UNITED STATES
SECURITIES AND EXCHANGE COMMISSION
Washington, D.C. 20549
FORM N-CSR
CERTIFIED SHAREHOLDER REPORT OF REGISTERED
MANAGEMENT INVESTMENT COMPANIES
Investment Company Act file number | 811-09645 |
|
Columbia Funds Series Trust |
(Exact name of registrant as specified in charter) |
|
225 Franklin Street, Boston, Massachusetts | | 02110 |
(Address of principal executive offices) | | (Zip code) |
|
Scott R. Plummer 5228 Ameriprise Financial Center Minneapolis, MN 55474 |
(Name and address of agent for service) |
|
Registrant’s telephone number, including area code: | 1-612-671-1947 | |
|
Date of fiscal year end: | March 31 | |
|
Date of reporting period: | March 31, 2011 | |
| | | | | | | | |
Form N-CSR is to be used by management investment companies to file reports with the Commission not later than 10 days after the transmission to stockholders of any report that is required to be transmitted to stockholders under Rule 30e-1 under the Investment Company Act of 1940 (17 CFR 270.30e-1). The Commission may use the information provided on Form N-CSR in its regulatory, disclosure review, inspection, and policymaking roles.
A registrant is required to disclose the information specified by Form N-CSR, and the Commission will make this information public. A registrant is not required to respond to the collection of information contained in Form N-CSR unless the Form displays a currently valid Office of Management and Budget ("OMB") control number. Please direct comments concerning the accuracy of the information collection burden estimate and any suggestions for reducing the burden to Secretary, Securities and Exchange Commission, 450 Fifth Street, NW, Washington, DC 20549-0609. The OMB has reviewed this collection of information under the clearance requirements of 44 U.S.C. § 3507.
Item 1. Reports to Stockholders.

Columbia Short Term Municipal Bond Fund
Annual Report for the Period Ended March 31, 2011
Not FDIC insured • No bank guarantee • May lose value
Table of Contents
| Fund Profile | | | 1 | | |
|
| Economic Update | | | 2 | | |
|
| Performance Information | | | 4 | | |
|
| Understanding Your Expenses | | | 5 | | |
|
| Portfolio Manager's Report | | | 6 | | |
|
| Investment Portfolio | | | 8 | | |
|
Statement of Assets and
Liabilities | | | 24 | | |
|
| Statement of Operations | | | 26 | | |
|
Statement of Changes in
Net Assets | | | 27 | | |
|
| Financial Highlights | | | 29 | | |
|
| Notes to Financial Statements | | | 33 | | |
|
Report of Independent Registered
Public Accounting Firm | | | 40 | | |
|
| Federal Income Tax Information | | | 41 | | |
|
| Fund Governance | | | 42 | | |
|
| Shareholder Meeting Results | | | 46 | | |
|
Important Information About
This Report | | | 49 | | |
|
The views expressed in this report reflect the current views of the respective parties. These views are not guarantees of future performance and involve certain risks, uncertainties and assumptions that are difficult to predict, so actual outcomes and results may differ significantly from the views expressed. These views are subject to change at any time based upon economic, market or other conditions and the respective parties disclaim any responsibility to update such views. These views may not be relied on as investment advice and, because investment decisions for a Columbia Fund are based on numerous factors, may not be relied on as an indication of trading intent on behalf of any particular Columbia Fund. References to specific securities should not be construed as a recommendation or investment advice.
President's Message

Dear Shareholder:
The Columbia Management story began over 100 years ago, and today, we are one of the nation's largest dedicated asset managers. The recent acquisition by Ameriprise Financial, Inc. brings together the talents, resources and capabilities of Columbia Management with those of RiverSource Investments, Threadneedle (acquired by Ameriprise in 2003) and Seligman Investments (acquired by Ameriprise in 2008) to build a best-in-class asset management business that we believe is truly greater than its parts.
RiverSource Investments traces its roots to 1894 when its then newly-founded predecessor, Investors Syndicate, offered a face-amount savings certificate that gave small investors the opportunity to build a safe and secure fund for retirement, education or other special needs. A mutual fund pioneer, Investors Syndicate launched Investors Mutual Fund in 1940. In the decades that followed, its mutual fund products and services lineup grew to include a full spectrum of styles and specialties. More than 110 years later, RiverSource continues to be a trusted financial products leader.
Threadneedle, a leader in global asset management and one of Europe's largest asset managers, offers sophisticated international experience from a dedicated U.K. management team. Headquartered in London, it is named for Threadneedle Street in the heart of the city's financial district, where British investors pioneered international and global investing. Threadneedle was acquired in 2003 and today operates as an affiliate of Columbia Management.
Seligman Investments' beginnings date back to the establishment of the investment firm J. & W. Seligman & Co. in 1864. In the years that followed, Seligman played a major role in the geographical expansion and industrial development of the United States. In 1874, President Ulysses S. Grant named Seligman as fiscal agent for the U.S. Navy—an appointment that would last through World War I. Seligman helped finance the westward path of the railroads and the building of the Panama Canal. The firm organized its first investment company in 1929 and began managing its first mutual fund in 1930. In 2008, J. & W. Seligman & Co. Incorporated was acquired and Seligman Investments became an offering brand of RiverSource Investments, LLC.
We are proud of the rich and distinctive history of these firms, the strength and breadth of products and services they offer, and the combined cultures of pioneering spirit and forward thinking. Together we are committed to providing more for our shareholders than ever before.
> A singular focus on our shareholders
Our business is asset management, so investors are our first priority. We dedicate our resources to identifying timely investment opportunities and provide a comprehensive choice of equity, fixed-income and alternative investments to help meet your individual needs.
> First-class research and thought leadership
We are dedicated to helping you take advantage of today's opportunities and anticipate tomorrow's. We stay abreast of the latest investment trends and ideas, using our collective insight to evaluate events and transform them into solutions you can use.
> A disciplined investment approach
We aren't distracted by passing fads. Our teams adhere to a rigorous investment process that helps ensure the integrity of our products and enables you and your financial advisor to match our solutions to your objectives with confidence.
When you choose Columbia Management, you can be confident that we will take the time to understand your needs and help you and your financial advisor identify the solutions that are right for you. Because at Columbia Management, we don't consider ourselves successful unless you are.
Sincerely,

J. Kevin Connaughton
President, Columbia Funds
Investors should consider the investment objectives, risks, charges and expenses of a mutual fund carefully before investing. For a free prospectus, which contains this and other important information about the funds, visit www.columbiamanagement.com. The prospectus should be read carefully before investing.
Columbia Funds are distributed by Columbia Management Investment Distributors, Inc., member FINRA, and managed by Columbia Management Investment Advisers, LLC.
© 2011 Columbia Management Investment Advisers, LLC. All rights reserved.
Fund Profile – Columbia Short Term Municipal Bond Fund
Summary
g For the 12-month period that ended March 31, 2011, the fund's Class A shares returned 0.75% without sales charge.
g The fund's benchmark, the Barclays Capital 1-3 Year Municipal Bond Index1, returned 1.69%. The average return of funds in the Lipper Short Municipal Debt Funds Classification2 was 1.33%.
g The fund's interest rate positioning had a negative impact on performance relative to the benchmark, as did a position in bonds backed by BP, which suffered in the wake of last year's Gulf oil spill.
Portfolio Management
James M. D'Arcy has managed the fund since 2010. From 1999 until joining the Investment Manager in May 2010, Mr. D'Arcy was associated with the fund's previous investment adviser as an investment professional.
On January 1, 2011, the fund adopted a new benchmark, the Barclays Capital 1-3 Year Municipal Bond Index. We believe this index more accurately reflects the composition of the portfolio.
1The Barclays Capital 1-3 Year Municipal Bond Index consists of a broad selection of investment grade general obligation and revenue bonds of maturities ranging from one to four years.
2Lipper Inc., a widely respected data provider in the industry, calculates an average total return (assuming reinvestment of distributions) for mutual funds with investment objectives similar to those of the fund. Lipper makes no adjustment for the effect of sales loads.
3The BofAML 1-3 Year Municipal Index tracks the performance of investment grade U.S. tax exempt bonds with remaining terms to final maturities of at least one year and less than three years.
Indices are not available for investment, are not professionally managed and do not reflect sales charges, fees, brokerage commissions, taxes or other expenses of investing. Securities in the fund may not match those in an index.
Performance data quoted represents past performance and current performance may be lower or higher. Past performance is no guarantee of future results. The investment return and principal value will fluctuate so that shares, when redeemed, may be worth more or less than the original cost. Please visit www.columbiamanagement.com for daily and most recent month-end performance updates.
Summary
1-year return as of 03/31/11
| | +0.75% | |
|
|  | | | Class A shares
(without sales charge) | |
|
| | +1.69% | |
|
|  | | | Barclays Capital 1-3 Year
Municipal Bond Index | |
|
| | +1.72% | |
|
|  | | | BofAML 1-3 Year
Municipal Index3 | |
|
1
Economic Update – Columbia Short Term Municipal Bond Fund
Summary
For the 12-month period that ended March 31, 2011
g Strengthening economic growth and rising interest rates kept a lid on most bond market sectors. The Barclays Capital Aggregate Bond Index delivered modest results. However, high-yield bonds were strong performers, as measured by the JPMorgan Developed BB High Yield Index.
Barclays
Aggregate Index | | JPMorgan
Index | |
|
 | |  | |
|
g The U.S. stock market, as measured by the S&P 500 Index, delivered solid returns, despite a summer 2010 correction. Foreign stock market returns were also positive, as measured by the MSCI EAFE Index (Net).
| S&P Index | | MSCI Index | |
|
 | |  | |
|
The U.S. economy continued to expand at a solid but uneven pace over the past 12 months, as measured by gross domestic product (GDP). Although lackluster second quarter 2010 GDP growth raised fears that the economy was losing steam and might lapse back into recession, the pace picked up in the third quarter of 2010, inspiring confidence among consumers, businesses and investors. GDP expanded by 2.6% in the third quarter and 3.1% in the fourth quarter. With the Federal Reserve Board (the Fed) providing additional monetary stimulus to shore up economic growth and the extension of key tax cuts for the next two years, expectations are for continued growth in 2011. However, early estimates of first quarter 2011 growth place it just under 2.0%, a disappointment after two strong quarters and a pick-up in employment.
Consumer spending on cars, clothing and other goods generally trended higher during the 12-month period, accelerating in the fourth quarter of 2010. Holiday spending rose 5.5% between November 5, 2010 and December 24, 2010, in all retail categories, excluding automobiles, compared with the same period in 2009, according to MasterCard Advisors' SpendingPulse, which tracks spending on all transactions including cash. Personal income surged in January 2011, as payroll tax cuts kicked in. The personal savings rate edged higher, ending February 2011, the last month for which data was available, at 5.8%.
News on the job front was increasingly positive. A good portion of the jobs added in March, April and May of 2010 were temporary, government-sponsored census positions, which began to unwind in June, July and August 2010. However, private sector payroll employment began to trend higher in the third quarter, massive layoffs declined and job growth turned solidly positive, with the addition of 444,000 new jobs in the first quarter of 2011.
Despite some glimmers of improvement early in 2010, the housing market remained troublesome throughout the period. Both new and existing home sales fell after a federal tax credit for new and repeat homebuyers expired. Distressed properties pressured prices and foreclosures continued—another drag on prices. The inventory of unsold homes ended the period higher than it started, at 8.9 and 8.6 months for new and existing homes, respectively, according to the National Association of Realtors and a joint release from the U.S. Census Bureau and the U.S. Department of Housing and Urban Development. The new year brought more disappointing news: Existing home sales fell in January 2011, after three months of sustained improvement. Tight credit and weak appraisals were cited as possible reasons for the decline.
Reports from the business side of the economy were generally positive. A key measure of the nation's manufacturing situation—the Institute for Supply Management's Index—took a somewhat surprising turn higher in the final months of the period. Technology spending rose 12% in 2010, according to the NPD Group, a national marketing research firm. Purchases of computers, networking and software returned to prerecession levels. Industrial production rose over the period, and manufacturing capacity utilized, per the report issued by the Fed—a key measure of the health of the manufacturing sector—also edged higher.
2
Economic Update (continued) – Columbia Short Term Municipal Bond Fund
Bonds delivered modest returns
As the economy strengthened and interest rates edged higher, most bond sectors delivered modest returns. The Barclays Capital Aggregate Bond Index1 returned 5.12%. High-yield bonds led the fixed-income markets. For the 12 months covered by this report, the JPMorgan Developed BB High Yield Index2 returned 13.04% as default fears abated and investors grew more comfortable with risk. Despite rising yields in the second half of the period, the Treasury market was also positive. The Barclays Capital U.S. Treasury Index3 returned 4.53%. However, municipal bonds struggled in the second half of the period, as interest rates inched higher and issue supply surged ahead of the year-end expiration of the Build America Bonds program. The Barclays Capital Municipal Bond Index4 gained 1.63% for the period. Despite positive economic activity, the Fed kept a key short-term interest rate—the federal funds rate—close to zero, reflecting ongoing concerns about employment and the housing market.
Stocks moved higher despite summer 2010 decline
Against a strengthening economic backdrop, stock prices continued to rally despite a summer 2010 setback linked to a debt crisis brewing in Europe, which raised concerns among U.S. investors. These fears were short-lived and stocks regained their footing. In this environment, the S&P 500 Index5 returned 15.65% for the 12 months through March 31, 2011. Outside the United States, stock markets also delivered solid gains. The MSCI EAFE Index (Net),6 a broad gauge of stock market performance in foreign developed markets, returned 10.42% (in U.S. dollars) for the 12-month period, as concerns about the impact of a bailout for weak euro zone economies eased yet continued to restrain market performance. Emerging stock markets were strong. The MSCI Emerging Markets Index (Net)7 returned 18.46% (in U.S. dollars) for the 12-month period.
Past performance is no guarantee of future results.
1The Barclays Capital Aggregate Bond Index is a market value-weighted index that tracks the daily price, coupon, pay-downs and total return performance of fixed-rate, publicly placed, dollar-denominated and non-convertible investment grade debt issues with at least $250 million par amount outstanding and with at least one year to final maturity.
2The JPMorgan Developed BB High Yield Index is an unmanaged index designed to mirror the investable universe of the U.S. dollar developed, BB-rated, high yield corporate debt market.
3The Barclays Capital U.S. Treasury Index includes public obligations of the U.S. Treasury. Treasury bills are excluded by the maturity constraint. In addition, certain special issues, such as state and local government series bonds (SLGs), as well as U.S. Treasury TIPS, are excluded. STRIPS are excluded from the index because their inclusion would result in double-counting.
4The Barclays Capital Municipal Bond Index is considered representative of the broad market for investment-grade, tax-exempt bonds with a maturity of at least one year.
5The Standard & Poor's (S&P) 500 Index tracks the performance of 500 widely held, large-capitalization U.S. stocks.
6The Morgan Stanley Capital International Europe, Australasia, Far East (MSCI EAFE) Index (Net) is a free float- adjusted market capitalization index that is designed to measure the equity market performance of developed markets, excluding the U.S. & Canada. As of December 31, 2010, the MSCI EAFE Index (Net) consisted of the following 22 developed market country indices: Australia, Austria, Belgium, Denmark, Finland, France, Germany, Greece, Hong Kong, Ireland, Israel, Italy, Japan, the Netherlands, New Zealand, Norway, Portugal, Singapore, Spain, Sweden, Switzerland and the United Kingdom.
7The Morgan Stanley Capital International Emerging Markets (MSCI EM) Index (Net) is a free float-adjusted market capitalization index that is designed to measure equity market performance of emerging markets. As of December 31, 2010, the MSCI EM Index (Net) consisted of the following 21 emerging market country indices: Brazil, Chile, China, Colombia, Czech Republic, Egypt, Hungary, India, Indonesia, Korea, Malaysia, Mexico, Morocco, Peru, Philippines, Poland, Russia, South Africa, Taiwan, Thailand and Turkey.
Indices are not available for investment, are not professionally managed and do not reflect sales charges, fees, brokerage commissions, taxes or other expenses of investing. Securities in the fund may not match those in an index.
3
Performance Information – Columbia Short Term Municipal Bond Fund
Performance data quoted represents past performance and current performance may be lower or higher. Past performance is no guarantee of future results. The investment return and principal value will fluctuate so that shares, when redeemed, may be worth more or less than the original cost. Please visit www.columbiamanagement.com for daily and most recent month-end performance updates.
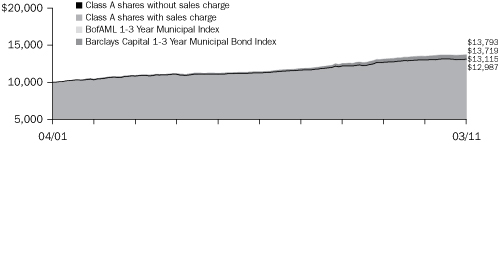
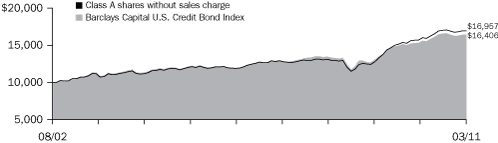
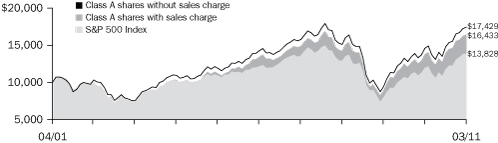
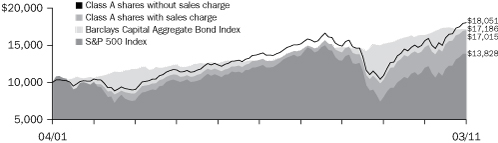
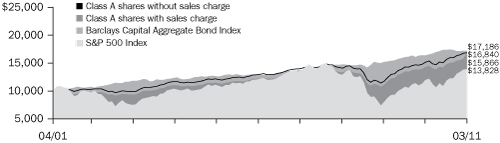
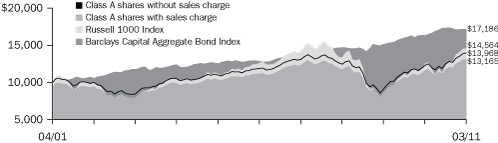
Performance of a $10,000 investment 04/01/01 – 03/31/11
The chart above shows the change in value of a hypothetical $10,000 investment in Class A shares of Columbia Short Term Municipal Bond Fund during the stated time period, and does not reflect the deduction of taxes that a shareholder may pay on fund distributions or on the redemption of fund shares.
Performance of a $10,000 investment 04/01/01 – 03/31/11 ($)
| Sales charge: | | without | | with | |
| Class A | | | 13,115 | | | | 12,987 | | |
| Class B | | | 12,165 | | | | n/a | | |
| Class C | | | 12,165 | | | | 12,165 | | |
| Class Z | | | 13,448 | | | | n/a | | |
Average annual total return as of 03/31/11 (%)
| Share class | | A | | B | | C | | Z | |
| Inception | | 11/02/93 | | 10/12/93 | | 05/19/94 | | 10/07/93 | |
| Sales charge | | without | | with | | without | | without | | with | | without | |
| 1-year | | | 0.75 | | | | –0.29 | | | | 0.00 | | | | 0.00 | | | | –0.99 | | | | 1.00 | | |
| 5-year | | | 3.07 | | | | 2.87 | | | | 2.30 | | | | 2.30 | | | | 2.30 | | | | 3.33 | | |
| 10-year | | | 2.75 | | | | 2.65 | | | | 1.98 | | | | 1.98 | | | | 1.98 | | | | 3.01 | | |
The "with sales charge" returns include the maximum initial sales charge of 1.00% for Class A shares and the applicable contingent deferred sales charge of 1.00% for Class C shares in the first year after purchase. The "without sales charge" returns do not include the effect of sales charges. If they had, returns would be lower.
Performance results reflect any fee waivers or reimbursements of fund expenses by the Investment Manager and/or any of its affiliates. Absent these fee waivers or expense reimbursement arrangements, performance results would have been lower.
All results shown assume reinvestment of distributions. Class Z shares are sold at net asset value with no distribution and service (Rule 12b-1) fees. Class Z shares have limited eligibility and the investment minimum requirements may vary. Please see the fund's prospectus for details. Performance for different share classes will vary based on differences in sales charges and fees associated with each class.
The tables do not reflect the deduction of taxes that a shareholder may pay on fund distributions or on the redemption of fund shares.
4
Understanding Your Expenses – Columbia Short Term Municipal Bond Fund
As a fund shareholder, you incur two types of costs. There are transaction costs, which generally include sales charges on purchases and may include redemption fees or exchange fees. There are also ongoing costs, which generally include investment advisory fees, distribution and service (Rule 12b-1) fees and other fund expenses. The information on this page is intended to help you understand the ongoing costs of investing in the fund and to compare these costs with the ongoing costs of investing in other mutual funds.
Analyzing your fund's expenses by share class
To illustrate these ongoing costs, we have provided an example and calculated the expenses paid by investors in each share class during the period. The information in the following table is based on an initial investment of $1,000, which is invested at the beginning of the period and held for the entire period. Expense information is calculated two ways and each method provides you with different information. The amount listed in the "Actual" column is calculated using the fund's actual operating expenses and total return for the period. The amount listed in the "Hypothetical" column for each share class assumes that the return each year is 5% before expenses and is calculated based on the fund's actual operating expenses. You should not use the hypothetical account values and expenses to estimate either your actual account balance at the end of the period or the expenses you paid during this period.
Compare with other funds
Since all mutual funds are required to include the same hypothetical calculations about expenses in shareholder reports, you can use this information to compare the ongoing cost of investing in the fund with other funds. To do so, compare the 5% hypothetical example with the 5% hypothetical examples that appear in the shareholder reports of other funds. As you compare hypothetical examples of other funds, it is important to note that hypothetical examples are meant to highlight the ongoing costs of investing in a fund and do not reflect any transaction costs, such as sales charges, redemption fees or exchange fees.
Estimating your actual expenses
To estimate the expenses that you paid over the period, first you will need your account balance at the end of the period:
g For shareholders who receive their account statements from Columbia Management Investment Services Corp., your account balance is available online at www.columbiamanagement.com or by calling Shareholder Services at 800.345.6611.
g For shareholders who receive their account statements from their financial intermediary, contact your financial intermediary to obtain your account balance.
1. Divide your ending account balance by $1,000. For example, if an account balance was $8,600 at the end of the period, the result would be 8.6.
2. In the section of the table below titled "Expenses paid during the period," locate the amount for your share class. You will find this number in the column labeled "Actual." Multiply this number by the result from step 1. Your answer is an estimate of the expenses you paid on your account during the period.
If the value of your account falls below the minimum initial investment requirement applicable to you, your account may be subject to a $20 annual fee. This fee is not included in the accompanying table. If you are subject to the fee, keep it in mind when you are estimating the ongoing expenses of investing in the fund and when comparing the expenses of this fund with other funds.
10/01/10 – 03/31/11
| | | Account value at the
beginning of the period ($) | | Account value at the
end of the period ($) | | Expenses paid
during the period ($) | | Fund's annualized
expense ratio (%) | |
| | | Actual | | Hypothetical | | Actual | | Hypothetical | | Actual | | Hypothetical | | Actual | |
| Class A | | | 1,000.00 | | | | 1,000.00 | | | | 997.50 | | | | 1,021.19 | | | | 3.74 | | | | 3.78 | | | | 0.75 | | |
| Class B | | | 1,000.00 | | | | 1,000.00 | | | | 993.70 | | | | 1,017.45 | | | | 7.46 | | | | 7.54 | | | | 1.50 | | |
| Class C | | | 1,000.00 | | | | 1,000.00 | | | | 993.80 | | | | 1,017.45 | | | | 7.46 | | | | 7.54 | | | | 1.50 | | |
| Class Z | | | 1,000.00 | | | | 1,000.00 | | | | 998.70 | | | | 1,022.44 | | | | 2.49 | | | | 2.52 | | | | 0.50 | | |
Expenses paid during the period are equal to the annualized expense ratio for the share class, multiplied by the average account value over the period, then multiplied by the number of days in the fund's most recent fiscal half-year and divided by 365.
Had the Investment Manager and/or any of its affiliates not waived fees or reimbursed a portion of expenses, account value at the end of the period would have been reduced.
It is important to note that the expense amounts shown in the table are meant to highlight only ongoing costs of investing in the fund and do not reflect any transaction costs, such as sales charges, redemption fees or exchange fees. Therefore, the hypothetical examples provided may not help you determine the relative total costs of owning shares of different funds. If these transaction costs were included, your costs would have been higher.
5
Portfolio Manager's Report – Columbia Short Term Municipal Bond Fund
Performance data quoted represents past performance and current performance may be lower or higher. Past performance is no guarantee of future results. The investment return and principal value will fluctuate so that shares, when redeemed, may be worth more or less than the original cost. Please visit www.columbiamanagement.com for daily and most recent month-end performance updates.
Net asset value per share
as of 03/31/11 ($)
| Class A | | | 10.47 | | |
| Class B | | | 10.47 | | |
| Class C | | | 10.47 | | |
| Class Z | | | 10.47 | | |
Distributions declared per share
04/01/10 – 03/31/11 ($)
| Class A | | | 0.16 | | |
| Class B | | | 0.08 | | |
| Class C | | | 0.08 | | |
| Class Z | | | 0.19 | | |
A portion of the fund's income may be subject to the alternative minimum tax. The fund may at times purchase tax-exempt securities at a discount. Some, or all of this discount may be included in the fund's ordinary income and is taxable when distributed.
30-day SEC yields
as of 03/31/11 (%)
| Class A | | | 0.96 | | |
| Class B | | | 0.22 | | |
| Class C | | | 0.24 | | |
| Class Z | | | 1.21 | | |
The 30-day SEC yields reflect the fund's earning power, net of expenses, expressed as an annualized percentage of the public offering price per share at the end of the period.
On January 1, 2011, the fund adopted a new benchmark, the Barclays Capital 1-3 Year Municipal Bond Index. We believe this index more accurately reflects the composition of the portfolio.
For the 12-month period that ended March 31, 2011, the fund's Class A shares returned 0.75% without sales charge. The fund's benchmark, the Barclays Capital 1-3 Year Municipal Bond Index, returned 1.69%. The average return of funds in its peer group, the Lipper Short Municipal Debt Funds Classification, was 1.33%. The fund's interest rate positioning and a position in bonds backed by BP generally accounted for the fund's shortfall against its benchmark. We also believe that the fund's shortfall against its peer group was the result of interest rate positioning. Some competing funds have more flexibility in maintaining longer durations, a measure of interest rate sensitivity, which benefited performance as interest rates declined.
Interest rate positioning and other disappointments
In a year of modest returns from the fixed income markets, a decision to maintain a duration that was shorter than the benchmark detracted from performance. We kept the fund's duration short because we expected the Federal Reserve Board (the Fed) to raise short-term interest rates during the period. When rates rise, bond prices go down and our move seemed prudent in light of a generally volatile environment. However, the Fed did not take any action on rates during the period, so our move cost the fund a modest amount of performance.
The fund also held several positions in bonds backed by BP (1.1% of net assets). During the Gulf of Mexico oil spill, these bonds were downgraded from AA to A1 and suffered large price declines. To stay in line with our diversification guidelines for a single A-rated security, we reduced the fund's position by about 20% as prices started to recover. Even though prices recovered, the downturn had a significant negative impact on second quarter performance in 2010. Finally, the fund's cash position, with its very low yields, detracted from its overall return. However, the cash position offered a measure of stability during a volatile fourth quarter.
Sector, credit allocations aided results
The fund had more exposure than the benchmark to health care bonds, the best performing sector in the index, which aided relative performance. We did well to underweight pre-refunded bonds, which also aided performance as pre-refunded bonds were the worst performers in the index. A pre-refunded bond is created when an issuer refinances an existing issue by issuing a new bond deal. Proceeds from the new deal are then placed in an escrow account where, generally, Treasuries or agency bonds are purchased and are used to pay off the old issue, which has now become pre-refunded. The pre-refunded bonds underperformed because they offered very low yields.
The fund's credit allocation positioning also benefited performance. It was overweight in single A rated bonds, which more than compensated for a slight underweight in BBB-rated bonds, the best performers within credit quality sectors. The fund's BBB-rated holdings generally outperformed the index holdings, which was another plus for performance. Many of the fund's electric revenue bonds also outperformed the index. In addition, prices rose on California general obligation paper that was owned by the fund.
1The credit quality ratings represent the lower of one of the following nationally recognized rating agencies: Standard & Poor's or Moody's Investor Services. If a security is rated by only one of the two agencies, that rating is used. If a security is not rated by either of the two agencies, it is designated as Non-Rated. Ratings are relative and subjective and are not absolute standards of quality. The credit quality of the fund's investments does not remove market risk.
6
Portfolio Manager's Report (continued) – Columbia Short Term Municipal Bond Fund
Portfolio positioning
We took advantage of fourth quarter 2010 bond market weakness and raised the fund's duration closer to neutral. This move hurt performance in the short term as the bond market declined, but as markets stabilized in the first quarter of 2011, these trades proved beneficial. The yield on the fund rose and performance benefited from some of the rally that occurred later in the first quarter. We also increased the fund's allocation to A rated securities, which offer the optimum risk/reward profile for the fund's conservative nature. While BBB bonds offer higher yield, they also carry more risk. In light of a still-tenuous economic recovery, we believe this positioning is prudent.
As a result of concerns about state budgets, we reduced the fund's exposure to state and local general obligation securities in favor of certain revenue bonds, including special non-property tax, health care, airport and electric revenue bonds. We also increased the fund's allocation to two- to four-year floating rate securities, which provide higher yields than other securities with a similar duration and have the benefit of resetting their coupons, which will rise when interest rates rise.
Outlook
The broad municipal bond market experienced much volatility during the second half of the period, but the market for short-term bonds was more stable as investors took refuge there. We believe that Fed rate hikes are closer now than they were a year ago, but we do not believe they are on the near-term horizon. Still, we expect two- and three-year interest rates to rise in anticipation of Fed action. Thus, we are taking a relatively conservative stance on the fund's interest rate positioning, which remains slightly short of the benchmark. We have been building the fund's floating rate securities position, which have the potential to perform well in a rising interest-rate environment. A sizeable portion of the fund's assets are due to mature within the next 12 months, which should provide relative stability even if rates begin to rise—and opportunities to reinvest once rates do start to rise, which will benefit the fund's yield.
Portfolio characteristics and holdings are subject to change periodically and may not be representative of current characteristics and holdings. The outlook for the fund may differ from that presented for other Columbia Funds.
Tax-exempt investing offers current tax-exempt income, but it also involves certain risks. The value of the fund will be affected by interest rate changes and the creditworthiness of issues held in the fund. When interest rates go up, bond prices generally drop and vice versa.
Interest income from certain tax-exempt bonds may be subject to certain state and local taxes and, if applicable, the alternative minimum tax. Capital gains are not exempt from income taxes.
Taxable-equivalent SEC yields
as of 03/31/11 (%)
| Class A | | | 1.48 | | |
| Class B | | | 0.35 | | |
| Class C | | | 0.37 | | |
| Class Z | | | 1.86 | | |
Taxable-equivalent SEC yields are based on the combined maximum effective 35.0% federal income tax rate and applicable state income tax rate. This tax rate does not reflect the phase out of exemptions or the reduction of the otherwise allowable deductions that occur when adjusted gross income exceeds certain levels. Your taxable-equivalent yield may be different depending on your tax bracket.
Top 5 sectors
as of 03/31/11 (%)
| Tax-Backed | | | 40.2 | | |
| Utilities | | | 14.5 | | |
| Transportation | | | 12.8 | | |
| Other | | | 10.0 | | |
| Health Care | | | 8.4 | | |
Quality breakdown
as of 03/31/11 (%)
| AAA | | | 20.2 | | |
| AA | | | 51.9 | | |
| A | | | 26.1 | | |
| BBB | | | 1.8 | | |
Maturity breakdown
as of 03/31/11 (%)
| 0-1 year | | | 27.4 | | |
| 1-3 years | | | 33.7 | | |
| 3-5 years | | | 24.9 | | |
| 5-7 years | | | 7.1 | | |
| 10-15 years | | | 0.1 | | |
| 15-20 years | | | 0.5 | | |
| Net Cash & Equivalents | | | 6.3 | | |
Ratings shown in the quality breakdown are assigned to individual bonds by taking the lower of the ratings available from one of the following nationally recognized rating agencies: Standard & Poor's or Moody's Investor Services. If a security is rated by only one of the two agencies, that rating is used. If a security is not rated by either of the two agencies, it is designated as Non-Rated. Ratings are relative and subjective and are not absolute standards of quality. The credit quality of the fund's investments does not remove market risk.
The fund is actively managed and the composition of its portfolio will change over time. Information provided is calculated as a percentage of net assets.
7
Investment Portfolio – Columbia Short Term Municipal Bond Fund
March 31, 2011
| Municipal Bonds – 96.1% | |
| | | Par ($) | | Value ($) | |
| Education – 4.8% | |
| Education – 3.9% | |
| DE University of Delaware | |
Series 2009 A,
2.000% 11/01/37
(06/01/11) (a)(b) | | | 10,750,000 | | | | 10,778,595 | | |
FL University Athletic
Association, Inc. | |
Series 2006,
LOC: SunTrust Bank
3.800% 10/01/31
(10/01/11) (a)(b) | | | 3,510,000 | | | | 3,546,890 | | |
GA Private Colleges &
Universities Authority | |
Emory University,
Series 2008 B,
5.000% 09/01/11 | | | 7,400,000 | | | | 7,544,670 | | |
| IL Educational Facilities Authority | |
University of Chicago,
Series 1998,
3.375% 07/01/25
(02/03/14) (a)(b) | | | 5,650,000 | | | | 5,889,504 | | |
| IL Finance Authority | |
The Art Institute of Chicago:
Series 2010 B,
4.000% 07/01/15 | | | 13,850,000 | | | | 14,292,092 | | |
Series 2010,
5.000% 03/01/15 | | | 3,200,000 | | | | 3,450,240 | | |
IN St. Joseph County
Educational Facilities Revenue | |
University of Notre Dame Du Lac,
Series 2005,
3.875% 03/01/40
(03/01/12) (a)(b) | | | 6,700,000 | | | | 6,861,269 | | |
| MA Development Finance Agency | |
Boston College,
Series 2010 R1,
5.000% 07/01/12 | | | 1,000,000 | | | | 1,055,220 | | |
Boston University,
Series 2009 V-2,
2.875% 10/01/14 | | | 4,975,000 | | | | 5,118,877 | | |
Williams College,
Series 2011 N,
0.230% 07/01/41
(04/07/11) (a)(b) | | | 11,250,000 | | | | 11,229,637 | | |
| | | Par ($) | | Value ($) | |
MA University of Massachusetts
Building Authority | |
Series 2005,
Insured: AMBAC
5.000% 11/01/15 | | | 3,000,000 | | | | 3,355,230 | | |
| NJ Educational Facilities Authority | |
Princeton University,
Series 2008 K,
5.000% 07/01/11 | | | 2,965,000 | | | | 2,999,928 | | |
NY Troy Industrial Development
Authority | |
Rensselaer Polytechnic Institute,
Series 2002 E,
4.050% 04/01/37
(09/01/11) (a)(b) | | | 2,500,000 | | | | 2,528,750 | | |
| Education Total | | | 78,650,902 | | |
| Student Loan – 0.9% | |
MA Educational Financing
Authority | |
Series 2009 I,
5.250% 01/01/16 | | | 12,500,000 | | | | 13,517,125 | | |
NM Educational Assistance
Foundation | |
Series 2009 C, AMT,
3.900% 09/01/14 | | | 4,890,000 | | | | 5,100,221 | | |
| Student Loan Total | | | 18,617,346 | | |
| Education Total | | | 97,268,248 | | |
| Health Care – 8.4% | |
| Hospitals – 8.4% | |
| AZ Health Facilities Authority | |
Banner Health System,
Series 2008 D,
5.000% 01/01/12 | | | 2,000,000 | | | | 2,056,240 | | |
CA Health Facilities Financing
Authority | |
Catholic Healthcare West:
Series 2009 C,
5.000% 07/01/34
(10/16/14) (a)(b) | | | 12,000,000 | | | | 13,007,280 | | |
Series 2009 G,
5.000% 07/01/28
(07/02/12) (a)(b) | | | 3,000,000 | | | | 3,136,620 | | |
St. Joseph Health System,
Series 2009 C,
5.000% 07/01/37
(07/02/12) (a)(b) | | | 15,250,000 | | | | 15,926,947 | | |
See Accompanying Notes to Financial Statements.
8
Columbia Short Term Municipal Bond Fund
March 31, 2011
| Municipal Bonds (continued) | |
| | | Par ($) | | Value ($) | |
CA Statewide Communities
Development Authority | |
Kaiser Hospital Asset Management:
Series 2002 E,
4.000% 11/01/36
(05/02/11) (a)(b) | | | 15,830,000 | | | | 15,879,864 | | |
Series 2009 A,
5.000% 04/01/13 | | | 10,250,000 | | | | 10,951,100 | | |
| CO Health Facilities Authority | |
Catholic Health Initiatives:
Series 2008 D2,
5.250% 10/01/38
(11/12/13) (a)(b) | | | 2,185,000 | | | | 2,374,199 | | |
Series 2009 B,
5.000% 07/01/39
(11/08/12) (a)(b) | | | 2,250,000 | | | | 2,385,495 | | |
FL Orange County Health
Facilities Authority | |
Orlando Health, Inc.,
Series 2009,
5.000% 10/01/14 | | | 2,000,000 | | | | 2,139,860 | | |
| FL Tampa | |
Baycare Health System, Inc.,
Series 2010,
5.000% 11/15/16 | | | 2,000,000 | | | | 2,190,300 | | |
| IA Finance Authority | |
Central Health System,
Series 2009 F,
5.000% 08/15/39
(08/15/12) (a)(b) | | | 5,100,000 | | | | 5,348,115 | | |
Genesis Health Systems,
Series 2010:
5.000% 07/01/15 | | | 1,075,000 | | | | 1,165,053 | | |
| 5.000% 07/01/16 | | | 1,150,000 | | | | 1,243,472 | | |
| IL Finance Authority | |
Advocate Healthcare Network,
Series 2008 A3,
3.875% 11/01/30
(05/01/12) (a)(b) | | | 2,250,000 | | | | 2,327,378 | | |
Northwestern Memorial Hospital,
Series 2009 A:
5.000% 08/15/11 | | | 2,450,000 | | | | 2,490,793 | | |
| 5.000% 08/15/12 | | | 5,130,000 | | | | 5,388,193 | | |
| 5.000% 08/15/13 | | | 3,500,000 | | | | 3,776,535 | | |
IN Health Facility Financing
Authority | |
Ascension Health,
Series 2001 A2,
3.750% 11/15/36
(02/01/12) (a)(b) | | | 9,675,000 | | | | 9,948,899 | | |
| | | Par ($) | | Value ($) | |
KY Economic Development
Finance Authority | |
Catholic Health Initiatives,
Series 2009 B,
5.000% 05/01/39
(11/08/12) (a)(b) | | | 2,000,000 | | | | 2,201,160 | | |
| MA Development Finance Agency | |
Partners Healthcare System,
Series 2011 K3,
0.900% 07/01/38
(04/07/11) (a)(b) | | | 7,500,000 | | | | 7,489,425 | | |
MA Health & Educational
Facilities Authority | |
Caregroup, Inc.,
Series 2008 E-2,
5.000% 07/01/12 | | | 2,500,000 | | | | 2,585,450 | | |
MD Health & Higher Educational
Facilities Authority | |
Johns Hopkins Health Systems,
Series 2008,
5.000% 05/15/42
(11/15/11) (a)(b) | | | 4,450,000 | | | | 4,574,378 | | |
| MI Hospital Finance Authority | |
Ascension Health,
Series 2010,
5.000% 11/15/15 | | | 2,000,000 | | | | 2,201,140 | | |
| MI Kent Hospital Financial Authority | |
Spectrum Health,
Series 2008 A,
5.000% 01/15/47
(01/15/12) (a)(b) | | | 1,300,000 | | | | 1,342,978 | | |
| NV Reno Hospital | |
Renown Regional Medical Center Project,
Series 2007 A:
5.000% 06/01/11 | | | 650,000 | | | | 652,100 | | |
| 5.000% 06/01/12 | | | 815,000 | | | | 830,558 | | |
| 5.000% 06/01/13 | | | 500,000 | | | | 512,730 | | |
| NY Dormitory Authority | |
Mt. Sinai School of Medicine,
Series 2010 A:
5.000% 07/01/12 | | | 1,000,000 | | | | 1,044,000 | | |
| 5.000% 07/01/15 | | | 1,000,000 | | | | 1,089,630 | | |
| 5.000% 07/01/16 | | | 2,000,000 | | | | 2,176,140 | | |
| OK Development Finance Authority | |
Integris Baptist Medical Center,
Series 2008 B,
5.000% 08/15/11 | | | 4,590,000 | | | | 4,667,663 | | |
See Accompanying Notes to Financial Statements.
9
Columbia Short Term Municipal Bond Fund
March 31, 2011
| Municipal Bonds (continued) | |
| | | Par ($) | | Value ($) | |
PA Allegheny County Hospital
Development Authority | |
University of Pittsburgh Medical Center,
Series 2008 A,
5.000% 09/01/11 | | | 9,450,000 | | | | 9,628,605 | | |
PA Higher Educational Facilties
Authority | |
University of Pittsburgh Medical Center,
Series 2010 E,
5.000% 05/15/15 | | | 4,250,000 | | | | 4,697,482 | | |
TX Harris County Cultural
Education Facilities Finance Corp. | |
Memorial Hermann Hospital System,
Series 2010 A,
4.000% 06/01/12 | | | 1,000,000 | | | | 1,029,330 | | |
Methodist Hospital,
Series 2009 B1,
5.000% 12/01/28
(06/01/12) (a)(b) | | | 10,000,000 | | | | 10,489,400 | | |
TX Lubbock Health Facilities
Development Corp. | |
Series 2008 A,
3.050% 07/01/30
(10/16/12) (a)(b) | | | 4,875,000 | | | | 4,962,652 | | |
TX Tarrant County Cultural
Education Facilities Finance Corp. | |
Scott and White Memorial Hospital,
Series 2008,
5.000% 08/15/11 | | | 1,275,000 | | | | 1,291,588 | | |
| UT Riverton | |
IHC Health Services, Inc.,
Series 2009,
5.000% 08/15/13 | | | 1,400,000 | | | | 1,519,392 | | |
VA Roanoke Economic
Development Authority | |
Carilion Medical Center,
Series 2002 A:
5.500% 07/01/16 | | | 1,500,000 | | | | 1,560,735 | | |
| 5.500% 07/01/17 | | | 1,945,000 | | | | 2,023,753 | | |
| Hospitals Total | | | 170,306,632 | | |
| Health Care Total | | | 170,306,632 | | |
| | | Par ($) | | Value ($) | |
| Housing – 1.8% | |
| Multi-Family – 1.0% | |
GA Clayton County Housing
Authority | |
GCC Ventures LLC,
Series 2001A,
LIQ FAC: FNMA
4.350% 12/01/31
(12/01/11) (a)(b) | | | 2,955,000 | | | | 2,955,000 | | |
| MA Housing Finance Agency | |
Series 2009 D,
4.000% 09/01/11 | | | 7,250,000 | | | | 7,343,670 | | |
NY New York City Housing
Development Corp. | |
Series 2009 C2,
5.000% 11/01/11 | | | 10,000,000 | | | | 10,218,500 | | |
| Multi-Family Total | | | 20,517,170 | | |
| Single-Family – 0.8% | |
| CT Housing Finance Authority | |
Series 2008 D,
4.750% 05/15/18 | | | 7,000,000 | | | | 7,127,050 | | |
| FL Housing Finance Corp. | |
Series 2010 A,
5.000% 07/01/28 | | | 3,495,000 | | | | 3,712,459 | | |
| OH Housing Finance Agency | |
Series 2010,
5.000% 11/01/28 | | | 4,000,000 | | | | 4,287,080 | | |
| WA Housing Finance Commission | |
Series 2010 A,
Insured: GNMA
4.700% 10/01/28 | | | 1,485,000 | | | | 1,566,408 | | |
| Single-Family Total | | | 16,692,997 | | |
| Housing Total | | | 37,210,167 | | |
| Industrials – 1.7% | |
| Oil & Gas – 1.7% | |
CA Pollution Control Financing
Authority | |
BP West Coast Products LLC,
Series 2009,
GTY AGMT: BP PLC
2.600% 12/01/46
(09/02/14) (a)(b) | | | 5,000,000 | | | | 4,988,900 | | |
See Accompanying Notes to Financial Statements.
10
Columbia Short Term Municipal Bond Fund
March 31, 2011
| Municipal Bonds (continued) | |
| | | Par ($) | | Value ($) | |
| GA Public Gas Partners, Inc. | |
Series 2009 A:
5.000% 10/01/12 | | | 2,300,000 | | | | 2,423,602 | | |
| 5.000% 10/01/14 | | | 3,630,000 | | | | 3,948,206 | | |
| IN Whiting | |
BP PLC,
Series 2008,
GTY AGMT: BP PLC
2.800% 06/01/44
(06/02/14) (a)(b) | | | 13,250,000 | | | | 13,188,785 | | |
| LA Offshore Terminal Authority | |
Loop LLC:
Series 2007 B-1A,
1.600% 10/01/37
(10/01/12) (a)(b) | | | 3,350,000 | | | | 3,346,750 | | |
Series 2010 B1,
1.875% 10/01/40
(04/01/11) (a)(b) | | | 3,500,000 | | | | 3,477,110 | | |
TX Gulf Coast Waste Disposal
Authority | |
BP Products North America,
Series 2007,
GTY AGMT: BP PLC
2.300% 01/01/42
(09/03/13) (a)(b) | | | 2,950,000 | | | | 2,944,867 | | |
| Oil & Gas Total | | | 34,318,220 | | |
| Industrials Total | | | 34,318,220 | | |
| Other – 10.0% | |
| Other – 0.9% | |
CA Infrastructure & Economic
Development Bank | |
J. Paul Getty Trust:
Series 2007 A3,
2.250% 10/01/47
(04/02/12) (a)(b) | | | 6,675,000 | | | | 6,789,676 | | |
Series 2007 A4,
1.650% 10/01/47
(04/01/11) (a)(b) | | | 2,325,000 | | | | 2,325,000 | | |
| United Nations Development Corp. | |
Series 2009 A:
4.000% 07/01/12 | | | 3,925,000 | | | | 4,091,420 | | |
| 4.500% 07/01/13 | | | 2,200,000 | | | | 2,363,196 | | |
| 5.000% 07/01/14 | | | 2,000,000 | | | | 2,208,440 | | |
| Other Total | | | 17,777,732 | | |
| | | Par ($) | | Value ($) | |
| Pool/Bond Bank – 0.8% | |
AK Industrial Development &
Export Authority | |
Series 2010 A,
5.000% 04/01/16 | | | 2,500,000 | | | | 2,762,950 | | |
ME Health & Higher Educational
Fasilities Authority | |
Series 2010 B:
4.000% 07/01/16 | | | 3,555,000 | | | | 3,772,530 | | |
| 5.000% 07/01/15 | | | 3,455,000 | | | | 3,790,101 | | |
PA Delaware Valley Regional
Financing Authority | |
Series 2002,
5.500% 07/01/12 | | | 6,000,000 | | | | 6,275,760 | | |
| Pool/Bond Bank Total | | | 16,601,341 | | |
| Refunded/Escrowed (c) – 7.7% | |
| CA County of Sacramento | |
Series 1988 A, AMT,
Escrowed to Maturity,
8.000% 07/01/16 | | | 12,810,000 | | | | 16,255,506 | | |
| CA Department of Water Resources | |
Series 2002 A,
Pre-refunded 05/01/12:
6.000% 05/01/14 | | | 8,250,000 | | | | 8,831,707 | | |
Insured: AMBAC
5.500% 05/01/14 | | | 7,035,000 | | | | 7,493,049 | | |
| CA Economic Recovery | |
Series 2004 A,
Pre-refunded 07/01/14,
5.000% 07/01/15 | | | 1,170,000 | | | | 1,322,884 | | |
Series 2008 B,
Pre-refunded 07/01/11,
5.000% 07/01/23
(07/01/11) (a)(b) | | | 5,650,000 | | | | 5,715,992 | | |
| CO Health Facilities Authority | |
Catholic Health Initiatives,
Series 2008 D1,
Pre-refunded 11/12/13,
5.250% 10/01/38
(11/12/13) (a)(b) | | | 315,000 | | | | 351,376 | | |
FL Orlando Urban Community
Development District | |
Series 2001 A,
Pre-refunded 05/01/11,
6.950% 05/01/33 | | | 7,690,000 | | | | 7,799,967 | | |
See Accompanying Notes to Financial Statements.
11
Columbia Short Term Municipal Bond Fund
March 31, 2011
| Municipal Bonds (continued) | |
| | | Par ($) | | Value ($) | |
| IL State | |
Series 2002,
Pre-refunded 10/01/12,
Insured: NPFGC
5.250% 10/01/14 | | | 5,000,000 | | | | 5,352,900 | | |
| MI State | |
Series 2001 A,
Pre-refunded 11/01/11,
Insured: AGMC
5.500% 11/01/13 | | | 7,345,000 | | | | 7,563,293 | | |
MN Dakota & Washington Counties
Housing & Redevelopment Authority | |
Series 1988, AMT,
Escrowed to Maturity,
Insured: GNMA
7.950% 03/01/13 | | | 3,000,000 | | | | 3,397,200 | | |
MO Health & Educational
Facilities Authority | |
SSM Healthcare System,
Series 2001 A,
Pre-refunded 06/01/11,
Insured: AMBAC
5.250% 06/01/28 | | | 2,000,000 | | | | 2,036,300 | | |
| MS State | |
Capital Improvements,
Series 2002,
Pre-refunded 11/01/12,
Insured: FGIC
5.250% 11/01/13 | | | 7,925,000 | | | | 8,494,332 | | |
| NJ Economic Development Authority | |
Series 2008 W,
Escrowed to Maturity,
5.000% 09/01/11 | | | 4,705,000 | | | | 4,796,983 | | |
NJ Tobacco Settlement
Financing Corp. | |
Series 2002,
Pre-refunded 12/01/12,
6.125% 06/01/42 | | | 6,425,000 | | | | 6,848,408 | | |
| NM State Severance Tax | |
Series 2006 A,
Pre-refunded 07/01/2011,
Insured: NPFGC
4.000% 07/01/13 | | | 3,000,000 | | | | 3,027,720 | | |
NY New York City Transitional
Finance Authority | |
Series 2009 A,
Escrowed to Maturity,
5.000% 11/01/11 | | | 3,470,000 | | | | 3,564,002 | | |
| | | Par ($) | | Value ($) | |
| OH Building Authority | |
Series 2003 A,
Pre-refunded 04/01/2013,
Insured: AGMC
5.000% 04/01/15 | | | 2,080,000 | | | | 2,254,283 | | |
| SC Greenville County School District | |
Series 2002,
Pre-refunded 12/01/12,
5.875% 12/01/16 | | | 5,475,000 | | | | 6,011,550 | | |
| TX Houston | |
Series 2002,
Pre-refunded 03/01/12,
5.250% 03/01/19 | | | 3,750,000 | | | | 3,907,275 | | |
| WA Energy Northwest | |
Bonneville Power Administration
Series 2001 A,
Pre-refunded 07/01/2011,
Insured: AGMC:
5.500% 07/01/16 | | | 10,000,000 | | | | 10,229,200 | | |
| 5.500% 07/01/17 | | | 8,800,000 | | | | 8,990,168 | | |
WI Badger Tobacco Asset
Securitization Corp. | |
Pre-refunded to Various Dates,
Series 2002,
6.125% 06/01/27 | | | 9,520,000 | | | | 9,911,177 | | |
Series 2002,
Pre-refunded 06/01/12,
6.000% 06/01/17 | | | 20,000,000 | | | | 21,269,600 | | |
| Refunded/Escrowed Total | | | 155,424,872 | | |
| Tobacco – 0.6% | |
IL Railsplitter Tobacco
Settlement Authority | |
Series 2010:
4.000% 06/01/12 | | | 3,500,000 | | | | 3,571,680 | | |
| 5.000% 06/01/15 | | | 3,615,000 | | | | 3,800,450 | | |
NY Tobacco Settlement
Financing Corp. | |
Series 2003 B-1C,
5.500% 06/01/17 | | | 4,300,000 | | | | 4,328,337 | | |
| Tobacco Total | | | 11,700,467 | | |
| Other Total | | | 201,504,412 | | |
See Accompanying Notes to Financial Statements.
12
Columbia Short Term Municipal Bond Fund
March 31, 2011
| Municipal Bonds (continued) | |
| | | Par ($) | | Value ($) | |
| Other Revenue – 0.7% | |
| Recreation – 0.7% | |
| FL Board of Education | |
Series 2006 A,
Insured: AMBAC
5.000% 07/01/12 | | | 6,150,000 | | | | 6,469,062 | | |
OR Department of
Administrative Services | |
Series 2004 A,
Insured: AGMC
5.000% 04/01/11 | | | 5,010,000 | | | | 5,010,000 | | |
Series 2009 A,
3.000% 04/01/11 | | | 2,000,000 | | | | 2,000,000 | | |
| Recreation Total | | | 13,479,062 | | |
| Other Revenue Total | | | 13,479,062 | | |
| Resource Recovery – 1.2% | |
| Disposal – 0.3% | |
CA Statewide Communities
Development Authority | |
Republic Services, Inc.,
Series 2003 A, AMT,
4.950% 12/01/12 | | | 3,000,000 | | | | 3,157,260 | | |
NY Babylon Industrial Development
Agency | |
Babylon, Inc.,
Series 2009 A,
5.000% 01/01/13 | | | 1,500,000 | | | | 1,582,290 | | |
Babylon, Inc.,
Series 2009 A,
5.000% 01/01/14 | | | 2,000,000 | | | | 2,143,580 | | |
| Disposal Total | | | 6,883,130 | | |
| Resource Recovery – 0.9% | |
| FL County of Hillsborough | |
Series 2006 A, AMT,
Insured: AMBAC
5.000% 09/01/14 | | | 3,025,000 | | | | 3,255,687 | | |
| FL County of Lee | |
Series 2001, AMT,
Insured: NPFGC
5.625% 10/01/12 | | | 5,285,000 | | | | 5,388,110 | | |
MD Northeast Waste Disposal
Authority | |
Series 2003, AMT,
Insured: AMBAC
5.500% 04/01/11 | | | 8,425,000 | | | | 8,425,000 | | |
| Resource Recovery Total | | | 17,068,797 | | |
| Resource Recovery Total | | | 23,951,927 | | |
| | | Par ($) | | Value ($) | |
| Tax-Backed – 40.2% | |
| Local Appropriated – 1.8% | |
CA Golden Empire Schools
Financing Authority | |
Series 2010,
4.000% 05/01/12 | | | 10,000,000 | | | | 10,244,300 | | |
| FL Palm Beach County School Board | |
Series 2002 E,
Insured: AMBAC
5.250% 08/01/12 | | | 7,625,000 | | | | 8,014,714 | | |
IL Chicago Public Building
Commission | |
Series 1999 B,
Insured: NPFGC
5.250% 12/01/15 | | | 3,165,000 | | | | 3,395,349 | | |
| NY Dormitory Authority | |
Series 2008,
5.000% 01/15/14 | | | 6,300,000 | | | | 6,771,240 | | |
| NY Health & Hospital Corp. | |
Series 2010 A,
5.000% 02/15/15 | | | 4,500,000 | | | | 4,908,780 | | |
| OK Tulsa County Industrial Authority | |
Series 2009:
4.000% 09/01/13 | | | 1,000,000 | | | | 1,066,140 | | |
| 5.500% 09/01/14 | | | 1,280,000 | | | | 1,449,382 | | |
| Local Appropriated Total | | | 35,849,905 | | |
| Local General Obligations – 9.5% | |
| AK North Slope Borough | |
Series 2000 B,
Insured: NPFGC
(d) 06/30/11 | | | 16,050,000 | | | | 16,028,012 | | |
Series 2010 A,
3.000% 06/30/12 | | | 2,500,000 | | | | 2,574,000 | | |
| CA Gilroy Unified School District | |
Series 2010,
5.000% 04/01/13 | | | 5,125,000 | | | | 5,405,286 | | |
CA Long Beach Community
College District | |
Series 2010 A,
9.850% 01/15/13 | | | 13,875,000 | | | | 15,914,764 | | |
CA Long Beach Unified School
District | |
Series 2009 A:
4.000% 08/01/11 | | | 2,150,000 | | | | 2,175,628 | | |
| 5.000% 08/01/11 | | | 1,650,000 | | | | 1,675,146 | | |
See Accompanying Notes to Financial Statements.
13
Columbia Short Term Municipal Bond Fund
March 31, 2011
| Municipal Bonds (continued) | |
| | | Par ($) | | Value ($) | |
CA Los Angeles Unified School
District | |
Series 2009,
3.000% 07/01/11 | | | 9,905,000 | | | | 9,964,529 | | |
FL Miami Dade County School
District | |
Series 1996,
Insured: NPFGC
5.000% 07/15/11 | | | 5,895,000 | | | | 5,970,692 | | |
| GA Whitfield County School District | |
Series 2009,
5.000% 04/01/11 | | | 3,250,000 | | | | 3,250,000 | | |
| IL Chicago Board of Education | |
Series 1999 A,
Insured: NPFGC
(d) 12/01/11 | | | 4,500,000 | | | | 4,446,495 | | |
Series 2010 F,
5.000% 12/01/15 | | | 2,000,000 | | | | 2,146,920 | | |
| IL County of Cook | |
Series 2009 C,
5.000% 11/15/12 | | | 4,000,000 | | | | 4,214,800 | | |
Series 2009 D,
5.000% 11/15/14 | | | 3,000,000 | | | | 3,241,650 | | |
KS Sedgwick County Unified
School District No. 259 | |
Series 2001,
Insured: AGMC
5.500% 09/01/11 | | | 5,100,000 | | | | 5,210,313 | | |
| KS Spring Hill | |
Series 2009 C,
2.000% 09/01/11 | | | 5,475,000 | | | | 5,492,958 | | |
| KS Topeka | |
Series 2009 B,
4.000% 08/15/11 | | | 5,700,000 | | | | 5,777,748 | | |
LA Orleans Parish Parishwide
School District | |
Series 2010,
Insured: AGMC:
4.000% 09/01/15 | | | 8,240,000 | | | | 8,675,978 | | |
| 5.000% 09/01/16 | | | 3,785,000 | | | | 4,148,890 | | |
| MA Plymouth | |
Series 2009,
3.000% 05/15/11 | | | 3,195,000 | | | | 3,205,639 | | |
| NM Albuquerque | |
Series 2009 A,
3.000% 07/01/11 | | | 6,085,000 | | | | 6,126,317 | | |
| | | Par ($) | | Value ($) | |
| NY New York City | |
Series 2005 J,
5.000% 03/01/16 | | | 8,000,000 | | | | 8,768,880 | | |
Series 2005 O,
5.000% 06/01/14 | | | 4,250,000 | | | | 4,703,688 | | |
Series 2007 A-1,
5.000% 08/01/12 | | | 3,000,000 | | | | 3,174,840 | | |
Series 2009 E,
5.000% 08/01/15 | | | 3,500,000 | | | | 3,924,375 | | |
| TN County of Rutherford | |
Series 2009,
4.000% 04/01/12 | | | 10,000,000 | | | | 10,341,500 | | |
TN Sevier County Public
Building Authority | |
Series 2009,
4.000% 06/01/11 | | | 7,500,000 | | | | 7,543,200 | | |
| TN Shelby County | |
Public Improvement,
Series 2001 A,
5.000% 04/01/11 | | | 6,250,000 | | | | 6,250,000 | | |
| TX Lubbock City | |
Series 2011,
5.000% 02/15/15 (e) | | | 1,250,000 | | | | 1,402,675 | | |
TX Plano Independent School
District | |
Series 2002,
Insured: PSFG
5.000% 02/15/12 | | | 3,335,000 | | | | 3,471,502 | | |
Series 2004,
Insured: PSFG
5.000% 02/15/12 | | | 7,000,000 | | | | 7,286,510 | | |
| VA Newport News | |
Series 2009 B,
3.250% 09/01/11 | | | 6,095,000 | | | | 6,172,467 | | |
| VA Norfolk City | |
Series 2011 A,
3.000% 01/01/14 | | | 3,250,000 | | | | 3,319,485 | | |
| VA Pittsylvania County | |
Series 2010 A,
3.500% 07/15/13 | | | 3,000,000 | | | | 3,019,710 | | |
| WA Seattle | |
Series 2009,
4.000% 05/01/11 | | | 8,655,000 | | | | 8,682,090 | | |
| Local General Obligations Total | | | 193,706,687 | | |
See Accompanying Notes to Financial Statements.
14
Columbia Short Term Municipal Bond Fund
March 31, 2011
| Municipal Bonds (continued) | |
| | | Par ($) | | Value ($) | |
| Special Non-Property Tax – 9.6% | |
| AR Fayetteville | |
Series 2005 B,
Insured: NPFGC
4.000% 12/01/11 | | | 6,830,000 | | | | 6,995,696 | | |
| CA State | |
Series 2004 A,
5.000% 07/01/15 | | | 1,690,000 | | | | 1,838,686 | | |
Series 2009 B,
5.000% 07/01/23
(07/01/14) (a)(b) | | | 14,500,000 | | | | 15,713,940 | | |
| CT State | |
Series 2001 B,
Insured: AGMC
5.375% 10/01/14 | | | 15,780,000 | | | | 16,140,889 | | |
| FL Citizens Property Insurance Corp. | |
Series 2007 A,
Insured: NPFGC
5.000% 03/01/13 | | | 15,000,000 | | | | 15,646,200 | | |
Series 2010 A-3,
2.000% 06/01/13
(04/07/11) (a)(b) | | | 10,000,000 | | | | 9,994,200 | | |
FL Department of Environmental
Protection | |
Series 2008 A,
5.000% 07/01/11 | | | 4,865,000 | | | | 4,919,877 | | |
| FL Jacksonville | |
Series 2010 A-1,
5.000% 10/01/16 | | | 8,985,000 | | | | 10,085,932 | | |
| GA Douglas County | |
Series 2011,
5.000% 08/01/12 | | | 4,000,000 | | | | 4,237,640 | | |
IL Metropolitan Pier & Exposition
Authority | |
Series 1996 A,
Insured: NPFGC
(d) 12/15/11 | | | 6,500,000 | | | | 6,419,985 | | |
| IL Regional Transportation Authority | |
Series 1999,
Insured: AGMC
5.750% 06/01/11 | | | 8,125,000 | | | | 8,192,844 | | |
KS Wyandotte County-Kansas
City Unified Government | |
Series 2010,
(d) 06/01/21 | | | 4,100,000 | | | | 2,205,841 | | |
| | | Par ($) | | Value ($) | |
| LA Regional Transit Authority | |
Series 2010,
Insured: AGMC:
4.000% 12/01/15 | | | 1,150,000 | | | | 1,228,223 | | |
| 4.000% 12/01/16 | | | 1,000,000 | | | | 1,062,720 | | |
| LA State Gas & Fuel Tax | |
Series 2010 A-1,
1.000% 05/01/43
(04/07/11) (a)(b) | | | 21,250,000 | | | | 21,219,400 | | |
| MA School Building Authority | |
Series 2005 A,
Insured: AGMC
5.000% 08/15/12 | | | 6,100,000 | | | | 6,470,514 | | |
MO Bi-State Development
Agency of the Missouri-Illinois
Metropolitan District | |
Series 2002 B,
5.250% 10/01/15 | | | 10,500,000 | | | | 11,255,475 | | |
| ND Fargo Sales Tax | |
Series 2009 D,
3.000% 11/01/11 | | | 5,040,000 | | | | 5,114,138 | | |
| NM State Severance Tax | |
Series 2009 A,
5.000% 07/01/14 | | | 7,895,000 | | | | 8,851,006 | | |
NY Local Government
Assistance Corp. | |
Series 2001 A-1,
5.000% 04/01/11 | | | 9,300,000 | | | | 9,300,000 | | |
NY New York City Transitional
Finance Authority | |
Series 2009 C1,
5.000% 08/01/14 | | | 6,795,000 | | | | 7,614,341 | | |
| RI Convention Center Authority | |
Series 2003 A,
Insured: AGMC
5.000% 05/15/16 | | | 5,610,000 | | | | 5,931,902 | | |
| TX Houston | |
Series 2001 B,
Insured: AMBAC
5.750% 09/01/12 | | | 3,590,000 | | | | 3,641,875 | | |
| TX Public Finance Authority | |
Series 2010 A,
5.000% 07/01/12 | | | 3,100,000 | | | | 3,274,003 | | |
See Accompanying Notes to Financial Statements.
15
Columbia Short Term Municipal Bond Fund
March 31, 2011
| Municipal Bonds (continued) | |
| | | Par ($) | | Value ($) | |
VI Virgin Islands Public
Finance Authority | |
Series 2009 B:
5.000% 10/01/11 | | | 2,500,000 | | | | 2,539,925 | | |
| 5.000% 10/01/12 | | | 4,145,000 | | | | 4,325,473 | | |
| Special Non-Property Tax Total | | | 194,220,725 | | |
| State Appropriated – 8.1% | |
| AL Public School & College Authority | |
Series 2009 A,
5.000% 05/01/14 | | | 9,000,000 | | | | 9,993,600 | | |
| AZ School Facilities Board | |
Series 2005 A-1,
5.000% 09/01/14 | | | 10,000,000 | | | | 10,827,300 | | |
Series 2008,
5.500% 09/01/13 | | | 8,000,000 | | | | 8,630,240 | | |
| AZ State | |
Series 2010 A,
Insured: AGMC
5.000% 10/01/15 | | | 5,000,000 | | | | 5,388,550 | | |
| CA Public Works Board | |
Series 2010 A-1:
5.000% 03/01/15 | | | 3,000,000 | | | | 3,202,590 | | |
| 5.000% 03/01/16 | | | 1,325,000 | | | | 1,410,873 | | |
CA Statewide Communities
Development Authority | |
Series 2009,
5.000% 06/15/13 | | | 20,945,000 | | | | 22,305,168 | | |
| KS Development Finance Authority | |
Series 2004 F,
Insured: AMBAC
5.250% 10/01/11 | | | 2,250,000 | | | | 2,303,393 | | |
| LA Facilities Authority Revenue | |
Hurricane Recovery Program,
Series 2007,
Insured: AMBAC
5.000% 06/01/11 | | | 3,000,000 | | | | 3,017,910 | | |
LA Local Government
Environmental Facilities &
Community Development Authority | |
LA Community & Technical College System,
Series 2009 A,
4.000% 10/01/14 | | | 1,545,000 | | | | 1,640,605 | | |
| LA Office Facilities Corp. | |
Series 2010,
5.000% 05/01/16 | | | 4,505,000 | | | | 4,843,100 | | |
| | | Par ($) | | Value ($) | |
| MI Building Authority | |
Series 2005 I,
Insured: AMBAC
5.000% 10/15/29
(10/15/11) (a)(b) | | | 12,000,000 | | | | 12,222,240 | | |
| NJ Building Authority | |
Series 2007 B,
5.000% 06/15/13 | | | 8,205,000 | | | | 8,756,376 | | |
NJ Economic Development
Authority | |
Series 1992 A,
(d) 03/15/13 | | | 4,500,000 | | | | 4,327,920 | | |
| NY Dormitory Authority | |
Series 2002 B,
Insured: NPFGC
5.250% 11/15/29
(05/15/12) (a)(b) | | | 10,000,000 | | | | 10,466,600 | | |
Series 2004,
Insured: NPFGC
5.000% 07/01/14 | | | 3,660,000 | | | | 4,017,179 | | |
Series 2009,
5.000% 02/15/13 | | | 13,505,000 | | | | 14,366,889 | | |
NY Thruway Authority
Service Contract | |
Local Highway & Bridge,
Series 2002,
5.500% 04/01/11 | | | 3,000,000 | | | | 3,000,000 | | |
Series 2008,
5.000% 04/01/12 | | | 5,245,000 | | | | 5,460,727 | | |
| OH Major New State Infrastructure | |
Series 2008-1,
5.000% 06/15/12 | | | 2,200,000 | | | | 2,315,390 | | |
OR Department of Administrative
Services | |
Series 2002 B,
Insured: NPFGC:
5.250% 05/01/15 | | | 6,020,000 | | | | 6,295,415 | | |
| 5.250% 05/01/16 | | | 6,085,000 | | | | 6,357,973 | | |
Series 2009 A,
5.000% 05/01/14 | | | 3,125,000 | | | | 3,457,000 | | |
| VA Public Building Authority | |
Series 2008,
5.000% 08/01/11 | | | 9,000,000 | | | | 9,141,840 | | |
| State Appropriated Total | | | 163,748,878 | | |
See Accompanying Notes to Financial Statements.
16
Columbia Short Term Municipal Bond Fund
March 31, 2011
| Municipal Bonds (continued) | |
| | | Par ($) | | Value ($) | |
| State General Obligations – 11.2% | |
| AK State | |
Series 2003 A,
Insured:AGMC
5.000% 08/01/14 | | | 14,000,000 | | | | 15,245,720 | | |
| CA State | |
Series 2004:
5.000% 04/01/11 | | | 1,850,000 | | | | 1,850,000 | | |
| 5.000% 12/01/15 | | | 2,200,000 | | | | 2,378,596 | | |
Series 2005,
5.000% 03/01/15 | | | 4,000,000 | | | | 4,428,640 | | |
Series 2006,
5.000% 03/01/14 | | | 4,000,000 | | | | 4,365,280 | | |
Series 2010:
4.000% 11/01/13 | | | 1,650,000 | | | | 1,750,634 | | |
| 4.000% 11/01/14 | | | 1,250,000 | | | | 1,339,563 | | |
| CT State | |
Series 2004 C,
Insured: NPFGC
5.000% 04/01/11 | | | 5,000,000 | | | | 5,000,000 | | |
Series 2009 B,
4.000% 06/01/11 | | | 15,000,000 | | | | 15,091,650 | | |
| FL Board of Education | |
Series 2005 A,
Insured: NPFGC
5.000% 06/01/11 | | | 4,090,000 | | | | 4,121,575 | | |
Series 2009 D,
5.000% 06/01/14 | | | 16,460,000 | | | | 18,333,313 | | |
| GA State | |
Series 1994 D,
6.800% 08/01/11 | | | 3,000,000 | | | | 3,063,960 | | |
| IL State | |
Series 2002,
Insured: NPFGC
5.500% 08/01/16 | | | 6,700,000 | | | | 6,831,454 | | |
Series 2009,
3.000% 04/01/11 | | | 6,000,000 | | | | 6,000,000 | | |
Series 2010:
5.000% 01/01/16 | | | 10,000,000 | | | | 10,472,200 | | |
Insured: AGMC
5.000% 01/01/16 | | | 4,250,000 | | | | 4,460,077 | | |
| LA State | |
Series 2005 A,
Insured: NPFGC
5.000% 08/01/12 | | | 10,000,000 | | | | 10,595,800 | | |
| | | Par ($) | | Value ($) | |
| MA State | |
Series 2010 A:
0.630% 02/01/13
(04/07/11) (a)(b) | | | 14,500,000 | | | | 14,500,580 | | |
0.780% 02/01/14
(04/07/11) (a)(b) | | | 5,050,000 | | | | 5,049,697 | | |
Series 2011 A:
0.730% 02/01/14
(04/07/11) (a)(b) | | | 5,400,000 | | | | 5,400,000 | | |
0.920% 02/01/15
(04/06/11) (a)(b) | | | 2,000,000 | | | | 2,000,000 | | |
| MI Finance Authority | |
Series 2010 D-1,
2.000% 08/19/11 | | | 6,400,000 | | | | 6,435,072 | | |
| MI State | |
Series 2008 A,
5.000% 05/01/12 | | | 3,670,000 | | | | 3,838,416 | | |
| NJ State | |
Series 2010 S,
5.000% 02/15/13 | | | 10,000,000 | | | | 10,707,500 | | |
| OH State | |
Series 2009 C,
5.000% 09/15/14 | | | 20,000,000 | | | | 22,390,200 | | |
| TX State | |
Series 2010, AMT,
5.000% 08/01/15 | | | 5,775,000 | | | | 6,415,159 | | |
Tax & Revenue Anticipation Notes,
Series 2010,
2.000% 08/31/11 | | | 20,000,000 | | | | 20,140,200 | | |
| UT State | |
Series 2009 C,
5.000% 07/01/14 | | | 2,500,000 | | | | 2,814,675 | | |
Series 2010 A,
5.000% 07/01/12 | | | 6,180,000 | | | | 6,532,445 | | |
| WV State | |
Sereis 2005,
Insured:NPFGC
5.000% 06/01/11 | | | 5,700,000 | | | | 5,744,802 | | |
| State General Obligations Total | | | 227,297,208 | | |
| Tax-Backed Total | | | 814,823,403 | | |
| Transportation – 12.8% | |
| Airports – 6.1% | |
| AZ Phoenix Civic Improvement Corp. | |
Series 2002 B, AMT,
Insured: NPFGC
5.750% 07/01/17 | | | 6,000,000 | | | | 6,177,540 | | |
See Accompanying Notes to Financial Statements.
17
Columbia Short Term Municipal Bond Fund
March 31, 2011
| Municipal Bonds (continued) | |
| | | Par ($) | | Value ($) | |
Series 2005 B,
Insured: NPFGC
5.000% 07/01/11 | | | 4,500,000 | | | | 4,553,010 | | |
Series 2008 D, AMT,
5.250% 07/01/11 | | | 2,600,000 | | | | 2,628,106 | | |
| CO Denver City & County Airport | |
Series 2008 A1, AMT,
5.000% 11/15/11 | | | 5,000,000 | | | | 5,128,350 | | |
DC Metropolitan Washington
Airports Authority | |
Series 2007 B, AMT,
Insured: AMBAC
5.000% 10/01/11 | | | 5,000,000 | | | | 5,108,000 | | |
Series 2010 B, AMT,
5.000% 10/01/12 | | | 3,300,000 | | | | 3,479,784 | | |
FL Broward County Airport
Systems Revenue | |
Series 1998 G, AMT,
Insured: AMBAC
4.500% 10/01/11 | | | 3,300,000 | | | | 3,309,471 | | |
| FL County of Lee | |
Series 2010 A, AMT,
Insured: AGMC
5.000% 10/01/12 | | | 1,500,000 | | | | 1,570,035 | | |
| FL Miami Dade County Aviation | |
Miami International Airport,
Series 2007 C, AMT,
Insured:AGMC
5.000% 10/01/13 | | | 3,500,000 | | | | 3,770,620 | | |
| GA Atlanta | |
Series 2003 D, AMT,
Insured: NPFGC
5.250% 01/01/15 | | | 5,000,000 | | | | 5,268,850 | | |
| HI State | |
Series 2010 B, AMT,
5.000% 07/01/15 | | | 7,000,000 | | | | 7,552,930 | | |
| IL City of Chicago | |
Series 2010 B,
5.000% 01/01/34
(01/01/15) (a)(b) | | | 5,500,000 | | | | 5,897,265 | | |
KY Louisville Regional
Airport Authority | |
Series 2008, AMT,
Insured: AGMC
5.000% 07/01/12 | | | 2,935,000 | | | | 3,073,268 | | |
| | | Par ($) | | Value ($) | |
| MA Port Authority | |
Series 2010 E, AMT:
5.000% 07/01/14 | | | 5,000,000 | | | | 5,381,200 | | |
| 5.000% 07/01/15 | | | 4,000,000 | | | | 4,325,120 | | |
| MI Wayne County Airport Authority | |
Series 2010 C,
5.000% 12/01/14 | | | 12,805,000 | | | | 13,624,264 | | |
MN Minneapolis - St. Paul
Metropolitan Airports Commission | |
Series 2009 B, AMT,
5.000% 01/01/14 | | | 2,055,000 | | | | 2,228,298 | | |
Series 2010 D, AMT,
5.000% 01/01/16 | | | 5,160,000 | | | | 5,484,151 | | |
| NV Clark County Airport | |
Series 2010 E2,
5.000% 07/01/12 | | | 7,000,000 | | | | 7,302,120 | | |
Series 2010,
3.000% 07/01/12 | | | 2,000,000 | | | | 2,035,880 | | |
TN Memphis-Shelby County
Airport Authority | |
Series 2010 B, AMT:
4.000% 07/01/15 | | | 2,060,000 | | | | 2,120,379 | | |
| 5.000% 07/01/16 | | | 1,000,000 | | | | 1,065,880 | | |
TX Dallas-Fort Worth International
Airport Facilities Improvement Corp. | |
Series 2009 A,
5.000% 11/01/14 | | | 3,000,000 | | | | 3,291,780 | | |
| TX Houston | |
Series 2002,
Insured: AGMC
5.500% 07/01/13 | | | 6,330,000 | | | | 6,654,412 | | |
| WA Port of Seattle | |
Series 2007 B, AMT,
Insured: AGMC
5.000% 10/01/11 | | | 5,580,000 | | | | 5,701,979 | | |
Series 2010 B AMT,
5.000% 12/01/15 | | | 7,000,000 | | | | 7,586,740 | | |
| Airports Total | | | 124,319,432 | | |
| Ports – 1.1% | |
| CA Port of Oakland | |
Series 2007 A, AMT,
Insured: NPFGC
5.000% 11/01/13 | | | 5,610,000 | | | | 5,922,253 | | |
See Accompanying Notes to Financial Statements.
18
Columbia Short Term Municipal Bond Fund
March 31, 2011
| Municipal Bonds (continued) | |
| | | Par ($) | | Value ($) | |
NY Port Authority of New York &
New Jersey | |
Series 2002, AMT,
Insured: AMBAC
5.500% 12/15/16 | | | 3,630,000 | | | | 3,791,353 | | |
Series 2003, AMT,
Insured: CIFG
5.000% 12/15/16 | | | 10,000,000 | | | | 10,568,300 | | |
| TX Port of Houston Authority | |
Series 2001 B, AMT,
Insured: NPFGC
5.500% 10/01/13 | | | 2,515,000 | | | | 2,566,331 | | |
| Ports Total | | | 22,848,237 | | |
| Toll Facilities – 3.2% | |
NY Buffalo & Fort Erie Public
Bridge Authority | |
Series 2005,
LOC: U.S. Bank N.A.
2.625% 01/01/25
(07/01/14) (a)(b) | | | 10,440,000 | | | | 10,467,248 | | |
| NY Thruway Authority | |
Series 2009,
4.000% 07/15/11 | | | 17,000,000 | | | | 17,179,860 | | |
NY Triborough Bridge &
Tunnel Authority | |
Series 2002 B,
5.250% 11/15/16 | | | 10,000,000 | | | | 10,657,900 | | |
| PA Turnpike Commission | |
Series 2001 S,
5.625% 06/01/12 | | | 7,750,000 | | | | 7,892,833 | | |
Series 2009 C:
0.770% 12/01/11
(04/07/11) (a)(b) | | | 6,500,000 | | | | 6,505,070 | | |
0.870% 12/01/12
(04/07/11) (a)(b) | | | 10,000,000 | | | | 10,000,800 | | |
| TX North Texas Tollway Authority | |
Series 2009 A,
5.000% 01/01/13 | | | 1,300,000 | | | | 1,372,475 | | |
| Toll Facilities Total | | | 64,076,186 | | |
| Transportation – 2.4% | |
| CO Regional Transportation District | |
Series 2010:
5.000% 06/01/15 | | | 1,420,000 | | | | 1,550,186 | | |
| 5.000% 06/01/16 | | | 2,010,000 | | | | 2,194,860 | | |
| | | Par ($) | | Value ($) | |
DE Transportation Authority
Motor Fuel Tax | |
Series 2008 A,
5.000% 07/01/11 | | | 3,385,000 | | | | 3,425,044 | | |
| IL Chicago Transit Authority | |
Series 2006 A,
5.000% 06/01/12 | | | 3,650,000 | | | | 3,781,254 | | |
| KS Department of Transportation | |
Series 2003 A,
5.000% 09/01/12 | | | 8,000,000 | | | | 8,509,440 | | |
NY Metropolitan Transportation
Authority | |
Series 2003 B,
5.250% 11/15/16 | | | 4,500,000 | | | | 4,807,215 | | |
Series 2008 B,
5.000% 11/15/16
(11/15/11) (a)(b) | | | 20,150,000 | | | | 20,649,317 | | |
| TX Transportation Commission | |
Series 2006 A,
5.000% 04/01/12 | | | 3,000,000 | | | | 3,137,430 | | |
| Transportation Total | | | 48,054,746 | | |
| Transportation Total | | | 259,298,601 | | |
| Utilities – 14.5% | |
| Investor Owned – 4.3% | |
AL Mobile Industrial Development
Board | |
Alabama Power Co.,
Series 2007 A,
4.750% 06/01/34
(03/19/12) (a)(b) | | | 2,000,000 | | | | 2,068,340 | | |
CA Infrastructure & Economic
Development Bank | |
Pacific Gas & Electric,
Series 2010 E,
2.250% 11/01/26
(04/02/12) (a)(b) | | | 6,000,000 | | | | 6,035,640 | | |
CA Pollution Control Financing
Authority | |
San Diego Gas & Electric Co.,
Series 1996 A,
5.900% 06/01/14 | | | 4,500,000 | | | | 4,965,615 | | |
| CT Development Authority | |
Connecticut Light & Power Co.,
Series 1996 A, AMT,
1.400% 05/01/31
(04/01/11) (a)(b) | | | 5,000,000 | | | | 5,000,000 | | |
See Accompanying Notes to Financial Statements.
19
Columbia Short Term Municipal Bond Fund
March 31, 2011
| Municipal Bonds (continued) | |
| | | Par ($) | | Value ($) | |
| FL Escambia County | |
Gulf Power Co.,
Series 2009,
2.000% 04/01/39
(04/03/12) (a)(b) | | | 5,000,000 | | | | 5,032,800 | | |
GA Burke County Development
Authority | |
Georgia Power Co.,
Series 1994,
3.750% 10/01/32
(01/12/12) (a)(b) | | | 16,025,000 | | | | 16,360,884 | | |
| LA Public Facilities Authority | |
Cleco Power LLC,
Series 2008,
7.000% 12/01/38
(12/01/11) (a)(b) | | | 4,000,000 | | | | 4,120,720 | | |
Series 2010 B,
2.875% 11/01/15 | | | 2,750,000 | | | | 2,727,890 | | |
| MI Strategic Fund | |
The Detroit Edison Co.,
Series 2009,
3.050% 08/01/24
(12/03/12) (a)(b) | | | 5,000,000 | | | | 5,098,200 | | |
| NH Business Finance Authority | |
United Illuminating Co.:
Series 2009 A, AMT,
6.875% 12/01/29
(02/01/12) (a)(b) | | | 2,000,000 | | | | 2,084,360 | | |
Series 2009 AMT,
7.125% 07/01/27
(02/01/12) (a)(b) | | | 4,000,000 | | | | 4,177,360 | | |
| NJ Salem County Utilities Authority | |
Public Service Electric & Gas,
Series 2010 A,
0.950% 05/01/28
(11/01/11) (a)(b) | | | 4,500,000 | | | | 4,498,695 | | |
| OH Air Quality Development Authority | |
Columbus Southern Power Co.,
Series 2009 A,
3.875% 12/01/38
(06/01/14) (a)(b) | | | 3,400,000 | | | | 3,445,934 | | |
Ohio Power Co.:
Series 2010 A,
3.250% 06/01/41
(06/02/14) (a)(b) | | | 6,150,000 | | | | 6,199,692 | | |
Series 2010 A, AMT,
2.875% 12/01/27
(08/01/14) (a)(b) | | | 3,130,000 | | | | 3,122,832 | | |
| | | Par ($) | | Value ($) | |
VA Louisa Industrial Development
Authority | |
Virginia Electric & Power Co.,
Series 1997 A, AMT,
1.375% 04/01/22
(04/01/11) (a)(b) | | | 3,500,000 | | | | 3,500,000 | | |
VA York County Economic
Development Authority | |
Virginia Electric & Power Co.,
Series 2009 A,
4.050% 05/01/33
(05/01/14) (a)(b) | | | 3,500,000 | | | | 3,658,585 | | |
| WV Economic Development Authority | |
Appalachian Power Co,
Series 2011 A AMT,
2.000% 01/01/41
(08/01/12) (a)(b) | | | 4,000,000 | | | | 4,011,400 | | |
| Investor Owned Total | | | 86,108,947 | | |
| Joint Power Authority – 5.4% | |
AL Chatom Industrial
Development Board | |
Powersouth Energy Coop,
Series 2010 B:
2.000% 08/01/11 | | | 5,895,000 | | | | 5,909,679 | | |
| 4.000% 08/01/12 | | | 5,895,000 | | | | 6,077,804 | | |
CA Infrastructure & Economic
Development Bank | |
Independent System Operator Corp.,
Series 2008 A,
5.000% 02/01/13 | | | 6,000,000 | | | | 6,297,720 | | |
| CA Northern California Power Agency | |
Series 2010 A,
4.000% 07/01/15 | | | 1,355,000 | | | | 1,414,972 | | |
| GA Municipal Electric Authority | |
Series 1998 Y,
Insured: AGMC
6.500% 01/01/17 | | | 6,300,000 | | | | 7,209,556 | | |
Series 2008 A,
5.000% 01/01/12 | | | 2,000,000 | | | | 2,063,420 | | |
| MN Municipal Power Agency | |
Series 2010 B,
4.000% 10/01/13 | | | 3,000,000 | | | | 3,057,510 | | |
| NC Eastern Municipal Power Agency | |
Series 2003 F,
5.375% 01/01/13 | | | 7,000,000 | | | | 7,446,530 | | |
See Accompanying Notes to Financial Statements.
20
Columbia Short Term Municipal Bond Fund
March 31, 2011
| Municipal Bonds (continued) | |
| | | Par ($) | | Value ($) | |
| NC Municipal Power Agency No. 1 | |
Series 2003 A,
5.250% 01/01/15 | | | 2,000,000 | | | | 2,120,060 | | |
| ND McLean County | |
Great River Energy,
Series 2010 C, AMT,
3.500% 07/01/38
(07/01/15) (a)(b) | | | 13,000,000 | | | | 13,179,270 | | |
| OK Grand River Dam Authority | |
Series 1995,
Insured: AMBAC
6.250% 06/01/11 | | | 13,590,000 | | | | 13,707,689 | | |
| SC Public Service Authority | |
Series 2009 E,
5.000% 01/01/14 | | | 1,500,000 | | | | 1,658,445 | | |
| TX Lower Colorado River Authority | |
Series 2010:
5.000% 05/15/14 | | | 2,230,000 | | | | 2,462,767 | | |
| 5.000% 05/15/15 | | | 4,000,000 | | | | 4,469,960 | | |
| UT Intermountain Power Agency | |
Series 2008 A,
5.250% 07/01/11 | | | 7,000,000 | | | | 7,084,210 | | |
Series 2009 A,
5.000% 07/01/13 | | | 10,000,000 | | | | 10,812,000 | | |
WA Energy Northwest Washington
Electric Revenue | |
Refunding Project No. 1A,
Series 2002,
Insured: NPFGC
5.500% 07/01/15 | | | 5,000,000 | | | | 5,286,800 | | |
| WA Energy Northwest | |
Series 1992 A,
6.300% 07/01/12 | | | 9,000,000 | | | | 9,635,760 | | |
| Joint Power Authority Total | | | 109,894,152 | | |
| Municipal Electric – 3.0% | |
| CA Department of Water Resources | |
Series 2002 A,
Insured: AGMC
5.250% 05/01/12 | | | 4,200,000 | | | | 4,408,404 | | |
Series 2010,
5.000% 05/01/12 | | | 3,500,000 | | | | 3,672,165 | | |
| FL JEA | |
Series 2002,
5.250% 10/01/12 | | | 4,910,000 | | | | 5,020,475 | | |
| | | Par ($) | | Value ($) | |
| FL Kissimmee Utility Authority | |
Series 2001,
Insured: AMBAC
5.000% 10/01/14 | | | 7,195,000 | | | | 7,335,159 | | |
| FL Lakeland Energy System | |
Series 2009,
1.000% 10/01/12
(04/07/11) (a)(b) | | | 13,475,000 | | | | 13,479,312 | | |
| NE Lincoln | |
Series 2002,
5.000% 09/01/14 | | | 5,000,000 | | | | 5,269,600 | | |
| NM Los Alamos County, Inc. | |
Series 2004 A,
Insured: AGO
5.000% 07/01/15 | | | 2,555,000 | | | | 2,699,562 | | |
| NY Long Island Power Authority | |
Series 2003 B,
5.250% 06/01/13 | | | 4,250,000 | | | | 4,602,197 | | |
TX Lubbock Electric Light &
Power System | |
Series 2010:
4.000% 04/15/12 | | | 1,595,000 | | | | 1,646,614 | | |
| 4.000% 04/15/15 | | | 1,250,000 | | | | 1,330,313 | | |
| 5.000% 04/15/16 | | | 1,500,000 | | | | 1,660,080 | | |
WA Clark County Public Utility
District No. 1 | |
Series 2010,
5.000% 01/01/15 | | | 2,900,000 | | | | 3,163,320 | | |
WA Seattle Municipal
Light & Power | |
Series 2004,
Insured: AGMC
5.000% 08/01/15 | | | 6,000,000 | | | | 6,622,620 | | |
| Municipal Electric Total | | | 60,909,821 | | |
| Water & Sewer – 1.8% | |
| AR Development Finance Authority | |
Series 2004 A,
5.000% 12/01/12 | | | 2,435,000 | | | | 2,452,069 | | |
| AZ Pima County Sewer Revenue | |
Series 2011 A:
5.000% 07/01/12 | | | 1,000,000 | | | | 1,050,010 | | |
| 5.000% 07/01/13 | | | 1,250,000 | | | | 1,347,738 | | |
| CA Los Angeles | |
Series 2009 A,
5.000% 06/01/12 | | | 6,040,000 | | | | 6,347,376 | | |
See Accompanying Notes to Financial Statements.
21
Columbia Short Term Municipal Bond Fund
March 31, 2011
| Municipal Bonds (continued) | |
| | | Par ($) | | Value ($) | |
FL Orlando Utilities Commission
Water & Electric | |
Series 2008,
3.500% 10/01/25
(10/01/12) (a)(b) | | | 10,500,000 | | | | 10,637,656 | | |
| IL Chicago Wastewater Transmission | |
Series 1993,
Insured: NPFGC
5.375% 01/01/13 | | | 1,870,000 | | | | 1,933,673 | | |
TX Dallas Waterworks &
Sewer Systems Revenue | |
Series 2007,
Insured: AMBAC
5.000% 10/01/12 | | | 5,000,000 | | | | 5,335,800 | | |
| TX Houston Water & Sewer System | |
Series 1991 C,
Insured: AMBAC
(d) 12/01/11 | | | 5,000,000 | | | | 4,976,450 | | |
TX Titus County Fresh Water
Supply District | |
Southwestern Electric Power Co.,
Series 2008,
4.500% 07/01/11 | | | 1,000,000 | | | | 1,007,130 | | |
| WA King County Sewer Revenue | |
Series 2002 B,
Insured: AGMC
5.500% 01/01/14 | | | 2,000,000 | | | | 2,068,420 | | |
| Water & Sewer Total | | | 37,156,322 | | |
| Utilities Total | | | 294,069,242 | | |
Total Municipal Bonds
(cost of $1,926,320,817) | | | 1,946,229,914 | | |
| Investment Company – 0.7% | |
| | | Shares | | | |
BofA Tax-Exempt Reserves,
Capital Class
(7 day yield of 0.110%) (f) | | | 15,324,354 | | | | 15,324,354 | | |
Total Investment Company
(cost of $15,324,354) | | | 15,324,354 | | |
| Short-Term Obligations – 2.4% | |
| | | Par ($) | | Value ($) | |
| Variable Rate Demand Notes (g) – 2.4% | |
| IA Finance Authority | |
Village Court Associates,
Series 1985 B,
GTY AGMT: E.I. DuPont De Nemours
0.340% 11/01/35
(04/07/11) (a)(b) | | | 10,000,000 | | | | 10,000,000 | | |
| IN Finance Authority | |
Duke Energy, Inc.,
Series 2003 A, AMT,
0.590% 12/01/38
(04/06/11) (a)(b) | | | 12,000,000 | | | | 12,000,000 | | |
NY Clinton County Industrial
Development Agency | |
Champlain Valley Physicians,
Series 2006 A,
LOC: Keybank N.A.
0.540% 07/01/17
(04/07/11) (a)(b) | | | 8,655,000 | | | | 8,655,000 | | |
OH Higher Educational Facility
Commission | |
Series 2006 A,
LOC: Fifth Third Bank
1.000% 09/01/36
(04/07/11) (a)(b) | | | 18,000,000 | | | | 18,000,000 | | |
| Variable Rate Demand Notes Total | | | 48,655,000 | | |
Total Short-Term Obligations
(cost of $48,655,000) | | | 48,655,000 | | |
Total Investments – 99.2%
(cost of $1,990,300,171) (h) | | | 2,010,209,268 | | |
| Other Assets & Liabilites, Net – 0.8% | | | 15,287,838 | | |
| Net Assets – 100.0% | | | 2,025,497,106 | | |
Notes to Investment Portfolio:
(a) The interest rate shown on floating rate or variable rate securities reflects the rate at March 31, 2011.
(b) Parenthetical date represents the next interest rate reset date for the security.
(c) The Fund has been informed that each issuer has placed direct obligations of the U.S. Government in an irrevocable trust, solely for the payment of principal and interest.
(d) Zero coupon bond.
(e) Security purchased on a delayed delivery basis.
See Accompanying Notes to Financial Statements.
22
Columbia Short Term Municipal Bond Fund
March 31, 2011
(f) Investments in affiliates during the year ended March 31, 2011:
| Affiliate | | Value,
beginning of
period | | Purchases | | Sales
Proceeds | | Dividend
Income | | Value,
ended of
period | |
BofA
Tax-Exempt
Reserves,
Capital Class
(7 day yield
of 0.110%) | | $ | 8,152,375 | | | $ | 120,426,296 | | | $ | 96,471,671 | | | $ | 2,413 | | | $ | — | | |
As of May 1, 2010, this company was no longer an affiliate of the Fund. The above table reflects activity for the period from April 1, 2010, through April 30, 2010.
(g) Variable rate demand notes. These securities are payable upon demand and are secured by letters of credit or other credit support agreements from banks. The interest rates change periodically and the interest rates shown reflect the rates at March 31, 2011.
(h) Cost for federal income tax purposes is $1,990,580,421.
Generally accepted accounting principles (GAAP) require disclosure regarding the inputs and valuation techniques used to measure fair value and any changes in valuation inputs or techniques. In addition, investments shall be disclosed by major category.
The Fund categorizes its fair value measurements according to a three-level hierarchy that maximizes the use of observable inputs and minimizes the use of unobservable inputs by prioritizing that the most observable input be used when available. Observable inputs are those that market participants would use in pricing an investment based on market data obtained from sources independent of the reporting entity. Unobservable inputs are those that reflect the Fund's assumptions about the information market participants would use in pricing an investment. An investment's level within the fair value hierarchy is based on the lowest level of any input that is deemed significant to the asset or liability's fair value measurement. The input levels are not necessarily an indication of the risk or liquidity associated with investments at that level. For example, certain U.S. government securities are generally high quality and liquid, however, they are reflected as Level 2 because the inputs used to determine fair value may not always be quoted prices in an active market.
Fair value inputs are summarized in the three broad levels listed below:
• Level 1—Valuations based on quoted prices for investments in active markets that the Fund has the ability to access at the measurement date (including NAV for open-end mutual funds). Valuation adjustments are not applied to Level 1 investments.
• Level 2—Valuations based on other significant observable inputs (including quoted prices for similar securities, interest rates, prepayment speeds, credit risks, etc.).
• Level 3—Valuations based on significant unobservable inputs (including the Fund's own assumptions and judgment in determining the fair value of investments).
Inputs that are used in determining fair value of an investment may include price information, credit data, volatility statistics, and other factors. These inputs can be either observable or unobservable. The availability of observable inputs can vary between investments, and is affected by various factors such as the type of investment, and the volume and level of activity for that investment or similar investments in the marketplace. The inputs will be considered by the Investment Manager, along with any other relevant factors in the calculation of an investment's fair value. The Fund uses prices and inputs that are current as of the measurement date, which may include periods of market dislocations. During these periods, the availability of prices and inputs may be reduced for many investments. This condition could cause an investment to be reclassified between the various levels within the hierarchy.
Investments falling into the Level 3 category are primarily supported by quoted prices from brokers and dealers participating in the market for those investments. However, these may be classified as Level 3 investments due to lack of market transparency and corroboration to support these quoted prices. Additionally, valuation models may be used as the pricing source for any remaining investments classified as Level 3. These models rely on one or more significant unobservable inputs and/or significant assumptions by the
Investment Manager. Inputs used in valuations may include, but are not limited to, financial statement analysis, capital account balances, discount rates and estimated cash flows, and comparable company data.
The following table is a summary of the inputs used to value the Fund's investments as of March 31, 2011:
| Description | | Quoted
Prices
(Level 1) | | Other
Significant
Observable
Inputs
(Level 2) | | Significant
Unobservable
Inputs
(Level 3) | | Total | |
| Total Municipal Bonds | | $ | — | | | $ | 1,946,229,914 | | | $ | — | | | $ | 1,946,229,914 | | |
Total Investment
Company | | | 15,324,354 | | | | — | | | | — | | | | 15,324,354 | | |
Total Short-Term
Obligations | | | — | | | | 48,655,000 | | | | — | | | | 48,655,000 | | |
| Total Investments | | $ | 15,324,354 | | | $ | 1,994,884,914 | | | $ | — | | | $ | 2,010,209,268 | | |
The Fund's assets assigned to the Level 2 input category are generally valued using the market approach, in which a security's value is determined through its correlation to prices and information from market transactions for similar or identical assets.
Certain short-term obligations may be valued using amortized cost, an income approach which converts future cash flows to a present value based upon the discount or premium at purchase.
There were no significant transfers of financial assets between Levels 1 and 2 during the period.
At March 31, 2011, the composition of the Fund by revenue source is as follows:
| Holdings By Revenue Source (Unaudited) | | % of
Net Assets | |
| Tax-Backed | | | 40.2 | | |
| Utilities | | | 14.5 | | |
| Transportation | | | 12.8 | | |
| Other | | | 10.0 | | |
| Health Care | | | 8.4 | | |
| Education | | | 4.8 | | |
| Housing | | | 1.8 | | |
| Industrials | | | 1.7 | | |
| Resource Recovery | | | 1.2 | | |
| Other Revenue | | | 0.7 | | |
| | | | 96.1 | | |
| Investment Company | | | 0.7 | | |
| Short-Term Obligations | | | 2.4 | | |
| Other Assets & Liabilities, Net | | | 0.8 | | |
| | | | 100.0 | | |
| Acronym | | Name | |
| AGMC | | Assured Guaranty Municipal Corp. | |
|
| AGO | | Assured Guaranty Ltd. | |
|
| AMBAC | | Ambac Assurance Corp. | |
|
| AMT | | Alternative Minimum Tax | |
|
| CIFG | | CIFG Assurance North America, Inc. | |
|
| FGIC | | Financial Guaranty Insurance Co. | |
|
| FNMA | | Federal National Mortgage Association | |
|
| GNMA | | Government National Mortgage Association | |
|
| GTY AGMT | | Guaranty Agreement | |
|
| LIQ FAC | | Liquidity Facility | |
|
| LOC | | Letter of Credit | |
|
| NPFGC | | National Public Finance Guarantee Corp. | |
|
| PSFG | | Permanent School Fund Guarantee | |
|
See Accompanying Notes to Financial Statements.
23
Statement of Assets and Liabilities – Columbia Short Term Municipal Bond Fund
March 31, 2011
| | | | | ($) | |
| Assets | | Investments, at identified cost | | | 1,990,300,171 | | |
| | | Investments, at value | | | 2,010,209,268 | | |
| | | Cash | | | 884 | | |
| | | Receivable for: | | | |
| | | Fund shares sold | | | 2,239,833 | | |
| | | Interest | | | 24,602,499 | | |
| | | Expense reimbursement due from Investment Manager | | | 355,032 | | |
| | | Prepaid expenses | | | 4,996 | | |
| | | Total Assets | | | 2,037,412,512 | | |
| Liabilities | | Payable for: | | | | | |
| | | Investments purchased on a delayed delivery basis | | | 1,407,925 | | |
| | | Fund shares repurchased | | | 6,377,030 | | |
| | | Distributions | | | 2,602,137 | | |
| | | Investment advisory fee | | | 456,889 | | |
| | | Administration fee | | | 249,727 | | |
| | | Pricing and bookkeeping fees | | | 20,138 | | |
| | | Transfer agent fee | | | 531,666 | | |
| | | Trustees' fees | | | 68,300 | | |
| | | Custody fee | | | 9,713 | | |
| | | Distribution and service fees | | | 97,298 | | |
| | | Chief compliance officer expenses | | | 801 | | |
| | | Interest payable | | | 119 | | |
| | | Other liabilities | | | 93,663 | | |
| | | Total Liabilities | | | 11,915,406 | | |
| | | Net Assets | | | 2,025,497,106 | | |
| Net Assets Consist of | | Paid-in capital | | | 2,017,023,636 | | |
| | | Undistributed net investment income | | | 73,430 | | |
| | | Accumulated net realized loss | | | (11,509,057 | ) | |
| | | Net unrealized appreciation on investments | | | 19,909,097 | | |
| | | Net Assets | | | 2,025,497,106 | | |
See Accompanying Notes to Financial Statements.
24
Statement of Assets and Liabilities (continued) – Columbia Short Term Municipal Bond Fund
March 31, 2011
| Class A | | Net assets | | $ | 281,009,339 | | |
| | | Shares outstanding | | | 26,833,436 | | |
| | | Net asset value per share | | $ | 10.47 | (a) | |
| | | Maximum sales charge | | | 1.00 | % | |
| | | Maximum offering price per share ($10.47/0.9900) | | $ | 10.58 | (b) | |
| Class B | | Net assets | | $ | 325,116 | | |
| | | Shares outstanding | | | 31,045 | | |
| | | Net asset value offering and redemption price per share | | $ | 10.47 | | |
| Class C | | Net assets | | $ | 40,602,960 | | |
| | | Shares outstanding | | | 3,876,752 | | |
| | | Net asset value and offering price per share | | $ | 10.47 | (a) | |
| Class Z | | Net assets | | $ | 1,703,559,691 | | |
| | | Shares outstanding | | | 162,658,742 | | |
| | | Net asset value, offering and redemption price per share | | $ | 10.47 | | |
(a) Redemption price per share is equal to net asset value less any applicable contingent deferred sales charge.
(b) On sales of $100,000 or more the offering price is reduced.
See Accompanying Notes to Financial Statements.
25
Statement of Operations – Columbia Short Term Municipal Bond Fund
For the Year Ended March 31, 2011
| | | | | ($) | |
| Investment Income | | Interest | | | 52,603,467 | | |
| | | Dividends | | | 36,148 | | |
| | | Dividends from affiliates | | | 2,413 | | |
| | | Total investment income | | | 52,642,028 | | |
| Expenses | | Investment advisory fee | | | 6,098,277 | | |
| | | Administration fee | | | 3,369,326 | | |
| | | Distribution fee: | | | |
| | | Class B | | | 2,533 | | |
| | | Class C | | | 383,067 | | |
| | | Service fee: | | | |
| | | Class B | | | 845 | | |
| | | Class C | | | 127,690 | | |
| | | Distribution and service fees: | | | |
| | | Class A | | | 976,179 | | |
| | | Transfer agent fee | | | 2,093,123 | | |
| | | Pricing and bookkeeping fees | | | 192,867 | | |
| | | Trustees' fees | | | 62,274 | | |
| | | Custody fee | | | 67,742 | | |
| | | Chief compliance officer expenses | | | 3,459 | | |
| | | Other expenses | | | 470,944 | | |
| | | Expenses before interest expense | | | 13,848,326 | | |
| | | Interest expense | | | 119 | | |
| | | Total Expenses | | | 13,848,445 | | |
| | | Fees waived or expenses reimbursed by Investment Manager | | | (662,933 | ) | |
| | | Interest expense reimbursement by Investment Manager | | | (119 | ) | |
| | | Expense reductions | | | (321 | ) | |
| | | Net Expenses | | | 13,185,072 | | |
| | | Net Investment Income | | | 39,456,956 | | |
| Net Realized and Unrealized Loss on Investments | | Net realized loss on investments | | | (876,253 | ) | |
| | | Net change in unrealized appreciation (depreciation) on investments | | | (15,352,790 | ) | |
| | | Net Loss | | | (16,229,043 | ) | |
| | | Net Increase Resulting from Operations | | | 23,227,913 | | |
See Accompanying Notes to Financial Statements.
26
Statement of Changes in Net Assets – Columbia Short Term Municipal Bond Fund
| | | | | Year Ended March 31, | |
| Increase (Decrease) in Net Assets | | | | 2011 ($) | | 2010 ($) | |
| Operations | | Net investment income | | | 39,456,956 | | | | 36,072,956 | | |
| | | Net realized gain (loss) on investments | | | (876,253 | ) | | | 159,968 | | |
| | | Net change in unrealized appreciation (depreciation)
on investments | | | (15,352,790 | ) | | | 15,106,965 | | |
| | | Net increase resulting from operations | | | 23,227,913 | | | | 51,339,889 | | |
| Distributions to Shareholders | | From net investment income: | | | | | |
| | | Class A | | | (5,845,572 | ) | | | (5,907,846 | ) | |
| | | Class B | | | (2,562 | ) | | | (3,989 | ) | |
| | | Class C | | | (383,703 | ) | | | (425,275 | ) | |
| | | Class Z | | | (33,225,119 | ) | | | (29,735,846 | ) | |
| | | Total distributions to shareholders | | | (39,456,956 | ) | | | (36,072,956 | ) | |
| | | Net Capital Stock Transactions | | | (523,375,361 | ) | | | 1,262,297,659 | | |
| | | Increase from regulatory settlements | | | — | | | | 1,276 | | |
| | | Total increase (decrease) in net assets | | | (539,604,404 | ) | | | 1,277,565,868 | | |
| Net Assets | | Beginning of period | | | 2,565,101,510 | | | | 1,287,535,642 | | |
| | | End of period | | | 2,025,497,106 | | | | 2,565,101,510 | | |
| | | Undistributed net investment income at
end of period | | | 73,430 | | | | 73,550 | | |
See Accompanying Notes to Financial Statements.
27
Statement of Changes in Net Assets (continued) – Columbia Short Term Municipal Bond
| | | Capital Stock Activity | |
| | | Year Ended
March 31, 2011 | | Year Ended
March 31, 2010 | |
| | | Shares | | Dollars ($) | | Shares | | Dollars ($) | |
| Class A | |
| Subscriptions | | | 12,279,571 | | | | 129,517,642 | | | | 40,601,310 | | | | 427,132,076 | | |
| Distributions reinvested | | | 313,484 | | | | 3,303,797 | | | | 414,761 | | | | 4,366,715 | | |
| Redemptions | | | (31,778,107 | ) | | | (334,757,283 | ) | | | (15,035,039 | ) | | | (158,399,815 | ) | |
| Net increase (decrease) | | | (19,185,052 | ) | | | (201,935,844 | ) | | | 25,981,032 | | | | 273,098,976 | | |
| Class B | |
| Subscriptions | | | 771 | | | | 8,128 | | | | — | | | | — | | |
| Distributions reinvested | | | 115 | | | | 1,216 | | | | 361 | | | | 3,794 | | |
| Redemptions | | | (1,233 | ) | | | (12,926 | ) | | | (12,797 | ) | | | (135,133 | ) | |
| Net decrease | | | (347 | ) | | | (3,582 | ) | | | (12,436 | ) | | | (131,339 | ) | |
| Class C | |
| Subscriptions | | | 855,755 | | | | 9,024,645 | | | | 3,720,975 | | | | 39,124,683 | | |
| Distributions reinvested | | | 15,439 | | | | 162,652 | | | | 21,795 | | | | 229,301 | | |
| Redemptions | | | (2,542,799 | ) | | | (26,774,517 | ) | | | (1,325,966 | ) | | | (13,975,192 | ) | |
| Net increase (decrease) | | | (1,671,605 | ) | | | (17,587,220 | ) | | | 2,416,804 | | | | 25,378,792 | | |
| Class Z | |
| Subscriptions | | | 75,831,499 | | | | 799,144,349 | | | | 163,803,147 | | | | 1,724,078,530 | | |
| Distributions reinvested | | | 310,136 | | | | 3,266,953 | | | | 262,626 | | | | 2,765,331 | | |
| Redemptions | | | (105,049,996 | ) | | | (1,106,260,017 | ) | | | (72,404,339 | ) | | | (762,892,631 | ) | |
| Net increase (decrease) | | | (28,908,361 | ) | | | (303,848,715 | ) | | | 91,661,434 | | | | 963,951,230 | | |
See Accompanying Notes to Financial Statements.
28
Financial Highlights – Columbia Short Term Municipal Bond Fund
Selected data for a share outstanding throughout each period is as follows:
| | | Year Ended March 31, | |
| Class A Shares | | 2011 | | 2010 | | 2009 | | 2008 | | 2007 | |
| Net Asset Value, Beginning of Period | | $ | 10.55 | | | $ | 10.46 | | | $ | 10.32 | | | $ | 10.17 | | | $ | 10.14 | | |
| Income from Investment Operations: | |
| Net investment income (a) | | | 0.16 | | | | 0.17 | | | | 0.27 | | | | 0.32 | | | | 0.30 | | |
| Net realized and unrealized gain (loss) on investments | | | (0.08 | ) | | | 0.09 | | | | 0.15 | | | | 0.15 | | | | 0.03 | | |
| Total from investment operations | | | 0.08 | | | | 0.26 | | | | 0.42 | | | | 0.47 | | | | 0.33 | | |
| Less Distributions to Shareholders: | |
| From net investment income | | | (0.16 | ) | | | (0.17 | ) | | | (0.28 | ) | | | (0.32 | ) | | | (0.30 | ) | |
| Increase from regulatory settlements | | | — | | | | — | (b) | | | — | | | | — | | | | — | | |
| Net Asset Value, End of Period | | $ | 10.47 | | | $ | 10.55 | | | $ | 10.46 | | | $ | 10.32 | | | $ | 10.17 | | |
| Total return (c)(d) | | | 0.75 | % | | | 2.53 | % | | | 4.14 | % | | | 4.66 | % | | | 3.30 | % | |
| Ratios to Average Net Assets/Supplemental Data: | |
| Net expenses before interest expense (e) | | | 0.75 | % | | | 0.72 | % | | | 0.65 | % | | | 0.65 | % | | | 0.65 | % | |
| Interest expense (f) | | | — | %(g) | | | — | % | | | — | % | | | — | % | | | — | % | |
| Net expenses (e) | | | 0.75 | % | | | 0.72 | % | | | 0.65 | % | | | 0.65 | % | | | 0.65 | % | |
| Waiver/Reimbursement | | | 0.03 | % | | | 0.01 | % | | | 0.07 | % | | | 0.11 | % | | | 0.11 | % | |
| Net investment income (e) | | | 1.50 | % | | | 1.57 | % | | | 2.60 | % | | | 3.09 | % | | | 2.95 | % | |
| Portfolio turnover rate | | | 38 | % | | | 62 | % | | | 94 | % | | | 73 | % | | | 98 | % | |
| Net assets, end of period (000s) | | $ | 281,009 | | | $ | 485,404 | | | $ | 209,539 | | | $ | 31,952 | | | $ | 32,855 | | |
(a) Per share data was calculated using the average shares outstanding during the period.
(b) Rounds to less than $0.01 per share.
(c) Total return at net asset value assuming all distributions reinvested and no initial sales charge or contingent deferred sales charge.
(d) Had the Investment Manager and/or any of its affiliates not waived fees or reimbursed a portion of expenses, total return would have been reduced.
(e) The benefits derived from expense reductions had an impact of less than 0.01%.
(f) Rounds to less than 0.01%.
(g) The Investment Manager reimbursed interest expense which had an impact of less than 0.01%.
See Accompanying Notes to Financial Statements.
29
Financial Highlights – Columbia Short Term Municipal Bond Fund
Selected data for a share outstanding throughout each period is as follows:
| | | Year Ended March 31, | |
| Class B Shares | | 2011 | | 2010 | | 2009 | | 2008 | | 2007 | |
| Net Asset Value, Beginning of Period | | $ | 10.55 | | | $ | 10.46 | | | $ | 10.32 | | | $ | 10.17 | | | $ | 10.14 | | |
| Income from Investment Operations: | |
| Net investment income (a) | | | 0.08 | | | | 0.10 | | | | 0.20 | | | | 0.24 | | | | 0.22 | | |
| Net realized and unrealized gain (loss) on investments | | | (0.08 | ) | | | 0.08 | | | | 0.14 | | | | 0.15 | | | | 0.03 | | |
| Total from investment operations | | | 0.00 | | | | 0.18 | | | | 0.34 | | | | 0.39 | | | | 0.25 | | |
| Less Distributions to Shareholders: | |
| From net investment income | | | (0.08 | ) | | | (0.09 | ) | | | (0.20 | ) | | | (0.24 | ) | | | (0.22 | ) | |
| Increase from regulatory settlements | | | — | | | | — | (b) | | | — | | | | — | | | | — | | |
| Net Asset Value, End of Period | | $ | 10.47 | | | $ | 10.55 | | | $ | 10.46 | | | $ | 10.32 | | | $ | 10.17 | | |
| Total return (c)(d) | | | 0.00 | %(e) | | | 1.77 | % | | | 3.37 | % | | | 3.88 | % | | | 2.54 | % | |
| Ratios to Average Net Assets/Supplemental Data: | |
| Net expenses before interest expense (f) | | | 1.50 | % | | | 1.47 | % | | | 1.40 | % | | | 1.40 | % | | | 1.40 | % | |
| Interest expense (e) | | | — | %(g) | | | — | % | | | — | % | | | — | % | | | — | % | |
| Net expenses (f) | | | 1.50 | % | | | 1.47 | % | | | 1.40 | % | | | 1.40 | % | | | 1.40 | % | |
| Waiver/Reimbursement | | | 0.03 | % | | | 0.01 | % | | | 0.07 | % | | | 0.11 | % | | | 0.11 | % | |
| Net investment income (f) | | | 0.76 | % | | | 0.91 | % | | | 1.98 | % | | | 2.35 | % | | | 2.20 | % | |
| Portfolio turnover rate | | | 38 | % | | | 62 | % | | | 94 | % | | | 73 | % | | | 98 | % | |
| Net assets, end of period (000s) | | $ | 325 | | | $ | 331 | | | $ | 458 | | | $ | 615 | | | $ | 739 | | |
(a) Per share data was calculated using the average shares outstanding during the period.
(b) Rounds to less than $0.01 per share.
(c) Total return at net asset value assuming all distributions reinvested.
(d) Had the Investment Manager and/or any of its affiliates not waived fees or reimbursed a portion of expenses, total return would have been reduced.
(e) Rounds to less than 0.01%.
(f) The benefits derived from expense reductions had an impact of less than 0.01%.
(g) The Investment Manager reimbursed interest expense which had an impact of less than 0.01%.
See Accompanying Notes to Financial Statements.
30
Financial Highlights – Columbia Short Term Municipal Bond Fund
Selected data for a share outstanding throughout each period is as follows:
| | | Year Ended March 31, | |
| Class C Shares | | 2011 | | 2010 | | 2009 | | 2008 | | 2007 | |
| Net Asset Value, Beginning of Period | | $ | 10.55 | | | $ | 10.46 | | | $ | 10.32 | | | $ | 10.17 | | | $ | 10.14 | | |
| Income from Investment Operations: | |
| Net investment income (a) | | | 0.08 | | | | 0.09 | | | | 0.20 | | | | 0.24 | | | | 0.22 | | |
| Net realized and unrealized gain (loss) on investments | | | (0.08 | ) | | | 0.09 | | | | 0.14 | | | | 0.15 | | | | 0.03 | | |
| Total from investment operations | | | 0.00 | | | | 0.18 | | | | 0.34 | | | | 0.39 | | | | 0.25 | | |
| Less Distributions to Shareholders: | |
| From net investment income | | | (0.08 | ) | | | (0.09 | ) | | | (0.20 | ) | | | (0.24 | ) | | | (0.22 | ) | |
| Increase from regulatory settlements | | | — | | | | — | (b) | | | — | | | | — | | | | — | | |
| Net Asset Value, End of Period | | $ | 10.47 | | | $ | 10.55 | | | $ | 10.46 | | | $ | 10.32 | | | $ | 10.17 | | |
| Total return (c)(d) | | | 0.00 | %(e) | | | 1.76 | % | | | 3.37 | % | | | 3.88 | % | | | 2.53 | % | |
| Ratios to Average Net Assets/Supplemental Data: | |
| Net expenses before interest expense (f) | | | 1.50 | % | | | 1.47 | % | | | 1.40 | % | | | 1.40 | % | | | 1.40 | % | |
| Interest expense (e) | | | — | %(g) | | | — | % | | | — | % | | | — | % | | | — | % | |
| Net expenses (f) | | | 1.50 | % | | | 1.47 | % | | | 1.40 | % | | | 1.40 | % | | | 1.40 | % | |
| Waiver/Reimbursement | | | 0.03 | % | | | 0.01 | % | | | 0.07 | % | | | 0.11 | % | | | 0.11 | % | |
| Net investment income (f) | | | 0.75 | % | | | 0.84 | % | | | 1.92 | % | | | 2.35 | % | | | 2.20 | % | |
| Portfolio turnover rate | | | 38 | % | | | 62 | % | | | 94 | % | | | 73 | % | | | 98 | % | |
| Net assets, end of period (000s) | | $ | 40,603 | | | $ | 58,529 | | | $ | 32,750 | | | $ | 14,816 | | | $ | 16,549 | | |
(a) Per share data was calculated using the average shares outstanding during the period.
(b) Rounds to less than $0.01 per share.
(c) Total return at net asset value assuming all distributions reinvested and no contingent deferred sales charge.
(d) Had the Investment Manager and/or any of its affiliates not waived fees or reimbursed a portion of expenses, total return would have been reduced.
(e) Rounds to less than 0.01%.
(f) The benefits derived from expense reductions had an impact of less than 0.01%.
(g) The Investment Manager reimbursed interest expense which had an impact of less than 0.01%.
See Accompanying Notes to Financial Statements.
31
Financial Highlights – Columbia Short Term Municipal Bond Fund
Selected data for a share outstanding throughout each period is as follows:
| | | Year Ended March 31, | |
| Class Z Shares | | 2011 | | 2010 | | 2009 | | 2008 | | 2007 | |
| Net Asset Value, Beginning of Period | | $ | 10.55 | | | $ | 10.46 | | | $ | 10.32 | | | $ | 10.17 | | | $ | 10.14 | | |
| Income from Investment Operations: | |
| Net investment income (a) | | | 0.18 | | | | 0.19 | | | | 0.30 | | | | 0.34 | | | | 0.32 | | |
| Net realized and unrealized gain (loss) on investments | | | (0.07 | ) | | | 0.10 | | | | 0.15 | | | | 0.15 | | | | 0.04 | | |
| Total from investment operations | | | 0.11 | | | | 0.29 | | | | 0.45 | | | | 0.49 | | | | 0.36 | | |
| Less Distributions to Shareholders: | |
| From net investment income | | | (0.19 | ) | | | (0.20 | ) | | | (0.31 | ) | | | (0.34 | ) | | | (0.33 | ) | |
| Increase from regulatory settlements | | | — | | | | — | (b) | | | — | | | | — | | | | — | | |
| Net Asset Value, End of Period | | $ | 10.47 | | | $ | 10.55 | | | $ | 10.46 | | | $ | 10.32 | | | $ | 10.17 | | |
| Total return (c)(d) | | | 1.00 | % | | | 2.79 | % | | | 4.41 | % | | | 4.92 | % | | | 3.56 | % | |
| Ratios to Average Net Assets/Supplemental Data: | |
| Net expenses before interest expense (e) | | | 0.50 | % | | | 0.47 | % | | | 0.40 | % | | | 0.40 | % | | | 0.40 | % | |
| Interest expense (f) | | | — | %(g) | | | — | % | | | — | % | | | — | % | | | — | % | |
| Net expenses (e) | | | 0.50 | % | | | 0.47 | % | | | 0.40 | % | | | 0.40 | % | | | 0.40 | % | |
| Waiver/Reimbursement | | | 0.03 | % | | | 0.01 | % | | | 0.07 | % | | | 0.11 | % | | | 0.11 | % | |
| Net investment income (e) | | | 1.75 | % | | | 1.83 | % | | | 2.94 | % | | | 3.34 | % | | | 3.20 | % | |
| Portfolio turnover rate | | | 38 | % | | | 62 | % | | | 94 | % | | | 73 | % | | | 98 | % | |
| Net assets, end of period (000s) | | $ | 1,703,560 | | | $ | 2,020,837 | | | $ | 1,044,788 | | | $ | 519,786 | | | $ | 380,532 | | |
(a) Per share data was calculated using the average shares outstanding during the period.
(b) Rounds to less than $0.01 per share.
(c) Total return at net asset value assuming all distributions reinvested.
(d) Had the Investment Manager and/or any of its affiliates not waived fees or reimbursed a portion of expenses, total return would have been reduced.
(e) The benefits derived from expense reductions had an impact of less than 0.01%.
(f) Rounds to less than 0.01%.
(g) The Investment Manager reimbursed interest expense which had an impact of less than 0.01%.
See Accompanying Notes to Financial Statements.
32
Notes to Financial Statements – Columbia Short Term Municipal Bond Fund
March 31, 2011
Note 1. Organization
Columbia Short Term Municipal Bond Fund (the Fund), a series of Columbia Funds Series Trust (the Trust), is a diversified fund. The Trust is registered under the Investment Company Act of 1940, as amended (the 1940 Act), as an open-end management investment company organized as a Delaware statutory trust.
After the close of business on April 30, 2010, Ameriprise Financial, Inc. (Ameriprise Financial) acquired a portion of the asset management business of Columbia Management Group, LLC (the Transaction), including the business of managing the Fund. In connection with the closing of the Transaction (the Closing), RiverSource Investments, LLC, a wholly owned subsidiary of Ameriprise Financial, became the investment manager of the Fund and changed its name to Columbia Management Investment Advisers, LLC (the Investment Manager).
Investment Objective
The Fund seeks current income exempt from federal income tax, consistent with minimal fluctuation of principal.
Fund Shares
The Trust has unlimited authorized shares of beneficial interest. The Fund offers Class A, Class B, Class C and Class Z shares. All share classes have identical voting, dividend and liquidation rights. Each share class has its own expense structure and sales charges, as applicable.
Class A shares are subject to a maximum front-end sales charge of 1.00% based on the initial investment amount. Class A shares purchased without an initial sales charge in accounts aggregating $1 million to $50 million at the time of purchase are subject to a 1.00% contingent deferred sales charge (CDSC) if the shares are sold within 18 months of purchase, charged as follows: 1.00% CDSC if redeemed within 12 months of purchase, and 0.50% CDSC if redeemed more than 12, but less than 18 months after purchase.
The Fund no longer accepts investments by new or existing investors in the Fund's Class B shares, except in connection with the reinvestment of any dividend and/or capital gain distributions in Class B shares of the Fund and exchanges by existing Class B shareholders of other funds within the Columbia Family of Funds. Class B shares are not subject to sales charges.
Class C shares are subject to a 1.00% CDSC on shares redeemed within one year of purchase.
Class Z shares are not subject to sales charges and are available only to certain investors, as described in the Fund's prospectus.
Note 2. Summary of Significant Accounting Policies
The preparation of financial statements in accordance with U.S. generally accepted accounting principles (GAAP) requires management to make certain estimates and assumptions that affect the reported amounts of assets and liabilities, the disclosure of contingent assets and liabilities at the date of the financial statements and the reported amounts of revenue and expenses during the reporting period. Actual results could differ from those estimates.
The following is a summary of significant accounting policies consistently followed by the Fund in the preparation of its financial statements.
Security Valuation
Debt securities generally are valued by pricing services approved by the Trust's Board of Trustees, based upon market transactions for normal, institutional-size trading units of similar securities. The services may use various pricing techniques which take into account appropriate factors such as yield, quality, coupon rate, maturity, type of issue, trading characteristics and other data, as well as broker quotes. Debt securities for which quotations are readily available may also be valued based upon an over-the-counter or exchange bid quotation.
Short-term investments maturing in 60 days or less are valued at amortized cost, which approximates market value.
Investments in other open-end investment companies are valued at net asset value.
Investments for which market quotations are not readily available, or that have quotations which the Investment Manager believes are not reliable, are valued at fair value as determined in good faith under consistently applied procedures established by and under the general supervision of the Board of Trustees. If a security is valued at fair value, such value is likely to be different from the last quoted market price for the security. The determination of fair value often requires significant judgment. To determine fair value, the Investment Manager may use assumptions including but not limited to future cash flows and estimated risk premiums. Multiple inputs from various sources may be used to determine value.
33
Columbia Short Term Municipal Bond Fund, March 31, 2011
Delayed Delivery Securities
The Fund may trade securities on other than normal settlement terms, including securities purchased or sold on a "when-issued" basis. This may increase the risk if the other party to the transaction fails to deliver and causes the Fund to subsequently invest at less advantageous prices. The Fund identifies within its portfolio of investments cash or liquid securities in an amount equal to the delayed delivery commitment.
Security Transactions
Security transactions are accounted for on the trade date. Cost is determined and gains (losses) are based upon the specific identification method for both financial statement and federal income tax purposes.
Income Recognition
Interest income is recorded on the accrual basis. Market premium and discount are amortized and accreted, respectively, on all debt securities, unless otherwise noted. Original issue discount is accreted to interest income over the life of the security with a corresponding increase in the cost basis, if any.
Dividend income is recorded on the ex-date.
Expenses
General expenses of the Trust are allocated to the Fund and other series of the Trust based upon relative net assets or other expense allocation methodologies determined by the nature of the expense. Expenses directly attributable to a specific class of shares are charged to that share class. Expenses directly attributable to the Fund are charged to the Fund.
Determination of Class Net Asset Value
All income, expenses (other than class-specific expenses which are charged directly to a share class, as shown in the Statement of Operations) and realized and unrealized gains (losses) are allocated to each class of the Fund on a daily basis for purposes of determining the net asset value of each class. Income and expenses are allocated to each class based on the settled shares method, while realized and unrealized gains (losses) are allocated based on the relative net assets of each class.
Federal Income Tax Status
The Fund intends to qualify each year as a "regulated investment company" under Subchapter M of the Internal Revenue Code, as amended, and will distribute substantially all of its tax exempt or taxable income, if any, for its tax year, and as such will not be subject to federal income taxes. In addition, the Fund intends to distribute in each calendar year substantially all of its net investment income, capital gains and certain other amounts, if any, such that the Fund should not be subject to federal excise tax. Therefore, no federal income or excise tax provision is recorded.
Distributions to Shareholders
Distributions from net investment income are declared daily and paid monthly. Net realized capital gains, if any, are distributed at least annually. Income distributions and capital gain distributions are determined in accordance with federal income tax regulations which may differ from GAAP.
Indemnifications
Under the Trust's organizational documents and, in some cases, by contract, its officers and directors are indemnified against certain liabilities arising out of the performance of their duties to the Fund. In addition, certain of the Fund's contracts with its service providers contain general indemnification clauses. The Fund's maximum exposure under these arrangements is unknown since the amount of any future claims that may be made against the Fund cannot be determined and the Fund has no historical basis for predicting the likelihood of any such claims.
Note 3. Fees and Compensation Paid to Affiliates
Investment Management Fee
Under an Investment Management Services Agreement (IMSA), the Investment Manager determines which securities will be purchased, held or sold. The management fee is equal to a percentage of the Fund's average daily net assets that declines from 0.30% to 0.25% as the Fund's net assets increase.
Prior to the Closing, Columbia Management Advisors, LLC (Columbia), an indirect, wholly owned subsidiary of Bank of America Corporation (BOA), provided investment management services to the Fund under the same fee structure. The effective management fee rate for the year ended March 31, 2011, was 0.26% of the Fund's average daily net assets.
34
Columbia Short Term Municipal Bond Fund, March 31, 2011
Administration Fee
Effective upon the Closing, the Investment Manager provides administration and accounting services to the Fund under an Administrative Services Agreement, including services previously performed under the Pricing and Bookkeeping Oversight and Services Agreement (the Services Agreement) as discussed in the Pricing and Bookkeeping Fees note below. The Fund pays an annual administration fee equal to 0.15% of the Fund's average daily net assets less the fees payable by the Fund as described under the Pricing and Bookkeeping Fees note below. Prior to the Closing, Columbia provided administrative services to the Fund at the same fee rates.
Pricing and Bookkeeping Fees
Prior to the Closing, the Fund entered into a Financial Reporting Services Agreement (the Financial Reporting Services Agreement) with State Street Bank and Trust Company (State Street) and Columbia pursuant to which State Street provides financial reporting services to the Fund. The Fund also entered into an Accounting Services Agreement (collectively with the Financial Reporting Services Agreement, the State Street Agreements) with State Street and Columbia pursuant to which State Street provides accounting services to the Fund. Upon the Closing, Columbia assigned and delegated its rights and obligations under the State Street Agreements to the Investment Manager. Under the State Street Agreements, the Fund pays State Street an annual fee of $38,000 paid monthly plus an additional monthly fee based on an annualized percentage rate of average daily net assets of the Fund for the month. The aggregate fee will not exceed $140,000 per year (exclusive of out-of-pocket expenses and charges). The Fund also reimburses State Street for certain out-of-pocket expenses and charges.
Also prior to the Closing, the Fund entered into the Services Agreement with Columbia. Under the Services Agreement, Columbia provided services related to Fund expenses and the requirements of the Sarbanes-Oxley Act of 2002, and provided oversight of the accounting and financial reporting services provided by State Street. Under the Services Agreement, the Fund reimbursed Columbia for out-of-pocket expenses and charges, including fees payable to third parties, such as for pricing the Fund's portfolio securities, incurred by Columbia in the performance of services under the Services Agreement. The Services Agreement was terminated upon the Closing. These services are now provided under the Administrative Services Agreement discussed above.
Transfer Agent Fee
In connection with the Closing, RiverSource Service Corporation, a wholly owned subsidiary of Ameriprise Financial, provides transfer agency services to the Fund under a Transfer Agency Agreement and changed its name to Columbia Management Investment Services Corp. (the Transfer Agent). The Transfer Agent has contracted with Boston Financial Data Services (BFDS) to serve as sub-transfer agent.
The Transfer Agent receives monthly account-based service fees based on the number of open accounts and is reimbursed by the Fund for the fees and expenses the Transfer Agent pays to financial intermediaries that maintain omnibus accounts with the Fund that is a percentage of the average aggregate value of the Fund's shares maintained in each such omnibus account (other than omnibus accounts for which American Enterprise Investment Services Inc. is the broker of record or accounts where the beneficial shareholder is a customer of Ameriprise Financial Services, Inc., which are paid a per account fee). The Transfer Agent pays the fees of BFDS for services as sub-transfer agent and is not entitled to reimbursement for such fees from the Fund (with the exception of out-of pocket fees). The Transfer Agent also receives compensation from fees for various shareholder services and reimbursements for certain out-of -pocket expenses.
Prior to the Closing, Columbia Management Services, Inc., an affiliate of Columbia and an indirect, wholly owned subsidiary of BOA, provided transfer agency services to the Fund and contracted with BFDS to serve as sub-transfer agent, under the same fee structure.
For the year ended March 31, 2011, the Fund's effective transfer agent fee rate for each class was 0.09% of the Fund's average daily net assets.
An annual minimum account balance fee of $20 may apply to certain accounts with a value below the Fund's initial minimum investment requirements to reduce the impact of small accounts on transfer agent fees. These minimum account balance fees are recorded as part of expense reductions on the Statement of Operations. For the year ended March 31, 2011, no minimum account balance fees were charged by the Fund.
Underwriting Discounts, Service and Distribution Fees
In connection with the Closing, RiverSource Fund Distributors, Inc., an indirect wholly owned subsidiary of Ameriprise Financial, provides distribution and shareholder services to the Fund and changed its name to Columbia Management Investment Distributors, Inc. (the Distributor). Pursuant to Rule 12b-1 under the 1940 Act, the Board
35
Columbia Short Term Municipal Bond Fund, March 31, 2011
of Trustees has approved, and the Fund has adopted, distribution and shareholder service plans (the Plans) which set the distribution and service fees for the Fund. These fees are calculated daily and are intended to compensate the Distributor and/or eligible selling and/or servicing agents for selling shares of the Fund and providing services to investors.
The Plans require the payment of a combined distribution and shareholder servicing fee for the Class A shares of the Fund. The Plans also require the payment of a monthly shareholder servicing fee and distribution fee for the Class B and Class C shares of the Fund. A substantial portion of the expenses incurred pursuant to these plans is paid to affiliates of the Distributor. The annual rates in effect and plan limits, as a percentage of average daily net assets, are as follows:
| | | Current
Rate | | Plan
Limit | |
Class A Combined Distribution and
Shareholder Servicing Plan | | | 0.25 | % | | | 0.25 | % | |
Class B and Class C Shareholder
Servicing Plans | | | 0.25 | % | | | 0.25 | % | |
Class B and Class C
Distribution Plans | | | 0.75 | % | | | 0.75 | % | |
Prior to the Closing, Columbia Management Distributors, Inc., an affiliate of Columbia and an indirect, wholly owned subsidiary of BOA, was the principal underwriter of the Fund's shares. There were no changes to the underwriting discount structure of the Fund or the service or distribution fee rates paid by the Fund as a result of the Transaction.
Sales Charges
Sales charges, including front-end and CDSC's, received by the Distributor for distributing Fund shares were $69,857 for Class A and $24,289 for Class C shares for the year ended March 31, 2011.
Fee Waivers and Expense Reimbursements
The Investment Manager has voluntarily agreed to bear a portion of the Fund's expenses so that the Fund's ordinary operating expenses (excluding any distribution and service fees, brokerage commissions, interest, taxes and extraordinary expenses, but including custodian charges relating to overdrafts, if any), after giving effect to any balance credits from the Fund's custodian, do not exceed 0.50% of the Fund's average daily net assets on an annualized basis. The Investment Manager, in its discretion, may revise or discontinue this arrangement at any time. Prior to May 1, 2010, Columbia voluntarily reimbursed a portion of the Fund's expenses in the same manner.
The Investment Manager is entitled to recover from the Fund any fees waived and/or expenses reimbursed for a three year period following the date of such fee waiver and/or reimbursement under these arrangements if such recovery does not cause the Fund's expenses to exceed the expense limitations in effect at the time of recovery. Prior to May 1, 2010, Columbia was entitled to recover fees waived and/or expenses reimbursed from the Fund in the same manner. At March 31, 2011, the amounts potentially recoverable pursuant to this arrangement were as follows:
| Amount of expiring potential recovery March 31, | | Total
potential | | Amount expired | | Amount recovered
during the year | |
| 2014 | | 2013 | | 2012 | | recovery | | 3/31/11 | | ended 3/31/11 | |
| $ | 662,933 | | | $ | 223,599 | | | $ | 602,386 | | | $ | 1,488,918 | | | $ | 470,899 | | | $ | — | | |
Effective May 1, 2011, the Investment Manager has eliminated the fee recoupment provisions detailed above.
Fees Paid to Officers and Trustees
In connection with the Closing, all officers of the Fund are employees of the Investment Manager or its affiliates and, with the exception of the Fund's Chief Compliance Officer, receive no compensation from the Fund. The Board of Trustees has appointed a Chief Compliance Officer to the Fund in accordance with federal securities regulations. The Fund, along with other affiliated funds, pays its pro-rata share of the expenses associated with the Chief Compliance Officer. The Fund's expenses for the Chief Compliance Officer will not exceed $15,000 per year. Prior to the Closing, all officers of the Fund were employees of Columbia or its affiliates and the Fund paid its pro-rata share of the expenses for the Chief Compliance Officer under the same fee structure.
Trustees are compensated for their services to the Fund, as set forth on the Statement of Operations. The Trust's eligible Trustees may participate in a non-qualified deferred compensation plan which may be terminated at any time. Any payments to plan participants are
36
Columbia Short Term Municipal Bond Fund, March 31, 2011
paid solely out of the Fund's assets. Income earned on the plan participant's deferral account is based on the rate of return of the eligible mutual funds selected by the participant or, if no funds are selected, on the rate of return of Columbia Money Market Fund (formerly known as RiverSource Cash Management Fund). Prior to the Closing, if no funds were selected, income earned on the plan participant's deferral account was based on the rate of return of BofA Treasury Reserves. Trustees' fees deferred during the current period as well as any gains or losses on the trustees' deferred compensation balances as a result of market fluctuations are included in "Trustees' fees" on the Statement of Operations. Liabilities under the deferred compensation plan are included in "Trustees' fees" on the Statement of Assets and Liabilities.
Other
Prior to the Closing, the Fund may have made daily investments of cash balances in BofA Tax-Exempt Reserves, formerly an affiliated open-ended investment company of Columbia, pursuant to an exemptive order received from the Securities and Exchange Commission. The income earned prior to the Closing by the Fund from such investments is included as Dividends from affiliates on the Statements of Operations. As an investing Fund, the Fund was indirectly allocated its proportionate share of the expenses of BofA Tax-Exempt Reserves.
Note 4. Custody Credits
The Fund has an agreement with its custodian bank under which custody fees may be reduced by balance credits. These credits are recorded as part of expense reductions on the Statement of Operations. The Fund could have invested a portion of the assets utilized in connection with the expense offset arrangement in an income-producing asset if it had not entered into such an agreement. For the year ended March 31, 2011, these custody credits reduced total expenses by $321 for the Fund.
Note 5. Portfolio Information
The cost of purchases and proceeds from sales of securities, excluding short-term obligations, aggregated $848,002,507 and $1,271,680,049, respectively, for the year ended March 31, 2011.
Note 6. Regulatory Settlements
During the year ended March 31, 2010, the Fund received payments totaling $1,276 resulting from certain regulatory settlements with third parties in which the Fund had participated. The payments have been included in "Increase from regulatory settlements" in the Statement of Changes in Net Assets.
Note 7. Shareholder Concentration
As of March 31, 2011, one shareholder account owned 72.4% of the outstanding shares of the Fund. Purchase and redemption activity of this account may have a significant effect on the operations of the Fund.
Note 8. Line of Credit
Prior to March 28, 2011, the Fund and other affiliated funds participated in a $280,000,000 committed, unsecured revolving line of credit provided by State Street. Effective March 28, 2011, the commitment was reduced to $225,000,000. The maximum amount that may be borrowed by any fund is limited to the lesser of $200,000,000 and the Fund's borrowing limit set forth in the Fund's registration statement. Borrowings are available for short-term liquidity or temporary or emergency purposes.
Effective October 14, 2010, interest is charged to each participating fund based on the fund's borrowings at a rate per annum equal to the greater of the Federal Funds Rate plus 1.25% or the overnight LIBOR Rate plus 1.25%. In addition, a commitment fee of 0.125% per annum is accrued and apportioned among the participating funds pro rata based on their relative net assets.
Prior to October 14, 2010, interest was charged to each participating fund at the same rates. In addition, a commitment fee of 0.15% per annum was accrued and apportioned among the participating funds pro rata based on their relative net assets.
For the year ended March 31, 2011, the average daily loan balance outstanding on days where borrowing existed was $2,900,000 at a weighted average interest rate of 1.48%.
For the year ended March 31, 2011, the Investment Manager reimbursed the Fund $119 of interest expense.
Note 9. Federal Tax Information
The timing and character of income and capital gain distributions are determined in accordance with income tax regulations, which may differ from GAAP. Reclassifications are made to the Fund's capital accounts for permanent tax differences to reflect income and gains available for distribution (or available capital loss carryforwards) under income tax regulations.
37
Columbia Short Term Municipal Bond Fund, March 31, 2011
For the year ended March 31, 2011, permanent book and tax basis differences resulting primarily from differing treatments for expired capital loss carryforwards were identified and reclassified among the components of the Fund's net assets as follows:
Undistributed
Net investment
Income | | Accumulated
Net Realized
Loss | | Paid-in Capital | |
| $ | (120 | ) | | $ | 10,144 | | | $ | (10,024 | ) | |
Net investment income and net realized gains (losses), as disclosed on the Statement of Operations, and net assets were not affected by this reclassification.
The tax character of distributions paid during the years ended March 31, 2011 and March 31, 2010 was as follows:
| | | March 31, | |
| Distributions paid from: | | 2011 | | 2010 | |
| Tax-Exempt Income | | $ | 39,449,774 | | | $ | 36,039,799 | | |
| Ordinary Income* | | | 7,182 | | | | 33,157 | | |
* For tax purposes short-term capital gains distributions, if any, are considered ordinary income distributions.
As of March 31, 2011, the components of distributable earnings on a tax basis were as follows:
Undistributed
Tax-Exempt
Income | | Undistributed
Ordinary
Income | | Undistributed
Long-Term
Capital Gains | | Net Unrealized
Appreciation* | |
| $ | 2,675,567 | | | $ | — | | | $ | — | | | $ | 19,628,847 | | |
* The differences between book-basis and tax-basis net unrealized appreciation are primarily due to deferral of losses from wash sales.
Unrealized appreciation and depreciation at March 31, 2011, based on cost of investments for federal income tax purposes were:
| Unrealized appreciation | | $ | 23,599,542 | | |
| Unrealized depreciation | | | (3,970,695 | ) | |
| Net unrealized appreciation | | $ | 19,628,847 | | |
The following capital loss carryforwards may be available to reduce taxable income arising from future net realized gains on investments, if any, to the extent permitted by the Internal Revenue Code:
| Year of Expiration | | Capital Loss
Carryforwards | |
| 2012 | | $ | 397,238 | | |
| 2013 | | | 2,170,497 | | |
| 2014 | | | 3,786,208 | | |
| 2015 | | | 3,090,745 | | |
| 2016 | | | 1,181,270 | | |
| 2019 | | | 602,849 | | |
| Total | | $ | 11,228,807 | | |
Capital loss carryforwards of $10,024 expired during the year ended March 31, 2011. Expired capital loss carryforwards are recorded as a reduction of paid-in capital.
Management of the Fund has concluded that there are no significant uncertain tax positions that would require recognition in the financial statements. However, management's conclusion may be subject to review and adjustment at a later date based on factors including, but not limited to, new tax laws, regulations, and administrative interpretations (including relevant court decisions). The Fund's federal tax returns for the prior three fiscal years remain subject to examination by the Internal Revenue Service.
Note 10. Significant Risks and Contingencies
Sector Focus Risk
The Fund may focus its investments in certain sectors, subjecting it to greater risk than a fund that is less focused.
Tax Development Risk
The Fund purchases municipal securities whose interest, in the opinion of bond counsel, is free from federal income tax. There is no assurance that the Internal Revenue Service (IRS) will agree with this opinion. In the event the IRS determines that an issuer does not comply with relevant tax requirements, interest payments from a security could become federally taxable, possibly retroactively to the date the security was issued. As a shareholder of the Fund, you may be required to file an amended tax return as a result.
38
Columbia Short Term Municipal Bond Fund, March 31, 2011
Note 11. Subsequent Events
Management has evaluated the events and transactions that have occurred through the date the financial statements were issued. Other than as noted below, there were no items requiring adjustment of the financial statements or additional disclosure.
Effective May 16, 2011, the line of credit commitment with State Street was reduced to $150,000,000, and the maximum amount that may be borrowed by any fund was limited to the lesser of $120,000,000 and the Fund's borrowing limit set forth in the Fund's registration statement.
Note 12. Information Regarding Pending and Settled Legal Proceedings
In June 2004, an action captioned John E. Gallus et al. v. American Express Financial Corp. and American Express Financial Advisors Inc. was filed in the United States District Court for the District of Arizona. The plaintiffs allege that they are investors in several American Express Company (now known as RiverSource) mutual funds and they purport to bring the action derivatively on behalf of those funds under the Investment Company Act of 1940. The plaintiffs allege that fees allegedly paid to the defendants by the funds for investment advisory and administrative services are excessive. The plaintiffs seek remedies including restitution and rescission of investment advisory and distribution agreements. The plaintiffs voluntarily agreed to transfer this case to the United States District Court for the District of Minnesota (the District Court). In response to defendants' motion to dismiss the complaint, the District Court dismissed one of plaintiffs' four claims and granted plaintiffs limited discovery. Defendants moved for summary judgment in April 2007. Summary judgment was granted in the defendants' favor on July 9, 2007. The plaintiffs filed a notice of appeal with the Eighth Circuit Court of Appeals (the Eighth Circuit) on August 8, 2007. On April 8, 2009, the Eighth Circuit reversed summary judgment and remanded to the District Court for further proceedings. On August 6, 2009, defendants filed a writ of certiorari with the U.S. Supreme Court (the Supreme Court), asking the Supreme Court to stay the District Court proceedings while the Supreme Court considers and rules in a case captioned Jones v. Harris Associates, which involves issues of law similar to those presented in the Gallus case. On March 30, 2010, the Supreme Court issued its ruling in Jones v. Harris Associates, and on April 5, 2010, the Supreme Court vacated the Eighth Circuit's decision in the Gallus case and remanded the case to the Eighth Circuit for further consideration in light of the Supreme Court's decision in Jones v. Harris Associates. On June 4, 2010, the Eighth Circuit remanded the Gallus case to the District Court for further consideration in light of the Supreme Court's decision in Jones v. Harris Associates. On December 9, 2010, the District Court reinstated its July 9, 2007, summary judgment order in favor of the defendants. On January 10, 2011, plaintiffs filed a notice of appeal with the Eighth Circuit.
In December 2005, without admitting or denying the allegations, American Express Financial Corporation (AEFC, which is now known as Ameriprise Financial, Inc. (Ameriprise Financial)), entered into settlement agreements with the Securities and Exchange Commission (SEC) and Minnesota Department of Commerce (MDOC) related to market timing activities. As a result, AEFC was censured and ordered to cease and desist from committing or causing any violations of certain provisions of the Investment Advisers Act of 1940, the Investment Company Act of 1940, and various Minnesota laws. AEFC agreed to pay disgorgement of $10 million and civil money penalties of $7 million. AEFC also agreed to retain an independent distribution consultant to assist in developing a plan for distribution of all disgorgement and civil penalties ordered by the SEC in accordance with various undertakings detailed at http://www.sec.gov/litigation/admin/ia-2451.pdf. Ameriprise Financial and its affiliates have cooperated with the SEC and the MDOC in these legal proceedings, and have made regular reports to the RiverSource, Seligman and Threadneedle funds' Boards of Directors/Trustees.
Ameriprise Financial and certain of its affiliates have historically been involved in a number of legal, arbitration and regulatory proceedings, including routine litigation, class actions, and governmental actions, concerning matters arising in connection with the conduct of their business activities. Ameriprise Financial believes that the Funds are not currently the subject of, and that neither Ameriprise Financial nor any of its affiliates are the subject of, any pending legal, arbitration or regulatory proceedings that are likely to have a material adverse effect on the Funds or the ability of Ameriprise Financial or its affiliates to perform under their contracts with the Funds. Ameriprise Financial is required to make 10-Q, 10-K and, as necessary, 8-K filings with the Securities and Exchange Commission on legal and regulatory matters that relate to Ameriprise Financial and its affiliates. Copies of these filings may be obtained by accessing the SEC website at www.sec.gov.
There can be no assurance that these matters, or the adverse publicity associated with them, will not result in increased fund redemptions, reduced sale of fund shares or other adverse consequences to the Funds. Further, although we believe proceedings are not likely to have a material adverse effect on the Funds or the ability of Ameriprise Financial or its affiliates to perform under their contracts with the Funds, these proceedings are subject to uncertainties and, as such, we are unable to estimate the possible loss or range of loss that may result. An adverse outcome in one or more of these proceedings could result in adverse judgments, settlements, fines, penalties or other relief that could have a material adverse effect on the consolidated financial condition or results of operations of Ameriprise Financial.
39
Report of Independent Registered Public Accounting Firm
To the Trustees of Columbia Funds Series Trust and the Shareholders of Columbia Short Term Municipal Bond Fund
In our opinion, the accompanying statement of assets and liabilities, including the investment portfolio, and the related statements of operations and of changes in net assets and the financial highlights present fairly, in all material respects, the financial position of Columbia Short Term Municipal Bond Fund (the "Fund") (a series of Columbia Funds Series Trust) at March 31, 2011, and the results of its operations for the year then ended, the changes in its net assets for each of the two years in the period then ended, and the financial highlights for each of the five years in the period then ended, in conformity with accounting principles generally accepted in the United States of America. These financial statements and financial highlights (hereafter referred to as "financial statements") are the responsibility of the Fund's management. Our responsibility is to express an opinion on these financial statements based on our audits. We conducted our audits of these financial statements in accordance with the standards of the Public Company Accounting Oversight Board (United States). Those standards require that we plan and perform the audit to obtain reasonable assurance about whether the financial statements are free of material misstatement. An audit includes examining, on a test basis, evidence supporting the amounts and disclosures in the financial statements, assessing the accounting principles used and significant estimates made by management, and evaluating the overall financial statement presentation. We believe that our audits, which included confirmation of securities at March 31, 2011 by correspondence with the custodian and brokers, provide a reasonable basis for our opinion.
PricewaterhouseCoopers LLP
Boston, Massachusetts
May 20, 2011
40
Federal Income Tax Information (Unaudited) – Columbia Short Term Municipal Bond Fund
For the fiscal year ended March 31, 2011, 99.98% of the distributions from net investment income of the Fund qualifies as exempt interest dividends for federal income tax purposes. A portion of the income may be subject to federal alternative minimum tax.
The Fund will notify shareholders in January 2012 of amounts for use in preparing 2011 income tax returns.
41
Fund Governance
The Trustees serve terms of indefinite duration. The names, addresses and birth years of the Trustees and Officers of the Funds in the Columbia Funds Series Trust, the year each was first elected or appointed to office, their principal business occupations during at least the last five years, the number of Funds overseen by each Trustee and other directorships they hold are shown below. Each officer listed below serves as an officer of each Fund in the Columbia Funds Series Trust.
Independent Trustees
Name, Address and Year of Birth,
Position with Funds, Year First
Elected or Appointed to Office | | Principal Occupation(s) During Past Five Years, Number of Funds in the Columbia
Funds Complex Overseen by Trustee, Other Directorships Held
| |
| Edward J. Boudreau, Jr. (Born 1944) | |
|
c/o Columbia Management
Investment Advisers, LLC
225 Franklin Street
Boston, MA 02110
Trustee (since 2005) | | Managing Director—E.J. Boudreau & Associates (consulting), from 2000 through current; oversees 41; Trustee—BofA Funds Series Trust. | |
|
| William P. Carmichael (Born 1943) | |
|
c/o Columbia Management
Investment Advisers, LLC
225 Franklin Street
Boston, MA 02110
Trustee (since 1999) | | Retired; oversees 41; Director—Cobra Electronics Corporation (electronic equipment manufacturer); Director—McMoRan Exploration Company (oil and gas exploration and development); Director—The Finish Line (athletic shoes and apparel); Trustee—BofA Funds Series Trust. | |
|
| William A. Hawkins (Born 1942) | |
|
c/o Columbia Management
Investment Advisers, LLC
225 Franklin Street
Boston, MA 02110
Trustee (since 2005) | | Managing Director—Overton Partners (financial consulting), August 2010 to present; President and Chief Executive Officer—California General Bank, N.A., from January 2008 through August 2010; oversees 41; Trustee—BofA Funds Series Trust. | |
|
| R. Glenn Hilliard (Born 1943) | |
|
c/o Columbia Management
Investment Advisers, LLC
225 Franklin Street
Boston, MA 02110
Trustee (since 2005) | | Chairman and Chief Executive Officer—Hilliard Group LLC (investing and consulting), from April 2003 through current; oversees 41; Trustee—BofA Funds Series Trust. | |
|
| John J. Nagorniak (Born 1944) | |
|
c/o Columbia Management
Investment Advisers, LLC
225 Franklin Street
Boston, MA 02110
Trustee (since 2008) | | Retired; President and Director—Foxstone Financial, Inc. (consulting), 2000 through December 2007; Director—Mellon Financial Corporation affiliates (investing), 2000 through 2007; Chairman—Franklin Portfolio Associates (investing—Mellon affiliate), 1982 through 2007; oversees 41; Director—MIT Investment Company; Trustee—MIT 401k Plan; Trustee—Research Foundation of CFA Institute; Trustee—BofA Funds Series Trust. | |
|
42
Fund Governance (continued)
Independent Trustees (continued)
Name, Address and Year of Birth,
Position with Funds, Year First
Elected or Appointed to Office | | Principal Occupation(s) During Past Five Years, Number of Funds in the Columbia
Funds Complex Overseen by Trustee, Other Directorships Held
| |
| Minor M. Shaw (Born 1947) | |
|
c/o Columbia Management
Investment Advisers, LLC
225 Franklin Street
Boston, MA 02110
Trustee (since 2003) | | President—Micco Corporation and Mickel Investment Group; oversees 41; Board Member—Piedmont Natural Gas; Trustee—BofA Funds Series Trust. | |
|
Interested Trustee
| Anthony M. Santomero1 (Born 1946) | |
|
c/o Columbia Management
Investment Advisers, LLC
225 Franklin Street
Boston, MA 02110
Trustee (since 2008) | | Richard K. Mellon Professor Emeritus of Finance, The Wharton School, University of Pennsylvania, from 2002 through current; Senior Advisor—McKinsey & Company (consulting), July 2006 through January 2008; President and Chief Executive Officer—Federal Reserve Bank of Philadelphia, July 2000 through April 2006; oversees 41; Director—Renaissance Reinsurance Ltd; Trustee—Penn Mutual Life Insurance Company; Director—Citigroup, Inc.; Director—Citibank, N.A.; Trustee—BofA Funds Series Trust. | |
|
1 Dr. Santomero is currently deemed by the Columbia Funds to be an "interested person" (as defined in the 1940 Act) of the Funds because he serves as a Director of Citigroup, Inc. and Citibank, N.A., companies that may directly or through subsidiaries and affiliates engage from time-to-time in brokerage execution, principal transactions and lending relationships with the Columbia Funds or other funds or accounts advised/managed by Columbia Management Investment Advisers, LLC.
The Statement of Additional Information includes additional information about the Trustees of the Funds and is available, without charge, upon request by calling 800-345-6611.
Officers
| Name, Year of Birth and Address | | Principal Occupation(s) During the Past Five Years | |
| J. Kevin Connaughton (Born 1964) | |
|
225 Franklin Street
Boston, MA 02110
President (since 2009) | | Senior Vice President and General Manager—Mutual Fund Products, Columbia Management Investment Advisers, LLC since May 2010; President, Columbia Funds, since 2009, and RiverSource Funds, since May 2010 (previously Senior Vice President and Chief Financial Officer, Columbia Funds, from June 2008 to January 2009, Treasurer, Columbia Funds, from October 2003 to May 2008, and senior officer of various other affiliated funds since 2000); Managing Director, Columbia Management Advisors, LLC from December 2004 to April 2010. | |
|
| Michael G. Clarke (Born 1969) | |
|
225 Franklin Street
Boston, MA 02110
Treasurer (since 2011) and
Chief Financial Officer (since 2009) | | Vice President, Columbia Management Investment Advisers, LLC since May 2010; Managing Director of Fund Administration, Columbia Management Advisors, LLC, from September 2004 to April 2010; senior officer of Columbia Funds and affiliated funds since 2002. | |
|
43
Fund Governance (continued)
Officers (continued)
| Name, Year of Birth and Address | | Principal Occupation(s) During the Past Five Years | |
| Scott R. Plummer (Born 1959) | |
|
5228 Ameriprise Financial Center
Minneapolis, MN 55474
Senior Vice President and
Chief Legal Officer (since 2010) | | Chief Legal Officer and Assistant Secretary, Columbia Management Investment Advisers, LLC since June 2005; Vice President and Lead Chief Counsel—Asset Management, Ameriprise Financial, Inc. since May 2010 (previously Vice President and Chief Counsel—Asset Management, from 2005 to April 2010, and Vice President—Asset Management Compliance from 2004 to 2005); Vice President, Chief Counsel and Assistant Secretary, Columbia Management Investment Distributors, Inc. since 2008; Vice President, General Counsel and Secretary, Ameriprise Certificate Company since 2005; Chief Counsel, RiverSource Distributors, Inc. since 2006; Vice President, General Counsel and Secretary, RiverSource Funds, since December 2006; Senior Vice President, Secretary and Chief Legal Officer, Columbia Funds, since May 2010. | |
|
| Linda J. Wondrack (Born 1964) | |
|
225 Franklin Street
Boston, MA 02110
Senior Vice President and
Chief Compliance Officer (since 2007) | | Vice President and Chief Compliance Officer, Columbia Management Investment Advisers, LLC since May 2010; Chief Compliance Officer, Columbia Funds, since 2007, and RiverSource Funds, since May 2010; Director (Columbia Management Group, LLC and Investment Product Group Compliance), Bank of America, from June 2005 to April 2010. | |
|
| William F. Truscott (Born 1960) | |
|
53600 Ameriprise Financial Center
Minneapolis, MN 55474
Senior Vice President (since 2010) | | Chairman of the Board, Columbia Management Investment Advisers, LLC since May 2010 (previously President, Chairman of the Board and Chief Investment Officer, from 2001 to April 2010); Chief Executive Officer, U.S. Asset Management & President, Annuities, Ameriprise Financial, Inc. since May 2010 (previously President—U.S. Asset Management and Chief Investment Officer from 2005 to April 2010, and Senior Vice President—Chief Investment Officer, from 2001 to 2005); Director, President and Chief Executive Officer, Ameriprise Certificate Company since 2006; Director, Columbia Management Investment Distributors, Inc. since May 2010 (previously Chairman of the Board and Chief Executive Officer from 2008 to April 2010); Chairman of the Board and Chief Executive Officer, RiverSource Distributors, Inc. since 2006. | |
|
| Colin Moore (Born 1958) | |
|
225 Franklin Street
Boston, MA 02110
Senior Vice President (since 2010) | | Director and Chief Investment Officer, Columbia Management Investment Advisers, LLC since May 2010; Manager, Managing Director and Chief Investment Officer of Columbia Management Advisors, LLC from 2007 to April 2010; Head of Equities, Columbia Management Advisors, LLC from 2002 to 2007. | |
|
| Michael A. Jones (Born 1959) | |
|
225 Franklin Street
Boston, MA 02110
Senior Vice President (since 2010) | | President and Director, Columbia Management Investment Advisers, LLC since May 2010; President and Director, Columbia Management Investment Distributors, Inc. since May 2010; Manager, Chairman, Chief Executive Officer and President, Columbia Management Advisors, LLC from 2007 to April 2010; Chief Executive Officer, President and Director, Columbia Management Distributors, Inc. from November 2006 to April 2010; previously, co-president and senior managing director at Robeco Investment Management. | |
|
44
Fund Governance (continued)
Officers (continued)
| Name, Year of Birth and Address | | Principal Occupation(s) During the Past Five Years | |
| Christopher O. Petersen (Born 1970) | |
|
5228 Ameriprise Financial Center
Minneapolis, MN 55474
Vice President and
Secretary (since 2011) | | Vice President and Chief Counsel, Ameriprise Financial since January 2010 (formerly Vice President and Group Counsel or Counsel from April 2004 to January 2010); Assistant Secretary of RiverSource Funds since January 2007. | |
|
| Amy Johnson (Born 1965) | |
|
5228 Ameriprise Financial Center
Minneapolis, MN 55474
Vice President (since 2010) | | Senior Vice President and Chief Operating Officer, Columbia Management Investment Advisers, LLC since May 2010 (previously Chief Administrative Officer, from 2009 until April 2010, Vice President—Asset Management and Trust Company Services, from 2006 to 2009, and Vice President—Operations and Compliance from 2004 to 2006). | |
|
| Joseph F. DiMaria (Born 1968) | |
|
225 Franklin Street
Boston, MA 02110
Vice President (since 2011) and
Chief Accounting Officer (since 2008) | | Vice President, Mutual Fund Administration, Columbia Management Investment Advisers, LLC, since May 2010; Director of Fund Administration, Columbia Management Advisors, LLC from January 2006 to April 2010; Head of Tax/Compliance and Assistant Treasurer, Columbia Management Advisors, LLC, from November 2004 to December 2005. | |
|
| Paul B. Goucher (Born 1968) | |
|
5228 Ameriprise Financial Center
Minneapolis, MN 55474
Vice President and
Assistant Treasurer (since 2010) | | Vice President and Chief Counsel of Ameriprise Financial since January 2010 (formerly Vice President and Group Counsel from November 2008 to January 2010); Director, Managing Director and General Counsel of J. & W. Seligman & Co. Incorporated (Seligman) from July 2008 to November 2008 and Managing Director and Associate General Counsel of Seligman from January 2005 to July 2008. | |
|
| Michael E. DeFao (Born 1968) | |
|
5228 Ameriprise Financial Center
Minneapolis, MN 55474
Vice President and
Assistant Treasurer (since 2011) | | Vice President and Chief Counsel, Ameriprise Financial since May 2010; Associate General Counsel Bank of America from June 2005 to April 2010. | |
|
| Stephen T. Welsh (Born 1957) | |
|
225 Franklin Street
Boston, MA 02110
Vice President (since 2006) | | President and Director, Columbia Management Investment Services Corp. since May 2010; President and Director, Columbia Management Services, Inc. from July 2004 to April 2010; Managing Director, Columbia Management Distributors, Inc. from August 2007 to April 2010. | |
|
45
Shareholder Meeting Results
At a Joint Special Meeting of Shareholders held on February 15, 2011, shareholders of the Fund considered the proposals described below.
Proposal 1. Shareholders of the Fund approved a proposed amendment to the Investment Management Services Agreement with Columbia Management Investment Advisers, LLC, as follows:
| Votes For | | Votes Against | | Abstentions | | Broker Non-Votes | |
| | 153,391,044 | | | | 687,704 | | | | 348,010 | | | | 29,704,651 | | |
Proposal 2. Shareholders of Columbia Funds Series Trust elected each of the nominees for trustees to the Board of Trustees of Columbia Funds Series Trust, each to hold office for an indefinite term, as follows:
| Trustee | | Votes For | | Votes Withheld | | Abstentions | |
| Kathleen Blatz | | | 2,145,636,122 | | | | 248,012,438 | | | | 0 | | |
| Edward J. Boudreau, Jr. | | | 2,145,430,114 | | | | 248,218,446 | | | | 0 | | |
| Pamela G. Carlton | | | 2,145,515,949 | | | | 248,132,612 | | | | 0 | | |
| William P. Carmichael | | | 2,145,038,695 | | | | 248,609,866 | | | | 0 | | |
| Patricia M. Flynn | | | 2,145,843,563 | | | | 247,804,997 | | | | 0 | | |
| William A. Hawkins | | | 2,145,359,401 | | | | 248,289,160 | | | | 0 | | |
| R. Glenn Hilliard | | | 2,145,079,400 | | | | 248,569,161 | | | | 0 | | |
| Stephen R. Lewis, Jr. | | | 2,145,092,209 | | | | 248,556,351 | | | | 0 | | |
| John F. Maher | | | 2,145,621,338 | | | | 248,027,223 | | | | 0 | | |
| John J. Nagorniak | | | 2,145,337,494 | | | | 248,311,067 | | | | 0 | | |
| Catherine James Paglia | | | 2,145,615,254 | | | | 248,033,306 | | | | 0 | | |
| Leroy C. Richie | | | 2,145,042,120 | | | | 248,606,441 | | | | 0 | | |
| Anthony M. Santomero | | | 2,145,088,174 | | | | 248,560,386 | | | | 0 | | |
| Minor M. Shaw | | | 2,145,430,762 | | | | 248,217,798 | | | | 0 | | |
| Alison Taunton-Rigby | | | 2,145,393,384 | | | | 248,255,177 | | | | 0 | | |
| William F. Truscott | | | 2,144,907,223 | | | | 248,741,338 | | | | 0 | | |
46
This page intentionally left blank.
This page intentionally left blank.
Important Information About This Report
The fund mails one shareholder report to each shareholder address. If you would like more than one report, please call shareholder services at 1-800-345-6611 and additional reports will be sent to you. This report has been prepared for shareholders of Columbia Short Term Municipal Bond Fund.
A description of the policies and procedures that the fund uses to determine how to vote proxies and a copy of the fund's voting records are available (i) at www.columbiamanagement.com, (ii) on the Securities and Exchange Commission's website at www.sec.gov, and (iii) without charge, upon request, by calling 1-800-368-0346. Information regarding how the fund voted proxies relating to portfolio securities during the 12-month period ended June 30 is available from the SEC's website. Information regarding how the fund voted proxies relating to portfolio securities is also available from the fund's website, www.columbiamanagement.com.
The fund files a complete schedule of portfolio holdings with the SEC for the first and third quarters of each fiscal year on Form N-Q. The fund's Form N-Q is available on the SEC's website at www.sec.gov and may be reviewed and copied at the SEC's Public Reference Room in Washington, D.C. Information on the operation of the Public Reference Room may be obtained by calling 1-800-SEC-0330.
Transfer Agent
Columbia Management Investment
Services Corp.
P.O. Box 8081
Boston, MA 02266-8081
1-800-345-6611
Distributor
Columbia Management Investment
Distributors, Inc.
225 Franklin Street
Boston, MA 02110
Investment Manager
Columbia Management Investment Advisers, LLC
225 Franklin Street
Boston, MA 02110
49

PRSRT STD
U.S. Postage
PAID
Holliston, MA
Permit NO. 20
Columbia Short Term Municipal Bond Fund
P. O. Box 8081
Boston, MA 02266-8081
columbiamanagement.com
This information is for use with concurrent or prior delivery of a fund prospectus. Investors should consider the investment objectives, risks, charges and expenses of a mutual fund carefully before investing. For a free prospectus, which contains this and other important information about the funds, visit columbiamanagement.com. Read the prospectus carefully before investing. The Fund is distributed by Columbia Management Investment Distributors, Inc., member FINRA, and managed by Columbia Management Investment Advisers, LLC.
© 2011 Columbia Management Investment Advisers, LLC. All rights reserved.
C-1076 A (05/11)

Columbia Georgia Intermediate Municipal Bond Fund
Annual Report for the Period Ended March 31, 2011
Not FDIC insured • No bank guarantee • May lose value
Table of Contents
| Fund Profile | | | 1 | | |
|
| Economic Update | | | 2 | | |
|
| Performance Information | | | 4 | | |
|
| Understanding Your Expenses | | | 5 | | |
|
| Portfolio Manager's Report | | | 6 | | |
|
| Investment Portfolio | | | 8 | | |
|
Statement of Assets and
Liabilities | | | 13 | | |
|
| Statement of Operations | | | 15 | | |
|
Statement of Changes in
Net Assets | | | 16 | | |
|
| Financial Highlights | | | 18 | | |
|
| Notes to Financial Statements | | | 22 | | |
|
Report of Independent Registered
Public Accounting Firm | | | 30 | | |
|
| Federal Income Tax Information | | | 31 | | |
|
| Fund Governance | | | 32 | | |
|
| Shareholder Meeting Results | | | 36 | | |
|
Important Information About
This Report | | | 37 | | |
|
The views expressed in this report reflect the current views of the respective parties. These views are not guarantees of future performance and involve certain risks, uncertainties and assumptions that are difficult to predict, so actual outcomes and results may differ significantly from the views expressed. These views are subject to change at any time based upon economic, market or other conditions and the respective parties disclaim any responsibility to update such views. These views may not be relied on as investment advice and, because investment decisions for a Columbia Fund are based on numerous factors, may not be relied on as an indication of trading intent on behalf of any particular Columbia Fund. References to specific securities should not be construed as a recommendation or investment advice.
President's Message

Dear Shareholder:
The Columbia Management story began over 100 years ago, and today, we are one of the nation's largest dedicated asset managers. The recent acquisition by Ameriprise Financial, Inc. brings together the talents, resources and capabilities of Columbia Management with those of RiverSource Investments, Threadneedle (acquired by Ameriprise in 2003) and Seligman Investments (acquired by Ameriprise in 2008) to build a best-in-class asset management business that we believe is truly greater than its parts.
RiverSource Investments traces its roots to 1894 when its then newly-founded predecessor, Investors Syndicate, offered a face-amount savings certificate that gave small investors the opportunity to build a safe and secure fund for retirement, education or other special needs. A mutual fund pioneer, Investors Syndicate launched Investors Mutual Fund in 1940. In the decades that followed, its mutual fund products and services lineup grew to include a full spectrum of styles and specialties. More than 110 years later, RiverSource continues to be a trusted financial products leader.
Threadneedle, a leader in global asset management and one of Europe's largest asset managers, offers sophisticated international experience from a dedicated U.K. management team. Headquartered in London, it is named for Threadneedle Street in the heart of the city's financial district, where British investors pioneered international and global investing. Threadneedle was acquired in 2003 and today operates as an affiliate of Columbia Management.
Seligman Investments' beginnings date back to the establishment of the investment firm J. & W. Seligman & Co. in 1864. In the years that followed, Seligman played a major role in the geographical expansion and industrial development of the United States. In 1874, President Ulysses S. Grant named Seligman as fiscal agent for the U.S. Navy—an appointment that would last through World War I. Seligman helped finance the westward path of the railroads and the building of the Panama Canal. The firm organized its first investment company in 1929 and began managing its first mutual fund in 1930. In 2008, J. & W. Seligman & Co. Incorporated was acquired and Seligman Investments became an offering brand of RiverSource Investments, LLC.
We are proud of the rich and distinctive history of these firms, the strength and breadth of products and services they offer, and the combined cultures of pioneering spirit and forward thinking. Together we are committed to providing more for our shareholders than ever before.
> A singular focus on our shareholders
Our business is asset management, so investors are our first priority. We dedicate our resources to identifying timely investment opportunities and provide a comprehensive choice of equity, fixed-income and alternative investments to help meet your individual needs.
> First-class research and thought leadership
We are dedicated to helping you take advantage of today's opportunities and anticipate tomorrow's. We stay abreast of the latest investment trends and ideas, using our collective insight to evaluate events and transform them into solutions you can use.
> A disciplined investment approach
We aren't distracted by passing fads. Our teams adhere to a rigorous investment process that helps ensure the integrity of our products and enables you and your financial advisor to match our solutions to your objectives with confidence.
When you choose Columbia Management, you can be confident that we will take the time to understand your needs and help you and your financial advisor identify the solutions that are right for you. Because at Columbia Management, we don't consider ourselves successful unless you are.
Sincerely,

J. Kevin Connaughton
President, Columbia Funds
Investors should consider the investment objectives, risks, charges and expenses of a mutual fund carefully before investing. For a free prospectus, which contains this and other important information about the funds, visit www.columbiamanagement.com. The prospectus should be read carefully before investing.
Columbia Funds are distributed by Columbia Management Investment Distributors, Inc., member FINRA, and managed by Columbia Management Investment Advisers, LLC.
© 2011 Columbia Management Investment Advisers, LLC. All rights reserved.
Fund Profile – Columbia Georgia Intermediate Municipal Bond Fund
Summary
g For the 12-month period that ended March 31, 2011, the fund's Class A shares returned 2.35% without sales charge.
g The fund lagged its benchmark, the Barclays Capital 3-15 Year Blend Municipal Bond Index1, and beat the average return of funds in its peer group, the Lipper Other States Intermediate Municipal Debt Funds Classification.2
g Maturity allocations and interest-rate positioning aided performance relative to the index, while certain sector weights and security selection in certain sectors detracted from results.
Portfolio Management
James M. D'Arcy has managed the fund since 2010. From 1999 until joining the Investment Manager in May 2010, Mr. D'Arcy was associated with the fund's previous investment adviser as an investment professional.
1The Barclays Capital 3-15 Year Blend Municipal Bond Index tracks the performance of municipal bonds issued after December 31, 1990 with remaining maturities between 2 and 17 years and at least $7 million in principal amount outstanding.
2Lipper Inc., a widely respected data provider in the industry, calculates an average total return (assuming reinvestment of distributions) for mutual funds with investment objectives similar to those of the fund. Lipper makes no adjustment for the effect of sales loads.
Indices are not available for investment, are not professionally managed and do not reflect sales charges, fees, brokerage commissions, taxes or other expenses of investing. Securities in the fund may not match those in an index.
Performance data quoted represents past performance and current performance may be lower or higher. Past performance is no guarantee of future results. The investment return and principal value will fluctuate so that shares, when redeemed, may be worth more or less than the original cost. Please visit www.columbiamanagement.com for daily and most recent month-end performance updates.
Summary
1-year return as of 03/31/11
| | +2.35% | |
|
 | | Class A shares
(without sales charge) | |
|
| | +2.91% | |
|
 | | Barclays Capital 3-15 Year
Blend Municipal Bond Index | |
|
1
Economic Update – Columbia Georgia Intermediate Municipal Bond Fund
Summary
For the 12-month period that ended March 31, 2011
g Strengthening economic growth and rising interest rates kept a lid on most bond market sectors. The Barclays Capital Aggregate Bond Index delivered modest results. However, high-yield bonds were strong performers, as measured by the JPMorgan Developed BB High Yield Index.
Barclays
Aggregate Index | | JPMorgan
Index | |
|
 | |  | |
|
g The U.S. stock market, as measured by the S&P 500 Index, delivered solid returns, despite a summer 2010 correction. Foreign stock market returns were also positive, as measured by the MSCI EAFE Index (Net).
| S&P Index | | MSCI Index | |
|
 | |  | |
|
The U.S. economy continued to expand at a solid but uneven pace over the past 12 months, as measured by gross domestic product (GDP). Although lackluster second quarter 2010 GDP growth raised fears that the economy was losing steam and might lapse back into recession, the pace picked up in the third quarter of 2010, inspiring confidence among consumers, businesses and investors. GDP expanded by 2.6% in the third quarter and 3.1% in the fourth quarter. With the Federal Reserve Board (the Fed) providing additional monetary stimulus to shore up economic growth and the extension of key tax cuts for the next two years, expectations are for continued growth in 2011. However, early estimates of first quarter 2011 growth place it just under 2.0%, a disappointment after two strong quarters and a pick-up in employment.
Consumer spending on cars, clothing and other goods generally trended higher during the 12-month period, accelerating in the fourth quarter of 2010. Holiday spending rose 5.5% between November 5, 2010 and December 24, 2010, in all retail categories, excluding automobiles, compared with the same period in 2009, according to MasterCard Advisors' SpendingPulse, which tracks spending on all transactions including cash. Personal income surged in January 2011, as payroll tax cuts kicked in. The personal savings rate edged higher, ending February 2011, the last month for which data was available, at 5.8%.
News on the job front was increasingly positive. A good portion of the jobs added in March, April and May of 2010 were temporary, government-sponsored census positions, which began to unwind in June, July and August 2010. However, private sector payroll employment began to trend higher in the third quarter, massive layoffs declined and job growth turned solidly positive, with the addition of 444,000 new jobs in the first quarter of 2011.
Despite some glimmers of improvement early in 2010, the housing market remained troublesome throughout the period. Both new and existing home sales fell after a federal tax credit for new and repeat homebuyers expired. Distressed properties pressured prices and foreclosures continued—another drag on prices. The inventory of unsold homes ended the period higher than it started, at 8.9 and 8.6 months for new and existing homes, respectively, according to the National Association of Realtors and a joint release from the U.S. Census Bureau and the U.S. Department of Housing and Urban Development. The new year brought more disappointing news: Existing home sales fell in January 2011 after three months of sustained improvement. Tight credit and weak appraisals were cited as possible reasons for the decline.
Reports from the business side of the economy were generally positive. A key measure of the nation's manufacturing situation—the Institute for Supply Management's Index—took a somewhat surprising turn higher in the final months of the period. Technology spending rose 12% in 2010, according to the NPD Group, a national marketing research firm. Purchases of computers, networking and software returned to prerecession levels. Industrial production rose over the period, and manufacturing capacity utilized, per the report issued by the Fed—a key measure of the health of the manufacturing sector—also edged higher.
Bonds delivered modest returns
As the economy strengthened and interest rates edged higher, most bond sectors delivered modest returns. The Barclays Capital Aggregate Bond Index1 returned 5.12%. High-yield bonds led the fixed-income markets. For the 12 months covered by this report, the JPMorgan
1The Barclays Capital Aggregate Bond Index is a market value-weighted index that tracks the daily price, coupon, pay-downs and total return performance of fixed-rate, publicly placed, dollar-denominated and non-convertible investment grade debt issues with at least $250 million par amount outstanding and with at least one year to final maturity.
2
Economic Update (continued) – Columbia Georgia Intermediate Municipal Bond Fund
Developed BB High Yield Index2 returned 13.04% as default fears abated and investors grew more comfortable with risk. Despite rising yields in the second half of the period, the Treasury market was also positive. The Barclays Capital U.S. Treasury Index3 returned 4.53%. However, municipal bonds struggled in the second half of the period, as interest rates inched higher and issue supply surged ahead of the year-end expiration of the Build America Bonds program. The Barclays Capital Municipal Bond Index4 gained 1.63% for the period. Despite positive economic activity, the Fed kept a key short-term interest rate—the federal funds rate—close to zero, reflecting ongoing concerns about employment and the housing market.
Stocks moved higher despite summer 2010 decline
Against a strengthening economic backdrop, stock prices continued to rally despite a summer 2010 setback linked to a debt crisis brewing in Europe, which raised concerns among U.S. investors. These fears were short-lived and stocks regained their footing. In this environment, the S&P 500 Index5 returned 15.65% for the 12 months through March 31, 2011. Outside the United States, stock markets also delivered solid gains. The MSCI EAFE Index (Net),6 a broad gauge of stock market performance in foreign developed markets, returned 10.42% (in U.S. dollars) for the 12-month period, as concerns about the impact of a bailout for weak euro zone economies eased yet continued to restrain market performance. Emerging stock markets were strong. The MSCI Emerging Markets Index (Net)7 returned 18.46% (in U.S. dollars) for the 12-month period.
Past performance is no guarantee of future results.
2The JPMorgan Developed BB High Yield Index is an unmanaged index designed to mirror the investable universe of the U.S. dollar developed, BB-rated, high yield corporate debt market.
3The Barclays Capital U.S. Treasury Index includes public obligations of the U.S. Treasury. Treasury bills are excluded by the maturity constraint. In addition, certain special issues, such as state and local government series bonds (SLGs), as well as U.S. Treasury TIPS, are excluded. STRIPS are excluded from the index because their inclusion would result in double-counting.
4The Barclays Capital Municipal Bond Index is considered representative of the broad market for investment-grade, tax-exempt bonds with a maturity of at least one year.
5The Standard & Poor's (S&P) 500 Index tracks the performance of 500 widely held, large-capitalization U.S. stocks.
6The Morgan Stanley Capital International Europe, Australasia, Far East (MSCI EAFE) Index (Net) is a free float- adjusted market capitalization index that is designed to measure the equity market performance of developed markets, excluding the U.S. & Canada. As of December 31, 2010, the MSCI EAFE Index (Net) consisted of the following 22 developed market country indices: Australia, Austria, Belgium, Denmark, Finland, France, Germany, Greece, Hong Kong, Ireland, Israel, Italy, Japan, the Netherlands, New Zealand, Norway, Portugal, Singapore, Spain, Sweden, Switzerland and the United Kingdom.
7The Morgan Stanley Capital International Emerging Markets (MSCI EM) Index (Net) is a free float-adjusted market capitalization index that is designed to measure equity market performance of emerging markets. As of December 31, 2010, the MSCI EM Index (Net) consisted of the following 21 emerging market country indices: Brazil, Chile, China, Colombia, Czech Republic, Egypt, Hungary, India, Indonesia, Korea, Malaysia, Mexico, Morocco, Peru, Philippines, Poland, Russia, South Africa, Taiwan, Thailand and Turkey.
Indices are not available for investment, are not professionally managed and do not reflect sales charges, fees, brokerage commissions, taxes or other expenses of investing. Securities in the fund may not match those in an index.
3
Performance Information – Columbia Georgia Intermediate Municipal Bond Fund
Performance data quoted represents past performance and current performance may be lower or higher. Past performance is no guarantee of future results. The investment return and principal value will fluctuate so that shares, when redeemed, may be worth more or less than the original cost. Please visit www.columbiamanagement.com for daily and most recent month-end performance updates.
Performance of a $10,000 investment 04/01/01 – 03/31/11
The chart above shows the change in value of a hypothetical $10,000 investment in Class A shares of Columbia Georgia Intermediate Municipal Bond Fund during the stated time period, and does not reflect the deduction of taxes that a shareholder may pay on fund distributions or on the redemption of fund shares.
Performance of a $10,000 investment 04/01/01 – 03/31/11 ($)
| Sales charge | | without | | with | |
| Class A | | | 14,127 | | | | 13,672 | | |
| Class B | | | 13,105 | | | | 13,105 | | |
| Class C | | | 13,105 | | | | 13,105 | | |
| Class Z | | | 14,483 | | | | n/a | | |
Average annual total return as of 03/31/11 (%)
| Share class | | A | | B | | C | | Z | |
| Inception | | 05/04/92 | | 06/07/93 | | 06/17/92 | | 03/01/92 | |
| Sales charge | | without | | with | | without | | with | | without | | with | | without | |
| 1-year | | | 2.35 | | | | –1.02 | | | | 1.59 | | | | –1.39 | | | | 1.59 | | | | 0.60 | | | | 2.61 | | |
| 5-year | | | 3.56 | | | | 2.89 | | | | 2.77 | | | | 2.77 | | | | 2.79 | | | | 2.79 | | | | 3.82 | | |
| 10-year | | | 3.52 | | | | 3.18 | | | | 2.74 | | | | 2.74 | | | | 2.74 | | | | 2.74 | | | | 3.77 | | |
The "with sales charge" returns include the maximum initial sales charge of 3.25% for Class A shares and the applicable contingent deferred sales charge of 3.00% in the first year, declining to 1.00% in the fourth year and eliminated thereafter for Class B shares and 1.00% for Class C shares for the first year only. The "without sales charge" returns do not include the effect of sales charges. If they had, returns would be lower.
Performance results reflect any fee waivers or reimbursements of fund expenses by the Investment Manager and/or any of its affiliates. Absent these fee waivers or expense reimbursement arrangements, performance results would have been lower.
All results shown assume reinvestment of distributions. Class Z shares are sold at net asset value with no distribution and service (Rule 12b-1) fees. Class Z shares have limited eligibility and the investment minimum requirements may vary. Please see the fund's prospectus for details. Performance for different share classes will vary based on differences in sales charges and fees associated with each class.
The tables do not reflect the deduction of taxes that a shareholder may pay on fund distributions or on the redemption of fund shares.
4
Understanding Your Expenses – Columbia Georgia Intermediate Municipal Bond Fund
As a fund shareholder, you incur two types of costs. There are transaction costs, which generally include sales charges on purchases and may include redemption fees or exchange fees. There are also ongoing costs, which generally include investment advisory fees, distribution and service (Rule 12b-1) fees and other fund expenses. The information on this page is intended to help you understand the ongoing costs of investing in the fund and to compare these costs with the ongoing costs of investing in other mutual funds.
Analyzing your fund's expenses by share class
To illustrate these ongoing costs, we have provided an example and calculated the expenses paid by investors in each share class during the period. The information in the following table is based on an initial investment of $1,000, which is invested at the beginning of the period and held for the entire period. Expense information is calculated two ways and each method provides you with different information. The amount listed in the "Actual" column is calculated using the fund's actual operating expenses and total return for the period. The amount listed in the "Hypothetical" column for each share class assumes that the return each year is 5% before expenses and is calculated based on the fund's actual operating expenses. You should not use the hypothetical account values and expenses to estimate either your actual account balance at the end of the period or the expenses you paid during this period.
Compare with other funds
Since all mutual funds are required to include the same hypothetical calculations about expenses in shareholder reports, you can use this information to compare the ongoing cost of investing in the fund with other funds. To do so, compare the 5% hypothetical example with the 5% hypothetical examples that appear in the shareholder reports of other funds. As you compare hypothetical examples of other funds, it is important to note that hypothetical examples are meant to highlight the ongoing costs of investing in a fund and do not reflect any transaction costs, such as sales charges, redemption fees or exchange fees.
Estimating your actual expenses
To estimate the expenses that you paid over the period, first you will need your account balance at the end of the period:
g For shareholders who receive their account statements from Columbia Management Investment Services Corp., your account balance is available online at www.columbiamanagement.com or by calling Shareholder Services at 800.345.6611.
g For shareholders who receive their account statements from their financial intermediary, contact your financial intermediary to obtain your account balance.
1. Divide your ending account balance by $1,000. For example, if an account balance was $8,600 at the end of the period, the result would be 8.6.
2. In the section of the table below titled "Expenses paid during the period," locate the amount for your share class. You will find this number in the column labeled "Actual." Multiply this number by the result from step 1. Your answer is an estimate of the expenses you paid on your account during the period.
If the value of your account falls below the minimum initial investment requirement applicable to you, your account may be subject to a $20 annual fee. This fee is not included in the accompanying table. If you are subject to the fee, keep it in mind when you are estimating the ongoing expenses of investing in the fund and when comparing the expenses of this fund with other funds.
10/01/10 – 03/31/11
| | | Account value at the
beginning of the period ($) | | Account value at the
end of the period ($) | | Expenses paid
during the period ($) | | Fund's annualized
expense ratio (%) | |
| | | Actual | | Hypothetical | | Actual | | Hypothetical | | Actual | | Hypothetical | | Actual | |
| Class A | | | 1,000.00 | | | | 1,000.00 | | | | 970.50 | | | | 1,020.94 | | | | 3.93 | | | | 4.03 | | | | 0.80 | | |
| Class B | | | 1,000.00 | | | | 1,000.00 | | | | 966.90 | | | | 1,017.20 | | | | 7.60 | | | | 7.80 | | | | 1.55 | | |
| Class C | | | 1,000.00 | | | | 1,000.00 | | | | 966.90 | | | | 1,017.20 | | | | 7.60 | | | | 7.80 | | | | 1.55 | | |
| Class Z | | | 1,000.00 | | | | 1,000.00 | | | | 971.70 | | | | 1,022.19 | | | | 2.70 | | | | 2.77 | | | | 0.55 | | |
Expenses paid during the period are equal to the annualized expense ratio for the share class, multiplied by the average account value over the period, then multiplied by the number of days in the fund's most recent fiscal half-year and divided by 365.
Had the Investment Manager and/or any of its affiliates not waived fees or reimbursed a portion of expenses, account value at the end of the period would have been reduced.
It is important to note that the expense amounts shown in the table are meant to highlight only ongoing costs of investing in the fund and do not reflect any transaction costs, such as sales charges, redemption fees or exchange fees. Therefore, the hypothetical examples provided may not help you determine the relative total costs of owning shares of different funds. If these transaction costs were included, your costs would have been higher.
5
Portfolio Manager's Report – Columbia Georgia Intermediate Municipal Bond Fund
Performance data quoted represents past performance and current performance may be lower or higher. Past performance is no guarantee of future results. The investment return and principal value will fluctuate so that shares, when redeemed, may be worth more or less than the original cost. Please visit www.columbiamanagement.com for daily and most recent month-end performance updates.
Net asset value per share
as of 03/31/11 ($)
| Class A | | | 10.50 | | |
| Class B | | | 10.50 | | |
| Class C | | | 10.50 | | |
| Class Z | | | 10.50 | | |
Distributions declared per share
04/01/10 – 03/31/11 ($)
| Class A | | | 0.33 | | |
| Class B | | | 0.25 | | |
| Class C | | | 0.25 | | |
| Class Z | | | 0.36 | | |
A portion of the fund's income may be subject to the alternative minimum tax. The fund may at times purchase tax-exempt securities at a discount. Some, or all, of this discount may be included in the fund's ordinary income, and is taxable when distributed.
30-day SEC yields
as of 03/31/11 (%)
| Class A | | | 2.55 | | |
| Class B | | | 1.89 | | |
| Class C | | | 1.88 | | |
| Class Z | | | 2.89 | | |
The 30-day SEC yields reflect the fund's earning power, net of expenses, expressed as an annualized percentage of the public offering price per share at the end of the period.
For the 12-month period that ended March 31, 2011, the fund's Class A shares returned 2.35% without sales charge. The fund lagged its benchmark, the Barclays Capital 3-15 Year Blend Municipal Bond Index, which returned 2.91% for the period. However, its return was higher than the 1.76% average return of funds in its peer group, the Lipper Other States Intermediate Municipal Debt Funds Classification. Maturity allocations and interest-rate positioning aided performance versus the index, while certain sector allocations and issue selection within certain sectors hurt results.
Solid results for Georgia municipal bonds
Georgia municipal bonds generally outpaced the broader municipal market. Although economic recovery has been slow to take hold in Georgia, we believe the state's conservative fiscal policies, low debt levels and high AAA credit quality rating1 helped attract out-of-state investors, benefiting Georgia muni bond returns.
Gains from interest-rate positioning, security selection and sector allocations
Strong interest-rate positioning helped performance. An overweight in bonds with intermediate-range maturities—six to 12 years—which were the year's best performers, and underweights in bonds with both shorter and longer-maturities were particularly helpful. The fund also benefited from strong security selection within the local general obligation (GO) sector, largely because of our focus on bonds in the seven- to nine-year maturity range. GO bonds are issued and backed by states or municipalities to finance capital projects. Elsewhere, issue selection among BBB rated and AA rated bonds boosted results, as returns beat those in the index. The fund picked up added ground from positive allocations and good security selection within the health care, industrial development/pollution control and transportation sectors. An overweight in health care, where the fund had an above-average stake in AA rated hospital bonds, was beneficial, as were underweights and strong returns in the industrial development/pollution control and transportation sectors. Top contributors included industrial development revenue bonds backed by International Paper (1.0% of net assets) and transportation bonds issued by Georgia State Road & Tollway Authority (3.1% of net assets). Revenue bonds are usually backed by revenues from the project being financed.
Underperformance from state GO allocation
A structural underweight in state GOs hurt performance versus the Barclays index, which is national in scope. The fund made up some ground, however, from strong issue selection, as the Georgia state GOs in the fund outperformed the broader range of state GOs in the index. Water and sewer bonds detracted from performance, largely because of weak results from bonds issued by DeKalb County Water & Sewer (1.9% of net assets). Standard & Poor's, the credit ratings agency, downgraded the issues from AA+ to AA- and then withdrew their rating amid concerns over the issuer's lack of disclosure and declining financial strength.
1The credit quality ratings represent the lower of one of the following nationally recognized rating agencies: Standard & Poor's or Moody's Investor Services. If a security is rated by only one of the two agencies, that rating is used. If a security is not rated by either of the two agencies, it is designated as Non-Rated. Ratings are relative and subjective and are not absolute standards of quality. The credit quality of the fund's investments does not remove market risk.
6
Portfolio Manager's Report (continued) – Columbia Georgia Intermediate Municipal Bond Fund
Slow recovery in Georgia
We expect sluggish economic growth in Georgia, given the headwinds facing the state. The local banking industry was particularly hard hit during the financial crisis and continues to contract. Unemployment remains high, as the construction, financial services, government and retail sectors have yet to recover from the downturn. In addition, house prices continue to decline. On a positive note, a weak U.S. dollar has helped Georgia's export business.
Despite this anemic outlook, we believe Georgia municipal bonds offer solid tax-exempt return potential. Going forward, we plan to take advantage of any issues that become mispriced and stand to benefit from a recovery. As the economy improves, we would expect municipal bond prices to move higher, in general. However, that trend could be offset at some point by a Federal Reserve Board short-term interest-rate hike. Although we don't expect rates to rise much in 2011, we have become more conservative by reducing the fund's sensitivity to interest rate changes. We also may increase exposure to shorter-maturity callable (or redeemable) bonds, which usually outperform similar maturity non-callable issues as interest rates rise.
Portfolio characteristics and holdings are subject to change periodically and may not be representative of current characteristics and holdings. The outlook for the fund may differ from that presented for other Columbia Funds.
Tax-exempt investing offers current tax-exempt income, but it also involves special risks. The value of the fund will be affected by interest rate changes and the creditworthiness of issues held in the fund. When interest rates go up, bond prices generally drop and vice versa.
Interest income from certain tax-exempt bonds may be subject to certain state and local taxes and, if applicable, the alternative minimum tax. Capital gains are not exempt from income taxes.
Single-state municipal bond funds pose additional risks due to limited geographical diversification.
Taxable-equivalent SEC yields
as of 03/31/11 (%)
| Class A | | | 4.18 | | |
| Class B | | | 3.09 | | |
| Class C | | | 3.08 | | |
| Class Z | | | 4.73 | | |
Taxable-equivalent SEC yields are based on the combined maximum effective 35.0% federal income tax rate and applicable state income tax rate. This tax rate does not reflect the phase out of exemptions or the reduction of the otherwise allowable deductions that occur when adjusted gross income exceeds certain levels. Your taxable-equivalent yield may be different depending on your tax bracket.
Top 5 sectors
as of 03/31/11 (%)
| Tax-Backed | | | 30.3 | | |
| Utilities | | | 25.5 | | |
| Education | | | 11.3 | | |
| Health Care | | | 11.0 | | |
| Housing | | | 8.1 | | |
Quality breakdown
as of 03/31/11 (%)
| AAA | | | 16.80 | | |
| AA | | | 50.20 | | |
| A | | | 25.50 | | |
| BBB | | | 6.50 | | |
| Non-Rated | | | 1.00 | | |
Maturity breakdown
as of 03/31/11 (%)
| 0-1 years | | | 1.0 | | |
| 1-3 years | | | 2.0 | | |
| 3-5 years | | | 7.6 | | |
| 5-7 years | | | 20.1 | | |
| 7-10 years | | | 23.2 | | |
| 10-15 years | | | 36.5 | | |
| 15-20 years | | | 3.9 | | |
| Net Cash and Equivalents | | | 5.7 | | |
Ratings shown in the quality breakdown are assigned to individual bonds by taking the lower of the ratings available from one of the following nationally recognized rating agencies: Standard & Poor's or Moody's Investor Services. If a security is rated by only one of the two agencies, that rating is used. If a security is not rated by either of the two agencies, it is designated as Non-Rated. Ratings are relative and subjective and are not absolute standards of quality. The credit quality of the fund's investments does not remove market risk.
The fund is actively managed and the composition of its portfolio will change over time. Information provided is calculated as a percentage of net assets.
7
Investment Portfolio – Columbia Georgia Intermediate Municipal Bond Fund
March 31, 2011
| Municipal Bonds – 96.9% | |
| | | Par ($) | | Value ($) | |
| Education – 11.3% | |
| Education – 11.3% | |
| GA Athens Housing Authority | |
University of Georgia - East Campus Housing,
Series 2010,
4.000% 12/01/16 | | | 1,575,000 | | | | 1,706,434 | | |
| GA Bleckley & Dodge County Development Authority | |
Middle Georgia College,
Series 2008,
5.000% 07/01/21 | | | 1,260,000 | | | | 1,302,462 | | |
| GA Bulloch County Development Authority | |
Georgia Southern University Student Housing,
Series 2008,
Insured: AGO
5.250% 07/01/20 | | | 1,000,000 | | | | 1,102,730 | | |
| GA Cobb County Development Authority | |
Kennesaw State University Foundation,
Series 2004,
Insured: NPFGC
5.000% 07/15/19 | | | 1,870,000 | | | | 2,019,731 | | |
| GA DeKalb Newton & Gwinnett Counties Joint Development Authority | |
GGC Foundation LLC,
Series 2009,
5.500% 07/01/24 | | | 2,500,000 | | | | 2,683,000 | | |
| GA Private Colleges & Universities Authority | |
Spelman College,
Series 2003,
5.250% 06/01/19 | | | 2,250,000 | | | | 2,309,760 | | |
| GA South Regional Joint Development Authority | |
Valdosta State University Auxiliary Services,
Series 2008,
Insured: AGO
5.000% 08/01/23 | | | 1,125,000 | | | | 1,158,885 | | |
| Education Total | | | 12,283,002 | | |
| Education Total | | | 12,283,002 | | |
| Health Care – 11.0% | |
| Hospitals – 11.0% | |
| GA Chatham County Hospital Authority | |
Memorial Health University Medical Center:
Series 2001 A,
6.125% 01/01/24 | | | 2,500,000 | | | | 2,343,150 | | |
Series 2004 A,
5.375% 01/01/26 | | | 1,000,000 | | | | 865,130 | | |
| | | Par ($) | | Value ($) | |
| GA Cobb County Kennestone Hospital Authority | |
Wellstar Health System,
Series 2005 B,
4.000% 04/01/16 | | | 1,110,000 | | | | 1,168,830 | | |
| GA DeKalb Private Hospital Authority | |
Children's Healthcare Atlanta, Inc.,
Series 2009,
5.000% 11/15/17 | | | 320,000 | | | | 353,312 | | |
| GA Fayette County Hospital Authority | |
Series 2009 A,
5.250% 06/15/23 | | | 2,000,000 | | | | 2,075,420 | | |
| GA Floyd County Hospital Authority | |
Floyd Healthcare Management,
Series 2002,
Insured: NPFGC:
5.500% 07/01/14 | | | 765,000 | | | | 807,190 | | |
| 5.500% 07/01/18 | | | 1,290,000 | | | | 1,337,111 | | |
| GA Gwinnett County Hospital Authority | |
Gwinnett Hospital System,
Series 2007 A,
Insured: AGMC
5.000% 07/01/23 | | | 2,000,000 | | | | 1,990,800 | | |
| GA Macon-Bibb County Hospital Authority | |
Medical Center of Central Georgia,
Series 2009,
5.000% 08/01/23 | | | 1,030,000 | | | | 1,051,753 | | |
| Hospitals Total | | | 11,992,696 | | |
| Health Care Total | | | 11,992,696 | | |
| Housing – 8.1% | |
| Multi-Family – 8.1% | |
| GA Clayton County Housing Authority | |
GCC Ventures LLC,
Series 2001A,
LIQ FAC: FNMA
4.350% 12/01/31
(12/01/11) (a)(b) | | | 3,390,000 | | | | 3,390,000 | | |
| GA Cobb County Development Authority | |
Kennesaw State University Foundation:
Series 2004 A,
Insured: NPFGC
5.250% 07/15/19 | | | 2,000,000 | | | | 2,175,840 | | |
Series 2007 A,
Insured: AMBAC
5.250% 07/15/27 | | | 3,000,000 | | | | 2,759,100 | | |
See Accompanying Notes to Financial Statements.
8
Columbia Georgia Intermediate Municipal Bond Fund
March 31, 2011
| Municipal Bonds (continued) | |
| | | Par ($) | | Value ($) | |
| GA Lawrenceville Housing Authority | |
Knollwood Park LP,
Series 1997, AMT,
Guarantor: FNMA
6.250% 12/01/29
(06/01/15) (a)(b) | | | 470,000 | | | | 487,912 | | |
| Multi-Family Total | | | 8,812,852 | | |
| Housing Total | | | 8,812,852 | | |
| Industrials – 1.2% | |
| Forest Products & Paper – 1.0% | |
| GA Richmond County Development Authority | |
International Paper Co.,
Series 2001 A,
5.150% 03/01/15 | | | 1,000,000 | | | | 1,058,750 | | |
| Forest Products & Paper Total | | | 1,058,750 | | |
| Oil & Gas – 0.2% | |
| GA Main Street Natural Gas, Inc. | |
Series 2007 A,
5.250% 09/15/19 | | | 295,000 | | | | 290,038 | | |
| Oil & Gas Total | | | 290,038 | | |
| Industrials Total | | | 1,348,788 | | |
| Other – 5.0% | |
| Refunded/Escrowed (c) – 5.0% | |
| GA Barrow County School District | |
Series 2006,
Escrowed to Maturity,
5.000% 02/01/14 | | | 665,000 | | | | 739,733 | | |
| GA Gwinnett County School District | |
Series 2008:
Escrowed to Maturity,
5.000% 02/01/17 | | | 1,000,000 | | | | 1,161,860 | | |
Pre-refunded 02/01/2018,
5.000% 02/01/22 | | | 1,000,000 | | | | 1,160,610 | | |
| GA State | |
Series 2007 G,
Pre-refunded 12/01/17,
5.000% 12/01/20 | | | 2,000,000 | | | | 2,371,580 | | |
| Refunded/Escrowed Total | | | 5,433,783 | | |
| Other Total | | | 5,433,783 | | |
| Tax-Backed – 30.3% | |
| Local Appropriated – 2.3% | |
| GA Atlanta Public Safety & Judicial Facilities Authority | |
Series 2006,
Insured: AGMC
5.000% 12/01/17 | | | 1,310,000 | | | | 1,459,196 | | |
| | | Par ($) | | Value ($) | |
| GA Fulton County Facilities Corp. | |
Series 2009,
5.000% 11/01/17 | | | 1,000,000 | | | | 1,095,060 | | |
| Local Appropriated Total | | | 2,554,256 | | |
| Local General Obligations – 18.1% | |
| GA Atlanta Solid Waste Management Authority | |
Series 2008,
Insured: AGMC
5.000% 12/01/17 | | | 795,000 | | | | 900,091 | | |
| GA Augusta Richmond County | |
Series 2009,
4.000% 10/01/15 | | | 2,310,000 | | | | 2,524,022 | | |
| GA Barrow County School District | |
Series 2006,
5.000% 02/01/14 | | | 335,000 | | | | 371,026 | | |
| GA Chatham County School District | |
Series 2002,
Insured: AGMC
5.250% 08/01/14 | | | 1,000,000 | | | | 1,131,400 | | |
Series 2004,
Insured: AGMC
5.250% 08/01/19 | | | 2,000,000 | | | | 2,339,020 | | |
| GA College Park Business & Industrial Development Authority | |
Series 2005,
Insured: AMBAC
5.250% 09/01/19 | | | 2,000,000 | | | | 2,127,920 | | |
| GA County of Cherokee | |
Series 2009,
5.000% 08/01/22 | | | 2,000,000 | | | | 2,200,100 | | |
| GA Douglas County School District | |
Series 2007,
Insured: AGMC:
5.000% 04/01/21 | | | 2,000,000 | | | | 2,166,500 | | |
| 5.000% 04/01/23 | | | 1,500,000 | | | | 1,595,760 | | |
| GA Gwinnett County School District | |
Series 2010:
4.000% 02/01/18 | | | 1,000,000 | | | | 1,095,830 | | |
| 5.000% 02/01/24 | | | 1,500,000 | | | | 1,692,645 | | |
| GA Walton County School District | |
Series 2005 A,
Insured: NPFGC
5.000% 08/01/22 | | | 1,500,000 | | | | 1,570,050 | | |
| Local General Obligations Total | | | 19,714,364 | | |
See Accompanying Notes to Financial Statements.
9
Columbia Georgia Intermediate Municipal Bond Fund
March 31, 2011
| Municipal Bonds (continued) | |
| | | Par ($) | | Value ($) | |
| Special Non-Property Tax – 4.6% | |
| GA Cobb-Marietta County Coliseum & Exhibit Hall Authority | |
Series 2005,
Insured: NPFGC
5.250% 10/01/19 | | | 2,430,000 | | | | 2,708,186 | | |
| GA Metropolitan Atlanta Rapid Transit Authority | |
Series 1992 N,
Insured: NPFGC
6.250% 07/01/18 | | | 2,000,000 | | | | 2,288,240 | | |
| Special Non-Property Tax Total | | | 4,996,426 | | |
| Special Property Tax – 1.5% | |
| GA Atlanta Tax Allocation | |
Atlantic Station Project,
Series 2007,
Insured: AGO
5.250% 12/01/20 | | | 1,545,000 | | | | 1,579,824 | | |
| Special Property Tax Total | | | 1,579,824 | | |
| State General Obligations – 3.8% | |
| GA State | |
Series 2009,
5.000% 05/01/23 | | | 2,000,000 | | | | 2,200,260 | | |
| PR Commonwealth of Puerto Rico Public Buildings Authority | |
Series 2007,
6.250% 07/01/23 | | | 1,825,000 | | | | 1,931,434 | | |
| State General Obligations Total | | | 4,131,694 | | |
| Tax-Backed Total | | | 32,976,564 | | |
| Transportation – 4.5% | |
| Airports – 1.4% | |
| GA Atlanta | |
Series 2010 C,
5.000% 01/01/25 | | | 1,500,000 | | | | 1,524,195 | | |
| Airports Total | | | 1,524,195 | | |
| Toll Facilities – 3.1% | |
| GA Road & Tollway Authority | |
Series 2006,
Insured: NPFGC
5.000% 06/01/16 | | | 2,000,000 | | | | 2,276,740 | | |
Series 2009 A,
5.000% 06/01/21 | | | 1,000,000 | | | | 1,096,250 | | |
| Toll Facilities Total | | | 3,372,990 | | |
| Transportation Total | | | 4,897,185 | | |
| | | Par ($) | | Value ($) | |
| Utilities – 25.5% | |
| Investor Owned – 0.9% | |
| GA Appling County Development Authority | |
Georgia Power Co.,
Series 2006,
Insured: AMBAC
4.400% 07/01/16 | | | 1,000,000 | | | | 1,008,860 | | |
| Investor Owned Total | | | 1,008,860 | | |
| Joint Power Authority – 6.5% | |
| GA Monroe County Development Authority | |
Oglethorpe Power Corp.,
Series 1992,
6.800% 01/01/12 | | | 1,000,000 | | | | 1,038,100 | | |
| GA Municipal Electric Authority | |
Power Revenue Bonds,
Series 1992 B,
Insured: NPFGC
6.375% 01/01/16 | | | 2,000,000 | | | | 2,274,080 | | |
Series 1998 A,
Insured: NPFGC
5.250% 01/01/13 | | | 1,000,000 | | | | 1,066,300 | | |
Series 2008 A,
5.250% 01/01/21 | | | 1,395,000 | | | | 1,528,655 | | |
Series 2008 D,
6.000% 01/01/23 | | | 1,000,000 | | | | 1,097,670 | | |
| Joint Power Authority Total | | | 7,004,805 | | |
| Municipal Electric – 2.0% | |
| PR Commonwealth of Puerto Rico Electric Power Authority | |
Series 2002 JJ,
Insured: SYNC
5.375% 07/01/16 | | | 1,405,000 | | | | 1,516,276 | | |
Series 2007 TT,
5.000% 07/01/20 | | | 655,000 | | | | 662,657 | | |
| Municipal Electric Total | | | 2,178,933 | | |
| Water & Sewer – 16.1% | |
| GA Atlanta Water & Wastewater | |
Series 2009 B,
Insured: AGMC
5.000% 11/01/17 | | | 2,000,000 | | | | 2,181,480 | | |
| GA Augusta Water & Sewer | |
Series 2007,
Insured: AGMC:
5.000% 10/01/21 | | | 1,000,000 | | | | 1,081,350 | | |
| 5.000% 10/01/22 | | | 2,000,000 | | | | 2,147,000 | | |
See Accompanying Notes to Financial Statements.
10
Columbia Georgia Intermediate Municipal Bond Fund
March 31, 2011
| Municipal Bonds (continued) | |
| | | Par ($) | | Value ($) | |
| GA County of Fulton | |
Series 2004,
Insured: NPFGC
5.000% 01/01/30 | | | 1,500,000 | | | | 1,476,570 | | |
| GA Dekalb County Water & Sewer | |
Series 2006 B,
5.250% 10/01/21 | | | 2,000,000 | | | | 2,120,980 | | |
| GA Griffin Combined Public Utility Improvement | |
Series 2002,
Insured: AMBAC
5.125% 01/01/19 | | | 2,585,000 | | | | 2,687,573 | | |
| GA Jackson County Water & Sewer | |
Series 2006 A,
Insured: SYNC
5.000% 09/01/16 | | | 1,030,000 | | | | 1,089,967 | | |
| GA Upper Oconee Basin Water Authority | |
Series 2005,
Insured: NPFGC:
5.000% 07/01/17 | | | 1,140,000 | | | | 1,271,487 | | |
| 5.000% 07/01/22 | | | 1,855,000 | | | | 1,941,053 | | |
| GA Walton County Water & Sewer Authority | |
Walton Hard Labor Creek Reservoir,
Series 2008,
Insured: AGMC
5.000% 02/01/25 | | | 1,495,000 | | | | 1,539,267 | | |
| Water & Sewer Total | | | 17,536,727 | | |
| Utilities Total | | | 27,729,325 | | |
Total Municipal Bonds
(cost of $103,586,049) | | | 105,474,195 | | |
| Investment Companies – 2.2% | |
| | | Shares | | | |
BofA Tax-Exempt Reserves,
Capital Class
(7 day yield of 0.110%) (d) | | | 1,050,790 | | | | 1,050,790 | | |
Dreyfus Tax-Exempt Cash
Management Fund
(7 day yield of 0.080%) | | | 1,361,361 | | | | 1,361,361 | | |
Total Investment Companies
(cost of $2,412,151) | | | 2,412,151 | | |
Total Investments – 99.1%
(cost of $105,998,200) (e) | | | 107,886,346 | | |
| Other Assets & Liabilities, Net – 0.9% | | | 934,784 | | |
| Net Assets – 100.0% | | | 108,821,130 | | |
Notes to Investment Portfolio:
(a) The interest rate shown on floating rate or variable rate securities reflects the rate at March 31, 2011.
(b) Parenthetical date represents the next interest rate reset date for the security.
(c) The Fund has been informed that each issuer has placed direct obligations of the U.S. Government in an irrevocable trust, solely for the payment of principal and interest.
(d) Investments in affiliates during the year ended March 31, 2011:
| Affiliate | | Value,
beginning of
period | | Purchases | | Sales
Proceeds | | Dividend
Income | | Value,
end of
period | |
BofA Tax-Exempt
Reserves, Capital
Class (7 day yield
of 0.110%) | | $ | 631,338 | | | $ | 2,237,118 | | | $ | 2,018,456 | | | $ | 111 | | | $ | — | | |
As of May 1, 2010, this company was no longer an affiliate of the fund. The above table reflects activity for the period from April 1, 2010 through April 30, 2010.
(e) Cost for federal income tax purposes is $105,998,200.
Generally accepted accounting principles (GAAP) require disclosure regarding the inputs and valuation techniques used to measure fair value and any changes in valuation inputs or techniques. In addition, investments shall be disclosed by major category.
The Fund categorizes its fair value measurements according to a three-level hierarchy that maximizes the use of observable inputs and minimizes the use of unobservable inputs by prioritizing that the most observable input be used when available. Observable inputs are those that market participants would use in pricing an investment based on market data obtained from sources independent of the reporting entity. Unobservable inputs are those that reflect the Fund's assumptions about the information market participants would use in pricing an investment. An investment's level within the fair value hierarchy is based on the lowest level of any input that is deemed significant to the asset or liability's fair value measurement. The input levels are not necessarily an indication of the risk or liquidity associated with investments at that level. For example, certain U.S. government securities are generally high quality and liquid, however, they are reflected as Level 2 because the inputs used to determine fair value may not always be quoted prices in an active market.
Fair value inputs are summarized in the three broad levels listed below:
• Level 1—Valuations based on quoted prices for investments in active markets that the Fund has the ability to access at the measurement date (including NAV for open-end mutual funds). Valuation adjustments are not applied to Level 1 investments.
• Level 2—Valuations based on other significant observable inputs (including quoted prices for similar securities, interest rates, prepayment speeds, credit risks, etc.).
• Level 3—Valuations based on significant unobservable inputs (including the Fund's own assumptions and judgment in determining the fair value of investments).
Inputs that are used in determining fair value of an investment may include price information, credit data, volatility statistics, and other factors. These inputs can be either observable or unobservable. The availability of observable inputs can vary between investments, and is affected by various factors such as the type of investment, and the volume and level of activity for that investment or similar investments in the marketplace. The inputs will be considered by the Investment Manager, along with any other relevant factors in the calculation of an investment's fair value. The Fund uses prices and inputs that are current as of the measurement date, which may include periods of market dislocations. During these periods, the availability of prices and inputs may be reduced for many investments. This condition could cause an investment to be reclassified between the various levels within the hierarchy.
Investments falling into the Level 3 category are primarily supported by quoted prices from brokers and dealers participating in the market for those investments. However, these may be classified as Level 3 investments due to lack of market transparency and corroboration to support these quoted prices. Additionally, valuation models may be used as the pricing source for
See Accompanying Notes to Financial Statements.
11
Columbia Georgia Intermediate Municipal Bond Fund
March 31, 2011
any remaining investments classified as Level 3. These models rely on one or more significant unobservable inputs and/or significant assumptions by the Investment Manager. Inputs used in valuations may include, but are not limited to, financial statement analysis, capital account balances, discount rates and estimated cash flows, and comparable company data.
The following table is a summary of the inputs used to value the Fund's investments as of March 31, 2011:
| Description | | Quoted
Prices
(Level 1) | | Other
Significant
Observable
Inputs
(Level 2) | | Significant
Unobservable
Inputs
(Level 3) | | Total | |
| Total Municipal Bonds | | $ | — | | | $ | 105,474,195 | | | $ | — | | | $ | 105,474,195 | | |
Total Investment
Companies | | | 2,412,151 | | | | — | | | | — | | | | 2,412,151 | | |
| Total Investments | | $ | 2,412,151 | | | $ | 105,474,195 | | | $ | — | | | $ | 107,886,346 | | |
The Fund's assets assigned to the Level 2 input category are generally valued using the market approach, in which a security's value is determined through its correlation to prices and information from market transactions for similar or identical assets.
There were no significant transfers of financial assets between Levels 1 and 2 during the period.
At March 31, 2011, the composition of the Fund by revenue source is as follows:
| Holdings By Revenue Source (Unaudited) | | % of
Net Assets | |
| Tax-Backed | | | 30.3 | | |
| Utilities | | | 25.5 | | |
| Education | | | 11.3 | | |
| Health Care | | | 11.0 | | |
| Housing | | | 8.1 | | |
| Other | | | 5.0 | | |
| Transportation | | | 4.5 | | |
| Industrials | | | 1.2 | | |
| | | | 96.9 | | |
| Investment Companies | | | 2.2 | | |
| Other Assets & Liabilities, Net | | | 0.9 | | |
| | | | 100.0 | | |
| Acronym | | Name | |
| AGMC | | Assured Guaranty Municipal Corp. | |
|
| AGO | | Assured Guaranty Ltd. | |
|
| AMBAC | | Ambac Assurance Corp. | |
|
| AMT | | Alternative Minimum Tax | |
|
| FNMA | | Federal National Mortgage Association | |
|
| LIQ FAC | | Liquidity Facility | |
|
| NPFGC | | National Public Finance Guarantee Corp. | |
|
| SYNC | | Syncora Guarantee, Inc. | |
|
See Accompanying Notes to Financial Statements.
12
Statement of Assets and Liabilities – Columbia Georgia Intermediate Municipal Bond Fund
March 31, 2011
| | | | | ($) | |
| Assets | | Investments, at identified cost | | | 105,998,200 | | |
| | | Investments, at value | | | 107,886,346 | | |
| | | Cash | | | 667 | | |
| | | Receivable for: | | | | | |
| | | Fund shares sold | | | 18,591 | | |
| | | Interest | | | 1,447,508 | | |
| | | Expense reimbursement due from Investment Manager | | | 50,223 | | |
| | | Prepaid expenses | | | 199 | | |
| | | Total Assets | | | 109,403,534 | | |
| Liabilities | | Payable for: | | | | | |
| | | Fund shares repurchased | | | 77,954 | | |
| | | Distributions | | | 276,112 | | |
| | | Investment advisory fee | | | 38,186 | | |
| | | Administration fee | | | 9,735 | | |
| | | Pricing and bookkeeping fees | | | 6,285 | | |
| | | Transfer agent fee | | | 22,474 | | |
| | | Trustees' fees | | | 74,407 | | |
| | | Audit fee | | | 28,700 | | |
| | | Legal fee | | | 30,776 | | |
| | | Custody fee | | | 1,986 | | |
| | | Distribution and service fees | | | 7,645 | | |
| | | Chief compliance officer expenses | | | 235 | | |
| | | Other liabilities | | | 7,909 | | |
| | | Total Liabilities | | | 582,404 | | |
| | | Net Assets | | | 108,821,130 | | |
| Net Assets Consist of | | Paid-in capital | | | 106,868,297 | | |
| | | Undistributed net investment income | | | 171,044 | | |
| | | Accumulated net realized loss | | | (106,357 | ) | |
| | | Net unrealized appreciation (depreciation) on investments | | | 1,888,146 | | |
| | | Net Assets | | | 108,821,130 | | |
See Accompanying Notes to Financial Statements.
13
Statement of Assets and Liabilities (continued) – Columbia Georgia Intermediate Municipal Bond Fund
March 31, 2011
| Class A | | Net assets | | $ | 19,641,281 | | |
| | | Shares outstanding | | | 1,871,129 | | |
| | | Net asset value per share | | $ | 10.50 | (a) | |
| | | Maximum sales charge | | | 3.25 | % | |
| | | Maximum offering price per share ($10.50/0.9675) | | $ | 10.85 | (b) | |
| Class B | | Net assets | | $ | 528,200 | | |
| | | Shares outstanding | | | 50,293 | | |
| | | Net asset value and offering price per share | | $ | 10.50 | (a) | |
| Class C | | Net assets | | $ | 3,347,030 | | |
| | | Shares outstanding | | | 318,764 | | |
| | | Net asset value and offering price per share | | $ | 10.50 | (a) | |
| Class Z | | Net assets | | $ | 85,304,619 | | |
| | | Shares outstanding | | | 8,126,471 | | |
| | | Net asset value, offering and redemption price per share | | $ | 10.50 | | |
(a) Redemption price per share is equal to net asset value less any applicable contingent deferred sales charge.
(b) On sales of $100,000 or more the offering price is reduced.
See Accompanying Notes to Financial Statements.
14
Statement of Operations – Columbia Georgia Intermediate Municipal Bond Fund
For the Year Ended March 31, 2011
| | | | | ($) | |
| Investment Income | | Interest | | | 4,803,477 | | |
| | | Dividends | | | 2,293 | | |
| | | Dividends from affiliates | | | 111 | | |
| | | Total Investment Income | | | 4,805,881 | | |
| Expenses | | Investment advisory fee | | | 494,944 | | |
| | | Administration fee | | | 129,055 | | |
| | | Distribution fee: | | | | | |
| | | Class B | | | 5,131 | | |
| | | Class C | | | 27,567 | | |
| | | Service fee: | | | | | |
| | | Class B | | | 1,710 | | |
| | | Class C | | | 9,189 | | |
| | | Distribution and service fees: | | | | | |
| | | Class A | | | 47,667 | | |
| | | Transfer agent fee | | | 66,558 | | |
| | | Pricing and bookkeeping fees | | | 66,957 | | |
| | | Trustees' fees | | | 33,113 | | |
| | | Custody fee | | | 10,959 | | |
| | | Chief compliance officer expenses | | | 1,105 | | |
| | | Other expenses | | | 111,222 | | |
| | | Total Expenses | | | 1,005,177 | | |
| | | Fees waived or expenses reimbursed by Investment Manager | | | (233,663 | ) | |
| | | Expense reductions | | | (4 | ) | |
| | | Net Expenses | | | 771,510 | | |
| | | Net Investment Income | | | 4,034,371 | | |
| Net Realized and Unrealized Gain (Loss) on Investments | | Net realized gain on investments | | | 853,561 | | |
| | | Net change in unrealized appreciation (depreciation) on investments | | | (1,509,643 | ) | |
| | | Net Loss | | | (656,082 | ) | |
| | | Net Increase Resulting from Operations | | | 3,378,289 | | |
See Accompanying Notes to Financial Statements.
15
Statement of Changes in Net Assets – Columbia Georgia Intermediate Municipal Bond Fund
| | | | | Year Ended March 31, | |
| Increase (Decrease) in Net Assets | | | | 2011 ($) | | 2010 ($) | |
| Operations | | Net investment income | | | 4,034,371 | | | | 4,509,696 | | |
| | | Net realized gain on investments | | | 853,561 | | | | 129,577 | | |
| | | Net change in unrealized appreciation (depreciation)
on investments | | | (1,509,643 | ) | | | 4,826,475 | | |
| | | Net increase resulting from operations | | | 3,378,289 | | | | 9,465,748 | | |
| Distributions to Shareholders | | From net investment income: | | | | | | | | | |
| | | Class A | | | (589,516 | ) | | | (560,391 | ) | |
| | | Class B | | | (15,911 | ) | | | (29,733 | ) | |
| | | Class C | | | (85,928 | ) | | | (71,706 | ) | |
| | | Class Z | | | (3,343,016 | ) | | | (3,847,866 | ) | |
| | | Total distributions to shareholders | | | (4,034,371 | ) | | | (4,509,696 | ) | |
| | | Net Capital Stock Transactions | | | (24,447,360 | ) | | | 394,560 | | |
| | | Total increase (decrease) in net assets | | | (25,103,442 | ) | | | 5,350,612 | | |
| Net Assets | | Beginning of period | | | 133,924,572 | | | | 128,573,960 | | |
| | | End of period | | | 108,821,130 | | | | 133,924,572 | | |
| | | Undistributed net investment income at
end of period | | | 171,044 | | | | 171,096 | | |
See Accompanying Notes to Financial Statements.
16
Statement of Changes in Net Assets (continued) – Columbia Georgia Intermediate Municipal Bond Fund
| | | Capital Stock Activity | |
| | | Year Ended
March 31, 2011 | | Year Ended
March 31, 2010 | |
| | | Shares | | Dollars ($) | | Shares | | Dollars ($) | |
| Class A | |
| Subscriptions | | | 501,954 | | | | 5,305,218 | | | | 519,795 | | | | 5,467,850 | | |
| Distributions reinvested | | | 31,411 | | | | 336,881 | | | | 35,742 | | | | 376,489 | | |
| Redemptions | | | (499,187 | ) | | | (5,355,329 | ) | | | (172,235 | ) | | | (1,826,548 | ) | |
| Net increase | | | 34,178 | | | | 286,770 | | | | 383,302 | | | | 4,017,791 | | |
| Class B | |
| Subscriptions | | | 258 | | | | 2,773 | | | | 9,049 | | | | 93,766 | | |
| Distributions reinvested | | | 855 | | | | 9,184 | | | | 2,312 | | | | 24,342 | | |
| Redemptions | | | (34,481 | ) | | | (372,916 | ) | | | (51,914 | ) | | | (550,367 | ) | |
| Net decrease | | | (33,368 | ) | | | (360,959 | ) | | | (40,553 | ) | | | (432,259 | ) | |
| Class C | |
| Subscriptions | | | 90,131 | | | | 965,858 | | | | 230,495 | | | | 2,418,784 | | |
| Distributions reinvested | | | 4,526 | | | | 48,513 | | | | 3,883 | | | | 40,983 | | |
| Redemptions | | | (112,972 | ) | | | (1,203,247 | ) | | | (103,530 | ) | | | (1,072,642 | ) | |
| Net increase (decrease) | | | (18,315 | ) | | | (188,876 | ) | | | 130,848 | | | | 1,387,125 | | |
| Class Z | |
| Subscriptions | | | 401,573 | | | | 4,312,332 | | | | 1,551,458 | | | | 16,301,234 | | |
| Distributions reinvested | | | 8,875 | | | | 95,257 | | | | 10,762 | | | | 113,395 | | |
| Redemptions | | | (2,686,058 | ) | | | (28,591,884 | ) | | | (2,003,923 | ) | | | (20,992,726 | ) | |
| Net decrease | | | (2,275,610 | ) | | | (24,184,295 | ) | | | (441,703 | ) | | | (4,578,097 | ) | |
See Accompanying Notes to Financial Statements.
17
Financial Highlights – Columbia Georgia Intermediate Municipal Bond Fund
Selected data for a share outstanding throughout each period is as follows:
| | | Year Ended March 31, | |
| Class A Shares | | 2011 | | 2010 | | 2009 | | 2008 | | 2007 | |
| Net Asset Value, Beginning of Period | | $ | 10.58 | | | $ | 10.18 | | | $ | 10.35 | | | $ | 10.54 | | | $ | 10.51 | | |
| Income from Investment Operations: | |
| Net investment income (a) | | | 0.33 | | | | 0.34 | | | | 0.37 | | | | 0.40 | | | | 0.40 | | |
Net realized and unrealized gain (loss) on investments
and futures contracts | | | (0.08 | ) | | | 0.40 | | | | (0.17 | ) | | | (0.19 | ) | | | 0.03 | | |
| Total from investment operations | | | 0.25 | | | | 0.74 | | | | 0.20 | | | | 0.21 | | | | 0.43 | | |
| Less Distributions to Shareholders: | |
| From net investment income | | | (0.33 | ) | | | (0.34 | ) | | | (0.37 | ) | | | (0.40 | ) | | | (0.40 | ) | |
| Net Asset Value, End of Period | | $ | 10.50 | | | $ | 10.58 | | | $ | 10.18 | | | $ | 10.35 | | | $ | 10.54 | | |
| Total return (b)(c) | | | 2.35 | % | | | 7.31 | % | | | 2.04 | % | | | 2.00 | % | | | 4.20 | % | |
| Ratios to Average Net Assets/Supplemental Data: | |
| Net expenses before interest expense (d) | | | 0.80 | % | | | 0.78 | % | | | 0.75 | % | | | 0.75 | % | | | 0.75 | % | |
| Interest expense | | | — | | | | — | | | | — | | | | — | %(e) | | | — | | |
| Net expenses (d) | | | 0.80 | % | | | 0.78 | % | | | 0.75 | % | | | 0.75 | % | | | 0.75 | % | |
| Waiver/Reimbursement | | | 0.19 | % | | | 0.17 | % | | | 0.17 | % | | | 0.20 | % | | | 0.21 | % | |
| Net investment income (d) | | | 3.09 | % | | | 3.20 | % | | | 3.67 | % | | | 3.80 | % | | | 3.84 | % | |
| Portfolio turnover rate | | | 11 | % | | | 22 | % | | | 22 | % | | | 28 | % | | | 26 | % | |
| Net assets, end of period (000s) | | $ | 19,641 | | | $ | 19,433 | | | $ | 14,801 | | | $ | 13,742 | | | $ | 15,574 | | |
(a) Per share data was calculated using the average shares outstanding during the period.
(b) Total return at net asset value assuming all distributions reinvested and no initial sales charge or contingent deferred sales charge.
(c) Had the Investment Manager and/or any of its affiliates not waived fees or reimbursed a portion of expenses, total return would have been reduced.
(d) The benefits derived from expense reductions had an impact of less than 0.01%.
(e) Rounds to less than 0.01%.
See Accompanying Notes to Financial Statements.
18
Financial Highlights – Columbia Georgia Intermediate Municipal Bond Fund
Selected data for a share outstanding throughout each period is as follows:
| | | Year Ended March 31, | |
| Class B Shares | | 2011 | | 2010 | | 2009 | | 2008 | | 2007 | |
| Net Asset Value, Beginning of Period | | $ | 10.58 | | | $ | 10.19 | | | $ | 10.35 | | | $ | 10.55 | | | $ | 10.52 | | |
| Income from Investment Operations: | |
| Net investment income (a) | | | 0.25 | | | | 0.26 | | | | 0.30 | | | | 0.32 | | | | 0.33 | | |
Net realized and unrealized gain (loss) on investments
and futures contracts | | | (0.08 | ) | | | 0.39 | | | | (0.16 | ) | | | (0.20 | ) | | | 0.03 | | |
| Total from investment operations | | | 0.17 | | | | 0.65 | | | | 0.14 | | | | 0.12 | | | | 0.36 | | |
| Less Distributions to Shareholders: | |
| From net investment income | | | (0.25 | ) | | | (0.26 | ) | | | (0.30 | ) | | | (0.32 | ) | | | (0.33 | ) | |
| Net Asset Value, End of Period | | $ | 10.50 | | | $ | 10.58 | | | $ | 10.19 | | | $ | 10.35 | | | $ | 10.55 | | |
| Total return (b)(c) | | | 1.59 | % | | | 6.41 | % | | | 1.38 | % | | | 1.15 | % | | | 3.43 | % | |
| Ratios to Average Net Assets/Supplemental Data: | |
| Net expenses before interest expense (d) | | | 1.55 | % | | | 1.53 | % | | | 1.50 | % | | | 1.50 | % | | | 1.50 | % | |
| Interest expense | | | — | | | | — | | | | — | | | | — | %(e) | | | — | | |
| Net expenses (d) | | | 1.55 | % | | | 1.53 | % | | | 1.50 | % | | | 1.50 | % | | | 1.50 | % | |
| Waiver/Reimbursement | | | 0.19 | % | | | 0.17 | % | | | 0.17 | % | | | 0.20 | % | | | 0.21 | % | |
| Net investment income (d) | | | 2.33 | % | | | 2.47 | % | | | 2.92 | % | | | 3.05 | % | | | 3.09 | % | |
| Portfolio turnover rate | | | 11 | % | | | 22 | % | | | 22 | % | | | 28 | % | | | 26 | % | |
| Net assets, end of period (000s) | | $ | 528 | | | $ | 886 | | | $ | 1,266 | | | $ | 1,364 | | | $ | 1,960 | | |
(a) Per share data was calculated using the average shares outstanding during the period.
(b) Total return at net asset value assuming all distributions reinvested and no contingent deferred sales charge.
(c) Had the Investment Manager and/or any of its affiliates not waived fees or reimbursed a portion of expenses, total return would have been reduced.
(d) The benefits derived from expense reductions had an impact of less than 0.01%.
(e) Rounds to less than 0.01%.
See Accompanying Notes to Financial Statements.
19
Financial Highlights – Columbia Georgia Intermediate Municipal Bond Fund
Selected data for a share outstanding throughout each period is as follows:
| | | Year Ended March 31, | |
| Class C Shares | | 2011 | | 2010 | | 2009 | | 2008 | | 2007 | |
| Net Asset Value, Beginning of Period | | $ | 10.58 | | | $ | 10.18 | | | $ | 10.35 | | | $ | 10.55 | | | $ | 10.51 | | |
| Income from Investment Operations: | |
| Net investment income (a) | | | 0.25 | | | | 0.26 | | | | 0.30 | | | | 0.32 | | | | 0.33 | | |
Net realized and unrealized gain (loss) on investments
and futures contracts | | | (0.08 | ) | | | 0.40 | | | | (0.17 | ) | | | (0.20 | ) | | | 0.04 | | |
| Total from investment operations | | | 0.17 | | | | 0.66 | | | | 0.13 | | | | 0.12 | | | | 0.37 | | |
| Less Distributions to Shareholders: | |
| From net investment income | | | (0.25 | ) | | | (0.26 | ) | | | (0.30 | ) | | | (0.32 | ) | | | (0.33 | ) | |
| Net Asset Value, End of Period | | $ | 10.50 | | | $ | 10.58 | | | $ | 10.18 | | | $ | 10.35 | | | $ | 10.55 | | |
| Total return (b)(c) | | | 1.59 | % | | | 6.51 | % | | | 1.28 | % | | | 1.14 | % | | | 3.52 | % | |
| Ratios to Average Net Assets/Supplemental Data: | |
| Net expenses before interest expense (d) | | | 1.55 | % | | | 1.53 | % | | | 1.50 | % | | | 1.50 | % | | | 1.50 | % | |
| Interest expense | | | — | | | | — | | | | — | | | | — | %(e) | | | — | | |
| Net expenses (d) | | | 1.55 | % | | | 1.53 | % | | | 1.50 | % | | | 1.50 | % | | | 1.50 | % | |
| Waiver/Reimbursement | | | 0.19 | % | | | 0.17 | % | | | 0.17 | % | | | 0.20 | % | | | 0.21 | % | |
| Net investment income (d) | | | 2.34 | % | | | 2.42 | % | | | 2.92 | % | | | 3.05 | % | | | 3.09 | % | |
| Portfolio turnover rate | | | 11 | % | | | 22 | % | | | 22 | % | | | 28 | % | | | 26 | % | |
| Net assets, end of period (000s) | | $ | 3,347 | | | $ | 3,567 | | | $ | 2,100 | | | $ | 1,830 | | | $ | 1,877 | | |
(a) Per share data was calculated using the average shares outstanding during the period.
(b) Total return at net asset value assuming all distributions reinvested and no contingent deferred sales charge.
(c) Had the Investment Manager and/or any of its affiliates not waived fees or reimbursed a portion of expenses, total return would have been reduced.
(d) The benefits derived from expense reductions had an impact of less than 0.01%.
(e) Rounds to less than 0.01%.
See Accompanying Notes to Financial Statements.
20
Financial Highlights – Columbia Georgia Intermediate Municipal Bond Fund
Selected data for a share outstanding throughout each period is as follows:
| | | Year Ended March 31, | |
| Class Z Shares | | 2011 | | 2010 | | 2009 | | 2008 | | 2007 | |
| Net Asset Value, Beginning of Period | | $ | 10.58 | | | $ | 10.18 | | | $ | 10.35 | | | $ | 10.54 | | | $ | 10.51 | | |
| Income from Investment Operations: | |
| Net investment income (a) | | | 0.36 | | | | 0.36 | | | | 0.40 | | | | 0.42 | | | | 0.43 | | |
Net realized and unrealized gain (loss) on investments
and futures contracts | | | (0.08 | ) | | | 0.40 | | | | (0.17 | ) | | | (0.19 | ) | | | 0.03 | | |
| Total from investment operations | | | 0.28 | | | | 0.76 | | | | 0.23 | | | | 0.23 | | | | 0.46 | | |
| Less Distributions to Shareholders: | |
| From net investment income | | | (0.36 | ) | | | (0.36 | ) | | | (0.40 | ) | | | (0.42 | ) | | | (0.43 | ) | |
| Net Asset Value, End of Period | | $ | 10.50 | | | $ | 10.58 | | | $ | 10.18 | | | $ | 10.35 | | | $ | 10.54 | | |
| Total return (b)(c) | | | 2.61 | % | | | 7.58 | % | | | 2.30 | % | | | 2.26 | % | | | 4.46 | % | |
| Ratios to Average Net Assets/Supplemental Data: | |
| Net expenses before interest expense (d) | | | 0.55 | % | | | 0.53 | % | | | 0.50 | % | | | 0.50 | % | | | 0.50 | % | |
| Interest expense | | | — | | | | — | | | | — | | | | — | %(e) | | | — | | |
| Net expenses (d) | | | 0.55 | % | | | 0.53 | % | | | 0.50 | % | | | 0.50 | % | | | 0.50 | % | |
| Waiver/Reimbursement | | | 0.19 | % | | | 0.17 | % | | | 0.17 | % | | | 0.20 | % | | | 0.21 | % | |
| Net investment income (d) | | | 3.34 | % | | | 3.46 | % | | | 3.92 | % | | | 4.05 | % | | | 4.09 | % | |
| Portfolio turnover rate | | | 11 | % | | | 22 | % | | | 22 | % | | | 28 | % | | | 26 | % | |
| Net assets, end of period (000s) | | $ | 85,305 | | | $ | 110,040 | | | $ | 110,408 | | | $ | 106,927 | | | $ | 100,541 | | |
(a) Per share data was calculated using the average shares outstanding during the period.
(b) Total return at net asset value assuming all distributions reinvested.
(c) Had the Investment Manager and/or any of its affiliates not waived fees or reimbursed a portion of expenses, total return would have been reduced.
(d) The benefits derived from expense reductions had an impact of less than 0.01%.
(e) Rounds to less than 0.01%.
See Accompanying Notes to Financial Statements.
21
Notes to Financial Statements – Columbia Georgia Intermediate Municipal Bond Fund
March 31, 2011
Note 1. Organization
Columbia Georgia Intermediate Municipal Bond Fund (the Fund), a series of Columbia Funds Series Trust (the Trust), is a diversified fund. The Trust is registered under the Investment Company Act of 1940, as amended (the 1940 Act), as an open-end management investment company organized as a Delaware statutory trust.
After the close of business on April 30, 2010, Ameriprise Financial, Inc. (Ameriprise Financial) acquired a portion of the asset management business of Columbia Management Group, LLC (the Transaction), including the business of managing the Fund. In connection with the closing of the Transaction (the Closing), RiverSource Investments, LLC, a wholly owned subsidiary of Ameriprise Financial, became the investment manager of the Fund and changed its name to Columbia Management Investment Advisers, LLC (the Investment Manager).
Investment Objective
The Fund seeks current income exempt from U.S. federal income tax and Georgia individual income tax, consistent with moderate fluctuation of principal.
Fund Shares
The Trust has unlimited authorized shares of beneficial interest. The Fund offers Class A, Class B, Class C and Class Z shares. All share classes have identical voting, dividend and liquidation rights. Each share class has its own expense structure and sales charges, as applicable.
Class A shares are subject to a maximum front-end sales charge of 3.25% based on the initial investment amount. Class A shares purchased without an initial sales charge in accounts aggregating $1 million to $50 million at the time of purchase are subject to a 1.00% contingent deferred sales charge (CDSC) if the shares are sold within 18 months of purchase, charged as follows: 1.00% CDSC if redeemed within 12 months of purchase, and 0.50% CDSC if redeemed more than 12, but less than 18 months after purchase.
The Fund no longer accepts investments by new or existing investors in the Fund's Class B shares, except in connection with the reinvestment of any dividend and/or capital gain distributions in Class B shares of the Fund and exchanges by existing Class B shareholders of other funds within the Columbia Family of Funds. Class B shares are subject to a maximum CDSC of 3.00% based upon the holding period after purchase. Class B shares will generally convert to Class A shares eight years after purchase.
Class C shares are subject to a 1.00% CDSC on shares redeemed within one year of purchase.
Class Z shares are not subject to sales charges and are available only to certain investors, as described in the Fund's prospectus.
Note 2. Summary of Significant Accounting Policies
The preparation of financial statements in accordance with U.S. generally accepted accounting principles (GAAP) requires management to make certain estimates and assumptions that affect the reported amounts of assets and liabilities, the disclosure of contingent assets and liabilities at the date of the financial statements and the reported amounts of revenue and expenses during the reporting period. Actual results could differ from those estimates.
The following is a summary of significant accounting policies consistently followed by the Fund in the preparation of its financial statements.
Security Valuation
Debt securities generally are valued by pricing services approved by the Trust's Board of Trustees, based upon market transactions for normal, institutional-size trading units of similar securities. The services may use various pricing techniques which take into account appropriate factors such as yield, quality, coupon rate, maturity, type of issue, trading characteristics and other data, as well as broker quotes. Debt securities for which quotations are readily available may also be valued based upon an over-the-counter or exchange bid quotation.
Investments in other open-end investment companies are valued at net asset value.
Investments for which market quotations are not readily available, or that have quotations which the Investment Manager believes are not reliable, are valued at fair value as determined in good faith under consistently applied procedures established by and under the general supervision of the Board of Trustees. If a security is valued at fair value, such value is likely to be different from the last quoted market price for the security. The determination of fair value often requires significant judgment. To determine fair value, the Investment Manager may use assumptions including but not limited to future cash flows and estimated risk premiums. Multiple inputs from various sources may be used to determine value.
22
Columbia Georgia Intermediate Municipal Bond Fund, March 31, 2011
Security Transactions
Security transactions are accounted for on the trade date. Cost is determined and gains (losses) are based upon the specific identification method for both financial statement and federal income tax purposes.
Income Recognition
Interest income is recorded on the accrual basis. Market premium and discount are amortized and accreted, respectively, on all debt securities, unless otherwise noted. Original issue discount is accreted to interest income over the life of the security with a corresponding increase in the cost basis, if any.
Dividend income is recorded on the ex-date.
Expenses
General expenses of the Trust are allocated to the Fund and other series of the Trust based upon relative net assets or other expense allocation methodologies determined by the nature of the expense. Expenses directly attributable to a specific class of shares are charged to that share class. Expenses directly attributable to the Fund are charged to the Fund.
Determination of Class Net Asset Value
All income, expenses (other than class-specific expenses which are charged directly to a share class, as shown in the Statement of Operations) and realized and unrealized gains (losses) are allocated to each class of the Fund on a daily basis for purposes of determining the net asset value of each class. Income and expenses are allocated to each class based on the settled shares method, while realized and unrealized gains (losses) are allocated based on the relative net assets of each class.
Federal Income Tax Status
The Fund intends to qualify each year as a "regulated investment company" under Subchapter M of the Internal Revenue Code, as amended, and will distribute substantially all of its tax exempt or taxable income, if any, for its tax year, and as such will not be subject to federal income taxes. In addition, the Fund intends to distribute in each calendar year substantially all of its net investment income, capital gains and certain other amounts, if any, such that the Fund should not be subject to federal excise tax. Therefore, no federal income or excise tax provision is recorded.
Distributions to Shareholders
Distributions from net investment income are declared daily and paid monthly. Net realized capital gains, if any, are distributed at least annually. Income distributions and capital gain distributions are determined in accordance with federal income tax regulations which may differ from GAAP.
Indemnifications
Under the Trust's organizational documents and, in some cases, by contract, its officers and directors are indemnified against certain liabilities arising out of the performance of their duties to the Fund. In addition, certain of the Fund's contracts with its service providers contain general indemnification clauses. The Fund's maximum exposure under these arrangements is unknown since the amount of any future claims that may be made against the Fund cannot be determined and the Fund has no historical basis for predicting the likelihood of any such claims.
Note 3. Fees and Compensation Paid to Affiliates
Investment Management Fee
Under an Investment Management Services Agreement (IMSA), the Investment Manager determines which securities will be purchased, held or sold. The management fee is equal to a percentage of the Fund's average daily net assets that declines from 0.40% to 0.27% as the Fund's net assets increase.
Prior to the Closing, Columbia Management Advisors, LLC (Columbia), an indirect, wholly owned subsidiary of Bank of America Corporation (BOA), provided investment management services to the Fund under the same fee structure. The effective management fee rate for the year ended March 31, 2011, was 0.40% of the Fund's average daily net assets.
Administration Fee
Effective upon the Closing, the Investment Manager provides administration and accounting services to the Fund under an Administrative Services Agreement, including services previously performed under the Pricing and Bookkeeping Oversight and Services Agreement (the Services Agreement) as discussed in the Pricing and Bookkeeping Fees note below. The Fund pays an annual administration fee equal to 0.15% of the Fund's average daily net assets less the fees payable by the Fund as described under the Pricing
23
Columbia Georgia Intermediate Municipal Bond Fund, March 31, 2011
and Bookkeeping Fees note below. Prior to the Closing, Columbia provided administrative services to the Fund at the same fee rates.
Pricing and Bookkeeping Fees
Prior to the Closing, the Fund entered into a Financial Reporting Services Agreement (the Financial Reporting Services Agreement) with State Street Bank and Trust Company (State Street) and Columbia pursuant to which State Street provides financial reporting services to the Fund. The Fund also entered into an Accounting Services Agreement (collectively with the Financial Reporting Services Agreement, the State Street Agreements) with State Street and Columbia pursuant to which State Street provides accounting services to the Fund. Upon the Closing, Columbia assigned and delegated its rights and obligations under the State Street Agreements to the Investment Manager. Under the State Street Agreements, the Fund pays State Street an annual fee of $38,000 paid monthly plus an additional monthly fee based on an annualized percentage rate of average daily net assets of the Fund for the month. The aggregate fee will not exceed $140,000 per year (exclusive of out-of-pocket expenses and charges). The Fund also reimburses State Street for certain out-of-pocket expenses and charges.
Also prior to the Closing, the Fund entered into the Services Agreement with Columbia. Under the Services Agreement, Columbia provided services related to Fund expenses and the requirements of the Sarbanes-Oxley Act of 2002, and provided oversight of the accounting and financial reporting services provided by State Street. Under the Services Agreement, the Fund reimbursed Columbia for out-of-pocket expenses and charges, including fees payable to third parties, such as for pricing the Fund's portfolio securities, incurred by Columbia in the performance of services under the Services Agreement. The Services Agreement was terminated upon the Closing. These services are now provided under the Administrative Services Agreement discussed above.
Transfer Agent Fee
In connection with the Closing, RiverSource Service Corporation, a wholly owned subsidiary of Ameriprise Financial, provides transfer agency services to the Fund under a Transfer Agency Agreement and changed its name to Columbia Management Investment Services Corp. (the Transfer Agent). The Transfer Agent has contracted with Boston Financial Data Services (BFDS) to serve as sub-transfer agent.
The Transfer Agent receives monthly account-based service fees based on the number of open accounts and is reimbursed by the Fund for the fees and expenses the Transfer Agent pays to financial intermediaries that maintain omnibus accounts with the Fund that is a percentage of the average aggregate value of the Fund's shares maintained in each such omnibus account (other than omnibus accounts for which American Enterprise Investment Services Inc. is the broker of record or accounts where the beneficial shareholder is a customer of Ameriprise Financial Services, Inc., which are paid a per account fee). The Transfer Agent pays the fees of BFDS for services as sub-transfer agent and is not entitled to reimbursement for such fees from the Fund (with the exception of out-of pocket fees). The Transfer Agent also receives compensation from fees for various shareholder services and reimbursements for certain out-of -pocket expenses.
Prior to the Closing, Columbia Management Services, Inc., an affiliate of Columbia and an indirect, wholly owned subsidiary of BOA, provided transfer agency services to the Fund and contracted with BFDS to serve as sub-transfer agent, under the same fee structure.
For the year ended March 31, 2011, the Fund's effective transfer agent fee rate for each class was 0.05% of the Fund's average daily net assets.
An annual minimum account balance fee of $20 may apply to certain accounts with a value below the Fund's initial minimum investment requirements to reduce the impact of small accounts on transfer agent fees. These minimum account balance fees are recorded as part of expense reductions on the Statement of Operations. For the year ended March 31, 2011, no minimum account balance fees were charged by the Fund.
Underwriting Discounts, Service and Distribution Fees
In connection with the Closing, RiverSource Fund Distributors, Inc., an indirect wholly owned subsidiary of Ameriprise Financial, provides distribution and shareholder services to the Fund and changed its name to Columbia Management Investment Distributors, Inc. (the Distributor). Pursuant to Rule 12b-1 under the 1940 Act, the Board of Trustees has approved, and the Fund has adopted, distribution and shareholder service plans (the Plans) which set the distribution and service fees for the Fund. These fees are calculated daily and are intended to compensate the Distributor and/or eligible selling and/or servicing agents for selling shares of the Fund and providing services to investors.
24
Columbia Georgia Intermediate Municipal Bond Fund, March 31, 2011
The Plans require the payment of a combined distribution and shareholder servicing fee for the Class A shares of the Fund. The Plans also require the payment of a monthly shareholder servicing fee and distribution fee for the Class B and Class C shares of the Fund. A substantial portion of the expenses incurred pursuant to these plans is paid to affiliates of the Distributor. The annual rates in effect and plan limits, as a percentage of average daily net assets, are as follows:
| | | Current
Rate | | Plan
Limit | |
Class A Combined Distribution and
Shareholder Servicing Plan | | | 0.25 | % | | | 0.25 | % | |
Class B and Class C Shareholder
Servicing Plans | | | 0.25 | % | | | 0.25 | % | |
Class B and Class C
Distribution Plans | | | 0.75 | % | | | 0.75 | % | |
Prior to the Closing, Columbia Management Distributors, Inc., an affiliate of Columbia and an indirect, wholly owned subsidiary of BOA, was the principal underwriter of the Fund's shares. There were no changes to the underwriting discount structure of the Fund or the service or distribution fee rates paid by the Fund as a result of the Transaction.
Sales Charges
Sales charges, including front-end and CDSC's, received by the Distributor for distributing Fund shares were $2,096 for Class A, $500 for Class B and $554 for Class C shares for the year ended March 31, 2011.
Fee Waivers and Expense Reimbursements
The Investment Manager has voluntarily agreed to bear a portion of the Fund's expenses so that the Fund's ordinary operating expenses (excluding any distribution and service fees, brokerage commissions, interest, taxes and extraordinary expenses, but including custodian charges relating to overdrafts, if any), after giving effect to any balance credits from the Fund's custodian, do not exceed 0.55% of the Fund's average daily net assets on an annualized basis. The Investment Manager, in its discretion, may revise or discontinue this arrangement at any time. Prior to May 1, 2010, Columbia voluntarily reimbursed a portion of the Fund's expenses in the same manner.
The Investment Manager is entitled to recover from the Fund any fees waived and/or expenses reimbursed for a three year period following the date of such fee waiver and/or reimbursement under these arrangements if such recovery does not cause the Fund's expenses to exceed the expense limitations in effect at the time of recovery. Prior to May 1, 2010, Columbia was entitled to recover fees waived and/or expenses reimbursed from the Fund in the same manner.
At March 31, 2011, the amounts potentially recoverable pursuant to this arrangement were as follows:
| Amount of potential recovery expiring March 31, | | Total
potential | | Amount
expired | | Amount recovered
during the year | |
| 2014 | | 2013 | | 2012 | | recovery | | 3/31/11 | | ended 3/31/11 | |
| $ | 233,663 | | | $ | 221,167 | | | $ | 212,433 | | | $ | 667,263 | | | $ | 246,888 | | | $ | — | | |
Effective May 1, 2011, the Investment Manager has eliminated the fee recoupment provisions detailed above.
Fees Paid to Officers and Trustees
In connection with the Closing, all officers of the Fund are employees of the Investment Manager or its affiliates and, with the exception of the Fund's Chief Compliance Officer, receive no compensation from the Fund. The Board of Trustees has appointed a Chief Compliance Officer to the Fund in accordance with federal securities regulations. The Fund, along with other affiliated funds, pays its pro-rata share of the expenses associated with the Chief Compliance Officer. The Fund's expenses for the Chief Compliance Officer will not exceed $15,000 per year. Prior to the Closing, all officers of the Fund were employees of Columbia or its affiliates and the Fund paid its pro-rata share of the expenses for the Chief Compliance Officer under the same fee structure.
Trustees are compensated for their services to the Fund, as set forth on the Statement of Operations. The Trust's eligible Trustees may participate in a non-qualified deferred compensation plan which may be terminated at any time. Any payments to plan participants are paid solely out of the Fund's assets. Income earned on the plan participant's deferral account is based on the rate of return of the eligible mutual funds selected by the participant or, if no funds are selected, on the rate of return of Columbia Money Market Fund (formerly known as RiverSource Cash Management Fund). Prior to
25
Columbia Georgia Intermediate Municipal Bond Fund, March 31, 2011
the Closing, if no funds were selected, income earned on the plan participant's deferral account was based on the rate of return of BofA Treasury Reserves. Trustees' fees deferred during the current period as well as any gains or losses on the trustees' deferred compensation balances as a result of market fluctuations are included in "Trustees' fees" on the Statement of Operations. Liabilities under the deferred compensation plan are included in "Trustees' fees" on the Statement of Assets and Liabilities.
Other
Prior to the Closing, the Fund made daily investments of cash balances in BofA Tax-Exempt Reserves, formerly an affiliated open-ended investment company of Columbia, pursuant to an exemptive order received from the Securities and Exchange Commission. The income earned prior to the Closing by the Fund from such investments is included as Dividends from affiliates on the Statement of Operations. As an investing Fund, the Fund was indirectly allocated its proportionate share of the expenses of BofA Tax-Exempt Reserves.
Note 4. Custody Credits
The Fund has an agreement with its custodian bank under which custody fees may be reduced by balance credits. These credits are recorded as part of expense reductions on the Statement of Operations. The Fund could have invested a portion of the assets utilized in connection with the expense offset arrangement in an income-producing asset if it had not entered into such an agreement. For the year ended March 31, 2011, these custody credits reduced total expenses by $4 for the Fund.
Note 5. Portfolio Information
The cost of purchases and proceeds from sales of securities, excluding short-term obligations, aggregated $13,572,011 and $37,907,466, respectively, for the year ended March 31, 2011.
Note 6. Shareholder Concentration
As of March 31, 2011, one shareholder account owned 75.0% of the outstanding shares of the Fund. Purchase and redemption activity of this account may have a significant effect on the operations of the Fund.
Note 7. Line of Credit
Prior to March 28, 2011, the Fund and other affiliated funds participated in a $280,000,000 committed, unsecured revolving line of credit provided by State Street. Effective March 28, 2011, the commitment was reduced to $225,000,000. The maximum amount that may be borrowed by any fund is limited to the lesser of $200,000,000 and the Fund's borrowing limit set forth in the Fund's registration statement. Borrowings are available for short-term liquidity or temporary or emergency purposes.
Effective October 14, 2010, interest is charged to each participating fund based on the fund's borrowings at a rate per annum equal to the greater of the Federal Funds Rate plus 1.25% or the overnight LIBOR Rate plus 1.25%. In addition, a commitment fee of 0.125% per annum is accrued and apportioned among the participating funds pro rata based on their relative net assets.
Prior to October 14, 2010, interest was charged to each participating fund at the same rates. In addition, a commitment fee of 0.15% per annum was accrued and apportioned among the participating funds pro rata based on their relative net assets.
For the year ended March 31, 2011, the Fund did not borrow under these arrangements.
Note 8. Federal Tax Information
The timing and character of income and capital gain distributions are determined in accordance with income tax regulations, which may differ from GAAP. Reclassifications are made to the Fund's capital accounts for permanent tax differences to reflect income and gains available for distribution (or available capital loss carryforwards) under income tax regulations.
For the year ended March 31, 2011, permanent book and tax basis differences resulting primarily from differing treatments for taxable dividends received were identified and reclassified among the components of the Fund's net assets as follows:
Undistributed
Net Investment
Income | | Accumulated
Net Realized
Loss | | Paid-In Capital | |
| $ | (52 | ) | | $ | 51 | | | $ | 1 | | |
Net investment income and net realized gains (losses), as disclosed on the Statement of Operations, and net assets were not affected by this reclassification.
26
Columbia Georgia Intermediate Municipal Bond Fund, March 31, 2011
The tax character of distributions paid during the years ended March 31, 2011 and March 31, 2010 was as follows:
| | | March 31, | |
| | | 2011 | | 2010 | |
| Tax-Exempt Income | | $ | 4,030,378 | | | $ | 4,506,122 | | |
| Ordinary Income* | | | 3,993 | | | | 3,574 | | |
* For tax purposes short-term capital gain distributions, if any, are considered ordinary income distributions.
As of March 31, 2011, the components of distributable earnings on a tax basis were as follows:
Undistributed
Ordinary
Income | | Undistributed
Long-Term
Capital Gains | | Net Unrealized
Appreciation | |
| $ | 447,156 | | | $ | — | | | $ | 1,888,146 | | |
Unrealized appreciation and depreciation at March 31, 2011, based on cost of investments for federal income tax purposes were:
| Unrealized appreciation | | $ | 2,865,282 | | |
| Unrealized depreciation | | | (977,136 | ) | |
| Net unrealized appreciation | | $ | 1,888,146 | | |
The following capital loss carryforwards may be available to reduce taxable income arising from future net realized gains on investments, if any, to the extent permitted by the Internal Revenue Code:
| Year of Expiration | | Capital Loss
Carryforwards | |
| 2018 | | $ | 106,357 | | |
Capital loss carryforwards of $853,612 were utilized during the year ended March 31, 2011.
Management of the Fund has concluded that there are no significant uncertain tax positions that would require recognition in the financial statements. However, management's conclusion may be subject to review and adjustment at a later date based on factors including, but not limited to, new tax laws, regulations, and administrative interpretations (including relevant court decisions). The Fund's federal tax returns for the prior three fiscal years remain subject to examination by the Internal Revenue Service.
Note 9. Significant Risks and Contingencies
Sector Focus Risk
The Fund may focus its investments in certain sectors, subjecting it to greater risk than a fund that is less focused.
Geographic Concentration Risk
Securities issued by a particular state and its instrumentalities are subject to the risk of unfavorable developments in such state. The value of Fund shares may be more volatile than the value of shares of funds that invest in municipal securities of issuers in more than one state, as unfavorable developments have the potential to impact more significantly the Fund than funds that invest in municipal securities of many different states. A municipal security can be significantly affected by adverse tax, legislative, demographic or political changes as well as changes in the state's financial or economic condition and prospects.
The Fund's municipal holdings may include obligations of issuers that rely in whole or in part for payment of interest and principal on state specific revenues, real property taxes, revenues from particular institutions, such as healthcare institutions, or obligations secured by mortgages on real property. Consequently, the impact of changes in state law or regulations or the economic conditions in a particular state should be considered. The ability of issuers of debt securities held by the Fund to meet their obligations may be affected by economic developments in a specific industry or region.
Tax Development Risk
The Fund purchases municipal securities whose interest, in the opinion of bond counsel, is free from federal income tax. There is no assurance that the Internal Revenue Service (IRS) will agree with this opinion. In the event the IRS determines that an issuer does not comply with relevant tax requirements, interest payments from a security could become federally taxable, possibly retroactively to the date the security was issued. As a shareholder of the Fund, you may be required to file an amended tax return as a result.
Note 10. Subsequent Events
Management has evaluated the events and transactions that have occurred through the date the financial statements were issued.
27
Columbia Georgia Intermediate Municipal Bond Fund, March 31, 2011
Other than as noted below, there were no items requiring adjustment of the financial statements or additional disclosure.
In August 2010, the Board of Trustees of the Trust approved an Agreement and Plan of Reorganization (the Agreement and Plan) to merge (the Reorganization) the Fund into Columbia Intermediate Municipal Bond Fund (the Acquiring Fund). Fund shareholders approved the Agreement and Plan providing for the Reorganization at a Joint Special Meeting of Shareholders held on February 15, 2011. After further consideration in light of changed circumstances, the Board of Trustees of the Trust and the Board of Trustees of Columbia Funds Series Trust I, of which the Acquiring Fund is a series, determined that the termination of the Agreement and Plan with respect to the Reorganization was in the best interests of shareholders of the Fund and shareholders of the Acquiring Fund, respectively, and pursuant to the terms of the Agreement and Plan mutually agreed to terminate the Agreement and Plan with respect to the Reorganization. As a result, the Reorganization will not occur.
Effective May 16, 2011, the line of credit commitment with State Street was reduced to $150,000,000, and the maximum amount that may be borrowed by any fund was limited to the lesser of $120,000,000 and the Fund's borrowing limit set forth in the Fund's registration statement.
Note 11. Information Regarding Pending and Settled Legal Proceedings
In June 2004, an action captioned John E. Gallus et al. v. American Express Financial Corp. and American Express Financial Advisors Inc. was filed in the United States District Court for the District of Arizona. The plaintiffs allege that they are investors in several American Express Company (now known as RiverSource) mutual funds and they purport to bring the action derivatively on behalf of those funds under the Investment Company Act of 1940. The plaintiffs allege that fees allegedly paid to the defendants by the funds for investment advisory and administrative services are excessive. The plaintiffs seek remedies including restitution and rescission of investment advisory and distribution agreements. The plaintiffs voluntarily agreed to transfer this case to the United States District Court for the District of Minnesota (the District Court). In response to defendants' motion to dismiss the complaint, the District Court dismissed one of plaintiffs' four claims and granted plaintiffs limited discovery. Defendants moved for summary judgment in April 2007. Summary judgment was granted in the defendants' favor on July 9, 2007. The plaintiffs filed a notice of appeal with the Eighth Circuit Court of Appeals (the Eighth Circuit) on August 8, 2007. On April 8, 2009, the Eighth Circuit reversed summary judgment and remanded to the District Court for further proceedings. On August 6, 2009, defendants filed a writ of certiorari with the U.S. Supreme Court (the Supreme Court), asking the Supreme Court to stay the District Court proceedings while the Supreme Court considers and rules in a case captioned Jones v. Harris Associates, which involves issues of law similar to those presented in the Gallus case. On March 30, 2010, the Supreme Court issued its ruling in Jones v. Harris Associates, and on April 5, 2010, the Supreme Court vacated the Eighth Circuit's decision in the Gallus case and remanded the case to the Eighth Circuit for further consideration in light of the Supreme Court's decision in Jones v. Harris Associates. On June 4, 2010, the Eighth Circuit remanded the Gallus case to the District Court for further consideration in light of the Supreme Court's decision in Jones v. Harris Associates. On December 9, 2010, the District Court reinstated its July 9, 2007 summary judgment order in favor of the defendants. On January 10, 2011, plaintiffs filed a notice of appeal with the Eighth Circuit.
In December 2005, without admitting or denying the allegations, American Express Financial Corporation (AEFC, which is now known as Ameriprise Financial, Inc. (Ameriprise Financial)), entered into settlement agreements with the Securities and Exchange Commission (SEC) and Minnesota Department of Commerce (MDOC) related to market timing activities. As a result, AEFC was censured and ordered to cease and desist from committing or causing any violations of certain provisions of the Investment Advisers Act of 1940, the Investment Company Act of 1940, and various Minnesota laws. AEFC agreed to pay disgorgement of $10 million and civil money penalties of $7 million. AEFC also agreed to retain an independent distribution consultant to assist in developing a plan for distribution of all disgorgement and civil penalties ordered by the SEC in accordance with various undertakings detailed at http://www.sec.gov/litigation/admin/ia-2451.pdf. Ameriprise Financial and its affiliates have cooperated with the SEC and the MDOC in these legal proceedings, and have made regular reports to the funds' Boards of Directors/Trustees.
Ameriprise Financial and certain of its affiliates have historically been involved in a number of legal, arbitration and regulatory proceedings, including routine litigation, class actions, and governmental actions, concerning matters arising in connection with the conduct of their business activities. Ameriprise Financial believes that the Funds are not currently the subject of, and that neither Ameriprise Financial nor any of its affiliates are the subject of, any
28
Columbia Georgia Intermediate Municipal Bond Fund, March 31, 2011
pending legal, arbitration or regulatory proceedings that are likely to have a material adverse effect on the Funds or the ability of Ameriprise Financial or its affiliates to perform under their contracts with the Funds. Ameriprise Financial is required to make 10-Q, 10-K and, as necessary, 8-K filings with the Securities and Exchange Commission on legal and regulatory matters that relate to Ameriprise Financial and its affiliates. Copies of these filings may be obtained by accessing the SEC website at www.sec.gov.
There can be no assurance that these matters, or the adverse publicity associated with them, will not result in increased fund redemptions, reduced sale of fund shares or other adverse consequences to the Funds. Further, although we believe proceedings are not likely to have a material adverse effect on the Funds or the ability of Ameriprise Financial or its affiliates to perform under their contracts with the Funds, these proceedings are subject to uncertainties and, as such, we are unable to estimate the possible loss or range of loss that may result. An adverse outcome in one or more of these proceedings could result in adverse judgments, settlements, fines, penalties or other relief that could have a material adverse effect on the consolidated financial condition or results of operations of Ameriprise Financial.
29
Report of Independent Registered Public Accounting Firm
To the Trustees of Columbia Funds Series Trust and the Shareholders of Columbia Georgia Intermediate Municipal Bond Fund
In our opinion, the accompanying statement of assets and liabilities, including the investment portfolio, and the related statements of operations and of changes in net assets and the financial highlights present fairly, in all material respects, the financial position of Columbia Georgia Intermediate Municipal Bond Fund (the "Fund") (a series of Columbia Funds Series Trust) at March 31, 2011, and the results of its operations for the year then ended, the changes in its net assets for each of the two years in the period then ended, and the financial highlights for each of the five years in the period then ended, in conformity with accounting principles generally accepted in the United States of America. These financial statements and financial highlights (hereafter referred to as "financial statements") are the responsibility of the Fund's management. Our responsibility is to express an opinion on these financial statements based on our audits. We conducted our audits of these financial statements in accordance with the standards of the Public Company Accounting Oversight Board (United States). Those standards require that we plan and perform the audit to obtain reasonable assurance about whether the financial statements are free of material misstatement. An audit includes examining, on a test basis, evidence supporting the amounts and disclosures in the financial statements, assessing the accounting principles used and significant estimates made by management, and evaluating the overall financial statement presentation. We believe that our audits, which included confirmation of securities at March 31, 2011 by correspondence with the custodian and brokers, provide a reasonable basis for our opinion.
PricewaterhouseCoopers LLP
Boston, Massachusetts
May 20, 2011
30
Federal Income Tax Information (Unaudited) – Columbia Georgia Intermediate Municipal Bond Fund
For the fiscal year ended March 31, 2011, 99.91% of the distributions from net investment income of the Fund qualifies as exempt interest dividends for federal income tax purposes. A portion of the income may be subject to federal alternative minimum tax.
The Fund will notify shareholders in January 2012 of amounts for use in preparing 2011 income tax returns.
31
Fund Governance
The Trustees serve terms of indefinite duration. The names, addresses and birth years of the Trustees and Officers of the Funds in the Columbia Funds Series Trust, the year each was first elected or appointed to office, their principal business occupations during at least the last five years, the number of Funds overseen by each Trustee and other directorships they hold are shown below. Each officer listed below serves as an officer of each Fund in the Columbia Funds Series Trust.
Independent Trustees
Name, Address and Year of Birth,
Position with Funds, Year First
Elected or Appointed to Office | | Principal Occupation(s) During Past Five Years, Number of Funds in the Columbia
Funds Complex Overseen by Trustee, Other Directorships Held
| |
| Edward J. Boudreau, Jr. (Born 1944) | |
|
c/o Columbia Management
Investment Advisers, LLC
225 Franklin Street
Boston, MA 02110
Trustee (since 2005) | | Managing Director—E.J. Boudreau & Associates (consulting), from 2000 through current; oversees 41; Trustee—BofA Funds Series Trust. | |
|
| William P. Carmichael (Born 1943) | |
|
c/o Columbia Management
Investment Advisers, LLC
225 Franklin Street
Boston, MA 02110
Trustee (since 1999) | | Retired; oversees 41; Director—Cobra Electronics Corporation (electronic equipment manufacturer); Director—McMoRan Exploration Company (oil and gas exploration and development); Director—The Finish Line (athletic shoes and apparel); Trustee—BofA Funds Series Trust. | |
|
| William A. Hawkins (Born 1942) | |
|
c/o Columbia Management
Investment Advisers, LLC
225 Franklin Street
Boston, MA 02110
Trustee (since 2005) | | Managing Director—Overton Partners (financial consulting), August 2010 to present; President and Chief Executive Officer—California General Bank, N.A., from January 2008 through August 2010; oversees 41; Trustee—BofA Funds Series Trust. | |
|
| R. Glenn Hilliard (Born 1943) | |
|
c/o Columbia Management
Investment Advisers, LLC
225 Franklin Street
Boston, MA 02110
Trustee (since 2005) | | Chairman and Chief Executive Officer—Hilliard Group LLC (investing and consulting), from April 2003 through current; oversees 41; Trustee—BofA Funds Series Trust. | |
|
| John J. Nagorniak (Born 1944) | |
|
c/o Columbia Management
Investment Advisers, LLC
225 Franklin Street
Boston, MA 02110
Trustee (since 2008) | | Retired; President and Director—Foxstone Financial, Inc. (consulting), 2000 through December 2007; Director—Mellon Financial Corporation affiliates (investing), 2000 through 2007; Chairman—Franklin Portfolio Associates (investing—Mellon affiliate), 1982 through 2007; oversees 41; Director—MIT Investment Company; Trustee—MIT 401k Plan; Trustee—Research Foundation of CFA Institute; Trustee—BofA Funds Series Trust. | |
|
32
Fund Governance (continued)
Independent Trustees (continued)
Name, Address and Year of Birth,
Position with Funds, Year First
Elected or Appointed to Office | | Principal Occupation(s) During Past Five Years, Number of Funds in the Columbia
Funds Complex Overseen by Trustee, Other Directorships Held
| |
| Minor M. Shaw (Born 1947) | |
|
c/o Columbia Management
Investment Advisers, LLC
225 Franklin Street
Boston, MA 02110
Trustee (since 2003) | | President—Micco Corporation and Mickel Investment Group; oversees 41; Board Member—Piedmont Natural Gas; Trustee—BofA Funds Series Trust. | |
|
Interested Trustee
| Anthony M. Santomero1 (Born 1946) | |
|
c/o Columbia Management
Investment Advisers, LLC
225 Franklin Street
Boston, MA 02110
Trustee (since 2008) | | Richard K. Mellon Professor Emeritus of Finance, The Wharton School, University of Pennsylvania, from 2002 through current; Senior Advisor—McKinsey & Company (consulting), July 2006 through January 2008; President and Chief Executive Officer—Federal Reserve Bank of Philadelphia, July 2000 through April 2006; oversees 41; Director—Renaissance Reinsurance Ltd; Trustee—Penn Mutual Life Insurance Company; Director—Citigroup, Inc.; Director—Citibank, N.A.; Trustee—BofA Funds Series Trust. | |
|
1 Dr. Santomero is currently deemed by the Columbia Funds to be an "interested person" (as defined in the 1940 Act) of the Funds because he serves as a Director of Citigroup, Inc. and Citibank, N.A., companies that may directly or through subsidiaries and affiliates engage from time-to-time in brokerage execution, principal transactions and lending relationships with the Columbia Funds or other funds or accounts advised/managed by Columbia Management Investment Advisers, LLC.
The Statement of Additional Information includes additional information about the Trustees of the Funds and is available, without charge, upon request by calling 800-345-6611.
Officers
| Name, Year of Birth and Address | | Principal Occupation(s) During the Past Five Years | |
| J. Kevin Connaughton (Born 1964) | |
|
225 Franklin Street
Boston, MA 02110
President (since 2009) | | Senior Vice President and General Manager—Mutual Fund Products, Columbia Management Investment Advisers, LLC since May 2010; President, Columbia Funds, since 2009, and RiverSource Funds, since May 2010 (previously Senior Vice President and Chief Financial Officer, Columbia Funds, from June 2008 to January 2009, Treasurer, Columbia Funds, from October 2003 to May 2008, and senior officer of various other affiliated funds since 2000); Managing Director, Columbia Management Advisors, LLC from December 2004 to April 2010. | |
|
| Michael G. Clarke (Born 1969) | |
|
225 Franklin Street
Boston, MA 02110
Treasurer (since 2011) and
Chief Financial Officer (since 2009) | | Vice President, Columbia Management Investment Advisers, LLC since May 2010; Managing Director of Fund Administration, Columbia Management Advisors, LLC, from September 2004 to April 2010; senior officer of Columbia Funds and affiliated funds since 2002. | |
|
33
Fund Governance (continued)
Officers (continued)
| Name, Year of Birth and Address | | Principal Occupation(s) During the Past Five Years | |
| Scott R. Plummer (Born 1959) | |
|
5228 Ameriprise Financial Center
Minneapolis, MN 55474
Senior Vice President and
Chief Legal Officer (since 2010) | | Chief Legal Officer and Assistant Secretary, Columbia Management Investment Advisers, LLC since June 2005; Vice President and Lead Chief Counsel—Asset Management, Ameriprise Financial, Inc. since May 2010 (previously Vice President and Chief Counsel—Asset Management, from 2005 to April 2010, and Vice President—Asset Management Compliance from 2004 to 2005); Vice President, Chief Counsel and Assistant Secretary, Columbia Management Investment Distributors, Inc. since 2008; Vice President, General Counsel and Secretary, Ameriprise Certificate Company since 2005; Chief Counsel, RiverSource Distributors, Inc. since 2006; Vice President, General Counsel and Secretary, RiverSource Funds, since December 2006; Senior Vice President, Secretary and Chief Legal Officer, Columbia Funds, since May 2010. | |
|
| Linda J. Wondrack (Born 1964) | |
|
225 Franklin Street
Boston, MA 02110
Senior Vice President and
Chief Compliance Officer (since 2007) | | Vice President and Chief Compliance Officer, Columbia Management Investment Advisers, LLC since May 2010; Chief Compliance Officer, Columbia Funds, since 2007, and RiverSource Funds, since May 2010; Director (Columbia Management Group, LLC and Investment Product Group Compliance), Bank of America, from June 2005 to April 2010. | |
|
| William F. Truscott (Born 1960) | |
|
53600 Ameriprise Financial Center
Minneapolis, MN 55474
Senior Vice President (since 2010) | | Chairman of the Board, Columbia Management Investment Advisers, LLC since May 2010 (previously President, Chairman of the Board and Chief Investment Officer, from 2001 to April 2010); Chief Executive Officer, U.S. Asset Management & President, Annuities, Ameriprise Financial, Inc. since May 2010 (previously President—U.S. Asset Management and Chief Investment Officer from 2005 to April 2010, and Senior Vice President—Chief Investment Officer, from 2001 to 2005); Director, President and Chief Executive Officer, Ameriprise Certificate Company since 2006; Director, Columbia Management Investment Distributors, Inc. since May 2010 (previously Chairman of the Board and Chief Executive Officer from 2008 to April 2010); Chairman of the Board and Chief Executive Officer, RiverSource Distributors, Inc. since 2006. | |
|
| Colin Moore (Born 1958) | |
|
225 Franklin Street
Boston, MA 02110
Senior Vice President (since 2010) | | Director and Chief Investment Officer, Columbia Management Investment Advisers, LLC since May 2010; Manager, Managing Director and Chief Investment Officer of Columbia Management Advisors, LLC from 2007 to April 2010; Head of Equities, Columbia Management Advisors, LLC from 2002 to 2007. | |
|
| Michael A. Jones (Born 1959) | |
|
225 Franklin Street
Boston, MA 02110
Senior Vice President (since 2010) | | President and Director, Columbia Management Investment Advisers, LLC since May 2010; President and Director, Columbia Management Investment Distributors, Inc. since May 2010; Manager, Chairman, Chief Executive Officer and President, Columbia Management Advisors, LLC from 2007 to April 2010; Chief Executive Officer, President and Director, Columbia Management Distributors, Inc. from November 2006 to April 2010; previously, co-president and senior managing director at Robeco Investment Management. | |
|
| Christopher O. Petersen (Born 1970) | |
|
5228 Ameriprise Financial Center
Minneapolis, MN 55474
Vice President and
Secretary (since 2011) | | Vice President and Chief Counsel, Ameriprise Financial since January 2010 (formerly Vice President and Group Counsel or Counsel from April 2004 to January 2010); Assistant Secretary of RiverSource Funds since January 2007. | |
|
34
Fund Governance (continued)
Officers (continued)
| Name, Year of Birth and Address | | Principal Occupation(s) During the Past Five Years | |
| Amy Johnson (Born 1965) | |
|
5228 Ameriprise Financial Center
Minneapolis, MN 55474
Vice President (since 2010) | | Senior Vice President and Chief Operating Officer, Columbia Management Investment Advisers, LLC since May 2010 (previously Chief Administrative Officer, from 2009 until April 2010, Vice President—Asset Management and Trust Company Services, from 2006 to 2009, and Vice President—Operations and Compliance from 2004 to 2006). | |
|
| Joseph F. DiMaria (Born 1968) | |
|
225 Franklin Street
Boston, MA 02110
Vice President (since 2011) and
Chief Accounting Officer (since 2008) | | Vice President, Mutual Fund Administration, Columbia Management Investment Advisers, LLC, since May 2010; Director of Fund Administration, Columbia Management Advisors, LLC from January 2006 to April 2010; Head of Tax/Compliance and Assistant Treasurer, Columbia Management Advisors, LLC, from November 2004 to December 2005. | |
|
| Paul B. Goucher (Born 1968) | |
|
5228 Ameriprise Financial Center
Minneapolis, MN 55474
Vice President and
Assistant Treasurer (since 2010) | | Vice President and Chief Counsel of Ameriprise Financial since January 2010 (formerly Vice President and Group Counsel from November 2008 to January 2010); Director, Managing Director and General Counsel of J. & W. Seligman & Co. Incorporated (Seligman) from July 2008 to November 2008 and Managing Director and Associate General Counsel of Seligman from January 2005 to July 2008. | |
|
| Michael E. DeFao (Born 1968) | |
|
5228 Ameriprise Financial Center
Minneapolis, MN 55474
Vice President and
Assistant Treasurer (since 2011) | | Vice President and Chief Counsel, Ameriprise Financial since May 2010; Associate General Counsel Bank of America from June 2005 to April 2010. | |
|
| Stephen T. Welsh (Born 1957) | |
|
225 Franklin Street
Boston, MA 02110
Vice President (since 2006) | | President and Director, Columbia Management Investment Services Corp. since May 2010; President and Director, Columbia Management Services, Inc. from July 2004 to April 2010; Managing Director, Columbia Management Distributors, Inc. from August 2007 to April 2010. | |
|
35
Shareholder Meeting Results
At a Joint Special Meeting of Shareholders held on February 15, 2011, shareholders of the Fund considered the proposals described below.
Proposal 1. Shareholders of the Fund approved an Agreement and Plan of Reorganization pursuant to which the Fund will transfer its assets to Columbia Intermediate Municipal Bond Fund (the "Buying Fund") in exchange for shares of the Buying Fund and the assumption by the Buying Fund of all of the liabilities of the Fund, as follows:
| Votes For | | Votes Against | | Abstentions | | Broker Non-Votes | |
| 9,251,956 | | | 50,128 | | | | 28,395 | | | | 1,233,315 | | |
Proposal 2. Shareholders of Columbia Funds Series Trust elected each of the nominees for trustees to the Board of Trustees of Columbia Funds Series Trust, each to hold office for an indefinite term, as follows:
| Trustee | | Votes For | | Votes Withheld | | Abstentions | |
| Kathleen Blatz | | | 2,145,636,122 | | | | 248,012,438 | | | | 0 | | |
| Edward J. Boudreau, Jr. | | | 2,145,430,114 | | | | 248,218,446 | | | | 0 | | |
| Pamela G. Carlton | | | 2,145,515,949 | | | | 248,132,612 | | | | 0 | | |
| William P. Carmichael | | | 2,145,038,695 | | | | 248,609,866 | | | | 0 | | |
| Patricia M. Flynn | | | 2,145,843,563 | | | | 247,804,997 | | | | 0 | | |
| William A. Hawkins | | | 2,145,359,401 | | | | 248,289,160 | | | | 0 | | |
| R. Glenn Hilliard | | | 2,145,079,400 | | | | 248,569,161 | | | | 0 | | |
| Stephen R. Lewis, Jr. | | | 2,145,092,209 | | | | 248,556,351 | | | | 0 | | |
| John F. Maher | | | 2,145,621,338 | | | | 248,027,223 | | | | 0 | | |
| John J. Nagorniak | | | 2,145,337,494 | | | | 248,311,067 | | | | 0 | | |
| Catherine James Paglia | | | 2,145,615,254 | | | | 248,033,306 | | | | 0 | | |
| Leroy C. Richie | | | 2,145,042,120 | | | | 248,606,441 | | | | 0 | | |
| Anthony M. Santomero | | | 2,145,088,174 | | | | 248,560,386 | | | | 0 | | |
| Minor M. Shaw | | | 2,145,430,762 | | | | 248,217,798 | | | | 0 | | |
| Alison Taunton-Rigby | | | 2,145,393,384 | | | | 248,255,177 | | | | 0 | | |
| William F. Truscott | | | 2,144,907,223 | | | | 248,741,338 | | | | 0 | | |
36
Important Information About This Report
The fund mails one shareholder report to each shareholder address. If you would like more than one report, please call shareholder services at 1-800-345-6611 and additional reports will be sent to you. This report has been prepared for shareholders of Columbia Georgia Intermediate Municipal Bond Fund.
A description of the policies and procedures that the fund uses to determine how to vote proxies and a copy of the fund's voting records are available (i) at www.columbiamanagement.com, (ii) on the Securities and Exchange Commission's website at www.sec.gov, and (iii) without charge, upon request, by calling 1-800-368-0346. Information regarding how the fund voted proxies relating to portfolio securities during the 12-month period ended June 30 is available from the SEC's website. Information regarding how the fund voted proxies relating to portfolio securities is also available from the fund's website, www.columbiamanagement.com.
The fund files a complete schedule of portfolio holdings with the SEC for the first and third quarters of each fiscal year on Form N-Q. The fund's Form N-Q is available on the SEC's website at www.sec.gov and may be reviewed and copied at the SEC's Public Reference Room in Washington, D.C. Information on the operation of the Public Reference Room may be obtained by calling 1-800-SEC-0330.
Transfer Agent
Columbia Management Investment
Services Corp.
P.O. Box 8081
Boston, MA 02266-8081
1-800-345-6611
Distributor
Columbia Management Investment
Distributors, Inc.
225 Franklin Street
Boston, MA 02110
Investment Manager
Columbia Management Investment Advisers, LLC
225 Franklin Street
Boston, MA 02110
37

PRSRT STD
U.S. Postage
PAID
Holliston, MA
Permit NO. 20
Columbia Georgia Intermediate Municipal Bond Fund
P. O. Box 8081
Boston, MA 02266-8081
columbiamanagement.com
This information is for use with concurrent or prior delivery of a fund prospectus. Investors should consider the investment objectives, risks, charges and expenses of a mutual fund carefully before investing. For a free prospectus, which contains this and other important information about the funds, visit columbiamanagement.com. Read the prospectus carefully before investing. The Fund is distributed by Columbia Management Investment Distributors, Inc., member FINRA, and managed by Columbia Management Investment Advisers, LLC.
© 2011 Columbia Management Investment Advisers, LLC. All rights reserved.
C-1086 A (05/11)

Columbia Maryland Intermediate Municipal Bond Fund
Annual Report for the Period Ended March 31, 2011
Not FDIC insured • No bank guarantee • May lose value
Table of Contents
| Fund Profile | | | 1 | | |
|
| Economic Update | | | 2 | | |
|
| Performance Information | | | 4 | | |
|
| Understanding Your Expenses | | | 5 | | |
|
| Portfolio Manager's Report | | | 6 | | |
|
| Investment Portfolio | | | 8 | | |
|
Statement of Assets and
Liabilities | | | 13 | | |
|
| Statement of Operations | | | 15 | | |
|
Statement of Changes in
Net Assets | | | 16 | | |
|
| Financial Highlights | | | 18 | | |
|
| Notes to Financial Statements | | | 22 | | |
|
Report of Independent Registered
Public Accounting Firm | | | 30 | | |
|
| Federal Income Tax Information | | | 31 | | |
|
| Fund Governance | | | 32 | | |
|
| Shareholder Meeting Results | | | 36 | | |
|
Important Information About
This Report | | | 37 | | |
|
The views expressed in this report reflect the current views of the respective parties. These views are not guarantees of future performance and involve certain risks, uncertainties and assumptions that are difficult to predict, so actual outcomes and results may differ significantly from the views expressed. These views are subject to change at any time based upon economic, market or other conditions and the respective parties disclaim any responsibility to update such views. These views may not be relied on as investment advice and, because investment decisions for a Columbia Fund are based on numerous factors, may not be relied on as an indication of trading intent on behalf of any particular Columbia Fund. References to specific securities should not be construed as a recommendation or investment advice.
President's Message

Dear Shareholder:
The Columbia Management story began over 100 years ago, and today, we are one of the nation's largest dedicated asset managers. The recent acquisition by Ameriprise Financial, Inc. brings together the talents, resources and capabilities of Columbia Management with those of RiverSource Investments, Threadneedle (acquired by Ameriprise in 2003) and Seligman Investments (acquired by Ameriprise in 2008) to build a best-in-class asset management business that we believe is truly greater than its parts.
RiverSource Investments traces its roots to 1894 when its then newly-founded predecessor, Investors Syndicate, offered a face-amount savings certificate that gave small investors the opportunity to build a safe and secure fund for retirement, education or other special needs. A mutual fund pioneer, Investors Syndicate launched Investors Mutual Fund in 1940. In the decades that followed, its mutual fund products and services lineup grew to include a full spectrum of styles and specialties. More than 110 years later, RiverSource continues to be a trusted financial products leader.
Threadneedle, a leader in global asset management and one of Europe's largest asset managers, offers sophisticated international experience from a dedicated U.K. management team. Headquartered in London, it is named for Threadneedle Street in the heart of the city's financial district, where British investors pioneered international and global investing. Threadneedle was acquired in 2003 and today operates as an affiliate of Columbia Management.
Seligman Investments' beginnings date back to the establishment of the investment firm J. & W. Seligman & Co. in 1864. In the years that followed, Seligman played a major role in the geographical expansion and industrial development of the United States. In 1874, President Ulysses S. Grant named Seligman as fiscal agent for the U.S. Navy—an appointment that would last through World War I. Seligman helped finance the westward path of the railroads and the building of the Panama Canal. The firm organized its first investment company in 1929 and began managing its first mutual fund in 1930. In 2008, J. & W. Seligman & Co. Incorporated was acquired and Seligman Investments became an offering brand of RiverSource Investments, LLC.
We are proud of the rich and distinctive history of these firms, the strength and breadth of products and services they offer, and the combined cultures of pioneering spirit and forward thinking. Together we are committed to providing more for our shareholders than ever before.
> A singular focus on our shareholders
Our business is asset management, so investors are our first priority. We dedicate our resources to identifying timely investment opportunities and provide a comprehensive choice of equity, fixed-income and alternative investments to help meet your individual needs.
> First-class research and thought leadership
We are dedicated to helping you take advantage of today's opportunities and anticipate tomorrow's. We stay abreast of the latest investment trends and ideas, using our collective insight to evaluate events and transform them into solutions you can use.
> A disciplined investment approach
We aren't distracted by passing fads. Our teams adhere to a rigorous investment process that helps ensure the integrity of our products and enables you and your financial advisor to match our solutions to your objectives with confidence.
When you choose Columbia Management, you can be confident that we will take the time to understand your needs and help you and your financial advisor identify the solutions that are right for you. Because at Columbia Management, we don't consider ourselves successful unless you are.
Sincerely,

J. Kevin Connaughton
President, Columbia Funds
Investors should consider the investment objectives, risks, charges and expenses of a mutual fund carefully before investing. For a free prospectus, which contains this and other important information about the funds, visit www.columbiamanagement.com. The prospectus should be read carefully before investing.
Columbia Funds are distributed by Columbia Management Investment Distributors, Inc., member FINRA, and managed by Columbia Management Investment Advisers, LLC.
© 2011 Columbia Management Investment Advisers, LLC. All rights reserved.
Fund Profile – Columbia Maryland Intermediate Municipal Bond Fund
Summary
g For the 12-month period that ended March 31, 2011, the fund's Class A shares returned 2.05% without sales charge.
g The fund lagged its benchmark, the Barclays Capital 3-15 Year Blend Municipal Bond Index,1 but came out ahead of the average return of funds in its peer group, the Lipper Other States Intermediate Municipal Debt Funds Classification.2
g The fund's Maryland focus hampered returns relative to the Barclays index, which is national in scope. Security selection among BBB rated3 credits aided results.
Portfolio Management
James M. D'Arcy has managed the fund since 2010. From 1999 until joining the Investment Manager in May 2010, Mr. D'Arcy was associated with the fund's previous investment adviser as an investment professional.
1The Barclays Capital 3-15 Year Blend Municipal Bond Index tracks the performance of municipal bonds issued after December 31, 1990 with remaining maturities between 2 and 17 years and at least $7 million in principal amount outstanding.
2Lipper Inc., a widely respected data provider in the industry, calculates an average total return (assuming reinvestment of distributions) for mutual funds with investment objectives similar to those of the fund. Lipper makes no adjustment for the effect of sales loads.
3The credit quality ratings represent the lower of one of the following nationally recognized rating agencies: Standard & Poor's or Moody's Investor Services. If a security is rated by only one of the two agencies, that rating is used. If a security is not rated by either of the two agencies, it is designated as Non-Rated. Ratings are relative and subjective and are not absolute standards of quality. The credit quality of the fund's investments does not remove market risk.
Indices are not available for investment, are not professionally managed and do not reflect sales charges, fees, brokerage commissions, taxes or other expenses of investing. Securities in the fund may not match those in an index.
Performance data quoted represents past performance and current performance may be lower or higher. Past performance is no guarantee of future results. The investment return and principal value will fluctuate so that shares, when redeemed, may be worth more or less than the original cost. Please visit www.columbiamanagement.com for daily and most recent month-end performance updates.
Summary
1-year return as of 03/31/11
| | +2.05% | |
|
 | | Class A shares
(without sales charge) | |
|
| | +2.91% | |
|
 | | Barclays Capital
3-15 Year Blend
Municipal Bond Index | |
|
1
Economic Update – Columbia Maryland Intermediate Municipal Bond Fund
Summary
For the 12-month period that ended March 31, 2011
g Strengthening economic growth and rising interest rates kept a lid on most bond market sectors. The Barclays Capital Aggregate Bond Index delivered modest results. However, high-yield bonds were strong performers, as measured by the JPMorgan Developed BB High Yield Index.
Barclays
Aggregate Index | | JPMorgan
Index | |
|
 | |  | |
|
g The U.S. stock market, as measured by the S&P 500 Index, delivered solid returns, despite a summer 2010 correction. Foreign stock market returns were also positive, as measured by the MSCI EAFE Index (Net).
| S&P Index | | MSCI Index | |
|
 | |  | |
|
The U.S. economy continued to expand at a solid but uneven pace over the past 12 months, as measured by gross domestic product (GDP). Although lackluster second quarter 2010 GDP growth raised fears that the economy was losing steam and might lapse back into recession, the pace picked up in the third quarter of 2010, inspiring confidence among consumers, businesses and investors. GDP expanded by 2.6% in the third quarter and 3.1% in the fourth quarter. With the Federal Reserve Board (the Fed) providing additional monetary stimulus to shore up economic growth and the extension of key tax cuts for the next two years, expectations are for continued growth in 2011. However, early estimates of first quarter 2011 growth place it just under 2.0%, a disappointment after two strong quarters and a pick-up in employment.
Consumer spending on cars, clothing and other goods generally trended higher during the 12-month period, accelerating in the fourth quarter of 2010. Holiday spending rose 5.5% between November 5, 2010 and December 24, 2010, in all retail categories, excluding automobiles, compared with the same period in 2009, according to MasterCard Advisors' SpendingPulse, which tracks spending on all transactions including cash. Personal income surged in January 2011, as payroll tax cuts kicked in. The personal savings rate edged higher, ending February 2011, the last month for which data was available, at 5.8%.
News on the job front was increasingly positive. A good portion of the jobs added in March, April and May of 2010 were temporary, government-sponsored census positions, which began to unwind in June, July and August 2010. However, private sector payroll employment began to trend higher in the third quarter, massive layoffs declined and job growth turned solidly positive, with the addition of 444,000 new jobs in the first quarter of 2011.
Despite some glimmers of improvement early in 2010, the housing market remained troublesome throughout the period. Both new and existing home sales fell after a federal tax credit for new and repeat homebuyers expired. Distressed properties pressured prices and foreclosures continued—another drag on prices. The inventory of unsold homes ended the period higher than it started, at 8.9 and 8.6 months for new and existing homes, respectively, according to the National Association of Realtors and a joint release from the U.S. Census Bureau and the U.S. Department of Housing and Urban Development. The new year brought more disappointing news: Existing home sales fell in January 2011, after three months of sustained improvement. Tight credit and weak appraisals were cited as possible reasons for the decline.
Reports from the business side of the economy were generally positive. A key measure of the nation's manufacturing situation—the Institute for Supply Management's Index—took a somewhat surprising turn higher in the final months of the period. Technology spending rose 12% in 2010, according to the NPD Group, a national marketing research firm. Purchases of computers, networking and software returned to prerecession levels. Industrial production rose over the period, and manufacturing capacity utilized, per the report issued by the Fed—a key measure of the health of the manufacturing sector—also edged higher.
Bonds delivered modest returns
As the economy strengthened and interest rates edged higher, most bond sectors delivered modest returns. The Barclays Capital Aggregate Bond Index1 returned 5.12%. High-yield bonds
1The Barclays Capital Aggregate Bond Index is a market value-weighted index that tracks the daily price, coupon, pay-downs and total return performance of fixed-rate, publicly placed, dollar-denominated and non-convertible investment grade debt issues with at least $250 million par amount outstanding and with at least one year to final maturity.
2
Economic Update (continued) – Columbia Maryland Intermediate Municipal Bond Fund
led the fixed-income markets. For the 12 months covered by this report, the JPMorgan Developed BB High Yield Index2 returned 13.04% as default fears abated and investors grew more comfortable with risk. Despite rising yields in the second half of the period, the Treasury market was also positive. The Barclays Capital U.S. Treasury Index3 returned 4.53%. However, municipal bonds struggled in the second half of the period, as interest rates inched higher and issue supply surged ahead of the year-end expiration of the Build America Bonds program. The Barclays Capital Municipal Bond Index4 gained 1.63% for the period. Despite positive economic activity, the Fed kept a key short-term interest rate—the federal funds rate—close to zero, reflecting ongoing concerns about employment and the housing market.
Stocks moved higher despite summer 2010 decline
Against a strengthening economic backdrop, stock prices continued to rally despite a summer 2010 setback linked to a debt crisis brewing in Europe, which raised concerns among U.S. investors. These fears were short-lived and stocks regained their footing. In this environment, the S&P 500 Index5 returned 15.65% for the 12 months through March 31, 2011. Outside the United States, stock markets also delivered solid gains. The MSCI EAFE Index (Net),6 a broad gauge of stock market performance in foreign developed markets, returned 10.42% (in U.S. dollars) for the 12-month period, as concerns about the impact of a bailout for weak euro zone economies eased yet continued to restrain market performance. Emerging stock markets were strong. The MSCI Emerging Markets Index (Net)7 returned 18.46% (in U.S. dollars) for the 12-month period.
Past performance is no guarantee of future results.
2The JPMorgan Developed BB High Yield Index is an unmanaged index designed to mirror the investable universe of the U.S. dollar developed, BB-rated, high yield corporate debt market.
3The Barclays Capital U.S. Treasury Index includes public obligations of the U.S. Treasury. Treasury bills are excluded by the maturity constraint. In addition, certain special issues, such as state and local government series bonds (SLGs), as well as U.S. Treasury TIPS, are excluded. STRIPS are excluded from the index because their inclusion would result in double-counting.
4The Barclays Capital Municipal Bond Index is considered representative of the broad market for investment-grade, tax-exempt bonds with a maturity of at least one year.
5The Standard & Poor's (S&P) 500 Index tracks the performance of 500 widely held, large-capitalization U.S. stocks.
6The Morgan Stanley Capital International Europe, Australasia, Far East (MSCI EAFE) Index (Net) is a free float- adjusted market capitalization index that is designed to measure the equity market performance of developed markets, excluding the U.S. & Canada. As of December 31, 2010, the MSCI EAFE Index (Net) consisted of the following 22 developed market country indices: Australia, Austria, Belgium, Denmark, Finland, France, Germany, Greece, Hong Kong, Ireland, Israel, Italy, Japan, the Netherlands, New Zealand, Norway, Portugal, Singapore, Spain, Sweden, Switzerland and the United Kingdom.
7The Morgan Stanley Capital International Emerging Markets (MSCI EM) Index (Net) is a free float-adjusted market capitalization index that is designed to measure equity market performance of emerging markets. As of December 31, 2010, the MSCI EM Index (Net) consisted of the following 21 emerging market country indices: Brazil, Chile, China, Colombia, Czech Republic, Egypt, Hungary, India, Indonesia, Korea, Malaysia, Mexico, Morocco, Peru, Philippines, Poland, Russia, South Africa, Taiwan, Thailand and Turkey.
Indices are not available for investment, are not professionally managed and do not reflect sales charges, fees, brokerage commissions, taxes or other expenses of investing. Securities in the fund may not match those in an index.
3
Performance Information – Columbia Maryland Intermediate Municipal Bond Fund
Performance data quoted represents past performance and current performance may be lower or higher. Past performance is no guarantee of future results. The investment return and principal value will fluctuate so that shares, when redeemed, may be worth more or less than the original cost. Please visit www.columbiamanagement.com for daily and most recent month-end performance updates.
Performance of a $10,000 investment 04/01/01 – 03/31/11
The chart above shows the change in value of a hypothetical $10,000 investment in Class A shares of Columbia Maryland Intermediate Municipal Bond Fund during the stated time period, and does not reflect the deduction of taxes that a shareholder may pay on fund distributions or on the redemption of fund shares.
Performance of a $10,000 investment 04/01/01 – 03/31/11 ($)
| Sales charge: | | without | | with | |
| Class A | | | 13,652 | | | | 13,208 | | |
| Class B | | | 12,683 | | | | 12,683 | | |
| Class C | | | 12,665 | | | | 12,665 | | |
| Class Z | | | 13,997 | | | | n/a | | |
Average annual total return as of 03/31/11 (%)
| Share class | | A | | B | | C | | Z | |
| Inception | | 09/01/90 | | 06/08/93 | | 06/17/92 | | 09/01/90 | |
| Sales charge | | without | | with | | without | | with | | without | | with | | without | |
| 1-year | | | 2.05 | | | | -1.23 | | | | 1.30 | | | | -1.67 | | | | 1.29 | | | | 0.30 | | | | 2.31 | | |
| 5-year | | | 3.30 | | | | 2.61 | | | | 2.55 | | | | 2.55 | | | | 2.53 | | | | 2.53 | | | | 3.56 | | |
| 10-year | | | 3.16 | | | | 2.82 | | | | 2.41 | | | | 2.41 | | | | 2.39 | | | | 2.39 | | | | 3.42 | | |
The "with sales charge" returns include the maximum initial sales charge of 3.25% for Class A shares and the applicable contingent deferred sales charge of 3.00% in the first year, declining to 1.00% in the fourth year and eliminated thereafter for Class B shares and 1.00% for Class C shares for the first year only. The "without sales charge" returns do not include the effect of sales charges. If they had, returns would be lower.
Performance results reflect any fee waivers or reimbursements of fund expenses by the Investment Manager and/or any of its affiliates. Absent these fee waivers or expense reimbursement arrangements, performance results would have been lower.
All results shown assume reinvestment of distributions. Class Z shares are sold at net asset value with no distribution and service (Rule 12b-1) fees. Class Z shares have limited eligibility and the investment minimum requirements may vary. Please see the fund's prospectus for details. Performance for different share classes will vary based on differences in sales charges and fees associated with each class.
The tables do not reflect the deduction of taxes that a shareholder may pay on fund distributions or on the redemption of fund shares.
4
Understanding Your Expenses – Columbia Maryland Intermediate Municipal Bond Fund
As a fund shareholder, you incur two types of costs. There are transaction costs, which generally include sales charges on purchases and may include redemption fees or exchange fees. There are also ongoing costs, which generally include investment advisory fees, distribution and service (Rule 12b-1) fees and other fund expenses. The information on this page is intended to help you understand the ongoing costs of investing in the fund and to compare these costs with the ongoing costs of investing in other mutual funds.
Analyzing your fund's expenses by share class
To illustrate these ongoing costs, we have provided an example and calculated the expenses paid by investors in each share class during the period. The information in the following table is based on an initial investment of $1,000, which is invested at the beginning of the period and held for the entire period. Expense information is calculated two ways and each method provides you with different information. The amount listed in the "Actual" column is calculated using the fund's actual operating expenses and total return for the period. The amount listed in the "Hypothetical" column for each share class assumes that the return each year is 5% before expenses and is calculated based on the fund's actual operating expenses. You should not use the hypothetical account values and expenses to estimate either your actual account balance at the end of the period or the expenses you paid during this period.
Compare with other funds
Since all mutual funds are required to include the same hypothetical calculations about expenses in shareholder reports, you can use this information to compare the ongoing cost of investing in the fund with other funds. To do so, compare the 5% hypothetical example with the 5% hypothetical examples that appear in the shareholder reports of other funds. As you compare hypothetical examples of other funds, it is important to note that hypothetical examples are meant to highlight the ongoing costs of investing in a fund and do not reflect any transaction costs, such as sales charges, redemption fees or exchange fees.
Estimating your actual expenses
To estimate the expenses that you paid over the period, first you will need your account balance at the end of the period:
g For shareholders who receive their account statements from Columbia Management Investment Services Corp., your account balance is available online at www.columbiamanagement.com or by calling Shareholder Services at 800.345.6611.
g For shareholders who receive their account statements from their financial intermediary, contact your financial intermediary to obtain your account balance.
1. Divide your ending account balance by $1,000. For example, if an account balance was $8,600 at the end of the period, the result would be 8.6.
2. In the section of the table below titled "Expenses paid during the period," locate the amount for your share class. You will find this number in the column labeled "Actual." Multiply this number by the result from step 1. Your answer is an estimate of the expenses you paid on your account during the period.
If the value of your account falls below the minimum initial investment requirement applicable to you, your account may be subject to a $20 annual fee. This fee is not included in the accompanying table. If you are subject to the fee, keep it in mind when you are estimating the ongoing expenses of investing in the fund and when comparing the expenses of this fund with other funds.
10/01/10 – 03/31/11
| | | Account value at the
beginning of the period ($) | | Account value at the
end of the period ($) | | Expenses paid
during the period ($) | | Fund's annualized
expense ratio (%) | |
| | | Actual | | Hypothetical | | Actual | | Hypothetical | | Actual | | Hypothetical | | Actual | |
| Class A | | | 1,000.00 | | | | 1,000.00 | | | | 970.70 | | | | 1,020.94 | | | | 3.93 | | | | 4.03 | | | | 0.80 | | |
| Class B | | | 1,000.00 | | | | 1,000.00 | | | | 967.20 | | | | 1,017.20 | | | | 7.60 | | | | 7.80 | | | | 1.55 | | |
| Class C | | | 1,000.00 | | | | 1,000.00 | | | | 967.00 | | | | 1,017.20 | | | | 7.60 | | | | 7.80 | | | | 1.55 | | |
| Class Z | | | 1,000.00 | | | | 1,000.00 | | | | 971.90 | | | | 1,022.19 | | | | 2.70 | | | | 2.77 | | | | 0.55 | | |
Expenses paid during the period are equal to the annualized expense ratio for the share class, multiplied by the average account value over the period, then multiplied by the number of days in the fund's most recent fiscal half-year and divided by 365.
Had the Investment Manager and/or any of its affiliates not waived fees or reimbursed a portion of expenses, account value at the end of the period would have been reduced.
It is important to note that the expense amounts shown in the table are meant to highlight only ongoing costs of investing in the fund and do not reflect any transaction costs, such as sales charges, redemption fees or exchange fees. Therefore, the hypothetical examples provided may not help you determine the relative total costs of owning shares of different funds. If these transaction costs were included, your costs would have been higher.
5
Portfolio Manager's Report – Columbia Maryland Intermediate Municipal Bond Fund
Performance data quoted represents past performance and current performance may be lower or higher. Past performance is no guarantee of future results. The investment return and principal value will fluctuate so that shares, when redeemed, may be worth more or less than the original cost. Please visit www.columbiamanagement.com for daily and most recent month-end performance updates.
Net asset value per share
as of 03/31/11 ($)
| Class A | | | 10.41 | | |
| Class B | | | 10.42 | | |
| Class C | | | 10.41 | | |
| Class Z | | | 10.41 | | |
Distributions declared per share
04/01/10 – 03/31/11 ($)
| Class A | | | 0.34 | | |
| Class B | | | 0.26 | | |
| Class C | | | 0.26 | | |
| Class Z | | | 0.37 | | |
A portion of the fund's income may be subject to the alternative minimum tax. The fund may at times purchase tax-exempt securities at a discount. Some, or all of this discount may be included in the fund's ordinary income and is taxable when distributed.
30-day SEC yields
as of 03/31/11 (%)
| Class A | | | 2.44 | | |
| Class B | | | 1.81 | | |
| Class C | | | 1.76 | | |
| Class Z | | | 2.78 | | |
The 30-day SEC yields reflect the fund's earning power, net of expenses, expressed as an annualized percentage of the public offering price per share at the end of the period.
Taxable-equivalent SEC yields
as of 03/31/11 (%)
| Class A | | | 4.01 | | |
| Class B | | | 2.97 | | |
| Class C | | | 2.89 | | |
| Class Z | | | 4.56 | | |
Taxable-equivalent SEC yields are based on the combined maximum effective 35.0% federal income tax rate and applicable state income tax rate. This tax rate does not reflect the phase out of exemptions or the reduction of the otherwise allowable deductions that occur when adjusted gross income exceeds certain levels. Your taxable-equivalent yield may be different depending on your tax bracket.
For the 12-month period that ended March 31, 2011, the fund's Class A shares returned 2.05% without sales charge. The Barclays Capital 3-15 Year Blend Municipal Bond Index, which is national in scope, gained 2.91%. The fund's return was higher than the 1.76% average return of funds in the Lipper Other States Intermediate Municipal Debt Funds Classification. The fund's return relative to its benchmark was constrained by its focus on Maryland bonds, which have the highest credit quality (AAA) and, therefore, a lower yield than bonds from many other states that are included in the Barclays index. Security selection among BBB rated credits aided results.
Favorable backdrop for Maryland municipal bonds
Maryland municipal bonds benefited as the state's economy and job growth showed signs of progress. Unemployment was 7.5% near period end, well below the national average. While private sector job growth was slow, the state continued to benefit from its proximity to government jobs in and around Washington, D.C. Maryland has maintained funding for job creation programs, but also taken steps to close its 2012 budget gap—with spending reductions in retirement, health care and education.
Positive contributions from credit, sector and maturity allocations
Certain credit quality decisions aided performance, including an underweight in AA3/AA rated bonds, whose weak returns were second only to those of BBB issues. The negative impact of the fund's overweight in BBB bonds was more than offset by strong issue selection in the group. In particular, BBB rated bonds backed by student housing developments at universities in the state did quite well. Overweights in health care, the best performing sector in the index, and housing also were helpful. Finally, an above-average stake in eight- to 12-year bonds made a positive contribution to return, as they were among the better performers in the intermediate range of maturities. An overweight in bonds with maturities under two years, whose low yields held back returns, detracted from performance. In addition, some of the fund's A-rated securities were weak performers, including bonds with 12- to 15-year maturities, which we added late in the year. They lagged as investors continued to sell longer-maturity municipals amid concerns that new issuance in the sector would increase after the year-end expiration of the federally subsidized Build America Bonds (BABs) Program, which tended to have longer maturities. The program provided qualifying municipalities with a less expensive way of financing infrastructure projects.
Changes to interest-rate positioning
The fund began the year with more interest-rate sensitivity than the benchmark. The more sensitive a bond is to interest rate changes, the more its price will fall as interest rates rise—or rise as interest rates fall. As the year progressed, we sold some longer-term issues—which tend to be more sensitive to interest rate changes—in order to bring the fund's positioning more in line with that of the benchmark. To pick up some yield and increase diversification, we reduced exposure to AAA securities and added AA and A issues. Finally, we trimmed investments in local general obligation (GO) bonds, which could be pressured by a slow recovery in local municipalities' tax bases, and increased exposure to revenue bonds in the electric, health care and housing sectors, which are backed by revenues from the projects they finance.
6
Portfolio Manager's Report (continued) – Columbia Maryland Intermediate Municipal Bond Fund
Slow recovery for Maryland's economy
We believe state municipal issues will benefit as the Maryland economy slowly continues to recover. We think the state is well positioned with exposure to the government sector as well as a highly educated workforce, which should allow it to take advantage of growth opportunities in science and technology. Housing, however, remains weak. As the economy eventually improves, we expect higher municipal bond prices. Although we do not anticipate that the Fed will raise short-term interest rates any time soon, we plan to take a more conservative approach going forward, lowering the fund's sensitivity to interest-rate risk. We also may increase exposure to shorter-maturity callable (or redeemable) bonds, which usually outperform similar maturity non-callable bonds when interest rates rise.
Portfolio characteristics and holdings are subject to change periodically and may not be representative of current characteristics and holdings. The outlook for the fund may differ from that presented for other Columbia Funds.
Tax-exempt investing offers current tax-exempt income, but it also involves special risks. The value of the fund will be affected by interest rate changes and the creditworthiness of issues held in the fund. When interest rates go up, bond prices generally drop and vice versa.
Interest income from certain tax-exempt bonds may be subject to certain state and local taxes and, if applicable, the alternative minimum tax. Capital gains are not exempt from income taxes.
Non-diversified investments increase the risk that a change in the value of any one investment held by the fund could affect the overall value of the fund more than it would affect that of a diversified fund holding a greater number of investments. Accordingly, the fund's value will likely be more volatile than the value of more diversified funds.
Single-state municipal bond funds pose additional risks due to limited geographical diversification.
Top 5 sectors
as of 03/31/11 (%)
| Tax-Backed | | | 42.8 | | |
| Health Care | | | 13.2 | | |
| Housing | | | 10.6 | | |
| Utilities | | | 10.4 | | |
| Other | | | 6.5 | | |
Quality breakdown
as of 03/31/11 (%)
| AAA | | | 37.1 | | |
| AA | | | 32.8 | | |
| A | | | 17.5 | | |
| BBB | | | 10.3 | | |
| BB | | | 0.7 | | |
| Non-Rated | | | 1.6 | | |
Maturity breakdown
as of 03/31/11 (%)
| 1-3 years | | | 9.4 | | |
| 3-5 years | | | 11.5 | | |
| 5-7 years | | | 17.2 | | |
| 7-10 years | | | 14.9 | | |
| 10-15 years | | | 35.0 | | |
| 15-20 years | | | 9.5 | | |
| Net Cash & Equivalents | | | 2.5 | | |
Ratings shown in the quality breakdown are assigned to individual bonds by taking the lower of the ratings available from one of the following nationally recognized rating agencies: Standard & Poor's or Moody's Investor Services. If a security is rated by only one of the two agencies, that rating is used. If a security is not rated by either of the two agencies, it is designated as Non-Rated. Ratings are relative and subjective and are not absolute standards of quality. The credit quality of the fund's investments does not remove market risk.
The fund is actively managed and the composition of its portfolio will change over time. Information provided is calculated as a percentage of net assets.
7
Investment Portfolio – Columbia Maryland Intermediate Municipal Bond Fund
March 31, 2011
| Municipal Bonds – 97.2% | |
| | | Par ($) | | Value ($) | |
| Education – 5.8% | |
| Education – 5.8% | |
| MD Health & Higher Educational Facilities Authority | |
College of Notre Dame,
Series 1998,
Insured: NPFGC
4.600% 10/01/14 | | | 510,000 | | | | 556,145 | | |
Johns Hopkins University,
Series 2008,
5.000% 07/01/18 | | | 1,750,000 | | | | 1,996,767 | | |
| MD Industrial Development Financing Authority | |
American Center for Physics,
Series 2001,
GTY AGMT:
American Institute of Physics
5.250% 12/15/15 | | | 1,000,000 | | | | 1,031,560 | | |
| MD University System of Maryland | |
Series 2006,
5.000% 10/01/15 | | | 2,000,000 | | | | 2,292,700 | | |
Series 2009 D,
4.000% 04/01/22 | | | 1,060,000 | | | | 1,085,387 | | |
| MD Westminster Educational Facilities | |
McDaniel College, Inc.,
Series 2006,
5.000% 11/01/17 | | | 575,000 | | | | 610,886 | | |
| Education Total | | | 7,573,445 | | |
| Education Total | | | 7,573,445 | | |
| Health Care – 13.2% | |
| Continuing Care Retirement – 4.3% | |
| MD Baltimore County | |
Oak Crest Village, Inc.,
Series 2007 A,
GTY AGMT: Oak Campus
Partners LLC:
5.000% 01/01/22 | | | 1,045,000 | | | | 1,022,825 | | |
| 5.000% 01/01/27 | | | 2,000,000 | | | | 1,824,480 | | |
| MD Gaithersburg | |
Series 2009,
6.000% 01/01/23 | | | 1,250,000 | | | | 1,253,237 | | |
| MD Health & Higher Educational Facilities Authority | |
King Farm Presbyterian Community,
Series 2007 A,
5.250% 01/01/27 | | | 2,000,000 | | | | 1,552,420 | | |
| Continuing Care Retirement Total | | | 5,652,962 | | |
| | | Par ($) | | Value ($) | |
| Hospitals – 8.9% | |
| MD Baltimore County | |
Catholic Health Initiatives,
Series 2006 A:
5.000% 09/01/16 | | | 1,000,000 | | | | 1,127,510 | | |
| 5.000% 09/01/26 | | | 1,500,000 | | | | 1,536,360 | | |
| MD Health & Higher Educational Facilities Authority | |
Carroll Hospital Center, Inc.,
Series 2006,
4.500% 07/01/26 | | | 1,000,000 | | | | 920,400 | | |
Johns Hopkins Health System,
Series 2008,
5.000% 05/15/48 (05/15/15) (a)(b) | | | 2,000,000 | | | | 2,210,840 | | |
Peninsula Regional Medical Center,
Series 2006,
5.000% 07/01/26 | | | 2,000,000 | | | | 1,874,920 | | |
University of Maryland Medical System,
Series 2010,
5.000% 07/01/20 | | | 1,000,000 | | | | 1,027,820 | | |
Western Maryland Health System,
Series 2006 A,
Insured: NPFGC:
5.000% 07/01/13 | | | 1,280,000 | | | | 1,364,211 | | |
| 5.000% 01/01/20 | | | 1,450,000 | | | | 1,497,836 | | |
| Hospitals Total | | | 11,559,897 | | |
| Health Care Total | | | 17,212,859 | | |
| Housing – 10.6% | |
| Multi-Family – 6.5% | |
| MD Economic Development Corp. | |
Collegiate Housing Foundation,
Series 1999 A:
5.700% 06/01/12 | | | 685,000 | | | | 687,589 | | |
| 6.000% 06/01/19 | | | 815,000 | | | | 820,143 | | |
| 6.000% 06/01/30 | | | 1,850,000 | | | | 1,716,800 | | |
Towson University,
Series 2007 A,
5.250% 07/01/24 | | | 1,185,000 | | | | 1,128,357 | | |
University of Maryland - Baltimore,
Series 2006,
Insured: SYNC
5.000% 07/01/20 | | | 600,000 | | | | 579,690 | | |
University of Maryland - College Park,
Series 2006,
Insured: CIFG:
5.000% 06/01/17 | | | 1,000,000 | | | | 1,041,000 | | |
| 5.000% 06/01/19 | | | 1,000,000 | | | | 1,015,850 | | |
See Accompanying Notes to Financial Statements.
8
Columbia Maryland Intermediate Municipal Bond Fund
March 31, 2011
| Municipal Bonds (continued) | |
| | | Par ($) | | Value ($) | |
| MD Montgomery County Housing Opportunities Commission | |
Series 2000 A,
6.100% 07/01/30 | | | 1,500,000 | | | | 1,500,795 | | |
| Multi-Family Total | | | 8,490,224 | | |
| Single-Family – 4.1% | |
| MD Community Development Administration Department of Housing & Community Development | |
Series 1999 D, AMT,
5.375% 09/01/24 | | | 2,410,000 | | | | 2,410,361 | | |
Series 2003,
Insured: AGMC
4.400% 07/01/21 | | | 1,500,000 | | | | 1,514,475 | | |
Series 2010 B,
5.125% 09/01/30 | | | 1,500,000 | | | | 1,486,275 | | |
| Single-Family Total | | | 5,411,111 | | |
| Housing Total | | | 13,901,335 | | |
| Other – 6.5% | |
| Other – 4.1% | |
| MD Montgomery County | |
Series 2009 A,
5.000% 04/01/22 | | | 2,055,000 | | | | 2,226,408 | | |
| MD Transportation Authority | |
Baltimore/Washington International
Airport Parking,
Series 2002 A,
Insured: AMBAC
4.500% 03/01/15 | | | 3,000,000 | | | | 3,090,960 | | |
| Other Total | | | 5,317,368 | | |
| Pool/Bond Bank – 0.8% | |
| MD Water Quality Financing Administration Revolving Loan Fund | |
Series 2008 A,
5.000% 03/01/23 | | | 1,000,000 | | | | 1,087,820 | | |
| Pool/Bond Bank Total | | | 1,087,820 | | |
| Refunded/Escrowed (c) – 1.6% | |
| MD Baltimore | |
Series 1994 A,
Escrowed to Maturity,
5.000% 07/01/24 | | | 1,400,000 | | | | 1,581,342 | | |
| MD Transportation Authority | |
Series 1978,
Escrowed to Maturity,
6.800% 07/01/16 | | | 430,000 | | | | 492,135 | | |
| Refunded/Escrowed Total | | | 2,073,477 | | |
| Other Total | | | 8,478,665 | | |
| | | Par ($) | | Value ($) | |
| Other Revenue – 2.1% | |
| Hotels – 1.4% | |
| MD Baltimore | |
Baltimore Hotel Corp.,
Series 2006 A,
Insured: SYNC
5.250% 09/01/17 | | | 1,835,000 | | | | 1,805,530 | | |
| Hotels Total | | | 1,805,530 | | |
| Other Industrial Development Bonds – 0.7% | |
| MD Economic Development Corp. | |
CNX Marine Terminals, Inc.,
Series 2010,
GTY AGMT: Consol Energy, Inc.
5.750% 09/01/25 | | | 1,000,000 | | | | 930,700 | | |
| Other Industrial Development Bonds Total | | | 930,700 | | |
| Other Revenue Total | | | 2,736,230 | | |
| Resource Recovery – 0.8% | |
| Disposal – 0.8% | |
| MD Environmental Service | |
Mid-Shore II Regional Landfill,
Series 2011,
5.000% 11/01/24 | | | 1,030,000 | | | | 1,079,255 | | |
| Disposal Total | | | 1,079,255 | | |
| Resource Recovery Total | | | 1,079,255 | | |
| Tax-Backed – 42.8% | |
| Local Appropriated – 1.8% | |
| MD Baltimore | |
Series 2010,
5.000% 10/01/17 | | | 2,100,000 | | | | 2,348,997 | | |
| Local Appropriated Total | | | 2,348,997 | | |
| Local General Obligations – 16.8% | |
| MD Anne Arundel County | |
Series 2006:
5.000% 03/01/15 | | | 2,000,000 | | | | 2,268,060 | | |
| 5.000% 03/01/18 | | | 3,300,000 | | | | 3,693,657 | | |
| MD Baltimore County | |
Series 2008,
5.000% 02/01/18 | | | 1,000,000 | | | | 1,158,360 | | |
| MD Baltimore | |
Series 2008 A,
Insured: AGMC
5.000% 10/15/22 | | | 2,000,000 | | | | 2,176,660 | | |
See Accompanying Notes to Financial Statements.
9
Columbia Maryland Intermediate Municipal Bond Fund
March 31, 2011
| Municipal Bonds (continued) | |
| | | Par ($) | | Value ($) | |
| MD Frederick County | |
Series 2005,
5.000% 08/01/14 | | | 1,500,000 | | | | 1,689,615 | | |
Series 2006:
5.250% 11/01/18 | | | 2,005,000 | | | | 2,353,890 | | |
| 5.250% 11/01/21 | | | 2,500,000 | | | | 2,919,050 | | |
| MD Howard County | |
Series 2002 A,
5.250% 08/15/15 | | | 795,000 | | | | 825,782 | | |
| MD Montgomery County | |
Series 2001,
5.250% 10/01/14 | | | 1,000,000 | | | | 1,034,320 | | |
Series 2005 A,
5.000% 07/01/16 | | | 1,500,000 | | | | 1,734,510 | | |
| MD Prince Georges County | |
Series 1999,
Insured: AGMC
5.000% 10/01/12 | | | 65,000 | | | | 65,570 | | |
Series 2001,
Insured: NPFGC
5.250% 12/01/12 | | | 2,000,000 | | | | 2,083,600 | | |
| Local General Obligations Total | | | 22,003,074 | | |
| Special Non-Property Tax – 8.9% | |
| MD Department of Transportation | |
Series 2002,
5.500% 02/01/14 | | | 5,000,000 | | | | 5,620,650 | | |
Series 2008,
5.000% 02/15/22 | | | 3,125,000 | | | | 3,397,844 | | |
Series 2009,
4.000% 06/15/21 | | | 1,495,000 | | | | 1,547,743 | | |
| VI Virgin Islands Public Finance Authority | |
Series 2010 A,
5.000% 10/01/17 | | | 1,000,000 | | | | 1,072,410 | | |
| Special Non-Property Tax Total | | | 11,638,647 | | |
| Special Property Tax – 1.9% | |
| MD Frederick County | |
Series 2010 A,
5.000% 07/01/25 | | | 2,500,000 | | | | 2,447,450 | | |
| Special Property Tax Total | | | 2,447,450 | | |
| State Appropriated – 2.6% | |
| MD Economic Development Corp. | |
Series 2010,
4.500% 06/01/22 | | | 2,675,000 | | | | 2,856,285 | | |
| NJ Transportation Trust Fund Authority | |
Series 2006 A,
Insured: NPFGC
5.250% 12/15/19 | | | 500,000 | | | | 528,835 | | |
| State Appropriated Total | | | 3,385,120 | | |
| | | Par ($) | | Value ($) | |
| State General Obligations – 10.8% | |
| MD State | |
Series 2002 A,
5.500% 03/01/13 | | | 2,245,000 | | | | 2,453,134 | | |
Series 2003,
5.250% 03/01/17 | | | 4,000,000 | | | | 4,686,840 | | |
Series 2009,
5.000% 03/01/21 | | | 2,000,000 | | | | 2,256,660 | | |
| PR Commonwealth of Puerto Rico Public Buildings Authority | |
Series 2003 H,
Insured: AMBAC
5.500% 07/01/18 | | | 2,000,000 | | | | 2,055,740 | | |
| PR Commonwealth of Puerto Rico | |
Series 2002 A,
Insured: FGIC
5.500% 07/01/17 | | | 2,520,000 | | | | 2,624,429 | | |
| State General Obligations Total | | | 14,076,803 | | |
| Tax-Backed Total | | | 55,900,091 | | |
| Transportation – 5.0% | |
| Toll Facilities – 2.5% | |
| MD Transportation Authority | |
Series 2009,
5.000% 07/01/22 | | | 3,000,000 | | | | 3,291,720 | | |
| Toll Facilities Total | | | 3,291,720 | | |
| Transportation – 2.5% | |
| DC District of Columbia Washington Metropolitan Area Transit Authority | |
Series 2009 A,
5.250% 07/01/23 | | | 3,000,000 | | | | 3,218,610 | | |
| Transportation Total | | | 3,218,610 | | |
| Transportation Total | | | 6,510,330 | | |
| Utilities – 10.4% | |
| Investor Owned – 2.2% | |
| MD Economic Development Corp. | |
Potomac Electric Power Co.,
Series 2009,
6.200% 09/01/22 | | | 2,500,000 | | | | 2,828,850 | | |
| Investor Owned Total | | | 2,828,850 | | |
| Municipal Electric – 1.5% | |
| PR Commonwealth of Puerto Rico Electric Power Authority | |
Series 2010,
5.250% 07/01/25 | | | 1,985,000 | | | | 1,901,253 | | |
| Municipal Electric Total | | | 1,901,253 | | |
See Accompanying Notes to Financial Statements.
10
Columbia Maryland Intermediate Municipal Bond Fund
March 31, 2011
| Municipal Bonds (continued) | |
| | | Par ($) | | Value ($) | |
| Water & Sewer – 6.7% | |
| MD Baltimore | |
Series 2006 C,
Insured: AMBAC
5.000% 07/01/18 | | | 1,125,000 | | | | 1,227,836 | | |
Series 2007 DC,
Insured: AMBAC
5.000% 07/01/19 | | | 1,250,000 | | | | 1,378,675 | | |
Series 2008 A,
Insured: AGMC
5.000% 07/01/21 | | | 1,250,000 | | | | 1,371,175 | | |
| MD Washington Suburban Sanitation District | |
Series 2009,
4.000% 06/01/21 | | | 2,000,000 | | | | 2,095,500 | | |
| MD Water Quality Financing Administration Revolving Loan Fund | |
Bay Restoration Fund,
Series 2008,
5.000% 03/01/21 | | | 2,500,000 | | | | 2,711,750 | | |
| Water & Sewer Total | | | 8,784,936 | | |
| Utilities Total | | | 13,515,039 | | |
Total Municipal Bonds
(cost of $124,085,270) | | | 126,907,249 | | |
| Investment Companies – 2.3% | |
| | | Shares | | | |
BofA Tax-Exempt Reserves,
Capital Class
(7 day yield of 0.110%) (d) | | | 1,600,632 | | | | 1,600,632 | | |
Dreyfus Tax-Exempt
Cash Management Fund
(7 day yield of 0.080%) | | | 1,416,547 | | | | 1,416,547 | | |
Total Investment Companies
(cost of $3,017,179) | | | 3,017,179 | | |
Total Investments – 99.5%
(cost of $127,102,449) (e) | | | 129,924,428 | | |
| Other Assets & Liabilities, Net – 0.5% | | | 636,494 | | |
| Net Assets – 100.0% | | | 130,560,922 | | |
Notes to Investment Portfolio:
(a) The interest rate shown on floating rate or variable rate securities reflects the rate at March 31, 2011.
(b) Parenthetical date represents the next interest rate reset date for the security.
(c) The Fund has been informed that each issuer has placed direct obligations of the U.S. Government in an irrevocable trust, solely for the payment of principal and interest.
(d) Investments in affiliates during the year ended March 31, 2011:
| Affiliate | | Value,
beginning
of period | | Purchases | | Sales
Proceeds | | Dividend
Income | | Value,
end of
period | |
BofA Tax-Exempt
Reserves,
Capital Class
(7 day yield of
0.110%) | | $ | 2,037,000 | | | $ | 4,021,188 | | | $ | 4,886,000 | | | $ | 114 | | | $ | — | | |
As of May 1, 2010, this company was no longer an affiliate of the fund. The above table reflects activity for the period from April 1, 2010 through April 30, 2010.
(e) Cost for federal income tax purposes is $126,961,884.
Generally accepted accounting principles (GAAP) require disclosure regarding the inputs and valuation techniques used to measure fair value and any changes in valuation inputs or techniques. In addition, investments shall be disclosed by major category.
The Fund categorizes its fair value measurements according to a three-level hierarchy that maximizes the use of observable inputs and minimizes the use of unobservable inputs by prioritizing that the most observable input be used when available. Observable inputs are those that market participants would use in pricing an investment based on market data obtained from sources independent of the reporting entity. Unobservable inputs are those that reflect the Fund's assumptions about the information market participants would use in pricing an investment. An investment's level within the fair value hierarchy is based on the lowest level of any input that is deemed significant to the asset or liability's fair value measurement. The input levels are not necessarily an indication of the risk or liquidity associated with investments at that level. For example, certain U.S. government securities are generally high quality and liquid, however, they are reflected as Level 2 because the inputs used to determine fair value may not always be quoted prices in an active market.
Fair value inputs are summarized in the three broad levels listed below:
• Level 1—Valuations based on quoted prices for investments in active markets that the Fund has the ability to access at the measurement date (including NAV for open-end mutual funds). Valuation adjustments are not applied to Level 1 investments.
• Level 2—Valuations based on other significant observable inputs (including quoted prices for similar securities, interest rates, prepayment speeds, credit risks, etc.).
• Level 3—Valuations based on significant unobservable inputs (including the Fund's own assumptions and judgment in determining the fair value of investments).
Inputs that are used in determining fair value of an investment may include price information, credit data, volatility statistics, and other factors. These inputs can be either observable or unobservable. The availability of observable inputs can vary between investments, and is affected by various factors such as the type of investment, and the volume and level of activity for that investment or similar investments in the marketplace. The inputs will be considered by the Investment Manager, along with any other relevant factors in the calculation of an investment's fair value. The Fund uses prices and inputs that are current as of the measurement date, which may include periods of market dislocations. During these periods, the availability of prices and inputs may be reduced for many investments. This condition could cause an investment to be reclassified between the various levels within the hierarchy.
Investments falling into the Level 3 category are primarily supported by quoted prices from brokers and dealers participating in the market for those investments. However, these may be classified as Level 3 investments due to lack of market transparency and corroboration to support these quoted prices. Additionally, valuation models may be used as the pricing source for any remaining investments classified as Level 3. These models rely on one or more significant unobservable inputs and/or significant assumptions by the Investment Manager. Inputs used in valuations may include, but are not limited to, financial statement analysis, capital account balances, discount rates and estimated cash flows, and comparable company data.
See Accompanying Notes to Financial Statements.
11
Columbia Maryland Intermediate Municipal Bond Fund
March 31, 2011
The following table is a summary of the inputs used to value the Fund's investments as of March 31, 2011:
| Description | | Quoted
Prices
(Level 1) | | Other
Significant
Observable
Inputs
(Level 2) | | Significant
Unobservable
Inputs
(Level 3) | | Total | |
| Total Municipal Bonds | | $ | — | | | $ | 126,907,249 | | | $ | — | | | $ | 126,907,249 | | |
| Total Investment Companies | | | 3,017,179 | | | | — | | | | — | | | | 3,017,179 | | |
| Total Investments | | $ | 3,017,179 | | | $ | 126,907,249 | | | $ | — | | | $ | 129,924,428 | | |
The Fund's assets assigned to the Level 2 input category are generally valued using the market approach, in which a security's value is determined through its correlation to prices and information from market transactions for similar or identical assets.
There were no significant transfers of financial assets between Levels 1 and 2 during the period.
At March 31, 2011, the composition of the Fund by revenue source is as follows:
| Holdings by Revenue Source (Unaudited) | | % of
Net Assets | |
| Tax-Backed | | | 42.8 | | |
| Health Care | | | 13.2 | | |
| Housing | | | 10.6 | | |
| Utilities | | | 10.4 | | |
| Other | | | 6.5 | | |
| Education | | | 5.8 | | |
| Transportation | | | 5.0 | | |
| Other Revenue | | | 2.1 | | |
| Resource Recovery | | | 0.8 | | |
| | | | 97.2 | | |
| Investment Companies | | | 2.3 | | |
| Other Assets & Liabilities, Net | | | 0.5 | | |
| | | | 100.0 | | |
| Acronym | | Name | |
| AGMC | | Assured Guaranty Municipal Corp. | |
|
| AMBAC | | Ambac Assurance Corp. | |
|
| AMT | | Alternative Minimum Tax | |
|
| CIFG | | CIFG Assurance North America, Inc. | |
|
| FGIC | | Financial Guaranty Insurance Co. | |
|
| GTY AGMT | | Guaranty Agreement | |
|
| NPFGC | | National Public Finance Guarantee Corp. | |
|
| SYNC | | Syncora Guarantee, Inc. | |
|
See Accompanying Notes to Financial Statements.
12
Statement of Assets and Liabilities – Columbia Maryland Intermediate Municipal Bond Fund
March 31, 2011
| | | | | ($) | |
| Assets | | Investments, at identified cost | | | 127,102,449 | | |
| | | Investments, at value | | | 129,924,428 | | |
| | | Cash | | | 992 | | |
| | | Receivable for: | | | | | |
| | | Fund shares sold | | | 164,360 | | |
| | | Interest | | | 1,447,779 | | |
| | | Expense reimbursement due from Investment Manager | | | 59,209 | | |
| | | Prepaid expenses | | | 259 | | |
| | | Total Assets | | | 131,597,027 | | |
| Liabilities | | Payable for: | | | | | |
| | | Fund shares repurchased | | | 423,272 | | |
| | | Distributions | | | 356,067 | | |
| | | Investment advisory fee | | | 45,491 | | |
| | | Administration fee | | | 12,189 | | |
| | | Pricing and bookkeeping fees | | | 6,823 | | |
| | | Transfer agent fee | | | 40,640 | | |
| | | Trustees' fees | | | 78,196 | | |
| | | Audit fee | | | 26,800 | | |
| | | Legal fee | | | 30,407 | | |
| | | Custody fee | | | 2,127 | | |
| | | Distribution and service fees | | | 8,615 | | |
| | | Chief compliance officer expenses | | | 220 | | |
| | | Other liabilities | | | 5,258 | | |
| | | Total Liabilities | | | 1,036,105 | | |
| | | Net Assets | | | 130,560,922 | | |
| Net Assets Consist of | | Paid-in capital | | | 131,899,189 | | |
| | | Undistributed net investment income | | | 165,047 | | |
| | | Accumulated net realized loss | | | (4,325,293 | ) | |
| | | Net unrealized appreciation on investments | | | 2,821,979 | | |
| | | Net Assets | | | 130,560,922 | | |
See Accompanying Notes to Financial Statements.
13
Statement of Assets and Liabilities – Columbia Maryland Intermediate Municipal Bond Fund
March 31, 2011 (continued)
| Class A | | Net assets | | $ | 23,454,107 | | |
| | | Shares outstanding | | | 2,252,749 | | |
| | | Net asset value per share | | $ | 10.41 | (a) | |
| | | Maximum sales charge | | | 3.25 | % | |
| | | Maximum offering price per share ($10.41/0.9675) | | $ | 10.76 | (b) | |
| Class B | | Net assets | | $ | 370,631 | | |
| | | Shares outstanding | | | 35,571 | | |
| | | Net asset value and offering price per share | | $ | 10.42 | (a) | |
| Class C | | Net assets | | $ | 3,704,981 | | |
| | | Shares outstanding | | | 355,820 | | |
| | | Net asset value and offering price per share | | $ | 10.41 | (a) | |
| Class Z | | Net assets | | $ | 103,031,203 | | |
| | | Shares outstanding | | | 9,893,774 | | |
| | | Net asset value, offering and redemption price per share | | $ | 10.41 | | |
(a) Redemption price per share is equal to net asset value less any applicable contingent deferred sales charge.
(b) On sales of $100,000 or more the offering price is reduced.
See Accompanying Notes to Financial Statements.
14
Statement of Operations – Columbia Maryland Intermediate Municipal Bond Fund
For the Year Ended March 31, 2011
| | | | | ($) | |
| Investment Income | | Interest | | | 6,113,373 | | |
| | | Dividends | | | 3,235 | | |
| | | Dividends from affiliates | | | 114 | | |
| | | Total Investment Income | | | 6,116,722 | | |
| Expenses | | Investment advisory fee | | | 615,159 | | |
| | | Administration fee | | | 169,618 | | |
| | | Distribution fee: | | | | | |
| | | Class B | | | 4,496 | | |
| | | Class C | | | 30,141 | | |
| | | Service fee: | | | | | |
| | | Class B | | | 1,499 | | |
| | | Class C | | | 10,047 | | |
| | | Distribution and service fees: | | | | | |
| | | Class A | | | 66,263 | | |
| | | Transfer agent fee | | | 98,101 | | |
| | | Pricing and bookkeeping fees | | | 72,676 | | |
| | | Trustees' fees | | | 31,461 | | |
| | | Custody fee | | | 11,903 | | |
| | | Chief compliance officer expenses | | | 1,143 | | |
| | | Other expenses | | | 110,331 | | |
| | | Total Expenses | | | 1,222,838 | | |
| | | Fees waived or expenses reimbursed by Investment Manager | | | (264,133 | ) | |
| | | Expense reductions | | | (3 | ) | |
| | | Net Expenses | | | 958,702 | | |
| | | Net Investment Income | | | 5,158,020 | | |
| Net Realized and Unrealized Gain (Loss) on Investments | | Net realized gain on investments | | | 271,338 | | |
| | | Net change in unrealized appreciation (depreciation) on investments | | | (1,709,143 | ) | |
| | | Net Loss | | | (1,437,805 | ) | |
| | | Net Increase Resulting from Operations | | | 3,720,215 | | |
See Accompanying Notes to Financial Statements.
15
Statement of Changes in Net Assets – Columbia Maryland Intermediate Municipal Bond Fund
| | | | | Year Ended March 31, | |
| Increase (Decrease) in Net Assets | | | | 2011 ($) | | 2010 ($) | |
| Operations | | Net investment income | | | 5,158,020 | | | | 5,601,499 | | |
| | | Net realized gain (loss) on investments | | | 271,338 | | | | (2,377,473 | ) | |
| | | Net change in unrealized appreciation (depreciation)
on investments | | | (1,709,143 | ) | | | 9,226,271 | | |
| | | Net increase resulting from operations | | | 3,720,215 | | | | 12,450,297 | | |
| Distributions to Shareholders | | From net investment income: | | | | | | | | | |
| | | Class A | | | (843,558 | ) | | | (842,997 | ) | |
| | | Class B | | | (14,545 | ) | | | (39,020 | ) | |
| | | Class C | | | (97,205 | ) | | | (65,708 | ) | |
| | | Class Z | | | (4,202,712 | ) | | | (4,653,775 | ) | |
| | | Total distributions to shareholders | | | (5,158,020 | ) | | | (5,601,500 | ) | |
| | | Net Capital Stock Transactions | | | (30,855,959 | ) | | | 1,451,169 | | |
| | | Total increase (decrease) in net assets | | | (32,293,764 | ) | | | 8,299,966 | | |
| Net Assets | | Beginning of period | | | 162,854,686 | | | | 154,554,720 | | |
| | | End of period | | | 130,560,922 | | | | 162,854,686 | | |
| | | Undistributed net investment income at end of period | | | 165,047 | | | | 222,956 | | |
See Accompanying Notes to Financial Statements.
16
Statement of Changes in Net Assets (continued) – Columbia Maryland Intermediate Municipal Bond Fund
| | | Capital Stock Activity | |
| | | Year Ended
March 31, 2011 | | Year Ended
March 31, 2010 | |
| | | Shares | | Dollars ($) | | Shares | | Dollars ($) | |
| Class A | |
| Subscriptions | | | 231,923 | | | | 2,474,616 | | | | 459,976 | | | | 4,837,296 | | |
| Distributions reinvested | | | 35,693 | | | | 381,387 | | | | 61,434 | | | | 644,916 | | |
| Redemptions | | | (618,863 | ) | | | (6,579,671 | ) | | | (250,909 | ) | | | (2,643,212 | ) | |
| Net increase (decrease) | | | (351,247 | ) | | | (3,723,668 | ) | | | 270,501 | | | | 2,839,000 | | |
| Class B | |
| Subscriptions | | | 348 | | | | 3,697 | | | | 445 | | | | 4,667 | | |
| Distributions reinvested | | | 654 | | | | 6,984 | | | | 2,372 | | | | 24,864 | | |
| Redemptions | | | (53,603 | ) | | | (572,016 | ) | | | (134,682 | ) | | | (1,408,921 | ) | |
| Net decrease | | | (52,601 | ) | | | (561,335 | ) | | | (131,865 | ) | | | (1,379,390 | ) | |
| Class C | |
| Subscriptions | | | 175,943 | | | | 1,892,940 | | | | 188,231 | | | | 1,987,840 | | |
| Distributions reinvested | | | 5,851 | | | | 62,325 | | | | 5,148 | | | | 54,083 | | |
| Redemptions | | | (136,350 | ) | | | (1,439,106 | ) | | | (95,577 | ) | | | (1,009,407 | ) | |
| Net increase | | | 45,444 | | | | 516,159 | | | | 97,802 | | | | 1,032,516 | | |
| Class Z | |
| Subscriptions | | | 684,337 | | | | 7,323,647 | | | | 2,836,340 | | | | 29,758,810 | | |
| Distributions reinvested | | | 16,832 | | | | 179,322 | | | | 17,904 | | | | 187,830 | | |
| Redemptions | | | (3,266,739 | ) | | | (34,590,084 | ) | | | (2,953,816 | ) | | | (30,987,597 | ) | |
| Net decrease | | | (2,565,570 | ) | | | (27,087,115 | ) | | | (99,572 | ) | | | (1,040,957 | ) | |
See Accompanying Notes to Financial Statements.
17
Financial Highlights – Columbia Maryland Intermediate Municipal Bond Fund
Selected data for a share outstanding throughout each period is as follows:
| | | Year Ended March 31, | |
| Class A Shares | | 2011 | | 2010 | | 2009 | | 2008 | | 2007 | |
| Net Asset Value, Beginning of Period | | $ | 10.53 | | | $ | 10.08 | | | $ | 10.44 | | | $ | 10.63 | | | $ | 10.57 | | |
| Income from Investment Operations: | |
| Net investment income (a) | | | 0.34 | | | | 0.34 | | | | 0.38 | | | | 0.39 | | | | 0.40 | | |
Net realized and unrealized gain (loss) on investments
and futures contracts | | | (0.12 | ) | | | 0.45 | | | | (0.36 | ) | | | (0.19 | ) | | | 0.06 | | |
| Total from investment operations | | | 0.22 | | | | 0.79 | | | | 0.02 | | | | 0.20 | | | | 0.46 | | |
| Less Distributions to Shareholders: | |
| From net investment income | | | (0.34 | ) | | | (0.34 | ) | | | (0.38 | ) | | | (0.39 | ) | | | (0.40 | ) | |
| Net Asset Value, End of Period | | $ | 10.41 | | | $ | 10.53 | | | $ | 10.08 | | | $ | 10.44 | | | $ | 10.63 | | |
| Total return (b)(c) | | | 2.05 | % | | | 7.93 | % | | | 0.26 | % | | | 1.96 | % | | | 4.46 | % | |
| Ratios to Average Net Assets/Supplemental Data: | |
| Net expenses before interest expense (d) | | | 0.80 | % | | | 0.79 | % | | | 0.75 | % | | | 0.75 | % | | | 0.75 | % | |
| Interest expense | | | — | | | | — | | | | — | | | | — | | | | — | %(e) | |
| Net expenses (d) | | | 0.80 | % | | | 0.79 | % | | | 0.75 | % | | | 0.75 | % | | | 0.75 | % | |
| Waiver/Reimbursement | | | 0.17 | % | | | 0.15 | % | | | 0.15 | % | | | 0.16 | % | | | 0.17 | % | |
| Net investment income (d) | | | 3.18 | % | | | 3.26 | % | | | 3.76 | % | | | 3.74 | % | | | 3.81 | % | |
| Portfolio turnover rate | | | 11 | % | | | 23 | % | | | 11 | % | | | 8 | % | | | 20 | % | |
| Net assets, end of period (000s) | | $ | 23,454 | | | $ | 27,423 | | | $ | 23,530 | | | $ | 24,405 | | | $ | 24,730 | | |
(a) Per share data was calculated using the average shares outstanding during the period.
(b) Total return at net asset value assuming all distributions reinvested and no initial sales charge or contingent deferred sales charge.
(c) Had the Investment Manager and/or any of its affiliates not waived fees or reimbursed a portion of expenses, total return would have been reduced.
(d) The benefits derived from expense reductions had an impact of less than 0.01%.
(e) Rounds to less than 0.01%.
See Accompanying Notes to Financial Statements.
18
Financial Highlights – Columbia Maryland Intermediate Municipal Bond Fund
Selected data for a share outstanding throughout each period is as follows:
| | | Year Ended March 31, | |
| Class B Shares | | 2011 | | 2010 | | 2009 | | 2008 | | 2007 | |
| Net Asset Value, Beginning of Period | | $ | 10.54 | | | $ | 10.09 | | | $ | 10.45 | | | $ | 10.64 | | | $ | 10.57 | | |
| Income from Investment Operations: | |
| Net investment income (a) | | | 0.26 | | | | 0.27 | | | | 0.31 | | | | 0.32 | | | | 0.33 | | |
Net realized and unrealized gain (loss) on investments
and futures contracts | | | (0.12 | ) | | | 0.45 | | | | (0.36 | ) | | | (0.19 | ) | | | 0.06 | | |
| Total from investment operations | | | 0.14 | | | | 0.72 | | | | (0.05 | ) | | | 0.13 | | | | 0.39 | | |
| Less Distributions to Shareholders: | |
| From net investment income | | | (0.26 | ) | | | (0.27 | ) | | | (0.31 | ) | | | (0.32 | ) | | | (0.32 | ) | |
| Net Asset Value, End of Period | | $ | 10.42 | | | $ | 10.54 | | | $ | 10.09 | | | $ | 10.45 | | | $ | 10.64 | | |
| Total return (b)(c) | | | 1.30 | % | | | 7.13 | % | | | (0.48 | )% | | | 1.20 | % | | | 3.78 | % | |
| Ratios to Average Net Assets/Supplemental Data: | |
| Net expenses before interest expense (d) | | | 1.55 | % | | | 1.54 | % | | | 1.50 | % | | | 1.50 | % | | | 1.50 | % | |
| Interest expense | | | — | | | | — | | | | — | | | | — | | | | — | %(e) | |
| Net expenses (d) | | | 1.55 | % | | | 1.54 | % | | | 1.50 | % | | | 1.50 | % | | | 1.50 | % | |
| Waiver/Reimbursement | | | 0.17 | % | | | 0.15 | % | | | 0.15 | % | | | 0.16 | % | | | 0.17 | % | |
| Net investment income (d) | | | 2.43 | % | | | 2.56 | % | | | 3.01 | % | | | 3.00 | % | | | 3.07 | % | |
| Portfolio turnover rate | | | 11 | % | | | 23 | % | | | 11 | % | | | 8 | % | | | 20 | % | |
| Net assets, end of period (000s) | | $ | 371 | | | $ | 929 | | | $ | 2,220 | | | $ | 2,689 | | | $ | 4,159 | | |
(a) Per share data was calculated using the average shares outstanding during the period.
(b) Total return at net asset value assuming all distributions reinvested and no contingent deferred sales charge.
(c) Had the Investment Manager and/or any of its affiliates not waived fees or reimbursed a portion of expenses, total return would have been reduced.
(d) The benefits derived from expense reductions had an impact of less than 0.01%.
(e) Rounds to less than 0.01%.
See Accompanying Notes to Financial Statements.
19
Financial Highlights – Columbia Maryland Intermediate Municipal Bond Fund
Selected data for a share outstanding throughout each period is as follows:
| | | Year Ended March 31, | |
| Class C Shares | | 2011 | | 2010 | | 2009 | | 2008 | | 2007 | |
| Net Asset Value, Beginning of Period | | $ | 10.53 | | | $ | 10.08 | | | $ | 10.44 | | | $ | 10.63 | | | $ | 10.57 | | |
| Income from Investment Operations: | |
| Net investment income (a) | | | 0.26 | | | | 0.26 | | | | 0.31 | | | | 0.32 | | | | 0.32 | | |
Net realized and unrealized gain (loss) on investments
and futures contracts | | | (0.12 | ) | | | 0.45 | | | | (0.36 | ) | | | (0.19 | ) | | | 0.06 | | |
| Total from investment operations | | | 0.14 | | | | 0.71 | | | | (0.05 | ) | | | 0.13 | | | | 0.38 | | |
| Less Distributions to Shareholders: | |
| From net investment income | | | (0.26 | ) | | | (0.26 | ) | | | (0.31 | ) | | | (0.32 | ) | | | (0.32 | ) | |
| Net Asset Value, End of Period | | $ | 10.41 | | | $ | 10.53 | | | $ | 10.08 | | | $ | 10.44 | | | $ | 10.63 | | |
| Total return (b)(c) | | | 1.29 | % | | | 7.12 | % | | | (0.49 | )% | | | 1.20 | % | | | 3.68 | % | |
| Ratios to Average Net Assets/Supplemental Data: | |
| Net expenses before interest expense (d) | | | 1.55 | % | | | 1.54 | % | | | 1.50 | % | | | 1.50 | % | | | 1.50 | % | |
| Interest expense | | | — | | | | — | | | | — | | | | — | | | | — | %(e) | |
| Net expenses (d) | | | 1.55 | % | | | 1.54 | % | | | 1.50 | % | | | 1.50 | % | | | 1.50 | % | |
| Waiver/Reimbursement | | | 0.17 | % | | | 0.15 | % | | | 0.15 | % | | | 0.16 | % | | | 0.17 | % | |
| Net investment income (d) | | | 2.42 | % | | | 2.49 | % | | | 3.02 | % | | | 2.99 | % | | | 3.06 | % | |
| Portfolio turnover rate | | | 11 | % | | | 23 | % | | | 11 | % | | | 8 | % | | | 20 | % | |
| Net assets, end of period (000s) | | $ | 3,705 | | | $ | 3,269 | | | $ | 2,143 | | | $ | 1,597 | | | $ | 1,767 | | |
(a) Per share data was calculated using the average shares outstanding during the period.
(b) Total return at net asset value assuming all distributions reinvested and no contingent deferred sales charge.
(c) Had the Investment Manager and/or any of its affiliates not waived fees or reimbursed a portion of expenses, total return would have been reduced.
(d) The benefits derived from expense reductions had an impact of less than 0.01%.
(e) Rounds to less than 0.01%.
See Accompanying Notes to Financial Statements.
20
Financial Highlights – Columbia Maryland Intermediate Municipal Bond Fund
Selected data for a share outstanding throughout each period is as follows:
| | | Year Ended March 31, | |
| Class Z Shares | | 2011 | | 2010 | | 2009 | | 2008 | | 2007 | |
| Net Asset Value, Beginning of Period | | $ | 10.53 | | | $ | 10.09 | | | $ | 10.44 | | | $ | 10.63 | | | $ | 10.57 | | |
| Income from Investment Operations: | |
| Net investment income (a) | | | 0.36 | | | | 0.37 | | | | 0.41 | | | | 0.42 | | | | 0.43 | | |
Net realized and unrealized gain (loss) on investments
and futures contracts | | | (0.11 | ) | | | 0.44 | | | | (0.35 | ) | | | (0.19 | ) | | | 0.06 | | |
| Total from investment operations | | | 0.25 | | | | 0.81 | | | | 0.06 | | | | 0.23 | | | | 0.49 | | |
| Less Distributions to Shareholders: | |
| From net investment income | | | (0.37 | ) | | | (0.37 | ) | | | (0.41 | ) | | | (0.42 | ) | | | (0.43 | ) | |
| Net Asset Value, End of Period | | $ | 10.41 | | | $ | 10.53 | | | $ | 10.09 | | | $ | 10.44 | | | $ | 10.63 | | |
| Total return (b)(c) | | | 2.31 | % | | | 8.09 | % | | | 0.61 | % | | | 2.21 | % | | | 4.72 | % | |
| Ratios to Average Net Assets/Supplemental Data: | |
| Net expenses before interest expense (d) | | | 0.55 | % | | | 0.54 | % | | | 0.50 | % | | | 0.50 | % | | | 0.50 | % | |
| Interest expense | | | — | | | | — | | | | — | | | | — | | | | — | %(e) | |
| Net expenses (d) | | | 0.55 | % | | | 0.54 | % | | | 0.50 | % | | | 0.50 | % | | | 0.50 | % | |
| Waiver/Reimbursement | | | 0.17 | % | | | 0.15 | % | | | 0.15 | % | | | 0.16 | % | | | 0.17 | % | |
| Net investment income (d) | | | 3.43 | % | | | 3.52 | % | | | 4.01 | % | | | 3.99 | % | | | 4.06 | % | |
| Portfolio turnover rate | | | 11 | % | | | 23 | % | | | 11 | % | | | 8 | % | | | 20 | % | |
| Net assets, end of period (000s) | | $ | 103,031 | | | $ | 131,234 | | | $ | 126,661 | | | $ | 135,506 | | | $ | 141,094 | | |
(a) Per share data was calculated using the average shares outstanding during the period.
(b) Total return at net asset value assuming all distributions reinvested.
(c) Had the Investment Manager and/or any of its affiliates not waived fees or reimbursed a portion of expenses, total return would have been reduced.
(d) The benefits derived from expense reductions had an impact of less than 0.01%.
(e) Rounds to less than 0.01%.
See Accompanying Notes to Financial Statements.
21
Notes to Financial Statements – Columbia Maryland Intermediate Municipal Bond Fund
March 31, 2011
Note 1. Organization
Columbia Maryland Intermediate Municipal Bond Fund (the Fund), a series of Columbia Funds Series Trust (the Trust), is a non-diversified fund. The Trust is registered under the Investment Company Act of 1940, as amended (the 1940 Act), as an open-end management investment company organized as a Delaware statutory trust.
After the close of business on April 30, 2010, Ameriprise Financial, Inc. (Ameriprise Financial) acquired a portion of the asset management business of Columbia Management Group, LLC (the Transaction), including the business of managing the Fund. In connection with the closing of the Transaction (the Closing), RiverSource Investments, LLC, a wholly owned subsidiary of Ameriprise Financial, became the investment manager of the Fund and changed its name to Columbia Management Investment Advisers, LLC (the Investment Manager).
Investment Objective
The Fund seeks current income exempt from U.S. federal income tax and Maryland individual income tax, consistent with moderate fluctuation of principal.
Fund Shares
The Trust has unlimited authorized shares of beneficial interest. The Fund offers Class A, Class B, Class C and Class Z shares. All share classes have identical voting, dividend and liquidation rights. Each share class has its own expense structure and sales charges, as applicable.
Class A shares are subject to a maximum front-end sales charge of 3.25% based on the initial investment amount. Class A shares purchased without an initial sales charge in accounts aggregating $1 million to $50 million at the time of purchase are subject to a 1.00% contingent deferred sales charge (CDSC) if the shares are sold within 18 months of purchase, charged as follows: 1.00% CDSC if redeemed within 12 months of purchase, and 0.50% CDSC if redeemed more than 12, but less than 18 months after purchase.
The Fund no longer accepts investments by new or existing investors in the Fund's Class B shares, except in connection with the reinvestment of any dividend and/or capital gain distributions in Class B shares of the Fund and exchanges by existing Class B shareholders of other funds within the Columbia Family of Funds. Class B shares are subject to a maximum CDSC of 3.00% based upon the holding period after purchase. Class B shares will generally convert to Class A shares eight years after purchase.
Class C shares are subject to a 1.00% CDSC on shares redeemed within one year of purchase.
Class Z shares are not subject to sales charges and are available only to certain investors, as described in the Fund's prospectus.
Note 2. Summary of Significant Accounting Policies
The preparation of financial statements in accordance with U.S. generally accepted accounting principles (GAAP) requires management to make certain estimates and assumptions that affect the reported amounts of assets and liabilities, the disclosure of contingent assets and liabilities at the date of the financial statements and the reported amounts of revenue and expenses during the reporting period. Actual results could differ from those estimates.
The following is a summary of significant accounting policies consistently followed by the Fund in the preparation of its financial statements.
Security Valuation
Debt securities generally are valued by pricing services approved by the Trust's Board of Trustees, based upon market transactions for normal, institutional-size trading units of similar securities. The services may use various pricing techniques which take into account appropriate factors such as yield, quality, coupon rate, maturity, type of issue, trading characteristics and other data, as well as broker quotes. Debt securities for which quotations are readily available may also be valued based upon an over-the-counter or exchange bid quotation.
Investments in other open-end investment companies are valued at net asset value.
Investments for which market quotations are not readily available, or that have quotations which the Investment Manager believes are not reliable, are valued at fair value as determined in good faith under consistently applied procedures established by and under the general supervision of the Board of Trustees. If a security is valued at fair value, such value is likely to be different from the last quoted market price for the security. The determination of fair value often requires significant judgment. To determine fair value, the Investment Manager may use assumptions including but not limited to future cash flows and estimated risk premiums. Multiple inputs from various sources may be used to determine value.
22
Columbia Maryland Intermediate Municipal Bond Fund, March 31, 2011
Security Transactions
Security transactions are accounted for on the trade date. Cost is determined and gains (losses) are based upon the specific identification method for both financial statement and federal income tax purposes.
Income Recognition
Interest income is recorded on the accrual basis. Market premium and discount are amortized and accreted, respectively, on all debt securities, unless otherwise noted. Original issue discount is accreted to interest income over the life of the security with a corresponding increase in the cost basis, if any.
Dividend income is recorded on the ex-date.
Expenses
General expenses of the Trust are allocated to the Fund and other series of the Trust based upon relative net assets or other expense allocation methodologies determined by the nature of the expense. Expenses directly attributable to a specific class of shares are charged to that share class. Expenses directly attributable to the Fund are charged to the Fund.
Determination of Class Net Asset Value
All income, expenses (other than class-specific expenses which are charged directly to a share class, as shown in the Statement of Operations) and realized and unrealized gains (losses) are allocated to each class of the Fund on a daily basis for purposes of determining the net asset value of each class. Income and expenses are allocated to each class based on the settled shares method, while realized and unrealized gains (losses) are allocated based on the relative net assets of each class.
Federal Income Tax Status
The Fund intends to qualify each year as a regulated investment company under Subchapter M of the Internal Revenue Code, as amended, and will distribute substantially all of its tax exempt or taxable income, if any, for its tax year, and as such will not be subject to federal income taxes. In addition, the Fund intends to distribute in each calendar year substantially all of its net investment income, capital gains and certain other amounts, if any, such that the Fund should not be subject to federal excise tax. Therefore, no federal income or excise tax provision is recorded.
Distributions to Shareholders
Distributions from net investment income are declared daily and paid monthly. Net realized capital gains, if any, are distributed at least annually. Income distributions and capital gain distributions are determined in accordance with federal income tax regulations which may differ from GAAP.
Indemnifications
Under the Trust's organizational documents and, in some cases, by contract, its officers and directors are indemnified against certain liabilities arising out of the performance of their duties to the Fund. In addition, certain of the Fund's contracts with its service providers contain general indemnification clauses. The Fund's maximum exposure under these arrangements is unknown since the amount of any future claims that may be made against the Fund cannot be determined and the Fund has no historical basis for predicting the likelihood of any such claims.
Note 3. Fees and Compensation Paid to Affiliates
Investment Management Fee
Under an Investment Management Services Agreement (IMSA), the Investment Manager determines which securities will be purchased, held or sold. The management fee is equal to a percentage of the Fund's average daily net assets that declines from 0.40% to 0.27% as the Fund's net assets increase.
Prior to the Closing, Columbia Management Advisors, LLC (Columbia), an indirect, wholly owned subsidiary of Bank of America Corporation (BOA), provided investment management services to the Fund under the same fee structure. The effective management fee rate for the year ended March 31, 2011, was 0.40% of the Fund's average daily net assets.
Administration Fee
Effective upon the Closing, the Investment Manager provides administration and accounting services to the Fund under an Administrative Services Agreement, including services previously performed under the Pricing and Bookkeeping Oversight and Services Agreement (the Services Agreement) as discussed in the Pricing and Bookkeeping Fees note below. The Fund pays an annual administration fee equal to 0.15% of the Fund's average daily net assets less the fees payable by the Fund as described under the Pricing and Bookkeeping Fees note below. Prior to the Closing, Columbia provided administrative services to the Fund at the same fee rates.
23
Columbia Maryland Intermediate Municipal Bond Fund, March 31, 2011
Pricing and Bookkeeping Fees
Prior to the Closing, the Fund entered into a Financial Reporting Services Agreement (the Financial Reporting Services Agreement) with State Street Bank and Trust Company (State Street) and Columbia pursuant to which State Street provides financial reporting services to the Fund. The Fund also entered into an Accounting Services Agreement (collectively with the Financial Reporting Services Agreement, the State Street Agreements) with State Street and Columbia pursuant to which State Street provides accounting services to the Fund. Upon the Closing, Columbia assigned and delegated its rights and obligations under the State Street Agreements to the Investment Manager. Under the State Street Agreements, the Fund pays State Street an annual fee of $38,000 paid monthly plus an additional monthly fee based on an annualized percentage rate of average daily net assets of the Fund for the month. The aggregate fee will not exceed $140,000 per year (exclusive of out-of-pocket expenses and charges). The Fund also reimburses State Street for certain out-of-pocket expenses and charges.
Also prior to the Closing, the Fund entered into the Services Agreement with Columbia. Under the Services Agreement, Columbia provided services related to Fund expenses and the requirements of the Sarbanes-Oxley Act of 2002, and provided oversight of the accounting and financial reporting services provided by State Street. Under the Services Agreement, the Fund reimbursed Columbia for out-of-pocket expenses and charges, including fees payable to third parties, such as for pricing the Fund's portfolio securities, incurred by Columbia in the performance of services under the Services Agreement. The Services Agreement was terminated upon the Closing. These services are now provided under the Administrative Services Agreement discussed above.
Transfer Agent Fee
In connection with the Closing, RiverSource Service Corporation, a wholly owned subsidiary of Ameriprise Financial, provides transfer agency services to the Fund under a Transfer Agency Agreement and changed its name to Columbia Management Investment Services Corp. (the Transfer Agent). The Transfer Agent has contracted with Boston Financial Data Services (BFDS) to serve as sub-transfer agent.
The Transfer Agent receives monthly account-based service fees based on the number of open accounts and is reimbursed by the Fund for the fees and expenses the Transfer Agent pays to financial intermediaries that maintain omnibus accounts with the Fund that is a percentage of the average aggregate value of the Fund's shares maintained in each such omnibus account (other than omnibus accounts for which American Enterprise Investment Services Inc. is the broker of record or accounts where the beneficial shareholder is a customer of Ameriprise Financial Services, Inc., which are paid a per account fee). The Transfer Agent pays the fees of BFDS for services as sub-transfer agent and is not entitled to reimbursement for such fees from the Fund (with the exception of out-of pocket fees). The Transfer Agent also receives compensation from fees for various shareholder services and reimbursements for certain out-of -pocket expenses.
Prior to the Closing, Columbia Management Services, Inc., an affiliate of Columbia and an indirect, wholly owned subsidiary of BOA, provided transfer agency services to the Fund and contracted with BFDS to serve as sub-transfer agent, under the same fee structure.
For the year ended March 31, 2011, the Fund's effective transfer agent fee rate for each class was 0.06% of the Fund's average daily net assets.
An annual minimum account balance fee of $20 may apply to certain accounts with a value below the Fund's initial minimum investment requirements to reduce the impact of small accounts on transfer agent fees. These minimum account balance fees are recorded as part of expense reductions on the Statement of Operations. For the year ended March 31, 2011, no minimum account balance fees were charged by the Fund.
Underwriting Discounts, Service and Distribution Fees
In connection with the Closing, RiverSource Fund Distributors, Inc., an indirect wholly owned subsidiary of Ameriprise Financial, provides distribution and shareholder services to the Fund and changed its name to Columbia Management Investment Distributors, Inc. (the Distributor). Pursuant to Rule 12b-1 under the 1940 Act, the Board of Trustees has approved, and the Fund has adopted, distribution and shareholder service plans (the Plans) which set the distribution and service fees for the Fund. These fees are calculated daily and are intended to compensate the Distributor and/or eligible selling and/or servicing agents for selling shares of the Fund and providing services to investors.
The Plans require the payment of a combined distribution and shareholder servicing fee for the Class A shares of the Fund. The Plans also require the payment of a monthly shareholder servicing fee and distribution fee for the Class B and Class C shares of the Fund. A substantial portion of the expenses incurred pursuant to these plans is paid to affiliates of the Distributor. The annual rates in
24
Columbia Maryland Intermediate Municipal Bond Fund, March 31, 2011
effect and plan limits, as a percentage of average daily net assets, are as follows:
| | | Current
Rate | | Plan
Limit | |
Class A Combined Distribution and
Shareholder Servicing Plan | | | 0.25 | % | | | 0.25 | % | |
Class B and Class C Shareholder
Servicing Plans | | | 0.25 | % | | | 0.25 | % | |
Class B and Class C
Distribution Plans | | | 0.75 | % | | | 0.75 | % | |
Prior to the Closing, Columbia Management Distributors, Inc., an affiliate of Columbia and an indirect, wholly owned subsidiary of BOA, was the principal underwriter of the Fund's shares. There were no changes to the underwriting discount structure of the Fund or the service or distribution fee rates paid by the Fund as a result of the Transaction.
Sales Charges
Sales charges, including front-end and CDSC's, received by the Distributor for distributing Fund shares were $2,973 for Class A, $1,999 for Class B and $437 for Class C shares for the year ended March 31, 2011.
Fee Waivers and Expense Reimbursements
The Investment Manager has voluntarily agreed to bear a portion of the Fund's expenses so that the Fund's ordinary operating expenses (excluding any distribution and service fees, brokerage commissions, interest, taxes and extraordinary expenses, but including custodian charges relating to overdrafts, if any), after giving effect to any balance credits from the Fund's custodian, do not exceed 0.55% of the Fund's average daily net assets on an annualized basis. The Investment Manager, in its discretion, may revise or discontinue this arrangement at any time. Prior to May 1, 2010, Columbia voluntarily reimbursed a portion of the Fund's expenses in the same manner.
The Investment Manager is entitled to recover from the Fund any fees waived and/or expenses reimbursed for a three year period following the date of such fee waiver and/or reimbursement under these arrangements if such recovery does not cause the Fund's expenses to exceed the expense limitations in effect at the time of recovery. Prior to May 1, 2010, Columbia was entitled to recover fees waived and/or expenses reimbursed from the Fund in the same manner.
At March 31, 2011, the amounts potentially recoverable pursuant to this arrangement were as follows:
| Amount of potential recovery expiring March 31, | | Total
potential | | Amount
expired | | Amount recovered
during the year | |
| 2014 | | 2013 | | 2012 | | recovery | | 3/31/11 | | ended 3/31/11 | |
| $ | 264,133 | | | $ | 249,129 | | | $ | 239,429 | | | $ | 752,691 | | | $ | 267,402 | | | $ | — | | |
Effective May 1, 2011, the Investment Manager has eliminated the fee recoupment provisions detailed above.
Fees Paid to Officers and Trustees
In connection with the Closing, all officers of the Fund are employees of the Investment Manager or its affiliates and, with the exception of the Fund's Chief Compliance Officer, receive no compensation from the Fund. The Board of Trustees has appointed a Chief Compliance Officer to the Fund in accordance with federal securities regulations. The Fund, along with other affiliated funds, pays its pro-rata share of the expenses associated with the Chief Compliance Officer. The Fund's expenses for the Chief Compliance Officer will not exceed $15,000 per year. Prior to the Closing, all officers of the Fund were employees of Columbia or its affiliates and the Fund paid its pro-rata share of the expenses for the Chief Compliance Officer under the same fee structure.
Trustees are compensated for their services to the Fund, as set forth on the Statement of Operations. The Trust's eligible Trustees may participate in a non-qualified deferred compensation plan which may be terminated at any time. Any payments to plan participants are paid solely out of the Fund's assets. Income earned on the plan participant's deferral account is based on the rate of return of the eligible mutual funds selected by the participant or, if no funds are selected, on the rate of return of Columbia Money Market Fund (formerly known as RiverSource Cash Management Fund). Prior to the Closing, if no funds were selected, income earned on the plan
25
Columbia Maryland Intermediate Municipal Bond Fund, March 31, 2011
participant's deferral account was based on the rate of return of BofA Treasury Reserves. Trustees' fees deferred during the current period as well as any gains or losses on the trustees' deferred compensation balances as a result of market fluctuations are included in "Trustees' fees" on the Statement of Operations. Liabilities under the deferred compensation plan are included in "Trustees' fees" on the Statement of Assets and Liabilities.
Other
Prior to the Closing, the Fund made daily investments of cash balances in BofA Tax-Exempt Reserves, formerly an affiliated open-ended investment company of Columbia, pursuant to an exemptive order received from the Securities and Exchange Commission. The income earned prior to the Closing by the Fund from such investments is included as Dividends from affiliates on the Statement of Operations. As an investing Fund, the Fund was indirectly allocated its proportionate share of the expenses of BofA Tax-Exempt Reserves.
Note 4. Custody Credits
The Fund has an agreement with its custodian bank under which custody fees may be reduced by balance credits. These credits are recorded as part of expense reductions on the Statement of Operations. The Fund could have invested a portion of the assets utilized in connection with the expense offset arrangement in an income-producing asset if it had not entered into such an agreement. For the year ended March 31, 2011, these custody credits reduced total expenses by $3 for the Fund.
Note 5. Portfolio Information
The cost of purchases and proceeds from sales of securities, excluding short-term obligations, aggregated $16,401,008 and $44,271,593, respectively, for the year ended March 31, 2011.
Note 6. Shareholder Concentration
As of March 31, 2011, two shareholder accounts owned 88.9% of the outstanding shares of the Fund. Purchase and redemption activity of these accounts may have a significant effect on the operations of the Fund.
Note 7. Line of Credit
Prior to March 28, 2011, the Fund and other affiliated funds participated in a $280,000,000 committed, unsecured revolving line of credit provided by State Street. Effective March 28, 2011, the commitment was reduced to $225,000,000. The maximum amount that may be borrowed by any fund is limited to the lesser of $200,000,000 and the Fund's borrowing limit set forth in the Fund's registration statement. Borrowings are available for short-term liquidity or temporary or emergency purposes.
Effective October 14, 2010, interest is charged to each participating fund based on the fund's borrowings at a rate per annum equal to the greater of the Federal Funds Rate plus 1.25% or the overnight LIBOR Rate plus 1.25%. In addition, a commitment fee of 0.125% per annum is accrued and apportioned among the participating funds pro rata based on their relative net assets.
Prior to October 14, 2010, interest was charged to each participating fund at the same rates. In addition, a commitment fee of 0.15% per annum was accrued and apportioned among the participating funds pro rata based on their relative net assets.
For the year ended March 31, 2011, the Fund did not borrow under these arrangements.
Note 8. Federal Tax Information
The timing and character of income and capital gain distributions are determined in accordance with income tax regulations, which may differ from GAAP. Reclassifications are made to the Fund's capital accounts for permanent tax differences to reflect income and gains available for distribution (or available capital loss carryforwards) under income tax regulations.
For the year ended March 31, 2011, permanent book and tax basis differences resulting primarily from differing treatments for market discount adjustments and expired capital loss carryforwards were identified and reclassified among the components of the Fund's net assets as follows:
Undistributed
Net Investment
Income | | Accumulated
Net Realized
Loss | | Paid-In Capital | |
| $ | (57,909 | ) | | $ | 218,785 | | | $ | (160,876 | ) | |
Net investment income and net realized gains (losses), as disclosed on the Statement of Operations, and net assets were not affected by this reclassification.
26
Columbia Maryland Intermediate Municipal Bond Fund, March 31, 2011
The tax character of distributions paid during the years ended March 31, 2011 and March 31, 2010 was as follows:
| | | March 31, | |
| Distributions paid from: | | 2011 | | 2010 | |
| Tax-Exempt Income | | $ | 5,135,836 | | | $ | 5,494,650 | | |
| Ordinary Income* | | | 22,184 | | | | 106,849 | | |
* For tax purposes short-term capital gain distributions, if any, are considered ordinary income distributions.
As of March 31, 2011, the components of distributable earnings on a tax basis were as follows:
Undistributed
Ordinary
Income | | Undistributed
Long-Term
Capital Gains | | Net Unrealized
Appreciation* | |
| $ | 380,549 | | | $ | — | | | $ | 2,962,544 | | |
* The differences between book-basis and tax-basis net unrealized appreciation are primarily due to market discount accretion on debt securities.
Unrealized appreciation and depreciation at March 31, 2011, based on cost of investments for federal income tax purposes were:
| Unrealized appreciation | | $ | 4,794,809 | | |
| Unrealized depreciation | | | (1,832,265 | ) | |
| Net unrealized appreciation | | $ | 2,962,544 | | |
The following capital loss carryforwards may be available to reduce taxable income arising from future net realized gains on investments, if any, to the extent permitted by the Internal Revenue Code:
| Year of Expiration | | | Capital Loss
Carryforwards | | |
| 2013 | | $ | 828,332 | | |
| 2014 | | | 901,428 | | |
| 2015 | | | 271,557 | | |
| 2017 | | | 511 | | |
| 2018 | | | 2,323,465 | | |
| Total | | $ | 4,325,293 | | |
Capital loss carryforwards of $260,911 were utilized and capital loss carryforwards of $160,876 expired during the year ended March 31, 2011. Expired capital loss carryforwards are recorded as a reduction of paid in capital.
Management of the Fund has concluded that there are no significant uncertain tax positions that would require recognition in the financial statements. However, management's conclusion may be subject to review and adjustment at a later date based on factors including, but not limited to, new tax laws, regulations, and administrative interpretations (including relevant court decisions). The Fund's federal tax returns for the prior three fiscal years remain subject to examination by the Internal Revenue Service.
Note 9. Significant Risks and Contingencies
Sector Focus Risk
The Fund may focus its investments in certain sectors, subjecting it to greater risk than a fund that is less focused.
Non-Diversified Risk
The Fund is a non-diversified fund, which generally means that it may invest a greater percentage of its total assets in the securities of fewer issuers than a "diversified" fund. This increases the risk that a change in the value of any one investment held by the Fund could affect the overall value of the Fund more than it would affect that of a diversified fund holding a greater number of investments. Accordingly, the Fund's value will likely be more volatile than the value of more diversified funds. The Fund may not operate as a non-diversified fund at all times.
Geographic Concentration Risk
Securities issued by a particular state and its instrumentalities are subject to the risk of unfavorable developments in such state. The value of Fund shares may be more volatile than the value of shares of funds that invest in municipal securities of issuers in more than one state, as unfavorable developments have the potential to impact more significantly the Fund than funds that invest in municipal securities of many different states. A municipal security can be significantly affected by adverse tax, legislative, demographic or political changes as well as changes in the state's financial or economic condition and prospects.
The Fund's municipal holdings may include obligations of issuers that rely in whole or in part for payment of interest and principal on state specific revenues, real property taxes, revenues from particular institutions, such as healthcare institutions, or obligations secured by mortgages on real property. Consequently, the impact of changes in state law or regulations or the economic conditions in a particular state should be considered. The ability of issuers of debt securities
27
Columbia Maryland Intermediate Municipal Bond Fund, March 31, 2011
held by the Fund to meet their obligations may be affected by economic developments in a specific industry or region.
Tax Development Risk
The Fund purchases municipal securities whose interest, in the opinion of bond counsel, is free from federal income tax. There is no assurance that the Internal Revenue Service (IRS) will agree with this opinion. In the event the IRS determines that an issuer does not comply with relevant tax requirements, interest payments from a security could become federally taxable, possibly retroactively to the date the security was issued. As a shareholder of the Fund, you may be required to file an amended tax return as a result.
Note 10. Subsequent Events
Management has evaluated the events and transactions that have occurred through the date the financial statements were issued. Other than as noted below, there were no items requiring adjustment of the financial statements or additional disclosure.
In August 2010, the Board of Trustees of the Trust approved an Agreement and Plan of Reorganization (the Agreement and Plan) to merge (the Reorganization) the Fund into Columbia Intermediate Municipal Bond Fund (the Acquiring Fund). Fund shareholders approved the Agreement and Plan providing for the Reorganization at a Joint Special Meeting of Shareholders held on February 15, 2011. After further consideration in light of changed circumstances, the Board of Trustees of the Trust and the Board of Trustees of Columbia Funds Series Trust I, of which the Acquiring Fund is a series, determined that the termination of the Agreement and Plan with respect to the Reorganization was in the best interests of shareholders of the Fund and shareholders of the Acquiring Fund, respectively, and pursuant to the terms of the Agreement and Plan mutually agreed to terminate the Agreement and Plan with respect to the Reorganization. As a result, the Reorganization will not occur.
Effective May 16, 2011, the line of credit commitment with State Street was reduced to $150,000,000, and the maximum amount that may be borrowed by any fund was limited to the lesser of $120,000,000 and the Fund's borrowing limit set forth in the Fund's registration statement.
Note 11. Information Regarding Pending and Settled Legal Proceedings
In June 2004, an action captioned John E. Gallus et al. v. American Express Financial Corp. and American Express Financial Advisors Inc. was filed in the United States District Court for the District of Arizona. The plaintiffs allege that they are investors in several American Express Company (now known as RiverSource) mutual funds and they purport to bring the action derivatively on behalf of those funds under the Investment Company Act of 1940. The plaintiffs allege that fees allegedly paid to the defendants by the funds for investment advisory and administrative services are excessive. The plaintiffs seek remedies including restitution and rescission of investment advisory and distribution agreements. The plaintiffs voluntarily agreed to transfer this case to the United States District Court for the District of Minnesota (the District Court). In response to defendants' motion to dismiss the complaint, the District Court dismissed one of plaintiffs' four claims and granted plaintiffs limited discovery. Defendants moved for summary judgment in April 2007. Summary judgment was granted in the defendants' favor on July 9, 2007. The plaintiffs filed a notice of appeal with the Eighth Circuit Court of Appeals (the Eighth Circuit) on August 8, 2007. On April 8, 2009, the Eighth Circuit reversed summary judgment and remanded to the District Court for further proceedings. On August 6, 2009, defendants filed a writ of certiorari with the U.S. Supreme Court (the Supreme Court), asking the Supreme Court to stay the District Court proceedings while the Supreme Court considers and rules in a case captioned Jones v. Harris Associates, which involves issues of law similar to those presented in the Gallus case. On March 30, 2010, the Supreme Court issued its ruling in Jones v. Harris Associates, and on April 5, 2010, the Supreme Court vacated the Eighth Circuit's decision in the Gallus case and remanded the case to the Eighth Circuit for further consideration in light of the Supreme Court's decision in Jones v. Harris Associates. On June 4, 2010, the Eighth Circuit remanded the Gallus case to the District Court for further consideration in light of the Supreme Court's decision in Jones v. Harris Associates. On December 9, 2010, the District Court reinstated its July 9, 2007 summary judgment order in favor of the defendants. On January 10, 2011, plaintiffs filed a notice of appeal with the Eighth Circuit.
In December 2005, without admitting or denying the allegations, American Express Financial Corporation (AEFC, which is now known as Ameriprise Financial, Inc. (Ameriprise Financial)), entered into settlement agreements with the Securities and Exchange Commission (SEC) and Minnesota Department of Commerce (MDOC) related to market timing activities. As a result, AEFC was censured and ordered to cease and desist from committing or causing any violations of certain provisions of the Investment Advisers Act of 1940, the Investment Company Act of 1940, and various Minnesota laws. AEFC agreed to pay disgorgement of $10 million and civil money penalties of $7 million. AEFC also agreed to retain
28
Columbia Maryland Intermediate Municipal Bond Fund, March 31, 2011
an independent distribution consultant to assist in developing a plan for distribution of all disgorgement and civil penalties ordered by the SEC in accordance with various undertakings detailed at http://www.sec.gov/litigation/admin/ia-2451.pdf. Ameriprise Financial and its affiliates have cooperated with the SEC and the MDOC in these legal proceedings, and have made regular reports to the funds' Boards of Directors/Trustees.
Ameriprise Financial and certain of its affiliates have historically been involved in a number of legal, arbitration and regulatory proceedings, including routine litigation, class actions, and governmental actions, concerning matters arising in connection with the conduct of their business activities. Ameriprise Financial believes that the Funds are not currently the subject of, and that neither Ameriprise Financial nor any of its affiliates are the subject of, any pending legal, arbitration or regulatory proceedings that are likely to have a material adverse effect on the Funds or the ability of Ameriprise Financial or its affiliates to perform under their contracts with the Funds. Ameriprise Financial is required to make 10-Q, 10-K and, as necessary, 8-K filings with the Securities and Exchange Commission on legal and regulatory matters that relate to Ameriprise Financial and its affiliates. Copies of these filings may be obtained by accessing the SEC website at www.sec.gov.
There can be no assurance that these matters, or the adverse publicity associated with them, will not result in increased fund redemptions, reduced sale of fund shares or other adverse consequences to the Funds. Further, although we believe proceedings are not likely to have a material adverse effect on the Funds or the ability of Ameriprise Financial or its affiliates to perform under their contracts with the Funds, these proceedings are subject to uncertainties and, as such, we are unable to estimate the possible loss or range of loss that may result. An adverse outcome in one or more of these proceedings could result in adverse judgments, settlements, fines, penalties or other relief that could have a material adverse effect on the consolidated financial condition or results of operations of Ameriprise Financial.
29
Report of Independent Registered Public Accounting Firm
To the Trustees of Columbia Funds Series Trust and the Shareholders of Columbia Maryland Intermediate Municipal Bond Fund
In our opinion, the accompanying statement of assets and liabilities, including the investment portfolio, and the related statements of operations and of changes in net assets and the financial highlights present fairly, in all material respects, the financial position of Columbia Maryland Intermediate Municipal Bond Fund (the "Fund") (a series of Columbia Funds Series Trust) at March 31, 2011, and the results of its operations for the year then ended, the changes in its net assets for each of the two years in the period then ended, and the financial highlights for each of the five years in the period then ended, in conformity with accounting principles generally accepted in the United States of America. These financial statements and financial highlights (hereafter referred to as "financial statements") are the responsibility of the Fund's management. Our responsibility is to express an opinion on these financial statements based on our audits. We conducted our audits of these financial statements in accordance with the standards of the Public Company Accounting Oversight Board (United States). Those standards require that we plan and perform the audit to obtain reasonable assurance about whether the financial statements are free of material misstatement. An audit includes examining, on a test basis, evidence supporting the amounts and disclosures in the financial statements, assessing the accounting principles used and significant estimates made by management, and evaluating the overall financial statement presentation. We believe that our audits, which included confirmation of securities at March 31, 2011 by correspondence with the custodian and brokers, provide a reasonable basis for our opinion.
PricewaterhouseCoopers LLP
Boston, Massachusetts
May 20, 2011
30
Federal Income Tax Information (Unaudited) – Columbia Maryland Intermediate Municipal Bond Fund
For the fiscal year ended March 31, 2011, 99.57% of the distributions from net investment income of the Fund qualifies as exempt interest dividends for federal income tax purposes. A portion of the income may be subject to federal alternative minimum tax.
The Fund will notify shareholders in January 2012 of amounts for use in preparing 2011 income tax returns.
31
Fund Governance
The Trustees serve terms of indefinite duration. The names, addresses and birth years of the Trustees and Officers of the Funds in the Columbia Funds Series Trust, the year each was first elected or appointed to office, their principal business occupations during at least the last five years, the number of Funds overseen by each Trustee and other directorships they hold are shown below. Each officer listed below serves as an officer of each Fund in the Columbia Funds Series Trust.
Independent Trustees
Name, Address and Year of Birth,
Position with Funds, Year First
Elected or Appointed to Office | | Principal Occupation(s) During Past Five Years, Number of Funds in the Columbia
Funds Complex Overseen by Trustee, Other Directorships Held
| |
| Edward J. Boudreau, Jr. (Born 1944) | |
|
c/o Columbia Management
Investment Advisers, LLC
225 Franklin Street
Boston, MA 02110
Trustee (since 2005) | | Managing Director—E.J. Boudreau & Associates (consulting), from 2000 through current; oversees 41; Trustee—BofA Funds Series Trust. | |
|
| William P. Carmichael (Born 1943) | |
|
c/o Columbia Management
Investment Advisers, LLC
225 Franklin Street
Boston, MA 02110
Trustee (since 1999) | | Retired; oversees 41; Director—Cobra Electronics Corporation (electronic equipment manufacturer); Director—McMoRan Exploration Company (oil and gas exploration and development); Director—The Finish Line (athletic shoes and apparel); Trustee—BofA Funds Series Trust. | |
|
| William A. Hawkins (Born 1942) | |
|
c/o Columbia Management
Investment Advisers, LLC
225 Franklin Street
Boston, MA 02110
Trustee (since 2005) | | Managing Director—Overton Partners (financial consulting), August 2010 to present; President and Chief Executive Officer—California General Bank, N.A., from January 2008 through August 2010; oversees 41; Trustee—BofA Funds Series Trust. | |
|
| R. Glenn Hilliard (Born 1943) | |
|
c/o Columbia Management
Investment Advisers, LLC
225 Franklin Street
Boston, MA 02110
Trustee (since 2005) | | Chairman and Chief Executive Officer—Hilliard Group LLC (investing and consulting), from April 2003 through current; oversees 41; Trustee—BofA Funds Series Trust. | |
|
| John J. Nagorniak (Born 1944) | |
|
c/o Columbia Management
Investment Advisers, LLC
225 Franklin Street
Boston, MA 02110
Trustee (since 2008) | | Retired; President and Director—Foxstone Financial, Inc. (consulting), 2000 through December 2007; Director—Mellon Financial Corporation affiliates (investing), 2000 through 2007; Chairman—Franklin Portfolio Associates (investing—Mellon affiliate), 1982 through 2007; oversees 41; Director—MIT Investment Company; Trustee—MIT 401k Plan; Trustee—Research Foundation of CFA Institute; Trustee—BofA Funds Series Trust. | |
|
32
Fund Governance (continued)
Independent Trustees (continued)
Name, Address and Year of Birth,
Position with Funds, Year First
Elected or Appointed to Office | | Principal Occupation(s) During Past Five Years, Number of Funds in the Columbia
Funds Complex Overseen by Trustee, Other Directorships Held
| |
| Minor M. Shaw (Born 1947) | |
|
c/o Columbia Management
Investment Advisers, LLC
225 Franklin Street
Boston, MA 02110
Trustee (since 2003) | | President—Micco Corporation and Mickel Investment Group; oversees 41; Board Member—Piedmont Natural Gas; Trustee—BofA Funds Series Trust. | |
|
Interested Trustee
| Anthony M. Santomero1 (Born 1946) | |
|
c/o Columbia Management
Investment Advisers, LLC
225 Franklin Street
Boston, MA 02110
Trustee (since 2008) | | Richard K. Mellon Professor Emeritus of Finance, The Wharton School, University of Pennsylvania, from 2002 through current; Senior Advisor—McKinsey & Company (consulting), July 2006 through January 2008; President and Chief Executive Officer—Federal Reserve Bank of Philadelphia, July 2000 through April 2006; oversees 41; Director—Renaissance Reinsurance Ltd; Trustee—Penn Mutual Life Insurance Company; Director—Citigroup, Inc.; Director—Citibank, N.A.; Trustee—BofA Funds Series Trust. | |
|
1 Dr. Santomero is currently deemed by the Columbia Funds to be an "interested person" (as defined in the 1940 Act) of the Funds because he serves as a Director of Citigroup, Inc. and Citibank, N.A., companies that may directly or through subsidiaries and affiliates engage from time-to-time in brokerage execution, principal transactions and lending relationships with the Columbia Funds or other funds or accounts advised/managed by Columbia Management Investment Advisers, LLC.
The Statement of Additional Information includes additional information about the Trustees of the Funds and is available, without charge, upon request by calling 800-345-6611.
Officers
| Name, Year of Birth and Address | | Principal Occupation(s) During the Past Five Years | |
| J. Kevin Connaughton (Born 1964) | |
|
225 Franklin Street
Boston, MA 02110
President (since 2009) | | Senior Vice President and General Manager—Mutual Fund Products, Columbia Management Investment Advisers, LLC since May 2010; President, Columbia Funds, since 2009, and RiverSource Funds, since May 2010 (previously Senior Vice President and Chief Financial Officer, Columbia Funds, from June 2008 to January 2009, Treasurer, Columbia Funds, from October 2003 to May 2008, and senior officer of various other affiliated funds since 2000); Managing Director, Columbia Management Advisors, LLC from December 2004 to April 2010. | |
|
| Michael G. Clarke (Born 1969) | |
|
225 Franklin Street
Boston, MA 02110
Treasurer (since 2011) and
Chief Financial Officer (since 2009) | | Vice President, Columbia Management Investment Advisers, LLC since May 2010; Managing Director of Fund Administration, Columbia Management Advisors, LLC, from September 2004 to April 2010; senior officer of Columbia Funds and affiliated funds since 2002. | |
|
33
Fund Governance (continued)
Officers (continued)
| Name, Year of Birth and Address | | Principal Occupation(s) During the Past Five Years | |
| Scott R. Plummer (Born 1959) | |
|
5228 Ameriprise Financial Center
Minneapolis, MN 55474
Senior Vice President and
Chief Legal Officer (since 2010) | | Chief Legal Officer and Assistant Secretary, Columbia Management Investment Advisers, LLC since June 2005; Vice President and Lead Chief Counsel—Asset Management, Ameriprise Financial, Inc. since May 2010 (previously Vice President and Chief Counsel—Asset Management, from 2005 to April 2010, and Vice President—Asset Management Compliance from 2004 to 2005); Vice President, Chief Counsel and Assistant Secretary, Columbia Management Investment Distributors, Inc. since 2008; Vice President, General Counsel and Secretary, Ameriprise Certificate Company since 2005; Chief Counsel, RiverSource Distributors, Inc. since 2006; Vice President, General Counsel and Secretary, RiverSource Funds, since December 2006; Senior Vice President, Secretary and Chief Legal Officer, Columbia Funds, since May 2010. | |
|
| Linda J. Wondrack (Born 1964) | |
|
225 Franklin Street
Boston, MA 02110
Senior Vice President and
Chief Compliance Officer (since 2007) | | Vice President and Chief Compliance Officer, Columbia Management Investment Advisers, LLC since May 2010; Chief Compliance Officer, Columbia Funds, since 2007, and RiverSource Funds, since May 2010; Director (Columbia Management Group, LLC and Investment Product Group Compliance), Bank of America, from June 2005 to April 2010. | |
|
| William F. Truscott (Born 1960) | |
|
53600 Ameriprise Financial Center
Minneapolis, MN 55474
Senior Vice President (since 2010) | | Chairman of the Board, Columbia Management Investment Advisers, LLC since May 2010 (previously President, Chairman of the Board and Chief Investment Officer, from 2001 to April 2010); Chief Executive Officer, U.S. Asset Management & President, Annuities, Ameriprise Financial, Inc. since May 2010 (previously President—U.S. Asset Management and Chief Investment Officer from 2005 to April 2010, and Senior Vice President—Chief Investment Officer, from 2001 to 2005); Director, President and Chief Executive Officer, Ameriprise Certificate Company since 2006; Director, Columbia Management Investment Distributors, Inc. since May 2010 (previously Chairman of the Board and Chief Executive Officer from 2008 to April 2010); Chairman of the Board and Chief Executive Officer, RiverSource Distributors, Inc. since 2006. | |
|
| Colin Moore (Born 1958) | |
|
225 Franklin Street
Boston, MA 02110
Senior Vice President (since 2010) | | Director and Chief Investment Officer, Columbia Management Investment Advisers, LLC since May 2010; Manager, Managing Director and Chief Investment Officer of Columbia Management Advisors, LLC from 2007 to April 2010; Head of Equities, Columbia Management Advisors, LLC from 2002 to 2007. | |
|
| Michael A. Jones (Born 1959) | |
|
225 Franklin Street
Boston, MA 02110
Senior Vice President (since 2010) | | President and Director, Columbia Management Investment Advisers, LLC since May 2010; President and Director, Columbia Management Investment Distributors, Inc. since May 2010; Manager, Chairman, Chief Executive Officer and President, Columbia Management Advisors, LLC from 2007 to April 2010; Chief Executive Officer, President and Director, Columbia Management Distributors, Inc. from November 2006 to April 2010; previously, co-president and senior managing director at Robeco Investment Management. | |
|
34
Fund Governance (continued)
Officers (continued)
| Name, Year of Birth and Address | | Principal Occupation(s) During the Past Five Years | |
| Christopher O. Petersen (Born 1970) | |
|
5228 Ameriprise Financial Center
Minneapolis, MN 55474
Vice President and
Secretary (since 2011) | | Vice President and Chief Counsel, Ameriprise Financial since January 2010 (formerly Vice President and Group Counsel or Counsel from April 2004 to January 2010); Assistant Secretary of RiverSource Funds since January 2007. | |
|
| Amy Johnson (Born 1965) | |
|
5228 Ameriprise Financial Center
Minneapolis, MN 55474
Vice President (since 2010) | | Senior Vice President and Chief Operating Officer, Columbia Management Investment Advisers, LLC since May 2010 (previously Chief Administrative Officer, from 2009 until April 2010, Vice President—Asset Management and Trust Company Services, from 2006 to 2009, and Vice President—Operations and Compliance from 2004 to 2006). | |
|
| Joseph F. DiMaria (Born 1968) | |
|
225 Franklin Street
Boston, MA 02110
Vice President (since 2011) and
Chief Accounting Officer (since 2008) | | Vice President, Mutual Fund Administration, Columbia Management Investment Advisers, LLC, since May 2010; Director of Fund Administration, Columbia Management Advisors, LLC from January 2006 to April 2010; Head of Tax/Compliance and Assistant Treasurer, Columbia Management Advisors, LLC, from November 2004 to December 2005. | |
|
| Paul B. Goucher (Born 1968) | |
|
5228 Ameriprise Financial Center
Minneapolis, MN 55474
Vice President and
Assistant Treasurer (since 2010) | | Vice President and Chief Counsel of Ameriprise Financial since January 2010 (formerly Vice President and Group Counsel from November 2008 to January 2010); Director, Managing Director and General Counsel of J. & W. Seligman & Co. Incorporated (Seligman) from July 2008 to November 2008 and Managing Director and Associate General Counsel of Seligman from January 2005 to July 2008. | |
|
| Michael E. DeFao (Born 1968) | |
|
5228 Ameriprise Financial Center
Minneapolis, MN 55474
Vice President and
Assistant Treasurer (since 2011) | | Vice President and Chief Counsel, Ameriprise Financial since May 2010; Associate General Counsel Bank of America from June 2005 to April 2010. | |
|
| Stephen T. Welsh (Born 1957) | |
|
225 Franklin Street
Boston, MA 02110
Vice President (since 2006) | | President and Director, Columbia Management Investment Services Corp. since May 2010; President and Director, Columbia Management Services, Inc. from July 2004 to April 2010; Managing Director, Columbia Management Distributors, Inc. from August 2007 to April 2010. | |
|
35
Shareholder Meeting Results
At a Joint Special Meeting of Shareholders held on February 15, 2011, shareholders of the Fund considered the proposals described below.
Proposal 1. Shareholders of the Fund approved an Agreement and Plan of Reorganization pursuant to which the Fund will transfer its assets to Columbia Intermediate Municipal Bond Fund (the "Buying Fund") in exchange for shares of the Buying Fund and the assumption by the Buying Fund of all of the liabilities of the Fund, as follows:
| Votes For | | Votes Against | | Abstentions | | Broker Non-Votes | |
| 10,933,445 | | | 85,082 | | | | 2,652 | | | | 735,935 | | |
Proposal 2. Shareholders of Columbia Funds Series Trust elected each of the nominees for trustees to the Board of Trustees of Columbia Funds Series Trust, each to hold office for an indefinite term, as follows:
| Trustee | | Votes For | | Votes Withheld | | Abstentions | |
| Kathleen Blatz | | | 2,145,636,122 | | | | 248,012,438 | | | | 0 | | |
| Edward J. Boudreau, Jr. | | | 2,145,430,114 | | | | 248,218,446 | | | | 0 | | |
| Pamela G. Carlton | | | 2,145,515,949 | | | | 248,132,612 | | | | 0 | | |
| William P. Carmichael | | | 2,145,038,695 | | | | 248,609,866 | | | | 0 | | |
| Patricia M. Flynn | | | 2,145,843,563 | | | | 247,804,997 | | | | 0 | | |
| William A. Hawkins | | | 2,145,359,401 | | | | 248,289,160 | | | | 0 | | |
| R. Glenn Hilliard | | | 2,145,079,400 | | | | 248,569,161 | | | | 0 | | |
| Stephen R. Lewis, Jr. | | | 2,145,092,209 | | | | 248,556,351 | | | | 0 | | |
| John F. Maher | | | 2,145,621,338 | | | | 248,027,223 | | | | 0 | | |
| John J. Nagorniak | | | 2,145,337,494 | | | | 248,311,067 | | | | 0 | | |
| Catherine James Paglia | | | 2,145,615,254 | | | | 248,033,306 | | | | 0 | | |
| Leroy C. Richie | | | 2,145,042,120 | | | | 248,606,441 | | | | 0 | | |
| Anthony M. Santomero | | | 2,145,088,174 | | | | 248,560,386 | | | | 0 | | |
| Minor M. Shaw | | | 2,145,430,762 | | | | 248,217,798 | | | | 0 | | |
| Alison Taunton-Rigby | | | 2,145,393,384 | | | | 248,255,177 | | | | 0 | | |
| William F. Truscott | | | 2,144,907,223 | | | | 248,741,338 | | | | 0 | | |
36
Important Information About This Report
The fund mails one shareholder report to each shareholder address. If you would like more than one report, please call shareholder services at 1-800-345-6611 and additional reports will be sent to you. This report has been prepared for shareholders of Columbia Maryland Intermediate Municipal Bond Fund.
A description of the policies and procedures that the fund uses to determine how to vote proxies and a copy of the fund's voting records are available (i) at www.columbiamanagement.com, (ii) on the Securities and Exchange Commission's website at www.sec.gov, and (iii) without charge, upon request, by calling 1-800-368-0346. Information regarding how the fund voted proxies relating to portfolio securities during the 12-month period ended June 30 is available from the SEC's website. Information regarding how the fund voted proxies relating to portfolio securities is also available from the fund's website, www.columbiamanagement.com.
The fund files a complete schedule of portfolio holdings with the SEC for the first and third quarters of each fiscal year on Form N-Q. The fund's Form N-Q is available on the SEC's website at www.sec.gov and may be reviewed and copied at the SEC's Public Reference Room in Washington, D.C. Information on the operation of the Public Reference Room may be obtained by calling 1-800-SEC-0330.
Transfer Agent
Columbia Management Investment
Services Corp.
P.O. Box 8081
Boston, MA 02266-8081
1-800-345-6611
Distributor
Columbia Management Investment
Distributors, Inc.
225 Franklin Street
Boston, MA 02110
Investment Manager
Columbia Management Investment Advisers, LLC
225 Franklin Street
Boston, MA 02110
37

PRSRT STD
U.S. Postage
PAID
Holliston, MA
Permit NO. 20
Columbia Maryland Intermediate Municipal Bond Fund
P. O. Box 8081
Boston, MA 02266-8081
columbiamanagement.com
This information is for use with concurrent or prior delivery of a fund prospectus. Investors should consider the investment objectives, risks, charges and expenses of a mutual fund carefully before investing. For a free prospectus, which contains this and other important information about the funds, visit columbiamanagement.com. Read the prospectus carefully before investing. The Fund is distributed by Columbia Management Investment Distributors, Inc., member FINRA, and managed by Columbia Management Investment Advisers, LLC.
© 2011 Columbia Management Investment Advisers, LLC. All rights reserved.
C-1091 A (05/11)

Columbia North Carolina Intermediate Municipal Bond Fund
Annual Report for the Period Ended March 31, 2011
Not FDIC insured • No bank guarantee • May lose value
Table of Contents
| Fund Profile | | | 1 | | |
|
| Economic Update | | | 2 | | |
|
| Performance Information | | | 4 | | |
|
| Understanding Your Expenses | | | 5 | | |
|
| Portfolio Manager's Report | | | 6 | | |
|
| Investment Portfolio | | | 8 | | |
|
Statement of Assets and
Liabilities | | | 14 | | |
|
| Statement of Operations | | | 15 | | |
|
Statement of Changes in
Net Assets | | | 16 | | |
|
| Financial Highlights | | | 18 | | |
|
| Notes to Financial Statements | | | 22 | | |
|
Report of Independent Registered
Public Accounting Firm | | | 30 | | |
|
| Fund Governance | | | 32 | | |
|
| Shareholder Meeting Results | | | 36 | | |
|
Important Information About
This Report | | | 37 | | |
|
The views expressed in this report reflect the current views of the respective parties. These views are not guarantees of future performance and involve certain risks, uncertainties and assumptions that are difficult to predict, so actual outcomes and results may differ significantly from the views expressed. These views are subject to change at any time based upon economic, market or other conditions and the respective parties disclaim any responsibility to update such views. These views may not be relied on as investment advice and, because investment decisions for a Columbia Fund are based on numerous factors, may not be relied on as an indication of trading intent on behalf of any particular Columbia Fund. References to specific securities should not be construed as a recommendation or investment advice.
President's Message

Dear Shareholder:
The Columbia Management story began over 100 years ago, and today, we are one of the nation's largest dedicated asset managers. The recent acquisition by Ameriprise Financial, Inc. brings together the talents, resources and capabilities of Columbia Management with those of RiverSource Investments, Threadneedle (acquired by Ameriprise in 2003) and Seligman Investments (acquired by Ameriprise in 2008) to build a best-in-class asset management business that we believe is truly greater than its parts.
RiverSource Investments traces its roots to 1894 when its then newly-founded predecessor, Investors Syndicate, offered a face-amount savings certificate that gave small investors the opportunity to build a safe and secure fund for retirement, education or other special needs. A mutual fund pioneer, Investors Syndicate launched Investors Mutual Fund in 1940. In the decades that followed, its mutual fund products and services lineup grew to include a full spectrum of styles and specialties. More than 110 years later, RiverSource continues to be a trusted financial products leader.
Threadneedle, a leader in global asset management and one of Europe's largest asset managers, offers sophisticated international experience from a dedicated U.K. management team. Headquartered in London, it is named for Threadneedle Street in the heart of the city's financial district, where British investors pioneered international and global investing. Threadneedle was acquired in 2003 and today operates as an affiliate of Columbia Management.
Seligman Investments' beginnings date back to the establishment of the investment firm J. & W. Seligman & Co. in 1864. In the years that followed, Seligman played a major role in the geographical expansion and industrial development of the United States. In 1874, President Ulysses S. Grant named Seligman as fiscal agent for the U.S. Navy—an appointment that would last through World War I. Seligman helped finance the westward path of the railroads and the building of the Panama Canal. The firm organized its first investment company in 1929 and began managing its first mutual fund in 1930. In 2008, J. & W. Seligman & Co. Incorporated was acquired and Seligman Investments became an offering brand of RiverSource Investments, LLC.
We are proud of the rich and distinctive history of these firms, the strength and breadth of products and services they offer, and the combined cultures of pioneering spirit and forward thinking. Together we are committed to providing more for our shareholders than ever before.
> A singular focus on our shareholders
Our business is asset management, so investors are our first priority. We dedicate our resources to identifying timely investment opportunities and provide a comprehensive choice of equity, fixed-income and alternative investments to help meet your individual needs.
> First-class research and thought leadership
We are dedicated to helping you take advantage of today's opportunities and anticipate tomorrow's. We stay abreast of the latest investment trends and ideas, using our collective insight to evaluate events and transform them into solutions you can use.
> A disciplined investment approach
We aren't distracted by passing fads. Our teams adhere to a rigorous investment process that helps ensure the integrity of our products and enables you and your financial advisor to match our solutions to your objectives with confidence.
When you choose Columbia Management, you can be confident that we will take the time to understand your needs and help you and your financial advisor identify the solutions that are right for you. Because at Columbia Management, we don't consider ourselves successful unless you are.
Sincerely,

J. Kevin Connaughton
President, Columbia Funds
Investors should consider the investment objectives, risks, charges and expenses of a mutual fund carefully before investing. For a free prospectus, which contains this and other important information about the funds, visit www.columbiamanagement.com. The prospectus should be read carefully before investing.
Columbia Funds are distributed by Columbia Management Investment Distributors, Inc., member FINRA, and managed by Columbia Management Investment Advisers, LLC.
© 2011 Columbia Management Investment Advisers, LLC. All rights reserved.
Fund Profile – Columbia North Carolina Intermediate Municipal Bond Fund
Summary
g For the 12-month period that ended March 31, 2011, the fund's Class A shares returned 2.61% without sales charge.
g The fund's return was modestly less than the return of its benchmark, the Barclays Capital 3-15 Year Blend Municipal Bond Index1, and higher than the average return of funds in its peer group, the Lipper Other States Intermediate Municipal Debt Funds Classification.2
g North Carolina's high credit quality translated into lower yields, hampering results versus the Barclays index, which is national in scope. However, sector allocations and strong issue selection in certain sectors aided results.
Portfolio Management
James M. D'Arcy has managed the fund since 2010. From 1999 until joining the Investment Manager in May 2010, Mr. D'Arcy was associated with the fund's previous investment adviser as an investment professional.
1The Barclays Capital 3-15 Year Blend Municipal Bond Index tracks the performance of municipal bonds issued after December 31, 1990 with remaining maturities between 2 and 17 years and at least $7 million in principal amount outstanding.
2Lipper Inc., a widely respected data provider in the industry, calculates an average total return (assuming reinvestment of distributions) for mutual funds with investment objectives similar to those of the fund. Lipper makes no adjustment for the effect of sales loads.
Indices are not available for investment, are not professionally managed and do not reflect sales charges, fees, brokerage commissions, taxes or other expenses of investing. Securities in the fund may not match those in an index.
Performance data quoted represents past performance and current performance may be lower or higher. Past performance is no guarantee of future results. The investment return and principal value will fluctuate so that shares, when redeemed, may be worth more or less than the original cost. Please visit www.columbiamanagement.com for daily and most recent month-end performance updates.
Summary
1-year return as of 03/31/11
| | +2.61% | |
|
 | | Class A shares
(without sales charge) | |
|
| | +2.91% | |
|
 | | Barclays Capital 3-15 Year
Blend Municipal Bond Index | |
|
1
Economic Update – Columbia North Carolina Intermediate Municipal Bond Fund
Summary
For the 12-month period that ended March 31, 2011
g Strengthening economic growth and rising interest rates kept a lid on most bond market sectors. The Barclays Capital Aggregate Bond Index delivered modest results. However, high-yield bonds were strong performers, as measured by the JPMorgan Developed BB High Yield Index.
Barclays
Aggregate Index | | JPMorgan
Index | |
|
 | |  | |
|
g The U.S. stock market, as measured by the S&P 500 Index, delivered solid returns, despite a summer 2010 correction. Foreign stock market returns were also positive, as measured by the MSCI EAFE Index (Net).
| S&P Index | | MSCI Index | |
|
 | |  | |
|
The U.S. economy continued to expand at a solid but uneven pace over the past 12 months, as measured by gross domestic product (GDP). Although lackluster second quarter 2010 GDP growth raised fears that the economy was losing steam and might lapse back into recession, the pace picked up in the third quarter of 2010, inspiring confidence among consumers, businesses and investors. GDP expanded by 2.6% in the third quarter and 3.1% in the fourth quarter. With the Federal Reserve Board (the Fed) providing additional monetary stimulus to shore up economic growth and the extension of key tax cuts for the next two years, expectations are for continued growth in 2011. However, early estimates of first quarter 2011 growth place it just under 2.0%, a disappointment after two strong quarters and a pick-up in employment.
Consumer spending on cars, clothing and other goods generally trended higher during the 12-month period, accelerating in the fourth quarter of 2010. Holiday spending rose 5.5% between November 5, 2010 and December 24, 2010, in all retail categories, excluding automobiles, compared with the same period in 2009, according to MasterCard Advisors' SpendingPulse, which tracks spending on all transactions including cash. Personal income surged in January 2011, as payroll tax cuts kicked in. The personal savings rate edged higher, ending February 2011, the last month for which data was available, at 5.8%.
News on the job front was increasingly positive. A good portion of the jobs added in March, April and May of 2010 were temporary, government-sponsored census positions, which began to unwind in June, July and August 2010. However, private sector payroll employment began to trend higher in the third quarter, massive layoffs declined and job growth turned solidly positive, with the addition of 444,000 new jobs in the first quarter of 2011.
Despite some glimmers of improvement early in 2010, the housing market remained troublesome throughout the period. Both new and existing home sales fell after a federal tax credit for new and repeat homebuyers expired. Distressed properties pressured prices and foreclosures continued—another drag on prices. The inventory of unsold homes ended the period higher than it started, at 8.9 and 8.6 months for new and existing homes, respectively, according to the National Association of Realtors and a joint release from the U.S. Census Bureau and the U.S. Department of Housing and Urban Development. The new year brought more disappointing news: Existing home sales fell in January 2011 after three months of sustained improvement. Tight credit and weak appraisals were cited as possible reasons for the decline.
Reports from the business side of the economy were generally positive. A key measure of the nation's manufacturing situation—the Institute for Supply Management's Index—took a somewhat surprising turn higher in the final months of the period. Technology spending rose 12% in 2010, according to the NPD Group, a national marketing research firm. Purchases of computers, networking and software returned to prerecession levels. Industrial production rose over the period, and manufacturing capacity utilized, per the report issued by the Fed—a key measure of the health of the manufacturing sector—also edged higher.
Bonds delivered modest returns
As the economy strengthened and interest rates edged higher, most bond sectors delivered modest returns. The Barclays Capital Aggregate Bond Index1 returned 5.12%. High-yield bonds led the fixed-income markets. For the 12 months covered by this report, the JPMorgan Developed BB High Yield Index2 returned 13.04% as default fears abated and investors grew
2
Economic Update (continued) – Columbia North Carolina Intermediate Municipal Bond Fund
more comfortable with risk. Despite rising yields in the second half of the period, the Treasury market was also positive. The Barclays Capital U.S. Treasury Index3 returned 4.53%. However, municipal bonds struggled in the second half of the period, as interest rates inched higher and issue supply surged ahead of the year-end expiration of the Build America Bonds program. The Barclays Capital Municipal Bond Index4 gained 1.63% for the period. Despite positive economic activity, the Fed kept a key short-term interest rate—the federal funds rate—close to zero, reflecting ongoing concerns about employment and the housing market.
Stocks moved higher despite summer 2010 decline
Against a strengthening economic backdrop, stock prices continued to rally despite a summer 2010 setback linked to a debt crisis brewing in Europe, which raised concerns among U.S. investors. These fears were short-lived and stocks regained their footing. In this environment, the S&P 500 Index5 returned 15.65% for the 12 months through March 31, 2011. Outside the United States, stock markets also delivered solid gains. The MSCI EAFE Index (Net),6 a broad gauge of stock market performance in foreign developed markets, returned 10.42% (in U.S. dollars) for the 12-month period, as concerns about the impact of a bailout for weak euro zone economies eased yet continued to restrain market performance. Emerging stock markets were strong. The MSCI Emerging Markets Index (Net)7 returned 18.46% (in U.S. dollars) for the 12-month period.
Past performance is no guarantee of future results.
1The Barclays Capital Aggregate Bond Index is a market value-weighted index that tracks the daily price, coupon, pay-downs and total return performance of fixed-rate, publicly placed, dollar-denominated and non-convertible investment grade debt issues with at least $250 million par amount outstanding and with at least one year to final maturity.
2The JPMorgan Developed BB High Yield Index is an unmanaged index designed to mirror the investable universe of the U.S. dollar developed, BB-rated, high yield corporate debt market.
3The Barclays Capital U.S. Treasury Index includes public obligations of the U.S. Treasury. Treasury bills are excluded by the maturity constraint. In addition, certain special issues, such as state and local government series bonds (SLGs), as well as U.S. Treasury TIPS, are excluded. STRIPS are excluded from the index because their inclusion would result in double-counting.
4The Barclays Capital Municipal Bond Index is considered representative of the broad market for investment-grade, tax-exempt bonds with a maturity of at least one year.
5The Standard & Poor's (S&P) 500 Index tracks the performance of 500 widely held, large-capitalization U.S. stocks.
6The Morgan Stanley Capital International Europe, Australasia, Far East (MSCI EAFE) Index (Net) is a free float- adjusted market capitalization index that is designed to measure the equity market performance of developed markets, excluding the U.S. & Canada. As of December 31, 2010, the MSCI EAFE Index (Net) consisted of the following 22 developed market country indices: Australia, Austria, Belgium, Denmark, Finland, France, Germany, Greece, Hong Kong, Ireland, Israel, Italy, Japan, the Netherlands, New Zealand, Norway, Portugal, Singapore, Spain, Sweden, Switzerland and the United Kingdom.
7The Morgan Stanley Capital International Emerging Markets (MSCI EM) Index (Net) is a free float-adjusted market capitalization index that is designed to measure equity market performance of emerging markets. As of December 31, 2010, the MSCI EM Index (Net) consisted of the following 21 emerging market country indices: Brazil, Chile, China, Colombia, Czech Republic, Egypt, Hungary, India, Indonesia, Korea, Malaysia, Mexico, Morocco, Peru, Philippines, Poland, Russia, South Africa, Taiwan, Thailand and Turkey.
Indices are not available for investment, are not professionally managed and do not reflect sales charges, fees, brokerage commissions, taxes or other expenses of investing. Securities in the fund may not match those in an index.
3
Performance Information – Columbia North Carolina Intermediate Municipal Bond Fund
Performance data quoted represents past performance and current performance may be lower or higher. Past performance is no guarantee of future results. The investment return and principal value will fluctuate so that shares, when redeemed, may be worth more or less than the original cost. Please visit www.columbiamanagement.com for daily and most recent month-end performance updates.
Performance of a $10,000 investment 04/01/01 – 03/31/11
The chart above shows the change in value of a hypothetical $10,000 investment in Class A shares of Columbia North Carolina Intermediate Municipal Bond Fund during the stated time period, and does not reflect the deduction of taxes that a shareholder may pay on fund distributions or on the redemption of fund shares.
Performance of a $10,000 investment 04/01/01 – 03/31/11 ($)
| Sales charge | | without | | with | |
| Class A | | | 13,996 | | | | 13,535 | | |
| Class B | | | 12,990 | | | | 12,990 | | |
| Class C | | | 12,981 | | | | 12,981 | | |
| Class Z | | | 14,336 | | | | n/a | | |
Average annual total return as of 03/31/11 (%)
| Share class | | A | | B | | C | | Z | |
| Inception | | 12/14/92 | | 06/07/93 | | 12/16/92 | | 12/11/92 | |
| Sales charge | | without | | with | | without | | with | | without | | with | | without | |
| 1-year | | | 2.61 | | | | –0.71 | | | | 1.85 | | | | –1.14 | | | | 1.84 | | | | 0.85 | | | | 2.76 | | |
| 5-year | | | 3.15 | | | | 2.47 | | | | 2.40 | | | | 2.40 | | | | 2.38 | | | | 2.38 | | | | 3.41 | | |
| 10-year | | | 3.42 | | | | 3.07 | | | | 2.65 | | | | 2.65 | | | | 2.64 | | | | 2.64 | | | | 3.67 | | |
The "with sales charge" returns include the maximum initial sales charge of 3.25% for Class A shares and the applicable contingent deferred sales charge of 3.00% in the first year, declining to 1.00% in the fourth year, and eliminated thereafter for Class B shares and 1.00% for Class C shares for the first year only. The "without sales charge" returns do not include the effect of sales charges. If they had, returns would be lower.
Performance results reflect any fee waivers or reimbursements of fund expenses by the Investment Manager and/or any of its affiliates. Absent these fee waivers or expense reimbursement arrangements, performance results would have been lower.
All results shown assume reinvestment of distributions. Class Z shares are sold at net asset value with no distribution and service (Rule 12b-1) fees. Class Z shares have limited eligibility and the investment minimum requirements may vary. Please see the fund's prospectuses for details. Performance for different share classes will vary based on differences in sales charges and fees associated with each class.
The tables do not reflect the deduction of taxes that a shareholder may pay on fund distributions or on the redemption of fund shares.
4
Understanding Your Expenses – Columbia North Carolina Intermediate Municipal Bond Fund
As a fund shareholder, you incur two types of costs. There are transaction costs, which generally include sales charges on purchases and may include redemption fees or exchange fees. There are also ongoing costs, which generally include investment advisory fees, distribution and service (Rule 12b-1) fees and other fund expenses. The information on this page is intended to help you understand the ongoing costs of investing in the fund and to compare these costs with the ongoing costs of investing in other mutual funds.
Analyzing your fund's expenses by share class
To illustrate these ongoing costs, we have provided an example and calculated the expenses paid by investors in each share class during the period. The information in the following table is based on an initial investment of $1,000, which is invested at the beginning of the period and held for the entire period. Expense information is calculated two ways and each method provides you with different information. The amount listed in the "Actual" column is calculated using the fund's actual operating expenses and total return for the period. The amount listed in the "Hypothetical" column for each share class assumes that the return each year is 5% before expenses and is calculated based on the fund's actual operating expenses. You should not use the hypothetical account values and expenses to estimate either your actual account balance at the end of the period or the expenses you paid during this period.
Compare with other funds
Since all mutual funds are required to include the same hypothetical calculations about expenses in shareholder reports, you can use this information to compare the ongoing cost of investing in the fund with other funds. To do so, compare the 5% hypothetical example with the 5% hypothetical examples that appear in the shareholder reports of other funds. As you compare hypothetical examples of other funds, it is important to note that hypothetical examples are meant to highlight the ongoing costs of investing in a fund and do not reflect any transaction costs, such as sales charges, redemption fees or exchange fees.
Estimating your actual expenses
To estimate the expenses that you paid over the period, first you will need your account balance at the end of the period:
g For shareholders who receive their account statements from Columbia Management Investment Services Corp., your account balance is available online at www.columbiamanagement.com or by calling Shareholder Services at 800.345.6611.
g For shareholders who receive their account statements from their financial intermediary, contact your financial intermediary to obtain your account balance.
1. Divide your ending account balance by $1,000. For example, if an account balance was $8,600 at the end of the period, the result would be 8.6.
2. In the section of the table below titled "Expenses paid during the period," locate the amount for your share class. You will find this number in the column labeled "Actual." Multiply this number by the result from step 1. Your answer is an estimate of the expenses you paid on your account during the period.
If the value of your account falls below the minimum initial investment requirement applicable to you, your account may be subject to a $20 annual fee. This fee is not included in the accompanying table. If you are subject to the fee, keep it in mind when you are estimating the ongoing expenses of investing in the fund and when comparing the expenses of this fund with other funds.
10/01/10 – 03/31/11
| | | Account value at the
beginning of the period ($) | | Account value at the
end of the period ($) | | Expenses paid
during the period ($) | | Fund's annualized
expense ratio (%) | |
| | | Actual | | Hypothetical | | Actual | | Hypothetical | | Actual | | Hypothetical | | Actual | |
| Class A | | | 1,000.00 | | | | 1,000.00 | | | | 973.90 | | | | 1,020.94 | | | | 3.94 | | | | 4.03 | | | | 0.80 | | |
| Class B | | | 1,000.00 | | | | 1,000.00 | | | | 970.20 | | | | 1,017.20 | | | | 7.61 | | | | 7.80 | | | | 1.55 | | |
| Class C | | | 1,000.00 | | | | 1,000.00 | | | | 970.20 | | | | 1,017.20 | | | | 7.61 | | | | 7.80 | | | | 1.55 | | |
| Class Z | | | 1,000.00 | | | | 1,000.00 | | | | 974.10 | | | | 1,022.19 | | | | 2.71 | | | | 2.77 | | | | 0.55 | | |
Expenses paid during the period are equal to the annualized expense ratio for the share class, multiplied by the average account value over the period, then multiplied by the number of days in the fund's most recent fiscal half-year and divided by 365.
Had the Investment Manager and/or any of its affiliates not waived fees or reimbursed a portion of expenses, account value at the end of the period would have been reduced.
It is important to note that the expense amounts shown in the table are meant to highlight only ongoing costs of investing in the fund and do not reflect any transaction costs, such as sales charges, redemption fees or exchange fees. Therefore, the hypothetical examples provided may not help you determine the relative total costs of owning shares of different funds. If these transaction costs were included, your costs would have been higher.
5
Portfolio Manager's Report – Columbia North Carolina Intermediate Municipal Bond Fund
Performance data quoted represents past performance and current performance may be lower or higher. Past performance is no guarantee of future results. The investment return and principal value will fluctuate so that shares, when redeemed, may be worth more or less than the original cost. Please visit www.columbiamanagement.com for daily and most recent month-end performance updates.
Net asset value per share
as of 03/31/11 ($)
| Class A | | | 10.13 | | |
| Class B | | | 10.13 | | |
| Class C | | | 10.13 | | |
| Class Z | | | 10.12 | | |
Distributions declared per share
04/01/10 – 03/31/11 ($)
| Class A | | | 0.31 | | |
| Class B | | | 0.23 | | |
| Class C | | | 0.23 | | |
| Class Z | | | 0.33 | | |
A portion of the fund's income may be subject to the alternative minimum tax. The fund may at times purchase tax-exempt securities at a discount. Some, or all, of this discount may be included in the fund's ordinary income, and is taxable when distributed.
30-day SEC yields
as of 03/31/11 (%)
| Class A | | | 2.35 | | |
| Class B | | | 1.70 | | |
| Class C | | | 1.67 | | |
| Class Z | | | 2.68 | | |
The 30-day SEC yields reflect the fund's earning power, net of expenses, expressed as an annualized percentage of the public offering price per share at the end of the period.
For the 12-month period that ended March 31, 2011, the fund's Class A shares returned 2.61% without sales charge. The fund's benchmark, the Barclays Capital 3-15 Year Blend Municipal Bond Index, returned 2.91%. The average return of funds in its peer group, the Lipper Other States Intermediate Municipal Debt Funds Classification, was 1.76%. The fund, which invests primarily in North Carolina bonds, lagged the Barclays index, which is national in scope, largely because the state's high credit quality resulted in lower yields relative to bonds from lower-rated states. However, sector allocation and strong issue selection in certain sectors aided results.
North Carolina kept high credit rating
Despite being hard hit by the financial crisis and a decline in manufacturing jobs, North Carolina maintained the highest (AAA) credit rating,1 allowing it to borrow at the lowest possible rates. North Carolina also benefited from positive migration trends, driven by the region's mild climate, low cost of living and highly-regarded university system. Efforts to attract new businesses to the state, particularly in technology, aided the recovery. In addition, Charlotte, one of the country's major banking centers, began to increase its presence as an energy hub, anchored by the recent announcement of a pending merger of two major energy companies.
A boost from positioning
The fund was well positioned to take advantage of slight changes in interest rates during the period. It had more exposure than the index to bonds with six- to eight-year maturities and eight- to 12-year maturities, two segments that posted solid returns in a period of overall modest returns. Of note were some local general obligation (GO) bonds with seven- and eight-year maturities that returned over 6%. An underweight relative to the index in issues with maturities of 12 to 17 years also aided results as these were weaker performers, especially in the fourth quarter of 2010, amid concerns related to the year-end expiration of the federally subsidized Build America Bonds (BABs) program. BABs offered qualifying issuers a less expensive means to finance infrastructure projects. Investors feared that once the BABs program disappeared, more longer-maturity municipal issues would come to market, pushing yields up and bond prices down.
Mixed results from sector allocations
Overweights in health care and in water and sewer revenue bonds, areas that turned in good performance, coupled with underweights in the weaker-performing industrial development/pollution control and transportation sectors, aided results.
Security selection also contributed positively, with some lower-rated continuing care retirement community (CCRC) bonds and education issues posting returns over 6%. However, a structural underweight in state general obligation (GO) bonds, relative to the Barclays index, detracted from relative performance. The fund's North Carolina focus meant that, unlike the benchmark, it did not own higher-yielding, lower-quality GOs from other states, such as California. A slightly above-average position in cash and short-term investments, both of which were low yielding, further hampered results. However, when the market was most volatile in the fourth quarter of 2010, these positions added stability to the portfolio.
1The credit quality ratings represent the lower of one of the following nationally recognized rating agencies: Standard & Poor's or Moody's Investor Services. If a security is rated by only one of the two agencies, that rating is used. If a security is not rated by either of the two agencies, it is designated as Non-Rated. Ratings are relative and subjective and are not absolute standards of quality. The credit quality of the fund's investments does not remove market risk.
6
Portfolio Manager's Report (continued) – Columbia North Carolina Intermediate Municipal Bond Fund
More defensive interest-rate positioning ahead
While North Carolina's economic recovery may be slow, we expect continued progress. As the economy improves, we think it will benefit municipal bond prices. In anticipation of the Federal Reserve Board's next short-term interest rate hike, we decreased the fund's sensitivity to interest rate changes, bringing it more in line with the benchmark's interest-rate positioning. The lower a bond's interest-rate sensitivity, the less its price is likely to fall as interest rates rise—or rise as interest rates fall. To position the fund for rising interest rates, we may further decrease interest-rate sensitivity by increasing exposure to shorter-maturity callable (redeemable) bonds—which typically outperform non-callable bonds of similar maturity as interest rates climb.
Portfolio characteristics and holdings are subject to change periodically and may not be representative of current characteristics and holdings. The outlook for the fund may differ from that presented for other Columbia Funds.
Tax-exempt investing offers current tax-exempt income, but it also involves special risks. The value of the fund will be affected by interest rate changes and the creditworthiness of issues held in the fund. When interest rates go up, bond prices generally drop and vice versa.
Interest income from certain tax-exempt bonds may be subject to certain state and local taxes and, if applicable, the alternative minimum tax. Capital gains are not exempt from income taxes.
Single-state municipal bond funds pose additional risks due to limited geographical diversification.
Taxable-equivalent SEC yields
as of 03/31/11 (%)
| Class A | | | 3.92 | | |
| Class B | | | 2.83 | | |
| Class C | | | 2.78 | | |
| Class Z | | | 4.47 | | |
Taxable-equivalent SEC yields are based on the combined maximum effective 35.0% federal income tax rate and applicable state income tax rate. This tax rate does not reflect the phase out of exemptions or the reduction of the otherwise allowable deductions that occur when adjusted gross income exceeds certain levels. Your taxable equivalent yield may be different depending on your tax bracket.
Top 5 Sectors
as of 03/31/11 (%)
| Tax-Backed | | | 36.9 | | |
| Utilities | | | 26.5 | | |
| Health Care | | | 11.5 | | |
| Other | | | 8.5 | | |
| Education | | | 7.0 | | |
Quality breakdown
as of 03/31/11 (%)
| AAA | | | 28.2 | | |
| AA | | | 48.5 | | |
| A | | | 13.6 | | |
| BBB | | | 7.3 | | |
| Non-Rated | | | 2.4 | | |
Maturity breakdown
as of 03/31/11 (%)
| 0-1 year | | | 0.8 | | |
| 1-3 years | | | 6.0 | | |
| 3-5 years | | | 6.7 | | |
| 5-7 years | | | 17.2 | | |
| 7-10 years | | | 28.3 | | |
| 10-15 years | | | 33.3 | | |
| 15-20 years | | | 2.6 | | |
| 20-25 years | | | 0.5 | | |
| Net Cash & Equivalents | | | 4.6 | | |
Ratings shown in the quality breakdown are assigned to individual bonds by taking the lower of the ratings available from one of the following nationally-recognized rating agencies: Standard & Poor's or Moody's Investor Services. If a security is rated by only one of the two agencies, that rating is used. If a security is not rated by either of the two agencies, it is designated as Non-Rated. Ratings are relative and subjective and are not absolute standards of quality. The credit quality of the fund's investments does not remove market risk.
The fund is actively managed and the composition of its portfolio will change over time. Information provided is calculated as a percentage of net assets.
7
Investment Portfolio – Columbia North Carolina Intermediate Municipal Bond Fund
March 31, 2011
| | | Par ($) | | Value ($) | |
| Education – 7.0% | |
| Education – 7.0% | |
| NC Appalachian State University | |
| Series 1998, | |
| Insured: NPFGC | |
| 5.000% 05/15/12 | | | 1,000,000 | | | | 1,047,770 | | |
| Series 2005, | |
| Insured: NPFGC | |
| 5.000% 07/15/21 | | | 1,485,000 | | | | 1,537,688 | | |
NC Board of Governors of the
University of North Carolina | |
| Series 2008 A, | |
| Insured: AGC | |
| 5.000% 10/01/22 | | | 2,000,000 | | | | 2,138,120 | | |
| Series 2009 B, | |
| 4.250% 10/01/17 | | | 1,000,000 | | | | 1,078,220 | | |
| Series 2009 C, | |
| 4.500% 10/01/17 | | | 1,525,000 | | | | 1,625,757 | | |
| Series 2010 C, | |
| Insured: AGC | |
| 5.000% 10/01/16 | | | 3,000,000 | | | | 3,406,260 | | |
| NC Capital Facilities Finance Agency | |
| Johnson & Wales University, | |
| Series 2003 A, | |
| Insured: SYNC | |
| 5.250% 04/01/21 | | | 1,000,000 | | | | 1,008,670 | | |
| Meredith College, | |
| Series 2008, | |
| 6.000% 06/01/31 | | | 1,000,000 | | | | 973,690 | | |
| Wake Forest University, | |
| Series 2009, | |
| 5.000% 01/01/26 | | | 1,000,000 | | | | 1,046,330 | | |
| Education Total | | | 13,862,505 | | |
| Education Total | | | 13,862,505 | | |
| Health Care – 11.5% | |
| Continuing Care Retirement – 0.5% | |
| NC Medical Care Commission | |
| Givens Estate, Inc., | |
| Series 2007, | |
| 5.000% 07/01/16 | | | 1,000,000 | | | | 1,038,710 | | |
| Continuing Care Retirement Total | | | 1,038,710 | | |
| Hospitals – 11.0% | |
| AZ University Medical Center Corp. | |
| Series 2004, | |
| 5.250% 07/01/13 | | | 750,000 | | | | 788,422 | | |
| | | Par ($) | | Value ($) | |
| NC Albemarle Hospital Authority | |
| Series 2007: | |
| 5.250% 10/01/21 | | | 2,000,000 | | | | 1,785,220 | | |
| 5.250% 10/01/27 | | | 1,000,000 | | | | 802,750 | | |
NC Charlotte Mecklenburg
Hospital Authority | |
| Carolinas Healthcare Foundation: | |
| Series 2007 A, | |
| Insured: AGMC | |
| 5.000% 01/15/20 | | | 1,550,000 | | | | 1,643,775 | | |
| Series 2008, | |
| 5.250% 01/15/24 | | | 2,000,000 | | | | 2,085,580 | | |
| Series 2009, | |
| 5.000% 01/15/21 | | | 1,000,000 | | | | 1,062,170 | | |
| NC Medical Care Commission | |
| Moses H. Cone Memorial Hospital, | |
| Series 2011, | |
| 5.000% 10/01/20 | | | 2,000,000 | | | | 2,129,120 | | |
| North Carolina Baptist Hospitals, | |
| Series 2010, | |
| 5.000% 06/01/17 | | | 1,500,000 | | | | 1,679,340 | | |
| Novant Health, Inc., | |
| Series 2003 A: | |
| 5.000% 11/01/13 | | | 3,000,000 | | | | 3,269,280 | | |
| 5.000% 11/01/17 | | | 2,000,000 | | | | 2,091,060 | | |
| Wilson Medical Center, | |
| Series 2007, | |
| 5.000% 11/01/19 | | | 3,385,000 | | | | 3,442,173 | | |
NC Northern Hospital
District of Surry County | |
| Series 2008, | |
| 5.750% 10/01/24 | | | 1,000,000 | | | | 987,090 | | |
| Hospitals Total | | | 21,765,980 | | |
| Health Care Total | | | 22,804,690 | | |
| Housing – 2.0% | |
| Single-Family – 2.0% | |
| NC Housing Finance Agency | |
| Series 1998 A-2, AMT, | |
| 5.200% 01/01/20 | | | 510,000 | | | | 510,204 | | |
| Series 1999 A-3, AMT, | |
| 5.150% 01/01/19 | | | 740,000 | | | | 740,281 | | |
| Series 1999 A-5, AMT, | |
| 5.550% 01/01/19 | | | 1,195,000 | | | | 1,227,420 | | |
| Series 1999 A-6, AMT, | |
| 6.000% 01/01/16 | | | 285,000 | | | | 285,428 | | |
See Accompanying Notes to Financial Statements.
8
Columbia North Carolina Intermediate Municipal Bond Fund
March 31, 2011
| Municipal Bonds (continued) | |
| | | Par ($) | | Value ($) | |
| Series 2000 A-8, AMT, | |
| 6.050% 07/01/12 | | | 130,000 | | | | 130,373 | | |
| Series 2007 A-30, AMT, | |
| 5.000% 07/01/23 | | | 1,000,000 | | | | 1,003,390 | | |
| Single-Family Total | | | 3,897,096 | | |
| Housing Total | | | 3,897,096 | | |
| Other – 8.5% | |
| Other – 1.3% | |
NC Durham County Industrial
Facilities & Pollution Control
Financing Authority | |
Research Triangle Institute,
Series 2010: | | | |
| 4.000% 02/01/17 | | | 1,440,000 | | | | 1,548,015 | | |
| 4.000% 02/01/18 | | | 1,000,000 | | | | 1,068,220 | | |
| Other Total | | | 2,616,235 | | |
| Refunded/Escrowed (a) – 6.2% | |
| NC Craven County | |
| Series 2002, | |
| Pre-refunded 05/01/12, | |
| Insured: AMBAC | |
| 5.000% 05/01/19 | | | 1,000,000 | | | | 1,059,450 | | |
NC Eastern Municipal Power
Agency | |
| Series 1986 A, | |
| Escrowed to Maturity, | |
| 5.000% 01/01/17 | | | 2,165,000 | | | | 2,483,103 | | |
| Series 1988 A, | |
| Pre-refunded 01/01/22, | |
| 6.000% 01/01/26 | | | 1,000,000 | | | | 1,231,400 | | |
| NC Gaston County | |
| Series 2002, | |
| Pre-refunded 06/01/12, | |
| Insured: AMBAC | |
| 5.250% 06/01/20 | | | 1,500,000 | | | | 1,598,895 | | |
| NC High Point | |
| Series 2002, | |
| Pre-refunded 06/01/12, | |
| Insured: NPFGC | |
| 4.500% 06/01/14 | | | 1,275,000 | | | | 1,347,943 | | |
| NC Wake County | |
| Series 2009, | |
| Pre-refunded 03/01/19, | |
| 5.000% 03/01/20 | | | 935,000 | | | | 1,102,365 | | |
| | | Par ($) | | Value ($) | |
| Wake Medical, | |
| Series 1993, | |
| Escrowed to Maturity, | |
| Insured: NPFGC | |
| 5.125% 10/01/26 | | | 3,065,000 | | | | 3,438,777 | | |
| Refunded/Escrowed Total | | | 12,261,933 | | |
| Tobacco – 1.0% | |
NJ Tobacco Settlement
Financing Corp. | |
| Series 2007 1A, | |
| 4.250% 06/01/12 | | | 2,000,000 | | | | 2,021,900 | | |
| Tobacco Total | | | 2,021,900 | | |
| Other Total | | | 16,900,068 | | |
| Tax-Backed – 36.9% | |
| Local Appropriated – 18.6% | |
| NC Burke County | |
| Series 2006 B, | |
| Insured: AMBAC | |
| 5.000% 04/01/18 | | | 1,425,000 | | | | 1,520,119 | | |
| NC Cabarrus County | |
| Series 2008, | |
| 5.000% 06/01/22 | | | 1,545,000 | | | | 1,644,220 | | |
| NC Chapel Hill | |
| Series 2005, | |
| 5.250% 06/01/21 | | | 1,360,000 | | | | 1,435,425 | | |
| NC Charlotte | |
| Series 2003 A, | |
| 5.500% 08/01/16 | | | 2,550,000 | | | | 2,789,394 | | |
| NC Chatham County | |
| Series 2006, | |
| Insured: AMBAC | |
| 5.000% 06/01/20 | | | 1,065,000 | | | | 1,109,464 | | |
| NC Concord | |
| Series 2001 A, | |
| Insured: NPFGC | |
| 5.000% 06/01/17 | | | 1,490,000 | | | | 1,516,462 | | |
| NC Craven County | |
| Series 2007, | |
| Insured: NPFGC: | |
| 5.000% 06/01/18 | | | 2,825,000 | | | | 3,089,392 | | |
| 5.000% 06/01/19 | | | 1,825,000 | | | | 1,963,408 | | |
| NC Cumberland County | |
| Series 2009 B1, | |
| 5.000% 12/01/21 | | | 2,775,000 | | | | 3,005,353 | | |
See Accompanying Notes to Financial Statements.
9
Columbia North Carolina Intermediate Municipal Bond Fund
March 31, 2011
| Municipal Bonds (continued) | |
| | | Par ($) | | Value ($) | |
| NC Dare County | |
| Series 2005, | |
| Insured: NPFGC | |
| 5.000% 06/01/20 | | | 3,005,000 | | | | 3,144,492 | | |
| NC Gaston County | |
| Series 2005, | |
| Insured: NPFGC | |
| 5.000% 12/01/15 | | | 1,350,000 | | | | 1,502,280 | | |
| NC Greenville | |
| Series 2004, | |
| Insured: AMBAC | |
| 5.250% 06/01/22 | | | 2,180,000 | | | | 2,266,023 | | |
| NC Harnett County | |
| Series 2009, | |
| Insured: AGC | |
| 5.000% 06/01/22 | | | 1,880,000 | | | | 1,972,233 | | |
| NC Henderson County | |
| Series 2006 A, | |
| Insured: AMBAC | |
| 5.000% 06/01/16 | | | 1,060,000 | | | | 1,180,861 | | |
| NC Mecklenburg County | |
| Series 2009 A, | |
| 5.000% 02/01/23 | | | 1,000,000 | | | | 1,058,490 | | |
| NC Moore County | |
| Series 2010, | |
| 5.000% 06/01/24 | | | 1,635,000 | | | | 1,717,437 | | |
| NC New Hanover County | |
| Series 2005, | |
| Insured: AMBAC | |
| 5.000% 09/01/18 | | | 1,755,000 | | | | 1,955,070 | | |
| NC Randolph County | |
| Series 2004, | |
| Insured: AGMC | |
| 5.000% 06/01/14 | | | 1,640,000 | | | | 1,799,096 | | |
| NC Sampson County | |
| Series 2006, | |
| Insured: AGMC | |
| 5.000% 06/01/16 | | | 1,000,000 | | | | 1,126,380 | | |
| NC Wilmington | |
| Series 2006 A, | |
| 5.000% 06/01/17 | | | 1,005,000 | | | | 1,119,077 | | |
| Local Appropriated Total | | | 36,914,676 | | |
| Local General Obligations – 11.9% | |
| NC Cabarrus County | |
| Series 2006: | |
| 5.000% 03/01/15 | | | 1,000,000 | | | | 1,131,990 | | |
| 5.000% 03/01/16 | | | 1,000,000 | | | | 1,146,210 | | |
| | | Par ($) | | Value ($) | |
| NC Charlotte | |
| Series 2002 C: | |
| 5.000% 07/01/20 | | | 1,570,000 | | | | 1,638,060 | | |
| 5.000% 07/01/22 | | | 1,265,000 | | | | 1,298,889 | | |
| NC Iredell County | |
| Series 2006, | |
| 5.000% 02/01/19 | | | 2,420,000 | | | | 2,641,164 | | |
| NC Mecklenburg County | |
| Series 1993, | |
| 6.000% 04/01/11 | | | 1,000,000 | | | | 1,000,000 | | |
| Series 2009 A, | |
| 5.000% 08/01/19 | | | 1,000,000 | | | | 1,157,560 | | |
| NC New Hanover County | |
| Series 2009, | |
| 5.000% 12/01/17 | | | 1,170,000 | | | | 1,363,939 | | |
| NC Orange County | |
| Series 2005 A, | |
| 5.000% 04/01/22 | | | 2,000,000 | | | | 2,137,980 | | |
| NC Stanly County | |
| Series 2010, | |
| 4.000% 02/01/18 | | | 1,500,000 | | | | 1,631,445 | | |
| NC Wake County | |
| Series 2009: | |
| 4.000% 02/01/18 | | | 2,000,000 | | | | 2,191,660 | | |
| 5.000% 03/01/20 | | | 3,065,000 | | | | 3,486,407 | | |
| Series 2011, | |
| 5.000% 04/01/15 | | | 2,000,000 | | | | 2,274,120 | | |
| NC Wilmington | |
| Series 1997 A, | |
| Insured: NPFCG | |
| 5.000% 04/01/11 | | | 460,000 | | | | 460,000 | | |
| Local General Obligations Total | | | 23,559,424 | | |
| Special Non-Property Tax – 3.9% | |
| NC Charlotte | |
| Storm Water Fee, | |
| Series 2006, | |
| 5.000% 06/01/17 | | | 1,120,000 | | | | 1,268,994 | | |
PR Commonwealth of Puerto Rico
Highway & Transportation Authority | |
| Series 2003 AA, | |
| Insured: NPFGC | |
| 5.500% 07/01/18 | | | 3,500,000 | | | | 3,629,815 | | |
PR Commonwealth of Puerto Rico
Infrastructure Financing Authority | |
| Series 2005 C, | |
| Insured: FGIC | |
| 5.500% 07/01/20 | | | 1,200,000 | | | | 1,223,412 | | |
See Accompanying Notes to Financial Statements.
10
Columbia North Carolina Intermediate Municipal Bond Fund
March 31, 2011
| Municipal Bonds (continued) | |
| | | Par ($) | | Value ($) | |
VI Virgin Islands Public Finance
Authority | |
| Series 2010 A, | |
| 5.000% 10/01/20 | | | 1,560,000 | | | | 1,618,531 | | |
| Special Non-Property Tax Total | | | 7,740,752 | | |
| State Appropriated – 1.4% | |
| NC Infrastructure Finance Corp. | |
| Capital Improvement, | |
| Series 2007 A, | |
| Insured: AGMC | |
| 5.000% 05/01/24 | | | 2,570,000 | | | | 2,665,295 | | |
| State Appropriated Total | | | 2,665,295 | | |
| State General Obligations – 1.1% | |
| NC State | |
| Series 2001 A, | |
| 4.750% 03/01/14 | | | 395,000 | | | | 402,158 | | |
| PR Commonwealth of Puerto Rico | |
| Series 2001 A, | |
| Insured: NPFGC | |
| 5.500% 07/01/14 | | | 1,725,000 | | | | 1,852,253 | | |
| State General Obligations Total | | | 2,254,411 | | |
| Tax-Backed Total | | | 73,134,558 | | |
| Transportation – 2.6% | |
| Airports – 1.6% | |
NC Raleigh Durham Airport
Authority | |
| Series 2010 A, | |
| 5.000% 05/01/23 | | | 3,000,000 | | | | 3,164,280 | | |
| Airports Total | | | 3,164,280 | | |
| Ports – 1.0% | |
| NC Ports Authority | |
| Series 2010 B, | |
| 5.000% 02/01/25 | | | 2,000,000 | | | | 1,947,280 | | |
| Ports Total | | | 1,947,280 | | |
| Transportation Total | | | 5,111,560 | | |
| Utilities – 26.5% | |
| Joint Power Authority – 7.5% | |
| NC Eastern Municipal Power Agency | |
| Series 1993 B, | |
| Insured: NPFGC | |
| 6.000% 01/01/22 | | | 3,000,000 | | | | 3,435,090 | | |
| | | Par ($) | | Value ($) | |
| Series 1993, | |
| Insured: AGC | |
| 6.000% 01/01/22 | | | 1,000,000 | | | | 1,125,750 | | |
| Series 2005, | |
| Insured: AMBAC | |
| 5.250% 01/01/20 | | | 2,000,000 | | | | 2,128,200 | | |
| Series 2008 A, | |
| Insured: AGC | |
| 5.250% 01/01/19 | | | 1,500,000 | | | | 1,621,845 | | |
| Series 2009 B, | |
| 5.000% 01/01/26 | | | 1,500,000 | | | | 1,501,800 | | |
| NC Municipal Power Agency No. 1 | |
| Series 2008 A: | |
| 5.250% 01/01/17 | | | 1,185,000 | | | | 1,336,135 | | |
| 5.250% 01/01/20 | | | 2,000,000 | | | | 2,176,080 | | |
| Series 2009 A, | |
| 5.000% 01/01/25 | | | 1,500,000 | | | | 1,540,605 | | |
| Joint Power Authority Total | | | 14,865,505 | | |
| Municipal Electric – 1.9% | |
| NC Greenville Utilities Commission | |
| Series 2008 A, | |
| Insured: AGMC | |
| 5.000% 11/01/18 | | | 1,040,000 | | | | 1,164,093 | | |
PR Commonwealth of Puerto Rico
Electric Power Authority | |
| Series 2007 TT, | |
| 5.000% 07/01/22 | | | 1,000,000 | | | | 988,490 | | |
| Series 2007 VV, | |
| Insured: NPFGC | |
| 5.250% 07/01/25 | | | 1,690,000 | | | | 1,626,692 | | |
| Municipal Electric Total | | | 3,779,275 | | |
| Water & Sewer – 17.1% | |
| NC Brunswick County | |
| Enterprise Systems, | |
| Series 2008 A, | |
| Insured: AGMC: | |
| 5.000% 04/01/20 | | | 1,915,000 | | | | 2,079,958 | | |
| 5.000% 04/01/22 | | | 1,390,000 | | | | 1,482,699 | | |
NC Cape Fear Public Utility
Authority | |
| Series 2008, | |
| 5.000% 08/01/20 | | | 1,000,000 | | | | 1,102,900 | | |
| NC Charlotte | |
| Water and Sewer Systems: | |
| Series 2002 A, | |
| 5.500% 07/01/14 | | | 1,250,000 | | | | 1,423,800 | | |
| Series 2008, | |
| 5.000% 07/01/23 | | | 3,000,000 | | | | 3,237,930 | | |
See Accompanying Notes to Financial Statements.
11
Columbia North Carolina Intermediate Municipal Bond Fund
March 31, 2011
| Municipal Bonds (continued) | |
| | | Par ($) | | Value ($) | |
| Series 2009 B, | |
| 5.000% 07/01/25 | | | 5,835,000 | | | | 6,284,412 | | |
| NC Concord | |
| Series 2009, | |
| 5.000% 12/01/19 | | | 1,500,000 | | | | 1,664,865 | | |
| NC Gastonia | |
| Combined Utility System, | |
| Series 2009, | |
| Insured: AGC | |
| 4.000% 05/01/17 | | | 1,205,000 | | | | 1,296,098 | | |
| NC Greensboro | |
| Enterprise Systems, | |
| Series 2006: | |
| 5.250% 06/01/17 | | | 2,000,000 | | | | 2,325,980 | | |
| 5.250% 06/01/22 | | | 1,200,000 | | | | 1,394,964 | | |
| Series 2006, | |
| 5.250% 06/01/23 | | | 2,000,000 | | | | 2,315,860 | | |
| NC High Point | |
| Combined Enterprise System, | |
| Series 2008, | |
| Insured: AGMC: | |
| 5.000% 11/01/24 | | | 1,000,000 | | | | 1,048,150 | | |
| 5.000% 11/01/25 | | | 1,000,000 | | | | 1,040,390 | | |
| NC Raleigh | |
| Combined Enterprise System: | |
| Series 2006 A, | |
| 5.000% 03/01/16 | | | 1,500,000 | | | | 1,719,315 | | |
| Series 2011, | |
| 5.000% 03/01/27 | | | 800,000 | | | | 858,832 | | |
| NC Winston Salem | |
| Water and Sewer System: | |
| Series 2007 A, | |
| 5.000% 06/01/19 | | | 3,000,000 | | | | 3,340,920 | | |
| Series 2009, | |
| 5.000% 06/01/23 | | | 1,000,000 | | | | 1,091,080 | | |
| Water & Sewer Total | | | 33,708,153 | | |
| Utilities Total | | | 52,352,933 | | |
Total Municipal Bonds
(cost of $184,226,835) | | | 188,063,410 | | |
| Investment Companies – 3.4% | |
| | | Shares | | Value ($) | |
| BofA Tax-Exempt Reserves, | |
Capital Class
(7 day yield of 0.110%) (b) | | | 3,028,351 | | | | 3,028,351 | | |
| Dreyfus Tax-Exempt Cash | |
Management Fund
(7 day yield of 0.080%) | | | 3,821,242 | | | | 3,821,242 | | |
Total Investment Companies
(cost of $6,849,593) | | | 6,849,593 | | |
Total Investments – 98.4%
(cost of $191,076,428) (c) | | | 194,913,003 | | |
| Other Assets & Liabilities, Net – 1.6% | | | 3,069,241 | | |
| Net Assets – 100.0% | | | 197,982,244 | | |
Notes to Investment Portfolio:
(a) The Fund has been informed that each issuer has placed direct obligations of the U.S. Government in an irrevocable trust, solely for the payment of principal and interest.
(b) Investments in affiliates during the year ended March 31, 2011:
| Affiliate | | Value,
beginning
of period | | Purchases | | Sales
Proceeds | | Dividend
Income | | Value,
end of
period | |
BofA Tax-Exempt
Reserves,
Capital Class
(7 day yield
of 0.110%) | | $ | 551,000 | | | $ | 4,567,298 | | | $ | 1,995,000 | | | $ | 617 | | | $ | — | | |
As of May 1, 2010, this company was no longer an affiliate of the fund. The above table reflects activity for the period from April 1, 2010 through April 30, 2010.
(c) Cost for federal income tax purposes is $191,051,024.
Generally accepted accounting principles (GAAP) require disclosure regarding the inputs and valuation techniques used to measure fair value and any changes in valuation inputs or techniques. In addition, investments shall be disclosed by major category.
The Fund categorizes its fair value measurements according to a three-level hierarchy that maximizes the use of observable inputs and minimizes the use of unobservable inputs by prioritizing that the most observable input be used when available. Observable inputs are those that market participants would use in pricing an investment based on market data obtained from sources independent of the reporting entity. Unobservable inputs are those that reflect the Fund's assumptions about the information market participants would use in pricing an investment. An investment's level within the fair value hierarchy is based on the lowest level of any input that is deemed significant to the asset or liability's fair value measurement. The input levels are not necessarily an indication of the risk or liquidity associated with investments at that level. For example, certain U.S. government securities are generally high quality and liquid, however, they are reflected as Level 2 because the inputs used to determine fair value may not always be quoted prices in an active market.
Fair value inputs are summarized in the three broad levels listed below:
• Level 1—Valuations based on quoted prices for investments in active markets that the Fund has the ability to access at the measurement date (including NAV for open-end mutual funds). Valuation adjustments are not applied to Level 1 investments.
• Level 2—Valuations based on other significant observable inputs (including quoted prices for similar securities, interest rates, prepayment speeds, credit risks, etc.).
See Accompanying Notes to Financial Statements.
12
Columbia North Carolina Intermediate Municipal Bond Fund
March 31, 2011
• Level 3—Valuations based on significant unobservable inputs (including the Fund's own assumptions and judgment in determining the fair value of investments).
Inputs that are used in determining fair value of an investment may include price information, credit data, volatility statistics, and other factors. These inputs can be either observable or unobservable. The availability of observable inputs can vary between investments, and is affected by various factors such as the type of investment, and the volume and level of activity for that investment or similar investments in the marketplace. The inputs will be considered by the Investment Manager, along with any other relevant factors in the calculation of an investment's fair value. The Fund uses prices and inputs that are current as of the measurement date, which may include periods of market dislocations. During these periods, the availability of prices and inputs may be reduced for many investments. This condition could cause an investment to be reclassified between the various levels within the hierarchy.
Investments falling into the Level 3 category are primarily supported by quoted prices from brokers and dealers participating in the market for those investments. However, these may be classified as Level 3 investments due to lack of market transparency and corroboration to support these quoted prices. Additionally, valuation models may be used as the pricing source for any remaining investments classified as Level 3. These models rely on one or more significant unobservable inputs and/or significant assumptions by the Investment Manager. Inputs used in valuations may include, but are not limited to, financial statement analysis, capital account balances, discount rates and estimated cash flows, and comparable company data.
The following table is a summary of the inputs used to value the Fund's investments as of March 31, 2011:
| Description | | Quoted
Prices
(Level 1) | | Other
Significant
Observable
Inputs
(Level 2) | | Significant
Unobservable
Inputs
(Level 3) | | Total | |
| Total Municipal Bonds | | $ | — | | | $ | 188,063,410 | | | $ | — | | | $ | 188,063,410 | | |
| Investment Companies | | | 6,849,593 | | | | — | | | | — | | | | 6,849,593 | | |
| Total Investments | | $ | 6,849,593 | | | $ | 188,063,410 | | | $ | — | | | $ | 194,913,003 | | |
The Fund's assets assigned to the Level 2 input category are generally valued using the market approach, in which a security's value is determined through its correlation to prices and information from market transactions for similar or identical assets.
There were no significant transfers of financial assets between Levels 1 and 2 during the period.
At March 31, 2011, the composition of the Fund by revenue source is as follows:
| Holdings by Revenue Source (Unaudited) | | % of
Net Assets | |
| Tax-Backed | | | 36.9 | | |
| Utilities | | | 26.5 | | |
| Health Care | | | 11.5 | | |
| Other | | | 8.5 | | |
| Education | | | 7.0 | | |
| Transportation | | | 2.6 | | |
| Housing | | | 2.0 | | |
| | | | 95.0 | | |
| Investment Companies | | | 3.4 | | |
| Other Assets & Liabilities, Net | | | 1.6 | | |
| | | | 100.0 | | |
| Acronym | | Name | |
| AGC | | Assured Guaranty Corp. | |
|
| AGMC | | Assured Guaranty Municipal Corp. | |
|
| AMBAC | | Ambac Assurance Corp. | |
|
| AMT | | Alternative Minimum Tax | |
|
| FGIC | | Financial Guaranty Insurance Co. | |
|
| NPFGC | | National Public Finance Guarantee Corp. | |
|
| SYNC | | Syncora Guarantee, Inc. | |
|
See Accompanying Notes to Financial Statements.
13
Statement of Assets and Liabilities – Columbia North Carolina Intermediate Municipal Bond Fund
March 31, 2011
| Assets | | Investments, at identified cost | | $ | 191,076,428 | | |
| | | Investments, at value | | | 194,913,003 | | |
| | | Cash | | | 779 | | |
| | | Receivable for: | | | |
| | | Fund shares sold | | | 1,131,827 | | |
| | | Interest | | | 2,707,103 | | |
| | | Expense reimbursement due from Investment Manager | | | 57,986 | | |
| | | Prepaid expenses | | | 332 | | |
| | | Total Assets | | | 198,811,030 | | |
| Liabilities | | Payable for: | | | |
| | | Fund shares repurchased | | | 88,761 | | |
| | | Distributions | | | 448,903 | | |
| | | Investment advisory fee | | | 67,236 | | |
| | | Administration fee | | | 19,525 | | |
| | | Pricing and bookkeeping fees | | | 8,434 | | |
| | | Transfer agent fee | | | 41,827 | | |
| | | Trustees' fees | | | 77,525 | | |
| | | Custody fee | | | 2,271 | | |
| | | Distribution and service fees | | | 11,730 | | |
| | | Chief compliance officer expenses | | | 231 | | |
| | | Other liabilities | | | 62,343 | | |
| | | Total Liabilities | | | 828,786 | | |
| | | Net Assets | | | 197,982,244 | | |
| Net Assets Consist of | | Paid-in capital | | | 196,962,409 | | |
| | | Undistributed net investment income | | | 736,474 | | |
| | | Accumulated net realized loss | | | (3,553,214 | ) | |
| | | Net unrealized appreciation on investments | | | 3,836,575 | | |
| | | Net Assets | | | 197,982,244 | | |
| Class A | | Net assets | | $ | 31,731,246 | | |
| | | Shares outstanding | | | 3,132,338 | | |
| | | Net asset value per share | | $ | 10.13 | (a) | |
| | | Maximum sales charge | | | 3.25 | % | |
| | | Maximum offering price per share ($10.13/0.9675) | | $ | 10.47 | (b) | |
| Class B | | Net assets | | $ | 554,045 | | |
| | | Shares outstanding | | | 54,684 | | |
| | | Net asset value and offering price per share | | $ | 10.13 | (a) | |
| Class C | | Net assets | | $ | 5,269,510 | | |
| | | Shares outstanding | | | 520,271 | | |
| | | Net asset value and offering price per share | | $ | 10.13 | (a) | |
| Class Z | | Net assets | | $ | 160,427,443 | | |
| | | Shares outstanding | | | 15,848,006 | | |
| | | Net asset value, offering and redemption price per share | | $ | 10.12 | | |
(a) Redemption price per share is equal to net asset value less any applicable contingent deferred sales charge.
(b) On sales of $100,000 or more the offering price is reduced.
See Accompanying Notes to Financial Statements.
14
Statement of Operations – Columbia North Carolina Intermediate Municipal Bond Fund
For the Year Ended March 31, 2011
| | | | | ($) | |
| Investment Income | | Interest | | | 7,911,870 | | |
| | | Dividends | | | 5,654 | | |
| | | Dividends from affiliates | | | 617 | | |
| | | Total investment income | | | 7,918,141 | | |
| Expenses | | Investment advisory fee | | | 839,476 | | |
| | | Administration fee | | | 245,313 | | |
| | | Distribution fee: | | | |
| | | Class B | | | 8,479 | | |
| | | Class C | | | 33,966 | | |
| | | Service fee: | | | |
| | | Class B | | | 2,826 | | |
| | | Class C | | | 11,322 | | |
| | | Distribution and service fees: | | | |
| | | Class A | | | 85,899 | | |
| | | Transfer agent fee | | | 115,725 | | |
| | | Pricing and bookkeeping fees | | | 86,539 | | |
| | | Trustees' fees | | | 32,531 | | |
| | | Custody fee | | | 13,567 | | |
| | | Chief compliance officer expenses | | | 1,198 | | |
| | | Other expenses | | | 114,627 | | |
| | | Total Expenses | | | 1,591,468 | | |
| | | Fees waived or expenses reimbursed by Investment Manager | | | (294,489 | ) | |
| | | Expense reductions | | | (4 | ) | |
| | | Net Expenses | | | 1,296,975 | | |
| | | Net Investment Income | | | 6,621,166 | | |
| Net Realized and Unrealized Gain (Loss) on Investments | | Net realized gain on investments | | | 421,138 | | |
| | | Net change in unrealized appreciation (depreciation) on investments | | | (1,571,989 | ) | |
| | | Net Loss | | | (1,150,851 | ) | |
| | | Net Increase Resulting from Operations | | | 5,470,315 | | |
See Accompanying Notes to Financial Statements.
15
Statement of Changes in Net Assets – Columbia North Carolina Intermediate Municipal Bond Fund
| | | | | Year Ended March 31, | |
| Increase (Decrease) in Net Assets | | | | 2011 ($) | | 2010 ($) | |
| Operations | | Net investment income | | | 6,621,166 | | | | 7,008,384 | | |
| | | Net realized gain (loss) on investments | | | 421,138 | | | | (509,896 | ) | |
| | | Net change in unrealized appreciation (depreciation) on investments | | | (1,571,989 | ) | | | 7,819,262 | | |
| | | Net increase resulting from operations | | | 5,470,315 | | | | 14,317,750 | | |
| Distributions to Shareholders | | From net investment income: | | | | | | | | | |
| | | Class A | | | (1,021,135 | ) | | | (940,744 | ) | |
| | | Class B | | | (25,047 | ) | | | (41,658 | ) | |
| | | Class C | | | (100,745 | ) | | | (97,172 | ) | |
| | | Class Z | | | (5,474,239 | ) | | | (5,928,809 | ) | |
| | | Total distributions to shareholders | | | (6,621,166 | ) | | | (7,008,383 | ) | |
| | | Net Capital Stock Transactions | | | (12,026,995 | ) | | | 11,137,493 | | |
| | | Total increase (decrease) in net assets | | | (13,177,846 | ) | | | 18,446,860 | | |
| Net Assets | | Beginning of period | | | 211,160,090 | | | | 192,713,230 | | |
| | | End of period | | | 197,982,244 | | | | 211,160,090 | | |
| | | Undistributed net investment income at end of period | | | 736,474 | | | | 677,205 | | |
See Accompanying Notes to Financial Statements.
16
Statement of Changes in Net Assets (continued) – Columbia North Carolina Intermediate Municipal Bond Fund
| | | Capital Stock Activity | |
| | | Year Ended
March 31, 2011 | | Year Ended
March 31, 2010 | |
| | | Shares | | Dollars ($) | | Shares | | Dollars ($) | |
| Class A | |
| Subscriptions | | | 744,742 | | | | 7,705,255 | | | | 1,182,078 | | | | 11,995,911 | | |
| Distributions reinvested | | | 66,632 | | | | 688,368 | | | | 73,398 | | | | 745,118 | | |
| Redemptions | | | (952,825 | ) | | | (9,935,460 | ) | | | (354,419 | ) | | | (3,593,240 | ) | |
| Net increase (decrease) | | | (141,451 | ) | | | (1,541,837 | ) | | | 901,057 | | | | 9,147,789 | | |
| Class B | |
| Subscriptions | | | 6,350 | | | | 65,743 | | | | 8,987 | | | | 89,797 | | |
| Distributions reinvested | | | 1,042 | | | | 10,808 | | | | 2,839 | | | | 28,763 | | |
| Redemptions | | | (76,554 | ) | | | (778,304 | ) | | | (84,053 | ) | | | (852,174 | ) | |
| Net decrease | | | (69,162 | ) | | | (701,753 | ) | | | (72,227 | ) | | | (733,614 | ) | |
| Class C | |
| Subscriptions | | | 255,153 | | | | 2,624,201 | | | | 111,489 | | | | 1,130,922 | | |
| Distributions reinvested | | | 4,823 | | | | 49,683 | | | | 4,318 | | | | 43,832 | | |
| Redemptions | | | (113,002 | ) | | | (1,163,003 | ) | | | (117,514 | ) | | | (1,196,223 | ) | |
| Net increase (decrease) | | | 146,974 | | | | 1,510,881 | | | | (1,707 | ) | | | (21,469 | ) | |
| Class Z | |
| Subscriptions | | | 3,796,730 | | | | 39,249,860 | | | | 4,615,577 | | | | 46,761,349 | | |
| Distributions reinvested | | | 31,553 | | | | 325,530 | | | | 32,514 | | | | 329,596 | | |
| Redemptions | | | (4,975,352 | ) | | | (50,869,676 | ) | | | (4,396,215 | ) | | | (44,346,158 | ) | |
| Net increase (decrease) | | | (1,147,069 | ) | | | (11,294,286 | ) | | | 251,876 | | | | 2,744,787 | | |
See Accompanying Notes to Financial Statements.
17
Financial Highlights – Columbia North Carolina Intermediate Municipal Bond Fund
Selected data for a share outstanding throughout each period is as follows:
| | | Year Ended March 31, | |
| Class A Shares | | 2011 | | 2010 | | 2009 | | 2008 | | 2007 | |
| Net Asset Value, Beginning of Period | | $ | 10.17 | | | $ | 9.79 | | | $ | 10.08 | | | $ | 10.38 | | | $ | 10.40 | | |
| Income from Investment Operations: | |
| Net investment income (a) | | | 0.31 | | | | 0.33 | | | | 0.37 | | | | 0.39 | | | | 0.40 | | |
Net realized and unrealized gain (loss) on investments
and futures contracts | | | (0.04 | ) | | | 0.38 | | | | (0.29 | ) | | | (0.30 | ) | | | 0.03 | | |
| Total from investment operations | | | 0.27 | | | | 0.71 | | | | 0.08 | | | | 0.09 | | | | 0.43 | | |
| Less Distributions to Shareholders: | |
| From net investment income | | | (0.31 | ) | | | (0.33 | ) | | | (0.37 | ) | | | (0.39 | ) | | | (0.39 | ) | |
| From net realized gains | | | — | | | | — | | | | — | | | | — | (b) | | | (0.06 | ) | |
| Total distributions to shareholders | | | (0.31 | ) | | | (0.33 | ) | | | (0.37 | ) | | | (0.39 | ) | | | (0.45 | ) | |
| Net Asset Value, End of Period | | $ | 10.13 | | | $ | 10.17 | | | $ | 9.79 | | | $ | 10.08 | | | $ | 10.38 | | |
| Total return (c)(d) | | | 2.61 | % | | | 7.34 | % | | | 0.87 | % | | | 0.84 | % | | | 4.23 | % | |
| Ratios to Average Net Assets/Supplemental Data: | |
| Net expenses (e) | | | 0.80 | % | | | 0.78 | % | | | 0.75 | % | | | 0.75 | % | | | 0.75 | % | |
| Waiver/Reimbursement | | | 0.14 | % | | | 0.13 | % | | | 0.14 | % | | | 0.16 | % | | | 0.18 | % | |
| Net investment income (e) | | | 2.97 | % | | | 3.27 | % | | | 3.79 | % | | | 3.73 | % | | | 3.80 | % | |
| Portfolio turnover rate | | | 16 | % | | | 15 | % | | | 20 | % | | | 25 | % | | | 17 | % | |
| Net assets, end of period (000s) | | $ | 31,731 | | | $ | 33,307 | | | $ | 23,236 | | | $ | 22,399 | | | $ | 18,705 | | |
(a) Per share data was calculated using the average shares outstanding during the period.
(b) Rounds to less than $0.01 per share.
(c) Total return at net asset value assuming all distributions reinvested and no initial sales charge or contingent deferred sales charge.
(d) Had the Investment Manager and/or any of its affiliates not waived fees or reimbursed a portion of expenses, total return would have been reduced.
(e) The benefits derived from expense reductions had an impact of less than 0.01%.
See Accompanying Notes to Financial Statements.
18
Financial Highlights – Columbia North Carolina Intermediate Municipal Bond Fund
Selected data for a share outstanding throughout each period is as follows:
| | | Year Ended March 31, | |
| Class B Shares | | 2011 | | 2010 | | 2009 | | 2008 | | 2007 | |
| Net Asset Value, Beginning of Period | | $ | 10.17 | | | $ | 9.79 | | | $ | 10.08 | | | $ | 10.38 | | | $ | 10.39 | | |
| Income from Investment Operations: | |
| Net investment income (a) | | | 0.23 | | | | 0.26 | | | | 0.30 | | | | 0.31 | | | | 0.32 | | |
Net realized and unrealized gain (loss) on investments
and futures contracts | | | (0.04 | ) | | | 0.38 | | | | (0.29 | ) | | | (0.30 | ) | | | 0.04 | | |
| Total from investment operations | | | 0.19 | | | | 0.64 | | | | 0.01 | | | | 0.01 | | | | 0.36 | | |
| Less Distributions to Shareholders: | |
| From net investment income | | | (0.23 | ) | | | (0.26 | ) | | | (0.30 | ) | | | (0.31 | ) | | | (0.31 | ) | |
| From net realized gains | | | — | | | | — | | | | — | | | | — | (b) | | | (0.06 | ) | |
| Total distributions to shareholders | | | (0.23 | ) | | | (0.26 | ) | | | (0.30 | ) | | | (0.31 | ) | | | (0.37 | ) | |
| Net Asset Value, End of Period | | $ | 10.13 | | | $ | 10.17 | | | $ | 9.79 | | | $ | 10.08 | | | $ | 10.38 | | |
| Total return (c)(d) | | | 1.85 | % | | | 6.55 | % | | | 0.13 | % | | | 0.09 | % | | | 3.55 | % | |
| Ratios to Average Net Assets/Supplemental Data: | |
| Net expenses (e) | | | 1.55 | % | | | 1.53 | % | | | 1.50 | % | | | 1.50 | % | | | 1.50 | % | |
| Waiver/Reimbursement | | | 0.14 | % | | | 0.13 | % | | | 0.14 | % | | | 0.16 | % | | | 0.18 | % | |
| Net investment income (e) | | | 2.22 | % | | | 2.56 | % | | | 3.04 | % | | | 2.99 | % | | | 3.05 | % | |
| Portfolio turnover rate | | | 16 | % | | | 15 | % | | | 20 | % | | | 25 | % | | | 17 | % | |
| Net assets, end of period (000s) | | $ | 554 | | | $ | 1,260 | | | $ | 1,920 | | | $ | 2,668 | | | $ | 3,776 | | |
(a) Per share data was calculated using the average shares outstanding during the period.
(b) Rounds to less than $0.01 per share.
(c) Total return at net asset value assuming all distributions reinvested and no contingent deferred sales charge.
(d) Had the Investment Manager and/or any of its affiliates not waived fees or reimbursed a portion of expenses, total return would have been reduced.
(e) The benefits derived from expense reductions had an impact of less than 0.01%.
See Accompanying Notes to Financial Statements.
19
Financial Highlights – Columbia North Carolina Intermediate Municipal Bond Fund
Selected data for a share outstanding throughout each period is as follows:
| | | Year Ended March 31, | |
| Class C Shares | | 2011 | | 2010 | | 2009 | | 2008 | | 2007 | |
| Net Asset Value, Beginning of Period | | $ | 10.17 | | | $ | 9.79 | | | $ | 10.08 | | | $ | 10.38 | | | $ | 10.40 | | |
| Income from Investment Operations: | |
| Net investment income (a) | | | 0.23 | | | | 0.26 | | | | 0.30 | | | | 0.31 | | | | 0.32 | | |
Net realized and unrealized gain (loss) on investments
and futures contracts | | | (0.04 | ) | | | 0.38 | | | | (0.29 | ) | | | (0.30 | ) | | | 0.03 | | |
| Total from investment operations | | | 0.19 | | | | 0.64 | | | | 0.01 | | | | 0.01 | | | | 0.35 | | |
| Less Distributions to Shareholders: | |
| From net investment income | | | (0.23 | ) | | | (0.26 | ) | | | (0.30 | ) | | | (0.31 | ) | | | (0.31 | ) | |
| From net realized gains | | | — | | | | — | | | | — | | | | — | (b) | | | (0.06 | ) | |
| Total distributions to shareholders | | | (0.23 | ) | | | (0.26 | ) | | | (0.30 | ) | | | (0.31 | ) | | | (0.37 | ) | |
| Net Asset Value, End of Period | | $ | 10.13 | | | $ | 10.17 | | | $ | 9.79 | | | $ | 10.08 | | | $ | 10.38 | | |
| Total return (c)(d) | | | 1.84 | % | | | 6.55 | % | | | 0.12 | % | | | 0.09 | % | | | 3.45 | % | |
| Ratios to Average Net Assets/Supplemental Data: | |
| Net expenses (e) | | | 1.55 | % | | | 1.53 | % | | | 1.50 | % | | | 1.50 | % | | | 1.50 | % | |
| Waiver/Reimbursement | | | 0.14 | % | | | 0.13 | % | | | 0.14 | % | | | 0.16 | % | | | 0.18 | % | |
| Net investment income (e) | | | 2.22 | % | | | 2.54 | % | | | 3.04 | % | | | 2.99 | % | | | 3.05 | % | |
| Portfolio turnover rate | | | 16 | % | | | 15 | % | | | 20 | % | | | 25 | % | | | 17 | % | |
| Net assets, end of period (000s) | | $ | 5,270 | | | $ | 3,797 | | | $ | 3,672 | | | $ | 3,108 | | | $ | 3,760 | | |
(a) Per share data was calculated using the average shares outstanding during the period.
(b) Rounds to less than $0.01 per share.
(c) Total return at net asset value assuming all distributions reinvested and no contingent deferred sales charge.
(d) Had the Investment Manager and/or any of its affiliates not waived fees or reimbursed a portion of expenses, total return would have been reduced.
(e) The benefits derived from expense reductions had an impact of less than 0.01%.
See Accompanying Notes to Financial Statements.
20
Financial Highlights – Columbia North Carolina Intermediate Municipal Bond Fund
Selected data for a share outstanding throughout each period is as follows:
| | | Year Ended March 31, | |
| Class Z Shares | | 2011 | | 2010 | | 2009 | | 2008 | | 2007 | |
| Net Asset Value, Beginning of Period | | $ | 10.17 | | | $ | 9.79 | | | $ | 10.07 | | | $ | 10.38 | | | $ | 10.39 | | |
| Income from Investment Operations: | |
| Net investment income (a) | | | 0.33 | | | | 0.36 | | | | 0.40 | | | | 0.41 | | | | 0.42 | | |
Net realized and unrealized gain (loss) on investments
and futures contracts | | | (0.05 | ) | | | 0.38 | | | | (0.28 | ) | | | (0.31 | ) | | | 0.05 | | |
| Total from investment operations | | | 0.28 | | | | 0.74 | | | | 0.12 | | | | 0.10 | | | | 0.47 | | |
| Less Distributions to Shareholders: | |
| From net investment income | | | (0.33 | ) | | | (0.36 | ) | | | (0.40 | ) | | | (0.41 | ) | | | (0.42 | ) | |
| From net realized gains | | | — | | | | — | | | | — | | | | — | (b) | | | (0.06 | ) | |
| Total distributions to shareholders | | | (0.33 | ) | | | (0.36 | ) | | | (0.40 | ) | | | (0.41 | ) | | | (0.48 | ) | |
| Net Asset Value, End of Period | | $ | 10.12 | | | $ | 10.17 | | | $ | 9.79 | | | $ | 10.07 | | | $ | 10.38 | | |
| Total return (c)(d) | | | 2.76 | % | | | 7.61 | % | | | 1.22 | % | | | 0.99 | % | | | 4.59 | % | |
| Ratios to Average Net Assets/Supplemental Data: | |
| Net expenses (e) | | | 0.55 | % | | | 0.53 | % | | | 0.50 | % | | | 0.50 | % | | | 0.50 | % | |
| Waiver/Reimbursement | | | 0.14 | % | | | 0.13 | % | | | 0.14 | % | | | 0.16 | % | | | 0.18 | % | |
| Net investment income (e) | | | 3.22 | % | | | 3.54 | % | | | 4.03 | % | | | 3.99 | % | | | 4.05 | % | |
| Portfolio turnover rate | | | 16 | % | | | 15 | % | | | 20 | % | | | 25 | % | | | 17 | % | |
| Net assets, end of period (000s) | | $ | 160,427 | | | $ | 172,795 | | | $ | 163,885 | | | $ | 154,515 | | | $ | 155,432 | | |
(a) Per share data was calculated using the average shares outstanding during the period.
(b) Rounds to less than $0.01 per share.
(c) Total return at net asset value assuming all distributions reinvested.
(d) Had the Investment Manager and/or any of its affiliates not waived fees or reimbursed a portion of expenses, total return would have been reduced.
(e) The benefits derived from expense reductions had an impact of less than 0.01%.
See Accompanying Notes to Financial Statements.
21
Notes to Financial Statements – Columbia North Carolina Intermediate Municipal Bond Fund
March 31, 2011
Note 1. Organization
Columbia North Carolina Intermediate Municipal Bond Fund (the Fund), a series of Columbia Funds Series Trust (the Trust), is a diversified fund. The Trust is registered under the Investment Company Act of 1940, as amended (the 1940 Act), as an open-end management investment company organized as a Delaware statutory trust.
After the close of business on April 30, 2010, Ameriprise Financial, Inc. (Ameriprise Financial) acquired a portion of the asset management business of Columbia Management Group, LLC (the Transaction), including the business of managing the Fund. In connection with the closing of the Transaction (the Closing), RiverSource Investments, LLC, a wholly owned subsidiary of Ameriprise Financial, became the investment manager of the Fund and changed its name to Columbia Management Investment Advisers, LLC (the Investment Manager).
Investment Objective
The Fund seeks current income exempt from U.S. federal income tax and North Carolina individual income tax, consistent with moderate fluctuation of principal.
Fund Shares
The Trust has unlimited authorized shares of beneficial interest. The Fund offers Class A, Class B, Class C and Class Z shares. All share classes have identical voting, dividend and liquidation rights. Each share class has its own expense structure and sales charges, as applicable.
Class A shares are subject to a maximum front-end sales charge of 3.25% based on the initial investment amount. Class A shares purchased without an initial sales charge in accounts aggregating $1 million to $50 million at the time of purchase are subject to a 1.00% contingent deferred sales charge (CDSC) if the shares are sold within 18 months of purchase, charged as follows: 1.00% CDSC if redeemed within 12 months of purchase, and 0.50% CDSC if redeemed more than 12, but less than 18 months after purchase.
The Fund no longer accepts investments by new or existing investors in the Fund's Class B shares, except in connection with the reinvestment of any dividend and/or capital gain distributions in Class B shares of the Fund and exchanges by existing Class B shareholders of other funds within the Columbia Family of Funds. Class B shares are subject to a maximum CDSC of 3.00% based upon the holding period after purchase. Class B shares will generally convert to Class A shares eight years after purchase.
Class C shares are subject to a 1.00% CDSC on shares redeemed within one year of purchase.
Class Z shares are not subject to sales charges and are available only to certain investors, as described in the Fund's prospectus.
Note 2. Summary of Significant Accounting Policies
The preparation of financial statements in accordance with U.S. generally accepted accounting principles (GAAP) requires management to make certain estimates and assumptions that affect the reported amounts of assets and liabilities, the disclosure of contingent assets and liabilities at the date of the financial statements and the reported amounts of revenue and expenses during the reporting period. Actual results could differ from those estimates.
The following is a summary of significant accounting policies consistently followed by the Fund in the preparation of its financial statements.
Security Valuation
Debt securities generally are valued by pricing services approved by the Trust's Board of Trustees, based upon market transactions for normal, institutional-size trading units of similar securities. The services may use various pricing techniques which take into account appropriate factors such as yield, quality, coupon rate, maturity, type of issue, trading characteristics and other data, as well as broker quotes. Debt securities for which quotations are readily available may also be valued based upon an over-the-counter or exchange bid quotation.
Investments in other open-end investment companies are valued at net asset value.
Investments for which market quotations are not readily available, or that have quotations which the Investment Manager believes are not reliable, are valued at fair value as determined in good faith under consistently applied procedures established by and under the general supervision of the Board of Trustees. If a security is valued at fair value, such value is likely to be different from the last quoted market price for the security. The determination of fair value often requires significant judgment. To determine fair value, the Investment Manager may use assumptions including but not limited to future cash flows and estimated risk premiums. Multiple inputs from various sources may be used to determine value.
22
Columbia North Carolina Intermediate Municipal Bond Fund, March 31, 2011
Security Transactions
Security transactions are accounted for on the trade date. Cost is determined and gains (losses) are based upon the specific identification method for both financial statement and federal income tax purposes.
Income Recognition
Interest income is recorded on the accrual basis. Market premium and discount are amortized and accreted, respectively, on all debt securities, unless otherwise noted. Original issue discount is accreted to interest income over the life of the security with a corresponding increase in the cost basis, if any.
Dividend income is recorded on the ex-date.
Expenses
General expenses of the Trust are allocated to the Fund and other series of the Trust based upon relative net assets or other expense allocation methodologies determined by the nature of the expense. Expenses directly attributable to a specific class of shares are charged to that share class. Expenses directly attributable to the Fund are charged to the Fund.
Determination of Class Net Asset Value
All income, expenses (other than class-specific expenses which are charged directly to a share class, as shown in the Statement of Operations) and realized and unrealized gains (losses) are allocated to each class of the Fund on a daily basis for purposes of determining the net asset value of each class. Income and expenses are allocated to each class based on the settled shares method, while realized and unrealized gains (losses) are allocated based on the relative net assets of each class.
Federal Income Tax Status
The Fund intends to qualify each year as a regulated investment company under Subchapter M of the Internal Revenue Code, as amended, and will distribute substantially all of its tax exempt or taxable income, if any, for its tax year, and as such will not be subject to federal income taxes. In addition, the Fund intends to distribute in each calendar year substantially all of its net investment income, capital gains and certain other amounts, if any, such that the Fund should not be subject to federal excise tax. Therefore, no federal income or excise tax provision is recorded.
Distributions to Shareholders
Distributions from net investment income are declared daily and paid monthly. Net realized capital gains, if any, are distributed at least annually. Income distributions and capital gain distributions are determined in accordance with federal income tax regulations which may differ from GAAP.
Indemnifications
Under the Trust's organizational documents and, in some cases, by contract, its officers and directors are indemnified against certain liabilities arising out of the performance of their duties to the Fund. In addition, certain of the Fund's contracts with its service providers contain general indemnification clauses. The Fund's maximum exposure under these arrangements is unknown since the amount of any future claims that may be made against the Fund cannot be determined and the Fund has no historical basis for predicting the likelihood of any such claims.
Note 3. Fees and Compensation Paid to Affiliates
Investment Management Fee
Under an Investment Management Services Agreement (IMSA), the Investment Manager determines which securities will be purchased, held or sold. The management fee is equal to a percentage of the Fund's average daily net assets that declines from 0.40% to 0.27% as the Fund's net assets increase.
Prior to the Closing, Columbia Management Advisors, LLC (Columbia), an indirect, wholly owned subsidiary of Bank of America Corporation (BOA), provided investment management services to the Fund under the same fee structure. The effective management fee rate for the year ended March 31, 2011, was 0.40% of the Fund's average daily net assets.
Administration Fee
Effective upon the Closing, the Investment Manager provides administration and accounting services to the Fund under an Administrative Services Agreement, including services previously performed under the Pricing and Bookkeeping Oversight and Services Agreement (the Services Agreement) as discussed in the Pricing and Bookkeeping Fees note below. The Fund pays an annual administration fee equal to 0.15% of the Fund's average daily net assets less the fees payable by the Fund as described under the Pricing and Bookkeeping Fees note below. Prior to the Closing,
23
Columbia North Carolina Intermediate Municipal Bond Fund, March 31, 2011
Columbia provided administrative services to the Fund at the same fee rates.
Pricing and Bookkeeping Fees
Prior to the Closing, the Fund entered into a Financial Reporting Services Agreement (the Financial Reporting Services Agreement) with State Street Bank and Trust Company (State Street) and Columbia pursuant to which State Street provides financial reporting services to the Fund. The Fund also entered into an Accounting Services Agreement (collectively with the Financial Reporting Services Agreement, the State Street Agreements) with State Street and Columbia pursuant to which State Street provides accounting services to the Fund. Upon the Closing, Columbia assigned and delegated its rights and obligations under the State Street Agreements to the Investment Manager. Under the State Street Agreements, the Fund pays State Street an annual fee of $38,000 paid monthly plus an additional monthly fee based on an annualized percentage rate of average daily net assets of the Fund for the month. The aggregate fee will not exceed $140,000 per year (exclusive of out-of-pocket expenses and charges). The Fund also reimburses State Street for certain out-of-pocket expenses and charges.
Also prior to the Closing, the Fund entered into the Services Agreement with Columbia. Under the Services Agreement, Columbia provided services related to Fund expenses and the requirements of the Sarbanes-Oxley Act of 2002, and provided oversight of the accounting and financial reporting services provided by State Street. Under the Services Agreement, the Fund reimbursed Columbia for out-of-pocket expenses and charges, including fees payable to third parties, such as for pricing the Fund's portfolio securities, incurred by Columbia in the performance of services under the Services Agreement. The Services Agreement was terminated upon the Closing. These services are now provided under the Administrative Services Agreement discussed above.
Transfer Agent Fee
In connection with the Closing, RiverSource Service Corporation, a wholly owned subsidiary of Ameriprise Financial, provides transfer agency services to the Fund under a Transfer Agency Agreement and changed its name to Columbia Management Investment Services Corp. (the Transfer Agent). The Transfer Agent has contracted with Boston Financial Data Services (BFDS) to serve as sub-transfer agent.
The Transfer Agent receives monthly account-based service fees based on the number of open accounts and is reimbursed by the Fund for the fees and expenses the Transfer Agent pays to financial intermediaries that maintain omnibus accounts with the Fund that is a percentage of the average aggregate value of the Fund's shares maintained in each such omnibus account (other than omnibus accounts for which American Enterprise Investment Services Inc. is the broker of record or accounts where the beneficial shareholder is a customer of Ameriprise Financial Services, Inc., which are paid a per account fee). The Transfer Agent pays the fees of BFDS for services as sub-transfer agent and is not entitled to reimbursement for such fees from the Fund (with the exception of out-of pocket fees). The Transfer Agent also receives compensation from fees for various shareholder services and reimbursements for certain out-of -pocket expenses.
Prior to the Closing, Columbia Management Services, Inc., an affiliate of Columbia and an indirect, wholly owned subsidiary of BOA, provided transfer agency services to the Fund and contracted with BFDS to serve as sub-transfer agent, under the same fee structure.
For the year ended March 31, 2011, the Fund's effective transfer agent fee rate for each class was 0.06% of the Fund's average daily net assets.
An annual minimum account balance fee of $20 may apply to certain accounts with a value below the Fund's initial minimum investment requirements to reduce the impact of small accounts on transfer agent fees. These minimum account balance fees are recorded as part of expense reductions on the Statement of Operations. For the year ended March 31, 2011, no minimum account balance fees were charged by the Fund.
Underwriting Discounts, Service and Distribution Fees
In connection with the Closing, RiverSource Fund Distributors, Inc., an indirect wholly owned subsidiary of Ameriprise Financial, provides distribution and shareholder services to the Fund and changed its name to Columbia Management Investment Distributors, Inc. (the Distributor). Pursuant to Rule 12b-1 under the 1940 Act, the Board of Trustees has approved, and the Fund has adopted, distribution and shareholder service plans (the Plans) which set the distribution and service fees for the Fund. These fees are calculated daily and are intended to compensate the Distributor and/or eligible selling and/or servicing agents for selling shares of the Fund and providing services to investors.
24
Columbia North Carolina Intermediate Municipal Bond Fund, March 31, 2011
The Plans require the payment of a combined distribution and shareholder servicing fee for the Class A shares of the Fund. The Plans also require the payment of a monthly shareholder servicing fee and distribution fee for the Class B and Class C shares of the Fund. A substantial portion of the expenses incurred pursuant to these plans is paid to affiliates of the Distributor. The annual rates in effect and plan limits, as a percentage of average daily net assets, are as follows:
| | | Current
Rate | | Plan
Limit | |
Class A Combined Distribution and
Shareholder Servicing Plan | | | 0.25 | % | | | 0.25 | % | |
Class B and Class C Shareholder
Servicing Plans | | | 0.25 | % | | | 0.25 | % | |
Class B and Class C
Distribution Plans | | | 0.75 | % | | | 0.75 | % | |
Prior to the Closing, Columbia Management Distributors, Inc., an affiliate of Columbia and an indirect, wholly owned subsidiary of BOA, was the principal underwriter of the Fund's shares. There were no changes to the underwriting discount structure of the Fund or the service or distribution fee rates paid by the Fund as a result of the Transaction.
Sales Charges
Sales charges, including front-end and CDSC's, received by the Distributor for distributing Fund shares were $6,647 for Class A and $295 for Class C shares for the year ended March 31, 2011.
Fee Waivers and Expense Reimbursements
The Investment Manager has voluntarily agreed to bear a portion of the Fund's expenses so that the Fund's ordinary operating expenses (excluding any distribution and service fees, brokerage commissions, interest, taxes and extraordinary expenses, but including custodian charges relating to overdrafts, if any), after giving effect to any balance credits from the Fund's custodian, do not exceed 0.55% of the Fund's average daily net assets on an annualized basis. The Investment Manager, in its discretion, may revise or discontinue this arrangement at any time. Prior to May 1, 2010, Columbia voluntarily reimbursed a portion of the Fund's expenses in the same manner.
The Investment Manager is entitled to recover from the Fund any fees waived and/or expenses reimbursed for a three year period following the date of such fee waiver and/or reimbursement under these arrangements if such recovery does not cause the Fund's expenses to exceed the expense limitations in effect at the time of recovery. Prior to May 1, 2010, Columbia was entitled to recover fees waived and/or expenses reimbursed from the Fund in the same manner.
At March 31, 2011, the amounts potentially recoverable pursuant to this arrangement were as follows:
| Amount of potential recovery expiring March 31, | | Total
potential | | Amount
expired | | Amount recovered
during the year | |
| 2014 | | 2013 | | 2012 | | recovery | | 3/31/11 | | ended 3/31/11 | |
| $ | 294,489 | | | $ | 259,947 | | | $ | 259,156 | | | $ | 813,592 | | | $ | 293,196 | | | $ | — | | |
Effective May 1, 2011, the Investment Manager has eliminated the fee recoupment provisions detailed above.
Fees Paid to Officers and Trustees
In connection with the Closing, all officers of the Fund are employees of the Investment Manager or its affiliates and, with the exception of the Fund's Chief Compliance Officer, receive no compensation from the Fund. The Board of Trustees has appointed a Chief Compliance Officer to the Fund in accordance with federal securities regulations. The Fund, along with other affiliated funds, pays its pro-rata share of the expenses associated with the Chief Compliance Officer. The Fund's expenses for the Chief Compliance Officer will not exceed $15,000 per year. Prior to the Closing, all officers of the Fund were employees of Columbia or its affiliates and the Fund paid its pro-rata share of the expenses for the Chief Compliance Officer under the same fee structure.
Trustees are compensated for their services to the Fund, as set forth on the Statement of Operations. The Trust's eligible Trustees may participate in a non-qualified deferred compensation plan which may be terminated at any time. Any payments to plan participants are paid solely out of the Fund's assets. Income earned on the plan participant's deferral account is based on the rate of return of the eligible mutual funds selected by the participant or, if no funds are
25
Columbia North Carolina Intermediate Municipal Bond Fund, March 31, 2011
selected, on the rate of return of Columbia Money Market Fund (formerly known as RiverSource Cash Management Fund). Prior to the Closing, if no funds were selected, income earned on the plan participant's deferral account was based on the rate of return of BofA Treasury Reserves. Trustees' fees deferred during the current period as well as any gains or losses on the trustees' deferred compensation balances as a result of market fluctuations are included in "Trustees' fees" on the Statement of Operations. Liabilities under the deferred compensation plan are included in "Trustees' fees" on the Statement of Assets and Liabilities.
Other
Prior to the Closing, the Fund made daily investments of cash balances in BofA Tax-Exempt Reserves, formerly an affiliated open-ended investment company of Columbia, pursuant to an exemptive order received from the Securities and Exchange Commission. The income earned prior to the Closing by the Fund from such investments is included as Dividends from affiliates on the Statements of Operations. As an investing Fund, the Fund was indirectly allocated its proportionate share of the expenses of BofA Tax-Exempt Reserves.
Note 4. Custody Credits
The Fund has an agreement with its custodian bank under which custody fees may be reduced by balance credits. These credits are recorded as part of expense reductions on the Statement of Operations. The Fund could have invested a portion of the assets utilized in connection with the expense offset arrangement in an income-producing asset if it had not entered into such an agreement. For the year ended March 31, 2011, these custody credits reduced total expenses by $4 for the Fund.
Note 5. Portfolio Information
The cost of purchases and proceeds from sales of securities, excluding short-term obligations, aggregated $31,988,204 and $49,124,521, respectively, for the year ended March 31, 2011.
Note 6. Shareholder Concentration
As of March 31, 2011, one shareholder account owned 73.3% of the outstanding shares of the Fund. Purchase and redemption activity of this account may have a significant effect on the operations of the Fund.
Note 7. Line of Credit
Prior to March 28, 2011, the Fund and other affiliated funds participated in a $280,000,000 committed, unsecured revolving line of credit provided by State Street. Effective March 28, 2011, the commitment was reduced to $225,000,000. The maximum amount that may be borrowed by any fund is limited to the lesser of $200,000,000 and the Fund's borrowing limit set forth in the Fund's registration statement. Borrowings are available for short-term liquidity or temporary or emergency purposes.
Effective October 14, 2010, interest is charged to each participating fund based on the fund's borrowings at a rate per annum equal to the greater of the Federal Funds Rate plus 1.25% or the overnight LIBOR Rate plus 1.25%. In addition, a commitment fee of 0.125% per annum is accrued and apportioned among the participating funds pro rata based on their relative net assets.
Prior to October 14, 2010, interest was charged to each participating fund at the same rates. In addition, a commitment fee of 0.15% per annum was accrued and apportioned among the participating funds pro rata based on their relative net assets.
For the year ended March 31, 2011, the Fund did not borrow under these arrangements.
Note 8. Federal Tax Information
The timing and character of income and capital gain distributions are determined in accordance with income tax regulations, which may differ from GAAP. Reclassifications are made to the Fund's capital accounts for permanent tax differences to reflect income and gains available for distribution (or available capital loss carryforwards) under income tax regulations.
For the year ended March 31, 2011, permanent book and tax basis differences resulting primarily from differing treatments for market discount adjustments were identified and reclassified among the components of the Fund's net assets as follows:
Overdistributed
Net Investment
Income | | Accumulated
Net Realized
Loss | | Paid-In Capital | |
| $ | 59,269 | | | $ | (59,270 | ) | | $ | 1 | | |
26
Columbia North Carolina Intermediate Municipal Bond Fund, March 31, 2011
Net investment income and net realized gains (losses), as disclosed on the Statement of Operations, and net assets were not affected by this reclassification.
The tax character of distributions paid during the years ended March 31, 2011 and March 31, 2010 was as follows:
| | | March 31, | |
| Distributions paid from: | | 2011 | | 2010 | |
| Tax-Exempt Income | | $ | 6,544,753 | | | $ | 6,939,301 | | |
| Ordinary Income* | | | 76,413 | | | | 69,082 | | |
* For tax purposes short-term capital gain distributions, if any, are considered ordinary income distributions.
As of March 31, 2011, the components of distributable earnings on a tax basis were as follows:
Undistributed
Tax-Exempt
Income | | Undistributed
Long-Term
Capital Gains | | Net Unrealized
Appreciation* | |
| $ | 1,159,972 | | | $ | — | | | $ | 3,861,979 | | |
* The differences between book-basis and tax-basis net unrealized appreciation are primarily due to deferral of losses from wash sales.
Unrealized appreciation and depreciation at March 31, 2011, based on cost of investments for federal income tax purposes were:
| Unrealized appreciation | | $ | 5,513,532 | | |
| Unrealized depreciation | | | (1,651,553 | ) | |
| Net unrealized appreciation | | $ | 3,861,979 | | |
The following capital loss carryforwards may be available to reduce taxable income arising from future net realized gains on investments, if any, to the extent permitted by the Internal Revenue Code:
| Year of Expiration | | Capital Loss
Carryforwards | |
| 2017 | | $ | 620,438 | | |
| 2018 | | | 2,905,585 | | |
| Total | | $ | 3,526,023 | | |
Capital loss carryforwards of $428,679 were utilized during the year ended March 31, 2011.
Management of the Fund has concluded that there are no significant uncertain tax positions that would require recognition in the financial statements. However, management's conclusion may be subject to review and adjustment at a later date based on factors including, but not limited to, new tax laws, regulations, and administrative interpretations (including relevant court decisions). The Fund's federal tax returns for the prior three fiscal years remain subject to examination by the Internal Revenue Service.
Note 9. Significant Risks and Contingencies
Sector Focus Risk
The Fund may focus its investments in certain sectors, subjecting it to greater risk than a fund that is less focused.
Geographic Concentration Risk
Securities issued by a particular state and its instrumentalities are subject to the risk of unfavorable developments in such state. The value of Fund shares may be more volatile than the value of shares of funds that invest in municipal securities of issuers in more than one state, as unfavorable developments have the potential to impact more significantly the Fund than funds that invest in municipal securities of many different states. A municipal security can be significantly affected by adverse tax, legislative, demographic or political changes as well as changes in the state's financial or economic condition and prospects.
The Fund's municipal holdings may include obligations of issuers that rely in whole or in part for payment of interest and principal on state specific revenues, real property taxes, revenues from particular institutions, such as healthcare institutions, or obligations secured by mortgages on real property. Consequently, the impact of changes in state law or regulations or the economic conditions in a particular state should be considered. The ability of issuers of debt securities held by the Fund to meet their obligations may be affected by economic developments in a specific industry or region.
Tax Development Risk
The Fund purchases municipal securities whose interest, in the opinion of bond counsel, is free from federal income tax. There is no assurance that the Internal Revenue Service (IRS) will agree with this opinion. In the event the IRS determines that an issuer does not comply with relevant tax requirements, interest payments from a security could become federally taxable, possibly retroactively to the
27
Columbia North Carolina Intermediate Municipal Bond Fund, March 31, 2011
date the security was issued. As a shareholder of the Fund, you may be required to file an amended tax return as a result.
Note 10. Subsequent Events
Management has evaluated the events and transactions that have occurred through the date the financial statements were issued. Other than as noted below, there were no items requiring adjustment of the financial statements or additional disclosure.
Effective May 16, 2011, the line of credit commitment with State Street was reduced to $150,000,000, and the maximum amount that may be borrowed by any fund was limited to the lesser of $120,000,000 and the Fund's borrowing limit set forth in the Fund's registration statement.
Note 11. Information Regarding Pending and Settled Legal Proceedings
In June 2004, an action captioned John E. Gallus et al. v. American Express Financial Corp. and American Express Financial Advisors Inc. was filed in the United States District Court for the District of Arizona. The plaintiffs allege that they are investors in several American Express Company (now known as RiverSource) mutual funds and they purport to bring the action derivatively on behalf of those funds under the Investment Company Act of 1940. The plaintiffs allege that fees allegedly paid to the defendants by the funds for investment advisory and administrative services are excessive. The plaintiffs seek remedies including restitution and rescission of investment advisory and distribution agreements. The plaintiffs voluntarily agreed to transfer this case to the United States District Court for the District of Minnesota (the District Court). In response to defendants' motion to dismiss the complaint, the District Court dismissed one of plaintiffs' four claims and granted plaintiffs limited discovery. Defendants moved for summary judgment in April 2007. Summary judgment was granted in the defendants' favor on July 9, 2007. The plaintiffs filed a notice of appeal with the Eighth Circuit Court of Appeals (the Eighth Circuit) on August 8, 2007. On April 8, 2009, the Eighth Circuit reversed summary judgment and remanded to the District Court for further proceedings. On August 6, 2009, defendants filed a writ of certiorari with the U.S. Supreme Court (the Supreme Court), asking the Supreme Court to stay the District Court proceedings while the Supreme Court considers and rules in a case captioned Jones v. Harris Associates, which involves issues of law similar to those presented in the Gallus case. On March 30, 2010, the Supreme Court issued its ruling in Jones v. Harris Associates, and on April 5, 2010, the Supreme Court vacated the Eighth Circuit's decision in the Gallus case and remanded the case to the Eighth Circuit for further consideration in light of the Supreme Court's decision in Jones v. Harris Associates. On June 4, 2010, the Eighth Circuit remanded the Gallus case to the District Court for further consideration in light of the Supreme Court's decision in Jones v. Harris Associates. On December 9, 2010, the District Court reinstated its July 9, 2007 summary judgment order in favor of the defendants. On January 10, 2011 plaintiffs filed a notice of appeal with the Eighth Circuit.
In December 2005, without admitting or denying the allegations, American Express Financial Corporation (AEFC, which is now known as Ameriprise Financial, Inc. (Ameriprise Financial)), entered into settlement agreements with the Securities and Exchange Commission (SEC) and Minnesota Department of Commerce (MDOC) related to market timing activities. As a result, AEFC was censured and ordered to cease and desist from committing or causing any violations of certain provisions of the Investment Advisers Act of 1940, the Investment Company Act of 1940, and various Minnesota laws. AEFC agreed to pay disgorgement of $10 million and civil money penalties of $7 million. AEFC also agreed to retain an independent distribution consultant to assist in developing a plan for distribution of all disgorgement and civil penalties ordered by the SEC in accordance with various undertakings detailed at http://www.sec.gov/litigation/admin/ia-2451.pdf. Ameriprise Financial and its affiliates have cooperated with the SEC and the MDOC in these legal proceedings, and have made regular reports to the funds' Boards of Directors/Trustees.
Ameriprise Financial and certain of its affiliates have historically been involved in a number of legal, arbitration and regulatory proceedings, including routine litigation, class actions, and governmental actions, concerning matters arising in connection with the conduct of their business activities. Ameriprise Financial believes that the Funds are not currently the subject of, and that neither Ameriprise Financial nor any of its affiliates are the subject of, any pending legal, arbitration or regulatory proceedings that are likely to have a material adverse effect on the Funds or the ability of Ameriprise Financial or its affiliates to perform under their contracts with the Funds. Ameriprise Financial is required to make 10-Q, 10-K and, as necessary, 8-K filings with the Securities and Exchange Commission on legal and regulatory matters that relate to Ameriprise Financial and its affiliates. Copies of these filings may be obtained by accessing the SEC website at www.sec.gov.
There can be no assurance that these matters, or the adverse publicity associated with them, will not result in increased fund redemptions,
28
Columbia North Carolina Intermediate Municipal Bond Fund, March 31, 2011
reduced sale of fund shares or other adverse consequences to the Funds. Further, although we believe proceedings are not likely to have a material adverse effect on the Funds or the ability of Ameriprise Financial or its affiliates to perform under their contracts with the Funds, these proceedings are subject to uncertainties and, as such, we are unable to estimate the possible loss or range of loss that may result. An adverse outcome in one or more of these proceedings could result in adverse judgments, settlements, fines, penalties or other relief that could have a material adverse effect on the consolidated financial condition or results of operations of Ameriprise Financial.
29
Report of Independent Registered Public Accounting Firm
To the Trustees of Columbia Funds Series Trust and the Shareholders of Columbia North Carolina Intermediate Municipal Bond Fund
In our opinion, the accompanying statement of assets and liabilities, including the investment portfolio, and the related statements of operations and of changes in net assets and the financial highlights present fairly, in all material respects, the financial position of Columbia North Carolina Intermediate Municipal Bond Fund (the "Fund") (a series of Columbia Funds Series Trust) at March 31, 2011, and the results of its operations for the year then ended, the changes in its net assets for each of the two years in the period then ended, and the financial highlights for each of the five years in the period then ended, in conformity with accounting principles generally accepted in the United States of America. These financial statements and financial highlights (hereafter referred to as "financial statements") are the responsibility of the Fund's management. Our responsibility is to express an opinion on these financial statements based on our audits. We conducted our audits of these financial statements in accordance with the standards of the Public Company Accounting Oversight Board (United States). Those standards require that we plan and perform the audit to obtain reasonable assurance about whether the financial statements are free of material misstatement. An audit includes examining, on a test basis, evidence supporting the amounts and disclosures in the financial statements, assessing the accounting principles used and significant estimates made by management, and evaluating the overall financial statement presentation. We believe that our audits, which included confirmation of securities at March 31, 2011 by correspondence with the custodian and brokers, provide a reasonable basis for our opinion.
PricewaterhouseCoopers LLP
Boston, Massachusetts
May 20, 2011
30
Federal Income Tax Information (Unaudited) – Columbia North Carolina Intermediate Municipal Bond Fund
For the fiscal year ended March 31, 2011, 98.85% of the distributions from net investment income of the Fund qualifies as exempt interest dividends for federal income tax purposes. A portion of the income may be subject to federal alternative minimum tax.
The Fund will notify shareholders in January 2012 of amounts for use in preparing 2011 income tax returns.
31
Fund Governance
The Trustees serve terms of indefinite duration. The names, addresses and birth years of the Trustees and Officers of the Funds in the Columbia Funds Series Trust, the year each was first elected or appointed to office, their principal business occupations during at least the last five years, the number of Funds overseen by each Trustee and other directorships they hold are shown below. Each officer listed below serves as an officer of each Fund in the Columbia Funds Series Trust.
Independent Trustees
Name, Address and Year of Birth,
Position with Funds, Year First
Elected or Appointed to Office | | Principal Occupation(s) During Past Five Years, Number of Funds in the Columbia
Funds Complex Overseen by Trustee, Other Directorships Held
| |
| Edward J. Boudreau, Jr. (Born 1944) | |
|
c/o Columbia Management
Investment Advisers, LLC
225 Franklin Street
Boston, MA 02110
Trustee (since 2005) | | Managing Director—E.J. Boudreau & Associates (consulting), from 2000 through current; oversees 41; Trustee—BofA Funds Series Trust. | |
|
| William P. Carmichael (Born 1943) | |
|
c/o Columbia Management
Investment Advisers, LLC
225 Franklin Street
Boston, MA 02110
Trustee (since 1999) | | Retired; oversees 41; Director—Cobra Electronics Corporation (electronic equipment manufacturer); Director—McMoRan Exploration Company (oil and gas exploration and development); Director—The Finish Line (athletic shoes and apparel); Trustee—BofA Funds Series Trust. | |
|
| William A. Hawkins (Born 1942) | |
|
c/o Columbia Management
Investment Advisers, LLC
225 Franklin Street
Boston, MA 02110
Trustee (since 2005) | | Managing Director—Overton Partners (financial consulting), August 2010 to present; President and Chief Executive Officer—California General Bank, N.A., from January 2008 through August 2010; oversees 41; Trustee—BofA Funds Series Trust. | |
|
| R. Glenn Hilliard (Born 1943) | |
|
c/o Columbia Management
Investment Advisers, LLC
225 Franklin Street
Boston, MA 02110
Trustee (since 2005) | | Chairman and Chief Executive Officer—Hilliard Group LLC (investing and consulting), from April 2003 through current; oversees 41; Trustee—BofA Funds Series Trust. | |
|
| John J. Nagorniak (Born 1944) | |
|
c/o Columbia Management
Investment Advisers, LLC
225 Franklin Street
Boston, MA 02110
Trustee (since 2008) | | Retired; President and Director—Foxstone Financial, Inc. (consulting), 2000 through December 2007; Director—Mellon Financial Corporation affiliates (investing), 2000 through 2007; Chairman—Franklin Portfolio Associates (investing—Mellon affiliate), 1982 through 2007; oversees 41; Director—MIT Investment Company; Trustee—MIT 401k Plan; Trustee—Research Foundation of CFA Institute; Trustee—BofA Funds Series Trust. | |
|
32
Fund Governance (continued)
Independent Trustees (continued)
Name, Address and Year of Birth,
Position with Funds, Year First
Elected or Appointed to Office | | Principal Occupation(s) During Past Five Years, Number of Funds in the Columbia
Funds Complex Overseen by Trustee, Other Directorships Held
| |
| Minor M. Shaw (Born 1947) | |
|
c/o Columbia Management
Investment Advisers, LLC
225 Franklin Street
Boston, MA 02110
Trustee (since 2003) | | President—Micco Corporation and Mickel Investment Group; oversees 41; Board Member—Piedmont Natural Gas; Trustee—BofA Funds Series Trust. | |
|
Interested Trustee
| Anthony M. Santomero1 (Born 1946) | |
|
c/o Columbia Management
Investment Advisers, LLC
225 Franklin Street
Boston, MA 02110
Trustee (since 2008) | | Richard K. Mellon Professor Emeritus of Finance, The Wharton School, University of Pennsylvania, from 2002 through current; Senior Advisor—McKinsey & Company (consulting), July 2006 through January 2008; President and Chief Executive Officer—Federal Reserve Bank of Philadelphia, July 2000 through April 2006; oversees 41; Director—Renaissance Reinsurance Ltd; Trustee—Penn Mutual Life Insurance Company; Director—Citigroup, Inc.; Director—Citibank, N.A.; Trustee—BofA Funds Series Trust. | |
|
1 Dr. Santomero is currently deemed by the Columbia Funds to be an "interested person" (as defined in the 1940 Act) of the Funds because he serves as a Director of Citigroup, Inc. and Citibank, N.A., companies that may directly or through subsidiaries and affiliates engage from time-to-time in brokerage execution, principal transactions and lending relationships with the Columbia Funds or other funds or accounts advised/managed by Columbia Management Investment Advisers, LLC.
The Statement of Additional Information includes additional information about the Trustees of the Funds and is available, without charge, upon request by calling 800-345-6611.
Officers
| Name, Year of Birth and Address | | Principal Occupation(s) During the Past Five Years | |
| J. Kevin Connaughton (Born 1964) | |
|
225 Franklin Street
Boston, MA 02110
President (since 2009) | | Senior Vice President and General Manager—Mutual Fund Products, Columbia Management Investment Advisers, LLC since May 2010; President, Columbia Funds, since 2009, and RiverSource Funds, since May 2010 (previously Senior Vice President and Chief Financial Officer, Columbia Funds, from June 2008 to January 2009, Treasurer, Columbia Funds, from October 2003 to May 2008, and senior officer of various other affiliated funds since 2000); Managing Director, Columbia Management Advisors, LLC from December 2004 to April 2010. | |
|
| Michael G. Clarke (Born 1969) | |
|
225 Franklin Street
Boston, MA 02110
Treasurer (since 2011) and
Chief Financial Officer (since 2009) | | Vice President, Columbia Management Investment Advisers, LLC since May 2010; Managing Director of Fund Administration, Columbia Management Advisors, LLC, from September 2004 to April 2010; senior officer of Columbia Funds and affiliated funds since 2002. | |
|
33
Fund Governance (continued)
Officers (continued)
| Name, Year of Birth and Address | | Principal Occupation(s) During the Past Five Years | |
| Scott R. Plummer (Born 1959) | |
|
5228 Ameriprise Financial Center
Minneapolis, MN 55474
Senior Vice President and
Chief Legal Officer (since 2010) | | Chief Legal Officer and Assistant Secretary, Columbia Management Investment Advisers, LLC since June 2005; Vice President and Lead Chief Counsel—Asset Management, Ameriprise Financial, Inc. since May 2010 (previously Vice President and Chief Counsel—Asset Management, from 2005 to April 2010, and Vice President—Asset Management Compliance from 2004 to 2005); Vice President, Chief Counsel and Assistant Secretary, Columbia Management Investment Distributors, Inc. since 2008; Vice President, General Counsel and Secretary, Ameriprise Certificate Company since 2005; Chief Counsel, RiverSource Distributors, Inc. since 2006; Vice President, General Counsel and Secretary, RiverSource Funds, since December 2006; Senior Vice President, Secretary and Chief Legal Officer, Columbia Funds, since May 2010. | |
|
| Linda J. Wondrack (Born 1964) | |
|
225 Franklin Street
Boston, MA 02110
Senior Vice President and
Chief Compliance Officer (since 2007) | | Vice President and Chief Compliance Officer, Columbia Management Investment Advisers, LLC since May 2010; Chief Compliance Officer, Columbia Funds, since 2007, and RiverSource Funds, since May 2010; Director (Columbia Management Group, LLC and Investment Product Group Compliance), Bank of America, from June 2005 to April 2010. | |
|
| William F. Truscott (Born 1960) | |
|
53600 Ameriprise Financial Center
Minneapolis, MN 55474
Senior Vice President (since 2010) | | Chairman of the Board, Columbia Management Investment Advisers, LLC since May 2010 (previously President, Chairman of the Board and Chief Investment Officer, from 2001 to April 2010); Chief Executive Officer, U.S. Asset Management & President, Annuities, Ameriprise Financial, Inc. since May 2010 (previously President—U.S. Asset Management and Chief Investment Officer from 2005 to April 2010, and Senior Vice President—Chief Investment Officer, from 2001 to 2005); Director, President and Chief Executive Officer, Ameriprise Certificate Company since 2006; Director, Columbia Management Investment Distributors, Inc. since May 2010 (previously Chairman of the Board and Chief Executive Officer from 2008 to April 2010); Chairman of the Board and Chief Executive Officer, RiverSource Distributors, Inc. since 2006. | |
|
| Colin Moore (Born 1958) | |
|
225 Franklin Street
Boston, MA 02110
Senior Vice President (since 2010) | | Director and Chief Investment Officer, Columbia Management Investment Advisers, LLC since May 2010; Manager, Managing Director and Chief Investment Officer of Columbia Management Advisors, LLC from 2007 to April 2010; Head of Equities, Columbia Management Advisors, LLC from 2002 to 2007. | |
|
| Michael A. Jones (Born 1959) | |
|
225 Franklin Street
Boston, MA 02110
Senior Vice President (since 2010) | | President and Director, Columbia Management Investment Advisers, LLC since May 2010; President and Director, Columbia Management Investment Distributors, Inc. since May 2010; Manager, Chairman, Chief Executive Officer and President, Columbia Management Advisors, LLC from 2007 to April 2010; Chief Executive Officer, President and Director, Columbia Management Distributors, Inc. from November 2006 to April 2010; previously, co-president and senior managing director at Robeco Investment Management. | |
|
34
Fund Governance (continued)
Officers (continued)
| Name, Year of Birth and Address | | Principal Occupation(s) During the Past Five Years | |
| Christopher O. Petersen (Born 1970) | |
|
5228 Ameriprise Financial Center
Minneapolis, MN 55474
Vice President and
Secretary (since 2011) | | Vice President and Chief Counsel, Ameriprise Financial since January 2010 (formerly Vice President and Group Counsel or Counsel from April 2004 to January 2010); Assistant Secretary of RiverSource Funds since January 2007. | |
|
| Amy Johnson (Born 1965) | |
|
5228 Ameriprise Financial Center
Minneapolis, MN 55474
Vice President (since 2010) | | Senior Vice President and Chief Operating Officer, Columbia Management Investment Advisers, LLC since May 2010 (previously Chief Administrative Officer, from 2009 until April 2010, Vice President—Asset Management and Trust Company Services, from 2006 to 2009, and Vice President—Operations and Compliance from 2004 to 2006). | |
|
| Joseph F. DiMaria (Born 1968) | |
|
225 Franklin Street
Boston, MA 02110
Vice President (since 2011) and
Chief Accounting Officer (since 2008) | | Vice President, Mutual Fund Administration, Columbia Management Investment Advisers, LLC, since May 2010; Director of Fund Administration, Columbia Management Advisors, LLC from January 2006 to April 2010; Head of Tax/Compliance and Assistant Treasurer, Columbia Management Advisors, LLC, from November 2004 to December 2005. | |
|
| Paul B. Goucher (Born 1968) | |
|
5228 Ameriprise Financial Center
Minneapolis, MN 55474
Vice President and
Assistant Treasurer (since 2010) | | Vice President and Chief Counsel of Ameriprise Financial since January 2010 (formerly Vice President and Group Counsel from November 2008 to January 2010); Director, Managing Director and General Counsel of J. & W. Seligman & Co. Incorporated (Seligman) from July 2008 to November 2008 and Managing Director and Associate General Counsel of Seligman from January 2005 to July 2008. | |
|
| Michael E. DeFao (Born 1968) | |
|
5228 Ameriprise Financial Center
Minneapolis, MN 55474
Vice President and
Assistant Treasurer (since 2011) | | Vice President and Chief Counsel, Ameriprise Financial since May 2010; Associate General Counsel Bank of America from June 2005 to April 2010. | |
|
| Stephen T. Welsh (Born 1957) | |
|
225 Franklin Street
Boston, MA 02110
Vice President (since 2006) | | President and Director, Columbia Management Investment Services Corp. since May 2010; President and Director, Columbia Management Services, Inc. from July 2004 to April 2010; Managing Director, Columbia Management Distributors, Inc. from August 2007 to April 2010. | |
|
35
Shareholder Meeting Results
At a Joint Special Meeting of Shareholders held on February 15, 2011, shareholders of the series of Columbia Funds Series Trust, including the Fund, elected each of the nominees for trustees to the Board of Trustees of Columbia Funds Series Trust, each to hold office for an indefinite term, as follows:
| Trustee | | Votes For | | Votes Withheld | | Abstentions | |
| Kathleen Blatz | | | 2,145,636,122 | | | | 248,012,438 | | | | 0 | | |
| Edward J. Boudreau, Jr. | | | 2,145,430,114 | | | | 248,218,446 | | | | 0 | | |
| Pamela G. Carlton | | | 2,145,515,949 | | | | 248,132,612 | | | | 0 | | |
| William P. Carmichael | | | 2,145,038,695 | | | | 248,609,866 | | | | 0 | | |
| Patricia M. Flynn | | | 2,145,843,563 | | | | 247,804,997 | | | | 0 | | |
| William A. Hawkins | | | 2,145,359,401 | | | | 248,289,160 | | | | 0 | | |
| R. Glenn Hilliard | | | 2,145,079,400 | | | | 248,569,161 | | | | 0 | | |
| Stephen R. Lewis, Jr. | | | 2,145,092,209 | | | | 248,556,351 | | | | 0 | | |
| John F. Maher | | | 2,145,621,338 | | | | 248,027,223 | | | | 0 | | |
| John J. Nagorniak | | | 2,145,337,494 | | | | 248,311,067 | | | | 0 | | |
| Catherine James Paglia | | | 2,145,615,254 | | | | 248,033,306 | | | | 0 | | |
| Leroy C. Richie | | | 2,145,042,120 | | | | 248,606,441 | | | | 0 | | |
| Anthony M. Santomero | | | 2,145,088,174 | | | | 248,560,386 | | | | 0 | | |
| Minor M. Shaw | | | 2,145,430,762 | | | | 248,217,798 | | | | 0 | | |
| Alison Taunton-Rigby | | | 2,145,393,384 | | | | 248,255,177 | | | | 0 | | |
| William F. Truscott | | | 2,144,907,223 | | | | 248,741,338 | | | | 0 | | |
36
Important Information About This Report
The fund mails one shareholder report to each shareholder address. If you would like more than one report, please call shareholder services at 1-800-345-6611 and additional reports will be sent to you. This report has been prepared for shareholders of Columbia North Carolina Intermediate Municipal Bond Fund.
A description of the policies and procedures that the fund uses to determine how to vote proxies and a copy of the fund's voting records are available (i) at www.columbiamanagement.com, (ii) on the Securities and Exchange Commission's website at www.sec.gov, and (iii) without charge, upon request, by calling 1-800-368-0346. Information regarding how the fund voted proxies relating to portfolio securities during the 12-month period ended June 30 is available from the SEC's website. Information regarding how the fund voted proxies relating to portfolio securities is also available from the fund's website, www.columbiamanagement.com.
The fund files a complete schedule of portfolio holdings with the SEC for the first and third quarters of each fiscal year on Form N-Q. The fund's Form N-Q is available on the SEC's website at www.sec.gov and may be reviewed and copied at the SEC's Public Reference Room in Washington, D.C. Information on the operation of the Public Reference Room may be obtained by calling 1-800-SEC-0330.
Transfer Agent
Columbia Management Investment
Services Corp.
P.O. Box 8081
Boston, MA 02266-8081
1-800-345-6611
Distributor
Columbia Management Investment
Distributors, Inc.
225 Franklin Street
Boston, MA 02110
Investment Manager
Columbia Management Investment Advisers, LLC
225 Franklin Street
Boston, MA 02110
37

PRSRT STD
U.S. Postage
PAID
Holliston, MA
Permit NO. 20
Columbia North Carolina Intermediate Municipal Bond Fund
P. O. Box 8081
Boston, MA 02266-8081
columbiamanagement.com
This information is for use with concurrent or prior delivery of a fund prospectus. Investors should consider the investment objectives, risks, charges and expenses of a mutual fund carefully before investing. For a free prospectus, which contains this and other important information about the funds, visit columbiamanagement.com. Read the prospectus carefully before investing. The Fund is distributed by Columbia Management Investment Distributors, Inc., member FINRA, and managed by Columbia Management Investment Advisers, LLC.
© 2011 Columbia Management Investment Advisers, LLC. All rights reserved.
C-1096 A (05/11)

Columbia South Carolina Intermediate Municipal Bond Fund
Annual Report for the Period Ended March 31, 2011
Not FDIC insured • No bank guarantee • May lose value
Table of Contents
| Fund Profile | | | 1 | | |
|
| Economic Update | | | 2 | | |
|
| Performance Information | | | 4 | | |
|
| Understanding Your Expenses | | | 5 | | |
|
| Portfolio Manager's Report | | | 6 | | |
|
| Investment Portfolio | | | 8 | | |
|
Statement of Assets and
Liabilities | | | 13 | | |
|
| Statement of Operations | | | 14 | | |
|
Statement of Changes in
Net Assets | | | 15 | | |
|
| Financial Highlights | | | 17 | | |
|
| Notes to Financial Statements | | | 21 | | |
|
Report of Independent Registered
Public Accounting Firm | | | 28 | | |
|
| Federal Income Tax Information | | | 29 | | |
|
| Fund Governance | | | 30 | | |
|
| Shareholder Meeting Results | | | 34 | | |
|
Important Information About
This Report | | | 37 | | |
|
The views expressed in this report reflect the current views of the respective parties. These views are not guarantees of future performance and involve certain risks, uncertainties and assumptions that are difficult to predict, so actual outcomes and results may differ significantly from the views expressed. These views are subject to change at any time based upon economic, market or other conditions and the respective parties disclaim any responsibility to update such views. These views may not be relied on as investment advice and, because investment decisions for a Columbia Fund are based on numerous factors, may not be relied on as an indication of trading intent on behalf of any particular Columbia Fund. References to specific securities should not be construed as a recommendation or investment advice.
President's Message

Dear Shareholder:
The Columbia Management story began over 100 years ago, and today, we are one of the nation's largest dedicated asset managers. The recent acquisition by Ameriprise Financial, Inc. brings together the talents, resources and capabilities of Columbia Management with those of RiverSource Investments, Threadneedle (acquired by Ameriprise in 2003) and Seligman Investments (acquired by Ameriprise in 2008) to build a best-in-class asset management business that we believe is truly greater than its parts.
RiverSource Investments traces its roots to 1894 when its then newly-founded predecessor, Investors Syndicate, offered a face-amount savings certificate that gave small investors the opportunity to build a safe and secure fund for retirement, education or other special needs. A mutual fund pioneer, Investors Syndicate launched Investors Mutual Fund in 1940. In the decades that followed, its mutual fund products and services lineup grew to include a full spectrum of styles and specialties. More than 110 years later, RiverSource continues to be a trusted financial products leader.
Threadneedle, a leader in global asset management and one of Europe's largest asset managers, offers sophisticated international experience from a dedicated U.K. management team. Headquartered in London, it is named for Threadneedle Street in the heart of the city's financial district, where British investors pioneered international and global investing. Threadneedle was acquired in 2003 and today operates as an affiliate of Columbia Management.
Seligman Investments' beginnings date back to the establishment of the investment firm J. & W. Seligman & Co. in 1864. In the years that followed, Seligman played a major role in the geographical expansion and industrial development of the United States. In 1874, President Ulysses S. Grant named Seligman as fiscal agent for the U.S. Navy—an appointment that would last through World War I. Seligman helped finance the westward path of the railroads and the building of the Panama Canal. The firm organized its first investment company in 1929 and began managing its first mutual fund in 1930. In 2008, J. & W. Seligman & Co. Incorporated was acquired and Seligman Investments became an offering brand of RiverSource Investments, LLC.
We are proud of the rich and distinctive history of these firms, the strength and breadth of products and services they offer, and the combined cultures of pioneering spirit and forward thinking. Together we are committed to providing more for our shareholders than ever before.
> A singular focus on our shareholders
Our business is asset management, so investors are our first priority. We dedicate our resources to identifying timely investment opportunities and provide a comprehensive choice of equity, fixed-income and alternative investments to help meet your individual needs.
> First-class research and thought leadership
We are dedicated to helping you take advantage of today's opportunities and anticipate tomorrow's. We stay abreast of the latest investment trends and ideas, using our collective insight to evaluate events and transform them into solutions you can use.
> A disciplined investment approach
We aren't distracted by passing fads. Our teams adhere to a rigorous investment process that helps ensure the integrity of our products and enables you and your financial advisor to match our solutions to your objectives with confidence.
When you choose Columbia Management, you can be confident that we will take the time to understand your needs and help you and your financial advisor identify the solutions that are right for you. Because at Columbia Management, we don't consider ourselves successful unless you are.
Sincerely,

J. Kevin Connaughton
President, Columbia Funds
Investors should consider the investment objectives, risks, charges and expenses of a mutual fund carefully before investing. For a free prospectus, which contains this and other important information about the funds, visit www.columbiamanagement.com. The prospectus should be read carefully before investing.
Columbia Funds are distributed by Columbia Management Investment Distributors, Inc., member FINRA, and managed by Columbia Management Investment Advisers, LLC.
© 2011 Columbia Management Investment Advisers, LLC. All rights reserved.
Fund Profile – Columbia South Carolina Intermediate Municipal Bond Fund
Summary
g For the 12-month period that ended March 31, 2011, the fund's Class A shares returned 2.54% without sales charge.
g The fund underperformed its benchmark, the Barclays Capital 3-15 Year Blend Municipal Bond Index,1 but outperformed the average return of funds in its peer group, the Lipper Other States Intermediate Municipal Debt Funds Classification.2
g The fund's focus on South Carolina contributed to underperformance relative to the Barclays index, which is national in scope. Overweights and strong security selection in the best performing maturity ranges aided results.
Portfolio Management
James M. D'Arcy has managed the fund since 2010. From 1999 until joining the Investment Manager in May 2010, Mr. D'Arcy was associated with the fund's previous investment adviser as an investment professional.
1The Barclays Capital 3-15 Year Blend Municipal Bond Index tracks the performance of municipal bonds issued after December 31, 1990 with remaining maturities between 2 and 17 years and at least $7 million in principal amount outstanding.
2Lipper Inc., a widely respected data provider in the industry, calculates an average total return (assuming reinvestment of distributions) for mutual funds with investment objectives similar to those of the fund. Lipper makes no adjustment for the effect of sales loads.
Indices are not available for investment, are not professionally managed and do not reflect sales charges, fees, brokerage commissions, taxes or other expenses of investing. Securities in the fund may not match those in an index.
Performance data quoted represents past performance and current performance may be lower or higher. Past performance is no guarantee of future results. The investment return and principal value will fluctuate so that shares, when redeemed, may be worth more or less than the original cost. Please visit www.columbiamanagement.com for daily and most recent month-end performance updates.
Summary
1-year return as of 03/31/11
| | +2.54% | |
|
 | | Class A shares
(without sales charge) | |
|
| | +2.91% | |
|
 | | Barclays Capital 3-15 Year Blend Municipal Bond Index | |
|
1
Economic Update – Columbia South Carolina Intermediate Municipal Bond Fund
Summary
For the 12-month period that ended March 31, 2011
g Strengthening economic growth and rising interest rates kept a lid on most bond market sectors. The Barclays Capital Aggregate Bond Index delivered modest results. However, high-yield bonds were strong performers, as measured by the JPMorgan Developed BB High Yield Index.
Barclays
Aggregate Index | | JPMorgan
Index | |
|
 | |  | |
|
g The U.S. stock market, as measured by the S&P 500 Index, delivered solid returns, despite a summer 2010 correction. Foreign stock market returns were also positive, as measured by the MSCI EAFE Index (Net).
| S&P Index | | MSCI Index | |
|
 | |  | |
|
The U.S. economy continued to expand at a solid but uneven pace over the past 12 months, as measured by gross domestic product (GDP). Although lackluster second quarter 2010 GDP growth raised fears that the economy was losing steam and might lapse back into recession, the pace picked up in the third quarter of 2010, inspiring confidence among consumers, businesses and investors. GDP expanded by 2.6% in the third quarter and 3.1% in the fourth quarter. With the Federal Reserve Board (the Fed) providing additional monetary stimulus to shore up economic growth and the extension of key tax cuts for the next two years, expectations are for continued growth in 2011. However, early estimates of first quarter 2011 growth place it just under 2.0%, a disappointment after two strong quarters and a pick-up in employment.
Consumer spending on cars, clothing and other goods generally trended higher during the 12-month period, accelerating in the fourth quarter of 2010. Holiday spending rose 5.5% between November 5, 2010 and December 24, 2010, in all retail categories, excluding automobiles, compared with the same period in 2009, according to MasterCard Advisors' SpendingPulse, which tracks spending on all transactions including cash. Personal income surged in January 2011, as payroll tax cuts kicked in. The personal savings rate edged higher, ending February 2011, the last month for which data was available, at 5.8%.
News on the job front was increasingly positive. A good portion of the jobs added in March, April and May of 2010 were temporary, government-sponsored census positions, which began to unwind in June, July and August 2010. However, private sector payroll employment began to trend higher in the third quarter, massive layoffs declined and job growth turned solidly positive, with the addition of 444,000 new jobs in the first quarter of 2011.
Despite some glimmers of improvement early in 2010, the housing market remained troublesome throughout the period. Both new and existing home sales fell after a federal tax credit for new and repeat homebuyers expired. Distressed properties pressured prices and foreclosures continued—another drag on prices. The inventory of unsold homes ended the period higher than it started, at 8.9 and 8.6 months for new and existing homes, respectively, according to the National Association of Realtors and a joint release from the U.S. Census Bureau and the U.S. Department of Housing and Urban Development. The new year brought more disappointing news: Existing home sales fell in January 2011 after three months of sustained improvement. Tight credit and weak appraisals were cited as possible reasons for the decline.
Reports from the business side of the economy were generally positive. A key measure of the nation's manufacturing situation—the Institute for Supply Management's Index—took a somewhat surprising turn higher in the final months of the period. Technology spending rose 12% in 2010, according to the NPD Group, a national marketing research firm. Purchases of computers, networking and software returned to prerecession levels. Industrial production rose over the period, and manufacturing capacity utilized, per the report issued be the Fed—a key measure of the health of the manufacturing sector—also edged higher.
2
Economic Update (continued) – Columbia South Carolina Intermediate Municipal Bond Fund
Bonds delivered modest returns
As the economy strengthened and interest rates edged higher, most bond sectors delivered modest returns. The Barclays Capital Aggregate Bond Index1 returned 5.12%. High-yield bonds led the fixed-income markets. For the 12 months covered by this report, the JPMorgan Developed BB High Yield Index2 returned 13.04% as default fears abated and investors grew more comfortable with risk. Despite rising yields in the second half of the period, the Treasury market was also positive. The Barclays Capital U.S. Treasury Index3 returned 4.53%. However, municipal bonds struggled in the second half of the period, as interest rates inched higher and issue supply surged ahead of the year-end expiration of the Build America Bonds program. The Barclays Capital Municipal Bond Index4 gained 1.63% for the period. Despite positive economic activity, the Fed kept a key short-term interest rate—the federal funds rate—close to zero, reflecting ongoing concerns about employment and the housing market.
Stocks moved higher despite summer 2010 decline
Against a strengthening economic backdrop, stock prices continued to rally despite a summer 2010 setback linked to a debt crisis brewing in Europe, which raised concerns among U.S. investors. These fears were short-lived and stocks regained their footing. In this environment, the S&P 500 Index5 returned 15.65% for the 12 months through March 31, 2011. Outside the United States, stock markets also delivered solid gains. The MSCI EAFE Index (Net),6 a broad gauge of stock market performance in foreign developed markets, returned 10.42% (in U.S. dollars) for the 12-month period, as concerns about the impact of a bailout for weak euro zone economies eased yet continued to restrain market performance. Emerging stock markets were strong. The MSCI Emerging Markets Index (Net)7 returned 18.46% (in U.S. dollars) for the 12-month period.
Past performance is no guarantee of future results.
1The Barclays Capital Aggregate Bond Index is a market value-weighted index that tracks the daily price, coupon, pay-downs and total return performance of fixed-rate, publicly placed, dollar-denominated and non-convertible investment grade debt issues with at least $250 million par amount outstanding and with at least one year to final maturity.
2The JPMorgan Developed BB High Yield Index is an unmanaged index designed to mirror the investable universe of the U.S. dollar developed, BB-rated, high yield corporate debt market.
3The Barclays Capital U.S. Treasury Index includes public obligations of the U.S. Treasury. Treasury bills are excluded by the maturity constraint. In addition, certain special issues, such as state and local government series bonds (SLGs), as well as U.S. Treasury TIPS, are excluded. STRIPS are excluded from the index because their inclusion would result in double-counting.
4The Barclays Capital Municipal Bond Index is considered representative of the broad market for investment-grade, tax-exempt bonds with a maturity of at least one year.
5The Standard & Poor's (S&P) 500 Index tracks the performance of 500 widely held, large-capitalization U.S. stocks.
6The Morgan Stanley Capital International Europe, Australasia, Far East (MSCI EAFE) Index (Net) is a free float- adjusted market capitalization index that is designed to measure the equity market performance of developed markets, excluding the U.S. & Canada. As of December 31, 2010, the MSCI EAFE Index (Net) consisted of the following 22 developed market country indices: Australia, Austria, Belgium, Denmark, Finland, France, Germany, Greece, Hong Kong, Ireland, Israel, Italy, Japan, the Netherlands, New Zealand, Norway, Portugal, Singapore, Spain, Sweden, Switzerland and the United Kingdom.
7The Morgan Stanley Capital International Emerging Markets (MSCI EM) Index (Net) is a free float-adjusted market capitalization index that is designed to measure equity market performance of emerging markets. As of December 31, 2010, the MSCI EM Index (Net) consisted of the following 21 emerging market country indices: Brazil, Chile, China, Colombia, Czech Republic, Egypt, Hungary, India, Indonesia, Korea, Malaysia, Mexico, Morocco, Peru, Philippines, Poland, Russia, South Africa, Taiwan, Thailand and Turkey.
Indices are not available for investment, are not professionally managed and do not reflect sales charges, fees, brokerage commissions, taxes or other expenses of investing. Securities in the fund may not match those in an index.
3
Performance Information – Columbia South Carolina Intermediate Municipal Bond Fund
Performance data quoted represents past performance and current performance may be lower or higher. Past performance is no guarantee of future results. The investment return and principal value will fluctuate so that shares, when redeemed, may be worth more or less than the original cost. Please visit www.columbiamanagement.com for daily and most recent month-end performance updates.
Performance of a $10,000 investment 04/01/01 – 03/31/11
The chart above shows the change in value of a hypothetical $10,000 investment in Class A shares of Columbia South Carolina Intermediate Municipal Bond Fund during the stated time period, and does not reflect the deduction of taxes that a shareholder may pay on fund distributions or on the redemption of fund shares.
Performance of a $10,000 investment 04/01/01 – 03/31/11 ($)
| Sales charge | | without | | with | |
| Class A | | | 14,296 | | | | 13,828 | | |
| Class B | | | 13,270 | | | | 13,270 | | |
| Class C | | | 13,262 | | | | 13,262 | | |
| Class Z | | | 14,656 | | | | n/a | | |
Average annual total return as of 03/31/11 (%)
| Share class | | A | | B | | C | | Z | |
| Inception | | 05/05/92 | | 06/08/93 | | 06/17/92 | | 01/06/92 | |
| Sales charge | | without | | with | | without | | with | | without | | with | | without | |
| 1-year | | | 2.54 | | | | –0.78 | | | | 1.70 | | | | –1.27 | | | | 1.68 | | | | 0.69 | | | | 2.70 | | |
| 5-year | | | 3.47 | | | | 2.79 | | | | 2.70 | | | | 2.70 | | | | 2.67 | | | | 2.67 | | | | 3.72 | | |
| 10-year | | | 3.64 | | | | 3.29 | | | | 2.87 | | | | 2.87 | | | | 2.86 | | | | 2.86 | | | | 3.90 | | |
The "with sales charge" returns include the maximum initial sales charge of 3.25% for Class A shares and the applicable contingent deferred sales charge of 3.00% in the first year, declining to 1.00% in the fourth year and eliminated thereafter for Class B shares and 1.00% for Class C shares for the first year only. The "without sales charge" returns do not include the effect of sales charges. If they had, returns would be lower.
Performance results reflect any fee waivers or reimbursements of fund expenses by the Investment Manager and/or any of its affiliates. Absent these fee waivers or expense reimbursement arrangements, performance results would have been lower.
All results shown assume reinvestment of distributions. Class Z shares are sold at net asset value with no distribution and service (Rule 12b-1) fees. Class Z shares have limited eligibility and the investment minimum requirements may vary. Please see the fund's prospectus for details. Performance for different share classes will vary based on differences in sales charges and fees associated with each class.
The tables do not reflect the deduction of taxes that a shareholder may pay on fund distributions or on the redemption of fund shares.
4
Understanding Your Expenses – Columbia South Carolina Intermediate Municipal Bond Fund
As a fund shareholder, you incur two types of costs. There are transaction costs, which generally include sales charges on purchases and may include redemption fees or exchange fees. There are also ongoing costs, which generally include investment advisory fees, distribution and service (Rule 12b-1) fees and other fund expenses. The information on this page is intended to help you understand the ongoing costs of investing in the fund and to compare these costs with the ongoing costs of investing in other mutual funds.
Analyzing your fund's expenses by share class
To illustrate these ongoing costs, we have provided an example and calculated the expenses paid by investors in each share class during the period. The information in the following table is based on an initial investment of $1,000, which is invested at the beginning of the period and held for the entire period. Expense information is calculated two ways and each method provides you with different information. The amount listed in the "Actual" column is calculated using the fund's actual operating expenses and total return for the period. The amount listed in the "Hypothetical" column for each share class assumes that the return each year is 5% before expenses and is calculated based on the fund's actual operating expenses. You should not use the hypothetical account values and expenses to estimate either your actual account balance at the end of the period or the expenses you paid during this period.
Compare with other funds
Since all mutual funds are required to include the same hypothetical calculations about expenses in shareholder reports, you can use this information to compare the ongoing cost of investing in the fund with other funds. To do so, compare the 5% hypothetical example with the 5% hypothetical examples that appear in the shareholder reports of other funds. As you compare hypothetical examples of other funds, it is important to note that hypothetical examples are meant to highlight the ongoing costs of investing in a fund and do not reflect any transaction costs, such as sales charges, redemption fees or exchange fees.
Estimating your actual expenses
To estimate the expenses that you paid over the period, first you will need your account balance at the end of the period:
g For shareholders who receive their account statements from Columbia Management Investment Services Corp., your account balance is available online at www.columbiamanagement.com or by calling Shareholder Services at 800.345.6611.
g For shareholders who receive their account statements from their financial intermediary, contact your financial intermediary to obtain your account balance.
1. Divide your ending account balance by $1,000. For example, if an account balance was $8,600 at the end of the period, the result would be 8.6.
2. In the section of the table below titled "Expenses paid during the period," locate the amount for your share class. You will find this number in the column labeled "Actual." Multiply this number by the result from step 1. Your answer is an estimate of the expenses you paid on your account during the period.
If the value of your account falls below the minimum initial investment requirement applicable to you, your account may be subject to a $20 annual fee. This fee is not included in the accompanying table. If you are subject to the fee, keep it in mind when you are estimating the ongoing expenses of investing in the fund and when comparing the expenses of this fund with other funds.
10/01/10 – 03/31/11
| | | Account value at the
beginning of the period ($) | | Account value at the
end of the period ($) | | Expenses paid
during the period ($) | | Fund's annualized
expense ratio (%) | |
| | | Actual | | Hypothetical | | Actual | | Hypothetical | | Actual | | Hypothetical | | Actual | |
| Class A | | | 1,000.00 | | | | 1,000.00 | | | | 974.70 | | | | 1,020.94 | | | | 3.94 | | | | 4.03 | | | | 0.80 | | |
| Class B | | | 1,000.00 | | | | 1,000.00 | | | | 971.30 | | | | 1,017.20 | | | | 7.62 | | | | 7.80 | | | | 1.55 | | |
| Class C | | | 1,000.00 | | | | 1,000.00 | | | | 970.20 | | | | 1,017.20 | | | | 7.61 | | | | 7.80 | | | | 1.55 | | |
| Class Z | | | 1,000.00 | | | | 1,000.00 | | | | 976.00 | | | | 1,022.19 | | | | 2.71 | | | | 2.77 | | | | 0.55 | | |
Expenses paid during the period are equal to the annualized expense ratio for the share class, multiplied by the average account value over the period, then multiplied by the number of days in the fund's most recent fiscal half-year and divided by 365.
Had the Investment Manager and/or any of its affiliates not waived fees or reimbursed a portion of expenses, account value at the end of the period would have been reduced.
It is important to note that the expense amounts shown in the table are meant to highlight only ongoing costs of investing in the fund and do not reflect any transaction costs, such as sales charges, redemption fees or exchange fees. Therefore, the hypothetical examples provided may not help you determine the relative total costs of owning shares of different funds. If these transaction costs were included, your costs would have been higher.
5
Portfolio Manager's Report – Columbia South Carolina Intermediate Municipal Bond Fund
Performance data quoted represents past performance and current performance may be lower or higher. Past performance is no guarantee of future results. The investment return and principal value will fluctuate so that shares, when redeemed, may be worth more or less than the original cost. Please visit www.columbiamanagement.com for daily and most recent month-end performance updates.
Net asset value per share
as of 03/31/11 ($)
| Class A | | | 10.08 | | |
| Class B | | | 10.08 | | |
| Class C | | | 10.08 | | |
| Class Z | | | 10.08 | | |
Distributions declared per share
04/01/10 – 03/31/11 ($)
| Class A | | | 0.35 | | |
| Class B | | | 0.28 | | |
| Class C | | | 0.27 | | |
| Class Z | | | 0.38 | | |
A portion of the fund's income may be subject to the alternative minimum tax. The fund may at times purchase tax-exempt securities at a discount. Some or all of this discount may be included in the fund's ordinary income, and is taxable when distributed.
30-day SEC yields
as of 03/31/11 (%)
| Class A | | | 2.73 | | |
| Class B | | | 2.29 | | |
| Class C | | | 2.06 | | |
| Class Z | | | 3.07 | | |
The 30-day SEC yields reflect the fund's earning power, net of expenses, expressed as an annualized percentage of the public offering price per share at the end of the period.
Taxable-equivalent SEC yields
as of 03/31/11 (%)
| Class A | | | 4.52 | | |
| Class B | | | 3.79 | | |
| Class C | | | 3.41 | | |
| Class Z | | | 5.08 | | |
Taxable-equivalent SEC yields are based on the combined maximum effective 35.0% federal income tax rate and applicable state income tax rate. This tax rate does not reflect the phase out of exemptions or the reduction of the otherwise allowable deductions that occur when adjusted gross income exceeds certain levels. Your taxable-equivalent yield may be different depending on your tax bracket.
For the 12-month period that ended March 31, 2011, the fund's Class A shares returned 2.54% without sales charge. By comparison, the fund's benchmark, the Barclays Capital 3-15 Year Blend Municipal Bond Index, returned 2.91%. The average return of the fund's peer group, the Lipper Other States Intermediate Municipal Debt Funds Classification, was 1.76%. Some of the fund's underperformance relative to the benchmark came from the fact that it focuses on South Carolina while the benchmark is national in scope. Sector allocation and strong security selection within the best-performing maturity ranges benefited results.
Gains from positioning and security selection
The fund's positioning across the maturity spectrum gave the fund its biggest boost in performance relative to the index. The fund had more exposure than the index to six- to eight- and eight- to 12-year municipal bonds, the two best performing segments within the intermediate maturity range. It had less exposure than the index to 12- to 17-year bonds, and that further aided results. These longer-maturity issues were hard hit by heavy fourth-quarter 2010 selling as investors became concerned about the year-end expiration of the Build America Bonds (BABs) program, which gave qualifying municipal issuers a less expensive financing option for large infrastructure projects. Investors feared that once the federally subsidized BABs option disappeared, more issuers would return to the municipal market, driving long-term yields higher and bond prices lower. Strong security selection and an overweight in health care, the top- performing sector among intermediate-maturity bonds, also helped results, as did positive issue selection among lease revenue bonds, whose principal and interest payments are backed by money earned from leasing the projects they finance.
Disappointment from GO allocation
A structural underweight in state general obligation (GO) bonds was the biggest deterrent to performance versus the benchmark. GO bonds, which are backed by the ad valorem taxing power of the state, help finance capital projects, including public buildings and highways. (Ad valorem means a tax on goods or property expressed as a percentage of the sales price or assessed value.) The benchmark holds state GOs from across the nation, including higher-yielding, lower-quality issues, while the fund focuses primarily on South Carolina, whose high AAA credit rating1 translated into lower yields. In addition, exposure to revenue bonds in Puerto Rico hurt results, as their prices fell.
Changes to interest-rate sensitivity
We increased the fund's sensitivity to interest rate changes to take advantage of higher yields during the fourth-quarter 2010 downturn and early in 2011. Elsewhere, we reduced the fund's stake in pre-refunded bonds. Pre-refunding occurs when a bond issuer sells a new bond and invests the proceeds in U.S. Treasuries or other short-term government securities to help pay off the older, higher-rate debt. Over the year, we also trimmed exposure to local GOs and increased the fund's investments in health care, water and sewer and electric revenue bonds, which are typically backed by revenues generated from the project they financed. We were concerned that declining tax revenues could pressure some local GOs, and thought revenue bonds could provide
1The credit quality ratings represent the lower of one of the following nationally recognized rating agencies: Standard & Poor's or Moody's Investor Services. If a security is rated by only one of the two agencies, that rating is used. If a security is not rated by either of the two agencies, it is designated as Non-Rated. Ratings are relative and subjective and are not absolute standards of quality. The credit quality of the fund's investments does not remove market risk.
6
Portfolio Manager's Report (continued) – Columbia South Carolina Intermediate Municipal Bond Fund
more stability. Finally, we lowered credit risk by trimming exposure to BBB rated bonds and investing in A rated issues.
Slow recovery ahead in South Carolina
Going forward, we expect slow but continued growth in South Carolina, as the state's warm climate and low cost of living continue to attract tourists, new residents and new businesses. A rebound in exports also should benefit the economy. However, challenges remain, including a weak housing market and an unemployment rate of over 10%. The state has been conservative in managing its budget during the downturn, prioritizing spending and cutting government programs. We expect South Carolina municipal bonds to benefit from the government's fiscal prudence as well as ongoing economic improvement. Eventually, however, we expect the Fed to raise interest rates at some point, which will pressure bond prices. With that possibility in mind, we plan to lower the fund's sensitivity to interest-rate changes.
Portfolio characteristics and holdings are subject to change periodically and may not be representative of current characteristics and holdings. The outlook for the fund may differ from that presented for other Columbia Funds.
Tax-exempt investing offers current tax-exempt income, but it also involves special risks. The value of the fund will be affected by interest rate changes and the creditworthiness of issues held in the fund. When interest rates go up, bond prices generally drop and vice versa.
Interest income from certain tax-exempt bonds may be subject to certain state and local taxes and, if applicable, the alternative minimum tax. Capital gains are not exempt from income taxes.
Single-state municipal bond funds pose additional risks due to limited geographical diversification.
Top 5 sectors
as of 03/31/11 (%)
| Tax-Backed | | | 32.4 | | |
| Utilities | | | 25.9 | | |
| Health Care | | | 21.2 | | |
| Transportation | | | 6.1 | | |
| Education | | | 4.3 | | |
Maturity breakdown
as of 03/31/11 (%)
| 0-1 year | | | 1.3 | | |
| 1-3 years | | | 5.2 | | |
| 3-5 years | | | 9.6 | | |
| 5-7 years | | | 19.9 | | |
| 7-10 years | | | 21.0 | | |
| 10-15 years | | | 34.7 | | |
| 15-20 years | | | 5.0 | | |
| Net Cash and Equivalents | | | 3.3 | | |
Quality breakdown
as of 03/31/11 (%)
| AAA | | | 9.9 | | |
| AA | | | 53.1 | | |
| A | | | 27.7 | | |
| BBB | | | 4.9 | | |
| Non-Rated | | | 4.4 | | |
Ratings shown in the quality breakdown are assigned to individual bonds by taking the lower of the ratings available from one of the following nationally recognized rating agencies: Standard & Poor's or Moody's Investor Services. If a security is rated by only one of the two agencies, that rating is used. If a security is not rated by either of the two agencies, it is designated as Non-Rated. Ratings are relative and subjective and are not absolute standards of quality. The credit quality of the fund's investments does not remove market risk.
The fund is actively managed and the composition of its portfolio will change over time. Information provided is calculated as a percentage of net assets.
7
Investment Portfolio – Columbia South Carolina Intermediate Municipal Bond Fund
March 31, 2011
| Municipal Bonds – 96.1% | |
| | | Par ($) | | Value ($) | |
| Education – 4.3% | |
| Education – 3.2% | |
| SC Florence Darlington Commission for Technical Education | |
| Series 2005 A, | |
| Insured: NPFGC: | |
| 5.000% 03/01/18 | | | 1,725,000 | | | | 1,840,299 | | |
| 5.000% 03/01/20 | | | 1,905,000 | | | | 1,980,648 | | |
| SC University of South Carolina | |
| Series 2008 A, | |
| Insured: AGMC | |
| 5.000% 06/01/21 | | | 1,060,000 | | | | 1,143,443 | | |
| Education Total | | | 4,964,390 | | |
| Student Loan – 1.1% | |
| SC Education Assistance Authority | |
| Series 2009 I, | |
| 5.000% 10/01/24 | | | 1,730,000 | | | | 1,713,271 | | |
| Student Loan Total | | | 1,713,271 | | |
| Education Total | | | 6,677,661 | | |
| Health Care – 21.2% | |
| Continuing Care Retirement – 2.9% | |
| SC Jobs-Economic Development Authority | |
| Episcopal Church Home, | |
| Series 2007: | |
| 5.000% 04/01/15 | | | 525,000 | | | | 548,772 | | |
| 5.000% 04/01/16 | | | 600,000 | | | | 618,852 | | |
| Lutheran Homes of South Carolina, Inc., | |
| Series 2007: | |
| 5.000% 05/01/16 | | | 1,245,000 | | | | 1,174,421 | | |
| 5.375% 05/01/21 | | | 1,650,000 | | | | 1,466,470 | | |
| Wesley Commons, | |
| Series 2006, | |
| 5.125% 10/01/26 | | | 1,000,000 | | | | 787,580 | | |
| Continuing Care Retirement Total | | | 4,596,095 | | |
| Hospitals – 18.3% | |
| SC Charleston County | |
| Care Alliance Health Services, | |
| Series 1999 A, | |
| Insured: AGMC: | |
| 5.000% 08/15/12 | | | 1,000,000 | | | | 1,007,640 | | |
| 5.125% 08/15/15 | | | 6,370,000 | | | | 6,991,776 | | |
| SC Greenville Hospital System Board | |
| GHS Partners in Health, | |
| Series 2008 A, | |
| GTY AGMT: Endowment Fund Greenville | |
| 5.250% 05/01/21 | | | 2,750,000 | | | | 2,889,123 | | |
| | | Par ($) | | Value ($) | |
| SC Jobs-Economic Development Authority | |
| Anmed Health, | |
| Series 2010, | |
| 5.000% 02/01/17 | | | 1,000,000 | | | | 1,080,670 | | |
| Bon Secours Health System, Inc., | |
| Series 2002 B, | |
| 5.500% 11/15/23 | | | 2,235,000 | | | | 2,222,797 | | |
| Georgetown Memorial Hospital, | |
| Series 2001, | |
| Insured: RAD | |
| 5.250% 02/01/21 | | | 1,250,000 | | | | 1,221,775 | | |
| Kershaw County Medical Center, | |
| Series 2008, | |
| 5.500% 09/15/25 | | | 1,925,000 | | | | 1,833,851 | | |
| Palmetto Health Alliance, | |
| Series 2005 A, | |
| Insured: AGMC | |
| 5.250% 08/01/21 | | | 4,000,000 | | | | 4,107,680 | | |
SC Lexington County Health
Services District | |
| Lexington Medical Center: | |
| Series 1997, | |
| Insured: AGMC | |
| 5.125% 11/01/21 | | | 3,000,000 | | | | 3,001,560 | | |
| Series 2007: | |
| 5.000% 11/01/17 | | | 1,230,000 | | | | 1,309,470 | | |
| 5.000% 11/01/18 | | | 1,000,000 | | | | 1,046,150 | | |
SC Spartanburg County Health
Services District | |
| Series 2008 A, | |
| Insured: AGO: | |
| 5.000% 04/15/18 | | | 500,000 | | | | 529,740 | | |
| 5.000% 04/15/19 | | | 1,225,000 | | | | 1,276,058 | | |
| Hospitals Total | | | 28,518,290 | | |
| Health Care Total | | | 33,114,385 | | |
| Housing – 0.7% | |
| Single-Family – 0.7% | |
| SC Housing Finance & Development Authority | |
| Series 2010, | |
| 5.000% 01/01/28 | | | 995,000 | | | | 1,063,148 | | |
| Single-Family Total | | | 1,063,148 | | |
| Housing Total | | | 1,063,148 | | |
See Accompanying Notes to Financial Statements.
8
Columbia South Carolina Intermediate Municipal Bond Fund
March 31, 2011
| Municipal Bonds (continued) | |
| | | Par ($) | | Value ($) | |
| Industrials – 1.6% | |
| Forest Products & Paper – 1.6% | |
| SC Georgetown County | |
| International Paper Co.: | |
| Series 1997 A, AMT, | |
| 5.700% 10/01/21 | | | 500,000 | | | | 491,490 | | |
| Series 1999 A, | |
| 5.125% 02/01/12 | | | 2,000,000 | | | | 2,046,640 | | |
| Forest Products & Paper Total | | | 2,538,130 | | |
| Industrials Total | | | 2,538,130 | | |
| Other – 2.9% | |
| Refunded/Escrowed (a) – 2.9% | |
| SC Lexington County Health Services District | |
| Lexington Medical Center, | |
| Series 2003, | |
| Pre-refunded 11/01/13, | |
| 5.500% 11/01/23 | | | 2,000,000 | | | | 2,242,580 | | |
| SC Lexington Water & Sewer Authority | |
| Series 1997, | |
| Pre-refunded 10/01/14, | |
| Insured: RAD | |
| 5.450% 04/01/19 | | | 2,000,000 | | | | 2,226,380 | | |
| Refunded/Escrowed Total | | | 4,468,960 | | |
| Other Total | | | 4,468,960 | | |
| Resource Recovery – 1.0% | |
| Disposal – 1.0% | |
| SC Three Rivers Solid Waste Authority | |
| Series 2007: | |
| (b) 10/01/24 | | | 1,835,000 | | | | 815,125 | | |
| (b) 10/01/25 | | | 1,835,000 | | | | 751,763 | | |
| Disposal Total | | | 1,566,888 | | |
| Resource Recovery Total | | | 1,566,888 | | |
| Tax-Backed – 32.4% | |
| Local Appropriated – 20.0% | |
| SC Berkeley County School District | |
| Securing Assets for Education, | |
| Series 2006: | |
| 5.000% 12/01/20 | | | 1,000,000 | | | | 1,029,290 | | |
| 5.000% 12/01/21 | | | 2,000,000 | | | | 2,046,100 | | |
| 5.000% 12/01/22 | | | 3,545,000 | | | | 3,604,910 | | |
| | | Par ($) | | Value ($) | |
| SC Charleston County | |
| Certificates of Participation, | |
| Series 2005, | |
| Insured: NPFGC | |
| 5.125% 06/01/17 | | | 1,470,000 | | | | 1,606,195 | | |
| SC Charleston Educational Excellence Financing Corp. | |
| Series 2006, | |
| 5.000% 12/01/19 | | | 2,000,000 | | | | 2,145,040 | | |
| SC Fort Mill School Facilities Corp. | |
| Series 2006, | |
| 5.000% 12/01/17 | | | 2,900,000 | | | | 3,102,623 | | |
| SC Greenville County School District | |
| Series 2003, | |
| 5.250% 12/01/16 | | | 2,625,000 | | | | 2,826,574 | | |
| Series 2006: | |
| 5.000% 12/01/27 | | | 1,300,000 | | | | 1,295,541 | | |
| Insured: AGMC | |
| 5.000% 12/01/15 | | | 500,000 | | | | 561,945 | | |
| SC Hilton Head Island Public Facilities Corp. | |
| Series 2006, | |
| Insured: NPFGC | |
| 5.000% 08/01/14 | | | 1,600,000 | | | | 1,783,312 | | |
| SC Newberry Investing in Children's Education | |
| Series 2005, | |
| 5.250% 12/01/15 | | | 1,265,000 | | | | 1,383,999 | | |
| SC South Carolina Association of Governmental Organizations Educational Facilities Corp. | |
| Colleton School District, | |
| Series 2006, | |
| Insured: AGO | |
| 5.000% 12/01/14 | | | 1,325,000 | | | | 1,447,867 | | |
| Pickens School District, | |
| Series 2006, | |
| Insured: AGMC: | |
| 5.000% 12/01/23 | | | 5,000,000 | | | | 5,127,050 | | |
| 5.000% 12/01/24 | | | 2,000,000 | | | | 2,038,680 | | |
| SC Sumter Two School Facilities, Inc. | |
| Series 2007, | |
| Insured: AGO | |
| 5.000% 12/01/17 | | | 1,000,000 | | | | 1,108,260 | | |
| Local Appropriated Total | | | 31,107,386 | | |
| Local General Obligations – 6.4% | |
| SC Anderson County School District No. 004 | |
| Series 2006, | |
| Insured: AGMC | |
| 5.250% 03/01/19 | | | 1,115,000 | | | | 1,227,203 | | |
See Accompanying Notes to Financial Statements.
9
Columbia South Carolina Intermediate Municipal Bond Fund
March 31, 2011
| Municipal Bonds (continued) | |
| | | Par ($) | | Value ($) | |
| SC Charleston County | |
| Series 2009 A: | |
| 5.000% 08/01/23 | | | 2,000,000 | | | | 2,191,960 | | |
| 5.000% 08/01/24 | | | 2,000,000 | | | | 2,171,740 | | |
| SC Spartanburg County School District No. 007 | |
| Series 2001: | |
| 5.000% 03/01/18 | | | 2,000,000 | | | | 2,252,980 | | |
| 5.000% 03/01/21 | | | 1,940,000 | | | | 2,102,339 | | |
| Local General Obligations Total | | | 9,946,222 | | |
| Special Non-Property Tax – 4.7% | |
| PR Commonwealth of Puerto Rico Highway & Transportation Authority | |
| Series 2003 AA, | |
| Insured: NPFGC | |
| 5.500% 07/01/18 | | | 1,100,000 | | | | 1,140,799 | | |
| Series 2005 BB, | |
| Insured: AMBAC | |
| 5.250% 07/01/17 | | | 1,080,000 | | | | 1,113,243 | | |
PR Commonwealth of Puerto Rico Infrastructure
Financing Authority | |
| Series 2005 C, | |
| Insured: FGIC | |
| 5.500% 07/01/20 | | | 1,200,000 | | | | 1,223,412 | | |
| SC Greenville | |
| Series 2011, | |
| Insured: AGO | |
| 5.000% 04/01/21 | | | 1,290,000 | | | | 1,378,997 | | |
| SC Hilton Head Island Public Facilities Corp. | |
| Stormwater System, | |
| Series 2002, | |
| Insured: NPFGC | |
| 5.250% 12/01/16 | | | 1,440,000 | | | | 1,535,213 | | |
| VI Virgin Islands Public Finance Authority | |
| Series 2010 A, | |
| 5.000% 10/01/25 | | | 1,060,000 | | | | 1,014,144 | | |
| Special Non-Property Tax Total | | | 7,405,808 | | |
| State General Obligations – 1.3% | |
| SC State | |
| Series 2010 B, | |
| 5.000% 04/01/23 | | | 1,775,000 | | | | 1,970,356 | | |
| State General Obligations Total | | | 1,970,356 | | |
| Tax-Backed Total | | | 50,429,772 | | |
| | | Par ($) | | Value ($) | |
| Transportation – 6.1% | |
| Airports – 1.7% | |
| SC Horry County | |
| Myrtle Beach International Airport, | |
| Series 2010 A: | |
| 5.000% 07/01/18 | | | 1,315,000 | | | | 1,387,654 | | |
| 5.000% 07/01/20 | | | 1,150,000 | | | | 1,175,990 | | |
| Airports Total | | | 2,563,644 | | |
| Ports – 1.0% | |
| SC Ports Authority | |
| Series 2010: | |
| 5.000% 07/01/16 | | | 500,000 | | | | 547,455 | | |
| 5.250% 07/01/23 | | | 1,000,000 | | | | 1,041,180 | | |
| Ports Total | | | 1,588,635 | | |
| Transportation – 3.4% | |
| SC Transportation Infrastructure Bank | |
| Series 2005 A, | |
| Insured: AMBAC | |
| 5.250% 10/01/20 | | | 4,880,000 | | | | 5,334,767 | | |
| Transportation Total | | | 5,334,767 | | |
| Transportation Total | | | 9,487,046 | | |
| Utilities – 25.9% | |
| Investor Owned – 3.7% | |
| SC Jobs-Economic Development Authority | |
| South Carolina Electric & Gas Co., | |
| Series 2002, AMT, | |
| Insured: AMBAC | |
| 4.200% 11/01/12 | | | 3,615,000 | | | | 3,745,140 | | |
| SC Oconee County | |
| Duke Energy Carolinas LLC, | |
| Series 2009, | |
| 3.600% 02/01/17 | | | 2,000,000 | | | | 2,026,540 | | |
| Investor Owned Total | | | 5,771,680 | | |
| Joint Power Authority – 6.3% | |
| SC Easley | |
| Series 2011, | |
| Insured: AGO | |
| 5.000% 12/01/28 | | | 1,000,000 | | | | 1,005,630 | | |
| SC Piedmont Municipal Power Agency | |
| Series 2008 A-3, | |
| Insured: AGO: | |
| 5.000% 01/01/17 | | | 2,000,000 | | | | 2,173,380 | | |
| 5.000% 01/01/18 | | | 3,050,000 | | | | 3,290,431 | | �� |
See Accompanying Notes to Financial Statements.
10
Columbia South Carolina Intermediate Municipal Bond Fund
March 31, 2011
| Municipal Bonds (continued) | |
| | | Par ($) | | Value ($) | |
| SC Public Service Authority | |
| Series 2009 A, | |
| 5.000% 01/01/28 | | | 2,000,000 | | | | 2,050,200 | | |
| Series 2009 B, | |
| 5.000% 01/01/24 | | | 1,250,000 | | | | 1,329,088 | | |
| Joint Power Authority Total | | | 9,848,729 | | |
| Municipal Electric – 3.3% | |
PR Commonwealth of Puerto Rico
Electric Power Authority | |
| Series 2007 TT, | |
| 5.000% 07/01/20 | | | 1,000,000 | | | | 1,011,690 | | |
| Series 2010, | |
| 5.250% 07/01/25 | | | 1,485,000 | | | | 1,422,348 | | |
| SC Rock Hill Utility System | |
| Series 2003 A, | |
| Insured: AGMC | |
| 5.375% 01/01/19 | | | 1,500,000 | | | | 1,586,850 | | |
| SC Winnsboro Utility | |
| Series 1999, | |
| Insured: NPFGC | |
| 5.250% 08/15/13 | | | 1,020,000 | | | | 1,102,752 | | |
| Municipal Electric Total | | | 5,123,640 | | |
| Water & Sewer – 12.6% | |
| SC Beaufort-Jasper Water & Sewer Authority | |
| Series 2006, | |
| Insured: AGMC: | |
| 5.000% 03/01/23 | | | 1,500,000 | | | | 1,593,825 | | |
| 4.750% 03/01/25 | | | 3,000,000 | | | | 3,056,190 | | |
| SC Berkeley County Water & Sewer | |
| Series 2003, | |
| Insured: NPFGC | |
| 5.250% 06/01/19 | | | 155,000 | | | | 164,639 | | |
| Series 2008 A, | |
| Insured: AGMC | |
| 5.000% 06/01/21 | | | 1,000,000 | | | | 1,095,830 | | |
| SC Charleston | |
| Waterworks & Sewer System, | |
| Series 2009 A, | |
| 5.000% 01/01/21 | | | 2,500,000 | | | | 2,783,000 | | |
| SC Columbia | |
| Waterworks & Sewer System, | |
| Series 2005: | |
| Insured: AGMC | |
| 5.000% 02/01/23 | | | 2,000,000 | | | | 2,096,480 | | |
| Insured: AGO | |
| 5.000% 02/01/27 | | | 1,500,000 | | | | 1,524,570 | | |
| | | Par ($) | | Value ($) | |
| SC Mount Pleasant | |
| Waterworks & Sewer System, | |
| Series 2002, | |
| Insured: NPFGC | |
| 5.250% 12/01/18 | | | 1,270,000 | | | | 1,336,523 | | |
| SC North Charleston Sewer District | |
| Series 2002, | |
| Insured: AGMC | |
| 5.500% 07/01/17 | | | 3,040,000 | | | | 3,231,794 | | |
| SC Renewable Water Resources | |
| Series 2010 A, | |
| 5.000% 01/01/20 | | | 1,500,000 | | | | 1,652,790 | | |
| SC Western Carolina Regional Sewer Authority | |
| Series 2005 B, | |
| Insured: AGMC | |
| 5.250% 03/01/19 | | | 1,000,000 | | | | 1,140,690 | | |
| Water & Sewer Total | | | 19,676,331 | | |
| Utilities Total | | | 40,420,380 | | |
Total Municipal Bonds
(cost of $147,262,286) | | | 149,766,370 | | |
| Investment Companies – 2.0% | |
| | | Shares | | | |
| BofA Tax-Exempt Reserves, | |
Capital Class
(7 day yield of 0.110%) (c) | | | 1,641,470 | | | | 1,641,470 | | |
| Dreyfus Tax-Exempt Cash | |
Management Fund
(7 day yield of 0.080%) | | | 1,505,458 | | | | 1,505,458 | | |
Total Investment Companies
(cost of $3,146,928) | | | 3,146,928 | | |
Total Investments – 98.1%
(cost of $150,409,214) (d) | | | 152,913,298 | | |
| Other Assets & Liabilities, Net – 1.9% | | | 2,978,549 | | |
| Net Assets – 100.0% | | | 155,891,847 | | |
See Accompanying Notes to Financial Statements.
11
Columbia South Carolina Intermediate Municipal Bond Fund
March 31, 2011
Notes to Investment Portfolio:
(a) The Fund has been informed that each issuer has placed direct obligations of the U.S. Government in an irrevocable trust, solely for the payment of principal and interest.
(b) Zero coupon bond.
(c) Investments in affiliates during the year ended March 31, 2011:
| Affiliate | | Value,
beginning
of period | | Purchases | | Sales
Proceeds | | Dividend
Income | | Value,
end of
period | |
BofA Tax-Exempt
Reserves,
Capital Class
(7 day yield
of 0.110%) | | $ | 1,000 | | | $ | 4,219,068 | | | $ | 1,834,000 | | | $ | 176 | | | $ | — | | |
As of May 1, 2010, this company was no longer an affiliate of the Fund. The table above reflects activity for the period from April 1, 2010 through April 30, 2010.
(d) Cost for federal income tax purposes is $150,216,095.
Generally accepted accounting principles (GAAP) require disclosure regarding the inputs and valuation techniques used to measure fair value and any changes in valuation inputs or techniques. In addition, investments shall be disclosed by major category.
The Fund categorizes its fair value measurements according to a three-level hierarchy that maximizes the use of observable inputs and minimizes the use of unobservable inputs by prioritizing that the most observable input be used when available. Observable inputs are those that market participants would use in pricing an investment based on market data obtained from sources independent of the reporting entity. Unobservable inputs are those that reflect the Fund's assumptions about the information market participants would use in pricing an investment. An investment's level within the fair value hierarchy is based on the lowest level of any input that is deemed significant to the asset or liability's fair value measurement. The input levels are not necessarily an indication of the risk or liquidity associated with investments at that level. For example, certain U.S. government securities are generally high quality and liquid, however, they are reflected as Level 2 because the inputs used to determine fair value may not always be quoted prices in an active market.
Fair value inputs are summarized in the three broad levels listed below:
• Level 1—Valuations based on quoted prices for investments in active markets that the Fund has the ability to access at the measurement date (including NAV for open-end mutual funds). Valuation adjustments are not applied to Level 1 investments.
• Level 2—Valuations based on other significant observable inputs (including quoted prices for similar securities, interest rates, prepayment speeds, credit risks, etc.).
• Level 3—Valuations based on significant unobservable inputs (including the Fund's own assumptions and judgment in determining the fair value of investments).
Inputs that are used in determining fair value of an investment may include price information, credit data, volatility statistics, and other factors. These inputs can be either observable or unobservable. The availability of observable inputs can vary between investments, and is affected by various factors such as the type of investment, and the volume and level of activity for that investment or similar investments in the marketplace. The inputs will be considered by the Investment Manager, along with any other relevant factors in the calculation of an investment's fair value. The Fund uses prices and inputs that are current as of the measurement date, which may include periods of market dislocations. During these periods, the availability of prices and inputs may be reduced for many investments. This condition could cause an investment to be reclassified between the various levels within the hierarchy.
Investments falling into the Level 3 category are primarily supported by quoted prices from brokers and dealers participating in the market for those investments. However, these may be classified as Level 3 investments due to lack of market transparency and corroboration to support these quoted prices. Additionally, valuation models may be used as the pricing source for any remaining investments classified as Level 3. These models rely on one or
more significant unobservable inputs and/or significant assumptions by the Investment Manager. Inputs used in valuations may include, but are not limited to, financial statement analysis, capital account balances, discount rates and estimated cash flows, and comparable company data.
The following table is a summary of the inputs used to value the Fund's investments as of March 31, 2011:
| Description | | Quoted
Prices
(Level 1) | | Other
Significant
Observable
Inputs
(Level 2) | | Significant
Unobservable
Inputs
(Level 3) | | Total | |
| Total Municipal Bonds | | $ | — | | | $ | 149,766,370 | | | $ | — | | | $ | 149,766,370 | | |
Total Investment
Companies | | | 3,146,928 | | | | — | | | | — | | | | 3,146,928 | | |
| Total Investments | | $ | 3,146,928 | | | $ | 149,766,370 | | | $ | — | | | $ | 152,913,298 | | |
The Fund's assets assigned to the Level 2 input category are generally valued using the market approach, in which a security's value is determined through its correlation to prices and information from market transactions for similar or identical assets.
There were no significant transfers of financial assets between Levels 1 and 2 during the period.
At March 31, 2011, the composition of the Fund by revenue source is as follows:
| Holdings by Revenue Source (Unaudited) | | % of
Net Assets | |
| Tax-Backed | | | 32.4 | | |
| Utilities | | | 25.9 | | |
| Health Care | | | 21.2 | | |
| Transportation | | | 6.1 | | |
| Education | | | 4.3 | | |
| Other | | | 2.9 | | |
| Industrials | | | 1.6 | | |
| Resource Recovery | | | 1.0 | | |
| Housing | | | 0.7 | | |
| | | | 96.1 | | |
| Investment Companies | | | 2.0 | | |
| Other Assets & Liabilities, Net | | | 1.9 | | |
| | | | 100.0 | | |
| Acronym | | Name | |
| AGMC | | Assured Guaranty Municipal Corp. | |
|
| AGO | | Assured Guaranty Ltd. | |
|
| AMBAC | | Ambac Assurance Corp. | |
|
| AMT | | Alternative Minimum Tax | |
|
| FGIC | | Financial Guaranty Insurance Co. | |
|
| GTY AGMT | | Guaranty Agreement | |
|
| NPFGC | | National Public Finance Guarantee Corp. | |
|
| RAD | | Radian Asset Assurance, Inc. | |
|
See Accompanying Notes to Financial Statements.
12
Statement of Assets and Liabilities – Columbia South Carolina Intermediate Municipal Bond Fund
March 31, 2011
| | | | | ($) | |
| Assets | | Investments, at identified cost | | | 150,409,214 | | |
| | | Investments, at value | | | 152,913,298 | | |
| | | Cash | | | 925 | | |
| | | Receivable for: | | | | | |
| | | Investments sold | | | 1,651,301 | | |
| | | Fund shares sold | | | 174,939 | | |
| | | Interest | | | 2,018,376 | | |
| | | Expense reimbursement due from Investment Manager | | | 44,527 | | |
| | | Prepaid expenses | | | 286 | | |
| | | Total Assets | | | 156,803,652 | | |
| Liabilities | | Payable for: | | | | | |
| | | Fund shares repurchased | | | 240,890 | | |
| | | Distributions | | | 414,559 | | |
| | | Investment advisory fee | | | 53,879 | | |
| | | Administration fee | | | 15,019 | | |
| | | Pricing and bookkeeping fees | | | 7,198 | | |
| | | Transfer agent fee | | | 31,261 | | |
| | | Trustees' fees | | | 74,857 | | |
| | | Audit fee | | | 29,649 | | |
| | | Custody fee | | | 2,000 | | |
| | | Distribution and service fees | | | 12,694 | | |
| | | Chief compliance officer expenses | | | 250 | | |
| | | Other liabilities | | | 29,549 | | |
| | | Total Liabilities | | | 911,805 | | |
| | | Net Assets | | | 155,891,847 | | |
| Net Assets Consist of | | Paid-in capital | | | 153,133,585 | | |
| | | Undistributed net investment income | | | 1,123,082 | | |
| | | Accumulated net realized loss | | | (868,904 | ) | |
| | | Net unrealized appreciation (depreciation) on investments | | | 2,504,084 | | |
| | | Net Assets | | | 155,891,847 | | |
| Class A | | Net assets | | $ | 18,513,482 | | |
| | | Shares outstanding | | | 1,837,213 | | |
| | | Net asset value per share | | $ | 10.08 | (a) | |
| | | Maximum sales charge | | | 3.25 | % | |
| | | Maximum offering price per share ($10.08/0.9675) | | $ | 10.42 | (b) | |
| Class B | | Net assets | | $ | 246,206 | | |
| | | Shares outstanding | | | 24,421 | | |
| | | Net asset value and offering price per share | | $ | 10.08 | (a) | |
| Class C | | Net assets | | $ | 10,031,187 | | |
| | | Shares outstanding | | | 994,798 | | |
| | | Net asset value and offering price per share | | $ | 10.08 | (a) | |
| Class Z | | Net assets | | $ | 127,100,972 | | |
| | | Shares outstanding | | | 12,608,401 | | |
| | | Net asset value, offering and redemption price per share | | $ | 10.08 | | |
(a) Redemption price per share is equal to net asset value less any applicable contingent deferred sales charge.
(b) On sales of $100,000 or more the offering price is reduced.
See Accompanying Notes to Financial Statements.
13
Statement of Operations – Columbia South Carolina Intermediate Municipal Bond Fund
For the Year Ended March 31, 2011
| | | | | ($) | |
| Investment Income | | Interest | | | 7,393,059 | | |
| | | Dividends | | | 2,648 | | |
| | | Dividends from affiliates | | | 176 | | |
| | | Total investment income | | | 7,395,883 | | |
| Expenses | | Investment advisory fee | | | 703,827 | | |
| | | Administration fee | | | 199,538 | | |
| | | Distribution fee: | | | | | |
| | | Class B | | | 6,485 | | |
| | | Class C | | | 74,007 | | |
| | | Service fee: | | | | | |
| | | Class B | | | 2,172 | | |
| | | Class C | | | 24,669 | | |
| | | Distribution and service fees: | | | | | |
| | | Class A | | | 53,254 | | |
| | | Transfer agent fee | | | 94,335 | | |
| | | Pricing and bookkeeping fees | | | 76,745 | | |
| | | Trustees' fees | | | 32,523 | | |
| | | Custody fee | | | 13,511 | | |
| | | Chief compliance officer expenses | | | 1,171 | | |
| | | Other expenses | | | 106,784 | | |
| | | Total Expenses | | | 1,389,021 | | |
| | | Fees waived or expenses reimbursed by Investment Manager | | | (260,021 | ) | |
| | | Expense reductions | | | (7 | ) | |
| | | Net Expenses | | | 1,128,993 | | |
| | | Net Investment Income | | | 6,266,890 | | |
| Net Realized and Unrealized Gain (Loss) on Investments | | Net realized gain on investments | | | 1,946,509 | | |
| | | Net change in unrealized appreciation (depreciation) investments | | | (3,484,580 | ) | |
| | | Net Loss | | | (1,538,071 | ) | |
| | | Net Increase Resulting from Operations | | | 4,728,819 | | |
See Accompanying Notes to Financial Statements.
14
Statement of Changes in Net Assets – Columbia South Carolina Intermediate
Municipal Bond Fund
| | | | | Year Ended March 31, | |
| Increase (Decrease) in Net Assets | | | | 2011 ($) | | 2010 ($) | |
| Operations | | Net investment income | | | 6,266,890 | | | | 7,215,833 | | |
| | | Net realized gain (loss) on investments and futures contracts | | | 1,946,509 | | | | (1,425 | ) | |
| | | Net change in unrealized appreciation (depreciation)
on investments | | | (3,484,580 | ) | | | 6,852,647 | | |
| | | Net increase resulting from operations | | | 4,728,819 | | | | 14,067,055 | | |
| Distributions to Shareholders | | From net investment income: | | | | | | | | | |
| | | Class A | | | (725,948 | ) | | | (788,201 | ) | |
| | | Class B | | | (23,049 | ) | | | (43,672 | ) | |
| | | Class C | | | (261,647 | ) | | | (204,902 | ) | |
| | | Class Z | | | (5,256,247 | ) | | | (6,179,058 | ) | |
| | | Total distributions to shareholders | | | (6,266,891 | ) | | | (7,215,833 | ) | |
| | | Net Capital Stock Transactions | | | (28,142,285 | ) | | | (25,872,504 | ) | |
| | | Total decrease in net assets | | | (29,680,357 | ) | | | (19,021,282 | ) | |
| Net Assets | | Beginning of period | | | 185,572,204 | | | | 204,593,486 | | |
| | | End of period | | | 155,891,847 | | | | 185,572,204 | | |
| | | Undistributed net investment income at
end of period | | | 1,123,082 | | | | 1,119,407 | | |
See Accompanying Notes to Financial Statements.
15
Statement of Changes in Net Assets (continued) – Columbia South Carolina Intermediate
Municipal Bond Fund
| | | Capital Stock Activity | |
| | | Year Ended
March 31, 2011 | | Year Ended
March 31, 2010 | |
| | | Shares | | Dollars ($) | | Shares | | Dollars ($) | |
| Class A | |
| Subscriptions | | | 425,661 | | | | 4,369,782 | | | | 452,624 | | | | 4,557,470 | | |
| Distributions reinvested | | | 28,453 | | | | 292,547 | | | | 34,175 | | | | 346,148 | | |
| Redemptions | | | (988,465 | ) | | | (10,313,460 | ) | | | (540,186 | ) | | | (5,413,883 | ) | |
| Net decrease | | | (534,351 | ) | | | (5,651,131 | ) | | | (53,387 | ) | | | (510,265 | ) | |
| Class B | |
| Subscriptions | | | 183 | | | | 1,904 | | | | 4,052 | | | | 40,272 | | |
| Distributions reinvested | | | 1,132 | | | | 11,664 | | | | 2,997 | | | | 30,312 | | |
| Redemptions | | | (92,375 | ) | | | (944,122 | ) | | | (92,474 | ) | | | (935,553 | ) | |
| Net decrease | | | (91,060 | ) | | | (930,554 | ) | | | (85,425 | ) | | | (864,969 | ) | |
| Class C | |
| Subscriptions | | | 218,107 | | | | 2,243,051 | | | | 360,994 | | | | 3,661,805 | | |
| Distributions reinvested | | | 10,407 | | | | 107,061 | | | | 8,931 | | | | 90,549 | | |
| Redemptions | | | (147,265 | ) | | | (1,511,610 | ) | | | (80,493 | ) | | | (820,500 | ) | |
| Net increase | | | 81,249 | | | | 838,502 | | | | 289,432 | | | | 2,931,854 | | |
| Class Z | |
| Subscriptions | | | 2,393,454 | | | | 24,761,171 | | | | 2,791,722 | | | | 28,125,140 | | |
| Distributions reinvested | | | 31,046 | | | | 319,327 | | | | 34,920 | | | | 352,958 | | |
| Redemptions | | | (4,651,717 | ) | | | (47,479,600 | ) | | | (5,523,432 | ) | | | (55,907,222 | ) | |
| Net decrease | | | (2,227,217 | ) | | | (22,399,102 | ) | | | (2,696,790 | ) | | | (27,429,124 | ) | |
See Accompanying Notes to Financial Statements.
16
Financial Highlights – Columbia South Carolina Intermediate Municipal Bond Fund
Selected data for a share outstanding throughout each period is as follows:
| | | Year Ended March 31, | |
| Class A Shares | | 2011 | | 2010 | | 2009 | | 2008 | | 2007 | |
| Net Asset Value, Beginning of Period | | $ | 10.17 | | | $ | 9.84 | | | $ | 10.01 | | | $ | 10.27 | | | $ | 10.25 | | |
| Income from Investment Operations: | |
| Net investment income (a) | | | 0.35 | | | | 0.34 | | | | 0.37 | | | | 0.39 | | | | 0.39 | | |
Net realized and unrealized gain (loss) on investments
and futures contracts | | | (0.09 | ) | | | 0.33 | | | | (0.17 | ) | | | (0.25 | ) | | | 0.06 | | |
| Total from investment operations | | | 0.26 | | | | 0.67 | | | | 0.20 | | | | 0.14 | | | | 0.45 | | |
| Less Distributions to Shareholders: | |
| From net investment income | | | (0.35 | ) | | | (0.34 | ) | | | (0.37 | ) | | | (0.38 | ) | | | (0.38 | ) | |
| From net realized gains | | | — | | | | — | | | | — | | | | (0.02 | ) | | | (0.05 | ) | |
| Total distributions to shareholders | | | (0.35 | ) | | | (0.34 | ) | | | (0.37 | ) | | | (0.40 | ) | | | (0.43 | ) | |
| Net Asset Value, End of Period | | $ | 10.08 | | | $ | 10.17 | | | $ | 9.84 | | | $ | 10.01 | | | $ | 10.27 | | |
| Total return (b)(c) | | | 2.54 | % | | | 6.91 | % | | | 2.09 | % | | | 1.39 | % | | | 4.50 | % | |
| Ratios to Average Net Assets/Supplemental Data: | |
| Net expenses before interest expense (d) | | | 0.80 | % | | | 0.78 | % | | | 0.75 | % | | | 0.75 | % | | | 0.75 | % | |
| Interest expense | | | — | | | | — | | | | — | | | | — | | | | — | %(e) | |
| Net expenses (d) | | | 0.80 | % | | | 0.78 | % | | | 0.75 | % | | | 0.75 | % | | | 0.75 | % | |
| Waiver/Reimbursement | | | 0.15 | % | | | 0.13 | % | | | 0.13 | % | | | 0.15 | % | | | 0.17 | % | |
| Net investment income (d) | | | 3.41 | % | | | 3.39 | % | | | 3.76 | % | | | 3.78 | % | | | 3.77 | % | |
| Portfolio turnover rate | | | 15 | % | | | 16 | % | | | 21 | % | | | 13 | % | | | 15 | % | |
| Net assets, end of period (000s) | | $ | 18,513 | | | $ | 24,126 | | | $ | 23,865 | | | $ | 16,007 | | | $ | 17,443 | | |
(a) Per share data was calculated using the average shares outstanding during the period.
(b) Total return at net asset value assuming all distributions reinvested and no initial sales charge or contingent deferred sales charge.
(c) Had the Investment Manager and/or any of its affiliates not waived fees or reimbursed a portion of expenses, total return would have been reduced.
(d) The benefits derived from expense reductions had an impact of less than 0.01%.
(e) Rounds to less than 0.01%.
See Accompanying Notes to Financial Statements.
17
Financial Highlights – Columbia South Carolina Intermediate Municipal Bond Fund
Selected data for a share outstanding throughout each period is as follows:
| | | Year Ended March 31, | |
| Class B Shares | | 2011 | | 2010 | | 2009 | | 2008 | | 2007 | |
| Net Asset Value, Beginning of Period | | $ | 10.18 | | | $ | 9.85 | | | $ | 10.01 | | | $ | 10.27 | | | $ | 10.25 | | |
| Income from Investment Operations: | |
| Net investment income (a) | | | 0.27 | | | | 0.27 | | | | 0.30 | | | | 0.31 | | | | 0.31 | | |
Net realized and unrealized gain (loss) on investments
and futures contracts | | | (0.09 | ) | | | 0.33 | | | | (0.16 | ) | | | (0.24 | ) | | | 0.07 | | |
| Total from investment operations | | | 0.18 | | | | 0.60 | | | | 0.14 | | | | 0.07 | | | | 0.38 | | |
| Less Distributions to Shareholders: | |
| From net investment income | | | (0.28 | ) | | | (0.27 | ) | | | (0.30 | ) | | | (0.31 | ) | | | (0.31 | ) | |
| From net realized gains | | | — | | | | — | | | | — | | | | (0.02 | ) | | | (0.05 | ) | |
| Total distributions to shareholders | | | (0.28 | ) | | | (0.27 | ) | | | (0.30 | ) | | | (0.33 | ) | | | (0.36 | ) | |
| Net Asset Value, End of Period | | $ | 10.08 | | | $ | 10.18 | | | $ | 9.85 | | | $ | 10.01 | | | $ | 10.27 | | |
| Total return (b)(c) | | | 1.70 | % | | | 6.12 | % | | | 1.43 | % | | | 0.64 | % | | | 3.72 | % | |
| Ratios to Average Net Assets/Supplemental Data: | |
| Net expenses before interest expense (d) | | | 1.55 | % | | | 1.53 | % | | | 1.50 | % | | | 1.50 | % | | | 1.50 | % | |
| Interest expense | | | — | | | | — | | | | — | | | | — | | | | — | %(e) | |
| Net expenses (d) | | | 1.55 | % | | | 1.53 | % | | | 1.50 | % | | | 1.50 | % | | | 1.50 | % | |
| Waiver/Reimbursement | | | 0.15 | % | | | 0.13 | % | | | 0.13 | % | | | 0.15 | % | | | 0.17 | % | |
| Net investment income (d) | | | 2.65 | % | | | 2.64 | % | | | 3.03 | % | | | 3.03 | % | | | 3.02 | % | |
| Portfolio turnover rate | | | 15 | % | | | 16 | % | | | 21 | % | | | 13 | % | | | 15 | % | |
| Net assets, end of period (000s) | | $ | 246 | | | $ | 1,175 | | | $ | 1,978 | | | $ | 2,268 | | | $ | 2,866 | | |
(a) Per share data was calculated using the average shares outstanding during the period.
(b) Total return at net asset value assuming all distributions reinvested and no contingent deferred sales charge.
(c) Had the Investment Manager and/or any of its affiliates not waived fees or reimbursed a portion of expenses, total return would have been reduced.
(d) The benefits derived from expense reductions had an impact of less than 0.01%.
(e) Rounds to less than 0.01%.
See Accompanying Notes to Financial Statements.
18
Financial Highlights – Columbia South Carolina Intermediate Municipal Bond Fund
Selected data for a share outstanding throughout each period is as follows:
| | | Year Ended March 31, | |
| Class C Shares | | 2011 | | 2010 | | 2009 | | 2008 | | 2007 | |
| Net Asset Value, Beginning of Period | | $ | 10.18 | | | $ | 9.85 | | | $ | 10.01 | | | $ | 10.28 | | | $ | 10.26 | | |
| Income from Investment Operations: | |
| Net investment income (a) | | | 0.27 | | | | 0.27 | | | | 0.30 | | | | 0.31 | | | | 0.31 | | |
Net realized and unrealized gain (loss) on investments
and futures contracts | | | (0.10 | ) | | | 0.33 | | | | (0.16 | ) | | | (0.26 | ) | | | 0.07 | | |
| Total from investment operations | | | 0.17 | | | | 0.60 | | | | 0.14 | | | | 0.05 | | | | 0.38 | | |
| Less Distributions to Shareholders: | |
| From net investment income | | | (0.27 | ) | | | (0.27 | ) | | | (0.30 | ) | | | (0.30 | ) | | | (0.31 | ) | |
| From net realized gains | | | — | | | | — | | | | — | | | | (0.02 | ) | | | (0.05 | ) | |
| Total distributions to shareholders | | | (0.27 | ) | | | (0.27 | ) | | | (0.30 | ) | | | (0.32 | ) | | | (0.36 | ) | |
| Net Asset Value, End of Period | | $ | 10.08 | | | $ | 10.18 | | | $ | 9.85 | | | $ | 10.01 | | | $ | 10.28 | | |
| Total return (b)(c) | | | 1.68 | % | | | 6.11 | % | | | 1.43 | % | | | 0.54 | % | | | 3.72 | % | |
| Ratios to Average Net Assets/Supplemental Data: | |
| Net expenses before interest expense (d) | | | 1.55 | % | | | 1.53 | % | | | 1.50 | % | | | 1.50 | % | | | 1.50 | % | |
| Interest expense | | | — | | | | — | | | | — | | | | — | | | | — | %(e) | |
| Net expenses (d) | | | 1.55 | % | | | 1.53 | % | | | 1.50 | % | | | 1.50 | % | | | 1.50 | % | |
| Waiver/Reimbursement | | | 0.15 | % | | | 0.13 | % | | | 0.13 | % | | | 0.15 | % | | | 0.17 | % | |
| Net investment income (d) | | | 2.65 | % | | | 2.63 | % | | | 3.02 | % | | | 3.03 | % | | | 3.02 | % | |
| Portfolio turnover rate | | | 15 | % | | | 16 | % | | | 21 | % | | | 13 | % | | | 15 | % | |
| Net assets, end of period (000s) | | $ | 10,031 | | | $ | 9,300 | | | $ | 6,146 | | | $ | 5,697 | | | $ | 6,324 | | |
(a) Per share data was calculated using the average shares outstanding during the period.
(b) Total return at net asset value assuming all distributions reinvested and no contingent deferred sales charge.
(c) Had the Investment Manager and/or any of its affiliates not waived fees or reimbursed a portion of expenses, total return would have been reduced.
(d) The benefits derived from expense reductions had an impact of less than 0.01%.
(e) Rounds to less than 0.01%.
See Accompanying Notes to Financial Statements.
19
Financial Highlights – Columbia South Carolina Intermediate Municipal Bond Fund
Selected data for a share outstanding throughout each period is as follows:
| | | Year Ended March 31, | |
| Class Z Shares | | 2011 | | 2010 | | 2009 | | 2008 | | 2007 | |
| Net Asset Value, Beginning of Period | | $ | 10.18 | | | $ | 9.84 | | | $ | 10.01 | | | $ | 10.27 | | | $ | 10.25 | | |
| Income from Investment Operations: | |
| Net investment income (a) | | | 0.38 | | | | 0.37 | | | | 0.40 | | | | 0.41 | | | | 0.41 | | |
Net realized and unrealized gain (loss) on investments
and futures contracts | | | (0.10 | ) | | | 0.34 | | | | (0.17 | ) | | | (0.24 | ) | | | 0.07 | | |
| Total from investment operations | | | 0.28 | | | | 0.71 | | | | 0.23 | | | | 0.17 | | | | 0.48 | | |
| Less Distributions to Shareholders: | |
| From net investment income | | | (0.38 | ) | | | (0.37 | ) | | | (0.40 | ) | | | (0.41 | ) | | | (0.41 | ) | |
| From net realized gains | | | — | | | | — | | | | — | | | | (0.02 | ) | | | (0.05 | ) | |
| Total distributions to shareholders | | | (0.38 | ) | | | (0.37 | ) | | | (0.40 | ) | | | (0.43 | ) | | | (0.46 | ) | |
| Net Asset Value, End of Period | | $ | 10.08 | | | $ | 10.18 | | | $ | 9.84 | | | $ | 10.01 | | | $ | 10.27 | | |
| Total return (b)(c) | | | 2.70 | % | | | 7.28 | % | | | 2.34 | % | | | 1.65 | % | | | 4.76 | % | |
| Ratios to Average Net Assets/Supplemental Data: | |
| Net expenses before interest expense (d) | | | 0.55 | % | | | 0.53 | % | | | 0.50 | % | | | 0.50 | % | | | 0.50 | % | |
| Interest expense | | | — | | | | — | | | | — | | | | — | | | | — | %(e) | |
| Net expenses (d) | | | 0.55 | % | | | 0.53 | % | | | 0.50 | % | | | 0.50 | % | | | 0.50 | % | |
| Waiver/Reimbursement | | | 0.15 | % | | | 0.13 | % | | | 0.13 | % | | | 0.15 | % | | | 0.17 | % | |
| Net investment income (d) | | | 3.65 | % | | | 3.64 | % | | | 4.03 | % | | | 4.03 | % | | | 4.01 | % | |
| Portfolio turnover rate | | | 15 | % | | | 16 | % | | | 21 | % | | | 13 | % | | | 15 | % | |
| Net assets, end of period (000s) | | $ | 127,101 | | | $ | 150,971 | | | $ | 172,604 | | | $ | 170,987 | | | $ | 157,399 | | |
(a) Per share data was calculated using the average shares outstanding during the period.
(b) Total return at net asset value assuming all distributions reinvested.
(c) Had the Investment Manager and/or any of its affiliates not waived fees or reimbursed a portion of expenses, total return would have been reduced.
(d) The benefits derived from expense reductions had an impact of less than 0.01%.
(e) Rounds to less than 0.01%.
See Accompanying Notes to Financial Statements.
20
Notes to Financial Statements – Columbia South Carolina Intermediate Municipal Bond Fund
March 31, 2011
Note 1. Organization
Columbia South Carolina Intermediate Municipal Bond Fund (the Fund), a series of Columbia Funds Series Trust (the Trust), is a diversified fund. The Trust is registered under the Investment Company Act of 1940, as amended (the 1940 Act), as an open-end management investment company organized as a Delaware statutory trust.
After the close of business on April 30, 2010, Ameriprise Financial, Inc. (Ameriprise Financial) acquired a portion of the asset management business of Columbia Management Group, LLC (the Transaction), including the business of managing the Fund. In connection with the closing of the Transaction (the Closing), RiverSource Investments, LLC, a wholly owned subsidiary of Ameriprise Financial, became the investment manager of the Fund and changed its name to Columbia Management Investment Advisers, LLC (the Investment Manager).
Investment Objective
The Fund seeks current income exempt from U.S. federal income tax and South Carolina individual income tax, consistent with moderate fluctuation of principal.
Fund Shares
The Trust has unlimited authorized shares of beneficial interest. The Fund offers Class A, Class B, Class C and Class Z shares. All share classes have identical voting, dividend and liquidation rights. Each share class has its own expense structure and sales charges, as applicable.
Class A shares are subject to a maximum front-end sales charge of 3.25% based on the initial investment amount. Class A shares purchased without an initial sales charge in accounts aggregating $1 million to $50 million at the time of purchase are subject to a 1.00% contingent deferred sales charge (CDSC) if the shares are sold within 18 months of purchase, charged as follows: 1.00% CDSC if redeemed within 12 months of purchase, and 0.50% CDSC if redeemed more than 12, but less than 18 months after purchase.
The Fund no longer accepts investments by new or existing investors in the Fund's Class B shares, except in connection with the reinvestment of any dividend and/or capital gain distributions in Class B shares of the Fund and exchanges by existing Class B shareholders of other funds within the Columbia Family of Funds. Class B shares are subject to a maximum CDSC of 3.00% based upon the holding period after purchase. Class B shares will generally convert to Class A shares eight years after purchase.
Class C shares are subject to a 1.00% CDSC on shares redeemed within one year of purchase.
Class Z shares are not subject to sales charges and are available only to certain investors, as described in the Fund's Prospectus.
Note 2. Summary of Significant Accounting Policies
The preparation of financial statements in accordance with U.S. generally accepted accounting principles (GAAP) requires management to make certain estimates and assumptions that affect the reported amounts of assets and liabilities, the disclosure of contingent assets and liabilities at the date of the financial statements and the reported amounts of revenue and expenses during the reporting period. Actual results could differ from those estimates.
The following is a summary of significant accounting policies consistently followed by the Fund in the preparation of its financial statements.
Security Valuation
Debt securities generally are valued by pricing services approved by the Trust's Board of Trustees, based upon market transactions for normal, institutional-size trading units of similar securities. The services may use various pricing techniques which take into account appropriate factors such as yield, quality, coupon rate, maturity, type of issue, trading characteristics and other data, as well as broker quotes. Debt securities for which quotations are readily available may also be valued based upon an over-the-counter or exchange bid quotation.
Investments in other open-end investment companies are valued at net asset value.
Investments for which market quotations are not readily available, or that have quotations which the Investment Manager believes are not reliable, are valued at fair value as determined in good faith under consistently applied procedures established by and under the general supervision of the Board of Trustees. If a security is valued at fair value, such value is likely to be different from the last quoted market price for the security. The determination of fair value often requires significant judgment. To determine fair value, the Investment Manager may use assumptions including but not limited to future
21
Columbia South Carolina Intermediate Municipal Bond Fund, March 31, 2011
cash flows and estimated risk premiums. Multiple inputs from various sources may be used to determine value.
Security Transactions
Security transactions are accounted for on the trade date. Cost is determined and gains (losses) are based upon the specific identification method for both financial statement and federal income tax purposes.
Income Recognition
Interest income is recorded on the accrual basis. Market premium and discount are amortized and accreted, respectively, on all debt securities, unless otherwise noted. Original issue discount is accreted to interest income over the life of the security with a corresponding increase in the cost basis, if any.
Dividend income is recorded on the ex-date.
Expenses
General expenses of the Trust are allocated to the Fund and other series of the Trust based upon relative net assets or other expense allocation methodologies determined by the nature of the expense. Expenses directly attributable to a specific class of shares are charged to that share class. Expenses directly attributable to the Fund are charged to the Fund.
Determination of Class Net Asset Value
All income, expenses (other than class-specific expenses which are charged directly to a share class, as shown in the Statement of Operations) and realized and unrealized gains (losses) are allocated to each class of the Fund on a daily basis for purposes of determining the net asset value of each class. Income and expenses are allocated to each class based on the settled shares method, while realized and unrealized gains (losses) are allocated based on the relative net assets of each class.
Federal Income Tax Status
The Fund intends to qualify each year as a "regulated investment company" under Subchapter M of the Internal Revenue Code, as amended, and will distribute substantially all of its tax exempt or taxable income, if any, for its tax year, and as such will not be subject to federal income taxes. In addition, the Fund intends to distribute in each calendar year substantially all of its net investment income, capital gains and certain other amounts, if any, such that the Fund should not be subject to federal excise tax. Therefore, no federal income or excise tax provision is recorded.
Distributions to Shareholders
Distributions from net investment income are declared daily and paid monthly. Net realized capital gains, if any, are distributed at least annually. Income distributions and capital gain distributions are determined in accordance with federal income tax regulations which may differ from GAAP.
Indemnifications
Under the Trust's organizational documents and, in some cases, by contract, its officers and directors are indemnified against certain liabilities arising out of the performance of their duties to the Fund. In addition, certain of the Fund's contracts with its service providers contain general indemnification clauses. The Fund's maximum exposure under these arrangements is unknown since the amount of any future claims that may be made against the Fund cannot be determined and the Fund has no historical basis for predicting the likelihood of any such claims.
Note 3. Fees and Compensation Paid to Affiliates
Investment Management Fee
Under an Investment Management Services Agreement (IMSA), the Investment Manager determines which securities will be purchased, held or sold. The management fee is equal to a percentage of the Fund's average daily net assets that declines from 0.40% to 0.27% as the Fund's net assets increase.
Prior to the Closing, Columbia Management Advisors, LLC (Columbia), an indirect, wholly owned subsidiary of Bank of America Corporation (BOA), provided investment management services to the Fund under the same fee structure. The effective management fee rate for the year ended March 31, 2011, was 0.40% of the Fund's average daily net assets.
Administration Fee
Effective upon the Closing, the Investment Manager provides administration and accounting services to the Fund under an Administrative Services Agreement, including services previously performed under the Pricing and Bookkeeping Oversight and Services Agreement (the Services Agreement) as discussed in the Pricing and Bookkeeping Fees note below. The Fund pays an annual administration fee equal to 0.15% of the Fund's average daily net assets less the fees payable by the Fund as described under the Pricing and Bookkeeping Fees note below. Prior to the Closing, Columbia provided administrative services to the Fund at the same fee rates.
22
Columbia South Carolina Intermediate Municipal Bond Fund, March 31, 2011
Pricing and Bookkeeping Fees
Prior to the Closing, the Fund entered into a Financial Reporting Services Agreement (the Financial Reporting Services Agreement) with State Street Bank and Trust Company (State Street) and Columbia pursuant to which State Street provides financial reporting services to the Fund. The Fund also entered into an Accounting Services Agreement (collectively with the Financial Reporting Services Agreement, the State Street Agreements) with State Street and Columbia pursuant to which State Street provides accounting services to the Fund. Upon the Closing, Columbia assigned and delegated its rights and obligations under the State Street Agreements to the Investment Manager. Under the State Street Agreements, the Fund pays State Street an annual fee of $38,000 paid monthly plus an additional monthly fee based on an annualized percentage rate of average daily net assets of the Fund for the month. The aggregate fee will not exceed $140,000 per year (exclusive of out-of-pocket expenses and charges). The Fund also reimburses State Street for certain out-of-pocket expenses and charges.
Also prior to the Closing, the Fund entered into the Services Agreement with Columbia. Under the Services Agreement, Columbia provided services related to Fund expenses and the requirements of the Sarbanes-Oxley Act of 2002, and provided oversight of the accounting and financial reporting services provided by State Street. Under the Services Agreement, the Fund reimbursed Columbia for out-of-pocket expenses and charges, including fees payable to third parties, such as for pricing the Fund's portfolio securities, incurred by Columbia in the performance of services under the Services Agreement. The Services Agreement was terminated upon the Closing. These services are now provided under the Administrative Services Agreement discussed above.
Transfer Agent Fee
In connection with the Closing, RiverSource Service Corporation, a wholly owned subsidiary of Ameriprise Financial, provides transfer agency services to the Fund under a Transfer Agency Agreement and changed its name to Columbia Management Investment Services Corp. (the Transfer Agent). The Transfer Agent has contracted with Boston Financial Data Services (BFDS) to serve as sub-transfer agent.
The Transfer Agent receives monthly account-based service fees based on the number of open accounts and is reimbursed by the Fund for the fees and expenses the Transfer Agent pays to financial intermediaries that maintain omnibus accounts with the Fund that is a percentage of the average aggregate value of the Fund's shares maintained in each such omnibus account (other than omnibus accounts for which American Enterprise Investment Services Inc. is the broker of record or accounts where the beneficial shareholder is a customer of Ameriprise Financial Services, Inc., which are paid a per account fee). The Transfer Agent pays the fees of BFDS for services as sub-transfer agent and is not entitled to reimbursement for such fees from the Fund (with the exception of out-of pocket fees). The Transfer Agent also receives compensation from fees for various shareholder services and reimbursements for certain out-of -pocket expenses.
Prior to the Closing, Columbia Management Services, Inc., an affiliate of Columbia and an indirect, wholly owned subsidiary of BOA, provided transfer agency services to the Fund and contracted with BFDS to serve as sub-transfer agent, under the same fee structure.
For the year ended March 31, 2011, the Fund's effective transfer agent fee rate for each class was 0.05% of the Fund's average daily net assets.
An annual minimum account balance fee of $20 may apply to certain accounts with a value below the Fund's initial minimum investment requirements to reduce the impact of small accounts on transfer agent fees. These minimum account balance fees are recorded as part of expense reductions on the Statement of Operations. For the year ended March 31, 2011, no minimum account balance fees were charged by the Fund.
Underwriting Discounts, Service and Distribution Fees
In connection with the Closing, RiverSource Fund Distributors, Inc., an indirect wholly owned subsidiary of Ameriprise Financial, provides distribution and shareholder services to the Fund and changed its name to Columbia Management Investment Distributors, Inc. (the Distributor). Pursuant to Rule 12b-1 under the 1940 Act, the Board of Trustees has approved, and the Fund has adopted, distribution and shareholder service plans (the Plans) which set the distribution and service fees for the Fund. These fees are calculated daily and are intended to compensate the Distributor and/or eligible selling and/or servicing agents for selling shares of the Fund and providing services to investors.
The Plans require the payment of a combined distribution and shareholder servicing fee for the Class A shares of the Fund. The Plans also require the payment of a monthly shareholder servicing fee and distribution fee for the Class B and Class C shares of the Fund. A substantial portion of the expenses incurred pursuant to these plans is
23
Columbia South Carolina Intermediate Municipal Bond Fund, March 31, 2011
paid to affiliates of the Distributor. The annual rates in effect and plan limits, as a percentage of average daily net assets, are as follows:
| | | Current
Rate | | Plan
Limit | |
Class A Combined Distribution and
Shareholder Servicing Plan | | | 0.25 | % | | | 0.25 | % | |
Class B and Class C Shareholder
Servicing Plans | | | 0.25 | % | | | 0.25 | % | |
Class B and Class C
Distribution Plans | | | 0.75 | % | | | 0.75 | % | |
Prior to the Closing, Columbia Management Distributors, Inc., an affiliate of Columbia and an indirect, wholly owned subsidiary of BOA, was the principal underwriter of the Fund's shares. There were no changes to the underwriting discount structure of the Fund or the service or distribution fee rates paid by the Fund as a result of the Transaction.
Sales Charges
Sales charges, including front-end and CDSC's, received by the Distributor for distributing Fund shares were $5,681 for Class A, $1,500 for Class B and $404 for Class C shares for the year ended March 31, 2011.
Fee Waivers and Expense Reimbursements
The Investment Manager has voluntarily agreed to bear a portion of the Fund's expenses so that the Fund's ordinary operating expenses (excluding any distribution and service fees, brokerage commissions, interest, taxes and extraordinary expenses, but including custodian charges relating to overdrafts, if any), after giving effect to any balance credits from the Fund's custodian, do not exceed 0.55% of the Fund's average daily net assets on an annualized basis. The Investment Manager, in its discretion, may revise or discontinue this arrangement at any time. Prior to May 1, 2010, Columbia voluntarily reimbursed a portion of the Fund's expenses in the same manner.
The Investment Manager is entitled to recover from the Fund any fees waived and/or expenses reimbursed for a three year period following the date of such fee waiver and/or reimbursement under these arrangements if such recovery does not cause the Fund's expenses to exceed the expense limitations in effect at the time of recovery. Prior to May 1, 2010, Columbia was entitled to recover fees waived and/or expenses reimbursed from the Fund in the same manner. At March 31, 2011, the amounts potentially recoverable pursuant to this arrangement were as follows:
| Amount of potential recovery expiring March 31, | | Total
potential | | Amount
expired | | Amount
recovered
during the
year ended | |
| 2014 | | 2013 | | 2012 | | recovery | | 3/31/11 | | 3/31/11 | |
| $ | 260,021 | | | $ | 247,880 | | | $ | 267,234 | | | $ | 775,135 | | | $ | 273,304 | | | $ | — | | |
Effective May 1, 2011, the Investment Manager has eliminated the fee recoupment provisions detailed above.
Fees Paid to Officers and Trustees
In connection with the Closing, all officers of the Fund are employees of the Investment Manager or its affiliates and, with the exception of the Fund's Chief Compliance Officer, receive no compensation from the Fund. The Board of Trustees has appointed a Chief Compliance Officer to the Fund in accordance with federal securities regulations. The Fund, along with other affiliated funds, pays its pro-rata share of the expenses associated with the Chief Compliance Officer. The Fund's expenses for the Chief Compliance Officer will not exceed $15,000 per year. Prior to the Closing, all officers of the Fund were employees of Columbia or its affiliates and the Fund paid its pro-rata share of the expenses for the Chief Compliance Officer under the same fee structure.
Trustees are compensated for their services to the Fund, as set forth on the Statement of Operations. The Trust's eligible Trustees may participate in a non-qualified deferred compensation plan which may be terminated at any time. Any payments to plan participants are paid solely out of the Fund's assets. Income earned on the plan participant's deferral account is based on the rate of return of the eligible mutual funds selected by the participant or, if no funds are selected, on the rate of return of Columbia Money Market Fund (formerly known as RiverSource Cash Management Fund). Prior to the Closing, if no funds were selected, income earned on the plan participant's deferral account was based on the rate of return of BofA Treasury Reserves. Trustees' fees deferred during the current period as well as any gains or losses on the trustees' deferred compensation balances as a result of market fluctuations are included in "Trustees' fees" on the Statement of Operations.
24
Columbia South Carolina Intermediate Municipal Bond Fund, March 31, 2011
Liabilities under the deferred compensation plan are included in "Trustees' fees" on the Statement of Assets and Liabilities.
Other
Prior to the Closing, the Fund made daily investments of cash balances in BofA Tax-Exempt Reserves, formerly an affiliated open-ended investment company of Columbia, pursuant to an exemptive order received from the Securities and Exchange Commission. The income earned prior to the Closing by the Fund from such investments is included as Dividends from affiliates on the Statement of Operations. As an investing Fund, the Fund was indirectly allocated its proportionate share of the expenses of BofA Tax-Exempt Reserves.
Note 4. Custody Credits
The Fund has an agreement with its custodian bank under which custody fees may be reduced by balance credits. These credits are recorded as part of expense reductions on the Statement of Operations. The Fund could have invested a portion of the assets utilized in connection with the expense offset arrangement in an income-producing asset if it had not entered into such an agreement. For the year ended March 31, 2011, these custody credits reduced total expenses by $7 for the Fund.
Note 5. Portfolio Information
The cost of purchases and proceeds from sales of securities, excluding short-term obligations, aggregated $25,162,140 and $56,269,117, respectively, for the year ended March 31, 2011.
Note 6. Shareholder Concentration
As of March 31, 2011, one shareholder account owned 72.3% of the outstanding shares of the Fund. Purchase and redemption activity of this account may have a significant effect on the operations of the Fund.
Note 7. Line of Credit
Prior to March 28, 2011, the Fund and other affiliated funds participated in a $280,000,000 committed, unsecured revolving line of credit provided by State Street. Effective March 28, 2011, the commitment was reduced to $225,000,000. The maximum amount that may be borrowed by any fund is limited to the lesser of $200,000,000 and the Fund's borrowing limit set forth in the Fund's registration statement. Borrowings are available for short-term liquidity or temporary or emergency purposes.
Effective October 14, 2010, interest is charged to each participating fund based on the fund's borrowings at a rate per annum equal to the greater of the Federal Funds Rate plus 1.25% or the overnight LIBOR Rate plus 1.25%. In addition, a commitment fee of 0.125% per annum is accrued and apportioned among the participating funds pro rata based on their relative net assets.
Prior to October 14, 2010, interest was charged to each participating fund at the same rates. In addition, a commitment fee of 0.15% per annum was accrued and apportioned among the participating funds pro rata based on their relative net assets.
For the year ended March 31, 2011, the Fund did not borrow under these arrangements.
Note 8. Federal Tax Information
The timing and character of income and capital gain distributions are determined in accordance with income tax regulations, which may differ from GAAP. Reclassifications are made to the Fund's capital accounts for permanent tax differences to reflect income and gains available for distribution (or available capital loss carryforwards) under income tax regulations.
For the year ended March 31, 2011, permanent book and tax basis differences resulting primarily from differing treatments for market discount adjustments were identified and reclassified among the components of the Fund's net assets as follows:
Undistributed
Net Investment
Income | | Accumulated
Net Realized
Loss | | Paid-In Capital | |
| $ | 3,676 | | | $ | (3,676 | ) | | $ | — | | |
Net investment income and net realized gains (losses), as disclosed on the Statement of Operations, and net assets were not affected by this reclassification.
The tax character of distributions paid during the years ended March 31, 2011 and March 31, 2010 was as follows:
| | | March 31, | |
| Distributions paid from: | | 2011 | | 2010 | |
| Tax-Exempt Income | | $ | 6,193,303 | | | $ | 7,126,807 | | |
| Ordinary Income* | | $ | 73,588 | | | | 89,026 | | |
* For tax purposes short-term capital gain distributions, if any, are considered ordinary income distributions.
25
Columbia South Carolina Intermediate Municipal Bond Fund, March 31, 2011
As of March 31, 2011, the components of distributable earnings on a tax basis were as follows:
Undistributed
Tax-Exempt
Income | | Undistributed
Long-Term
Capital Gains | | Net Unrealized
Appreciation* | |
| $ | 1,344,524 | | | $ | — | | | $ | 2,697,203 | | |
* The differences between book-basis and tax-basis net unrealized appreciation are primarily due to outstanding basis on market discount securities.
Unrealized appreciation and depreciation at March 31, 2011, based on cost of investments for federal income tax purposes were:
| Unrealized appreciation | | $ | 4,037,309 | | |
| Unrealized depreciation | | | (1,340,106 | ) | |
| Net unrealized appreciation | | $ | 2,697,203 | | |
The following capital loss carryforwards may be available to reduce taxable income arising from future net realized gains on investments, if any, to the extent permitted by the Internal Revenue Code:
| Year of Expiration | | Capital Loss
Carryforwards | |
| 2018 | | $ | 868,905 | | |
Capital loss carryforwards of $1,942,832 were utilized during the year ended March 31, 2011.
Management of the Fund has concluded that there are no significant uncertain tax positions that would require recognition in the financial statements. However, management's conclusion may be subject to review and adjustment at a later date based on factors including, but not limited to, new tax laws, regulations, and administrative interpretations (including relevant court decisions). The Fund's federal tax returns for the prior three fiscal years remain subject to examination by the Internal Revenue Service.
Note 9. Significant Risks and Contingencies
Sector Focus Risk
The Fund may focus its investments in certain sectors, subjecting it to greater risk than a fund that is less focused.
Geographic Concentration Risk
Securities issued by a particular state and its instrumentalities are subject to the risk of unfavorable developments in such state. The value of Fund shares may be more volatile than the value of shares of funds that invest in municipal securities of issuers in more than one state, as unfavorable developments have the potential to impact more significantly the Fund than funds that invest in municipal securities of many different states. A municipal security can be significantly affected by adverse tax, legislative, demographic or political changes as well as changes in the state's financial or economic condition and prospects.
The Fund's municipal holdings may include obligations of issuers that rely in whole or in part for payment of interest and principal on state specific revenues, real property taxes, revenues from particular institutions, such as healthcare institutions, or obligations secured by mortgages on real property. Consequently, the impact of changes in state law or regulations or the economic conditions in a particular state should be considered. The ability of issuers of debt securities held by the Fund to meet their obligations may be affected by economic developments in a specific industry or region.
Concentration of Credit Risk
The Fund holds investments that are insured by private insurers who guarantee the payment of principal and interest in the event of default or that are supported by a letter of credit. At March 31, 2011, Assured Guaranty Municipal Corp., which is rated AA+ by Standard & Poor's, insured 25.0% of the Fund's total net assets.
Tax Development Risk
The Fund purchases municipal securities whose interest, in the opinion of bond counsel, is free from federal income tax. There is no assurance that the Internal Revenue Service (IRS) will agree with this opinion. In the event the IRS determines that an issuer does not comply with relevant tax requirements, interest payments from a security could become federally taxable, possibly retroactively to the date the security was issued. As a shareholder of the Fund, you may be required to file an amended tax return as a result.
Note 10. Subsequent Events
Management has evaluated the events and transactions that have occurred through the date the financial statements were issued. Other than as noted below, there were no items requiring adjustment of the financial statements or additional disclosure.
26
Columbia South Carolina Intermediate Municipal Bond Fund, March 31, 2011
Effective May 16, 2011, the line of credit commitment with State Street was reduced to $150,000,000, and the maximum amount that may be borrowed by any fund was limited to the lesser of $120,000,000 and the Fund's borrowing limit set forth in the Fund's registration statement.
Note 11. Information Regarding Pending and Settled Legal Proceedings
In June 2004, an action captioned John E. Gallus et al. v. American Express Financial Corp. and American Express Financial Advisors Inc. was filed in the United States District Court for the District of Arizona. The plaintiffs allege that they are investors in several American Express Company (now known as RiverSource) mutual funds and they purport to bring the action derivatively on behalf of those funds under the Investment Company Act of 1940. The plaintiffs allege that fees allegedly paid to the defendants by the funds for investment advisory and administrative services are excessive. The plaintiffs seek remedies including restitution and rescission of investment advisory and distribution agreements. The plaintiffs voluntarily agreed to transfer this case to the United States District Court for the District of Minnesota (the District Court). In response to defendants' motion to dismiss the complaint, the District Court dismissed one of plaintiffs' four claims and granted plaintiffs limited discovery. Defendants moved for summary judgment in April 2007. Summary judgment was granted in the defendants' favor on July 9, 2007. The plaintiffs filed a notice of appeal with the Eighth Circuit Court of Appeals (the Eighth Circuit) on August 8, 2007. On April 8, 2009, the Eighth Circuit reversed summary judgment and remanded to the District Court for further proceedings. On August 6, 2009, defendants filed a writ of certiorari with the U.S. Supreme Court (the Supreme Court), asking the Supreme Court to stay the District Court proceedings while the Supreme Court considers and rules in a case captioned Jones v. Harris Associates, which involves issues of law similar to those presented in the Gallus case. On March 30, 2010, the Supreme Court issued its ruling in Jones v. Harris Associates, and on April 5, 2010, the Supreme Court vacated the Eighth Circuit's decision in the Gallus case and remanded the case to the Eighth Circuit for further consideration in light of the Supreme Court's decision in Jones v. Harris Associates. On June 4, 2010, the Eighth Circuit remanded the Gallus case to the District Court for further consideration in light of the Supreme Court's decision in Jones v. Harris Associates. On December 9, 2010, the District Court reinstated its July 9, 2007 summary judgment order in favor of the defendants. On January 10, 2011, plaintiffs filed a notice of appeal with the Eighth Circuit.
In December 2005, without admitting or denying the allegations, American Express Financial Corporation (AEFC, which is now known as Ameriprise Financial, Inc. (Ameriprise Financial)), entered into settlement agreements with the Securities and Exchange Commission (SEC) and Minnesota Department of Commerce (MDOC) related to market timing activities. As a result, AEFC was censured and ordered to cease and desist from committing or causing any violations of certain provisions of the Investment Advisers Act of 1940, the Investment Company Act of 1940, and various Minnesota laws. AEFC agreed to pay disgorgement of $10 million and civil money penalties of $7 million. AEFC also agreed to retain an independent distribution consultant to assist in developing a plan for distribution of all disgorgement and civil penalties ordered by the SEC in accordance with various undertakings detailed at http://www.sec.gov/litigation/admin/ia-2451.pdf. Ameriprise Financial and its affiliates have cooperated with the SEC and the MDOC in these legal proceedings, and have made regular reports to the funds' Boards of Directors/Trustees.
Ameriprise Financial and certain of its affiliates have historically been involved in a number of legal, arbitration and regulatory proceedings, including routine litigation, class actions, and governmental actions, concerning matters arising in connection with the conduct of their business activities. Ameriprise Financial believes that the Funds are not currently the subject of, and that neither Ameriprise Financial nor any of its affiliates are the subject of, any pending legal, arbitration or regulatory proceedings that are likely to have a material adverse effect on the Funds or the ability of Ameriprise Financial or its affiliates to perform under their contracts with the Funds. Ameriprise Financial is required to make 10-Q, 10-K and, as necessary, 8-K filings with the Securities and Exchange Commission on legal and regulatory matters that relate to Ameriprise Financial and its affiliates. Copies of these filings may be obtained by accessing the SEC website at www.sec.gov.
There can be no assurance that these matters, or the adverse publicity associated with them, will not result in increased fund redemptions, reduced sale of fund shares or other adverse consequences to the Funds. Further, although we believe proceedings are not likely to have a material adverse effect on the Funds or the ability of Ameriprise Financial or its affiliates to perform under their contracts with the Funds, these proceedings are subject to uncertainties and, as such, we are unable to estimate the possible loss or range of loss that may result. An adverse outcome in one or more of these proceedings could result in adverse judgments, settlements, fines, penalties or other relief that could have a material adverse effect on the consolidated financial condition or results of operations of Ameriprise Financial.
27
Report of Independent Registered Public Accounting Firm
To the Trustees of Columbia Funds Series Trust and the Shareholders of Columbia South Carolina Intermediate Municipal Bond Fund
In our opinion, the accompanying statement of assets and liabilities, including the investment portfolio, and the related statements of operations and of changes in net assets and the financial highlights present fairly, in all material respects, the financial position of Columbia South Carolina Intermediate Municipal Bond Fund (the "Fund") (a series of Columbia Funds Series Trust) at March 31, 2011, and the results of its operations for the year then ended, the changes in its net assets for each of the two years in the period then ended, and the financial highlights for each of the five years in the period then ended, in conformity with accounting principles generally accepted in the United States of America. These financial statements and financial highlights (hereafter referred to as "financial statements") are the responsibility of the Fund's management. Our responsibility is to express an opinion on these financial statements based on our audits. We conducted our audits of these financial statements in accordance with the standards of the Public Company Accounting Oversight Board (United States). Those standards require that we plan and perform the audit to obtain reasonable assurance about whether the financial statements are free of material misstatement. An audit includes examining, on a test basis, evidence supporting the amounts and disclosures in the financial statements, assessing the accounting principles used and significant estimates made by management, and evaluating the overall financial statement presentation. We believe that our audits, which included confirmation of securities at March 31, 2011 by correspondence with the custodian and brokers, provide a reasonable basis for our opinion.
PricewaterhouseCoopers LLP
Boston, Massachusetts
May 20, 2011
28
Federal Income Tax Information (Unaudited) – Columbia South Carolina Intermediate Municipal Bond Fund
For the fiscal year ended March 31, 2011, 98.83% of distributions made from net investment income of the Fund qualifies as exempt interest dividends for federal income tax purposes. A portion of the income may be subject to federal alternative minimum tax.
The Fund will notify shareholders in January 2012 of amounts for use in preparing 2011 income tax returns.
29
Fund Governance
The Trustees serve terms of indefinite duration. The names, addresses and birth years of the Trustees and Officers of the Funds in the Columbia Funds Series Trust, the year each was first elected or appointed to office, their principal business occupations during at least the last five years, the number of Funds overseen by each Trustee and other directorships they hold are shown below. Each officer listed below serves as an officer of each Fund in the Columbia Funds Series Trust.
Independent Trustees
Name, Address and Year of Birth,
Position with Funds, Year First
Elected or Appointed to Office | | Principal Occupation(s) During Past Five Years, Number of Funds in the Columbia
Funds Complex Overseen by Trustee, Other Directorships Held
| |
| Edward J. Boudreau, Jr. (Born 1944) | |
|
c/o Columbia Management
Investment Advisers, LLC
225 Franklin Street
Boston, MA 02110
Trustee (since 2005) | | Managing Director—E.J. Boudreau & Associates (consulting), from 2000 through current; oversees 41; Trustee—BofA Funds Series Trust. | |
|
| William P. Carmichael (Born 1943) | |
|
c/o Columbia Management
Investment Advisers, LLC
225 Franklin Street
Boston, MA 02110
Trustee (since 1999) | | Retired; oversees 41; Director—Cobra Electronics Corporation (electronic equipment manufacturer); Director—McMoRan Exploration Company (oil and gas exploration and development); Director—The Finish Line (athletic shoes and apparel); Trustee—BofA Funds Series Trust. | |
|
| William A. Hawkins (Born 1942) | |
|
c/o Columbia Management
Investment Advisers, LLC
225 Franklin Street
Boston, MA 02110
Trustee (since 2005) | | Managing Director—Overton Partners (financial consulting), August 2010 to present; President and Chief Executive Officer—California General Bank, N.A., from January 2008 through August 2010; oversees 41; Trustee—BofA Funds Series Trust. | |
|
| R. Glenn Hilliard (Born 1943) | |
|
c/o Columbia Management
Investment Advisers, LLC
225 Franklin Street
Boston, MA 02110
Trustee (since 2005) | | Chairman and Chief Executive Officer—Hilliard Group LLC (investing and consulting), from April 2003 through current; oversees 41; Trustee—BofA Funds Series Trust. | |
|
| John J. Nagorniak (Born 1944) | |
|
c/o Columbia Management
Investment Advisers, LLC
225 Franklin Street
Boston, MA 02110
Trustee (since 2008) | | Retired; President and Director—Foxstone Financial, Inc. (consulting), 2000 through December 2007; Director—Mellon Financial Corporation affiliates (investing), 2000 through 2007; Chairman—Franklin Portfolio Associates (investing—Mellon affiliate), 1982 through 2007; oversees 41; Director—MIT Investment Company; Trustee—MIT 401k Plan Trustee—Research Foundation of CFA Institute; Trustee—BofA Funds Series Trust. | |
|
30
Fund Governance (continued)
Independent Trustees (continued)
Name, Address and Year of Birth,
Position with Funds, Year First
Elected or Appointed to Office | | Principal Occupation(s) During Past Five Years, Number of Funds in the Columbia
Funds Complex Overseen by Trustee, Other Directorships Held
| |
| Minor M. Shaw (Born 1947) | |
|
c/o Columbia Management
Investment Advisers, LLC
225 Franklin Street
Boston, MA 02110
Trustee (since 2003) | | President—Micco Corporation and Mickel Investment Group; oversees 41; Board Member—Piedmont Natural Gas; Trustee—BofA Funds Series Trust. | |
|
Interested Trustee
| Anthony M. Santomero1 (Born 1946) | |
|
c/o Columbia Management
Investment Advisers, LLC
225 Franklin Street
Boston, MA 02110
Trustee (since 2008) | | Richard K. Mellon Professor Emeritus of Finance, The Wharton School, University of Pennsylvania, from 2002 through current; Senior Advisor—McKinsey & Company (consulting), July 2006 through January 2008; President and Chief Executive Officer—Federal Reserve Bank of Philadelphia, July 2000 through April 2006; oversees 41; Director—Renaissance Reinsurance Ltd; Trustee—Penn Mutual Life Insurance Company; Director—Citigroup, Inc.; Director—Citibank, N.A.; Trustee—BofA Funds Series Trust. | |
|
1 Dr. Santomero is currently deemed by the Columbia Funds to be an "interested person" (as defined in the 1940 Act) of the Funds because he serves as a Director of Citigroup, Inc. and Citibank, N.A., companies that may directly or through subsidiaries and affiliates engage from time-to-time in brokerage execution, principal transactions and lending relationships with the Columbia Funds or other funds or accounts advised/managed by Columbia Management Investment Advisers, LLC.
The Statement of Additional Information includes additional information about the Trustees of the Funds and is available, without charge, upon request by calling 800-345-6611.
Officers
| Name, Year of Birth and Address | | Principal Occupation(s) During the Past Five Years | |
| J. Kevin Connaughton (Born 1964) | |
|
225 Franklin Street
Boston, MA 02110
President (since 2009) | | Senior Vice President and General Manager—Mutual Fund Products, Columbia Management Investment Advisers, LLC since May 2010; President, Columbia Funds, since 2009, and RiverSource Funds, since May 2010 (previously Senior Vice President and Chief Financial Officer, Columbia Funds, from June 2008 to January 2009, Treasurer, Columbia Funds, from October 2003 to May 2008, and senior officer of various other affiliated funds since 2000); Managing Director, Columbia Management Advisors, LLC from December 2004 to April 2010. | |
|
| Michael G. Clarke (Born 1969) | |
|
225 Franklin Street
Boston, MA 02110
Treasurer (since 2011) and
Chief Financial Officer (since 2009) | | Vice President, Columbia Management Investment Advisers, LLC since May 2010; Managing Director of Fund Administration, Columbia Management Advisors, LLC, from September 2004 to April 2010; senior officer of Columbia Funds and affiliated funds since 2002. | |
|
31
Fund Governance (continued)
Officers (continued)
| Name, Year of Birth and Address | | Principal Occupation(s) During the Past Five Years | |
| Scott R. Plummer (Born 1959) | |
|
5228 Ameriprise Financial Center
Minneapolis, MN 55474
Senior Vice President and
Chief Legal Officer (since 2010) | | Chief Legal Officer and Assistant Secretary, Columbia Management Investment Advisers, LLC since June 2005; Vice President and Lead Chief Counsel—Asset Management, Ameriprise Financial, Inc. since May 2010 (previously Vice President and Chief Counsel—Asset Management, from 2005 to April 2010, and Vice President—Asset Management Compliance from 2004 to 2005); Vice President, Chief Counsel and Assistant Secretary, Columbia Management Investment Distributors, Inc. since 2008; Vice President, General Counsel and Secretary, Ameriprise Certificate Company since 2005; Chief Counsel, RiverSource Distributors, Inc. since 2006; Vice President, General Counsel and Secretary, RiverSource Funds, since December 2006; Senior Vice President, Secretary and Chief Legal Officer, Columbia Funds, since May 2010. | |
|
| Linda J. Wondrack (Born 1964) | |
|
225 Franklin Street
Boston, MA 02110
Senior Vice President and
Chief Compliance Officer (since 2007) | | Vice President and Chief Compliance Officer, Columbia Management Investment Advisers, LLC since May 2010; Chief Compliance Officer, Columbia Funds, since 2007, and RiverSource Funds, since May 2010; Director (Columbia Management Group, LLC and Investment Product Group Compliance), Bank of America, from June 2005 to April 2010. | |
|
| William F. Truscott (Born 1960) | |
|
53600 Ameriprise Financial Center
Minneapolis, MN 55474
Senior Vice President (since 2010) | | Chairman of the Board, Columbia Management Investment Advisers, LLC since May 2010 (previously President, Chairman of the Board and Chief Investment Officer, from 2001 to April 2010); Chief Executive Officer, U.S. Asset Management & President, Annuities, Ameriprise Financial, Inc. since May 2010 (previously President—U.S. Asset Management and Chief Investment Officer from 2005 to April 2010, and Senior Vice President—Chief Investment Officer, from 2001 to 2005); Director, President and Chief Executive Officer, Ameriprise Certificate Company since 2006; Director, Columbia Management Investment Distributors, Inc. since May 2010 (previously Chairman of the Board and Chief Executive Officer from 2008 to April 2010); Chairman of the Board and Chief Executive Officer, RiverSource Distributors, Inc. since 2006. | |
|
| Colin Moore (Born 1958) | |
|
225 Franklin Street
Boston, MA 02110
Senior Vice President (since 2010) | | Director and Chief Investment Officer, Columbia Management Investment Advisers, LLC since May 2010; Manager, Managing Director and Chief Investment Officer of Columbia Management Advisors, LLC from 2007 to April 2010; Head of Equities, Columbia Management Advisors, LLC from 2002 to 2007. | |
|
| Michael A. Jones (Born 1959) | |
|
225 Franklin Street
Boston, MA 02110
Senior Vice President (since 2010) | | President and Director, Columbia Management Investment Advisers, LLC since May 2010; President and Director, Columbia Management Investment Distributors, Inc. since May 2010; Manager, Chairman, Chief Executive Officer and President, Columbia Management Advisors, LLC from 2007 to April 2010; Chief Executive Officer, President and Director, Columbia Management Distributors, Inc. from November 2006 to April 2010; previously, co-president and senior managing director at Robeco Investment Management. | |
|
32
Fund Governance (continued)
Officers (continued)
| Name, Year of Birth and Address | | Principal Occupation(s) During the Past Five Years | |
| Christopher O. Petersen (Born 1970) | |
|
5228 Ameriprise Financial Center
Minneapolis, MN 55474
Vice President and
Secretary (since 2011) | | Vice President and Chief Counsel, Ameriprise Financial since January 2010 (formerly Vice President and Group Counsel or Counsel from April 2004 to January 2010); Assistant Secretary of RiverSource Funds since January 2007. | |
|
| Amy Johnson (Born 1965) | |
|
5228 Ameriprise Financial Center
Minneapolis, MN 55474
Vice President (since 2010) | | Senior Vice President and Chief Operating Officer, Columbia Management Investment Advisers, LLC since May 2010 (previously Chief Administrative Officer, from 2009 until April 2010, Vice President—Asset Management and Trust Company Services, from 2006 to 2009, and Vice President—Operations and Compliance from 2004 to 2006). | |
|
| Joseph F. DiMaria (Born 1968) | |
|
225 Franklin Street
Boston, MA 02110
Vice President (since 2011) and
Chief Accounting Officer (since 2008) | | Vice President, Mutual Fund Administration, Columbia Management Investment Advisers, LLC, since May 2010; Director of Fund Administration, Columbia Management Advisors, LLC from January 2006 to April 2010; Head of Tax/Compliance and Assistant Treasurer, Columbia Management Advisors, LLC, from November 2004 to December 2005. | |
|
| Paul B. Goucher (Born 1968) | |
|
5228 Ameriprise Financial Center
Minneapolis, MN 55474
Vice President and
Assistant Treasurer (since 2010) | | Vice President and Chief Counsel of Ameriprise Financial since January 2010 (formerly Vice President and Group Counsel from November 2008 to January 2010); Director, Managing Director and General Counsel of J. & W. Seligman & Co. Incorporated (Seligman) from July 2008 to November 2008 and Managing Director and Associate General Counsel of Seligman from January 2005 to July 2008. | |
|
| Michael E. DeFao (Born 1968) | |
|
5228 Ameriprise Financial Center
Minneapolis, MN 55474
Vice President and
Assistant Treasurer (since 2011) | | Vice President and Chief Counsel, Ameriprise Financial since May 2010; Associate General Counsel Bank of America from June 2005 to April 2010. | |
|
| Stephen T. Welsh (Born 1957) | |
|
225 Franklin Street
Boston, MA 02110
Vice President (since 2006) | | President and Director, Columbia Management Investment Services Corp. since May 2010; President and Director, Columbia Management Services, Inc. from July 2004 to April 2010; Managing Director, Columbia Management Distributors, Inc. from August 2007 to April 2010. | |
|
33
Shareholder Meeting Results
At a Joint Special Meeting of Shareholders held on February 15, 2011, shareholders of the series of Columbia Funds Series Trust, including the Fund, elected each of the nominees for trustees to the Board of Trustees of Columbia Funds Series Trust, each to hold office for an indefinite term, as follows:
| Trustee | | Votes For | | Votes Withheld | | Abstentions | |
| Kathleen Blatz | | | 2,145,636,122 | | | | 248,012,438 | | | | 0 | | |
| Edward J. Boudreau, Jr. | | | 2,145,430,114 | | | | 248,218,446 | | | | 0 | | |
| Pamela G. Carlton | | | 2,145,515,949 | | | | 248,132,612 | | | | 0 | | |
| William P. Carmichael | | | 2,145,038,695 | | | | 248,609,866 | | | | 0 | | |
| Patricia M. Flynn | | | 2,145,843,563 | | | | 247,804,997 | | | | 0 | | |
| William A. Hawkins | | | 2,145,359,401 | | | | 248,289,160 | | | | 0 | | |
| R. Glenn Hilliard | | | 2,145,079,400 | | | | 248,569,161 | | | | 0 | | |
| Stephen R. Lewis, Jr. | | | 2,145,092,209 | | | | 248,556,351 | | | | 0 | | |
| John F. Maher | | | 2,145,621,338 | | | | 248,027,223 | | | | 0 | | |
| John J. Nagorniak | | | 2,145,337,494 | | | | 248,311,067 | | | | 0 | | |
| Catherine James Paglia | | | 2,145,615,254 | | | | 248,033,306 | | | | 0 | | |
| Leroy C. Richie | | | 2,145,042,120 | | | | 248,606,441 | | | | 0 | | |
| Anthony M. Santomero | | | 2,145,088,174 | | | | 248,560,386 | | | | 0 | | |
| Minor M. Shaw | | | 2,145,430,762 | | | | 248,217,798 | | | | 0 | | |
| Alison Taunton-Rigby | | | 2,145,393,384 | | | | 248,255,177 | | | | 0 | | |
| William F. Truscott | | | 2,144,907,223 | | | | 248,741,338 | | | | 0 | | |
34
This page intentionally left blank.
This page intentionally left blank.
Important Information About This Report
The fund mails one shareholder report to each shareholder address. If you would like more than one report, please call shareholder services at 1-800-345-6611 and additional reports will be sent to you. This report has been prepared for shareholders of Columbia South Carolina Intermediate Municipal Bond Fund.
A description of the policies and procedures that the fund uses to determine how to vote proxies and a copy of the fund's voting records are available (i) at www.columbiamanagement.com, (ii) on the Securities and Exchange Commission's website at www.sec.gov, and (iii) without charge, upon request, by calling 1-800-368-0346. Information regarding how the fund voted proxies relating to portfolio securities during the 12-month period ended June 30 is available from the SEC's website. Information regarding how the fund voted proxies relating to portfolio securities is also available from the fund's website, www.columbiamanagement.com.
The fund files a complete schedule of portfolio holdings with the SEC for the first and third quarters of each fiscal year on Form N-Q. The fund's Form N-Q is available on the SEC's website at www.sec.gov and may be reviewed and copied at the SEC's Public Reference Room in Washington, D.C. Information on the operation of the Public Reference Room may be obtained by calling 1-800-SEC-0330.
Transfer Agent
Columbia Management Investment
Services Corp.
P.O. Box 8081
Boston, MA 02266-8081
1-800-345-6611
Distributor
Columbia Management Investment
Distributors, Inc.
225 Franklin Street
Boston, MA 02110
Investment Manager
Columbia Management Investment Advisers, LLC
225 Franklin Street
Boston, MA 02110
37

PRSRT STD
U.S. Postage
PAID
Holliston, MA
Permit NO. 20
Columbia South Carolina Intermediate Municipal Bond Fund
P. O. Box 8081
Boston, MA 02266-8081
columbiamanagement.com
This information is for use with concurrent or prior delivery of a fund prospectus. Investors should consider the investment objectives, risks, charges and expenses of a mutual fund carefully before investing. For a free prospectus, which contains this and other important information about the funds, visit columbiamanagement.com. Read the prospectus carefully before investing. The Fund is distributed by Columbia Management Investment Distributors, Inc., member FINRA, and managed by Columbia Management Investment Advisers, LLC.
© 2011 Columbia Management Investment Advisers, LLC. All rights reserved.
C-1101 A (05/11)

Columbia Virginia Intermediate Municipal Bond Fund
Annual Report for the Period Ended March 31, 2011
Not FDIC insured • No bank guarantee • May lose value
Table of Contents
| Fund Profile | | | 1 | | |
|
| Economic Update | | | 2 | | |
|
| Performance Information | | | 4 | | |
|
| Understanding Your Expenses | | | 5 | | |
|
| Portfolio Manager's Report | | | 6 | | |
|
| Investment Portfolio | | | 8 | | |
|
Statement of Assets and
Liabilities | | | 15 | | |
|
| Statement of Operations | | | 17 | | |
|
Statement of Changes in
Net Assets | | | 18 | | |
|
| Financial Highlights | | | 20 | | |
|
| Notes to Financial Statements | | | 24 | | |
|
Report of Independent Registered
Public Accounting Firm | | | 32 | | |
|
| Federal Income Tax Information | | | 33 | | |
|
| Fund Governance | | | 34 | | |
|
| Shareholder Meeting Results | | | 38 | | |
|
Important Information About
This Report | | | 41 | | |
|
The views expressed in this report reflect the current views of the respective parties. These views are not guarantees of future performance and involve certain risks, uncertainties and assumptions that are difficult to predict, so actual outcomes and results may differ significantly from the views expressed. These views are subject to change at any time based upon economic, market or other conditions and the respective parties disclaim any responsibility to update such views. These views may not be relied on as investment advice and, because investment decisions for a Columbia Fund are based on numerous factors, may not be relied on as an indication of trading intent on behalf of any particular Columbia Fund. References to specific securities should not be construed as a recommendation or investment advice.
President's Message

Dear Shareholder:
The Columbia Management story began over 100 years ago, and today, we are one of the nation's largest dedicated asset managers. The recent acquisition by Ameriprise Financial, Inc. brings together the talents, resources and capabilities of Columbia Management with those of RiverSource Investments, Threadneedle (acquired by Ameriprise in 2003) and Seligman Investments (acquired by Ameriprise in 2008) to build a best-in-class asset management business that we believe is truly greater than its parts.
RiverSource Investments traces its roots to 1894 when its then newly-founded predecessor, Investors Syndicate, offered a face-amount savings certificate that gave small investors the opportunity to build a safe and secure fund for retirement, education or other special needs. A mutual fund pioneer, Investors Syndicate launched Investors Mutual Fund in 1940. In the decades that followed, its mutual fund products and services lineup grew to include a full spectrum of styles and specialties. More than 110 years later, RiverSource continues to be a trusted financial products leader.
Threadneedle, a leader in global asset management and one of Europe's largest asset managers, offers sophisticated international experience from a dedicated U.K. management team. Headquartered in London, it is named for Threadneedle Street in the heart of the city's financial district, where British investors pioneered international and global investing. Threadneedle was acquired in 2003 and today operates as an affiliate of Columbia Management.
Seligman Investments' beginnings date back to the establishment of the investment firm J. & W. Seligman & Co. in 1864. In the years that followed, Seligman played a major role in the geographical expansion and industrial development of the United States. In 1874, President Ulysses S. Grant named Seligman as fiscal agent for the U.S. Navy—an appointment that would last through World War I. Seligman helped finance the westward path of the railroads and the building of the Panama Canal. The firm organized its first investment company in 1929 and began managing its first mutual fund in 1930. In 2008, J. & W. Seligman & Co. Incorporated was acquired and Seligman Investments became an offering brand of RiverSource Investments, LLC.
We are proud of the rich and distinctive history of these firms, the strength and breadth of products and services they offer, and the combined cultures of pioneering spirit and forward thinking. Together we are committed to providing more for our shareholders than ever before.
> A singular focus on our shareholders
Our business is asset management, so investors are our first priority. We dedicate our resources to identifying timely investment opportunities and provide a comprehensive choice of equity, fixed-income and alternative investments to help meet your individual needs.
> First-class research and thought leadership
We are dedicated to helping you take advantage of today's opportunities and anticipate tomorrow's. We stay abreast of the latest investment trends and ideas, using our collective insight to evaluate events and transform them into solutions you can use.
> A disciplined investment approach
We aren't distracted by passing fads. Our teams adhere to a rigorous investment process that helps ensure the integrity of our products and enables you and your financial advisor to match our solutions to your objectives with confidence.
When you choose Columbia Management, you can be confident that we will take the time to understand your needs and help you and your financial advisor identify the solutions that are right for you. Because at Columbia Management, we don't consider ourselves successful unless you are.
Sincerely,

J. Kevin Connaughton
President, Columbia Funds
Investors should consider the investment objectives, risks, charges and expenses of a mutual fund carefully before investing. For a free prospectus, which contains this and other important information about the funds, visit www.columbiamanagement.com. The prospectus should be read carefully before investing.
Columbia Funds are distributed by Columbia Management Investment Distributors, Inc., member FINRA, and managed by Columbia Management Investment Advisers, LLC.
© 2011 Columbia Management Investment Advisers, LLC. All rights reserved.
Fund Profile – Columbia Virginia Intermediate Municipal Bond Fund
Summary
g For the 12-month period that ended March 31, 2011, the fund's Class A shares returned 2.40% without sales charge.
g The fund trailed its benchmark, the Barclays Capital 3-15 Year Blend Municipal Bond Index,1 but outdistanced the average return of funds in its peer group, the Lipper Other States Intermediate Municipal Debt Funds Classification.2
g The fund's focus on Virginia hampered returns against the Barclays index, which is national in scope. The fund's positioning across the maturity spectrum aided performance.
Portfolio Management
James M. D'Arcy has managed the fund since 2010. From 1999 until joining the Investment Manager in May 2010, Mr. D'Arcy was associated with the fund's previous investment adviser as an investment professional.
1The Barclays Capital 3-15 Year Blend Municipal Bond Index tracks the performance of municipal bonds issued after December 31, 1990 with remaining maturities between 2 and 17 years and at least $7 million in principal amount outstanding.
2Lipper Inc., a widely respected data provider in the industry, calculates an average total return (assuming reinvestment of distributions) for mutual funds with investment objectives similar to those of the fund. Lipper makes no adjustment for the effect of sales loads.
Indices are not available for investment, are not professionally managed and do not reflect sales charges, fees, brokerage commissions, taxes or other expenses of investing. Securities in the fund may not match those in an index.
Performance data quoted represents past performance and current performance may be lower or higher. Past performance is no guarantee of future results. The investment return and principal value will fluctuate so that shares, when redeemed, may be worth more or less than the original cost. Please visit www.columbiamanagement.com for daily and most recent month-end performance updates.
Summary
1-year return as of 03/31/11
| | +2.40% | |
|
 | | Class A shares
(without sales charge) | |
|
| | +2.91% | |
|
 | | Barclays Capital 3-15 Year
Blend Municipal Bond Index | |
|
1
Economic Update – Columbia Virginia Intermediate Municipal Bond Fund
Summary
For the 12-month period that ended March 31, 2011
g Strengthening economic growth and rising interest rates kept a lid on most bond market sectors. The Barclays Capital Aggregate Bond Index delivered modest results. However, high-yield bonds were strong performers, as measured by the JPMorgan Developed BB High Yield Index.
Barclays
Aggregate Index | | JPMorgan
Index | |
|
 | |  | |
|
g The U.S. stock market, as measured by the S&P 500 Index, delivered solid returns, despite a summer 2010 correction. Foreign stock market returns were also positive, as measured by the MSCI EAFE Index (Net).
| S&P Index | | MSCI Index | |
|
 | |  | |
|
The U.S. economy continued to expand at a solid but uneven pace over the past 12 months, as measured by gross domestic product (GDP). Although lackluster second quarter 2010 GDP growth raised fears that the economy was losing steam and might lapse back into recession, the pace picked up in the third quarter of 2010, inspiring confidence among consumers, businesses and investors. GDP expanded by 2.6% in the third quarter and 3.1% in the fourth quarter. With the Federal Reserve Board (the Fed) providing additional monetary stimulus to shore up economic growth and the extension of key tax cuts for the next two years, expectations are for continued growth in 2011. However, early estimates of first quarter 2011 growth place it just under 2.0%, a disappointment after two strong quarters and a pick-up in employment.
Consumer spending on cars, clothing and other goods generally trended higher during the 12-month period, accelerating in the fourth quarter of 2010. Holiday spending rose 5.5% between November 5, 2010 and December 24, 2010, in all retail categories, excluding automobiles, compared with the same period in 2009, according to MasterCard Advisors' SpendingPulse, which tracks spending on all transactions including cash. Personal income surged in January 2011, as payroll tax cuts kicked in. The personal savings rate edged higher, ending February 2011, the last month for which data was available, at 5.8%.
News on the job front was increasingly positive. A good portion of the jobs added in March, April and May of 2010 were temporary, government-sponsored census positions, which began to unwind in June, July and August 2010. However, private sector payroll employment began to trend higher in the third quarter, massive layoffs declined and job growth turned solidly positive, with the addition of 444,000 new jobs in the first quarter of 2011.
Despite some glimmers of improvement early in 2010, the housing market remained troublesome throughout the period. Both new and existing home sales fell after a federal tax credit for new and repeat homebuyers expired. Distressed properties pressured prices and foreclosures continued—another drag on prices. The inventory of unsold homes ended the period higher than it started, at 8.9 and 8.6 months for new and existing homes, respectively, according to the National Association of Realtors and a joint release from the U.S. Census Bureau and the U.S. Department of Housing and Urban Development. The new year brought more disappointing news: Existing home sales fell in January 2011 after three months of sustained improvement. Tight credit and weak appraisals were cited as possible reasons for the decline.
Reports from the business side of the economy were generally positive. A key measure of the nation's manufacturing situation—the Institute for Supply Management's Index—took a somewhat surprising turn higher in the final months of the period. Technology spending rose 12% in 2010, according to the NPD Group, a national marketing research firm. Purchases of computers, networking and software returned to prerecession levels. Industrial production rose over the period, and manufacturing capacity utilized, per the report issued by the Fed—a key measure of the health of the manufacturing sector—also edged higher.
2
Economic Update (continued) – Columbia Virginia Intermediate Municipal Bond Fund
Bonds delivered modest returns
As the economy strengthened and interest rates edged higher, most bond sectors delivered modest returns. The Barclays Capital Aggregate Bond Index1 returned 5.12%. High-yield bonds led the fixed-income markets. For the 12 months covered by this report, the JPMorgan Developed BB High Yield Index2 returned 13.04% as default fears abated and investors grew more comfortable with risk. Despite rising yields in the second half of the period, the Treasury market was also positive. The Barclays Capital U.S. Treasury Index3 returned 4.53%. However, municipal bonds struggled in the second half of the period, as interest rates inched higher and issue supply surged ahead of the year-end expiration of the Build America Bonds program. The Barclays Capital Municipal Bond Index4 gained 1.63% for the period. Despite positive economic activity, the Fed kept a key short-term interest rate—the federal funds rate—close to zero, reflecting ongoing concerns about employment and the housing market.
Stocks moved higher despite summer 2010 decline
Against a strengthening economic backdrop, stock prices continued to rally despite a summer 2010 setback linked to a debt crisis brewing in Europe, which raised concerns among U.S. investors. These fears were short-lived and stocks regained their footing. In this environment, the S&P 500 Index5 returned 15.65% for the 12 months through March 31, 2011. Outside the United States, stock markets also delivered solid gains. The MSCI EAFE Index (Net),6 a broad gauge of stock market performance in foreign developed markets, returned 10.42% (in U.S. dollars) for the 12-month period, as concerns about the impact of a bailout for weak euro zone economies eased yet continued to restrain market performance. Emerging stock markets were strong. The MSCI Emerging Markets Index (Net)7 returned 18.46% (in U.S. dollars) for the 12-month period.
Past performance is no guarantee of future results.
1The Barclays Capital Aggregate Bond Index is a market value-weighted index that tracks the daily price, coupon, pay-downs and total return performance of fixed-rate, publicly placed, dollar-denominated and non-convertible investment grade debt issues with at least $250 million par amount outstanding and with at least one year to final maturity.
2The JPMorgan Developed BB High Yield Index is an unmanaged index designed to mirror the investable universe of the U.S. dollar developed, BB-rated, high yield corporate debt market.
3The Barclays Capital U.S. Treasury Index includes public obligations of the U.S. Treasury. Treasury bills are excluded by the maturity constraint. In addition, certain special issues, such as state and local government series bonds (SLGs), as well as U.S. Treasury TIPS, are excluded. STRIPS are excluded from the index because their inclusion would result in double-counting.
4The Barclays Capital Municipal Bond Index is considered representative of the broad market for investment-grade, tax-exempt bonds with a maturity of at least one year.
5The Standard & Poor's (S&P) 500 Index tracks the performance of 500 widely held, large-capitalization U.S. stocks.
6The Morgan Stanley Capital International Europe, Australasia, Far East (MSCI EAFE) Index (Net) is a free float- adjusted market capitalization index that is designed to measure the equity market performance of developed markets, excluding the U.S. & Canada. As of December 31, 2010, the MSCI EAFE Index (Net) consisted of the following 22 developed market country indices: Australia, Austria, Belgium, Denmark, Finland, France, Germany, Greece, Hong Kong, Ireland, Israel, Italy, Japan, the Netherlands, New Zealand, Norway, Portugal, Singapore, Spain, Sweden, Switzerland and the United Kingdom.
7The Morgan Stanley Capital International Emerging Markets (MSCI EM) Index (Net) is a free float-adjusted market capitalization index that is designed to measure equity market performance of emerging markets. As of December 31, 2010, the MSCI EM Index (Net) consisted of the following 21 emerging market country indices: Brazil, Chile, China, Colombia, Czech Republic, Egypt, Hungary, India, Indonesia, Korea, Malaysia, Mexico, Morocco, Peru, Philippines, Poland, Russia, South Africa, Taiwan, Thailand and Turkey.
Indices are not available for investment, are not professionally managed and do not reflect sales charges, fees, brokerage commissions, taxes or other expenses of investing. Securities in the fund may not match those in an index.
3
Performance Information – Columbia Virginia Intermediate Municipal Bond Fund
Performance data quoted represents past performance and current performance may be lower or higher. Past performance is no guarantee of future results. The investment return and principal value will fluctuate so that shares, when redeemed, may be worth more or less than the original cost. Please visit www.columbiamanagement.com for daily and most recent month-end performance updates.
Performance of a $10,000 investment 04/01/01 – 03/31/11
The chart above shows the change in value of a hypothetical $10,000 investment in Class A shares of Columbia Virginia Intermediate Municipal Bond Fund during the stated time period, and does not reflect the deduction of taxes that a shareholder may pay on fund distributions or on the redemption of fund shares.
Performance of a $10,000 investment 04/01/01 – 03/31/11 ($)
| Sales charge | | without | | with | |
| Class A | | | 14,412 | | | | 13,940 | | |
| Class B | | | 13,371 | | | | 13,371 | | |
| Class C | | | 13,371 | | | | 13,371 | | |
| Class Z | | | 14,762 | | | | n/a | | |
Average annual total return as of 03/31/11 (%)
| Share class | | A | | B | | C | | Z | |
| Inception | | 12/05/89 | | 06/07/93 | | 06/17/92 | | 09/20/89 | |
| Sales charge | | without | | with | | without | | with | | without | | with | | without | |
| 1-year | | | 2.40 | | | | –0.95 | | | | 1.55 | | | | –1.42 | | | | 1.54 | | | | 0.55 | | | | 2.56 | | |
| 5-year | | | 3.90 | | | | 3.21 | | | | 3.13 | | | | 3.13 | | | | 3.12 | | | | 3.12 | | | | 4.14 | | |
| 10-year | | | 3.72 | | | | 3.38 | | | | 2.95 | | | | 2.95 | | | | 2.95 | | | | 2.95 | | | | 3.97 | | |
The "with sales charge" returns include the maximum initial sales charge of 3.25% for Class A shares and the applicable contingent deferred sales charge of 3.00% in the first year, declining to 1.00% in the fourth year and eliminated thereafter for Class B shares and 1.00% for Class C shares for the first year only. The "without sales charge" returns do not include the effect of sales charges. If they had, returns would be lower.
Performance results reflect any fee waivers or reimbursements of fund expenses by the Investment Manager and/or any of its affiliates. Absent these fee waivers or expense reimbursement arrangements, performance results would have been lower.
All results shown assume reinvestment of distributions. Class Z shares are sold at net asset value with no distribution and service (Rule 12b-1) fees. Class Z shares have limited eligibility and the investment minimum requirements may vary. Please see the fund's prospectus for details. Performance for different share classes will vary based on differences in sales charges and fees associated with each class.
The tables do not reflect the deduction of taxes that a shareholder may pay on fund distributions or on the redemption of fund shares.
4
Understanding Your Expenses – Columbia Virginia Intermediate Municipal Bond Fund
As a fund shareholder, you incur two types of costs. There are transaction costs, which generally include sales charges on purchases and may include redemption fees or exchange fees. There are also ongoing costs, which generally include investment advisory fees, distribution and service (Rule 12b-1) fees and other fund expenses. The information on this page is intended to help you understand the ongoing costs of investing in the fund and to compare these costs with the ongoing costs of investing in other mutual funds.
Analyzing your fund's expenses by share class
To illustrate these ongoing costs, we have provided an example and calculated the expenses paid by investors in each share class during the period. The information in the following table is based on an initial investment of $1,000, which is invested at the beginning of the period and held for the entire period. Expense information is calculated two ways and each method provides you with different information. The amount listed in the "Actual" column is calculated using the fund's actual operating expenses and total return for the period. The amount listed in the "Hypothetical" column for each share class assumes that the return each year is 5% before expenses and is calculated based on the fund's actual operating expenses. You should not use the hypothetical account values and expenses to estimate either your actual account balance at the end of the period or the expenses you paid during this period.
Compare with other funds
Since all mutual funds are required to include the same hypothetical calculations about expenses in shareholder reports, you can use this information to compare the ongoing cost of investing in the fund with other funds. To do so, compare the 5% hypothetical example with the 5% hypothetical examples that appear in the shareholder reports of other funds. As you compare hypothetical examples of other funds, it is important to note that hypothetical examples are meant to highlight the ongoing costs of investing in a fund and do not reflect any transaction costs, such as sales charges, redemption fees or exchange fees.
Estimating your actual expenses
To estimate the expenses that you paid over the period, first you will need your account balance at the end of the period:
g For shareholders who receive their account statements from Columbia Management Investment Services Corp., your account balance is available online at www.columbiamanagement.com or by calling Shareholder Services at 800.345.6611.
g For shareholders who receive their account statements from their financial intermediary, contact your financial intermediary to obtain your account balance.
1. Divide your ending account balance by $1,000. For example, if an account balance was $8,600 at the end of the period, the result would be 8.6.
2. In the section of the table below titled "Expenses paid during the period," locate the amount for your share class. You will find this number in the column labeled "Actual." Multiply this number by the result from step 1. Your answer is an estimate of the expenses you paid on your account during the period.
If the value of your account falls below the minimum initial investment requirement applicable to you, your account may be subject to a $20 annual fee. This fee is not included in the accompanying table. If you are subject to the fee, keep it in mind when you are estimating the ongoing expenses of investing in the fund and when comparing the expenses of this fund with other funds.
10/01/10 – 03/31/11
| | | Account value at the
beginning of the period ($) | | Account value at the
end of the period ($) | | Expenses paid
during the period ($) | | Fund's annualized
expense ratio (%) | |
| | | Actual | | Hypothetical | | Actual | | Hypothetical | | Actual | | Hypothetical | | Actual | |
| Class A | | | 1,000.00 | | | | 1,000.00 | | | | 974.60 | | | | 1,020.94 | | | | 3.94 | | | | 4.03 | | | | 0.80 | | |
| Class B | | | 1,000.00 | | | | 1,000.00 | | | | 971.10 | | | | 1,017.20 | | | | 7.62 | | | | 7.80 | | | | 1.55 | | |
| Class C | | | 1,000.00 | | | | 1,000.00 | | | | 971.00 | | | | 1,017.20 | | | | 7.62 | | | | 7.80 | | | | 1.55 | | |
| Class Z | | | 1,000.00 | | | | 1,000.00 | | | | 975.00 | | | | 1,022.19 | | | | 2.71 | | | | 2.77 | | | | 0.55 | | |
Expenses paid during the period are equal to the annualized expense ratio for the share class, multiplied by the average account value over the period, then multiplied by the number of days in the fund's most recent fiscal half-year and divided by 365.
Had the Investment Manager and/or any of its affiliates not waived fees or reimbursed a portion of expenses, account value at the end of the period would have been reduced.
It is important to note that the expense amounts shown in the table are meant to highlight only ongoing costs of investing in the fund and do not reflect any transaction costs, such as sales charges, redemption fees or exchange fees. Therefore, the hypothetical examples provided may not help you determine the relative total costs of owning shares of different funds. If these transaction costs were included, your costs would have been higher.
5
Portfolio Manager's Report – Columbia Virginia Intermediate Municipal Bond Fund
Performance data quoted represents past performance and current performance may be lower or higher. Past performance is no guarantee of future results. The investment return and principal value will fluctuate so that shares, when redeemed, may be worth more or less than the original cost. Please visit www.columbiamanagement.com for daily and most recent month-end performance updates.
Net asset value per share
as of 03/31/11 ($)
| Class A | | | 10.86 | | |
| Class B | | | 10.86 | | |
| Class C | | | 10.86 | | |
| Class Z | | | 10.85 | | |
Distributions declared per share
04/01/10 – 03/31/11 ($)
| Class A | | | 0.34 | | |
| Class B | | | 0.26 | | |
| Class C | | | 0.26 | | |
| Class Z | | | 0.37 | | |
A portion of the fund's income may be subject to the alternative minimum tax. The fund may at times purchase tax-exempt securities at a discount. Some, or all, of this discount may be included in the fund's ordinary income, and is taxable when distributed.
30-day SEC yields
as of 03/31/11 (%)
| Class A | | | 2.26 | | |
| Class B | | | 1.71 | | |
| Class C | | | 1.57 | | |
| Class Z | | | 2.59 | | |
The 30-day SEC yields reflect the fund's earning power, net of expenses, expressed as an annualized percentage of the public offering price per share at the end of the period.
Taxable-equivalent SEC yields
as of 03/31/11 (%)
| Class A | | | 3.69 | | |
| Class B | | | 2.79 | | |
| Class C | | | 2.56 | | |
| Class Z | | | 4.22 | | |
Taxable-equivalent SEC yields are based on the combined maximum effective 35.0% federal income tax rate and applicable state income tax rate. This tax rate does not reflect the phase out of exemptions or the reduction of the otherwise allowable deductions that occur when adjusted gross income exceeds certain levels. Your taxable-equivalent yield may be different depending on your tax bracket.
For the 12-month period that ended March 31, 2011, the fund's Class A shares returned 2.40% without sales charge. The fund's benchmark, Barclays Capital 3-15 Year Blend Municipal Bond Index, returned 2.91%. The average return of funds in its peer group, the Lipper Other States Intermediate Municipal Debt Funds Classification, was 1.76%. The fund's focus on Virginia hampered results versus the Barclays index, which, because it is national in scope, includes bonds from a range of states. The Commonwealth's AAA credit rating1 resulted in lower bond yields than states with lower credit-quality ratings. An overweight in and strong security selection among bonds in the eight- to 12-year maturity range helped performance.
Favorable positioning and security selection
The fund was well positioned to take advantage of changing interest rates during the period. It had more exposure than the index to bonds with eight- to 12-year maturities, which were solid performers, and it had less exposure to bonds with 12- to 17-year maturities, which suffered from heavy selling in the fourth quarter of 2010. As the federally subsidized Build America Bonds (BABs) program was set to expire at the end of 2010, investors exited bonds in this maturity range. They feared that there would be an increase in the supply of newly issued longer-term bonds, which would drive yields higher and bond prices lower. BABs offered qualifying municipal issuers a less expensive way to finance infrastructure projects.
Security selection also was strong. Several issues that were pre-refunded during 2010 experienced strong price gains. Pre-refunding occurs when a bond issuer sells a new bond and invests the proceeds in U.S. Treasuries or other short-term government securities to pay off the old debt once it can be called (or redeemed). Additionally, some local general obligation (GO) bonds in the fund posted strong returns. GOs are bonds backed by the taxing power of the municipal issuer and help finance capital projects.
State GOs and other disappointments
The fund had less exposure to state GOs, which detracted from performance as the sector did well during the period. The Barclays index tends to have a higher weight in state GOs than the fund, because it can invest in bonds of any state while the fund focuses primarily on Virginia. In addition, Virginia GOs underperformed those from states whose bonds were of lower credit quality. An overweight in Virginia state-appropriated debt, whose credit rating is one notch below the state GOs, also detracted from performance. In addition, some Puerto Rico Electric Power revenue bonds with 12- and 13-year maturities experienced price declines amid growing concerns over Puerto Rico's credit quality. Finally, the fund lost some ground because it had a slightly higher-than-normal position in cash and other short-term equivalents.
Shifts in interest-rate sensitivity and sector allocations
Over the course of the year, we adjusted the fund's sensitivity to interest-rate changes as market conditions changed. We reduced interest rate exposure ahead of a fourth-quarter 2010 market sell-off, added more exposure late in the year to take advantage of market weakness and later brought interest-rate positioning back in line with that of the benchmark. These moves helped
1The credit quality ratings represent the lower of one of the following nationally recognized rating agencies: Standard & Poor's or Moody's Investor Services. If a security is rated by only one of the two agencies, that rating is used. If a security is not rated by either of the two agencies, it is designated as Non-Rated. Ratings are relative and subjective and are not absolute standards of quality. The credit quality of the fund's investments does not remove market risk.
6
Portfolio Manager's Report (continued) – Columbia Virginia Intermediate Municipal Bond Fund
performance. We also reduced exposure to local GOs, state-appropriated debt and very short-maturity pre-refunded bonds. In their place, we added to the health care, education and transportation sectors, helping to increase diversification and yield.
Improving outlook for Virginia
Although Virginia has had an average recovery so far, we think its economy will continue to grow. The Commonwealth benefits from being close to Washington, D.C. and federal government jobs, keeping unemployment under 7%—well below the national average. We also expect a strong job market and favorable climate to continue to drive positive migration trends. The state government is well run, which has meant fewer budget cuts than many other states. That said, some local municipalities continue to struggle with home foreclosures, which have hurt property tax revenues. Overall, as the economy improves, we expect municipal bond prices to benefit. However, we could see interest rates move higher as the recovery takes hold. As a result, we plan to make the portfolio less sensitive to interest rate changes.
Portfolio characteristics and holdings are subject to change periodically and may not be representative of current characteristics and holdings. The outlook for the fund may differ from that presented for other Columbia Funds.
Tax-exempt investing offers current tax-exempt income, but it also involves special risks. The value of the fund will be affected by interest rate changes and the creditworthiness of issues held in the fund. When interest rates go up, bond prices generally drop and vice versa.
Interest income from certain tax-exempt bonds may be subject to certain state and local taxes and, if applicable, the alternative minimum tax. Capital gains are not exempt from income taxes.
Single-state municipal bond funds pose additional risks due to limited geographical diversification.
Top 5 sectors
as of 03/31/11 (%)
| Tax-Backed | | | 43.4 | | |
| Other | | | 22.5 | | |
| Health Care | | | 9.9 | | |
| Utilities | | | 7.7 | | |
| Transportation | | | 6.9 | | |
Maturity breakdown
as of 03/31/11 (%)
| 0 - 1 year | | | 3.2 | | |
| 1 - 3 years | | | 4.9 | | |
| 3 - 5 years | | | 18.1 | | |
| 5 - 7 years | | | 11.9 | | |
| 7 - 10 years | | | 25.5 | | |
| 10 - 15 years | | | 28.4 | | |
| 15 - 20 years | | | 5.7 | | |
| Net Cash and Equivalents | | | 2.3 | | |
Quality breakdown
as of 03/31/11 (%)
| AAA | | | 25.7 | | |
| AA | | | 48.4 | | |
| A | | | 17.4 | | |
| BBB | | | 4.3 | | |
| Non-Rated | | | 4.2 | | |
Ratings shown in the quality breakdown are assigned to individual bonds by taking the lower of the ratings available from one of the following nationally recognized rating agencies: Standard & Poor's or Moody's Investor Services. If a security is rated by only one of the two agencies, that rating is used. If a security is not rated by either of the two agencies, it is designated as Non-Rated. Ratings are relative and subjective and are not absolute standards of quality. The credit quality of the fund's investments does not remove market risk.
The fund is actively managed and the composition of its portfolio will change over time. Information provided is calculated as a percentage of net assets.
7
Investment Portfolio – Columbia Virginia Intermediate Municipal Bond Fund
March 31, 2011
| Municipal Bonds – 97.2% | |
| | | Par ($) | | Value ($) | |
| Education – 4.4% | |
| Education – 4.4% | |
| VA Amherst Industrial Development Authority | |
Sweet Briar College,
Series 2006,
5.000% 09/01/26 | | | 1,000,000 | | | | 931,690 | | |
| VA College Building Authority | |
Liberty University, Inc.,
Series 2010:
5.000% 03/01/19 | | | 1,000,000 | | | | 1,116,750 | | |
| 5.000% 03/01/23 | | | 2,000,000 | | | | 2,147,760 | | |
Roanoke College,
Series 2007,
5.000% 04/01/23 | | | 1,000,000 | | | | 1,015,420 | | |
University of Richmond:
Series 2011 A,
5.000% 03/01/22 | | | 1,245,000 | | | | 1,400,525 | | |
Series 2011 B,
5.000% 03/01/21 | | | 2,250,000 | | | | 2,564,055 | | |
Washington & Lee University,
Series 1998,
Insured: NPFGC
5.250% 01/01/26 | | | 3,115,000 | | | | 3,468,958 | | |
| VA Lexington Industrial Development Authority | |
VMI Development Board, Inc.,
Series 2006,
5.000% 12/01/20 | | | 1,400,000 | | | | 1,571,150 | | |
| Education Total | | | 14,216,308 | | |
| Education Total | | | 14,216,308 | | |
| Health Care – 9.9% | |
| Continuing Care Retirement – 1.6% | |
| VA Fairfax County Economic Development Authority | |
Goodwin House, Inc.,
Series 2007,
5.000% 10/01/22 | | | 2,500,000 | | | | 2,440,225 | | |
Greenspring Village, Inc.,
Series 2006 A,
4.750% 10/01/26 | | | 2,000,000 | | | | 1,783,800 | | |
| VA Henrico County Economic Development Authority | |
Westminster-Canterbury,
Series 2006,
5.000% 10/01/21 | | | 1,000,000 | | | | 1,005,730 | | |
| Continuing Care Retirement Total | | | 5,229,755 | | |
| | | Par ($) | | Value ($) | |
| Hospitals – 8.3% | |
| AZ University Medical Center Corp. | |
Series 2004,
5.250% 07/01/14 | | | 1,000,000 | | | | 1,058,940 | | |
| VA Chesapeake Hospital Authority | |
Chesapeake General Hospital,
Series 2004 A,
5.250% 07/01/18 | | | 1,500,000 | | | | 1,572,510 | | |
| VA Fairfax County Industrial Development Authority | |
Inova Health Systems:
Series 1993:
5.250% 08/15/19 | | | 1,000,000 | | | | 1,099,490 | | |
Insured: NPFGC
5.250% 08/15/19 | | | 1,000,000 | | | | 1,089,880 | | |
Series 2009 C,
5.000% 05/15/25 | | | 1,000,000 | | | | 1,029,540 | | |
| VA Fredericksburg Economic Development Authority | |
Medicorp Health Systems,
Series 2007:
5.250% 06/15/18 | | | 2,000,000 | | | | 2,152,440 | | |
| 5.250% 06/15/20 | | | 6,495,000 | | | | 6,928,996 | | |
| VA Roanoke Economic Development Authority | |
Carilion Clinic Obligated Group,
Series 2010,
5.000% 07/01/25 | | | 3,500,000 | | | | 3,412,675 | | |
| VA Roanoke Industrial Development Authority | |
Carilion Medical Center,
Series 2002 A,
Insured: NPFGC
5.250% 07/01/12 | | | 4,000,000 | | | | 4,211,120 | | |
| VA Small Business Financing Authority | |
Sentara Healthcare,
Series 2010,
4.000% 11/01/16 | | | 1,000,000 | | | | 1,063,740 | | |
Wellmont Health Systems,
Series 2007 A,
5.125% 09/01/22 | | | 710,000 | | | | 676,616 | | |
| VA Winchester Industrial Development Authority | |
Valley Health Systems,
Series 2007,
5.000% 01/01/26 | | | 1,250,000 | | | | 1,264,850 | | |
| WI Health & Educational Facilities Authority | |
Agnesian Healthcare, Inc.,
Series 2001,
6.000% 07/01/21 | | | 1,000,000 | | | | 1,014,100 | | |
| Hospitals Total | | | 26,574,897 | | |
| Health Care Total | | | 31,804,652 | | |
See Accompanying Notes to Financial Statements.
8
Columbia Virginia Intermediate Municipal Bond Fund
March 31, 2011
| Municipal Bonds (continued) | |
| | | Par ($) | | Value ($) | |
| Housing – 2.1% | |
| Multi-Family – 2.1% | |
| VA Prince William County Industrial Development Authority | |
CRS Triangle Housing Corp.,
Series 1998 C,
7.000% 07/01/29 | | | 950,000 | | | | 789,887 | | |
| VA Suffolk Redevelopment & Housing Authority | |
Windsor Fieldstone LP,
Series 2001,
4.850% 07/01/31
(07/01/11) (a)(b) | | | 5,800,000 | | | | 5,854,752 | | |
| Multi-Family Total | | | 6,644,639 | | |
| Housing Total | | | 6,644,639 | | |
| Industrials – 0.3% | |
| Other Industrial Development Bonds – 0.3% | |
| VA Peninsula Ports Authority | |
Series 2003,
GTY AGMT: Dominion Energy Terminal
5.000% 10/01/33
(10/01/11) (a)(b) | | | 1,000,000 | | | | 1,014,680 | | |
| Other Industrial Development Bonds Total | | | 1,014,680 | | |
| Industrials Total | | | 1,014,680 | | |
| Other – 22.5% | |
| Other – 1.6% | |
| VA Norfolk Parking Systems | |
Series 2005 A,
Insured: NPFGC
5.000% 02/01/21 | | | 5,170,000 | | | | 5,180,908 | | |
| Other Total | | | 5,180,908 | | |
| Pool/Bond Bank – 15.1% | |
| VA Public School Authority | |
Series 2004 C,
5.000% 08/01/16 | | | 7,425,000 | | | | 8,515,139 | | |
Series 2009:
4.000% 08/01/24 | | | 1,000,000 | | | | 990,980 | | |
| 4.000% 08/01/25 | | | 2,560,000 | | | | 2,507,315 | | |
| VA Resources Authority | |
Airports Revolving Fund,
Series 2001 A,
5.250% 08/01/18 | | | 1,205,000 | | | | 1,209,362 | | |
| | | Par ($) | | Value ($) | |
Clean Water State Revolving Fund
Series 2005:
5.500% 10/01/19 | | | 5,180,000 | | | | 6,161,507 | | |
| 5.500% 10/01/20 | | | 3,500,000 | | | | 4,162,865 | | |
| 5.500% 10/01/21 | | | 6,475,000 | | | | 7,706,998 | | |
Series 2008,
5.000% 10/01/29 | | | 5,000,000 | | | | 5,238,700 | | |
Series 2009,
5.000% 10/01/17 | | | 1,380,000 | | | | 1,600,427 | | |
Virginia Pooled Financing Program
Series 2002 B,
5.000% 11/01/13 | | | 1,175,000 | | | | 1,296,436 | | |
Series 2003:
5.000% 11/01/18 | | | 1,055,000 | | | | 1,140,603 | | |
| 5.000% 11/01/19 | | | 1,100,000 | | | | 1,185,844 | | |
Series 2005 B,
5.000% 11/01/18 | | | 1,030,000 | | | | 1,133,103 | | |
Series 2009 B:
4.000% 11/01/18 | | | 4,000,000 | | | | 4,335,240 | | |
| 4.000% 11/01/18 | | | 1,000,000 | | | | 1,078,970 | | |
| Pool/Bond Bank Total | | | 48,263,489 | | |
| Refunded/Escrowed (c) – 5.8% | |
| VA Arlington County | |
Series 2006,
Pre-refunded 08/01/16,
5.000% 08/01/17 | | | 1,600,000 | | | | 1,869,872 | | |
| VA Biotechnology Research Park Authority | |
Series 2001,
Pre-refunded 09/01/11,
5.125% 09/01/16 | | | 1,100,000 | | | | 1,122,220 | | |
| VA Hampton | |
Series 2005 A,
Pre-refunded 04/01/15,
Insured: NPFGC
5.000% 04/01/18 | | | 1,500,000 | | | | 1,704,030 | | |
| VA Henrico County | |
Series 2008 A,
Pre-refunded 12/01/18,
5.000% 12/01/21 | | | 1,000,000 | | | | 1,179,740 | | |
| VA Resources Authority Infrastructure | |
Pooled Financing Program:
Series 2000 A,
Pre-refunded 05/01/11,
Insured: NPFGC
5.500% 05/01/21 | | | 1,070,000 | | | | 1,085,280 | | |
See Accompanying Notes to Financial Statements.
9
Columbia Virginia Intermediate Municipal Bond Fund
March 31, 2011
| Municipal Bonds (continued) | |
| | | Par ($) | | Value ($) | |
Series 2003,
Pre-refunded 11/01/13:
5.000% 11/01/18 | | | 20,000 | | | | 22,196 | | |
| 5.000% 11/01/19 | | | 25,000 | | | | 27,744 | | |
| VA Tobacco Settlement Financing Corp. | |
Series 2005:
Refunded to various dates/prices,
5.250% 06/01/19 | | | 2,010,000 | | | | 2,045,899 | | |
| 5.500% 06/01/26 | | | 4,250,000 | | | | 4,703,262 | | |
| VA Virginia Beach Development Authority | |
Series 2005 A,
Pre-refunded 05/01/15,
5.000% 05/01/21 | | | 4,000,000 | | | | 4,573,640 | | |
| Refunded/Escrowed Total | | | 18,333,883 | | |
| Other Total | | | 71,778,280 | | |
| Tax-Backed – 43.4% | |
| Local Appropriated – 11.2% | |
| VA Appomattox County Economic Development Authority | |
Series 2010,
5.000% 05/01/22 | | | 1,490,000 | | | | 1,593,942 | | |
| VA Arlington County Industrial Development Authority | |
Series 2004:
5.000% 08/01/17 | | | 1,205,000 | | | | 1,323,223 | | |
| 5.000% 08/01/18 | | | 1,205,000 | | | | 1,320,776 | | |
| VA Bedford County Economic Development Authority | |
Series 2006,
Insured: NPFGC
5.000% 05/01/15 | | | 1,230,000 | | | | 1,358,756 | | |
| VA Fairfax County Economic Development Authority | |
Series 2003,
5.000% 05/15/15 | | | 6,260,000 | | | | 7,020,277 | | |
Series 2005 A,
5.000% 04/01/19 | | | 1,380,000 | | | | 1,466,015 | | |
Series 2005,
5.000% 01/15/24 | | | 2,315,000 | | | | 2,399,544 | | |
Series 2010,
4.000% 04/01/24 | | | 1,340,000 | | | | 1,333,689 | | |
| VA Hampton Roads Regional Jail Authority | |
Series 2004,
Insured: NPFGC:
5.000% 07/01/14 | | | 1,750,000 | | | | 1,891,435 | | |
| 5.000% 07/01/15 | | | 1,685,000 | | | | 1,797,423 | | |
| 5.000% 07/01/16 | | | 1,930,000 | | | | 2,038,157 | | |
| | | Par ($) | | Value ($) | |
| VA Henrico County Economic Development Authority | |
Series 2009 B,
4.500% 08/01/21 | | | 1,770,000 | | | | 1,904,290 | | |
| VA James City County Economic Development Authority | |
Series 2006,
Insured: AGMC
5.000% 06/15/23 | | | 2,000,000 | | | | 2,089,700 | | |
| VA Montgomery County Industrial Development Authority | |
Series 2008,
5.000% 02/01/29 | | | 1,000,000 | | | | 1,009,150 | | |
| VA New Kent County Economic Development Authority | |
Series 2006,
Insured: AGMC:
5.000% 02/01/15 | | | 1,000,000 | | | | 1,112,530 | | |
| 5.000% 02/01/21 | | | 2,075,000 | | | | 2,200,953 | | |
| VA Prince William County Industrial Development Authority | |
Series 2005,
5.250% 02/01/17 | | | 1,115,000 | | | | 1,276,530 | | |
Series 2006 A,
Insured: AMBAC:
5.000% 09/01/17 | | | 800,000 | | | | 883,888 | | |
| 5.000% 09/01/21 | | | 1,625,000 | | | | 1,708,233 | | |
| Local Appropriated Total | | | 35,728,511 | | |
| Local General Obligations – 17.0% | |
| VA Arlington County | |
Series 1993,
6.000% 06/01/12 | | | 3,285,000 | | | | 3,498,098 | | |
Series 2006,
5.000% 08/01/17 | | | 2,400,000 | | | | 2,733,504 | | |
| VA Fairfax County | |
Series 2011 A,
4.000% 04/01/24 | | | 2,000,000 | | | | 2,015,280 | | |
| VA Hampton | |
Series 2004,
5.000% 02/01/15 | | | 1,275,000 | | | | 1,396,189 | | |
Series 2010 A,
4.000% 01/15/19 | | | 2,000,000 | | | | 2,162,920 | | |
| VA Leesburg | |
Series 2006 B,
Insured: NPFGC
5.000% 09/15/17 | | | 1,145,000 | | | | 1,315,765 | | |
| VA Loudoun County | |
Series 1998 B,
5.250% 12/01/15 | | | 1,000,000 | | | | 1,164,750 | | |
See Accompanying Notes to Financial Statements.
10
Columbia Virginia Intermediate Municipal Bond Fund
March 31, 2011
| Municipal Bonds (continued) | |
| | | Par ($) | | Value ($) | |
Series 2005 A,
5.000% 07/01/14 | | | 4,000,000 | | | | 4,504,840 | | |
| VA Lynchburg | |
Series 2009 A:
5.000% 08/01/20 | | | 525,000 | | | | 591,496 | | |
| 5.000% 08/01/21 | | | 530,000 | | | | 589,763 | | |
| VA Manassas Park | |
Series 2008,
Insured: AGMC
5.000% 01/01/22 | | | 1,205,000 | | | | 1,296,255 | | |
| VA Newport News | |
Series 2005 A,
5.250% 01/15/23 | | | 1,510,000 | | | | 1,600,751 | | |
Series 2006 B,
5.250% 02/01/18 | | | 3,030,000 | | | | 3,521,799 | | |
Series 2007 B,
5.250% 07/01/20 | | | 2,000,000 | | | | 2,329,420 | | |
| VA Norfolk | |
Series 2005,
Insured: NPFGC
5.000% 03/01/15 | | | 5,070,000 | | | | 5,733,612 | | |
| VA Pittsylvania County | |
Series 2008 B,
5.500% 02/01/23 | | | 1,030,000 | | | | 1,134,123 | | |
| VA Portsmouth | |
Series 2003,
Insured: AGMC:
5.000% 07/01/17 | | | 4,385,000 | | | | 4,850,819 | | |
| 5.000% 07/01/19 | | | 2,060,000 | | | | 2,255,082 | | |
Series 2006 A,
Insured: NPFGC
5.000% 07/01/16 | | | 1,000,000 | | | | 1,148,240 | | |
| VA Richmond | |
Series 2005 A,
Insured: AGMC
5.000% 07/15/15 | | | 5,340,000 | | | | 6,090,003 | | |
Series 2010 D:
5.000% 07/15/22 | | | 575,000 | | | | 641,079 | | |
| 5.000% 07/15/24 | | | 1,000,000 | | | | 1,088,550 | | |
| VA Virginia Beach | |
Series 2004 B:
5.000% 05/01/13 | | | 1,305,000 | | | | 1,421,328 | | |
| 5.000% 05/01/17 | | | 1,000,000 | | | | 1,151,370 | | |
| Local General Obligations Total | | | 54,235,036 | | |
| | | Par ($) | | Value ($) | |
| Special Non-Property Tax – 7.9% | |
| PR Commonwealth of Puerto Rico Infrastructure Financing Authority | |
Series 2005 C,
Insured: FGIC
5.500% 07/01/19 | | | 2,500,000 | | | | 2,581,750 | | |
| VA Greater Richmond Convention Center Authority | |
Series 2005,
Insured: NPFGC:
5.000% 06/15/15 | | | 2,480,000 | | | | 2,692,065 | | |
| 5.000% 06/15/18 | | | 3,800,000 | | | | 3,989,658 | | |
| 5.000% 06/15/25 | | | 3,000,000 | | | | 3,014,460 | | |
| VA Marquis Community Development Authority | |
Series 2007,
5.625% 09/01/18 | | | 3,000,000 | | | | 2,367,750 | | |
| VA Peninsula Town Center Community Development Authority | |
Series 2007,
6.250% 09/01/24 | | | 1,989,000 | | | | 1,865,344 | | |
| VA Reynolds Crossing Community Development Authority | |
Series 2007,
5.100% 03/01/21 | | | 2,135,000 | | | | 1,939,840 | | |
| VA Watkins Centre Community Development Authority | |
Series 2007,
5.400% 03/01/20 | | | 2,188,000 | | | | 2,050,834 | | |
| VA White Oak Village Shops Community Development Authority | |
Series 2007,
5.300% 03/01/17 | | | 2,374,000 | | | | 2,365,548 | | |
| VI Virgin Islands Public Finance Authority | |
Series 2010 A,
5.000% 10/01/25 | | | 2,450,000 | | | | 2,344,013 | | |
| Special Non-Property Tax Total | | | 25,211,262 | | |
| Special Property Tax – 0.9% | |
| VA Fairfax County Economic Development Authority | |
Series 2004,
Insured: NPFGC
5.000% 04/01/24 | | | 2,865,000 | | | | 2,953,672 | | |
| Special Property Tax Total | | | 2,953,672 | | |
| State Appropriated – 5.4% | |
| VA Biotechnology Research Partnership Authority | |
Series 2009,
5.000% 09/01/20 | | | 1,715,000 | | | | 1,911,950 | | |
See Accompanying Notes to Financial Statements.
11
Columbia Virginia Intermediate Municipal Bond Fund
March 31, 2011
| Municipal Bonds (continued) | |
| | | Par ($) | | Value ($) | |
| VA College Building Authority | |
Series 2006 A:
5.000% 09/01/13 | | | 2,000,000 | | | | 2,198,060 | | |
| 5.000% 09/01/14 | | | 2,925,000 | | | | 3,294,808 | | |
| VA Public Building Authority | |
Series 2005 C,
5.000% 08/01/14 | | | 2,000,000 | | | | 2,248,620 | | |
Series 2006 A,
5.000% 08/01/15 | | | 4,775,000 | | | | 5,439,298 | | |
Series 2006 B,
4.500% 08/01/26 | | | 2,000,000 | | | | 2,014,980 | | |
| State Appropriated Total | | | 17,107,716 | | |
| State General Obligations – 1.0% | |
| PR Commonwealth of Puerto Rico Public Buildings Authority | |
Series 2007,
5.500% 07/01/24 | | | 3,425,000 | | | | 3,353,794 | | |
| State General Obligations Total | | | 3,353,794 | | |
| Tax-Backed Total | | | 138,589,991 | | |
| Transportation – 6.9% | |
| Airports – 3.6% | |
| DC District of Columbia Metropolitan Airports Authority | |
Series 2009 B,
5.000% 10/01/21 | | | 3,000,000 | | | | 3,212,160 | | |
Series 2009 C,
5.000% 10/01/23 | | | 3,000,000 | | | | 3,130,080 | | |
Series 2010 A,
5.000% 10/01/23 | | | 2,475,000 | | | | 2,605,606 | | |
Series 2010 C,
5.000% 10/01/27 | | | 1,515,000 | | | | 1,542,527 | | |
Series 2010 F1,
5.000% 10/01/21 | | | 1,000,000 | | | | 1,085,950 | | |
| Airports Total | | | 11,576,323 | | |
| Ports – 0.9% | |
| VA Port Authority | |
Series 2003, AMT,
Insured: NPFGC:
5.125% 07/01/14 | | | 1,360,000 | | | | 1,455,717 | | |
| 5.125% 07/01/15 | | | 1,430,000 | | | | 1,517,316 | | |
| Ports Total | | | 2,973,033 | | |
| Toll Facilities – 2.4% | |
| DC District of Columbia Metropolitan Airports Authority | |
Series 2009,
Insured: AGC
(d) 10/01/23 | | | 5,000,000 | | | | 2,418,650 | | |
| | | Par ($) | | Value ($) | |
| VA Chesapeake Bay Bridge & Tunnel District | |
Series 1998,
Insured: NPFGC
5.500% 07/01/25 | | | 4,000,000 | | | | 4,003,560 | | |
| VA Richmond Metropolitan Authority | |
Series 1998,
Insured: NPFGC
5.250% 07/15/17 | | | 1,000,000 | | | | 1,101,370 | | |
| Toll Facilities Total | | | 7,523,580 | | |
| Transportation Total | | | 22,072,936 | | |
| Utilities – 7.7% | |
| Investor Owned – 1.4% | |
| VA Chesterfield County Economic Development Authority | |
Virginia Electric & Power Co.,
Series 2009 A,
5.000% 05/01/23 | | | 2,000,000 | | | | 2,078,060 | | |
| VA Louisa Industrial Development Authority | |
Virginia Electric & Power Co.,
Series 2008,
5.375% 11/01/35
(12/02/13) (a)(b) | | | 1,000,000 | | | | 1,077,440 | | |
| VA York County Economic Development Authority | |
Virginia Electric & Power Co.,
Series 2009 A,
4.050% 05/01/33
(05/01/14) (a)(b) | | | 1,300,000 | | | | 1,358,903 | | |
| Investor Owned Total | | | 4,514,403 | | |
| Municipal Electric – 1.3% | |
| PR Commonwealth of Puerto Rico Electric Power Authority | |
Series 2002 JJ,
Insured: SYNC
5.375% 07/01/16 | | | 1,100,000 | | | | 1,187,120 | | |
Series 2007 V,
Insured: NPFGC
5.250% 07/01/24 | | | 1,000,000 | | | | 978,440 | | |
Series 2010,
5.250% 07/01/23 | | | 2,000,000 | | | | 1,990,900 | | |
| Municipal Electric Total | | | 4,156,460 | | |
| Water & Sewer – 5.0% | |
| VA Fairfax County Water Authority | |
Series 2005 B,
5.250% 04/01/19 | | | 1,835,000 | | | | 2,145,629 | | |
See Accompanying Notes to Financial Statements.
12
Columbia Virginia Intermediate Municipal Bond Fund
March 31, 2011
| Municipal Bonds (continued) | |
| | | Par ($) | | Value ($) | |
| VA Hampton Roads Sanitation District | |
Series 2007,
5.000% 04/01/22 | | | 1,000,000 | | | | 1,087,750 | | |
Series 2008,
5.000% 04/01/24 | | | 3,000,000 | | | | 3,201,030 | | |
| VA Newport News Water Authority | |
Series 2007,
Insured: AGMC
5.000% 06/01/19 | | | 1,035,000 | | | | 1,131,017 | | |
| VA Richmond Public Utility Authority | |
Series 2007,
Insured: AGMC
4.500% 01/15/21 | | | 1,000,000 | | | | 1,053,390 | | |
| VA Spotsylvania County | |
Series 2007,
Insured: AGMC
5.000% 06/01/19 | | | 1,030,000 | | | | 1,144,598 | | |
| VA Upper Occoquan Sewage Authority | |
Series 1995 A,
Insured: NPFGC
5.150% 07/01/20 | | | 1,295,000 | | | | 1,477,569 | | |
Series 2003,
Insured: AGMC
5.000% 07/01/13 | | | 1,640,000 | | | | 1,795,587 | | |
Series 2005,
Insured: AGMC
5.000% 07/01/21 | | | 2,640,000 | | | | 2,815,401 | | |
| Water & Sewer Total | | | 15,851,971 | | |
| Utilities Total | | | 24,522,834 | | |
Total Municipal Bonds
(cost of $302,339,751) | | | 310,644,320 | | |
| Investment Companies – 1.7% | |
| | | Shares | | | |
BofA Tax-Exempt Reserves,
Capital Class
(7 day yield of 0.110%) (e) | | | 3,290,970 | | | | 3,290,970 | | |
Dreyfus Tax-Exempt Cash
Management Fund
(7 day yield of 0.080%) | | | 2,120,416 | | | | 2,120,416 | | |
Total Investment Companies
(cost of $5,411,386) | | | 5,411,386 | | |
Total Investments – 98.9%
(cost of $307,751,137) (f) | | | 316,055,706 | | |
| Other Assets & Liabilities, Net – 1.1% | | | 3,581,641 | | |
| Net Assets – 100.0% | | | 319,637,347 | | |
Notes to Investment Portfolio:
(a) The interest rate shown on floating rate or variable rate securities reflects the rate at March 31, 2011.
(b) Parenthetical date represents the next interest rate reset date for the security.
(c) The Fund has been informed that each issuer has placed direct obligations of the U.S. Government in an irrevocable trust, solely for the payment of principal and interest.
(d) Zero coupon bond.
(e) Investments in affiliates during the year ended March 31, 2011:
| Affiliate | | Value,
beginning of
period | | Purchases | | Sales
Proceeds | | Dividend
Income | | Value,
end of
period | |
BofA
Tax-Exempt
Reserves,
Capital
Class
(7 day yield
of 0.110%) | | $ | 1,987,000 | | | $ | 5,021,271 | | | $ | 3,613,000 | | | $ | 241 | | | $ | — | | |
As of May 1, 2010, this company was no longer an affiliate of the Fund. The above table reflects activity for the period from April 1, 2010 through April 30, 2010.
(f) Cost for federal income tax purposes is $307,751,137.
Generally accepted accounting principles (GAAP) require disclosure regarding the inputs and valuation techniques used to measure fair value and any changes in valuation inputs or techniques. In addition, investments shall be disclosed by major category. The Fund categorizes its fair value measurements according to a three-level hierarchy that maximizes the use of observable inputs and minimizes the use of unobservable inputs by prioritizing that the most observable input be used when available. Observable inputs are those that market participants would use in pricing an investment based on market data obtained from sources independent of the reporting entity. Unobservable inputs are those that reflect the Fund's assumptions about the information market participants would use in pricing an investment. An investment's level within the fair value hierarchy is based on the lowest level of any input that is deemed significant to the asset or liability's fair value measurement. The input levels are not necessarily an indication of the risk or liquidity associated with investments at that level. For example, certain U.S. government securities are generally high quality and liquid, however, they are reflected as Level 2 because the inputs used to determine fair value may not always be quoted prices in an active market.
Fair value inputs are summarized in the three broad levels listed below:
• Level 1—Valuations based on quoted prices for investments in active markets that the Fund has the ability to access at the measurement date (including NAV for open-end mutual funds). Valuation adjustments are not applied to Level 1 investments.
• Level 2—Valuations based on other significant observable inputs (including quoted prices for similar securities, interest rates, prepayment speeds, credit risks, etc.).
• Level 3—Valuations based on significant unobservable inputs (including the Fund's own assumptions and judgment in determining the fair value of investments).
Inputs that are used in determining fair value of an investment may include price information, credit data, volatility statistics, and other factors. These inputs can be either observable or unobservable. The availability of observable inputs can vary between investments, and is affected by various factors such as the type of investment, and the volume and level of activity for that investment or similar investments in the marketplace. The inputs will be considered by the Investment Manager, along with any other relevant factors in the calculation of an investment's fair value. The Fund uses prices and inputs that are current as of the measurement date, which may include periods of market dislocations. During these periods, the availability of prices and inputs may be reduced for many investments. This condition could cause an investment to be reclassified between the various levels within the hierarchy.
Investments falling into the Level 3 category are primarily supported by quoted prices from brokers and dealers participating in the market for those
See Accompanying Notes to Financial Statements.
13
Columbia Virginia Intermediate Municipal Bond Fund
March 31, 2011
investments. However, these may be classified as Level 3 investments due to lack of market transparency and corroboration to support these quoted prices. Additionally, valuation models may be used as the pricing source for any remaining investments classified as Level 3. These models rely on one or more significant unobservable inputs and/or significant assumptions by the Investment Manager. Inputs used in valuations may include, but are not limited to, financial statement analysis, capital account balances, discount rates and estimated cash flows, and comparable company data.
The following table is a summary of the inputs used to value the Fund's investments as of March 31, 2011:
| Description | | Quoted
Prices
(Level 1) | | Other
Significant
Observable
Inputs
(Level 2) | | Significant
Unobservable
Inputs
(Level 3) | | Total | |
| Total Municipal Bonds | | $ | — | | | $ | 310,644,320 | | | $ | — | | | $ | 310,644,320 | | |
Total Investment
Companies | | | 5,411,386 | | | | — | | | | — | | | | 5,411,386 | | |
| Total Investments | | $ | 5,411,386 | | | $ | 310,644,320 | | | $ | — | | | $ | 316,055,706 | | |
The Fund's assets assigned to the Level 2 input category are generally valued using the market approach, in which a security's value is determined through its correlation to prices and information from market transactions for similar or identical assets.
There were no significant transfers of financial assets between Levels 1 and 2 during the period.
At March 31, 2011, the composition of the Fund by revenue source is as follows:
| Holdings By Revenue Source (Unaudited) | | % of
Net Assets | |
| Tax-Backed | | | 43.4 | | |
| Other | | | 22.5 | | |
| Health Care | | | 9.9 | | |
| Utilities | | | 7.7 | | |
| Transportation | | | 6.9 | | |
| Education | | | 4.4 | | |
| Housing | | | 2.1 | | |
| Industrials | | | 0.3 | | |
| | | | 97.2 | | |
| Investment Companies | | | 1.7 | | |
| Other Assets & Liabilities, Net | | | 1.1 | | |
| | | | 100.0 | | |
| Acronym | | Name | |
| AGC | | Assured Guaranty Corp. | |
|
| AGMC | | Assured Guaranty Municipal Corp. | |
|
| AMBAC | | Ambac Assurance Corp. | |
|
| AMT | | Alternative Minimum Tax | |
|
| FGIC | | Financial Guaranty Insurance Co. | |
|
| GTY AGMT | | Guaranty Agreement | |
|
| NPFGC | | National Public Finance Guarantee Corp. | |
|
| SYNC | | Syncora Guarantee, Inc. | |
|
See Accompanying Notes to Financial Statements.
14
Statement of Assets and Liabilities – Columbia Virginia Intermediate Municipal Bond Fund
March 31, 2011
| | | | | ($) | |
| Assets | | Investments, at cost | | | 307,751,137 | | |
| | | Investments, at value | | | 316,055,706 | | |
| | | Cash | | | 721 | | |
| | | Receivable for: | | | | | |
| | | Investments sold | | | 3,156,086 | | |
| | | Fund shares sold | | | 319,642 | | |
| | | Interest | | | 4,153,391 | | |
| | | Expense reimbursement due from Investment Manager | | | 130,113 | | |
| | | Prepaid expenses | | | 499 | | |
| | | Total Assets | | | 323,816,158 | | |
| Liabilities | | Payable for: | | | |
| | | Investments purchased | | | 2,630,777 | | |
| | | Fund shares repurchased | | | 329,532 | | |
| | | Distributions | | | 825,498 | | |
| | | Investment advisory fee | | | 109,113 | | |
| | | Administration fee | | | 33,660 | | |
| | | Pricing and bookkeeping fees | | | 10,631 | | |
| | | Transfer agent fee | | | 81,303 | | |
| | | Trustees' fees | | | 77,909 | | |
| | | Custody fee | | | 2,416 | | |
| | | Distribution and service fees | | | 14,215 | | |
| | | Chief compliance officer expenses | | | 285 | | |
| | | Other liabilities | | | 63,472 | | |
| | | Total Liabilities | | | 4,178,811 | | |
| | | Net Assets | | | 319,637,347 | | |
| Net Assets Consist of | | Paid-in capital | | | 310,692,920 | | |
| | | Undistributed net investment income | | | 855,801 | | |
| | | Accumulated net realized loss | | | (215,943 | ) | |
| | | Net unrealized appreciation (depreciation) on investments | | | 8,304,569 | | |
| | | Net Assets | | | 319,637,347 | | |
See Accompanying Notes to Financial Statements.
15
Statement of Assets and Liabilities (continued) – Columbia Virginia Intermediate Municipal Bond Fund
March 31, 2011
| Class A | | Net assets | | $ | 51,195,874 | | |
| | | Shares outstanding | | | 4,716,134 | | |
| | | Net asset value per share | | $ | 10.86 | (a) | |
| | | Maximum sales charge | | | 3.25 | % | |
| | | Maximum offering price per share ($10.86/0.9675) | | $ | 11.22 | (b) | |
| Class B | | Net assets | | $ | 391,973 | | |
| | | Shares outstanding | | | 36,099 | | |
| | | Net asset value and offering price per share | | $ | 10.86 | (a) | |
| Class C | | Net assets | | $ | 3,544,448 | | |
| | | Shares outstanding | | | 326,392 | | |
| | | Net asset value and offering price per share | | $ | 10.86 | (a) | |
| Class Z | | Net assets | | $ | 264,505,052 | | |
| | | Shares outstanding | | | 24,368,657 | | |
| | | Net asset value, offering and redemption price per share | | $ | 10.85 | | |
(a) Redemption price per share is equal to net asset value less any applicable contingent deferred sales charge.
(b) On sales of $100,000 or more the offering price is reduced.
See Accompanying Notes to Financial Statements.
16
Statement of Operations – Columbia Virginia Intermediate Municipal Bond Fund
For the Year Ended March 31, 2011
| | | | | ($) | |
| Investment Income | | Interest | | | 12,924,440 | | |
| | | Dividends | | | 7,692 | | |
| | | Dividends from affiliates | | | 241 | | |
| | | Total Investment Income | | | 12,932,373 | | |
| Expenses | | Investment advisory fee | | | 1,323,154 | | |
| | | Administration fee | | | 408,562 | | |
| | | Distribution fee: | | | | | |
| | | Class B | | | 7,621 | | |
| | | Class C | | | 25,359 | | |
| | | Service fee: | | | | | |
| | | Class B | | | 2,540 | | |
| | | Class C | | | 8,453 | | |
| | | Distribution and service fees: | | | | | |
| | | Class A | | | 129,294 | | |
| | | Transfer agent fee | | | 205,776 | | |
| | | Pricing and bookkeeping fees | | | 107,911 | | |
| | | Trustees' fees | | | 34,145 | | |
| | | Custody fee | | | 15,816 | | |
| | | Chief compliance officer expenses | | | 1,320 | | |
| | | Other expenses | | | 123,238 | | |
| | | Total Expenses | | | 2,393,189 | | |
| | | Fees waived or expenses reimbursed by Investment Manager | | | (400,194 | ) | |
| | | Expense reductions | | | (6 | ) | |
| | | Net Expenses | | | 1,992,989 | | |
| | | Net Investment Income | | | 10,939,384 | | |
| Net Realized and Unrealized Gain (Loss) on Investments | | Net realized gain on investments | | | 944,804 | | |
| | | Net change in unrealized appreciation (depreciation) on investments | | | (3,524,802 | ) | |
| | | Net Loss | | | (2,579,998 | ) | |
| | | Net Increase Resulting from Operations | | | 8,359,386 | | |
See Accompanying Notes to Financial Statements.
17
Statement of Changes in Net Assets – Columbia Virginia Intermediate Municipal Bond Fund
| | | | | Year Ended March 31, | |
| Increase (Decrease) in Net Assets | | | | 2011 ($) | | 2010 ($) | |
| Operations | | Net investment income | | | 10,939,384 | | | | 11,223,036 | | |
| | | Net realized gain (loss) on investments | | | 944,804 | | | | (712,903 | ) | |
| | | Net change in unrealized appreciation (depreciation)
on investments | | | (3,524,802 | ) | | | 12,093,012 | | |
| | | Net increase resulting from operations | | | 8,359,386 | | | | 22,603,145 | | |
| Distributions to Shareholders | | From net investment income: | | | | | |
| | | Class A | | | (1,609,269 | ) | | | (1,611,250 | ) | |
| | | Class B | | | (23,816 | ) | | | (46,449 | ) | |
| | | Class C | | | (79,442 | ) | | | (51,913 | ) | |
| | | Class Z | | | (9,226,858 | ) | | | (9,513,424 | ) | |
| | | Total distributions to shareholders | | | (10,939,385 | ) | | | (11,223,036 | ) | |
| | | Net Capital Stock Transactions | | | (12,192,563 | ) | | | 3,365,566 | | |
| | | Total increase (decrease) in net assets | | | (14,772,562 | ) | | | 14,745,675 | | |
| Net Assets | | Beginning of period | | | 334,409,909 | | | | 319,664,234 | | |
| | | End of period | | | 319,637,347 | | | | 334,409,909 | | |
| | | Undistributed net investment income at end of period | | | 855,801 | | | | 859,995 | | |
See Accompanying Notes to Financial Statements.
18
Statement of Changes in Net Assets (continued) – Columbia Virginia Intermediate Municipal Bond Fund
| | | Capital Stock Activity | |
| | | Year Ended
March 31, 2011 | | Year Ended
March 31, 2010 | |
| | | Shares | | Dollars ($) | | Shares | | Dollars ($) | |
| Class A | |
| Subscriptions | | | 636,302 | | | | 6,986,838 | | | | 672,637 | | | | 7,332,775 | | |
| Distributions reinvested | | | 67,509 | | | | 749,647 | | | | 100,572 | | | | 1,097,331 | | |
| Redemptions | | | (725,931 | ) | | | (8,021,397 | ) | | | (573,018 | ) | | | (6,279,940 | ) | |
| Net increase (decrease) | | | (22,120 | ) | | | (284,912 | ) | | | 200,191 | | | | 2,150,166 | | |
| Class B | |
| Subscriptions | | | 2,104 | | | | 23,309 | | | | 6,934 | | | | 75,488 | | |
| Distributions reinvested | | | 876 | | | | 9,748 | | | | 2,355 | | | | 25,657 | | |
| Redemptions | | | (110,751 | ) | | | (1,220,503 | ) | | | (75,392 | ) | | | (821,354 | ) | |
| Net decrease | | | (107,771 | ) | | | (1,187,446 | ) | | | (66,103 | ) | | | (720,209 | ) | |
| Class C | |
| Subscriptions | | | 211,559 | | | | 2,351,630 | | | | 80,863 | | | | 885,276 | | |
| Distributions reinvested | | | 4,380 | | | | 48,552 | | | | 3,508 | | | | 38,255 | | |
| Redemptions | | | (117,843 | ) | | | (1,282,673 | ) | | | (35,678 | ) | | | (387,391 | ) | |
| Net increase | | | 98,096 | | | | 1,117,509 | | | | 48,693 | | | | 536,140 | | |
| Class Z | |
| Subscriptions | | | 3,242,791 | | | | 35,857,898 | | | | 4,784,155 | | | | 52,070,723 | | |
| Distributions reinvested | | | 36,806 | | | | 407,886 | | | | 25,325 | | | | 276,557 | | |
| Redemptions | | | (4,358,459 | ) | | | (48,103,498 | ) | | | (4,677,774 | ) | | | (50,947,811 | ) | |
| Net increase (decrease) | | | (1,078,862 | ) | | | (11,837,714 | ) | | | 131,706 | | | | 1,399,469 | | |
See Accompanying Notes to Financial Statements.
19
Financial Highlights – Columbia Virginia Intermediate Municipal Bond Fund
Selected data for a share outstanding throughout each period is as follows:
| | | Year Ended March 31, | |
| Class A Shares | | 2011 | | 2010 | | 2009 | | 2008 | | 2007 | |
| Net Asset Value, Beginning of Period | | $ | 10.94 | | | $ | 10.57 | | | $ | 10.65 | | | $ | 10.73 | | | $ | 10.67 | �� | |
| Income from Investment Operations: | |
| Net investment income (a) | | | 0.34 | | | | 0.35 | | | | 0.37 | | | | 0.38 | | | | 0.38 | | |
Net realized and unrealized gain (loss) on investments
and futures contracts | | | (0.08 | ) | | | 0.37 | | | | (0.08 | ) | | | (0.08 | ) | | | 0.11 | | |
| Total from investment operations | | | 0.26 | | | | 0.72 | | | | 0.29 | | | | 0.30 | | | | 0.49 | | |
| Less Distributions to Shareholders: | |
| From net investment income | | | (0.34 | ) | | | (0.35 | ) | | | (0.37 | ) | | | (0.38 | ) | | | (0.38 | ) | |
| From net realized gains | | | — | | | | — | | | | — | | | | — | (b) | | | (0.05 | ) | |
| Total distributions to shareholders | | | (0.34 | ) | | | (0.35 | ) | | | (0.37 | ) | | | (0.38 | ) | | | (0.43 | ) | |
| Net Asset Value, End of Period | | $ | 10.86 | | | $ | 10.94 | | | $ | 10.57 | | | $ | 10.65 | | | $ | 10.73 | | |
| Total return (c)(d) | | | 2.40 | % | | | 6.83 | % | | | 2.83 | % | | | 2.85 | % | | | 4.64 | % | |
| Ratios to Average Net Assets/Supplemental Data: | |
| Net expenses before interest expense (e) | | | 0.80 | % | | | 0.78 | % | | | 0.75 | % | | | 0.75 | % | | | 0.75 | % | |
| Interest expense | | | — | | | | — | | | | — | | | | — | | | | — | %(f) | |
| Net expenses (e) | | | 0.80 | % | | | 0.78 | % | | | 0.75 | % | | | 0.75 | % | | | 0.75 | % | |
| Waiver/Reimbursement | | | 0.12 | % | | | 0.09 | % | | | 0.11 | % | | | 0.12 | % | | | 0.13 | % | |
| Net investment income (e) | | | 3.11 | % | | | 3.17 | % | | | 3.54 | % | | | 3.51 | % | | | 3.55 | % | |
| Portfolio turnover rate | | | 14 | % | | | 12 | % | | | 12 | % | | | 12 | % | | | 22 | % | |
| Net assets, end of period (000s) | | $ | 51,196 | | | $ | 51,857 | | | $ | 47,970 | | | $ | 48,158 | | | $ | 48,924 | | |
(a) Per share data was calculated using the average shares outstanding during the period.
(b) Rounds to less than $0.01 per share.
(c) Total return at net asset value assuming all distributions reinvested and no initial sales charge or contingent deferred sales charge.
(d) Had the Investment Manager and/or any of its affiliates not waived fees or reimbursed a portion of expenses, total return would have been reduced.
(e) The benefits derived from expense reductions had an impact of less than 0.01%.
(f) Rounds to less than 0.01%.
See Accompanying Notes to Financial Statements.
20
Financial Highlights – Columbia Virginia Intermediate Municipal Bond Fund
Selected data for a share outstanding throughout each period is as follows:
| | | Year Ended March 31, | |
| Class B Shares | | 2011 | | 2010 | | 2009 | | 2008 | | 2007 | |
| Net Asset Value, Beginning of Period | | $ | 10.95 | | | $ | 10.57 | | | $ | 10.65 | | | $ | 10.73 | | | $ | 10.67 | | |
| Income from Investment Operations: | |
| Net investment income (a) | | | 0.26 | | | | 0.27 | | | | 0.29 | | | | 0.30 | | | | 0.30 | | |
Net realized and unrealized gain (loss) on investments
and futures contracts | | | (0.09 | ) | | | 0.37 | | | | (0.08 | ) | | | (0.08 | ) | | | 0.11 | | |
| Total from investment operations | | | 0.17 | | | | 0.64 | | | | 0.21 | | | | 0.22 | | | | 0.41 | | |
| Less Distributions to Shareholders: | |
| From net investment income | | | (0.26 | ) | | | (0.26 | ) | | | (0.29 | ) | | | (0.30 | ) | | | (0.30 | ) | |
| From net realized gains | | | — | | | | — | | | | — | | | | — | (b) | | | (0.05 | ) | |
| Total distributions to shareholders | | | (0.26 | ) | | | (0.26 | ) | | | (0.29 | ) | | | (0.30 | ) | | | (0.35 | ) | |
| Net Asset Value, End of Period | | $ | 10.86 | | | $ | 10.95 | | | $ | 10.57 | | | $ | 10.65 | | | $ | 10.73 | | |
| Total return (c)(d) | | | 1.55 | % | | | 6.14 | % | | | 2.07 | % | | | 2.08 | % | | | 3.86 | % | |
| Ratios to Average Net Assets/Supplemental Data: | |
| Net expenses before interest expense (e) | | | 1.55 | % | | | 1.53 | % | | | 1.50 | % | | | 1.50 | % | | | 1.50 | % | |
| Interest expense | | | — | | | | — | | | | — | | | | — | | | | — | %(f) | |
| Net expenses (e) | | | 1.55 | % | | | 1.53 | % | | | 1.50 | % | | | 1.50 | % | | | 1.50 | % | |
| Waiver/Reimbursement | | | 0.12 | % | | | 0.09 | % | | | 0.11 | % | | | 0.12 | % | | | 0.13 | % | |
| Net investment income (e) | | | 2.34 | % | | | 2.44 | % | | | 2.80 | % | | | 2.77 | % | | | 2.80 | % | |
| Portfolio turnover rate | | | 14 | % | | | 12 | % | | | 12 | % | | | 12 | % | | | 22 | % | |
| Net assets, end of period (000s) | | $ | 392 | | | $ | 1,575 | | | $ | 2,220 | | | $ | 2,434 | | | $ | 3,119 | | |
(a) Per share data was calculated using the average shares outstanding during the period.
(b) Rounds to less than $0.01 per share.
(c) Total return at net asset value assuming all distributions reinvested and no contingent deferred sales charge.
(d) Had the Investment Manager and/or any of its affiliates not waived fees or reimbursed a portion of expenses, total return would have been reduced.
(e) The benefits derived from expense reductions had an impact of less than 0.01%.
(f) Rounds to less than 0.01%.
See Accompanying Notes to Financial Statements.
21
Financial Highlights – Columbia Virginia Intermediate Municipal Bond Fund
Selected data for a share outstanding throughout each period is as follows:
| | | Year Ended March 31, | |
| Class C Shares | | 2011 | | 2010 | | 2009 | | 2008 | | 2007 | |
| Net Asset Value, Beginning of Period | | $ | 10.95 | | | $ | 10.57 | | | $ | 10.65 | | | $ | 10.73 | | | $ | 10.67 | | |
| Income from Investment Operations: | |
| Net investment income (a) | | | 0.26 | | | | 0.26 | | | | 0.29 | | | | 0.30 | | | | 0.30 | | |
Net realized and unrealized gain (loss) on investments
and futures contracts | | | (0.09 | ) | | | 0.38 | | | | (0.08 | ) | | | (0.08 | ) | | | 0.11 | | |
| Total from investment operations | | | 0.17 | | | | 0.64 | | | | 0.21 | | | | 0.22 | | | | 0.41 | | |
| Less Distributions to Shareholders: | |
| From net investment income | | | (0.26 | ) | | | (0.26 | ) | | | (0.29 | ) | | | (0.30 | ) | | | (0.30 | ) | |
| From net realized gains | | | — | | | | — | | | | — | | | | — | (b) | | | (0.05 | ) | |
| Total distributions to shareholders | | | (0.26 | ) | | | (0.26 | ) | | | (0.29 | ) | | | (0.30 | ) | | | (0.35 | ) | |
| Net Asset Value, End of Period | | $ | 10.86 | | | $ | 10.95 | | | $ | 10.57 | | | $ | 10.65 | | | $ | 10.73 | | |
| Total return (c)(d) | | | 1.54 | % | | | 6.13 | % | | | 2.07 | % | | | 2.08 | % | | | 3.86 | % | |
| Ratios to Average Net Assets/Supplemental Data: | |
| Net expenses before interest expense (e) | | | 1.55 | % | | | 1.53 | % | | | 1.50 | % | | | 1.50 | % | | | 1.50 | % | |
| Interest expense | | | — | | | | — | | | | — | | | | — | | | | — | %(f) | |
| Net expenses (e) | | | 1.55 | % | | | 1.53 | % | | | 1.50 | % | | | 1.50 | % | | | 1.50 | % | |
| Waiver/Reimbursement | | | 0.12 | % | | | 0.09 | % | | | 0.11 | % | | | 0.12 | % | | | 0.13 | % | |
| Net investment income (e) | | | 2.35 | % | | | 2.41 | % | | | 2.79 | % | | | 2.77 | % | | | 2.80 | % | |
| Portfolio turnover rate | | | 14 | % | | | 12 | % | | | 12 | % | | | 12 | % | | | 22 | % | |
| Net assets, end of period (000s) | | $ | 3,544 | | | $ | 2,499 | | | $ | 1,898 | | | $ | 967 | | | $ | 1,340 | | |
(a) Per share data was calculated using the average shares outstanding during the period.
(b) Rounds to less than $0.01 per share.
(c) Total return at net asset value assuming all distributions reinvested and no contingent deferred sales charge.
(d) Had the Investment Manager and/or any of its affiliates not waived fees or reimbursed a portion of expenses, total return would have been reduced.
(e) The benefits derived from expense reductions had an impact of less than 0.01%.
(f) Rounds to less than 0.01%.
See Accompanying Notes to Financial Statements.
22
Financial Highlights – Columbia Virginia Intermediate Municipal Bond Fund
Selected data for a share outstanding throughout each period is as follows:
| | | Year Ended March 31, | |
| Class Z Shares | | 2011 | | 2010 | | 2009 | | 2008 | | 2007 | |
| Net Asset Value, Beginning of Period | | $ | 10.94 | | | $ | 10.57 | | | $ | 10.65 | | | $ | 10.73 | | | $ | 10.67 | | |
| Income from Investment Operations: | |
| Net investment income (a) | | | 0.37 | | | | 0.37 | | | | 0.40 | | | | 0.40 | | | | 0.41 | | |
Net realized and unrealized gain (loss) on investments
and futures contracts | | | (0.09 | ) | | | 0.37 | | | | (0.08 | ) | | | (0.07 | ) | | | 0.10 | | |
| Total from investment operations | | | 0.28 | | | | 0.74 | | | | 0.32 | | | | 0.33 | | | | 0.51 | | |
| Less Distributions to Shareholders: | |
| From net investment income | | | (0.37 | ) | | | (0.37 | ) | | | (0.40 | ) | | | (0.41 | ) | | | (0.40 | ) | |
| From net realized gains | | | — | | | | — | | | | — | | | | — | (b) | | | (0.05 | ) | |
| Total distributions to shareholders | | | (0.37 | ) | | | (0.37 | ) | | | (0.40 | ) | | | (0.41 | ) | | | (0.45 | ) | |
| Net Asset Value, End of Period | | $ | 10.85 | | | $ | 10.94 | | | $ | 10.57 | | | $ | 10.65 | | | $ | 10.73 | | |
| Total return (c)(d) | | | 2.56 | % | | | 7.10 | % | | | 3.09 | % | | | 3.10 | % | | | 4.90 | % | |
| Ratios to Average Net Assets/Supplemental Data: | |
| Net expenses before interest expense (e) | | | 0.55 | % | | | 0.53 | % | | | 0.50 | % | | | 0.50 | % | | | 0.50 | % | |
| Interest expense | | | — | | | | — | | | | — | | | | — | | | | — | %(f) | |
| Net expenses (e) | | | 0.55 | % | | | 0.53 | % | | | 0.50 | % | | | 0.50 | % | | | 0.50 | % | |
| Waiver/Reimbursement | | | 0.12 | % | | | 0.09 | % | | | 0.11 | % | | | 0.12 | % | | | 0.13 | % | |
| Net investment income (e) | | | 3.36 | % | | | 3.42 | % | | | 3.80 | % | | | 3.76 | % | | | 3.80 | % | |
| Portfolio turnover rate | | | 14 | % | | | 12 | % | | | 12 | % | | | 12 | % | | | 22 | % | |
| Net assets, end of period (000s) | | $ | 264,505 | | | $ | 278,479 | | | $ | 267,576 | | | $ | 288,262 | | | $ | 273,728 | | |
(a) Per share data was calculated using the average shares outstanding during the period.
(b) Rounds to less than $0.01 per share.
(c) Total return at net asset value assuming all distributions reinvested.
(d) Had the Investment Manager and/or any of its affiliates not waived fees or reimbursed a portion of expenses, total return would have been reduced.
(e) The benefits derived from expense reductions had an impact of less than 0.01%.
(f) Rounds to less than 0.01%.
See Accompanying Notes to Financial Statements.
23
Notes to Financial Statements – Columbia Virginia Intermediate Municipal Bond Fund
March 31, 2011
Note 1. Organization
Columbia Virginia Intermediate Municipal Bond Fund (the Fund), a series of Columbia Funds Series Trust (the Trust), is a diversified fund. The Trust is registered under the Investment Company Act of 1940, as amended (the 1940 Act), as an open-end management investment company organized as a Delaware statutory trust.
After the close of business on April 30, 2010, Ameriprise Financial, Inc. (Ameriprise Financial) acquired a portion of the asset management business of Columbia Management Group, LLC (the Transaction), including the business of managing the Fund. In connection with the closing of the Transaction (the Closing), RiverSource Investments, LLC, a wholly owned subsidiary of Ameriprise Financial, became the investment manager of the Fund and changed its name to Columbia Management Investment Advisers, LLC (the Investment Manager).
Investment Objective
The Fund seeks current income exempt from U.S. federal income tax and Virginia individual income tax, consistent with moderate fluctuation of principal.
Fund Shares
The Trust has unlimited authorized shares of beneficial interest. The Fund offers Class A, Class B, Class C and Class Z shares. All share classes have identical voting, dividend and liquidation rights. Each share class has its own expense structure and sales charges, as applicable.
Class A shares are subject to a maximum front-end sales charge of 3.25% based on the initial investment amount. Class A shares purchased without an initial sales charge in accounts aggregating $1 million to $50 million at the time of purchase are subject to a 1.00% contingent deferred sales charge (CDSC) if the shares are sold within 18 months of purchase, charged as follows: 1.00% CDSC if redeemed within 12 months of purchase, and 0.50% CDSC if redeemed more than 12, but less than 18 months after purchase.
The Fund no longer accepts investments by new or existing investors in the Fund's Class B shares, except in connection with the reinvestment of any dividend and/or capital gain distributions in Class B shares of the Fund and exchanges by existing Class B shareholders of other funds within the Columbia Family of Funds. Class B shares are subject to a maximum CDSC of 3.00% based upon the holding period after purchase. Class B shares will generally convert to Class A shares eight years after purchase.
Class C shares are subject to a 1.00% CDSC on shares redeemed within one year of purchase.
Class Z shares are not subject to sales charges and are available only to certain investors, as described in the Fund's prospectus.
Note 2. Summary of Significant Accounting Policies
The preparation of financial statements in accordance with U.S. generally accepted accounting principles (GAAP) requires management to make certain estimates and assumptions that affect the reported amounts of assets and liabilities, the disclosure of contingent assets and liabilities at the date of the financial statements and the reported amounts of revenue and expenses during the reporting period. Actual results could differ from those estimates.
The following is a summary of significant accounting policies consistently followed by the Fund in the preparation of its financial statements.
Security Valuation
Debt securities generally are valued by pricing services approved by the Trust's Board of Trustees, based upon market transactions for normal, institutional-size trading units of similar securities. The services may use various pricing techniques which take into account appropriate factors such as yield, quality, coupon rate, maturity, type of issue, trading characteristics and other data, as well as broker quotes. Debt securities for which quotations are readily available may also be valued based upon an over-the-counter or exchange bid quotation.
Investments in other open-end investment companies are valued at net asset value.
Investments for which market quotations are not readily available, or that have quotations which the Investment Manager believes are not reliable, are valued at fair value as determined in good faith under consistently applied procedures established by and under the general supervision of the Board of Trustees. If a security is valued at fair value, such value is likely to be different from the last quoted market price for the security. The determination of fair value often requires significant judgment. To determine fair value, the Investment Manager may use assumptions including but not limited to future cash flows and estimated risk premiums. Multiple inputs from various sources may be used to determine value.
24
Columbia Virginia Intermediate Municipal Bond Fund, March 31, 2011
Security Transactions
Security transactions are accounted for on the trade date. Cost is determined and gains (losses) are based upon the specific identification method for both financial statement and federal income tax purposes.
Income Recognition
Interest income is recorded on the accrual basis. Market premium and discount are amortized and accreted, respectively, on all debt securities, unless otherwise noted. Original issue discount is accreted to interest income over the life of the security with a corresponding increase in the cost basis, if any.
Dividend income is recorded on the ex-date.
Expenses
General expenses of the Trust are allocated to the Fund and other series of the Trust based upon relative net assets or other expense allocation methodologies determined by the nature of the expense. Expenses directly attributable to a specific class of shares are charged to that share class. Expenses directly attributable to the Fund are charged to the Fund.
Determination of Class Net Asset Value
All income, expenses (other than class-specific expenses which are charged directly to a share class, as shown in the Statement of Operations) and realized and unrealized gains (losses) are allocated to each class of the Fund on a daily basis for purposes of determining the net asset value of each class. Income and expenses are allocated to each class based on the settled shares method, while realized and unrealized gains (losses) are allocated based on the relative net assets of each class.
Federal Income Tax Status
The Fund intends to qualify each year as a "regulated investment company" under Subchapter M of the Internal Revenue Code, as amended, and will distribute substantially all of its tax exempt or taxable income, if any, for its tax year, and as such will not be subject to federal income taxes. In addition, the Fund intends to distribute in each calendar year substantially all of its net investment income, capital gains and certain other amounts, if any, such that the Fund should not be subject to federal excise tax. Therefore, no federal income or excise tax provision is recorded.
Distributions to Shareholders
Distributions from net investment income are declared daily and paid monthly. Net realized capital gains, if any, are distributed at least annually. Income distributions and capital gain distributions are determined in accordance with federal income tax regulations which may differ from GAAP.
Indemnifications
Under the Trust's organizational documents and, in some cases, by contract, its officers and directors are indemnified against certain liabilities arising out of the performance of their duties to the Fund. In addition, certain of the Fund's contracts with its service providers contain general indemnification clauses. The Fund's maximum exposure under these arrangements is unknown since the amount of any future claims that may be made against the Fund cannot be determined and the Fund has no historical basis for predicting the likelihood of any such claims.
Note 3. Fees and Compensation Paid to Affiliates
Investment Management Fee
Under an Investment Management Services Agreement (IMSA), the Investment Manager determines which securities will be purchased, held or sold. The management fee is equal to a percentage of the Fund's average daily net assets that declines from 0.40% to 0.27% as the Fund's net assets increase.
Prior to the Closing, Columbia Management Advisors, LLC (Columbia), an indirect, wholly owned subsidiary of Bank of America Corporation (BOA), provided investment management services to the Fund under the same fee structure. The effective management fee rate for the year ended March 31, 2011, was 0.40% of the Fund's average daily net assets.
Administration Fee
Effective upon the Closing, the Investment Manager provides administration and accounting services to the Fund under an Administrative Services Agreement, including services previously performed under the Pricing and Bookkeeping Oversight and Services Agreement (the Services Agreement) as discussed in the Pricing and Bookkeeping Fees note below. The Fund pays an annual administration fee equal to 0.15% of the Fund's average daily net assets less the fees payable by the Fund as described under the Pricing and Bookkeeping Fees note below. Prior to the Closing,
25
Columbia Virginia Intermediate Municipal Bond Fund, March 31, 2011
Columbia provided administrative services to the Fund at the same fee rates.
Pricing and Bookkeeping Fees
Prior to the Closing, the Fund entered into a Financial Reporting Services Agreement (the Financial Reporting Services Agreement) with State Street Bank and Trust Company (State Street) and Columbia pursuant to which State Street provides financial reporting services to the Fund. The Fund also entered into an Accounting Services Agreement (collectively with the Financial Reporting Services Agreement, the State Street Agreements) with State Street and Columbia pursuant to which State Street provides accounting services to the Fund. Upon the Closing, Columbia assigned and delegated its rights and obligations under the State Street Agreements to the Investment Manager. Under the State Street Agreements, the Fund pays State Street an annual fee of $38,000 paid monthly plus an additional monthly fee based on an annualized percentage rate of average daily net assets of the Fund for the month. The aggregate fee will not exceed $140,000 per year (exclusive of out-of-pocket expenses and charges). The Fund also reimburses State Street for certain out-of-pocket expenses and charges.
Also prior to the Closing, the Fund entered into the Services Agreement with Columbia. Under the Services Agreement, Columbia provided services related to Fund expenses and the requirements of the Sarbanes-Oxley Act of 2002, and provided oversight of the accounting and financial reporting services provided by State Street. Under the Services Agreement, the Fund reimbursed Columbia for out-of-pocket expenses and charges, including fees payable to third parties, such as for pricing the Fund's portfolio securities, incurred by Columbia in the performance of services under the Services Agreement. The Services Agreement was terminated upon the Closing. These services are now provided under the Administrative Services Agreement discussed above.
Transfer Agent Fee
In connection with the Closing, RiverSource Service Corporation, a wholly owned subsidiary of Ameriprise Financial, provides transfer agency services to the Fund under a Transfer Agency Agreement and changed its name to Columbia Management Investment Services Corp. (the Transfer Agent). The Transfer Agent has contracted with Boston Financial Data Services (BFDS) to serve as sub-transfer agent.
The Transfer Agent receives monthly account-based service fees based on the number of open accounts and is reimbursed by the Fund for the fees and expenses the Transfer Agent pays to financial intermediaries that maintain omnibus accounts with the Fund that is a percentage of the average aggregate value of the Fund's shares maintained in each such omnibus account (other than omnibus accounts for which American Enterprise Investment Services Inc. is the broker of record or accounts where the beneficial shareholder is a customer of Ameriprise Financial Services, Inc., which are paid a per account fee). The Transfer Agent pays the fees of BFDS for services as sub-transfer agent and is not entitled to reimbursement for such fees from the Fund (with the exception of out-of pocket fees). The Transfer Agent also receives compensation from fees for various shareholder services and reimbursements for certain out-of -pocket expenses.
Prior to the Closing, Columbia Management Services, Inc., an affiliate of Columbia and an indirect, wholly owned subsidiary of BOA, provided transfer agency services to the Fund and contracted with BFDS to serve as sub-transfer agent, under the same fee structure.
For the year ended March 31, 2011, the Fund's effective transfer agent fee rate for each class was 0.06% of the Fund's average daily net assets.
An annual minimum account balance fee of $20 may apply to certain accounts with a value below the Fund's initial minimum investment requirements to reduce the impact of small accounts on transfer agent fees. These minimum account balance fees are recorded as part of expense reductions on the Statement of Operations. For the year ended March 31, 2011, no minimum account balance fees were charged by the Fund.
Underwriting Discounts, Service and Distribution Fees
In connection with the Closing, RiverSource Fund Distributors, Inc., an indirect wholly owned subsidiary of Ameriprise Financial, provides distribution and shareholder services to the Fund and changed its name to Columbia Management Investment Distributors, Inc. (the Distributor). Pursuant to Rule 12b-1 under the 1940 Act, the Board of Trustees has approved, and the Fund has adopted, distribution and shareholder service plans (the Plans) which set the distribution and service fees for the Fund. These fees are calculated daily and are intended to compensate the Distributor and/or eligible selling and/or servicing agents for selling shares of the Fund and providing services to investors.
The Plans require the payment of a combined distribution and shareholder servicing fee for the Class A shares of the Fund. The Plans also require the payment of a monthly shareholder servicing
26
Columbia Virginia Intermediate Municipal Bond Fund, March 31, 2011
fee and distribution fee for the Class B and Class C shares of the Fund. A substantial portion of the expenses incurred pursuant to these plans is paid to affiliates of the Distributor. The annual rates in effect and plan limits, as a percentage of average daily net assets, are as follows:
| | | Current
Rate | | Plan
Limit | |
Class A Combined Distribution
and Shareholder Servicing Plan | | | 0.25 | % | | | 0.25 | % | |
Class B and Class C Shareholder
Servicing Plans | | | 0.25 | % | | | 0.25 | % | |
Class B and Class C
Distribution Plans | | | 0.75 | % | | | 0.75 | % | |
Prior to the Closing, Columbia Management Distributors, Inc., an affiliate of Columbia and an indirect, wholly owned subsidiary of BOA, was the principal underwriter of the Fund's shares. There were no changes to the underwriting discount structure of the Fund or the service or distribution fee rates paid by the Fund as a result of the Transaction.
Sales Charges
Sales charges, including front-end and CDSC's, received by the Distributor for distributing Fund shares were $2,467 for Class A, $2 for Class B and $3,889 for Class C shares for the year ended March 31, 2011.
Fee Waivers and Expense Reimbursements
The Investment Manager has voluntarily agreed to bear a portion of the Fund's expenses so that the Fund's ordinary operating expenses (excluding any distribution and service fees, brokerage commissions, interest, taxes and extraordinary expenses, but including custodian charges relating to overdrafts, if any), after giving effect to any balance credits from the Fund's custodian, do not exceed 0.55% of the Fund's average daily net assets on an annualized basis. The Investment Manager, in its discretion, may revise or discontinue this arrangement at any time. Prior to May 1, 2010, Columbia voluntarily reimbursed a portion of the Fund's expenses in the same manner.
The Investment Manager is entitled to recover from the Fund any fees waived and/or expenses reimbursed for a three year period following the date of such fee waiver and/or reimbursement under these arrangements if such recovery does not cause the Fund's expenses to exceed the expense limitations in effect at the time of recovery. Prior to May 1, 2010, Columbia was entitled to recover fees waived and/or expenses reimbursed from the Fund in the same manner.
At March 31, 2011, the amounts potentially recoverable pursuant to this arrangement were as follows:
| Amount of potential recovery expiring March 31, | | Total
potential | | Amount
expired | | Amount recovered
during the year | |
| 2014 | | 2013 | | 2012 | | recovery | | 3/31/11 | | ended 3/31/11 | |
| $ | 400,194 | | | $ | 298,704 | | | $ | 367,033 | | | $ | 1,065,931 | | | $ | 386,045 | | | $ | — | | |
Effective May 1, 2011, the Investment Manager has eliminated the fee recoupment provisions detailed above.
Fees Paid to Officers and Trustees
In connection with the Closing, all officers of the Fund are employees of the Investment Manager or its affiliates and, with the exception of the Fund's Chief Compliance Officer, receive no compensation from the Fund. The Board of Trustees has appointed a Chief Compliance Officer to the Fund in accordance with federal securities regulations. The Fund, along with other affiliated funds, pays its pro-rata share of the expenses associated with the Chief Compliance Officer. The Fund's expenses for the Chief Compliance Officer will not exceed $15,000 per year. Prior to the Closing, all officers of the Fund were employees of Columbia or its affiliates and the Fund paid its pro-rata share of the expenses for the Chief Compliance Officer under the same fee structure.
Trustees are compensated for their services to the Fund, as set forth on the Statement of Operations. The Trust's eligible Trustees may participate in a non-qualified deferred compensation plan which may be terminated at any time. Any payments to plan participants are paid solely out of the Fund's assets. Income earned on the plan participant's deferral account is based on the rate of return of the
27
Columbia Virginia Intermediate Municipal Bond Fund, March 31, 2011
eligible mutual funds selected by the participant or, if no funds are selected, on the rate of return of Columbia Money Market Fund (formerly known as RiverSource Cash Management Fund). Prior to the Closing, if no funds were selected, income earned on the plan participant's deferral account was based on the rate of return of BofA Treasury Reserves. Trustees' fees deferred during the current period as well as any gains or losses on the trustees' deferred compensation balances as a result of market fluctuations are included in "Trustees' fees" on the Statement of Operations. Liabilities under the deferred compensation plan are included in "Trustees' fees" on the Statement of Assets and Liabilities.
Other
Prior to the Closing, the Fund made daily investments of cash balances in BofA Tax-Exempt Reserves, formerly an affiliated open-ended investment company of Columbia, pursuant to an exemptive order received from the Securities and Exchange Commission. The income earned prior to the Closing by the Fund from such investments is included as Dividends from affiliates on the Statement of Operations. As an investing Fund, the Fund was indirectly allocated its proportionate share of the expenses of BofA Tax-Exempt Reserves.
Note 4. Custody Credits
The Fund has an agreement with its custodian bank under which custody fees may be reduced by balance credits. These credits are recorded as part of expense reductions on the Statement of Operations. The Fund could have invested a portion of the assets utilized in connection with the expense offset arrangement in an income-producing asset if it had not entered into such an agreement. For the year ended March 31, 2011, these custody credits reduced total expenses by $6 for the Fund.
Note 5. Portfolio Information
The cost of purchases and proceeds from sales of securities, excluding short-term obligations, aggregated $44,599,818 and $57,000,360, respectively, for the year ended March 31, 2011.
Note 6. Shareholder Concentration
As of March 31, 2011, two shareholder accounts owned 86.8% of the outstanding shares of the Fund. Purchase and redemption activity of these accounts may have a significant effect on the operations of the Fund.
Note 7. Line of Credit
Prior to March 28, 2011, the Fund and other affiliated funds participated in a $280,000,000 committed, unsecured revolving line of credit provided by State Street. Effective March 28, 2011, the commitment was reduced to $225,000,000. The maximum amount that may be borrowed by any fund is limited to the lesser of $200,000,000 and the Fund's borrowing limit set forth in the Fund's registration statement. Borrowings are available for short-term liquidity or temporary or emergency purposes.
Effective October 14, 2010, interest is charged to each participating fund based on the fund's borrowings at a rate per annum equal to the greater of the Federal Funds Rate plus 1.25% or the overnight LIBOR Rate plus 1.25%. In addition, a commitment fee of 0.125% per annum is accrued and apportioned among the participating funds pro rata based on their relative net assets.
Prior to October 14, 2010, interest was charged to each participating fund at the same rates. In addition, a commitment fee of 0.15% per annum was accrued and apportioned among the participating funds pro rata based on their relative net assets.
For the year ended March 31, 2011, the Fund did not borrow under these arrangements.
Note 8. Federal Tax Information
The timing and character of income and capital gain distributions are determined in accordance with income tax regulations, which may differ from GAAP. Reclassifications are made to the Fund's capital accounts for permanent tax differences to reflect income and gains available for distribution (or available capital loss carryforwards) under income tax regulations.
For the year ended March 31, 2011, permanent book and tax basis differences resulting primarily from differing treatments for market discount adjustments were identified and reclassified among the components of the Fund's net assets as follows:
Undistributed
Net Investment
Income | | Accumulated
Net Realized
Loss | | Paid-In Capital | |
| $ | (4,193 | ) | | $ | 4,193 | | | $ | — | | |
Net investment income and net realized gains (losses), as disclosed on the Statement of Operations, and net assets were not affected by this reclassification.
28
Columbia Virginia Intermediate Municipal Bond Fund, March 31, 2011
The tax character of distributions paid during the years ended March 31, 2011 and March 31, 2010 was as follows:
| | | March 31, | |
| | | 2011 | | 2010 | |
| Tax-Exempt Income | | $ | 10,925,921 | | | $ | 11,077,237 | | |
| Ordinary Income* | | | 13,464 | | | | 145,799 | | |
* For tax purposes short-term capital gain distributions, if any, are considered ordinary income distributions.
As of March 31, 2011, the components of distributable earnings on a tax basis were as follows:
Undistributed
Tax-Exempt
Income | | Undistributed
Long-Term
Capital Gains | | Net Unrealized
Appreciation | |
| $ | 1,681,299 | | | $ | — | | | $ | 8,304,569 | | |
Unrealized appreciation and depreciation at March 31, 2011, based on cost of investments for federal income tax purposes were:
| Unrealized appreciation | | $ | 12,035,263 | | |
| Unrealized depreciation | | | (3,730,694 | ) | |
| Net unrealized appreciation | | $ | 8,304,569 | | |
The following capital loss carryforwards may be available to reduce taxable income arising from future net realized gains on investments, if any, to the extent permitted by the Internal Revenue Code:
| Year of Expiration | | Capital Loss
Carryforwards | |
| 2018 | | $ | 215,943 | | |
Capital loss carryforwards of $948,997 were utilized during the year ended March 31, 2011.
Management of the Fund has concluded that there are no significant uncertain tax positions that would require recognition in the financial statements. However, management's conclusion may be subject to review and adjustment at a later date based on factors including, but not limited to, new tax laws, regulations, and administrative interpretations (including relevant court decisions). The Fund's federal tax returns for the prior three fiscal years remain subject to examination by the Internal Revenue Service.
Note 9. Significant Risks and Contingencies
Sector Focus Risk
The Fund may focus its investments in certain sectors, subjecting it to greater risk than a fund that is less focused.
Geographic Concentration Risk
Securities issued by a particular state and its instrumentalities are subject to the risk of unfavorable developments in such state. The value of Fund shares may be more volatile than the value of shares of funds that invest in municipal securities of issuers in more than one state, as unfavorable developments have the potential to impact more significantly the Fund than funds that invest in municipal securities of many different states. A municipal security can be significantly affected by adverse tax, legislative, demographic or political changes as well as changes in the state's financial or economic condition and prospects.
The Fund's municipal holdings may include obligations of issuers that rely in whole or in part for payment of interest and principal on state specific revenues, real property taxes, revenues from particular institutions, such as healthcare institutions, or obligations secured by mortgages on real property. Consequently, the impact of changes in state law or regulations or the economic conditions in a particular state should be considered. The ability of issuers of debt securities held by the Fund to meet their obligations may be affected by economic developments in a specific industry or region.
Tax Development Risk
The Fund purchases municipal securities whose interest, in the opinion of bond counsel, is free from federal income tax. There is no assurance that the Internal Revenue Service (IRS) will agree with this opinion. In the event the IRS determines that an issuer does not comply with relevant tax requirements, interest payments from a security could become federally taxable, possibly retroactively to the date the security was issued. As a shareholder of the Fund, you may be required to file an amended tax return as a result.
Note 10. Subsequent Events
Management has evaluated the events and transactions that have occurred through the date the financial statements were issued.
29
Columbia Virginia Intermediate Municipal Bond Fund, March 31, 2011
Other than as noted below, there were no items requiring adjustment of the financial statements or additional disclosure.
Effective May 16, 2011, the line of credit commitment with State Street was reduced to $150,000,000, and the maximum amount that may be borrowed by any fund was limited to the lesser of $120,000,000 and the Fund's borrowing limit set forth in the Fund's registration statement.
Note 11. Information Regarding Pending and Settled Legal Proceedings
In June 2004, an action captioned John E. Gallus et al. v. American Express Financial Corp. and American Express Financial Advisors Inc. was filed in the United States District Court for the District of Arizona. The plaintiffs allege that they are investors in several American Express Company (now known as RiverSource) mutual funds and they purport to bring the action derivatively on behalf of those funds under the Investment Company Act of 1940. The plaintiffs allege that fees allegedly paid to the defendants by the funds for investment advisory and administrative services are excessive. The plaintiffs seek remedies including restitution and rescission of investment advisory and distribution agreements. The plaintiffs voluntarily agreed to transfer this case to the United States District Court for the District of Minnesota (the District Court). In response to defendants' motion to dismiss the complaint, the District Court dismissed one of plaintiffs' four claims and granted plaintiffs limited discovery. Defendants moved for summary judgment in April 2007. Summary judgment was granted in the defendants' favor on July 9, 2007. The plaintiffs filed a notice of appeal with the Eighth Circuit Court of Appeals (the Eighth Circuit) on August 8, 2007. On April 8, 2009, the Eighth Circuit reversed summary judgment and remanded to the District Court for further proceedings. On August 6, 2009, defendants filed a writ of certiorari with the U.S. Supreme Court (the Supreme Court), asking the Supreme Court to stay the District Court proceedings while the Supreme Court considers and rules in a case captioned Jones v. Harris Associates, which involves issues of law similar to those presented in the Gallus case. On March 30, 2010, the Supreme Court issued its ruling in Jones v. Harris Associates, and on April 5, 2010, the Supreme Court vacated the Eighth Circuit's decision in the Gallus case and remanded the case to the Eighth Circuit for further consideration in light of the Supreme Court's decision in Jones v. Harris Associates. On June 4, 2010, the Eighth Circuit remanded the Gallus case to the District Court for further consideration in light of the Supreme Court's decision in Jones v. Harris Associates. On December 9, 2010, the District Court reinstated its July 9, 2007 summary judgment order in favor of the defendants. On January 10, 2011, plaintiffs filed a notice of appeal with the Eighth Circuit.
In December 2005, without admitting or denying the allegations, American Express Financial Corporation (AEFC, which is now known as Ameriprise Financial, Inc. (Ameriprise Financial)), entered into settlement agreements with the Securities and Exchange Commission (SEC) and Minnesota Department of Commerce (MDOC) related to market timing activities. As a result, AEFC was censured and ordered to cease and desist from committing or causing any violations of certain provisions of the Investment Advisers Act of 1940, the Investment Company Act of 1940, and various Minnesota laws. AEFC agreed to pay disgorgement of $10 million and civil money penalties of $7 million. AEFC also agreed to retain an independent distribution consultant to assist in developing a plan for distribution of all disgorgement and civil penalties ordered by the SEC in accordance with various undertakings detailed at http:// www.sec.gov/litigation/admin/ia-2451.pdf. Ameriprise Financial and its affiliates have cooperated with the SEC and the MDOC in these legal proceedings, and have made regular reports to funds' Boards of Directors/Trustees.
Ameriprise Financial and certain of its affiliates have historically been involved in a number of legal, arbitration and regulatory proceedings, including routine litigation, class actions, and governmental actions, concerning matters arising in connection with the conduct of their business activities. Ameriprise Financial believes that the Funds are not currently the subject of, and that neither Ameriprise Financial nor any of its affiliates are the subject of, any pending legal, arbitration or regulatory proceedings that are likely to have a material adverse effect on the Funds or the ability of Ameriprise Financial or its affiliates to perform under their contracts with the Funds. Ameriprise Financial is required to make 10-Q, 10-K and, as necessary, 8-K filings with the Securities and Exchange Commission on legal and regulatory matters that relate to Ameriprise Financial and its affiliates. Copies of these filings may be obtained by accessing the SEC website at www.sec.gov.
There can be no assurance that these matters, or the adverse publicity associated with them, will not result in increased fund redemptions, reduced sale of fund shares or other adverse consequences to the Funds. Further, although we believe proceedings are not likely to have a material adverse effect on the Funds or the ability of Ameriprise Financial or its affiliates to perform under their contracts with the Funds, these proceedings are subject to uncertainties and, as
30
Columbia Virginia Intermediate Municipal Bond Fund, March 31, 2011
such, we are unable to estimate the possible loss or range of loss that may result. An adverse outcome in one or more of these proceedings could result in adverse judgments, settlements, fines, penalties or other relief that could have a material adverse effect on the consolidated financial condition or results of operations of Ameriprise Financial.
31
Report of Independent Registered Public Accounting Firm
To the Trustees of Columbia Funds Series Trust and the Shareholders of Columbia Virginia Intermediate Municipal Bond Fund
In our opinion, the accompanying statement of assets and liabilities, including the investment portfolio, and the related statements of operations and of changes in net assets and the financial highlights present fairly, in all material respects, the financial position of Columbia Virginia Intermediate Municipal Bond Fund (the "Fund") (a series of Columbia Funds Series Trust) at March 31, 2011, and the results of its operations for the year then ended, the changes in its net assets for each of the two years in the period then ended, and the financial highlights for each of the five years in the period then ended, in conformity with accounting principles generally accepted in the United States of America. These financial statements and financial highlights (hereafter referred to as "financial statements") are the responsibility of the Fund's management. Our responsibility is to express an opinion on these financial statements based on our audits. We conducted our audits of these financial statements in accordance with the standards of the Public Company Accounting Oversight Board (United States). Those standards require that we plan and perform the audit to obtain reasonable assurance about whether the financial statements are free of material misstatement. An audit includes examining, on a test basis, evidence supporting the amounts and disclosures in the financial statements, assessing the accounting principles used and significant estimates made by management, and evaluating the overall financial statement presentation. We believe that our audits, which included confirmation of securities at March 31, 2011 by correspondence with the custodian and brokers, provide a reasonable basis for our opinion.
PricewaterhouseCoopers LLP
Boston, Massachusetts
May 20, 2011
32
Federal Income Tax Information (Unaudited) – Columbia Virginia Intermediate Municipal Bond Fund
For the fiscal year ended March 31, 2011, 99.90% of distributions made from net investment income of the Fund qualifies as exempt interest dividends for federal income tax purposes. A portion of the income may be subject to federal alternative minimum tax.
The Fund will notify shareholders in January 2012 of amounts for use in preparing 2011 income tax returns.
33
Fund Governance
The Trustees serve terms of indefinite duration. The names, addresses and birth years of the Trustees and Officers of the Funds in the Columbia Funds Series Trust, the year each was first elected or appointed to office, their principal business occupations during at least the last five years, the number of Funds overseen by each Trustee and other directorships they hold are shown below. Each officer listed below serves as an officer of each Fund in the Columbia Funds Series Trust.
Independent Trustees
Name, Address and Year of Birth,
Position with Funds, Year First
Elected or Appointed to Office | | Principal Occupation(s) During Past Five Years, Number of Funds in the Columbia
Funds Complex Overseen by Trustee, Other Directorships Held
| |
| Edward J. Boudreau, Jr. (Born 1944) | |
|
c/o Columbia Management
Investment Advisers, LLC
225 Franklin Street
Boston, MA 02110
Trustee (since 2005) | | Managing Director—E.J. Boudreau & Associates (consulting), from 2000 through current; oversees 41; Trustee—BofA Funds Series Trust. | |
|
| William P. Carmichael (Born 1943) | |
|
c/o Columbia Management
Investment Advisers, LLC
225 Franklin Street
Boston, MA 02110
Trustee (since 1999) | | Retired; oversees 41; Director—Cobra Electronics Corporation (electronic equipment manufacturer); Director—McMoRan Exploration Company (oil and gas exploration and development); Director—The Finish Line (athletic shoes and apparel); Trustee—BofA Funds Series Trust. | |
|
| William A. Hawkins (Born 1942) | |
|
c/o Columbia Management
Investment Advisers, LLC
225 Franklin Street
Boston, MA 02110
Trustee (since 2005) | | Managing Director—Overton Partners (financial consulting), August 2010 to present; President and Chief Executive Officer—California General Bank, N.A., from January 2008 through August 2010; oversees 41; Trustee—BofA Funds Series Trust. | |
|
| R. Glenn Hilliard (Born 1943) | |
|
c/o Columbia Management
Investment Advisers, LLC
225 Franklin Street
Boston, MA 02110
Trustee (since 2005) | | Chairman and Chief Executive Officer—Hilliard Group LLC (investing and consulting), from April 2003 through current; oversees 41; Trustee—BofA Funds Series Trust. | |
|
| John J. Nagorniak (Born 1944) | |
|
c/o Columbia Management
Investment Advisers, LLC
225 Franklin Street
Boston, MA 02110
Trustee (since 2008) | | Retired; President and Director—Foxstone Financial, Inc. (consulting), 2000 through December 2007; Director—Mellon Financial Corporation affiliates (investing), 2000 through 2007; Chairman—Franklin Portfolio Associates (investing—Mellon affiliate), 1982 through 2007; oversees 41; Director—MIT Investment Company; Trustee—MIT 401k Plan Trustee—Research Foundation of CFA Institute; Trustee—BofA Funds Series Trust. | |
|
34
Fund Governance (continued)
Independent Trustees (continued)
Name, Address and Year of Birth,
Position with Funds, Year First
Elected or Appointed to Office | | Principal Occupation(s) During Past Five Years, Number of Funds in the Columbia
Funds Complex Overseen by Trustee, Other Directorships Held
| |
| Minor M. Shaw (Born 1947) | |
|
c/o Columbia Management
Investment Advisers, LLC
225 Franklin Street
Boston, MA 02110
Trustee (since 2003) | | President—Micco Corporation and Mickel Investment Group; oversees 41; Board Member—Piedmont Natural Gas; Trustee—BofA Funds Series Trust. | |
|
Interested Trustee
| Anthony M. Santomero1 (Born 1946) | |
|
c/o Columbia Management
Investment Advisers, LLC
225 Franklin Street
Boston, MA 02110
Trustee (since 2008) | | Richard K. Mellon Professor Emeritus of Finance, The Wharton School, University of Pennsylvania, from 2002 through current; Senior Advisor—McKinsey & Company (consulting), July 2006 through January 2008; President and Chief Executive Officer—Federal Reserve Bank of Philadelphia, July 2000 through April 2006; oversees 41; Director—Renaissance Reinsurance Ltd; Trustee—Penn Mutual Life Insurance Company; Director—Citigroup, Inc.; Director—Citibank, N.A.; Trustee—BofA Funds Series Trust. | |
|
1 Dr. Santomero is currently deemed by the Columbia Funds to be an "interested person" (as defined in the 1940 Act) of the Funds because he serves as a Director of Citigroup, Inc. and Citibank, N.A., companies that may directly or through subsidiaries and affiliates engage from time-to-time in brokerage execution, principal transactions and lending relationships with the Columbia Funds or other funds or accounts advised/managed by Columbia Management Investment Advisers, LLC.
The Statement of Additional Information includes additional information about the Trustees of the Funds and is available, without charge, upon request by calling 800-345-6611.
Officers
| Name, Year of Birth and Address | | Principal Occupation(s) During the Past Five Years | |
| J. Kevin Connaughton (Born 1964) | |
|
225 Franklin Street
Boston, MA 02110
President (since 2009) | | Senior Vice President and General Manager—Mutual Fund Products, Columbia Management Investment Advisers, LLC since May 2010; President, Columbia Funds, since 2009, and RiverSource Funds, since May 2010 (previously Senior Vice President and Chief Financial Officer, Columbia Funds, from June 2008 to January 2009, Treasurer, Columbia Funds, from October 2003 to May 2008, and senior officer of various other affiliated funds since 2000); Managing Director, Columbia Management Advisors, LLC from December 2004 to April 2010. | |
|
| Michael G. Clarke (Born 1969) | |
|
225 Franklin Street
Boston, MA 02110
Treasurer (since 2011) and
Chief Financial Officer (since 2009) | | Vice President, Columbia Management Investment Advisers, LLC since May 2010; Managing Director of Fund Administration, Columbia Management Advisors, LLC, from September 2004 to April 2010; senior officer of Columbia Funds and affiliated funds since 2002. | |
|
35
Fund Governance (continued)
Officers (continued)
| Name, Year of Birth and Address | | Principal Occupation(s) During the Past Five Years | |
| Scott R. Plummer (Born 1959) | |
|
5228 Ameriprise Financial Center
Minneapolis, MN 55474
Senior Vice President and
Chief Legal Officer (since 2010) | | Chief Legal Officer and Assistant Secretary, Columbia Management Investment Advisers, LLC since June 2005; Vice President and Lead Chief Counsel—Asset Management, Ameriprise Financial, Inc. since May 2010 (previously Vice President and Chief Counsel—Asset Management, from 2005 to April 2010, and Vice President—Asset Management Compliance from 2004 to 2005); Vice President, Chief Counsel and Assistant Secretary, Columbia Management Investment Distributors, Inc. since 2008; Vice President, General Counsel and Secretary, Ameriprise Certificate Company since 2005; Chief Counsel, RiverSource Distributors, Inc. since 2006; Vice President, General Counsel and Secretary, RiverSource Funds, since December 2006; Senior Vice President, Secretary and Chief Legal Officer, Columbia Funds, since May 2010. | |
|
| Linda J. Wondrack (Born 1964) | |
|
225 Franklin Street
Boston, MA 02110
Senior Vice President and
Chief Compliance Officer (since 2007) | | Vice President and Chief Compliance Officer, Columbia Management Investment Advisers, LLC since May 2010; Chief Compliance Officer, Columbia Funds, since 2007, and RiverSource Funds, since May 2010; Director (Columbia Management Group, LLC and Investment Product Group Compliance), Bank of America, from June 2005 to April 2010. | |
|
| William F. Truscott (Born 1960) | |
|
53600 Ameriprise Financial Center
Minneapolis, MN 55474
Senior Vice President (since 2010) | | Chairman of the Board, Columbia Management Investment Advisers, LLC since May 2010 (previously President, Chairman of the Board and Chief Investment Officer, from 2001 to April 2010); Chief Executive Officer, U.S. Asset Management & President, Annuities, Ameriprise Financial, Inc. since May 2010 (previously President—U.S. Asset Management and Chief Investment Officer from 2005 to April 2010, and Senior Vice President—Chief Investment Officer, from 2001 to 2005); Director, President and Chief Executive Officer, Ameriprise Certificate Company since 2006; Director, Columbia Management Investment Distributors, Inc. since May 2010 (previously Chairman of the Board and Chief Executive Officer from 2008 to April 2010); Chairman of the Board and Chief Executive Officer, RiverSource Distributors, Inc. since 2006. | |
|
| Colin Moore (Born 1958) | |
|
225 Franklin Street
Boston, MA 02110
Senior Vice President (since 2010) | | Director and Chief Investment Officer, Columbia Management Investment Advisers, LLC since May 2010; Manager, Managing Director and Chief Investment Officer of Columbia Management Advisors, LLC from 2007 to April 2010; Head of Equities, Columbia Management Advisors, LLC from 2002 to 2007. | |
|
| Michael A. Jones (Born 1959) | |
|
225 Franklin Street
Boston, MA 02110
Senior Vice President (since 2010) | | President and Director, Columbia Management Investment Advisers, LLC since May 2010; President and Director, Columbia Management Investment Distributors, Inc. since May 2010; Manager, Chairman, Chief Executive Officer and President, Columbia Management Advisors, LLC from 2007 to April 2010; Chief Executive Officer, President and Director, Columbia Management Distributors, Inc. from November 2006 to April 2010; previously, co-president and senior managing director at Robeco Investment Management. | |
|
36
Fund Governance (continued)
Officers (continued)
| Name, Year of Birth and Address | | Principal Occupation(s) During the Past Five Years | |
| Christopher O. Petersen (Born 1970) | |
|
5228 Ameriprise Financial Center
Minneapolis, MN 55474
Vice President and
Secretary (since 2011) | | Vice President and Chief Counsel, Ameriprise Financial since January 2010 (formerly Vice President and Group Counsel or Counsel from April 2004 to January 2010); Assistant Secretary of RiverSource Funds since January 2007. | |
|
| Amy Johnson (Born 1965) | |
|
5228 Ameriprise Financial Center
Minneapolis, MN 55474
Vice President (since 2010) | | Senior Vice President and Chief Operating Officer, Columbia Management Investment Advisers, LLC since May 2010 (previously Chief Administrative Officer, from 2009 until April 2010, Vice President—Asset Management and Trust Company Services, from 2006 to 2009, and Vice President—Operations and Compliance from 2004 to 2006). | |
|
| Joseph F. DiMaria (Born 1968) | |
|
225 Franklin Street
Boston, MA 02110
Vice President (since 2011) and
Chief Accounting Officer (since 2008) | | Vice President, Mutual Fund Administration, Columbia Management Investment Advisers, LLC, since May 2010; Director of Fund Administration, Columbia Management Advisors, LLC from January 2006 to April 2010; Head of Tax/Compliance and Assistant Treasurer, Columbia Management Advisors, LLC, from November 2004 to December 2005. | |
|
| Paul B. Goucher (Born 1968) | |
|
5228 Ameriprise Financial Center
Minneapolis, MN 55474
Vice President and
Assistant Treasurer (since 2010) | | Vice President and Chief Counsel of Ameriprise Financial since January 2010 (formerly Vice President and Group Counsel from November 2008 to January 2010); Director, Managing Director and General Counsel of J. & W. Seligman & Co. Incorporated (Seligman) from July 2008 to November 2008 and Managing Director and Associate General Counsel of Seligman from January 2005 to July 2008. | |
|
| Michael E. DeFao (Born 1968) | |
|
5228 Ameriprise Financial Center
Minneapolis, MN 55474
Vice President and
Assistant Treasurer (since 2011) | | Vice President and Chief Counsel, Ameriprise Financial since May 2010; Associate General Counsel Bank of America from June 2005 to April 2010. | |
|
| Stephen T. Welsh (Born 1957) | |
|
225 Franklin Street
Boston, MA 02110
Vice President (since 2006) | | President and Director, Columbia Management Investment Services Corp. since May 2010; President and Director, Columbia Management Services, Inc. from July 2004 to April 2010; Managing Director, Columbia Management Distributors, Inc. from August 2007 to April 2010. | |
|
37
Shareholder Meeting Results
At a Joint Special Meeting of Shareholders held on February 15, 2011, shareholders of the series of Columbia Funds Series Trust, including the Fund, elected each of the nominees for trustees to the Board of Trustees of Columbia Funds Series Trust, each to hold office for an indefinite term, as follows:
| Trustee | | Votes For | | Votes Withheld | | Abstentions | |
| Kathleen Blatz | | | 2,145,636,122 | | | | 248,012,438 | | | | 0 | | |
| Edward J. Boudreau, Jr. | | | 2,145,430,114 | | | | 248,218,446 | | | | 0 | | |
| Pamela G. Carlton | | | 2,145,515,949 | | | | 248,132,612 | | | | 0 | | |
| William P. Carmichael | | | 2,145,038,695 | | | | 248,609,866 | | | | 0 | | |
| Patricia M. Flynn | | | 2,145,843,563 | | | | 247,804,997 | | | | 0 | | |
| William A. Hawkins | | | 2,145,359,401 | | | | 248,289,160 | | | | 0 | | |
| R. Glenn Hilliard | | | 2,145,079,400 | | | | 248,569,161 | | | | 0 | | |
| Stephen R. Lewis, Jr. | | | 2,145,092,209 | | | | 248,556,351 | | | | 0 | | |
| John F. Maher | | | 2,145,621,338 | | | | 248,027,223 | | | | 0 | | |
| John J. Nagorniak | | | 2,145,337,494 | | | | 248,311,067 | | | | 0 | | |
| Catherine James Paglia | | | 2,145,615,254 | | | | 248,033,306 | | | | 0 | | |
| Leroy C. Richie | | | 2,145,042,120 | | | | 248,606,441 | | | | 0 | | |
| Anthony M. Santomero | | | 2,145,088,174 | | | | 248,560,386 | | | | 0 | | |
| Minor M. Shaw | | | 2,145,430,762 | | | | 248,217,798 | | | | 0 | | |
| Alison Taunton-Rigby | | | 2,145,393,384 | | | | 248,255,177 | | | | 0 | | |
| William F. Truscott | | | 2,144,907,223 | | | | 248,741,338 | | | | 0 | | |
38
This page intentionally left blank.
This page intentionally left blank.
Important Information About This Report
The fund mails one shareholder report to each shareholder address. If you would like more than one report, please call shareholder services at 1-800-345-6611 and additional reports will be sent to you. This report has been prepared for shareholders of Columbia Virginia Intermediate Municipal Bond Fund.
A description of the policies and procedures that the fund uses to determine how to vote proxies and a copy of the fund's voting records are available (i) at www.columbiamanagement.com, (ii) on the Securities and Exchange Commission's website at www.sec.gov, and (iii) without charge, upon request, by calling 1-800-368-0346. Information regarding how the fund voted proxies relating to portfolio securities during the 12-month period ended June 30 is available from the SEC's website. Information regarding how the fund voted proxies relating to portfolio securities is also available from the fund's website, www.columbiamanagement.com.
The fund files a complete schedule of portfolio holdings with the SEC for the first and third quarters of each fiscal year on Form N-Q. The fund's Form N-Q is available on the SEC's website at www.sec.gov and may be reviewed and copied at the SEC's Public Reference Room in Washington, D.C. Information on the operation of the Public Reference Room may be obtained by calling 1-800-SEC-0330.
Transfer Agent
Columbia Management Investment
Services Corp.
P.O. Box 8081
Boston, MA 02266-8081
1-800-345-6611
Distributor
Columbia Management Investment
Distributors, Inc.
225 Franklin Street
Boston, MA 02110
Investment Manager
Columbia Management Investment Advisers, LLC
225 Franklin Street
Boston, MA 02110
41

PRSRT STD
U.S. Postage
PAID
Holliston, MA
Permit NO. 20
Columbia Virginia Intermediate Municipal Bond Fund
P. O. Box 8081
Boston, MA 02266-8081
columbiamanagement.com
This information is for use with concurrent or prior delivery of a fund prospectus. Investors should consider the investment objectives, risks, charges and expenses of a mutual fund carefully before investing. For a free prospectus, which contains this and other important information about the funds, visit columbiamanagement.com. Read the prospectus carefully before investing. The Fund is distributed by Columbia Management Investment Distributors, Inc., member FINRA, and managed by Columbia Management Investment Advisers, LLC.
© 2011 Columbia Management Investment Advisers, LLC. All rights reserved.
C-1106 A (05/11)

Columbia California Intermediate Municipal Bond Fund
Annual Report for the Period Ended March 31, 2011
Not FDIC insured • No bank guarantee • May lose value
Table of Contents
| Fund Profile | | | 1 | | |
|
| Economic Update | | | 2 | | |
|
| Performance Information | | | 4 | | |
|
| Understanding Your Expenses | | | 5 | | |
|
| Portfolio Manager's Report | | | 6 | | |
|
| Investment Portfolio | | | 8 | | |
|
Statement of Assets and
Liabilities | | | 16 | | |
|
| Statement of Operations | | | 18 | | |
|
Statement of Changes in
Net Assets | | | 19 | | |
|
| Financial Highlights | | | 21 | | |
|
| Notes to Financial Statements | | | 25 | | |
|
Report of Independent Registered
Public Accounting Firm | | | 32 | | |
|
| Federal Income Tax Information | | | 33 | | |
|
| Fund Governance | | | 34 | | |
|
| Shareholder Meeting Results | | | 38 | | |
|
Important Information About
This Report | | | 41 | | |
|
The views expressed in this report reflect the current views of the respective parties. These views are not guarantees of future performance and involve certain risks, uncertainties and assumptions that are difficult to predict, so actual outcomes and results may differ significantly from the views expressed. These views are subject to change at any time based upon economic, market or other conditions and the respective parties disclaim any responsibility to update such views. These views may not be relied on as investment advice and, because investment decisions for a Columbia Fund are based on numerous factors, may not be relied on as an indication of trading intent on behalf of any particular Columbia Fund. References to specific securities should not be construed as a recommendation or investment advice.
President's Message

Dear Shareholder:
The Columbia Management story began over 100 years ago, and today, we are one of the nation's largest dedicated asset managers. The recent acquisition by Ameriprise Financial, Inc. brings together the talents, resources and capabilities of Columbia Management with those of RiverSource Investments, Threadneedle (acquired by Ameriprise in 2003) and Seligman Investments (acquired by Ameriprise in 2008) to build a best-in-class asset management business that we believe is truly greater than its parts.
RiverSource Investments traces its roots to 1894 when its then newly-founded predecessor, Investors Syndicate, offered a face-amount savings certificate that gave small investors the opportunity to build a safe and secure fund for retirement, education or other special needs. A mutual fund pioneer, Investors Syndicate launched Investors Mutual Fund in 1940. In the decades that followed, its mutual fund products and services lineup grew to include a full spectrum of styles and specialties. More than 110 years later, RiverSource continues to be a trusted financial products leader.
Threadneedle, a leader in global asset management and one of Europe's largest asset managers, offers sophisticated international experience from a dedicated U.K. management team. Headquartered in London, it is named for Threadneedle Street in the heart of the city's financial district, where British investors pioneered international and global investing. Threadneedle was acquired in 2003 and today operates as an affiliate of Columbia Management.
Seligman Investments' beginnings date back to the establishment of the investment firm J. & W. Seligman & Co. in 1864. In the years that followed, Seligman played a major role in the geographical expansion and industrial development of the United States. In 1874, President Ulysses S. Grant named Seligman as fiscal agent for the U.S. Navy—an appointment that would last through World War I. Seligman helped finance the westward path of the railroads and the building of the Panama Canal. The firm organized its first investment company in 1929 and began managing its first mutual fund in 1930. In 2008, J. & W. Seligman & Co. Incorporated was acquired and Seligman Investments became an offering brand of RiverSource Investments, LLC.
We are proud of the rich and distinctive history of these firms, the strength and breadth of products and services they offer, and the combined cultures of pioneering spirit and forward thinking. Together we are committed to providing more for our shareholders than ever before.
> A singular focus on our shareholders
Our business is asset management, so investors are our first priority. We dedicate our resources to identifying timely investment opportunities and provide a comprehensive choice of equity, fixed-income and alternative investments to help meet your individual needs.
> First-class research and thought leadership
We are dedicated to helping you take advantage of today's opportunities and anticipate tomorrow's. We stay abreast of the latest investment trends and ideas, using our collective insight to evaluate events and transform them into solutions you can use.
> A disciplined investment approach
We aren't distracted by passing fads. Our teams adhere to a rigorous investment process that helps ensure the integrity of our products and enables you and your financial advisor to match our solutions to your objectives with confidence.
When you choose Columbia Management, you can be confident that we will take the time to understand your needs and help you and your financial advisor identify the solutions that are right for you. Because at Columbia Management, we don't consider ourselves successful unless you are.
Sincerely,

J. Kevin Connaughton
President, Columbia Funds
Investors should consider the investment objectives, risks, charges and expenses of a mutual fund carefully before investing. For a free prospectus, which contains this and other important information about the funds, visit www.columbiamanagement.com. The prospectus should be read carefully before investing.
Columbia Funds are distributed by Columbia Management Investment Distributors, Inc., member FINRA, and managed by Columbia Management Investment Advisers, LLC.
© 2011 Columbia Management Investment Advisers, LLC. All rights reserved.
Fund Profile – Columbia California Intermediate Municipal Bond Fund
Summary
g For the 12-month period that ended March 31, 2011, the fund's Class A shares returned 2.48% without sales charge.
g The fund lagged its primary benchmark, the Barclays Capital California 3-15 Year Blend Municipal Bond Index1, as well as its secondary benchmark, the Barclays Capital 3-15 Year Blend Municipal Bond Index.2 The fund's return was higher than the average return of funds in its peer group, the Lipper California Intermediate Municipal Debt Funds Classification.3
g The fund had less exposure than the index to California State government obligation (GO) bonds, which detracted from performance relative to the primary benchmark as the group performed well during the period. However, we believe the fund had a higher allocation to state GOs than many of its peers, which benefited performance relative to that measure.
Portfolio Management
James M. D'Arcy has managed the fund since 2010. From 1999 until joining the Investment Manager in May 2010, Mr. D'Arcy was associated with the fund's previous investment adviser as an investment professional.
1The Barclays Capital California 3-15 Year Blend Municipal Bond Index tracks investment grade bonds issued from the state of California and its municipalities.
2The Barclays Capital 3-15 Year Blend Municipal Bond Index tracks the performance of municipal bonds issued after December 31, 1990 with remaining maturities between 2 and 17 years and at least $7 million in principal amount outstanding.
3Lipper Inc., a widely respected data provider in the industry, calculates an average total return (assuming reinvestment of distributions) for mutual funds with investment objectives similar to those of the fund. Lipper makes no adjustment for the effect of sales loads. Funds in the Lipper California Intermediate Municipal Debt Funds Category invest in municipal debt issues with dollar-weighted average maturities of five to ten years and are exempt from taxation in California.
Indices are not available for investment, are not professionally managed and do not reflect sales charges, fees, brokerage commissions, taxes or other expenses of investing. Securities in the fund may not match those in an index.
Performance data quoted represents past performance and current performance may be lower or higher. Past performance is no guarantee of future results. The investment return and principal value will fluctuate so that shares, when redeemed, may be worth more or less than the original cost. Please visit www.columbiamanagement.com for daily and most recent month-end performance updates.
Summary
1-year return as of 03/31/11
| | | | +2.48% | |
|
|  | | | Class A shares
(without sales charge) | |
|
| | | | +3.35% | |
|
|  | | | Barclays Capital California
3-15 Year Blend
Municipal Bond Index | |
|
| | | | +2.91% | |
|
|  | | | Barclays Capital
3-15 Year Blend
Municipal Bond Index | |
|
1
Economic Update – Columbia California Intermediate Municipal Bond Fund
Summary
For the 12-month period that ended March 31, 2011
g Strengthening economic growth and rising interest rates kept a lid on most bond market sectors. The Barclays Capital Aggregate Bond Index delivered modest results. However, high-yield bonds were strong performers, as measured by the JPMorgan Developed BB High Yield Index.
Barclays
Aggregate Index | | JPMorgan
Index | |
|
 | |  | |
|
g The U.S. stock market, as measured by the S&P 500 Index, delivered solid returns, despite a summer 2010 correction. Foreign stock market returns were also positive, as measured by the MSCI EAFE Index (Net).
| S&P Index | | MSCI Index | |
|
 | |  | |
|
The U.S. economy continued to expand at a solid but uneven pace over the past 12 months, as measured by gross domestic product (GDP). Although lackluster second quarter 2010 GDP growth raised fears that the economy was losing steam and might lapse back into recession, the pace picked up in the third quarter of 2010, inspiring confidence among consumers, businesses and investors. GDP expanded by 2.6% in the third quarter and 3.1% in the fourth quarter. With the Federal Reserve Board (the Fed) providing additional monetary stimulus to shore up economic growth and the extension of key tax cuts for the next two years, expectations are for continued growth in 2011. However, early estimates of first quarter 2011 growth place it just under 2.0%, a disappointment after two strong quarters and a pick-up in employment.
Consumer spending on cars, clothing and other goods generally trended higher during the 12-month period, accelerating in the fourth quarter of 2010. Holiday spending rose 5.5% between November 5, 2010 and December 24, 2010, in all retail categories, excluding automobiles, compared with the same period in 2009, according to MasterCard Advisors' SpendingPulse, which tracks spending on all transactions including cash. Personal income surged in January 2011, as payroll tax cuts kicked in. The personal savings rate edged higher, ending February 2011, the last month for which data was available, at 5.8%.
News on the job front was increasingly positive. A good portion of the jobs added in March, April and May of 2010 were temporary, government-sponsored census positions, which began to unwind in June, July and August 2010. However, private sector payroll employment began to trend higher in the third quarter, massive layoffs declined and job growth turned solidly positive, with the addition of 444,000 new jobs in the first quarter of 2011.
Despite some glimmers of improvement early in 2010, the housing market remained troublesome throughout the period. Both new and existing home sales fell after a federal tax credit for new and repeat homebuyers expired. Distressed properties pressured prices and foreclosures continued—another drag on prices. The inventory of unsold homes ended the period higher than it started, at 8.9 and 8.6 months for new and existing homes, respectively, according to the National Association of Realtors and a joint release from the U.S. Census Bureau and the U.S. Department of Housing and Urban Development. The new year brought more disappointing news: Existing home sales fell in January 2011 after three months of sustained improvement. Tight credit and weak appraisals were cited as possible reasons for the decline.
Reports from the business side of the economy were generally positive. A key measure of the nation's manufacturing situation—the Institute for Supply Management's Index—took a somewhat surprising turn higher in the final months of the period. Technology spending rose 12% in 2010, according to the NPD Group, a national marketing research firm. Purchases of computers, networking and software returned to prerecession levels. Industrial production rose over the period, and manufacturing capacity utilized, per the report issued by the Fed—a key measure of the health of the manufacturing sector—also edged higher.
2
Economic Update (continued) – Columbia California Intermediate Municipal Bond Fund
Bonds delivered modest returns
As the economy strengthened and interest rates edged higher, most bond sectors delivered modest returns. The Barclays Capital Aggregate Bond Index1 returned 5.12%. High-yield bonds led the fixed-income markets. For the 12 months covered by this report, the JPMorgan Developed BB High Yield Index2 returned 13.04% as default fears abated and investors grew more comfortable with risk. Despite rising yields in the second half of the period, the Treasury market was also positive. The Barclays Capital U.S. Treasury Index3 returned 4.53%. However, municipal bonds struggled in the second half of the period, as interest rates inched higher and issue supply surged ahead of the year-end expiration of the Build America Bonds program. The Barclays Capital Municipal Bond Index4 gained 1.63% for the period. Despite positive economic activity, the Fed kept a key short-term interest rate—the federal funds rate—close to zero, reflecting ongoing concerns about employment and the housing market.
Stocks moved higher despite summer 2010 decline
Against a strengthening economic backdrop, stock prices continued to rally despite a summer 2010 setback linked to a debt crisis brewing in Europe, which raised concerns among U.S. investors. These fears were short-lived and stocks regained their footing. In this environment, the S&P 500 Index5 returned 15.65% for the 12 months through March 31, 2011. Outside the United States, stock markets also delivered solid gains. The MSCI EAFE Index (Net),6 a broad gauge of stock market performance in foreign developed markets, returned 10.42% (in U.S. dollars) for the 12-month period, as concerns about the impact of a bailout for weak euro zone economies eased yet continued to restrain market performance. Emerging stock markets were strong. The MSCI Emerging Markets Index (Net)7 returned 18.46% (in U.S. dollars) for the 12-month period.
Past performance is no guarantee of future results.
1The Barclays Capital Aggregate Bond Index is a market value-weighted index that tracks the daily price, coupon, pay-downs and total return performance of fixed-rate, publicly placed, dollar-denominated and non-convertible investment grade debt issues with at least $250 million par amount outstanding and with at least one year to final maturity.
2The JPMorgan Developed BB High Yield Index is an unmanaged index designed to mirror the investable universe of the U.S. dollar developed, BB-rated, high yield corporate debt market.
3The Barclays Capital U.S. Treasury Index includes public obligations of the U.S. Treasury. Treasury bills are excluded by the maturity constraint. In addition, certain special issues, such as state and local government series bonds (SLGs), as well as U.S. Treasury TIPS, are excluded. STRIPS are excluded from the index because their inclusion would result in double-counting.
4The Barclays Capital Municipal Bond Index is considered representative of the broad market for investment-grade, tax-exempt bonds with a maturity of at least one year.
5The Standard & Poor's (S&P) 500 Index tracks the performance of 500 widely held, large-capitalization U.S. stocks.
6The Morgan Stanley Capital International Europe, Australasia, Far East (MSCI EAFE) Index (Net) is a free float- adjusted market capitalization index that is designed to measure the equity market performance of developed markets, excluding the U.S. & Canada. As of December 31, 2010, the MSCI EAFE Index (Net) consisted of the following 22 developed market country indices: Australia, Austria, Belgium, Denmark, Finland, France, Germany, Greece, Hong Kong, Ireland, Israel, Italy, Japan, the Netherlands, New Zealand, Norway, Portugal, Singapore, Spain, Sweden, Switzerland and the United Kingdom.
7The Morgan Stanley Capital International Emerging Markets (MSCI EM) Index (Net) is a free float-adjusted market capitalization index that is designed to measure equity market performance of emerging markets. As of December 31, 2010, the MSCI EM Index (Net) consisted of the following 21 emerging market country indices: Brazil, Chile, China, Colombia, Czech Republic, Egypt, Hungary, India, Indonesia, Korea, Malaysia, Mexico, Morocco, Peru, Philippines, Poland, Russia, South Africa, Taiwan, Thailand and Turkey.
Indices are not available for investment, are not professionally managed and do not reflect sales charges, fees, brokerage commissions, taxes or other expenses of investing. Securities in the fund may not match those in an index.
3
Performance Information – Columbia California Intermediate Municipal Bond Fund
Performance data quoted represents past performance and current performance may be lower or higher. Past performance is no guarantee of future results. The investment return and principal value will fluctuate so that shares, when redeemed, may be worth more or less than the original cost. Please visit www.columbiamanagement.com for daily and most recent month-end performance updates.
Performance of a $10,000 investment 09/09/02 – 03/31/11
The chart above shows the change in value of a hypothetical $10,000 investment in Class A shares of Columbia California Intermediate Municipal Bond Fund during the stated time period, and does not reflect the deduction of taxes that a shareholder may pay on fund distributions or on the redemption of fund shares.
* Barclays Capital California 3-15 Year Blend Municipal Bond Index is from August 31, 2002.
Performance of a $10,000 investment Inception – 03/31/11 ($)
| Sales charge | | without | | with | |
| Class A | | | 12,989 | | | | 12,567 | | |
| Class B | | | 12,294 | | | | 12,294 | | |
| Class C | | | 12,166 | | | | 12,166 | | |
| Class Z | | | 13,451 | | | | n/a | | |
Average annual total return as of 03/31/11 (%)
| Share class | | A | | B | | C | | Z | |
| Inception | | 09/09/02 | | 08/29/02 | | 09/11/02 | | 08/19/02 | |
| Sales charge | | without | | with | | without | | with | | without | | with | | without | |
| 1-year | | | 2.48 | | | | –0.88 | | | | 1.72 | | | | –1.26 | | | | 1.61 | | | | 0.62 | | | | 2.74 | | |
| 5-year | | | 3.75 | | | | 3.06 | | | | 2.98 | | | | 2.98 | | | | 2.95 | | | | 2.95 | | | | 4.01 | | |
| Life | | | 3.10 | | | | 2.70 | | | | 2.43 | | | | 2.43 | | | | 2.32 | | | | 2.32 | | | | 3.50 | | |
The "with sales charge" returns include the maximum initial sales charge of 3.25% for Class A shares and the applicable contingent deferred sales charge of 3.00% in the first year, declining to 1.00% in the fourth year and eliminated thereafter for Class B shares and 1.00% for Class C shares for the first year only. The "without sales charge" returns do not include the effect of sales charges. If they had, returns would be lower.
Performance results reflect any fee waivers or reimbursements of fund expenses by the Investment Manager and/or any of its affiliates. Absent these fee waivers or expense reimbursement arrangements, performance results would have been lower.
All results shown assume the reinvestment of distributions. Class Z shares are sold at net asset value with no distribution and service (Rule 12b-1) fees. Class Z shares have limited eligibility and the investment minimum requirements may vary. Please see the fund's prospectus for details. Performance for different share classes will vary based on differences in sales charges and fees associated with each class.
The tables do not reflect the deduction of taxes that a shareholder may pay on fund distributions or on the redemption of fund shares.
4
Understanding Your Expenses – Columbia California Intermediate Municipal Bond Fund
As a fund shareholder, you incur two types of costs. There are transaction costs, which generally include sales charges on purchases and may include redemption fees or exchange fees. There are also ongoing costs, which generally include investment advisory fees, distribution and service (Rule 12b-1) fees and other fund expenses. The information on this page is intended to help you understand the ongoing costs of investing in the fund and to compare these costs with the ongoing costs of investing in other mutual funds.
Analyzing your fund's expenses by share class
To illustrate these ongoing costs, we have provided an example and calculated the expenses paid by investors in each share class during the period. The information in the following table is based on an initial investment of $1,000, which is invested at the beginning of the period and held for the entire period. Expense information is calculated two ways and each method provides you with different information. The amount listed in the "Actual" column is calculated using the fund's actual operating expenses and total return for the period. The amount listed in the "Hypothetical" column for each share class assumes that the return each year is 5% before expenses and is calculated based on the fund's actual operating expenses. You should not use the hypothetical account values and expenses to estimate either your actual account balance at the end of the period or the expenses you paid during this period.
Compare with other funds
Since all mutual funds are required to include the same hypothetical calculations about expenses in shareholder reports, you can use this information to compare the ongoing cost of investing in the fund with other funds. To do so, compare the 5% hypothetical example with the 5% hypothetical examples that appear in the shareholder reports of other funds. As you compare hypothetical examples of other funds, it is important to note that hypothetical examples are meant to highlight the ongoing costs of investing in a fund and do not reflect any transaction costs, such as sales charges, redemption fees or exchange fees.
Estimating your actual expenses
To estimate the expenses that you paid over the period, first you will need your account balance at the end of the period:
g For shareholders who receive their account statements from Columbia Management Investment Services Corp., your account balance is available online at www.columbiamanagement.com or by calling Shareholder Services at 800.345.6611.
g For shareholders who receive their account statements from their financial intermediary, contact your financial intermediary to obtain your account balance.
1. Divide your ending account balance by $1,000. For example, if an account balance was $8,600 at the end of the period, the result would be 8.6.
2. In the section of the table below titled "Expenses paid during the period," locate the amount for your share class. You will find this number in the column labeled "Actual." Multiply this number by the result from step 1. Your answer is an estimate of the expenses you paid on your account during the period.
If the value of your account falls below the minimum initial investment requirement applicable to you, your account may be subject to a $20 annual fee. This fee is not included in the accompanying table. If you are subject to the fee, keep it in mind when you are estimating the ongoing expenses of investing in the fund and when comparing the expenses of this fund with other funds.
10/01/10 – 03/31/11
| | | Account value at the
beginning of the period ($) | | Account value at the
end of the period ($) | | Expenses paid
during the period ($) | | Fund's annualized
expense ratio (%) | |
| | | Actual | | Hypothetical | | Actual | | Hypothetical | | Actual | | Hypothetical | | Actual | |
| Class A | | | 1,000.00 | | | | 1,000.00 | | | | 968.00 | | | | 1,020.94 | | | | 3.93 | | | | 4.03 | | | | 0.80 | | |
| Class B | | | 1,000.00 | | | | 1,000.00 | | | | 965.30 | | | | 1,017.20 | | | | 7.59 | | | | 7.80 | | | | 1.55 | | |
| Class C | | | 1,000.00 | | | | 1,000.00 | | | | 964.40 | | | | 1,017.20 | | | | 7.59 | | | | 7.80 | | | | 1.55 | | |
| Class Z | | | 1,000.00 | | | | 1,000.00 | | | | 970.10 | | | | 1,022.19 | | | | 2.70 | | | | 2.77 | | | | 0.55 | | |
Expenses paid during the period are equal to the annualized expense ratio for the share class, multiplied by the average account value over the period, then multiplied by the number of days in the fund's most recent fiscal half-year and divided by 365.
Had the Investment Manager and/or any of its affiliates not waived fees or reimbursed a portion of expenses, account value at the end of the period would have been reduced.
It is important to note that the expense amounts shown in the table are meant to highlight only ongoing costs of investing in the fund and do not reflect any transaction costs, such as sales charges, redemption fees or exchange fees. Therefore, the hypothetical examples provided may not help you determine the relative total costs of owning shares of different funds. If these transaction costs were included, your costs would have been higher.
5
Portfolio Manager's Report – Columbia California Intermediate Municipal Bond Fund
Performance data quoted represents past performance and current performance may be lower or higher. Past performance is no guarantee of future results. The investment return and principal value will fluctuate so that shares, when redeemed, may be worth more or less than the original cost. Please visit www.columbiamanagement.com for daily and most recent month-end performance updates.
Net asset value per share
as of 03/31/11 ($)
| Class A | | | 9.65 | | |
| Class B | | | 9.64 | | |
| Class C | | | 9.64 | | |
| Class Z | | | 9.63 | | |
Distribution declared per share
04/01/10 – 03/31/11 ($)
| Class A | | | 0.31 | | |
| Class B | | | 0.24 | | |
| Class C | | | 0.24 | | |
| Class Z | | | 0.34 | | |
A portion of the fund's income may be subject to the alternative minimum tax. The fund may at times purchase tax-exempt securities at a discount. Some or all of this discount may be included in the fund's ordinary income, and is taxable when distributed.
30-day SEC yields
as of 03/31/11 (%)
| Class A | | | 2.88 | | |
| Class B | | | 2.22 | | |
| Class C | | | 2.22 | | |
| Class Z | | | 3.23 | | |
The 30-day SEC yields reflect the fund's earning power, net of expenses, expressed as an annualized percentage of the public offering price per share at the end of the period.
Taxable-equivalent SEC yields
as of 03/31/11 (%)
| Class A | | | 4.95 | | |
| Class B | | | 3.82 | | |
| Class C | | | 3.82 | | |
| Class Z | | | 5.55 | | |
Taxable-equivalent SEC yields are based on the combined maximum effective 35.0% federal income tax rate and applicable state income tax rate. This tax rate does not reflect the phase out of exemptions or the reduction of the otherwise allowable deductions that occur when adjusted gross income exceeds certain levels. Your taxable-equivalent yield may be different depending on your tax bracket.
For the 12-month period that ended March 31, 2011, the fund's Class A shares returned 2.48% without sales charge. The fund's primary benchmark, the Barclays Capital California 3-15 Year Blend Municipal Bond Index, returned 3.35%. Its secondary benchmark, the Barclays Capital 3-15 Year Blend Municipal Bond Index, returned 2.91%. The fund's return was higher than the 1.71% average return of funds in its peer group, the Lipper California Intermediate Municipal Debt Funds Classification. An underweight in California State general obligation (GO) bonds, which were strong performers, detracted from performance versus the fund's primary benchmark. However, we believe the fund had a higher allocation to California GOs than many of its peers, which benefited performance.
Gains from maturity and sector positioning
An overweight in bonds with eight- to 12-year maturities and an underweight in bonds with maturities longer than 12 years helped performance. Longer-maturity municipal bond prices fell late in 2010 amid concerns over the year-end expiration of the federally subsidized Build America Bonds (BABs) program—a less expensive way for qualifying municipal issuers to finance infrastructure projects. Investors anticipated an increase in long-term municipal issuance when the program expired, which led to heavy selling in the sector. Elsewhere, exposure to health care bonds, particularly higher quality issues, further aided results. An added boost came from industrial development bonds backed by BP (0.9% of net assets), which we purchased at attractive prices after the Gulf of Mexico oil disaster. By period end, the BP bonds had posted strong returns.
Lost ground from GO allocation
To provide adequate diversification and risk control, the fund had a much lower stake in California state GOs than the roughly 25% weight in the Barclays California benchmark. This underweight detracted from performance, as the sector posted strong gains driven by low supply. Some of these losses were offset by strong security selection within the sector. The fund also lost ground from the addition of some longer-maturity (10- to 15-year) transportation bonds. We focused on higher quality airport securities, which underperformed late last year as issuers raced to market to avoid being subject to the alternative minimum tax (or AMT) in 2011. The AMT, which is not indexed to inflation, applies to certain income earned by high income tax payers. Since we try to minimize AMT exposure, we viewed this supply increase as a unique buying opportunity.
Changes to interest-rate positioning
Over much of the year, the fund had more sensitivity to interest rate changes than the Barclays California index, which helped performance as interest rates edged lower. (The more sensitive a bond is to interest rate changes, the more its price will rise as interest rates fall—or fall as interest rates rise.) We reduced interest-rate sensitivity shortly before the fourth quarter 2010 sell-off, which also was positive for performance. Late in the period, we took advantage of buying opportunities created by the expiration of the BABs program and added to the fund's stake in 10- to 15-year bonds. We also purchased some high quality (AA and A rated1) hospital bonds with very attractive yields during the first quarter of 2011.
1The credit quality ratings represent the lower of one of the following nationally recognized rating agencies: Standard & Poor's or Moody's Investor Services. If a security is rated by only one of the two agencies, that rating is used. If a security is not rated by either of the two agencies, it is designated as Non-Rated. Ratings are relative and subjective and are not absolute standards of quality. The credit quality of the fund's investments does not remove market risk.
6
Portfolio Manager's Report (continued) – Columbia California Intermediate Municipal Bond Fund
Mixed outlook for California
California faces another severe budget crisis, which will most likely be resolved through a combination of spending cuts and the extension of temporary tax hikes. Most observers expect the budget process to draw out until late in 2011, which would delay new issuance and reduce overall municipal bond supply. However, the state is seeing signs of improvement. Although corporate income tax revenues have fallen short of projections, revenues from personal income taxes have exceeded estimates. We expect municipal bonds to benefit as the state's economy slowly improves. In anticipation of an eventual hike in short-term interest rates, we plan to reduce the fund's sensitivity to interest-rate changes by adjusting maturity allocations. We may also increase exposure to shorter-maturity callable (or redeemable) bonds, which typically outperform similar maturity non-callable issues in a rising interest-rate environment.
Portfolio characteristics and holdings are subject to change periodically and may not be representative of current characteristics and holdings. The outlook for the fund may differ from that presented for other Columbia Funds.
Tax-exempt investing offers current tax-exempt income, but it also involves certain risks. The value of the fund will be affected by interest rate changes and the creditworthiness of issues held in the fund. When interest rates go up, bond prices generally drop and vice versa.
Interest income from certain tax-exempt bonds may be subject to certain state and local taxes and, if applicable, the alternative minimum tax. Capital gains are not exempt from income taxes.
Single-state municipal bond funds pose additional risks due to limited geographical diversification.
Top 5 sectors
as of 03/31/11 (%)
| Tax-Backed | | | 41.1 | | |
| Utilities | | | 23.8 | | |
| Health Care | | | 10.2 | | |
| Transportation | | | 6.5 | | |
| Education | | | 5.7 | | |
Maturity breakdown
as of 03/31/11 (%)
| 0-1 year | | | 0.4 | | |
| 1-3 years | | | 13.6 | | |
| 3-5 years | | | 10.1 | | |
| 5-7 years | | | 9.5 | | |
| 7-10 years | | | 14.8 | | |
| 10-15 years | | | 37.5 | | |
| 15-20 years | | | 9.0 | | |
| 25 years and over | | | 0.7 | | |
| Net Cash and Equivalents | | | 4.4 | | |
Quality breakdown
as of 03/31/11 (%)
| AAA | | | 7.5 | | |
| AA | | | 46.9 | | |
| A | | | 35.5 | | |
| BBB | | | 5.6 | | |
| BB | | | 0.7 | | |
| Non-Rated | | | 3.8 | | |
Ratings shown in the quality breakdown are assigned to individual bonds by taking the lower of the ratings available from one of the following nationally recognized rating agencies: Standard & Poor's or Moody's Investor Services. If a security is rated by only one of the two agencies, that rating is used. If a security is not rated by either of the two agencies, it is designated as Non-Rated. Ratings are relative and subjective and are not absolute standards of quality. The credit quality of the fund's investments does not remove market risk.
The fund is actively managed and the composition of its portfolio will change over time. Information provided is calculated as a percentage of net assets.
7
Investment Portfolio – Columbia California Intermediate Municipal Bond Fund
March 31, 2011
| Municipal Bonds – 94.1% | |
| | | Par ($) | | Value ($) | |
| Education – 5.7% | |
| Education – 5.7% | |
| CA Educational Facilities Authority | |
Pitzer College:
Series 2005 A,
5.000% 04/01/25 | | | 1,270,000 | | | | 1,208,557 | | |
Series 2009,
5.000% 04/01/19 | | | 1,610,000 | | | | 1,654,871 | | |
University of Southern California,
Series 2009,
5.250% 10/01/24 | | | 3,000,000 | | | | 3,368,910 | | |
| CA Public Works Board | |
California State University,
Series 2006 A, Insured: NPFGC
5.000% 10/01/16 | | | 1,000,000 | | | | 1,067,850 | | |
University of California:
Series 2005 C,
5.000% 04/01/16 | | | 1,000,000 | | | | 1,073,100 | | |
Series 2005 D,
5.000% 05/01/15 | | | 1,000,000 | | | | 1,087,170 | | |
| CA State University | |
Series 2009 A,
5.250% 11/01/22 | | | 2,500,000 | | | | 2,609,950 | | |
| CA University of California | |
Series 2009 O,
5.000% 05/15/20 | | | 1,000,000 | | | | 1,109,540 | | |
| Education Total | | | 13,179,948 | | |
| Education Total | | | 13,179,948 | | |
| Health Care – 10.2% | |
| Continuing Care Retirement – 1.5% | |
CA ABAG Finance Authority for
Nonprofit Corporations | |
Series 2010,
Insured: CMI
4.000% 09/01/15 | | | 1,500,000 | | | | 1,547,775 | | |
| CA Health Facilities Financing Authority | |
Episcopal Senior Communities,
Series 2010 B,
5.100% 02/01/19 | | | 920,000 | | | | 923,413 | | |
Nevada Methodist Homes,
Series 2006,
Insured: CMI
5.000% 07/01/26 | | | 1,000,000 | | | | 932,120 | | |
| Continuing Care Retirement Total | | | 3,403,308 | | |
| | | Par ($) | | Value ($) | |
| Hospitals – 8.7% | |
CA ABAG Finance Authority for
Nonprofit Corporations | |
Sharp Healthcare,
Series 2011 A,
5.250% 08/01/24 | | | 2,750,000 | | | | 2,685,430 | | |
| CA Health Facilities Financing Authority | |
Catholic Healthcare West:
Series 2009 A,
6.000% 07/01/29 | | | 1,250,000 | | | | 1,266,887 | | |
Series 2009 E,
5.625% 07/01/25 | | | 1,500,000 | | | | 1,523,085 | | |
Children's Hospital Orange County,
Series 2009 A,
6.000% 11/01/21 | | | 2,000,000 | | | | 2,098,260 | | |
| CA Loma Linda | |
Loma Linda University Medical Center,
Series 2005,
5.000% 12/01/18 | | | 1,000,000 | | | | 922,390 | | |
| CA Municipal Finance Authority | |
Community Hospitals of Central California,
Series 2007,
5.000% 02/01/13 | | | 1,150,000 | | | | 1,181,660 | | |
| CA Newport Beach | |
Hoag Memorial Hospital Presbyterian,
Series 2011,
5.875% 12/01/30 | | | 1,000,000 | | | | 1,017,750 | | |
CA Rancho Mirage Joint Powers
Financing Authority | |
Eisenhower Medical Center,
Series 1997 B,
Insured: NPFGC
4.875% 07/01/22 | | | 1,500,000 | | | | 1,414,785 | | |
CA Statewide Communities
Development Authority | |
Adventist Health System West,
Series 2005 A,
5.000% 03/01/17 | | | 1,000,000 | | | | 1,036,550 | | |
Cottage Health System Obligation,
Series 2010:
5.000% 11/01/16 | | | 250,000 | | | | 270,390 | | |
| 5.000% 11/01/18 | | | 500,000 | | | | 533,425 | | |
John Muir Health,
Series 2006 A,
5.000% 08/15/17 | | | 3,000,000 | | | | 3,127,980 | | |
Kaiser Permanente,
Series 2009 A,
5.000% 04/01/19 | | | 2,000,000 | | | | 2,115,840 | | |
See Accompanying Notes to Financial Statements.
8
Columbia California Intermediate Municipal Bond Fund
March 31, 2011
| Municipal Bonds (continued) | |
| | | Par ($) | | Value ($) | |
Sutter Health,
Series 2011 A,
5.500% 08/15/26 | | | 1,000,000 | | | | 992,150 | | |
| Hospitals Total | | | 20,186,582 | | |
| Health Care Total | | | 23,589,890 | | |
| Housing – 0.4% | |
| Single-Family – 0.4% | |
| CA Department of Veteran Affairs | |
Series 2006,
4.500% 12/01/23 | | | 1,000,000 | | | | 939,470 | | |
| Single-Family Total | | | 939,470 | | |
| Housing Total | | | 939,470 | | |
| Industrials – 1.7% | |
| Oil & Gas – 1.7% | |
| CA Pollution Control Financing Authority | |
BP West Coast Products LLC,
Series 2009,
2.600% 12/01/46
(09/02/14) (a)(b) | | | 2,000,000 | | | | 1,995,560 | | |
| CA M-S-R Energy Authority | |
Series 2009,
6.125% 11/01/29 | | | 2,000,000 | | | | 1,994,380 | | |
| Industrials Total | | | 3,989,940 | | |
| Other – 4.3% | |
| Other – 1.5% | |
CA Infrastructure & Economic
Development Bank | |
California Science Center,
Series 2006 B,
Insured: NPFGC:
5.000% 05/01/22 | | | 1,360,000 | | | | 1,297,984 | | |
| 5.000% 05/01/23 | | | 1,240,000 | | | | 1,164,261 | | |
CA Statewide Communities
Development Authority | |
The California Endowment,
Series 2003,
5.000% 07/01/13 | | | 1,000,000 | | | | 1,085,720 | | |
| Other Total | | | 3,547,965 | | |
| Refunded/Escrowed (c) – 1.8% | |
CA Golden State Tobacco
Securitization Corp. | |
Series 2003 A1,
Pre-refunded 06/01/13,
6.625% 06/01/40 | | | 1,485,000 | | | | 1,668,011 | | |
| | | Par ($) | | Value ($) | |
Series 2003 B,
Pre-refunded 06/01/13,
5.625% 06/01/38 | | | 1,500,000 | | | | 1,652,745 | | |
| CA Orange County Water District | |
Series 2003 B,
Pre-refunded 08/15/13,
Insured: NPFGC
5.375% 08/15/17 | | | 650,000 | | | | 722,521 | | |
| Refunded/Escrowed Total | | | 4,043,277 | | |
| Tobacco – 1.0% | |
CA California County Tobacco
Securitization Agency | |
Series 2006,
5.250% 06/01/21 | | | 1,000,000 | | | | 888,130 | | |
CA Golden State Tobacco
Securitization Corp. | |
Series 2005 A,
Insured: AMBAC
5.000% 06/01/14 | | | 1,250,000 | | | | 1,323,075 | | |
| Tobacco Total | | | 2,211,205 | | |
| Other Total | | | 9,802,447 | | |
| Resource Recovery – 0.4% | |
| Resource Recovery – 0.4% | |
| CA Los Angeles Sanitation Equipment | |
Series 2005,
Insured: NPFGC
5.000% 02/01/13 | | | 1,000,000 | | | | 1,073,570 | | |
| Resource Recovery Total | | | 1,073,570 | | |
| Resource Recovery Total | | | 1,073,570 | | |
| Tax-Backed – 41.1% | |
| Local Appropriated – 10.0% | |
| CA City & County of San Francisco | |
Series 2009 B,
5.000% 04/01/24 | | | 1,495,000 | | | | 1,514,674 | | |
| CA County of Monterey | |
Series 2009,
Insured: AGMC
5.000% 08/01/17 | | | 1,000,000 | | | | 1,067,750 | | |
| CA County of San Diego | |
Certificates of Participation,
Series 2001,
Insured: AMBAC
5.000% 11/01/11 | | | 1,000,000 | | | | 1,003,400 | | |
See Accompanying Notes to Financial Statements.
9
Columbia California Intermediate Municipal Bond Fund
March 31, 2011
| Municipal Bonds (continued) | |
| | | Par ($) | | Value ($) | |
CA Golden Empire Schools
Financing Authority | |
Series 2010,
4.000% 05/01/12 | | | 2,500,000 | | | | 2,561,075 | | |
| CA Kings River Conservation District | |
Series 2004,
5.000% 05/01/14 | | | 3,135,000 | | | | 3,356,488 | | |
CA Los Angeles Community
Redevelopment Agency | |
Series 2005,
Insured: AMBAC
5.000% 09/01/15 | | | 1,095,000 | | | | 1,163,952 | | |
CA Los Angeles County Capital Asset
Leasing Corp. | |
Series 2002 B,
Insured: AMBAC
6.000% 12/01/12 | | | 1,000,000 | | | | 1,042,060 | | |
CA Los Angeles Municipal
Improvement Corp. | |
Series 2002 G,
Insured: NPFGC
5.250% 09/01/13 | | | 1,500,000 | | | | 1,603,515 | | |
CA Oakland Joint Powers
Financing Authority | |
Series 2008 B,
Insured: AGC
5.000% 08/01/22 | | | 2,000,000 | | | | 2,035,620 | | |
| CA Pasadena Public Financing Authority | |
Series 2010 A,
5.000% 03/01/26 | | | 2,500,000 | | | | 2,513,500 | | |
| CA Pico Rivera Public Financing Authority | |
Series 2009,
5.250% 09/01/26 | | | 1,085,000 | | | | 1,095,980 | | |
CA Richmond Joint Powers
Financing Authority | |
Series 2009,
Insured: AGC
5.000% 08/01/17 | | | 1,570,000 | | | | 1,672,725 | | |
CA San Mateo County Joint Powers
Financing Authority | |
Series 2008 A,
5.000% 07/15/20 | | | 435,000 | | | | 448,907 | | |
| CA Santa Clara County Financing Authority | |
Series 2010 N,
5.000% 05/15/17 | | | 1,000,000 | | | | 1,100,840 | | |
| | | Par ($) | | Value ($) | |
| CA Vista | |
Series 2007,
Insured: NPFGC
4.750% 05/01/21 | | | 750,000 | | | | 739,575 | | |
| Local Appropriated Total | | | 22,920,061 | | |
| Local General Obligations – 10.7% | |
| CA City & County of San Francisco | |
Series 2010 E,
5.000% 06/15/27 | | | 3,380,000 | | | | 3,439,657 | | |
CA Culver City School Facilities
Financing Authority | |
Series 2005,
Insured: AGMC
5.500% 08/01/23 | | | 1,490,000 | | | | 1,623,996 | | |
| CA East Bay Municipal Utility District | |
Series 2003 F,
Insured: AMBAC
5.000% 04/01/15 | | | 1,000,000 | | | | 1,066,110 | | |
| CA East Side Union High School District | |
Series 2006,
Insured: AGMC
5.250% 09/01/20 | | | 1,280,000 | | | | 1,413,248 | | |
| CA Long Beach Unified School District | |
Series 2009 A,
5.250% 08/01/21 | | | 1,750,000 | | | | 1,934,712 | | |
| CA Los Angeles Unified School District | |
Series 2003 F,
Insured: AGMC
5.000% 07/01/18 | | | 1,275,000 | | | | 1,352,788 | | |
Series 2006 G,
Insured: AMBAC
5.000% 07/01/20 | | | 1,000,000 | | | | 1,056,410 | | |
| CA Los Angeles | |
Series 2004 A,
Insured: NPFGC
4.000% 09/01/13 | | | 1,000,000 | | | | 1,069,680 | | |
| CA Palomar Community College District | |
Series 2010 B,
(d) 08/01/22 | | | 2,140,000 | | | | 1,100,987 | | |
CA Rancho Santiago Community
College District | |
Series 2005,
Insured: AGMC
5.250% 09/01/19 | | | 1,000,000 | | | | 1,139,340 | | |
See Accompanying Notes to Financial Statements.
10
Columbia California Intermediate Municipal Bond Fund
March 31, 2011
| Municipal Bonds (continued) | |
| | | Par ($) | | Value ($) | |
| CA Rescue Unified School District | |
Series 2005,
Insured: NPFGC
(d) 09/01/26 | | | 1,100,000 | | | | 394,108 | | |
| CA San Diego Unified School District | |
Series 2004 F,
Insured: AGMC
5.000% 07/01/21 | | | 1,645,000 | | | | 1,696,143 | | |
CA San Mateo County Community
College District | |
Series 2006 A,
Insured: NPFGC
(d) 09/01/15 | | | 1,000,000 | | | | 877,380 | | |
CA San Mateo Foster City School Facilities
Financing Authority | |
Series 2005,
Insured: AGMC
5.500% 08/15/19 | | | 2,000,000 | | | | 2,323,160 | | |
CA San Ramon Valley Unified
School District | |
Series 2004,
Insured: AGMC
5.250% 08/01/16 | | | 1,800,000 | | | | 1,958,202 | | |
| CA Saugus Union School District | |
Series 2006,
Insured: NPFGC
5.250% 08/01/21 | | | 1,000,000 | | | | 1,092,760 | | |
| CA Simi Valley School Financing Authority | |
Series 2007,
Insured: AGMC
5.000% 08/01/18 | | | 1,045,000 | | | | 1,179,053 | | |
| Local General Obligations Total | | | 24,717,734 | | |
| Special Non-Property Tax – 2.6% | |
| CA Economic Recovery | |
Series 2004 A,
Insured: NPFGC
5.250% 07/01/14 | | | 1,000,000 | | | | 1,114,110 | | |
Series 2009 A,
5.000% 07/01/18 | | | 3,000,000 | | | | 3,351,930 | | |
| VI Virgin Islands Public Finance Authority | |
Series 2010 A,
5.000% 10/01/20 | | | 1,490,000 | | | | 1,545,905 | | |
| Special Non-Property Tax Total | | | 6,011,945 | | |
| | | Par ($) | | Value ($) | |
| Special Property Tax – 3.6% | |
CA Culver City Redevelopment
Finance Authority | |
Series 1993,
Insured: AMBAC
5.500% 11/01/14 | | | 1,420,000 | | | | 1,451,680 | | |
| CA Indian Wells Redevelopment Agency | |
Series 2003 A,
Insured: AMBAC
5.000% 09/01/14 | | | 450,000 | | | | 455,490 | | |
| CA Long Beach Bond Finance Authority | |
Series 2002 B,
Insured: AMBAC
5.500% 11/01/19 | | | 1,070,000 | | | | 1,051,029 | | |
| CA Oakland Redevelopment Agency | |
Series 1992,
Insured: AMBAC
5.500% 02/01/14 | | | 1,945,000 | | | | 1,963,263 | | |
| CA Redwood City Redevelopment Agency | |
Series 2003 A,
Insured: AMBAC
5.250% 07/15/13 | | | 1,000,000 | | | | 1,025,830 | | |
CA San Francisco City & County
Redevelopment Agency | |
Series 2009,
5.000% 08/01/18 | | | 1,255,000 | | | | 1,222,985 | | |
| CA Tustin Community Redevelopment Agency | |
Series 2010,
5.000% 09/01/25 | | | 1,250,000 | | | | 1,074,075 | | |
| Special Property Tax Total | | | 8,244,352 | | |
| State Appropriated – 6.8% | |
CA Bay Area Infrastructure
Financing Authority | |
Series 2006:
Insured: NPFGC
5.000% 08/01/17 | | | 2,000,000 | | | | 2,028,540 | | |
Insured: SYNC
5.000% 08/01/17 | | | 2,000,000 | | | | 2,019,940 | | |
| CA Public Works Board | |
Series 2005 A,
5.000% 06/01/15 | | | 1,200,000 | | | | 1,284,156 | | |
Series 2006 A,
5.000% 04/01/28 | | | 1,000,000 | | | | 912,240 | | |
Series 2009,
5.000% 11/01/17 | | | 2,000,000 | | | | 2,113,260 | | |
Series 2010 A-1,
5.250% 03/01/22 | | | 2,000,000 | | | | 2,014,060 | | |
See Accompanying Notes to Financial Statements.
11
Columbia California Intermediate Municipal Bond Fund
March 31, 2011
| Municipal Bonds (continued) | |
| | | Par ($) | | Value ($) | |
| CA San Francisco Building Authority | |
Series 2005 A,
5.000% 12/01/12 | | | 3,000,000 | | | | 3,133,680 | | |
CA Statewide Communities
Development Authority | |
Series 2009,
5.000% 06/15/13 | | | 2,000,000 | | | | 2,129,880 | | |
| State Appropriated Total | | | 15,635,756 | | |
| State General Obligations – 7.4% | |
| CA State | |
Series 2007:
4.500% 08/01/26 | | | 1,000,000 | | | | 903,020 | | |
| 5.000% 08/01/18 | | | 3,750,000 | | | | 4,063,650 | | |
| 5.000% 12/01/26 | | | 2,000,000 | | | | 1,991,260 | | |
Series 2009:
5.250% 10/01/29 | | | 1,500,000 | | | | 1,502,040 | | |
| 5.625% 04/01/26 | | | 2,000,000 | | | | 2,076,260 | | |
Series 2010,
5.000% 11/01/24 | | | 5,000,000 | | | | 5,051,400 | | |
| PR Commonwealth of Puerto Rico | |
Series 2007 A,
Insured: FGIC
5.500% 07/01/21 | | | 1,500,000 | | | | 1,521,585 | | |
| State General Obligations Total | | | 17,109,215 | | |
| Tax-Backed Total | | | 94,639,063 | | |
| Transportation – 6.5% | |
| Airports – 4.6% | |
| CA Los Angeles Department of Airports | |
Series 2009 A,
5.250% 05/15/22 | | | 1,855,000 | | | | 1,990,675 | | |
| CA Orange County | |
Series 2009 A,
5.250% 07/01/25 | | | 1,500,000 | | | | 1,559,925 | | |
| CA Sacramento County Airport Systems | |
Series 2008 A,
Insured: AGMC
5.000% 07/01/23 | | | 1,000,000 | | | | 1,005,660 | | |
CA San Diego County Regional
Airport Authority | |
Series 2010 A,
5.000% 07/01/24 | | | 1,000,000 | | | | 979,070 | | |
| | | Par ($) | | Value ($) | |
CA San Francisco City & County
Airports Commission | |
Series 2003 B,
Insured: NPFGC
5.250% 05/01/13 | | | 2,000,000 | | | | 2,147,860 | | |
Series 2009 C,
Insured: AGMC
5.000% 05/01/18 | | | 1,825,000 | | | | 2,001,003 | | |
| CA San Jose Airport | |
Series 2007,
Insured: AMBAC
5.000% 03/01/22 | | | 1,000,000 | | | | 1,014,470 | | |
| Airports Total | | | 10,698,663 | | |
| Ports – 0.9% | |
| CA Los Angeles Harbor Department | |
Series 2009 A,
5.250% 08/01/23 | | | 2,000,000 | | | | 2,130,480 | | |
| Ports Total | | | 2,130,480 | | |
| Toll Facilities – 0.5% | |
| CA Bay Area Toll Authority | |
Series 2006 F,
5.000% 04/01/22 | | | 1,100,000 | | | | 1,175,889 | | |
| Toll Facilities Total | | | 1,175,889 | | |
| Transportation – 0.5% | |
| CA Department of Transportation | |
Series 2004 A,
Insured: NPFGC
4.500% 02/01/13 | | | 1,000,000 | | | | 1,063,050 | | |
| Transportation Total | | | 1,063,050 | | |
| Transportation Total | | | 15,068,082 | | |
| Utilities – 23.8% | |
| Independent Power Producers – 1.4% | |
| CA Sacramento Power Authority | |
Series 2005,
Insured: AMBAC
5.250% 07/01/15 | | | 3,000,000 | | | | 3,199,980 | | |
| Independent Power Producers Total | | | 3,199,980 | | |
| Joint Power Authority – 7.2% | |
CA Infrastructure & Economic
Development Bank | |
California Independent System Operator Corp.,
Series 2009 A,
5.250% 02/01/22 | | | 1,900,000 | | | | 1,942,560 | | |
See Accompanying Notes to Financial Statements.
12
Columbia California Intermediate Municipal Bond Fund
March 31, 2011
| Municipal Bonds (continued) | |
| | | Par ($) | | Value ($) | |
| CA M-S-R Public Power Agency | |
Series 2008 L,
Insured: AGMC
5.000% 07/01/21 | | | 2,500,000 | | | | 2,646,150 | | |
| CA Northern California Power Agency | |
Series 2008 1C,
Insured: AGC
5.000% 07/01/22 | | | 3,000,000 | | | | 3,166,710 | | |
CA Southern California Public
Power Authority | |
Series 1989,
6.750% 07/01/13 | | | 3,000,000 | | | | 3,335,340 | | |
Series 2005 A,
Insured: AGMC
5.000% 01/01/18 | | | 2,000,000 | | | | 2,144,060 | | |
Series 2008 A,
5.000% 07/01/22 | | | 2,000,000 | | | | 2,111,140 | | |
Series 2008 B,
6.000% 07/01/27 | | | 1,000,000 | | | | 1,079,640 | | |
| Joint Power Authority Total | | | 16,425,600 | | |
| Municipal Electric – 8.6% | |
| CA Anaheim Public Financing Authority | |
Series 1999,
Insured: AMBAC
5.000% 10/01/13 | | | 1,500,000 | | | | 1,595,670 | | |
| CA Department of Water Resources | |
Series 2002 G 11,
5.000% 05/01/18 | | | 2,000,000 | | | | 2,244,960 | | |
| CA Imperial Irrigation District | |
Series 2008,
5.250% 11/01/21 | | | 2,500,000 | | | | 2,647,725 | | |
CA Los Angeles Department of
Water & Power | |
Series 2007 A Sub-Series A-1,
Insured: AMBAC
5.000% 07/01/19 | | | 1,000,000 | | | | 1,083,850 | | |
Series 2009,
5.250% 07/01/23 | | | 2,000,000 | | | | 2,143,580 | | |
| CA Modesto Irrigation District | |
Series 2001 A,
Insured: AGMC
5.250% 07/01/18 | | | 1,185,000 | | | | 1,214,033 | | |
| CA Riverside | |
Series 2008 D,
Insured: AGMC
5.000% 10/01/23 | | | 1,000,000 | | | | 1,033,590 | | |
| | | Par ($) | | Value ($) | |
| CA Sacramento Municipal Utility District | |
Series 2006,
Insured: NPFGC
5.000% 07/01/15 | | | 1,000,000 | | | | 1,052,850 | | |
Series 2008 U,
Insured: AGMC
5.000% 08/15/21 | | | 2,500,000 | | | | 2,670,975 | | |
| CA Santa Clara | |
Series 2011 A,
5.375% 07/01/29 | | | 1,000,000 | | | | 992,450 | | |
| CA Tuolumne Wind Project Authority | |
Series 2009 A,
5.000% 01/01/22 | | | 1,000,000 | | | | 1,040,310 | | |
| CA Walnut Energy Center Authority | |
Series 2004 A,
Insured: AMBAC
5.000% 01/01/16 | | | 2,055,000 | | | | 2,149,324 | | |
| Municipal Electric Total | | | 19,869,317 | | |
| Water & Sewer – 6.6% | |
| CA Clovis Public Financing Authority | |
Series 2007,
Insured: AMBAC
5.000% 08/01/21 | | | 1,000,000 | | | | 1,029,060 | | |
| CA Fresno | |
Series 2008 A,
Insured: AGC
5.000% 09/01/23 | | | 1,000,000 | | | | 1,047,700 | | |
CA Kern County Water Agency
Improvement District No. 004 | |
Series 2008 A,
Insured: AGC
5.000% 05/01/22 | | | 2,020,000 | | | | 2,099,729 | | |
CA Los Angeles Waste Water
System Authority | |
Series 2009 A,
5.750% 06/01/25 | | | 2,000,000 | | | | 2,204,480 | | |
CA Sacramento County Sanitation Districts
Financing Authority | |
Series 2005,
Insured: NPFGC
5.000% 08/01/22 | | | 2,840,000 | | | | 2,980,268 | | |
Series 2006,
Insured: NPFGC
5.000% 12/01/17 | | | 1,000,000 | | | | 1,116,270 | | |
See Accompanying Notes to Financial Statements.
13
Columbia California Intermediate Municipal Bond Fund
March 31, 2011
| Municipal Bonds (continued) | |
| | | Par ($) | | Value ($) | |
CA San Diego Public Facilities
Financing Authority | |
Series 2009 B,
5.250% 05/15/25 | | | 1,500,000 | | | | 1,573,665 | | |
Series 2010,
5.000% 08/01/24 | | | 2,000,000 | | | | 2,088,120 | | |
CA San Francisco City & County Public
Utilities Commission | |
Series 2003 A,
Insured: NPFGC
5.000% 10/01/13 | | | 1,000,000 | | | | 1,068,240 | | |
| Water & Sewer Total | | | 15,207,532 | | |
| Utilities Total | | | 54,702,429 | | |
Total Municipal Bonds
(cost of $214,908,285) | | | 216,984,839 | | |
| Municipal Preferred Stock – 0.7% | |
| | | Shares | | | |
| Housing – 0.7% | |
| Multi-Family – 0.7% | |
| Munimae Tax-Exempt Bond Subsidiary LLC | |
Series 2004 A-2,
4.900% 06/30/49
(09/30/14) (a)(b)(e) | | | 2,000,000 | | | | 1,609,940 | | |
| Multi-Family Total | | | 1,609,940 | | |
| Housing Total | | | 1,609,940 | | |
Total Municipal Preferred Stock
(cost of $2,000,000) | | | 1,609,940 | | |
| Investment Companies – 3.0% | |
BofA California Tax-Exempt Reserves,
Capital Class
(7 day yield of 0.120%) (f) | | | 4,263,226 | | | | 4,263,226 | | |
Dreyfus General California
Municipal Money Market Fund
(7 day yield of 0.000%) | | | 2,550,000 | | | | 2,550,000 | | |
Total Investment Companies
(cost of $6,813,226) | | | 6,813,226 | | |
Total Investments – 97.8%
(cost of $223,721,511) (g) | | | 225,408,005 | | |
| Other Assets & Liabilities, Net – 2.2% | �� | | 4,971,925 | | |
| Net Assets – 100.0% | | | 230,379,930 | | |
See Accompanying Notes to Financial Statements.
Notes to Investment Portfolio:
(a) The interest rate shown on floating rate or variable rate securities reflects the rate at March 31, 2011.
(b) Parenthetical date represents the next interest rate reset date for the security.
(c) The Fund has been informed that each issuer has placed direct obligations of the U.S. Government in an irrevocable trust, solely for the payment of principal and interest.
(d) Zero coupon bond.
(e) Security exempt from registration pursuant to Rule 144A under the Securities Act of 1933. This security may be resold in transactions exempt from registration, normally to qualified institutional buyers. At March 31, 2011, this security, which is not illiquid, amounted to $1,609,940, which represents 0.7% of net assets.
(f) Investments in affiliates during the year ended March 31, 2011:
| Affiliate | | Value,
beginning
of period | | Purchases | | Sales
Proceeds | | Dividend
Income | | Value,
end of
period | |
BofA California
Tax-Exempt
Reserves,
Capital Class
(7 day yield of
0.120%) | | $ | 8,127,933 | | | $ | 8,049,631 | | | $ | 11,430,000 | | | $ | 368 | | | $ | — | | |
As of May 1, 2010, this company was no longer an affiliate of the Fund. The above table reflects activity for the period from April 1, 2010 through April 30, 2010.
(g) Cost for federal income tax purposes is $223,681,096.
Generally accepted accounting principles (GAAP) require disclosure regarding the inputs and valuation techniques used to measure fair value and any changes in valuation inputs or techniques. In addition, investments shall be disclosed by major category.
The Fund categorizes its fair value measurements according to a three-level hierarchy that maximizes the use of observable inputs and minimizes the use of unobservable inputs by prioritizing that the most observable input be used when available. Observable inputs are those that market participants would use in pricing an investment based on market data obtained from sources independent of the reporting entity. Unobservable inputs are those that reflect the Fund's assumptions about the information market participants would use in pricing an investment. An investment's level within the fair value hierarchy is based on the lowest level of any input that is deemed significant to the asset or liability's fair value measurement. The input levels are not necessarily an indication of the risk or liquidity associated with investments at that level. For example, certain U.S. government securities are generally high quality and liquid, however, they are reflected as Level 2 because the inputs used to determine fair value may not always be quoted prices in an active market.
Fair value inputs are summarized in the three broad levels listed below:
• Level 1—Valuations based on quoted prices for investments in active markets that the Fund has the ability to access at the measurement date (including NAV for open-end mutual funds). Valuation adjustments are not applied to Level 1 investments.
• Level 2—Valuations based on other significant observable inputs (including quoted prices for similar securities, interest rates, prepayment speeds, credit risks, etc.).
• Level 3—Valuations based on significant unobservable inputs (including the Fund's own assumptions and judgment in determining the fair value of investments).
Inputs that are used in determining fair value of an investment may include price information, credit data, volatility statistics, and other factors. These inputs can be either observable or unobservable. The availability of observable inputs can vary between investments, and is affected by various factors such as the type of investment, and the volume and level of activity for that investment or similar investments in the marketplace. The inputs will be considered by the Investment Manager, along with any other relevant factors in the calculation of an investment's fair value. The Fund uses prices and inputs that are current as of the measurement date, which may include periods of market dislocations. During these periods, the availability of prices and inputs may be reduced for many investments. This condition could cause an investment to be reclassified between the various levels within the hierarchy.
14
Columbia California Intermediate Municipal Bond Fund
March 31, 2011
Investments falling into the Level 3 category are primarily supported by quoted prices from brokers and dealers participating in the market for those investments. However, these may be classified as Level 3 investments due to lack of market transparency and corroboration to support these quoted prices. Additionally, valuation models may be used as the pricing source for any remaining investments classified as Level 3. These models rely on one or more significant unobservable inputs and/or significant assumptions by the Investment Manager. Inputs used in valuations may include, but are not limited to, financial statement analysis, capital account balances, discount rates and estimated cash flows, and comparable company data.
The following table is a summary of the inputs used to value the Fund's investments as of March 31, 2011:
| Description | | Quoted
Prices
(Level 1) | | Other
Significant
Observable
Inputs
(Level 2) | | Significant
Unobservable
Inputs
(Level 3) | | Total | |
| Total Municipal Bonds | | $ | — | | | $ | 216,984,839 | | | $ | — | | | $ | 216,984,839 | | |
Total Municipal
Preferred Stock | | | — | | | | 1,609,940 | | | | — | | | | 1,609,940 | | |
Total Investment
Companies | | | 6,813,226 | | | | — | | | | — | | | | 6,813,226 | | |
| Total Investments | | $ | 6,813,226 | | | $ | 218,594,779 | | | $ | — | | | $ | 225,408,005 | | |
The Fund's assets assigned to the Level 2 input category are generally valued using the market approach, in which a security's value is determined through its correlation to prices and information from market transactions for similar or identical assets.
There were no significant transfers of financial assets between Levels 1 and 2 during the period.
At March 31, 2011, the composition of the Fund by revenue source is as follows:
| Holdings By Revenue Source (Unaudited) | | % of
Net Assets | |
| Tax-Backed | | | 41.1 | | |
| Utilities | | | 23.8 | | |
| Health Care | | | 10.2 | | |
| Transportation | | | 6.5 | | |
| Education | | | 5.7 | | |
| Other | | | 4.3 | | |
| Industrials | | | 1.7 | | |
| Housing | | | 1.1 | | |
| Resource Recovery | | | 0.4 | | |
| | | | 94.8 | | |
| Investment Companies | | | 3.0 | | |
| Other Assets & Liabilities, Net | | | 2.2 | | |
| | | | 100.0 | | |
| Acronym | | Name | |
| AGC | | Assured Guaranty Corp. | |
|
| AGMC | | Assured Guaranty Municipal Corp. | |
|
| AMBAC | | Ambac Assurance Corp. | |
|
| CMI | | California Mortgage Insurance | |
|
| FGIC | | Financial Guaranty Insurance Co. | |
|
| NPFGC | | National Public Finance Guarantee Corp. | |
|
| SYNC | | Syncora Guarantee, Inc. | |
|
See Accompanying Notes to Financial Statements.
15
Statement of Assets and Liabilities – Columbia California Intermediate Municipal Bond Fund
March 31, 2011
| | | | | ($) | |
| Assets | | Investments, at identified cost | | | 223,721,511 | | |
| | | Investments, at value | | | 225,408,005 | | |
| | | Cash | | | 560 | | |
| | | Receivable for: | | | | | |
| | | Investments sold | | | 2,705,533 | | |
| | | Fund shares sold | | | 467,007 | | |
| | | Interest | | | 2,977,732 | | |
| | | Expense reimbursement due from Investment Manager | | | 104,881 | | |
| | | Prepaid expenses | | | 864 | | |
| | | Total Assets | | | 231,664,582 | | |
| Liabilities | | Payable for: | | | | | |
| | | Fund shares repurchased | | | 375,006 | | |
| | | Distributions | | | 624,607 | | |
| | | Investment advisory fee | | | 79,002 | | |
| | | Administration fee | | | 23,493 | | |
| | | Pricing and bookkeeping fees | | | 9,447 | | |
| | | Transfer agent fee | | | 50,457 | | |
| | | Trustees' fees | | | 43,654 | | |
| | | Audit fee | | | 30,700 | | |
| | | Legal fee | | | 33,436 | | |
| | | Custody fee | | | 3,065 | | |
| | | Distribution and service fees | | | 3,938 | | |
| | | Chief compliance officer expenses | | | 260 | | |
| | | Other liabilities | | | 7,587 | | |
| | | Total Liabilities | | | 1,284,652 | | |
| | | Net Assets | | | 230,379,930 | | |
| Net Assets Consist of | | Paid-in capital | | | 229,153,993 | | |
| | | Overdistributed net investment income | | | (35,127 | ) | |
| | | Accumulated net realized loss | | | (425,430 | ) | |
| | | Net unrealized appreciation on investments | | | 1,686,494 | | |
| | | Net Assets | | | 230,379,930 | | |
See Accompanying Notes to Financial Statements.
16
Statement of Assets and Liabilities – Columbia California Intermediate Municipal Bond Fund
March 31, 2011 (continued)
| Class A | | Net assets | | $ | 11,612,942 | | |
| | | Shares outstanding | | | 1,203,908 | | |
| | | Net asset value per share | | $ | 9.65 | (a) | |
| | | Maximum sales charge | | | 3.25 | % | |
| | | Maximum offering price per share ($9.65/0.9675) | | $ | 9.97 | (b) | |
| Class B | | Net assets | | $ | 144,266 | | |
| | | Shares outstanding | | | 14,973 | | |
| | | Net asset value and offering price per share | | $ | 9.64 | (a) | |
| Class C | | Net assets | | $ | 1,598,885 | | |
| | | Shares outstanding | | | 165,819 | | |
| | | Net asset value and offering price per share | | $ | 9.64 | (a) | |
| Class Z | | Net assets | | $ | 217,023,837 | | |
| | | Shares outstanding | | | 22,547,376 | | |
| | | Net asset value, offering and redemption price per share | | $ | 9.63 | | |
(a) Redemption price per share is equal to net asset value less any applicable contingent deferred sales charge.
(b) On sales of $100,000 or more the offering price is reduced.
See Accompanying Notes to Financial Statements.
17
Statement of Operations – Columbia California Intermediate Municipal Bond Fund
For the Year Ended March 31, 2011
| | | | | ($) | |
| Investment Income | | Interest | | | 9,513,210 | | |
| | | Dividends | | | 8,122 | | |
| | | Dividends from affiliates | | | 368 | | |
| | | Total investment income | | | 9,521,700 | | |
| Expenses | | Investment advisory fee | | | 957,358 | | |
| | | Administration fee | | | 285,104 | | |
| | | Distribution fee: | | | | | |
| | | Class B | | | 1,467 | | |
| | | Class C | | | 14,313 | | |
| | | Service fee: | | | | | |
| | | Class B | | | 489 | | |
| | | Class C | | | 4,771 | | |
| | | Distribution and service fees: | | | | | |
| | | Class A | | | 37,795 | | |
| | | Transfer agent fee | | | 139,970 | | |
| | | Pricing and bookkeeping fees | | | 93,984 | | |
| | | Trustees' fees | | | 32,233 | | |
| | | Custody fee | | | 14,328 | | |
| | | Chief compliance officer expenses | | | 1,218 | | |
| | | Other expenses | | | 119,396 | | |
| | | Total Expenses | | | 1,702,426 | | |
| | | Fees waived or expenses reimbursed by Investment Manager | | | (327,203 | ) | |
| | | Expense reductions | | | (22 | ) | |
| | | Net Expenses | | | 1,375,201 | | |
| | | Net Investment Income | | | 8,146,499 | | |
| Net Realized and Unrealized Gain (Loss) on Investments | | Net realized gain on investments | | | 165,204 | | |
| | | Net change in unrealized appreciation (depreciation) on investments | | | (3,280,904 | ) | |
| | | Net Loss | | | (3,115,700 | ) | |
| | | Net Increase Resulting from Operations | | | 5,030,799 | | |
See Accompanying Notes to Financial Statements.
18
Statement of Changes in Net Assets – Columbia California Intermediate Municipal Bond Fund
| | | | | Year Ended March 31, | |
| Increase (Decrease) in Net Assets | | | | 2011 ($) | | 2010 ($) | |
| Operations | | Net investment income | | | 8,146,499 | | | | 7,764,145 | | |
| | | Net realized gain (loss) on investments | | | 165,204 | | | | (603,780 | ) | |
| | | Net change in unrealized appreciation (depreciation)
on investments | | | (3,280,904 | ) | | | 9,108,635 | | |
| | | Net increase resulting from operations | | | 5,030,799 | | | | 16,269,000 | | |
| Distributions to Shareholders | | From net investment income: | | | | | | | | | |
| | | Class A | | | (474,558 | ) | | | (577,687 | ) | |
| | | Class B | | | (4,709 | ) | | | (6,372 | ) | |
| | | Class C | | | (46,111 | ) | | | (39,246 | ) | |
| | | Class Z | | | (7,621,120 | ) | | | (7,140,840 | ) | |
| | | From net realized gains: | | | | | | | | | |
| | | Class A | | | — | | | | (16,678 | ) | |
| | | Class B | | | — | | | | (187 | ) | |
| | | Class C | | | — | | | | (1,026 | ) | |
| | | Class Z | | | — | | | | (143,875 | ) | |
| | | Total distributions to shareholders | | | (8,146,498 | ) | | | (7,925,911 | ) | |
| | | Net Capital Stock Transactions | | | 6,296,453 | | | | 11,140,052 | | |
| | | Total increase in net assets | | | 3,180,754 | | | | 19,483,141 | | |
| Net Assets | | Beginning of period | | | 227,199,176 | | | | 207,716,035 | | |
| | | End of period | | | 230,379,930 | | | | 227,199,176 | | |
| | | Overdistributed net investment income at end of period | | | (35,127 | ) | | | (35,128 | ) | |
See Accompanying Notes to Financial Statements.
19
Statement of Changes in Net Assets (continued) – Columbia California Intermediate Municipal Bond Fund
| | | Capital Stock Activity | |
| | | Year Ended
March 31, 2011 | | Year Ended
March 31, 2010 | |
| | | Shares | | Dollars ($) | | Shares | | Dollars ($) | |
| Class A | |
| Subscriptions | | | 2,427,085 | | | | 24,429,818 | | | | 483,750 | | | | 4,620,287 | | |
| Distributions reinvested | | | 15,526 | | | | 152,363 | | | | 43,349 | | | | 415,676 | | |
| Redemptions | | | (2,684,389 | ) | | | (26,210,695 | ) | | | (1,057,393 | ) | | | (10,175,520 | ) | |
| Net decrease | | | (241,778 | ) | | | (1,628,514 | ) | | | (530,294 | ) | | | (5,139,557 | ) | |
| Class B | |
| Subscriptions | | | 83 | | | | 813 | | | | 23 | | | | 221 | | |
| Distributions reinvested | | | 53 | | | | 524 | | | | 219 | | | | 2,094 | | |
| Redemptions | | | (7,650 | ) | | | (75,477 | ) | | | (15,078 | ) | | | (142,192 | ) | |
| Net decrease | | | (7,514 | ) | | | (74,140 | ) | | | (14,836 | ) | | | (139,877 | ) | |
| Class C | |
| Subscriptions | | | 66,490 | | | | 653,746 | | | | 109,932 | | | | 1,070,384 | | |
| Distributions reinvested | | | 1,303 | | | | 12,838 | | | | 877 | | | | 8,503 | | |
| Redemptions | | | (94,974 | ) | | | (922,403 | ) | | | (31,284 | ) | | | (305,059 | ) | |
| Net increase (decrease) | | | (27,181 | ) | | | (255,819 | ) | | | 79,525 | | | | 773,828 | | |
| Class Z | |
| Subscriptions | | | 5,482,045 | | | | 54,193,355 | | | | 6,030,327 | | | | 57,994,921 | | |
| Distributions reinvested | | | 65,365 | | | | 642,397 | | | | 65,061 | | | | 624,637 | | |
| Redemptions | | | (4,757,117 | ) | | | (46,580,826 | ) | | | (4,473,766 | ) | | | (42,973,900 | ) | |
| Net increase | | | 790,293 | | | | 8,254,926 | | | | 1,621,622 | | | | 15,645,658 | | |
See Accompanying Notes to Financial Statements.
20
Financial Highlights – Columbia California Intermediate Municipal Bond Fund
Selected data for a share outstanding throughout each period is as follows:
| | | Year Ended March 31, | |
| Class A Shares | | 2011 | | 2010 | | 2009 | | 2008 | | 2007 | |
| Net Asset Value, Beginning of Period | | $ | 9.72 | | | $ | 9.34 | | | $ | 9.50 | | | $ | 9.63 | | | $ | 9.49 | | |
| Income from Investment Operations: | |
| Net investment income (a) | | | 0.31 | | | | 0.32 | | | | 0.31 | | | | 0.33 | | | | 0.33 | | |
Net realized and unrealized gain (loss) on investments and
futures contracts | | | (0.07 | ) | | | 0.39 | | | | (0.16 | ) | | | (0.13 | ) | | | 0.14 | | |
| Total from investment operations | | | 0.24 | | | | 0.71 | | | | 0.15 | | | | 0.20 | | | | 0.47 | | |
| Less Distributions to Shareholders: | |
| From net investment income | | | (0.31 | ) | | | (0.32 | ) | | | (0.31 | ) | | | (0.33 | ) | | | (0.33 | ) | |
| From net realized gains | | | — | | | | (0.01 | ) | | | — | | | | — | | | | — | | |
| Total distributions to shareholders | | | (0.31 | ) | | | (0.33 | ) | | | (0.31 | ) | | | (0.33 | ) | | | (0.33 | ) | |
| Net Asset Value, End of Period | | $ | 9.65 | | | $ | 9.72 | | | $ | 9.34 | | | $ | 9.50 | | | $ | 9.63 | | |
| Total return (b)(c) | | | 2.48 | % | | | 7.65 | % | | | 1.65 | % | | | 2.08 | % | | | 5.00 | % | |
| Ratios to Average Net Assets/Supplemental Data: | |
| Net expenses before interest expense (d) | | | 0.80 | % | | | 0.79 | % | | | 0.75 | % | | | 0.75 | % | | | 0.75 | % | |
| Interest expense | | | — | | | | — | | | | — | | | | — | %(e) | | | — | | |
| Net expenses (d) | | | 0.80 | % | | | 0.79 | % | | | 0.75 | % | | | 0.75 | % | | | 0.75 | % | |
| Waiver/Reimbursement | | | 0.14 | % | | | 0.11 | % | | | 0.13 | % | | | 0.16 | % | | | 0.20 | % | |
| Net investment income (d) | | | 3.14 | % | | | 3.34 | % | | | 3.33 | % | | | 3.40 | % | | | 3.41 | % | |
| Portfolio turnover rate | | | 26 | % | | | 25 | % | | | 19 | % | | | 5 | % | | | 13 | % | |
| Net assets, end of period (000s) | | $ | 11,613 | | | $ | 14,059 | | | $ | 18,463 | | | $ | 13,488 | | | $ | 9,108 | | |
(a) Per share data was calculated using the average shares outstanding during the period.
(b) Total return at net asset value assuming all distributions reinvested and no initial sales charge or contingent deferred sales charge.
(c) Had the Investment Manager and/or any of its affiliates not waived fees or reimbursed a portion of expenses, total return would have been reduced.
(d) The benefits derived from expense reductions had an impact of less than 0.01%.
(e) Rounds to less than 0.01%.
See Accompanying Notes to Financial Statements.
21
Financial Highlights – Columbia California Intermediate Municipal Bond Fund
Selected data for a share outstanding throughout each period is as follows:
| | | Year Ended March 31, | |
| Class B Shares | | 2011 | | 2010 | | 2009 | | 2008 | | 2007 | |
| Net Asset Value, Beginning of Period | | $ | 9.71 | | | $ | 9.34 | | | $ | 9.49 | | | $ | 9.62 | | | $ | 9.48 | | |
| Income from Investment Operations: | |
| Net investment income (a) | | | 0.24 | | | | 0.25 | | | | 0.24 | | | | 0.26 | | | | 0.26 | | |
Net realized and unrealized gain (loss) on investments and
futures contracts | | | (0.07 | ) | | | 0.37 | | | | (0.15 | ) | | | (0.14 | ) | | | 0.14 | | |
| Total from investment operations | | | 0.17 | | | | 0.62 | | | | 0.09 | | | | 0.12 | | | | 0.40 | | |
| Less Distributions to Shareholders: | |
| From net investment income | | | (0.24 | ) | | | (0.24 | ) | | | (0.24 | ) | | | (0.25 | ) | | | (0.26 | ) | |
| From net realized gains | | | — | | | | (0.01 | ) | | | — | | | | — | | | | — | | |
| Total distributions to shareholders | | | (0.24 | ) | | | (0.25 | ) | | | (0.24 | ) | | | (0.25 | ) | | | (0.26 | ) | |
| Net Asset Value, End of Period | | $ | 9.64 | | | $ | 9.71 | | | $ | 9.34 | | | $ | 9.49 | | | $ | 9.62 | | |
| Total return (b)(c) | | | 1.72 | % | | | 6.74 | % | | | 1.00 | % | | | 1.32 | % | | | 4.22 | % | |
| Ratios to Average Net Assets/Supplemental Data: | |
| Net expenses before interest expense (d) | | | 1.55 | % | | | 1.54 | % | | | 1.50 | % | | | 1.50 | % | | | 1.50 | % | |
| Interest expense | | | — | | | | — | | | | — | | | | — | %(e) | | | — | | |
| Net expenses (d) | | | 1.55 | % | | | 1.54 | % | | | 1.50 | % | | | 1.50 | % | | | 1.50 | % | |
| Waiver/Reimbursement | | | 0.14 | % | | | 0.11 | % | | | 0.13 | % | | | 0.16 | % | | | 0.20 | % | |
| Net investment income (d) | | | 2.41 | % | | | 2.58 | % | | | 2.58 | % | | | 2.69 | % | | | 2.67 | % | |
| Portfolio turnover rate | | | 26 | % | | | 25 | % | | | 19 | % | | | 5 | % | | | 13 | % | |
| Net assets, end of period (000s) | | $ | 144 | | | $ | 218 | | | $ | 348 | | | $ | 475 | | | $ | 874 | | |
(a) Per share data was calculated using the average shares outstanding during the period.
(b) Total return at net asset value assuming all distributions reinvested and no contingent deferred sales charge.
(c) Had the Investment Manager and/or any of its affiliates not waived fees or reimbursed a portion of expenses, total return would have been reduced.
(d) The benefits derived from expense reductions had an impact of less than 0.01%.
(e) Rounds to less than 0.01%.
See Accompanying Notes to Financial Statements.
22
Financial Highlights – Columbia California Intermediate Municipal Bond Fund
Selected data for a share outstanding throughout each period is as follows:
| | | Year Ended March 31, | |
| Class C Shares | | 2011 | | 2010 | | 2009 | | 2008 | | 2007 | |
| Net Asset Value, Beginning of Period | | $ | 9.72 | | | $ | 9.35 | | | $ | 9.50 | | | $ | 9.63 | | | $ | 9.49 | | |
| Income from Investment Operations: | |
| Net investment income (a) | | | 0.24 | | | | 0.25 | | | | 0.24 | | | | 0.26 | | | | 0.26 | | |
Net realized and unrealized gain (loss) on investments and
futures contracts | | | (0.08 | ) | | | 0.37 | | | | (0.15 | ) | | | (0.14 | ) | | | 0.14 | | |
| Total from investment operations | | | 0.16 | | | | 0.62 | | | | 0.09 | | | | 0.12 | | | | 0.40 | | |
| Less Distributions to Shareholders: | |
| From net investment income | | | (0.24 | ) | | | (0.24 | ) | | | (0.24 | ) | | | (0.25 | ) | | | (0.26 | ) | |
| From net realized gains | | | — | | | | (0.01 | ) | | | — | | | | — | | | | — | | |
| Total distributions to shareholders | | | (0.24 | ) | | | (0.25 | ) | | | (0.24 | ) | | | (0.25 | ) | | | (0.26 | ) | |
| Net Asset Value, End of Period | | $ | 9.64 | | | $ | 9.72 | | | $ | 9.35 | | | $ | 9.50 | | | $ | 9.63 | | |
| Total return (b)(c) | | | 1.61 | % | | | 6.74 | % | | | 1.00 | % | | | 1.31 | % | | | 4.22 | % | |
| Ratios to Average Net Assets/Supplemental Data: | |
| Net expenses before interest expense (d) | | | 1.55 | % | | | 1.54 | % | | | 1.50 | % | | | 1.50 | % | | | 1.50 | % | |
| Interest expense | | | — | | | | — | | | | — | | | | — | %(e) | | | — | | |
| Net expenses (d) | | | 1.55 | % | | | 1.54 | % | | | 1.50 | % | | | 1.50 | % | | | 1.50 | % | |
| Waiver/Reimbursement | | | 0.14 | % | | | 0.11 | % | | | 0.13 | % | | | 0.16 | % | | | 0.20 | % | |
| Net investment income (d) | | | 2.42 | % | | | 2.55 | % | | | 2.58 | % | | | 2.67 | % | | | 2.67 | % | |
| Portfolio turnover rate | | | 26 | % | | | 25 | % | | | 19 | % | | | 5 | % | | | 13 | % | |
| Net assets, end of period (000s) | | $ | 1,599 | | | $ | 1,875 | | | $ | 1,061 | | | $ | 1,263 | | | $ | 1,274 | | |
(a) Per share data was calculated using the average shares outstanding during the period.
(b) Total return at net asset value assuming all distributions reinvested and no contingent deferred sales charge.
(c) Had the Investment Manager and/or any of its affiliates not waived fees or reimbursed a portion of expenses, total return would have been reduced.
(d) The benefits derived from expense reductions had an impact of less than 0.01%.
(e) Rounds to less than 0.01%.
See Accompanying Notes to Financial Statements.
23
Financial Highlights – Columbia California Intermediate Municipal Bond Fund
Selected data for a share outstanding throughout each period is as follows:
| | | Year Ended March 31, | |
| Class Z Shares | | 2011 | | 2010 | | 2009 | | 2008 | | 2007 | |
| Net Asset Value, Beginning of Period | | $ | 9.70 | | | $ | 9.33 | | | $ | 9.48 | | | $ | 9.61 | | | $ | 9.47 | | |
| Income from Investment Operations: | |
| Net investment income (a) | | | 0.34 | | | | 0.34 | | | | 0.34 | | | | 0.35 | | | | 0.35 | | |
Net realized and unrealized gain (loss) on investments and
futures contracts | | | (0.07 | ) | | | 0.38 | | | | (0.15 | ) | | | (0.13 | ) | | | 0.14 | | |
| Total from investment operations | | | 0.27 | | | | 0.72 | | | | 0.19 | | | | 0.22 | | | | 0.49 | | |
| Less Distributions to Shareholders: | |
| From net investment income | | | (0.34 | ) | | | (0.34 | ) | | | (0.34 | ) | | | (0.35 | ) | | | (0.35 | ) | |
| From net realized gains | | | — | | | | (0.01 | ) | | | — | | | | — | | | | — | | |
| Total distributions to shareholders | | | (0.34 | ) | | | (0.35 | ) | | | (0.34 | ) | | | (0.35 | ) | | | (0.35 | ) | |
| Net Asset Value, End of Period | | $ | 9.63 | | | $ | 9.70 | | | $ | 9.33 | | | $ | 9.48 | | | $ | 9.61 | | |
| Total return (b)(c) | | | 2.74 | % | | | 7.82 | % | | | 2.02 | % | | | 2.33 | % | | | 5.27 | % | |
| Ratios to Average Net Assets/Supplemental Data: | |
| Net expenses before interest expense (d) | | | 0.55 | % | | | 0.54 | % | | | 0.50 | % | | | 0.50 | % | | | 0.50 | % | |
| Interest expense | | | — | | | | — | | | | — | | | | — | %(e) | | | — | | |
| Net expenses (d) | | | 0.55 | % | | | 0.54 | % | | | 0.50 | % | | | 0.50 | % | | | 0.50 | % | |
| Waiver/Reimbursement | | | 0.14 | % | | | 0.11 | % | | | 0.13 | % | | | 0.16 | % | | | 0.20 | % | |
| Net investment income (d) | | | 3.43 | % | | | 3.56 | % | | | 3.58 | % | | | 3.66 | % | | | 3.67 | % | |
| Portfolio turnover rate | | | 26 | % | | | 25 | % | | | 19 | % | | | 5 | % | | | 13 | % | |
| Net assets, end of period (000s) | | $ | 217,024 | | | $ | 211,046 | | | $ | 187,844 | | | $ | 203,426 | | | $ | 132,921 | | |
(a) Per share data was calculated using the average shares outstanding during the period.
(b) Total return at net asset value assuming all distributions reinvested.
(c) Had the Investment Manager and/or any of its affiliates not waived fees or reimbursed a portion of expenses, total return would have been reduced.
(d) The benefits derived from expense reductions had an impact of less than 0.01%.
(e) Rounds to less than 0.01%.
See Accompanying Notes to Financial Statements.
24
Notes to Financial Statements – Columbia California Intermediate Municipal Bond Fund
March 31, 2011
Note 1. Organization
Columbia California Intermediate Municipal Bond Fund (the Fund), a series of Columbia Funds Series Trust (the Trust), is a diversified fund. The Trust is registered under the Investment Company Act of 1940, as amended (the 1940 Act), as an open-end management investment company organized as a Delaware statutory trust.
After the close of business on April 30, 2010, Ameriprise Financial, Inc. (Ameriprise Financial) acquired a portion of the asset management business of Columbia Management Group, LLC (the Transaction), including the business of managing the Fund. In connection with the closing of the Transaction (the Closing), RiverSource Investments, LLC, a wholly owned subsidiary of Ameriprise Financial, became the investment manager of the Fund and changed its name to Columbia Management Investment Advisers, LLC (the Investment Manager).
Investment Objective
The Fund seeks current income exempt from U.S. federal income tax and California individual income tax, consistent with moderate fluctuation of principal.
Fund Shares
The Trust has unlimited authorized shares of beneficial interest. The Fund offers Class A, Class B, Class C and Class Z shares. All share classes have identical voting, dividend and liquidation rights. Each share class has its own expense structure and sales charges, as applicable.
Class A shares are subject to a maximum front-end sales charge of 3.25% based on the initial investment amount. Class A shares purchased without an initial sales charge in accounts aggregating $1 million to $50 million at the time of purchase are subject to a 1.00% contingent deferred sales charge (CDSC) if the shares are sold within 18 months of purchase, charged as follows: 1.00% CDSC if redeemed within 12 months of purchase, and 0.50% CDSC if redeemed more than 12, but less than 18 months after purchase.
The Fund no longer accepts investments by new or existing investors in the Fund's Class B shares, except in connection with the reinvestment of any dividend and/or capital gain distributions in Class B shares of the Fund and exchanges by existing Class B shareholders of other funds within the Columbia Family of Funds. Class B shares are subject to a maximum CDSC of 3.00% based upon the holding period after purchase. Class B shares will generally convert to Class A shares eight years after purchase.
Class C shares are subject to a 1.00% CDSC on shares redeemed within one year of purchase.
Class Z shares are not subject to sales charges and are available only to certain investors, as described in the Fund's prospectus.
Note 2. Summary of Significant Accounting Policies
The preparation of financial statements in accordance with U.S. generally accepted accounting principles (GAAP) requires management to make certain estimates and assumptions that affect the reported amounts of assets and liabilities, the disclosure of contingent assets and liabilities at the date of the financial statements and the reported amounts of revenue and expenses during the reporting period. Actual results could differ from those estimates.
The following is a summary of significant accounting policies consistently followed by the Fund in the preparation of its financial statements.
Security Valuation
Debt securities generally are valued by pricing services approved by the Trust's Board of Trustees, based upon market transactions for normal, institutional-size trading units of similar securities. The services may use various pricing techniques which take into account appropriate factors such as yield, quality, coupon rate, maturity, type of issue, trading characteristics and other data, as well as broker quotes. Debt securities for which quotations are readily available may also be valued based upon an over-the-counter or exchange bid quotation.
Investments in other open-end investment companies are valued at net asset value.
Investments for which market quotations are not readily available, or that have quotations which the Investment Manager believes are not reliable, are valued at fair value as determined in good faith under consistently applied procedures established by and under the general supervision of the Board of Trustees. If a security is valued at fair value, such value is likely to be different from the last quoted market price for the security. The determination of fair value often requires significant judgment. To determine fair value, the Investment Manager may use assumptions including but not limited to future cash flows and estimated risk premiums. Multiple inputs from various sources may be used to determine value.
25
Columbia California Intermediate Municipal Bond Fund, March 31, 2011
Security Transactions
Security transactions are accounted for on the trade date. Cost is determined and gains (losses) are based upon the specific identification method for both financial statement and federal income tax purposes.
Income Recognition
Interest income is recorded on the accrual basis. Market premium and discount are amortized and accreted, respectively, on all debt securities, unless otherwise noted. Original issue discount is accreted to interest income over the life of the security with a corresponding increase in the cost basis, if any.
Dividend income is recorded on the ex-date.
Expenses
General expenses of the Trust are allocated to the Fund and other series of the Trust based upon relative net assets or other expense allocation methodologies determined by the nature of the expense. Expenses directly attributable to a specific class of shares are charged to that share class. Expenses directly attributable to the Fund are charged to the Fund.
Determination of Class Net Asset Value
All income, expenses (other than class-specific expenses which are charged directly to a share class, as shown in the Statement of Operations) and realized and unrealized gains (losses) are allocated to each class of the Fund on a daily basis for purposes of determining the net asset value of each class. Income and expenses are allocated to each class based on the settled shares method, while realized and unrealized gains (losses) are allocated based on the relative net assets of each class.
Federal Income Tax Status
The Fund intends to qualify each year as a "regulated investment company" under Subchapter M of the Internal Revenue Code, as amended, and will distribute substantially all of its tax exempt or taxable income, if any, for its tax year, and as such will not be subject to federal income taxes. In addition, the Fund intends to distribute in each calendar year substantially all of its net investment income, capital gains and certain other amounts, if any, such that the Fund should not be subject to federal excise tax. Therefore, no federal income or excise tax provision is recorded.
Distributions to Shareholders
Distributions from net investment income are declared daily and paid monthly. Net realized capital gains, if any, are distributed at least annually. Income distributions and capital gain distributions are determined in accordance with federal income tax regulations which may differ from GAAP.
Indemnifications
Under the Trust's organizational documents and, in some cases, by contract, its officers and directors are indemnified against certain liabilities arising out of the performance of their duties to the Fund. In addition, certain of the Fund's contracts with its service providers contain general indemnification clauses. The Fund's maximum exposure under these arrangements is unknown since the amount of any future claims that may be made against the Fund cannot be determined and the Fund has no historical basis for predicting the likelihood of any such claims.
Note 3. Fees and Compensation Paid to Affiliates
Investment Management Fee
Under an Investment Management Services Agreement (IMSA), the Investment Manager determines which securities will be purchased, held or sold. The management fee is equal to a percentage of the Fund's average daily net assets that declines from 0.40% to 0.27% as the Fund's net assets increase.
Prior to the Closing, Columbia Management Advisors, LLC (Columbia), an indirect, wholly owned subsidiary of Bank of America Corporation (BOA), provided investment management services to the Fund under the same fee structure. The effective management fee rate for the year ended March 31, 2011, was 0.40% of the Fund's average daily net assets.
Administration Fee
Effective upon the Closing, the Investment Manager provides administration and accounting services to the Fund under an Administrative Services Agreement, including services previously performed under the Pricing and Bookkeeping Oversight and Services Agreement (the Services Agreement) as discussed in the Pricing and Bookkeeping Fees note below. The Fund pays an annual administration fee equal to 0.15% of the Fund's average daily net assets less the fees payable by the Fund as described under the Pricing and Bookkeeping Fees note below. Prior to the Closing, Columbia provided administrative services to the Fund at the same fee rates.
26
Columbia California Intermediate Municipal Bond Fund, March 31, 2011
Pricing and Bookkeeping Fees
Prior to the Closing, the Fund entered into a Financial Reporting Services Agreement (the Financial Reporting Services Agreement) with State Street Bank and Trust Company (State Street) and Columbia pursuant to which State Street provides financial reporting services to the Fund. The Fund also entered into an Accounting Services Agreement (collectively with the Financial Reporting Services Agreement, the State Street Agreements) with State Street and Columbia pursuant to which State Street provides accounting services to the Fund. Upon the Closing, Columbia assigned and delegated its rights and obligations under the State Street Agreements to the Investment Manager. Under the State Street Agreements, the Fund pays State Street an annual fee of $38,000 paid monthly plus an additional monthly fee based on an annualized percentage rate of average daily net assets of the Fund for the month. The aggregate fee will not exceed $140,000 per year (exclusive of out-of-pocket expenses and charges). The Fund also reimburses State Street for certain out-of-pocket expenses and charges.
Also prior to the Closing, the Fund entered into the Services Agreement with Columbia. Under the Services Agreement, Columbia provided services related to Fund expenses and the requirements of the Sarbanes-Oxley Act of 2002, and provided oversight of the accounting and financial reporting services provided by State Street. Under the Services Agreement, the Fund reimbursed Columbia for out-of-pocket expenses and charges, including fees payable to third parties, such as for pricing the Fund's portfolio securities, incurred by Columbia in the performance of services under the Services Agreement. The Services Agreement was terminated upon the Closing. These services are now provided under the Administrative Services Agreement discussed above.
Transfer Agent Fee
In connection with the Closing, RiverSource Service Corporation, a wholly owned subsidiary of Ameriprise Financial, provides transfer agency services to the Fund under a Transfer Agency Agreement and changed its name to Columbia Management Investment Services Corp. (the Transfer Agent). The Transfer Agent has contracted with Boston Financial Data Services (BFDS) to serve as sub-transfer agent.
The Transfer Agent receives monthly account-based service fees based on the number of open accounts and is reimbursed by the Fund for the fees and expenses the Transfer Agent pays to financial intermediaries that maintain omnibus accounts with the Fund that is a percentage of the average aggregate value of the Fund's shares maintained in each such omnibus account (other than omnibus accounts for which American Enterprise Investment Services Inc. is the broker of record or accounts where the beneficial shareholder is a customer of Ameriprise Financial Services, Inc., which are paid a per account fee). The Transfer Agent pays the fees of BFDS for services as sub-transfer agent and is not entitled to reimbursement for such fees from the Fund (with the exception of out-of pocket fees). The Transfer Agent also receives compensation from fees for various shareholder services and reimbursements for certain out-of-pocket expenses.
Prior to the Closing, Columbia Management Services, Inc., an affiliate of Columbia and an indirect, wholly owned subsidiary of BOA, provided transfer agency services to the Fund and contracted with BFDS to serve as sub-transfer agent, under the same fee structure.
For the year ended March 31, 2011, the Fund's effective transfer agent fee rate for each class was 0.05% of the Fund's average daily net assets.
An annual minimum account balance fee of $20 may apply to certain accounts with a value below the Fund's initial minimum investment requirements to reduce the impact of small accounts on transfer agent fees. These minimum account balance fees are recorded as part of expense reductions on the Statement of Operations. For the year ended March 31, 2011, no minimum account balance fees were charged by the Fund.
Underwriting Discounts, Service and Distribution Fees
In connection with the Closing, RiverSource Fund Distributors, Inc., an indirect wholly owned subsidiary of Ameriprise Financial, provides distribution and shareholder services to the Fund and changed its name to Columbia Management Investment Distributors, Inc. (the Distributor). Pursuant to Rule 12b-1 under the 1940 Act, the Board of Trustees has approved, and the Fund has adopted, distribution and shareholder service plans (the Plans) which set the distribution and service fees for the Fund. These fees are calculated daily and are intended to compensate the Distributor and/or eligible selling and/or servicing agents for selling shares of the Fund and providing services to investors.
The Plans require the payment of a combined distribution and shareholder servicing fee for the Class A shares of the Fund. The Plans also require the payment of a monthly shareholder servicing fee and distribution fee for the Class B and Class C shares of the Fund. A substantial portion of the expenses incurred pursuant to these plans is paid to affiliates of the Distributor. The annual rates in
27
Columbia California Intermediate Municipal Bond Fund, March 31, 2011
effect and plan limits, as a percentage of average daily net assets, are as follows:
| | | Current
Rate | | Plan
Limit | |
Class A Combined Distribution and
Shareholder Servicing Plan | | | 0.25 | % | | | 0.25 | % | |
Class B and Class C Shareholder
Servicing Plans | | | 0.25 | % | | | 0.25 | % | |
Class B and Class C
Distribution Plans | | | 0.75 | % | | | 0.75 | % | |
Prior to the Closing, Columbia Management Distributors, Inc., an affiliate of Columbia and an indirect, wholly owned subsidiary of BOA, was the principal underwriter of the Fund's shares. There were no changes to the underwriting discount structure of the Fund or the service or distribution fee rates paid by the Fund as a result of the Transaction.
Sales Charges
Sales charges, including front-end and CDSC's, received by the Distributor for distributing Fund shares were $4,249 for Class A and $381 for Class C shares for the year ended March 31, 2011.
Fee Waivers and Expense Reimbursements
The Investment Manager has voluntarily agreed to bear a portion of the Fund's expenses so that the Fund's ordinary operating expenses (excluding any distribution and service fees, brokerage commissions, interest, taxes and extraordinary expenses, but including custodian charges relating to overdrafts, if any), after giving effect to any balance credits from the Fund's custodian, do not exceed 0.55% of the Fund's average daily net assets on an annualized basis. The Investment Manager, in its discretion, may revise or discontinue this arrangement at any time. Prior to May 1, 2010, Columbia voluntarily reimbursed a portion of the Fund's expenses in the same manner.
The Investment Manager is entitled to recover from the Fund any fees waived and/or expenses reimbursed for a three year period following the date of such fee waiver and/or reimbursement under these arrangements if such recovery does not cause the Fund's expenses to exceed the expense limitations in effect at the time of recovery. Prior to May 1, 2010, Columbia was entitled to recover fees waived and/or expenses reimbursed from the Fund in the same manner.
At March 31, 2011, the amounts potentially recoverable pursuant to this arrangement were as follows:
| Amount of potential recovery expiring March 31, | | Total
potential | | Amount
expired | | Amount recovered
during the year | |
| 2014 | | 2013 | | 2012 | | recovery | | 3/31/11 | | ended 3/31/11 | |
| $ | 327,203 | | | $ | 249,629 | | | $ | 299,298 | | | $ | 876,130 | | | $ | 245,824 | | | $ | — | | |
Effective May 1, 2011, the Investment Manager has eliminated the fee recoupment provisions detailed above.
Fees Paid to Officers and Trustees
In connection with the Closing, all officers of the Fund are employees of the Investment Manager or its affiliates and, with the exception of the Fund's Chief Compliance Officer, receive no compensation from the Fund. The Board of Trustees has appointed a Chief Compliance Officer to the Fund in accordance with federal securities regulations. The Fund, along with other affiliated funds, pays its pro-rata share of the expenses associated with the Chief Compliance Officer. The Fund's expenses for the Chief Compliance Officer will not exceed $15,000 per year. Prior to the Closing, all officers of the Fund were employees of Columbia or its affiliates and the Fund paid its pro-rata share of the expenses for the Chief Compliance Officer under the same fee structure.
Trustees are compensated for their services to the Fund, as set forth on the Statement of Operations. The Trust's eligible Trustees may participate in a non-qualified deferred compensation plan which may be terminated at any time. Any payments to plan participants are paid solely out of the Fund's assets. Income earned on the plan participant's deferral account is based on the rate of return of the eligible mutual funds selected by the participant or, if no funds are selected, on the rate of return of Columbia Money Market Fund (formerly known as RiverSource Cash Management Fund). Prior to
28
Columbia California Intermediate Municipal Bond Fund, March 31, 2011
the Closing, if no funds were selected, income earned on the plan participant's deferral account was based on the rate of return of BofA Treasury Reserves. Trustees' fees deferred during the current period as well as any gains or losses on the trustees' deferred compensation balances as a result of market fluctuations are included in "Trustees' fees" on the Statement of Operations. Liabilities under the deferred compensation plan are included in "Trustees' fees" on the Statement of Assets and Liabilities.
Other
Prior to the Closing, the Fund made daily investments of cash balances in BofA Tax-Exempt Reserves, formerly an affiliated open-ended investment company of Columbia, pursuant to an exemptive order received from the Securities and Exchange Commission. The income earned prior to the Closing by the Fund from such investments is included as Dividends from affiliates on the Statement of Operations. As an investing Fund, the Fund was indirectly allocated its proportionate share of the expenses of BofA Tax-Exempt Reserves.
Note 4. Custody Credits
The Fund has an agreement with its custodian bank under which custody fees may be reduced by balance credits. These credits are recorded as part of expense reductions on the Statement of Operations. The Fund could have invested a portion of the assets utilized in connection with the expense offset arrangement in an income-producing asset if it had not entered into such an agreement. For the year ended March 31, 2011, these custody credits reduced total expenses by $22 for the Fund.
Note 5. Portfolio Information
The cost of purchases and proceeds from sales of securities, excluding short-term obligations, aggregated $64,795,163 and $61,086,033, respectively, for the year ended March 31, 2011.
Note 6. Shareholder Concentration
As of March 31, 2011, one shareholder account owned 82.5% of the outstanding shares of the Fund. Purchase and redemption activity of this account may have a significant effect on the operations of the Fund.
Note 7. Line of Credit
Prior to March 28, 2011, the Fund and other affiliated funds participated in a $280,000,000 committed, unsecured revolving line of credit provided by State Street. Effective March 28, 2011, the commitment was reduced to $225,000,000. The maximum amount that may be borrowed by any fund is limited to the lesser of $200,000,000 and the Fund's borrowing limit set forth in the Fund's registration statement. Borrowings are available for short-term liquidity or temporary or emergency purposes.
Effective October 14, 2010, interest is charged to each participating fund based on the fund's borrowings at a rate per annum equal to the greater of the Federal Funds Rate plus 1.25% or the overnight LIBOR Rate plus 1.25%. In addition, a commitment fee of 0.125% per annum is accrued and apportioned among the participating funds pro rata based on their relative net assets.
Prior to October 14, 2010, interest was charged to each participating fund at the same rates. In addition, a commitment fee of 0.15% per annum was accrued and apportioned among the participating funds pro rata based on their relative net assets.
For the year ended March 31, 2011, the Fund did not borrow under these arrangements.
Note 8. Federal Tax Information
The timing and character of income and capital gain distributions are determined in accordance with income tax regulations, which may differ from GAAP. Reclassifications are made to the Fund's capital accounts for permanent tax differences to reflect income and gains available for distribution (or available capital loss carryforwards) under income tax regulations.
The tax character of distributions paid during the years ended March 31, 2011 and March 31, 2010 was as follows:
| | | March 31, | |
| Distributions paid from: | | 2011 | | 2010 | |
| Tax-Exempt Income | | $ | 8,126,306 | | | $ | 7,781,315 | | |
| Ordinary Income* | | | 20,192 | | | | 3,073 | | |
| Long-Term Capital Gains | | | — | | | | 141,523 | | |
* For tax purposes short-term capital gain distributions, if any, are considered ordinary income distributions.
29
Columbia California Intermediate Municipal Bond Fund, March 31, 2011
As of March 31, 2011, the components of distributable earnings on a tax basis were as follows:
Undistributed
Tax-Exempt
Income | | Undistributed
Long-Term
Capital Gains | | Net Unrealized
Appreciation | |
| $ | 564,711 | | | $ | — | | | $ | 1,726,909 | | |
Unrealized appreciation and depreciation at March 31, 2011, based on cost of investments for federal income tax purposes were:
| Unrealized appreciation | | $ | 4,537,716 | | |
| Unrealized depreciation | | | (2,810,807 | ) | |
| Net unrealized appreciation | | $ | 1,726,909 | | |
The following capital loss carryforwards may be available to reduce taxable income arising from future net realized gains on investments, if any, to the extent permitted by the Internal Revenue Code:
| Year of Expiration | | Capital Loss
Carryforwards | |
| 2018 | | $ | 438,576 | | |
Capital loss carryforwards of $111,165 were utilized during the year ended March 31, 2011.
Management of the Fund has concluded that there are no significant uncertain tax positions that would require recognition in the financial statements. However, management's conclusion may be subject to review and adjustment at a later date based on factors including, but not limited to, new tax laws, regulations, and administrative interpretations (including relevant court decisions). The Fund's federal tax returns for the prior three fiscal years remain subject to examination by the Internal Revenue Service.
Note 9. Significant Risks and Contingencies
Sector Focus Risk
The Fund may focus its investments in certain sectors, subjecting it to greater risk than a fund that is less focused.
Geographic Concentration Risk
Securities issued by a particular state and its instrumentalities are subject to the risk of unfavorable developments in such state. The value of Fund shares may be more volatile than the value of shares of funds that invest in municipal securities of issuers in more than one state, as unfavorable developments have the potential to impact more significantly the Fund than funds that invest in municipal securities of many different states. A municipal security can be significantly affected by adverse tax, legislative, demographic or political changes as well as changes in the state's financial or economic condition and prospects.
The Fund's municipal holdings may include obligations of issuers that rely in whole or in part for payment of interest and principal on state specific revenues, real property taxes, revenues from particular institutions, such as healthcare institutions, or obligations secured by mortgages on real property. Consequently, the impact of changes in state law or regulations or the economic conditions in a particular state should be considered. The ability of issuers of debt securities held by the Fund to meet their obligations may be affected by economic developments in a specific industry or region.
Tax Development Risk
The Fund purchases municipal securities whose interest, in the opinion of bond counsel, is free from federal income tax. There is no assurance that the Internal Revenue Service (IRS) will agree with this opinion. In the event the IRS determines that an issuer does not comply with relevant tax requirements, interest payments from a security could become federally taxable, possibly retroactively to the date the security was issued. As a shareholder of the Fund, you may be required to file an amended tax return as a result.
Note 10. Subsequent Events
Management has evaluated the events and transactions that have occurred through the date the financial statements were issued. Other than as noted below, there were no items requiring adjustment of the financial statements or additional disclosure.
Effective May 16, 2011, the line of credit commitment with State Street was reduced to $150,000,000, and the maximum amount that may be borrowed by any fund was limited to the lesser of $120,000,000 and the Fund's borrowing limit set forth in the Fund's registration statement.
30
Columbia California Intermediate Municipal Bond Fund, March 31, 2011
Note 11. Information Regarding Pending and Settled Legal Proceedings
In June 2004, an action captioned John E. Gallus et al. v. American Express Financial Corp. and American Express Financial Advisors Inc. was filed in the United States District Court for the District of Arizona. The plaintiffs allege that they are investors in several American Express Company (now known as RiverSource) mutual funds and they purport to bring the action derivatively on behalf of those funds under the Investment Company Act of 1940. The plaintiffs allege that fees allegedly paid to the defendants by the funds for investment advisory and administrative services are excessive. The plaintiffs seek remedies including restitution and rescission of investment advisory and distribution agreements. The plaintiffs voluntarily agreed to transfer this case to the United States District Court for the District of Minnesota (the District Court). In response to defendants' motion to dismiss the complaint, the District Court dismissed one of plaintiffs' four claims and granted plaintiffs limited discovery. Defendants moved for summary judgment in April 2007. Summary judgment was granted in the defendants' favor on July 9, 2007. The plaintiffs filed a notice of appeal with the Eighth Circuit Court of Appeals (the Eighth Circuit) on August 8, 2007. On April 8, 2009, the Eighth Circuit reversed summary judgment and remanded to the District Court for further proceedings. On August 6, 2009, defendants filed a writ of certiorari with the U.S. Supreme Court (the Supreme Court), asking the Supreme Court to stay the District Court proceedings while the Supreme Court considers and rules in a case captioned Jones v. Harris Associates, which involves issues of law similar to those presented in the Gallus case. On March 30, 2010, the Supreme Court issued its ruling in Jones v. Harris Associates, and on April 5, 2010, the Supreme Court vacated the Eighth Circuit's decision in the Gallus case and remanded the case to the Eighth Circuit for further consideration in light of the Supreme Court's decision in Jones v. Harris Associates. On June 4, 2010, the Eighth Circuit remanded the Gallus case to the District Court for further consideration in light of the Supreme Court's decision in Jones v. Harris Associates. On December 9, 2010, the District Court reinstated its July 9, 2007 summary judgment order in favor of the defendants. On January 10, 2011 plaintiffs filed a notice of appeal with the Eighth Circuit.
In December 2005, without admitting or denying the allegations, American Express Financial Corporation (AEFC, which is now known as Ameriprise Financial, Inc. (Ameriprise Financial)), entered into settlement agreements with the Securities and Exchange Commission (SEC) and Minnesota Department of Commerce (MDOC) related to market timing activities. As a result, AEFC was censured and ordered to cease and desist from committing or causing any violations of certain provisions of the Investment Advisers Act of 1940, the Investment Company Act of 1940, and various Minnesota laws. AEFC agreed to pay disgorgement of $10 million and civil money penalties of $7 million. AEFC also agreed to retain an independent distribution consultant to assist in developing a plan for distribution of all disgorgement and civil penalties ordered by the SEC in accordance with various undertakings detailed at http://www.sec.gov/litigation/admin/ia-2451.pdf. Ameriprise Financial and its affiliates have cooperated with the SEC and the MDOC in these legal proceedings, and have made regular reports to the funds' Boards of Directors/Trustees.
Ameriprise Financial and certain of its affiliates have historically been involved in a number of legal, arbitration and regulatory proceedings, including routine litigation, class actions, and governmental actions, concerning matters arising in connection with the conduct of their business activities. Ameriprise Financial believes that the Funds are not currently the subject of, and that neither Ameriprise Financial nor any of its affiliates are the subject of, any pending legal, arbitration or regulatory proceedings that are likely to have a material adverse effect on the Funds or the ability of Ameriprise Financial or its affiliates to perform under their contracts with the Funds. Ameriprise Financial is required to make 10-Q, 10-K and, as necessary, 8-K filings with the Securities and Exchange Commission on legal and regulatory matters that relate to Ameriprise Financial and its affiliates. Copies of these filings may be obtained by accessing the SEC website at www.sec.gov.
There can be no assurance that these matters, or the adverse publicity associated with them, will not result in increased fund redemptions, reduced sale of fund shares or other adverse consequences to the Funds. Further, although we believe proceedings are not likely to have a material adverse effect on the Funds or the ability of Ameriprise Financial or its affiliates to perform under their contracts with the Funds, these proceedings are subject to uncertainties and, as such, we are unable to estimate the possible loss or range of loss that may result. An adverse outcome in one or more of these proceedings could result in adverse judgments, settlements, fines, penalties or other relief that could have a material adverse effect on the consolidated financial condition or results of operations of Ameriprise Financial.
31
Report of Independent Registered Public Accounting Firm
To the Trustees of Columbia Funds Series Trust and the Shareholders of Columbia California Intermediate Municipal Bond Fund
In our opinion, the accompanying statement of assets and liabilities, including the investment portfolio, and the related statements of operations and of changes in net assets and the financial highlights present fairly, in all material respects, the financial position of Columbia California Intermediate Municipal Bond Fund (the "Fund") (a series of Columbia Funds Series Trust) at March 31, 2011, and the results of its operations for the year then ended, the changes in its net assets for each of the two years in the period then ended, and the financial highlights for each of the five years in the period then ended, in conformity with accounting principles generally accepted in the United States of America. These financial statements and financial highlights (hereafter referred to as "financial statements") are the responsibility of the Fund's management. Our responsibility is to express an opinion on these financial statements based on our audits. We conducted our audits of these financial statements in accordance with the standards of the Public Company Accounting Oversight Board (United States). Those standards require that we plan and perform the audit to obtain reasonable assurance about whether the financial statements are free of material misstatement. An audit includes examining, on a test basis, evidence supporting the amounts and disclosures in the financial statements, assessing the accounting principles used and significant estimates made by management, and evaluating the overall financial statement presentation. We believe that our audits, which included confirmation of securities at March 31, 2011 by correspondence with the custodian and brokers, provide a reasonable basis for our opinion.
PricewaterhouseCoopers LLP
Boston, Massachusetts
May 20, 2011
32
Federal Income Tax Information (Unaudited) – Columbia California Intermediate Municipal Bond Fund
For the fiscal year ended March 31, 2011, 99.80% of distributions made from net investment income of the Fund qualifies as exempt interest dividends for federal income tax purposes. A portion of the income may be subject to federal alternative minimum tax.
The Fund will notify shareholders in January 2012 of amounts for use in preparing 2011 income tax returns.
33
Fund Governance
The Trustees serve terms of indefinite duration. The names, addresses and birth years of the Trustees and Officers of the Funds in the Columbia Funds Series Trust, the year each was first elected or appointed to office, their principal business occupations during at least the last five years, the number of Funds overseen by each Trustee and other directorships they hold are shown below. Each officer listed below serves as an officer of each Fund in the Columbia Funds Series Trust.
Independent Trustees
Name, Address and Year of Birth,
Position with Funds, Year First
Elected or Appointed to Office | | Principal Occupation(s) During Past Five Years, Number of Funds in the Columbia
Funds Complex Overseen by Trustee, Other Directorships Held
| |
| Edward J. Boudreau, Jr. (Born 1944) | |
|
c/o Columbia Management
Investment Advisers, LLC
225 Franklin Street
Boston, MA 02110
Trustee (since 2005) | | Managing Director—E.J. Boudreau & Associates (consulting), from 2000 through current; oversees 41; Trustee—BofA Funds Series Trust. | |
|
| William P. Carmichael (Born 1943) | |
|
c/o Columbia Management
Investment Advisers, LLC
225 Franklin Street
Boston, MA 02110
Trustee (since 1999) | | Retired; oversees 41; Director—Cobra Electronics Corporation (electronic equipment manufacturer); Director—McMoRan Exploration Company (oil and gas exploration and development); Director—The Finish Line (athletic shoes and apparel); Trustee—BofA Funds Series Trust. | |
|
| William A. Hawkins (Born 1942) | |
|
c/o Columbia Management
Investment Advisers, LLC
225 Franklin Street
Boston, MA 02110
Trustee (since 2005) | | Managing Director—Overton Partners (financial consulting), August 2010 to present; President and Chief Executive Officer—California General Bank, N.A., from January 2008 through August 2010; oversees 41; Trustee—BofA Funds Series Trust. | |
|
| R. Glenn Hilliard (Born 1943) | |
|
c/o Columbia Management
Investment Advisers, LLC
225 Franklin Street
Boston, MA 02110
Trustee (since 2005) | | Chairman and Chief Executive Officer—Hilliard Group LLC (investing and consulting), from April 2003 through current; oversees 41; Trustee—BofA Funds Series Trust. | |
|
| John J. Nagorniak (Born 1944) | |
|
c/o Columbia Management
Investment Advisers, LLC
225 Franklin Street
Boston, MA 02110
Trustee (since 2008) | | Retired; President and Director—Foxstone Financial, Inc. (consulting), 2000 through December 2007; Director—Mellon Financial Corporation affiliates (investing), 2000 through 2007; Chairman—Franklin Portfolio Associates (investing—Mellon affiliate), 1982 through 2007; oversees 41; Director—MIT Investment Company; Trustee—MIT 401k Plan; Trustee—Research Foundation of CFA Institute; Trustee—BofA Funds Series Trust. | |
|
34
Fund Governance (continued)
Independent Trustees (continued)
Name, Address and Year of Birth,
Position with Funds, Year First
Elected or Appointed to Office | | Principal Occupation(s) During Past Five Years, Number of Funds in the Columbia
Funds Complex Overseen by Trustee, Other Directorships Held
| |
| Minor M. Shaw (Born 1947) | |
|
c/o Columbia Management
Investment Advisers, LLC
225 Franklin Street
Boston, MA 02110
Trustee (since 2003) | | President—Micco Corporation and Mickel Investment Group; oversees 41; Board Member—Piedmont Natural Gas; Trustee—BofA Funds Series Trust. | |
|
Interested Trustee
| Anthony M. Santomero1 (Born 1946) | |
|
c/o Columbia Management
Investment Advisers, LLC
225 Franklin Street
Boston, MA 02110
Trustee (since 2008) | | Richard K. Mellon Professor Emeritus of Finance, The Wharton School, University of Pennsylvania, from 2002 through current; Senior Advisor—McKinsey & Company (consulting), July 2006 through January 2008; President and Chief Executive Officer—Federal Reserve Bank of Philadelphia, July 2000 through April 2006; oversees 41; Director—Renaissance Reinsurance Ltd; Trustee—Penn Mutual Life Insurance Company; Director—Citigroup, Inc.; Director—Citibank, N.A.; Trustee—BofA Funds Series Trust. | |
|
1 Dr. Santomero is currently deemed by the Columbia Funds to be an "interested person" (as defined in the 1940 Act) of the Funds because he serves as a Director of Citigroup, Inc. and Citibank, N.A., companies that may directly or through subsidiaries and affiliates engage from time-to-time in brokerage execution, principal transactions and lending relationships with the Columbia Funds or other funds or accounts advised/managed by Columbia Management Investment Advisers, LLC.
The Statement of Additional Information includes additional information about the Trustees of the Funds and is available, without charge, upon request by calling 800-345-6611.
Officers
| Name, Year of Birth and Address | | Principal Occupation(s) During the Past Five Years | |
| J. Kevin Connaughton (Born 1964) | |
|
225 Franklin Street
Boston, MA 02110
President (since 2009) | | Senior Vice President and General Manager—Mutual Fund Products, Columbia Management Investment Advisers, LLC since May 2010; President, Columbia Funds, since 2009, and RiverSource Funds, since May 2010 (previously Senior Vice President and Chief Financial Officer, Columbia Funds, from June 2008 to January 2009, Treasurer, Columbia Funds, from October 2003 to May 2008, and senior officer of various other affiliated funds since 2000); Managing Director, Columbia Management Advisors, LLC from December 2004 to April 2010. | |
|
| Michael G. Clarke (Born 1969) | |
|
225 Franklin Street
Boston, MA 02110
Treasurer (since 2011) and
Chief Financial Officer (since 2009) | | Vice President, Columbia Management Investment Advisers, LLC since May 2010; Managing Director of Fund Administration, Columbia Management Advisors, LLC, from September 2004 to April 2010; senior officer of Columbia Funds and affiliated funds since 2002. | |
|
35
Fund Governance (continued)
Officers (continued)
| Name, Year of Birth and Address | | Principal Occupation(s) During the Past Five Years | |
| Scott R. Plummer (Born 1959) | |
|
5228 Ameriprise Financial Center
Minneapolis, MN 55474
Senior Vice President and
Chief Legal Officer (since 2010) | | Chief Legal Officer and Assistant Secretary, Columbia Management Investment Advisers, LLC since June 2005; Vice President and Lead Chief Counsel—Asset Management, Ameriprise Financial, Inc. since May 2010 (previously Vice President and Chief Counsel—Asset Management, from 2005 to April 2010, and Vice President—Asset Management Compliance from 2004 to 2005); Vice President, Chief Counsel and Assistant Secretary, Columbia Management Investment Distributors, Inc. since 2008; Vice President, General Counsel and Secretary, Ameriprise Certificate Company since 2005; Chief Counsel, RiverSource Distributors, Inc. since 2006; Vice President, General Counsel and Secretary, RiverSource Funds, since December 2006; Senior Vice President, Secretary and Chief Legal Officer, Columbia Funds, since May 2010. | |
|
| Linda J. Wondrack (Born 1964) | |
|
225 Franklin Street
Boston, MA 02110
Senior Vice President and
Chief Compliance Officer (since 2007) | | Vice President and Chief Compliance Officer, Columbia Management Investment Advisers, LLC since May 2010; Chief Compliance Officer, Columbia Funds, since 2007, and RiverSource Funds, since May 2010; Director (Columbia Management Group, LLC and Investment Product Group Compliance), Bank of America, from June 2005 to April 2010. | |
|
| William F. Truscott (Born 1960) | |
|
53600 Ameriprise Financial Center
Minneapolis, MN 55474
Senior Vice President (since 2010) | | Chairman of the Board, Columbia Management Investment Advisers, LLC since May 2010 (previously President, Chairman of the Board and Chief Investment Officer, from 2001 to April 2010); Chief Executive Officer, U.S. Asset Management & President, Annuities, Ameriprise Financial, Inc. since May 2010 (previously President—U.S. Asset Management and Chief Investment Officer from 2005 to April 2010, and Senior Vice President—Chief Investment Officer, from 2001 to 2005); Director, President and Chief Executive Officer, Ameriprise Certificate Company since 2006; Director, Columbia Management Investment Distributors, Inc. since May 2010 (previously Chairman of the Board and Chief Executive Officer from 2008 to April 2010); Chairman of the Board and Chief Executive Officer, RiverSource Distributors, Inc. since 2006. | |
|
| Colin Moore (Born 1958) | |
|
225 Franklin Street
Boston, MA 02110
Senior Vice President (since 2010) | | Director and Chief Investment Officer, Columbia Management Investment Advisers, LLC since May 2010; Manager, Managing Director and Chief Investment Officer of Columbia Management Advisors, LLC from 2007 to April 2010; Head of Equities, Columbia Management Advisors, LLC from 2002 to 2007. | |
|
| Michael A. Jones (Born 1959) | |
|
225 Franklin Street
Boston, MA 02110
Senior Vice President (since 2010) | | President and Director, Columbia Management Investment Advisers, LLC since May 2010; President and Director, Columbia Management Investment Distributors, Inc. since May 2010; Manager, Chairman, Chief Executive Officer and President, Columbia Management Advisors, LLC from 2007 to April 2010; Chief Executive Officer, President and Director, Columbia Management Distributors, Inc. from November 2006 to April 2010; previously, co-president and senior managing director at Robeco Investment Management. | |
|
36
Fund Governance (continued)
Officers (continued)
| Name, Year of Birth and Address | | Principal Occupation(s) During the Past Five Years | |
| Christopher O. Petersen (Born 1970) | |
|
5228 Ameriprise Financial Center
Minneapolis, MN 55474
Vice President and
Secretary (since 2011) | | Vice President and Chief Counsel, Ameriprise Financial since January 2010 (formerly Vice President and Group Counsel or Counsel from April 2004 to January 2010); Assistant Secretary of RiverSource Funds since January 2007. | |
|
| Amy Johnson (Born 1965) | |
|
5228 Ameriprise Financial Center
Minneapolis, MN 55474
Vice President (since 2010) | | Senior Vice President and Chief Operating Officer, Columbia Management Investment Advisers, LLC since May 2010 (previously Chief Administrative Officer, from 2009 until April 2010, Vice President—Asset Management and Trust Company Services, from 2006 to 2009, and Vice President—Operations and Compliance from 2004 to 2006). | |
|
| Joseph F. DiMaria (Born 1968) | |
|
225 Franklin Street
Boston, MA 02110
Vice President (since 2011) and
Chief Accounting Officer (since 2008) | | Vice President, Mutual Fund Administration, Columbia Management Investment Advisers, LLC, since May 2010; Director of Fund Administration, Columbia Management Advisors, LLC from January 2006 to April 2010; Head of Tax/Compliance and Assistant Treasurer, Columbia Management Advisors, LLC, from November 2004 to December 2005. | |
|
| Paul B. Goucher (Born 1968) | |
|
5228 Ameriprise Financial Center
Minneapolis, MN 55474
Vice President and
Assistant Treasurer (since 2010) | | Vice President and Chief Counsel of Ameriprise Financial since January 2010 (formerly Vice President and Group Counsel from November 2008 to January 2010); Director, Managing Director and General Counsel of J. & W. Seligman & Co. Incorporated (Seligman) from July 2008 to November 2008 and Managing Director and Associate General Counsel of Seligman from January 2005 to July 2008. | |
|
| Michael E. DeFao (Born 1968) | |
|
5228 Ameriprise Financial Center
Minneapolis, MN 55474
Vice President and
Assistant Treasurer (since 2011) | | Vice President and Chief Counsel, Ameriprise Financial since May 2010; Associate General Counsel Bank of America from June 2005 to April 2010. | |
|
| Stephen T. Welsh (Born 1957) | |
|
225 Franklin Street
Boston, MA 02110
Vice President (since 2006) | | President and Director, Columbia Management Investment Services Corp. since May 2010; President and Director, Columbia Management Services, Inc. from July 2004 to April 2010; Managing Director, Columbia Management Distributors, Inc. from August 2007 to April 2010. | |
|
37
Shareholder Meeting Results
At a Joint Special Meeting of Shareholders held on February 15, 2011, shareholders of the series of Columbia Funds Series Trust, including the Fund, elected each of the nominees for trustees to the Board of Trustees of Columbia Funds Series Trust, each to hold office for an indefinite term, as follows:
| Trustee | | Votes For | | Votes Withheld | | Abstentions | |
| Kathleen Blatz | | | 2,145,636,122 | | | | 248,012,438 | | | | 0 | | |
| Edward J. Boudreau, Jr. | | | 2,145,430,114 | | | | 248,218,446 | | | | 0 | | |
| Pamela G. Carlton | | | 2,145,515,949 | | | | 248,132,612 | | | | 0 | | |
| William P. Carmichael | | | 2,145,038,695 | | | | 248,609,866 | | | | 0 | | |
| Patricia M. Flynn | | | 2,145,843,563 | | | | 247,804,997 | | | | 0 | | |
| William A. Hawkins | | | 2,145,359,401 | | | | 248,289,160 | | | | 0 | | |
| R. Glenn Hilliard | | | 2,145,079,400 | | | | 248,569,161 | | | | 0 | | |
| Stephen R. Lewis, Jr. | | | 2,145,092,209 | | | | 248,556,351 | | | | 0 | | |
| John F. Maher | | | 2,145,621,338 | | | | 248,027,223 | | | | 0 | | |
| John J. Nagorniak | | | 2,145,337,494 | | | | 248,311,067 | | | | 0 | | |
| Catherine James Paglia | | | 2,145,615,254 | | | | 248,033,306 | | | | 0 | | |
| Leroy C. Richie | | | 2,145,042,120 | | | | 248,606,441 | | | | 0 | | |
| Anthony M. Santomero | | | 2,145,088,174 | | | | 248,560,386 | | | | 0 | | |
| Minor M. Shaw | | | 2,145,430,762 | | | | 248,217,798 | | | | 0 | | |
| Alison Taunton-Rigby | | | 2,145,393,384 | | | | 248,255,177 | | | | 0 | | |
| William F. Truscott | | | 2,144,907,223 | | | | 248,741,338 | | | | 0 | | |
38
This page intentionally left blank.
This page intentionally left blank.
Important Information About This Report
The fund mails one shareholder report to each shareholder address. If you would like more than one report, please call shareholder services at 1-800-345-6611 and additional reports will be sent to you. This report has been prepared for shareholders of Columbia California Intermediate Municipal Bond Fund.
A description of the policies and procedures that the fund uses to determine how to vote proxies and a copy of the fund's voting records are available (i) at www.columbiamanagement.com, (ii) on the Securities and Exchange Commission's website at www.sec.gov, and (iii) without charge, upon request, by calling 1-800-368-0346. Information regarding how the fund voted proxies relating to portfolio securities during the 12-month period ended June 30 is available from the SEC's website. Information regarding how the fund voted proxies relating to portfolio securities is also available from the fund's website, www.columbiamanagement.com.
The fund files a complete schedule of portfolio holdings with the SEC for the first and third quarters of each fiscal year on Form N-Q. The fund's Form N-Q is available on the SEC's website at www.sec.gov and may be reviewed and copied at the SEC's Public Reference Room in Washington, D.C. Information on the operation of the Public Reference Room may be obtained by calling 1-800-SEC-0330.
Transfer Agent
Columbia Management Investment
Services Corp.
P.O. Box 8081
Boston, MA 02266-8081
1-800-345-6611
Distributor
Columbia Management Investment
Distributors, Inc.
225 Franklin Street
Boston, MA 02110
Investment Manager
Columbia Management Investment Advisers, LLC
225 Franklin Street
Boston, MA 02110
41

PRSRT STD
U.S. Postage
PAID
Holliston, MA
Permit NO. 20
Columbia California Intermediate Municipal Bond Fund
P. O. Box 8081
Boston, MA 02266-8081
columbiamanagement.com
This information is for use with concurrent or prior delivery of a fund prospectus. Investors should consider the investment objectives, risks, charges and expenses of a mutual fund carefully before investing. For a free prospectus, which contains this and other important information about the funds, visit columbiamanagement.com. Read the prospectus carefully before investing. The Fund is distributed by Columbia Management Investment Distributors, Inc., member FINRA, and managed by Columbia Management Investment Advisers, LLC.
© 2011 Columbia Management Investment Advisers, LLC. All rights reserved.
C-1081 A (05/11)

Columbia Short Term Bond Fund
Annual Report for the Period Ended March 31, 2011
Not FDIC insured • No bank guarantee • May lose value
Table of Contents
| Fund Profile | | | 1 | | |
|
| Economic Update | | | 2 | | |
|
| Performance Information | | | 4 | | |
|
| Understanding Your Expenses | | | 5 | | |
|
| Portfolio Managers' Report | | | 6 | | |
|
| Investment Portfolio | | | 8 | | |
|
Statement of Assets and
Liabilities | | | 18 | | |
|
| Statement of Operations | | | 20 | | |
|
Statement of Changes in
Net Assets | | | 21 | | |
|
| Financial Highlights | | | 24 | | |
|
| Notes to Financial Statements | | | 33 | | |
|
Report of Independent Registered
Public Accounting Firm | | | 44 | | |
|
| Fund Governance | | | 45 | | |
|
| Shareholder Meeting Results | | | 49 | | |
|
Important Information About
This Report | | | 53 | | |
|
The views expressed in this report reflect the current views of the respective parties. These views are not guarantees of future performance and involve certain risks, uncertainties and assumptions that are difficult to predict, so actual outcomes and results may differ significantly from the views expressed. These views are subject to change at any time based upon economic, market or other conditions and the respective parties disclaim any responsibility to update such views. These views may not be relied on as investment advice and, because investment decisions for a Columbia Fund are based on numerous factors, may not be relied on as an indication of trading intent on behalf of any particular Columbia Fund. References to specific securities should not be construed as a recommendation or investment advice.
President's Message

Dear Shareholder:
The Columbia Management story began over 100 years ago, and today, we are one of the nation's largest dedicated asset managers. The recent acquisition by Ameriprise Financial, Inc. brings together the talents, resources and capabilities of Columbia Management with those of RiverSource Investments, Threadneedle (acquired by Ameriprise in 2003) and Seligman Investments (acquired by Ameriprise in 2008) to build a best-in-class asset management business that we believe is truly greater than its parts.
RiverSource Investments traces its roots to 1894 when its then newly-founded predecessor, Investors Syndicate, offered a face-amount savings certificate that gave small investors the opportunity to build a safe and secure fund for retirement, education or other special needs. A mutual fund pioneer, Investors Syndicate launched Investors Mutual Fund in 1940. In the decades that followed, its mutual fund products and services lineup grew to include a full spectrum of styles and specialties. More than 110 years later, RiverSource continues to be a trusted financial products leader.
Threadneedle, a leader in global asset management and one of Europe's largest asset managers, offers sophisticated international experience from a dedicated U.K. management team. Headquartered in London, it is named for Threadneedle Street in the heart of the city's financial district, where British investors pioneered international and global investing. Threadneedle was acquired in 2003 and today operates as an affiliate of Columbia Management.
Seligman Investments' beginnings date back to the establishment of the investment firm J. & W. Seligman & Co. in 1864. In the years that followed, Seligman played a major role in the geographical expansion and industrial development of the United States. In 1874, President Ulysses S. Grant named Seligman as fiscal agent for the U.S. Navy—an appointment that would last through World War I. Seligman helped finance the westward path of the railroads and the building of the Panama Canal. The firm organized its first investment company in 1929 and began managing its first mutual fund in 1930. In 2008, J. & W. Seligman & Co. Incorporated was acquired and Seligman Investments became an offering brand of RiverSource Investments, LLC.
We are proud of the rich and distinctive history of these firms, the strength and breadth of products and services they offer, and the combined cultures of pioneering spirit and forward thinking. Together we are committed to providing more for our shareholders than ever before.
> A singular focus on our shareholders
Our business is asset management, so investors are our first priority. We dedicate our resources to identifying timely investment opportunities and provide a comprehensive choice of equity, fixed-income and alternative investments to help meet your individual needs.
> First-class research and thought leadership
We are dedicated to helping you take advantage of today's opportunities and anticipate tomorrow's. We stay abreast of the latest investment trends and ideas, using our collective insight to evaluate events and transform them into solutions you can use.
> A disciplined investment approach
We aren't distracted by passing fads. Our teams adhere to a rigorous investment process that helps ensure the integrity of our products and enables you and your financial advisor to match our solutions to your objectives with confidence.
When you choose Columbia Management, you can be confident that we will take the time to understand your needs and help you and your financial advisor identify the solutions that are right for you. Because at Columbia Management, we don't consider ourselves successful unless you are.
Sincerely,

J. Kevin Connaughton
President, Columbia Funds
Investors should consider the investment objectives, risks, charges and expenses of a mutual fund carefully before investing. For a free prospectus, which contains this and other important information about the funds, visit www.columbiamanagement.com. The prospectus should be read carefully before investing.
Columbia Funds are distributed by Columbia Management Investment Distributors, Inc., member FINRA, and managed by Columbia Management Investment Advisers, LLC.
© 2011 Columbia Management Investment Advisers, LLC. All rights reserved.
Fund Profile – Columbia Short Term Bond Fund
Summary
g For the 12-month period that ended March 31, 2011, the fund's Class A shares returned 2.57% without sales charge.
g The fund performed better than its benchmark, the Barclays Capital 1-3 Year Government/Credit Index1, but trailed the average return of the funds in its peer group, the Lipper Short Investment Grade Debt Classification.2
g The fund's performance benefited from its exposure to non-Treasury investment-grade sectors. Its interest rate positioning was shorter than the benchmark, which detracted from relative returns.
Portfolio Management
Leonard Aplet has co-managed the fund since 2004 and has been associated with the fund's adviser or the fund's previous adviser or its predecessors since 1987.
Gregory S. Liechty has co-managed the fund since 2010 and has been associated with the fund's adviser or the fund's previous adviser or its predecessors since 2005.
Ronald Stahl has co-managed the fund since 2006 and has been associated with the fund's adviser or the fund's previous adviser or its predecessors since 1998.
1The Barclays Capital 1-3 Year Government/Credit Index consists of Treasury or government agency securities and investment grade corporate debt securities with maturities of one to three years.
2Lipper Inc., a widely respected data provider in the industry, calculates an average total return (assuming reinvestment of distributions) for mutual funds with investment objectives similar to those of the fund. Lipper makes no adjustment for the effect of sales loads.
Indices are not available for investment, are not professionally managed and do not reflect sales charges, fees, brokerage commissions, taxes or other expenses of investing. Securities in the fund may not match those in an index.
Performance data quoted represents past performance and current performance may be lower or higher. Past performance is no guarantee of future results. The investment return and principal value will fluctuate so that shares, when redeemed, may be worth more or less than the original cost. Please visit www.columbiamanagement.com for daily and most recent month-end performance updates.
Summary
1-year return as of 03/31/11
| | +2.57% | |
|
|  | | | Class A shares
(without sales charges) | |
|
| | +2.08% | |
|
|  | | | Barclays Capital
1-3 Year Government/Credit
Index | |
|
1
Economic Update – Columbia Short Term Bond Fund
Summary
For the 12-month period that ended March 31, 2011
g Strengthening economic growth and rising interest rates kept a lid on most bond market sectors. The Barclays Capital Aggregate Bond Index delivered modest results. However, high-yield bonds were strong performers, as measured by the JPMorgan Developed BB High Yield Index.
Barclays
Aggregate Index | | JPMorgan
Index | |
|
 | |  | |
|
g The U.S. stock market, as measured by the S&P 500 Index, delivered solid returns, despite a summer 2010 correction. Foreign stock market returns were also positive, as measured by the MSCI EAFE Index (Net).
| S&P Index | | MSCI Index | |
|
 | |  | |
|
The U.S. economy continued to expand at a solid but uneven pace over the past 12 months, as measured by gross domestic product (GDP). Although lackluster second quarter 2010 GDP growth raised fears that the economy was losing steam and might lapse back into recession, the pace picked up in the third quarter of 2010, inspiring confidence among consumers, businesses and investors. GDP expanded by 2.6% in the third quarter and 3.1% in the fourth quarter. With the Federal Reserve Board (the Fed) providing additional monetary stimulus to shore up economic growth and the extension of key tax cuts for the next two years, expectations are for continued growth in 2011. However, early estimates of first quarter 2011 growth place it just under 2.0%, a disappointment after two strong quarters and a pick-up in employment.
Consumer spending on cars, clothing and other goods generally trended higher during the 12-month period, accelerating in the fourth quarter. Holiday spending rose 5.5% between November 5, 2010 and December 24, 2010, in all retail categories, excluding automobiles, compared with the same period in 2009, according to MasterCard Advisors' SpendingPulse, which tracks spending on all transactions including cash. Personal income surged in January 2011 as payroll tax cuts kicked in. The personal savings rate edged higher, ending February 2011, the last month for which data was available, at 5.8%.
News on the job front was increasingly positive. A good portion of the jobs added in March, April and May of 2010 were temporary, government-sponsored census positions, which began to unwind in June, July and August of 2010. However, private sector payroll employment began to trend higher in the third quarter, massive layoffs declined and job growth turned solidly positive, with the addition of 444,000 new jobs in the first quarter of 2011.
Despite some glimmers of improvement early in 2010, the housing market remained troublesome throughout the period. Both new and existing home sales fell after a federal tax credit for new and repeat homebuyers expired. Distressed properties pressured prices and foreclosures continued—another drag on prices. The inventory of unsold homes ended the period higher than it started, at 8.9 and 8.6 months for both new and existing homes, respectively, according to the National Association of Realtors and a joint release from the U.S. Census Bureau and the U.S. Department of Housing and Urban Development. The new year brought more disappointing news: Existing home sales fell in January 2011 after three months of sustained improvement. Tight credit and weak appraisals were cited as possible reasons for the decline.
Reports from the business side of the economy were generally positive. A key measure of the nation's manufacturing situation—the Institute for Supply Management's Index—took a somewhat surprising turn higher in the final months of the period. Technology spending rose 12% in 2010, according to the NPD Group, a national marketing research firm. Purchases of computers, networking and software returned to prerecession levels. Industrial production rose over the period, and manufacturing capacity utilized, per the report issued by the Fed—a key measure of the health of the manufacturing sector—also edged higher.
2
Economic Update (continued) – Columbia Short Term Bond Fund
Bonds delivered modest returns
As the economy strengthened and interest rates edged higher, most bond sectors delivered modest returns. The Barclays Capital Aggregate Bond Index1 returned 5.12%. High-yield bonds led the fixed-income markets. For the 12 months covered by this report, the JPMorgan Developed BB High Yield Index2 returned 13.04% as default fears abated and investors grew more comfortable with risk. Despite rising yields in the second half of the period, the Treasury market was also positive. The Barclays Capital U.S. Treasury Index3 returned 4.53%. However, municipal bonds struggled in the second half of the period, as interest rates inched higher and issue supply surged ahead of the year-end expiration of the Build America Bonds program. The Barclays Capital Municipal Bond Index4 gained 1.63% for the period. Despite positive economic activity, the Fed kept a key short-term interest rate—the federal funds rate—close to zero, reflecting ongoing concerns about employment and the housing market.
Stocks moved higher despite summer 2010 decline
Against a strengthening economic backdrop, stock prices continued to rally despite a summer 2010 setback linked to a debt crisis brewing in Europe, which raised concerns among U.S. investors. These fears were short-lived and stocks regained their footing. In this environment, the S&P 500 Index5 returned 15.65% for the 12 months through March 31, 2011. Outside the United States, stock markets also delivered solid gains. The MSCI EAFE Index (Net),6 a broad gauge of stock market performance in foreign developed markets, returned 10.42% (in U.S. dollars) for the 12-month period, as concerns about the impact of a bailout for weak euro zone economies eased yet continued to restrain market performance. Emerging stock markets were strong. The MSCI Emerging Markets Index (Net)7 returned 18.46% (in U.S. dollars) for the 12-month period.
Past performance is no guarantee of future results.
1The Barclays Capital Aggregate Bond Index is a market value-weighted index that tracks the daily price, coupon, pay-downs and total return performance of fixed-rate, publicly placed, dollar-denominated and non-convertible investment grade debt issues with at least $250 million par amount outstanding and with at least one year to final maturity.
2 The JPMorgan Developed BB High Yield Index is an unmanaged index designed to mirror the investable universe of the U.S. dollar developed, BB-rated, high yield corporate debt market.
3 The Barclays Capital U.S. Treasury Index includes public obligations of the U.S. Treasury. Treasury bills are excluded by the maturity constraint. In addition, certain special issues, such as state and local government series bonds (SLGs), as well as U.S. Treasury TIPS, are excluded. STRIPS are excluded from the index because their inclusion would result in double-counting.
4The Barclays Capital Municipal Bond Index is considered representative of the broad market for investment-grade, tax-exempt bonds with a maturity of at least one year
5The Standard & Poor's (S&P) 500 Index tracks the performance of 500 widely held, large-capitalization U.S. stocks.
6The Morgan Stanley Capital International Europe, Australasia, Far East (MSCI EAFE) Index (Net) is a free float-adjusted market capitalization index that is designed to measure the equity market performance of developed markets, excluding the U.S. & Canada. As of December 31, 2010, the MSCI EAFE Index (Net) consisted of the following 22 developed market country indices: Australia, Austria, Belgium, Denmark, Finland, France, Germany, Greece, Hong Kong, Ireland, Israel, Italy, Japan, the Netherlands, New Zealand, Norway, Portugal, Singapore, Spain, Sweden, Switzerland and the United Kingdom.
7The Morgan Stanley Capital International Emerging Markets (MSCI EM) Index (Net) is a free float-adjusted market capitalization index that is designed to measure equity market performance of emerging markets. As of December 31, 2010, the MSCI EM Index (Net) consisted of the following 21 emerging market country indices: Brazil, Chile, China, Colombia, Czech Republic, Egypt, Hungary, India, Indonesia, Korea, Malaysia, Mexico, Morocco, Peru, Philippines, Poland, Russia, South Africa, Taiwan, Thailand and Turkey.
Indices are not available for investment, are not professionally managed and do not reflect sales charges, fees, brokerage commissions, taxes or other expenses of investing. Securities in the fund may not match those in an index.
3
Performance Information – Columbia Short Term Bond Fund
Performance data quoted represents past performance and current performance may be lower or higher. Past performance is no guarantee of future results. The investment return and principal value will fluctuate so that shares, when redeemed, may be worth more or less than the original cost. Please visit www.columbiamanagement.com for daily and most recent month-end performance updates.
Performance of a $10,000 investment 04/01/01 – 03/31/11
The chart above shows the change in value of a hypothetical $10,000 investment in Class A shares of Columbia Short Term Bond Fund during the stated time period, and does not reflect the deduction of taxes that a shareholder may pay on fund distributions or on the redemption of fund shares.
Performance of a $10,000 investment 04/01/01 – 03/31/11 ($)
| Sales charge | | without | | with | |
| Class A | | | 14,331 | | | | 14,186 | | |
| Class B | | | 13,303 | | | | 13,303 | | |
| Class C | | | 13,623 | | | | 13,623 | | |
| Class I | | | n/a | | | | n/a | | |
| Class R | | | n/a | | | | n/a | | |
| Class R4 | | | n/a | | | | n/a | | |
| Class W | | | n/a | | | | n/a | | |
| Class Y | | | 14,685 | | | | n/a | | |
| Class Z | | | 14,682 | | | | n/a | | |
Average annual total return as of 03/31/11 (%)
| Share class | | A | | B | | C | | I | | R | | R4 | | W | | Y | | Z | |
| Inception | | 10/02/92 | | 06/07/93 | | 10/02/92 | | 09/27/10 | | 09/27/10 | | 03/07/11 | | 09/27/10 | | 07/15/09 | | 09/30/92 | |
| Sales charge | | without | | with | | without | | with | | without | | with | | without | | without | | without | | without | | without | | without | |
| 1-year | | | 2.57 | | | | 1.55 | | | | 1.80 | | | | –1.19 | | | | 2.25 | | | | 1.25 | | | | n/a | | | | n/a | | | | n/a | | | | n/a | | | | 2.84 | | | | 2.82 | | |
| 5-year | | | 4.27 | | | | 4.05 | | | | 3.49 | | | | 3.49 | | | | 3.94 | | | | 3.94 | | | | n/a | | | | n/a | | | | n/a | | | | n/a | | | | 4.53 | | | | 4.53 | | |
| 10-year/Life | | | 3.66 | | | | 3.56 | | | | 2.89 | | | | 2.89 | | | | 3.14 | | | | 3.14 | | | | 0.73 | | | | 0.37 | | | | 0.07 | | | | 0.48 | | | | 3.92 | | | | 3.92 | | |
The "with sales charge" returns include the maximum initial sales charge of 1.00% for Class A shares and the applicable contingent deferred sales charge of 3.00% in the first year, declining to 1.00% in the fourth year and eliminated thereafter for Class B shares and 1.00% for Class C shares for the first year only. The "without sales charge" returns do not include the effect of sales charges. If they had, returns would be lower.
Performance results reflect any fee waivers or reimbursements of fund expenses by the Investment Manager and/or any of its affiliates. Absent these fee waivers or expense reimbursement arrangements, performance results would have been lower.
All results shown assume reinvestment of distributions. Class I, Class Y, Class R4 and Class Z shares are sold at net asset value with no distribution and service (Rule 12b-1) fees. Class R shares are sold at net asset value with a distribution (Rule 12b-1) fee and Class W shares are sold at net asset value with a service (Rule 12b-1) fee. Class I, Class R, Class R4, Class W, Class Y and Class Z shares have limited eligibility and the investment minimum requirements may vary. Please see the fund's prospectus for details. Performance for different share classes will vary based on differences in sales charges and fees associated with each class.
The returns for Class Y shares include the returns for Class Z shares prior to July 15, 2009, the date on which Class Y shares were initially offered by the fund. The returns shown have not been adjusted to reflect any differences in expenses between Class Y shares and Class Z shares.
The tables do not reflect the deduction of taxes that a shareholder may pay on fund distributions or on the redemption of fund shares.
Class I, Class R and Class W shares were initially offered on September 27, 2010. Class R4 shares were initially offered on March 7, 2011.
4
Understanding Your Expenses – Columbia Short Term Bond Fund
As a fund shareholder, you incur two types of costs. There are transaction costs, which generally include sales charges on purchases and may include redemption fees or exchange fees. There are also ongoing costs, which generally include investment advisory fees, distribution and service (Rule 12b-1) fees and other fund expenses. The information on this page is intended to help you understand the ongoing costs of investing in the fund and to compare these costs with the ongoing costs of investing in other mutual funds.
Analyzing your fund's expenses by share class
To illustrate these ongoing costs, we have provided an example and calculated the expenses paid by investors in each share class during the period. The information in the following table is based on an initial investment of $1,000, which is invested at the beginning of the period and held for the entire period. Expense information is calculated two ways and each method provides you with different information. The amount listed in the "Actual" column is calculated using the fund's actual operating expenses and total return for the period. The amount listed in the "Hypothetical" column for each share class assumes that the return each year is 5% before expenses and is calculated based on the fund's actual operating expenses. You should not use the hypothetical account values and expenses to estimate either your actual account balance at the end of the period or the expenses you paid during this period.
Compare with other funds
Since all mutual funds are required to include the same hypothetical calculations about expenses in shareholder reports, you can use this information to compare the ongoing cost of investing in the fund with other funds. To do so, compare the 5% hypothetical example with the 5% hypothetical examples that appear in the shareholder reports of other funds. As you compare hypothetical examples of other funds, it is important to note that hypothetical examples are meant to highlight the ongoing costs of investing in a fund and do not reflect any transaction costs, such as sales charges, redemption fees or exchange fees.
Estimating your actual expenses
To estimate the expenses that you paid over the period, first you will need your account balance at the end of the period:
g For shareholders who receive their account statements from Columbia Management Investment Services Corp., your account balance is available online at www.columbiamanagement.com or by calling Shareholder Services at 800.345.6611.
g For shareholders who receive their account statements from their financial intermediary, contact your financial intermediary to obtain your account balance.
1. Divide your ending account balance by $1,000. For example, if an account balance was $8,600 at the end of the period, the result would be 8.6.
2. In the section of the table below titled "Expenses paid during the period," locate the amount for your share class. You will find this number in the column labeled "Actual." Multiply this number by the result from step 1. Your answer is an estimate of the expenses you paid on your account during the period.
If the value of your account falls below the minimum initial investment requirement applicable to you, your account may be subject to a $20 annual fee. This fee is not included in the accompanying table. If you are subject to the fee, keep it in mind when you are estimating the ongoing expenses of investing in the fund and when comparing the expenses of this fund with other funds.
10/01/10 – 3/31/11
| | | Account value at the
beginning of the period ($) | | Account value at the
end of the period ($) | | Expenses paid
during the period ($) | | Fund's annualized
expense ratio (%) | |
| | | Actual | | Hypothetical | | Actual | | Hypothetical | | Actual | | Hypothetical | | Actual | |
| Class A | | | 1,000.00 | | | | 1,000.00 | | | | 1,004.70 | | | | 1,021.29 | | | | 3.65 | | | | 3.68 | | | | 0.73 | | |
| Class B | | | 1,000.00 | | | | 1,000.00 | | | | 1,000.90 | | | | 1,017.55 | | | | 7.38 | | | | 7.44 | | | | 1.48 | | |
| Class C | | | 1,000.00 | | | | 1,000.00 | | | | 1,003.10 | | | | 1,019.75 | | | | 5.19 | | | | 5.24 | | | | 1.04 | | |
| Class I | | | 1,000.00 | | | | 1,000.00 | | | | 1,007.10 | | | | 1,022.64 | | | | 2.30 | | | | 2.32 | | | | 0.46 | | |
| Class R | | | 1,000.00 | | | | 1,000.00 | | | | 1,003.50 | | | | 1,019.75 | | | | 5.19 | | | | 5.24 | | | | 1.04 | | |
| Class R4 | | | 1,000.00 | | | | 1,000.00 | | | | 1,000.70 | * | | | 1,022.94 | | | | 0.27 | * | | | 2.02 | | | | 0.40 | | |
| Class W | | | 1,000.00 | | | | 1,000.00 | | | | 1,004.60 | | | | 1,021.09 | | | | 3.85 | | | | 3.88 | | | | 0.77 | | |
| Class Y | | | 1,000.00 | | | | 1,000.00 | | | | 1,006.00 | | | | 1,022.79 | | | | 2.15 | | | | 2.17 | | | | 0.43 | | |
| Class Z | | | 1,000.00 | | | | 1,000.00 | | | | 1,005.90 | | | | 1,022.54 | | | | 2.40 | | | | 2.42 | | | | 0.48 | | |
Expenses paid during the period are equal to the annualized expense ratio for the share class, multiplied by the average account value over the period, then multiplied by the number of days in the fund's most recent fiscal half-year and divided by 365.
Had the Investment Manager and/or any of its affiliates not waived fees or reimbursed a portion of expenses, account value at the end of the period would have been reduced
It is important to note that the expense amounts shown in the table are meant to highlight only ongoing costs of investing in the fund and do not reflect any transaction costs, such as sales charges, redemption fees or exchange fees. Therefore, the hypothetical examples provided may not help you determine the relative total costs of owning shares of different funds. If these transaction costs were included, your costs would have been higher.
* For the period March 7, 2011 through March 31, 2011. Class R4 shares commenced operations on March 7, 2011.
5
Portfolio Managers' Report – Columbia Short Term Bond Fund
Performance data quoted represents past performance and current performance may be lower or higher. Past performance is no guarantee of future results. The investment return and principal value will fluctuate so that shares, when redeemed, may be worth more or less than the original cost. Please visit www.columbiamanagement.com for daily and most recent month-end performance updates.
Net asset value per share
as of 03/31/11 ($)
| Class A | | | 9.94 | | |
| Class B | | | 9.93 | | |
| Class C | | | 9.93 | | |
| Class I | | | 9.93 | | |
| Class R | | | 9.94 | | |
| Class R4 | | | 9.92 | | |
| Class W | | | 9.94 | | |
| Class Y | | | 9.92 | | |
| Class Z | | | 9.92 | | |
Distributions declared per share
04/01/10 – 03/31/11 ($)
| Class A | | | 0.26 | | |
| Class B | | | 0.19 | | |
| Class C | | | 0.23 | | |
| Class I | | | 0.14 | | |
| Class R | | | 0.12 | | |
| Class R4 | | | 0.02 | | |
| Class W | | | 0.13 | | |
| Class Y | | | 0.29 | | |
| Class Z | | | 0.29 | | |
Portfolio structure
as of 03/31/11 (%)
Corporate Fixed-Income
Bonds & Notes | | | 30.0 | | |
Collateralized Mortgage
Obligations | | | 23.1 | | |
| Asset-Backed Securities | | | 15.5 | | |
Government & Agency
Obligations | | | 10.6 | | |
| Mortgage-Backed Securities | | | 10.0 | | |
Commercial Mortgage-Backed
Securities | | | 9.0 | | |
| Municipal Bond | | | 0.5 | | |
| Short-Term Obligation | | | 1.7 | | |
| Other Assets & Liabilities, Net | | | –0.4 | | |
The fund is actively managed and the composition of its portfolio will change over time. Portfolio structure is calculated as a percentage of net assets.
For the 12-month period that ended March 31, 2011, the fund's Class A shares returned 2.57% without sales charge. The fund outperformed its benchmark, the Barclays Capital 1-3 Year Government/Credit Index, which returned 2.08%. The fund's return was slightly lower than the 3.03% average return of the funds in its peer group, the Lipper Short Investment Grade Debt Funds Classification. In an environment of generally modest returns from fixed-income securities, fund performance benefited most from its exposure to non-Treasury investment-grade sectors. The fund's duration and high quality emphasis were a slight drag on performance. Duration is a measure of interest-rate sensitivity.
The fund's positioning aided returns
During the period, we reduced the fund's exposure to Treasury issues and increased its weight in corporate bonds, primarily in the financials sector, and also to commercial mortgage-backed securities (CMBS). This reallocation had a positive impact on performance as both sectors were among the best performers for the year. Within the fund's corporate bond holdings, an emphasis on real estate investment trusts (REITs), banks and insurance had a positive impact on results, as these groups outperformed the rest of the corporate market. The fund was also overweighted in wireless communications and natural gas, which were good performers within the corporate market.
Structured securities, including mortgage- and asset-backed securities (MBS &ABS), also performed well during the period. CMBS benefited from improving underlying property fundamentals, limited supply and cheapness relative to other short-term market segments. The government's efforts to revive the MBS and ABS sectors of the market have worked, and the yield difference among different types of bonds has remained narrow.
During the period, we employed a barbell strategy to take advantage of the distribution of yields along the Treasury yield curve—a graphic depiction of yields from short-term to long term, which for this fund is five years. This strategy aided returns as five-year yields declined more than yields on two-year securities, which is the midpoint of the range of maturities for the fund. (Remember, bond prices and yields move in opposite directions.)
Interest rate positioning, quality selection detracted from return
The fund's interest rate positioning, as measured by its duration, was shorter than the benchmark index. This had a modestly negative impact on performance as interest rates declined during the period, and a longer duration would have added to returns. Meanwhile, lower quality securities outperformed across all sectors of the bond market, and the fund's higher quality emphasis also hampered performance.
Looking ahead
We believe the U.S. economy is starting to enter the expansion phase of its current economic cycle. We see the possibility of inflation ticking upward, as commodities prices move higher. We plan to proceed with caution amid concerns about the cumulative effects of Federal Reserve Board stimulus and continued weakness in the housing market. Because we believe that there is more room for short-term rates to rise than to decline, we plan to keep the fund's duration slightly shorter than the benchmark. We plan to maintain the fund's barbell positioning to take advantage of the current distribution of yields. We have added to the fund's position in floating-rate securities, which contribute to the barbell and should benefit the fund when short-term rates begin to rise, because yields on floating-rate securities reset frequently.
6
Portfolio Managers' Report (continued) – Columbia Short Term Bond Fund
We continue to favor shorter-maturity CMBS, because their yields relative to Treasuries look attractive. Within ABS, we continue to favor well-secured, very short-term AAA-rated auto securities and have been adding certain AAA-rated floating-rate ABS issues to the portfolio. We also have invested in short-term government agency collateralized mortgage obligations (CMO) which we believe are attractively priced. We continue to favor corporate bonds, and continue to emphasize banks, REIT, natural gas and communications within the sector.
Portfolio characteristics and holdings are subject to change periodically and may not be representative of current characteristics and holdings. The outlook for the fund may differ from that presented for other Columbia Funds.
Investing in fixed-income securities may involve certain risks, including the credit quality of individual issuers, possible prepayments, market or economic developments and yields and share price fluctuations due to changes in interest rates. When interest rates go up, bond prices typically drop, and vice versa.
Investments in real estate securities can be subject to fluctuations in the value of the underlying properties, the effect of economic conditions on real estate values, changes in interest rates and risks related to renting properties, such as rental defaults.
Any guarantee by the U.S. Government, it agencies or instrumentalities applies only to the payment of principal and interest on the guaranteed security and does not guarantee the yield or value of that security.
Top 10 holdings
as of 03/31/11 (%)
U.S. Treasury Notes
2.000% 01/31/16 | | | 3.7 | | |
U.S. Treasury Notes
1.375% 03/15/13 | | | 2.5 | | |
General Electric Capital Corp.
0.570% 09/15/14 | | | 1.4 | | |
Federal Home Loan
Mortgage Corp.
4.500% 08/01/24 | | | 1.1 | | |
Federal Home Loan
Mortgage Corp.
3.000% 08/15/20 | | | 1.1 | | |
Federal Home Loan
Mortgage Corp.
3.500% 12/15/20 | | | 1.0 | | |
U.S. Treasury Inflation
Indexed Notes
3.000% 07/15/12 | | | 1.0 | | |
U.S. Treasury Notes
1.375% 11/30/15 | | | 1.0 | | |
CitiFinancial Auto Issuance Trust
2.590% 10/15/13 | | | 0.9 | | |
Federal Home Loan
Mortgage Corp.
3.000% 10/15/18 | | | 0.8 | | |
Top 10 holdings are calculated as a percentage of net assets.
Quality breakdown
as of 03/31/11 (%)
| Treasury | | | 8.2 | | |
| Agency | | | 31.8 | | |
| AAA | | | 20.5 | | |
| AA | | | 12.2 | | |
| A | | | 14.1 | | |
| BBB | | | 12.2 | | |
| Cash & Equivalents | | | 1.0 | | |
Quality breakdown is calculated as a percentage of total investments.
Ratings shown in the quality breakdown are assigned to individual bonds by taking the lower of the ratings available from one of the following nationally recognized rating agencies: Standard & Poor's or Moody's Investor Services. If a security is rated by only one of the two agencies, that rating is used. If a security is not rated by either of the two agencies, it is designated as Non-Rated. Ratings are relative and subjective and are not absolute standards of quality. The credit quality of the fund's investments does not remove market risk.
The fund is actively managed and the composition of its portfolio will change over time.
30-day SEC yields
as of 03/31/11 (%)
| Class A | | | 1.78 | | |
| Class B | | | 1.04 | | |
| Class C | | | 1.76 | | |
| Class I | | | 2.06 | | |
| Class R | | | 1.36 | | |
| Class W | | | 1.86 | | |
| Class Y | | | 2.10 | | |
| Class Z | | | 2.05 | | |
The 30-day SEC yields reflect the fund's earning power, net of expenses, expressed as an annualized percentage of the public offering price per share at the end of the period. Had the Investment Manager and/or its affiliates not waived fees or reimbursed a portion of expenses, the 30-day SEC yields would have been lower.
7
Investment Portfolio – Columbia Short Term Bond Fund
March 31, 2011
| Corporate Fixed-Income Bonds & Notes – 30.0% | |
| | | Par ($) | | Value ($) | |
| Basic Materials – 1.0% | |
| Chemicals – 0.4% | |
Dow Chemical Co.
5.900% 02/15/15 | | | 6,835,000 | | | | 7,575,634 | | |
Lubrizol Corp.
5.500% 10/01/14 | | | 1,636,000 | | | | 1,827,081 | | |
| Chemicals Total | | | 9,402,715 | | |
| Iron/Steel – 0.3% | |
ArcelorMittal USA, Inc.
6.500% 04/15/14 | | | 7,580,000 | | | | 8,351,750 | | |
| Iron/Steel Total | | | 8,351,750 | | |
| Metals & Mining – 0.3% | |
Vale Inco Ltd.
7.750% 05/15/12 | | | 6,355,000 | | | | 6,806,510 | | |
| Metals & Mining Total | | | 6,806,510 | | |
| Basic Materials Total | | | 24,560,975 | | |
| Communications – 4.3% | |
| Media – 1.5% | |
DIRECTV Holdings LLC
3.550% 03/15/15 | | | 7,210,000 | | | | 7,366,911 | | |
NBC Universal, Inc.
2.100% 04/01/14 (a) | | | 10,000,000 | | | | 9,953,540 | | |
RR Donnelley & Sons Co.
6.125% 01/15/17 | | | 7,160,000 | | | | 7,442,620 | | |
TCM Sub LLC
3.550% 01/15/15 (a) | | | 1,605,000 | | | | 1,642,856 | | |
Time Warner, Inc.
3.150% 07/15/15 | | | 9,285,000 | | | | 9,390,331 | | |
| Media Total | | | 35,796,258 | | |
| Telecommunication Services – 2.8% | |
America Movil S.A. de C.V.
5.500% 03/01/14 | | | 7,420,000 | | | | 8,094,203 | | |
AT&T, Inc.
6.700% 11/15/13 | | | 10,000,000 | | | | 11,256,420 | | |
Deutsche Telekom International Finance BV
5.875% 08/20/13 | �� | | 5,000,000 | | | | 5,485,620 | | |
Telecom Italia Capital SA
5.250% 10/01/15 | | | 7,785,000 | | | | 8,057,942 | | |
Telefonica Emisiones SAU
4.949% 01/15/15 | | | 12,000,000 | | | | 12,661,452 | | |
Verizon Virginia, Inc.
4.625% 03/15/13 | | | 10,133,000 | | | | 10,686,454 | | |
Vodafone Group PLC
5.375% 01/30/15 | | | 9,038,000 | | | | 9,950,522 | | |
| Telecommunication Services Total | | | 66,192,613 | | |
| Communications Total | | | 101,988,871 | | |
| | | Par ($) | | Value ($) | |
| Consumer Cyclical – 0.3% | |
| Retail – 0.3% | |
CVS Caremark Corp.
3.250% 05/18/15 | | | 6,000,000 | | | | 6,094,878 | | |
| Retail Total | | | 6,094,878 | | |
| Consumer Cyclical Total | | | 6,094,878 | | |
| Consumer Non-Cyclical – 2.9% | |
| Beverages – 1.1% | |
Anheuser-Busch InBev Worldwide, Inc.
2.500% 03/26/13 | | | 6,500,000 | | | | 6,631,970 | | |
Bottling Group LLC
6.950% 03/15/14 | | | 5,000,000 | | | | 5,758,750 | | |
Diageo Capital PLC
5.200% 01/30/13 | | | 5,600,000 | | | | 6,002,461 | | |
Miller Brewing Co.
5.500% 08/15/13 (a) | | | 4,460,000 | | | | 4,847,195 | | |
SABMiller PLC
5.700% 01/15/14 (a) | | | 2,360,000 | | | | 2,589,498 | | |
| Beverages Total | | | 25,829,874 | | |
| Food – 0.3% | |
Kraft Foods, Inc.
2.625% 05/08/13 | | | 6,650,000 | | | | 6,805,909 | | |
| Food Total | | | 6,805,909 | | |
| Healthcare Products – 0.1% | |
Hospira, Inc.
5.900% 06/15/14 | | | 2,000,000 | | | | 2,201,820 | | |
| 6.050% 03/30/17 | | | 509,000 | | | | 564,072 | | |
| Healthcare Products Total | | | 2,765,892 | | |
| Healthcare Services – 0.4% | |
Roche Holdings, Inc.
5.000% 03/01/14 (a) | | | 3,945,000 | | | | 4,300,614 | | |
UnitedHealth Group, Inc.
5.500% 11/15/12 | | | 3,641,000 | | | | 3,897,931 | | |
| Healthcare Services Total | | | 8,198,545 | | |
| Pharmaceuticals – 1.0% | |
Cardinal Health, Inc.
4.000% 06/15/15 | | | 8,770,000 | | | | 9,056,604 | | |
Express Scripts, Inc.
6.250% 06/15/14 | | | 5,080,000 | | | | 5,642,851 | | |
Pfizer, Inc.
4.500% 02/15/14 | | | 8,830,000 | | | | 9,540,577 | | |
| Pharmaceuticals Total | | | 24,240,032 | | |
| Consumer Non-Cyclical Total | | | 67,840,252 | | |
See Accompanying Notes to Financial Statements.
8
Columbia Short Term Bond Fund
March 31, 2011
| Corporate Fixed-Income Bonds & Notes (continued) | |
| | | Par ($) | | Value ($) | |
| Energy – 2.4% | |
| Oil & Gas – 0.9% | |
Anadarko Petroleum Corp.
7.625% 03/15/14 | | | 6,650,000 | | | | 7,591,487 | | |
Canadian Natural Resources Ltd.
5.450% 10/01/12 | | | 4,100,000 | | | | 4,342,880 | | |
Ras Laffan Liquefied Natural Gas Co. Ltd. III
4.500% 09/30/12 (a) | | | 9,250,000 | | | | 9,561,965 | | |
| Oil & Gas Total | | | 21,496,332 | | |
| Oil & Gas Services – 0.4% | |
Weatherford International Ltd.
5.150% 03/15/13 | | | 139,000 | | | | 147,124 | | |
| 6.350% 06/15/17 | | | 7,530,000 | | | | 8,321,983 | | |
| Oil & Gas Services Total | | | 8,469,107 | | |
| Pipelines – 1.1% | |
Energy Transfer Partners LP
8.500% 04/15/14 | | | 6,000,000 | | | | 7,011,036 | | |
Plains All American Pipeline LP
4.250% 09/01/12 | | | 5,000,000 | | | | 5,190,170 | | |
TransCanada PipeLines Ltd.
3.400% 06/01/15 | | | 6,385,000 | | | | 6,542,816 | | |
Williams Partners LP
7.250% 02/01/17 | | | 6,290,000 | | | | 7,366,515 | | |
| Pipelines Total | | | 26,110,537 | | |
| Energy Total | | | 56,075,976 | | |
| Financials – 15.8% | |
| Banks – 11.0% | |
ANZ National International Ltd.
1.309% 12/20/13
(06/20/11) (a)(b)(c) | | | 10,000,000 | | | | 10,010,540 | | |
Barclays Bank PLC
3.900% 04/07/15 | | | 12,325,000 | | | | 12,749,411 | | |
BNP Paribas
1.203% 01/10/14
(04/11/11) (b)(c) | | | 11,830,000 | | | | 11,900,874 | | |
Canadian Imperial Bank of Commerce
1.450% 09/13/13 | | | 2,000,000 | | | | 1,992,608 | | |
Capital One Financial Corp.
6.250% 11/15/13 | | | 9,160,000 | | | | 10,079,728 | | |
Citigroup, Inc.
5.500% 10/15/14 | | | 16,690,000 | | | | 18,001,834 | | |
Commonwealth Bank of Australia
1.039% 03/17/14
(06/17/11) (a)(b)(c) | | | 3,200,000 | | | | 3,195,392 | | |
| 3.750% 10/15/14 (a) | | | 11,000,000 | | | | 11,419,573 | | |
Cooperatieve Centrale Raiffeisen-Boerenleenbank BA
1.850% 01/10/14 | | | 12,000,000 | | | | 11,977,956 | | |
| | | Par ($) | | Value ($) | |
Goldman Sachs Group, Inc.
3.700% 08/01/15 | | | 10,000,000 | | | | 10,073,790 | | |
HSBC Bank PLC
1.103% 01/17/14
(04/17/11) (a)(b)(c) | | | 11,250,000 | | | | 11,253,071 | | |
ING Bank NV
1.623% 10/18/13
(04/18/11) (a)(b)(c) | | | 12,500,000 | | | | 12,552,725 | | |
JPMorgan Chase & Co.
1.103% 01/24/14
(04/24/11) (b)(c) | | | 18,300,000 | | | | 18,401,162 | | |
Keycorp
3.750% 08/13/15 | | | 8,000,000 | | | | 8,055,528 | | |
Lloyds TSB Bank PLC
4.875% 01/21/16 | | | 10,000,000 | | | | 10,311,240 | | |
Merrill Lynch & Co., Inc.
5.000% 01/15/15 | | | 17,200,000 | | | | 18,196,774 | | |
Morgan Stanley
0.603% 01/09/14
(04/11/11) (b)(c) | | | 9,795,000 | | | | 9,640,876 | | |
Royal Bank of Scotland PLC
3.950% 09/21/15 | | | 11,315,000 | | | | 11,293,910 | | |
Santander US Debt SA Unipersonal
2.991% 10/07/13 (a) | | | 10,300,000 | | | | 10,235,069 | | |
Svenska Handelsbanken AB
2.875% 09/14/12 (a) | | | 12,155,000 | | | | 12,449,479 | | |
U.S. Bank N.A.
6.300% 02/04/14 | | | 11,200,000 | | | | 12,466,082 | | |
Wachovia Corp.
0.494% 08/01/13
(05/03/11) (b)(c) | | | 11,010,000 | | | | 10,945,548 | | |
Westpac Banking Corp.
1.040% 12/09/13
(06/09/11) (b)(c) | | | 10,000,000 | | | | 10,023,690 | | |
| Banks Total | | | 257,226,860 | | |
| Diversified Financial Services – 2.0% | |
ERAC USA Finance LLC
5.600% 05/01/15 (a) | | | 7,000,000 | | | | 7,613,648 | | |
General Electric Capital Corp.
0.570% 09/15/14
(06/15/11) (b)(c) | | | 32,325,000 | | | | 31,908,622 | | |
Woodside Finance Ltd.
4.500% 11/10/14 (a) | | | 5,225,000 | | | | 5,523,015 | | |
| 8.125% 03/01/14 (a) | | | 2,070,000 | | | | 2,377,892 | | |
| Diversified Financial Services Total | | | 47,423,177 | | |
| Insurance – 1.7% | |
Berkshire Hathaway, Inc.
0.742% 02/11/13
(05/11/11) (b)(c) | | | 4,969,000 | | | | 4,999,857 | | |
CNA Financial Corp.
5.850% 12/15/14 | | | 6,585,000 | | | | 7,099,697 | | |
See Accompanying Notes to Financial Statements.
9
Columbia Short Term Bond Fund
March 31, 2011
| Corporate Fixed-Income Bonds & Notes (continued) | |
| | | Par ($) | | Value ($) | |
Lincoln National Corp.
4.750% 02/15/14 | | | 1,855,000 | | | | 1,949,167 | | |
| 5.650% 08/27/12 | | | 5,300,000 | | | | 5,605,932 | | |
MetLife Institutional Funding II
1.207% 04/04/14 (a)(b)(d) | | | 11,215,000 | | | | 11,214,626 | | |
Prudential Financial, Inc.
6.100% 06/15/17 | | | 1,700,000 | | | | 1,870,500 | | |
Travelers Property Casualty Corp.
5.000% 03/15/13 | | | 6,741,000 | | | | 7,202,435 | | |
| Insurance Total | | | 39,942,214 | | |
| Real Estate Investment Trusts (REITs) – 1.1% | |
Camden Property Trust
5.875% 11/30/12 | | | 6,160,000 | | | | 6,533,961 | | |
Duke Realty LP
7.375% 02/15/15 | | | 5,340,000 | | | | 6,061,156 | | |
Kimco Realty Corp.
4.300% 02/01/18 | | | 6,300,000 | | | | 6,282,833 | | |
Simon Property Group LP
4.900% 01/30/14 | | | 7,760,000 | | | | 8,297,559 | | |
| Real Estate Investment Trusts (REITs) Total | | | 27,175,509 | | |
| Financials Total | | | 371,767,760 | | |
| Industrials – 0.9% | |
| Machinery – 0.3% | |
John Deere Capital Corp.
4.500% 04/03/13 | | | 6,215,000 | | | | 6,608,522 | | |
| Machinery Total | | | 6,608,522 | | |
| Miscellaneous Manufacturing – 0.6% | |
Ingersoll-Rand Global Holding Co., Ltd.
9.500% 04/15/14 | | | 6,002,000 | | | | 7,203,498 | | |
Tyco International Finance SA
4.125% 10/15/14 | | | 2,000,000 | | | | 2,123,616 | | |
| 6.000% 11/15/13 | | | 4,337,000 | | | | 4,801,250 | | |
| Miscellaneous Manufacturing Total | | | 14,128,364 | | |
| Industrials Total | | | 20,736,886 | | |
| Technology – 0.5% | |
| Computers – 0.2% | |
Electronic Data Systems Corp.
6.000% 08/01/13 | | | 4,500,000 | | | | 4,956,511 | | |
| Computers Total | | | 4,956,511 | | |
| Software – 0.3% | |
Oracle Corp.
3.750% 07/08/14 | | | 6,000,000 | | | | 6,368,100 | | |
| Software Total | | | 6,368,100 | | |
| Technology Total | | | 11,324,611 | | |
| | | Par ($) | | Value ($) | |
| Utilities – 1.9% | |
| Electric – 1.5% | |
CenterPoint Energy Houston Electric LLC
5.750% 01/15/14 (a) | | | 1,000,000 | | | | 1,096,219 | | |
Consolidated Edison Co. of New York, Inc.
4.875% 02/01/13 | | | 5,193,000 | | | | 5,506,294 | | |
| 5.550% 04/01/14 | | | 265,000 | | | | 289,651 | | |
Detroit Edison Co.
6.400% 10/01/13 | | | 4,205,000 | | | | 4,700,483 | | |
National Rural Utilities Cooperative Finance Corp.
5.500% 07/01/13 | | | 9,325,000 | | | | 10,174,340 | | |
Nevada Power Co.
5.950% 03/15/16 | | | 1,000,000 | | | | 1,116,532 | | |
Nisource Finance Corp.
6.150% 03/01/13 | | | 4,305,000 | | | | 4,666,887 | | |
Ohio Power Co.
5.750% 09/01/13 | | | 5,870,000 | | | | 6,390,863 | | |
Progress Energy, Inc.
6.050% 03/15/14 | | | 1,845,000 | | | | 2,040,245 | | |
| Electric Total | | | 35,981,514 | | |
| Gas – 0.4% | |
Atmos Energy Corp.
5.125% 01/15/13 | | | 1,960,000 | | | | 2,057,418 | | |
Sempra Energy
8.900% 11/15/13 | | | 5,230,000 | | | | 6,084,477 | | |
| Gas Total | | | 8,141,895 | | |
| Utilities Total | | | 44,123,409 | | |
Total Corporate Fixed-Income Bonds & Notes
(cost of $688,956,280) | | | 704,513,618 | | |
| Collateralized Mortgage Obligations – 23.1% | |
| Agency – 20.6% | |
Federal Home Loan Mortgage Corp.
2.750% 09/15/18 | | | 11,710,635 | | | | 11,929,808 | | |
| 3.000% 10/15/18 | | | 12,225,000 | | | | 12,536,363 | | |
| 3.000% 10/15/18 | | | 18,690,000 | | | | 19,166,023 | | |
| 3.000% 08/15/20 | | | 25,000,000 | | | | 25,638,392 | | |
| 3.250% 07/15/24 | | | 628,318 | | | | 643,777 | | |
| 3.500% 12/15/20 | | | 22,851,289 | | | | 23,674,607 | | |
| 3.100% 08/15/19 | | | 4,210,653 | | | | 4,326,494 | | |
| 3.200% 07/15/19 | | | 10,876,347 | | | | 11,191,206 | | |
| 3.500% 01/15/17 | | | 911,040 | | | | 926,805 | | |
| 4.000% 08/15/16 | | | 309,817 | | | | 313,593 | | |
| 4.000% 12/15/17 | | | 13,582,805 | | | | 14,282,769 | | |
| 4.250% 04/15/33 | | | 823,825 | | | | 853,384 | | |
| 4.500% 03/15/17 | | | 262,919 | | | | 265,827 | | |
| 4.500% 03/15/19 | | | 6,829,142 | | | | 7,134,074 | | |
| 4.500% 07/15/22 | | | 11,705,985 | | | | 12,248,934 | | |
See Accompanying Notes to Financial Statements.
10
Columbia Short Term Bond Fund
March 31, 2011
| Collateralized Mortgage Obligations (continued) | |
| | | Par ($) | | Value ($) | |
| 4.500% 09/25/24 | | | 17,625,167 | | | | 18,425,184 | | |
| 4.500% 01/15/29 | | | 4,834,552 | | | | 4,898,858 | | |
| 4.500% 11/15/32 | | | 4,053,260 | | | | 4,263,904 | | |
| 4.500% 05/15/39 | | | 7,545,989 | | | | 7,943,142 | | |
| 4.750% 08/15/19 | | | 13,020,711 | | | | 13,679,496 | | |
| 4.750% 08/15/19 | | | 14,287,064 | | | | 15,009,921 | | |
| 5.000% 07/15/17 | | | 6,247,808 | | | | 6,641,072 | | |
| 5.000% 02/15/21 | | | 7,567,110 | | | | 7,903,565 | | |
| 5.000% 10/15/34 | | | 1,917,376 | | | | 2,002,536 | | |
| 5.000% 12/15/35 | | | 7,731,874 | | | | 8,116,780 | | |
| 5.000% 10/15/36 | | | 13,311,232 | | | | 14,016,859 | | |
| 5.000% 07/15/37 | | | 8,211,909 | | | | 8,639,709 | | |
| 5.125% 10/15/15 | | | 368,984 | | | | 371,402 | | |
| 5.350% 05/15/29 | | | 4,224,165 | | | | 4,294,891 | | |
| 5.500% 08/15/13 | | | 151,516 | | | | 155,049 | | |
| 5.500% 12/15/19 | | | 5,873,332 | | | | 6,155,943 | | |
| 5.500% 01/15/29 | | | 1,320,111 | | | | 1,331,629 | | |
| 5.500% 10/15/29 | | | 85,698 | | | | 85,692 | | |
| 5.500% 12/15/31 | | | 3,310,836 | | | | 3,470,839 | | |
Federal National Mortgage Association
(e) 05/25/23 | | | 697,821 | | | | 620,172 | | |
| 2.500% 09/25/24 | | | 7,301,241 | | | | 7,328,116 | | |
| 2.750% 05/25/20 | | | 1,684,609 | | | | 1,714,605 | | |
| 2.750% 06/25/21 | | | 14,750,000 | | | | 15,013,158 | | |
| 2.750% 03/25/26 | | | 16,160,527 | | | | 16,442,755 | | |
| 3.000% 08/25/24 | | | 4,794,964 | | | | 4,875,549 | | |
| 3.000% 11/25/24 | | | 14,461,161 | | | | 14,699,744 | | |
| 3.500% 03/25/18 | | | 5,004,599 | | | | 5,167,182 | | |
| 3.500% 01/25/24 | | | 2,057,081 | | | | 2,118,834 | | |
| 3.750% 05/25/30 | | | 4,379,923 | | | | 4,522,934 | | |
| 4.000% 01/25/19 | | | 3,283,626 | | | | 3,438,065 | | |
| 4.000% 06/25/23 | | | 2,678,452 | | | | 2,790,042 | | |
| 4.000% 11/25/23 | | | 13,839,306 | | | | 14,435,755 | | |
| 4.250% 03/25/22 | | | 1,891,233 | | | | 1,943,802 | | |
| 4.500% 11/25/21 | | | 2,532,137 | | | | 2,641,073 | | |
| 4.500% 03/25/23 | | | 9,158,001 | | | | 9,648,385 | | |
| 4.500% 12/25/23 | | | 5,866,397 | | | | 6,152,045 | | |
| 4.500% 10/25/39 | | | 15,925,878 | | | | 16,466,570 | | |
| 5.000% 12/25/16 | | | 447,887 | | | | 449,834 | | |
| 5.000% 12/25/17 | | | 243,803 | | | | 244,073 | | |
| 5.000% 11/25/24 | | | 4,399,600 | | | | 4,561,702 | | |
| 5.000% 04/25/31 | | | 800,053 | | | | 818,372 | | |
| 5.000% 05/25/32 | | | 2,253,116 | | | | 2,377,062 | | |
| 5.000% 07/25/33 | | | 12,075,021 | | | | 12,704,034 | | |
| 5.000% 09/25/33 | | | 2,418,412 | | | | 2,555,716 | | |
| 5.500% 12/25/29 | | | 3,249,832 | | | | 3,320,540 | | |
| 5.500% 06/25/30 | | | 698,845 | | | | 715,108 | | |
| 5.500% 01/25/33 | | | 8,646,865 | | | | 8,948,657 | | |
| 5.500% 05/25/33 | | | 3,936,645 | | | | 4,169,538 | | |
| 4.000% 06/20/37 | | | 6,064,280 | | | | 6,299,322 | | |
| | | Par ($) | | Value ($) | |
| 4.000% 05/16/39 | | | 18,017,383 | | | | 18,757,150 | | |
| 4.500% 01/16/31 | | | 2,227,543 | | | | 2,335,470 | | |
| 4.500% 03/20/33 | | | 6,775,041 | | | | 7,163,111 | | |
| 4.500% 08/20/35 | | | 171,036 | | | | 174,497 | | |
| 4.500% 05/20/39 | | | 4,399,643 | | | | 4,570,627 | | |
| Agency Total | | | 482,722,126 | | |
| Non-Agency – 2.5% | |
Bank of America Mortgage Securities
2.859% 03/25/34
(04/01/11) (b)(c) | | | 2,135,346 | | | | 2,112,270 | | |
BCAP LLC Trust
4.000% 01/26/37
(04/01/11) (a)(b)(c) | | | 12,615,124 | | | | 12,744,387 | | |
5.000% 12/26/36
(04/01/11) (a)(b)(c) | | | 8,107,321 | | | | 8,256,464 | | |
6.000% 05/26/37
(04/01/11) (a)(b)(c) | | | 7,744,371 | | | | 7,754,786 | | |
Countrywide Alternative Loan Trust
0.650% 03/25/34
(04/25/11) (b)(c) | | | 150,494 | | | | 143,669 | | |
Countrywide Home Loan Mortgage Pass Through Trust
0.750% 03/25/34
(04/25/11) (b)(c) | | | 392,221 | | | | 388,224 | | |
Credit Suisse Mortgage Capital Certificates
2.774% 04/27/36
(04/01/11) (a)(b)(c) | | | 1,767,284 | | | | 1,755,325 | | |
5.000% 06/27/37
(04/01/11) (a)(b)(c) | | | 2,421,196 | | | | 2,433,302 | | |
5.347% 10/27/37
(04/01/11) (a)(b)(c) | | | 7,451,027 | | | | 7,544,895 | | |
6.250% 12/27/36
(04/01/11) (a)(b)(c) | | | 5,448,649 | | | | 5,735,804 | | |
GMAC Mortgage Corp. Loan Trust
0.750% 05/25/18
(04/25/11) (b)(c) | | | 815,168 | | | | 809,097 | | |
Residential Accredit Loans, Inc.
0.850% 07/25/32
(04/25/11) (b)(c) | | | 18,491 | | | | 12,797 | | |
Structured Asset Securities Corp.
5.500% 05/25/33 | | | 131,800 | | | | 135,940 | | |
| 5.500% 07/25/33 | | | 38,196 | | | | 38,182 | | |
| 5.750% 04/25/33 | | | 867,080 | | | | 892,260 | | |
Wells Fargo Mortgage Loan Trust
5.578% 12/27/46
(04/01/11) (a)(b)(c) | | | 8,029,146 | | | | 8,276,363 | | |
| Non-Agency Total | | | 59,033,765 | | |
Total Collateralized Mortgage Obligations
(cost of $538,346,617) | | | 541,755,891 | | |
See Accompanying Notes to Financial Statements.
11
Columbia Short Term Bond Fund
March 31, 2011
| Asset-Backed Securities – 15.5% | |
| | | Par ($) | | Value ($) | |
Ally Auto Receivables Trust
0.710% 02/15/13 | | | 5,250,000 | | | | 5,249,647 | | |
Ally Master Owner Trust
1.125% 01/15/16
(04/15/11) (b)(c) | | | 10,000,000 | | | | 10,024,063 | | |
AmeriCredit Automobile Receivables Trust
0.840% 06/09/14 | | | 505,000 | | | | 505,130 | | |
| 1.220% 10/08/13 | | | 5,262,076 | | | | 5,275,378 | | |
| 5.210% 09/06/13 | | | 944,832 | | | | 951,732 | | |
5.260% 04/06/15
(04/06/11) (b)(c) | | | 3,825,000 | | | | 3,913,747 | | |
| 5.530% 01/06/14 | | | 16,744,998 | | | | 16,871,274 | | |
| 5.560% 06/06/14 | | | 9,145,058 | | | | 9,528,757 | | |
| 5.640% 09/06/13 | | | 3,671,906 | | | | 3,674,437 | | |
| 5.680% 12/12/12 | | | 1,492,202 | | | | 1,501,328 | | |
Amresco Residential Securities Mortgage Loan Trust
0.730% 07/25/28
(04/25/11) (b)(c) | | | 14,774 | | | | 11,280 | | |
Arizona Educational Loan Marketing Corp.
0.531% 12/01/23
(06/01/11) (b)(c) | | | 7,578,947 | | | | 7,570,156 | | |
BMW Vehicle Lease Trust
2.910% 03/15/12 | | | 2,021,613 | | | | 2,031,332 | | |
Brazos Higher Education Authority
0.759% 02/25/20
(05/25/11) (b)(c) | | | 1,465,000 | | | | 1,465,054 | | |
Capital Auto Receivables Asset Trust
5.300% 05/15/14 | | | 1,246,220 | | | | 1,273,359 | | |
| 5.310% 06/15/12 | | | 11,346,115 | | | | 11,467,152 | | |
| 5.420% 12/15/14 | | | 4,125,000 | | | | 4,314,968 | | |
| 5.760% 02/18/14 (a) | | | 11,500,000 | | | | 11,945,603 | | |
Capital One Prime Auto Receivables Trust
5.060% 06/15/14 | | | 870,494 | | | | 881,345 | | |
Chesapeake Funding LLC
2.255% 12/15/20
(04/15/11) (a)(b)(c) | | | 13,606,211 | | | | 13,683,210 | | |
CitiFinancial Auto Issuance Trust
2.590% 10/15/13 (a) | | | 20,225,000 | | | | 20,511,453 | | |
Cityscape Home Equity Loan Trust
7.380% 07/25/28
(04/01/11) (b)(c) | | | 597,474 | | | | 566,514 | | |
| 7.410% 05/25/28 | | | 2,166 | | | | 2,175 | | |
CNH Wholesale Master Note Trust
1.055% 12/15/15
(04/15/11) (a)(b)(c) | | | 7,000,000 | | | | 7,015,791 | | |
CPS Auto Trust
5.330% 11/15/12 (a) | | | 2,087,088 | | | | 2,089,883 | | |
DT Auto Owner Trust
1.940% 12/16/13 (a) | | | 3,000,000 | | | | 3,001,075 | | |
| | | Par ($) | | Value ($) | |
EFS Volunteer LLC
1.160% 10/26/26
(04/25/11) (a)(b)(c) | | | 13,701,787 | | | | 13,645,488 | | |
First Alliance Mortgage Loan Trust
6.680% 06/25/25 | | | 44,201 | | | | 43,295 | | |
| 8.225% 09/20/27 | | | 141,333 | | | | 116,314 | | |
Ford Credit Auto Owner Trust
5.240% 07/15/12 | | | 153,858 | | | | 155,766 | | |
Ford Credit Floorplan Master Owner Trust
1.905% 12/15/14
(04/15/11) (a)(b)(c) | | | 10,000,000 | | | | 10,190,247 | | |
Franklin Auto Trust
5.360% 05/20/16 | | | 2,165,701 | | | | 2,202,537 | | |
GS Auto Loan Trust
5.480% 12/15/14 | | | 8,582,022 | | | | 8,707,229 | | |
Household Automotive Trust
5.340% 09/17/13 | | | 1,700,077 | | | | 1,703,579 | | |
HSBC Home Equity Loan Trust
0.404% 03/20/36
(04/20/11) (b)(c) | | | 17,848,711 | | | | 16,790,586 | | |
IMC Home Equity Loan Trust
7.080% 08/20/28 | | | 4,964 | | | | 4,865 | | |
| 7.500% 04/25/26 | | | 35,366 | | | | 35,483 | | |
| 7.520% 08/20/28 | | | 737,023 | | | | 740,951 | | |
Keycorp Student Loan Trust
0.389% 06/27/25
(06/28/11) (b)(c) | | | 11,193,672 | | | | 10,769,289 | | |
0.639% 12/27/29
(06/28/11) (b)(c) | | | 15,277,697 | | | | 14,913,140 | | |
0.742% 08/25/27
(05/25/11) (b)(c) | | | 10,057,448 | | | | 9,893,424 | | |
Marriott Vacation Club Owner Trust
4.809% 07/20/31 (a) | | | 6,593,644 | | | | 6,762,456 | | |
| 5.518% 05/20/29 (a) | | | 2,976,261 | | | | 3,109,369 | | |
National Collegiate Student Loan Trust
0.400% 07/25/26
(04/25/11) (b)(c) | | | 12,000,000 | | | | 10,844,207 | | |
Navistar Financial Corp. Owner Trust
1.470% 10/18/12 (a) | | | 9,227,363 | | | | 9,245,616 | | |
Nissan Auto Lease Trust
0.900% 05/15/13 | | | 4,450,000 | | | | 4,457,066 | | |
Residential Funding Mortgage Securities II, Inc.
0.540% 08/25/33
(04/25/11) (b)(c) | | | 11,379 | | | | 8,944 | | |
Santander Drive Auto Receivables Trust
0.950% 08/15/13 | | | 8,732,988 | | | | 8,738,922 | | |
| 1.360% 03/15/13 | | | 6,305,277 | | | | 6,322,837 | | |
Sierra Receivables Funding Co. LLC
3.350% 06/20/18 (a) | | | 10,000,000 | | | | 10,000,000 | | |
See Accompanying Notes to Financial Statements.
12
Columbia Short Term Bond Fund
March 31, 2011
| Asset-Backed Securities (continued) | |
| | | Par ($) | | Value ($) | |
SLM Student Loan Trust
0.390% 12/15/20
(06/15/11) (b)(c) | | | 2,395,976 | | | | 2,389,197 | | |
0.450% 12/15/20
(06/15/11) (b)(c) | | | 11,882,141 | | | | 11,542,645 | | |
0.977% 09/16/20
(06/15/11) (b)(c) | | | 11,586,983 | | | | 11,137,914 | | |
SMART Trust
1.104% 10/14/14
(04/14/11) (a)(b)(c) | | | 11,400,000 | | | | 11,377,394 | | |
Terwin Mortgage Trust
1.150% 07/25/34
(04/25/11) (b)(c) | | | 733,551 | | | | 677,667 | | |
Triad Auto Receivables Owner Trust
0.316% 02/12/14
(04/12/11) (b)(c) | | | 8,824,028 | | | | 8,777,046 | | |
| 5.310% 05/13/13 | | | 7,327,414 | | | | 7,365,208 | | |
Volkswagen Auto Lease Trust
3.410% 04/16/12 | | | 14,999,673 | | | | 15,090,733 | | |
Total Asset-Backed Securities
(cost of $361,594,545) | | | 363,085,257 | | |
| Government & Agency Obligations – 10.6% | |
| Foreign Government Obligations – 2.4% | |
Financement-Quebec
5.000% 10/25/12 | | | 11,146,000 | | | | 11,840,440 | | |
Morocco Government AID Bond
0.461% 05/01/23
(04/05/11) (b)(c)(f) | | | 1,062,500 | | | | 1,009,375 | | |
Nova Scotia Province
5.750% 02/27/12 | | | 10,493,000 | | | | 10,983,863 | | |
Petroleos Mexicanos
4.875% 03/15/15 | | | 7,000,000 | | | | 7,455,000 | | |
Province of Ontario
4.100% 06/16/14 | | | 13,175,000 | | | | 14,145,708 | | |
Svensk Exportkredit AB
3.250% 09/16/14 | | | 10,000,000 | | | | 10,447,990 | | |
| Foreign Government Obligations Total | | | 55,882,376 | | |
| U.S. Government Obligations – 8.2% | |
U.S. Treasury Inflation Indexed Notes
3.000% 07/15/12 | | | 21,724,936 | | | | 23,269,449 | | |
U.S. Treasury Notes
1.375% 03/15/13 | | | 59,000,000 | | | | 59,684,400 | | |
| | | Par ($) | | Value ($) | |
| 1.375% 11/30/15 (g) | | | 23,500,000 | | | | 22,756,436 | | |
| 2.000% 01/31/16 | | | 88,000,000 | | | | 87,360,592 | | |
| U.S. Government Obligations Total | | | 193,070,877 | | |
Total Government & Agency Obligations
(cost of $246,444,245) | | | 248,953,253 | | |
| Mortgage-Backed Securities – 10.0% | |
Federal Home Loan Mortgage Corp.
2.281% 04/01/35
(04/01/11) (b)(c) | | | 418,154 | | | | 431,710 | | |
2.515% 03/01/34
(04/01/11) (b)(c) | | | 714,296 | | | | 749,799 | | |
2.681% 01/01/36
(04/01/11) (b)(c) | | | 1,297,848 | | | | 1,366,760 | | |
| 4.000% 05/01/11 | | | 1,043,443 | | | | 1,048,287 | | |
| 4.000% 05/01/24 | | | 3,953,031 | | | | 4,069,768 | | |
| 4.000% 07/01/24 | | | 11,739,694 | | | | 12,086,381 | | |
| 4.500% 02/01/13 | | | 3,802 | | | | 3,885 | | |
| 4.500% 07/01/13 | | | 10,378 | | | | 10,635 | | |
| 4.500% 04/01/14 | | | 654,407 | | | | 674,553 | | |
| 4.500% 03/01/19 | | | 8,363 | | | | 8,835 | | |
| 4.500% 11/01/20 | | | 1,360,277 | | | | 1,435,479 | | |
| 4.500% 01/01/21 | | | 615,398 | | | | 651,151 | | |
| 4.500% 03/01/21 | | | 2,493,293 | | | | 2,620,187 | | |
| 4.500% 01/01/23 | | | 245,441 | | | | 257,706 | | |
| 4.500% 03/01/23 | | | 854,341 | | | | 897,034 | | |
| 4.500% 04/01/23 | | | 298,615 | | | | 313,537 | | |
| 4.500% 05/01/23 | | | 8,804,226 | | | | 9,244,187 | | |
| 4.500% 06/01/23 | | | 731,434 | | | | 768,899 | | |
| 4.500% 07/01/23 | | | 111,068 | | | | 116,618 | | |
| 4.500% 02/01/24 | | | 2,047,189 | | | | 2,147,571 | | |
| 4.500% 03/01/24 | | | 170,072 | | | | 178,412 | | |
| 4.500% 05/01/24 | | | 4,239,559 | | | | 4,447,442 | | |
| 4.500% 06/01/24 | | | 8,696,529 | | | | 9,123,882 | | |
| 4.500% 07/01/24 | | | 657,433 | | | | 689,670 | | |
| 4.500% 08/01/24 | | | 25,301,811 | | | | 26,542,462 | | |
| 4.500% 10/01/24 | | | 4,528,355 | | | | 4,750,399 | | |
| 4.500% 12/01/24 | | | 8,042,251 | | | | 8,436,595 | | |
| 4.500% 06/01/25 | | | 78,309 | | | | 82,271 | | |
| 5.000% 11/01/21 | | | 2,339,321 | | | | 2,496,295 | | |
| 5.000% 09/01/22 | | | 6,747,338 | | | | 7,176,906 | | |
| 5.000% 06/01/23 | | | 2,808,108 | | | | 2,982,497 | | |
| 5.000% 07/01/23 | | | 3,756,536 | | | | 3,989,825 | | |
| 5.000% 09/01/23 | | | 3,852,621 | | | | 4,091,878 | | |
| 5.000% 01/01/24 | | | 1,674,462 | | | | 1,778,450 | | |
| 5.000% 02/01/24 | | | 2,630,299 | | | | 2,797,756 | | |
| 5.000% 07/01/24 | | | 2,591,434 | | | | 2,756,417 | | |
| 5.000% 07/01/25 | | | 3,916,889 | | | | 4,166,257 | | |
| 5.500% 05/01/17 | | | 53,797 | | | | 58,266 | | |
| 5.500% 09/01/17 | | | 196,109 | | | | 212,399 | | |
See Accompanying Notes to Financial Statements.
13
Columbia Short Term Bond Fund
March 31, 2011
| Mortgage-Backed Securities (continued) | |
| | | Par ($) | | Value ($) | |
| 5.500% 01/01/19 | | | 5,316 | | | | 5,771 | | |
| 5.500% 07/01/19 | | | 265,071 | | | | 287,752 | | |
| 5.500% 12/01/20 | | | 2,750,840 | | | | 2,985,365 | | |
| 5.500% 01/01/21 | | | 4,549,504 | | | | 4,937,375 | | |
| 5.500% 02/01/21 | | | 4,306,292 | | | | 4,658,625 | | |
5.900% 07/01/36
(04/01/11) (b)(c) | | | 35,206 | | | | 37,626 | | |
| 6.000% 03/01/17 | | | 24,854 | | | | 27,028 | | |
| 6.000% 04/01/17 | | | 28,956 | | | | 31,490 | | |
| 6.000% 06/01/17 | | | 1,788 | | | | 1,944 | | |
| 6.000% 08/01/17 | | | 86,335 | | | | 93,889 | | |
| 6.000% 08/01/21 | | | 664,031 | | | | 723,378 | | |
| 6.000% 09/01/21 | | | 261,133 | | | | 284,472 | | |
| 6.000% 10/01/21 | | | 2,125,844 | | | | 2,315,842 | | |
| 7.500% 09/01/15 | | | 28,693 | | | | 31,378 | | |
| 8.500% 07/01/30 | | | 19,795 | | | | 23,618 | | |
Federal National Mortgage Association
2.055% 06/01/33
(04/01/11) (b)(c) | | | 1,352,338 | | | | 1,388,682 | | |
2.088% 01/01/35
(04/01/11) (b)(c) | | | 1,002,072 | | | | 1,037,634 | | |
2.442% 03/01/34
(04/01/11) (b)(c) | | | 1,270,854 | | | | 1,332,279 | | |
2.445% 04/01/34
(04/01/11) (b)(c) | | | 1,009,578 | | | | 1,050,709 | | |
2.689% 06/01/34
(04/01/11) (b)(c) | | | 868,476 | | | | 910,593 | | |
2.748% 07/01/34
(04/01/11) (b)(c) | | | 1,238,411 | | | | 1,301,671 | | |
| 4.500% 10/01/13 | | | 829,005 | | | | 872,365 | | |
| 4.500% 11/01/13 | | | 779,193 | | | | 815,790 | | |
| 4.500% 11/01/14 | | | 848,361 | | | | 898,894 | | |
| 4.500% 11/01/17 | | | 354,814 | | | | 371,345 | | |
| 4.500% 04/01/23 | | | 654,335 | | | | 687,340 | | |
| 4.500% 06/01/23 | | | 105,370 | | | | 110,685 | | |
| 4.500% 01/01/24 | | | 146,510 | | | | 153,900 | | |
| 4.500% 02/01/24 | | | 2,377,340 | | | | 2,497,254 | | |
| 4.500% 03/01/24 | | | 2,286,543 | | | | 2,402,553 | | |
| 4.500% 04/01/24 | | | 2,177,242 | | | | 2,286,383 | | |
| 4.500% 05/01/24 | | | 155,783 | | | | 163,641 | | |
| 4.500% 07/01/24 | | | 3,692,281 | | | | 3,895,206 | | |
| 4.500% 08/01/24 | | | 3,116,363 | | | | 3,272,580 | | |
| 4.500% 10/01/24 | | | 4,880,917 | | | | 5,125,586 | | |
| 4.500% 11/01/24 | | | 334,532 | | | | 351,301 | | |
| 4.500% 12/01/24 | | | 344,261 | | | | 361,518 | | |
| 4.500% 02/01/25 | | | 938,905 | | | | 985,970 | | |
| 4.500% 04/01/25 | | | 933,644 | | | | 981,029 | | |
| 4.500% 05/01/25 | | | 241,674 | | | | 253,940 | | |
| 4.500% 07/01/25 | | | 916,690 | | | | 963,215 | | |
4.819% 06/01/35
(04/01/11) (b)(c) | | | 1,702,231 | | | | 1,785,261 | | |
| | | Par ($) | | Value ($) | |
4.960% 07/01/35
(04/01/11) (b)(c) | | | 1,259,006 | | | | 1,336,511 | | |
| 5.000% 07/01/22 | | | 7,932,859 | | | | 8,441,621 | | |
| 5.000% 08/01/24 | | | 4,982,823 | | | | 5,297,718 | | |
| 5.000% 03/01/25 | | | 8,652,851 | | | | 9,199,677 | | |
| 5.500% 05/01/21 | | | 595,742 | | | | 645,415 | | |
| 5.500% 11/01/21 | | | 2,484,005 | | | | 2,691,123 | | |
| 5.500% 10/01/23 | | | 3,177,556 | | | | 3,440,835 | | |
| 5.500% 01/01/24 | | | 4,201,439 | | | | 4,549,552 | | |
| 5.500% 10/01/24 | | | 2,238,320 | | | | 2,423,778 | | |
5.698% 04/01/36
(04/01/11) (b)(c) | | | 1,413,910 | | | | 1,469,505 | | |
5.774% 10/01/35
(04/01/11) (b)(c) | | | 622,609 | | | | 662,306 | | |
5.841% 07/01/36
(04/01/11) (b)(c) | | | 45,341 | | | | 48,509 | | |
6.177% 09/01/37
(04/01/11) (b)(c) | | | 657,240 | | | | 707,091 | | |
| 6.500% 03/01/12 | | | 1,983 | | | | 2,024 | | |
| 7.500% 08/01/15 | | | 20,202 | | | | 22,365 | | |
| 7.500% 10/01/28 | | | 1,031,602 | | | | 1,193,701 | | |
| 7.500% 01/01/29 | | | 365,844 | | | | 423,330 | | |
| 8.000% 05/01/15 | | | 42,748 | | | | 47,355 | | |
| 8.000% 01/01/16 | | | 75,481 | | | | 83,228 | | |
| 8.000% 08/01/30 | | | 14,242 | | | | 16,654 | | |
| 8.000% 05/01/31 | | | 51,606 | | | | 60,346 | | |
| 8.000% 07/01/31 | | | 20,060 | | | | 23,475 | | |
| 9.000% 04/01/16 | | | 203 | | | | 204 | | |
TBA,
5.500% 04/01/26 (d) | | | 8,775,000 | | | | 9,471,516 | | |
Government National Mortgage Association
3.000% 07/20/18
(04/01/11) (b)(c) | | | 193,459 | | | | 200,117 | | |
3.250% 03/20/30
(04/01/11) (b)(c) | | | 48,126 | | | | 50,075 | | |
3.375% 04/20/22
(04/01/11) (b)(c) | | | 1,224,461 | | | | 1,273,388 | | |
3.375% 06/20/29
(04/01/11) (b)(c) | | | 163,136 | | | | 169,654 | | |
| 6.000% 09/20/21 | | | 484,606 | | | | 524,510 | | |
| 6.500% 09/15/13 | | | 11,751 | | | | 12,801 | | |
| 6.500% 03/15/32 | | | 1,505 | | | | 1,704 | | |
| 6.500% 11/15/33 | | | 209,373 | | | | 237,056 | | |
| 7.000% 11/15/13 | | | 16,570 | | | | 17,456 | | |
| 7.000% 04/15/29 | | | 56,497 | | | | 65,335 | | |
| 7.000% 08/15/29 | | | 2,843 | | | | 3,288 | | |
| 8.000% 10/15/17 | | | 188,789 | | | | 212,798 | | |
Small Business Administration
0.875% 06/25/22
(04/01/11) (b)(c) | | | 147,048 | | | | 147,530 | | |
Total Mortgage-Backed Securities
(cost of $228,229,122) | | | 233,537,489 | | |
See Accompanying Notes to Financial Statements.
14
Columbia Short Term Bond Fund
March 31, 2011
| Commercial Mortgage-Backed Securities – 9.0% | |
| | | Par ($) | | Value ($) | |
Bear Stearns Commercial Mortgage Securities, Inc.
4.060% 08/15/38 | | | 3,250,870 | | | | 3,270,130 | | |
5.133% 10/12/42
(04/01/11) (b)(c) | | | 16,067,378 | | | | 16,832,462 | | |
| 5.382% 12/11/40 | | | 10,454,632 | | | | 11,049,519 | | |
5.698% 09/11/38
(04/01/11) (b)(c) | | | 3,500,000 | | | | 3,728,039 | | |
| 6.480% 02/15/35 | | | 565,378 | | | | 565,061 | | |
Citigroup Commercial Mortgage Trust
4.755% 05/15/43 | | | 10,043,767 | | | | 10,452,255 | | |
Credit Suisse First Boston Mortgage Securities Corp.
3.727% 03/15/35 | | | 293,686 | | | | 298,343 | | |
| 4.302% 07/15/36 | | | 246,737 | | | | 246,612 | | |
| 4.681% 04/15/37 | | | 12,182,233 | | | | 12,507,409 | | |
5.100% 08/15/38
(04/01/11) (b)(c) | | | 5,695,342 | | | | 5,986,961 | | |
Credit Suisse Mortgage Capital Certificates
5.250% 03/15/39 | | | 1,436,029 | | | | 1,435,244 | | |
CW Capital Cobalt Ltd.
5.324% 05/15/46 | | | 569,640 | | | | 579,692 | | |
First Union National Bank Commercial Mortgage
6.141% 02/12/34 | | | 3,791,225 | | | | 3,896,386 | | |
GE Capital Commercial Mortgage Corp.
4.599% 06/10/48 | | | 2,225,026 | | | | 2,312,225 | | |
| 4.970% 08/11/36 | | | 1,839,067 | | | | 1,877,523 | | |
| 6.070% 06/10/38 | | | 14,017,085 | | | | 14,251,460 | | |
| 6.531% 05/15/33 | | | 244,411 | | | | 244,156 | | |
Government National Mortgage Association
2.110% 05/16/35 | | | 13,066,107 | | | | 13,085,544 | | |
| 2.159% 01/16/33 | | | 2,656,821 | | | | 2,671,872 | | |
| 2.210% 11/16/34 | | | 2,420,001 | | | | 2,430,621 | | |
| 2.450% 04/01/41 (d) | | | 8,000,000 | | | | 8,050,000 | | |
Greenwich Capital Commercial Funding Corp.
4.533% 01/05/36 | | | 5,551,531 | | | | 5,657,564 | | |
| 4.619% 08/10/42 | | | 4,425,780 | | | | 4,571,519 | | |
GS Mortgage Securities Trust
2.331% 03/12/44 | | | 16,525,000 | | | | 16,633,414 | | |
JPMorgan Chase Commercial Mortgage Securities Corp.
4.659% 07/15/42 | | | 10,659,678 | | | | 11,095,436 | | |
| 4.914% 07/12/37 | | | 490,234 | | | | 492,551 | | |
| 4.980% 02/15/51 | | | 2,042,505 | | | | 2,075,975 | | |
5.201% 08/12/37
(04/01/11) (b)(c) | | | 12,081,262 | | | | 12,601,950 | | |
| 5.320% 06/12/47 | | | 566,862 | | | | 572,999 | | |
5.506% 12/12/44
(04/01/11) (b)(c) | | | 8,614,009 | | | | 9,057,084 | | |
| 5.822% 05/12/34 | | | 618,531 | | | | 621,209 | | |
5.863% 04/15/45
(04/01/11) (b)(c) | | | 2,856,776 | | | | 3,033,435 | | |
| 6.812% 01/15/30 | | | 1,174,296 | | | | 1,179,903 | | |
| | | Par ($) | | Value ($) | |
LB-UBS Commercial Mortgage Trust
4.095% 03/15/27 | | | 2,492,396 | | | | 2,541,358 | | |
| 5.007% 04/15/30 | | | 1,792,830 | | | | 1,857,793 | | |
| 5.391% 02/15/40 | | | 2,263,217 | | | | 2,292,393 | | |
| 5.403% 02/15/40 | | | 5,526,335 | | | | 5,821,961 | | |
| 5.611% 04/15/41 | | | 1,976,324 | | | | 2,057,952 | | |
| 5.642% 12/15/25 | | | 100,767 | | | | 100,872 | | |
Morgan Stanley Dean Witter Capital I
6.390% 10/15/35 | | | 3,001,261 | | | | 3,057,804 | | |
Nationslink Funding Corp.
7.104% 01/22/26 | | | 8,148,674 | | | | 8,849,304 | | |
Prudential Securities Secured Financing Corp.
7.094% 06/16/31
(04/01/11) (b)(c) | | | 48,860 | | | | 48,788 | | |
Wachovia Bank Commercial Mortgage Trust
5.037% 03/15/42 | | | 1,353,648 | | | | 1,409,919 | | |
Total Commercial Mortgage-Backed Securities
(cost of $211,539,741) | | | 211,402,697 | | |
| Municipal Bond – 0.5% | |
| Illinois – 0.5% | |
| IL State | |
Series 2011,
4.511% 03/01/15 | | | 11,675,000 | | | | 11,691,578 | | |
| Illinois Total | | | 11,691,578 | | |
Total Municipal Bond
(cost of $11,675,000) | | | 11,691,578 | | |
| Short-Term Obligation – 1.7% | |
Repurchase agreement with
Fixed Income Clearing Corp.,
dated 03/31/11, due 04/01/11
at 0.070%, collateralized by a
U.S. Government Agency
obligation maturing to 06/23/15,
market value $41,603,375
(repurchase proceeds
$40,784,079) | | | 40,784,000 | | | | 40,784,000 | | |
Total Short-Term Obligation
(cost of $40,784,000) | | | 40,784,000 | | |
Total Investments – 100.4%
(cost of $2,327,569,550) (h) | | | 2,355,723,783 | | |
| Other Assets & Liabilities, Net – (0.4)% | | | (9,609,177 | ) | |
| Net Assets – 100.0% | | | 2,346,114,606 | | |
See Accompanying Notes to Financial Statements.
15
Columbia Short Term Bond Fund
March 31, 2011
Notes to Investment Portfolio:
(a) Security exempt from registration pursuant to Rule 144A under the Securities Act of 1933. These securities may be resold in transactions exempt from registration, normally to qualified institutional buyers. At March 31, 2011, these securities, which are not illiquid, amounted to $308,915,828, which represents 13.2% of net assets.
(b) The interest rate shown on floating rate or variable rate securities reflects the rate at March 31, 2011.
(c) Parenthetical date represents the effective maturity date for the security.
(d) Security purchased on a delayed delivery basis.
(e) Zero coupon bond.
(f) Represents fair value as determined in good faith under procedures approved by the Board of Trustees. At March 31, 2011, the value of this security amounted to $1,009,375, which represents less than 0.1% of net assets.
(g) The security or a portion of the security is pledged as collateral for open futures contracts. At March 31, 2011, the total market value of securities pledged amounted to $2,324,062.
(h) Cost for federal income tax purposes is $2,327,687,723.
Generally accepted accounting principles (GAAP) require disclosure regarding the inputs and valuation techniques used to measure fair value and any changes in valuation inputs or techniques. In addition, investments shall be disclosed by major category.
The Fund categorizes its fair value measurements according to a three-level hierarchy that maximizes the use of observable inputs and minimizes the use of unobservable inputs by prioritizing that the most observable input be used when available. Observable inputs are those that market participants would use in pricing an investment based on market data obtained from sources independent of the reporting entity. Unobservable inputs are those that reflect the Fund's assumptions about the information market participants would use in pricing an investment. An investment's level within the fair value hierarchy is based on the lowest level of any input that is deemed significant to the asset or liability's fair value measurement. The input levels are not necessarily an indication of the risk or liquidity associated with investments at that level. For example, certain U.S. government securities are generally high quality and liquid, however, they are reflected as Level 2 because the inputs used to determine fair value may not always be quoted prices in an active market.
Fair value inputs are summarized in the three broad levels listed below:
• Level 1—Valuations based on quoted prices for investments in active markets that the Fund has the ability to access at the measurement date (including NAV for open-end mutual funds). Valuation adjustments are not applied to Level 1 investments.
• Level 2—Valuations based on other significant observable inputs (including quoted prices for similar securities, interest rates, prepayment speeds, credit risks, etc.).
• Level 3—Valuations based on significant unobservable inputs (including the Fund's own assumptions and judgment in determining the fair value of investments).
Inputs that are used in determining fair value of an investment may include price information, credit data, volatility statistics, and other factors. These inputs can be either observable or unobservable. The availability of observable inputs can vary between investments, and is affected by various factors such as the type of investment, and the volume and level of activity for that investment or similar investments in the marketplace. The inputs will be considered by the Investment Manager, along with any other relevant factors in the calculation of an investment's fair value. The Fund uses prices and inputs that are current as of the measurement date, which may include periods of market dislocations. During these periods, the availability of prices and inputs may be reduced for many investments. This condition could cause an investment to be reclassified between the various levels within the hierarchy. Non-U.S. equity securities actively traded in foreign markets may be reflected in Level 2 despite the availability of closing prices, because the Fund evaluates and determines whether those closing prices reflect fair value at the close of the New York Stock Exchange (NYSE) or require adjustment, as described in Note 2 to the financial statements—Security Valuation.
Investments falling into the Level 3 category are primarily supported by quoted prices from brokers and dealers participating in the market for those investments. However, these may be classified as Level 3 investments due to lack of market transparency and corroboration to support these quoted prices. Additionally, valuation models may be used as the pricing source for any remaining investments classified as Level 3. These models rely on one or more significant unobservable inputs and/or significant assumptions by the Investment Manager. Inputs used in valuations may include, but are not limited to, financial statement analysis, capital account balances, discount rates and estimated cash flows, and comparable company data.
The following table summarizes the inputs used, as of March 31, 2011, in valuing the Fund's assets:
| Description | | Quoted
Prices
(Level 1) | | Other
Significant
Observable
Inputs
(Level 2) | | Significant
Unobservable
Inputs
(Level 3) | | Total | |
Total Corporate
Fixed-Income
Bonds & Notes | | $ | — | | | $ | 704,513,618 | | | $ | — | | | $ | 704,513,618 | | |
Total Collateralized
Mortgage
Obligations | | | — | | | | 541,755,891 | | | | — | | | | 541,755,891 | | |
Total Asset-Backed
Securities | | | — | | | | 363,085,257 | | | | — | | | | 363,085,257 | | |
Government &
Agency Obligations | |
Foreign
Government
Obligations | | | — | | | | 54,873,001 | | | | 1,009,375 | | | | 55,882,376 | | |
U.S. Government
Obligations | | | 193,070,877 | | | | — | | | | — | | | | 193,070,877 | | |
Total Government &
Agency Obligations | | | 193,070,877 | | | | 54,873,001 | | | | 1,009,375 | | | | 248,953,253 | | |
Total Mortgage-Backed
Securities | | | — | | | | 233,537,489 | | | | — | | | | 233,537,489 | | |
Total Commercial
Mortgage-Backed
Securities | | | — | | | | 211,402,697 | | | | — | | | | 211,402,697 | | |
| Total Municipal Bonds | | | — | | | | 11,691,578 | | | | — | | | | 11,691,578 | | |
Total Short-Term
Obligation | | | — | | | | 40,784,000 | | | | — | | | | 40,784,000 | | |
| Total Investments | | | 193,070,877 | | | | 2,161,643,531 | | | | 1,009,375 | | | | 2,355,723,783 | | |
Unrealized
Depreciation on
Futures Contracts | | | (420,157 | ) | | | — | | | | — | | | | (420,157 | ) | |
| Total | | $ | 192,650,720 | | | $ | 2,161,643,531 | | | $ | 1,009,375 | | | $ | 2,355,303,626 | | |
The Fund's assets assigned to the Level 2 input category are generally valued using the market approach, in which a security's value is determined through its correlation to prices and information from market transactions for similar or identical assets.
Certain short-term obligations may be valued using amortized cost, an income approach which converts future cash flows to a present value based upon the discount or premium at purchase.
The Fund's assets assigned to the Level 3 category are valued utilizing the valuation technique deemed the most appropriate in the circumstances.
Certain government & agency obligations classified as Level 3 securities are valued using the market approach. To determine fair value for these securities, management considered various factors including, but were not limited to, estimated cash flows of the securities and observed yields on securities management deemed comparable.
See Accompanying Notes to Financial Statements.
16
Columbia Short Term Bond Fund
March 31, 2011
The following table reconciles asset balances for the year ending March 31, 2011, in which significant unobservable inputs (Level 3) were used in determining value:
| Investments in Securities | | Balance
as of
March 31,
2010 | | Accrued
Discounts
(Premiums) | | Realized
Gain
(Loss) | | Change in
Unrealized
Appreciation
(Depreciation) | | Purchases | | Sales | | Transfers
into
Level 3 | | Transfers
out of
Level 3 | | Balance
as of
March 31,
2011 | |
Government & Agency
Obligations | |
Foreign Government
Obligations | | $ | — | | | $ | 1,459 | | | $ | 2,304 | | | $ | 32,640 | | | $ | — | | | $ | (85,000 | ) | | $ | 1,057,972 | | | $ | — | | | $ | 1,009,375 | | |
The information in the above reconciliation represents fiscal year to date activity for any securities identified as using Level 3 inputs at either the beginning or the end of the current fiscal period.
The change in unrealized appreciation attributed to securities owned at March 31, 2011, which were valued using significant unobservable inputs (Level 3) amounted to $32,640. This amount is included in net change in unrealized appreciation (depreciation) on the Statement of Changes in Net Assets.
There were no significant transfers of financial assets between Levels 1 and 2 during the period.
The following table shows transfers between Level 2 and Level 3 of the fair value hierarchy:
| Transfers In | | Transfers Out | |
| Level 2 | | Level 3 | | Level 2 | | Level 3 | |
| $ | — | | | $ | 1,057,972 | | | $ | 1,057,972 | | | $ | — | | |
Financial assets were transferred from Level 2 to Level 3 as the result of the pricing services discontinuing coverage of the securities. As a result, as of period end, management determined to fair value the securities under consistently applied procedures established by and under the general supervision of the Board of Trustees.
Investments in affiliates during the year ended March 31, 2011:
| Affiliate | | Value,
beginning of
period | | Purchases | | Sales
Proceeds | | Interest
Income | | Value,
end of
period | |
Merrill Lynch &
Co., Inc. 6.150%
04/25/13 | | $ | 2,153,404 | | | $ | — | | | $ | — | | | $ | 10,250 | | | $ | — | | |
As of May 1, 2010, this company was no longer an affiliate of the fund. The above table reflects activity for the period from April 1, 2010 through April 30, 2010.
At March 31, 2011, the Fund held the following open short futures contracts:
Risk Exposure/Type
| Interest Rate Risk | | Number
of
Contracts | | Value | | Aggregate
Face Value | | Expiration
Date | | Unrealized
Appreciation/
Depreciation | |
| 2-Year U.S. Treasury Notes | | | 1,275 | | | $ | 278,109,375 | | | $ | 277,686,873 | | | June 2011 | | $ | (422,502 | ) | |
| 5-Year U.S. Treasury Notes | | | 550 | | | | 64,233,985 | | | | 64,236,330 | | | June 2011 | | | 2,345 | | |
| | | $ | (420,157 | ) | |
At March 31, 2011, the asset allocation of the Fund is as follows:
| Asset Allocation (Unaudited) | | % of
Net Assets | |
| Corporate Fixed-Income Bonds & Notes | | | 30.0 | | |
| Collateralized Mortgage Obligations | | | 23.1 | | |
| Asset-Backed Securities | | | 15.5 | | |
| Government & Agency Obligations | | | 10.6 | | |
| Mortgage-Backed Securities | | | 10.0 | | |
| Commercial Mortgage-Backed Securities | | | 9.0 | | |
| Municipal Bond | | | 0.5 | | |
| | | | 98.7 | | |
| Short-Term Obligation | | | 1.7 | | |
| Other Assets & Liabilities, Net | | | (0.4 | ) | |
| | | | 100.0 | | |
| Acronym | | Name | |
| AID | | Agency for International Development | |
|
| TBA | | To Be Announced | |
|
See Accompanying Notes to Financial Statements.
17
Statement of Assets and Liabilities – Columbia Short Term Bond Fund
March 31, 2011
| | | | | ($) | |
| Assets | | Investments, at identified cost | | | 2,327,569,550 | | |
| | | Investments, at value | | | 2,355,723,783 | | |
| | | Cash | | | 408 | | |
| | | Receivable for: | | | | | |
| | | Investments sold | | | 11,638,253 | | |
| | | Fund shares sold | | | 3,666,202 | | |
| | | Interest | | | 11,836,028 | | |
| | | Foreign tax reclaims | | | 4,964 | | |
| | | Expense reimbursement due from Investment Manager | | | 1,070,976 | | |
| | | Trustees' deferred compensation plan | | | 5,381 | | |
| | | Prepaid expenses | | | 6,296 | | |
| | | Total Assets | | | 2,383,952,291 | | |
| Liabilities | | Payable for: | | | | | |
| | | Investments purchased on a delayed delivery basis | | | 28,822,910 | | |
| | | Fund shares repurchased | | | 3,348,733 | | |
| | | Futures variation margin | | | 53,906 | | |
| | | Distributions | | | 3,493,993 | | |
| | | Investment advisory fee | | | 713,680 | | |
| | | Administration fee | | | 114,662 | | |
| | | Pricing and bookkeeping fees | | | 16,638 | | |
| | | Transfer agent fee | | | 918,506 | | |
| | | Trustees' fees | | | 101,828 | | |
| | | Custody fee | | | 10,467 | | |
| | | Distribution and service fees | | | 113,553 | | |
| | | Chief compliance officer expenses | | | 930 | | |
| | | Trustees' deferred compensation plan | | | 5,381 | | |
| | | Other liabilities | | | 122,498 | | |
| | | Total Liabilities | | | 37,837,685 | | |
| | | Net Assets | | | 2,346,114,606 | | |
| Net Assets Consist of | | Paid-in capital | | | 2,347,804,540 | | |
| | | Overdistributed net investment income | | | (3,501,686 | ) | |
| | | Accumulated net realized loss | | | (25,922,324 | ) | |
| | | Net unrealized appreciation (depreciation) on: | | | | | |
| | | Investments | | | 28,154,233 | | |
| | | Futures contracts | | | (420,157 | ) | |
| | | Net Assets | | | 2,346,114,606 | | |
See Accompanying Notes to Financial Statements.
18
Statement of Assets and Liabilities (continued) – Columbia Short Term Bond Fund
March 31, 2011
| Class A | | Net assets | | $ | 263,223,018 | | |
| | | Shares outstanding | | | 26,482,647 | | |
| | | Net asset value per share | | $ | 9.94 | (a) | |
| | | Maximum sales charge | | | 1.00 | % | |
| | | Maximum offering price per share($9.94/0.9900) | | $ | 10.04 | (b) | |
| Class B | | Net assets | | $ | 6,100,190 | | |
| | | Shares outstanding | | | 614,060 | | |
| | | Net asset value per share | | $ | 9.93 | (a) | |
| Class C | | Net assets | | $ | 113,862,515 | | |
| | | Shares outstanding | | | 11,467,992 | | |
| | | Net asset value per share | | $ | 9.93 | (a) | |
| Class I (c) | | Net assets | | $ | 10,678,571 | | |
| | | Shares outstanding | | | 1,075,905 | | |
| | | Net asset value, offering and redemption price per share | | $ | 9.93 | | |
| Class R (c) | | Net assets | | $ | 2,494 | | |
| | | Shares outstanding | | | 251 | | |
| | | Net asset value, offering and redemption price per share | | $ | 9.94 | | |
| Class R4 (d) | | Net assets | | $ | 2,501 | | |
| | | Shares outstanding | | | 252 | | |
| | | Net asset value, offering and redemption price per share | | $ | 9.92 | | |
| Class W (c) | | Net assets | | $ | 2,496 | | |
| | | Shares outstanding | | | 251 | | |
| | | Net asset value, offering and redemption price per share | | $ | 9.94 | | |
| Class Y | | Net assets | | $ | 16,173,278 | | |
| | | Shares outstanding | | | 1,630,161 | | |
| | | Net asset value per share | | $ | 9.92 | | |
| Class Z | | Net assets | | $ | 1,936,069,543 | | |
| | | Shares outstanding | | | 195,143,832 | | |
| | | Net asset value per share | | $ | 9.92 | | |
(a) Redemption price per share is equal to net asset value less any applicable contingent deferred sales charge.
(b) On sales of $50,000 or more the offering price is reduced.
(c) Class I, Class R and Class W shares commenced operations on September 27, 2010.
(d) Class R4 shares commenced operations on March 7, 2011.
See Accompanying Notes to Financial Statements.
19
Statement of Operations – Columbia Short Term Bond Fund
For the Year Ended March 31, 2011
| | | | | ($) | |
| Investment Income | | Interest | | | 71,840,361 | | |
| | | Interest from affiliates | | | 10,250 | | |
| | | Foreign taxes withheld | | | (488 | ) | |
| | | Total Investment Income | | | 71,850,123 | | |
| Expenses | | Investment advisory fee | | | 7,444,542 | | |
| | | Administration fee | | | 3,127,398 | | |
| | | Distribution fee: | | | | | |
| | | Class B | | | 61,381 | | |
| | | Class C | | | 927,670 | | |
| | | Class R | | | 7 | | |
| | | Service fee: | | | | | |
| | | Class B | | | 20,460 | | |
| | | Class C | | | 309,223 | | |
| | | Class W | | | 4 | | |
| | | Distribution and service fees: | | | | | |
| | | Class A | | | 697,939 | | |
| | | Transfer agent fee: | | | | | |
| | | Class A, Class B, Class C, Class R, Class W and Class Z | | | 2,468,480 | | |
| | | Class R4 | | | — | * | |
| | | Class Y | | | 199 | | |
| | | Plan administration fee: | | | | | |
| | | Class R4 | | | — | * | |
| | | Pricing and bookkeeping fees | | | 171,788 | | |
| | | Trustees' fees | | | 50,490 | | |
| | | Custody fee | | | 84,716 | | |
| | | Chief compliance officer expenses | | | 3,603 | | |
| | | Other expenses | | | 626,085 | | |
| | | Total Expenses | | | 15,993,985 | | |
| | | Fees waived or expenses reimbursed by Investment Manager and/or administrator | | | (2,228,810 | ) | |
| | | Fees waived by distributor—Class C | | | (544,233 | ) | |
| | | Expense reductions | | | (4,178 | ) | |
| | | Net Expenses | | | 13,216,764 | | |
| | | Net Investment Income | | | 58,633,359 | | |
| Net Realized and Unrealized Gain (Loss) on Investments and Futures Contracts | | Net realized gain (loss) on: | | | | | |
| | | Investments | | | 14,159,943 | | |
| | | Futures contracts | | | (2,822,103 | ) | |
| | | Net realized gain | | | 11,337,840 | | |
| | | Net change in unrealized appreciation (depreciation) on: | | | | | |
| | | Investments | | | (2,473,069 | ) | |
| | | Futures contracts | | | (322,187 | ) | |
| | | Net change in unrealized appreciation (depreciation) | | | (2,795,256 | ) | |
| | | Net Gain | | | 8,542,584 | | |
| | | Net Increase Resulting from Operations | | | 67,175,943 | | |
* Rounds to less than one dollar.
For the period March 7, 2011 through March 31, 2011.
Class R4 shares commenced operations on March 7, 2011.
See Accompanying Notes to Financial Statements.
20
Statement of Changes in Net Assets – Columbia Short Term Bond Fund
| | | | | Year Ended March 31, | |
| Increase (Decrease) in Net Assets | | | | 2011 ($)(a)(b)(c)(d) | | 2010 ($)(e)(f) | |
| Operations | | Net investment income | | | 58,633,359 | | | | 67,230,409 | | |
| | | Net realized gain on investments and futures contracts | | | 11,337,840 | | | | 1,967,672 | | |
| | | Net change in unrealized appreciation (depreciation)
on investments and futures contracts | | | (2,795,256 | ) | | | 79,994,878 | | |
| | | Net increase resulting from operations | | | 67,175,943 | | | | 149,192,959 | | |
| Distributions to Shareholders | | From net investment income: | | | | | |
| | | Class A | | | (7,364,546 | ) | | | (6,207,014 | ) | |
| | | Class B | | | (155,774 | ) | | | (271,323 | ) | |
| | | Class C | | | (2,880,627 | ) | | | (2,094,729 | ) | |
| | | Class I | | | (125,306 | ) | | | — | | |
| | | Class R | | | (29 | ) | | | — | | |
| | | Class R4 | | | (4 | ) | | | — | | |
| | | Class W | | | (32 | ) | | | — | | |
| | | Class Y | | | (600,807 | ) | | | (690,988 | ) | |
| | | Class Z | | | (58,054,450 | ) | | | (58,760,506 | ) | |
| | | Total distributions to shareholders | | | (69,181,575 | ) | | | (68,024,560 | ) | |
| | | Net Capital Stock Transactions | | | (71,423,953 | ) | | | 1,036,423,022 | | |
| | | Increase from regulatory settlements | | | — | | | | 49,053 | | |
| | | Total increase (decrease) in net assets | | | (73,429,585 | ) | | | 1,117,640,474 | | |
| Net Assets | | Beginning of period | | | 2,419,544,191 | | | | 1,301,903,717 | | |
| | | End of period | | | 2,346,114,606 | | | | 2,419,544,191 | | |
| | | Overdistributed net investment income at end of period | | | (3,501,686 | ) | | | (1,748,904 | ) | |
(a) Class I, Class R and Class W shares commenced operations on September 27, 2010.
(b) Class I, Class R and Class W shares reflect activity for the period September 27, 2010 through March 31, 2011.
(c) Class R4 shares commenced operations on March 7, 2011.
(d) Class R4 shares reflect activity for the period March 7, 2011 through March 31, 2011.
(e) Class Y shares commenced operations on July 15, 2009.
(f) Class Y shares reflect activity for the period July 15, 2009 through March 31, 2010.
See Accompanying Notes to Financial Statements.
21
Statement of Changes in Net Assets (continued) – Columbia Short Term Bond Fund
| | | Capital Stock Activity | |
| | | Year Ended
March 31, 2011 | | Year Ended
March 31, 2010 | |
| | | Shares | | Dollars ($) | | Shares | | Dollars ($) | |
| Class A | |
| Subscriptions | | | 15,294,072 | | | | 152,573,055 | | | | 19,545,601 | | | | 192,127,134 | | |
| Distributions reinvested | | | 474,538 | | | | 4,734,919 | | | | 522,432 | | | | 5,145,173 | | |
| Redemptions | | | (14,001,098 | ) | | | (139,605,799 | ) | | | (8,226,025 | ) | | | (81,090,294 | ) | |
| Net increase | | | 1,767,512 | | | | 17,702,175 | | | | 11,842,008 | | | | 116,182,013 | | |
| Class B | |
| Subscriptions | | | 208,622 | | | | 2,079,277 | | | | 269,391 | | | | 2,650,071 | | |
| Distributions reinvested | | | 10,191 | | | | 101,641 | | | | 23,567 | | | | 231,211 | | |
| Redemptions | | | (542,696 | ) | | | (5,407,084 | ) | | | (464,484 | ) | | | (4,570,887 | ) | |
| Net decrease | | | (323,883 | ) | | | (3,226,166 | ) | | | (171,526 | ) | | | (1,689,605 | ) | |
| Class C | |
| Subscriptions | | | 4,345,566 | | | | 43,300,685 | | | | 9,522,422 | | | | 93,616,714 | | |
| Distributions reinvested | | | 145,799 | | | | 1,453,196 | | | | 137,158 | | | | 1,351,256 | | |
| Redemptions | | | (4,398,309 | ) | | | (43,776,269 | ) | | | (2,082,162 | ) | | | (20,462,910 | ) | |
| Net increase | | | 93,056 | | | | 977,612 | | | | 7,577,418 | | | | 74,505,060 | | |
| Class I (a)(b) | |
| Subscriptions | | | 1,551,583 | | | | 15,407,172 | | | | — | | | | — | | |
| Distributions reinvested | | | 12,614 | | | | 125,289 | | | | — | | | | — | | |
| Redemptions | | | (488,292 | ) | | | (4,846,321 | ) | | | — | | | | — | | |
| Net increase | | | 1,075,905 | | | | 10,686,140 | | | | — | | | | — | | |
| Class R (a)(b) | |
| Subscriptions | | | 250 | | | | 2,500 | | | | — | | | | — | | |
| Distributions reinvested | | | 1 | | | | 15 | | | | — | | | | — | | |
| Net increase | | | 251 | | | | 2,515 | | | | — | | | | — | | |
| Class R4 (c)(d) | |
| Subscriptions | | | 252 | | | | 2,500 | | | | — | | | | — | | |
| Distributions reinvested | | | — | * | | | 4 | | | | — | | | | — | | |
| Net increase | | | 252 | | | | 2,504 | | | | — | | | | — | | |
| Class W (a)(b) | |
| Subscriptions | | | 264 | | | | 2,650 | | | | — | | | | — | | |
| Distributions reinvested | | | 2 | | | | 16 | | | | — | | | | — | | |
| Redemptions | | | (15 | ) | | | (150 | ) | | | — | | | | — | | |
| Net increase | | | 251 | | | | 2,516 | | | | — | | | | — | | |
* Rounds to less than one share.
See Accompanying Notes to Financial Statements.
22
Statement of Changes in Net Assets (continued) – Columbia Short Term Bond Fund
| | | Capital Stock Activity | |
| | | Year Ended
March 31, 2011 | | Year Ended
March 31, 2010 | |
| | | Shares | | Dollars ($) | | Shares | | Dollars ($) | |
| Class Y (e)(f) | |
| Subscriptions | | | 15,742 | | | | 157,008 | | | | 3,701,658 | | | | 36,034,293 | | |
| Distributions reinvested | | | 16,093 | | | | 160,329 | | | | 14,109 | | | | 139,640 | | |
| Redemptions | | | (1,031,479 | ) | | | (10,291,770 | ) | | | (1,085,962 | ) | | | (10,693,171 | ) | |
| Net increase (decrease) | | | (999,644 | ) | | | (9,974,433 | ) | | | 2,629,805 | | | | 25,480,762 | | |
| Class Z | |
| Subscriptions | | | 80,659,730 | | | | 802,780,170 | | | | 140,730,646 | | | | 1,377,894,072 | | |
| Distributions reinvested | | | 1,491,180 | | | | 14,849,498 | | | | 1,673,563 | | | | 16,441,940 | | |
| Redemptions | | | (90,950,158 | ) | | | (905,226,484 | ) | | | (58,374,664 | ) | | | (572,391,220 | ) | |
| Net increase (decrease) | | | (8,799,248 | ) | | | (87,596,816 | ) | | | 84,029,545 | | | | 821,944,792 | | |
(a) Class I, Class R and Class W shares commenced operations on September 27, 2010.
(b) Class I, Class R and Class W shares reflect activity for the period September 27, 2010 through March 31, 2011.
(c) Class R4 shares commenced operations on March 7, 2011.
(d) Class R4 shares reflect activity for the period March 7, 2011 through March 31, 2011.
(e) Class Y shares commenced operations on July 15, 2009.
(f) Class Y shares reflect activity for the period July 15, 2009 through March 31, 2010.
See Accompanying Notes to Financial Statements.
23
Financial Highlights – Columbia Short Term Bond Fund
Selected data for a share outstanding throughout each period is as follows:
| | | Year Ended March 31, | |
| Class A Shares | | 2011 | | 2010 | | 2009 | | 2008 | | 2007 | |
| Net Asset Value, Beginning of Period | | $ | 9.95 | | | $ | 9.47 | | | $ | 9.89 | | | $ | 9.84 | | | $ | 9.75 | | |
| Income from Investment Operations: | |
| Net investment income (a) | | | 0.22 | | | | 0.32 | | | | 0.42 | | | | 0.44 | | | | 0.40 | | |
Net realized and unrealized gain (loss) on investments
and futures contracts | | | 0.03 | | | | 0.49 | | | | (0.42 | ) | | | 0.05 | | | | 0.09 | | |
| Total from investment operations | | | 0.25 | | | | 0.81 | | | | — | | | | 0.49 | | | | 0.49 | | |
| Less Distributions to Shareholders: | |
| From net investment income | | | (0.26 | ) | | | (0.33 | ) | | | (0.42 | ) | | | (0.44 | ) | | | (0.40 | ) | |
| Increase from regulatory settlements | | | — | | | | — | (b) | | | — | (b) | | | — | | | | — | | |
| Net Asset Value, End of Period | | $ | 9.94 | | | $ | 9.95 | | | $ | 9.47 | | | $ | 9.89 | | | $ | 9.84 | | |
| Total return (c)(d) | | | 2.57 | % | | | 8.68 | % | | | 0.03 | % | | | 5.13 | % | | | 5.12 | % | |
| Ratios to Average Net Assets/Supplemental Data: | |
| Net expenses (e) | | | 0.73 | % | | | 0.73 | % | | | 0.73 | % | | | 0.73 | % | | | 0.73 | % | |
| Waiver/Reimbursement | | | 0.09 | % | | | 0.03 | % | | | 0.04 | % | | | 0.02 | % | | | 0.02 | % | |
| Net investment income (e) | | | 2.21 | % | | | 3.27 | % | | | 4.43 | % | | | 4.43 | % | | | 4.05 | % | |
| Portfolio turnover rate | | | 83 | % | | | 91 | % | | | 58 | % | | | 58 | % | | | 72 | % | |
| Net assets, end of period (000s) | | $ | 263,223 | | | $ | 245,872 | | | $ | 121,914 | | | $ | 76,196 | | | $ | 85,635 | | |
(a) Per share data was calculated using the average shares outstanding during the period.
(b) Rounds to less than $0.01 per share.
(c) Total return at net asset value assuming all distributions reinvested and no initial sales charge or contingent deferred sales charge.
(d) Had the Investment Manager and/or any of its affiliates not waived fees or reimbursed a portion of expenses, total return would have been reduced.
(e) The benefits derived from expense reductions had an impact of less than 0.01%.
See Accompanying Notes to Financial Statements.
24
Financial Highlights – Columbia Short Term Bond Fund
Selected data for a share outstanding throughout each period is as follows:
| | | Year Ended March 31, | |
| Class B Shares | | 2011 | | 2010 | | 2009 | | 2008 | | 2007 | |
| Net Asset Value, Beginning of Period | | $ | 9.94 | | | $ | 9.47 | | | $ | 9.89 | | | $ | 9.84 | | | $ | 9.74 | | |
| Income from Investment Operations: | |
| Net investment income (a) | | | 0.15 | | | | 0.26 | | | | 0.35 | | | | 0.36 | | | | 0.32 | | |
Net realized and unrealized gain (loss) on investments
and futures contracts | | | 0.03 | | | | 0.47 | | | | (0.42 | ) | | | 0.06 | | | | 0.11 | | |
| Total from investment operations | | | 0.18 | | | | 0.73 | | | | (0.07 | ) | | | 0.42 | | | | 0.43 | | |
| Less Distributions to Shareholders: | |
| From net investment income | | | (0.19 | ) | | | (0.26 | ) | | | (0.35 | ) | | | (0.37 | ) | | | (0.33 | ) | |
| Increase from regulatory settlements | | | — | | | | — | (b) | | | — | (b) | | | — | | | | — | | |
| Net Asset Value, End of Period | | $ | 9.93 | | | $ | 9.94 | | | $ | 9.47 | | | $ | 9.89 | | | $ | 9.84 | | |
| Total return (c)(d) | | | 1.80 | % | | | 7.77 | % | | | (0.72 | )% | | | 4.35 | % | | | 4.45 | % | |
| Ratios to Average Net Assets/Supplemental Data: | |
| Net expenses (e) | | | 1.48 | % | | | 1.48 | % | | | 1.48 | % | | | 1.48 | % | | | 1.48 | % | |
| Waiver/Reimbursement | | | 0.09 | % | | | 0.03 | % | | | 0.04 | % | | | 0.02 | % | | | 0.02 | % | |
| Net investment income (e) | | | 1.47 | % | | | 2.62 | % | | | 3.69 | % | | | 3.69 | % | | | 3.30 | % | |
| Portfolio turnover rate | | | 83 | % | | | 91 | % | | | 58 | % | | | 58 | % | | | 72 | % | |
| Net assets, end of period (000s) | | $ | 6,100 | | | $ | 9,326 | | | $ | 10,502 | | | $ | 14,035 | | | $ | 20,303 | | |
(a) Per share data was calculated using the average shares outstanding during the period.
(b) Rounds to less than $0.01 per share.
(c) Total return at net asset value assuming all distributions reinvested and no contingent deferred sales charge.
(d) Had the Investment Manager and/or any of its affiliates not waived fees or reimbursed a portion of expenses, total return would have been reduced.
(e) The benefits derived from expense reductions had an impact of less than 0.01%.
See Accompanying Notes to Financial Statements.
25
Financial Highlights – Columbia Short Term Bond Fund
Selected data for a share outstanding throughout each period is as follows:
| | | Year Ended March 31, | |
| Class C Shares | | 2011 | | 2010 | | 2009 | | 2008 | | 2007 | |
| Net Asset Value, Beginning of Period | | $ | 9.94 | | | $ | 9.46 | | | $ | 9.88 | | | $ | 9.83 | | | $ | 9.74 | | |
| Income from Investment Operations: | |
| Net investment income (a) | | | 0.19 | | | | 0.29 | | | | 0.39 | | | | 0.41 | | | | 0.37 | | |
Net realized and unrealized gain (loss) on investments
and futures contracts | | | 0.03 | | | | 0.49 | | | | (0.42 | ) | | | 0.05 | | | | 0.09 | | |
| Total from investment operations | | | 0.22 | | | | 0.78 | | | | (0.03 | ) | | | 0.46 | | | | 0.46 | | |
| Less Distributions to Shareholders: | |
| From net investment income | | | (0.23 | ) | | | (0.30 | ) | | | (0.39 | ) | | | (0.41 | ) | | | (0.37 | ) | |
| Increase from regulatory settlements | | | — | | | | — | (b) | | | — | (b) | | | — | | | | — | | |
| Net Asset Value, End of Period | | $ | 9.93 | | | $ | 9.94 | | | $ | 9.46 | | | $ | 9.88 | | | $ | 9.83 | | |
| Total return (c)(d) | | | 2.25 | % | | | 8.35 | % | | | (0.29 | )% | | | 4.80 | % | | | 4.80 | % | |
| Ratios to Average Net Assets/Supplemental Data: | |
| Net expenses (e) | | | 1.04 | % | | | 1.04 | % | | | 1.04 | % | | | 1.04 | % | | | 1.04 | % | |
| Waiver/Reimbursement | | | 0.53 | % | | | 0.47 | % | | | 0.48 | % | | | 0.46 | % | | | 0.46 | % | |
| Net investment income (e) | | | 1.90 | % | | | 2.90 | % | | | 4.12 | % | | | 4.12 | % | | | 3.75 | % | |
| Portfolio turnover rate | | | 83 | % | | | 91 | % | | | 58 | % | | | 58 | % | | | 72 | % | |
| Net assets, end of period (000s) | | $ | 113,863 | | | $ | 113,038 | | | $ | 35,926 | | | $ | 18,644 | | | $ | 17,598 | | |
(a) Per share data was calculated using the average shares outstanding during the period.
(b) Rounds to less than $0.01 per share.
(c) Total return at net asset value assuming all distributions reinvested and no contingent deferred sales charge.
(d) Had the Investment Manager and/or any of its affiliates not waived fees or reimbursed a portion of expenses, total return would have been reduced.
(e) The benefits derived from expense reductions had an impact of less than 0.01%.
See Accompanying Notes to Financial Statements.
26
Financial Highlights – Columbia Short Term Bond Fund
Selected data for a share outstanding throughout the period is as follows:
| Class I Shares | | Period Ended
March 31,
2011 (a) | |
| Net Asset Value, Beginning of Period | | $ | 10.00 | | |
| Income from Investment Operations: | |
| Net investment income (b) | | | 0.10 | | |
| Net realized and unrealized loss on investments and futures contracts | | | (0.03 | ) | |
| Total from investment operations | | | 0.07 | | |
| Less Distributions to Shareholders: | |
| From net investment income | | | (0.14 | ) | |
| Net Asset Value, End of Period | | $ | 9.93 | | |
| Total return (c)(d)(e) | | | 0.73 | % | |
| Ratios to Average Net Assets/Supplemental Data: | |
| Net expenses (f)(g) | | | 0.46 | % | |
| Waiver/Reimbursement (g) | | | 0.02 | % | |
| Net investment income (f)(g) | | | 1.99 | % | |
| Portfolio turnover rate (e) | | | 83 | % | |
| Net assets, end of period (000s) | | $ | 10,679 | | |
(a) Class I shares commenced operations on September 27, 2010. Per share data and total return reflect activity from that date.
(b) Per share data was calculated using the average shares outstanding during the period.
(c) Total return at net asset value assuming all distributions reinvested and no contingent deferred sales charge.
(d) Had the Investment Manager and/or any of its affiliates not waived fees or reimbursed a portion of expenses, total return would have been reduced.
(e) Not annualized.
(f) The benefits derived from expense reductions had an impact of less than 0.01%.
(g) Annualized.
See Accompanying Notes to Financial Statements.
27
Financial Highlights – Columbia Short Term Bond Fund
Selected data for a share outstanding throughout the period is as follows:
| Class R Shares | | Period Ended
March 31,
2011 (a) | |
| Net Asset Value, Beginning of Period | | $ | 10.02 | | |
| Income from Investment Operations: | |
| Net investment income (b) | | | 0.07 | | |
| Net realized and unrealized loss on investments and futures contracts | | | (0.03 | ) | |
| Total from investment operations | | | 0.04 | | |
| Less Distributions to Shareholders: | |
| From net investment income | | | (0.12 | ) | |
| Net Asset Value, End of Period | | $ | 9.94 | | |
| Total return (c)(d)(e) | | | 0.37 | % | |
| Ratios to Average Net Assets/Supplemental Data: | |
| Net expenses (f)(g) | | | 1.04 | % | |
| Waiver/Reimbursement (g) | | | 0.15 | % | |
| Net investment income (f)(g) | | | 1.35 | % | |
| Portfolio turnover rate (e) | | | 83 | % | |
| Net assets, end of period (000s) | | $ | 2 | | |
(a) Class R shares commenced operations on September 27, 2010. Per share data and total return reflect activity from that date.
(b) Per share data was calculated using the average shares outstanding during the period.
(c) Total return at net asset value assuming all distributions reinvested and no contingent deferred sales charge.
(d) Had the Investment Manager and/or any of its affiliates not waived fees or reimbursed a portion of expenses, total return would have been reduced.
(e) Not annualized.
(f) The benefits derived from expense reductions had an impact of less than 0.01%.
(g) Annualized.
See Accompanying Notes to Financial Statements.
28
Financial Highlights – Columbia Short Term Bond Fund
Selected data for a share outstanding throughout the period is as follows:
| Class R4 Shares | | Period Ended
March 31,
2011 (a) | |
| Net Asset Value, Beginning of Period | | $ | 9.93 | | |
| Income from Investment Operations: | |
| Net investment loss (b) | | | (0.03 | ) | |
| Net realized and unrealized gain on investments and futures contracts | | | 0.04 | | |
| Total from investment operations | | | 0.01 | | |
| Less Distributions to Shareholders: | |
| From net investment income | | | (0.02 | ) | |
| Net Asset Value, End of Period | | $ | 9.92 | | |
| Total return (c)(d)(e) | | | 0.07 | % | |
| Ratios to Average Net Assets/Supplemental Data: | |
| Net expenses (f)(g) | | | 0.66 | % | |
| Waiver/Reimbursement (g) | | | 0.02 | % | |
| Net investment loss (f)(g) | | | (4.05 | )% | |
| Portfolio turnover rate (e) | | | 83 | % | |
| Net assets, end of period (000s) | | $ | 3 | | |
(a) Class R4 shares commenced operations on March 7, 2011. Per share data and total return reflect activity from that date.
(b) Per share data was calculated using the average shares outstanding during the period.
(c) Total return at net asset value assuming all distributions reinvested and no contingent deferred sales charge.
(d) Had the Investment Manager and/or any of its affiliates not waived fees or reimbursed a portion of expenses, total return would have been reduced.
(e) Not annualized.
(f) The benefits derived from expense reductions had an impact of less than 0.01%.
(g) Annualized.
See Accompanying Notes to Financial Statements.
29
Financial Highlights – Columbia Short Term Bond Fund
Selected data for a share outstanding throughout the period is as follows:
| Class W Shares | | Period Ended
March 31,
2011 (a) | |
| Net Asset Value, Beginning of Period | | $ | 10.02 | | |
| Income from Investment Operations: | |
| Net investment income (b) | | | 0.08 | | |
| Net realized and unrealized loss on investments and futures contracts | | | (0.03 | ) | |
| Total from investment operations | | | 0.05 | | |
| Less Distributions to Shareholders: | |
| From net investment income | | | (0.13 | ) | |
| Net Asset Value, End of Period | | $ | 9.94 | | |
| Total return (c)(d)(e) | | | 0.48 | % | |
| Ratios to Average Net Assets/Supplemental Data: | |
| Net expenses (f)(g) | | | 0.77 | % | |
| Waiver/Reimbursement (g) | | | 0.13 | % | |
| Net investment income (f)(g) | | | 1.67 | % | |
| Portfolio turnover rate (e) | | | 83 | % | |
| Net assets, end of period (000s) | | $ | 2 | | |
(a) Class W shares commenced operations on September 27, 2010. Per share data and total return reflect activity from that date.
(b) Per share data was calculated using the average shares outstanding during the period.
(c) Total return at net asset value assuming all distributions reinvested and no contingent deferred sales charge.
(d) Had the Investment Manager and/or any of its affiliates not waived fees or reimbursed a portion of expenses, total return would have been reduced.
(e) Not annualized.
(f) The benefits derived from expense reductions had an impact of less than 0.01%.
(g) Annualized.
See Accompanying Notes to Financial Statements.
30
Financial Highlights – Columbia Short Term Bond Fund
Selected data for a share outstanding throughout each period is as follows:
| Class Y Shares | | Year Ended
March 31,
2011 | | Period Ended
March 31,
2010 (a) | |
| Net Asset Value, Beginning of Period | | $ | 9.93 | | | $ | 9.70 | | |
| Income from Investment Operations: | |
| Net investment income (b) | | | 0.25 | | | | 0.24 | | |
| Net realized and unrealized gain on investments and futures contracts | | | 0.03 | | | | 0.23 | | |
| Total from investment operations | | | 0.28 | | | | 0.47 | | |
| Less Distributions to Shareholders: | |
| From net investment income | | | (0.29 | ) | | | (0.24 | ) | |
| Increase from regulatory settlements | | | — | | | | — | (c) | |
| Net Asset Value, End of Period | | $ | 9.92 | | | $ | 9.93 | | |
| Total return (d)(e) | | | 2.84 | % | | | 4.91 | %(f) | |
| Ratios to Average Net Assets/Supplemental Data: | |
| Net expenses (g) | | | 0.45 | % | | | 0.47 | %(h) | |
| Waiver/Reimbursement | | | 0.02 | % | | | — | %(h)(i) | |
| Net investment income (g) | | | 2.51 | % | | | 3.39 | %(h) | |
| Portfolio turnover rate | | | 83 | % | | | 91 | %(f) | |
| Net assets, end of period (000s) | | $ | 16,173 | | | $ | 26,110 | | |
(a) Class Y shares commenced operations on July 15, 2009. Per share data and total return reflect activity from that date.
(b) Per share data was calculated using the average shares outstanding during the period.
(c) Rounds to less than $0.01 per share.
(d) Total return at net asset value assuming all distributions reinvested.
(e) Had the Investment Manager and/or any of its affiliates not waived fees or reimbursed a portion of expenses, total return would have been reduced.
(f) Not annualized.
(g) The benefits derived from expense reductions had an impact of less than 0.01%.
(h) Annualized.
(i) Rounds to less than 0.01%.
See Accompanying Notes to Financial Statements.
31
Financial Highlights – Columbia Short Term Bond Fund
Selected data for a share outstanding throughout each period is as follows:
| | | Year Ended March 31, | |
| Class Z Shares | | 2011 | | 2010 | | 2009 | | 2008 | | 2007 | |
| Net Asset Value, Beginning of Period | | $ | 9.93 | | | $ | 9.45 | | | $ | 9.87 | | | $ | 9.82 | | | $ | 9.73 | | |
| Income from Investment Operations: | |
| Net investment income (a) | | | 0.24 | | | | 0.35 | | | | 0.45 | | | | 0.46 | | | | 0.42 | | |
Net realized and unrealized gain (loss) on investments
and futures contracts | | | 0.04 | | | | 0.49 | | | | (0.43 | ) | | | 0.06 | | | | 0.09 | | |
| Total from investment operations | | | 0.28 | | | | 0.84 | | | | 0.02 | | | | 0.52 | | | | 0.51 | | |
| Less Distributions to Shareholders: | |
| From net investment income | | | (0.29 | ) | | | (0.36 | ) | | | (0.44 | ) | | | (0.47 | ) | | | (0.42 | ) | |
| Increase from regulatory settlements | | | — | | | | — | (b) | | | — | (b) | | | — | | | | — | | |
| Net Asset Value, End of Period | | $ | 9.92 | | | $ | 9.93 | | | $ | 9.45 | | | $ | 9.87 | | | $ | 9.82 | | |
| Total return (c)(d) | | | 2.82 | % | | | 8.97 | % | | | 0.27 | % | | | 5.39 | % | | | 5.39 | % | |
| Ratios to Average Net Assets/Supplemental Data: | |
| Net expenses (e) | | | 0.48 | % | | | 0.48 | % | | | 0.48 | % | | | 0.48 | % | | | 0.48 | % | |
| Waiver/Reimbursement | | | 0.09 | % | | | 0.03 | % | | | 0.04 | % | | | 0.02 | % | | | 0.02 | % | |
| Net investment income (e) | | | 2.46 | % | | | 3.54 | % | | | 4.68 | % | | | 4.67 | % | | | 4.29 | % | |
| Portfolio turnover rate | | | 83 | % | | | 91 | % | | | 58 | % | | | 58 | % | | | 72 | % | |
| Net assets, end of period (000s) | | $ | 1,936,070 | | | $ | 2,025,199 | | | $ | 1,133,563 | | | $ | 1,092,555 | | | $ | 857,655 | | |
(a) Per share data was calculated using the average shares outstanding during the period.
(b) Rounds to less than $0.01 per share.
(c) Total return at net asset value assuming all distributions reinvested.
(d) Had the Investment Manager and/or any of its affiliates not waived fees or reimbursed a portion of expenses, total return would have been reduced.
(e) The benefits derived from expense reductions had an impact of less than 0.01%.
See Accompanying Notes to Financial Statements.
32
Notes to Financial Statements – Columbia Short Term Bond Fund
March 31, 2011
Note 1. Organization
Columbia Short Term Bond Fund (the Fund), a series of Columbia Funds Series Trust (the Trust), is a diversified fund. The Trust is registered under the Investment Company Act of 1940, as amended (the 1940 Act), as an open-end management investment company organized as a Delaware statutory trust.
After the close of business on April 30, 2010, Ameriprise Financial, Inc. (Ameriprise Financial) acquired a portion of the asset management business of Columbia Management Group, LLC (the Transaction), including the business of managing the Fund. In connection with the closing of the Transaction (the Closing), RiverSource Investments, LLC, a wholly owned subsidiary of Ameriprise Financial, became the investment manager of the Fund and changed its name to Columbia Management Investment Advisers, LLC (the Investment Manager).
Investment Objective
The Fund seeks current income, consistent with minimal fluctuation of principal.
Fund Shares
The Trust has unlimited authorized shares of beneficial interest. The Fund offers Class A, Class B, Class C, Class I, Class R, Class R4, Class W, Class Y and Class Z shares. On December 10, 2010, the Investment Manager exchanged Class Z shares of the Fund valued at $15,256,281 for Class I shares of the Fund. All share classes have identical voting, dividend and liquidation rights. Each share class has its own expense structure and sales charges, as applicable.
Class A shares are subject to a maximum front-end sales charge of 5.75% based on the initial investment amount. Class A shares purchased without an initial sales charge in accounts aggregating $1 million to $50 million at the time of purchase are subject to a 1.00% contingent deferred sales charge (CDSC) if the shares are sold within 18 months of purchase, charged as follows: 1.00% CDSC if redeemed within 12 months of purchase, and 0.50% CDSC if redeemed more than 12, but less than 18 months after purchase.
The Fund no longer accepts investments by new or existing investors in the Fund's Class B shares, except in connection with the reinvestment of any dividend and/or capital gain distributions in Class B shares of the Fund and exchanges by existing Class B shareholders of other funds within the Columbia Family of Funds. Class B shares are subject to a maximum CDSC of 5.00% based upon the holding period after purchase. Class B shares will generally convert to Class A shares eight years after purchase.
Class C shares are subject to a 1.00% CDSC on shares redeemed within one year of purchase.
Class I shares are not subject to sales charges and are available only to the Columbia Family of Funds. Class I shares commenced operations on September 27, 2010.
Class R shares are not subject to sales charges and are available only to qualifying institutional investors. Class R shares commenced operations on September 27, 2010.
The Fund is authorized to issue Class R4 shares, which would not be subject to sales charges, however this share class is closed to new investors and new accounts. Class R4 shares commenced operations on March 7, 2011.
Class W shares are not subject to sales charges and are available only to investors purchasing through authorized investment programs managed by investment professionals, including discretionary managed account programs. Class W shares commenced operations on September 27, 2010.
Class Y shares are not subject to sales charges and are available only to certain investors, as described in the Fund's prospectus.
Class Z shares are not subject to sales charges and are available only to certain investors, as described in the Fund's prospectus.
Note 2. Summary of Significant Accounting Policies
The preparation of financial statements in accordance with U.S. generally accepted accounting principles (GAAP) requires the Investment Manager to make certain estimates and assumptions that affect the reported amounts of assets and liabilities, the disclosure of contingent assets and liabilities at the date of the financial statements and the reported amounts of revenue and expenses during the reporting period. Actual results could differ from those estimates.
The following is a summary of significant accounting policies consistently followed by the Fund in the preparation of its financial statements.
Security Valuation
Debt securities generally are valued by pricing services approved by the Trust's Board of Trustees, based upon market transactions for normal, institutional-size trading units of similar securities. The services may use various pricing techniques which take into account appropriate factors such as yield, quality, coupon rate, maturity, type of issue, trading characteristics and other data, as well as broker quotes. Debt securities for which quotations are readily available
33
Columbia Short Term Bond Fund, March 31, 2011
may also be valued based upon an over-the-counter or exchange bid quotation.
Certain debt securities, which tend to be more thinly traded and of lesser quality, are priced based on fundamental analysis of the financial condition of the issuer and the estimated value of any collateral. Valuations developed through pricing techniques may vary from the actual amounts realized upon sale of the securities, and the potential variation may be greater for those securities valued using fundamental analysis.
Asset-backed and mortgage-backed securities are generally valued by pricing services, which utilize pricing models that incorporate the securities' cash flow and loan performance data. These models also take into account available market data, including trades, market quotations, and benchmark yield curves for identical or similar securities. Factors used to identify similar securities may include, but are not limited to, issuer, collateral type, vintage, prepayment speeds, collateral performance, credit ratings, credit enhancement and expected life. Asset-backed and mortgage-backed securities for which quotations are readily available may also be valued based upon an over-the-counter or exchange bid quotation.
Short-term investments maturing in 60 days or less are valued at amortized cost, which approximates market value.
Futures contracts are valued at the settlement price established each day by the board of trade or exchange on which they are traded.
Foreign securities are generally valued at the last sale price on the foreign exchange or market on which they trade. If any foreign share prices are not readily available as a result of limited share activity, the securities are valued at the last sale price of the local shares in the principal market in which such securities are normally traded.
Generally, trading in foreign securities is substantially completed each day at various times prior to the close of the New York Stock Exchange (NYSE). The values of such securities used in computing the net asset value of the Fund's shares are determined as of such times. Foreign currency exchange rates are generally determined at 4:00 p.m. Eastern (U.S.) time. Occasionally, events affecting the values of such foreign securities may occur between the times at which they are determined and the close of the customary trading session of the NYSE, which would not be reflected in the computation of the Fund's net asset value. If events materially affecting the values of such foreign securities occur and it is determined that market quotations are not reliable, then these foreign securities will be valued at their fair value using procedures approved by the Board of Trustees.
Investments for which market quotations are not readily available, or that have quotations which the Investment Manager believes are not reliable, are valued at fair value as determined in good faith under consistently applied procedures established by and under the general supervision of the Board of Trustees. If a security is valued at fair value, such value is likely to be different from the last quoted market price for the security. The determination of fair value often requires significant judgment. To determine fair value, the Investment Manager may use assumptions including but not limited to future cash flows and estimated risk premiums. Multiple inputs from various sources may be used to determine value.
Derivative Instruments
The Fund may use derivative instruments including futures contracts in order to meet its investment objectives. The Fund employs strategies in differing combinations to permit it to increase, decrease or change the level of exposure to market risk factors. The achievement of any strategy relating to derivatives depends on an analysis of various risk factors, and if the strategies for the use of derivatives do not work as intended, the Fund may not achieve its investment objectives.
In pursuit of its investment objectives, the Fund is exposed to the following market risk among others:
Interest Rate Risk: Interest rate risk relates to the fluctuation in value of fixed income securities because of the inverse relationship of price and yield. Fixed income securities generally will decline in value upon an increase in general interest rates and their value generally will increase upon a decline in general interest rates. Fixed income securities with longer durations tend to be more sensitive to changes in interest rates, usually making them more volatile than securities with shorter durations.
The following provides more detailed information about the derivative type held by the Fund:
Futures Contracts—The Fund entered into interest rate futures contracts to manage the duration and yield curve exposure of the Fund versus the benchmark.
The use of futures contracts involves certain risks, which include, among others: (1) imperfect correlation between the price movement of the instruments and the underlying securities, (2) inability to close out positions due to differing trading hours, or the temporary
34
Columbia Short Term Bond Fund, March 31, 2011
absence of a liquid market, for either the instruments or the underlying securities, and (3) an inaccurate prediction of the future direction of interest rates by the Fund's Investment Manager.
Upon entering into a futures contract, the Fund identifies within its portfolio of investments cash or securities in an amount sufficient to meet the initial margin requirement. Subsequent payments are made or received by the Fund equal to the daily change in the contract value and are recorded as variation margin receivable or payable and offset in unrealized gains or losses. The Fund recognizes a realized gain or loss when the contract is closed or expires.
Futures contracts involve, to varying degrees, risk of loss in excess of the variation margin disclosed on the Statement of Assets and Liabilities.
During the year ended March 31, 2011, the Fund entered into 9,473 futures contracts.
The following table is a summary of the value of the Fund's derivative instruments as of March 31, 2011.
| Fair Value of Derivative Instruments | |
| Statement of Assets and Liabilities | |
| Assets | | Fair Value* | | Liabilities | | Fair Value* | |
| — | | $ | — | | | Futures Variation Margin | | $ | 53,906 | | |
* Includes only the current day's variation margin.
The effect of derivative instruments on the Fund's Statement of Operations for the year ended March 31, 2011:
| | | Amount of Realized Gain or (Loss)
and Change in Unrealized Appreciation
(Depreciation) on Derivatives | |
| | |
Equity Risk | |
Net Realized
Loss | | Change in
Unrealized
Depreciation | |
| | | | | Futures Contracts | | $ | (2,822,103 | ) | | $ | (322,187 | ) | |
Repurchase Agreements
The Fund may engage in repurchase agreement transactions with institutions that the Investment Manager has determined are creditworthy. The Fund, through the custodian, receives delivery of the underlying securities collateralizing a repurchase agreement. The Investment Manager is responsible for determining that the collateral is at least equal, at all times, to the value of the repurchase obligation including interest. A repurchase agreement transaction involves certain risks in the event of default or insolvency of the counterparty. These risks include possible delays in or restrictions on the Fund's ability to dispose of the underlying securities and a possible decline in the value of the underlying securities during the period while the Fund seeks to assert its rights.
Restricted Securities
Restricted securities are securities that may only be resold upon registration under federal securities laws or in transactions exempt from registration. In some cases, the issuer of restricted securities has agreed to register such securities for resale at the issuer's expense either upon demand by the Fund or in connection with another registered offering of the securities. Many restricted securities may be resold in the secondary market in transactions exempt from registration. Such restricted securities may be determined to be liquid under criteria established by the Board of Trustees. The Fund will not incur any registration costs upon such resale.
Loan Participations and Commitments
The Fund may invest in loan participations. When the Fund purchases a loan participation, the Fund typically enters into a contractual
35
Columbia Short Term Bond Fund, March 31, 2011
relationship with the lender or third party selling such participation ("Selling Participant"), but not the borrower. However, the Fund assumes the credit risk of the borrower, Selling Participant and any other persons interpositioned between the Fund and the borrower. The Fund may not directly benefit from the collateral supporting the senior loan which it has purchased from the Selling Participant.
Delayed Delivery Securities
The Fund may trade securities on other than normal settlement terms, including securities purchased or sold on a "when-issued" basis. This may increase the risk if the other party to the transaction fails to deliver and causes the Fund to subsequently invest at less advantageous prices. The Fund identifies within its portfolio of investments cash or liquid securities in an amount equal to the delayed delivery commitment.
Treasury Inflation Protected Securities
The Fund may invest in treasury inflation protected securities (TIPS). The principal amount of TIPS is adjusted periodically and is increased for inflation or decreased for deflation based on a monthly published index. Interest payments are based on the adjusted principal at the time the interest is paid. These adjustments are recorded as interest income in the Statement of Operations.
Stripped Securities
The Fund may invest in Interest Only (IO) and Principal Only (PO) stripped mortgage-backed securities. These securities are derivative multi-class mortgage securities structured so that one class receives most, if not all, of the principal from the underlying mortgage assets, while the other class receives most, if not all, of the interest and the remainder of the principal. If the underlying mortgage assets experience greater than anticipated prepayments of principal, the Fund may fail to fully recoup its initial investment in an IO security, therefore, the daily interest accrual factor is adjusted each month to reflect the paydown of principal. The market value of these securities can be extremely volatile in response to changes in interest rates. Credit risk reflects the risk that the Fund may not receive all or part of its principal because the issuer or credit enhancer has defaulted on its obligation.
Security Transactions
Security transactions are accounted for on the trade date. Cost is determined and gains (losses) are based upon the specific identification method for both financial statement and federal income tax purposes.
Income Recognition
Interest income is recorded on the accrual basis. Market premium and discount are amortized and accreted, respectively, on all debt securities, unless otherwise noted. Original issue discount is accreted to interest income over the life of the security with a corresponding increase in the cost basis, if any.
Dividend income is recorded on the ex-date.
Awards from class action litigation are recorded as a reduction of cost if the Fund still owns the applicable securities on the payment date. If the Fund no longer owns the applicable securities, the proceeds are recorded as realized gains.
Expenses
General expenses of the Trust are allocated to the Fund and other series of the Trust based upon relative net assets or other expense allocation methodologies determined by the nature of the expense. Expenses directly attributable to a specific class of shares are charged to that share class. Expenses directly attributable to the Fund are charged to the Fund.
Determination of Class Net Asset Value
All income, expenses (other than class-specific expenses which are charged directly to a share class, as shown in the Statement of Operations) and realized and unrealized gains (losses) are allocated to each class of the Fund on a daily basis for purposes of determining the net asset value of each class. Income and expenses are allocated to each class based on the settled shares method, while realized and unrealized gains (losses) are allocated based on the relative net assets of each class.
Federal Income Tax Status
The Fund intends to qualify each year as a regulated investment company under Subchapter M of the Internal Revenue Code, as amended, and will distribute substantially all of its tax exempt or taxable income, if any, for its tax year, and as such will not be subject to federal income taxes. In addition, the Fund intends to distribute in each calendar year substantially all of its net investment income, capital gains and certain other amounts, if any, such that the Fund should not be subject to federal excise tax. Therefore, no federal income or excise tax provision is recorded.
Distributions to Shareholders
Distributions from net investment income are declared daily and paid monthly. Net realized capital gains, if any, are distributed at least
36
Columbia Short Term Bond Fund, March 31, 2011
annually. Income distributions and capital gain distributions are determined in accordance with federal income tax regulations which may differ from GAAP.
Indemnifications
Under the Trust's organizational documents and, in some cases, by contract, its officers and directors are indemnified against certain liabilities arising out of the performance of their duties to the Fund. In addition, certain of the Fund's contracts with its service providers contain general indemnification clauses. The Fund's maximum exposure under these arrangements is unknown since the amount of any future claims that may be made against the Fund cannot be determined and the Fund has no historical basis for predicting the likelihood of any such claims.
Note 3. Fees and Compensation Paid to Affiliates
Investment Management Fee
Under an Investment Management Services Agreement (IMSA), the Investment Manager determines which securities will be purchased, held or sold. In September 2010, the Board of Trustees approved an amended IMSA that includes an annual management fee rate that declines from 0.36% to 0.24% as the Fund's net assets increase and would increase the management fees payable to the Investment Manager at certain asset levels. The amended IMSA was approved by the Fund's shareholders at a meeting held on February 15, 2011. The amended IMSA was effective on March 1, 2011.
For the period from the Closing through February 28, 2011, the management fee was based on the annual rate of 0.30% of the Fund's average daily net assets. Prior to the Closing, Columbia Management Advisors, LLC (Columbia), an indirect, wholly owned subsidiary of Bank of America Corporation (BOA), provided investment management services to the Fund under the same fee structure. The effective management fee rate for the year ended March 31, 2011, was 0.31% of the Fund's average daily net assets.
Administration Fee
Effective upon the Closing, the Investment Manager provides administration and accounting services to the Fund under an Administrative Services Agreement, including services previously performed under the Pricing and Bookkeeping Oversight and Services Agreement (the Services Agreement) as discussed in the Pricing and Bookkeeping Fees note below. In September 2010, the Board of Trustees approved an amended Administrative Services Agreement that includes an annual administration fee rate that declines from 0.07% to 0.04% as the Fund's net assets increase and would decrease the administration fees payable to the Investment Manager at all asset levels. The amended Administrative Services Agreement was effective on March 1, 2011.
For the period from the Closing through February 28, 2011, the administration fee was equal to 0.14% of the Fund's average daily net assets less the fees payable by the Fund as described under the Pricing and Bookkeeping Fees note below. Prior to the Closing, Columbia provided administrative services to the Fund at the same fee rates. The effective administration fee rate for the year ended March 31, 2011, was 0.13% of the Fund's average daily net assets.
Pricing and Bookkeeping Fees
Prior to the Closing, the Fund entered into a Financial Reporting Services Agreement (the Financial Reporting Services Agreement) with State Street Bank and Trust Company (State Street) and Columbia pursuant to which State Street provides financial reporting services to the Fund. The Fund also entered into an Accounting Services Agreement (collectively with the Financial Reporting Services Agreement, the State Street Agreements) with State Street and Columbia pursuant to which State Street provides accounting services to the Fund. Upon the Closing, Columbia assigned and delegated its rights and obligations under the State Street Agreements to the Investment Manager. Under the State Street Agreements, the Fund pays State Street an annual fee of $38,000 paid monthly plus an additional monthly fee based on an annualized percentage rate of average daily net assets of the Fund for the month. The aggregate fee will not exceed $140,000 per year (exclusive of out-of-pocket expenses and charges). The Fund also reimburses State Street for certain out-of-pocket expenses and charges.
Also prior to the Closing, the Fund entered into the Services Agreement with Columbia. Under the Services Agreement, Columbia provided services related to Fund expenses and the requirements of the Sarbanes-Oxley Act of 2002, and provided oversight of the accounting and financial reporting services provided by State Street. Under the Services Agreement, the Fund reimbursed Columbia for out-of-pocket expenses and charges, including fees payable to third parties, such as for pricing the Fund's portfolio securities, incurred by Columbia in the performance of services under the Services Agreement. The Services Agreement was terminated upon the Closing. These services are now provided under the Administrative Services Agreement discussed above.
37
Columbia Short Term Bond Fund, March 31, 2011
Transfer Agent Fee
In connection with the Closing, RiverSource Service Corporation, a wholly owned subsidiary of Ameriprise Financial, provides transfer agency services to the Fund under a Transfer Agency Agreement and changed its name to Columbia Management Investment Services Corp. (the Transfer Agent). The Transfer Agent has contracted with Boston Financial Data Services (BFDS) to serve as sub-transfer agent.
The Transfer Agent receives monthly account-based service fees based on the number of open accounts and is reimbursed by the Fund for the fees and expenses the Transfer Agent pays to financial intermediaries that maintain omnibus accounts with the Fund that is a percentage of the average aggregate value of the Fund's shares maintained in each such omnibus account (other than omnibus accounts for which American Enterprise Investment Services Inc. is the broker of record or accounts where the beneficial shareholder is a customer of Ameriprise Financial Services, Inc., which are paid a per account fee). The Transfer Agent pays the fees of BFDS for services as sub-transfer agent and is not entitled to reimbursement for such fees from the Fund (with the exception of out-of pocket fees). The Transfer Agent also receives compensation from fees for various shareholder services and reimbursements for certain out-of -pocket expenses. Class I shares do not pay any transfer agency fees. Total transfer agent fees for Class R4 shares are subject to an annual limitation of not more than 0.05% of the average daily net assets attributable to the Class R4 shares.
Prior to the Closing, Columbia Management Services, Inc., an affiliate of Columbia and an indirect, wholly owned subsidiary of BOA, provided transfer agency services to the Fund and contracted with BFDS to serve as sub-transfer agent, under the same fee structure.
For the year ended March 31, 2011, the Fund's effective transfer agent fee rate for each class, with the exception of Class I shares, as a percentage of each class' average daily net assets was as follows:
| Class A | | Class B | | Class C | | Class R | | Class R4* | | Class W | | Class Y* | | Class Z | |
| | 0.10 | % | | | 0.10 | % | | | 0.10 | % | | | 0.14 | % | | | 0.00 | % | | | 0.13 | % | | | 0.00 | % | | | 0.10 | % | |
* Rounds to less than 0.01%.
An annual minimum account balance fee of $20 may apply to certain accounts with a value below the Fund's initial minimum investment requirements to reduce the impact of small accounts on transfer agent fees. These minimum account balance fees are recorded as part of expense reductions on the Statement of Operations. For the year ended March 31, 2011, no minimum account balance fees were charged by the Fund.
Plan Administration Fee
Under a Plan Administration Services Agreement with the Transfer Agent, the Fund pays an annual fee at a rate of 0.25% of the Fund's average daily net assets attributable to Class R4 shares for the provision of various administrative, recordkeeping, communication and educational services.
Underwriting Discounts, Service and Distribution Fees
In connection with the Closing, RiverSource Fund Distributors, Inc., an indirect wholly owned subsidiary of Ameriprise Financial, provides distribution and shareholder services to the Fund and changed its name to Columbia Management Investment Distributors, Inc. (the Distributor). Pursuant to Rule 12b-1 under the 1940 Act, the Board of Trustees has approved, and the Fund has adopted, distribution and shareholder service plans (the Plans) which set the distribution and service fees for the Fund. These fees are calculated daily and are intended to compensate the Distributor and/or eligible selling and/or servicing agents for selling shares of the Fund and providing services to investors.
The Plans require the payment of a combined distribution and shareholder servicing fee for the Class A shares. The Plans also require the payment of a monthly distribution fee for the Class B, Class C, Class R and Class W shares of the Fund and a monthly shareholder servicing fee for the Class B, Class C and Class W shares
38
Columbia Short Term Bond Fund, March 31, 2011
of the Fund. A substantial portion of the expenses incurred pursuant to these plans may be paid to affiliates of the Distributor.
The annual rates in effect and plan limits, as a percentage of average daily net assets are as follows:
| | | Current
Fee Rate | | Plan
Limit | |
Class A Combined Distribution and
Shareholder Servicing Plan | | 0.25% | | 0.25% | |
Class B and Class C Shareholder
Servicing Plans | | 0.25% | | 0.25% | |
Class B and Class C
Distribution Plans | | 0.75% | | 0.75% | |
| Class R Distribution Plan | | 0.50% | | 0.50% | |
Class W Shareholder
Servicing Plan | | Up to 0.25% | | 0.25%1 | |
| Class W Distribution Plan | | Up to 0.25% | | 0.25%1 | |
1 The Fund may pay a distribution fee of up to 0.25% of the Fund's average daily net assets attributable to Class W shares and a service fee of up to 0.25% of the Fund's average daily net assets attributable to Class W shares, provided, however, that the aggregate fee shall not exceed 0.25% of the Fund's average daily net assets attributable to Class W shares.
The Distributor has voluntarily agreed to waive a portion of the distribution fee on the Class C shares for the Fund so that it does not exceed 0.31% of average net assets. This arrangement may be modified or terminated by the Distributor at any time.
Prior to the Closing, Columbia Management Distributors, Inc., an affiliate of Columbia and an indirect, wholly owned subsidiary of BOA, was the principal underwriter of the Fund's shares. There were no changes to the underwriting discount structure of the Fund, the service or distribution fee rates paid by the Fund, or the distribution fee waivers for the Class C shares of the Fund as a result of the Transaction.
Sales Charges
Sales charges, including front-end and CDSC's, received by the Distributor for distributing Fund shares were $51,632 for Class A, $4,674 for Class B and $60,542 for Class C shares for the year ended March 31, 2011.
Fee Waivers and Expense Reimbursements
Effective March 1, 2011, the Investment Manager and certain of its affiliates have contractually agreed to waive fees or reimburse expenses, through July 31, 2012, so that the Fund's ordinary operating expenses (excluding certain expenses described below), after giving effect to any balance credits or overdraft charges from the Fund's custodian, do not exceed the annual rates of 0.74%, 1.49%, 1.49%, 0.45%, 0.99%, 0.75%, 0.74%, 0.49% and 0.49% of the Fund's average daily net assets attributable to Class A, Class B, Class C, Class I, Class R, Class R4, Class W, Class Y and Class Z shares, respectively. The following expenses are excluded from the Fund's ordinary operating expenses when calculating the cap, and therefore will be paid by the Fund: taxes (including foreign transaction taxes), expenses associated with investment in other pooled investment vehicles (including exchange traded funds and other affiliated and unaffiliated mutual funds), transaction costs and brokerage commissions, costs related to any securities lending program, dividend expenses associated with securities sold short, inverse floater program fees and expenses, transaction charges and interest on borrowed money, interest, extraordinary expenses and any other expenses, the exclusion of which is specifically approved by the Fund's Board. This agreement may be modified or amended only with approval from all parties.
For the period May 1, 2010 through February 28, 2011, the Investment Manager voluntarily agreed to bear a portion of the Fund's expenses so that the Fund's ordinary operating expenses (excluding any distribution and service fees, brokerage commissions, interest, taxes and extraordinary expenses, but including custodian charges relating to overdrafts, if any), after giving effect to any balance credits from the Fund's custodian, did not exceed 0.48% of the Fund's average daily net assets on an annualized basis. Prior to May 1, 2010, Columbia voluntarily reimbursed a portion of the Fund's expenses in the same manner.
Fees Paid to Officers and Trustees
In connection with the Closing, all officers of the Fund are employees of the Investment Manager or its affiliates and, with the exception of the Fund's Chief Compliance Officer, receive no compensation from the Fund. The Board of Trustees has appointed a Chief Compliance Officer to the Fund in accordance with federal securities regulations. The Fund, along with other affiliated funds, pays its pro-rata share of the expenses associated with the Chief Compliance Officer. The Fund's expenses for the Chief Compliance Officer will not exceed $15,000 per year. Prior to the Closing, all officers of the Fund were employees of Columbia or its affiliates and the Fund paid its pro-rata share of the expenses for the Chief Compliance Officer under the same fee structure.
Trustees are compensated for their services to the Fund, as set forth on the Statement of Operations. The Trust's eligible Trustees may
39
Columbia Short Term Bond Fund, March 31, 2011
participate in a non-qualified deferred compensation plan which may be terminated at any time. Any payments to plan participants are paid solely out of the Fund's assets. Income earned on the plan participant's deferral account is based on the rate of return of the eligible mutual funds selected by the participant or, if no funds are selected, on the rate of return of Columbia Money Market Fund (formerly known as RiverSource Cash Management Fund). Prior to the Closing, if no funds were selected, income earned on the plan participant's deferral account was based on the rate of return of BofA Treasury Reserves. Trustees' fees deferred during the current period as well as any gains or losses on the trustees' deferred compensation balances as a result of market fluctuations are included in "Trustees' fees" on the Statement of Operations. Liabilities under the deferred compensation plan are included in "Trustees' fees" on the Statement of Assets and Liabilities.
Note 4. Custody Credits
The Fund has an agreement with its custodian bank under which custody fees may be reduced by balance credits. These credits are recorded as part of expense reductions on the Statement of Operations. The Fund could have invested a portion of the assets utilized in connection with the expense offset arrangement in an income-producing asset if it had not entered into such an agreement. For the year ended March 31, 2011, these custody credits reduced total expenses by $4,178 for the Fund.
Note 5. Portfolio Information
The cost of purchases and proceeds from sales of securities, excluding short-term obligations, aggregated $1,997,261,188 and $2,017,071,410, respectively, for the year ended March 31, 2011, of which $405,129,422 and $850,432,191, respectively, were U.S. Government securities.
Note 6. Lending of Portfolio Securities
The Fund may lend its securities to certain approved brokers, dealers and other financial institutions. Each loan is collateralized by cash, in an amount at least equal to the market value of the securities loaned plus accrued income from the investment of collateral. The market value of the loaned securities is determined at the close of business of the Fund and any additional required collateral is delivered to the Fund on the next business day. The collateral received is invested and the income generated by the investment of the collateral, net of any fees remitted to State Street as the lending agent and borrower rebates, is paid to the Fund. Generally, in the event of borrower default, the Fund has the right to use the collateral to offset any losses incurred. In the event the Fund is delayed or prevented from exercising its right to dispose of the collateral, there may be a potential loss to the Fund. The Fund bears the risk of loss with respect to the investment of collateral.
For the year ended March 31, 2011, the Fund did not participate in the securities lending program.
Note 7. Shareholder Concentration
As of March 31, 2011, one shareholder account owned 58.0% of the outstanding shares of the Fund. Purchase and redemption activity of this account may have a significant effect on the operations of the Fund.
Note 8. Regulatory Settlements
During the year ended March 31, 2010, the Fund received payments totaling $49,053 resulting from certain regulatory settlements with third parties in which the Fund had participated. The payments have been included in "Increase from regulatory settlements" in the Statement of Changes in Net Assets.
Note 9. Line of Credit
Prior to March 28, 2011, the Fund and other affiliated funds participated in a $280,000,000 committed, unsecured revolving line of credit provided by State Street. Effective March 28, 2011, the commitment was reduced to $225,000,000. The maximum amount that may be borrowed by any fund is limited to the lesser of $200,000,000 and the Fund's borrowing limit set forth in the Fund's registration statement. Borrowings are available for short-term liquidity or temporary or emergency purposes.
Effective October 14, 2010, interest is charged to each participating fund based on the fund's borrowings at a rate per annum equal to the greater of the Federal Funds Rate plus 1.25% or the overnight LIBOR Rate plus 1.25%. In addition, a commitment fee of 0.125% per annum is accrued and apportioned among the participating funds pro rata based on their relative net assets.
Prior to October 14, 2010, interest was charged to each participating fund at the same rates. In addition, a commitment fee of 0.15% per annum was accrued and apportioned among the participating funds pro rata based on their relative net assets.
For the year ended March 31, 2011, the Fund did not borrow under these arrangements.
40
Columbia Short Term Bond Fund, March 31, 2011
Note 10. Federal Tax Information
The timing and character of income and capital gain distributions are determined in accordance with income tax regulations, which may differ from GAAP. Reclassifications are made to the Fund's capital accounts for permanent tax differences to reflect income and gains available for distribution (or available capital loss carryforwards) under income tax regulations.
For the year ended March 31, 2011, permanent book and tax basis differences resulting primarily from differing treatments for proceeds received from litigation settlements, defaulted bonds and excess distributions were identified and reclassified among the components of the Fund's net assets as follows:
Overdistributed
Net Investment
Income | | Accumulated
Net Realized
Loss | | Paid-In Capital | |
| $ | 8,795,434 | | | $ | (17,316 | ) | | $ | (8,778,118 | ) | |
Net investment income and net realized gains (losses), as disclosed on the Statement of Operations, and net assets were not affected by this reclassification.
The tax character of distributions paid during the years ended March 31, 2011 and March 31, 2010 was as follows:
| | | March 31, | |
| | | 2011 | | 2010 | |
| Ordinary Income* | | $ | 69,181,575 | | | $ | 68,024,560 | | |
* For tax purposes short-term capital gain distributions, if any, are considered ordinary income distributions.
As of March 31, 2011, the components of distributable earnings on a tax basis were as follows:
Undistributed
Ordinary
Income | | Undistributed
Long-Term
Capital Gains | | Net Unrealized
Appreciation* | |
| $ | — | | | $ | — | | | $ | 28,036,060 | | |
* The differences between book-basis and tax-basis net unrealized appreciation are primarily due to deferral of losses from wash sales.
Unrealized appreciation and depreciation at March 31, 2011, based on cost of investments for federal income tax purposes were:
| Unrealized appreciation | | $ | 33,495,690 | | |
| Unrealized depreciation | | | (5,459,630 | ) | |
| Net unrealized appreciation | | $ | 28,036,060 | | |
The following capital loss carryforwards may be available to reduce taxable income arising from future net realized gains on investments, if any, to the extent permitted by the Internal Revenue Code:
| Year of Expiration | | Capital Loss
Carryforwards | |
| 2013 | | $ | 991,027 | | |
| 2014 | | | 11,783,069 | | |
| 2015 | | | 12,691,619 | | |
| 2016 | | | 642,768 | | |
| | | $ | 26,108,483 | | |
Capital loss carryforwards of $9,651,979 were utilized during the year ended March 31, 2011.
Management of the Fund has concluded that there are no significant uncertain tax positions that would require recognition in the financial statements. However, management's conclusion may be subject to review and adjustment at a later date based on factors including, but not limited to, new tax laws, regulations, and administrative interpretations (including relevant court decisions). The Fund's federal tax returns for the prior three fiscal years remain subject to examination by the Internal Revenue Service.
Note 11. Significant Risks and Contingencies
Foreign Securities Risk
Investing in foreign securities may include certain risks and considerations not typically associated with investing in U.S. securities, such as fluctuating currency values and changing local and regional economic, political and social conditions, which may result in greater market volatility. In addition, certain foreign securities may not be as liquid as U.S. securities. Investing in emerging markets may accentuate these risks.
41
Columbia Short Term Bond Fund, March 31, 2011
Asset-Backed Securities Risk
The value of asset-backed securities may be affected by, among other factors, changes in interest rates, the market's assessment of the quality of underlying assets, the creditworthiness of the servicer for the underlying assets, factors concerning the interests in and structure of the issuer or the originator of the underlying assets, or the creditworthiness or rating of the entities that provide any supporting letters of credit, surety bonds, derivative instruments, or other credit enhancement. The value of asset-backed securities also will be affected by the exhaustion, termination or expiration of any credit enhancement. Most asset-backed securities are subject to prepayment risk, which is the possibility that the underlying debt may be refinanced or prepaid prior to maturity during periods of declining or low interest rates, causing the Fund to have to reinvest the money received in securities that have lower yields. In addition, the impact of prepayments on the value of asset-backed securities may be difficult to predict and may result in greater volatility.
Mortgage-Backed Securities Risk
The value of mortgage-backed securities may be affected by, among other things, changes in interest rates, factors concerning the interests in and structure of the issuer or the originator of the mortgages, the creditworthiness of the entities that provide any supporting letters of credit, surety bonds or other credit enhancements or the quality of underlying assets or the market's assessment thereof. Mortgage-backed securities are subject to prepayment risk, which is the possibility that the underlying mortgage may be refinanced or prepaid prior to maturity during periods of declining or low interest rates, causing the Fund to have to reinvest the money received in securities that have lower yields. In addition, the impact of prepayments on the value of mortgage-backed securities may be difficult to predict and may result in greater volatility.
Note 12. Subsequent Events
Management has evaluated the events and transactions that have occurred through the date the financial statements were issued. Other than as noted below, there were no items requiring adjustment of the financial statements or additional disclosure.
Effective May 2, 2011, the Distributor has voluntarily agreed to waive a portion of the distribution fee on the Class C shares for the Fund so that it does not exceed 0.44% of average net assets attributable to Class C shares. This arrangement may be modified or terminated by the Distributor at any time.
Effective May 16, 2011, the line of credit commitment with State Street was reduced to $150,000,000, and the maximum amount that may be borrowed by any fund was limited to the lesser of $120,000,000 and the Fund's borrowing limit set forth in the Fund's registration statement.
Note 13. Information Regarding Pending and Settled Legal Proceedings
In June 2004, an action captioned John E. Gallus et al. v. American Express Financial Corp. and American Express Financial Advisors Inc. was filed in the United States District Court for the District of Arizona. The plaintiffs allege that they are investors in several American Express Company (now known as RiverSource) mutual funds and they purport to bring the action derivatively on behalf of those funds under the Investment Company Act of 1940. The plaintiffs allege that fees allegedly paid to the defendants by the funds for investment advisory and administrative services are excessive. The plaintiffs seek remedies including restitution and rescission of investment advisory and distribution agreements. The plaintiffs voluntarily agreed to transfer this case to the United States District Court for the District of Minnesota (the District Court). In response to defendants' motion to dismiss the complaint, the District Court dismissed one of plaintiffs' four claims and granted plaintiffs limited discovery. Defendants moved for summary judgment in April 2007. Summary judgment was granted in the defendants' favor on July 9, 2007. The plaintiffs filed a notice of appeal with the Eighth Circuit Court of Appeals (the Eighth Circuit) on August 8, 2007. On April 8, 2009, the Eighth Circuit reversed summary judgment and remanded to the District Court for further proceedings. On August 6, 2009, defendants filed a writ of certiorari with the U.S. Supreme Court (the Supreme Court), asking the Supreme Court to stay the District Court proceedings while the Supreme Court considers and rules in a case captioned Jones v. Harris Associates, which involves issues of law similar to those presented in the Gallus case. On March 30, 2010, the Supreme Court issued its ruling in Jones v. Harris Associates, and on April 5, 2010, the Supreme Court vacated the Eighth Circuit's decision in the Gallus case and remanded the case to the Eighth Circuit for further consideration in light of the Supreme Court's decision in Jones v. Harris Associates. On June 4, 2010, the Eighth Circuit remanded the Gallus case to the District Court for further consideration in light of the Supreme Court's decision in Jones v. Harris Associates. On December 9, 2010, the District Court reinstated its July 9, 2007 summary judgment order in favor of the defendants. On January 10, 2011, plaintiffs filed a notice of appeal with the Eighth Circuit.
42
Columbia Short Term Bond Fund, March 31, 2011
In December 2005, without admitting or denying the allegations, American Express Financial Corporation (AEFC, which is now known as Ameriprise Financial, Inc. (Ameriprise Financial)), entered into settlement agreements with the Securities and Exchange Commission (SEC) and Minnesota Department of Commerce (MDOC) related to market timing activities. As a result, AEFC was censured and ordered to cease and desist from committing or causing any violations of certain provisions of the Investment Advisers Act of 1940, the Investment Company Act of 1940, and various Minnesota laws. AEFC agreed to pay disgorgement of $10 million and civil money penalties of $7 million. AEFC also agreed to retain an independent distribution consultant to assist in developing a plan for distribution of all disgorgement and civil penalties ordered by the SEC in accordance with various undertakings detailed at http://www.sec.gov/litigation/admin/ia-2451.pdf. Ameriprise Financial and its affiliates have cooperated with the SEC and the MDOC in these legal proceedings, and have made regular reports to the funds' Boards of Directors/Trustees.
Ameriprise Financial and certain of its affiliates have historically been involved in a number of legal, arbitration and regulatory proceedings, including routine litigation, class actions, and governmental actions, concerning matters arising in connection with the conduct of their business activities. Ameriprise Financial believes that the Funds are not currently the subject of, and that neither Ameriprise Financial nor any of its affiliates are the subject of, any pending legal, arbitration or regulatory proceedings that are likely to have a material adverse effect on the Funds or the ability of Ameriprise Financial or its affiliates to perform under their contracts with the Funds. Ameriprise Financial is required to make 10-Q, 10-K and, as necessary, 8-K filings with the Securities and Exchange Commission on legal and regulatory matters that relate to Ameriprise Financial and its affiliates. Copies of these filings may be obtained by accessing the SEC website at www.sec.gov.
There can be no assurance that these matters, or the adverse publicity associated with them, will not result in increased fund redemptions, reduced sale of fund shares or other adverse consequences to the Funds. Further, although we believe proceedings are not likely to have a material adverse effect on the Funds or the ability of Ameriprise Financial or its affiliates to perform under their contracts with the Funds, these proceedings are subject to uncertainties and, as such, we are unable to estimate the possible loss or range of loss that may result. An adverse outcome in one or more of these proceedings could result in adverse judgments, settlements, fines, penalties or other relief that could have a material adverse effect on the consolidated financial condition or results of operations of Ameriprise Financial.
43
Report of Independent Registered Public Accounting Firm
To the Trustees of Columbia Funds Series Trust and the Shareholders of Columbia Short Term Bond Fund
In our opinion, the accompanying statement of assets and liabilities, including the investment portfolio, and the related statements of operations and of changes in net assets and the financial highlights present fairly, in all material respects, the financial position of Columbia Short Term Bond Fund (the "Fund") (a series of Columbia Funds Series Trust) at March 31, 2011, and the results of its operations for the year then ended, the changes in its net assets for each of the two years in the period then ended and the financial highlights for each of the periods indicated, in conformity with accounting principles generally accepted in the United States of America. These financial statements and financial highlights (hereafter referred to as "financial statements") are the responsibility of the Fund's management. Our responsibility is to express an opinion on these financial statements based on our audits. We conducted our audits of these financial statements in accordance with the standards of the Public Company Accounting Oversight Board (United States). Those standards require that we plan and perform the audit to obtain reasonable assurance about whether the financial statements are free of material misstatement. An audit includes examining, on a test basis, evidence supporting the amounts and disclosures in the financial statements, assessing the accounting principles used and significant estimates made by management, and evaluating the overall financial statement presentation. We believe that our audits, which included confirmation of securities at March 31, 2011 by correspondence with the custodian and brokers, provide a reasonable basis for our opinion.
PricewaterhouseCoopers LLP
Boston, Massachusetts
May 20, 2011
44
Fund Governance
The Trustees serve terms of indefinite duration. The names, addresses and birth years of the Trustees and Officers of the Funds in the Columbia Funds Series Trust, the year each was first elected or appointed to office, their principal business occupations during at least the last five years, the number of Funds overseen by each Trustee and other directorships they hold are shown below. Each officer listed below serves as an officer of each Fund in the Columbia Funds Series Trust.
Independent Trustees
Name, Address and Year of Birth,
Position with Funds, Year First
Elected or Appointed to Office | | Principal Occupation(s) During Past Five Years, Number of Funds in the Columbia
Funds Complex Overseen by Trustee, Other Directorships Held
| |
| Edward J. Boudreau, Jr. (Born 1944) | |
|
c/o Columbia Management
Investment Advisers, LLC
225 Franklin Street
Boston, MA 02110
Trustee (since 2005) | | Managing Director—E.J. Boudreau & Associates (consulting), from 2000 through current; oversees 41; Trustee—BofA Funds Series Trust. | |
|
| William P. Carmichael (Born 1943) | |
|
c/o Columbia Management
Investment Advisers, LLC
225 Franklin Street
Boston, MA 02110
Trustee (since 1999) | | Retired; oversees 41; Director—Cobra Electronics Corporation (electronic equipment manufacturer); Director—McMoRan Exploration Company (oil and gas exploration and development); Director—The Finish Line (athletic shoes and apparel); Trustee—BofA Funds Series Trust. | |
|
| William A. Hawkins (Born 1942) | |
|
c/o Columbia Management
Investment Advisers, LLC
225 Franklin Street
Boston, MA 02110
Trustee (since 2005) | | Managing Director—Overton Partners (financial consulting), August 2010 to present; President and Chief Executive Officer—California General Bank, N.A., from January 2008 through August 2010; oversees 41; Trustee—BofA Funds Series Trust. | |
|
| R. Glenn Hilliard (Born 1943) | |
|
c/o Columbia Management
Investment Advisers, LLC
225 Franklin Street
Boston, MA 02110
Trustee (since 2005) | | Chairman and Chief Executive Officer—Hilliard Group LLC (investing and consulting), from April 2003 through current; oversees 41; Trustee—BofA Funds Series Trust. | |
|
| John J. Nagorniak (Born 1944) | |
|
c/o Columbia Management
Investment Advisers, LLC
225 Franklin Street
Boston, MA 02110
Trustee (since 2008) | | Retired; President and Director—Foxstone Financial, Inc. (consulting), 2000 through December 2007; Director—Mellon Financial Corporation affiliates (investing), 2000 through 2007; Chairman—Franklin Portfolio Associates (investing—Mellon affiliate), 1982 through 2007; oversees 41; Director—MIT Investment Company; Trustee—MIT 401k Plan; Trustee—Research Foundation of CFA Institute; Trustee—BofA Funds Series Trust. | |
|
45
Fund Governance (continued)
Independent Trustees (continued)
Name, Address and Year of Birth,
Position with Funds, Year First
Elected or Appointed to Office | | Principal Occupation(s) During Past Five Years, Number of Funds in the Columbia
Funds Complex Overseen by Trustee, Other Directorships Held
| |
| Minor M. Shaw (Born 1947) | |
|
c/o Columbia Management
Investment Advisers, LLC
225 Franklin Street
Boston, MA 02110
Trustee (since 2003) | | President—Micco Corporation and Mickel Investment Group; oversees 41; Board Member—Piedmont Natural Gas; Trustee—BofA Funds Series Trust. | |
|
Interested Trustee
| Anthony M. Santomero1 (Born 1946) | |
|
c/o Columbia Management
Investment Advisers, LLC
225 Franklin Street
Boston, MA 02110
Trustee (since 2008) | | Richard K. Mellon Professor Emeritus of Finance, The Wharton School, University of Pennsylvania, from 2002 through current; Senior Advisor—McKinsey & Company (consulting), July 2006 through January 2008; President and Chief Executive Officer—Federal Reserve Bank of Philadelphia, July 2000 through April 2006; oversees 41; Director—Renaissance Reinsurance Ltd; Trustee—Penn Mutual Life Insurance Company; Director—Citigroup, Inc.; Director—Citibank, N.A.; Trustee—BofA Funds Series Trust. | |
|
1 Dr. Santomero is currently deemed by the Columbia Funds to be an "interested person" (as defined in the 1940 Act) of the Funds because he serves as a Director of Citigroup, Inc. and Citibank, N.A., companies that may directly or through subsidiaries and affiliates engage from time-to-time in brokerage execution, principal transactions and lending relationships with the Columbia Funds or other funds or accounts advised/managed by Columbia Management Investment Advisers, LLC.
The Statement of Additional Information includes additional information about the Trustees of the Funds and is available, without charge, upon request by calling 800-345-6611.
Officers
| Name, Year of Birth and Address | | Principal Occupation(s) During the Past Five Years | |
| J. Kevin Connaughton (Born 1964) | |
|
225 Franklin Street
Boston, MA 02110
President (since 2009) | | Senior Vice President and General Manager—Mutual Fund Products, Columbia Management Investment Advisers, LLC since May 2010; President, Columbia Funds, since 2009, and RiverSource Funds, since May 2010 (previously Senior Vice President and Chief Financial Officer, Columbia Funds, from June 2008 to January 2009, Treasurer, Columbia Funds, from October 2003 to May 2008, and senior officer of various other affiliated funds since 2000); Managing Director, Columbia Management Advisors, LLC from December 2004 to April 2010. | |
|
| Michael G. Clarke (Born 1969) | |
|
225 Franklin Street
Boston, MA 02110
Treasurer (since 2011) and
Chief Financial Officer (since 2009) | | Vice President, Columbia Management Investment Advisers, LLC since May 2010; Managing Director of Fund Administration, Columbia Management Advisors, LLC, from September 2004 to April 2010; senior officer of Columbia Funds and affiliated funds since 2002. | |
|
46
Fund Governance (continued)
Officers (continued)
| Name, Year of Birth and Address | | Principal Occupation(s) During the Past Five Years | |
| Scott R. Plummer (Born 1959) | |
|
5228 Ameriprise Financial Center
Minneapolis, MN 55474
Senior Vice President and
Chief Legal Officer (since 2010) | | Chief Legal Officer and Assistant Secretary, Columbia Management Investment Advisers, LLC since June 2005; Vice President and Lead Chief Counsel—Asset Management, Ameriprise Financial, Inc. since May 2010 (previously Vice President and Chief Counsel—Asset Management, from 2005 to April 2010, and Vice President—Asset Management Compliance from 2004 to 2005); Vice President, Chief Counsel and Assistant Secretary, Columbia Management Investment Distributors, Inc. since 2008; Vice President, General Counsel and Secretary, Ameriprise Certificate Company since 2005; Chief Counsel, RiverSource Distributors, Inc. since 2006; Vice President, General Counsel and Secretary, RiverSource Funds, since December 2006; Senior Vice President, Secretary and Chief Legal Officer, Columbia Funds, since May 2010. | |
|
| Linda J. Wondrack (Born 1964) | |
|
225 Franklin Street
Boston, MA 02110
Senior Vice President and
Chief Compliance Officer (since 2007) | | Vice President and Chief Compliance Officer, Columbia Management Investment Advisers, LLC since May 2010; Chief Compliance Officer, Columbia Funds, since 2007, and RiverSource Funds, since May 2010; Director (Columbia Management Group, LLC and Investment Product Group Compliance), Bank of America, from June 2005 to April 2010. | |
|
| William F. Truscott (Born 1960) | |
|
53600 Ameriprise Financial Center
Minneapolis, MN 55474
Senior Vice President (since 2010) | | Chairman of the Board, Columbia Management Investment Advisers, LLC since May 2010 (previously President, Chairman of the Board and Chief Investment Officer, from 2001 to April 2010); Chief Executive Officer, U.S. Asset Management & President, Annuities, Ameriprise Financial, Inc. since May 2010 (previously President—U.S. Asset Management and Chief Investment Officer from 2005 to April 2010, and Senior Vice President—Chief Investment Officer, from 2001 to 2005); Director, President and Chief Executive Officer, Ameriprise Certificate Company since 2006; Director, Columbia Management Investment Distributors, Inc. since May 2010 (previously Chairman of the Board and Chief Executive Officer from 2008 to April 2010); Chairman of the Board and Chief Executive Officer, RiverSource Distributors, Inc. since 2006. | |
|
| Colin Moore (Born 1958) | |
|
225 Franklin Street
Boston, MA 02110
Senior Vice President (since 2010) | | Director and Chief Investment Officer, Columbia Management Investment Advisers, LLC since May 2010; Manager, Managing Director and Chief Investment Officer of Columbia Management Advisors, LLC from 2007 to April 2010; Head of Equities, Columbia Management Advisors, LLC from 2002 to 2007. | |
|
| Michael A. Jones (Born 1959) | |
|
225 Franklin Street
Boston, MA 02110
Senior Vice President (since 2010) | | President and Director, Columbia Management Investment Advisers, LLC since May 2010; President and Director, Columbia Management Investment Distributors, Inc. since May 2010; Manager, Chairman, Chief Executive Officer and President, Columbia Management Advisors, LLC from 2007 to April 2010; Chief Executive Officer, President and Director, Columbia Management Distributors, Inc. from November 2006 to April 2010; previously, co-president and senior managing director at Robeco Investment Management. | |
|
47
Fund Governance (continued)
Officers (continued)
| Name, Year of Birth and Address | | Principal Occupation(s) During the Past Five Years | |
| Christopher O. Petersen (Born 1970) | |
|
5228 Ameriprise Financial Center
Minneapolis, MN 55474
Vice President and Secretary
(since 2011) | | Vice President and Chief Counsel, Ameriprise Financial since January 2010 (formerly Vice President and Group Counsel or Counsel from April 2004 to January 2010); Assistant Secretary of RiverSource Funds since January 2007. | |
|
| Amy Johnson (Born 1965) | |
|
5228 Ameriprise Financial Center
Minneapolis, MN 55474
Vice President (since 2010) | | Senior Vice President and Chief Operating Officer, Columbia Management Investment Advisers, LLC since May 2010 (previously Chief Administrative Officer, from 2009 until April 2010, Vice President—Asset Management and Trust Company Services, from 2006 to 2009, and Vice President—Operations and Compliance from 2004 to 2006). | |
|
| Joseph F. DiMaria (Born 1968) | |
|
225 Franklin Street
Boston, MA 02110
Vice President (since 2011) and
Chief Accounting Officer (since 2008) | | Vice President, Mutual Fund Administration, Columbia Management Investment Advisers, LLC, since May 2010; Director of Fund Administration, Columbia Management Advisors, LLC from January 2006 to April 2010; Head of Tax/Compliance and Assistant Treasurer, Columbia Management Advisors, LLC, from November 2004 to December 2005. | |
|
| Paul B. Goucher (Born 1968) | |
|
5228 Ameriprise Financial Center
Minneapolis, MN 55474
Vice President and
Assistant Treasurer (since 2010) | | Vice President and Chief Counsel of Ameriprise Financial since January 2010 (formerly Vice President and Group Counsel from November 2008 to January 2010); Director, Managing Director and General Counsel of J. & W. Seligman & Co. Incorporated (Seligman) from July 2008 to November 2008 and Managing Director and Associate General Counsel of Seligman from January 2005 to July 2008. | |
|
| Michael E. DeFao (Born 1968) | |
|
5228 Ameriprise Financial Center
Minneapolis, MN 55474
Vice President and
Assistant Treasurer (since 2011) | | Vice President and Chief Counsel, Ameriprise Financial since May 2010; Associate General Counsel Bank of America from June 2005 to April 2010 | |
|
| Stephen T. Welsh (Born 1957) | |
|
225 Franklin Street
Boston, MA 02110
Vice President (since 2006) | | President and Director, Columbia Management Investment Services Corp. since May 2010; President and Director, Columbia Management Services, Inc. from July 2004 to April 2010; Managing Director, Columbia Management Distributors, Inc. from August 2007 to April 2010. | |
|
48
Shareholder Meeting Results
At a Joint Special Meeting of Shareholders held on February 15, 2011, shareholders of the Fund considered the proposals described below.
Proposal 1. Shareholders of the Fund approved a proposed amendment to the Investment Management Services Agreement with Columbia Management Investment Advisers, LLC, as follows:
| Votes For | | Votes Against | | Abstentions | | Broker Non-Votes | |
| 165,052,613 | | | 8,790,884 | | | | 485,271 | | | | 32,290,852 | | |
Proposal 2. Shareholders of Columbia Funds Series Trust elected each of the nominees for trustees to the Board of Trustees of Columbia Funds Series Trust, each to hold office for an indefinite term, as follows:
| Trustee | | Votes For | | Votes Withheld | | Abstentions | |
| Kathleen Blatz | | | 2,145,636,122 | | | | 248,012,438 | | | | 0 | | |
| Edward J. Boudreau, Jr. | | | 2,145,430,114 | | | | 248,218,446 | | | | 0 | | |
| Pamela G. Carlton | | | 2,145,515,949 | | | | 248,132,612 | | | | 0 | | |
| William P. Carmichael | | | 2,145,038,695 | | | | 248,609,866 | | | | 0 | | |
| Patricia M. Flynn | | | 2,145,843,563 | | | | 247,804,997 | | | | 0 | | |
| William A. Hawkins | | | 2,145,359,401 | | | | 248,289,160 | | | | 0 | | |
| R. Glenn Hilliard | | | 2,145,079,400 | | | | 248,569,161 | | | | 0 | | |
| Stephen R. Lewis, Jr. | | | 2,145,092,209 | | | | 248,556,351 | | | | 0 | | |
| John F. Maher | | | 2,145,621,338 | | | | 248,027,223 | | | | 0 | | |
| John J. Nagorniak | | | 2,145,337,494 | | | | 248,311,067 | | | | 0 | | |
| Catherine James Paglia | | | 2,145,615,254 | | | | 248,033,306 | | | | 0 | | |
| Leroy C. Richie | | | 2,145,042,120 | | | | 248,606,441 | | | | 0 | | |
| Anthony M. Santomero | | | 2,145,088,174 | | | | 248,560,386 | | | | 0 | | |
| Minor M. Shaw | | | 2,145,430,762 | | | | 248,217,798 | | | | 0 | | |
| Alison Taunton-Rigby | | | 2,145,393,384 | | | | 248,255,177 | | | | 0 | | |
| William F. Truscott | | | 2,144,907,223 | | | | 248,741,338 | | | | 0 | | |
49
This page intentionally left blank.
This page intentionally left blank.
This page intentionally left blank.
Important Information About This Report
The fund mails one shareholder report to each shareholder address. If you would like more than one report, please call shareholder services at 1-800-345-6611 and additional reports will be sent to you. This report has been prepared for shareholders of Columbia Short Term Bond Fund.
A description of the policies and procedures that the fund uses to determine how to vote proxies and a copy of the fund's voting records are available (i) at www.columbiamanagement.com, (ii) on the Securities and Exchange Commission's website at www.sec.gov, and (iii) without charge, upon request, by calling 1-800-368-0346. Information regarding how the fund voted proxies relating to portfolio securities during the 12-month period ended June 30 is available from the SEC's website. Information regarding how the fund voted proxies relating to portfolio securities is also available from the fund's website, www.columbiamanagement.com.
The fund files a complete schedule of portfolio holdings with the SEC for the first and third quarters of each fiscal year on Form N-Q. The fund's Form N-Q is available on the SEC's website at www.sec.gov and may be reviewed and copied at the SEC's Public Reference Room in Washington, D.C. Information on the operation of the Public Reference Room may be obtained by calling 1-800-SEC-0330.
Transfer Agent
Columbia Management Investment
Services Corp.
P.O. Box 8081
Boston, MA 02266-8081
1-800-345-6611
Distributor
Columbia Management Investment
Distributors, Inc.
225 Franklin Street
Boston, MA 02110
Investment Manager
Columbia Management Investment Advisers, LLC
225 Franklin Street
Boston, MA 02110
53

PRSRT STD
U.S. Postage
PAID
Holliston, MA
Permit NO. 20
Columbia Short Term Bond Fund
P. O. Box 8081
Boston, MA 02266-8081
columbiamanagement.com
This information is for use with concurrent or prior delivery of a fund prospectus. Investors should consider the investment objectives, risks, charges and expenses of a mutual fund carefully before investing. For a free prospectus, which contains this and other important information about the funds, visit columbiamanagement.com. Read the prospectus carefully before investing. The Fund is distributed by Columbia Management Investment Distributors, Inc., member FINRA, and managed by Columbia Management Investment Advisers, LLC.
© 2011 Columbia Management Investment Advisers, LLC. All rights reserved.
C-1071 A (05/11)

Fixed Income Sector Portfolios
Annual Report for the Period Ended March 31, 2011
> Corporate Bond Portfolio
> Mortgage- and Asset-Backed Portfolio
Not FDIC insured • No bank guarantee • May lose value
Table of Contents
| Economic Update | | | 1 | | |
|
| Corporate Bond Portfolio | | | 3 | | |
|
| Mortgage- and Asset-Backed Portfolio | | | 8 | | |
|
| Financial Statements | | | 24 | | |
|
Report of Independent Registered
Public Accounting Firm | | | 39 | | |
|
| Fund Governance | | | 40 | | |
|
| Shareholder Meeting Results | | | 44 | | |
|
Important Information About
This Report | | | 45 | | |
|
The views expressed in this report reflect the current views of the respective parties. These views are not guarantees of future performance and involve certain risks, uncertainties and assumptions that are difficult to predict, so actual outcomes and results may differ significantly from the views expressed. These views are subject to change at any time based upon economic, market or other conditions and the respective parties disclaim any responsibility to update such views. These views may not be relied on as investment advice and, because investment decisions for a Columbia Fund are based on numerous factors, may not be relied on as an indication of trading intent on behalf of any particular Columbia Fund. References to specific securities should not be construed as a recommendation or investment advice.
President's Message

Dear Shareholder:
The Columbia Management story began over 100 years ago, and today, we are one of the nation's largest dedicated asset managers. The recent acquisition by Ameriprise Financial, Inc. brings together the talents, resources and capabilities of Columbia Management with those of RiverSource Investments, Threadneedle (acquired by Ameriprise in 2003) and Seligman Investments (acquired by Ameriprise in 2008) to build a best-in-class asset management business that we believe is truly greater than its parts.
RiverSource Investments traces its roots to 1894 when its then newly-founded predecessor, Investors Syndicate, offered a face-amount savings certificate that gave small investors the opportunity to build a safe and secure fund for retirement, education or other special needs. A mutual fund pioneer, Investors Syndicate launched Investors Mutual Fund in 1940. In the decades that followed, its mutual fund products and services lineup grew to include a full spectrum of styles and specialties. More than 110 years later, RiverSource continues to be a trusted financial products leader.
Threadneedle, a leader in global asset management and one of Europe's largest asset managers, offers sophisticated international experience from a dedicated U.K. management team. Headquartered in London, it is named for Threadneedle Street in the heart of the city's financial district, where British investors pioneered international and global investing. Threadneedle was acquired in 2003 and today operates as an affiliate of Columbia Management.
Seligman Investments' beginnings date back to the establishment of the investment firm J. & W. Seligman & Co. in 1864. In the years that followed, Seligman played a major role in the geographical expansion and industrial development of the United States. In 1874, President Ulysses S. Grant named Seligman as fiscal agent for the U.S. Navy—an appointment that would last through World War I. Seligman helped finance the westward path of the railroads and the building of the Panama Canal. The firm organized its first investment company in 1929 and began managing its first mutual fund in 1930. In 2008, J. & W. Seligman & Co. Incorporated was acquired and Seligman Investments became an offering brand of RiverSource Investments, LLC.
We are proud of the rich and distinctive history of these firms, the strength and breadth of products and services they offer, and the combined cultures of pioneering spirit and forward thinking. Together we are committed to providing more for our shareholders than ever before.
> A singular focus on our shareholders
Our business is asset management, so investors are our first priority. We dedicate our resources to identifying timely investment opportunities and provide a comprehensive choice of equity, fixed-income and alternative investments to help meet your individual needs.
> First-class research and thought leadership
We are dedicated to helping you take advantage of today's opportunities and anticipate tomorrow's. We stay abreast of the latest investment trends and ideas, using our collective insight to evaluate events and transform them into solutions you can use.
> A disciplined investment approach
We aren't distracted by passing fads. Our teams adhere to a rigorous investment process that helps ensure the integrity of our products and enables you and your financial advisor to match our solutions to your objectives with confidence.
When you choose Columbia Management, you can be confident that we will take the time to understand your needs and help you and your financial advisor identify the solutions that are right for you. Because at Columbia Management, we don't consider ourselves successful unless you are.
Sincerely,

J. Kevin Connaughton
President, Columbia Funds
Investors should consider the investment objectives, risks, charges and expenses of a mutual fund carefully before investing. For a free prospectus, which contains this and other important information about the funds, visit www.columbiamanagement.com. The prospectus should be read carefully before investing.
Columbia Funds are distributed by Columbia Management Investment Distributors, Inc., member FINRA, and managed by Columbia Management Investment Advisers, LLC.
© 2011 Columbia Management Investment Advisers, LLC. All rights reserved.
Economic Update – Fixed Income Sector Portfolios
The U.S. economy continued to expand at a solid but uneven pace over the past 12 months, as measured by gross domestic product (GDP). Although lackluster second quarter 2010 GDP growth raised fears that the economy was losing steam and might lapse back into recession, the pace picked up in the third quarter of 2010, inspiring confidence among consumers, businesses and investors. GDP expanded by 2.6% in the third quarter and 3.1% in the fourth quarter. With the Federal Reserve Board (the Fed) providing additional monetary stimulus to shore up economic growth and the extension of key tax cuts for the next two years, expectations are for continued growth in 2011. However, early estimates of first quarter 2011 growth place it just under 2.0%, a disappointment after two strong quarters and a pick-up in employment.
Consumer spending on cars, clothing and other goods generally trended higher during the 12-month period, accelerating in the fourth quarter. Holiday spending rose 5.5% between November 5, 2010 and December 24, 2010, in all retail categories, excluding automobiles, compared with the same period in 2009, according to MasterCard Advisors' SpendingPulse, which tracks spending on all transactions including cash. Personal income surged in January 2011 as payroll tax cuts kicked in. The personal savings rate edged higher, ending February 2011, the last month for which data was available, at 5.8%.
News on the job front was increasingly positive. A good portion of the jobs added in March, April and May of 2010 were temporary, government-sponsored census positions, which began to unwind in June, July and August of 2010. However, private sector payroll employment began to trend higher in the third quarter, massive layoffs declined and job growth turned solidly positive, with the addition of 444,000 new jobs in the first quarter of 2011.
Despite some glimmers of improvement early in 2010, the housing market remained troublesome throughout the period. Both new and existing home sales fell after a federal tax credit for new and repeat homebuyers expired. Distressed properties pressured prices and foreclosures continued—another drag on prices. The inventory of unsold homes ended the period higher than it started, at 8.9 and 8.6 months for both new and existing homes, respectively, according to the National Association of Realtors and a joint release from the U.S. Census Bureau and the U.S. Department of Housing and Urban Development. The new year brought more disappointing news: Existing home sales fell in January 2011 after three months of sustained improvement. Tight credit and weak appraisals were cited as possible reasons for the decline.
Reports from the business side of the economy were generally positive. A key measure of the nation's manufacturing situation—the Institute for Supply Management's Index—took a somewhat surprising turn higher in the final months of the period. Technology spending rose 12% in 2010, according to the NPD Group, a national marketing research firm. Purchases of computers, networking and software returned to prerecession levels. Industrial production rose over the period, and manufacturing capacity utilized, per the report issued by the Fed—a key measure of the health of the manufacturing sector—also edged higher.
Summary
For the 12-month period that ended March 31, 2011
g Strengthening economic growth and rising interest rates kept a lid on most bond market sectors. The Barclays Capital Aggregate Bond Index delivered modest results. However, high-yield bonds were strong performers, as measured by the JPMorgan Developed BB High Yield Index.
Barclays
Aggregate Index | | JPMorgan
Index | |
|
 | |  | |
|
g The U.S. stock market, as measured by the S&P 500 Index, delivered solid returns, despite a summer 2010 correction. Foreign stock market returns were also positive, as measured by the MSCI EAFE Index.
| S&P Index | | MSCI Index | |
|
 | |  | |
|
1
Economic Update (continued) – Fixed Income Sector Portfolios
Bonds delivered modest returns
As the economy strengthened and interest rates edged higher, most bond sectors delivered modest returns. The Barclays Capital Aggregate Bond Index1 returned 5.12%. High-yield bonds led the fixed-income markets. For the 12 months covered by this report, the JPMorgan Developed BB High Yield Index2 returned 13.04% as default fears abated and investors grew more comfortable with risk. Despite rising yields in the second half of the period, the Treasury market was also positive. The Barclays Capital U.S. Treasury Index3 returned 4.53%. However, municipal bonds struggled in the second half of the period, as interest rates inched higher and issue supply surged ahead of the year-end expiration of the Build America Bonds program. The Barclays Capital Municipal Bond Index4 gained 1.63% for the period. Despite positive economic activity, the Fed kept a key short-term interest rate—the federal funds rate—close to zero, reflecting ongoing concerns about employment and the housing market.
Stocks moved higher despite summer 2010 decline
Against a strengthening economic backdrop, stock prices continued to rally despite a summer 2010 setback linked to a debt crisis brewing in Europe, which raised concerns among U.S. investors. These fears were short-lived and stocks regained their footing. In this environment, the S&P 500 Index5 returned 15.65% for the 12 months through March 31, 2011. Outside the United States, stock markets also delivered solid gains. The MSCI EAFE Index,6 a broad gauge of stock market performance in foreign developed markets, returned 10.42% (in U.S. dollars) for the 12-month period, as concerns about the impact of a bailout for weak euro zone economies eased yet continued to restrain market performance. Emerging stock markets were strong. The MSCI Emerging Markets Index7 returned 18.46% (in U.S. dollars) for the 12-month period.
Past performance is no guarantee of future results.
1The Barclays Capital Aggregate Bond Index is a market value-weighted index that tracks the daily price, coupon, pay-downs and total return performance of fixed-rate, publicly placed, dollar-denominated and non-convertible investment grade debt issues with at least $250 million par amount outstanding and with at least one year to final maturity.
2The JPMorgan Developed BB High Yield Index is an unmanaged index designed to mirror the investable universe of the U.S. dollar developed, BB-rated, high yield corporate debt market.
3The Barclays Capital U.S. Treasury Index includes public obligations of the U.S. Treasury. Treasury bills are excluded by the maturity constraint. In addition, certain special issues, such as state and local government series bonds (SLGs), as well as U.S.Treasury TIPS, are excluded. STRIPS are excluded from the index because their inclusion would result in double-counting.
4The Barclays Capital Municipal Bond Index is considered representative of the broad market for investment-grade, tax-exempt bonds with maturity of at least one year.
5The Standard & Poor's (S&P) 500 Index tracks the performance of 500 widely held, large-capitalization U.S. stocks.
6The Morgan Stanley Capital International Europe, Australasia, Far East (MSCI EAFE) Index (Net) is a free float adjusted market capitalization index that is designed to measure the equity market performance of developed markets, excluding the U.S. & Canada. As of December 31, 2010, the MSCI EAFE Index (Net) consisted of the following 22 developed market country indices: Australia, Austria, Belgium, Denmark, Finland, France, Germany, Greece, Hong Kong, Ireland, Israel, Italy, Japan, the Netherlands, New Zealand, Norway, Portugal, Singapore, Spain, Sweden, Switzerland and the United Kingdom.
7The Morgan Stanley Capital International Emerging Markets (MSCI EM) Index (Net) is a free float-adjusted market capitalization index that is designed to measure equity market performance in the global emerging markets. As of December 31, 2010 the MSCI EM Index (Net) consisted of the following 21 emerging market country indices: Brazil, Chile, China, Colombia, Czech Republic, Egypt, Hungary, India, Indonesia, Korea, Malaysia, Mexico, Morocco, Peru, Philippines, Poland, Russia, South Africa, Taiwan, Thailand and Turkey.
Indices are not available for investment, are not professionally managed and do not reflect sales charges, fees, brokerage commissions, taxes or other expenses of investing. Securities in the fund may not match those in an index.
2
Fund Profile – Corporate Bond Portfolio
Summary
g For the 12-month period that ended March 31, 2011, the portfolio returned 7.87%.
g The portfolio outperformed its benchmark, the Barclays Capital U.S. Credit Bond Index.1
g The fund had more exposure than the benchmark to financials and preferred securities, which contributed to its outperformance.
Portfolio Management
Carl Pappo has managed the portfolio since November 2006 and has been associated with the advisor or its predecessors since 1993.
Effective May 1, 2010, RiverSource Investments, LLC, a subsidiary of Ameriprise Financial, Inc., became the investment advisor to the portfolio and changed its name to Columbia Management Investment Advisors, LLC. Please see the portfolio's prospectus, as supplemented, for more information regarding the change in investment advisor and certain other changes.
1The Barclays Capital U.S. Credit Bond Index consists of publicly issued investment grade corporate securities and dollar-denominated SEC registered global debentures.
Indices are not available for investment, are not professionally managed and do not reflect sales charges, fees, brokerage commissions, taxes or other expenses of investing. Securities in the fund may not match those in an index.
Performance data quoted represents past performance and current performance may be lower or higher. Past performance is no guarantee of future results. The investment return and principal value will fluctuate so that shares, when redeemed, may be worth more or less than the original cost. Please visit www.columbiamanagement.com for daily and most recent month-end performance updates.
Summary
1-year return as of 03/31/11
| | +7.87% | |
|
|  | | | Portfolio Performance | |
|
| | +7.01% | |
|
|  | | | Barclays Capital
U.S Credit Bond Index | |
|
3
Performance Information – Corporate Bond Portfolio
Performance data quoted represents past performance and current performance may be lower or higher. Past performance is no guarantee of future results. The investment return and principal value will fluctuate so that shares, when redeemed, may be worth more or less than the original cost. Please visit www.columbiamanagement.com for daily and most recent month-end performance updates.
Performance of a $10,000 investment 08/30/02 – 03/31/11
The chart above shows the change in value of a hypothetical $10,000 investment in Class A shares of Corporate Bond Portfolio during the stated time period, and does not reflect the deduction of taxes that a shareholder may pay on fund distributions or on the redemption of fund shares.
Performance of a $10,000 investment 08/30/02 – 03/31/11 ($)
| Portfolio | | | 16,957 | | |
| Barclays Capital U.S. Credit Bond Index | | | 16,406 | | |
Average annual total return as of 03/31/11 (%)
| Inception | | 08/30/02 | |
| 1-year | | | 7.87 | | |
| 5-year | | | 7.24 | | |
| Life | | | 6.34 | | |
No fees or expenses are charged to the Portfolio. Participants in wrap fee programs eligible to invest in the portfolio, however, pay an asset-based fee, which is negotiable, for investment services, brokerage services and investment consultation. The portfolio may incur significant transaction costs that are in addition to the wrap fees paid to the program sponsor that are not included in this table. All results shown assume reinvestment of distributions.
The tables do not reflect the deduction of taxes that a shareholder may pay on fund distributions or on the redemption of Portfolio shares.
4
Understanding Your Expenses – Corporate Bond Portfolio
The information on this page is intended to help you understand your ongoing costs of investing in the portfolio.
The table below reflects the fact that no fees or expenses are charged to the portfolio. Participants in the wrap fee programs eligible to invest in the portfolio pay an asset-based fee, which is negotiable, for investment services, brokerage services and investment consultation. Please read the wrap program documents for information regarding fees charged.
The information in the following table is based on an initial investment of $1,000, which is invested at the beginning of the period and held for the entire period. The amount listed in the "Actual" column is calculated using the portfolio's actual total return for the period. The amount listed in the "Hypothetical" column is calculated using a hypothetical annual return of 5%. You should not use the hypothetical account value to estimate your actual account balance.
Account value at the
beginning of the period ($)
10/01/10 | | Account value at the
end of the period ($)
03/31/11 | | Expenses paid
during the period ($)* | |
| Actual | | Hypothetical | | Actual | | Hypothetical | | Actual | | Hypothetical | |
| | 1,000.00 | | | | 1,000.00 | | | | 996.20 | | | | 1,024.93 | | | | — | | | | — | | |
* No fees or expenses are charged to the Portfolio. Participants in wrap fee programs pay an asset-based fee that is not included in this table.
5
Portfolio Manager's Report – Corporate Bond Portfolio
Performance data quoted represents past performance and current performance may be lower or higher. Past performance is no guarantee of future results. The investment return and principal value will fluctuate so that shares, when redeemed, may be worth more or less than the original cost. Please visit www.columbiamanagement.com for daily and most recent month-end performance updates.
Net asset value per share
Distributions declared per share
| 04/01/10 – 03/31/11 ($) | | | 0.57 | | |
Top 10 holdings
as of 03/31/11 (%)
Anheuser-Busch, InBev
Worldwide, Inc.,
7.200 01/15/14 | | | 2.5 | | |
Wells Fargo & Co.,
3.6800% 06/15/16 | | | 2.4 | | |
NBC Universal,
2.875% 04/01/16 | | | 2.2 | | |
Kraft Foods Inc.,
4.125% 02/09/16 | | | 1.9 | | |
Verizon Communications,
3.000% 04//01/16 | | | 1.8 | | |
| Kroger Co., 3.900% 10/01/15 | | | 1.8 | | |
| KeyCorp, 5.100% 03/24/21 | | | 1.7 | | |
British Telecommuncations,
5.950% 01/15/18 | | | 1.7 | | |
State Street Corp,
2.875% 03/07/16 | | | 1.3 | | |
European Investment Bank,
3.000% 04/08/14 | | | 1.3 | | |
Portfolio Structure
as of 03/31/11 (%)
Corporate Fixed-Income
Bonds & Notes | | | 88.6 | | |
Government & Agency
Obligations | | | 5.0 | | |
| Municipal Bonds | | | 3.7 | | |
| Preferred Stock | | | 0.6 | | |
| Other Assets & Liabilities, Net | | | 2.1 | | |
The portfolio is actively managed and the composition of its portfolio will change over time. Portfolio structure and top holdings are calculated as a percentage of net assets.
Portfolio Manager's Report
For the 12-month period that ended March 31, 2011, the portfolio returned 7.87%, compared with 7.01% for its benchmark, the Barclays Capital U.S. Credit Bond Index. The Federal Reserve Board's (the Fed's) highly accommodative monetary policies worked to expand liquidity in the economy, much of which found its way into higher-risk assets, such as stocks and corporate bonds. Riskier segments of the bond market outperformed higher-quality Treasuries for the period.
Security selection fueled outperformance
The portfolio's overweight stake in investment-grade bonds, combined with strong security selection in the financials sector and among preferred issues, generally accounted for the portfolio's performance advantage over the benchmark. The best results for the period were in the intermediate-quality tier, where the portfolio had strong representation.
Holdings of certain bonds in euro zone banks benefited from better financial positions and more conservative operating policies. In this regard, bonds of Barclays Bank and ING (0.9% and 0.9% of net assets, respectively) rose. The portfolio had more exposure than the benchmark to the telecommunications sector, which aided performance, thanks to gains by both AT&T and Verizon (1.3% and 1.9% of net assets, respectively). Both companies benefited from improving business activity. Issuance of new telecommunications bonds was low, and that helped bolster prices. Lower vacancies brightened the outlook for Brandywine Realty (0.5% of net assets), a real estate investment trust, pushing its securities higher.
The portfolio held fewer non-corporate issues than the index, which hampered results somewhat as yields fell and prices rose on Treasury debt.
Looking ahead
Core inflation, which does not take into account food and energy prices, remains benign. Wages and salaries are relatively stable, so there is little upward pressure on prices in the current environment. The global economic outlook looks positive overall, and the recent restructuring of banks should help them maintain momentum. Against that backdrop, the Fed's goal is to keep interest rates relatively low in the five-to-seven year range, that portion of the yield curve that tends to influence mortgage rates. This policy has aided non-Treasury segments of the bond market, and we expect that policy to persist. As a result, we have made few changes to portfolio positioning for the period ahead. However, we will begin to rethink positioning once the Fed begins to shift its policies and rates move higher, a point that, in our opinion is still six to 12 months away.
6
Portfolio Manager's Report (continued) – Corporate Bond Portfolio
Portfolio characteristics and holdings are subject to change periodically and may not be representative of current characteristics and holdings. The outlook for this portfolio may differ from that presented for other Columbia Funds.
Investing in fixed-income securities may involve certain risks, including the credit quality of individual issuers, possible prepayments, market or economic developments and yields and share price fluctuations due to changes in interest rates. When interest rates go up, bond prices typically drop, and vice versa.
Investments in high-yield bonds (sometimes referred to as "junk" bonds) offer the potential for high current income and attractive total return, but involve certain risks. Changes in economic conditions or other circumstances may adversely affect a high-yield bond issuer's ability to make principal and interest payments.
7
Fund Profile – Mortgage- and Asset-Backed Portfolio
Performance data quoted represents past performance and current performance may be lower or higher. Past performance is no guarantee of future results. The investment return and principal value will fluctuate so that shares, when redeemed, may be worth more or less than the original cost. Please visit www.columbiamanagement.com for daily and most recent month-end performance updates.
Summary
| 1-year return as of 03/31/11 | |
|
| | +4.82% | |
|
|  | | | Portfolio Performance | |
|
| | +5.01% | |
|
|  | | | Barclays Capital
U.S. Securitized Index | |
|
Summary
g For the 12-month period that ended March 31, 2011, the portfolio returned 4.82%.
g Returns were slightly below the Barclays Capital U.S. Securitized Index.1
g The fund's underweight in Ginnie Maes and its high quality orientation outside the mortgage-backed market were a modest drag on performance.
Portfolio Management
Lee Reddin has co-managed the portfolio since December 2007 and has been associated with the advisor or its predecessors since 2000.
Michael Zazzarino has co-managed the portfolio since December 2007 and has been associated with the advisor or its predecessors since 2005.
Effective May 1, 2010, RiverSource Investments, LLC, a subsidiary of Ameriprise Financial, Inc., became the investment advisor to the portfolio and changed its name to Columbia Management Investment Advisors, LLC. Please see the portfolio's prospectus, as supplemented, for more information regarding the change in investment advisor and certain other changes.
1The Barclays Capital U.S. Securitized Index is the largest component of the U.S. Aggregate Index and consists of the U.S. MBS Index, the ERISA-Eligible CMBS Index and the fixed-rate ABS Index. The U.S. MBS Index includes both fixed-rate agency passthroughs and agency hybrid ARM securities.
Indices are not available for investment, are not professionally managed and do not reflect sales charges, fees, brokerage commissions, taxes or other expenses of investing. Securities in the fund may not match those in an index.
8
Performance Information – Mortgage- and Asset-Backed Portfolio
Performance of a $10,000 investment 08/30/02 – 03/31/11
The chart above shows the change in value of a hypothetical $10,000 investment in Class A shares of Mortgage- and Asset-Backed Portfolio during the stated time period, and does not reflect the deduction of taxes that a shareholder may pay on fund distributions or on the redemption of fund shares.
Performance of a $10,000 investment 08/30/02 – 03/31/11 ($)
| Portfolio | | | 13,584 | | |
| Barclays Capital U.S. Securitized Index | | | 15,469 | | |
Average annual total return as of 03/31/11 (%)
| Inception | | 08/30/02 | |
| 1-year | | | 4.82 | | |
| 5-year | | | 3.83 | | |
| Life | | | 3.63 | | |
No fees or expenses are charged to the Portfolio. Participants in the wrap fee programs eligible to invest in the Portfolio, however, pay an asset-based fee, which is negotiable, for investment services, brokerage services and investment consultation. The Portfolio may incur significant transaction costs that are in addition to the wrap fees paid to the program sponsor that are not included in this table. All results shown assume reinvestment of distributions.
The tables do not reflect the deduction of taxes that a shareholder may pay on fund distributions or on the redemption of Portfolio shares.
Performance data quoted represents past performance and current performance may be lower or higher. Past performance is no guarantee of future results. The investment return and principal value will fluctuate so that shares, when redeemed, may be worth more or less than the original cost. Please visit www.columbiamanagement.com for daily and most recent month-end performance updates.
9
Understanding Your Expenses – Mortgage- and Asset-Backed Portfolio
The information on this page is intended to help you understand your ongoing costs of investing in the portfolio.
The table below reflects the fact that no fees or expenses are charged to the portfolio. Participants in the wrap fee programs eligible to invest in the portfolio pay an asset-based fee, which is negotiable, for investment services, brokerage services and investment consultation. Please read the wrap program documents for information regarding fees charged.
The information in the following table is based on an initial investment of $1,000, which is invested at the beginning of the period and held for the entire period. The amount listed in the "Actual" column is calculated using the portfolio's actual total return for the period. The amount listed in the "Hypothetical" column is calculated using a hypothetical annual return of 5%. You should not use the hypothetical account value to estimate your actual account balance.
Account value at the
beginning of the period ($)
10/01/10 | | Account value at the
end of the period ($)
03/31/11 | | Expenses paid
during the period ($)* | |
| Actual | | Hypothetical | | Actual | | Hypothetical | | Actual | | Hypothetical | |
| | 1,000.00 | | | | 1,000.00 | | | | 1,007.00 | | | | 1,024.93 | | | | — | | | | — | | |
* No fees or expenses are charged to the Portfolio. Participants in wrap fee programs pay an asset-based fee that is not included in this table.
10
Portfolio Managers' Report – Mortgage- and Asset-Backed Portfolio
For the 12-month period that ended March 31, 2011, Mortgage- and Asset-Backed Portfolio returned 4.82%, compared with 5.01% for its benchmark, the Barclays Capital U.S. Securitized Index. For the most part, the portfolio's allocations aided relative performance. However, in two key instances securities selection within those asset classes offset that advantage, accounting for the portfolio's modest performance shortfall.
Market leans toward risk
Against the backdrop of a gradually improving economy, riskier fixed-income securities tended to outperform Treasury securities and other higher quality issues. As a result, the portfolio benefited from its maximal overweight position in commercial mortgage-backed securities (CMBS), which was maintained throughout the period. However, the portfolio gave up some performance because of its higher quality orientation. We avoided securities that originated in and around 2007, when underwriting standards were lax. However, this group of securities enjoyed a nice rebound over the past twelve months. The one exception to the trend toward lower quality came from Ginnie Maes, which were especially strong performers within the mortgage passthrough market. Ginnie Mae securities have the explicit backing of the federal government and account for roughly 21% of the benchmark. The portfolio was heavily underweight in Ginnie Maes for most of the period. As a result, the portfolio slightly underperformed its benchmark.
For the 12-month period as a whole, the portfolio devoted approximately 60% of its net assets to mortgage passthroughs, which represents a significant underweight relative to the benchmark. The CMBS market accounted for another 23-25% of net assets, the maximum allocation permitted by the portfolio's charter. This segment of the market has been aided by government support and the securities carry higher yields than agency passthroughs. The remainder of the portfolio's investments consisted of high quality asset-backed securities (ABS). The portfolio's positions in ABS have been sculpted to fit the macroeconomic environment. In a period of high unemployment, we have been reluctant to expose the portfolio to undue consumer risk. We therefore have minimized our investments in securities backed by credit card debt in favor of auto loans, which in most households tend to be paid off before credit cards. Although the portfolio held small positions in sub-prime auto loans and securities backed by used cars, the vast majority of the portfolio's auto-related ABS carried AAA ratings.
Looking ahead
We have not lost sight of the fact that banks and consumers remain vulnerable, despite steady improvement in the overall economy. We continue to be overweight in the CMBS sector, which enjoys government support. We are heartened that the financing market for CMBS continues to improve. Insurance companies and banks are lending in this sector, whereas lending on the residential side is not as robust. We have neutralized the portfolio's prior underweight in Ginnie Maes, although we don't anticipate a rally in that sector the likes of which they enjoyed in the past 12 months. Finally, the government programs that have aided the mortgage sector for the past two years are by necessity subject to political risks, which we will monitor closely in the months ahead.
Performance data quoted represents past performance and current performance may be lower or higher. Past performance is no guarantee of future results. The investment return and principal value will fluctuate so that shares, when redeemed, may be worth more or less than the original cost. Please visit www.columbiamanagement.com for daily and most recent month-end performance updates.
Net asset value per share
Distributions declared per share
| 04/01/10 – 03/31/11 ($) | | | 0.30 | | |
Portfolio Structure
as of 03/31/11 (%)
| Mortgage Backed Securities | | | 63.0 | | |
Commercial Mortgage-Backed
Securities | | | 24.8 | | |
Collateralized Mortgage
Obligations | | | 0.6 | | |
| Asset Backed Securities | | | 8.8 | | |
| Government Obligation | | | 0.0 | * | |
| Short Term Obligations | | | 24.9 | | |
Other Assets and
Liabilities, Net | | | (22.1) | | |
The portfolio is actively managed and the composition of its portfolio will change over time. Portfolio structure and top holdings are calculated as a percentage of net assets.
*Less than 0.01%
11
Portfolio Managers' Report (continued) – Mortgage- and Asset-Backed Portfolio
Top 10 holdings
as of 03/31/11 (%)
Federal Home Loan Mortgage,
TBA, 5.50% 04/01/41 | | 6.5 | |
Federal National Mortgage
Association, 5.00% 06/01/40 | | 5.0 | |
Government National Mortgage
Association, 4.50% 06/15/39 | | 4.3 | |
Federal National Mortgage
Association, 5.50% 07/01/39 | | 3.9 | |
Federal National Mortgage
Association, 4.50% 05/01/40 | | 3.5 | |
Federal National Mortgage
Association, TBA,
4.50% 04/01/41 | | 3.3 | |
Federal National Mortgage
Association, 5.50% 06/01/38 | | 3.2 | |
Federal National Mortgage
Association, TBA,
4.00% 04/01/41 | | 3.0 | |
Federal Home Loan Mortgage,
6.00% 04/01/40 | | 2.8 | |
Government National Mortgage
Association, 4.50% 09/15/40 | | 2.7 | |
Portfolio characteristics and holdings are subject to change periodically and may not be representative of current characteristics and holdings. The outlook for the portfolio may differ from that presented for other Columbia Funds.
Investing in fixed-income securities may involve certain risks, including the credit quality of individual issuers, possible prepayments, market or economic developments and yields and share price fluctuations due to changes in interest rates. When interest rates go up, bond prices typically drop, and vice versa.
Investments in high-yield bonds (sometimes referred to as "junk" bonds) offer the potential for high current income and attractive total return, but involve certain risks. Changes in economic conditions or other circumstances may adversely affect a high-yield bond issuer's ability to make principal and interest payments.
12
Investment Portfolio – Corporate Bond Portfolio
March 31, 2011
| Corporate Fixed-Income Bonds & Notes – 88.6% | |
| | | Par ($) | | Value ($) | |
| Basic Materials – 4.4% | |
| Chemicals – 1.8% | |
Dow Chemical Co.
4.250% 11/15/20 | | | 90,000 | | | | 85,953 | | |
| 5.900% 02/15/15 | | | 145,000 | | | | 160,712 | | |
| 8.550% 05/15/19 | | | 32,000 | | | | 40,449 | | |
| 9.400% 05/15/39 | | | 90,000 | | | | 133,638 | | |
| Chemicals Total | | | 420,752 | | |
| Iron/Steel – 1.9% | |
ArcelorMittal
6.750% 03/01/41 | | | 40,000 | | | | 39,202 | | |
| 7.000% 10/15/39 | | | 140,000 | | | | 140,375 | | |
Nucor Corp.
5.850% 06/01/18 | | | 215,000 | | | | 245,115 | | |
| Iron/Steel Total | | | 424,692 | | |
| Metals & Mining – 0.7% | |
Vale Overseas Ltd.
6.875% 11/21/36 | | | 150,000 | | | | 159,729 | | |
| Metals & Mining Total | | | 159,729 | | |
| Basic Materials Total | | | 1,005,173 | | |
| Communications – 15.9% | |
| Media – 7.2% | |
Comcast Cable Holdings LLC
9.875% 06/15/22 | | | 72,000 | | | | 94,706 | | |
Comcast Corp.
6.950% 08/15/37 | | | 70,000 | | | | 76,208 | | |
DirecTV Holdings LLC
3.125% 02/15/16 | | | 75,000 | | | | 73,912 | | |
| 6.375% 06/15/15 | | | 75,000 | | | | 77,531 | | |
NBC Universal, Inc.
2.875% 04/01/16 (a) | | | 505,000 | | | | 493,338 | | |
News America, Inc.
6.150% 02/15/41 (a) | | | 150,000 | | | | 148,747 | | |
| 6.400% 12/15/35 | | | 159,000 | | | | 163,587 | | |
| 6.550% 03/15/33 | | | 35,000 | | | | 36,760 | | |
Rogers Cable, Inc.
6.250% 06/15/13 | | | 6,000 | | | | 6,612 | | |
Time Warner Cable, Inc.
5.850% 05/01/17 | | | 60,000 | | | | 65,622 | | |
| 5.875% 11/15/40 | | | 90,000 | | | | 84,569 | | |
| 7.300% 07/01/38 | | | 135,000 | | | | 149,465 | | |
Time Warner, Inc.
6.500% 11/15/36 | | | 170,000 | | | | 174,762 | | |
| Media Total | | | 1,645,819 | | |
| | | Par ($) | | Value ($) | |
| Telecommunication Services – 8.7% | |
AT&T, Inc.
5.625% 06/15/16 | | | 130,000 | | | | 145,425 | | |
| 6.550% 02/15/39 | | | 150,000 | | | | 156,336 | | |
BellSouth Corp.
5.200% 09/15/14 | | | 150,000 | | | | 164,006 | | |
British Telecommunications PLC
5.950% 01/15/18 | | | 355,000 | | | | 391,641 | | |
Cellco Partnership/Verizon Wireless Capital LLC
5.550% 02/01/14 | | | 205,000 | | | | 225,098 | | |
Telefonica Emisiones SAU
5.134% 04/27/20 | | | 190,000 | | | | 189,042 | | |
| 6.221% 07/03/17 | | | 95,000 | | | | 103,639 | | |
| 6.421% 06/20/16 | | | 170,000 | | | | 188,904 | | |
Verizon Communications, Inc.
3.000% 04/01/16 | | | 415,000 | | | | 412,886 | | |
| 4.600% 04/01/21 | | | 30,000 | | | | 29,871 | | |
| Telecommunication Services Total | | | 2,006,848 | | |
| Communications Total | | | 3,652,667 | | |
| Consumer Cyclical – 1.0% | |
| Airlines – 0.3% | |
Continental Airlines, Inc.
7.461% 04/01/15 | | | 65,023 | | | | 65,674 | | |
| Airlines Total | | | 65,674 | | |
| Home Builders – 0.0% | |
D.R. Horton, Inc.
5.625% 09/15/14 | | | 10,000 | | | | 10,450 | | |
| Home Builders Total | | | 10,450 | | |
| Retail – 0.7% | |
CVS Pass-Through Trust
5.298% 01/11/27 (a) | | | 97,590 | | | | 98,613 | | |
McDonald's Corp.
4.875% 07/15/40 | | | 55,000 | | | | 51,928 | | |
| Retail Total | | | 150,541 | | |
| Consumer Cyclical Total | | | 226,665 | | |
| Consumer Non-Cyclical – 10.8% | |
| Beverages – 2.9% | |
Anheuser-Busch InBev Worldwide, Inc.
7.200% 01/15/14 | | | 505,000 | | | | 573,714 | | |
PepsiCo, Inc.
4.500% 01/15/20 | | | 80,000 | | | | 83,469 | | |
| Beverages Total | | | 657,183 | | |
See Accompanying Notes to Financial Statements.
13
Corporate Bond Portfolio
March 31, 2011
| Corporate Fixed-Income Bonds & Notes (continued) | |
| | | Par ($) | | Value ($) | |
| Commercial Services – 0.5% | |
President & Fellows of Harvard College
4.875% 10/15/40 | | | 85,000 | | | | 81,223 | | |
| 6.500% 01/15/39 (a) | | | 30,000 | | | | 36,097 | | |
| Commercial Services Total | | | 117,320 | | |
| Food – 5.1% | |
ConAgra Foods, Inc.
7.000% 10/01/28 | | | 70,000 | | | | 75,226 | | |
General Mills, Inc.
5.200% 03/17/15 | | | 230,000 | | | | 252,613 | | |
Kraft Foods, Inc.
4.125% 02/09/16 | | | 415,000 | | | | 430,575 | | |
Kroger Co.
3.900% 10/01/15 | | | 390,000 | | | | 404,804 | | |
| Food Total | | | 1,163,218 | | |
| Healthcare Services – 0.4% | |
UnitedHealth Group, Inc.
6.000% 02/15/18 | | | 90,000 | | | | 100,101 | | |
| Healthcare Services Total | | | 100,101 | | |
| Pharmaceuticals – 1.9% | |
Novartis Securities Investment Ltd.
5.125% 02/10/19 | | | 180,000 | | | | 194,850 | | |
Wyeth
5.500% 02/01/14 | | | 215,000 | | | | 237,095 | | |
| Pharmaceuticals Total | | | 431,945 | | |
| Consumer Non-Cyclical Total | | | 2,469,767 | | |
| Energy – 7.5% | |
| Oil & Gas – 4.8% | |
Canadian Natural Resources Ltd.
6.250% 03/15/38 | | | 220,000 | | | | 236,931 | | |
Devon Energy Corp.
6.300% 01/15/19 | | | 70,000 | | | | 82,038 | | |
Hess Corp.
7.300% 08/15/31 | | | 65,000 | | | | 76,210 | | |
Marathon Oil Corp.
6.000% 10/01/17 | | | 54,000 | | | | 60,769 | | |
Nexen, Inc.
5.875% 03/10/35 | | | 75,000 | | | | 71,190 | | |
| 7.500% 07/30/39 | | | 45,000 | | | | 50,671 | | |
Qatar Petroleum
5.579% 05/30/11 (a) | | | 10,008 | | | | 10,060 | | |
Shell International Finance BV
5.500% 03/25/40 | | | 205,000 | | | | 207,740 | | |
Talisman Energy, Inc.
5.850% 02/01/37 | | | 145,000 | | | | 144,069 | | |
| 7.750% 06/01/19 | | | 130,000 | | | | 158,624 | | |
| Oil & Gas Total | | | 1,098,302 | | |
| | | Par ($) | | Value ($) | |
| Oil & Gas Services – 0.4% | |
Hess Corp.
5.600% 02/15/41 | | | 70,000 | | | | 66,873 | | |
Weatherford International Ltd.
5.125% 09/15/20 | | | 30,000 | | | | 29,789 | | |
| Oil & Gas Services Total | | | 96,662 | | |
| Pipelines – 2.3% | |
Plains All American Pipeline LP/PAA Finance Corp.
5.750% 01/15/20 | | | 10,000 | | | | 10,703 | | |
| 6.500% 05/01/18 | | | 55,000 | | | | 61,827 | | |
| 8.750% 05/01/19 | | | 110,000 | | | | 137,615 | | |
Southern Natural Gas Co.
8.000% 03/01/32 | | | 105,000 | | | | 128,126 | | |
TransCanada Pipelines Ltd.
6.350% 05/15/67
(05/15/17) (b)(c) | | | 180,000 | | | | 180,734 | | |
| Pipelines Total | | | 519,005 | | |
| Energy Total | | | 1,713,969 | | |
| Financials – 31.0% | |
| Banks – 18.3% | |
Bank of New York Mellon Corp.
5.450% 05/15/19 | | | 205,000 | | | | 224,870 | | |
Barclays Bank PLC
3.900% 04/07/15 | | | 65,000 | | | | 67,238 | | |
| 5.000% 09/22/16 | | | 125,000 | | | | 132,523 | | |
Capital One Capital IV
6.745% 02/17/37 (c) | | | 110,000 | | | | 110,412 | | |
Capital One Capital V
10.250% 08/15/39 | | | 120,000 | | | | 130,200 | | |
Capital One Financial Corp.
7.375% 05/23/14 | | | 15,000 | | | | 17,217 | | |
Chinatrust Commercial Bank
5.625% 12/29/49
(03/01/15) (a)(b)(c) | | | 45,000 | | | | 44,057 | | |
Comerica Bank
5.200% 08/22/17 | | | 115,000 | | | | 121,910 | | |
Discover Bank/Greenwood DE
8.700% 11/18/19 | | | 205,000 | | | | 245,603 | | |
Discover Financial Services
10.250% 07/15/19 | | | 60,000 | | | | 77,188 | | |
Fifth Third Bancorp
3.625% 01/25/16 | | | 125,000 | | | | 124,890 | | |
ING Bank NV
4.000% 03/15/16 (a) | | | 200,000 | | | | 199,720 | | |
JPMorgan Chase & Co.
7.900% 04/29/49
(04/30/18) (b)(c) | | | 50,000 | | | | 54,705 | | |
See Accompanying Notes to Financial Statements.
14
Corporate Bond Portfolio
March 31, 2011
| Corporate Fixed-Income Bonds & Notes (continued) | |
| | | Par ($) | | Value ($) | |
JPMorgan Chase Capital XX
6.550% 09/15/66 | | | 20,000 | | | | 20,328 | | |
JPMorgan Chase Capital XXIII
1.313% 05/15/77
(05/16/11) (b)(c) | | | 150,000 | | | | 124,156 | | |
KeyCorp
5.100% 03/24/21 | | | 400,000 | | | | 397,531 | | |
Lloyds TSB Bank PLC
4.375% 01/12/15 (a) | | | 196,000 | | | | 199,630 | | |
Marshall & IIsley Bank
5.300% 09/08/11 | | | 67,000 | | | | 67,353 | | |
Merrill Lynch & Co., Inc.
5.000% 02/03/14 | | | 100,000 | | | | 106,453 | | |
| 5.700% 05/02/17 | | | 40,000 | | | | 41,511 | | |
National City Corp.
4.900% 01/15/15 | | | 15,000 | | | | 16,125 | | |
| 6.875% 05/15/19 | | | 105,000 | | | | 119,868 | | |
Northern Trust Co.
6.500% 08/15/18 | | | 25,000 | | | | 28,794 | | |
PNC Funding Corp.
3.625% 02/08/15 | | | 130,000 | | | | 134,400 | | |
| 5.125% 02/08/20 | | | 150,000 | | | | 157,886 | | |
Santander U.S. Debt SA Unipersonal
3.724% 01/20/15 (a) | | | 70,000 | | | | 67,693 | | |
| 3.781% 10/07/15 (a) | | | 130,000 | | | | 124,922 | | |
Scotland International Finance No. 2 BV
4.250% 05/23/13 (a) | | | 127,000 | | | | 125,177 | | |
State Street Corp.
2.875% 03/07/16 | | | 310,000 | | | | 307,954 | | |
| 4.956% 03/15/18 | | | 45,000 | | | | 46,371 | | |
Wells Fargo & Co.
3.676% 06/15/16 | | | 555,000 | | | | 558,280 | | |
| Banks Total | | | 4,194,965 | | |
| Diversified Financial Services – 3.0% | |
Eaton Vance Corp.
6.500% 10/02/17 | | | 110,000 | | | | 124,595 | | |
ERAC USA Finance LLC
2.750% 07/01/13 (a) | | | 170,000 | | | | 172,750 | | |
| 5.250% 10/01/20 (a) | | | 155,000 | | | | 159,650 | | |
General Electric Capital Corp.
4.375% 09/16/20 | | | 155,000 | | | | 150,629 | | |
Lehman Brothers Holdings, Inc.
5.625% 01/24/13 (d) | | | 240,000 | | | | 62,400 | | |
| 6.875% 05/02/18 (d) | | | 45,000 | | | | 11,812 | | |
| Diversified Financial Services Total | | | 681,836 | | |
| Insurance – 7.7% | |
CNA Financial Corp.
5.750% 08/15/21 | | | 25,000 | | | | 25,595 | | |
| 5.850% 12/15/14 | | | 61,000 | | | | 65,768 | | |
| 7.350% 11/15/19 | | | 114,000 | | | | 128,750 | | |
ING Groep NV
5.775% 12/29/49
(12/08/15) (b)(c) | | | 105,000 | | | | 97,125 | | |
| | | Par ($) | | Value ($) | |
Liberty Mutual Group, Inc.
7.500% 08/15/36 (a) | | | 235,000 | | | | 251,450 | | |
10.750% 06/15/88
(06/15/58) (a)(b)(c) | | | 45,000 | | | | 58,500 | | |
Lincoln National Corp.
8.750% 07/01/19 | | | 155,000 | | | | 196,270 | | |
MetLife Capital Trust X
9.250% 04/08/68
(04/08/38) (a)(b)(c) | | | 95,000 | | | | 114,713 | | |
MetLife, Inc.
10.750% 08/01/69 | | | 75,000 | | | | 103,500 | | |
OneBeacon U.S. Holdings, Inc.
5.875% 05/15/13 | | | 105,000 | | | | 112,875 | | |
Prudential Financial, Inc.
4.500% 07/15/13 | | | 90,000 | | | | 94,539 | | |
| 7.375% 06/15/19 | | | 50,000 | | | | 58,706 | | |
8.875% 06/15/68
(06/15/38) (b)(c) | | | 70,000 | | | | 82,600 | | |
Transatlantic Holdings, Inc.
8.000% 11/30/39 | | | 175,000 | | | | 183,773 | | |
Unum Group
7.125% 09/30/16 | | | 165,000 | | | | 186,010 | | |
| Insurance Total | | | 1,760,174 | | |
| Real Estate Investment Trusts (REITs) – 2.0% | |
Brandywine Operating Partnership LP
7.500% 05/15/15 | | | 105,000 | | | | 118,629 | | |
Duke Realty LP
7.375% 02/15/15 | | | 125,000 | | | | 141,881 | | |
| 8.250% 08/15/19 | | | 125,000 | | | | 150,115 | | |
Highwoods Properties, Inc.
5.850% 03/15/17 | | | 55,000 | | | | 58,534 | | |
| Real Estate Investment Trusts (REITs) Total | | | 469,159 | | |
| Financials Total | | | 7,106,134 | | |
| Industrials – 4.2% | |
| Aerospace & Defense – 1.1% | |
Embraer Overseas Ltd.
6.375% 01/15/20 | | | 125,000 | | | | 134,375 | | |
L-3 Communications Corp.
4.950% 02/15/21 | | | 125,000 | | | | 125,729 | | |
| Aerospace & Defense Total | | | 260,104 | | |
| Miscellaneous Manufacturing – 1.1% | |
Ingersoll-Rand Global Holding Co., Ltd.
9.500% 04/15/14 | | | 140,000 | | | | 168,026 | | |
Tyco International Ltd./Tyco International Finance SA
6.875% 01/15/21 | | | 70,000 | | | | 83,616 | | |
| Miscellaneous Manufacturing Total | | | 251,642 | | |
See Accompanying Notes to Financial Statements.
15
Corporate Bond Portfolio
March 31, 2011
| Corporate Fixed-Income Bonds & Notes (continued) | |
| | | Par ($) | | Value ($) | |
| Transportation – 2.0% | |
BNSF Funding Trust I
6.613% 12/15/55
(01/15/26) (b)(c) | | | 130,000 | | | | 135,038 | | |
Burlington Northern Santa Fe Corp.
7.950% 08/15/30 | | | 110,000 | | | | 139,693 | | |
Union Pacific Corp.
4.698% 01/02/24 | | | 9,279 | | | | 9,556 | | |
| 5.700% 08/15/18 | | | 150,000 | | | | 167,948 | | |
| Transportation Total | | | 452,235 | | |
| Industrials Total | | | 963,981 | | |
| Technology – 2.1% | |
| Networking Products – 0.5% | |
Cisco Systems, Inc.
5.900% 02/15/39 | | | 110,000 | | | | 114,143 | | |
| Networking Products Total | | | 114,143 | | |
| Office/Business Equipment – 0.4% | |
Xerox Corp.
6.400% 03/15/16 | | | 80,000 | | | | 90,677 | | |
| Office/Business Equipment Total | | | 90,677 | | |
| Software – 1.2% | |
Oracle Corp.
5.375% 07/15/40 (a) | | | 280,000 | | | | 272,129 | | |
| Software Total | | | 272,129 | | |
| Technology Total | | | 476,949 | | |
| Utilities – 11.7% | |
| Electric – 9.7% | |
American Electric Power Co., Inc.
5.250% 06/01/15 | | | 120,000 | | | | 130,075 | | |
Commonwealth Edison Co.
4.000% 08/01/20 | | | 105,000 | | | | 101,390 | | |
| 5.950% 08/15/16 | | | 75,000 | | | | 84,176 | | |
| 6.950% 07/15/18 | | | 90,000 | | | | 99,410 | | |
Detroit Edison Co.
3.450% 10/01/20 | | | 235,000 | | | | 221,428 | | |
Duke Energy Carolinas LLC
5.300% 10/01/15 | | | 165,000 | | | | 183,900 | | |
Exelon Generation Co., LLC
6.200% 10/01/17 | | | 205,000 | | | | 227,082 | | |
Georgia Power Co.
4.750% 09/01/40 | | | 210,000 | | | | 188,059 | | |
MidAmerican Energy Holdings Co.
5.000% 02/15/14 | | | 197,000 | | | | 211,580 | | |
| 6.125% 04/01/36 | | | 70,000 | | | | 74,247 | | |
| | | Par ($) | | Value ($) | |
Nevada Power Co.
5.375% 09/15/40 | | | 250,000 | | | | 239,486 | | |
Niagara Mohawk Power Corp.
4.881% 08/15/19 (a) | | | 75,000 | | | | 78,815 | | |
Oncor Electric Delivery Co., LLC
5.950% 09/01/13 | | | 150,000 | | | | 163,641 | | |
Southern California Edison Co.
4.500% 09/01/40 | | | 100,000 | | | | 87,365 | | |
Southern Co.
4.150% 05/15/14 | | | 60,000 | | | | 63,478 | | |
Xcel Energy, Inc.
4.700% 05/15/20 | | | 65,000 | | | | 66,920 | | |
| Electric Total | | | 2,221,052 | | |
| Gas – 2.0% | |
Atmos Energy Corp.
6.350% 06/15/17 | | | 100,000 | | | | 111,434 | | |
| 8.500% 03/15/19 | �� | | 105,000 | | | | 131,163 | | |
Nakilat, Inc.
6.067% 12/31/33 (a) | | | 145,000 | | | | 144,275 | | |
Sempra Energy
6.500% 06/01/16 | | | 60,000 | | | | 68,478 | | |
| Gas Total | | | 455,350 | | |
| Utilities Total | | | 2,676,402 | | |
Total Corporate Fixed-Income Bonds & Notes
(cost of $19,523,379) | | | 20,291,707 | | |
| Government & Agency Obligations – 5.0% | |
| Foreign Government Obligations – 2.8% | |
European Investment Bank
3.000% 04/08/14 | | | 285,000 | | | | 297,006 | | |
Province of Quebec
5.125% 11/14/16 | | | 200,000 | | | | 222,864 | | |
Republic of Italy
5.375% 06/12/17 | | | 105,000 | | | | 111,647 | | |
| Foreign Government Obligations Total | | | 631,517 | | |
| U.S. Government Obligations – 2.2% | |
U.S. Treasury Bonds
4.250% 11/15/40 | | | 290,000 | | | | 277,358 | | |
U.S. Treasury Notes
2.125% 02/29/16 | | | 75,000 | | | | 74,766 | | |
| 2.625% 11/15/20 | | | 170,000 | | | | 158,631 | | |
| U.S. Government Obligations Total | | | 510,755 | | |
Total Government & Agency Obligations
(cost of $1,115,478) | | | 1,142,272 | | |
See Accompanying Notes to Financial Statements.
16
Corporate Bond Portfolio
March 31, 2011
| Municipal Bonds – 3.7% | |
| | | Par ($) | | Value ($) | |
| California – 1.6% | |
| CA Educational Facilities Authority | |
University of Southern California,
Series 2009 A,
5.250% 10/01/38 | | | 70,000 | | | | 70,647 | | |
| CA Los Angeles Unified School District | |
Series 2009,
5.750% 07/01/34 | | | 115,000 | | | | 108,591 | | |
| CA State | |
Series 2009,
7.550% 04/01/39 | | | 25,000 | | | | 27,300 | | |
Series 2010,
3.950% 11/01/15 | | | 170,000 | | | | 169,827 | | |
| California Total | | | 376,365 | | |
| Illinois – 0.1% | |
| IL Chicago | |
Series 2010 B,
6.742% 11/01/40 | | | 25,000 | | | | 25,556 | | |
| Illinois Total | | | 25,556 | | |
| Kentucky – 0.7% | |
| KY Asset Liability Commission | |
Series 2010,
3.165% 04/01/18 | | | 165,000 | | | | 160,111 | | |
| Kentucky Total | | | 160,111 | | |
| Massachusetts – 0.9% | |
| MA State | |
Series 2010:
5.631% 06/01/30 | | | 85,000 | | | | 88,458 | | |
| 5.731% 06/01/40 | | | 115,000 | | | | 118,150 | | |
| Massachusetts Total | | | 206,608 | | |
| New York – 0.4% | |
| NY New York City Municipal Water Finance Authority | |
| Series 2005 D, | |
| 5.000% 06/15/39 | | | 85,000 | | | | 81,884 | | |
| New York Total | | | 81,884 | | |
Total Municipal Bonds
(cost of $847,396) | | | 850,524 | | |
| Preferred Stock – 0.6% | |
| | | Shares | | Value ($) | |
| Financials – 0.6% | |
| Banks – 0.6% | |
| Citigroup Capital XIII 7.875% | | | 4,810 | | | | 131,794 | | |
| Banks Total | | | 131,794 | | |
| Energy Total | | | 131,794 | | |
Total Preferred Stock
(cost of $130,014) | | | 131,794 | | |
Total Investments – 97.9%
(cost of $21,616,267) (e) | | | 22,416,297 | | |
| Other Assets & Liabilities, Net – 2.1% | | | 488,524 | | |
| Net Assets – 100.0% | | | 22,904,821 | | |
Notes to Investment Portfolio:
(a) Security exempt from registration pursuant to Rule 144A under the Securities Act of 1933. These securities may be resold in transactions exempt from registration, normally to qualified institutional buyers. At March 31, 2011, these securities, which are not illiquid, amounted to $2,800,336, which represents 12.2% of net assets.
(b) Parenthetical date represents the effective maturity date for the security.
(c) The interest rate shown on floating rate or variable rate securities reflects the rate at March 31, 2011.
(d) The issuer has filed for bankruptcy protection under Chapter 11, and is in default of certain debt covenants. Income is not being accrued. At March 31, 2011, the value of these securities amounted to $74,212, which represents 0.3% of net assets.
(e) Cost for federal income tax purposes is $21,653,355.
| Affiliate | | Value,
beginning
of period | | Purchases | | Sales
Proceeds | | Interest
Income | | Value,
end of
period | |
Merrill Lynch &
Co., Inc.
6.050%
08/15/12 | | $ | 37,380 | | | $ | — | | | $ | — | | | $ | 176 | | | $ | — | | |
As of May 1, 2010, this company was no longer an affiliate of the Portfolio. The above table reflects activity for the period from April 1, 2010 to April 30, 2010.
Generally accepted accounting principles (GAAP) require disclosure regarding the inputs and valuation techniques used to measure fair value and any changes in valuation inputs or techniques. In addition, investments shall be disclosed by major category.
The Fund categorizes its fair value measurements according to a three-level hierarchy that maximizes the use of observable inputs and minimizes the use of unobservable inputs by prioritizing that the most observable input be used when available. Observable inputs are those that market participants would use in pricing an investment based on market data obtained from sources independent of the reporting entity. Unobservable inputs are those that reflect the Fund's assumptions about the information market participants would use in pricing an investment. An investment's level within the fair value hierarchy is based on the lowest level of any input that is deemed significant to the asset or liability's fair value measurement. The input levels are not necessarily an indication of the risk or liquidity associated with investments at that level. For example, certain U.S. government securities are generally high quality and liquid, however, they are reflected as Level 2 because the inputs used to determine fair value may not always be quoted prices in an active market.
See Accompanying Notes to Financial Statements.
17
Corporate Bond Portfolio
March 31, 2011
Fair value inputs are summarized in the three broad levels listed below:
• Level 1—Valuations based on quoted prices for investments in active markets that the Fund has the ability to access at the measurement date (including NAV for open-end mutual funds). Valuation adjustments are not applied to Level 1 investments.
• Level 2—Valuations based on other significant observable inputs (including quoted prices for similar securities, interest rates, prepayment speeds, credit risks, etc.).
• Level 3—Valuations based on significant unobservable inputs (including the Fund's own assumptions and judgment in determining the fair value of investments).
Inputs that are used in determining fair value of an investment may include price information, credit data, volatility statistics, and other factors. These inputs can be either observable or unobservable. The availability of observable inputs can vary between investments, and is affected by various factors such as the type of investment, and the volume and level of activity for that investment or similar investments in the marketplace. The inputs will be considered by the Investment Manager, along with any other relevant factors in the calculation of an investment's fair value. The Fund uses prices and inputs that are current as of the measurement date, which may include periods of market dislocations. During these periods, the availability of prices and inputs may be reduced for many investments. This condition could cause an investment to be reclassified between the various levels within the hierarchy. Non-U.S. equity securities actively traded in foreign markets may be reflected in Level 2 despite the availability of closing prices, because the Fund evaluates and determines whether those closing prices reflect fair value at the close of the New York Stock Exchange (NYSE) or require adjustment, as described in Note 2 to the financial statements—Security Valuation.
Investments falling into the Level 3 category are primarily supported by quoted prices from brokers and dealers participating in the market for those investments. However, these may be classified as Level 3 investments due to lack of market transparency and corroboration to support these quoted prices. Additionally, valuation models may be used as the pricing source for any remaining investments classified as Level 3. These models rely on one or more significant unobservable inputs and/or significant assumptions by the Investment Manager. Inputs used in valuations may include, but are not limited to, financial statement analysis, capital account balances, discount rates and estimated cash flows, and comparable company data.
The following table is a summary of the inputs used to value the Portfolio's investments as of March 31, 2011:
| Description | | Quoted Prices
(Level 1) | | Other
Significant
(Level 2) | | Significant
Unobservable
Inputs
(Level 3) | | Total | |
Corporate Fixed-Income
Bonds & Notes | |
| Basic Materials | | $ | — | | | $ | 1,005,173 | | | $ | — | | | $ | 1,005,173 | | |
| Communications | | | — | | | | 3,652,667 | | | | — | | | | 3,652,667 | | |
| Consumer Cyclical | | | — | | | | 160,991 | | | | 65,674 | | | | 226,665 | | |
| Consumer Non-Cyclical | | | — | | | | 2,469,767 | | | | — | | | | 2,469,767 | | |
| Energy | | | — | | | | 1,713,969 | | | | — | | | | 1,713,969 | | |
| Financials | | | — | | | | 7,106,134 | | | | — | | | | 7,106,134 | | |
| Industrials | | | — | | | | 963,981 | | | | — | | | | 963,981 | | |
| Technology | | | — | | | | 476,949 | | | | — | | | | 476,949 | | |
| Utilities | | | — | | | | 2,676,402 | | | | — | | | | 2,676,402 | | |
Total Corporate
Fixed-Income
Bonds & Notes | | | — | | | | 20,226,033 | | | | 65,674 | | | | 20,291,707 | | |
Government & Agency
Obligations | |
Foreign Government
Obligations | | | — | | | | 631,517 | | | | — | | | | 631,517 | | |
U.S. Government
Obligations | | | 510,755 | | | | — | | | | — | | | | 510,755 | | |
Total Government &
Agency Obligations | | | 510,755 | | | | 631,517 | | | | — | | | | 1,142,272 | | |
| Total Municipal Bonds | | | — | | | | 850,524 | | | | — | | | | 850,524 | | |
| Total Preferred Stock | | | — | | | | 131,794 | | | | — | | | | 131,794 | | |
| Total Investments | | | 510,755 | | | | 21,839,868 | | | | 65,674 | | | | 22,416,297 | | |
Unrealized Depreciation
on open Futures
Contracts | | | (3,519 | ) | | | — | | | | — | | | | (3,519 | ) | |
Unrealized Appreciation
on Credit Default
Swap Contracts | | | — | | | | 1,197 | | | | — | | | | 1,197 | | |
Unrealized Depreciation
on Credit Default
Swap Contracts | | | — | | | | (1,702 | ) | | | — | | | | (1,702 | ) | |
| Total | | $ | 507,236 | | | $ | 21,839,363 | | | $ | 65,674 | | | $ | 22,412,273 | | |
The Portfolio's assets assigned to the Level 2 input category are generally valued using the market approach, in which a security's value is determined through reference to prices and information from market transactions for similar or identical assets.
The Portfolio's assets assigned to the Level 3 category are valued utilizing the valuation technique deemed the most appropriate in the circumstance.
Certain corporate fixed-income bonds & notes classified as Level 3 securities are valued using the market approach and utilize single market quotations from broker dealers
There were no significant transfers of financial assets between Levels 1 and 2 during the period.
The following table reconciles asset balances for the year ended March 31, 2011, in which significant unobservable inputs (Level 3) were used in determining value:
| Investment in Securities | | Balance
as of
March 31,
2010 | | Accrued
Discounts/
(Premiums) | | Realized
Gain
(Loss) | | Change in
Unrealized
Appreciation
(Depreciation) | | Purchases | | Sales | | Transfers
into
Level 3 | | Transfers
out of
Level 3 | | Balance
as of
March 31,
2011 | |
Corporate Fixed-Income
Bonds & Notes | |
| Consumer Cyclical | | $ | 91,195 | | | $ | 531 | | | $ | 885 | | | $ | 389 | | | $ | — | | | $ | (27,326 | ) | | $ | — | | | $ | — | | | $ | 65,674 | | |
The information in the above reconciliation represents fiscal year to date activity for any securities identified as using Level 3 inputs at either the beginning or the end of the current fiscal period. The change in unrealized appreciation attributable to securities owned at March 31, 2011, which were valued using significant unobservable inputs (Level 3) amounted to $389.
See Accompanying Notes to Financial Statements.
18
Corporate Bond Portfolio
March 31, 2011
At March 31, 2011, the Portfolio has entered into the following credit default swap contracts:
Credit Risk
Swap
Counterparty | | Referenced
Obligation | | Receive
Buy/Sell
Protection | | Fixed Rate | | Expiration
Date | | Notional
Amount | | Upfront
Premium
Paid
(Received) | | Value of
Contract | |
| Barclays Capital | | D.R. Horton, Inc. | | Buy | | | 1.000 | % | | 06/20/16 | | $ | 320,000 | | | $ | 17,669 | | | $ | (98 | ) | |
| Barclays Capital | | The Home Depot, Inc. | | Buy | | | 1.000 | % | | 06/20/16 | | | 350,000 | | | | (6,546 | ) | | | (47 | ) | |
| Barclays Capital | | Toll Brothers, Inc. | | Buy | | | 1.000 | % | | 06/20/16 | | | 390,000 | | | | 16,345 | | | | 869 | | |
| JPMorgan | | D.R. Horton, Inc. | | Buy | | | 1.000 | % | | 03/20/15 | | | 300,000 | | | | 13,092 | | | | (1,499 | ) | |
| JPMorgan | | Macy's, Inc. | | Buy | | | 1.000 | % | | 06/20/16 | | | 190,000 | | | | 4,060 | | | | (58 | ) | |
| Morgan Stanley | | Limited Brands, Inc. | | Buy | | | 1.000 | % | | 06/20/16 | | | 190,000 | | | | 7,317 | | | | 328 | | |
| | | $ | (505 | ) | |
At March 31, 2011 the Portfolio held the following open short futures contracts:
Risk Exposure/Type
| Interest Rate Risk | | Number
of
Contracts | | Value | | Aggregate
Face Value | | Expiration
Date | | Unrealized
Depreciation | |
| 5-Year U.S. Treasury Notes | | | 2 | | | $ | 233,578 | | | $ | 233,540 | | | June-2011 | | $ | (38 | ) | |
| 10-Year U.S. Treasury Notes | | | 8 | | | | 952,250 | | | | 952,037 | | | June-2011 | | | (213 | ) | |
| Ultra Long-Term U.S. Treasury Bonds | | | 3 | | | | 370,688 | | | | 367,420 | | | June-2011 | | | (3,268 | ) | |
| | | $ | (3,519 | ) | |
As of March 31, 2011, cash of $99,000 was pledged as collateral for open futures contracts.
At March 31, 2011, the Portfolio held investments in the following sectors:
| Sector (Unaudited) | | % of
Net Assets | |
| Financials | | | 31.0 | | |
| Communications | | | 15.9 | | |
| Utilities | | | 11.7 | | |
| Consumer Non-Cyclical | | | 10.8 | | |
| Energy | | | 7.5 | | |
| Industrials | | | 4.2 | | |
| Basic Materials | | | 4.4 | | |
| Technology | | | 2.1 | | |
| Consumer Cyclical | | | 1.0 | | |
| | | | 88.6 | | |
| Government & Agency Obligations | | | 5.0 | | |
| Municipal Bonds | | | 3.7 | | |
| Preferred Stock | | | 0.6 | | |
| Other Assets & Liabilities, Net | | | 2.1 | | |
| | | | 100.0 | | |
See Accompanying Notes to Financial Statements.
19
Investment Portfolio – Mortgage- and Asset-Backed Portfolio
March 31, 2011
| Mortgage-Backed Securities – 63.0% | |
| | | Par ($) | | Value ($) | |
Federal Home Loan Mortgage Corp.
4.000% 12/01/40 | | | 1,841,086 | | | | 1,810,356 | | |
| 4.500% 11/15/24 | | | 544,515 | | | | 574,186 | | |
| 5.500% 06/01/40 | | | 1,302,864 | | | | 1,390,987 | | |
| 6.000% 04/01/40 | | | 2,124,365 | | | | 2,310,540 | | |
| 6.500% 11/01/32 | | | 6,220 | | | | 7,029 | | |
5.618% 06/01/37
(04/01/11) (a)(b) | | | 378,750 | | | | 403,147 | | |
TBA,
5.500% 04/01/41 (c) | | | 5,000,000 | | | | 5,332,810 | | |
Federal National Mortgage Association
4.000% 11/01/40 | | | 1,913,568 | | | | 1,886,184 | | |
| 4.000% 12/01/40 | | | 685,198 | | | | 675,178 | | |
| 4.500% 04/01/39 | | | 220,899 | | | | 225,875 | | |
| 4.500% 04/01/40 | | | 261,410 | | | | 267,135 | | |
| 4.500% 05/01/40 | | | 2,815,868 | | | | 2,890,016 | | |
| 4.500% 06/01/40 | | | 1,591,353 | | | | 1,624,716 | | |
| 4.500% 07/01/40 | | | 1,389,111 | | | | 1,418,234 | | |
| 4.500% 09/01/40 | | | 1,700,000 | | | | 1,732,453 | | |
| 5.000% 04/25/18 | | | 1,980,608 | | | | 2,110,432 | | |
| 5.000% 06/01/40 | | | 3,943,134 | | | | 4,132,536 | | |
| 5.000% 07/01/40 | | | 1,201,253 | | | | 1,267,198 | | |
| 5.500% 08/01/37 | | | 120,175 | | | | 129,257 | | |
| 5.500% 06/01/38 | | | 2,467,642 | | | | 2,649,494 | | |
| 5.500% 07/01/39 | | | 3,010,286 | | | | 3,240,400 | | |
| 6.000% 09/01/36 | | | 961,478 | | | | 1,055,070 | | |
| 6.000% 11/01/38 | | | 752,622 | | | | 822,108 | | |
| 6.500% 10/01/37 | | | 195,483 | | | | 219,365 | | |
| 7.000% 02/01/32 | | | 6,781 | | | | 7,826 | | |
TBA:
4.000% 04/01/41 (c) | | | 2,500,000 | | | | 2,458,595 | | |
| 4.500% 04/01/41 (c) | | | 2,700,000 | | | | 2,747,671 | | |
Government National Mortgage Association
4.500% 06/15/39 | | | 3,440,038 | | | | 3,555,244 | | |
| 4.500% 09/15/40 | | | 2,143,714 | | | | 2,215,507 | | |
| 4.500% 03/15/41 (c) | | | 2,500,000 | | | | 2,583,725 | | |
| 7.000% 03/15/31 | | | 1,413 | | | | 1,636 | | |
Total Mortgage-Backed Securities
(cost of $51,736,221) | | | 51,744,910 | | |
| Commercial Mortgage-Backed Securities – 24.8% | |
Bear Stearns Commercial Mortgage Securities
4.740% 03/13/40 | | | 95,848 | | | | 100,149 | | |
| 5.200% 01/12/41 | | | 70,000 | | | | 74,644 | | |
| 5.201% 12/11/38 | | | 474,847 | | | | 500,752 | | |
| 5.700% 06/13/50 | | | 870,000 | | | | 927,363 | | |
5.742% 09/11/42
(04/01/11) (a)(b) | | | 570,000 | | | | 618,874 | | |
| | | Par ($) | | Value ($) | |
Citigroup/Deutsche Bank Commercial Mortgage Trust
5.322% 12/11/49 | | | 1,051,667 | | | | 1,084,610 | | |
Commercial Mortgage Pass Through Certificates
5.311% 07/10/37
(04/01/11) (a)(b) | | | 235,000 | | | | 252,206 | | |
Credit Suisse Mortgage Capital Certificates
5.441% 02/15/39
(04/01/11) (a)(b) | | | 48,729 | | | | 51,414 | | |
5.825% 06/15/38
(04/01/11) (a)(b) | | | 690,000 | | | | 746,683 | | |
GE Capital Commercial Mortgage Corp.
4.819% 01/10/38 | | | 425,000 | | | | 443,914 | | |
| 5.349% 08/11/36 | | | 130,000 | | | | 135,020 | | |
GMAC Commercial Mortgage Securities, Inc.
5.472% 05/10/40
(04/01/11) (a)(b) | | | 80,000 | | | | 85,487 | | |
Greenwich Capital Commercial Funding Corp.
4.799% 08/10/42
(04/01/11) (a)(b) | | | 140,000 | | | | 147,696 | | |
| 5.444% 03/10/39 | | | 620,000 | | | | 656,247 | | |
5.890% 07/10/38
(04/01/11) (a)(b) | | | 1,000,000 | | | | 1,093,996 | | |
GS Mortgage Securities Corp. II
4.753% 03/10/44 | | | 265,000 | | | | 266,866 | | |
5.162% 12/10/43
(04/01/11) (a)(b)(d) | | | 330,000 | | | | 342,684 | | |
JPMorgan Chase Commercial Mortgage Securities Corp.
4.070% 11/15/43 (d) | | | 145,000 | | | | 139,397 | | |
| 4.717% 02/15/46 (d) | | | 895,000 | | | | 898,137 | | |
| 4.985% 01/12/37 | | | 85,000 | | | | 89,304 | | |
4.999% 10/15/42
(04/01/11) (a)(b) | | | 700,000 | | | | 720,936 | | |
| 5.170% 05/15/47 | | | 77,203 | | | | 77,552 | | |
5.202% 12/15/44
(04/01/11) (a)(b) | | | 650,000 | | | | 695,904 | | |
| 5.255% 07/12/37 | | | 30,000 | | | | 31,812 | | |
| 5.440% 06/12/47 | | | 425,000 | | | | 448,156 | | |
| 5.552% 05/12/45 | | | 865,000 | | | | 925,933 | | |
5.738% 02/12/49
(04/01/11) (a)(b) | | | 400,000 | | | | 428,368 | | |
| 5.857% 10/12/35 | | | 102,596 | | | | 103,363 | | |
LB-UBS Commercial Mortgage Trust
4.166% 05/15/32 | | | 205,000 | | | | 212,731 | | |
| 4.810% 01/15/36 | | | 554,190 | | | | 570,738 | | |
| 5.020% 08/15/29 | | | 170,000 | | | | 180,810 | | |
| 5.430% 02/15/40 | | | 295,000 | | | | 310,848 | | |
| 5.866% 09/15/45 | | | 975,000 | | | | 1,045,745 | | |
See Accompanying Notes to Financial Statements.
20
Mortgage- and Asset-Backed Portfolio
March 31, 2011
| Mortgage-Backed Securities (continued) | |
| | | Par ($) | | Value ($) | |
Morgan Stanley Capital I
4.660% 09/13/45 | | | 215,000 | | | | 226,911 | | |
| 4.970% 12/15/41 | | | 280,000 | | | | 297,204 | | |
5.033% 09/15/47
(04/01/11) (a)(b)(d) | | | 365,000 | | | | 378,328 | | |
| 5.332% 12/15/43 | | | 844,566 | | | | 891,131 | | |
Morgan Stanley Dean Witter Capital I
4.920% 03/12/35 | | | 400,722 | | | | 420,924 | | |
Wachovia Bank Commercial Mortgage Trust
4.748% 02/15/41 | | | 265,000 | | | | 279,025 | | |
| 4.980% 11/15/34 | | | 85,000 | | | | 88,335 | | |
| 5.012% 12/15/35 | | | 515,000 | | | | 546,308 | | |
| 5.037% 03/15/42 | | | 244,985 | | | | 255,169 | | |
5.209% 10/15/44
(04/01/11) (a)(b) | | | 895,000 | | | | 962,198 | | |
| 5.308% 11/15/48 | | | 115,000 | | | | 123,197 | | |
5.320% 12/15/44
(04/01/11) (a)(b) | | | 30,000 | | | | 31,545 | | |
| 5.997% 06/15/45 | | | 85,000 | | | | 90,715 | | |
Wells Fargo Commercial Mortgage Trust
4.393% 11/15/43 (d) | | | 825,000 | | | | 817,175 | | |
WF-RBS Commercial Mortgage Trust
4.869% 02/15/44
(04/01/11) (a)(b)(d) | | | 540,000 | | | | 552,424 | | |
Total Commercial Mortgage-Backed Securities
(cost of $19,896,079) | | | 20,368,928 | | |
| Asset-Backed Securities – 8.8% | |
Ally Auto Receivables Trust
1.380% 07/15/14
(04/15/11) (a)(b) | | | 135,000 | | | | 135,674 | | |
| 1.450% 05/15/14 | | | 100,000 | | | | 100,779 | | |
BMW Vehicle Lease Trust
0.820% 04/15/13 | | | 100,000 | | | | 100,036 | | |
Capital Auto Receivables Asset Trust
5.210% 03/17/14 | | | 338,191 | | | | 344,320 | | |
| 5.300% 05/15/14 | | | 1,068,189 | | | | 1,091,451 | | |
Chrysler Financial Auto Securitization Trust
0.910% 08/08/13 | | | 750,000 | | | | 748,096 | | |
| 6.250% 05/08/14 (d) | | | 100,000 | | | | 103,911 | | |
Citibank Credit Card Issuance Trust
6.300% 06/20/14 | | | 375,000 | | | | 396,216 | | |
| 6.950% 02/18/14 | | | 38,000 | | | | 39,797 | | |
Citicorp Residential Mortgage Securities, Inc.
5.775% 09/25/36
(04/01/11) (a)(b) | | | 200,000 | | | | 197,143 | | |
CitiFinancial Auto Issuance Trust
2.590% 10/15/13 (d) | | | 350,000 | | | | 354,957 | | |
CNH Equipment Trust
1.170% 05/15/15 | | | 165,000 | | | | 164,074 | | |
| | | Par ($) | | Value ($) | |
Daimler Chrysler Auto Trust
5.280% 03/08/13 | | | 139,948 | | | | 142,813 | | |
Ford Credit Auto Lease Trust
0.910% 07/15/13 (d) | | | 645,000 | | | | 644,469 | | |
Ford Credit Auto Owner Trust
1.320% 06/15/14 | | | 100,000 | | | | 100,620 | | |
| 5.160% 04/15/13 | | | 389,000 | | | | 402,138 | | |
| 6.070% 05/15/14 | | | 250,000 | | | | 267,422 | | |
Franklin Auto Trust
5.360% 05/20/16 | | | 86,697 | | | | 88,172 | | |
GE Capital Credit Card Master Note Trust
3.690% 07/15/15 | | | 335,000 | | | | 346,843 | | |
Harley-Davidson Motorcycle Trust
1.160% 02/15/15 | | | 100,000 | | | | 99,803 | | |
Honda Auto Receivables Owner Trust
0.700% 04/21/14 | | | 105,000 | | | | 104,753 | | |
Nissan Auto Lease Trust
1.120% 12/15/13 | | | 150,000 | | | | 150,089 | | |
SACO I, Inc.
0.450% 04/25/35
(04/25/11) (a)(b)(d) | | | 13,515 | | | | 5,613 | | |
Terwin Mortgage Trust
1.150% 07/25/34
(04/25/11) (a)(b) | | | 40,537 | | | | 37,449 | | |
USAA Auto Owner Trust
2.530% 07/15/15 | | | 300,000 | | | | 307,813 | | |
| 5.070% 06/15/13 | | | 340,141 | | | | 341,928 | | |
Volkswagen Auto Lease Trust
0.770% 01/22/13 | | | 350,000 | | | | 350,141 | | |
Volkswagen Auto Loan Enhanced Trust
5.470% 03/20/13 | | | 44,144 | | | | 44,835 | | |
Total Asset-Backed Securities
(cost of $7,220,510) | | | 7,211,355 | | |
| Collateralized Mortgage Obligations – 0.6% | |
| Agency – 0.5% | |
Federal Home Loan Mortgage Corp.
4.000% 12/15/22 | | | 376,091 | | | | 391,553 | | |
| Agency Total | | | 391,553 | | |
| Non-Agency – 0.1% | |
Morgan Stanley Mortgage Loan Trust
0.470% 02/25/47
(04/25/11) (a)(b) | | | 636,597 | | | | 115,416 | | |
| Non-Agency Total | | | 115,416 | | |
Total Collateralized Mortgage Obligations
(cost of $1,024,188) | | | 506,969 | | |
See Accompanying Notes to Financial Statements.
21
Mortgage- and Asset-Backed Portfolio
March 31, 2011
| Government Obligation – 0.0% | |
| | | Par ($) | | Value ($) | |
| U.S. Government Obligation – 0.0% | |
U.S. Treasury Note
1.875% 06/30/15 (e) | | | 20,000 | | | | 19,989 | | |
| U.S. Government Obligation Total | | | 19,989 | | |
Total Government Obligation
(cost of $20,159) | | | 19,989 | | |
| Short-Term Obligations – 24.9% | |
| Repurchase Agreement – 16.1% | |
Repurchase agreement with
Fixed Income Clearing Corp.,
dated 03/31/11, due 04/01/11
at 0.070%, collateralized by a
U.S. Government Agency
obligation maturing 06/23/15,
market value $13,459,625
(repurchase proceeds
$13,195,026) | | | 13,195,000 | | | | 13,195,000 | | |
| U.S. Government Obligations – 8.8% | |
U.S. Treasury Bill
0.010% 08/25/11 (e) | | | 270,000 | | | | 269,847 | | |
| 0.055% 04/14/11 | | | 7,000,000 | | | | 6,999,861 | | |
| U.S. Government Obligations Total | | | 7,269,708 | | |
Total Short-Term Obligations
(cost of $20,464,614) | | | 20,464,708 | | |
Total Investments – 122.1%
(cost of $100,361,771) (f) | | | 100,316,859 | | |
| Other Assets & Liabilities, Net – (22.1)% | | | (18,185,019 | ) | |
| Net Assets – 100.0% | | | 82,131,840 | | |
Notes to Investment Portfolio:
(a) The interest rate shown on floating rate or variable rate securities reflects the rate at March 31, 2011.
(b) Parenthetical date represents the next reset date for the security.
(c) Security purchased on a delayed delivery basis.
(d) Security exempt from registration pursuant to Rule 144A under the Securities Act of 1933. These securities may be resold in transactions exempt from registration, normally to qualified institutional buyers. At March 31, 2011, these securities, which are not illiquid, amounted to $4,237,095, which represents 5.2% of net assets.
(e) A portion of these securities, with a market value of $49,972, is pledged as collateral for open future contracts.
(f) Cost for federal income tax purposes is $100,361,771.
Generally accepted accounting principles (GAAP) require disclosure regarding the inputs and valuation techniques used to measure fair value and any changes in valuation inputs or techniques. In addition, investments shall be disclosed by major category.
The Fund categorizes its fair value measurements according to a three-level hierarchy that maximizes the use of observable inputs and minimizes the use of unobservable inputs by prioritizing that the most observable input be used when available. Observable inputs are those that market participants would use in pricing an investment based on market data obtained from sources independent of the reporting entity. Unobservable inputs are those that reflect the Fund's assumptions about the information market participants would use in pricing an investment. An investment's level within the fair value hierarchy is based on the lowest level of any input that is deemed significant to the asset or liability's fair value measurement. The input levels are not necessarily an indication of the risk or liquidity associated with investments at that level. For example, certain U.S. government securities are generally high quality and liquid, however, they are reflected as Level 2 because the inputs used to determine fair value may not always be quoted prices in an active market.
Fair value inputs are summarized in the three broad levels listed below:
• Level 1—Valuations based on quoted prices for investments in active markets that the Fund has the ability to access at the measurement date (including NAV for open-end mutual funds). Valuation adjustments are not applied to Level 1 investments.
• Level 2—Valuations based on other significant observable inputs (including quoted prices for similar securities, interest rates, prepayment speeds, credit risks, etc.).
• Level 3—Valuations based on significant unobservable inputs (including the Fund's own assumptions and judgment in determining the fair value of investments).
Inputs that are used in determining fair value of an investment may include price information, credit data, volatility statistics, and other factors. These inputs can be either observable or unobservable. The availability of observable inputs can vary between investments, and is affected by various factors such as the type of investment, and the volume and level of activity for that investment or similar investments in the marketplace. The inputs will be considered by the Investment Manager, along with any other relevant factors in the calculation of an investment's fair value. The Fund uses prices and inputs that are current as of the measurement date, which may include periods of market dislocations. During these periods, the availability of prices and inputs may be reduced for many investments. This condition could cause an investment to be reclassified between the various levels within the hierarchy. Non-U.S. equity securities actively traded in foreign markets may be reflected in Level 2 despite the availability of closing prices, because the Fund evaluates and determines whether those closing prices reflect fair value at the close of the New York Stock Exchange (NYSE) or require adjustment, as described in Note 2 to the financial statements—Security Valuation.
Investments falling into the Level 3 category are primarily supported by quoted prices from brokers and dealers participating in the market for those investments. However, these may be classified as Level 3 investments due to lack of market transparency and corroboration to support these quoted prices. Additionally, valuation models may be used as the pricing source for any remaining investments classified as Level 3. These models rely on one or more significant unobservable inputs and/or significant assumptions by the Investment Manager. Inputs used in valuations may include, but are not limited to, financial statement analysis, capital account balances, discount rates and estimated cash flows, and comparable company data.
See Accompanying Notes to Financial Statements.
22
Mortgage- and Asset-Backed Portfolio
March 31, 2011
The following table is a summary of the inputs used to value the Portfolio's investments as of March 31, 2011:
| Description | | Quoted
Prices
(Level 1) | | Other
Significant
Observable
Inputs
(Level 2) | | Significant
Unobservable
Inputs
(Level 3) | | Total | |
Total Mortgage-Backed
Securities | | $ | 0 | | | $ | 51,744,910 | | | $ | — | | | $ | 51,744,910 | | |
Total Commercial
Mortgage-Backed
Securities | | | — | | | | 20,368,928 | | | | — | | | | 20,368,928 | | |
Total Asset-Backed
Securities | | | — | | | | 7,211,355 | | | | — | | | | 7,211,355 | | |
Total Collateralized
Mortgage Obligations | | | — | | | | 506,969 | | | | — | | | | 506,969 | | |
Total Government
Obligations | | | 19,989 | | | | — | | | | — | | | | 19,989 | | |
| Short-Term Obligations | | | | | | | | | |
| Repurchase Agreement | | | — | | | | 13,195,000 | | | | — | | | | 13,195,000 | | |
U.S. Government
Obligations | | | 7,269,708 | | | | — | | | | — | | | | 7,269,708 | | |
Total Short-Term
Obligations | | | 7,269,708 | | | | 13,195,000 | | | | — | | | | 20,464,708 | | |
| Total Investments | | | 7,289,697 | | | | 93,027,162 | | | | — | | | | 100,316,859 | | |
Unrealized Depreciation
on open Futures
Contracts | | | (828 | ) | | | — | | | | — | | | | (828 | ) | |
| Total | | $ | 7,288,869 | | | $ | 93,027,162 | | | $ | — | | | $ | 100,316,031 | | |
The Portfolio's assets assigned to the Level 2 input category are generally valued using the market approach, in which a security's value is determined through reference to prices and information from market transactions for similar or identical assets.
Certain short-term obligations may be valued using amortized cost, an income approach which converts future cash flows to a present value based upon the discount or premium at purchase.
There were no significant transfers of financial assets between Levels 1 and 2 during the period.
At March 31, 2011, the Portfolio held the following open short futures contracts:
| Interest Rate Risk | | Number
of
Contracts | | Value | | Aggregate
Face Value | | Expiration
Date | | Unrealized
Depreciation | |
| 10-Year U.S. Treasury Notes | | | 24 | | | $ | 2,856,750 | | | $ | 2,855,922 | | | June-2011 | | $ | (828 | ) | |
At March 31, 2011, the asset allocation of the Portfolio is as follow:
| Asset Allocation (unaudited) | | % of
Net Assets | |
| Mortgage-Backed Securities | | | 63.0 | | |
| Commercial Mortgage-Backed Securities | | | 24.8 | | |
| Asset-Backed Securities | | | 8.8 | | |
| Collateralized Mortgage Obligations | | | 0.6 | | |
| Government Obligation | | | 0.0 | * | |
| | | | 97.2 | | |
| Short-Term Obligations | | | 24.9 | | |
| Other Assets & Liabilities, Net | | | (22.1 | ) | |
| | | | 100.0 | | |
* Rounds to less than 0.01%.
| Acronym | | Name | |
| TBA | | To Be Announced | |
See Accompanying Notes to Financial Statements.
23
Statements of Assets and Liabilities – Fixed Income Sector Portfolios
March 31, 2011
| | | ($) | | ($) | |
| | | Corporate
Bond
Portfolio | | Mortgage- and
Asset- Backed
Portfolio | |
| Assets | |
| Investments, at identified cost | | | 21,616,267 | | | | 87,166,771 | | |
| Repurchase agreements, at cost | | | — | | | | 13,195,000 | | |
| Total investments, at cost | | | 21,616,267 | | | | 100,361,771 | | |
| Investments, at value | | | 22,416,297 | | | | 87,121,859 | | |
| Repurchase agreement, at value | | | — | | | | 13,195,000 | | |
| Total investments, at value | | | 22,416,297 | | | | 100,316,859 | | |
| Cash | | | 59,596 | | | | 920 | | |
| Cash collateral for open futures contracts | | | 99,000 | | | | — | | |
| Open credit default swap contracts | | | 1,197 | | | | — | | |
| Credit default swap contracts premiums paid | | | 55,618 | | | | — | | |
| Receivable for: | |
| Investments sold | | | 2,938,122 | | | | — | | |
| Investments sold on a delayed delivery basis | | | — | | | | 1,372,102 | | |
| Portfolio shares sold | | | — | | | | 1,597 | | |
| Interest | | | 282,207 | | | | 268,169 | | |
| Futures variation margin | | | — | | | | 2,250 | | |
| Foreign tax reclaims | | | 49 | | | | — | | |
| Other assets | | | 9,988 | | | | — | | |
| Total Assets | | | 25,862,074 | | | | 101,961,897 | | |
| Liabilities | |
| Open credit default swap contracts | | | 1,702 | | | | — | | |
| Credit default swap contracts premiums received | | | 6,535 | | | | — | | |
| Payable for: | |
| Investments purchased | | | 2,948,735 | | | | 5,337,018 | | |
| Investments purchased on a delayed delivery basis | | | — | | | | 14,492,711 | | |
| Portfolio shares repurchased | | | — | | | | 328 | | |
| Futures variation margin | | | 281 | | | | — | | |
| Total Liabilities | | | 2,957,253 | | | | 19,830,057 | | |
| Net Assets | | | 22,904,821 | | | | 82,131,840 | | |
| Net Assets Consist of | |
| Paid-in capital | | | 25,019,061 | | | | 94,338,254 | | |
| Undistributed net investment income | | | 73,292 | | | | 75,765 | | |
| Accumulated net realized loss | | | (2,976,691 | ) | | | (12,236,439 | ) | |
| Net unrealized appreciation (depreciation) on: | |
| Investments | | | 800,030 | | | | (44,912 | ) | |
| Credit default swap contracts | | | (7,352 | ) | | | — | | |
| Futures contracts | | | (3,519 | ) | | | (828 | ) | |
| Net Assets | | | 22,904,821 | | | | 82,131,840 | | |
| Shares outstanding | | | 2,174,982 | | | | 8,738,000 | | |
| Net asset value price per share | | | 10.53 | | | | 9.40 | | |
See Accompanying Notes to Financial Statements.
24
Statements of Operations – Fixed Income Sector Portfolios
For the Year Ended March 31, 2011
| | | ($) | | ($) | |
| | | Corporate
Bond
Portfolio | | Mortgage- and
Asset- Backed
Portfolio | |
| Investment Income | |
| Interest | | | 1,148,387 | | | | 1,444,145 | | |
| Interest from affiliates | | | 176 | | | | — | | |
| Dividends | | | 2,849 | | | | — | | |
| Foreign taxes withheld | | | (54 | ) | | | — | | |
| Total Investment Income | | | 1,151,358 | | | | 1,444,145 | | |
| Expenses | |
| Expenses before interest expense | | | — | | | | — | | |
| Interest expense | | | 2,308 | | | | — | | |
| Total Expenses | | | 2,308 | | | | — | | |
| Net Investment Income | | | 1,149,050 | | | | 1,444,145 | | |
Net Realized and Unrealized Gain (Loss) on Investments,
Futures Contracts and Credit Default Swap Contracts | |
| Net realized gain (loss) on: | |
| Investments | | | 917,432 | | | | 957,184 | | |
| Futures contracts | | | (36,754 | ) | | | (23,625 | ) | |
| Credit default swap contracts | | | (85,932 | ) | | | — | | |
| Net realized gain | | | 794,746 | | | | 933,559 | | |
| Net change in unrealized appreciation (depreciation) on: | |
| Investments | | | (252,264 | ) | | | (306,919 | ) | |
| Futures contracts | | | (3,519 | ) | | | (828 | ) | |
| Credit default swap contracts | | | 24,611 | | | | — | | |
| Net change in unrealized appreciation (depreciation) | | | (231,172 | ) | | | (307,747 | ) | |
| Net Gain | | | 563,574 | | | | 625,812 | | |
| Net Increase Resulting from Operations | | | 1,712,624 | | | | 2,069,957 | | |
See Accompanying Notes to Financial Statements.
25
Statements of Changes in Net Assets – Fixed Income Sector Portfolios
| Increase (Decrease) in Net Assets | | Corporate Bond Portfolio | | Mortgage- and Asset-Backed Portfolio | |
| | | Year Ended March 31, | | Year Ended March 31, | |
| | | 2011 ($) | | 2010 ($) | | 2011 ($) | | 2010 ($) | |
| Operations | |
| Net investment income | | | 1,149,050 | | | | 1,345,672 | | | | 1,444,145 | | | | 1,747,063 | | |
Net realized gain on investments,
futures contracts and credit default
swap contracts | | | 794,746 | | | | 400,541 | | | | 933,559 | | | | 954,764 | | |
Net change in unrealized appreciation
(depreciation) on investments,
futures contracts and credit default
swap contracts | | | (231,172 | ) | | | 3,275,751 | | | | (307,747 | ) | | | 823,140 | | |
| Net increase resulting from operations | | | 1,712,624 | | | | 5,021,964 | | | | 2,069,957 | | | | 3,524,967 | | |
| Distributions to Shareholders | |
| From net investment income | | | (1,167,963 | ) | | | (1,309,428 | ) | | | (1,417,691 | ) | | | (1,762,349 | ) | |
| Net Capital Stock Transactions | | | (1,471,501 | ) | | | 564,513 | | | | 40,823,318 | | | | (9,234,695 | ) | |
| Total increase (decrease) in net assets | | | (926,840 | ) | | | 4,277,049 | | | | 41,475,584 | | | | (7,472,077 | ) | |
| Net Assets | |
| Beginning of period | | | 23,831,661 | | | | 19,554,612 | | | | 40,656,256 | | | | 48,128,333 | | |
| End of period | | | 22,904,821 | | | | 23,831,661 | | | | 82,131,840 | | | | 40,656,256 | | |
| Undistributed net investment income at end of period | | | 73,292 | | | | 91,529 | | | | 75,765 | | | | 49,311 | | |
See Accompanying Notes to Financial Statements.
26
Statements of Changes in Net Assets (continued) – Capital Stock Activity
| | | Corporate Bond Portfolio | | Mortgage- and Asset-Backed Portfolio | |
| | | Year Ended
March 31, 2011 | | Year Ended
March 31, 2010 | | Year Ended
March 31, 2011 | | Year Ended
March 31, 2010 | |
| | | Shares | | Dollars ($) | | Shares | | Dollars ($) | | Shares | | Dollars ($) | | Shares | | Dollars ($) | |
| Subscriptions | | | 300,583 | | | | 3,142,631 | | | | 465,475 | | | | 4,487,267 | | | | 5,402,346 | | | | 50,734,583 | | | | 536,314 | | | | 4,902,872 | | |
| Distributions reinvested | | | 296 | | | | 3,074 | | | | 1,274 | | | | 12,338 | | | | 33,563 | | | | 315,612 | | | | 16,385 | | | | 148,495 | | |
| Redemptions | | | (439,728 | ) | | | (4,617,206 | ) | | | (415,326 | ) | | | (3,935,092 | ) | | | (1,090,178 | ) | | | (10,226,877 | ) | | | (1,583,094 | ) | | | (14,286,062 | ) | |
| Net increase (decrease) | | | (138,849 | ) | | | (1,471,501 | ) | | | 51,423 | | | | 564,513 | | | | 4,345,731 | | | | 40,823,318 | | | | (1,030,395 | ) | | | (9,234,695 | ) | |
See Accompanying Notes to Financial Statements.
27
Financial Highlights – Corporate Bond Portfolio
Selected data for a share outstanding throughout each period is as follows:
| | | Year Ended March 31, | |
| | | 2011 | | 2010 | | 2009 | | 2008 | | 2007 | |
| Net Asset Value, Beginning of Period | | $ | 10.30 | | | $ | 8.64 | | | $ | 9.66 | | | $ | 10.06 | | | $ | 9.93 | | |
| Income from Investment Operations: | |
| Net investment income (a) | | | 0.56 | | | | 0.60 | | | | 0.56 | | | | 0.58 | | | | 0.55 | | |
Net realized and unrealized gain (loss) on investments,
futures contracts and credit default swap contracts | | | 0.24 | | | | 1.65 | | | | (1.01 | ) | | | (0.40 | ) | | | 0.13 | | |
| Total from investment operations | | | 0.80 | | | | 2.25 | | | | (0.45 | ) | | | 0.18 | | | | 0.68 | | |
| Less Distributions to Shareholders: | |
| From net investment income | | | (0.57 | ) | | | (0.59 | ) | | | (0.57 | ) | | | (0.58 | ) | | | (0.55 | ) | |
| Net Asset Value, End of Period | | $ | 10.53 | | | $ | 10.30 | | | $ | 8.64 | | | $ | 9.66 | | | $ | 10.06 | | |
| Total return (b) | | | 7.87 | % | | | 26.58 | % | | | (4.65 | )% | | | 1.81 | %(c) | | | 7.01 | % | |
| Ratios to Average Net Assets/Supplemental Data: | |
| Net expenses before interest expense (d) | | | — | | | | — | | | | — | | | | — | | | | — | | |
| Interest expense | | | 0.02 | % | | | — | | | | — | | | | — | | | | — | | |
| Net expenses (d) | | | 0.02 | % | | | — | | | | — | | | | — | | | | — | | |
| Net investment income (d) | | | 5.28 | % | | | 6.14 | % | | | 6.10 | % | | | 5.84 | % | | | 5.55 | % | |
| Portfolio turnover rate | | | 132 | % | | | 146 | % | | | 137 | % | | | 189 | % | | | 114 | % | |
| Net assets, end of period (000s) | | $ | 22,905 | | | $ | 23,832 | | | $ | 19,555 | | | $ | 73,803 | | | $ | 78,588 | | |
(a) Per share data was calculated using the average shares outstanding during the period.
(b) Total return at net asset value assuming all distributions reinvested.
(c) Total return includes a voluntary reimbursement by the Investment Manager for a realized investment loss due to a trading error. This reimbursement increased total return and net asset value per share by less than 0.01% and less than $0.01, respectively.
(d) The net investment income and expense ratios exclude expenses charged directly to shareholders.
See Accompanying Notes to Financial Statements.
28
Financial Highlights – Mortgage- and Asset-Backed Portfolio
Selected data for a share outstanding throughout each period is as follows:
| | | Year Ended March 31, | |
| | | 2011 | | 2010 | | 2009 | | 2008 | | 2007 | |
| Net Asset Value, Beginning of Period | | $ | 9.26 | | | $ | 8.88 | | | $ | 9.32 | | | $ | 10.01 | | | $ | 9.85 | | |
| Income from Investment Operations: | |
| Net investment income (a) | | | 0.30 | | | | 0.38 | | | | 0.44 | | | | 0.54 | | | | 0.54 | | |
Net realized and unrealized gain (loss) on investments
and futures contracts | | | 0.14 | | | | 0.39 | | | | (0.44 | ) | | | (0.67 | ) | | | 0.14 | | |
| Total from investment operations | | | 0.44 | | | | 0.77 | | | | — | | | | (0.13 | ) | | | 0.68 | | |
| Less Distributions to Shareholders: | |
| From net investment income | | | (0.30 | ) | | | (0.39 | ) | | | (0.44 | ) | | | (0.53 | ) | | | (0.52 | ) | |
| From net realized gains | | | — | | | | — | | | | — | | | | (0.03 | ) | | | — | | |
| Total distributions to shareholders | | | (0.30 | ) | | | (0.39 | ) | | | (0.44 | ) | | | (0.56 | ) | | | (0.52 | ) | |
| Net Asset Value, End of Period | | $ | 9.40 | | | $ | 9.26 | | | $ | 8.88 | | | $ | 9.32 | | | $ | 10.01 | | |
| Total return (b) | | | 4.82 | % | | | 8.79 | % | | | 0.10 | % | | | (1.34 | )% | | | 7.12 | % | |
| Ratios to Average Net Assets/Supplemental Data: | |
| Net expenses (c) | | | — | | | | — | | | | — | | | | — | | | | — | | |
| Net investment income (c) | | | 3.19 | % | | | 4.20 | % | | | 4.92 | % | | | 5.50 | % | | | 5.41 | % | |
| Portfolio turnover rate | | | 194 | % | | | 146 | % | | | 142 | % | | | 369 | % | | | 543 | % | |
| Net assets, end of period (000s) | | $ | 82,132 | | | $ | 40,656 | | | $ | 48,128 | | | $ | 138,196 | | | $ | 135,358 | | |
(a) Per share data was calculated using the average shares outstanding during the period.
(b) Total return at net asset value assuming all distributions reinvested.
(c) The net investment income and expense ratios exclude expenses charged directly to shareholders.
See Accompanying Notes to Financial Statements.
29
Notes to Financial Statements – Fixed Income Sector Portfolios
March 31, 2011
Note 1. Organization
Columbia Funds Series Trust (the Trust) is registered under the Investment Company Act of 1940, as amended (the 1940 Act), as an open-end management investment company organized as a Delaware statutory trust. Information presented in these financial statements pertains to Corporate Bond Portfolio and Mortgage- and Asset-Backed Portfolio (each, a Portfolio and collectively, the Portfolios), each a series of the Trust.
After the close of business on April 30, 2010, Ameriprise Financial, Inc. (Ameriprise Financial) acquired a portion of the asset management business of Columbia Management Group, LLC (the Transaction), including the business of managing the Portfolios. In connection with the closing of the Transaction (the Closing), RiverSource Investments, LLC, a wholly owned subsidiary of Ameriprise Financial, became the investment manager of the Portfolios and changed its name to Columbia Management Investment Advisers, LLC (the Investment Manager).
Investment Objectives
Corporate Bond Portfolio and Mortgage- and Asset-Backed Portfolio each seek total return, consisting of current income and capital appreciation.
Portfolio Shares
The Portfolios are authorized to issue an unlimited number of shares without par value and are available only to certain eligible investors through certain wrap fee programs, certain other managed accounts and certain registered investment companies, including those sponsored or managed by Ameriprise Financial and certain of its affiliates.
Note 2. Summary of Significant Accounting Policies
The preparation of financial statements in accordance with U.S. generally accepted accounting principles (GAAP) requires management to make certain estimates and assumptions that affect the reported amounts of assets and liabilities, the disclosure of contingent assets and liabilities at the date of the financial statements and the reported amounts of revenue and expenses during the reporting period. Actual results could differ from those estimates.
The following is a summary of significant accounting policies consistently followed by the Portfolios in the preparation of their financial statements.
Security Valuation
Debt securities generally are valued by pricing services approved by the Trust's Board of Trustees, based upon market transactions for normal, institutional-size trading units of similar securities. The services may use various pricing techniques which take into account appropriate factors such as yield, quality, coupon rate, maturity, type of issue, trading characteristics and other data, as well as broker quotes. Debt securities for which quotations are readily available may also be valued based upon an over-the-counter or exchange bid quotation.
Certain debt securities, which tend to be more thinly traded and of lesser quality, are priced based on fundamental analysis of the financial condition of the issuer and the estimated value of any collateral. Valuations developed through pricing techniques may vary from the actual amounts realized upon sale of the securities, and the potential variation may be greater for those securities valued using fundamental analysis.
Short-term investments maturing in 60 days or less are valued at amortized cost, which approximates market value.
Futures contracts are valued at the settlement price established each day by the board of trade or exchange on which they are traded.
Credit default swap contracts are marked to market daily based upon spread quotations from market makers.
Investments for which market quotations are not readily available, or that have quotations which management believes are not reliable, are valued at fair value as determined in good faith under consistently applied procedures established by and under the general supervision of the Board of Trustees. If a security is valued at fair value, such value is likely to be different from the last quoted market price for the security. The determination of fair value often requires significant judgment. To determine fair value, management may use assumptions including but not limited to future cash flows and estimated risk premiums. Multiple inputs from various sources may be used to determine value.
Derivative Instruments
The Portfolios may use derivative instruments including futures contracts and credit default swap contracts in order to meet its investment objectives. The Portfolios employ strategies in differing combinations to permit it to increase, decrease or change the level of exposure to market risk factors. The achievement of any strategy relating to derivatives depends on an analysis of various risk factors, and if the strategies for the use of derivatives do not work as intended, the Portfolios may not achieve their investment objectives.
30
Fixed Income Sector Portfolios, March 31, 2011 (continued)
In pursuit of their investment objectives, the Portfolios are exposed to the following market risks among others:
Interest Rate Risk: Interest rate risk relates to the fluctuation in value of fixed income securities because of the inverse relationship of price and yield. Fixed income securities generally will decline in value upon an increase in general interest rates and their value generally will increase upon a decline in general interest rates. Fixed income securities with longer durations tend to be more sensitive to changes in interest rates, usually making them more volatile than securities with shorter durations.
Credit Risk: Credit risk relates to the ability of the issuer or guarantor of a fixed income security, or counterparty to a derivative contract to make timely principal and /or interest payments, or to otherwise honor its obligations. Securities are subject to varying degrees of credit risk, which are often reflected in credit ratings. Generally, lower-yield higher-quality bonds are subject to credit risk to a lesser extent than lower-grade higher-yield bonds.
The following notes provide more detailed information about each derivative type held by the Portfolios:
Futures Contracts—The Portfolios entered into interest rate futures contracts to manage the duration and yield curve exposure of the Portfolios versus the benchmark.
The use of futures contracts involves certain risks, which include, among these: (1) imperfect correlation between the price movement of the instruments and the underlying securities, (2) inability to close out positions due to differing trading hours, or the temporary absence of a liquid market, for either the instruments or the underlying securities, and (3) an inaccurate prediction of the future direction of interest rates by the Portfolios' Investment Manager.
Upon entering into a futures contract, a Portfolio identifies within its portfolio of investments cash or securities in an amount sufficient to meet the initial margin requirement. Subsequent payments are made or received by a Portfolio equal to the daily change in the contract value and are recorded as variation margin receivable or payable and offset in unrealized gains or losses. A Portfolio recognizes a realized gain or loss when the contract is closed or expires.
Futures contracts involve, to varying degrees, risk of loss in excess of the variation margin disclosed on the Statement of Assets and Liabilities.
During the year ended March 31, 2011, the Corporate Bond Portfolio entered into 165 futures contracts.
During the year ended March 31, 2011, the Mortgage-and-Asset Backed Portfolio entered into 72 futures contracts.
Credit Default Swaps—Corporate Bond Portfolio entered into credit default swap transactions as a protection buyer to reduce overall credit exposure.
Credit default swaps are agreements in which one party pays fixed periodic payments to a counterparty in consideration for a guarantee from the counterparty to make a specific payment should a negative credit event take place. The Portfolio may receive or make an upfront payment as the protection buyer or seller. Credit default swaps are marked to market daily based on quotations from market makers and any change is recorded as unrealized appreciation/depreciation on the Statement of Assets and Liabilities. Periodic payments received or made are recorded as a realized gain or loss and premiums received or made are amortized on the Statement of Operations.
If the Portfolio is a buyer of protection and a credit event occurs, as defined under the terms of that particular swap agreement, the Portfolio will either (i) receive from the seller of protection an amount equal to the notional amount of the swap and deliver the referenced obligation or underlying securities comprising the referenced index or (ii) receive a net settlement amount in the form of cash or securities equal to the notional amount of the swap less the recovery value of the referenced obligation or underlying securities comprising the referenced index.
If the Portfolio is a seller of protection and a credit event occurs, as defined under the terms of that particular swap agreement, the Portfolio will either (i) pay to the buyer of protection an amount equal to the notional amount of the swap and take delivery of the referenced obligation or underlying securities comprising the referenced index or (ii) pay a net settlement amount in the form of cash or securities equal to the notional amount of the swap less the recovery value of the referenced obligation or underlying securities comprising the referenced index.
Credit default swap agreements involve greater risks than if the Portfolio had invested in the reference obligation directly since, in addition to general market risks, credit default swaps are subject to illiquidity risk, counterparty risk and credit risk.
During the year ended March 31, 2011, the Corporate Bond Portfolio purchased credit default swaps with a notional amount of $6,905,000.
31
Fixed Income Sector Portfolios, March 31, 2011 (continued)
Effects of Derivative Transactions in the Financial Statements
The following table is a summary of the value of the Portfolios' derivative instruments as of March 31, 2011:
| | | Fair Value of Derivative Instruments | |
| | | Assets | | | | Liabilities | | | |
| | | Statement of
Assets and
Liabilities | | Fair Value | | Statement of
Assets and
Liabilities | | Fair Value | |
| Corporate Bond Portfolio | | | — | | | $ | — | | | Futures Variation Margin | | $ | (281 | )* | |
| | | Open Credit Default Swap
Contracts/Premiums paid | | | 56,815 | | | Open Credit Default Swap
Contracts/Premiums received | | | (8,237 | ) | |
| Mortgage and Asset-Backed Portfolio | | Futures Variation Margin | | | 2,250 | * | | | — | | | | — | | |
* Includes only current day's variation margin.
The effect of derivative instruments on the Portfolios' Statements of Operations for the year ended March 31, 2011:
| | | Amount of Realized Gain or (Loss)
and Change in Unrealized Appreciation or
(Depreciation) on Derivatives | |
| Corporate Bond Portfolio | | Risk Exposure | | Net Realized
Gain (Loss) | | Change in
Unrealized
Appreciation
(Depreciation) | |
| Futures Contracts | | Interest Rate Risk | | $ | (36,754 | ) | | $ | (3,519 | ) | |
| Credit Default Swap Contracts | | Credit Risk | | | (85,932 | ) | | | 24,611 | | |
| Mortgage and Asset-Backed Portfolio | |
| Futures Contracts | | Interest Rate Risk | | | (23,625 | ) | | | (828 | ) | |
Repurchase Agreements
Each Portfolio may engage in repurchase agreement transactions with institutions that the Investment Manager has determined are creditworthy. Each Portfolio, through the custodian, receives delivery of the underlying securities collateralizing a repurchase agreement. The Investment Manager is responsible for determining that the collateral is at least equal, at all times, to the value of the repurchase obligation including interest. A repurchase agreement transaction involves certain risks in the event of default or insolvency of the counterparty. These risks include possible delays in or restrictions on each Portfolio's ability to dispose of the underlying securities and a possible decline in the value of the underlying securities during the period while the Portfolios seek to assert their rights.
Restricted Securities
Restricted securities are securities that may only be resold upon registration under federal securities laws or in transactions exempt from registration. In some cases, the issuer of restricted securities has agreed to register such securities for resale at the issuer's expense either upon demand by the Portfolios or in connection with another registered offering of the securities. Many restricted securities may be resold in the secondary market in transactions exempt from registration. Such restricted securities may be determined to be liquid under criteria established by the Board of Trustees. The Portfolios will not incur any registration costs upon such resale.
32
Fixed Income Sector Portfolios, March 31, 2011 (continued)
Delayed Delivery Securities
Each Portfolio may trade securities on other than normal settlement terms, including securities purchased or sold on a "when-issued" basis. This may increase the risk if the other party to the transaction fails to deliver and causes the Portfolios to subsequently invest at less advantageous prices. Each Portfolio identifies within its portfolio of investments cash or liquid securities in an amount equal to the delayed delivery commitment.
Security Transactions
Security transactions are accounted for on the trade date. Cost is determined and gains (losses) are based upon the specific identification method for both financial statement and federal income tax purposes.
Income Recognition
Interest income is recorded on the accrual basis. Market premium and discount are amortized and accreted, respectively, on all debt securities, unless otherwise noted. Original issue discount is accreted to interest income over the life of the security with a corresponding increase in the cost basis, if any.
Dividend income is recorded on the ex-date.
Federal Income Tax Status
Each Portfolio intends to qualify each year as a regulated investment company under Subchapter M of the Internal Revenue Code, as amended, and will distribute substantially all of its taxable income for its tax year, and as such will not be subject to federal income taxes. In addition, each Portfolio intends to distribute in each calendar year substantially all of its net investment income, capital gains and certain other amounts, if any, such that each Portfolio should not be subject to federal excise tax. Therefore, no federal income or excise tax provision is recorded.
Distributions to Shareholders
Distributions from net investment income are declared and paid monthly. Net realized capital gains, if any, are distributed at least annually. Income distributions and capital gain distributions are determined in accordance with federal income tax regulations which may differ from GAAP.
Indemnifications
Under the Trust's organizational documents and, in some cases, by contract, its officers and directors are indemnified against certain liabilities arising out of the performance of their duties to the Portfolios. In addition, certain of the Portfolios' contracts with its service providers contain general indemnification clauses. The Portfolios' maximum exposure under these arrangements is unknown since the amount of any future claims that may be made against the Portfolios cannot be determined and the Portfolios have no historical basis for predicting the likelihood of any such claims.
Note 3. Fees and Compensation Paid to Affiliates
Investment Management Fee
Under an Investment Management Services Agreement (IMSA), the Investment Manager determines which securities will be purchased, held or sold. Under the IMSA, the Investment Manager does not receive any fees for its investment management services. In addition, the Investment Manager has agreed to bear all fees and expenses of the Portfolios, except brokerage fees and commissions, taxes, interest expense and extraordinary expenses, but inclusive of custodian charges relating to overdrafts, if any.
The Portfolios do not incur any fees or expenses except brokerage fees and commissions, taxes, interest expense and extraordinary expenses. Participants in the wrap fee programs eligible to invest in the Portfolios are required to pay fees to the program sponsor pursuant to separate agreements and should review the wrap program disclosure document for fees and expenses charged.
Prior to the Closing, Columbia Management Advisors, LLC (Columbia), an indirect, wholly owned subsidiary of Bank of America Corporation (BOA), provided investment management services to the Portfolios under the same fee structure.
Administration Fee
Effective upon the Closing, the Investment Manager provides administration and accounting services to the Portfolios under an Administrative Services Agreement. The Investment Manager does not receive any compensation for its administration services from the Portfolios.
Prior to the Closing, Columbia provided administrative services to the Portfolios. Columbia did not receive any compensation from the Portfolios for its services.
Transfer Agent Fee
In connection with the Closing, RiverSource Service Corporation, a wholly owned subsidiary of Ameriprise Financial, provides transfer agency services to the Portfolios under a Transfer Agency
33
Fixed Income Sector Portfolios, March 31, 2011 (continued)
Agreement and changed its name to Columbia Management Investment Services Corp. (the Transfer Agent). The Transfer Agent has contracted with Boston Financial Data Services (BFDS) to serve as sub-transfer agent. The Transfer Agent pays the fees of BFDS for services as sub-transfer agent and is not entitled to reimbursement for such fees from the Portfolios. The Transfer Agent does not receive any compensation directly from the Portfolios for its services.
Prior to the Closing, Columbia Management Services, Inc., an affiliate of Columbia and an indirect, wholly owned subsidiary of BOA, provided transfer agency services to the Portfolios and contracted with BFDS to serve as sub-transfer agent, under the same fee structure.
Distribution and Service Fees
In connection with the Closing, RiverSource Fund Distributors, Inc., an indirect wholly owned subsidiary of Ameriprise Financial, provides distribution and shareholder services to the Portfolios and changed its name to Columbia Management Investment Distributors, Inc. (the Distributor). The Distributor does not receive a fee for its services.
Prior to the Closing, Columbia Management Distributors, Inc., an affiliate of Columbia and an indirect, wholly owned subsidiary of BOA, was the principal underwriter of the Portfolios' shares and did not receive any fees for its services. There were no changes to the underwriting discount structure of the Portfolios as a result of the Transaction.
Note 4. Portfolio Information
The cost of purchases and proceeds from sales of securities, excluding short-term obligations, for the year ended March 31, 2011, were as follows:
| | | U.S Government Securities | | Other Investment Securities | |
| | | Purchases | | Sales | | Purchases | | Sales | |
| Corporate Bond Portfolio | | $ | 11,201,298 | | | $ | 11,356,230 | | | $ | 17,514,426 | | | $ | 18,576,773 | | |
| Mortgage-and-Asset Backed Portfolio | | | 108,389,709 | | | | 83,174,904 | | | | 22,766,263 | | | | 7,491,037 | | |
Note 5. Shareholder Concentration
As of March 31, 2011, certain shareholder accounts owned of record more than 10% of the outstanding shares of one or more of the Portfolios. Purchase and redemption activity of these accounts may have a significant effect on the operations of the Portfolios. The number of accounts and aggregate percentages of shares outstanding held therein are as follows:
| | | Number of
Accounts | | % of Shares
Outstanding
Held | |
Corporate Bond
Portfolio | | | 1 | | | | 100.0 | | |
Mortgage-and-Asset Backed
Portfolio | | | 3 | | | | 76.8 | | |
Note 6. Line of Credit
Prior to March 28, 2011, the Portfolios and other affiliated funds participate in a $280,000,000 committed, unsecured revolving line of credit provided by State Street. Effective March 28, 2011, the commitment was reduced to $225,000,000. The maximum amount that may be borrowed by any fund is limited to the lesser of $200,000,000 and the Portfolios' borrowing limit set forth in the Portfolios' registration statement. Borrowings are available for short-term liquidity or temporary or emergency purposes.
Effective October 14, 2010, interest is charged to each participating portfolio based on each portfolio's borrowings at a rate per annum equal to the greater of the Federal Funds Rate plus 1.25% or the overnight LIBOR Rate plus 1.25%. In addition, a commitment fee of 0.125% per annum is accrued and apportioned among the participating portfolios pro rata based on their relative net assets.
34
Fixed Income Sector Portfolios, March 31, 2011 (continued)
Prior to October 14, 2010, interest was charged to each participating portfolio at the same rates. In addition, a commitment fee of 0.15% per annum was accrued and apportioned among the participating portfolios pro rata based on their relative net assets.
For the year ended March 31, 2011, the average daily loan balance outstanding on days where borrowing existed, and the weighted average interest rate of each Portfolio that borrowed were as follows:
| Portfolio | | Average Daily Loan
Balance Outstanding
on Days Where
Borrowing Existed | | Weighted
Average
Interest Rate | |
Corporate Bond
Portfolio | | $ | 1,263,636 | | | | 1.495 | % | |
Note 7. Federal Tax Information
The timing and character of income and capital gain distributions are determined in accordance with income tax regulations, which may differ from GAAP. Reclassifications are made to each Portfolio's capital accounts for permanent tax differences to reflect income and gains available for distribution (or available capital loss carryforwards) under income tax regulations.
For the year ended March 31, 2011, permanent book and tax basis differences resulting primarily from differing treatments for defaulted security basis adjustments were identified and reclassified among the components of the Corporate Bond Portfolio's net assets as follows:
| | | Undistributed
Net Investment
Income | | Accumulated
Net Realized
Loss | | Paid-In Capital | |
| Corporate Bond Portfolio | | $ | 676 | | | $ | (675 | ) | | $ | (1 | ) | |
Net investment income and net realized gains (losses), as disclosed on the Statements of Operations, and net assets were not affected by these reclassifications.
The tax character of distributions paid during the years ended March 31, 2011 and March 31, 2010 was as follows:
| | | March 31, 2011:
Ordinary
Income* | |
| Corporate Bond Portfolio | | $ | 1,167,963 | | |
| Mortgage-and-Asset Backed Portfolio | | | 1,417,691 | | |
| | | March 31, 2010:
Ordinary
Income* | |
| Corporate Bond Portfolio | | $ | 1,309,428 | | |
| Mortgage-and-Asset Backed Portfolio | | | 1,762,349 | | |
* For tax purposes short-term capital gain distributions, if any, are considered ordinary income distributions.
As of March 31, 2011, the components of distributable earnings on a tax basis were as follows:
| | | Undistributed
Ordinary
Income | | Undistributed
Long-Term
Capital Gains | | Net Unrealized
Appreciation
(Depreciation)* | |
| Corporate Bond Portfolio | | $ | 83,650 | | | $ | — | | | $ | 762,942 | | |
| Mortgage-and-Asset Backed Portfolio | | | 75,765 | | | | — | | | | (44,912 | ) | |
* The differences between book-basis and tax-basis net unrealized appreciation/depreciation are primarily due to deferral of losses from wash sales.
35
Fixed Income Sector Portfolios, March 31, 2011 (continued)
Unrealized appreciation and depreciation at March 31, 2011, based on cost of investments for federal income tax purposes, were:
| | | Unrealized
Appreciation | | Unrealized
Depreciation | | Net Unrealized
Appreciation
(Depreciation) | |
| Corporate Bond Portfolio | | $ | 1,144,842 | | | $ | (381,900 | ) | | $ | 762,942 | | |
| Mortgage-and-Asset Backed Portfolio | | | 804,119 | | | | (849,031 | ) | | | (44,912 | ) | |
The following capital loss carryforwards may be available to reduce taxable income arising from future net realized gains on investments, if any, to the extent permitted by the Internal Revenue Code:
| | | Year of Expiration | |
| | | 2015 | | 2016 | | 2017 | | 2018 | | Total | |
| Corporate Bond Portfolio | | $ | 18,360 | | | $ | 576,674 | | | $ | 2,121,554 | | | $ | 224,029 | | | $ | 2,940,617 | | |
| Mortgage and Asset-Backed Portfolio | | | — | | | | — | | | | 12,237,267 | | | | — | | | | 12,237,267 | | |
Capital loss carryforwards of $767,628 and $932,731 for Corporate Bond Portfolio and Mortgage-and-Asset Backed Portfolio, respectively, were utilized during the year ended March 31, 2011.
Management of the Portfolios has concluded that there are no significant uncertain tax positions that would require recognition in the financial statements. However, management's conclusion may be subject to review and adjustment at a later date based on factors including, but not limited to, new tax laws, regulations, and administrative interpretations (including relevant court decisions). The Portfolios' federal tax returns for the prior three fiscal years remain subject to examination by the Internal Revenue Service.
Note 8. Significant Risks and Contingencies
Foreign Securities Risk
Investing in foreign securities may include certain risks and considerations not typically associated with investing in U.S. securities, such as fluctuating currency values and changing local and regional economic, political and social conditions, which may result in greater market volatility. In addition, certain foreign securities may not be as liquid as U.S. securities. Investing in emerging markets may accentuate these risks.
Asset-Backed Securities Risk
The value of asset-backed securities may be affected by, among other factors, changes in interest rates, the market's assessment of the quality of underlying assets, the creditworthiness of the servicer for the underlying assets, factors concerning the interests in and structure of the issuer or the originator of the underlying assets, or the creditworthiness or rating of the entities that provide any supporting letters of credit, surety bonds, derivative instruments, or other credit enhancement. The value of asset-backed securities also will be affected by the exhaustion, termination or expiration of any credit enhancement. Most asset-backed securities are subject to prepayment risk, which is the possibility that the underlying debt may be refinanced or prepaid prior to maturity during periods of declining or low interest rates, causing the Portfolios to have to reinvest the money received in securities that have lower yields. In addition, the impact of prepayments on the value of asset-backed securities may be difficult to predict and may result in greater volatility.
Mortgage-Backed Securities Risk
The value of mortgage-backed securities may be affected by, among other things, changes in interest rates, factors concerning the interests in and structure of the issuer or the originator of the mortgages, the creditworthiness of the entities that provide any supporting letters of credit, surety bonds or other credit enhancements or the quality of underlying assets or the market's assessment thereof. Mortgage-backed securities are subject to prepayment risk, which is the possibility that the underlying mortgage may be refinanced or prepaid prior to maturity during periods of declining or low interest rates, causing the Portfolios to have to reinvest the money received in securities that have lower yields. In addition, the impact of prepayments on the value of
36
Fixed Income Sector Portfolios, March 31, 2011 (continued)
mortgage-backed securities may be difficult to predict and may result in greater volatility.
Note 9. Subsequent Events
Management has evaluated the events and transactions that have occurred through the date the financial statements were issued. Other than as noted below, there were no items requiring adjustment of the financial statements or additional disclosure.
Effective May 16, 2011, the line of credit commitment will be reduced to $150,000,000, and the maximum amount that may be borrowed by any portfolio will be limited to the lesser of $120,000,000 and the Portfolio's borrowing limit set forth in the Portfolio's registration statement.
Note 10. Information Regarding Pending and Settled Legal Proceedings
In June 2004, an action captioned John E. Gallus et al. v. American Express Financial Corp. and American Express Financial Advisors Inc. was filed in the United States District Court for the District of Arizona. The plaintiffs allege that they are investors in several American Express Company (now known as RiverSource) mutual funds and they purport to bring the action derivatively on behalf of those funds under the Investment Company Act of 1940. The plaintiffs allege that fees allegedly paid to the defendants by the funds for investment advisory and administrative services are excessive. The plaintiffs seek remedies including restitution and rescission of investment advisory and distribution agreements. The plaintiffs voluntarily agreed to transfer this case to the United States District Court for the District of Minnesota (the District Court). In response to defendants' motion to dismiss the complaint, the District Court dismissed one of plaintiffs' four claims and granted plaintiffs limited discovery. Defendants moved for summary judgment in April 2007. Summary judgment was granted in the defendants' favor on July 9, 2007. The plaintiffs filed a notice of appeal with the Eighth Circuit Court of Appeals (the Eighth Circuit) on August 8, 2007. On April 8, 2009, the Eighth Circuit reversed summary judgment and remanded to the District Court for further proceedings. On August 6, 2009, defendants filed a writ of certiorari with the U.S. Supreme Court (the Supreme Court), asking the Supreme Court to stay the District Court proceedings while the Supreme Court considers and rules in a case captioned Jones v. Harris Associates, which involves issues of law similar to those presented in the Gallus case. On March 30, 2010, the Supreme Court issued its ruling in Jones v. Harris Associates, and on April 5, 2010, the Supreme Court vacated the Eighth Circuit's decision in the Gallus case and remanded the case to the Eighth Circuit for further consideration in light of the Supreme Court's decision in Jones v. Harris Associates. On June 4, 2010, the Eighth Circuit remanded the Gallus case to the District Court for further consideration in light of the Supreme Court's decision in Jones v. Harris Associates. On December 9, 2010, the District Court reinstated its July 9, 2007 summary judgment order in favor of the defendants. On January 10, 2011, plaintiffs filed a notice of appeal with the Eighth Circuit.
In December 2005, without admitting or denying the allegations, American Express Financial Corporation (AEFC, which is now known as Ameriprise Financial, Inc. (Ameriprise Financial)), entered into settlement agreements with the Securities and Exchange Commission (SEC) and Minnesota Department of Commerce (MDOC) related to market timing activities. As a result, AEFC was censured and ordered to cease and desist from committing or causing any violations of certain provisions of the Investment Advisers Act of 1940, the Investment Company Act of 1940, and various Minnesota laws. AEFC agreed to pay disgorgement of $10 million and civil money penalties of $7 million. AEFC also agreed to retain an independent distribution consultant to assist in developing a plan for distribution of all disgorgement and civil penalties ordered by the SEC in accordance with various undertakings detailed at http://www.sec.gov/litigation/admin/ia-2451.pdf. Ameriprise Financial and its affiliates have cooperated with the SEC and the MDOC in these legal proceedings, and have made regular reports to the funds' Boards of Directors/Trustees.
Ameriprise Financial and certain of its affiliates have historically been involved in a number of legal, arbitration and regulatory proceedings, including routine litigation, class actions, and governmental actions, concerning matters arising in connection with the conduct of their business activities. Ameriprise Financial believes that the Funds are not currently the subject of, and that neither Ameriprise Financial nor any of its affiliates are the subject of, any pending legal, arbitration or regulatory proceedings that are likely to have a material adverse effect on the Funds or the ability of Ameriprise Financial or its affiliates to perform under their contracts with the Funds. Ameriprise Financial is required to make 10-Q, 10-K and, as necessary, 8-K filings with the Securities and Exchange Commission on legal and regulatory matters that relate to Ameriprise Financial and its affiliates. Copies of these filings may be obtained by accessing the SEC website at www.sec.gov.
There can be no assurance that these matters, or the adverse publicity associated with them, will not result in increased fund redemptions,
37
Fixed Income Sector Portfolios, March 31, 2011 (continued)
reduced sale of fund shares or other adverse consequences to the Funds. Further, although we believe proceedings are not likely to have a material adverse effect on the Funds or the ability of Ameriprise Financial or its affiliates to perform under their contracts with the Funds, these proceedings are subject to uncertainties and, as such, we are unable to estimate the possible loss or range of loss that may result. An adverse outcome in one or more of these proceedings could result in adverse judgments, settlements, fines, penalties or other relief that could have a material adverse effect on the consolidated financial condition or results of operations of Ameriprise Financial.
38
Report of Independent Registered Public Accounting Firm
To the Trustees of Columbia Funds Series Trust and the Shareholders of Corporate Bond Portfolio and Mortgage- and Asset-Backed Portfolio
In our opinion, the accompanying statement of assets and liabilities, including the investment portfolio, and the related statements of operations and of changes in net assets and the financial highlights present fairly, in all material respects, the financial position of Corporate Bond Portfolio and Mortgage- and Asset-Backed Portfolio (each a series of Columbia Funds Series Trust, hereafter referred to as the "Portfolios") at March 31, 2011, the results of its operations for the year then ended, the changes in its net assets for each of the two years in the period then ended and the financial highlights for each of the five years in the period then ended, in conformity with accounting principles generally accepted in the United States of America. These financial statements and financial highlights (hereafter referred to as "financial statements") are the responsibility of the Portfolios' management. Our responsibility is to express an opinion on these financial statements based on our audits. We conducted our audits of these financial statements in accordance with the standards of the Public Company Accounting Oversight Board (United States). Those standards require that we plan and perform the audit to obtain reasonable assurance about whether the financial statements are free of material misstatement. An audit includes examining, on a test basis, evidence supporting the amounts and disclosures in the financial statements, assessing the accounting principles used and significant estimates made by management, and evaluating the overall financial statement presentation. We believe that our audits, which included confirmation of securities at March 31, 2011 by correspondence with the custodian and brokers, provide a reasonable basis for our opinion.
PricewaterhouseCoopers LLP
Boston, Massachusetts
May 20, 2011
39
Fund Governance
The Trustees serve terms of indefinite duration. The names, addresses and birth years of the Trustees and Officers of the Funds in the Columbia Funds Series Trust, the year each was first elected or appointed to office, their principal business occupations during at least the last five years, the number of Funds overseen by each Trustee and other directorships they hold are shown below. Each officer listed below serves as an officer of each Fund in the Columbia Funds Series Trust.
Independent Trustees
Name, Address and Year of Birth,
Position with Funds, Year First
Elected or Appointed to Office | | Principal Occupation(s) During Past Five Years, Number of Funds in the Columbia
Funds Complex Overseen by Trustee, Other Directorships Held
| |
| Edward J. Boudreau, Jr. (Born 1944) | |
|
c/o Columbia Management
Investment Advisers, LLC
225 Franklin Street
Boston, MA 02110
Trustee (since 2005) | | Managing Director—E.J. Boudreau & Associates (consulting), from 2000 through current; oversees 41; Trustee—BofA Funds Series Trust. | |
|
| William P. Carmichael (Born 1943) | |
|
c/o Columbia Management
Investment Advisers, LLC
225 Franklin Street
Boston, MA 02110
Trustee (since 1999) | | Retired; oversees 41; Director—Cobra Electronics Corporation (electronic equipment manufacturer); Director—McMoRan Exploration Company (oil and gas exploration and development); Director—The Finish Line (athletic shoes and apparel); Trustee—BofA Funds Series Trust. | |
|
| William A. Hawkins (Born 1942) | |
|
c/o Columbia Management
Investment Advisers, LLC
225 Franklin Street
Boston, MA 02110
Trustee (since 2005) | | Managing Director—Overton Partners (financial consulting), August 2010 to present; President and Chief Executive Officer—California General Bank, N.A., from January 2008 through August 2010; oversees 41; Trustee—BofA Funds Series Trust. | |
|
| R. Glenn Hilliard (Born 1943) | |
|
c/o Columbia Management
Investment Advisers, LLC
225 Franklin Street
Boston, MA 02110
Trustee (since 2005) | | Chairman and Chief Executive Officer—Hilliard Group LLC (investing and consulting), from April 2003 through current; oversees 41; Trustee—BofA Funds Series Trust. | |
|
| John J. Nagorniak (Born 1944) | |
|
c/o Columbia Management
Investment Advisers, LLC
225 Franklin Street
Boston, MA 02110
Trustee (since 2008) | | Retired; President and Director—Foxstone Financial, Inc. (consulting), 2000 through December 2007; Director—Mellon Financial Corporation affiliates (investing), 2000 through 2007; Chairman—Franklin Portfolio Associates (investing—Mellon affiliate), 1982 through 2007; oversees 41; Director—MIT Investment Company; Trustee—MIT 401k Plan; Trustee—Research Foundation of CFA Institute; Trustee—BofA Funds Series Trust. | |
|
40
Fund Governance (continued)
Independent Trustees (continued)
Name, Address and Year of Birth,
Position with Funds, Year First
Elected or Appointed to Office | | Principal Occupation(s) During Past Five Years, Number of Funds in the Columbia
Funds Complex Overseen by Trustee, Other Directorships Held
| |
| Minor M. Shaw (Born 1947) | |
|
c/o Columbia Management
Investment Advisers, LLC
225 Franklin Street
Boston, MA 02110
Trustee (since 2003) | | President—Micco Corporation and Mickel Investment Group; oversees 41; Board Member—Piedmont Natural Gas; Trustee—BofA Funds Series Trust. | |
|
Interested Trustee
| Anthony M. Santomero1 (Born 1946) | |
|
c/o Columbia Management
Investment Advisers, LLC
225 Franklin Street
Boston, MA 02110
Trustee (since 2008) | | Richard K. Mellon Professor Emeritus of Finance, The Wharton School, University of Pennsylvania, from 2002 through current; Senior Advisor—McKinsey & Company (consulting), July 2006 through January 2008; President and Chief Executive Officer—Federal Reserve Bank of Philadelphia, July 2000 through April 2006; oversees 41; Director—Renaissance Reinsurance Ltd; Trustee—Penn Mutual Life Insurance Company; Director—Citigroup, Inc.; Director—Citibank, N.A.; Trustee—BofA Funds Series Trust. | |
|
1 Dr. Santomero is currently deemed by the Columbia Funds to be an "interested person" (as defined in the 1940 Act) of the Funds because he serves as a Director of Citigroup, Inc. and Citibank, N.A., companies that may directly or through subsidiaries and affiliates engage from time-to-time in brokerage execution, principal transactions and lending relationships with the Columbia Funds or other funds or accounts advised/managed by the Columbia Management Investment Advisers, LLC.
The Statement of Additional Information includes additional information about the Trustees of the Funds and is available, without charge, upon request by calling 800-345-6611.
Officers
| Name, Year of Birth and Address | | Principal Occupation(s) During the Past Five Years | |
| J. Kevin Connaughton (Born 1964) | |
|
225 Franklin Street
Boston, MA 02110
President and
Principal Executive Officer (since 2009) | | Senior Vice President and General Manager—Mutual Fund Products, Columbia Management Investment Advisers, LLC since May 2010; President, Columbia Funds, since 2009, and RiverSource Funds, since May 2010 (previously Senior Vice President and Chief Financial Officer, Columbia Funds, from June 2008 to January 2009, Treasurer, Columbia Funds, from October 2003 to May 2008, and senior officer of various other affiliated funds since 2000); Managing Director, Columbia Management Advisors, LLC from December 2004 to April 2010. | |
|
| Michael G. Clarke (Born 1969) | |
|
225 Franklin Street
Boston, MA 02110
Treasurer (since 2011) and
Chief Financial Officer (since 2009) | | Vice President, Columbia Management Investment Advisers, LLC since May 2010; Managing Director of Fund Administration, Columbia Management Advisors, LLC, from September 2004 to April 2010; senior officer of Columbia Funds and affiliated funds since 2002. | |
|
41
Fund Governance (continued)
Officers (continued)
| Name, Year of Birth and Address | | Principal Occupation(s) During the Past Five Years | |
| Scott R. Plummer (Born 1959) | |
|
5228 Ameriprise Financial Center
Minneapolis, MN 55474
Senior Vice President and
Chief Legal Officer (since 2010) | | Chief Legal Officer and Assistant Secretary, Columbia Management Investment Advisers, LLC since June 2005; Vice President and Lead Chief Counsel—Asset Management, Ameriprise Financial, Inc. since May 2010 (previously Vice President and Chief Counsel—Asset Management, from 2005 to April 2010, and Vice President—Asset Management Compliance from 2004 to 2005); Vice President, Chief Counsel and Assistant Secretary, Columbia Management Investment Distributors, Inc. since 2008; Vice President, General Counsel and Secretary, Ameriprise Certificate Company since 2005; Chief Counsel, RiverSource Distributors, Inc. since 2006; Vice President, General Counsel and Secretary, RiverSource Funds, since December 2006; Senior Vice President, Secretary and Chief Legal Officer, Columbia Funds, since May 2010. | |
|
| Linda J. Wondrack (Born 1964) | |
|
225 Franklin Street
Boston, MA 02110
Senior Vice President and
Chief Compliance Officer (since 2007) | | Vice President and Chief Compliance Officer, Columbia Management Investment Advisers, LLC since May 2010; Chief Compliance Officer, Columbia Funds, since 2007, and RiverSource Funds, since May 2010; Director (Columbia Management Group, LLC and Investment Product Group Compliance), Bank of America, from June 2005 to April 2010. | |
|
| William F. Truscott (Born 1960) | |
|
53600 Ameriprise Financial Center
Minneapolis, MN 55474
Senior Vice President (since 2010) | | Chairman of the Board, Columbia Management Investment Advisers, LLC since May 2010 (previously President, Chairman of the Board and Chief Investment Officer, from 2001 to April 2010); Chief Executive Officer, U.S. Asset Management & President, Annuities, Ameriprise Financial, Inc. since May 2010 (previously President—U.S. Asset Management and Chief Investment Officer from 2005 to April 2010, and Senior Vice President—Chief Investment Officer, from 2001 to 2005); Director, President and Chief Executive Officer, Ameriprise Certificate Company since 2006; Director, Columbia Management Investment Distributors, Inc. since May 2010 (previously Chairman of the Board and Chief Executive Officer from 2008 to April 2010); Chairman of the Board and Chief Executive Officer, RiverSource Distributors, Inc. since 2006. | |
|
| Colin Moore (Born 1958) | |
|
225 Franklin Street
Boston, MA 02110
Senior Vice President (since 2010) | | Director and Chief Investment Officer, Columbia Management Investment Advisers, LLC since May 2010; Manager, Managing Director and Chief Investment Officer of Columbia Management Advisors, LLC from 2007 to April 2010; Head of Equities, Columbia Management Advisors, LLC from 2002 to 2007. | |
|
| Michael A. Jones (Born 1959) | |
|
225 Franklin Street
Boston, MA 02110
Senior Vice President (since 2010) | | President and Director, Columbia Management Investment Advisers, LLC since May 2010; President and Director, Columbia Management Investment Distributors, Inc. since May 2010; Manager, Chairman, Chief Executive Officer and President, Columbia Management Advisors, LLC from 2007 to April 2010; Chief Executive Officer, President and Director, Columbia Management Distributors, Inc. from November 2006 to April 2010; previously, co-president and senior managing director at Robeco Investment Management. | |
|
42
Fund Governance (continued)
Officers (continued)
| Name, Year of Birth and Address | | Principal Occupation(s) During the Past Five Years | |
| Christopher O. Petersen (Born 1970) | |
|
5228 Ameriprise Financial Center
Minneapolis, MN 55474
Vice President and
Secretary (since 2011) | | Vice President and Chief Counsel, Ameriprise Financial since January 2010 (formerly Vice President and Group Counsel or Counsel from April 2004 to January 2010); Assistant Secretary of RiverSource Funds since January 2007. | |
|
| Amy Johnson (Born 1965) | |
|
5228 Ameriprise Financial Center
Minneapolis, MN 55474
Vice President (since 2010) | | Senior Vice President and Chief Operating Officer, Columbia Management Investment Advisers, LLC since May 2010 (previously Chief Administrative Officer, from 2009 until April 2010, Vice President—Asset Management and Trust Company Services, from 2006 to 2009, and Vice President—Operations and Compliance from 2004 to 2006). | |
|
| Joseph F. DiMaria (Born 1968) | |
|
225 Franklin Street
Boston, MA 02110
Vice President (since 2011) and
Chief Accounting Officer (since 2008) | | Vice President, Mutual Fund Administration, Columbia Management Investment Advisers, LLC, since May 2010; Director of Fund Administration, Columbia Management Advisors, LLC from January 2006 to April 2010; Head of Tax/Compliance and Assistant Treasurer, Columbia Management Advisors, LLC, from November 2004 to December 2005. | |
|
| Paul B. Goucher (Born 1968) | |
|
5228 Ameriprise Financial Center
Minneapolis, MN 55474
Vice President and
Assistant Treasurer (since 2010) | | Vice President and Chief Counsel of Ameriprise Financial since January 2010 (formerly Vice President and Group Counsel from November 2008 to January 2010); Director, Managing Director and General Counsel of J. & W. Seligman & Co. Incorporated (Seligman) from July 2008 to November 2008 and Managing Director and Associate General Counsel of Seligman from January 2005 to July 2008. | |
|
| Michael E. DeFao (Born 1968) | |
|
5228 Ameriprise Financial Center
Minneapolis, MN 55474
Vice President and
Assistant Treasurer (since 2011) | | Vice President and Chief Counsel, Ameriprise Financial since May 2010; Associate General Counsel Bank of America from June 2005 to April 2010. | |
|
| Stephen T. Welsh (Born 1957) | |
|
225 Franklin Street
Boston, MA 02110
Vice President (since 2006) | | President and Director, Columbia Management Investment Services Corp. since May 2010; President and Director, Columbia Management Services, Inc. from July 2004 to April 2010; Managing Director, Columbia Management Distributors, Inc. from August 2007 to April 2010. | |
|
43
Shareholder Meeting Results
At a Joint Special Meeting of Shareholders held on February 15, 2011, shareholders of the series of Columbia Funds Series Trust, including the Portfolios, elected each of the nominees for trustees to the Board of Trustees of Columbia Funds Series Trust, each to hold office for an indefinite term, as follows:
| Trustee | | Votes For | | Votes Withheld | | Abstentions | |
| Kathleen Blatz | | | 2,145,636,122 | | | | 248,012,438 | | | | 0 | | |
| Edward J. Boudreau, Jr. | | | 2,145,430,114 | | | | 248,218,446 | | | | 0 | | |
| Pamela G. Carlton | | | 2,145,515,949 | | | | 248,132,612 | | | | 0 | | |
| William P. Carmichael | | | 2,145,038,695 | | | | 248,609,866 | | | | 0 | | |
| Patricia M. Flynn | | | 2,145,843,563 | | | | 247,804,997 | | | | 0 | | |
| William A. Hawkins | | | 2,145,359,401 | | | | 248,289,160 | | | | 0 | | |
| R. Glenn Hilliard | | | 2,145,079,400 | | | | 248,569,161 | | | | 0 | | |
| Stephen R. Lewis, Jr. | | | 2,145,092,209 | | | | 248,556,351 | | | | 0 | | |
| John F. Maher | | | 2,145,621,338 | | | | 248,027,223 | | | | 0 | | |
| John J. Nagorniak | | | 2,145,337,494 | | | | 248,311,067 | | | | 0 | | |
| Catherine James Paglia | | | 2,145,615,254 | | | | 248,033,306 | | | | 0 | | |
| Leroy C. Richie | | | 2,145,042,120 | | | | 248,606,441 | | | | 0 | | |
| Anthony M. Santomero | | | 2,145,088,174 | | | | 248,560,386 | | | | 0 | | |
| Minor M. Shaw | | | 2,145,430,762 | | | | 248,217,798 | | | | 0 | | |
| Alison Taunton-Rigby | | | 2,145,393,384 | | | | 248,255,177 | | | | 0 | | |
| William F. Truscott | | | 2,144,907,223 | | | | 248,741,338 | | | | 0 | | |
44
Important Information About This Report
The fund mails one shareholder report to each shareholder address. If you would like more than one report, please call shareholder services at 1-800-345-6611 and additional reports will be sent to you. This report has been prepared for shareholders of Fixed Income Sector Portfolios.
A description of the policies and procedures that the fund uses to determine how to vote proxies and a copy of the fund's voting records are available (i) at www.columbiamanagement.com, (ii) on the Securities and Exchange Commission's website at www.sec.gov, and (iii) without charge, upon request, by calling 1-800-368-0346. Information regarding how the fund voted proxies relating to portfolio securities during the 12-month period ended June 30 is available from the SEC's website. Information regarding how the fund voted proxies relating to portfolio securities is also available from the fund's website, www.columbiamanagement.com.
The fund files a complete schedule of portfolio holdings with the SEC for the first and third quarters of each fiscal year on Form N-Q. The fund's Form N-Q is available on the SEC's website at www.sec.gov and may be reviewed and copied at the SEC's Public Reference Room in Washington, D.C. Information on the operation of the Public Reference Room may be obtained by calling 1-800-SEC-0330.
Transfer Agent
Columbia Management Investment
Services Corp.
P.O. Box 8081
Boston, MA 02266-8081
1-800-345-6611
Distributor
Columbia Management Investment
Distributors, Inc.
225 Franklin Street
Boston, MA 02110
Investment Manager
Columbia Management Investment Advisers, LLC
225 Franklin Street
Boston, MA 02110
45

PRSRT STD
U.S. Postage
PAID
Holliston, MA
Permit NO. 20
Fixed Income Sector Portfolios
P. O. Box 8081
Boston, MA 02266-8081
columbiamanagement.com
This information is for use with concurrent or prior delivery of a fund prospectus. Investors should consider the investment objectives, risks, charges and expenses of a mutual fund carefully before investing. For a free prospectus, which contains this and other important information about the funds, visit columbiamanagement.com. Read the prospectus carefully before investing. The Fund is distributed by Columbia Management Investment Distributors, Inc., member FINRA, and managed by Columbia Management Investment Advisers, LLC.
© 2011 Columbia Management Investment Advisers, LLC. All rights reserved.
C-1121 A (05/11)

Columbia LifeGoal® Portfolios
Annual Report for the Period Ended March 31, 2011
> Columbia LifeGoal® Growth Portfolio
> Columbia LifeGoal® Balanced Growth Portfolio
> Columbia LifeGoal® Income and Growth Portfolio
> Columbia LifeGoal® Income Portfolio
Not FDIC insured • No bank guarantee • May lose value
Table of Contents
| Economic Update | | | 1 | | |
|
Columbia LifeGoal® Growth
Portfolio | | | 3 | | |
|
Columbia LifeGoal® Balanced
Growth Portfolio | | | 8 | | |
|
Columbia LifeGoal® Income and
Growth Portfolio | | | 13 | | |
|
Columbia LifeGoal® Income
Portfolio | | | 18 | | |
|
| Investment Portfolios | | | 23 | | |
|
| Financial Statements | | | 31 | | |
|
| Notes to Financial Statements | | | 63 | | |
|
Report of Independent Registered
Public Accounting Firm | | | 76 | | |
|
| Federal Income Tax Information | | | 77 | | |
|
| Fund Governance | | | 78 | | |
|
| Shareholder Meeting Results | | | 82 | | |
|
Important Information About
This Report | | | 85 | | |
|
The views expressed in this report reflect the current views of the respective parties. These views are not guarantees of future performance and involve certain risks, uncertainties and assumptions that are difficult to predict, so actual outcomes and results may differ significantly from the views expressed. These views are subject to change at any time based upon economic, market or other conditions and the respective parties disclaim any responsibility to update such views. These views may not be relied on as investment advice and, because investment decisions for a Columbia Fund are based on numerous factors, may not be relied on as an indication of trading intent on behalf of any particular Columbia Fund. References to specific securities should not be construed as a recommendation or investment advice.
President's Message

Dear Shareholder:
The Columbia Management story began over 100 years ago, and today, we are one of the nation's largest dedicated asset managers. The recent acquisition by Ameriprise Financial, Inc. brings together the talents, resources and capabilities of Columbia Management with those of RiverSource Investments, Threadneedle (acquired by Ameriprise in 2003) and Seligman Investments (acquired by Ameriprise in 2008) to build a best-in-class asset management business that we believe is truly greater than its parts.
RiverSource Investments traces its roots to 1894 when its then newly-founded predecessor, Investors Syndicate, offered a face-amount savings certificate that gave small investors the opportunity to build a safe and secure fund for retirement, education or other special needs. A mutual fund pioneer, Investors Syndicate launched Investors Mutual Fund in 1940. In the decades that followed, its mutual fund products and services lineup grew to include a full spectrum of styles and specialties. More than 110 years later, RiverSource continues to be a trusted financial products leader.
Threadneedle, a leader in global asset management and one of Europe's largest asset managers, offers sophisticated international experience from a dedicated U.K. management team. Headquartered in London, it is named for Threadneedle Street in the heart of the city's financial district, where British investors pioneered international and global investing. Threadneedle was acquired in 2003 and today operates as an affiliate of Columbia Management.
Seligman Investments' beginnings date back to the establishment of the investment firm J. & W. Seligman & Co. in 1864. In the years that followed, Seligman played a major role in the geographical expansion and industrial development of the United States. In 1874, President Ulysses S. Grant named Seligman as fiscal agent for the U.S. Navy—an appointment that would last through World War I. Seligman helped finance the westward path of the railroads and the building of the Panama Canal. The firm organized its first investment company in 1929 and began managing its first mutual fund in 1930. In 2008, J. & W. Seligman & Co. Incorporated was acquired and Seligman Investments became an offering brand of RiverSource Investments, LLC.
We are proud of the rich and distinctive history of these firms, the strength and breadth of products and services they offer, and the combined cultures of pioneering spirit and forward thinking. Together we are committed to providing more for our shareholders than ever before.
> A singular focus on our shareholders
Our business is asset management, so investors are our first priority. We dedicate our resources to identifying timely investment opportunities and provide a comprehensive choice of equity, fixed-income and alternative investments to help meet your individual needs.
> First-class research and thought leadership
We are dedicated to helping you take advantage of today's opportunities and anticipate tomorrow's. We stay abreast of the latest investment trends and ideas, using our collective insight to evaluate events and transform them into solutions you can use.
> A disciplined investment approach
We aren't distracted by passing fads. Our teams adhere to a rigorous investment process that helps ensure the integrity of our products and enables you and your financial advisor to match our solutions to your objectives with confidence.
When you choose Columbia Management, you can be confident that we will take the time to understand your needs and help you and your financial advisor identify the solutions that are right for you. Because at Columbia Management, we don't consider ourselves successful unless you are.
Sincerely,

J. Kevin Connaughton
President, Columbia Funds
Investors should consider the investment objectives, risks, charges and expenses of a mutual fund carefully before investing. For a free prospectus, which contains this and other important information about the funds, visit www.columbiamanagement.com. The prospectus should be read carefully before investing.
Columbia Funds are distributed by Columbia Management Investment Distributors, Inc., member FINRA, and managed by Columbia Management Investment Advisers, LLC.
© 2011 Columbia Management Investment Advisers, LLC. All rights reserved.
Economic Update – Columbia LifeGoal Portfolios
The U.S. economy continued to expand at a solid but uneven pace over the past 12 months, as measured by gross domestic product (GDP). Although lackluster second quarter 2010 GDP growth raised fears that the economy was losing steam and might lapse back into recession, the pace picked up in the third quarter of 2010, inspiring confidence among consumers, businesses and investors. GDP expanded by 2.6% in the third quarter and 3.1% in the fourth quarter. With the Federal Reserve Board (the Fed) providing additional monetary stimulus to shore up economic growth and the extension of key tax cuts for the next two years, expectations are for continued growth in 2011. However, early estimates of first quarter 2011 growth place it just under 2.0%, a disappointment after two strong quarters and a pick-up in employment.
Consumer spending on cars, clothing and other goods generally trended higher during the 12-month period, accelerating in the fourth quarter. Holiday spending rose 5.5% between November 5, 2010 and December 24, 2010, in all retail categories, excluding automobiles, compared with the same period in 2009, according to MasterCard Advisors' SpendingPulse, which tracks spending on all transactions including cash. Personal income surged in January 2011 as payroll tax cuts kicked in. The personal savings rate edged higher, ending February 2011, the last month for which data was available, at 5.8%.
News on the job front was increasingly positive. A good portion of the jobs added in March, April and May of 2010 were temporary, government-sponsored census positions, which began to unwind in June, July and August 2010. However, private sector payroll employment began to trend higher in the third quarter, massive layoffs declined and job growth turned solidly positive, with the addition of 444,000 new jobs in the first quarter of 2011.
Despite some glimmers of improvement early in 2010, the housing market remained troublesome throughout the period. Both new and existing home sales fell after a federal tax credit for new and repeat homebuyers expired. Distressed properties pressured prices and foreclosures continued—another drag on prices. The inventory of unsold homes ended the period higher than it started, at 8.9 and 8.6 months for both new and existing homes, respectively, according to the National Association of Realtors and a joint release from the U.S. Census Bureau and the U.S. Department of Housing and Urban Development. The new year brought more disappointing news: Existing home sales fell in January 2011 after three months of sustained improvement. Tight credit and weak appraisals were cited as possible reasons for the decline.
Reports from the business side of the economy were generally positive. A key measure of the nation's manufacturing situation—the Institute for Supply Management's Index—took a somewhat surprising turn higher in the final months of the period. Technology spending rose 12% in 2010, according to the NPD Group, a national marketing research firm. Purchases of computers, networking and software returned to prerecession levels. Industrial production rose over the period, and manufacturing capacity utilized, per the report issued by the Fed—a key measure of the health of the manufacturing sector—edged higher.
Stocks moved higher despite summer 2010 decline
Against a strengthening economic backdrop, stock prices continued to rally despite a summer 2010 setback linked to a debt crisis brewing in Europe, which raised concerns among U.S.
Summary
For the 12-month period that ended March 31, 2011
g The U.S. stock market, as measured by the S&P 500 Index, delivered solid returns, despite a summer 2010 correction. Foreign stock market returns were also positive, as measured by the MSCI EAFE Index (Net).
| S&P Index | | MSCI Index | |
|
 | |  | |
|
g Strengthening economic growth and rising interest rates kept a lid on most bond market sectors. The Barclays Capital Aggregate Bond Index delivered modest results. However, high-yield bonds were strong performers, as measured by the JPMorgan Developed BB High Yield Index.
Barclays
Aggregate Index | | JPMorgan
Index | |
|
 | |  | |
|
1
Economic Update (continued) – Columbia LifeGoal Portfolios
investors. These fears were short-lived and stocks regained their footing. In this environment, the S&P 500 Index1 returned 15.65% for the 12 months through March 31, 2011. Outside the United States, stock markets also delivered solid gains. The MSCI EAFE Index (Net)2, a broad gauge of stock market performance in foreign developed markets, returned 10.42% (in U.S. dollars) for the 12-month period, as concerns about the impact of a bailout for weak euro zone economies eased yet continued to restrain market performance. Emerging stock markets were strong. The MSCI Emerging Markets Index (Net)3 returned 18.46% (in U.S. dollars) for the 12-month period.
Bonds delivered modest returns
As the economy strengthened and interest rates edged higher, most bond sectors delivered modest returns. The Barclays Capital Aggregate Bond Index4 returned 5.12%. High-yield bonds led the fixed-income markets. For the 12 months covered by this report, the JPMorgan Developed BB High Yield Index5 returned 13.04% as default fears abated and investors grew more comfortable with risk. Despite rising yields in the second half of the period, the Treasury market was also positive. The Barclays Capital U.S. Treasury Index6 returned 4.53%. However, municipal bonds struggled in the second half of the period, as interest rates inched higher and issue supply surged ahead of the year-end expiration of the Build America Bonds program. The Barclays Capital Municipal Bond Index7 gained 1.63% for the period. Despite positive economic activity, the Fed kept a key short-term interest rate—the federal funds rate—close to zero, reflecting ongoing concerns about employment and the housing market.
Past performance is no guarantee of future results.
1The Standard & Poor's (S&P) 500 Index tracks the performance of 500 widely held, large-capitalization U.S. stocks.
2The Morgan Stanley Capital International Europe, Australasia, Far East (MSCI EAFE) Index (Net) is a free float-adjusted market capitalization index that is designed to measure the equity market performance of developed markets, excluding the U.S. & Canada. As of December 31, 2010, the MSCI EAFE Index (Net) consisted of the following 22 developed market country indices: Australia, Austria, Belgium, Denmark, Finland, France, Germany, Greece, Hong Kong, Ireland, Israel, Italy, Japan, the Netherlands, New Zealand, Norway, Portugal, Singapore, Spain, Sweden, Switzerland and the United Kingdom.
3The Morgan Stanley Capital International Emerging Markets (MSCI EM) Index (Net) is a free float-adjusted market capitalization index that is designed to measure equity market performance of emerging markets. As of December 31, 2010, the MSCI EM Index (Net) consisted of the following 21 emerging market country indices: Brazil, Chile, China, Colombia, Czech Republic, Egypt, Hungary, India, Indonesia, Korea, Malaysia, Mexico, Morocco, Peru, Philippines, Poland, Russia, South Africa, Taiwan, Thailand and Turkey.
4The Barclays Capital Aggregate Bond Index is a market value-weighted index that tracks the daily price, coupon, pay-downs and total return performance of fixed-rate, publicly placed, dollar-denominated and non-convertible investment grade debt issues with at least $250 million par amount outstanding and with at least one year to final maturity.
5The JPMorgan Developed BB High Yield Index is an unmanaged index designed to mirror the investable universe of the U.S. dollar developed, BB-rated, high yield corporate debt market.
6The Barclays Capital U.S. Treasury Index includes public obligations of the U.S. Treasury. Treasury bills are excluded by the maturity constraint. In addition, certain special issues, such as state and local government series bonds (SLGs), as well as U.S. Treasury TIPS, are excluded. STRIPS are excluded from the index because their inclusion would result in double-counting.
7The Barclays Capital Municipal Bond Index is considered representative of the broad market for investment-grade, tax-exempt bonds with a maturity of at least one year.
Indices are not available for investment, are not professionally managed and do not reflect sales charges, fees, brokerage commissions, taxes or other expenses of investing. Securities in the fund may not match those in an index.
2
Portfolio Profile – Columbia LifeGoal Growth Portfolio
Summary
g For the 12-month period that ended March 31, 2011, the portfolio's Class A shares returned 19.35% without sales charge.
g The portfolio outperformed its benchmark, the S&P 500 Index1, which returned 15.65%. Its return was significantly higher than the 13.44% average return of funds in its peer group, the Lipper Large-Cap Core Funds Classification2.
g We attribute the portfolio's strong relative performance to the strong performance of equities relative to fixed income. Within equities, the decision to favor U.S. equities over international aided results. Exposure to commodity-related equities also benefited the portfolio.
Portfolio Management
Anwiti Bahuguna, PhD has co-managed the portfolio since 2009. From 2002 until joining Columbia Management Investment Advisers, LLC (the Investment Manager) in May 2010, Ms. Bahuguna was associated with the portfolio's previous investment adviser as an investment professional.
Kent M. Bergene has co-managed the portfolio since 2010. From 1981 until joining the Investment Manager in May 2010, Mr. Bergene was associated with the portfolio's previous investment adviser as an investment professional.
Colin Moore has co-managed the portfolio since 2009. From 2002 until joining the Investment Manager in May 2010, Mr. Moore was associated with the portfolio's previous investment adviser as an investment professional.
Robert McConnaughey has co-managed the portfolio since 2011. From 2002 until joining the Investment Manager in May 2010, Mr. McConnaughey was associated with the portfolio's previous investment adviser as an investment professional.
Kent M. Peterson, PhD has co-managed the portfolio since 2009. From 2006 until joining the Investment Manager in May 2010, Mr. Peterson was associated with the portfolio's previous investment adviser as an investment professional.
Marie M. Schofield, CFA has co-managed the portfolio since 2009. From 1990 until joining the Investment Manager in May 2010, Ms. Schofield was associated with the portfolio's previous investment adviser as an investment professional.
1The Standard & Poor's (S&P) 500 Index tracks the performance of 500 widely held, large-capitalization U.S. stocks.
2Lipper Inc., a widely respected data provider in the industry, calculates an average total return (assuming reinvestment of distributions) for mutual funds with investment objectives similar to those of the fund. Lipper makes no adjustment for the effect of sales loads.
Indices are not available for investment, are not professionally managed and do not reflect sales charges, fees, brokerage commissions, taxes or other expenses of investing. Securities in the fund may not match those in an index.
Performance data quoted represents past performance and current performance may be lower or higher. Past performance is no guarantee of future results. The investment return and principal value will fluctuate so that shares, when redeemed, may be worth more or less than the original cost. Please visit www.columbiamanagement.com for daily and most recent month-end performance updates.
Summary
1-year return as of 03/31/11
| | +19.35% | |
|
|  | | | Class A shares
(without sales charge) | |
|
| | +15.65% | |
|
|  | | | S&P 500 Index | |
|
3
Performance Information – Columbia LifeGoal Growth Portfolio
Performance data quoted represents past performance and current performance may be lower or higher. Past performance is no guarantee of future results. The investment return and principal value will fluctuate so that shares, when redeemed, may be worth more or less than the original cost. Please visit www.columbiamanagement.com for daily and most recent month-end performance updates.
Performance of a $10,000 investment 04/01/01 – 03/31/11
The chart above shows the change in value of a hypothetical $10,000 investment in Class A shares of Columbia LifeGoal Growth Portfolio during the stated time period, and does not reflect the deduction of taxes that a shareholder may pay on portfolio distributions or on the redemption of portfolio shares.
Performance of a $10,000 investment 04/01/01 – 03/31/11 ($)
| Sales charge | | without | | with | |
| Class A | | | 17,429 | | | | 16,433 | | |
| Class B | | | 16,167 | | | | 16,167 | | |
| Class C | | | 16,148 | | | | 16,148 | | |
| Class R | | | 17,191 | | | | n/a | | |
| Class R4 | | | n/a | | | | n/a | | |
| Class Z | | | 17,877 | | | | n/a | | |
Average annual total return as of 03/31/11 (%)
| Share class | | A | | B | | C | | R | | R4 | | Z | |
| Inception | | 10/15/96 | | 08/12/97 | | 10/15/96 | | 01/23/06 | | 03/07/11 | | 10/15/96 | |
| Sales charge | | without | | with | | without | | with | | without | | with | | without | | without | | without | |
| 1-year | | | 19.35 | | | | 12.49 | | | | 18.46 | | | | 13.46 | | | | 18.41 | | | | 17.41 | | | | 18.99 | | | | n/a | | | | 19.64 | | |
| 5-year | | | 4.11 | | | | 2.88 | | | | 3.34 | | | | 3.04 | | | | 3.33 | | | | 3.33 | | | | 3.82 | | | | n/a | | | | 4.38 | | |
| 10-year/Life | | | 5.71 | | | | 5.09 | | | | 4.92 | | | | 4.92 | | | | 4.91 | | | | 4.91 | | | | 5.57 | | | | 1.77 | | | | 5.98 | | |
The "with sales charge" returns include the maximum initial sales charge of 5.75% for Class A shares, the applicable contingent deferred sales charge of 5.00% in the first year, declining to 1.00% in the sixth year and eliminated thereafter for Class B shares and 1.00% for Class C shares for the first year only. The "without sales charge" returns do not include the effect of sales charges. If they had, returns would be lower.
Performance results reflect any fee waivers or reimbursements of portfolio expenses by the Investment Manager and/or any of its affiliates. Absent these fee waivers or expense reimbursement arrangements, performance results would have been lower.
All results shown assume reinvestment of distributions. Class R4 and Class Z shares are sold at net asset value with no distribution and service (Rule 12b-1) fees. Class R shares are sold at net asset value with distribution (Rule 12b-1) fees. Class R and Class Z shares have limited eligibility and the investment minimum requirements may vary. Please see the portfolio's prospectus for details. Performance for different share classes will vary based on differences in sales charges and fees associated with each class.
The tables do not reflect the deduction of taxes that a shareholder may pay on portfolio distributions or on the redemption of portfolio shares.
The inception date of the portfolio's Class R shares is January 23, 2006. Class R shares have no performance prior to their inception date. The performance shown for Class R shares prior to their inception date is that of Class A shares. If Class R shares fees and expenses were included, performance would be lower.
Class R4 shares were initially offered on March 7, 2011.
4
Understanding Your Expenses – Columbia LifeGoal Growth Portfolio
As a portfolio shareholder, you incur two types of costs. There are transaction costs, which generally include sales charges on purchases and may include redemption fees or exchange fees. There are also ongoing costs, which generally include investment advisory fees, distribution and service (Rule 12b-1) fees and other portfolio expenses. The information on this page is intended to help you understand the ongoing costs of investing in the portfolio and to compare these costs with the ongoing costs of investing in other mutual funds.
Analyzing your portfolio's expenses by share class
To illustrate these ongoing costs, we have provided an example and calculated the expenses paid by investors in each share class during the period. The information in the following table is based on an initial investment of $1,000, which is invested at the beginning of the period and held for the entire period. Expense information is calculated two ways and each method provides you with different information. The amount listed in the "Actual" column is calculated using the portfolio's actual operating expenses and total return for the period. The amount listed in the "Hypothetical" column for each share class assumes that the return each year is 5% before expenses and is calculated based on the portfolio's actual operating expenses. You should not use the hypothetical account values and expenses to estimate either your actual account balance at the end of the period or the expenses you paid during this period.
Compare with other funds
Since all mutual funds are required to include the same hypothetical calculations about expenses in shareholder reports, you can use this information to compare the ongoing cost of investing in the portfolio with other funds. To do so, compare the 5% hypothetical example with the 5% hypothetical examples that appear in the shareholder reports of other funds. As you compare hypothetical examples of other funds, it is important to note that hypothetical examples are meant to highlight the ongoing costs of investing in a portfolio and do not reflect any transaction costs, such as sales charges, redemption fees or exchange fees.
As a shareholder of the underlying funds in which it invests, the portfolio will bear its allocable share of the costs and expenses of these underlying funds. The costs and expenses are not included in the portfolio's annualized expense ratios used to calculate the expense information below.
Estimating your actual expenses
To estimate the expenses that you paid over the period, first you will need your account balance at the end of the period:
g For shareholders who receive their account statements from Columbia Management Investment Services Corp., your account balance is available online at www.columbiamanagement.com or by calling Shareholder Services at 800.345.6611.
g For shareholders who receive their account statements from their financial intermediary, contact your financial intermediary to obtain your account balance.
1. Divide your ending account balance by $1,000. For example, if an account balance was $8,600 at the end of the period, the result would be 8.6.
2. In the section of the table below titled "Expenses paid during the period," locate the amount for your share class. You will find this number in the column labeled "Actual." Multiply this number by the result from step 1. Your answer is an estimate of the expenses you paid on your account during the period.
If the value of your account falls below the minimum initial investment requirement applicable to you, your account may be subject to a $20 annual fee. This fee is not included in the accompanying table. If you are subject to the fee, keep it in mind when you are estimating the ongoing expenses of investing in the portfolio and when comparing the expenses of this portfolio with other funds.
10/01/10 – 03/31/11
| | | Account value at the
beginning of the period ($) | | Account value at the
end of the period ($) | | Expenses paid
during the period ($) | | Portfolio's annualized
expense ratio (%)** | |
| | | Actual | | Hypothetical | | Actual | | Hypothetical | | Actual | | Hypothetical | | Actual | |
| Class A | | | 1,000.00 | | | | 1,000.00 | | | | 1,178.10 | | | | 1,022.39 | | | | 2.77 | | | | 2.57 | | | | 0.51 | | |
| Class B | | | 1,000.00 | | | | 1,000.00 | | | | 1,174.30 | | | | 1,018.65 | | | | 6.83 | | | | 6.34 | | | | 1.26 | | |
| Class C | | | 1,000.00 | | | | 1,000.00 | | | | 1,173.60 | | | | 1,018.65 | | | | 6.83 | | | | 6.34 | | | | 1.26 | | |
| Class R | | | 1,000.00 | | | | 1,000.00 | | | | 1,175.90 | | | | 1,021.14 | | | | 4.12 | | | | 3.83 | | | | 0.76 | | |
| Class R4 | | | 1,000.00 | | | | 1,000.00 | | | | 1,017.70 | * | | | 1,022.39 | | | | 0.34 | * | | | 2.57 | | | | 0.51 | | |
| Class Z | | | 1,000.00 | | | | 1,000.00 | | | | 1,178.80 | | | | 1,023.64 | | | | 1.41 | | | | 1.31 | | | | 0.26 | | |
Expenses paid during the period are equal to the annualized expense ratio for the share class, multiplied by the average account value over the period, then multiplied by the number of days in the portfolio's most recent fiscal half-year and divided by 365.
It is important to note that the expense amounts shown in the table are meant to highlight only ongoing costs of investing in the portfolio and do not reflect any transaction costs, such as sales charges, redemption fees or exchange fees. Therefore, the hypothetical examples provided may not help you determine the relative total costs of owning shares of different portfolios. If these transaction costs were included, your costs would have been higher.
*For the period March 7, 2011 through March 31, 2011. Class R4 shares commenced operations on March 7, 2011.
**Columbia LifeGoal Growth Portfolio's expense ratios do not include fees and expenses incurred by the underlying funds.
5
Portfolio Managers' Report – Columbia LifeGoal Growth Portfolio
Performance data quoted represents past performance and current performance may be lower or higher. Past performance is no guarantee of future results. The investment return and principal value will fluctuate so that shares, when redeemed, may be worth more or less than the original cost. Please visit www.columbiamanagement.com for daily and most recent month-end performance updates.
Net asset value per share
as of 03/31/11 ($)
| Class A | | | 12.25 | | |
| Class B | | | 11.21 | | |
| Class C | | | 11.11 | | |
| Class R | | | 12.14 | | |
| Class R4 | | | 12.45 | | |
| Class Z | | | 12.45 | | |
Distributions declared per share
04/01/10 – 03/31/11 ($)
| Class A | | | 0.07 | | |
| Class B | | | 0.02 | | |
| Class C | | | 0.02 | | |
| Class R | | | 0.05 | | |
| Class R4 | | | 0.04 | | |
| Class Z | | | 0.09 | | |
For the 12-month period that ended March 31, 2011, the portfolio's Class A shares returned 19.35% without sales charge. The portfolio outperformed its benchmark, the S&P 500 Index, which returned 15.65% during the period. Its return was significantly better than the average return of its peer group, the Lipper Large-Cap Core Funds Classification, which rose 13.44%. We attribute the portfolio's strong relative performance to the strong performance of equities relative to fixed income as well as the decision to favor U.S. equities over international. Exposure to commodity-related equities also benefited the fund.
Allocation decisions, underlying fund performance aided results
During the 12-month period, global markets maintained their upward momentum, posting solid gains during the period. At the start of the period, equity markets experienced higher volatility as concerns lingered around the economic recovery and the potential of a "double-dip" recession. As summer progressed, this outcome appeared unlikely, and markets responded by moving significantly higher to end the period. Still, volatility escalated again at the end of the period due to concerns over geopolitical risks, Japan's earthquake/tsunami disaster, and the fear of rising inflation.
The portfolio's asset allocation team believed a "double-dip" was unlikely, and when equity prices were depressed during the summer, we opportunistically increased the portfolio's allocation to equities. In this regard, exposure to commodity-related equities was a solid driver of performance. In addition, we decreased the portfolio's allocation to developed international equities in favor of U.S. large-cap stocks, an action that also benefited results. The portfolio's exposure to small- and mid-cap stocks as well as emerging market equities was also beneficial. In light of heightened volatility near the end of the period, we cut back slightly on the portfolio's emerging markets allocation.
In addition to positive tactical allocations, Columbia LifeGoal Growth Portfolio benefited from strong performance of several of its underlying funds. For the period, Columbia Select Large Cap Growth Fund, Columbia Small Cap Value Fund II and Columbia Dividend Opportunity Fund outperformed their respective benchmarks by comfortable margins. The impact of Columbia Dividend Opportunity Fund on the portfolio was small because only 0.33% of the portfolio's assets are invested in the fund. Columbia Energy and Natural Resources Fund, Columbia Real Estate Equity Fund and Columbia International Value Fund were some of the weakest performers relative to their respective benchmarks.
Looking ahead
For 2011, we expect positive GDP growth in the range of 2.5% to 3.5%. Monetary stimulus continues, but its impact on the economy is constrained by structural challenges, including the continuing housing recession, ongoing deleveraging by households and a relatively weak labor market. Still, both stimulus spending and related liquidity are finding their way into markets and will provide continuing support. In this environment, the portfolio favors equities relative to bonds. Within equities, we favor domestic stocks over international. Domestically, we favor higher quality, large companies. The portfolio is underweight in international developed markets and has reduced its exposure to emerging market equities. In fixed income, the portfolio continues to emphasize investment-grade and high-yield bond sectors within the bond portion of the portfolio. Looking ahead, we will continue to monitor geopolitical risks and their potential impact on the markets.
6
Portfolio Managers' Report (continued) – Columbia LifeGoal Growth Portfolio
Portfolio characteristics and holdings are subject to change periodically and may not be representative of current characteristics and holdings. The outlook for the fund may differ from that presented for other Columbia Funds.
Columbia LifeGoal Portfolios reserve the right to add or remove underlying funds at any time.
The portfolio is a "fund of funds." A fund of funds bears its allocable share of the costs and expenses of the underlying funds in which it invests. Such funds are thus subject to two levels of fees and a potentially higher expense ratio than would be associated with an investment in a fund that invests and trades directly in financial instruments under the direction of a single manager. Risks include stock market fluctuations due to business and economic developments.
Equity securities are subject to stock market fluctuations that occur in response to economic and business developments.
Stocks of small- and mid-cap companies may pose special risks, including possible illiquidity and greater price volatility than stocks of larger, more established companies.
International investing involves special risks, including foreign taxation, currency risks, risks associated with possible differences in financial standards and other risks associated with future political and economic developments.
Investing in emerging markets may involve greater risks than investing in more developed countries. In addition, concentration of investments in a single region may result in greater volatility.
Portfolio Allocation
as of 03/31/11 (%)
| Columbia Mid Cap Growth Fund | | | 7.6 | | |
Columbia Energy and
Natural Resources Fund | | | 7.5 | | |
| Columbia Mid Cap Value Fund | | | 7.5 | | |
Columbia Emerging
Markets Fund | | | 6.4 | | |
| Columbia Contrarian Core Fund | | | 6.2 | | |
| Columbia Large Cap Core Fund | | | 5.5 | | |
Columbia Select Large
Cap Growth Fund | | | 4.4 | | |
Columbia Marsico International
Opportunities Fund | | | 3.9 | | |
Columbia International
Value Fund | | | 3.8 | | |
Columbia Large Cap
Growth Fund | | | 3.7 | | |
Columbia Marsico Focused
Equities Fund | | | 3.3 | | |
| Columbia Bond Fund | | | 3.3 | | |
| Columbia Acorn USA | | | 3.0 | | |
Columbia Small Cap
Value Fund II | | | 3.0 | | |
Columbia Small Cap
Value Fund I | | | 3.0 | | |
| Columbia Acorn International | | | 2.8 | | |
Columbia Convertible
Securities Fund | | | 2.8 | | |
Columbia Large Value
Quantitative Fund | | | 2.7 | | |
Columbia Value and
Restructuring Fund | | | 2.7 | | |
| Columbia Large Cap Value Fund | | | 2.7 | | |
Columbia Real Estate
Equity Fund | | | 2.5 | | |
| Columbia Dividend Income Fund | | | 2.3 | | |
| Columbia European Equity Fund | | | 2.3 | | |
| Columbia Pacific/Asia Fund | | | 1.9 | | |
Columbia Small Cap
Growth Fund II | | | 1.4 | | |
Columbia Small Cap
Growth Fund I | | | 1.4 | | |
Columbia Corporate
Income Fund | | | 1.1 | | |
Columbia U.S. Treasury
Index Fund | | | 1.0 | | |
Columbia Dividend
Opportunity Fund | | | 0.3 | | |
Portfolio allocation is calculated as a percentage of total investments.
7
Portfolio Profile – Columbia LifeGoal Balanced Growth Portfolio
Performance data quoted represents past performance and current performance may be lower or higher. Past performance is no guarantee of future results. The investment return and principal value will fluctuate so that shares, when redeemed, may be worth more or less than the original cost. Please visit www.columbiamanagement.com for daily and most recent month-end performance updates.
Summary
1-year return as of 03/31/11
| | +15.48% | |
|
|  | | | Class A shares
(without sales charge) | |
|
| | +5.12% | |
|
|  | | | Barclays Capital
Aggregate Bond Index | |
|
| | +15.65% | |
|
|  | | | S&P 500 Index | |
|
Summary
g For the 12-month period that ended March 31, 2011, the portfolio's Class A shares returned 15.48% without sales charge.
g The portfolio's equity benchmark, the S&P 500 Index1, returned 15.65% while the portfolio's fixed-income index, the Barclays Capital Aggregate Bond Index2, returned 5.12%.
g The portfolio outdistanced the average fund in its peer group, the Lipper Mixed-Asset Target Allocation Growth Funds Classification3, which returned 13.14%. An overweight in equities, as well as a decision to favor U.S. over international equities, aided performance.
Portfolio Management
Anwiti Bahuguna, PhD has co-managed the portfolio since 2009. From 2002 until joining Columbia Management Investment Advisers, LLC (the Investment Manager) in May 2010, Ms. Bahuguna was associated with the portfolio's previous investment adviser as an investment professional.
Kent M. Bergene has co-managed the portfolio since 2010. From 1981 until joining the Investment Manager in May 2010, Mr. Bergene was associated with the portfolio's previous investment adviser as an investment professional.
Colin Moore has co-managed the portfolio since 2009. From 2002 until joining the Investment Manager in May 2010, Mr. Moore was associated with the portfolio's previous investment adviser as an investment professional.
Kent M. Peterson, PhD has co-managed the portfolio since 2009. From 2006 until joining the Investment Manager in May 2010, Mr. Peterson was associated with the portfolio's previous investment adviser as an investment professional.
Marie M. Schofield, CFA has co-managed the portfolio since 2009. From 1990 until joining the Investment Manager in May 2010, Ms. Schofield was associated with the portfolio's previous investment adviser as an investment professional.
1The Standard & Poor's (S&P) 500 Index tracks the performance of 500 widely held, large-capitalization U.S. stocks.
2The Barclays Capital Aggregate Bond Index is a market value-weighted index that tracks the daily price, coupon, pay-downs, and total return performance of fixed-rate, publicly placed, dollar-denominated, and non-convertible investment grade debt issues with a least $250 million par amount outstanding and with a least one year to final maturity.
3Lipper Inc., a widely respected data provider in the industry, calculates an average total return (assuming reinvestment of distributions) for mutual funds with investment objectives similar to those of the fund.
Indices are not available for investment, are not professionally managed and do not reflect sales charges, fees, brokerage commissions, taxes or other expenses of investing. Securities in the fund may not match those in an index.
8
Performance Information – Columbia LifeGoal Balanced Growth Portfolio
Performance of a $10,000 investment 04/01/01 – 03/31/11
The chart above shows the change in value of a hypothetical $10,000 investment in Class A shares of Columbia LifeGoal Balanced Growth Portfolio during the stated time period, and does not reflect the deduction of taxes that a shareholder may pay on portfolio distributions or on the redemption of portfolio shares.
Performance of a $10,000 investment 04/01/01 – 03/31/11 ($)
| Sales charge | | without | | with | |
| Class A | | | 18,051 | | | | 17,015 | | |
| Class B | | | 16,733 | | | | 16,733 | | |
| Class C | | | 16,733 | | | | 16,733 | | |
| Class R | | | 17,803 | | | | n/a | | |
| Class T | | | n/a | | | | n/a | | |
| Class Z | | | 18,525 | | | | n/a | | |
Performance data quoted represents past performance and current performance may be lower or higher. Past performance is no guarantee of future results. The investment return and principal value will fluctuate so that shares, when redeemed, may be worth more or less than the original cost. Please visit www.columbiamanagement.com for daily and most recent month-end performance updates.
Average annual total return as of 03/31/11 (%)
| Share class | | A | | B | | C | | R | | T | | Z | |
| Inception | | 10/15/96 | | 08/13/97 | | 10/15/96 | | 01/23/06 | | 03/07/11 | | 10/15/96 | |
| Sales charge | | without | | with | | without | | with | | without | | with | | without | | without | | without | |
| 1-year | | | 15.48 | | | | 8.88 | | | | 14.63 | | | | 9.63 | | | | 14.64 | | | | 13.64 | | | | 15.21 | | | | n/a | | | | 15.89 | | |
| 5-year | | | 5.51 | | | | 4.27 | | | | 4.70 | | | | 4.37 | | | | 4.72 | | | | 4.72 | | | | 5.23 | | | | n/a | | | | 5.80 | | |
| 10-year/Life | | | 6.08 | | | | 5.46 | | | | 5.28 | | | | 5.28 | | | | 5.28 | | | | 5.28 | | | | 5.94 | | | | 1.28 | | | | 6.36 | | |
The "with sales charge" returns include the maximum initial sales charge of 5.75% for Class A and Class T shares, the applicable contingent deferred sales charge of 5.00% in the first year, declining to 1.00% in the sixth year and eliminated thereafter for Class B shares and 1.00% for Class C shares for the first year only. The "without sales charge" returns do not include the effect of sales charges. If they had, returns would be lower.
Performance results reflect any fee waivers or reimbursements of portfolio expenses by the Investment Manager and/or any of its affiliates. Absent these fee waivers or reimbursement arrangements, performance results shown would have been lower.
All results shown assume reinvestment of distributions. Class Z shares are sold at net asset value with no distribution and service (Rule 12b-1) fees. Class R shares are sold at net asset value with distribution (Rule 12b-1) fees. Class R and Class Z shares have limited eligibility and the investment minimum requirements may vary. Please see the portfolio's prospectus for details. Performance for different share classes will vary based on differences in sales charges and fees associated with each class.
The tables do not reflect the deduction of taxes that a shareholder may pay on portfolio distributions or on the redemption of portfolio shares.
The inception date of the portfolio's Class R shares is January 23, 2006. Class R shares have no performance prior to their inception date. The performance shown for Class R shares prior to their inception date is that of Class A shares. If Class R shares fees and expenses were included, performance would be lower.
Class T shares were initially offered on March 7, 2011.
9
Understanding Your Expenses – Columbia LifeGoal Balanced Growth Portfolio
Estimating your actual expenses
To estimate the expenses that you paid over the period, first you will need your account balance at the end of the period:
g For shareholders who receive their account statements from Columbia Management Investment Services Corp., your account balance is available online at www.columbiamanagement.com or by calling Shareholder Services at 800.345.6611.
g For shareholders who receive their account statements from their financial intermediary, contact your financial intermediary to obtain your account balance.
1. Divide your ending account balance by $1,000. For example, if an account balance was $8,600 at the end of the period, the result would be 8.6.
2. In the section of the table below titled "Expenses paid during the period," locate the amount for your share class. You will find this number in the column labeled "Actual." Multiply this number by the result from step 1. Your answer is an estimate of the expenses you paid on your account during the period.
If the value of your account falls below the minimum initial investment requirement applicable to you, your account may be subject to a $20 annual fee. This fee is not included in the accompanying table. If you are subject to the fee, keep it in mind when you are estimating the ongoing expenses of investing in the portfolio and when comparing the expenses of this portfolio with other funds.
As a portfolio shareholder, you incur two types of costs. There are transaction costs, which generally include sales charges on purchases and may include redemption fees or exchange fees. There are also ongoing costs, which generally include investment advisory fees, distribution and service (Rule 12b-1) fees and other portfolio expenses. The information on this page is intended to help you understand the ongoing costs of investing in the portfolio and to compare these costs with the ongoing costs of investing in other mutual funds.
Analyzing your portfolio's expenses by share class
To illustrate these ongoing costs, we have provided an example and calculated the expenses paid by investors in each share class during the period. The information in the following table is based on an initial investment of $1,000, which is invested at the beginning of the period and held for the entire period. Expense information is calculated two ways and each method provides you with different information. The amount listed in the "Actual" column is calculated using the portfolio's actual operating expenses and total return for the period. The amount listed in the "Hypothetical" column for each share class assumes that the return each year is 5% before expenses and is calculated based on the portfolio's actual operating expenses. You should not use the hypothetical account values and expenses to estimate either your actual account balance at the end of the period or the expenses you paid during this period.
Compare with other funds
Since all mutual funds are required to include the same hypothetical calculations about expenses in shareholder reports, you can use this information to compare the ongoing cost of investing in the portfolio with other funds. To do so, compare the 5% hypothetical example with the 5% hypothetical examples that appear in the shareholder reports of other funds. As you compare hypothetical examples of other funds, it is important to note that hypothetical examples are meant to highlight the ongoing costs of investing in a portfolio and do not reflect any transaction costs, such as sales charges, redemption fees or exchange fees.
As a shareholder of the underlying funds in which it invests, the portfolio will bear its allocable share of the costs and expenses of these underlying funds. The costs and expenses are not included in the portfolio's annualized expense ratios used to calculate the expense information below.
10/01/10 – 03/31/11
| | | Account value at the
beginning of the period ($) | | Account value at the
end of the period ($) | | Expenses paid
during the period ($) | | Portfolio's annualized
expense ratio (%)** | |
| | | Actual | | Hypothetical | | Actual | | Hypothetical | | Actual | | Hypothetical | | Actual | |
| Class A | | | 1,000.00 | | | | 1,000.00 | | | | 1,127.50 | | | | 1,022.44 | | | | 2.65 | | | | 2.52 | | | | 0.50 | | |
| Class B | | | 1,000.00 | | | | 1,000.00 | | | | 1,123.30 | | | | 1,018.70 | | | | 6.62 | | | | 6.29 | | | | 1.25 | | |
| Class C | | | 1,000.00 | | | | 1,000.00 | | | | 1,123.70 | | | | 1,018.70 | | | | 6.62 | | | | 6.29 | | | | 1.25 | | |
| Class R | | | 1,000.00 | | | | 1,000.00 | | | | 1,126.30 | | | | 1,021.19 | | | | 3.98 | | | | 3.78 | | | | 0.75 | | |
| Class T | | | 1,000.00 | | | | 1,000.00 | | | | 1,012.80 | * | | | 1,022.19 | | | | 0.36 | * | | | 2.77 | | | | 0.55 | | |
| Class Z | | | 1,000.00 | | | | 1,000.00 | | | | 1,130.10 | | | | 1,023.68 | | | | 1.33 | | | | 1.26 | | | | 0.25 | | |
Expenses paid during the period are equal to the annualized expense ratio for the share class, multiplied by the average account value over the period, then multiplied by the number of days in the portfolio's most recent fiscal half-year and divided by 365.
It is important to note that the expense amounts shown in the table are meant to highlight only ongoing costs of investing in the portfolio and do not reflect any transaction costs, such as sales charges, redemption fees or exchange fees. Therefore, the hypothetical examples provided may not help you determine the relative total costs of owning shares of different portfolios. If these transaction costs were included, your costs would have been higher.
*For the period March 7, 2011 through March 31, 2011. Class T shares commenced operations on March 7, 2011.
**Columbia LifeGoal Balanced Growth Portfolio's expense ratios do not include fees and expenses incurred by the underlying funds.
10
Portfolio Managers' Report – Columbia LifeGoal Balanced Growth Portfolio
For the 12-month period that ended March 31, 2011, the portfolio's Class A shares returned 15.48% without sales charge. The portfolio's equity benchmark, the broad-based S&P 500 Index, returned 15.65%, and its fixed-income benchmark, the Barclays Capital Aggregate Bond Index, returned 5.12%. The portfolio outperformed the average fund in its peer group, the Lipper Mixed-Asset Target Allocation Growth Funds Classification, which returned 13.14%. A tactical decision to increase the portfolio's exposure to equities at the expense of fixed income early in the period, as well as the decision to favor U.S. equities over international stocks, generally accounted for the portfolio's solid return.
Tactical asset allocation, underlying funds aided results
During the 12-month period, global markets maintained their upward momentum, posting solid gains. At the start of the period, equity markets experienced higher volatility as concerns lingered around the economic recovery and the potential for a "double-dip" recession. By summer 2010, this outcome appeared unlikely, and markets responded by moving significantly higher through the end the period. Yet, volatility escalated again early in 2011 due to concerns over geopolitical risks, Japan's earthquake/tsunami disaster and fears of rising inflation.
Against this backdrop, we remained confident that the economy's recovery was sustainable. As a result, we opportunistically increased the portfolio's allocation to equities when prices were depressed during the summer of 2010. We believe this decision was a key factor in the portfolio's outperformance relative to its peer group. In addition, we decreased the portfolio's allocation to developed international equities in favor of U.S. large-cap stocks, an action that also benefited results. The portfolio's exposure to small- and mid-cap stocks as well as emerging market equities was also beneficial. In light of heightened volatility near the end of the period, we pared the portfolio's emerging markets allocation.
Fixed-income positioning aided results
The portfolio's positions in both high-yield bonds and investment-grade bonds aided performance. During the period, we reduced the portfolio's exposure to investment-grade corporate bonds and emphasized high-yield bonds. Although the difference in yield between lower and higher quality bonds has narrowed from peak levels, high-yield bonds still appear reasonably attractive, especially given relatively low expected default rates for the sector. If the U.S. economy continues to grow at a reasonable pace, we do not believe that defaults are likely to rise.
In addition to positive tactical allocations, Columbia LifeGoal Balanced Growth Portfolio benefited from strong performance from several of its underlying funds. For the period, Columbia Select Large Cap Growth Fund, Columbia Small Cap Value Fund II and Columbia Dividend Opportunity Fund significantly outperformed their respective benchmarks. However, Columbia Energy and Natural Resources Fund, Columbia Real Estate Equity Fund and Columbia International Value Fund were some of the weakest performers relative to respective benchmarks.
Looking ahead
For 2011, we expect positive GDP growth in the range of 2.5% to 3.5%. Monetary stimulus continues, but its impact on the economy is constrained by structural challenges, including the continuing housing recession, ongoing deleveraging by households and a relatively weak labor market. Still, both stimulus spending and related liquidity are finding their way into markets and
Performance data quoted represents past performance and current performance may be lower or higher. Past performance is no guarantee of future results. The investment return and principal value will fluctuate so that shares, when redeemed, may be worth more or less than the original cost. Please visit www.columbiamanagement.com for daily and most recent month-end performance updates.
Net asset value per share
as of 03/31/11 ($)
| Class A | | | 11.61 | | |
| Class B | | | 11.53 | | |
| Class C | | | 11.68 | | |
| Class R | | | 11.60 | | |
| Class T | | | 11.61 | | |
| Class Z | | | 11.60 | | |
Distributions declared per share
04/01/10 – 03/31/11 ($)
| Class A | | | 0.18 | | |
| Class B | | | 0.10 | | |
| Class C | | | 0.10 | | |
| Class R | | | 0.16 | | |
| Class T | | | 0.03 | | |
| Class Z | | | 0.21 | | |
11
Portfolio Managers' Report (continued) – Columbia LifeGoal Balanced Growth Portfolio
Portfolio Allocation
as of 03/31/11 (%)
| Columbia Bond Fund | | | 11.9 | | |
Columbia Energy and
Natural Resources Fund | | | 7.1 | | |
Columbia Corporate
Income Fund | | | 6.9 | | |
Columbia Income
Opportunities Fund | | | 6.6 | | |
| Columbia Mid Cap Growth Fund | | | 4.6 | | |
| Columbia Mid Cap Value Fund | | | 4.6 | | |
Columbia Emerging
Markets Fund | | | 4.3 | | |
| Columbia Large Cap Core Fund | | | 3.9 | | |
| Columbia Contrarian Core Fund | | | 3.8 | | |
Mortgage- and Asset-
Backed Portfolio | | | 3.8 | | |
Columbia Large Cap
Growth Fund | | | 3.6 | | |
Columbia Real Estate
Equity Fund | | | 3.0 | | |
Columbia Marsico International
Opportunities Fund | | | 3.0 | | |
Columbia International
Value Fund | | | 2.9 | | |
| Columbia Dividend Income Fund | | | 2.8 | | |
Columbia Select Large
Cap Growth Fund | | | 2.2 | | |
Columbia Marsico Focused
Equities Fund | | | 2.0 | | |
Columbia Convertible
Securities Fund | | | 2.0 | | |
| Columbia Acorn USA | | | 1.8 | | |
Columbia Small Cap
Value Fund II | | | 1.8 | | |
Columbia Small Cap
Value Fund I | | | 1.8 | | |
| Columbia Pacific/Asia Fund | | | 1.5 | | |
Columbia Value and
Restructuring Fund | | | 1.5 | | |
Columbia Large Value
Quantitative Fund | | | 1.5 | | |
| Columbia Large Cap Value Fund | | | 1.5 | | |
| Columbia Acorn International | | | 1.4 | | |
| Columbia European Equity Fund | | | 1.3 | | |
Columbia U.S. Government
Mortgage Fund | | | 1.2 | | |
Columbia Small Cap
Growth Fund II | | | 1.0 | | |
Columbia Small Cap
Growth Fund I | | | 0.8 | | |
Columbia International
Bond Fund | | | 0.6 | | |
Columbia Emerging Markets
Bond Fund | | | 0.6 | | |
| BofA Cash Reserves | | | 0.5 | | |
Columbia U.S. Treasury
Index Fund | | | 0.4 | | |
Columbia Dividend
Opportunity Fund | | | 0.3 | | |
| U.S. Government Obligations | | | 1.5 | | |
Portfolio allocation is calculated as a percentage of total investments.
will provide continuing support. In this environment, the portfolio favors equities relative to bonds. Within equities, we favor domestic stocks over international. Domestically, we favor higher quality, large companies. The portfolio is underweight in international developed markets and has reduced its exposure to emerging market equities. In fixed income, the portfolio continues to emphasize investment-grade and high-yield bonds, with an underweight relative to its target allocations in Treasuries and TIPS. Looking ahead, we will continue to monitor geopolitical risks and their potential impact on the markets.
Portfolio characteristics and holdings are subject to change periodically and may not be representative of current characteristics and holdings. The outlook for the fund may differ from that presented for other Columbia Funds.
Columbia LifeGoal Portfolios reserve the right to add or remove underlying funds at any time.
The portfolio is a "fund of funds." A fund of funds bears its allocable share of the costs and expenses of the underlying funds in which it invests. Such funds are thus subject to two levels of fees and a potentially higher expense ratio than would be associated with an investment in a fund that invests and trades directly in financial instruments under the direction of a single manager. Risks include stock market fluctuations due to business and economic developments.
Equity securities are subject to stock market fluctuations that occur in response to economic and business developments.
Stocks of small- and mid-cap companies may pose special risks, including possible illiquidity and greater price volatility than stocks of larger, more established companies.
International investing involves special risks, including foreign taxation, currency risks, risks associated with possible differences in financial standards and other risks associated with future political and economic developments.
Investing in emerging markets may involve greater risks than investing in more developed countries. In addition, concentration of investments in a single region may result in greater volatility.
Investing in fixed-income securities may involve certain risks, including the credit quality of individual issuers, possible prepayments, market or economic developments and yields and share price fluctuations due to changes in interest rates. When interest rates go up, bond prices typically drop, and vice versa.
Investments in high-yield bonds (sometimes referred to as "junk" bonds) offer the potential for high current income and attractive total return, but involve certain risks. Changes in economic conditions or other circumstances may adversely affect a high-yield bond issuer's ability to make principal and interest payments. High-yield bonds issued by foreign entities have greater potential risks, including less regulation, currency fluctuations, economic instability and political developments.
12
Portfolio Profile – Columbia LifeGoal Income and Growth Portfolio
Summary
g For the 12-month period that ended March 31, 2011, the portfolio's Class A shares returned 11.21% without sales charge.
g The portfolio's equity benchmark, the S&P 500 Index1, returned 15.65%, while its fixed-income index, the Barclays Capital Aggregate Bond Index2, returned 5.12%.
g The portfolio outperformed the 9.28% average return of funds in its peer group, the Lipper Mixed-Asset Target Allocation Conservative Funds Classification3. A tactical decision to overweight equities relative to fixed income early in the period aided the portfolio's performance as did an emphasis on investment-grade bonds over Treasuries.
Portfolio Management
Anwiti Bahuguna, PhD has co-managed the portfolio since 2009. From 2002 until joining Columbia Management Investment Advisers, LLC (the Investment Manager) in May 2010, Ms. Bahuguna was associated with the portfolio's previous investment adviser as an investment professional.
Kent M. Bergene has co-managed the portfolio since 2010. From 1981 until joining the Investment Manager in May 2010, Mr. Bergene was associated with the portfolio's previous investment adviser as an investment professional.
Colin Moore has co-managed the portfolio since 2009. From 2002 until joining the Investment Manager in May 2010, Mr. Moore was associated with the portfolio's previous investment adviser as an investment professional.
Kent M. Peterson, PhD has co-managed the portfolio since 2009. From 2006 until joining the Investment Manager in May 2010, Mr. Peterson was associated with the portfolio's previous investment adviser as an investment professional.
Marie M. Schofield, CFA has co-managed the portfolio since 2009. From 1990 until joining the Investment Manager in May 2010, Ms. Schofield was associated with the portfolio's previous investment adviser as an investment professional.
1The Standard & Poor's (S&P) 500 Index tracks the performance of 500 widely held, large-capitalization U.S. stocks.
2The Barclays Capital Aggregate Bond Index is a market value-weighted index that tracks the daily price, coupon, pay-downs, and total return performance of fixed-rate, publicly placed, dollar-denominated, and non-convertible investment-grade debt issues with a least $250 million par amount outstanding and with at least one year to final maturity.
3Lipper Inc., a widely respected data provider in the industry, calculates an average total return (assuming reinvestment of distributions) for mutual funds with investment objectives similar to those of the fund. Lipper makes no adjustment for the effect of sales loads.
Indices are not available for investment, are not professionally managed and do not reflect sales charges, fees, brokerage commissions, taxes or other expenses of investing. Securities in the fund may not match those in an index.
Performance data quoted represents past performance and current performance may be lower or higher. Past performance is no guarantee of future results. The investment return and principal value will fluctuate so that shares, when redeemed, may be worth more or less than the original cost. Please visit www.columbiamanagement.com for daily and most recent month-end performance updates.
Summary
1-year return as of 03/31/11
| | +11.21% | |
|
|  | | | Class A shares
(without sales charge) | |
|
| | +5.12% | |
|
|  | | | Barclays Capital
Aggregate Bond Index | |
|
| | +15.65% | |
|
|  | | | S&P 500 Index | |
|
13
Performance Information – Columbia LifeGoal Income and Growth Portfolio
Performance data quoted represents past performance and current performance may be lower or higher. Past performance is no guarantee of future results. The investment return and principal value will fluctuate so that shares, when redeemed, may be worth more or less than the original cost. Please visit www.columbiamanagement.com for daily and most recent month-end performance updates.
Performance of a $10,000 investment 04/01/01 – 03/31/11
The chart above shows the change in value of a hypothetical $10,000 investment in Class A shares of Columbia LifeGoal Income and Growth Portfolio during the stated time period, and does not reflect the deduction of taxes that a shareholder may pay on portfolio distributions or on the redemption of portfolio shares.
Performance of a $10,000 investment 04/01/01 – 03/31/11 ($)
| Sales charge | | without | | with | |
| Class A | | | 16,840 | | | | 15,866 | | |
| Class B | | | 15,615 | | | | 15,615 | | |
| Class C | | | 15,610 | | | | 15,610 | | |
| Class R | | | 16,635 | | | | n/a | | |
| Class Z | | | 17,232 | | | | n/a | | |
Average annual total return as of 03/31/11 (%)
| Share class | | A | | B | | C | | R | | Z | |
| Inception | | 10/15/96 | | 08/07/97 | | 10/15/96 | | 01/23/06 | | 10/15/96 | |
| Sales charge | | without | | with | | without | | with | | without | | with | | without | | without | |
| 1-year | | | 11.21 | | | | 4.84 | | | | 10.43 | | | | 5.43 | | | | 10.39 | | | | 9.39 | | | | 11.03 | | | | 11.49 | | |
| 5-year | | | 5.36 | | | | 4.12 | | | | 4.57 | | | | 4.24 | | | | 4.58 | | | | 4.58 | | | | 5.11 | | | | 5.59 | | |
| 10-year | | | 5.35 | | | | 4.72 | | | | 4.56 | | | | 4.56 | | | | 4.55 | | | | 4.55 | | | | 5.22 | | | | 5.59 | | |
The "with sales charge" returns include the maximum initial sales charge of 5.75% for Class A shares, the applicable contingent deferred sales charge of 5.00% in the first year, declining to 1.00% in the sixth year and eliminated thereafter for Class B shares and 1.00% for Class C shares for the first year only. The "without sales charge" returns do not include the effect of sales charges. If they had, returns would be lower.
Performance results reflect any fee waivers or reimbursements of portfolio expenses by the Investment Manager and/or any of its affiliates. Absent these fee waivers or expense reimbursement arrangements, performance results would have been lower.
All results shown assume reinvestment of distributions. Class Z shares are sold at net asset value with no distribution and service (Rule 12b-1) fees. Class R shares are sold at net asset value with distribution (Rule 12b-1) fees. Class R and Class Z shares have limited eligibility and the investment minimum requirements may vary. Please see the portfolio's prospectus for details. Performance for different share classes will vary based on differences in sales charges and fees associated with each class.
The tables do not reflect the deduction of taxes that a shareholder may pay on portfolio distributions or on the redemption of portfolio shares.
The inception date of the portfolio's Class R shares is January 23, 2006. Class R shares have no performance prior to their inception date. The performance shown for Class R shares prior to their inception date is that of Class A shares. If Class R shares fees and expenses were included, performance would be lower.
14
Understanding Your Expenses – Columbia LifeGoal Income and Growth Portfolio
As a portfolio shareholder, you incur two types of costs. There are transaction costs, which generally include sales charges on purchases and may include redemption fees or exchange fees. There are also ongoing costs, which generally include investment advisory fees, distribution and service (Rule 12b-1) fees and other portfolio expenses. The information on this page is intended to help you understand the ongoing costs of investing in the portfolio and to compare these costs with the ongoing costs of investing in other mutual funds.
Analyzing your portfolio's expenses by share class
To illustrate these ongoing costs, we have provided an example and calculated the expenses paid by investors in each share class during the period. The information in the following table is based on an initial investment of $1,000, which is invested at the beginning of the period and held for the entire period. Expense information is calculated two ways and each method provides you with different information. The amount listed in the "Actual" column is calculated using the portfolio's actual operating expenses and total return for the period. The amount listed in the "Hypothetical" column for each share class assumes that the return each year is 5% before expenses and is calculated based on the portfolio's actual operating expenses. You should not use the hypothetical account values and expenses to estimate either your actual account balance at the end of the period or the expenses you paid during this period.
Compare with other funds
Since all mutual funds are required to include the same hypothetical calculations about expenses in shareholder reports, you can use this information to compare the ongoing cost of investing in the portfolio with other funds. To do so, compare the 5% hypothetical example with the 5% hypothetical examples that appear in the shareholder reports of other funds. As you compare hypothetical examples of other funds, it is important to note that hypothetical examples are meant to highlight the ongoing costs of investing in a portfolio and do not reflect any transaction costs, such as sales charges, redemption fees or exchange fees.
As a shareholder of the underlying funds in which it invests, the portfolio will bear its allocable share of the costs and expenses of these underlying funds. The costs and expenses are not included in the portfolio's annualized expense ratios used to calculate the expense information below.
Estimating your actual expenses
To estimate the expenses that you paid over the period, first you will need your account balance at the end of the period:
g For shareholders who receive their account statements from Columbia Management Investment Services Corp., your account balance is available online at www.columbiamanagement.com or by calling Shareholder Services at 800.345.6611.
g For shareholders who receive their account statements from their financial intermediary, contact your financial intermediary to obtain your account balance.
1. Divide your ending account balance by $1,000. For example, if an account balance was $8,600 at the end of the period, the result would be 8.6.
2. In the section of the table below titled "Expenses paid during the period," locate the amount for your share class. You will find this number in the column labeled "Actual." Multiply this number by the result from step 1. Your answer is an estimate of the expenses you paid on your account during the period.
If the value of your account falls below the minimum initial investment requirement applicable to you, your account may be subject to a $20 annual fee. This fee is not included in the accompanying table. If you are subject to the fee, keep it in mind when you are estimating the ongoing expenses of investing in the portfolio and when comparing the expenses of this portfolio with other funds.
10/01/10 – 03/31/11
| | | Account value at the
beginning of the period ($) | | Account value at the
end of the period ($) | | Expenses paid
during the period ($) | | Portfolio's annualized
expense ratio (%)** | |
| | | Actual | | Hypothetical | | Actual | | Hypothetical | | Actual | | Hypothetical | | Actual | |
| Class A | | | 1,000.00 | | | | 1,000.00 | | | | 1,076.80 | | | | 1,022.44 | | | | 2.59 | | | | 2.52 | | | | 0.50 | | |
| Class B | | | 1,000.00 | | | | 1,000.00 | | | | 1,073.10 | | | | 1,018.70 | | | | 6.46 | | | | 6.29 | | | | 1.25 | | |
| Class C | | | 1,000.00 | | | | 1,000.00 | | | | 1,072.60 | | | | 1,018.70 | | | | 6.46 | | | | 6.29 | | | | 1.25 | | |
| Class R | | | 1,000.00 | | | | 1,000.00 | | | | 1,075.40 | | | | 1,021.19 | | | | 3.88 | | | | 3.78 | | | | 0.75 | | |
| Class Z | | | 1,000.00 | | | | 1,000.00 | | | | 1,077.90 | | | | 1,023.68 | | | | 1.30 | | | | 1.26 | | | | 0.25 | | |
Expenses paid during the period are equal to the annualized expense ratio for the share class, multiplied by the average account value over the period, then multiplied by the number of days in the portfolio's most recent fiscal half-year and divided by 365.
It is important to note that the expense amounts shown in the table are meant to highlight only ongoing costs of investing in the portfolio and do not reflect any transaction costs, such as sales charges, redemption fees or exchange fees. Therefore, the hypothetical examples provided may not help you determine the relative total costs of owning shares of different portfolios. If these transaction costs were included, your costs would have been higher.
**Columbia LifeGoal Income and Growth Portfolio's expense ratios do not include fees and expenses incurred by the underlying funds.
15
Portfolio Managers' Report – Columbia LifeGoal Income and Growth Portfolio
Performance data quoted represents past performance and current performance may be lower or higher. Past performance is no guarantee of future results. The investment return and principal value will fluctuate so that shares, when redeemed, may be worth more or less than the original cost. Please visit www.columbiamanagement.com for daily and most recent month-end performance updates.
Net asset value per share
as of 03/31/11 ($)
| Class A | | | 10.89 | | |
| Class B | | | 10.85 | | |
| Class C | | | 10.78 | | |
| Class R | | | 10.90 | | |
| Class Z | | | 10.78 | | |
Distributions declared per share
04/01/10 – 03/31/11 ($)
| Class A | | | 0.26 | | |
| Class B | | | 0.18 | | |
| Class C | | | 0.18 | | |
| Class R | | | 0.23 | | |
| Class Z | | | 0.28 | | |
For the 12-month period that ended March 31, 2011, the portfolio's Class A shares returned 11.21% without sales charge. The portfolio's equity benchmark, the broad-based S&P 500 Index, returned 15.65% and its fixed-income benchmark, the Barclays Capital Aggregate Bond Index, rose 5.12%. The portfolio had a higher return than the average fund in its peer group, the Lipper Mixed-Asset Target Allocation Conservative Funds Classification, which returned 9.28%. A tactical decision to overweight equities relative to fixed income early in the period aided performance. The decision to favor investment grade-bonds over Treasuries also benefited return.
Tactical allocation decisions benefited performance
During the 12-month period, global markets maintained their upward momentum, posting solid gains during the period. At the start of the period, equity markets experienced higher volatility as concerns lingered around the economic recovery and the potential of a "double-dip" recession. As summer progressed, this outcome appeared unlikely, and markets responded by moving significantly higher. Volatility escalated again at the end of the period due to concerns over geopolitical risks, Japan's earthquake/tsunami disaster and the fear of rising inflation.
The portfolio's asset allocation team believed a "double-dip" was unlikely. So when equity prices were depressed during the summer, we opportunistically increased the portfolio's allocation to equities. This decision to overweight equities relative to fixed income early in the period was a key factor in the portfolio's outperformance. In addition, we decreased the portfolio's allocation to developed international equities in favor of U.S. large-cap stocks, an action that also benefited results. The management team's decision to favor investment-grade bonds over Treasury issues also aided performance. Exposure to small- and mid-cap stocks as well as high-yield bonds was also beneficial. In light of heightened volatility near the end of the period, we reduced the portfolio's exposure to emerging-markets.
The portfolio's position in investment-grade bonds aided performance. However, we trimmed exposure to investment-grade corporate bonds and added to the portfolio's allocation to high-yield bonds during the period. Although the yield difference between higher and lower quality bonds has narrowed significantly over the past year, high-yield bonds remain reasonably attractive, especially given low expected default rates, which are predicated on the avoidance of a significant slowdown in U.S. economic growth.
In addition to positive tactical allocations, Columbia LifeGoal Income and Growth Portfolio benefited from strong performance of several of its underlying funds. For the period, Columbia Select Large Cap Growth Fund, Columbia Small Cap Value Fund II, and Columbia Dividend Opportunity Fund outperformed their respective benchmarks. Columbia Energy and Natural Resources Fund, Columbia Income Opportunities Fund and Columbia Real Estate Equity Fund were some of the weakest performers relative to their respective benchmarks. However, it is worth noting that both Columbia Energy and Natural Resources Fund and Columbia Real Estate Equity Fund delivered 20%+ gains for the portfolio.
Looking ahead
For 2011, we expect positive GDP growth in the range of 2.5% to 3.5%. Monetary stimulus continues, but its impact on the economy is constrained by structural challenges, including the continuing housing recession, ongoing deleveraging by households and a relatively weak labor
16
Portfolio Managers' Report (continued) – Columbia LifeGoal Income and Growth Portfolio
market. Still, both stimulus spending and related liquidity are finding their way into markets and will provide continuing support. In this environment, the portfolio favors equities relative to bonds. Within equities, we favor domestic stocks over international. Domestically, we favor higher quality, large companies. The portfolio is underweight in international developed markets and has reduced its exposure to emerging market equities. In fixed income, the portfolio continues to emphasize investment-grade and high-yield bonds, with an underweight relative to its target allocations in Treasuries and TIPS. Looking ahead, we will continue to monitor geopolitical risks and their potential impact on the markets.
Portfolio characteristics and holdings are subject to change periodically and may not be representative of current characteristics and holdings. The outlook for the fund may differ from that presented for other Columbia Funds.
Columbia LifeGoal Portfolios reserve the right to add or remove underlying funds at any time.
The portfolio is a "fund of funds." A fund of funds bears its allocable share of the costs and expenses of the underlying funds in which it invests. Such funds are thus subject to two levels of fees and a potentially higher expense ratio than would be associated with an investment in a fund that invests and trades directly in financial instruments under the direction of a single manager. Risks include stock market fluctuations due to business and economic developments.
Equity securities are subject to stock market fluctuations that occur in response to economic and business developments.
Stocks of small- and mid-cap companies may pose special risks, including possible illiquidity and greater price volatility than stocks of larger, more established companies.
International investing involves special risks, including foreign taxation, currency risks, risks associated with possible differences in financial standards and other risks associated with future political and economic developments.
Investing in emerging markets may involve greater risks than investing in more developed countries. In addition, concentration of investments in a single region may result in greater volatility.
Investing in fixed-income securities may involve certain risks, including the credit quality of individual issuers, possible prepayments, market or economic developments and yields and share price fluctuations due to changes in interest rates. When interest rates go up, bond prices typically drop, and vice versa.
Investments in high-yield bonds (sometimes referred to as "junk" bonds) offer the potential for high current income and attractive total return, but involve certain risks. Changes in economic conditions or other circumstances may adversely affect a high-yield bond issuer's ability to make principal and interest payments. High-yield bonds issued by foreign entities have greater potential risks, including less regulation, currency fluctuation, economic instability and political developments.
Portfolio Allocation
as of 03/31/11 (%)
| Columbia Bond Fund | | | 18.1 | | |
Columbia Corporate
Income Fund | | | 11.2 | | |
Columbia Income
Opportunities Fund | | | 10.7 | | |
Mortgage- and Asset-
Backed Portfolio | | | 7.1 | | |
Columbia Short Term
Bond Fund | | | 6.3 | | |
Columbia Energy and
Natural Resources Fund | | | 5.0 | | |
| Columbia Dividend Income Fund | | | 3.3 | | |
Columbia Emerging
Markets Fund | | | 3.2 | | |
Columbia Convertible
Securities Fund | | | 3.0 | | |
| Columbia Mid Cap Growth Fund | | | 2.5 | | |
| Columbia Mid Cap Value Fund | | | 2.5 | | |
| Columbia Large Cap Core Fund | | | 2.3 | | |
| Columbia Contrarian Core Fund | | | 2.3 | | |
Columbia Real Estate
Equity Fund | | | 2.0 | | |
Columbia Select Large
Cap Growth Fund | | | 2.0 | | |
Columbia U.S. Government
Mortgage Fund | | | 1.7 | | |
Columbia Large Cap
Growth Fund | | | 1.6 | | |
Columbia U.S. Treasury
Index Fund | | | 1.4 | | |
Columbia International
Bond Fund | | | 1.2 | | |
Columbia Marsico Focused
Equities Fund | | | 1.0 | | |
Columbia Large Value
Quantitative Fund | | | 1.0 | | |
Columbia Emerging Markets
Bond Fund | | | 1.0 | | |
| Columbia Acorn USA | | | 0.9 | | |
Columbia Small Cap Growth
Fund I | | | 0.8 | | |
Columbia Small Cap Value
Fund I | | | 0.8 | | |
Columbia Small Cap Value
Fund II | | | 0.8 | | |
| Columbia European Equity Fund | | | 0.7 | | |
| Columbia Pacific/Asia Fund | | | 0.6 | | |
Columbia Marsico International
Opportunities Fund | | | 0.5 | | |
| BofA Cash Reserves | | | 0.5 | | |
Columbia International
Value Fund | | | 0.5 | | |
Columbia Dividend
Opportunity Fund | | | 0.3 | | |
| Columbia Acorn International | | | 0.1 | | |
| U.S. Government Obligations | | | 3.1 | | |
Portfolio allocation is calculated as a percentage of total investments.
17
Portfolio Profile – Columbia LifeGoal Income Portfolio
Performance data quoted represents past performance and current performance may be lower or higher. Past performance is no guarantee of future results. The investment return and principal value will fluctuate so that shares, when redeemed, may be worth more or less than the original cost. Please visit www.columbiamanagement.com for daily and most recent month-end performance updates.
Summary
1-year return as of 03/31/11
| | +7.21% | |
|
|  | | | Class A shares
(without sales charge) | |
|
| | +1.88% | |
|
|  | | | Barclays Capital
U.S. Aggregate 1-3 Years
Index | |
|
| | +4.30% | |
|
|  | | | Blended 80% Barclays Capital
U.S. Aggregate 1-3 Years
Index / 20% Barclays Capital
U.S. Corporate High Yield
Bond Index | |
|
Summary
g For the 12-month period that ended March 31, 2011, the portfolio's Class A shares returned 7.21% without sales charge.
g The portfolio outperformed the 1.88% return of its fixed-income index, the Barclays Capital U.S. Aggregate 1-3 Years Index1; the 4.30% return of a customized benchmark2 created by Columbia Management Investment Advisers, LLC, blending 80% Barclays Capital U.S. Aggregate 1-3 Years Index and 20% Barclays Capital U.S. Corporate High Yield Bond Index; and the 5.89% return of the average fund in its peer group, the Lipper General Bond Funds Classification.3
g We attribute the portfolio's strong relative performance to our decision to bolster the portfolio's small weight in equities early in the period, including a position in international equities. High-yield and convertible bonds also aided performance, as did a decision to favor non-Treasury sectors over Treasuries.
Portfolio Management
Anwiti Bahuguna, PhD has co-managed the portfolio since 2009. From 2002 until joining Columbia Management Investment Advisers, LLC (the Investment Manager) in May 2010, Ms. Bahuguna was associated with the portfolio's previous investment adviser as an investment professional.
Kent M. Bergene has co-managed the portfolio since 2010. From 1981 until joining the Investment Manager in May 2010, Mr. Bergene was associated with the portfolio's previous investment adviser as an investment professional.
Colin Moore has co-managed the portfolio since 2009. From 2002 until joining the Investment Manager in May 2010, Mr. Moore was associated with the portfolio's previous investment adviser as an investment professional.
Kent M. Peterson, PhD has co-managed the portfolio since 2009. From 2006 until joining the Investment Manager in May 2010, Mr. Peterson was associated with the portfolio's previous investment adviser as an investment professional.
Marie M. Schofield, CFA has co-managed the portfolio since 2009. From 1990 until joining the Investment Manager in May 2010, Ms. Schofield was associated with the portfolio's previous investment adviser as an investment professional.
1The Barclays Capital U.S. Aggregate 1-3 Years Index is an index of publicly-issued investment-grade corporate, U.S. Treasury and government agency securities with remaining maturities of one to three years.
2This blend is 80% Barclays Capital U.S. Aggregate 1-3 Years Index and 20% Barclays Capital U.S. Corporate High Yield Bond Index. The Barclays Capital U.S. Corporate High Yield Bond Index is a market value-weighted index, which covers the U.S. non-investment grade fixed-rate debt market. The index is composed of US. dollar-denominated corporate debt in industrial, utility and finance sectors with a minimum $150 million par amount outstanding and a maturity greater than one year. The index includes reinvestment of income.
3Lipper Inc., a widely respected data provider in the industry, calculates an average total return (assuming reinvestment of distributions) for mutual funds with investment objectives similar to those of the fund. Lipper makes no adjustment for the effect of sales loads.
Indices are not available for investment, are not professionally managed and do not reflect sales charges, fees, brokerage commissions, taxes or other expenses of investing. Securities in the fund may not match those in an index.
18
Performance Information – Columbia LifeGoal Income Portfolio
Performance of a $10,000 investment 09/04/03 – 03/31/11
The chart above shows the change in value of a hypothetical $10,000 investment in Class A shares of Columbia LifeGoal Income Portfolio during the stated time period, and does not reflect the deduction of taxes that a shareholder may pay on portfolio distributions or on the redemption of portfolio shares.
Performance of a $10,000 investment 09/04/03 – 03/31/11 ($)
| Sales charge | | without | | with | |
| Class A | | | 14,030 | | | | 13,569 | | |
| Class B | | | 13,242 | | | | 13,242 | | |
| Class C | | | 13,234 | | | | 13,234 | | |
| Class Z | | | 14,293 | | | | n/a | | |
Performance data quoted represents past performance and current performance may be lower or higher. Past performance is no guarantee of future results. The investment return and principal value will fluctuate so that shares, when redeemed, may be worth more or less than the original cost. Please visit www.columbiamanagement.com for daily and most recent month-end performance updates.
Average annual total return as of 03/31/11 (%)
| Share class | | A | | B | | C | | Z | |
| Inception | | 09/04/03 | | 09/04/03 | | 09/05/03 | | 09/04/03 | |
| Sales charge | | without | | with | | without | | with | | without | | with | | without | |
| 1-year | | | 7.21 | | | | 3.75 | | | | 6.31 | | | | 3.31 | | | | 6.32 | | | | 5.32 | | | | 7.37 | | |
| 5-year | | | 4.82 | | | | 4.12 | | | | 4.02 | | | | 4.02 | | | | 4.03 | | | | 4.03 | | | | 5.06 | | |
| Life | | | 4.57 | | | | 4.11 | | | | 3.78 | | | | 3.78 | | | | 3.77 | | | | 3.77 | | | | 4.83 | | |
The "with sales charge" returns include the maximum initial sales charge of 3.25% for Class A shares, the applicable contingent deferred sales charge of 3.00% in the first year, declining to 1.00% in the fourth year and eliminated thereafter for Class B shares and 1.00% for Class C shares for the first year only. The "without sales charge" returns do not include the effect of sales charges. If they had, returns would be lower.
Performance results reflect any fee waivers or reimbursements of portfolio expenses by the Investment Manager and/or any of its affiliates. Absent these fee waivers or expense reimbursement arrangements, performance results would have been lower.
All results shown assume reinvestment of distributions. Class Z shares are sold at net asset value with no distribution and service (Rule 12b-1) fees. Class Z shares have limited eligibility and the investment minimum requirements may vary. Please see the portfolio's prospectus for details. Performance for different share classes will vary based on differences in sales charges and fees associated with each class.
The tables do not reflect the deduction of taxes that a shareholder may pay on fund distributions or on the redemption of fund shares.
19
Understanding Your Expenses – Columbia LifeGoal Income Portfolio
Estimating your actual expenses
To estimate the expenses that you paid over the period, first you will need your account balance at the end of the period:
g For shareholders who receive their account statements from Columbia Management Investment Services Corp., your account balance is available online at www.columbiamanagement.com or by calling Shareholder Services at 800.345.6611.
g For shareholders who receive their account statements from their financial intermediary, contact your financial intermediary to obtain your account balance.
1. Divide your ending account balance by $1,000. For example, if an account balance was $8,600 at the end of the period, the result would be 8.6.
2. In the section of the table below titled "Expenses paid during the period," locate the amount for your share class. You will find this number in the column labeled "Actual." Multiply this number by the result from step 1. Your answer is an estimate of the expenses you paid on your account during the period.
If the value of your account falls below the minimum initial investment requirement applicable to you, your account may be subject to a $20 annual fee. This fee is not included in the accompanying table. If you are subject to the fee, keep it in mind when you are estimating the ongoing expenses of investing in the portfolio and when comparing the expenses of this portfolio with other funds.
As a portfolio shareholder, you incur two types of costs. There are transaction costs, which generally include sales charges on purchases and may include redemption fees or exchange fees. There are also ongoing costs, which generally include investment advisory fees, distribution and service (Rule 12b-1) fees and other portfolio expenses. The information on this page is intended to help you understand the ongoing costs of investing in the portfolio and to compare these costs with the ongoing costs of investing in other mutual funds.
Analyzing your portfolio's expenses by share class
To illustrate these ongoing costs, we have provided an example and calculated the expenses paid by investors in each share class during the period. The information in the following table is based on an initial investment of $1,000, which is invested at the beginning of the period and held for the entire period. Expense information is calculated two ways and each method provides you with different information. The amount listed in the "Actual" column is calculated using the portfolio's actual operating expenses and total return for the period. The amount listed in the "Hypothetical" column for each share class assumes that the return each year is 5% before expenses and is calculated based on the portfolio's actual operating expenses. You should not use the hypothetical account values and expenses to estimate either your actual account balance at the end of the period or the expenses you paid during this period.
Compare with other funds
Since all mutual funds are required to include the same hypothetical calculations about expenses in shareholder reports, you can use this information to compare the ongoing cost of investing in the portfolio with other funds. To do so, compare the 5% hypothetical example with the 5% hypothetical examples that appear in the shareholder reports of other funds. As you compare hypothetical examples of other funds, it is important to note that hypothetical examples are meant to highlight the ongoing costs of investing in a portfolio and do not reflect any transaction costs, such as sales charges, redemption fees or exchange fees.
As a shareholder of the underlying funds in which it invests, the portfolio will bear its allocable share of the costs and expenses of these underlying funds. The costs and expenses are not included in the portfolio's annualized expense ratios used to calculate the expense information below.
10/01/10 – 03/31/11
| | | Account value at the
beginning of the period ($) | | Account value at the
end of the period ($) | | Expenses paid
during the period ($) | | Portfolio's annualized
expense ratio (%)** | |
| | | Actual | | Hypothetical | | Actual | | Hypothetical | | Actual | | Hypothetical | | Actual | |
| Class A | | | 1,000.00 | | | | 1,000.00 | | | | 1,034.50 | | | | 1,021.59 | | | | 3.40 | | | | 3.38 | | | | 0.67 | | |
| Class B | | | 1,000.00 | | | | 1,000.00 | | | | 1,029.70 | | | | 1,017.85 | | | | 7.19 | | | | 7.14 | | | | 1.42 | | |
| Class C | | | 1,000.00 | | | | 1,000.00 | | | | 1,030.80 | | | | 1,017.85 | | | | 7.19 | | | | 7.14 | | | | 1.42 | | |
| Class Z | | | 1,000.00 | | | | 1,000.00 | | | | 1,035.80 | | | | 1,022.84 | | | | 2.13 | | | | 2.12 | | | | 0.42 | | |
Expenses paid during the period are equal to the annualized expense ratio for the share class, multiplied by the average account value over the period, then multiplied by the number of days in the portfolio's most recent fiscal half-year and divided by 365.
Had the Investment Manager and/or any of its affiliates not waived fees or reimbursed a portion of expenses, account value at the end of the period would have been reduced.
It is important to note that the expense amounts shown in the table are meant to highlight only ongoing costs of investing in the portfolio and do not reflect any transaction costs, such as sales charges, redemption fees or exchange fees. Therefore, the hypothetical examples provided may not help you determine the relative total costs of owning shares of different portfolios. If these transaction costs were included, your costs would have been higher.
**Columbia LifeGoal Income Portfolio's expense ratios do not include fees and expenses incurred by the underlying funds.
20
Portfolio Managers' Report – Columbia LifeGoal Income Portfolio
For the 12-month period that ended March 31, 2011, the portfolio's Class A shares returned 7.21% without sales charge. The portfolio's return was substantially higher than the 1.88% return of its benchmark, the Barclays Capital U.S. Aggregate 1-3 Years Index. It also outperformed its customized blended benchmark—80% Barclays Capital U.S. Aggregate 1-3 Years Index and 20% Barclays Capital U.S. Corporate High Yield Bond Index—which returned 4.30%. In addition, the portfolio performed better than the average fund in its peer group, the Lipper General Bond Funds Classification, which returned 5.89%. We attribute the portfolio's strong relative performance to our decision to bolster the portfolio's small weight in equities, including a new position in international equities early in the period. High-yield and convertible bonds also aided performance as did a decision to favor non-Treasury investment-grade bonds over Treasuries.
Tactical allocation decisions benefited performance
During the 12-month period, global markets maintained their upward momentum, posting solid gains during the period. At the start of the period, equity markets experienced higher volatility as concerns lingered around the economic recovery and the potential of a "double-dip" recession. As summer progressed, this outcome appeared unlikely, and markets responded by moving significantly higher to end the period. Still, volatility escalated again at the end of the period due to concerns over geopolitical risks, Japan's earthquake/tsunami disaster, and the fear of rising inflation.
The portfolio's asset allocation team believed a "double-dip" was unlikely, and when equity prices were depressed during the summer, we opportunistically increased the portfolio's allocation to equities. This decision to add to the portfolio's small position in equities early in the period was a key factor in the portfolio's outperformance. The management team's decision to favor non-Treasury investment-grade bonds over Treasury issues also aided results. The portfolio's exposure to high-yield bonds and convertible securities was also beneficial.
The portfolio's exposure to non-Treasury investment-grade bonds aided performance. However, during the period, we trimmed exposure to investment-grade corporate bonds in favor of high-yield bonds. Although the difference in yields between higher and lower quality bonds has narrowed significantly over the year, high-yield bonds are attractively priced on a historical basis, especially given low expected default rates, which are predicated on the avoidance of a significant slowdown in U.S. economic growth. During the period, we introduced a position in Treasury Inflation Protected Securities (TIPS) to broaden the diversification of the portfolio and as a hedge against future inflation.
In addition to positive tactical allocations, Columbia LifeGoal Income Portfolio benefited from strong performance of several of its underlying funds. For the period, Columbia European Equity Fund, Columbia Dividend Opportunity Fund and Columbia Small Cap Value Fund II outperformed their respective benchmarks by comfortable margins. Columbia Dividend Income Fund delivered disappointing performance relative to its benchmark, as did Columbia Energy and Natural Resources Fund and Columbia Real Estate Equity Fund. However, the latter two generated double-digit gains for the portfolio and, as such, added nicely to its overall return.
Looking ahead
We are optimistic on the potential for 2011. We expect positive GDP growth in the range of 2.5% to 3.5%. Monetary stimulus continues, but its effect on the economy is constrained by
Performance data quoted represents past performance and current performance may be lower or higher. Past performance is no guarantee of future results. The investment return and principal value will fluctuate so that shares, when redeemed, may be worth more or less than the original cost. Please visit www.columbiamanagement.com for daily and most recent month-end performance updates.
Net asset value per share
as of 03/31/11 ($)
| Class A | | | 10.31 | | |
| Class B | | | 10.29 | | |
| Class C | | | 10.28 | | |
| Class Z | | | 10.31 | | |
Distributions declared per share
04/01/10 – 03/31/11 ($)
| Class A | | | 0.29 | | |
| Class B | | | 0.22 | | |
| Class C | | | 0.22 | | |
| Class Z | | | 0.32 | | |
21
Portfolio Managers' Report (continued) – Columbia LifeGoal Income Portfolio
Portfolio Allocation
as of 03/31/11 (%)
| Columbia Bond Fund | | | 23.2 | | |
Columbia Corporate
Income Fund | | | 14.6 | | |
Columbia Income
Opportunities Fund | | | 12.3 | | |
Mortgage- and Asset-
Backed Portfolio | | | 9.7 | | |
| Columbia Short Term Bond Fund | | | 7.7 | | |
Columbia Convertible
Securities Fund | | | 5.0 | | |
Columbia Dividend
Income Fund | | | 4.6 | | |
Columbia Energy and
Natural Resources Fund | | | 3.0 | | |
Columbia U.S. Treasury
Index Fund | | | 2.5 | | |
Columbia U.S. Government
Mortgage Fund | | | 2.2 | | |
| BofA Cash Reserves | | | 2.0 | | |
| Columbia European Equity Fund | | | 2.0 | | |
Columbia Real Estate
Equity Fund | | | 1.9 | | |
Columbia International
Bond Fund | | | 1.5 | | |
Columbia Emerging Markets
Bond Fund | | | 1.3 | | |
Columbia Small Cap Value
Fund II | | | 0.5 | | |
Columbia Small Cap Value
Fund I | | | 0.5 | | |
Columbia Dividend
Opportunity Fund | | | 0.3 | | |
| U.S. Government Obligations | | | 5.2 | | |
Portfolio allocation is calculated as a percentage of total investments.
structural challenges, including the continuing housing recession, ongoing deleveraging by households and the weak labor market. Still, the stimulus and related liquidity is finding its way into markets and will be a continuing support. In this environment, the portfolio favors equities relative to bonds, and within equities, we favor domestic stocks over international. Domestically, we favor higher quality and larger companies. A small position in international equities was added during the year to broaden the fund's diversification. In fixed income, the portfolio continues to have exposure to a broad range of investment-grade and high-yield bonds, Treasuries and TIPS. As we move forward, we will continue to monitor geopolitical risks and their potential impacts on the markets.
Portfolio characteristics and holdings are subject to change periodically and may not be representative of current characteristics and holdings. The outlook for the fund may differ from that presented for other Columbia Funds.
Columbia LifeGoal Portfolios reserve the right to add or remove underlying funds at any time.
The portfolio is a "fund of funds." A fund of funds bears its allocable share of the costs and expenses of the underlying funds in which it invests. Such funds are thus subject to two levels of fees and a potentially higher expense ratio than would be associated with an investment in a fund that invests and trades directly in financial instruments under the direction of a single manager. Risks include stock market fluctuations due to business and economic developments.
Equity securities are subject to stock market fluctuations that occur in response to economic and business developments.
Stocks of small- and mid-cap companies may pose special risks, including possible illiquidity and greater price volatility than stocks of larger, more established companies.
International investing involves special risks, including foreign taxation, currency risks, risks associated with possible differences in financial standards and other risks associated with future political and economic developments.
Investing in fixed-income securities may involve certain risks, including the credit quality of individual issuers, possible prepayments, market or economic developments and yields and share price fluctuations due to changes in interest rates. When interest rates go up, bond prices typically drop, and vice versa.
Investments in high-yield bonds (sometimes referred to as "junk" bonds) offer the potential for high current income and attractive total return, but involve certain risks. Changes in economic conditions or other circumstances may adversely affect a high-yield bond issuer's ability to make principal and interest payments. High-yield bonds issued by foreign entities have greater potential risks, including less regulation, currency fluctuation, economic instability and political developments.
22
Investment Portfolio – Columbia LifeGoal Growth Portfolio
March 31, 2011
| Investment Companies (a) – 100.2% | |
| | | Shares | | Value ($) | |
Columbia Acorn International,
Class I | | | 274,929 | | | | 11,401,289 | | |
| Columbia Acorn USA, Class I | | | 399,398 | | | | 12,269,499 | | |
| Columbia Bond Fund, Class I | | | 1,446,824 | | | | 13,383,124 | | |
Columbia Contrarian Core Fund,
Class I | | | 1,651,924 | | | | 24,844,944 | | |
Columbia Convertible Securities
Fund, Class I | | | 728,730 | | | | 11,368,189 | | |
Columbia Corporate Income
Fund, Class I | | | 437,607 | | | | 4,249,166 | | |
Columbia Dividend Income Fund,
Class I | | | 688,810 | | | | 9,416,030 | | |
Columbia Dividend Opportunity
Fund, Class I | | | 159,879 | | | | 1,328,593 | | |
Columbia Emerging Markets
Fund, Class I | | | 2,256,219 | | | | 25,901,393 | | |
Columbia Energy and Natural
Resources Fund, Class I | | | 1,185,365 | | | | 30,463,868 | | |
Columbia European Equity Fund,
Class I | | | 1,487,895 | | | | 9,195,188 | | |
Columbia International Value
Fund, Class I | | | 1,045,976 | | | | 15,292,170 | | |
Columbia Large Cap Core Fund,
Class I | | | 1,615,787 | | | | 22,217,076 | | |
Columbia Large Cap Growth
Fund, Class I | | | 586,069 | | | | 14,892,022 | | |
Columbia Large Cap Value Fund,
Class I | | | 894,050 | | | | 10,683,897 | | |
Columbia Large Value
Quantitative Fund, Class I | | | 1,423,637 | | | | 10,805,408 | | |
Columbia Marsico Focused
Equities Fund, Class I | | | 553,926 | | | | 13,482,568 | | |
Columbia Marsico International
Opportunities Fund, Class I | | | 1,290,033 | | | | 15,622,300 | | |
Columbia Mid Cap Growth Fund,
Class I | | | 1,050,686 | | | | 30,616,995 | | |
Columbia Mid Cap Value Fund,
Class I | | | 2,110,678 | | | | 30,414,875 | | |
Columbia Pacific/Asia Fund,
Class I | | | 894,663 | | | | 7,703,049 | | |
Columbia Real Estate Equity
Fund, Class I | | | 778,438 | | | | 10,127,477 | | |
Columbia Select Large Cap
Growth Fund, Class I | | | 1,285,806 | | | | 17,679,838 | | |
Columbia Small Cap Growth
Fund I, Class I | | | 165,427 | | | | 5,826,333 | | |
Columbia Small Cap Growth
Fund II, Class Z | | | 432,226 | | | | 5,826,413 | | |
Columbia Small Cap Value
Fund I, Class I | | | 240,272 | | | | 11,900,685 | | |
| | | Shares | | Value ($) | |
Columbia Small Cap Value
Fund II, Class I | | | 787,722 | | | | 11,894,609 | | |
Columbia U.S. Treasury Index
Fund, Class I | | | 355,076 | | | | 3,916,493 | | |
Columbia Value and
Restructuring Fund, Class I | | | 203,582 | | | | 10,795,972 | | |
Total Investment Companies
(cost of $321,777,645) | | | 403,519,463 | | |
Total Investments – 100.2%
(cost of $321,777,645) (b) | | | 403,519,463 | | |
| Other Assets & Liabilities, Net – (0.2)% | | | (895,233 | ) | |
| Net Assets – 100.0% | | | 402,624,230 | | |
Notes to Investment Portfolio:
(a) Mutual funds registered under the Investment Company Act of 1940, as amended, and advised by Columbia Management Investment Advisers, LLC or one of its affiliates.
(b) Cost for federal income tax purposes is $332,115,696.
Generally accepted accounting principles (GAAP) require disclosure regarding the inputs and valuation techniques used to measure fair value and any changes in valuation inputs or techniques. In addition, investments shall be disclosed by major category.
The Portfolio categorizes its fair value measurements according to a three-level hierarchy that maximizes the use of observable inputs and minimizes the use of unobservable inputs by prioritizing that the most observable input be used when available. Observable inputs are those that market participants would use in pricing an investment based on market data obtained from sources independent of the reporting entity. Unobservable inputs are those that reflect the Portfolio's assumptions about the information market participants would use in pricing an investment. An investment's level within the fair value hierarchy is based on the lowest level of any input that is deemed significant to the asset or liability's fair value measurement. The input levels are not necessarily an indication of the risk or liquidity associated with investments at that level. For example, certain U.S. government securities are generally high quality and liquid, however, they are reflected as Level 2 because the inputs used to determine fair value may not always be quoted prices in an active market.
Fair value inputs are summarized in the three broad levels listed below:
• Level 1—Valuations based on quoted prices for investments in active markets that the Portfolio has the ability to access at the measurement date (including NAV for open-end mutual funds). Valuation adjustments are not applied to Level 1 investments.
• Level 2—Valuations based on other significant observable inputs (including quoted prices for similar securities, interest rates, prepayment speeds, credit risks, etc.).
• Level 3—Valuations based on significant unobservable inputs (including the Portfolio's own assumptions and judgment in determining the fair value of investments).
Inputs that are used in determining fair value of an investment may include price information, credit data, volatility statistics, and other factors. These inputs can be either observable or unobservable. The availability of observable inputs can vary between investments, and is affected by various factors such as the type of investment, and the volume and level of activity for that investment or similar investments in the marketplace. The inputs will be considered by the Investment Manager, along with any other relevant factors in the calculation of an investment's fair value. The Portfolio uses prices and
See Accompanying Notes to Financial Statements.
23
Columbia LifeGoal Growth Portfolio
March 31, 2011
inputs that are current as of the measurement date, which may include periods of market dislocations. During these periods, the availability of prices and inputs may be reduced for many investments. This condition could cause an investment to be reclassified between the various levels within the hierarchy. Non-U.S. equity securities actively traded in foreign markets may be reflected in Level 2 despite the availability of closing prices, because the Portfolio evaluates and determines whether those closing prices reflect fair value at the close of the New York Stock Exchange (NYSE) or require adjustment, as described in Note 2 to the financial statements—Security Valuation.
Investments falling into the Level 3 category are primarily supported by quoted prices from brokers and dealers participating in the market for those investments. However, these may be classified as Level 3 investments due to lack of market transparency and corroboration to support these quoted prices. Additionally, valuation models may be used as the pricing source for any remaining investments classified as Level 3. These models rely on one or more significant unobservable inputs and/or significant assumptions by the Investment Manager. Inputs used in valuations may include, but are not limited to, financial statement analysis, capital account balances, discount rates and estimated cash flows, and comparable company data.
The following table is a summary of the inputs used to value the Portfolio's investments as of March 31, 2011:
| Description | | Quoted
Prices
(Level 1) | | Other
Significant
Observable
Inputs
(Level 2) | | Significant
Unobservable
Inputs
(Level 3) | | Total | |
Total Investment
Companies | | $ | 403,519,463 | | | $ | — | | | $ | — | | | $ | 403,519,463 | | |
| Total Investments | | $ | 403,519,463 | | | $ | — | | | $ | — | | | $ | 403,519,463 | | |
There were no significant transfers of financial assets between Levels 1 and 2 during the period.
See Accompanying Notes to Financial Statements.
24
Investment Portfolio – Columbia LifeGoal Balanced Growth Portfolio
March 31, 2011
| Investment Companies – 98.6% | |
| | | Shares | | Value ($) | |
BofA Cash Reserves, Capital
Class Shares (a) | | | 2,834,597 | | | | 2,834,597 | | |
Columbia Acorn International,
Class I (b) | | | 202,219 | | | | 8,386,028 | | |
| Columbia Acorn USA, Class I (b) | | | 333,164 | | | | 10,234,808 | | |
| Columbia Bond Fund, Class I (b) | | | 7,401,077 | | | | 68,459,961 | | |
Columbia Contrarian Core Fund,
Class I (b) | | | 1,474,183 | | | | 22,171,706 | | |
Columbia Convertible Securities
Fund, Class I (b) | | | 742,336 | | | | 11,580,439 | | |
Columbia Corporate Income Fund,
Class I (b) | | | 4,137,377 | | | | 40,173,935 | | |
Columbia Dividend Income Fund,
Class I (b) | | | 1,167,200 | | | | 15,955,629 | | |
Columbia Dividend Opportunity
Fund, Class I (b) | | | 230,061 | | | | 1,911,804 | | |
Columbia Emerging Markets
Bond Fund, Class I (b) | | | 295,815 | | | | 3,330,874 | | |
Columbia Emerging Markets
Fund, Class I (b) | | | 2,155,860 | | | | 24,749,270 | | |
Columbia Energy and Natural
Resources Fund, Class I (b) | | | 1,588,816 | | | | 40,832,579 | | |
Columbia European Equity Fund,
Class I (b) | | | 1,208,137 | | | | 7,466,289 | | |
Columbia Income Opportunities
Fund, Class I (b) | | | 3,903,911 | | | | 37,985,057 | | |
Columbia International Bond
Fund, Class I (b) | | | 299,010 | | | | 3,319,010 | | |
Columbia International Value
Fund, Class I (b) | | | 1,157,192 | | | | 16,918,148 | | |
Columbia Large Cap Core Fund,
Class I (b) | | | 1,619,782 | | | | 22,271,999 | | |
Columbia Large Cap Growth
Fund, Class I (b) | | | 822,829 | | | | 20,908,093 | | |
Columbia Large Cap Value Fund,
Class I (b) | | | 725,696 | | | | 8,672,068 | | |
Columbia Large Value
Quantitative Fund, Class I (b) | | | 1,149,804 | | | | 8,727,014 | | |
Columbia Marsico Focused
Equities Fund, Class I (b) | | | 479,165 | | | | 11,662,876 | | |
Columbia Marsico International
Opportunities Fund, Class I (b) | | | 1,429,698 | | | | 17,313,641 | | |
Columbia Mid Cap Growth Fund,
Class I (b) | | | 905,850 | | | | 26,396,457 | | |
Columbia Mid Cap Value Fund,
Class I (b) | | | 1,816,096 | | | | 26,169,938 | | |
Columbia Pacific/Asia Fund,
Class I (b) | | | 1,018,524 | | | | 8,769,494 | | |
Columbia Real Estate Equity
Fund, Class I (b) | | | 1,338,341 | | | | 17,411,821 | | |
| | | Shares | | Value ($) | |
Columbia Select Large Cap
Growth Fund, Class I (b) | | | 924,248 | | | | 12,708,411 | | |
Columbia Small Cap Growth
Fund I, Class I (b) | | | 125,391 | | | | 4,416,286 | | |
Columbia Small Cap Growth
Fund II, Class Z (b) | | | 436,648 | | | | 5,886,019 | | |
Columbia Small Cap Value
Fund I, Class I (b) | | | 205,869 | | | | 10,196,672 | | |
Columbia Small Cap Value
Fund II, Class I (b) | | | 673,925 | | | | 10,176,271 | | |
Columbia U.S. Government
Mortgage Fund, Class I (b) | | | 1,251,451 | | | | 6,657,719 | | |
Columbia U.S. Treasury Index
Fund, Class I (b) | | | 212,213 | | | | 2,340,707 | | |
Columbia Value and
Restructuring Fund, Class I (b) | | | 164,888 | | | | 8,744,035 | | |
Mortgage- and Asset-Backed
Portfolio (b) | | | 2,310,304 | | | | 21,716,855 | | |
Total Investment Companies
(cost of $477,561,440) | | | 567,456,510 | | |
| Government Obligations – 1.5% | |
| | | Par ($) | | | |
| U.S. Government Obligations – 1.5% | |
U.S. Treasury Inflation Indexed Bonds
2.125% 02/15/40 | | | 183,373 | | | | 193,903 | | |
| 2.375% 01/15/25 | | | 1,209,015 | | | | 1,357,213 | | |
| 3.875% 04/15/29 | | | 1,178,681 | | | | 1,577,222 | | |
U.S. Treasury Inflation Indexed Notes
1.125% 01/15/21 | | | 85,558 | | | | 86,775 | | |
| 1.625% 01/15/15 | | | 1,026,304 | | | | 1,112,497 | | |
| 1.875% 07/15/13 | | | 671,367 | | | | 726,178 | | |
| 2.000% 01/15/14 | | | 798,419 | | | | 870,027 | | |
| 2.000% 01/15/16 | | | 698,916 | | | | 771,646 | | |
| 2.125% 01/15/19 | | | 784,561 | | | | 875,460 | | |
| 2.625% 07/15/17 | | | 573,696 | | | | 658,899 | | |
| 3.000% 07/15/12 | | | 465,359 | | | | 498,444 | | |
| U.S. Government Obligations Total | | | 8,728,264 | | |
Total Government Obligations
(cost of $8,420,891) | | | 8,728,264 | | |
Total Investments – 100.1%
(cost of $485,982,331) (c) | | | 576,184,774 | | |
| Other Assets & Liabilities, Net – (0.1)% | | | (776,370 | ) | |
| Net Assets – 100.0% | | | 575,408,404 | | |
See Accompanying Notes to Financial Statements.
25
Columbia LifeGoal Balanced Growth Portfolio
March 31, 2011
Notes to Investment Portfolio:
(a) As of May 1, 2010, this security was no longer an affiliate of the Portfolio.
(b) Mutual funds registered under the Investment Company Act of 1940, as amended, and advised by Columbia Management Investment Advisers, LLC or one of its affiliates.
(c) Cost for federal income tax purposes is $496,601,180.
Generally accepted accounting principles (GAAP) require disclosure regarding the inputs and valuation techniques used to measure fair value and any changes in valuation inputs or techniques. In addition, investments shall be disclosed by major category.
The Portfolio categorizes its fair value measurements according to a three-level hierarchy that maximizes the use of observable inputs and minimizes the use of unobservable inputs by prioritizing that the most observable input be used when available. Observable inputs are those that market participants would use in pricing an investment based on market data obtained from sources independent of the reporting entity. Unobservable inputs are those that reflect the Portfolio's assumptions about the information market participants would use in pricing an investment. An investment's level within the fair value hierarchy is based on the lowest level of any input that is deemed significant to the asset or liability's fair value measurement. The input levels are not necessarily an indication of the risk or liquidity associated with investments at that level. For example, certain U.S. government securities are generally high quality and liquid, however, they are reflected as Level 2 because the inputs used to determine fair value may not always be quoted prices in an active market.
Fair value inputs are summarized in the three broad levels listed below:
• Level 1—Valuations based on quoted prices for investments in active markets that the Portfolio has the ability to access at the measurement date (including NAV for open-end mutual funds). Valuation adjustments are not applied to Level 1 investments.
• Level 2—Valuations based on other significant observable inputs (including quoted prices for similar securities, interest rates, prepayment speeds, credit risks, etc.).
• Level 3—Valuations based on significant unobservable inputs (including the Portfolio's own assumptions and judgment in determining the fair value of investments).
Inputs that are used in determining fair value of an investment may include price information, credit data, volatility statistics, and other factors. These inputs can be either observable or unobservable. The availability of observable inputs can vary between investments, and is affected by various factors such as the type of investment, and the volume and level of activity for that investment or similar investments in the marketplace. The inputs will be considered by the Investment Manager, along with any other relevant factors in the calculation of an investment's fair value. The Portfolio uses prices and inputs that are current as of the measurement date, which may include periods of market dislocations. During these periods, the availability of prices and inputs may be reduced for many investments. This condition could cause an investment to be reclassified between the various levels within the hierarchy. Non-U.S. equity securities actively traded in foreign markets may be reflected in Level 2 despite the availability of closing prices, because the Portfolio evaluates and determines whether those closing prices reflect fair value at the close of the New York Stock Exchange (NYSE) or require adjustment, as described in Note 2 to the financial statements—Security Valuation.
Investments falling into the Level 3 category are primarily supported by quoted prices from brokers and dealers participating in the market for those investments. However, these may be classified as Level 3 investments due to lack of market transparency and corroboration to support these quoted prices. Additionally, valuation models may be used as the pricing source for any remaining investments classified as Level 3. These models rely on one or more significant unobservable inputs and/or significant assumptions by the Investment Manager. Inputs used in valuations may include, but are not limited to, financial statement analysis, capital account balances, discount rates and estimated cash flows, and comparable company data.
The following table is a summary of the inputs used to value the Portfolio's investments as of March 31, 2011:
| Description | | Quoted
Prices
(Level 1) | | Other
Significant
Observable
Inputs
(Level 2) | | Significant
Unobservable
Inputs
(Level 3) | | Total | |
Total Investment
Companies | | $ | 567,456,510 | | | $ | — | | | $ | — | | | $ | 567,456,510 | | |
Total Government
Obligations | | | 8,728,264 | | | | — | | | | — | | | | 8,728,264 | | |
| Total Investments | | $ | 576,184,774 | | | $ | — | | | $ | — | | | $ | 576,184,774 | | |
There were no significant transfers of financial assets between Levels 1 and 2 during the period.
See Accompanying Notes to Financial Statements.
26
Investment Portfolio – Columbia LifeGoal Income and Growth Portfolio
March 31, 2011
| Investment Companies – 97.2% | |
| | | Shares | | Value ($) | |
BofA Cash Reserves, Capital
Class Shares (a) | | | 678,051 | | | | 678,051 | | |
Columbia Acorn International,
Class I (b) | | | 2,211 | | | | 91,698 | | |
| Columbia Acorn USA, Class I (b) | | | 37,446 | | | | 1,150,342 | | |
| Columbia Bond Fund, Class I (b) | | | 2,670,195 | | | | 24,699,301 | | |
Columbia Contrarian Core Fund,
Class I (b) | | | 211,580 | | | | 3,182,166 | | |
Columbia Convertible Securities
Fund, Class I (b) | | | 262,687 | | | | 4,097,914 | | |
Columbia Corporate Income Fund,
Class I (b) | | | 1,572,517 | | | | 15,269,145 | | |
Columbia Dividend Income Fund,
Class I (b) | | | 325,141 | | | | 4,444,673 | | |
Columbia Dividend Opportunity
Fund, Class I (b) | | | 55,035 | | | | 457,340 | | |
Columbia Emerging Markets
Bond Fund, Class I (b) | | | 121,284 | | | | 1,365,657 | | |
Columbia Emerging Markets
Fund, Class I (b) | | | 375,811 | | | | 4,314,314 | | |
Columbia Energy and Natural
Resources Fund, Class I (b) | | | 266,564 | | | | 6,850,702 | | |
Columbia European Equity Fund,
Class I (b) | | | 153,832 | | | | 950,679 | | |
Columbia Income Opportunities
Fund, Class I (b) | | | 1,506,772 | | | | 14,660,892 | | |
Columbia International Bond
Fund, Class I (b) | | | 143,040 | | | | 1,587,739 | | |
Columbia International Value
Fund, Class I (b) | | | 45,708 | | | | 668,258 | | |
Columbia Large Cap Core Fund,
Class I (b) | | | 232,340 | | | | 3,194,673 | | |
Columbia Large Cap Growth
Fund, Class I (b) | | | 85,596 | | | | 2,175,005 | | |
Columbia Large Value
Quantitative Fund, Class I (b) | | | 180,856 | | | | 1,372,697 | | |
Columbia Marsico Focused
Equities Fund, Class I (b) | | | 56,384 | | | | 1,372,386 | | |
Columbia Marsico International
Opportunities Fund, Class I (b) | | | 56,147 | | | | 679,935 | | |
Columbia Mid Cap Growth Fund,
Class I (b) | | | 118,171 | | | | 3,443,492 | | |
Columbia Mid Cap Value Fund,
Class I (b) | | | 238,072 | | | | 3,430,611 | | |
Columbia Pacific/Asia Fund,
Class I (b) | | | 96,705 | | | | 832,626 | | |
Columbia Real Estate Equity
Fund, Class I (b) | | | 212,342 | | | | 2,762,568 | | |
Columbia Select Large Cap
Growth Fund, Class I (b) | | | 200,381 | | | | 2,755,243 | | |
| | | Shares | | Value ($) | |
Columbia Short Term Bond Fund,
Class I (b) | | | 867,189 | | | | 8,611,188 | | |
Columbia Small Cap Growth
Fund I, Class I (b) | | | 32,453 | | | | 1,142,991 | | |
Columbia Small Cap Value
Fund I, Class I (b) | | | 20,888 | | | | 1,034,567 | | |
Columbia Small Cap Value
Fund II, Class I (b) | | | 68,369 | | | | 1,032,365 | | |
Columbia U.S. Government
Mortgage Fund, Class I (b) | | | 427,561 | | | | 2,274,625 | | |
Columbia U.S. Treasury Index
Fund, Class I (b) | | | 173,756 | | | | 1,916,529 | | |
Mortgage- and Asset-Backed
Portfolio (b) | | | 1,023,179 | | | | 9,617,881 | | |
Total Investment Companies
(cost of $120,188,106) | | | 132,118,253 | | |
| Government Obligations – 3.1% | |
| | | Par ($) | | | |
| U.S. Government Obligations – 3.1% | |
U.S. Treasury Inflation Indexed Bonds
2.125% 02/15/40 | | | 81,499 | | | | 86,179 | | |
| 2.375% 01/15/25 | | | 566,543 | | | | 635,989 | | |
| 3.875% 04/15/29 | | | 535,764 | | | | 716,919 | | |
U.S. Treasury Inflation Indexed Notes
1.125% 01/15/21 | | | 135,887 | | | | 137,819 | | |
| 1.625% 01/15/15 | | | 478,557 | | | | 518,748 | | |
| 1.875% 07/15/13 | | | 317,701 | | | | 343,638 | | |
| 2.000% 01/15/14 | | | 381,334 | | | | 415,536 | | |
| 2.000% 01/15/16 | | | 321,723 | | | | 355,202 | | |
| 2.125% 01/15/19 | | | 369,205 | | | | 411,981 | | |
| 2.625% 07/15/17 | | | 265,600 | | | | 305,046 | | |
| 3.000% 07/15/12 | | | 208,187 | | | | 222,988 | | |
| U.S. Government Obligations Total | | | 4,150,045 | | |
Total Government Obligations
(cost of $3,992,628) | | | 4,150,045 | | |
Total Investments – 100.3%
(cost of $124,180,734) (c) | | | 136,268,298 | | |
| Other Assets & Liabilities, Net – (0.3)% | | | (361,832 | ) | |
| Net Assets – 100.0% | | | 135,906,466 | | |
Notes to Investment Portfolio:
(a) As of May 1, 2010, this security was no longer an affiliate of the Portfolio.
(b) Mutual funds registered under the Investment Company Act of 1940, as amended, and advised by Columbia Management Investment Advisers, LLC or one of its affiliates.
(c) Cost for federal income tax purposes is $127,391,681.
See Accompanying Notes to Financial Statements.
27
Columbia LifeGoal Income and Growth Portfolio
March 31, 2011
Generally accepted accounting principles (GAAP) require disclosure regarding the inputs and valuation techniques used to measure fair value and any changes in valuation inputs or techniques. In addition, investments shall be disclosed by major category.
The Portfolio categorizes its fair value measurements according to a three-level hierarchy that maximizes the use of observable inputs and minimizes the use of unobservable inputs by prioritizing that the most observable input be used when available. Observable inputs are those that market participants would use in pricing an investment based on market data obtained from sources independent of the reporting entity. Unobservable inputs are those that reflect the Portfolio's assumptions about the information market participants would use in pricing an investment. An investment's level within the fair value hierarchy is based on the lowest level of any input that is deemed significant to the asset or liability's fair value measurement. The input levels are not necessarily an indication of the risk or liquidity associated with investments at that level. For example, certain U.S. government securities are generally high quality and liquid, however, they are reflected as Level 2 because the inputs used to determine fair value may not always be quoted prices in an active market.
Fair value inputs are summarized in the three broad levels listed below:
• Level 1—Valuations based on quoted prices for investments in active markets that the Portfolio has the ability to access at the measurement date (including NAV for open-end mutual funds). Valuation adjustments are not applied to Level 1 investments.
• Level 2—Valuations based on other significant observable inputs (including quoted prices for similar securities, interest rates, prepayment speeds, credit risks, etc.).
• Level 3—Valuations based on significant unobservable inputs (including the Portfolio's own assumptions and judgment in determining the fair value of investments).
Inputs that are used in determining fair value of an investment may include price information, credit data, volatility statistics, and other factors. These inputs can be either observable or unobservable. The availability of observable inputs can vary between investments, and is affected by various factors such as the type of investment, and the volume and level of activity for that investment or similar investments in the marketplace. The inputs will be considered by the Investment Manager, along with any other relevant factors in the calculation of an investment's fair value. The Portfolio uses prices and inputs that are current as of the measurement date, which may include periods of market dislocations. During these periods, the availability of prices and inputs may be reduced for many investments. This condition could cause an investment to be reclassified between the various levels within the hierarchy. Non-U.S. equity securities actively traded in foreign markets may be reflected in Level 2 despite the availability of closing prices, because the Portfolio evaluates and determines whether those closing prices reflect fair value at the close of the New York Stock Exchange (NYSE) or require adjustment, as described in Note 2 to the financial statements—Security Valuation.
Investments falling into the Level 3 category are primarily supported by quoted prices from brokers and dealers participating in the market for those investments. However, these may be classified as Level 3 investments due to lack of market transparency and corroboration to support these quoted prices. Additionally, valuation models may be used as the pricing source for any remaining investments classified as Level 3. These models rely on one or more significant unobservable inputs and/or significant assumptions by the Investment Manager. Inputs used in valuations may include, but are not limited to, financial statement analysis, capital account balances, discount rates and estimated cash flows, and comparable company data.
The following table is a summary of the inputs used to value the Portfolio's investments as of March 31, 2011:
| Description | | Quoted
Prices
(Level 1) | | Other
Significant
Observable
Inputs
(Level 2) | | Significant
Unobservable
Inputs
(Level 3) | | Total | |
Total Investment
Companies | | $ | 132,118,253 | | | $ | — | | | $ | — | | | $ | 132,118,253 | | |
Total Government
Obligations | | | 4,150,045 | | | | — | | | | — | | | | 4,150,045 | | |
| Total Investments | | $ | 136,268,298 | | | $ | — | | | $ | — | | | $ | 136,268,298 | | |
There were no significant transfers of financial assets between Levels 1 and 2 during the period.
See Accompanying Notes to Financial Statements.
28
Investment Portfolio – Columbia LifeGoal Income Portfolio
March 31, 2011
| Investment Companies – 95.1% | |
| | | Shares | | Value ($) | |
BofA Cash Reserves, Capital Class
Shares (a) | | | 539,496 | | | | 539,496 | | |
| Columbia Bond Fund, Class I (b) | | | 677,066 | | | | 6,262,861 | | |
Columbia Convertible Securities
Fund, Class I (b) | | | 86,415 | | | | 1,348,069 | | |
Columbia Corporate Income Fund,
Class I (b) | | | 404,310 | | | | 3,925,853 | | |
Columbia Dividend Income Fund,
Class I (b) | | | 91,273 | | | | 1,247,706 | | |
Columbia Dividend Opportunity
Fund, Class I (b) | | | 10,843 | | | | 90,107 | | |
Columbia Emerging Markets Bond
Fund, Class I (b) | | | 31,983 | | | | 360,128 | | |
Columbia Energy and Natural
Resources Fund, Class I (b) | | | 31,181 | | | | 801,349 | | |
Columbia European Equity Fund,
Class I (b) | | | 85,342 | | | | 527,414 | | |
Columbia Income Opportunities
Fund, Class I (b) | | | 340,314 | | | | 3,311,255 | | |
Columbia International Bond Fund,
Class I (b) | | | 36,454 | | | | 404,635 | | |
Columbia Mid Cap Value Fund,
Class I (b) | | | — | (c) | | | 1 | | |
Columbia Real Estate Equity Fund,
Class I (b) | | | 39,309 | | | | 511,408 | | |
Columbia Short Term Bond Fund,
Class I (b) | | | 208,465 | | | | 2,070,053 | | |
Columbia Small Cap Value Fund I,
Class I (b) | | | 2,719 | | | | 134,695 | | |
Columbia Small Cap Value Fund II,
Class I (b) | | | 8,953 | | | | 135,191 | | |
Columbia U.S. Government
Mortgage Fund, Class I (b) | | | 110,006 | | | | 585,232 | | |
Columbia U.S. Treasury Index
Fund, Class I (b) | | | 60,999 | | | | 672,820 | | |
Mortgage- and Asset-Backed
Portfolio (b) | | | 277,645 | | | | 2,609,858 | | |
Total Investment Companies
(cost of $23,815,902) | | | 25,538,131 | | |
| Government Obligations – 5.2% | |
| | | Par ($) | | | |
| U.S. Government Obligations – 5.2% | |
U.S. Treasury Inflation Indexed Bonds
2.125% 02/15/40 | | | 35,656 | | | | 37,703 | | |
| 2.375% 01/15/25 | | | 198,582 | | | | 222,924 | | |
| 3.875% 04/15/29 | | | 174,123 | | | | 232,999 | | |
| | | Par ($) | | Value ($) | |
U.S. Treasury Inflation Indexed Notes
1.625% 01/15/15 | | | 167,207 | | | | 181,249 | | |
| 1.875% 07/15/13 | | | 101,904 | | | | 110,223 | | |
| 2.000% 01/15/14 | | | 131,084 | | | | 142,840 | | |
| 2.000% 01/15/16 | | | 116,486 | | | | 128,608 | | |
| 2.125% 01/15/19 | | | 133,324 | | | | 148,771 | | |
| 2.625% 07/15/17 | | | 95,616 | | | | 109,818 | | |
| 3.000% 07/15/12 | | | 73,478 | | | | 78,702 | | |
| U.S. Government Obligations Total | | | 1,393,837 | | |
Total Government Obligations
(cost of $1,340,347) | | | 1,393,837 | | |
Total Investments – 100.3%
(cost of $25,156,249) (d) | | | 26,931,968 | | |
| Other Assets & Liabilities, Net – (0.3)% | | | (85,339 | ) | |
| Net Assets – 100.0% | | | 26,846,629 | | |
Notes to Investment Portfolio:
(a) As of May 1, 2010, this security was no longer an affiliate of the Portfolio.
(b) Mutual funds registered under the Investment Company Act of 1940, as amended, and advised by Columbia Management Investment Advisers, LLC or one of its affiliates.
(c) Fraction of a share.
(d) Cost for federal income tax purposes is $26,275,949.
Generally accepted accounting principles (GAAP) require disclosure regarding the inputs and valuation techniques used to measure fair value and any changes in valuation inputs or techniques. In addition, investments shall be disclosed by major category.
The Portfolio categorizes its fair value measurements according to a three-level hierarchy that maximizes the use of observable inputs and minimizes the use of unobservable inputs by prioritizing that the most observable input be used when available. Observable inputs are those that market participants would use in pricing an investment based on market data obtained from sources independent of the reporting entity. Unobservable inputs are those that reflect the Portfolio's assumptions about the information market participants would use in pricing an investment. An investment's level within the fair value hierarchy is based on the lowest level of any input that is deemed significant to the asset or liability's fair value measurement. The input levels are not necessarily an indication of the risk or liquidity associated with investments at that level. For example, certain U.S. government securities are generally high quality and liquid, however, they are reflected as Level 2 because the inputs used to determine fair value may not always be quoted prices in an active market.
Fair value inputs are summarized in the three broad levels listed below:
• Level 1—Valuations based on quoted prices for investments in active markets that the Portfolio has the ability to access at the measurement date (including NAV for open-end mutual funds). Valuation adjustments are not applied to Level 1 investments.
• Level 2—Valuations based on other significant observable inputs (including quoted prices for similar securities, interest rates, prepayment speeds, credit risks, etc.).
• Level 3—Valuations based on significant unobservable inputs (including the Portfolio's own assumptions and judgment in determining the fair value of investments).
See Accompanying Notes to Financial Statements.
29
Columbia LifeGoal Income Portfolio
March 31, 2011
Inputs that are used in determining fair value of an investment may include price information, credit data, volatility statistics, and other factors. These inputs can be either observable or unobservable. The availability of observable inputs can vary between investments, and is affected by various factors such as the type of investment, and the volume and level of activity for that investment or similar investments in the marketplace. The inputs will be considered by the Investment Manager, along with any other relevant factors in the calculation of an investment's fair value. The Portfolio uses prices and inputs that are current as of the measurement date, which may include periods of market dislocations. During these periods, the availability of prices and inputs may be reduced for many investments. This condition could cause an investment to be reclassified between the various levels within the hierarchy. Non-U.S. equity securities actively traded in foreign markets may be reflected in Level 2 despite the availability of closing prices, because the Portfolio evaluates and determines whether those closing prices reflect fair value at the close of the New York Stock Exchange (NYSE) or require adjustment, as described in Note 2 to the financial statements—Security Valuation.
Investments falling into the Level 3 category are primarily supported by quoted prices from brokers and dealers participating in the market for those investments. However, these may be classified as Level 3 investments due to lack of market transparency and corroboration to support these quoted prices. Additionally, valuation models may be used as the pricing source for any remaining investments classified as Level 3. These models rely on one or more significant unobservable inputs and/or significant assumptions by the Investment Manager. Inputs used in valuations may include, but are not limited to, financial statement analysis, capital account balances, discount rates and estimated cash flows, and comparable company data.
The following table is a summary of the inputs used to value the Portfolio's investments as of March 31, 2011:
| Description | | Quoted
Prices
(Level 1) | | Other
Significant
Observable
Inputs
(Level 2) | | Significant
Unobservable
Inputs
(Level 3) | | Total | |
Total Investment
Companies | | $ | 25,538,131 | | | $ | — | | | $ | — | | | $ | 25,538,131 | | |
Total Government
Obligations | | | 1,393,837 | | | | — | | | | — | | | | 1,393,837 | | |
| Total Investments | | $ | 26,931,968 | | | $ | — | | | $ | — | | | $ | 26,931,968 | | |
There were no significant transfers of financial assets between Levels 1 and 2 during the period.
See Accompanying Notes to Financial Statements.
30
Statements of Assets and Liabilities – Columbia LifeGoal Portfolios
March 31, 2011
| | | ($) | | ($) | | ($) | | ($) | |
| | | Columbia
LifeGoal
Growth
Portfolio | | Columbia
LifeGoal
Balanced
Growth
Portfolio | | Columbia
LifeGoal
Income and
Growth
Portfolio | | Columbia
LifeGoal
Income
Portfolio | |
| Assets | |
| Affiliated investments, at identified cost | | | 321,777,645 | | | | 474,726,843 | | | | 119,510,055 | | | | 23,276,406 | | |
| Unaffiliated investments, at identified cost | | | — | | | | 11,255,488 | | | | 4,670,679 | | | | 1,879,843 | | |
| Total investments, at identified cost | | | 321,777,645 | | | | 485,982,331 | | | | 124,180,734 | | | | 25,156,249 | | |
| Affiliated investments, at value | | | 403,519,463 | | | | 564,621,913 | | | | 131,440,202 | | | | 24,998,635 | | |
| Unaffiliated investments, at value | | | — | | | | 11,562,861 | | | | 4,828,096 | | | | 1,933,333 | | |
| Total investments, at value | | | 403,519,463 | | | | 576,184,774 | | | | 136,268,298 | | | | 26,931,968 | | |
| Cash | | | — | | | | 34,905 | | | | 41,986 | | | | 19,209 | | |
| Receivable for: | |
| Investments sold | | | 101,288 | | | | 711,555 | | | | — | | | | 88,277 | | |
| Portfolio shares sold | | | 360,085 | | | | 504,731 | | | | 150,956 | | | | 3,556 | | |
| Interest | | | — | | | | 49,819 | | | | 23,200 | | | | 7,794 | | |
| Expense reimbursement due from Investment Manager | | | — | | | | — | | | | — | | | | 22,103 | | |
| Prepaid expenses | | | — | | | | — | | | | — | | | | 19 | | |
| Total Assets | | | 403,980,836 | | | | 577,485,784 | | | | 136,484,440 | | | | 27,072,926 | | |
| Liabilities | |
| Payable for: | |
| Investments purchased | | | — | | | | — | | | | 24,367 | | | | — | | |
| Portfolio shares repurchased | | | 1,086,199 | | | | 1,701,163 | | | | 468,376 | | | | 106,106 | | |
| Investment advisory fee | | | 84,249 | | | | 121,678 | | | | 28,845 | | | | 1,953 | | |
| Administration fee | | | — | | | | — | | | | — | | | | 831 | | |
| Pricing and bookkeeping fees | | | — | | | | — | | | | — | | | | 2,194 | | |
| Transfer agent fee | | | — | | | | — | | | | — | | | | 11,837 | | |
| Trustees' fees | | | — | | | | — | | | | — | | | | 41,894 | | |
| Audit fee | | | — | | | | — | | | | — | | | | 21,201 | | |
| Legal fee | | | — | | | | — | | | | — | | | | 24,097 | | |
| Custody fee | | | — | | | | — | | | | — | | | | 596 | | |
| Distribution and service fees | | | 165,007 | | | | 254,539 | | | | 56,386 | | | | 11,789 | | |
| Plan administration services fee—Class R4 | | | — | * | | | — | | | | — | | | | — | | |
| Chief compliance officer expenses | | | — | | | | — | | | | — | | | | 203 | | |
| Merger costs | | | 21,151 | | | | — | | | | — | | | | — | | |
| Other liabilities | | | — | | | | — | | | | — | | | | 3,596 | | |
| Total Liabilities | | | 1,356,606 | | | | 2,077,380 | | | | 577,974 | | | | 226,297 | | |
| Net Assets | | | 402,624,230 | | | | 575,408,404 | | | | 135,906,466 | | | | 26,846,629 | | |
| Net Assets Consist of | |
| Paid-in capital | | | 406,537,561 | | | | 547,362,601 | | | | 132,791,489 | | | | 27,024,984 | | |
| Undistributed net investment income | | | 180,416 | | | | 328,801 | | | | 134,174 | | | | 34,279 | | |
| Accumulated net realized loss | | | (85,835,565 | ) | | | (62,485,441 | ) | | | (9,106,761 | ) | | | (1,988,353 | ) | |
| Net unrealized appreciation (depreciation) on investments | | | 81,741,818 | | | | 90,202,443 | | | | 12,087,564 | | | | 1,775,719 | | |
| Net Assets | | | 402,624,230 | | | | 575,408,404 | | | | 135,906,466 | | | | 26,846,629 | | |
* Rounds to less than $1.00.
See Accompanying Notes to Financial Statements.
31
Statements of Assets and Liabilities – Columbia LifeGoal Portfolios
March 31, 2011 (continued)
| | | Columbia
LifeGoal
Growth
Portfolio | | Columbia
LifeGoal
Balanced
Growth
Portfolio | | Columbia
LifeGoal
Income and
Growth
Portfolio | | Columbia
LifeGoal
Income
Portfolio | |
| Class A | |
| Net assets | | $ | 201,436,888 | | | $ | 291,757,852 | | | $ | 63,807,198 | | | $ | 13,213,893 | | |
| Shares outstanding | | | 16,444,771 | | | | 25,129,273 | | | | 5,859,661 | | | | 1,282,101 | | |
| Net asset value and redemption price per share (a) | | $ | 12.25 | | | $ | 11.61 | | | $ | 10.89 | | | $ | 10.31 | | |
| Maximum sales charge | | | 5.75 | % | | | 5.75 | % | | | 5.75 | % | | | 3.25 | % | |
| Maximum offering price per share | | $ | 13.00 | (b) | | $ | 12.32 | (b) | | $ | 11.55 | (b) | | $ | 10.66 | (c) | |
| Class B | |
| Net assets | | $ | 74,402,889 | | | $ | 133,770,273 | | | $ | 26,181,102 | | | $ | 5,242,115 | | |
| Shares outstanding | | | 6,640,061 | | | | 11,602,642 | | | | 2,413,374 | | | | 509,333 | | |
| Net asset value and offering price per share (a) | | $ | 11.21 | | | $ | 11.53 | | | $ | 10.85 | | | $ | 10.29 | | |
| Class C | |
| Net assets | | $ | 70,437,409 | | | $ | 91,555,711 | | | $ | 23,651,118 | | | $ | 5,294,353 | | |
| Shares outstanding | | | 6,339,024 | | | | 7,840,899 | | | | 2,194,038 | | | | 515,152 | | |
| Net asset value and offering price per share (a) | | $ | 11.11 | | | $ | 11.68 | | | $ | 10.78 | | | $ | 10.28 | | |
| Class R | |
| Net assets | | $ | 1,462,661 | | | $ | 1,517,038 | | | $ | 428,276 | | | | — | | |
| Shares outstanding | | | 120,458 | | | | 130,773 | | | | 39,302 | | | | — | | |
| Net asset value and offering price per share | | $ | 12.14 | | | $ | 11.60 | | | $ | 10.90 | | | | — | | |
| Class R4 (d) | |
| Net assets | | $ | 2,538 | | | | — | | | | — | | | | — | | |
| Shares outstanding | | | 204 | | | | — | | | | — | | | | — | | |
| Net asset value and offering price per share | | $ | 12.45 | (e) | | | — | | | | — | | | | — | | |
| Class T (d) | |
| Net assets | | | — | | | $ | 2,526 | | | | — | | | | — | | |
| Shares outstanding | | | — | | | | 218 | | | | — | | | | — | | |
| Net asset value and redemption price per share (a) | | | — | | | $ | 11.61 | (e) | | | — | | | | — | | |
| Maximum sales charge | | | — | | | | 5.75 | % | | | — | | | | — | | |
| Maximum offering price per share | | | — | | | $ | 12.32 | | | | — | | | | — | | |
| Class Z | |
| Net assets | | $ | 54,881,845 | | | $ | 56,805,004 | | | $ | 21,838,772 | | | $ | 3,096,268 | | |
| Shares outstanding | | | 4,407,181 | | | | 4,898,464 | | | | 2,025,683 | | | | 300,330 | | |
| Net asset value and offering price per share | | $ | 12.45 | | | $ | 11.60 | | | $ | 10.78 | | | $ | 10.31 | | |
(a) Redemption price per share is equal to net asset value less any applicable contingent deferred sales charge.
(b) On sales of $50,000 or more the offering price is reduced.
(c) On sales of $100,000 or more the offering price is reduced.
(d) Class R4 and Class T shares commenced operations on March 7, 2011.
(e) Net asset value rounds to this amount per share due to fractional shares outstanding.
See Accompanying Notes to Financial Statements.
32
Statements of Operations – Columbia LifeGoal Portfolios
For the Year Ended March 31, 2011
| | | ($) | | ($) | | ($) | | ($) | |
| | | Columbia
LifeGoal
Growth
Portfolio(a) | | Columbia
LifeGoal
Balanced
Growth
Portfolio(b) | | Columbia
LifeGoal
Income and
Growth
Portfolio | | Columbia
LifeGoal
Income
Portfolio | |
| Investment Income | |
| Dividends from affiliates | | | 4,565,269 | | | | 12,255,227 | | | | 4,036,742 | | | | 983,931 | | |
| Dividends | | | 39,407 | | | | 62,826 | | | | 15,864 | | | | 729 | | |
| Interest | | | — | | | | 237,505 | | | | 108,224 | | | | 33,650 | | |
| Total Investment Income | | | 4,604,676 | | | | 12,555,558 | | | | 4,160,830 | | | | 1,018,310 | | |
| Expenses | |
| Investment advisory fee | | | 939,753 | | | | 1,395,306 | | | | 345,101 | | | | 17,230 | | |
| Administration fee | | | — | | | | — | | | | — | | | | 34,111 | | |
| Distribution and service fees: | |
| Class A | | | 451,913 | | | | 647,058 | | | | 149,635 | | | | 33,878 | | |
| Distribution fee: | |
| Class B | | | 599,244 | | | | 1,159,439 | | | | 249,923 | | | | 46,023 | | |
| Class C | | | 492,500 | | | | 651,082 | | | | 174,555 | | | | 38,526 | | |
| Class R | | | 8,305 | | | | 10,170 | | | | 2,617 | | | | — | | |
| Service fee: | |
| Class B | | | 199,748 | | | | 386,480 | | | | 83,308 | | | | 15,341 | | |
| Class C | | | 164,167 | | | | 217,027 | | | | 58,185 | | | | 12,842 | | |
| Shareholder services fee: | |
| Class T | | | — | | | | — | * | | | — | | | | — | | |
| Plan administration services fee—Class R4 | | | — | * | | | — | | | | — | | | | — | | |
| Transfer agent fee | | | — | | | | — | | | | — | | | | 42,871 | | |
| Pricing and bookkeeping fees | | | — | | | | — | | | | — | | | | 26,348 | | |
| Trustees' fees | | | — | | | | — | | | | — | | | | 27,853 | | |
| Custody fee | | | — | | | | — | | | | — | | | | 5,381 | | |
| Registration fees | | | — | | | | — | | | | — | | | | 47,904 | | |
| Audit fee | | | — | | | | — | | | | — | | | | 25,929 | | |
| Legal fees | | | — | | | | — | | | | — | | | | 37,329 | | |
| Chief compliance officer expenses | | | — | | | | — | | | | — | | | | 1,006 | | |
| Merger costs | | | 36,257 | | | | — | | | | — | | | | — | | |
| Other expenses | | | — | | | | — | | | | — | | | | 14,634 | | |
| Expenses before interest expense | | | 2,891,887 | | | | 4,466,562 | | | | 1,063,324 | | | | 427,206 | | |
| Interest expense | | | — | | | | 83 | | | | — | | | | — | | |
| Total Expenses | | | 2,891,887 | | | | 4,466,645 | | | | 1,063,324 | | | | 427,206 | | |
Fees waived or expenses reimbursed by Investment Manager
and/or administrator | | | — | | | | — | | | | — | | | | (161,666 | ) | |
| Net Expenses | | | 2,891,887 | | | | 4,466,645 | | | | 1,063,324 | | | | 265,540 | | |
| Net Investment Income | | | 1,712,789 | | | | 8,088,913 | | | | 3,097,506 | | | | 752,770 | | |
(a) Class R4 shares commenced operations on March 7, 2011.
(b) Class T shares commenced operations on March 7, 2011.
* Rounds to less than $1.00.
See Accompanying Notes to Financial Statements.
33
Statements of Operations (continued) – Columbia LifeGoal Portfolios
For the Year Ended March 31, 2011
| | | ($) | | ($) | | ($) | | ($) | |
| | | Columbia
LifeGoal
Growth
Portfolio(a) | | Columbia
LifeGoal
Balanced
Growth
Portfolio(b) | | Columbia
LifeGoal
Income and
Growth
Portfolio | | Columbia
LifeGoal
Income
Portfolio | |
Net Realized and Unrealized Gain (Loss) on Investments and
Capital Gains Distributions Received | |
| Net realized gain (loss) on: | |
| Affiliated investments | | | 939,932 | | | | 30,868,293 | | | | 9,770,359 | | | | 1,459,165 | | |
| Unaffiliated investments | | | (140,002 | ) | | | (99,979 | ) | | | (23,695 | ) | | | 4,811 | | |
| Capital gains distributions received from affiliates | | | 3,120,734 | | | | 3,244,910 | | | | 665,096 | | | | 20,145 | | |
| Net realized gain | | | 3,920,664 | | | | 34,013,224 | | | | 10,411,760 | | | | 1,484,121 | | |
Net change in unrealized appreciation (depreciation)
on investments | | | 59,201,605 | | | | 35,185,237 | | | | 518,350 | | | | (384,859 | ) | |
| Net Gain | | | 63,122,269 | | | | 69,198,461 | | | | 10,930,110 | | | | 1,099,262 | | |
| Net Increase Resulting from Operations | | | 64,835,058 | | | | 77,287,374 | | | | 14,027,616 | | | | 1,852,032 | | |
See Accompanying Notes to Financial Statements.
34
This page intentionally left blank.
Statements of Changes in Net Assets – Columbia LifeGoal Portfolios
| Increase (Decrease) in Net Assets | | Columbia
LifeGoal Growth Portfolio | | Columbia
LifeGoal Balanced Growth Portfolio | |
| | | Year Ended March 31, | | Year Ended March 31, | |
| | | 2011 ($)(a)(b) | | 2010 ($) | | 2011 ($)(c)(d) | | 2010 ($) | |
| Operations | |
| Net investment income | | | 1,712,789 | | | | 849,551 | | | | 8,088,913 | | | | 11,354,374 | | |
| Net realized gain (loss) on investments and capital gains distributions received | | | 3,920,664 | | | | (15,019,054 | ) | | | 34,013,224 | | | | (22,053,973 | ) | |
| Net change in unrealized appreciation (depreciation) on investments | | | 59,201,605 | | | | 158,467,291 | | | | 35,185,237 | | | | 191,543,831 | | |
| Net increase resulting from operations | | | 64,835,058 | | | | 144,297,788 | | | | 77,287,374 | | | | 180,844,232 | | |
| Distributions to Shareholders | |
| From net investment income: | |
| Class A | | | (1,169,632 | ) | | | (354,759 | ) | | | (4,512,130 | ) | | | (5,327,779 | ) | |
| Class B | | | (135,848 | ) | | | (72,537 | ) | | | (1,529,833 | ) | | | (3,029,203 | ) | |
| Class C | | | (124,109 | ) | | | (49,902 | ) | | | (857,409 | ) | | | (1,330,248 | ) | |
| Class R | | | (6,818 | ) | | | (2,306 | ) | | | (31,530 | ) | | | (37,238 | ) | |
| Class R4 | | | (8 | ) | | | — | | | | — | | | | — | | |
| Class T | | | — | | | | — | | | | (6 | ) | | | — | | |
| Class Z | | | (398,565 | ) | | | (102,921 | ) | | | (1,130,790 | ) | | | (1,522,123 | ) | |
| Total distributions to shareholders | | | (1,834,980 | ) | | | (582,425 | ) | | | (8,061,698 | ) | | | (11,246,591 | ) | |
| Net Capital Stock Transactions | | | (52,207,149 | ) | | | (22,899,343 | ) | | | (74,373,436 | ) | | | (26,500,404 | ) | |
| Increase from regulatory settlements | | | — | | | | 7,713 | | | | — | | | | — | | |
| Total increase (decrease) in net assets | | | 10,792,929 | | | | 120,823,733 | | | | (5,147,760 | ) | | | 143,097,237 | | |
| Net Assets | |
| Beginning of period | | | 391,831,301 | | | | 271,007,568 | | | | 580,556,164 | | | | 437,458,927 | | |
| End of period | | | 402,624,230 | | | | 391,831,301 | | | | 575,408,404 | | | | 580,556,164 | | |
| Undistributed net investment income at end of period | | | 180,416 | | | | 274,839 | | | | 328,801 | | | | 279,115 | | |
(a) Class R4 shares commenced operations on March 7, 2011.
(b) Class R4 shares reflect activity for the period March 7, 2011 through March 31, 2011.
(c) Class T shares commenced operations on March 7, 2011.
(d) Class T shares reflect activity for the period March 7, 2011 through March 31, 2011.
See Accompanying Notes to Financial Statements.
36
| Increase (Decrease) in Net Assets | | Columbia
LifeGoal Income and Growth Portfolio | | Columbia
LifeGoal Income Portfolio | |
| | | Year Ended March 31, | | Year Ended March 31, | |
| | | 2011 ($) | | 2010 ($) | | 2011 ($) | | 2010 ($) | |
| Operations | |
| Net investment income | | | 3,097,506 | | | | 4,079,078 | | | | 752,770 | | | | 1,076,274 | | |
| Net realized gain (loss) on investments and capital gains distributions received | | | 10,411,760 | | | | (1,712,275 | ) | | | 1,484,121 | | | | (514,103 | ) | |
| Net change in unrealized appreciation (depreciation) on investments | | | 518,350 | | | | 31,464,277 | | | | (384,859 | ) | | | 4,929,754 | | |
| Net increase resulting from operations | | | 14,027,616 | | | | 33,831,080 | | | | 1,852,032 | | | | 5,491,925 | | |
| Distributions to Shareholders | |
| From net investment income: | |
| Class A | | | (1,484,710 | ) | | | (1,774,246 | ) | | | (392,912 | ) | | | (500,449 | ) | |
| Class B | | | (565,960 | ) | | | (1,045,055 | ) | | | (131,848 | ) | | | (224,860 | ) | |
| Class C | | | (411,751 | ) | | | (542,321 | ) | | | (110,683 | ) | | | (164,769 | ) | |
| Class R | | | (12,309 | ) | | | (14,094 | ) | | | — | | | | — | | |
| Class R4 | | | — | | | | — | | | | — | | | | — | | |
| Class T | | | — | | | | — | | | | — | | | | — | | |
| Class Z | | | (582,134 | ) | | | (647,227 | ) | | | (110,974 | ) | | | (176,430 | ) | |
| Total distributions to shareholders | | | (3,056,864 | ) | | | (4,022,943 | ) | | | (746,417 | ) | | | (1,066,508 | ) | |
| Net Capital Stock Transactions | | | (20,706,161 | ) | | | (4,264,005 | ) | | | (4,776,128 | ) | | | (2,232,566 | ) | |
| Increase from regulatory settlements | | | — | | | | — | | | | — | | | | — | | |
| Total increase (decrease) in net assets | | | (9,735,409 | ) | | | 25,544,132 | | | | (3,670,513 | ) | | | 2,192,851 | | |
| Net Assets | |
| Beginning of period | | | 145,641,875 | | | | 120,097,743 | | | | 30,517,142 | | | | 28,324,291 | | |
| End of period | | | 135,906,466 | | | | 145,641,875 | | | | 26,846,629 | | | | 30,517,142 | | |
| Undistributed net investment income at end of period | | | 134,174 | | | | 74,079 | | | | 34,279 | | | | 22,128 | | |
See Accompanying Notes to Financial Statements.
37
Statements of Changes in Net Assets – Capital Stock Activity
| | | Columbia LifeGoal Growth Portfolio | |
| | | Year Ended
March 31, 2011(a)(b) | | Year Ended
March 31, 2010 | |
| | | Shares | | Dollars ($) | | Shares | | Dollars ($) | |
| Class A | |
| Subscriptions | | | 2,942,148 | | | | 32,004,906 | | | | 3,091,308 | | | | 27,588,415 | | |
| Distributions reinvested | | | 60,451 | | | | 628,610 | | | | 43,067 | | | | 335,160 | | |
| Redemptions | | | (3,866,896 | ) | | | (41,412,779 | ) | | | (3,207,836 | ) | | | (29,248,812 | ) | |
| Net increase (decrease) | | | (864,297 | ) | | | (8,779,263 | ) | | | (73,461 | ) | | | (1,325,237 | ) | |
| Class B | |
| Subscriptions | | | 68,216 | | | | 691,508 | | | | 300,175 | | | | 2,294,384 | | |
| Distributions reinvested | | | 5,672 | | | | 55,098 | | | | 9,589 | | | | 68,850 | | |
| Redemptions | | | (3,111,479 | ) | | | (30,764,657 | ) | | | (2,663,286 | ) | | | (21,979,706 | ) | |
| Net decrease | | | (3,037,591 | ) | | | (30,018,051 | ) | | | (2,353,522 | ) | | | (19,616,472 | ) | |
| Class C | |
| Subscriptions | | | 716,653 | | | | 7,079,074 | | | | 961,091 | | | | 7,928,734 | | |
| Distributions reinvested | | | 6,456 | | | | 65,447 | | | | 5,627 | | | | 40,063 | | |
| Redemptions | | | (1,636,359 | ) | | | (15,900,649 | ) | | | (1,945,856 | ) | | | (15,923,996 | ) | |
| Net decrease | | | (913,250 | ) | | | (8,756,128 | ) | | | (979,138 | ) | | | (7,955,199 | ) | |
| Class R | |
| Subscriptions | | | 59,234 | | | | 614,043 | | | | 59,693 | | | | 489,491 | | |
| Distributions reinvested | | | 634 | | | | 6,814 | | | | 298 | | | | 2,306 | | |
| Redemptions | | | (94,211 | ) | | | (1,066,410 | ) | | | (30,267 | ) | | | (272,508 | ) | |
| Net increase (decrease) | | | (34,343 | ) | | | (445,553 | ) | | | 29,724 | | | | 219,289 | | |
| Class R4 | |
| Subscriptions | | | 204 | | | | 2,500 | | | | — | | | | — | | |
| Net increase | | | 204 | | | | 2,500 | | | | — | | | | — | | |
| Class T | |
| Subscriptions | | | — | | | | — | | | | — | | | | — | | |
| Net increase | | | — | | | | — | | | | — | | | | — | | |
| Class Z | |
| Subscriptions | | | 1,269,960 | | | | 14,082,120 | | | | 1,752,025 | | | | 16,262,948 | | |
| Distributions reinvested | | | 8,249 | | | | 90,214 | | | | 7,159 | | | | 56,483 | | |
| Redemptions | | | (1,792,037 | ) | | | (18,382,988 | ) | | | (1,187,216 | ) | | | (10,541,155 | ) | |
| Net increase (decrease) | | | (513,828 | ) | | | (4,210,654 | ) | | | 571,968 | | | | 5,778,276 | | |
(a) Class R4 shares commenced operations on March 7, 2011.
(b) Class R4 shares reflect activity for the period March 7, 2011 through March 31, 2011.
(c) Class T shares commenced operations on March 7, 2011.
(d) Class T shares reflect activity for the period March 7, 2011 through March 31, 2011.
See Accompanying Notes to Financial Statements.
38
| | | Columbia LifeGoal Balanced Growth Portfolio | |
| | | Year Ended
March 31, 2011(c)(d) | | Year Ended
March 31, 2010 | |
| | | Shares | | Dollars ($) | | Shares | | Dollars ($) | |
| Class A | |
| Subscriptions | | | 6,541,121 | | | | 69,860,832 | | | | 4,803,386 | | | | 44,609,724 | | |
| Distributions reinvested | | | 215,592 | | | | 2,209,949 | | | | 532,093 | | | | 4,997,088 | | |
| Redemptions | | | (5,615,106 | ) | | | (59,795,287 | ) | | | (4,546,857 | ) | | | (42,351,740 | ) | |
| Net increase (decrease) | | | 1,141,607 | | | | 12,275,494 | | | | 788,622 | | | | 7,255,072 | | |
| Class B | |
| Subscriptions | | | 213,510 | | | | 2,293,757 | | | | 589,083 | | | | 5,178,715 | | |
| Distributions reinvested | | | 72,300 | | | | 715,651 | | | | 310,682 | | | | 2,872,923 | | |
| Redemptions | | | (6,505,211 | ) | | | (68,380,032 | ) | | | (4,573,702 | ) | | | (41,976,618 | ) | |
| Net decrease | | | (6,219,401 | ) | | | (65,370,624 | ) | | | (3,673,937 | ) | | | (33,924,980 | ) | |
| Class C | |
| Subscriptions | | | 966,168 | | | | 10,322,022 | | | | 1,437,027 | | | | 13,435,382 | | |
| Distributions reinvested | | | 43,487 | | | | 447,942 | | | | 115,164 | | | | 1,082,100 | | |
| Redemptions | | | (1,674,694 | ) | | | (17,771,209 | ) | | | (1,846,000 | ) | | | (17,014,082 | ) | |
| Net decrease | | | (665,039 | ) | | | (7,001,245 | ) | | | (293,809 | ) | | | (2,496,600 | ) | |
| Class R | |
| Subscriptions | | | 116,201 | | | | 1,182,795 | | | | 60,150 | | | | 539,862 | | |
| Distributions reinvested | | | 2,990 | | | | 31,530 | | | | 4,033 | | | | 37,237 | | |
| Redemptions | | | (158,727 | ) | | | (1,747,133 | ) | | | (121,078 | ) | | | (1,160,141 | ) | |
| Net increase (decrease) | | | (39,536 | ) | | | (532,808 | ) | | | (56,895 | ) | | | (583,042 | ) | |
| Class R4 | |
| Subscriptions | | | — | | | | — | | | | — | | | | — | | |
| Net increase | | | — | | | | — | | | | — | | | | — | | |
| Class T | |
| Subscriptions | | | 218 | | | | 2,500 | | | | — | | | | — | | |
| Net increase | | | 218 | | | | 2,500 | | | | — | | | | — | | |
| Class Z | |
| Subscriptions | | | 1,292,743 | | | | 13,769,633 | | | | 1,506,119 | | | | 13,977,974 | | |
| Distributions reinvested | | | 40,312 | | | | 424,948 | | | | 114,054 | | | | 1,061,854 | | |
| Redemptions | | | (2,794,570 | ) | | | (27,941,334 | ) | | | (1,268,234 | ) | | | (11,790,682 | ) | |
| Net increase (decrease) | | | (1,461,515 | ) | | | (13,746,753 | ) | | | 351,939 | | | | 3,249,146 | | |
See Accompanying Notes to Financial Statements.
39
Statements of Changes in Net Assets (continued) – Capital Stock Activity
| | | Columbia LifeGoal Income and Growth Portfolio | |
| | | Year Ended
March 31, 2011 | | Year Ended
March 31, 2010 | |
| | | Shares | | Dollars ($) | | Shares | | Dollars ($) | |
| Class A | |
| Subscriptions | | | 1,770,333 | | | | 18,308,738 | | | | 1,792,223 | | | | 16,683,536 | | |
| Distributions reinvested | | | 70,168 | | | | 713,359 | | | | 159,758 | | | | 1,519,412 | | |
| Redemptions | | | (2,041,585 | ) | | | (20,875,315 | ) | | | (1,470,993 | ) | | | (13,754,411 | ) | |
| Net increase (decrease) | | | (201,084 | ) | | | (1,853,218 | ) | | | 480,988 | | | | 4,448,537 | | |
| Class B | |
| Subscriptions | | | 102,115 | | | | 1,035,407 | | | | 209,608 | | | | 1,919,007 | | |
| Distributions reinvested | | | 25,558 | | | | 254,142 | | | | 101,019 | | | | 952,550 | | |
| Redemptions | | | (1,763,643 | ) | | | (18,113,872 | ) | | | (1,290,520 | ) | | | (12,149,208 | ) | |
| Net decrease | | | (1,635,970 | ) | | | (16,824,323 | ) | | | (979,893 | ) | | | (9,277,651 | ) | |
| Class C | |
| Subscriptions | | | 344,262 | | | | 3,500,601 | | | | 555,399 | | | | 5,176,368 | | |
| Distributions reinvested | | | 21,010 | | | | 211,334 | | | | 47,502 | | | | 445,991 | | |
| Redemptions | | | (517,115 | ) | | | (5,270,481 | ) | | | (565,216 | ) | | | (5,289,047 | ) | |
| Net increase (decrease) | | | (151,843 | ) | | | (1,558,546 | ) | | | 37,685 | | | | 333,312 | | |
| Class R | |
| Subscriptions | | | 24,212 | | | | 251,076 | | | | 24,710 | | | | 228,170 | | |
| Distributions reinvested | | | 1,199 | | | | 12,309 | | | | 1,484 | | | | 14,094 | | |
| Redemptions | | | (41,743 | ) | | | (439,144 | ) | | | (15,095 | ) | | | (140,807 | ) | |
| Net increase (decrease) | | | (16,332 | ) | | | (175,759 | ) | | | 11,099 | | | | 101,457 | | |
| Class Z | |
| Subscriptions | | | 632,691 | | | | 6,396,894 | | | | 579,483 | | | | 5,364,435 | | |
| Distributions reinvested | | | 24,952 | | | | 254,906 | | | | 43,544 | | | | 408,286 | | |
| Redemptions | | | (684,476 | ) | | | (6,946,115 | ) | | | (615,771 | ) | | | (5,642,381 | ) | |
| Net increase (decrease) | | | (26,833 | ) | | | (294,315 | ) | | | 7,256 | | | | 130,340 | | |
See Accompanying Notes to Financial Statements.
40
| | | Columbia LifeGoal Income Portfolio | |
| | | Year Ended
March 31, 2011 | | Year Ended
March 31, 2010 | |
| | | Shares | | Dollars ($) | | Shares | | Dollars ($) | |
| Class A | |
| Subscriptions | | | 371,656 | | | | 3,740,809 | | | | 414,030 | | | | 3,845,408 | | |
| Distributions reinvested | | | 24,375 | | | | 243,966 | | | | 44,786 | | | | 422,811 | | |
| Redemptions | | | (465,982 | ) | | | (4,705,202 | ) | | | (422,314 | ) | | | (4,050,740 | ) | |
| Net increase (decrease) | | | (69,951 | ) | | | (720,427 | ) | | | 36,502 | | | | 217,479 | | |
| Class B | |
| Subscriptions | | | 32,959 | | | | 327,934 | | | | 81,196 | | | | 758,008 | | |
| Distributions reinvested | | | 6,838 | | | | 68,016 | | | | 20,424 | | | | 192,117 | | |
| Redemptions | | | (246,160 | ) | | | (2,471,808 | ) | | | (257,918 | ) | | | (2,441,151 | ) | |
| Net decrease | | | (206,363 | ) | | | (2,075,858 | ) | | | (156,298 | ) | | | (1,491,026 | ) | |
| Class C | |
| Subscriptions | | | 148,916 | | | | 1,491,426 | | | | 126,587 | | | | 1,191,173 | | |
| Distributions reinvested | | | 6,200 | | | | 61,918 | | | | 14,092 | | | | 132,492 | | |
| Redemptions | | | (204,206 | ) | | | (2,043,283 | ) | | | (173,176 | ) | | | (1,638,681 | ) | |
| Net increase (decrease) | | | (49,090 | ) | | | (489,939 | ) | | | (32,497 | ) | | | (315,016 | ) | |
| Class R | |
| Subscriptions | | | — | | | | — | | | | — | | | | — | | |
| Distributions reinvested | | | — | | | | — | | | | — | | | | — | | |
| Redemptions | | | — | | | | — | | | | — | | | | — | | |
| Net increase (decrease) | | | — | | | | — | | | | — | | | | — | | |
| Class Z | |
| Subscriptions | | | 278,353 | | | | 2,786,284 | | | | 204,365 | | | | 1,949,223 | | |
| Distributions reinvested | | | 3,017 | | | | 30,252 | | | | 11,166 | | | | 105,281 | | |
| Redemptions | | | (432,823 | ) | | | (4,306,440 | ) | | | (285,245 | ) | | | (2,698,507 | ) | |
| Net increase (decrease) | | | (151,453 | ) | | | (1,489,904 | ) | | | (69,714 | ) | | | (644,003 | ) | |
See Accompanying Notes to Financial Statements.
41
Financial Highlights – Columbia LifeGoal Growth Portfolio
Selected data for a share outstanding throughout each period is as follows:
| | | Year Ended March 31, | |
| Class A Shares | | 2011 | | 2010 | | 2009 | | 2008 | | 2007 | |
| Net Asset Value, Beginning of Period | | $ | 10.33 | | | $ | 6.68 | | | $ | 13.24 | | | $ | 14.69 | | | $ | 13.92 | | |
| Income from Investment Operations: | |
| Net investment income (a) | | | 0.08 | | | | 0.05 | | | | 0.06 | | | | 0.05 | | | | 0.07 | | |
Net realized and unrealized gain (loss) on investments
and capital gains distributions received | | | 1.91 | | | | 3.62 | | | | (4.12 | ) | | | (0.59 | ) | | | 1.38 | | |
| Total from investment operations | | | 1.99 | | | | 3.67 | | | | (4.06 | ) | | | (0.54 | ) | | | 1.45 | | |
| Less Distributions to Shareholders: | |
| From net investment income | | | (0.07 | ) | | | (0.02 | ) | | | (0.03 | ) | | | (0.05 | ) | | | (0.05 | ) | |
| From net realized gains | | | — | | | | — | | | | (2.46 | ) | | | (0.86 | ) | | | (0.63 | ) | |
| From return of capital | | | — | | | | — | | | | (0.01 | ) | | | — | | | | — | | |
| Total distributions to shareholders | | | (0.07 | ) | | | (0.02 | ) | | | (2.50 | ) | | | (0.91 | ) | | | (0.68 | ) | |
| Increase from regulatory settlements | | | — | | | | — | (b) | | | — | | | | — | | | | — | | |
| Net Asset Value, End of Period | | $ | 12.25 | | | $ | 10.33 | | | $ | 6.68 | | | $ | 13.24 | | | $ | 14.69 | | |
| Total return (c) | | | 19.35 | % | | | 55.04 | % | | | (37.62 | )% | | | (4.31 | )% | | | 10.74 | % | |
| Ratios to Average Net Assets/Supplemental Data: | |
| Net expenses (d) | | | 0.51 | % | | | 0.50 | % | | | 0.50 | %(e) | | | 0.50 | %(e) | | | 0.50 | % | |
| Net investment income | | | 0.72 | % | | | 0.54 | % | | | 0.68 | %(e) | | | 0.31 | %(e) | | | 0.31 | % | |
| Portfolio turnover rate | | | 36 | % | | | 19 | % | | | 45 | % | | | 21 | % | | | 8 | % | |
| Net assets, end of period (000s) | | $ | 201,437 | | | $ | 178,769 | | | $ | 116,169 | | | $ | 210,861 | | | $ | 206,715 | | |
(a) Per share data was calculated using the average shares outstanding during the period.
(b) Rounds to less than $(0.01) per share.
(c) Total return at net asset value assuming all distributions reinvested and no initial sales charge or contingent deferred sales charge.
(d) Does not include expenses of the underlying investment companies in which the Portfolio invests. If these expenses were included, the expense ratios would have been higher.
(e) The benefits derived from expense reductions had an impact of less than 0.01%.
See Accompanying Notes to Financial Statements.
42
Financial Highlights – Columbia LifeGoal Growth Portfolio
Selected data for a share outstanding throughout each period is as follows:
| | | Year Ended March 31, | |
| Class B Shares | | 2011 | | 2010 | | 2009 | | 2008 | | 2007 | |
| Net Asset Value, Beginning of Period | | $ | 9.48 | | | $ | 6.17 | | | $ | 12.46 | | | $ | 13.93 | | | $ | 13.28 | | |
| Income from Investment Operations: | |
| Net investment loss (a) | | | — | (b) | | | (0.02 | ) | | | (0.01 | ) | | | (0.06 | ) | | | (0.04 | ) | |
Net realized and unrealized gain (loss) on investments
and capital gains distributions received | | | 1.75 | | | | 3.34 | | | | (3.80 | ) | | | (0.55 | ) | | | 1.32 | | |
| Total from investment operations | | | 1.75 | | | | 3.32 | | | | (3.81 | ) | | | (0.61 | ) | | | 1.28 | | |
| Less Distributions to Shareholders: | |
| From net investment income | | | (0.02 | ) | | | (0.01 | ) | | | (0.01 | ) | | | — | | | | — | | |
| From net realized gains | | | — | | | | — | | | | (2.46 | ) | | | (0.86 | ) | | | (0.63 | ) | |
| From return of capital | | | — | | | | — | | | | (0.01 | ) | | | — | | | | — | | |
| Total distributions to shareholders | | | (0.02 | ) | | | (0.01 | ) | | | (2.48 | ) | | | (0.86 | ) | | | (0.63 | ) | |
| Increase from regulatory settlements | | | — | | | | — | (b) | | | — | | | | — | | | | — | | |
| Net Asset Value, End of Period | | $ | 11.21 | | | $ | 9.48 | | | $ | 6.17 | | | $ | 12.46 | | | $ | 13.93 | | |
| Total return (c) | | | 18.46 | % | | | 53.78 | % | | | (37.99 | )% | | | (5.08 | )% | | | 9.90 | % | |
| Ratios to Average Net Assets/Supplemental Data: | |
| Net expenses (d) | | | 1.26 | % | | | 1.25 | % | | | 1.25 | %(e) | | | 1.25 | %(e) | | | 1.25 | % | |
| Net investment loss | | | (0.05 | )% | | | (0.21 | )% | | | (0.09 | )%(e) | | | (0.46 | )%(e) | | | (0.45 | )% | |
| Portfolio turnover rate | | | 36 | % | | | 19 | % | | | 45 | % | | | 21 | % | | | 8 | % | |
| Net assets, end of period (000s) | | $ | 74,403 | | | $ | 91,699 | | | $ | 74,197 | | | $ | 150,705 | | | $ | 170,971 | | |
(a) Per share data was calculated using the average shares outstanding during the period.
(b) Rounds to less than $(0.01) per share.
(c) Total return at net asset value assuming all distributions reinvested and no contingent deferred sales charge.
(d) Does not include expenses of the underlying investment companies in which the Portfolio invests. If these expenses were included, the expense ratios would have been higher.
(e) The benefits derived from expense reductions had an impact of less than 0.01%.
See Accompanying Notes to Financial Statements.
43
Financial Highlights – Columbia LifeGoal Growth Portfolio
Selected data for a share outstanding throughout each period is as follows:
| | | Year Ended March 31, | |
| Class C Shares | | 2011 | | 2010 | | 2009 | | 2008 | | 2007 | |
| Net Asset Value, Beginning of Period | | $ | 9.40 | | | $ | 6.12 | | | $ | 12.38 | | | $ | 13.85 | | | $ | 13.20 | | |
| Income from Investment Operations: | |
| Net investment loss (a) | | | — | (b) | | | (0.02 | ) | | | (0.01 | ) | | | (0.06 | ) | | | (0.04 | ) | |
Net realized and unrealized gain (loss) on investments
and capital gains distributions received | | | 1.73 | | | | 3.31 | | | | (3.77 | ) | | | (0.55 | ) | | | 1.32 | | |
| Total from investment operations | | | 1.73 | | | | 3.29 | | | | (3.78 | ) | | | (0.61 | ) | | | 1.28 | | |
| Less Distributions to Shareholders: | |
| From net investment income | | | (0.02 | ) | | | (0.01 | ) | | | (0.01 | ) | | | — | | | | — | | |
| From net realized gains | | | — | | | | — | | | | (2.46 | ) | | | (0.86 | ) | | | (0.63 | ) | |
| From return of capital | | | — | | | | — | | | | (0.01 | ) | | | — | | | | — | | |
| Total distributions to shareholders | | | (0.02 | ) | | | (0.01 | ) | | | (2.48 | ) | | | (0.86 | ) | | | (0.63 | ) | |
| Increase from regulatory settlements | | | — | | | | — | (b) | | | — | | | | — | | | | — | | |
| Net Asset Value, End of Period | | $ | 11.11 | | | $ | 9.40 | | | $ | 6.12 | | | $ | 12.38 | | | $ | 13.85 | | |
| Total return (c) | | | 18.41 | % | | | 53.73 | % | | | (37.99 | )% | | | (5.11 | )% | | | 9.97 | % | |
| Ratios to Average Net Assets/Supplemental Data: | |
| Net expenses (d) | | | 1.26 | % | | | 1.25 | % | | | 1.25 | %(e) | | | 1.25 | %(e) | | | 1.25 | % | |
| Net investment loss | | | (0.04 | )% | | | (0.21 | )% | | | (0.09 | )%(e) | | | (0.41 | )%(e) | | | (0.43 | )% | |
| Portfolio turnover rate | | | 36 | % | | | 19 | % | | | 45 | % | | | 21 | % | | | 8 | % | |
| Net assets, end of period (000s) | | $ | 70,437 | | | $ | 68,150 | | | $ | 50,343 | | | $ | 98,889 | | | $ | 96,558 | | |
(a) Per share data was calculated using the average shares outstanding during the period.
(b) Rounds to less than $0.01 per share.
(c) Total return at net asset value assuming all distributions reinvested and no contingent deferred sales charge.
(d) Does not include expenses of the underlying investment companies in which the Portfolio invests. If these expenses were included, the expense ratios would have been higher.
(e) The benefits derived from expense reductions had an impact of less than 0.01%.
See Accompanying Notes to Financial Statements.
44
Financial Highlights – Columbia LifeGoal Growth Portfolio
Selected data for a share outstanding throughout each period is as follows:
| | | Year Ended March 31, | |
| Class R Shares | | 2011 | | 2010 | | 2009 | | 2008 | | 2007 | |
| Net Asset Value, Beginning of Period | | $ | 10.25 | | | $ | 6.64 | | | $ | 13.19 | | | $ | 14.67 | | | $ | 13.92 | | |
| Income from Investment Operations: | |
| Net investment income (a) | | | 0.06 | | | | 0.03 | | | | 0.04 | | | | 0.02 | | | | 0.14 | | |
Net realized and unrealized gain (loss) on investments
and capital gains distributions received | | | 1.88 | | | | 3.60 | | | | (4.10 | ) | | | (0.60 | ) | | | 1.27 | | |
| Total from investment operations | | | 1.94 | | | | 3.63 | | | | (4.06 | ) | | | (0.58 | ) | | | 1.41 | | |
| Less Distributions to Shareholders: | |
| From net investment income | | | (0.05 | ) | | | (0.02 | ) | | | (0.02 | ) | | | (0.04 | ) | | | (0.03 | ) | |
| From net realized gains | | | — | | | | — | | | | (2.46 | ) | | | (0.86 | ) | | | (0.63 | ) | |
| From return of capital | | | — | | | | — | | | | (0.01 | ) | | | — | | | | — | | |
| Total distributions to shareholders | | | (0.05 | ) | | | (0.02 | ) | | | (2.49 | ) | | | (0.90 | ) | | | (0.66 | ) | |
| Increase from regulatory settlements | | | — | | | | — | (b) | | | — | | | | — | | | | — | | |
| Net Asset Value, End of Period | | $ | 12.14 | | | $ | 10.25 | | | $ | 6.64 | | | $ | 13.19 | | | $ | 14.67 | | |
| Total return (c) | | | 18.99 | % | | | 54.68 | % | | | (37.76 | )% | | | (4.65 | )% | | | 10.45 | % | |
| Ratios to Average Net Assets/Supplemental Data: | |
| Net expenses (d) | | | 0.76 | % | | | 0.75 | % | | | 0.75 | %(e) | | | 0.75 | %(e) | | | 0.75 | % | |
| Net investment income | | | 0.54 | % | | | 0.29 | % | | | 0.45 | %(e) | | | 0.12 | %(e) | | | 0.76 | % | |
| Portfolio turnover rate | | | 36 | % | | | 19 | % | | | 45 | % | | | 21 | % | | | 8 | % | |
| Net assets, end of period (000s) | | $ | 1,463 | | | $ | 1,586 | | | $ | 831 | | | $ | 1,206 | | | $ | 1,169 | | |
(a) Per share data was calculated using the average shares outstanding during the period.
(b) Rounds to less than $0.01 per share.
(c) Total return at net asset value assuming all distributions reinvested.
(d) Does not include expenses of the underlying investment companies in which the Portfolio invests. If these expenses were included, the expense ratios would have been higher.
(e) The benefits derived from expense reductions had an impact of less than 0.01%.
See Accompanying Notes to Financial Statements.
45
Financial Highlights – Columbia LifeGoal Growth Portfolio
Selected data for a share outstanding throughout the period is as follows:
| Class R4 Shares | | Period Ended
March 31,
2011 (a) | |
| Net Asset Value, Beginning of Period | | $ | 12.27 | | |
| Income from Investment Operations: | |
| Net investment income (b) | | | 0.01 | | |
Net realized and unrealized gain on investments
and capital gains distributions received | | | 0.21 | | |
| Total from investment operations | | | 0.22 | | |
| Less Distributions to Shareholders: | |
| From net investment income | | | (0.04 | ) | |
| Total distributions to shareholders | | | (0.04 | ) | |
| Net Asset Value, End of Period | | $ | 12.45 | | |
| Total return (c)(d) | | | 1.77 | % | |
| Ratios to Average Net Assets/Supplemental Data: | |
| Net expenses (e)(f) | | | 0.51 | % | |
| Net investment income (f) | | | 0.68 | % | |
| Portfolio turnover rate (d) | | | 36 | % | |
| Net assets, end of period (000s) | | $ | 3 | | |
(a) Class R4 shares commenced operations on March 7, 2011. Per share data and total return reflect activity from that date.
(b) Per share data was calculated using the average shares outstanding during the period.
(c) Total return at net asset value assuming all distributions reinvested.
(d) Not annualized.
(e) Does not include expenses of the underlying investment companies in which the Portfolio invests. If these expenses were included, the expense ratios would have been higher.
(f) Annualized.
See Accompanying Notes to Financial Statements.
46
Financial Highlights – Columbia LifeGoal Growth Portfolio
Selected data for a share outstanding throughout each period is as follows:
| | | Year Ended March 31, | |
| Class Z Shares | | 2011 | | 2010 | | 2009 | | 2008 | | 2007 | |
| Net Asset Value, Beginning of Period | | $ | 10.49 | | | $ | 6.78 | | | $ | 13.37 | | | $ | 14.80 | | | $ | 14.01 | | |
| Income from Investment Operations: | |
| Net investment income (a) | | | 0.11 | | | | 0.07 | | | | 0.09 | | | | 0.16 | | | | 0.10 | | |
Net realized and unrealized gain (loss) on investments
and capital gains distributions received | | | 1.94 | | | | 3.66 | | | | (4.17 | ) | | | (0.66 | ) | | | 1.40 | | |
| Total from investment operations | | | 2.05 | | | | 3.73 | | | | (4.08 | ) | | | (0.50 | ) | | | 1.50 | | |
| Less Distributions to Shareholders: | |
| From net investment income | | | (0.09 | ) | | | (0.02 | ) | | | (0.04 | ) | | | (0.07 | ) | | | (0.08 | ) | |
| From net realized gains | | | — | | | | — | | | | (2.46 | ) | | | (0.86 | ) | | | (0.63 | ) | |
| From return of capital | | | — | | | | — | | | | (0.01 | ) | | | — | | | | — | | |
| Total distributions to shareholders | | | (0.09 | ) | | | (0.02 | ) | | | (2.51 | ) | | | (0.93 | ) | | | (0.71 | ) | |
| Increase from regulatory settlements | | | — | | | | — | (b) | | | — | | | | — | | | | — | | |
| Net Asset Value, End of Period | | $ | 12.45 | | | $ | 10.49 | | | $ | 6.78 | | | $ | 13.37 | | | $ | 14.80 | | |
| Total return (c) | | | 19.64 | % | | | 55.20 | % | | | (37.38 | )% | | | (4.02 | )% | | | 11.01 | % | |
| Ratios to Average Net Assets/Supplemental Data: | |
| Net expenses (d) | | | 0.26 | % | | | 0.25 | % | | | 0.25 | %(e) | | | 0.25 | %(e) | | | 0.25 | % | |
| Net investment income | | | 0.97 | % | | | 0.78 | % | | | 0.90 | %(e) | | | 1.07 | %(e) | | | 0.55 | % | |
| Portfolio turnover rate | | | 36 | % | | | 19 | % | | | 45 | % | | | 21 | % | | | 8 | % | |
| Net assets, end of period (000s) | | $ | 54,882 | | | $ | 51,627 | | | $ | 29,467 | | | $ | 55,202 | | | $ | 252,536 | | |
(a) Per share data was calculated using the average shares outstanding during the period.
(b) Rounds to less than $0.01 per share.
(c) Total return at net asset value assuming all distributions reinvested.
(d) Does not include expenses of the underlying investment companies in which the Portfolio invests. If these expenses were included, the expense ratios would have been higher.
(e) The benefits derived from expense reductions had an impact of less than 0.01%.
See Accompanying Notes to Financial Statements.
47
Financial Highlights – Columbia LifeGoal Balanced Growth Portfolio
Selected data for a share outstanding throughout each period is as follows:
| | | Year Ended March 31, | |
| Class A Shares | | 2011 | | 2010 | | 2009 | | 2008 | | 2007 | |
| Net Asset Value, Beginning of Period | | $ | 10.23 | | | $ | 7.33 | | | $ | 11.36 | | | $ | 12.38 | | | $ | 11.86 | | |
| Income from Investment Operations: | |
| Net investment income (a) | | | 0.19 | | | | 0.23 | | | | 0.22 | | | | 0.25 | | | | 0.26 | | |
Net realized and unrealized gain (loss) on investments
and capital gains distributions received | | | 1.37 | | | | 2.89 | | | | (2.91 | ) | | | (0.45 | ) | | | 0.88 | | |
| Total from investment operations | | | 1.56 | | | | 3.12 | | | | (2.69 | ) | | | (0.20 | ) | | | 1.14 | | |
| Less Distributions to Shareholders: | |
| From net investment income | | | (0.18 | ) | | | (0.22 | ) | | | (0.22 | ) | | | (0.25 | ) | | | (0.26 | ) | |
| From net realized gains | | | — | | | | — | | | | (1.12 | ) | | | (0.57 | ) | | | (0.36 | ) | |
| Total distributions to shareholders | | | (0.18 | ) | | | (0.22 | ) | | | (1.34 | ) | | | (0.82 | ) | | | (0.62 | ) | |
| Net Asset Value, End of Period | | $ | 11.61 | | | $ | 10.23 | | | $ | 7.33 | | | $ | 11.36 | | | $ | 12.38 | | |
| Total return (b) | | | 15.48 | % | | | 42.94 | % | | | (26.48 | )% | | | (1.99 | )% | | | 9.95 | % | |
| Ratios to Average Net Assets/Supplemental Data: | |
| Net expenses before interest expense (c) | | | 0.50 | % | | | 0.50 | % | | | 0.50 | %(e) | | | 0.50 | %(e) | | | 0.50 | % | |
| Interest expense | | | — | %(d) | | | — | | | | — | | | | — | | | | — | | |
| Net expenses (c) | | | 0.50 | % | | | 0.50 | % | | | 0.50 | %(e) | | | 0.50 | %(e) | | | 0.50 | % | |
| Net investment income | | | 1.75 | % | | | 2.45 | % | | | 2.44 | %(e) | | | 2.05 | %(e) | | | 2.17 | % | |
| Portfolio turnover rate | | | 68 | % | | | 27 | % | | | 47 | % | | | 18 | % | | | 18 | % | |
| Net assets, end of period (000s) | | $ | 291,758 | | | $ | 245,327 | | | $ | 170,155 | | | $ | 275,576 | | | $ | 266,506 | | |
(a) Per share data was calculated using the average shares outstanding during the period.
(b) Total return at net asset value assuming all distributions reinvested and no initial sales charge or contingent deferred sales charge.
(c) Does not include expenses of the underlying investment companies in which the Portfolio invests. If these expenses were included, the expense ratios would have been higher.
(d) Rounds to less than 0.01%.
(e) The benefits derived from expense reductions had an impact of less than 0.01%.
See Accompanying Notes to Financial Statements.
48
Financial Highlights – Columbia LifeGoal Balanced Growth Portfolio
Selected data for a share outstanding throughout each period is as follows:
| | | Year Ended March 31, | |
| Class B Shares | | 2011 | | 2010 | | 2009 | | 2008 | | 2007 | |
| Net Asset Value, Beginning of Period | | $ | 10.16 | | | $ | 7.29 | | | $ | 11.30 | | | $ | 12.31 | | | $ | 11.81 | | |
| Income from Investment Operations: | |
| Net investment income (a) | | | 0.10 | | | | 0.16 | | | | 0.15 | | | | 0.16 | | | | 0.17 | | |
Net realized and unrealized gain (loss) on investments
and capital gains distributions received | | | 1.37 | | | | 2.87 | | | | (2.89 | ) | | | (0.44 | ) | | | 0.86 | | |
| Total from investment operations | | | 1.47 | | | | 3.03 | | | | (2.74 | ) | | | (0.28 | ) | | | 1.03 | | |
| Less Distributions to Shareholders: | |
| From net investment income | | | (0.10 | ) | | | (0.16 | ) | | | (0.15 | ) | | | (0.16 | ) | | | (0.17 | ) | |
| From net realized gains | | | — | | | | — | | | | (1.12 | ) | | | (0.57 | ) | | | (0.36 | ) | |
| Total distributions to shareholders | | | (0.10 | ) | | | (0.16 | ) | | | (1.27 | ) | | | (0.73 | ) | | | (0.53 | ) | |
| Net Asset Value, End of Period | | $ | 11.53 | | | $ | 10.16 | | | $ | 7.29 | | | $ | 11.30 | | | $ | 12.31 | | |
| Total return (b) | | | 14.63 | % | | | 41.72 | % | | | (27.01 | )% | | | (2.66 | )% | | | 9.00 | % | |
| Ratios to Average Net Assets/Supplemental Data: | |
| Net expenses before interest expense (c) | | | 1.25 | % | | | 1.25 | % | | | 1.25 | %(e) | | | 1.25 | %(e) | | | 1.25 | % | |
| Interest expense | | | — | %(d) | | | — | | | | — | | | | — | | | | — | | |
| Net expenses (c) | | | 1.25 | % | | | 1.25 | % | | | 1.25 | %(e) | | | 1.25 | %(e) | | | 1.25 | % | |
| Net investment income | | | 0.99 | % | | | 1.70 | % | | | 1.67 | %(e) | | | 1.28 | %(e) | | | 1.42 | % | |
| Portfolio turnover rate | | | 68 | % | | | 27 | % | | | 47 | % | | | 18 | % | | | 18 | % | |
| Net assets, end of period (000s) | | $ | 133,770 | | | $ | 181,026 | | | $ | 156,679 | | | $ | 282,912 | | | $ | 325,190 | | |
(a) Per share data was calculated using the average shares outstanding during the period.
(b) Total return at net asset value assuming all distributions reinvested and no contingent deferred sales charge.
(c) Does not include expenses of the underlying investment companies in which the Portfolio invests. If these expenses were included, the expense ratios would have been higher.
(d) Rounds to less than 0.01%.
(e) The benefits derived from expense reductions had an impact of less than 0.01%.
See Accompanying Notes to Financial Statements.
49
Financial Highlights – Columbia LifeGoal Balanced Growth Portfolio
Selected data for a share outstanding throughout each period is as follows:
| | | Year Ended March 31, | |
| Class C Shares | | 2011 | | 2010 | | 2009 | | 2008 | | 2007 | |
| Net Asset Value, Beginning of Period | | $ | 10.29 | | | $ | 7.38 | | | $ | 11.43 | | | $ | 12.44 | | | $ | 11.92 | | |
| Income from Investment Operations: | |
| Net investment income (a) | | | 0.11 | | | | 0.16 | | | | 0.15 | | | | 0.16 | | | | 0.17 | | |
Net realized and unrealized gain (loss) on investments
and capital gains distributions received | | | 1.38 | | | | 2.91 | | | | (2.93 | ) | | | (0.44 | ) | | | 0.88 | | |
| Total from investment operations | | | 1.49 | | | | 3.07 | | | | (2.78 | ) | | | (0.28 | ) | | | 1.05 | | |
| Less Distributions to Shareholders: | |
| From net investment income | | | (0.10 | ) | | | (0.16 | ) | | | (0.15 | ) | | | (0.16 | ) | | | (0.17 | ) | |
| From net realized gains | | | — | | | | — | | | | (1.12 | ) | | | (0.57 | ) | | | (0.36 | ) | |
| Total distributions to shareholders | | | (0.10 | ) | | | (0.16 | ) | | | (1.27 | ) | | | (0.73 | ) | | | (0.53 | ) | |
| Net Asset Value, End of Period | | $ | 11.68 | | | $ | 10.29 | | | $ | 7.38 | | | $ | 11.43 | | | $ | 12.44 | | |
| Total return (b) | | | 14.64 | % | | | 41.76 | % | | | (27.05 | )% | | | (2.63 | )% | | | 9.09 | % | |
| Ratios to Average Net Assets/Supplemental Data: | |
| Net expenses before interest expense (c) | | | 1.25 | % | | | 1.25 | % | | | 1.25 | %(e) | | | 1.25 | %(e) | | | 1.25 | % | |
| Interest expense | | | — | %(d) | | | — | | | | — | | | | — | | | | — | | |
| Net expenses (c) | | | 1.25 | % | | | 1.25 | % | | | 1.25 | %(e) | | | 1.25 | %(e) | | | 1.25 | % | |
| Net investment income | | | 1.00 | % | | | 1.70 | % | | | 1.67 | %(e) | | | 1.30 | %(e) | | | 1.42 | % | |
| Portfolio turnover rate | | | 68 | % | | | 27 | % | | | 47 | % | | | 18 | % | | | 18 | % | |
| Net assets, end of period (000s) | | $ | 91,556 | | | $ | 87,496 | | | $ | 64,940 | | | $ | 112,902 | | | $ | 118,747 | | |
(a) Per share data was calculated using the average shares outstanding during the period.
(b) Total return at net asset value assuming all distributions reinvested and no contingent deferred sales charge.
(c) Does not include expenses of the underlying investment companies in which the Portfolio invests. If these expenses were included, the expense ratios would have been higher.
(d) Rounds to less than 0.01%.
(e) The benefits derived from expense reductions had an impact of less than 0.01%.
See Accompanying Notes to Financial Statements.
50
Financial Highlights – Columbia LifeGoal Balanced Growth Portfolio
Selected data for a share outstanding throughout each period is as follows:
| | | Year Ended March 31, | |
| Class R Shares | | 2011 | | 2010 | | 2009 | | 2008 | | 2007 | |
| Net Asset Value, Beginning of Period | | $ | 10.22 | | | $ | 7.33 | | | $ | 11.36 | | | $ | 12.37 | | | $ | 11.86 | | |
| Income from Investment Operations: | |
| Net investment income (a) | | | 0.16 | | | | 0.20 | | | | 0.22 | | | | 0.21 | | | | 0.29 | | |
Net realized and unrealized gain (loss) on investments
and capital gains distributions received | | | 1.38 | | | | 2.89 | | | | (2.94 | ) | | | (0.43 | ) | | | 0.81 | | |
| Total from investment operations | | | 1.54 | | | | 3.09 | | | | (2.72 | ) | | | (0.22 | ) | | | 1.10 | | |
| Less Distributions to Shareholders: | |
| From net investment income | | | (0.16 | ) | | | (0.20 | ) | | | (0.19 | ) | | | (0.22 | ) | | | (0.23 | ) | |
| From net realized gains | | | — | | | | — | | | | (1.12 | ) | | | (0.57 | ) | | | (0.36 | ) | |
| Total distributions to shareholders | | | (0.16 | ) | | | (0.20 | ) | | | (1.31 | ) | | | (0.79 | ) | | | (0.59 | ) | |
| Net Asset Value, End of Period | | $ | 11.60 | | | $ | 10.22 | | | $ | 7.33 | | | $ | 11.36 | | | $ | 12.37 | | |
| Total return (b) | | | 15.21 | % | | | 42.46 | % | | | (26.67 | )% | | | (2.15 | )% | | | 9.59 | % | |
| Ratios to Average Net Assets/Supplemental Data: | |
| Net expenses before interest expense (c) | | | 0.75 | % | | | 0.75 | % | | | 0.75 | %(e) | | | 0.75 | %(e) | | | 0.75 | % | |
| Interest expense | | | — | %(d) | | | — | | | | — | | | | — | | | | — | | |
| Net expenses (c) | | | 0.75 | % | | | 0.75 | % | | | 0.75 | %(e) | | | 0.75 | %(e) | | | 0.75 | % | |
| Net investment income | | | 1.54 | % | | | 2.16 | % | | | 2.48 | %(e) | | | 1.69 | %(e) | | | 2.34 | % | |
| Portfolio turnover rate | | | 68 | % | | | 27 | % | | | 47 | % | | | 18 | % | | | 18 | % | |
| Net assets, end of period (000s) | | $ | 1,517 | | | $ | 1,740 | | | $ | 1,666 | | | $ | 1,257 | | | $ | 1,916 | | |
(a) Per share data was calculated using the average shares outstanding during the period.
(b) Total return at net asset value assuming all distributions reinvested.
(c) Does not include expenses of the underlying investment companies in which the Portfolio invests. If these expenses were included, the expense ratios would have been higher.
(d) Rounds to less than 0.01%.
(e) The benefits derived from expense reductions had an impact of less than 0.01%.
See Accompanying Notes to Financial Statements.
51
Financial Highlights – Columbia LifeGoal Balanced Growth Portfolio
Selected data for a share outstanding throughout the period is as follows:
| Class T Shares | | Period Ended
March 31,
2011 (a) | |
| Net Asset Value, Beginning of Year | | $ | 11.49 | | |
| Income from Investment Operations: | |
| Net investment income (b) | | | 0.02 | | |
Net realized and unrealized gain on investments
and capital gains distributions received | | | 0.13 | | |
| Total from investment operations | | | 0.15 | | |
| Less Distributions to Shareholders: | |
| From net investment income | | | (0.03 | ) | |
| Net Asset Value, End of Period | | $ | 11.61 | | |
| Total return (c)(d) | | | 1.28 | % | |
| Ratios to Average Net Assets/Supplemental Data: | |
| Net expenses (e)(f) | | | 0.55 | % | |
| Net investment income (f) | | | 2.26 | % | |
| Portfolio turnover rate (d) | | | 68 | % | |
| Net assets, end of period (000s) | | $ | 3 | | |
(a) Class T shares commenced operations on March 7, 2011. Per share data and total return reflect activity from that date.
(b) Per share data was calculated using the average shares outstanding during the period.
(c) Total return at net asset value assuming all distributions reinvested.
(d) Not annualized.
(e) Does not include expenses of the underlying investment companies in which the Portfolio invests. If these expenses were included, the expense ratios would have been higher.
(f) Annualized.
See Accompanying Notes to Financial Statements.
52
Financial Highlights – Columbia LifeGoal Balanced Growth Portfolio
Selected data for a share outstanding throughout each period is as follows:
| | | Year Ended March 31, | |
| Class Z Shares | | 2011 | | 2010 | | 2009 | | 2008 | | 2007 | |
| Net Asset Value, Beginning of Period | | $ | 10.21 | | | $ | 7.33 | | | $ | 11.36 | | | $ | 12.35 | | | $ | 11.84 | | |
| Income from Investment Operations: | |
| Net investment income (a) | | | 0.21 | | | | 0.25 | | | | 0.25 | | | | 0.34 | | | | 0.29 | | |
Net realized and unrealized gain (loss) on investments
and capital gains distributions received | | | 1.39 | | | | 2.88 | | | | (2.92 | ) | | | (0.47 | ) | | | 0.87 | | |
| Total from investment operations | | | 1.60 | | | | 3.13 | | | | (2.67 | ) | | | (0.13 | ) | | | 1.16 | | |
| Less Distributions to Shareholders: | |
| From net investment income | | | (0.21 | ) | | | (0.25 | ) | | | (0.24 | ) | | | (0.29 | ) | | | (0.29 | ) | |
| From net realized gains | | | — | | | | — | | | | (1.12 | ) | | | (0.57 | ) | | | (0.36 | ) | |
| Total distributions to shareholders | | | (0.21 | ) | | | (0.25 | ) | | | (1.36 | ) | | | (0.86 | ) | | | (0.65 | ) | |
| Net Asset Value, End of Period | | $ | 11.60 | | | $ | 10.21 | | | $ | 7.33 | | | $ | 11.36 | | | $ | 12.35 | | |
| Total return (b) | | | 15.89 | % | | | 43.01 | % | | | (26.28 | )% | | | (1.49 | )% | | | 10.15 | % | |
| Ratios to Average Net Assets/Supplemental Data: | |
| Net expenses before interest expense (c) | | | 0.25 | % | | | 0.25 | % | | | 0.25 | %(e) | | | 0.25 | %(e) | | | 0.25 | % | |
| Interest expense | | | — | %(d) | | | — | | | | — | | | | — | | | | — | | |
| Net expenses (c) | | | 0.25 | % | | | 0.25 | % | | | 0.25 | %(e) | | | 0.25 | %(e) | | | 0.25 | % | |
| Net investment income | | | 2.03 | % | | | 2.69 | % | | | 2.83 | %(e) | | | 2.68 | %(e) | | | 2.42 | % | |
| Portfolio turnover rate | | | 68 | % | | | 27 | % | | | 47 | % | | | 18 | % | | | 18 | % | |
| Net assets, end of period (000s) | | $ | 56,805 | | | $ | 64,967 | | | $ | 44,020 | | | $ | 46,711 | | | $ | 292,939 | | |
(a) Per share data was calculated using the average shares outstanding during the period.
(b) Total return at net asset value assuming all distributions reinvested.
(c) Does not include expenses of the underlying investment companies in which the Portfolio invests. If these expenses were included, the expense ratios would have been higher.
(d) Rounds to less than 0.01%.
(e) The benefits derived from expense reductions had an impact of less than 0.01%.
See Accompanying Notes to Financial Statements.
53
Financial Highlights – Columbia LifeGoal Income and Growth Portfolio
Selected data for a share outstanding throughout each period is as follows:
| | | Year Ended March 31, | |
| Class A Shares | | 2011 | | 2010 | | 2009 | | 2008 | | 2007 | |
| Net Asset Value, Beginning of Period | | $ | 10.04 | | | $ | 8.03 | | | $ | 10.40 | | | $ | 11.04 | | | $ | 10.80 | | |
| Income from Investment Operations: | |
| Net investment income (a) | | | 0.26 | | | | 0.31 | | | | 0.33 | | | | 0.36 | | | | 0.34 | | |
Net realized and unrealized gain (loss) on investments
and capital gains distributions received | | | 0.85 | | | | 2.00 | | | | (1.97 | ) | | | (0.30 | ) | | | 0.50 | | |
| Total from investment operations | | | 1.11 | | | | 2.31 | | | | (1.64 | ) | | | 0.06 | | | | 0.84 | | |
| Less Distributions to Shareholders: | |
| From net investment income | | | (0.26 | ) | | | (0.30 | ) | | | (0.33 | ) | | | (0.36 | ) | | | (0.34 | ) | |
| From net realized gains | | | — | | | | — | | | | (0.40 | ) | | | (0.34 | ) | | | (0.26 | ) | |
| Total distributions to shareholders | | | (0.26 | ) | | | (0.30 | ) | | | (0.73 | ) | | | (0.70 | ) | | | (0.60 | ) | |
| Net Asset Value, End of Period | | $ | 10.89 | | | $ | 10.04 | | | $ | 8.03 | | | $ | 10.40 | | | $ | 11.04 | | |
| Total return (b) | | | 11.21 | % | | | 29.06 | % | | | (16.58 | )% | | | 0.34 | % | | | 8.07 | % | |
| Ratios to Average Net Assets/Supplemental Data: | |
| Net expenses before interest expense (c) | | | 0.50 | % | | | 0.50 | % | | | 0.50 | %(d) | | | 0.50 | %(d) | | | 0.50 | % | |
| Interest expense | | | — | | | | — | | | | — | %(e) | | | — | | | | — | | |
| Net expenses (c) | | | 0.50 | % | | | 0.50 | % | | | 0.50 | %(d) | | | 0.50 | %(d) | | | 0.50 | % | |
| Net investment income | | | 2.52 | % | | | 3.26 | % | | | 3.59 | %(d) | | | 3.29 | %(d) | | | 3.15 | % | |
| Portfolio turnover rate | | | 87 | % | | | 34 | % | | | 52 | % | | | 20 | % | | | 25 | % | |
| Net assets, end of period (000s) | | $ | 63,807 | | | $ | 60,848 | | | $ | 44,825 | | | $ | 54,370 | | | $ | 50,829 | | |
(a) Per share data was calculated using the average shares outstanding during the period.
(b) Total return at net asset value assuming all distributions reinvested and no initial sales charge or contingent deferred sales charge.
(c) Does not include expenses of the underlying investment companies in which the Portfolio invests. If these expenses were included, the expense ratios would have been higher.
(d) The benefits derived from expense reductions had an impact of less than 0.01%.
(e) Rounds to less than 0.01%.
See Accompanying Notes to Financial Statements.
54
Financial Highlights – Columbia LifeGoal Income and Growth Portfolio
Selected data for a share outstanding throughout each period is as follows:
| | | Year Ended March 31, | |
| Class B Shares | | 2011 | | 2010 | | 2009 | | 2008 | | 2007 | |
| Net Asset Value, Beginning of Period | | $ | 10.00 | | | $ | 8.01 | | | $ | 10.36 | | | $ | 11.00 | | | $ | 10.77 | | |
| Income from Investment Operations: | |
| Net investment income (a) | | | 0.18 | | | | 0.23 | | | | 0.26 | | | | 0.28 | | | | 0.26 | | |
Net realized and unrealized gain (loss) on investments
and capital gains distributions received | | | 0.85 | | | | 1.99 | | | | (1.95 | ) | | | (0.31 | ) | | | 0.49 | | |
| Total from investment operations | | | 1.03 | | | | 2.22 | | | | (1.69 | ) | | | (0.03 | ) | | | 0.75 | | |
| Less Distributions to Shareholders: | |
| From net investment income | | | (0.18 | ) | | | (0.23 | ) | | | (0.26 | ) | | | (0.27 | ) | | | (0.26 | ) | |
| From net realized gains | | | — | | | | — | | | | (0.40 | ) | | | (0.34 | ) | | | (0.26 | ) | |
| Total distributions to shareholders | | | (0.18 | ) | | | (0.23 | ) | | | (0.66 | ) | | | (0.61 | ) | | | (0.52 | ) | |
| Net Asset Value, End of Period | | $ | 10.85 | | | $ | 10.00 | | | $ | 8.01 | | | $ | 10.36 | | | $ | 11.00 | | |
| Total return (b) | | | 10.43 | % | | | 27.94 | % | | | (17.09 | )% | | | (0.41 | )% | | | 7.20 | % | |
| Ratios to Average Net Assets/Supplemental Data: | |
| Net expenses before interest expense (c) | | | 1.25 | % | | | 1.25 | % | | | 1.25 | %(d) | | | 1.25 | %(d) | | | 1.25 | % | |
| Interest expense | | | — | | | | — | | | | — | %(e) | | | — | | | | — | | |
| Net expenses (c) | | | 1.25 | % | | | 1.25 | % | | | 1.25 | %(d) | | | 1.25 | %(d) | | | 1.25 | % | |
| Net investment income | | | 1.75 | % | | | 2.51 | % | | | 2.80 | %(d) | | | 2.53 | %(d) | | | 2.39 | % | |
| Portfolio turnover rate | | | 87 | % | | | 34 | % | | | 52 | % | | | 20 | % | | | 25 | % | |
| Net assets, end of period (000s) | | $ | 26,181 | | | $ | 40,508 | | | $ | 40,270 | | | $ | 66,558 | | | $ | 75,119 | | |
(a) Per share data was calculated using the average shares outstanding during the period.
(b) Total return at net asset value assuming all distributions reinvested and no contingent deferred sales charge.
(c) Does not include expenses of the underlying investment companies in which the Portfolio invests. If these expenses were included, the expense ratios would have been higher.
(d) The benefits derived from expense reductions had an impact of less than 0.01%.
(e) Rounds to less than 0.01%.
See Accompanying Notes to Financial Statements.
55
Financial Highlights – Columbia LifeGoal Income and Growth Portfolio
Selected data for a share outstanding throughout each period is as follows:
| | | Year Ended March 31, | |
| Class C Shares | | 2011 | | 2010 | | 2009 | | 2008 | | 2007 | |
| Net Asset Value, Beginning of Period | | $ | 9.94 | | | $ | 7.96 | | | $ | 10.30 | | | $ | 10.94 | | | $ | 10.71 | | |
| Income from Investment Operations: | |
| Net investment income (a) | | | 0.18 | | | | 0.23 | | | | 0.26 | | | | 0.28 | | | | 0.26 | | |
Net realized and unrealized gain (loss) on investments
and capital gains distributions received | | | 0.84 | | | | 1.98 | | | | (1.94 | ) | | | (0.31 | ) | | | 0.49 | | |
| Total from investment operations | | | 1.02 | | | | 2.21 | | | | (1.68 | ) | | | (0.03 | ) | | | 0.75 | | |
| Less Distributions to Shareholders: | |
| From net investment income | | | (0.18 | ) | | | (0.23 | ) | | | (0.26 | ) | | | (0.27 | ) | | | (0.26 | ) | |
| From net realized gains | | | — | | | | — | | | | (0.40 | ) | | | (0.34 | ) | | | (0.26 | ) | |
| Total distributions to shareholders | | | (0.18 | ) | | | (0.23 | ) | | | (0.66 | ) | | | (0.61 | ) | | | (0.52 | ) | |
| Net Asset Value, End of Period | | $ | 10.78 | | | $ | 9.94 | | | $ | 7.96 | | | $ | 10.30 | | | $ | 10.94 | | |
| Total return (b) | | | 10.39 | % | | | 27.99 | % | | | (17.09 | )% | | | (0.41 | )% | | | 7.24 | % | |
| Ratios to Average Net Assets/Supplemental Data: | |
| Net expenses before interest expense (c) | | | 1.25 | % | | | 1.25 | % | | | 1.25 | %(d) | | | 1.25 | %(d) | | | 1.25 | % | |
| Interest expense | | | — | | | | — | | | | — | %(e) | | | — | | | | — | | |
| Net expenses (c) | | | 1.25 | % | | | 1.25 | % | | | 1.25 | %(d) | | | 1.25 | %(d) | | | 1.25 | % | |
| Net investment income | | | 1.77 | % | | | 2.51 | % | | | 2.81 | %(d) | | | 2.55 | %(d) | | | 2.41 | % | |
| Portfolio turnover rate | | | 87 | % | | | 34 | % | | | 52 | % | | | 20 | % | | | 25 | % | |
| Net assets, end of period (000s) | | $ | 23,651 | | | $ | 23,321 | | | $ | 18,370 | | | $ | 26,501 | | | $ | 24,367 | | |
(a) Per share data was calculated using the average shares outstanding during the period.
(b) Total return at net asset value assuming all distributions reinvested and no contingent deferred sales charge.
(c) Does not include expenses of the underlying investment companies in which the Portfolio invests. If these expenses were included, the expense ratios would have been higher.
(d) The benefits derived from expense reductions had an impact of less than 0.01%.
(e) Rounds to less than 0.01%.
See Accompanying Notes to Financial Statements.
56
Financial Highlights – Columbia LifeGoal Income and Growth Portfolio
Selected data for a share outstanding throughout each period is as follows:
| | | Year Ended March 31, | |
| Class R Shares | | 2011 | | 2010 | | 2009 | | 2008 | | 2007 | |
| Net Asset Value, Beginning of Period | | $ | 10.04 | | | $ | 8.04 | | | $ | 10.40 | | | $ | 11.04 | | | $ | 10.80 | | |
| Income from Investment Operations: | |
| Net investment income (a) | | | 0.23 | | | | 0.28 | | | | 0.31 | | | | 0.32 | | | | 0.36 | | |
Net realized and unrealized gain (loss) on investments
and capital gains distributions received | | | 0.86 | | | | 2.00 | | | | (1.96 | ) | | | (0.29 | ) | | | 0.46 | | |
| Total from investment operations | | | 1.09 | | | | 2.28 | | | | (1.65 | ) | | | 0.03 | | | | 0.82 | | |
| Less Distributions to Shareholders: | |
| From net investment income | | | (0.23 | ) | | | (0.28 | ) | | | (0.31 | ) | | | (0.33 | ) | | | (0.32 | ) | |
| From net realized gains | | | — | | | | — | | | | (0.40 | ) | | | (0.34 | ) | | | (0.26 | ) | |
| Total distributions to shareholders | | | (0.23 | ) | | | (0.28 | ) | | | (0.71 | ) | | | (0.67 | ) | | | (0.58 | ) | |
| Net Asset Value, End of Period | | $ | 10.90 | | | $ | 10.04 | | | $ | 8.04 | | | $ | 10.40 | | | $ | 11.04 | | |
| Total return (b) | | | 11.03 | % | | | 28.58 | % | | | (16.69 | )% | | | 0.09 | % | | | 7.80 | % | |
| Ratios to Average Net Assets/Supplemental Data: | |
| Net expenses before interest expense (c) | | | 0.75 | % | | | 0.75 | % | | | 0.75 | %(d) | | | 0.75 | %(d) | | | 0.75 | % | |
| Interest expense | | | — | | | | — | | | | — | %(e) | | | — | | | | — | | |
| Net expenses (c) | | | 0.75 | % | | | 0.75 | % | | | 0.75 | %(d) | | | 0.75 | %(d) | | | 0.75 | % | |
| Net investment income | | | 2.28 | % | | | 3.00 | % | | | 3.34 | %(d) | | | 2.93 | %(d) | | | 3.25 | % | |
| Portfolio turnover rate | | | 87 | % | | | 34 | % | | | 52 | % | | | 20 | % | | | 25 | % | |
| Net assets, end of period (000s) | | $ | 428 | | | $ | 559 | | | $ | 358 | | | $ | 451 | | | $ | 896 | | |
(a) Per share data was calculated using the average shares outstanding during the period.
(b) Total return at net asset value assuming all distributions reinvested.
(c) Does not include expenses of the underlying investment companies in which the Portfolio invests. If these expenses were included, the expense ratios would have been higher.
(d) The benefits derived from expense reductions had an impact of less than 0.01%.
(e) Rounds to less than 0.01%.
See Accompanying Notes to Financial Statements.
57
Financial Highlights – Columbia LifeGoal Income and Growth Portfolio
Selected data for a share outstanding throughout each period is as follows:
| | | Year Ended March 31, | |
| Class Z Shares | | 2011 | | 2010 | | 2009 | | 2008 | | 2007 | |
| Net Asset Value, Beginning of Period | | $ | 9.94 | | | $ | 7.96 | | | $ | 10.30 | | | $ | 10.96 | | | $ | 10.73 | | |
| Income from Investment Operations: | |
| Net investment income (a) | | | 0.28 | | | | 0.33 | | | | 0.35 | | | | 0.42 | | | | 0.37 | | |
Net realized and unrealized gain (loss) on investments
and capital gains distributions received | | | 0.84 | | | | 1.98 | | | | (1.93 | ) | | | (0.36 | ) | | | 0.49 | | |
| Total from investment operations | | | 1.12 | | | | 2.31 | | | | (1.58 | ) | | | 0.06 | | | | 0.86 | | |
| Less Distributions to Shareholders: | |
| From net investment income | | | (0.28 | ) | | | (0.33 | ) | | | (0.36 | ) | | | (0.38 | ) | | | (0.37 | ) | |
| From net realized gains | | | — | | | | — | | | | (0.40 | ) | | | (0.34 | ) | | | (0.26 | ) | |
| Total distributions to shareholders | | | (0.28 | ) | | | (0.33 | ) | | | (0.76 | ) | | | (0.72 | ) | | | (0.63 | ) | |
| Net Asset Value, End of Period | | $ | 10.78 | | | $ | 9.94 | | | $ | 7.96 | | | $ | 10.30 | | | $ | 10.96 | | |
| Total return (b) | | | 11.49 | % | | | 29.25 | % | | | (16.23 | )% | | | 0.40 | % | | | 8.30 | % | |
| Ratios to Average Net Assets/Supplemental Data: | |
| Net expenses before interest expense (c) | | | 0.25 | % | | | 0.25 | % | | | 0.25 | %(d) | | | 0.25 | %(d) | | | 0.25 | % | |
| Interest expense | | | — | | | | — | | | | — | %(e) | | | — | | | | — | | |
| Net expenses (c) | | | 0.25 | % | | | 0.25 | % | | | 0.25 | %(d) | | | 0.25 | %(d) | | | 0.25 | % | |
| Net investment income | | | 2.77 | % | | | 3.51 | % | | | 3.98 | %(d) | | | 3.78 | %(d) | | | 3.42 | % | |
| Portfolio turnover rate | | | 87 | % | | | 34 | % | | | 52 | % | | | 20 | % | | | 25 | % | |
| Net assets, end of period (000s) | | $ | 21,839 | | | $ | 20,406 | | | $ | 16,275 | | | $ | 13,598 | | | $ | 68,749 | | |
(a) Per share data was calculated using the average shares outstanding during the period.
(b) Total return at net asset value assuming all distributions reinvested.
(c) Does not include expenses of the underlying investment companies in which the Portfolio invests. If these expenses were included, the expense ratios would have been higher.
(d) The benefits derived from expense reductions had an impact of less than 0.01%.
(e) Rounds to less than 0.01%.
See Accompanying Notes to Financial Statements.
58
Financial Highlights – Columbia LifeGoal Income Portfolio
Selected data for a share outstanding throughout each period is as follows:
| | | Year Ended March 31, | |
| Class A Shares | | 2011 | | 2010 | | 2009 | | 2008 | | 2007 | |
| Net Asset Value, Beginning of Period | | $ | 9.90 | | | $ | 8.58 | | | $ | 9.83 | | | $ | 10.22 | | | $ | 9.99 | | |
| Income from Investment Operations: | |
| Net investment income (a) | | | 0.29 | | | | 0.36 | | | | 0.38 | | | | 0.44 | | | | 0.42 | | |
Net realized and unrealized gain (loss) on investments
and capital gains distributions received | | | 0.41 | | | | 1.31 | | | | (1.19 | ) | | | (0.38 | ) | | | 0.25 | | |
| Total from investment operations | | | 0.70 | | | | 1.67 | | | | (0.81 | ) | | | 0.06 | | | | 0.67 | | |
| Less Distributions to Shareholders: | |
| From net investment income | | | (0.29 | ) | | | (0.35 | ) | | | (0.40 | ) | | | (0.43 | ) | | | (0.43 | ) | |
| From net realized gains | | | — | | | | — | | | | (0.04 | ) | | | (0.02 | ) | | | (0.01 | ) | |
| Total distributions to shareholders | | | (0.29 | ) | | | (0.35 | ) | | | (0.44 | ) | | | (0.45 | ) | | | (0.44 | ) | |
| Net Asset Value, End of Period | | $ | 10.31 | | | $ | 9.90 | | | $ | 8.58 | | | $ | 9.83 | | | $ | 10.22 | | |
| Total return (b)(c) | | | 7.21 | % | | | 19.77 | % | | | (8.37 | )% | | | 0.60 | % | | | 6.91 | % | |
| Ratios to Average Net Assets/Supplemental Data: | |
| Net expenses (d) | | | 0.67 | % | | | 0.67 | % | | | 0.67 | % | | | 0.67 | %(e) | | | 0.67 | % | |
| Waiver/Reimbursement | | | 0.57 | % | | | 0.58 | % | | | 0.39 | % | | | 0.47 | % | | | 0.54 | % | |
| Net investment income | | | 2.93 | % | | | 3.78 | % | | | 4.40 | % | | | 4.34 | %(e) | | | 4.19 | % | |
| Portfolio turnover rate | | | 109 | % | | | 35 | % | | | 51 | % | | | 24 | % | | | 42 | % | |
| Net assets, end of period (000s) | | $ | 13,214 | | | $ | 13,390 | | | $ | 11,281 | | | $ | 13,941 | | | $ | 15,240 | | |
(a) Per share data was calculated using the average shares outstanding during the period.
(b) Total return at net asset value assuming all distributions reinvested and no initial sales charge or contingent deferred sales charge.
(c) Had the Investment Manager and/or any of its affiliates not waived fees or reimbursed a portion of expenses, total return would have been reduced.
(d) Does not include expenses of the underlying investment companies in which the Portfolio invests. If these expenses were included, the expense ratios would have been higher.
(e) The benefits derived from expense reductions had an impact of less than 0.01%.
See Accompanying Notes to Financial Statements.
59
Financial Highlights – Columbia LifeGoal Income Portfolio
Selected data for a share outstanding throughout each period is as follows:
| | | Year Ended March 31, | |
| Class B Shares | | 2011 | | 2010 | | 2009 | | 2008 | | 2007 | |
| Net Asset Value, Beginning of Period | | $ | 9.89 | | | $ | 8.56 | | | $ | 9.82 | | | $ | 10.21 | | | $ | 9.98 | | |
| Income from Investment Operations: | |
| Net investment income (a) | | | 0.22 | | | | 0.28 | | | | 0.31 | | | | 0.36 | | | | 0.35 | | |
Net realized and unrealized gain (loss) on investments
and capital gains distributions received | | | 0.40 | | | | 1.33 | | | | (1.20 | ) | | | (0.37 | ) | | | 0.25 | | |
| Total from investment operations | | | 0.62 | | | | 1.61 | | | | (0.89 | ) | | | (0.01 | ) | | | 0.60 | | |
| Less Distributions to Shareholders: | |
| From net investment income | | | (0.22 | ) | | | (0.28 | ) | | | (0.33 | ) | | | (0.36 | ) | | | (0.36 | ) | |
| From net realized gains | | | — | | | | — | | | | (0.04 | ) | | | (0.02 | ) | | | (0.01 | ) | |
| Total distributions to shareholders | | | (0.22 | ) | | | (0.28 | ) | | | (0.37 | ) | | | (0.38 | ) | | | (0.37 | ) | |
| Net Asset Value, End of Period | | $ | 10.29 | | | $ | 9.89 | | | $ | 8.56 | | | $ | 9.82 | | | $ | 10.21 | | |
| Total return (b)(c) | | | 6.31 | % | | | 19.04 | % | | | (9.17 | )% | | | (0.15 | )% | | | 6.13 | % | |
| Ratios to Average Net Assets/Supplemental Data: | |
| Net expenses (d) | | | 1.42 | % | | | 1.42 | % | | | 1.42 | % | | | 1.42 | %(e) | | | 1.42 | % | |
| Waiver/Reimbursement | | | 0.57 | % | | | 0.58 | % | | | 0.39 | % | | | 0.47 | % | | | 0.54 | % | |
| Net investment income | | | 2.16 | % | | | 3.02 | % | | | 3.66 | % | | | 3.58 | %(e) | | | 3.43 | % | |
| Portfolio turnover rate | | | 109 | % | | | 35 | % | | | 51 | % | | | 24 | % | | | 42 | % | |
| Net assets, end of period (000s) | | $ | 5,242 | | | $ | 7,079 | | | $ | 7,467 | | | $ | 8,849 | | | $ | 9,591 | | |
(a) Per share data was calculated using the average shares outstanding during the period.
(b) Total return at net asset value assuming all distributions reinvested and no contingent deferred sales charge.
(c) Had the Investment Manager and/or any of its affiliates not waived fees or reimbursed a portion of expenses, total return would have been reduced.
(d) Does not include expenses of the underlying investment companies in which the Portfolio invests. If these expenses were included, the expense ratios would have been higher.
(e) The benefits derived from expense reductions had an impact of less than 0.01%.
See Accompanying Notes to Financial Statements.
60
Financial Highlights – Columbia LifeGoal Income Portfolio
Selected data for a share outstanding throughout each period is as follows:
| | | Year Ended March 31, | |
| Class C Shares | | 2011 | | 2010 | | 2009 | | 2008 | | 2007 | |
| Net Asset Value, Beginning of Period | | $ | 9.88 | | | $ | 8.55 | | | $ | 9.81 | | | $ | 10.19 | | | $ | 9.97 | | |
| Income from Investment Operations: | |
| Net investment income (a) | | | 0.22 | | | | 0.28 | | | | 0.31 | | | | 0.36 | | | | 0.35 | | |
Net realized and unrealized gain (loss) on investments
and capital gains distributions received | | | 0.40 | | | | 1.33 | | | | (1.20 | ) | | | (0.36 | ) | | | 0.24 | | |
| Total from investment operations | | | 0.62 | | | | 1.61 | | | | (0.89 | ) | | | 0.00 | | | | 0.59 | | |
| Less Distributions to Shareholders: | |
| From net investment income | | | (0.22 | ) | | | (0.28 | ) | | | (0.33 | ) | | | (0.36 | ) | | | (0.36 | ) | |
| From net realized gains | | | — | | | | — | | | | (0.04 | ) | | | (0.02 | ) | | | (0.01 | ) | |
| Total distributions to shareholders | | | (0.22 | ) | | | (0.28 | ) | | | (0.37 | ) | | | (0.38 | ) | | | (0.37 | ) | |
| Net Asset Value, End of Period | | $ | 10.28 | | | $ | 9.88 | | | $ | 8.55 | | | $ | 9.81 | | | $ | 10.19 | | |
| Total return (b)(c) | | | 6.32 | % | | | 19.07 | % | | | (9.18 | )% | | | (0.05 | )% | | | 6.03 | % | |
| Ratios to Average Net Assets/Supplemental Data: | |
| Net expenses (d) | | | 1.42 | % | | | 1.42 | % | | | 1.42 | % | | | 1.42 | %(e) | | | 1.42 | % | |
| Waiver/Reimbursement | | | 0.57 | % | | | 0.58 | % | | | 0.39 | % | | | 0.47 | % | | | 0.54 | % | |
| Net investment income | | | 2.18 | % | | | 3.02 | % | | | 3.70 | % | | | 3.59 | %(e) | | | 3.44 | % | |
| Portfolio turnover rate | | | 109 | % | | | 35 | % | | | 51 | % | | | 24 | % | | | 42 | % | |
| Net assets, end of period (000s) | | $ | 5,294 | | | $ | 5,573 | | | $ | 5,104 | | | $ | 4,932 | | | $ | 4,734 | | |
(a) Per share data was calculated using the average shares outstanding during the period.
(b) Total return at net asset value assuming all distributions reinvested and no contingent deferred sales charge.
(c) Had the Investment Manager and/or any of its affiliates not waived fees or reimbursed a portion of expenses, total return would have been reduced.
(d) Does not include expenses of the underlying investment companies in which the Portfolio invests. If these expenses were included, the expense ratios would have been higher.
(e) The benefits derived from expense reductions had an impact of less than 0.01%.
See Accompanying Notes to Financial Statements.
61
Financial Highlights – Columbia LifeGoal Income Portfolio
Selected data for a share outstanding throughout each period is as follows:
| | | Year Ended March 31, | |
| Class Z Shares | | 2011 | | 2010 | | 2009 | | 2008 | | 2007 | |
| Net Asset Value, Beginning of Period | | $ | 9.91 | | | $ | 8.57 | | | $ | 9.83 | | | $ | 10.22 | | | $ | 10.00 | | |
| Income from Investment Operations: | |
| Net investment income (a) | | | 0.32 | | | | 0.38 | | | | 0.42 | | | | 0.46 | | | | 0.46 | | |
Net realized and unrealized gain (loss) on investments
and capital gains distributions received | | | 0.40 | | | | 1.34 | | | | (1.21 | ) | | | (0.37 | ) | | | 0.23 | | |
| Total from investment operations | | | 0.72 | | | | 1.72 | | | | (0.79 | ) | | | 0.09 | | | | 0.69 | | |
| Less Distributions to Shareholders: | |
| From net investment income | | | (0.32 | ) | | | (0.38 | ) | | | (0.43 | ) | | | (0.46 | ) | | | (0.46 | ) | |
| From net realized gains | | | — | | | | — | | | | (0.04 | ) | | | (0.02 | ) | | | (0.01 | ) | |
| Total distributions to shareholders | | | (0.32 | ) | | | (0.38 | ) | | | (0.47 | ) | | | (0.48 | ) | | | (0.47 | ) | |
| Net Asset Value, End of Period | | $ | 10.31 | | | $ | 9.91 | | | $ | 8.57 | | | $ | 9.83 | | | $ | 10.22 | | |
| Total return (b)(c) | | | 7.37 | % | | | 20.33 | % | | | (8.25 | )% | | | 0.85 | % | | | 7.07 | % | |
| Ratios to Average Net Assets/Supplemental Data: | |
| Net expenses (d) | | | 0.42 | % | | | 0.42 | % | | | 0.42 | % | | | 0.42 | %(e) | | | 0.42 | % | |
| Waiver/Reimbursement | | | 0.57 | % | | | 0.58 | % | | | 0.39 | % | | | 0.47 | % | | | 0.54 | % | |
| Net investment income | | | 3.20 | % | | | 4.04 | % | | | 4.60 | % | | | 4.57 | %(e) | | | 4.50 | % | |
| Portfolio turnover rate | | | 109 | % | | | 35 | % | | | 51 | % | | | 24 | % | | | 42 | % | |
| Net assets, end of period (000s) | | $ | 3,096 | | | $ | 4,475 | | | $ | 4,472 | | | $ | 5,813 | | | $ | 3,731 | | |
(a) Per share data was calculated using the average shares outstanding during the period.
(b) Total return at net asset value assuming all distributions reinvested.
(c) Had the Investment Manager and/or any of its affiliates not waived fees or reimbursed a portion of expenses, total return would have been reduced.
(d) Does not include expenses of the underlying investment companies in which the Portfolio invests. If these expenses were included, the expense ratios would have been higher.
(e) The benefits derived from expense reductions had an impact of less than 0.01%.
See Accompanying Notes to Financial Statements.
62
Notes to Financial Statements – Columbia LifeGoal Portfolios
March 31, 2011
Note 1. Organization
Columbia Funds Series Trust (the Trust) is registered under the Investment Company Act of 1940, as amended (the 1940 Act), as an open-end management investment company organized as a Delaware statutory trust. Information presented in these financial statements pertains to the following diversified series of the Trust (each, a Portfolio and collectively, the Portfolios):
Columbia LifeGoal Growth Portfolio
Columbia LifeGoal Balanced Growth Portfolio
Columbia LifeGoal Income and Growth Portfolio
Columbia LifeGoal Income Portfolio
After the close of business on April 30, 2010, Ameriprise Financial, Inc. (Ameriprise Financial) acquired a portion of the asset management business of Columbia Management Group, LLC (the Transaction), including the business of managing the Portfolios. In connection with the closing of the Transaction (the Closing), RiverSource Investments, LLC, a wholly owned subsidiary of Ameriprise Financial, became the investment manager of the Portfolios and changed its name to Columbia Management Investment Advisers, LLC (the Investment Manager).
Investment Objectives
Columbia LifeGoal Growth Portfolio seeks capital appreciation.
Columbia LifeGoal Balanced Growth Portfolio seeks total return, consisting of capital appreciation and current income.
Columbia LifeGoal Income and Growth Portfolio seeks total return, consisting of current income and modest capital appreciation.
Columbia LifeGoal Income Portfolio seeks current income, consistent with relative stability of principal.
Under normal circumstances, the Portfolios invest most of their assets in Class I shares of mutual funds managed by the Investment Manager or its affiliates (Columbia Funds), exchange traded funds (ETFs) and third party-advised funds (collectively, Underlying Funds), equity and fixed income securities, including Treasury Inflation Protected Securities (TIPS), and other instruments such as derivatives. The financial statements of the Underlying Funds in which the Portfolios invest should be read in conjunction with the Portfolios' financial statements.
Portfolio Shares
The Trust has unlimited authorized shares of beneficial interest. The Trust's Declaration of Trust authorizes the Board of Trustees to classify or reclassify any authorized but unissued shares into one or more additional classes or series of shares.
Columbia LifeGoal Growth Portfolio offers Class A, Class B, Class C, Class R, Class R4 and Class Z shares.
Columbia LifeGoal Balanced Growth Portfolio offers Class A, Class B, Class C, Class R, Class T and Class Z.
Columbia LifeGoal Income and Growth Portfolio offers Class A, Class B, Class C, Class R and Class Z shares.
Columbia LifeGoal Income Portfolio offers Class A, Class B, Class C and Class Z shares.
All share classes have identical voting, dividend and liquidation rights. Each share class has its own expense structure and sales charges, as applicable.
Class A shares are subject to a maximum front-end sales charge of 5.75% for each Portfolio with the exception of Columbia LifeGoal Income Portfolio. Columbia LifeGoal Income Portfolio is subject to a maximum front-end sales charge of 3.25% based on the initial investment amount. Class A shares purchased without an initial sales charge in accounts aggregating $1 million to $50 million at the time of purchase are subject to a 1.00% contingent deferred sales charge (CDSC) if the shares are sold within 18 months of purchase, charged as follows: 1.00% CDSC if redeemed within 12 months of purchase, and 0.50% CDSC if redeemed more than 12, but less than 18 months after purchase.
The Portfolios no longer accept investments by new or existing investors in the Portfolios' Class B shares, except in connection with the reinvestment of any dividend and/or capital gain distributions in Class B shares of each Portfolio and exchanges by existing Class B shareholders of other funds within the Columbia Family of Funds. Class B shares are subject to a maximum CDSC of 5.00% (3.00% for Columbia LifeGoal Income Portfolio) based upon the holding period after purchase. Class B shares will generally convert to Class A shares eight years after purchase.
Class C shares are subject to a 1.00% CDSC on shares redeemed within one year of purchase.
Class R shares are not subject to sales charges and are available only to qualifying institutional investors.
Columbia LifeGoal Growth Portfolio is authorized to issue Class R4 shares, which would not be subject to sales charges, however this share class is closed to new investors and new accounts. Columbia
63
Columbia LifeGoal Portfolios, March 31, 2011 (continued)
LifeGoal Growth Portfolio's Class R4 shares commenced operations on March 7, 2011.
Class T shares are subject to a maximum front-end sales charge of 5.75% based on the investment amount. Class T shares purchased without an initial sales charge in accounts aggregating $1 million to $50 million at the time of purchase are subject to a 1.00% contingent deferred sales charge (CDSC) if the shares are sold within 18 months of purchase, charged as follows: 1.00% CDSC if redeemed within 12 months of purchase, and 0.50% CDSC if redeemed more than 12, but less than 18 months after purchase. Class T shares are available only to certain investors, as described in the Portfolio's prospectus. Columbia LifeGoal Balanced Growth Portfolio's Class T shares commenced operations on March 7, 2011.
Class Z shares are not subject to sales charges and are available only to certain investors, as described in the Portfolios' prospectus.
Note 2. Summary of Significant Accounting Policies
The preparation of financial statements in accordance with U.S. generally accepted accounting principles (GAAP) requires management to make certain estimates and assumptions that affect the reported amounts of assets and liabilities, the disclosure of contingent assets and liabilities at the date of the financial statements and the reported amounts of revenue and expenses during the reporting period. Actual results could differ from those estimates.
The following is a summary of significant accounting policies consistently followed by the Portfolios in the preparation of their financial statements.
Security Valuation
Investments in the Underlying Funds are valued at the net asset value of each class of the respective Underlying Fund determined as of the close of the New York Stock Exchange on the valuation date. Exchange-traded funds are valued at the last sale price on the principal exchange on which they trade, except for securities traded on the NASDAQ, which are valued at the NASDAQ official close price. Exchange-traded funds for which there were no sales during the day are valued at the latest bid price on such exchanges.
Certain debt securities, which tend to be more thinly traded and of lesser quality, are priced based on fundamental analysis of the financial condition of the issuer and the estimated value of any collateral. Valuations developed through pricing techniques may vary from the actual amounts realized upon sale of the securities, and the potential variation may be greater for those securities valued using fundamental analysis.
Investments in securities generally are valued by pricing services approved by the Trust's Board of Trustees, based upon market transactions for normal, institutional-size trading units of similar securities. The services may use various pricing techniques which take into account appropriate factors such as yield, quality, coupon rate, maturity, type of issue, trading characteristics and other data, as well as broker quotes. Debt securities for which quotations are readily available may also be valued based upon an over-the-counter or exchange bid quotation.
Treasury Inflation Protected Securities
The Portfolios may invest in TIPS. The principal amount of TIPS is adjusted periodically and is increased for inflation or decreased for deflation based on a monthly published index. Interest payments are based on the adjusted principal at the time the interest is paid. These adjustments are recorded as interest income in the Statements of Operations.
Security Transactions
Security transactions are accounted for on the trade date. Cost is determined and gains (losses) are based upon the specific identification method for both financial statement and federal income tax purposes.
Income Recognition
Interest income is recorded on the accrual basis. Market premium and discount are amortized and accreted, respectively, on all debt securities, unless otherwise noted. Original issue discount is accreted to interest income over the life of the security with a corresponding increase in the cost basis, if any.
Income and capital gain distributions from the Underlying Funds, if any, are recorded on the ex-dividend date.
Expenses
General expenses of the Trust are allocated to the Portfolios and other series of the Trust based upon relative net assets or other expense allocation methodologies determined by the nature of the expense. Expenses directly attributable to a specific class of shares are charged to that share class. Expenses directly attributable to a Portfolio are charged to such Portfolio.
64
Columbia LifeGoal Portfolios, March 31, 2011 (continued)
Determination of Class Net Asset Value
All income, expenses (other than class-specific expenses which are charged directly to a share class, as shown in the Statements of Operations) and realized and unrealized gains (losses) are allocated to each class of the Portfolios on a daily basis, based on the relative net assets of each class, for purposes of determining the net asset value of each class.
Federal Income Tax Status
Each Portfolio intends to qualify each year as a "regulated investment company" under Subchapter M of the Internal Revenue Code, as amended, and will distribute substantially all of its income, if any, for its tax year, and as such will not be subject to federal income taxes. In addition, each Portfolio intends to distribute in each calendar year substantially all of its net investment income, capital gains and certain other amounts, if any, such that each Portfolio should not be subject to federal excise tax. Therefore, no federal income or excise tax provision is recorded.
Distributions to Shareholders
Distributions from net investment income, if any, are declared and paid quarterly for each Portfolio, except Columbia LifeGoal Income Portfolio for which distributions from net investment income, if any, are declared and paid monthly. Net realized capital gains, if any, are distributed at least annually. Income distributions and capital gain distributions are determined in accordance with federal income tax regulations which differ from GAAP.
Indemnification
Under the Trust's organizational documents and, in some cases, by contract, its officers and directors are indemnified against certain liabilities arising out of the performance of their duties to the Portfolios. In addition, certain of the Portfolios' contracts with their service providers contain general indemnification clauses. The Portfolios' maximum exposure under these arrangements is unknown since the amount of any future claims that may be made against the Portfolios cannot be determined and the Portfolios have no historical basis for predicting the likelihood of any such claims.
Note 3. Fees and Compensation Paid to Affiliates
Investment Management Fee
Under an Investment Management Services Agreement (IMSA), the Investment Manager determines which securities will be purchased, held or sold. The management fee is based on each Portfolio's average daily net assets at the following annual rates:
| | | Annual
Fee Rate | |
| Columbia LifeGoal Growth Portfolio | | | 0.25 | % | |
| Columbia LifeGoal Balanced Growth Portfolio | | | 0.25 | % | |
| Columbia LifeGoal Income and Growth Portfolio | | | 0.25 | % | |
| Columbia LifeGoal Income Portfolio | | | 0.50 | %* | |
* The Investment Manager is entitled to receive an investment management fee based on Columbia LifeGoal Income Portfolio's assets that are invested in individual securities and the Mortgage- and Asset-Backed Portfolio and the Corporate Bond Portfolio, each of which is a series of the Trust. Columbia LifeGoal Income Portfolio is not charged an advisory fee on its assets that are invested in other Columbia Funds (excluding the Mortgage- and Asset-Backed Portfolio and the Corporate Bond Portfolio. Actual management fees will be charged to Columbia LifeGoal Income Portfolio based on a weighted average of applicable underlying assets of the Portfolio).
The Investment Manager has contractually agreed to waive 0.10% of advisory fees payable by Columbia LifeGoal Income Portfolio on its assets that are invested in individual securities, the Mortgage- and Asset-Backed Portfolio and the Corporate Bond Portfolio until July 31, 2012. This expense arrangement may only be modified or amended with approval from all parties to such arrangements, including the Portfolio and the Investment Manager.
Under the IMSA, the Investment Manager has agreed to bear all fees and expenses of the Portfolios, excluding Columbia LifeGoal Income Portfolio, except investment management fees, taxes, brokerage commissions, costs of borrowing money, distribution and shareholder servicing fees and extraordinary expenses, if any (unified fee structure).
Prior to the Closing, Columbia Management Advisors, LLC (Columbia), an indirect, wholly owned subsidiary of Bank of America Corporation (BOA), provided investment management services to the Portfolios under the same fee structure.
In September 2010, the Board of Trustees approved an amended IMSA that includes an annual management fee rate that is a blend of (i) 0.00% on assets invested in Columbia proprietary funds (excluding any proprietary fund that does not pay an investment management fee to the Investment Manager), (ii) 0.10% on assets invested in non-exchange traded third party advised mutual funds and (iii) 0.40% for Columbia LifeGoal Income Portfolio and 0.55% for all other Portfolios on assets invested in all other securities, including ETFs, derivatives and individual securities. The amended IMSA was
65
Columbia LifeGoal Portfolios, March 31, 2011 (continued)
approved by the each Portfolio's shareholders at a meeting held on February 15, 2011. The amended IMSA was effective on May 1, 2011.
In connection with the amended IMSA, the unified fee structure for the Columbia LifeGoal Growth Portfolio, Columbia LifeGoal Balanced Growth Portfolio and Columbia LifeGoal Income and Growth Portfolio was terminated. Effective May 1, 2011, the Investment Manager no longer bears the fees and expenses of these Portfolios.
Administration Fee
Effective upon the Closing, the Investment Manager provides administration and accounting services to the Portfolios under an Administrative Services Agreement, including services previously performed under the Pricing and Bookkeeping Oversight and Services Agreement (the Services Agreement) as discussed in the Pricing and Bookkeeping Fees note below. The Investment Manager does not receive any compensation for its administrative services from the Portfolios, excluding Columbia LifeGoal Income Portfolio.
Columbia LifeGoal Income Portfolio pays an annual administration fee equal to 0.23% of its average daily net assets less the custody and the pricing and bookkeeping fees payable by the Portfolio. The Investment Manager has contractually agreed to waive 0.10% of administration fees payable by Columbia LifeGoal Income Portfolio on its assets that are invested in Underlying Funds (excluding the Mortgage- and Asset-Backed Portfolio and the Corporate Bond Portfolio) until July 31, 2012. This expense arrangement may only be modified or amended with approval from all parties to such arrangements, including the Portfolio and the Investment Manager. Prior to the Closing, Columbia provided administrative services to the Portfolios at the same fee rates.
In September 2010, the Board of Trustees approved an amended Administrative Services Agreement that includes an annual administration fee rate equal to 0.02% of each Portfolio's average daily net assets and would increase the administration fees payable to the Investment Manager on certain assets. The amended Administrative Services Agreement was effective on May 1, 2011.
Pricing and Bookkeeping Fees
Prior to the Closing, the Portfolios entered into a Financial Reporting Services Agreement (the Financial Reporting Services Agreement) with State Street Bank and Trust Company (State Street) and Columbia pursuant to which State Street provides financial reporting services to the Portfolios. The Portfolios also entered into an Accounting Services Agreement (collectively with the Financial Reporting Services Agreement, the State Street Agreements) with State Street and Columbia pursuant to which State Street provides accounting services to the Portfolios. Upon the Closing, Columbia assigned and delegated its rights and obligations under the State Street Agreements to the Investment Manager. Under the State Street Agreements, Columbia LifeGoal Income Portfolio pays State Street an annual fee of $26,000 paid monthly. Columbia LifeGoal Income Portfolio also reimburses State Street for certain out-of-pocket expenses and charges. Except for Columbia LifeGoal Income Portfolio, the Portfolios do not pay any separate fees for services rendered under the State Street Agreements, and, except for Columbia LifeGoal Income Portfolio, the fees for pricing and bookkeeping services incurred by the Portfolios are paid as part of the management fee.
Effective May 1, 2011, the fees for pricing and bookkeeping services are no longer paid as part of the management fee for LifeGoal Growth Portfolio, LifeGoal Balanced Growth Portfolio and LifeGoal Income and Growth Portfolio. These Portfolios pay State Street an annual fee of $26,000 paid monthly and reimburse State Street for certain out of pocket expenses directly from the their assets. In addition, effective May 15, 2011, these services are provided under the Administrative Services Agreement for Columbia LifeGoal Growth Portfolio.
Also prior to the Closing, the Portfolios entered into the Services Agreement with Columbia. Under the Services Agreement, Columbia provided services related to Portfolio expenses and the requirements of the Sarbanes-Oxley Act of 2002, and provided oversight of the accounting and financial reporting services provided by State Street. Under the Services Agreement, Columbia LifeGoal Income Portfolio reimbursed Columbia for out-of-pocket expenses and charges, including fees payable to third parties, such as for pricing the Portfolio's portfolio securities, incurred by Columbia in the performance of services under the Services Agreement. The Services Agreement was terminated upon the Closing. These services are now provided under the Administrative Services Agreement discussed above.
Transfer Agent Fee
In connection with the Closing, RiverSource Service Corporation, a wholly owned subsidiary of Ameriprise Financial, provides transfer agency services to the Portfolios under a Transfer Agency Agreement and changed its name to Columbia Management Investment Services Corp. (the Transfer Agent). The Transfer Agent has contracted with Boston Financial Data Services (BFDS) to serve as sub-transfer agent.
The Transfer Agent receives from Columbia LifeGoal Income Portfolio monthly account-based service fees based on the number of
66
Columbia LifeGoal Portfolios, March 31, 2011 (continued)
open accounts and is reimbursed by Columbia LifeGoal Income Portfolio for the fees and expenses the Transfer Agent pays to financial intermediaries that maintain omnibus accounts with Columbia LifeGoal Income Portfolio that is a percentage of the average aggregate value of the Portfolio's shares maintained in each such omnibus account (other than omnibus accounts for which American Enterprise Investment Services Inc. is the broker of record or accounts where the beneficial shareholder is a customer of Ameriprise Financial Services, Inc., which are paid a per account fee). The Transfer Agent pays the fees of BFDS for services as sub-transfer agent and, is not entitled to reimbursement for such fees from Columbia LifeGoal Income Portfolio (with the exception of out-of pocket fees). The Transfer Agent also receives from Columbia LifeGoal Income Portfolio compensation from fees for various shareholder services and reimbursements for certain out-of -pocket expenses.
Prior to the Closing, Columbia Management Services, Inc., an affiliate of Columbia and an indirect, wholly owned subsidiary of BOA, provided transfer agency services to the Portfolios and contracted with BFDS to serve as sub-transfer agent, under the same fee structure.
Effective May 1, 2011, Columbia LifeGoal Growth Portfolio, Columbia LifeGoal Balanced Growth Portfolio and Columbia LifeGoal Income and Growth Portfolio pay transfer agency fees under the fee structure described above. Effective May 1, 2011, total transfer agent fees for Class R4 shares of Columbia LifeGoal Growth Portfolio are subject to an annual limitation of not more than 0.05% of the average daily net assets attributable to the Class R4 shares.
For the year ended March 31, 2011, Columbia LifeGoal Income Portfolio's effective transfer agent fee rate was 0.15% of the Portfolio's average daily net assets.
An annual minimum account balance fee of $20 may apply to certain accounts with a value below each Portfolio's initial minimum investment requirements to reduce the impact of small accounts on transfer agent fees. These minimum account balance fees are recorded as part of expense reductions on the Statements of Operations. For the year ended March 31, 2011, no minimum account balance fees were charged by the Portfolios.
Plan Administration Fee
Under a Plan Administration Services Agreement with the Transfer Agent, the Columbia LifeGoal Growth Portfolio pays an annual fee at a rate of 0.25% of the Portfolio's average daily net assets attributable to Class R4 shares for the provision of various administrative, recordkeeping, communication and educational services.
Underwriting Discounts, Service and Distribution Fees
In connection with the Closing, RiverSource Fund Distributors, Inc., an indirect wholly owned subsidiary of Ameriprise Financial, provides distribution and shareholder services to the Portfolios and changed its name to Columbia Management Investment Distributors, Inc. (the Distributor). Pursuant to Rule 12b-1 under the 1940 Act, the Board of Trustees has approved, and the Portfolios have adopted, distribution and shareholder service plans (the Plans) which set the distribution and service fees for the Portfolios. These fees are calculated daily and are intended to compensate the Distributor and/or eligible selling and/or servicing agents for selling shares of the Portfolios and providing services to investors.
The Plans require the payment of a combined distribution and shareholder servicing fee for the Class A shares of each Portfolio. The Plans also require the payment of a monthly shareholder servicing fee and distribution fee for the Class B and Class C shares of each Portfolio and a monthly distribution fee for the Class R shares of Columbia LifeGoal Growth Portfolio, Columbia LifeGoal Balanced Growth Portfolio and Columbia LifeGoal Income and Growth Portfolio. A substantial portion of the expenses incurred pursuant to these plans may be paid to affiliates of the Distributor. The annual rates in effect and plan limits, as a percentage of average daily net assets are as follows:
| | | Current
Rate | | Plan
Limit | |
Class A Combined Distribution and
Shareholder Servicing Plan | | | 0.25 | % | | | 0.25 | % | |
Class B and Class C Shareholder
Servicing Plans | | | 0.25 | % | | | 0.25 | % | |
Class B and Class C
Distribution Plans | | | 0.75 | % | | | 0.75 | % | |
| Class R Distribution Plan | | | 0.50 | % | | | 0.50 | % | |
Prior to the Closing, Columbia Management Distributors, Inc., an affiliate of Columbia and an indirect, wholly owned subsidiary of BOA, was the principal underwriter of the Portfolios' shares. There were no changes to the underwriting discount structure of the Portfolios or the service or distribution fee rates paid by the Portfolios as a result of the Transaction.
67
Columbia LifeGoal Portfolios, March 31, 2011 (continued)
Shareholder Services Fees
Columbia LifeGoal Balanced Growth Portfolio has adopted a shareholder services plan that permits it to pay for certain services provided to Class T shareholders by their selling and/or servicing agents. The Portfolio may pay shareholder servicing fees up to an aggregate annual rate of 0.50% of the Portfolio's average daily net assets attributable to Class T shares (comprised of up to 0.25% for shareholder liaison services and up to 0.25% for administrative support services). These fees are currently limited to an aggregate annual rate of not more than 0.30% of the Portfolio's average daily net assets attributable to Class T shares.
Sales Charges
Sales charges, including front-end and CDSCs, received by the Distributor for distributing Portfolio shares were as follows:
| | | Front-End Sales Charge | | Contingent Deferred Sales Charge | |
| | | Class A | | Class A | | Class B | | Class C | |
| Columbia LifeGoal Growth Portfolio | | $ | 44,019 | | | $ | 4 | | | $ | 67,582 | | | $ | 5,859 | | |
| Columbia LifeGoal Balanced Growth Portfolio | | | 88,517 | | | | — | | | | 99,464 | | | | 5,151 | | |
| Columbia LifeGoal Income and Growth Portfolio | | | 17,709 | | | | — | | | | 25,995 | | | | 1,302 | | |
| Columbia LifeGoal Income Portfolio | | | 1,357 | | | | — | | | | 2,546 | | | | 229 | | |
Fee Waivers and Expense Reimbursements
Effective August 1, 2010, the Investment Manager and certain of its affiliates have contractually agreed to waive fees or reimburse expenses of Columbia LifeGoal Income Portfolio, through July 31, 2011, so that the Portfolio's ordinary operating expenses (excluding certain expenses described below), after giving effect to any balance credits or overdraft charges from the Portfolio's custodian, do not exceed the annual rates of 0.67%, 1.42%, 1.42% and 0.42% of the Portfolio's average daily net assets attributable to Class A, Class B, Class C and Class Z shares, respectively. The following expenses are excluded from Columbia LifeGoal Income Portfolio's ordinary operating expenses when calculating the cap, and therefore will be paid by the Portfolio: taxes (including foreign transaction taxes), expenses associated with investment in other pooled investment vehicles (including exchange traded funds and other affiliated and unaffiliated mutual funds), transaction costs and brokerage commissions, costs related to any securities lending program, dividend expenses associated with securities sold short, inverse floater program fees and expenses, transaction charges and interest on borrowed money, interest, extraordinary expenses, investment management services fees and any other expenses the exclusion of which is specifically approved by Columbia LifeGoal Income Portfolio's Board. This agreement may be modified or amended only with approval from all parties.
For the period May 1, 2010 through July 31, 2010, the Investment Manager contractually agreed to bear a portion of Columbia LifeGoal Income Portfolio's expenses so that the Portfolio's ordinary operating expenses (excluding any distribution and service fees, brokerage commissions, interest, taxes, extraordinary expenses and expenses associated with the Portfolio's investments in other investment companies, but including custodian charges relating to overdrafts, if any), after giving effect to any balance credits from the Portfolio's custodian, did not exceed 0.42% annually of the Portfolio's average daily net assets. Prior to May 1, 2010, Columbia contractually agreed to reimburse a portion of Columbia LifeGoal Income Portfolio's expenses in the same manner.
Effective May 1, 2011, the Investment Manager and certain of its affiliates have contractually agreed to waive fees or reimburse expenses of each Portfolio, through July 31, 2012, so that the Portfolios' ordinary operating expenses (excluding certain expenses
68
Columbia LifeGoal Portfolios, March 31, 2011 (continued)
described below), after giving effect to any balance credits or overdraft charges from the Portfolios' custodian, do not exceed the following annual rates, based on each Portfolio's average daily net assets:
| | | Annual Rates | |
| | | Class A | | Class B | | Class C | | Class R | | Class R4 | | Class T | | Class Z | |
| Columbia LifeGoal Growth Portfolio | | | 0.45 | % | | | 1.20 | % | | | 1.20 | % | | | 0.70 | % | | | 0.39 | % | | | N/A | | | | 0.20 | % | |
| Columbia LifeGoal Balanced Growth Portfolio | | | 0.51 | % | | | 1.26 | % | | | 1.26 | % | | | 0.76 | % | | | N/A | | | | 0.56 | % | | | 0.26 | % | |
| Columbia LifeGoal Income and Growth Portfolio | | | 0.51 | % | | | 1.26 | % | | | 1.26 | % | | | 0.76 | % | | | N/A | | | | N/A | | | | 0.26 | % | |
| Columbia LifeGoal Income Portfolio | | | 0.51 | % | | | 1.26 | % | | | 1.26 | % | | | N/A | | | | N/A | | | | N/A | | | | 0.26 | % | |
The contractual annual rates above replace the contractual annual rates that were in effect for Columbia LifeGoal Income Portfolio on May 1, 2011. The following expenses are excluded from the Portfolios' ordinary operating expenses when calculating the cap, and therefore will be paid by the Portfolios: taxes (including foreign transaction taxes), expenses associated with investment in other pooled investment vehicles (including exchange traded funds and other affiliated and unaffiliated mutual funds), transaction costs and brokerage commissions, costs related to any securities lending program, dividend expenses associated with securities sold short, inverse floater program fees and expenses, transaction charges and interest on borrowed money, interest, extraordinary expenses, investment management services fees and any other expenses the exclusion of which is specifically approved by the Portfolios' Board of Trustees. This agreement may be modified or amended only with approval from all parties. Merger costs are treated as extraordinary expenses and therefore not subject to the Portfolios' expense limits.
Fees Paid to Officers and Trustees
In connection with the Closing, all officers of the Portfolios are employees of the Investment Manager or its affiliates and, with the exception of the Portfolios' Chief Compliance Officer, receive no compensation from the Portfolios. The Board of Trustees has appointed a Chief Compliance Officer to the Portfolios in accordance with federal securities regulations. Columbia LifeGoal Income Portfolio, along with other affiliated funds, pays its pro-rata share of the expenses associated with the Chief Compliance Officer. Columbia LifeGoal Income Portfolio's expenses for the Chief Compliance Officer will not exceed $15,000 per year. Prior to the Closing, all officers of the Portfolios were employees of Columbia or its affiliates and Columbia LifeGoal Income Portfolio paid its pro-rata share of the expenses for the Chief Compliance Officer under the same fee structure.
Trustees are compensated for their services to the Portfolios, as set forth on the Statements of Operations for Columbia LifeGoal Income Portfolio. The Trust's eligible Trustees may participate in a non-qualified deferred compensation plan which may be terminated at any time. Any payments to plan participants are paid solely out of Columbia LifeGoal Income Portfolio's assets. Income earned on the plan participant's deferral account is based on the rate of return of the eligible mutual funds selected by the participant or, if no funds are selected, on the rate of return of Columbia Money Market Fund (formerly known as RiverSource Cash Management Fund). Prior to the Closing, if no funds were selected, income earned on the plan participant's deferral account was based on the rate of return of BofA Treasury Reserves. The expense for the deferred compensation plan, which includes trustees' fees deferred during the current period as well as any gains or losses on the trustees' deferred compensation balances as a result of market fluctuations, is included in "Trustees' fees" on the Statements of Operations. The liability for the deferred compensation plan is included in "Trustees' fees" on the Statements of Assets and Liabilities.
69
Columbia LifeGoal Portfolios, March 31, 2011 (continued)
Note 4. Portfolio Information
The cost of purchases and proceeds from sales of securities, excluding short-term obligations, for the year ended March 31, 2011, were as follows:
| | | U.S Government Securities | | Other Investment Securities | |
| | | Purchases | | Sales | | Purchases | | Sales | |
| Columbia LifeGoal Growth Portfolio | | $ | — | | | $ | — | | | $ | 135,775,348 | | | $ | 192,251,513 | | |
| Columbia LifeGoal Balanced Growth Portfolio | | | 15,759,801 | | | | 7,505,318 | | | | 362,866,765 | | | | 457,426,153 | | |
| Columbia LifeGoal Income and Growth Portfolio | | | 5,968,795 | | | | 2,028,080 | | | | 113,468,652 | | | | 141,791,369 | | |
| Columbia LifeGoal Income Portfolio | | | 1,514,418 | | | | 184,379 | | | | 29,543,071 | | | | 36,506,632 | | |
Note 5. Shareholder Concentration
As of March 31, 2011, certain shareholder accounts of record owned more than 10% of the outstanding shares of one or more of the Portfolios. Purchase and redemption activity of these accounts may have a significant effect on the operations of the Funds. The number of accounts and aggregate percentages of shares outstanding held therein are as follows:
| | | Number of
Shareholders | | % of Shares
Outstanding
Held | |
Columbia LifeGoal
Growth Portfolio | | | 1 | | | | 58.8 | | |
Columbia LifeGoal Balanced
Growth Portfolio | | | 1 | | | | 65.7 | | |
Columbia LifeGoal Income
and Growth Portfolio | | | 1 | | | | 57.2 | | |
Columbia LifeGoal
Income Portfolio | | | 1 | | | | 53.2 | | |
Note 6. Line of Credit
Prior to March 28, 2011, the Portfolios and other affiliated funds participate in a $280,000,000 committed, unsecured revolving line of credit provided by State Street. Effective March 28, 2011, the commitment was reduced to $225,000,000. The maximum amount that may be borrowed by any fund is limited to the lesser of $200,000,000 and the Portfolio's borrowing limit set forth in the Portfolio's registration statement. Borrowings are available for short-term liquidity or temporary or emergency purposes.
Effective October 14, 2010, interest is charged to each participating fund based on each fund's borrowings at a rate per annum equal to the greater of the Federal Funds Rate plus 1.25% or the overnight LIBOR Rate plus 1.25%. In addition, a commitment fee of 0.125% per annum is accrued and apportioned among the participating funds pro rata based on their relative net assets.
Prior to October 14, 2010, interest was charged to each participating fund at the same rates. In addition, a commitment fee of 0.15% per annum was accrued and apportioned among the participating funds pro rata based on their relative net assets.
For the year ended March 31, 2011, LifeGoal Balanced Growth Portfolio borrowed under these arrangements. The average daily loan balance outstanding on days where borrowing existed was $1,000,000 at a weighted average interest rate of 1.49%.
Note 7. Federal Tax Information
The timing and character of income and capital gain distributions are determined in accordance with income tax regulations, which may differ from GAAP. Reclassifications are made to each Portfolio's capital accounts for permanent tax differences to reflect income and gains available for distribution (or available capital loss carryforwards) under income tax regulations.
70
Columbia LifeGoal Portfolios, March 31, 2011 (continued)
For the year ended March 31, 2011, permanent book and tax basis differences resulting primarily from differing treatments for short term capital gain distributions received from underlying funds were identified and reclassified among the components of each Portfolio's net assets as follows:
| | | Undistributed
Net Investment
Income | | Accumulated
Net Realized
Loss | | Paid-in Capital | |
| Columbia LifeGoal Growth Portfolio | | $ | 27,768 | | | $ | (27,768 | ) | | $ | — | | |
| Columbia LifeGoal Balanced Growth Portfolio | | | 22,471 | | | | (22,470 | ) | | | (1 | ) | |
| Columbia LifeGoal Income and Growth Portfolio | | | 19,453 | | | | (19,453 | ) | | | — | | |
| Columbia LifeGoal Income Portfolio | | | 5,798 | | | | (5,798 | ) | | | — | | |
Net investment income and net realized gains (losses), as disclosed on the Statements of Operations, and net assets were not affected by these reclassifications.
The tax character of distributions paid during the year ended March 31, 2011 was as follows:
| | | Ordinary
Income* | | Long-Term
Capital Gains | | Tax Return
of Capital | |
| Columbia LifeGoal Growth Portfolio | | $ | 1,834,980 | | | $ | — | | | $ | — | | |
| Columbia LifeGoal Balanced Growth Portfolio | | | 8,061,698 | | | | — | | | | — | | |
| Columbia LifeGoal Income and Growth Portfolio | | | 3,056,864 | | | | — | | | | — | | |
| Columbia LifeGoal Income Portfolio | | | 746,417 | | | | — | | | | — | | |
* For tax purposes short-term capital gains distributions, if any, are considered ordinary income distributions.
The tax character of distributions paid during the year ended March 31, 2010 was as follows:
| | | Ordinary
Income* | | Long-Term
Capital Gains | | Tax Return
of Capital | |
| Columbia LifeGoal Growth Portfolio | | $ | 582,425 | | | $ | — | | | $ | — | | |
| Columbia LifeGoal Balanced Growth Portfolio | | | 11,246,591 | | | | — | | | | — | | |
| Columbia LifeGoal Income and Growth Portfolio | | | 4,022,943 | | | | — | | | | — | | |
| Columbia LifeGoal Income Portfolio | | | 1,066,508 | | | | — | | | | — | | |
* For tax purposes short-term capital gains distributions, if any, are considered ordinary income distributions.
71
Columbia LifeGoal Portfolios, March 31, 2011 (continued)
As of March 31, 2011, the components of distributable earnings on a tax basis were as follows:
| | | Undistributed
Ordinary
Income | | Undistributed
Long-Term
Capital Gains | | Net Unrealized
Appreciation* | |
| Columbia LifeGoal Growth Portfolio | | $ | 180,416 | | | $ | — | | | $ | 71,403,767 | | |
| Columbia LifeGoal Balanced Growth Portfolio | | | 328,801 | | | | — | | | | 79,583,594 | | |
| Columbia LifeGoal Income and Growth Portfolio | | | 134,173 | | | | — | | | | 8,876,617 | | |
| Columbia LifeGoal Income Portfolio | | | 34,279 | | | | — | | | | 656,019 | | |
* The differences between book-basis and tax-basis net unrealized appreciation/depreciation are primarily due to deferral of losses from wash sales.
Unrealized appreciation and depreciation at March 31, 2011, based on cost of investments for federal income tax purposes, were:
| | | Unrealized
Appreciation | | Unrealized
Depreciation | | Net Unrealized
Appreciation | |
| Columbia LifeGoal Growth Portfolio | | $ | 77,353,407 | | | $ | (5,949,640 | ) | | $ | 71,403,767 | | |
| Columbia LifeGoal Balanced Growth Portfolio | | | 81,504,806 | | | | (1,921,212 | ) | | | 79,583,594 | | |
| Columbia LifeGoal Income and Growth Portfolio | | | 9,341,410 | | | | (464,793 | ) | | | 8,876,617 | | |
| Columbia LifeGoal Income Portfolio | | | 664,050 | | | | (8,031 | ) | | | 656,019 | | |
The following capital loss carryforwards may be available to reduce taxable income arising from future net realized gains on investments, if any, to the extent permitted by the Internal Revenue Code:
| | | Year of Expiration | |
| | | 2017 | | 2018 | | 2019 | | Total | |
| Columbia LifeGoal Growth Portfolio | | $ | 40,958,553 | | | $ | 32,807,517 | | | $ | 1,731,444 | | | $ | 75,497,514 | | |
| Columbia LifeGoal Balanced Growth Portfolio | | | 3,179,917 | | | | 48,686,674 | | | | — | | | | 51,866,591 | | |
| Columbia LifeGoal Income and Growth Portfolio | | | — | | | | 5,895,816 | | | | — | | | | 5,895,816 | | |
| Columbia LifeGoal Income Portfolio | | | 197,204 | | | | 666,391 | | | | — | | | | 863,595 | | |
Capital loss carryforwards that were utilized by the Portfolios during the year ended March 31, 2011 were as follows:
| Columbia LifeGoal Balanced Growth Portfolio | | $ | 24,230,854 | | |
| Columbia LifeGoal Income and Growth Portfolio | | | 5,852,538 | | |
| Columbia LifeGoal Income Portfolio | | | 228,412 | | |
Under current tax rules, certain currency (and capital) losses realized after October 31 may be deferred and treated as occurring on the first day of the following fiscal year. As of March 31, 2011, post-October capital losses attributed to security transactions were deferred to April 1, 2011 as follows:
| Columbia LifeGoal Income Portfolio | | $ | 5,058 | | |
Management of the Portfolios has concluded that there are no significant uncertain tax positions that would require recognition in
72
Columbia LifeGoal Portfolios, March 31, 2011 (continued)
the financial statements. However, management's conclusion may be subject to review and adjustment at a later date based on factors including, but not limited to, new tax laws, regulations, and administrative interpretations (including relevant court decisions). The Portfolios' federal tax returns for the prior three fiscal years remain subject to examination by the Internal Revenue Service.
Note 8. Significant Risks and Contingencies
Allocation Risk
Each Portfolio uses an asset allocation strategy in pursuing its investment objective. There is a risk that a Portfolio's allocation among asset classes or investments will cause the Portfolio to under-perform other funds with similar investment objectives, or that the investments themselves will not produce the returns expected.
Investing in Other Funds Risk
The performance of the Underlying Funds in which the Portfolios invest could be adversely affected if other entities investing in the same Underlying Funds make relatively large investments or redemptions in the Underlying Funds. Because the expenses and costs of the Underlying Funds are shared by the Portfolios, redemptions by other investors in the Underlying Funds could result in decreased economies of scale and increased operating expenses for the Portfolios. In addition, the Advisor has the authority to change the Underlying Funds in which the Portfolios invest or to change the percentage of each Portfolio's investments allocated to each Underlying Fund. If an Underlying Fund pays fees to the Investment Manager, such fees could result in the Advisor having a potential conflict of interest in selecting the Underlying Funds in which the Portfolios invest or in determining the percentage of the Portfolios' investments allocated to each Underlying Fund.
Smaller Company Securities Risk
Securities of small- or mid-capitalization companies ("smaller companies") may have a higher potential for gains than securities of large-capitalization companies but also may involve more risk. Smaller companies may be more vulnerable to market downturns and adverse economic events than larger, more established companies because smaller companies may have more limited financial resources and business operations. Their securities may trade less frequently and in smaller volumes and may be less liquid and fluctuate more sharply in value than securities of larger companies.
Value Securities Risk
Certain Underlying Funds invest in value securities, which are securities of companies that may have experienced adverse business, industry or other developments that have caused the securities to be potentially undervalued. There is the risk that the market value of a portfolio security may not meet the Investment Manager's future value assessment of that security. There is also a risk that it may take longer than expected for the value of these investments to rise to the believed value. In addition, value securities at times may not perform as well as growth securities or the stock market in general.
Interest Rate Risk
Certain Underlying Funds invest in debt securities, which are subject to interest rate risk. In general, if prevailing interest rates rise, the values of debt securities will tend to fall, and if interest rates fall, the values of debt securities will tend to rise. Changes in the value of a debt security may affect the value of the Underlying Fund's shares. Interest rate risk is generally greater for debt securities with longer maturities/durations.
Credit Risk
Certain Underlying Funds are subject to credit risk, which applies to most debt securities, but is generally not a factor for obligations backed by the "full faith and credit" of the U.S. Government. The Underlying Fund could lose money if the issuer of a debt security is unable or perceived to be unable to pay interest or principal when it becomes due. Various factors could affect the issuer's actual or perceived ability to make timely interest or principal payments, including changes in the issuer's financial condition or in general economic conditions. Debt securities backed by an issuer's taxing authority may be subject to legal limits on the issuer's ability to increase taxes or otherwise to raise revenue. Certain debt securities are backed only by revenues derived from a particular project, and thus may have a greater risk of default.
Low and Below Investment Grade Securities Risk
Certain Underlying Funds invest in debt securities with the lowest investment grade rating or that are below investment grade. These securities are more speculative than securities with higher ratings, and tend to be more sensitive to credit risk particularly during a downturn in the economy. These securities typically pay a premium in the form of a higher interest rate or yield because of the increased risk of loss, including default. These securities also are generally less liquid than higher-rated securities.
73
Columbia LifeGoal Portfolios, March 31, 2011 (continued)
Foreign Securities Risk
Certain Underlying Funds invest in foreign securities which involves certain additional risks. These risks may involve foreign currency exchange rate fluctuations, adverse political and economic developments or foreign governmental laws or restrictions. In addition, the liquidity of foreign securities may be more limited than that of domestic securities. Investments in emerging market countries are subject to additional risk as these countries are more likely to experience high levels of inflation, deflation or currency devaluation which could hurt their economies and securities markets.
Asset-Backed Securities Risk
The value of asset-backed securities may be affected by, among other factors, changes in interest rates, the market's assessment of the quality of underlying assets, the creditworthiness of the servicer for the underlying assets, factors concerning the interests in and structure of the issuer or the originator of the underlying assets, or the creditworthiness or rating of the entities that provide any supporting letters of credit, surety bonds, derivative instruments, or other credit enhancement. The value of asset-backed securities also will be affected by the exhaustion, termination or expiration of any credit enhancement. Most asset-backed securities are subject to prepayment risk, which is the possibility that the underlying debt may be refinanced or prepaid prior to maturity during periods of declining or low interest rates, causing a fund to have to reinvest the money received in securities that have lower yields. In addition, the impact of prepayments on the value of asset-backed securities may be difficult to predict and may result in greater volatility.
Mortgage-Backed Securities Risk
The value of mortgage-backed securities may be affected by, among other things, changes in interest rates, factors concerning the interests in and structure of the issuer or the originator of the mortgages, the creditworthiness of the entities that provide any supporting letters of credit, surety bonds or other credit enhancements or the quality of underlying assets or the market's assessment thereof. Mortgage-backed securities are subject to prepayment risk, which is the possibility that the underlying mortgage may be refinanced or prepaid prior to maturity during periods of declining or low interest rates, causing the Portfolios to have to reinvest the money received in securities that have lower yields. In addition, the impact of prepayments on the value of mortgage-backed securities may be difficult to predict and may result in greater volatility.
Note 9. Subsequent Events
Management has evaluated the events and transactions that have occurred through the date the financial statements were issued, other than as noted below and in Note 3 above, there were no items requiring adjustment of the financial statements or additional disclosure.
Effective May 16, 2011, the line of credit commitment with State Street was reduced to $150,000,000, and the maximum amount that may be borrowed by any fund was limited to the lesser of $120,000,000 and each Portfolio's borrowing limit set forth in each Portfolio's registration statement.
Note 10. Information Regarding Pending and Settled Legal Proceedings
In June 2004, an action captioned John E. Gallus et al. v. American Express Financial Corp. and American Express Financial Advisors Inc. was filed in the United States District Court for the District of Arizona. The plaintiffs allege that they are investors in several American Express Company (now known as RiverSource) mutual funds and they purport to bring the action derivatively on behalf of those funds under the Investment Company Act of 1940. The plaintiffs allege that fees allegedly paid to the defendants by the funds for investment advisory and administrative services are excessive. The plaintiffs seek remedies including restitution and rescission of investment advisory and distribution agreements. The plaintiffs voluntarily agreed to transfer this case to the United States District Court for the District of Minnesota (the District Court). In response to defendants' motion to dismiss the complaint, the District Court dismissed one of plaintiffs' four claims and granted plaintiffs limited discovery. Defendants moved for summary judgment in April 2007. Summary judgment was granted in the defendants' favor on July 9, 2007. The plaintiffs filed a notice of appeal with the Eighth Circuit Court of Appeals (the Eighth Circuit) on August 8, 2007. On April 8, 2009, the Eighth Circuit reversed summary judgment and remanded to the District Court for further proceedings. On August 6, 2009, defendants filed a writ of certiorari with the U.S. Supreme Court (the Supreme Court), asking the Supreme Court to stay the District Court proceedings while the Supreme Court considers and rules in a case captioned Jones v. Harris Associates, which involves issues of law similar to those presented in the Gallus case. On March 30, 2010, the Supreme Court issued its ruling in Jones v. Harris Associates, and on April 5, 2010, the Supreme Court vacated the Eighth Circuit's decision in the Gallus case and remanded the case to the Eighth Circuit for further consideration in light of the Supreme Court's decision in
74
Columbia LifeGoal Portfolios, March 31, 2011 (continued)
Jones v. Harris Associates. On June 4, 2010, the Eighth Circuit remanded the Gallus case to the District Court for further consideration in light of the Supreme Court's decision in Jones v. Harris Associates. On December 9, 2010, the District Court reinstated its July 9, 2007, summary judgment order in favor of the defendants. On January 10, 2011, plaintiffs filed a notice of appeal with the Eighth Circuit.
In December 2005, without admitting or denying the allegations, American Express Financial Corporation (AEFC, which is now known as Ameriprise Financial, Inc. (Ameriprise Financial)), entered into settlement agreements with the Securities and Exchange Commission (SEC) and Minnesota Department of Commerce (MDOC) related to market timing activities. As a result, AEFC was censured and ordered to cease and desist from committing or causing any violations of certain provisions of the Investment Advisers Act of 1940, the Investment Company Act of 1940, and various Minnesota laws. AEFC agreed to pay disgorgement of $10 million and civil money penalties of $7 million. AEFC also agreed to retain an independent distribution consultant to assist in developing a plan for distribution of all disgorgement and civil penalties ordered by the SEC in accordance with various undertakings detailed at http://www.sec.gov/litigation/admin/ia-2451.pdf. Ameriprise Financial and its affiliates have cooperated with the SEC and the MDOC in these legal proceedings, and have made regular reports to the RiverSource, Seligman and Threadneedle funds' Boards of Directors/Trustees.
Ameriprise Financial and certain of its affiliates have historically been involved in a number of legal, arbitration and regulatory proceedings, including routine litigation, class actions, and governmental actions, concerning matters arising in connection with the conduct of their business activities. Ameriprise Financial believes that the Funds are not currently the subject of, and that neither Ameriprise Financial nor any of its affiliates are the subject of, any pending legal, arbitration or regulatory proceedings that are likely to have a material adverse effect on the Funds or the ability of Ameriprise Financial or its affiliates to perform under their contracts with the Funds. Ameriprise Financial is required to make 10-Q, 10-K and, as necessary, 8-K filings with the Securities and Exchange Commission on legal and regulatory matters that relate to Ameriprise Financial and its affiliates. Copies of these filings may be obtained by accessing the SEC website at www.sec.gov.
There can be no assurance that these matters, or the adverse publicity associated with them, will not result in increased fund redemptions, reduced sale of fund shares or other adverse consequences to the Funds. Further, although we believe proceedings are not likely to have a material adverse effect on the Funds or the ability of Ameriprise Financial or its affiliates to perform under their contracts with the Funds, these proceedings are subject to uncertainties and, as such, we are unable to estimate the possible loss or range of loss that may result. An adverse outcome in one or more of these proceedings could result in adverse judgments, settlements, fines, penalties or other relief that could have a material adverse effect on the consolidated financial condition or results of operations of Ameriprise Financial.
75
Report of Independent Registered Public Accounting Firm
To the Shareholders and Trustees of Columbia Funds Series Trust
In our opinion, the accompanying statements of assets and liabilities, including the investment portfolios, and the related statements of operations and of changes in net assets and the financial highlights present fairly, in all material respects, the financial positions of Columbia LifeGoal Growth Portfolio, Columbia LifeGoal Balanced Growth Portfolio, Columbia LifeGoal Income and Growth Portfolio, and Columbia LifeGoal Income Portfolio (constituting part of Columbia Funds Series Trust, hereafter referred to as the "Portfolios") at March 31, 2011, the results of their operations and, the changes in each of their net assets, and the financial highlights for each of the periods indicated, in conformity with accounting principles generally accepted in the United States of America. These financial statements and financial highlights (hereafter referred to as "financial statements") are the responsibility of the Portfolios' management. Our responsibility is to express an opinion on these financial statements based on our audits. We conducted our audits of these financial statements in accordance with the standards of the Public Company Accounting Oversight Board (United States). Those standards require that we plan and perform the audits to obtain reasonable assurance about whether the financial statements are free of material misstatement. An audit includes examining, on a test basis, evidence supporting the amounts and disclosures in the financial statements, assessing the accounting principles used and significant estimates made by management, and evaluating the overall financial statement presentation. We believe that our audits, which included confirmation of securities at March 31, 2011 by correspondence with the transfer agent of the underlying funds, custodian and brokers, provide a reasonable basis for our opinion.
PricewaterhouseCoopers LLP
Boston, Massachusetts
May 20, 2011
76
Federal Income Tax Information (Unaudited) – Columbia LifeGoal Portfolios
Columbia LifeGoal Growth Portfolio
For non-corporate shareholders 100.00%, or the maximum amount allowable under the Jobs and Growth Tax Relief Reconciliation Act of 2003, of ordinary income distributed by the Portfolio for the fiscal year ended March 31, 2011 may represent qualified dividend income.
100.00% of the ordinary income distributed by the Portfolio for the fiscal year ended March 31, 2011, qualifies for the corporate dividends received deduction.
The Portfolio will notify shareholders in January 2012 of amounts for use in preparing 2011 income tax returns.
Columbia LifeGoal Balanced Growth Portfolio
For non-corporate shareholders 40.94%, or the maximum amount allowable under the Jobs and Growth Tax Relief Reconciliation Act of 2003, of ordinary income distributed by the Portfolio for the fiscal year ended March 31, 2011 may represent qualified dividend income.
22.90% of the ordinary income distributed by the Portfolio for the fiscal year ended March 31, 2011, qualifies for the corporate dividends received deduction.
The Portfolio will notify shareholders in January 2012 of amounts for use in preparing 2011 income tax returns.
Columbia LifeGoal Income and Growth Portfolio
For non-corporate shareholders 15.40%, or the maximum amount allowable under the Jobs and Growth Tax Relief Reconciliation Act of 2003, of ordinary income distributed by the Fund for the fiscal year ended March 31, 2011 may represent qualified dividend income.
11.36% of the ordinary income distributed by the Fund for the fiscal year ended March 31, 2011, qualifies for the corporate dividends received deduction.
The Portfolio will notify shareholders in January 2012 of amounts for use in preparing 2011 income tax returns.
Columbia LifeGoal Income Portfolio
For non-corporate shareholders 10.68%, or the maximum amount allowable under the Jobs and Growth Tax Relief Reconciliation Act of 2003, of ordinary income distributed by the Fund for the fiscal year ended March 31, 2011 may represent qualified dividend income.
8.25% of the ordinary income distributed by the Fund for the fiscal year ended March 31, 2011, qualifies for the corporate dividends received deduction.
The Portfolio will notify shareholders in January 2012 of amounts for use in preparing 2011 income tax returns.
77
Fund Governance
The Trustees serve terms of indefinite duration. The names, addresses and birth years of the Trustees and Officers of the Funds in the Columbia Funds Series Trust, the year each was first elected or appointed to office, their principal business occupations during at least the last five years, the number of Funds overseen by each Trustee and other directorships they hold are shown below. Each officer listed below serves as an officer of each Fund in the Columbia Funds Series Trust.
Independent Trustees
Name, Address and Year of Birth,
Position with Funds, Year First
Elected or Appointed to Office | | Principal Occupation(s) During Past Five Years, Number of Funds in the Columbia
Funds Complex Overseen by Trustee, Other Directorships Held
| |
| Edward J. Boudreau, Jr. (Born 1944) | |
|
c/o Columbia Management
Investment Advisers, LLC
225 Franklin Street
Boston, MA 02110
Trustee (since 2005) | | Managing Director—E.J. Boudreau & Associates (consulting), from 2000 through current; oversees 41; Trustee—BofA Funds Series Trust. | |
|
| William P. Carmichael (Born 1943) | |
|
c/o Columbia Management
Investment Advisers, LLC
225 Franklin Street
Boston, MA 02110
Trustee (since 1999) | | Retired; oversees 41; Director—Cobra Electronics Corporation (electronic equipment manufacturer); Director—McMoRan Exploration Company (oil and gas exploration and development); Director—The Finish Line (athletic shoes and apparel); Trustee—BofA Funds Series Trust. | |
|
| William A. Hawkins (Born 1942) | |
|
c/o Columbia Management
Investment Advisers, LLC
225 Franklin Street
Boston, MA 02110
Trustee (since 2005) | | Managing Director—Overton Partners (financial consulting), August 2010 to present; President and Chief Executive Officer—California General Bank, N.A., from January 2008 through August 2010; oversees 41; Trustee—BofA Funds Series Trust. | |
|
| R. Glenn Hilliard (Born 1943) | |
|
c/o Columbia Management
Investment Advisers, LLC
225 Franklin Street
Boston, MA 02110
Trustee (since 2005) | | Chairman and Chief Executive Officer—Hilliard Group LLC (investing and consulting), from April 2003 through current; oversees 41; Trustee—BofA Funds Series Trust. | |
|
| John J. Nagorniak (Born 1944) | |
|
c/o Columbia Management
Investment Advisers, LLC
225 Franklin Street
Boston, MA 02110
Trustee (since 2008) | | Retired; President and Director—Foxstone Financial, Inc. (consulting), 2000 through December 2007; Director—Mellon Financial Corporation affiliates (investing), 2000 through 2007; Chairman—Franklin Portfolio Associates (investing—Mellon affiliate), 1982 through 2007; oversees 41; Director—MIT Investment Company; Trustee—MIT 401k Plan; Trustee—Research Foundation of CFA Institute; Trustee—BofA Fund Series Trust. | |
|
78
Fund Governance (continued)
Independent Trustees (continued)
Name, Address and Year of Birth,
Position with Funds, Year First
Elected or Appointed to Office | | Principal Occupation(s) During Past Five Years, Number of Funds in the Columbia
Funds Complex Overseen by Trustee, Other Directorships Held
| |
| Minor M. Shaw (Born 1947) | |
|
c/o Columbia Management
Investment Advisers, LLC
225 Franklin Street
Boston, MA 02110
Trustee (since 2003) | | President—Micco Corporation and Mickel Investment Group; oversees 41; Board Member—Piedmont Natural Gas; Trustee—BofA Funds Series Trust. | |
|
Interested Trustee
| Anthony M. Santomero1 (Born 1946) | |
|
c/o Columbia Management
Investment Advisers, LLC
225 Franklin Street
Boston, MA 02110
Trustee (since 2008) | | Richard K. Mellon Professor Emeritus of Finance, The Wharton School, University of Pennsylvania, from 2002 through current; Senior Advisor—McKinsey & Company (consulting), July 2006 through January 2008; President and Chief Executive Officer—Federal Reserve Bank of Philadelphia, July 2000 through April 2006; oversees 41; Director—Renaissance Reinsurance Ltd; Trustee—Penn Mutual Life Insurance Company; Director—Citigroup, Inc.; Director—Citibank, N.A.; Trustee—BofA Funds Series Trust. | |
|
1 Dr. Santomero is currently deemed by the Columbia Funds to be an "interested person" (as defined in the 1940 Act) of the Funds because he serves as a Director of Citigroup, Inc. and Citibank, N.A., companies that may directly or through subsidiaries and affiliates engage from time-to-time in brokerage execution, principal transactions and lending relationships with the Columbia Funds or other funds or accounts advised/managed by the Columbia Management Investment Advisers, LLC.
The Statement of Additional Information includes additional information about the Trustees of the Funds and is available, without charge, upon request by calling 800-345-6611.
Officers
| Name, Year of Birth and Address | | Principal Occupation(s) During the Past Five Years | |
| J. Kevin Connaughton (Born 1964) | |
|
225 Franklin Street
Boston, MA 02110
President (since 2009) | | Senior Vice President and General Manager—Mutual Fund Products, Columbia Management Investment Advisers, LLC since May 2010; President, Columbia Funds, since 2009, and RiverSource Funds, since May 2010 (previously Senior Vice President and Chief Financial Officer, Columbia Funds, from June 2008 to January 2009, Treasurer, Columbia Funds, from October 2003 to May 2008, and senior officer of various other affiliated funds since 2000); Managing Director, Columbia Management Advisors, LLC from December 2004 to April 2010. | |
|
| Michael G. Clarke (Born 1969) | |
|
225 Franklin Street
Boston, MA 02110
Treasurer (since 2011) and
Chief Financial Officer (since 2009) | | Vice President, Columbia Management Investment Advisers, LLC since May 2010; Managing Director of Fund Administration, Columbia Management Advisors, LLC, from September 2004 to April 2010; senior officer of Columbia Funds and affiliated funds since 2002. | |
|
79
Fund Governance (continued)
Officers (continued)
| Name, Year of Birth and Address | | Principal Occupation(s) During the Past Five Years | |
| Scott R. Plummer (Born 1959) | |
|
5228 Ameriprise Financial Center
Minneapolis, MN 55474
Senior Vice President and
Chief Legal Officer (since 2010) | | Chief Legal Officer and Assistant Secretary, Columbia Management Investment Advisers, LLC since June 2005; Vice President and Lead Chief Counsel—Asset Management, Ameriprise Financial, Inc. since May 2010 (previously Vice President and Chief Counsel—Asset Management, from 2005 to April 2010, and Vice President—Asset Management Compliance from 2004 to 2005); Vice President, Chief Counsel and Assistant Secretary, Columbia Management Investment Distributors, Inc. since 2008; Vice President, General Counsel and Secretary, Ameriprise Certificate Company since 2005; Chief Counsel, RiverSource Distributors, Inc. since 2006; Vice President, General Counsel and Secretary, RiverSource Funds, since December 2006; Senior Vice President, Secretary and Chief Legal Officer, Columbia Funds, since May 2010. | |
|
| Linda J. Wondrack (Born 1964) | |
|
225 Franklin Street
Boston, MA 02110
Senior Vice President and
Chief Compliance Officer (since 2007) | | Vice President and Chief Compliance Officer, Columbia Management Investment Advisers, LLC since May 2010; Chief Compliance Officer, Columbia Funds, since 2007, and RiverSource Funds, since May 2010; Director (Columbia Management Group, LLC and Investment Product Group Compliance), Bank of America, from June 2005 to April 2010. | |
|
| William F. Truscott (Born 1960) | |
|
53600 Ameriprise Financial Center
Minneapolis, MN 55474
Senior Vice President (since 2010) | | Chairman of the Board, Columbia Management Investment Advisers, LLC since May 2010 (previously President, Chairman of the Board and Chief Investment Officer, from 2001 to April 2010); Chief Executive Officer, U.S. Asset Management & President, Annuities, Ameriprise Financial, Inc. since May 2010 (previously President—U.S. Asset Management and Chief Investment Officer from 2005 to April 2010, and Senior Vice President—Chief Investment Officer, from 2001 to 2005); Director, President and Chief Executive Officer, Ameriprise Certificate Company since 2006; Director, Columbia Management Investment Distributors, Inc. since May 2010 (previously Chairman of the Board and Chief Executive Officer from 2008 to April 2010); Chairman of the Board and Chief Executive Officer, RiverSource Distributors, Inc. since 2006. | |
|
| Colin Moore (Born 1958) | |
|
225 Franklin Street
Boston, MA 02110
Senior Vice President (since 2010) | | Director and Chief Investment Officer, Columbia Management Investment Advisers, LLC since May 2010; Manager, Managing Director and Chief Investment Officer of Columbia Management Advisors, LLC from 2007 to April 2010; Head of Equities, Columbia Management Advisors, LLC from 2002 to 2007. | |
|
| Michael A. Jones (Born 1959) | |
|
225 Franklin Street
Boston, MA 02110
Senior Vice President (since 2010) | | President and Director, Columbia Management Investment Advisers, LLC since May 2010; President and Director, Columbia Management Investment Distributors, Inc. since May 2010; Manager, Chairman, Chief Executive Officer and President, Columbia Management Advisors, LLC from 2007 to April 2010; Chief Executive Officer, President and Director, Columbia Management Distributors, Inc. from November 2006 to April 2010; previously, co-president and senior managing director at Robeco Investment Management. | |
|
80
Fund Governance (continued)
Officers (continued)
| Name, Year of Birth and Address | | Principal Occupation(s) During the Past Five Years | |
| Christopher O. Petersen (Born 1970) | |
|
5228 Ameriprise Financial Center
Minneapolis, MN 55474
Vice President and
Secretary (since 2011) | | Vice President and Chief Counsel, Ameriprise Financial since January 2010 (formerly Vice President and Group Counsel or Counsel from April 2004 to January 2010); Assistant Secretary of RiverSource Funds since January 2007. | |
|
| Amy Johnson (Born 1965) | |
|
5228 Ameriprise Financial Center
Minneapolis, MN 55474
Vice President (since 2010) | | Senior Vice President and Chief Operating Officer, Columbia Management Investment Advisers, LLC since May 2010 (previously Chief Administrative Officer, from 2009 until April 2010, Vice President—Asset Management and Trust Company Services, from 2006 to 2009, and Vice President—Operations and Compliance from 2004 to 2006). | |
|
| Joseph F. DiMaria (Born 1968) | |
|
225 Franklin Street
Boston, MA 02110
Vice President (since 2011) and
Chief Accounting Officer (since 2008) | | Vice President, Mutual Fund Administration, Columbia Management Investment Advisers, LLC, since May 2010; Director of Fund Administration, Columbia Management Advisors, LLC from January 2006 to April 2010; Head of Tax/Compliance and Assistant Treasurer, Columbia Management Advisors, LLC, from November 2004 to December 2005. | |
|
| Paul B. Goucher (Born 1968) | |
|
5228 Ameriprise Financial Center
Minneapolis, MN 55474
Vice President and
Assistant Treasurer (since 2010) | | Vice President and Chief Counsel of Ameriprise Financial since January 2010 (formerly Vice President and Group Counsel from November 2008 to January 2010); Director, Managing Director and General Counsel of J. & W. Seligman & Co. Incorporated (Seligman) from July 2008 to November 2008 and Managing Director and Associate General Counsel of Seligman from January 2005 to July 2008. | |
|
| Michael E. DeFao (Born 1968) | |
|
5228 Ameriprise Financial Center
Minneapolis, MN 55474
Vice President and
Assistant Treasurer (since 2011) | | Vice President and Chief Counsel, Ameriprise Financial since May 2010; Associate General Counsel Bank of America from June 2005 to April 2010 | |
|
| Stephen T. Welsh (Born 1957) | |
|
225 Franklin Street
Boston, MA 02110
Vice President (since 2006) | | President and Director, Columbia Management Investment Services Corp. since May 2010; President and Director, Columbia Management Services, Inc. from July 2004 to April 2010; Managing Director, Columbia Management Distributors, Inc. from August 2007 to April 2010. | |
|
81
Shareholder Meeting Results
At a Joint Special Meeting of Shareholders held on February 15, 2011, shareholders of the Portfolios considered the proposals described below.
Proposal 1.a. Shareholders of the Columbia LifeGoal® Growth Portfolio approved a proposed amendment to the Investment Management Services Agreement with Columbia Management Investment Advisers, LLC, as follows:
| Votes For | | Votes Against | | Abstentions | | Broker Non-Votes | |
| | 12,992,379 | | | | 371,393 | | | | 394,818 | | | | 5,317,690 | | |
Proposal 1.b. Shareholders of the Columbia LifeGoal® Balanced Growth Portfolio approved a proposed amendment to the Investment Management Services Agreement with Columbia Management Investment Advisers, LLC, as follows:
| Votes For | | Votes Against | | Abstentions | | Broker Non-Votes | |
| | 20,982,670 | | | | 688,306 | | | | 596,552 | | | | 6,440,076 | | |
Proposal 1.c. Shareholders of the Columbia LifeGoal® Income and Growth Portfolio approved a proposed amendment to the Investment Management Services Agreement with Columbia Management Investment Advisers, LLC, as follows:
| Votes For | | Votes Against | | Abstentions | | Broker Non-Votes | |
| | 5,613,930 | | | | 212,829 | | | | 134,853 | | | | 1,694,826 | | |
Proposal 1.d. Shareholders of the Columbia LifeGoal® Income Portfolio approved a proposed amendment to the Investment Management Services Agreement with Columbia Management Investment Advisers, LLC, as follows:
| Votes For | | Votes Against | | Abstentions | | Broker Non-Votes | |
| | 1,075,406 | | | | 49,715 | | | | 59,653 | | | | 324,419 | | |
82
Shareholder Meeting Results (continued)
Proposal 2. Shareholders of Columbia Funds Series Trust elected each of the nominees for trustees to the Board of Trustees of Columbia Funds Series Trust, each to hold office for an indefinite term, as follows:
| Trustee | | Votes For | | Votes Withheld | | Abstentions | |
| Kathleen Blatz | | | 2,145,636,122 | | | | 248,012,438 | | | | 0 | | |
| Edward J. Boudreau, Jr. | | | 2,145,430,114 | | | | 248,218,446 | | | | 0 | | |
| Pamela G. Carlton | | | 2,145,515,949 | | | | 248,132,612 | | | | 0 | | |
| William P. Carmichael | | | 2,145,038,695 | | | | 248,609,866 | | | | 0 | | |
| Patricia M. Flynn | | | 2,145,843,563 | | | | 247,804,997 | | | | 0 | | |
| William A. Hawkins | | | 2,145,359,401 | | | | 248,289,160 | | | | 0 | | |
| R. Glenn Hilliard | | | 2,145,079,400 | | | | 248,569,161 | | | | 0 | | |
| Stephen R. Lewis, Jr. | | | 2,145,092,209 | | | | 248,556,351 | | | | 0 | | |
| John F. Maher | | | 2,145,621,338 | | | | 248,027,223 | | | | 0 | | |
| John J. Nagorniak | | | 2,145,337,494 | | | | 248,311,067 | | | | 0 | | |
| Catherine James Paglia | | | 2,145,615,254 | | | | 248,033,306 | | | | 0 | | |
| Leroy C. Richie | | | 2,145,042,120 | | | | 248,606,441 | | | | 0 | | |
| Anthony M. Santomero | | | 2,145,088,174 | | | | 248,560,386 | | | | 0 | | |
| Minor M. Shaw | | | 2,145,430,762 | | | | 248,217,798 | | | | 0 | | |
| Alison Taunton-Rigby | | | 2,145,393,384 | | | | 248,255,177 | | | | 0 | | |
| William F. Truscott | | | 2,144,907,223 | | | | 248,741,338 | | | | 0 | | |
83
This page intentionally left blank.
Important Information About This Report
The fund mails one shareholder report to each shareholder address. If you would like more than one report, please call shareholder services at 1-800-345-6611 and additional reports will be sent to you. This report has been prepared for shareholders of Columbia LifeGoal Portfolios.
A description of the policies and procedures that the fund uses to determine how to vote proxies and a copy of the fund's voting records are available (i) at www.columbiamanagement.com, (ii) on the Securities and Exchange Commission's website at www.sec.gov, and (iii) without charge, upon request, by calling 1-800-368-0346. Information regarding how the fund voted proxies relating to portfolio securities during the 12-month period ended June 30 is available from the SEC's website. Information regarding how the fund voted proxies relating to portfolio securities is also available from the fund's website, www.columbiamanagement.com.
The fund files a complete schedule of portfolio holdings with the SEC for the first and third quarters of each fiscal year on Form N-Q. The fund's Form N-Q is available on the SEC's website at www.sec.gov and may be reviewed and copied at the SEC's Public Reference Room in Washington, D.C. Information on the operation of the Public Reference Room may be obtained by calling 1-800-SEC-0330.
Transfer Agent
Columbia Management Investment
Services Corp.
P.O. Box 8081
Boston, MA 02266-8081
1-800-345-6611
Distributor
Columbia Management Investment
Distributors, Inc.
225 Franklin Street
Boston, MA 02110
Investment Manager
Columbia Management Investment Advisers, LLC
225 Franklin Street
Boston, MA 02110
85

PRSRT STD
U.S. Postage
PAID
Holliston, MA
Permit NO. 20
Columbia LifeGoal Portfolios
P. O. Box 8081
Boston, MA 02266-8081
columbiamanagement.com
This information is for use with concurrent or prior delivery of a fund prospectus. Investors should consider the investment objectives, risks, charges and expenses of a mutual fund carefully before investing. For a free prospectus, which contains this and other important information about the funds, visit columbiamanagement.com. Read the prospectus carefully before investing. The Fund is distributed by Columbia Management Investment Distributors, Inc., member FINRA, and managed by Columbia Management Investment Advisers, LLC.
© 2011 Columbia Management Investment Advisers, LLC. All rights reserved.
C-1056 A (05/11)

Columbia Asset Allocation Fund II
Annual Report for the Period Ended March 31, 2011
Not FDIC insured • No bank guarantee • May lose value
Table of Contents
| Fund Profile | | | 1 | | |
|
| Economic Update | | | 2 | | |
|
| Performance Information | | | 4 | | |
|
| Understanding Your Expenses | | | 5 | | |
|
| Portfolio Managers' Report | | | 6 | | |
|
| Investment Portfolio | | | 8 | | |
|
Statement of Assets and
Liabilities | | | 10 | | |
|
| Statement of Operations | | | 12 | | |
|
Statement of Changes in
Net Assets | | | 13 | | |
|
| Financial Highlights | | | 15 | | |
|
| Notes to Financial Statements | | | 19 | | |
|
Report of Independent Registered
Public Accounting Firm | | | 29 | | |
|
| Federal Income Tax Information | | | 30 | | |
|
| Fund Governance | | | 31 | | |
|
| Shareholder Meeting Results | | | 35 | | |
|
Important Information About
This Report | | | 37 | | |
|
The views expressed in this report reflect the current views of the respective parties. These views are not guarantees of future performance and involve certain risks, uncertainties and assumptions that are difficult to predict, so actual outcomes and results may differ significantly from the views expressed. These views are subject to change at any time based upon economic, market or other conditions and the respective parties disclaim any responsibility to update such views. These views may not be relied on as investment advice and, because investment decisions for a Columbia Fund are based on numerous factors, may not be relied on as an indication of trading intent on behalf of any particular Columbia Fund. References to specific securities should not be construed as a recommendation or investment advice.
President's Message

Dear Shareholder:
The Columbia Management story began over 100 years ago, and today, we are one of the nation's largest dedicated asset managers. The recent acquisition by Ameriprise Financial, Inc. brings together the talents, resources and capabilities of Columbia Management with those of RiverSource Investments, Threadneedle (acquired by Ameriprise in 2003) and Seligman Investments (acquired by Ameriprise in 2008) to build a best-in-class asset management business that we believe is truly greater than its parts.
RiverSource Investments traces its roots to 1894 when its then newly-founded predecessor, Investors Syndicate, offered a face-amount savings certificate that gave small investors the opportunity to build a safe and secure fund for retirement, education or other special needs. A mutual fund pioneer, Investors Syndicate launched Investors Mutual Fund in 1940. In the decades that followed, its mutual fund products and services lineup grew to include a full spectrum of styles and specialties. More than 110 years later, RiverSource continues to be a trusted financial products leader.
Threadneedle, a leader in global asset management and one of Europe's largest asset managers, offers sophisticated international experience from a dedicated U.K. management team. Headquartered in London, it is named for Threadneedle Street in the heart of the city's financial district, where British investors pioneered international and global investing. Threadneedle was acquired in 2003 and today operates as an affiliate of Columbia Management.
Seligman Investments' beginnings date back to the establishment of the investment firm J. & W. Seligman & Co. in 1864. In the years that followed, Seligman played a major role in the geographical expansion and industrial development of the United States. In 1874, President Ulysses S. Grant named Seligman as fiscal agent for the U.S. Navy—an appointment that would last through World War I. Seligman helped finance the westward path of the railroads and the building of the Panama Canal. The firm organized its first investment company in 1929 and began managing its first mutual fund in 1930. In 2008, J. & W. Seligman & Co. Incorporated was acquired and Seligman Investments became an offering brand of RiverSource Investments, LLC.
We are proud of the rich and distinctive history of these firms, the strength and breadth of products and services they offer, and the combined cultures of pioneering spirit and forward thinking. Together we are committed to providing more for our shareholders than ever before.
> A singular focus on our shareholders
Our business is asset management, so investors are our first priority. We dedicate our resources to identifying timely investment opportunities and provide a comprehensive choice of equity, fixed-income and alternative investments to help meet your individual needs.
> First-class research and thought leadership
We are dedicated to helping you take advantage of today's opportunities and anticipate tomorrow's. We stay abreast of the latest investment trends and ideas, using our collective insight to evaluate events and transform them into solutions you can use.
> A disciplined investment approach
We aren't distracted by passing fads. Our teams adhere to a rigorous investment process that helps ensure the integrity of our products and enables you and your financial advisor to match our solutions to your objectives with confidence.
When you choose Columbia Management, you can be confident that we will take the time to understand your needs and help you and your financial advisor identify the solutions that are right for you. Because at Columbia Management, we don't consider ourselves successful unless you are.
Sincerely,

J. Kevin Connaughton
President, Columbia Funds
Investors should consider the investment objectives, risks, charges and expenses of a mutual fund carefully before investing. For a free prospectus, which contains this and other important information about the funds, visit www.columbiamanagement.com. The prospectus should be read carefully before investing.
Columbia Funds are distributed by Columbia Management Investment Distributors, Inc., member FINRA, and managed by Columbia Management Investment Advisers, LLC.
© 2011 Columbia Management Investment Advisers, LLC. All rights reserved.
Fund Profile – Columbia Asset Allocation Fund II
Summary
g For the 12-month period that ended March 31, 2011, the fund's Class A shares returned 13.59% without sales charge.
g The equity side of the portfolio beat its benchmark, the Russell 1000 Index,1 while the fixed-income side of the portfolio trailed the Barclay's Capital Aggregate Bond Index.2 The fund beat the average return of the funds in its peer group, the Lipper Mixed-Asset Target Allocation Growth Classification.3
g An overweight in equities, coupled with investments in high-yield bonds and investment-grade corporate issues, helped results.
Portfolio Management
Anwiti Bahuguna, PhD has co-managed the fund since 2009. From 2002 until joining Columbia Management Investment Advisers, LLC (the Investment Manager) in May 2010, Ms. Bahuguna was associated with the fund's previous investment adviser as an investment professional.
Kent M. Bergene has co-managed the fund since 2010. From 1981 until joining the Investment Manager in May 2010, Mr. Bergene was associated with the fund's previous investment adviser as an investment professional.
David Joy has co-managed the fund since 2010. From 2003 until joining the Investment Manager in May 2010, Mr. Joy was associated with the fund's previous investment adviser as an investment professional.
Colin Moore has co-managed the fund since 2009. From 2002 until joining the Investment Manager in May 2010, Mr. Moore was associated with the fund's previous investment adviser as an investment professional.
Kent M. Peterson, PhD has co-managed the fund since 2009. From 2006 until joining the Investment Manager in May 2010, Mr. Peterson was associated with the fund's previous investment adviser as an investment professional.
Marie M. Schofield, CFA has co-managed the fund since 2009. From 1990 until joining the Investment Manager in May 2010, Ms. Schofield was associated with the fund's previous investment adviser as an investment professional.
1The Russell 1000 Index tracks the performance of 1,000 of the largest U.S. companies, based on market capitalization.
2The Barclays Capital Aggregate Bond Index is a market value-weighted index that tracks the daily price, coupon, pay-downs, and total return performance of fixed-rate, publicly placed, dollar-denominated, and non-convertible investment grade debt issues with at least $250 million par amount outstanding and with at least one year to final maturity.
3Lipper Inc., a widely respected data provider in the industry, calculates an average total return (assuming reinvestment of distributions) for mutual funds with investment objectives similar to those of the fund. Lipper makes no adjustment for the effect of sales loads.
Indices are not available for investment, are not professionally managed and do not reflect sales charges, fees, brokerage commissions, taxes or other expenses of investing. Securities in the fund may not match those in an index.
Performance data quoted represents past performance and current performance may be lower or higher. Past performance is no guarantee of future results. The investment return and principal value will fluctuate so that shares, when redeemed, may be worth more or less than the original cost. Please visit www.columbiamanagement.com for daily and most recent month-end performance updates.
Summary
1-year return as of 03/31/11
| | | | +13.59% | |
|
|  | | | Class A shares
(without sales charge) | |
|
| | | | +16.69% | |
|
|  | | | Russell 1000 Index | |
|
| | | | +5.12% | |
|
|  | | | Barclays Capital Aggregate Bond Index | |
|
1
Economic Update – Columbia Asset Allocation Fund II
Summary
For the 12-month period that ended March 31, 2011
g The U.S. stock market, as measured by the S&P 500 Index, delivered solid returns, despite a summer 2010 correction. Foreign stock market returns were also positive, as measured by the MSCI EAFE Index (Net).
| S&P Index | | MSCI Index | |
|
 | |  | |
|
g Strengthening economic growth and rising interest rates kept a lid on most bond market sectors. The Barclays Capital Aggregate Bond Index delivered modest results. However, high-yield bonds were strong performers, as measured by the JPMorgan Developed BB High Yield Index.
Barclays
Aggregate Index | | JPMorgan
Index | |
|
 | |  | |
|
The U.S. economy continued to expand at a solid but uneven pace over the past 12 months, as measured by gross domestic product (GDP). Although lackluster second quarter 2010 GDP growth raised fears that the economy was losing steam and might lapse back into recession, the pace picked up in the third quarter of 2010, inspiring confidence among consumers, businesses and investors. GDP expanded by 2.6% in the third quarter and 3.1% in the fourth quarter. With the Federal Reserve Board (the Fed) providing additional monetary stimulus to shore up economic growth and the extension of key tax cuts for the next two years, expectations are for continued growth in 2011. However, early estimates of first quarter 2011 growth place it just under 2.0%, a disappointment after two strong quarters and a pick-up in employment.
Consumer spending on cars, clothing and other goods generally trended higher during the 12-month period, accelerating in the fourth quarter. Holiday spending rose 5.5% between November 5, 2010 and December 24, 2010, in all retail categories, excluding automobiles, compared with the same period in 2009, according to MasterCard Advisors' SpendingPulse, which tracks spending on all transactions including cash. Personal income surged in January 2011 as payroll tax cuts kicked in. The personal savings rate edged higher, ending February 2011, the last month for which data was available, at 5.8%.
News on the job front was increasingly positive. A good portion of the jobs added in March, April and May of 2010 were temporary, government-sponsored census positions, which began to unwind in June, July and August of 2010. However, private sector payroll employment began to trend higher in the third quarter, massive layoffs declined and job growth turned solidly positive, with the addition of 444,000 new jobs in the first quarter of 2011.
Despite some glimmers of improvement early in 2010, the housing market remained troublesome throughout the period. Both new and existing home sales fell after a federal tax credit for new and repeat homebuyers expired. Distressed properties pressured prices and foreclosures continued—another drag on prices. The inventory of unsold homes ended the period higher than it started, at 8.9 and 8.6 months for both new and existing homes, respectively, according to the National Association of Realtors and a joint release from the U.S. Census Bureau and the U.S. Department of Housing and Urban Development. The new year brought more disappointing news: Existing home sales fell in January 2011 after three months of sustained improvement. Tight credit and weak appraisals were cited as possible reasons for the decline.
Reports from the business side of the economy were generally positive. A key measure of the nation's manufacturing situation—the Institute for Supply Management's Index—took a somewhat surprising turn higher in the final months of the period. Technology spending rose 12% in 2010, according to the NPD Group, a national marketing research firm. Purchases of computers, networking and software returned to prerecession levels. Industrial production rose over the period, and manufacturing capacity utilized, per the report issued by the Fed—a key measure of the health of the manufacturing sector—edged higher.
2
Economic Update (continued) – Columbia Asset Allocation Fund II
Stocks moved higher despite summer 2010 decline
Against a strengthening economic backdrop, stock prices continued to rally despite a summer 2010 setback linked to a debt crisis brewing in Europe, which raised concerns among U.S. investors. These fears were short-lived and stocks regained their footing. In this environment, the S&P 500 Index1 returned 15.65% for the 12 months through March 31, 2011. Outside the United States, stock markets also delivered solid gains. The MSCI EAFE Index (Net),2 a broad gauge of stock market performance in foreign developed markets, returned 10.42% (in U.S. dollars) for the 12-month period, as concerns about the impact of a bailout for weak euro zone economies eased yet continued to restrain market performance. Emerging stock markets were strong. The MSCI Emerging Markets Index (Net)3 returned 18.46% (in U.S. dollars) for the 12-month period.
Bonds delivered modest returns
As the economy strengthened and interest rates edged higher, most bond sectors delivered modest returns. The Barclays Capital Aggregate Bond Index4 returned 5.12%. High-yield bonds led the fixed-income markets. For the 12 months covered by this report, the JPMorgan Developed BB High Yield Index5 returned 13.04% as default fears abated and investors grew more comfortable with risk. Despite rising yields in the second half of the period, the Treasury market was also positive. The Barclays Capital U.S. Treasury Index6 returned 4.53%. However, municipal bonds struggled in the second half of the period, as interest rates inched higher and issue supply surged ahead of the year-end expiration of the Build America Bonds program. The Barclays Capital Municipal Bond Index7 gained 1.63% for the period. Despite positive economic activity, the Fed kept a key short-term interest rate—the federal funds rate—close to zero, reflecting ongoing concerns about employment and the housing market.
Past performance is no guarantee of future results.
1The Standard & Poor's (S&P) 500 Index tracks the performance of 500 widely held, large-capitalization U.S. stocks.
2The Morgan Stanley Capital International Europe, Australasia, Far East (MSCI EAFE) Index (Net) is a free float-adjusted market capitalization index that is designed to measure the equity market performance of developed markets, excluding the U.S. & Canada. As of December 31, 2010, the MSCI EAFE Index (Net) consisted of the following 22 developed market country indices: Australia, Austria, Belgium, Denmark, Finland, France, Germany, Greece, Hong Kong, Ireland, Israel, Italy, Japan, the Netherlands, New Zealand, Norway, Portugal, Singapore, Spain, Sweden, Switzerland and the United Kingdom.
3The Morgan Stanley Capital International Emerging Markets (MSCI EM) Index (Net) is a free float-adjusted market capitalization index that is designed to measure equity market performance of emerging markets. As of December 31, 2010, the MSCI EM Index (Net) consisted of the following 21 emerging market country indices: Brazil, Chile, China, Colombia, Czech Republic, Egypt, Hungary, India, Indonesia, Korea, Malaysia, Mexico, Morocco, Peru, Philippines, Poland, Russia, South Africa, Taiwan, Thailand and Turkey.
4The Barclays Capital Aggregate Bond Index is a market value-weighted index that tracks the daily price, coupon, pay-downs and total return performance of fixed-rate, publicly placed, dollar-denominated and non-convertible investment grade debt issues with at least $250 million par amount outstanding and with at least one year to final maturity.
5The JPMorgan Developed BB High Yield Index is an unmanaged index designed to mirror the investable universe of the U.S. dollar developed, BB-rated, high yield corporate debt market.
6The Barclays Capital U.S. Treasury Index includes public obligations of the U.S. Treasury. Treasury bills are excluded by the maturity constraint. In addition, certain special issues, such as state and local government series bonds (SLGs), as well as U.S. Treasury TIPS, are excluded. STRIPS are excluded from the index because their inclusion would result in double-counting.
7The Barclays Capital Municipal Bond Index is considered representative of the broad market for investment-grade, tax-exempt bonds with a maturity of at least one year.
Indices are not available for investment, are not professionally managed and do not reflect sales charges, fees, brokerage commissions, taxes or other expenses of investing. Securities in the fund may not match those in an index.
3
Performance Information – Columbia Asset Allocation Fund II
Performance data quoted represents past performance and current performance may be lower or higher. Past performance is no guarantee of future results. The investment return and principal value will fluctuate so that shares, when redeemed, may be worth more or less than the original cost. Please visit www.columbiamanagement.com for daily and most recent month-end performance updates.
Performance of a $10,000 investment 04/01/01 – 03/31/11
The chart above shows the change in value of a hypothetical $10,000 investment in Class A shares of Columbia Asset Allocation Fund II during the stated time period, and does not reflect the deduction of taxes that a shareholder may pay on fund distributions or on the redemption of fund shares.
Performance of a $10,000 investment 04/01/01 – 03/31/11 ($)
| Sales charge | | without | | with | |
| Class A | | | 13,968 | | | | 13,165 | | |
| Class B | | | 12,939 | | | | 12,939 | | |
| Class C | | | 12,946 | | | | 12,946 | | |
| Class Z | | | 14,299 | | | | n/a | | |
Average annual total return as of 03/31/11 (%)
| Share class | | A | | B | | C | | Z | |
| Inception | | 01/18/94 | | 07/15/98 | | 11/11/96 | | 05/21/99 | |
| Sales charge | | without | | with | | without | | with | | without | | with | | without | |
| 1-year | | | 13.59 | | | | 7.06 | | | | 12.71 | | | | 7.71 | | | | 12.72 | | | | 11.72 | | | | 13.90 | | |
| 5-year | | | 3.32 | | | | 2.10 | | | | 2.55 | | | | 2.19 | | | | 2.56 | | | | 2.56 | | | | 3.59 | | |
| 10-year | | | 3.40 | | | | 2.79 | | | | 2.61 | | | | 2.61 | | | | 2.62 | | | | 2.62 | | | | 3.64 | | |
The "with sales charge" returns include the maximum initial sales charge of 5.75% for Class A shares and the applicable contingent deferred sales charge of 5.00% in the first year, declining to 1.00% in the sixth year and eliminated thereafter for Class B shares and 1.00% for Class C shares for the first year only. The "without sales charge" returns do not include the effect of sales charges. If they had, returns would be lower.
Performance results reflect any fee waivers or reimbursements of fund expenses by the Investment Manager and/or any of its affiliates. Absent these fee waivers or expense reimbursement arrangements, performance results would have been lower.
All results shown assume reinvestment of distributions. Class Z shares are sold at net asset value with no distribution and service (Rule 12b-1) fees. Class Z shares have limited eligibility and the investment minimum requirements may vary. Please see the fund's prospectus for details. Performance for different share classes will vary based on differences in sales charges and fees associated with each class.
The tables do not reflect the deduction of taxes that a shareholder may pay on fund distributions or on the redemption of fund shares.
4
Understanding Your Expenses – Columbia Asset Allocation Fund II
As a fund shareholder, you incur two types of costs. There are transaction costs, which generally include sales charges on purchases and may include redemption fees or exchange fees. There are also ongoing costs, which generally include investment advisory fees, distribution and service (Rule 12b-1) fees and other fund expenses. The information on this page is intended to help you understand the ongoing costs of investing in the fund and to compare these costs with the ongoing costs of investing in other mutual funds.
Analyzing your fund's expenses by share class
To illustrate these ongoing costs, we have provided an example and calculated the expenses paid by investors in each share class during the period. The information in the following table is based on an initial investment of $1,000, which is invested at the beginning of the period and held for the entire period. Expense information is calculated two ways and each method provides you with different information. The amount listed in the "Actual" column is calculated using the fund's actual operating expenses and total return for the period. The amount listed in the "Hypothetical" column for each share class assumes that the return each year is 5% before expenses and is calculated based on the fund's actual operating expenses. You should not use the hypothetical account values and expenses to estimate either your actual account balance at the end of the period or the expenses you paid during this period.
Compare with other funds
Since all mutual funds are required to include the same hypothetical calculations about expenses in shareholder reports, you can use this information to compare the ongoing cost of investing in the fund with other funds. To do so, compare the 5% hypothetical example with the 5% hypothetical examples that appear in the shareholder reports of other funds. As you compare hypothetical examples of other funds, it is important to note that hypothetical examples are meant to highlight the ongoing costs of investing in a fund and do not reflect any transaction costs, such as sales charges, redemption fees or exchange fees.
As a shareholder of the underlying funds in which it invests, the fund will bear its allocable share of the costs and expenses of these underlying funds. These costs and expenses are not included in the fund's annualized expense ratios used to calculate the expense information below.
Estimating your actual expenses
To estimate the expenses that you paid over the period, first you will need your account balance at the end of the period:
g For shareholders who receive their account statements from Columbia Management Investment Services Corp., your account balance is available online at www.columbiamanagement.com or by calling Shareholder Services at 800.345.6611.
g For shareholders who receive their account statements from their financial intermediary, contact your financial intermediary to obtain your account balance.
1. Divide your ending account balance by $1,000. For example, if an account balance was $8,600 at the end of the period, the result would be 8.6.
2. In the section of the table below titled "Expenses paid during the period," locate the amount for your share class. You will find this number in the column labeled "Actual." Multiply this number by the result from step 1. Your answer is an estimate of the expenses you paid on your account during the period.
If the value of your account falls below the minimum initial investment requirement applicable to you, your account may be subject to a $20 annual fee. This fee is not included in the accompanying table. If you are subject to the fee, keep it in mind when you are estimating the ongoing expenses of investing in the fund and when comparing the expenses of this fund with other funds.
10/01/10 – 03/31/11
| | | Account value at the
beginning of the period ($) | | Account value at the
end of the period ($) | | Expenses paid
during the period ($) | | Fund's annualized
expense ratio (%)* | |
| | | Actual | | Hypothetical | | Actual | | Hypothetical | | Actual | | Hypothetical | | Actual | |
| Class A | | | 1,000.00 | | | | 1,000.00 | | | | 1,118.90 | | | | 1,021.74 | | | | 3.38 | | | | 3.23 | | | | 0.64 | | |
| Class B | | | 1,000.00 | | | | 1,000.00 | | | | 1,114.40 | | | | 1,018.00 | | | | 7.33 | | | | 6.99 | | | | 1.39 | | |
| Class C | | | 1,000.00 | | | | 1,000.00 | | | | 1,114.40 | | | | 1,018.00 | | | | 7.33 | | | | 6.99 | | | | 1.39 | | |
| Class Z | | | 1,000.00 | | | | 1,000.00 | | | | 1,120.60 | | | | 1,022.99 | | | | 2.06 | | | | 1.97 | | | | 0.39 | | |
Expenses paid during the period are equal to the annualized expense ratio for the share class, multiplied by the average account value over the period, then multiplied by the number of days in the fund's most recent fiscal half-year and divided by 365.
Had the Investment Manager and/or any of its affiliates not waived fees or reimbursed a portion of expenses, account value at the end of the period would have been reduced.
It is important to note that the expense amounts shown in the table are meant to highlight only ongoing costs of investing in the fund and do not reflect any transaction costs, such as sales charges, redemption fees or exchange fees. Therefore, the hypothetical examples provided may not help you determine the relative total costs of owning shares of different funds. If these transaction costs were included, your costs would have been higher.
*Expense ratios for Columbia Asset Allocation Fund II do not include fees and expenses incurred by the underlying funds.
5
Portfolio Managers' Report – Columbia Asset Allocation Fund II
Performance data quoted represents past performance and current performance may be lower or higher. Past performance is no guarantee of future results. The investment return and principal value will fluctuate so that shares, when redeemed, may be worth more or less than the original cost. Please visit www.columbiamanagement.com for daily and most recent month-end performance updates.
Net asset value per share
as of 03/31/11 ($)
| Class A | | | 21.85 | | |
| Class B | | | 21.64 | | |
| Class C | | | 21.63 | | |
| Class Z | | | 21.80 | | |
Distributions declared per share
04/01/10 – 03/31/11 ($)
| Class A | | | 2.05 | | |
| Class B | | | 1.89 | | |
| Class C | | | 1.89 | | |
| Class Z | | | 2.10 | | |
For the 12-month period that ended March 31, 2011, the fund's Class A shares returned 13.59% without sales charge. Over the same period, the fund's benchmarks, the Russell 1000 Index and the Barclays Capital Aggregate Bond Index, returned 16.69% and 5.12%, respectively. The fund's performance beat a 60%/40% blend of the returns from the Russell and Barclays indexes, which was 12.41%. An overweight in equities, which reached a high of 63% of assets, and strong performance relative to the Russell index, coupled with investments in high-yield bonds and investment grade corporate issues, helped results. The fund came out modestly ahead of the average return of the funds in its peer group, the Lipper Mixed-Asset Target Allocation Growth Classification, which was 13.14%.
Shift in fund structure
For the first eight months of the period, the fund's assets were allocated to broad equity and fixed-income asset classes. In mid-November, shareholders approved a change in the fund's structure to give the fund access to a much broader set of asset classes and managers by investing in individual mutual funds. We believe the new structure provides the potential for better diversification and added transparency for shareholders who want to track asset class results. We started using this new approach in December and by period end had investments in approximately 20 different Columbia funds. The fund now has access to funds focused on domestic and international, large-cap, mid-cap and small-cap stocks; growth and value disciplines; investment grade corporate and high-yield bonds; convertible securities; Treasuries and money market instruments, commodities, real estate and other assets. At period end, roughly 65% of investments were in large-cap stock funds and another 30% in core bond funds with the balance in cash equivalents.
Favorable backdrop for stocks
Despite a volatile start, equity markets posted strong gains for the 12-month period. Early in the period, fears around the sovereign debt crisis in Europe and the oil disaster in the Gulf of Mexico pressured returns. During the summer of 2010, worries about weak U.S. economic growth and the potential for a double-dip recession sent stocks even lower. A massive Treasury bond buyback program that began last fall helped reassure investors that the economic recovery would stay on track. Stocks rallied sharply in the fourth quarter, buoyed in part by stronger-than-expected economic data. In the first three months of 2011, neither geopolitical risks related to the unrest in the Middle East nor the devastating earthquake and tsunami in Japan could derail the market's climb.
The fund was well positioned for the equity market rebound with an overweight in equities, which we had increased during last summer's downturn. We favored U.S. stocks, which outdistanced foreign issues by a wide margin. Stock selection also was strong, with returns surpassing those in the Russell index. Our focus on higher quality stocks worked well, especially during periods of market volatility.
Disappointing fixed-income performance
Bonds posted relatively modest gains, as interest rates edged higher but stayed near historical lows. Over the year, high-yield bonds were the fixed-income market leaders. Higher-risk sectors benefited, as an improved economic outlook helped reduce the risk that issuers would default on
6
Portfolio Managers' Report (continued) – Columbia Asset Allocation Fund II
their payments to bondholders. In this environment, the fund's exposure to investment-grade corporate bonds and high-yield issues was helpful. However, security selection in these sectors was disappointing, as we prematurely trimmed exposure to higher-risk issues.
Looking ahead
We expect positive but muted economic growth, as weak housing, burdensome levels of consumer debt and high unemployment limit the full impact of monetary stimulus. Given expectations that interest rates will eventually move higher, we plan to favor equities over bonds, focusing on higher quality, large-cap U.S. stocks. At period end, the fund had an underweight relative to its target allocation in foreign developed market equity exposure and a reduced stake in emerging markets stocks, largely because of our concerns that Chinese monetary policy and inflation could have on a negative impact on global markets. Within fixed income, we believe high-yield bonds remain reasonably priced and expect to favor them over investment-grade corporate bonds. The fund ended the period with underweights in Treasuries and Treasury Inflation Products (TIPs) and neutral allocations to other areas, such as commodities and real estate investment trusts (REITs).
Portfolio characteristics and holdings are subject to change periodically and may not be representative of current characteristics and holdings. The outlook for this portfolio may differ from that presented for other Columbia Funds.
Equity securities are subject to stock market fluctuations that occur in response to economic and business developments.
Stocks of mid-cap companies pose special risks, including possible illiquidity and greater price volatility than stocks of larger, more established companies.
Investing in fixed-income securities may involve certain risks, including the credit quality of individual issuers, possible prepayments, market or economic developments and yields and share price fluctuations due to changes in interest rates. When interest rates go up, bond prices typically drop, and vice versa.
Investments in high-yield bonds (sometimes referred to as "junk" bonds) offer the potential for high current income and attractive total return, but involve certain risks. Changes in economic conditions or other circumstances may adversely affect a high-yield bond issuer's ability to make principal and interest payments.
Portfolio Allocation
as of 03/31/11 by underlying fund (%)
Columbia Large Value
Quantitative Fund | | | 34.0 | | |
| Columbia Bond Fund | | | 20.8 | | |
Columbia Corporate Income
Fund | | | 4.3 | | |
Columbia Energy and
Natural Resources Fund | | | 3.6 | | |
Columbia European Equity
Fund | | | 3.3 | | |
Columbia High Yield Bond
Fund | | | 3.0 | | |
Columbia Emerging
Markets Fund | | | 2.9 | | |
Columbia Mid Cap Growth
Fund | | | 2.3 | | |
| Columbia Mid Cap Value Fund | | | 2.3 | | |
Mortgage- and Asset-Backed
Portfolio | | | 2.1 | | |
Columbia Large Cap Growth
Fund | | | 2.1 | | |
| Columbia Large Cap Core Fund | | | 2.0 | | |
| Columbia Contrarian Core Fund | | | 2.0 | | |
Columbia Real Estate Equity
Fund | | | 1.6 | | |
Columbia Select Large Cap
Growth Fund | | | 1.4 | | |
| Columbia Pacific/Asia Fund | | | 1.4 | | |
| Columbia Dividend Income Fund | | | 1.3 | | |
Columbia U.S. Government
Mortgage Fund | | | 1.2 | | |
Columbia Convertible Securities
Fund | | | 1.1 | | |
| Columbia Acorn USA | | | 0.9 | | |
Columbia Small Cap Value
Fund II | | | 0.9 | | |
Columbia Small Cap Value
Fund I | | | 0.9 | | |
| Columbia Large Cap Value Fund | | | 0.8 | | |
Columbia Value and
Restructuring Fund | | | 0.8 | | |
| Columbia Small Cap Growth | |
| Fund I | | | 0.6 | | |
Columbia Emerging Markets
Bond Fund | | | 0.6 | | |
Columbia International Bond
Fund | | | 0.6 | | |
Columbia Dividend Opportunity
Fund | | | 0.3 | | |
| BofA Cash Reserves | | | 0.3 | | |
| Columbia Acorn International | | | 0.3 | | |
Columbia U.S. Treasury Index
Fund | | | 0.2 | | |
Columbia Marsico Focused
Equities Fund | | | 0.1 | | |
Portfolio allocation is calculated as a percentage of total investments, excluding short-term investments.
7
Investment Portfolio – Columbia Asset Allocation Fund II
March 31, 2011
| Investment Companies – 100.2% | |
| | | Shares | | Value ($) | |
BofA Cash Reserves, Capital
Class Shares (a) | | | 285,073 | | | | 285,073 | | |
Columbia Acorn International,
Class I (b) | | | 6,516 | | | | 270,227 | | |
| Columbia Acorn USA, Class I (b) | | | 29,881 | | | | 917,948 | | |
| Columbia Bond Fund, Class I (b) | | | 2,267,482 | | | | 20,974,204 | | |
Columbia Contrarian Core Fund,
Class I (b) | | | 135,044 | | | | 2,031,060 | | |
Columbia Convertible Securities
Fund, Class I (b) | | | 68,248 | | | | 1,064,665 | | |
Columbia Corporate Income Fund,
Class I (b) | | | 455,363 | | | | 4,421,571 | | |
Columbia Dividend Income Fund,
Class I (b) | | | 95,899 | | | | 1,310,944 | | |
Columbia Dividend Opportunity
Fund, Class I (b) | | | 40,048 | | | | 332,800 | | |
Columbia Emerging Markets
Bond Fund, Class I (b) | | | 51,531 | | | | 580,241 | | |
Columbia Emerging Markets
Fund, Class I (b) | | | 252,908 | | | | 2,903,383 | | |
Columbia Energy and Natural
Resources Fund, Class I (b) | | | 141,695 | | | | 3,641,567 | | |
Columbia European Equity Fund,
Class I (b) | | | 529,999 | | | | 3,275,396 | | |
Columbia High Yield Bond
Fund, Class I (b) | | | 1,076,519 | | | | 3,057,315 | | |
Columbia International Bond
Fund, Class I (b) | | | 52,088 | | | | 578,174 | | |
Columbia Large Cap Core Fund,
Class I (b) | | | 148,179 | | | | 2,037,466 | | |
Columbia Large Cap Growth
Fund, Class I (b) | | | 80,994 | | | | 2,058,057 | | |
Columbia Large Cap Value Fund,
Class I (b) | | | 65,539 | | | | 783,190 | | |
Columbia Large Value
Quantitative Fund, Class I (b) | | | 4,512,769 | | | | 34,251,915 | | |
Columbia Marsico Focused
Equities Fund, Class I (b) | | | 2,894 | | | | 70,442 | | |
Columbia Mid Cap Growth Fund,
Class I (b) | | | 80,447 | | | | 2,344,240 | | |
Columbia Mid Cap Value Fund,
Class I (b) | | | 162,516 | | | | 2,341,857 | | |
Columbia Pacific/Asia Fund,
Class I (b) | | | 158,515 | | | | 1,364,812 | | |
Columbia Real Estate Equity
Fund, Class I (b) | | | 121,859 | | | | 1,585,390 | | |
Columbia Select Large Cap
Growth Fund, Class I (b) | | | 102,108 | | | | 1,403,980 | | |
Columbia Small Cap Growth
Fund I, Class I (b) | | | 16,419 | | | | 578,284 | | |
| | | Shares | | Value ($) | |
Columbia Small Cap Value
Fund I, Class I (b) | | | 18,494 | | | | 916,010 | | |
Columbia Small Cap Value
Fund II, Class I (b) | | | 60,557 | | | | 914,414 | | |
Columbia U.S. Government
Mortgage Fund, Class I (b) | | | 218,192 | | | | 1,160,784 | | |
Columbia U.S. Treasury Index
Fund, Class I (b) | | | 17,136 | | | | 189,015 | | |
Columbia Value and
Restructuring Fund, Class I (b) | | | 14,671 | | | | 778,000 | | |
Mortgage- and Asset-Backed
Portfolio (b) | | | 221,047 | | | | 2,077,844 | | |
Total Investment Companies
(cost of $101,918,267) | | | 100,500,268 | | |
Total Investments – 100.2%
(cost of $101,918,267) (c) | | | 100,500,268 | | |
| Other Assets & Liabilities, Net – (0.2)% | | | (170,489 | ) | |
| Net Assets – 100.0% | | | 100,329,779 | | |
Notes to Investment Portfolio:
(a) As of May 1, 2010, this security was no longer an affiliate of the Fund.
(b) Mutual funds registered under the Investment Company Act of 1940, as amended, and advised by Columbia Management Investment Advisers, LLC or one of its affiliates.
(c) Cost for federal income tax purposes is $102,496,389.
Generally accepted accounting principles (GAAP) require disclosure regarding the inputs and valuation techniques used to measure fair value and any changes in valuation inputs or techniques. In addition, investments shall be disclosed by major category.
The Fund categorizes its fair value measurements according to a three-level hierarchy that maximizes the use of observable inputs and minimizes the use of unobservable inputs by prioritizing that the most observable input be used when available. Observable inputs are those that market participants would use in pricing an investment based on market data obtained from sources independent of the reporting entity. Unobservable inputs are those that reflect the Fund's assumptions about the information market participants would use in pricing an investment. An investment's level within the fair value hierarchy is based on the lowest level of any input that is deemed significant to the asset or liability's fair value measurement. The input levels are not necessarily an indication of the risk or liquidity associated with investments at that level. For example, certain U.S. government securities are generally high quality and liquid, however, they are reflected as Level 2 because the inputs used to determine fair value may not always be quoted prices in an active market.
Fair value inputs are summarized in the three broad levels listed below:
• Level 1—Valuations based on quoted prices for investments in active markets that the Fund has the ability to access at the measurement date (including NAV for open-end mutual funds). Valuation adjustments are not applied to Level 1 investments.
• Level 2—Valuations based on other significant observable inputs (including quoted prices for similar securities, interest rates, prepayment speeds, credit risks, etc.).
• Level 3—Valuations based on significant unobservable inputs (including the Fund's own assumptions and judgment in determining the fair value of investments).
See Accompanying Notes to Financial Statements.
8
Columbia Asset Allocation Fund II
March 31, 2011
Inputs that are used in determining fair value of an investment may include price information, credit data, volatility statistics, and other factors. These inputs can be either observable or unobservable. The availability of observable inputs can vary between investments, and is affected by various factors such as the type of investment, and the volume and level of activity for that investment or similar investments in the marketplace. The inputs will be considered by the Investment Manager, along with any other relevant factors in the calculation of an investment's fair value. The Fund uses prices and inputs that are current as of the measurement date, which may include periods of market dislocations. During these periods, the availability of prices and inputs may be reduced for many investments. This condition could cause an investment to be reclassified between the various levels within the hierarchy. Non-U.S. equity securities actively traded in foreign markets may be reflected in Level 2 despite the availability of closing prices, because the Fund evaluates and determines whether those closing prices reflect fair value at the close of the New York Stock Exchange (NYSE) or require adjustment, as described in Note 2 to the financial statements—Security Valuation.
Investments falling into the Level 3 category are primarily supported by quoted prices from brokers and dealers participating in the market for those investments. However, these may be classified as Level 3 investments due to lack of market transparency and corroboration to support these quoted prices. Additionally, valuation models may be used as the pricing source for any remaining investments classified as Level 3. These models rely on one or more significant unobservable inputs and/or significant assumptions by the Investment Manager. Inputs used in valuations may include, but are not limited to, financial statement analysis, capital account balances, discount rates and estimated cash flows, and comparable company data.
The following table summarizes the inputs used, as of March 31, 2011, in valuing the Fund's assets:
| Description | | Quoted
Prices
(Level 1) | | Other
Significant
Observable
Inputs
(Level 2) | | Significant
Unobservable
Inputs
(Level 3) | | Total | |
| Investment Companies | | $ | 100,500,268 | | | $ | — | | | $ | — | | | $ | 100,500,268 | | |
| Total Investments | | $ | 100,500,268 | | | $ | — | | | $ | — | | | $ | 100,500,268 | | |
There were no significant transfers of financial assets between Levels 1 and 2 during the period.
See Accompanying Notes to Financial Statements.
9
Statement of Assets and Liabilities – Columbia Asset Allocation Fund II
March 31, 2011
| | | | | ($) | |
| Assets | | Affiliated investments, at identified cost | | | 101,633,194 | | |
| | | Unaffiliated investments, at identified cost | | | 285,073 | | |
| | | Total investments, at identified cost | | | 101,918,267 | | |
| | | Affiliated investments, at value | | | 100,215,195 | | |
| | | Unaffiliated investments, at value | | | 285,073 | | |
| | | Total investments, at value | | | 100,500,268 | | |
| | | Receivable for: | | | |
| | | Investments sold | | | 17,866 | | |
| | | Fund shares sold | | | 30,742 | | |
| | | Expense reimbursement due from Investment Manager | | | 91,982 | | |
| | | Prepaid expenses | | | 117 | | |
| | | Total Assets | | | 100,640,975 | | |
| Liabilities | | Payable for: | | | |
| | | Fund shares repurchased | | | 62,236 | | |
| | | Pricing and bookkeeping fees | | | 13,148 | | |
| | | Transfer agent fee | | | 38,462 | | |
| | | Trustees' fees | | | 62,799 | | |
| | | Custody fee | | | 810 | | |
| | | Reports to shareholders | | | 32,508 | | |
| | | Audit fee | | | 31,240 | | |
| | | Distribution and service fees | | | 17,587 | | |
| | | Chief compliance officer expenses | | | 203 | | |
| | | Merger costs | | | 28,828 | | |
| | | Other liabilities | | | 23,375 | | |
| | | Total Liabilities | | | 311,196 | | |
| | | Net Assets | | | 100,329,779 | | |
| Net Assets Consist of | | Paid-in capital | | | 99,202,023 | | |
| | | Undistributed net investment income | | | 71,400 | | |
| | | Accumulated net realized gain | | | 2,474,355 | | |
| | | Net unrealized appreciation (depreciation) on investments | | | (1,417,999 | ) | |
| | | Net Assets | | | 100,329,779 | | |
See Accompanying Notes to Financial Statements.
10
Statement of Assets and Liabilities (continued) – Columbia Asset Allocation Fund II
March 31, 2011
| Class A | | Net assets | | $ | 71,597,499 | | |
| | | Shares outstanding | | | 3,276,470 | | |
| | | Net asset value per share | | $ | 21.85 | (a) | |
| | | Maximum sales charge | | | 5.75 | % | |
| | | Maximum offering price per share ($21.85/0.9425) | | $ | 23.18 | (b) | |
| Class B | | Net assets | | $ | 1,145,836 | | |
| | | Shares outstanding | | | 52,938 | | |
| | | Net asset value and offering price per share | | $ | 21.64 | (a) | |
| Class C | | Net assets | | $ | 944,726 | | |
| | | Shares outstanding | | | 43,667 | | |
| | | Net asset value and offering price per share | | $ | 21.63 | (a) | |
| Class Z | | Net assets | | $ | 26,641,718 | | |
| | | Shares outstanding | | | 1,222,145 | | |
| | | Net asset value, offering and redemption price per share | | $ | 21.80 | | |
(a) Redemption price per share is equal to net asset value less any applicable contingent deferred sales charge.
(b) On sales of $50,000 or more the offering price is reduced.
See Accompanying Notes to Financial Statements.
11
Statement of Operations – Columbia Asset Allocation Fund II
For the Year Ended March 31, 2011
| | | | | ($) | |
| Investment Income | | Dividends | | | 942,294 | | |
| | | Dividends from affiliates | | | 1,272,897 | | |
| | | Interest | | | 919,392 | | |
| | | Interest from affiliates | | | 1,008 | | |
| | | Total Investment Income | | | 3,135,591 | | |
| Expenses | | Investment advisory fee | | | 581,666 | | |
| | | Administration fee | | | 30,190 | | |
| | | Distribution fee: | | | | | |
| | | Class B | | | 11,006 | | |
| | | Class C | | | 6,632 | | |
| | | Service fee: | | | | | |
| | | Class B | | | 3,669 | | |
| | | Class C | | | 2,211 | | |
| | | Distribution and service fees: | | | | | |
| | | Class A | | | 175,634 | | |
| | | Transfer agent fee | | | 162,605 | | |
| | | Pricing and bookkeeping fees | | | 62,489 | | |
| | | Trustees' fees | | | 27,191 | | |
| | | Custody fee | | | 15,230 | | |
| | | Reports to shareholders | | | 95,924 | | |
| | | Chief compliance officer expenses | | | 1,040 | | |
| | | Merger costs | | | 43,934 | | |
| | | Other expenses | | | 136,035 | | |
| | | Total Expenses | | | 1,355,456 | | |
| | | Fees waived or expenses reimbursed by Investment Manager | | | (487,925 | ) | |
| | | Expense reductions | | | (273 | ) | |
| | | Net Expenses | | | 867,258 | | |
| | | Net Investment Income | | | 2,268,333 | | |
Net Realized and Unrealized
Gain (Loss) on Investments,
Futures Contracts and
Capital Gains Distributions
Received | |
| | | Net realized gain (loss) on: | | | | | |
| | | Affiliated investments | | | (4,322,576 | ) | |
| | | Unaffiliated investments | | | 18,434,000 | | |
| | | Futures contracts | | | (71,003 | ) | |
| | | Capital gains distributions received from affiliates | | | 13,065,465 | | |
| | | Net realized gain | | | 27,105,886 | | |
| | | Net change in unrealized appreciation (depreciation) on: | | | | | |
| | | Investments | | | (16,939,876 | ) | |
| | | Futures contracts | | | (10,805 | ) | |
| | | Net change in unrealized appreciation (depreciation) | | | (16,950,681 | ) | |
| | | Net Gain | | | 10,155,205 | | |
| | | Net Increase Resulting from Operations | | | 12,423,538 | | |
See Accompanying Notes to Financial Statements.
12
Statement of Changes in Net Assets – Columbia Asset Allocation Fund II
| | | | | Year Ended March 31, | |
| Increase (Decrease) in Net Assets | | | | 2011 ($) | | 2010 ($) | |
| Operations | | Net investment income | | | 2,268,333 | | | | 2,009,113 | | |
| | | Net realized gain (loss) on investments, futures contracts
and capital gains distributions received from affiliates | | | 27,105,886 | | | | (446,388 | ) | |
| | | Net change in unrealized appreciation (depreciation)
on investments and futures contracts | | | (16,950,681 | ) | | | 25,738,908 | | |
| | | Net increase resulting from operations | | | 12,423,538 | | | | 27,301,633 | | |
| Distributions to Shareholders | | From net investment income: | | | | | | | | | |
| | | Class A | | | (6,119,106 | ) | | | (1,488,754 | ) | |
| | | Class B | | | (106,661 | ) | | | (33,825 | ) | |
| | | Class C | | | (74,489 | ) | | | (10,178 | ) | |
| | | Class Z | | | (2,233,619 | ) | | | (528,747 | ) | |
| | | From net realized gains: | | | | | | | | | |
| | | Class A | | | (396,309 | ) | | | — | | |
| | | Class B | | | (7,635 | ) | | | — | | |
| | | Class C | | | (5,298 | ) | | | — | | |
| | | Class Z | | | (139,897 | ) | | | — | | |
| | | Total distributions to shareholders | | | (9,083,014 | ) | | | (2,061,504 | ) | |
| | | Net Capital Stock Transactions | | | (2,328,202 | ) | | | (4,905,562 | ) | |
| | | Increase from regulatory settlements | | | — | | | | 1,914 | | |
| | | Total increase in net assets | | | 1,012,322 | | | | 20,336,481 | | |
| Net Assets | | Beginning of period | | | 99,317,457 | | | | 78,980,976 | | |
| | | End of period | | | 100,329,779 | | | | 99,317,457 | | |
| | | Undistributed net investment income at end of period | | | 71,400 | | | | 11,993 | | |
See Accompanying Notes to Financial Statements.
13
Statement of Changes in Net Assets (continued) – Columbia Asset Allocation Fund II
| | | Capital Stock Activity | |
| | | Year Ended
March 31, 2011 | | Year Ended
March 31, 2010 | |
| | | Shares | | Dollars ($) | | Shares | | Dollars ($) | |
| Class A | |
| Subscriptions | | | 288,236 | | | | 6,109,141 | | | | 85,822 | | | | 1,664,491 | | |
| Distributions reinvested | | | 69,955 | | | | 1,471,939 | | | | 71,862 | | | | 1,389,350 | | |
| Redemptions | | | (500,402 | ) | | | (10,678,327 | ) | | | (410,564 | ) | | | (7,883,419 | ) | |
| Net decrease | | | (142,211 | ) | | | (3,097,247 | ) | | | (252,880 | ) | | | (4,829,578 | ) | |
| Class B | |
| Subscriptions | | | 4,771 | | | | 100,321 | | | | 8,222 | | | | 146,335 | | |
| Distributions reinvested | | | 1,804 | | | | 37,673 | | | | 1,533 | | | | 28,971 | | |
| Redemptions | | | (47,649 | ) | | | (1,007,612 | ) | | | (68,470 | ) | | | (1,290,760 | ) | |
| Net decrease | | | (41,074 | ) | | | (869,618 | ) | | | (58,715 | ) | | | (1,115,454 | ) | |
| Class C | |
| Subscriptions | | | 6,222 | | | | 130,197 | | | | 8,666 | | | | 169,390 | | |
| Distributions reinvested | | | 2,833 | | | | 59,285 | | | | 381 | | | | 7,219 | | |
| Redemptions | | | (5,114 | ) | | | (106,812 | ) | | | (1,922 | ) | | | (38,180 | ) | |
| Net increase | | | 3,941 | | | | 82,670 | | | | 7,125 | | | | 138,429 | | |
| Class Z | |
| Subscriptions | | | 41,329 | | | | 875,302 | | | | 29,914 | | | | 584,656 | | |
| Distributions reinvested | | | 95,076 | | | | 2,004,150 | | | | 23,361 | | | | 451,485 | | |
| Redemptions | | | (63,930 | ) | | | (1,323,459 | ) | | | (6,797 | ) | | | (135,100 | ) | |
| Net increase | | | 72,475 | | | | 1,555,993 | | | | 46,478 | | | | 901,041 | | |
See Accompanying Notes to Financial Statements.
14
Financial Highlights – Columbia Asset Allocation Fund II
Selected data for a share outstanding throughout each period is as follows:
| | | Year Ended March 31, | |
| Class A Shares | | 2011 | | 2010 | | 2009 | | 2008 | | 2007 | |
| Net Asset Value, Beginning of Period | | $ | 21.14 | | | $ | 15.94 | | | $ | 22.39 | | | $ | 24.00 | | | $ | 22.22 | | |
| Income from Investment Operations: | |
| Net investment income (a) | | | 0.49 | | | | 0.41 | | | | 0.45 | | | | 0.48 | | | | 0.43 | | |
Net realized and unrealized gain (loss) on investments,
futures contracts, foreign currency and capital gains
distributions received from affiliates | | | 2.27 | | | | 5.21 | | | | (6.44 | ) | | | (1.60 | ) | | | 1.78 | | |
| Total from investment operations | | | 2.76 | | | | 5.62 | | | | (5.99 | ) | | | (1.12 | ) | | | 2.21 | | |
| Less Distributions to Shareholders: | |
| From net investment income | | | (1.92 | ) | | | (0.42 | ) | | | (0.46 | ) | | | (0.49 | ) | | | (0.43 | ) | |
| From net realized gains | | | (0.13 | ) | | | — | | | | — | | | | — | | | | — | | |
| Total distributions to shareholders | | | (2.05 | ) | | | (0.42 | ) | | | (0.46 | ) | | | (0.49 | ) | | | (0.43 | ) | |
| Increase from regulatory settlements | | | — | | | | — | (b) | | | — | | | | — | | | | — | | |
| Net Asset Value, End of Period | | $ | 21.85 | | | $ | 21.14 | | | $ | 15.94 | | | $ | 22.39 | | | $ | 24.00 | | |
| Total return (c)(d) | | | 13.59 | % | | | 35.54 | % | | | (27.03 | )% | | | (4.78 | )% | | | 10.06 | % | |
| Ratios to Average Net Assets/Supplemental Data: | |
| Net expenses before interest expense (e) | | | 0.94 | %(f) | | | 1.21 | % | | | 1.29 | % | | | 1.22 | % | | | 1.22 | % | |
| Interest expense | | | — | | | | — | | | | — | | | | — | %(g) | | | — | %(g) | |
| Net expenses (e) | | | 0.94 | %(f) | | | 1.21 | % | | | 1.29 | % | | | 1.22 | % | | | 1.22 | % | |
| Waiver/Reimbursement | | | 0.50 | % | | | 0.20 | % | | | 0.09 | % | | | 0.07 | % | | | 0.07 | % | |
| Net investment income (e) | | | 2.30 | % | | | 2.14 | % | | | 2.31 | % | | | 1.99 | % | | | 1.89 | % | |
| Portfolio turnover rate | | | 205 | %(h) | | | 80 | % | | | 67 | % | | | 63 | % | | | 55 | % | |
| Net assets, end of period (000s) | | $ | 71,597 | | | $ | 72,267 | | | $ | 58,511 | | | $ | 94,827 | | | $ | 115,393 | | |
(a) Per share data was calculated using the average shares outstanding during the period.
(b) Rounds to less than $0.01 per share.
(c) Total return at net asset value assuming all distributions reinvested and no initial sales charge or contingent deferred sales charge.
(d) Had the Investment Manager and/or any of its affiliates not waived fees or reimbursed a portion of expenses, total return would have been reduced.
(e) The benefits derived from expense reductions had an impact of less than 0.01%.
(f) Does not include expenses of the investment companies in which the Fund invests. If these expenses were included, the expense ratios would have been higher.
(g) Rounds to less than 0.01%.
(h) Effective October 22, 2010, the Fund transitioned to a fund-of-funds structure. If the Fund had not transitioned, portfolio turnover would have been lower.
See Accompanying Notes to Financial Statements.
15
Financial Highlights – Columbia Asset Allocation Fund II
Selected data for a share outstanding throughout each period is as follows:
| | | Year Ended March 31, | |
| Class B Shares | | 2011 | | 2010 | | 2009 | | 2008 | | 2007 | |
| Net Asset Value, Beginning of Period | | $ | 20.96 | | | $ | 15.81 | | | $ | 22.20 | | | $ | 23.81 | | | $ | 22.04 | | |
| Income from Investment Operations: | |
| Net investment income (a) | | | 0.32 | | | | 0.27 | | | | 0.29 | | | | 0.30 | | | | 0.26 | | |
Net realized and unrealized gain (loss) on investments,
futures contracts, foreign currency and capital gains
distributions received from affiliates | | | 2.25 | | | | 5.16 | | | | (6.37 | ) | | | (1.60 | ) | | | 1.77 | | |
| Total from investment operations | | | 2.57 | | | | 5.43 | | | | (6.08 | ) | | | (1.30 | ) | | | 2.03 | | |
| Less Distributions to Shareholders: | |
| From net investment income | | | (1.76 | ) | | | (0.28 | ) | | | (0.31 | ) | | | (0.31 | ) | | | (0.26 | ) | |
| From net realized gains | | | (0.13 | ) | | | — | | | | — | | | | — | | | | — | | |
| Total distributions to shareholders | | | (1.89 | ) | | | (0.28 | ) | | | (0.31 | ) | | | (0.31 | ) | | | (0.26 | ) | |
| Increase from regulatory settlements | | | — | | | | — | (b) | | | — | | | | — | | | | — | | |
| Net Asset Value, End of Period | | $ | 21.64 | | | $ | 20.96 | | | $ | 15.81 | | | $ | 22.20 | | | $ | 23.81 | | |
| Total return (c)(d) | | | 12.71 | % | | | 34.52 | % | | | (27.55 | )% | | | (5.54 | )% | | | 9.27 | % | |
| Ratios to Average Net Assets/Supplemental Data: | |
| Net expenses before interest expense (e) | | | 1.69 | %(f) | | | 1.96 | % | | | 2.04 | % | | | 1.97 | % | | | 1.97 | % | |
| Interest expense | | | — | | | | — | | | | — | | | | — | %(g) | | | — | %(g) | |
| Net expenses (e) | | | 1.69 | %(f) | | | 1.96 | % | | | 2.04 | % | | | 1.97 | % | | | 1.97 | % | |
| Waiver/Reimbursement | | | 0.50 | % | | | 0.20 | % | | | 0.09 | % | | | 0.07 | % | | | 0.07 | % | |
| Net investment income (e) | | | 1.54 | % | | | 1.42 | % | | | 1.49 | % | | | 1.25 | % | | | 1.14 | % | |
| Portfolio turnover rate | | | 2.05 | %(h) | | | 80 | % | | | 67 | % | | | 63 | % | | | 55 | % | |
| Net assets, end of period (000s) | | $ | 1,146 | | | $ | 1,970 | | | $ | 2,414 | | | $ | 7,349 | | | $ | 15,225 | | |
(a) Per share data was calculated using the average shares outstanding during the period.
(b) Rounds to less than $0.01 per share.
(c) Total return at net asset value assuming all distributions reinvested and no contingent deferred sales charge.
(d) Had the Investment Manager and/or any of its affiliates not waived fees or reimbursed a portion of expenses, total return would have been reduced.
(e) The benefits derived from expense reductions had an impact of less than 0.01%.
(f) Does not include expenses of the investment companies in which the Fund invests. If these expenses were included, the expense ratios would have been higher.
(g) Rounds to less than 0.01%.
(h) Effective October 22, 2010, the Fund transitioned to a fund-of-funds structure. If the Fund had not transitioned, portfolio turnover would have been lower.
See Accompanying Notes to Financial Statements.
16
Financial Highlights – Columbia Asset Allocation Fund II
Selected data for a share outstanding throughout each period is as follows:
| | | Year Ended March 31, | |
| Class C Shares | | 2011 | | 2010 | | 2009 | | 2008 | | 2007 | |
| Net Asset Value, Beginning of Period | | $ | 20.95 | | | $ | 15.79 | | | $ | 22.18 | | | $ | 23.79 | | | $ | 22.02 | | |
| Income from Investment Operations: | |
| Net investment income (a) | | | 0.33 | | | | 0.26 | | | | 0.30 | | | | 0.32 | | | | 0.26 | | |
Net realized and unrealized gain (loss) on investments,
futures contracts, foreign currency and capital gains
distributions received from affiliates | | | 2.24 | | | | 5.18 | | | | (6.38 | ) | | | (1.62 | ) | | | 1.77 | | |
| Total from investment operations | | | 2.57 | | | | 5.44 | | | | (6.08 | ) | | | (1.30 | ) | | | 2.03 | | |
| Less Distributions to Shareholders: | |
| From net investment income | | | (1.76 | ) | | | (0.28 | ) | | | (0.31 | ) | | | (0.31 | ) | | | (0.26 | ) | |
| From net realized gains | | | (0.13 | ) | | | — | | | | — | | | | — | | | | — | | |
| Total distributions to shareholders | | | (1.89 | ) | | | (0.28 | ) | | | (0.31 | ) | | | (0.31 | ) | | | (0.26 | ) | |
| Increase from regulatory settlements | | | — | | | | — | (b) | | | — | | | | — | | | | — | | |
| Net Asset Value, End of Period | | $ | 21.63 | | | $ | 20.95 | | | $ | 15.79 | | | $ | 22.18 | | | $ | 23.79 | | |
| Total return (c)(d) | | | 12.72 | % | | | 34.63 | % | | | (27.58 | )% | | | (5.54 | )% | | | 9.28 | % | |
| Ratios to Average Net Assets/Supplemental Data: | |
| Net expenses before interest expense (e) | | | 1.69 | %(f) | | | 1.96 | % | | | 2.04 | % | | | 1.97 | % | | | 1.97 | % | |
| Interest expense | | | — | | | | — | | | | — | | | | — | %(g) | | | — | %(g) | |
| Net expenses (e) | | | 1.69 | %(f) | | | 1.96 | % | | | 2.04 | % | | | 1.97 | % | | | 1.97 | % | |
| Waiver/Reimbursement | | | 0.50 | % | | | 0.20 | % | | | 0.09 | % | | | 0.07 | % | | | 0.07 | % | |
| Net investment income (e) | | | 1.58 | % | | | 1.38 | % | | | 1.59 | % | | | 1.32 | % | | | 1.14 | % | |
| Portfolio turnover rate | | | 205 | %(h) | | | 80 | % | | | 67 | % | | | 63 | % | | | 55 | % | |
| Net assets, end of period (000s) | | $ | 945 | | | $ | 832 | | | $ | 515 | | | $ | 730 | | | $ | 2,105 | | |
(a) Per share data was calculated using the average shares outstanding during the period.
(b) Rounds to less than $0.01 per share.
(c) Total return at net asset value assuming all distributions reinvested and no contingent deferred sales charge.
(d) Had the Investment Manager and/or any of its affiliates not waived fees or reimbursed a portion of expenses, total return would have been reduced.
(e) The benefits derived from expense reductions had an impact of less than 0.01%.
(f) Does not include expenses of the investment companies in which the Fund invests. If these expenses were included, the expense ratios would have been higher.
(g) Rounds to less than 0.01%.
(h) Effective October 22, 2010, the Fund transitioned to a fund-of-funds structure. If the Fund had not transitioned, portfolio turnover would have been lower.
See Accompanying Notes to Financial Statements.
17
Financial Highlights – Columbia Asset Allocation Fund II
Selected data for a share outstanding throughout each period is as follows:
| | | Year Ended March 31, | |
| Class Z Shares | | 2011 | | 2010 | | 2009 | | 2008 | | 2007 | |
| Net Asset Value, Beginning of Period | | $ | 21.09 | | | $ | 15.90 | | | $ | 22.34 | | | $ | 23.95 | | | $ | 22.17 | | |
| Income from Investment Operations: | |
| Net investment income (a) | | | 0.54 | | | | 0.46 | | | | 0.50 | | | | 0.54 | | | | 0.49 | | |
Net realized and unrealized gain (loss) on investments,
futures contracts, foreign currency and capital gains
distributions received from affiliates | | | 2.27 | | | | 5.20 | | | | (6.43 | ) | | | (1.60 | ) | | | 1.78 | | |
| Total from investment operations | | | 2.81 | | | | 5.66 | | | | (5.93 | ) | | | (1.06 | ) | | | 2.27 | | |
| Less Distributions to Shareholders: | |
| From net investment income | | | (1.97 | ) | | | (0.47 | ) | | | (0.51 | ) | | | (0.55 | ) | | | (0.49 | ) | |
| From net realized gains | | | (0.13 | ) | | | — | | | | — | | | | — | | | | — | | |
| Total distributions to shareholders | | | (2.10 | ) | | | (0.47 | ) | | | (0.51 | ) | | | (0.55 | ) | | | (0.49 | ) | |
| Increase from regulatory settlements | | | — | | | | — | (b) | | | — | | | | — | | | | — | | |
| Net Asset Value, End of Period | | $ | 21.80 | | | $ | 21.09 | | | $ | 15.90 | | | $ | 22.34 | | | $ | 23.95 | | |
| Total return (c)(d) | | | 13.90 | % | | | 35.90 | % | | | (26.86 | )% | | | (4.55 | )% | | | 10.35 | % | |
| Ratios to Average Net Assets/Supplemental Data: | |
| Net expenses before interest expense (e) | | | 0.69 | %(f) | | | 0.96 | % | | | 1.04 | % | | | 0.97 | % | | | 0.97 | % | |
| Interest expense | | | — | | | | — | | | | — | | | | — | %(g) | | | — | %(g) | |
| Net expenses (e) | | | 0.69 | %(f) | | | 0.96 | % | | | 1.04 | % | | | 0.97 | % | | | 0.97 | % | |
| Waiver/Reimbursement | | | 0.50 | % | | | 0.20 | % | | | 0.09 | % | | | 0.07 | % | | | 0.07 | % | |
| Net investment income (e) | | | 2.54 | % | | | 2.39 | % | | | 2.58 | % | | | 2.24 | % | | | 2.15 | % | |
| Portfolio turnover rate | | | 205 | %(h) | | | 80 | % | | | 67 | % | | | 63 | % | | | 55 | % | |
| Net assets, end of period (000s) | | $ | 26,642 | | | $ | 24,248 | | | $ | 17,541 | | | $ | 24,859 | | | $ | 24,680 | | |
(a) Per share data was calculated using the average shares outstanding during the period.
(b) Rounds to less than $0.01 per share.
(c) Total return at net asset value assuming all distributions reinvested.
(d) Had the Investment Manager and/or any of its affiliates not waived fees or reimbursed a portion of expenses, total return would have been reduced.
(e) The benefits derived from expense reductions had an impact of less than 0.01%.
(f) Does not include expenses of the investment companies in which the Fund invests. If these expenses were included, the expense ratios would have been higher.
(g) Rounds to less than 0.01%.
(h) Effective October 22, 2010, the Fund transitioned to a fund-of-funds structure. If the Fund had not transitioned, portfolio turnover would have been lower.
See Accompanying Notes to Financial Statements.
18
Notes to Financial Statements – Columbia Asset Allocation Fund II
March 31, 2011
Note 1. Organization
Columbia Asset Allocation Fund II (the Fund), a series of Columbia Funds Series Trust (the Trust), is a diversified fund. The Trust is registered under the Investment Company Act of 1940, as amended (the 1940 Act), as an open-end management investment company organized as a Delaware statutory trust.
After the close of business on April 30, 2010, Ameriprise Financial, Inc. (Ameriprise Financial) acquired a portion of the asset management business of Columbia Management Group, LLC (the Transaction), including the business of managing the Fund. In connection with the closing of the Transaction (the Closing), RiverSource Investments, LLC, a wholly owned subsidiary of Ameriprise Financial, became the investment advisor of the Fund and changed its name to Columbia Management Investment Advisers, LLC (the Investment Manager).
Investment Objective
The Fund seeks total return, consisting of long-term capital appreciation and current income.
Effective October 22, 2010, the Fund transitioned to a fund-of-funds structure, which means the Fund will seek to achieve its objective by investing primarily in shares of mutual funds managed by the Investment Manager or its affiliates (Columbia Funds), exchange-traded funds and third party-advised funds (collectively with the Columbia Funds, Underlying Funds). The Fund may also invest in equity and fixed income securities, including Treasury Inflation Protected Securities (TIPS), and other instruments such as derivatives. The financial statements of the Underlying Funds in which the Fund invests should be read in conjunction with the Fund's financial statements.
Fund Shares
The Trust has unlimited authorized shares of beneficial interest. The Fund offers Class A, Class B, Class C and Class Z shares. All share classes have identical voting, dividend and liquidation rights. Each share class has its own expense structure and sales charges, as applicable.
Class A shares are subject to a maximum front-end sales charge of 5.75% based on the initial investment amount. Class A shares purchased without an initial sales charge in accounts aggregating $1 million to $50 million at the time of purchase are subject to a 1.00% contingent deferred sales charge (CDSC) if the shares are sold within 18 months of purchase, charged as follows: 1.00% CDSC if redeemed within 12 months of purchase, and 0.50% CDSC if redeemed more than 12, but less than 18 months after purchase.
The Fund no longer accepts investments by new or existing investors in the Fund's Class B shares, except in connection with the reinvestment of any dividend and/or capital gain distributions in Class B shares of the Fund and exchanges by existing Class B shareholders of other funds within the Columbia Family of Funds. Class B shares are subject to a maximum CDSC of 5.00% based upon the holding period after purchase. Class B shares will generally convert to Class A shares eight years after purchase.
Class C shares are subject to a 1.00% CDSC on shares redeemed within one year of purchase.
Class Z shares are not subject to sales charges and are available only to certain investors, as described in the Fund's prospectus.
Note 2. Summary of Significant Accounting Policies
The preparation of financial statements in accordance with U.S. generally accepted accounting principles (GAAP) requires the Investment Manager to make certain estimates and assumptions that affect the reported amounts of assets and liabilities, the disclosure of contingent assets and liabilities at the date of the financial statements and the reported amounts of revenue and expenses during the reporting period. Actual results could differ from those estimates.
The following is a summary of significant accounting policies consistently followed by the Fund in the preparation of its financial statements.
Security Valuation
Investments in the Underlying Funds are valued at the net asset value of each class of the respective Underlying Fund determined as of the close of the New York Stock Exchange on the valuation date. Exchange-traded funds are valued at the last sale price on the principal exchange on which they trade, except for securities traded on the NASDAQ, which are valued at the NASDAQ official close price. Exchange-traded funds for which there were no sales during the day are valued at the latest bid price on such exchanges.
Investments in securities generally are valued by pricing services approved by the Trust's Board of Trustees, based upon market transactions for normal, institutional-size trading units of similar securities. The services may use various pricing techniques which take into account appropriate factors such as yield, quality, coupon
19
Columbia Asset Allocation Fund II, March 31, 2011
rate, maturity, type of issue, trading characteristics and other data, as well as broker quotes. Debt securities for which quotations are readily available may also be valued based upon an over-the-counter or exchange bid quotation.
Debt securities generally are valued by pricing services approved by the Trust's Board of Trustees, based upon market transactions for normal, institutional-size trading units of similar securities. The services may use various pricing techniques which take into account appropriate factors such as yield, quality, coupon rate, maturity, type of issue, trading characteristics and other data, as well as broker quotes. Debt securities for which quotations are readily available may also be valued based upon an over-the-counter or exchange bid quotation.
Certain debt securities, which tend to be more thinly traded and of lesser quality, are priced based on fundamental analysis of the financial condition of the issuer and the estimated value of any collateral. Valuations developed through pricing techniques may vary from the actual amounts realized upon sale of the securities, and the potential variation may be greater for those securities valued using fundamental analysis.
Asset-backed and mortgage-backed securities are generally valued by pricing services, which utilize pricing models that incorporate the securities' cash flow and loan performance data. These models also take into account available market data, including trades, market quotations, and benchmark yield curves for identical or similar securities. Factors used to identify similar securities may include, but are not limited to, issuer, collateral type, vintage, prepayment speeds, collateral performance, credit ratings, credit enhancement and expected life. Asset-backed and mortgage-backed securities for which quotations are readily available may also be valued based upon an over-the-counter or exchange bid quotation.
Equity securities are valued at the last sale price on the principal exchange on which they trade, except for securities traded on the NASDAQ, which are valued at the NASDAQ official close price. Unlisted securities or listed securities for which there were no sales during the day are valued at the closing bid price on such exchanges or over-the-counter markets.
Short-term investments maturing in 60 days or less are valued at amortized cost, which approximates market value.
Futures contracts are valued at the settlement price established each day by the board of trade or exchange on which they are traded.
Foreign securities are generally valued at the last sale price on the foreign exchange or market on which they trade. If any foreign share prices are not readily available as a result of limited share activity, the securities are valued at the last sale price of the local shares in the principal market in which such securities are normally traded.
Generally, trading in foreign securities is substantially completed each day at various times prior to the close of the New York Stock Exchange (NYSE). The values of such securities used in computing the net asset value of the Fund's shares are determined as of such times. Foreign currency exchange rates are generally determined at 4:00 p.m. Eastern (U.S.) time. Occasionally, events affecting the values of such foreign securities may occur between the times at which they are determined and the close of the customary trading session of the NYSE, which would not be reflected in the computation of the Fund's net asset value. If events materially affecting the values of such foreign securities occur and it is determined that market quotations are not reliable, then these foreign securities will be valued at their fair value using procedures approved by the Board of Trustees.
Investments for which market quotations are not readily available, or that have quotations which the Investment Manager believes are not reliable, are valued at fair value as determined in good faith under consistently applied procedures established by and under the general supervision of the Board of Trustees. If a security is valued at fair value, such value is likely to be different from the last quoted market price for the security. The determination of fair value often requires significant judgment. To determine fair value, the Investment Manager may use assumptions including but not limited to future cash flows and estimated risk premiums. Multiple inputs from various sources may be used to determine value.
Derivative Instruments
The Fund may use derivative instruments including futures contracts in order to meet its investment objectives. The Fund employs strategies in differing combinations to permit it to increase, decrease or change the level of exposure to market risk factors. The achievement of any strategy relating to derivatives depends on an analysis of various risk factors, and if the strategies for the use of derivatives do not work as intended, the Fund may not achieve its investment objectives.
20
Columbia Asset Allocation Fund II, March 31, 2011
In pursuit of its investment objectives, the Fund is exposed to the following market risk among others:
Interest Rate Risk: Interest rate risk relates to the fluctuation in value of fixed income securities because of the inverse relationship of price and yield. Fixed income securities generally will decline in value upon an increase in general interest rates and their value generally will increase upon a decline in general interest rates. Fixed income securities with longer durations tend to be more sensitive to changes in interest rates, usually making them more volatile than securities with shorter durations.
The following provides more detailed information about the derivative type held by the Fund:
Futures Contracts—The Fund entered into interest rate futures contracts to manage the duration and yield curve exposure of the Fund versus the benchmark.
The use of futures contracts involves certain risks, which include, among others: (1) imperfect correlation between the price movement of the instruments and the underlying securities, (2) inability to close out positions due to differing trading hours, or the temporary absence of a liquid market, for either the instruments or the underlying securities, and (3) an inaccurate prediction of the future direction of interest rates by the Fund's Investment Manager.
Upon entering into a futures contract, the Fund identifies within its portfolio of investments cash or securities in an amount sufficient to meet the initial margin requirement. Subsequent payments are made or received by the Fund equal to the daily change in the contract value and are recorded as variation margin receivable or payable and offset in unrealized gains or losses. The Fund recognizes a realized gain or loss when the contract is closed or expires.
Futures contracts involve, to varying degrees, risk of loss in excess of the variation margin disclosed on the Statement of Assets and Liabilities.
During the year ended March 31, 2011, the Fund entered into 169 futures contracts.
The following table is a summary of the value of the Fund's derivative instruments as of March 31, 2011:
| Fair Value of Derivative Instruments | |
| Statement of Assets and Liabilities | |
| Assets | | Fair Value | | Liabilities | | Fair Value | |
| Futures Variation Margin | | $ | — | | | Futures Variation Margin | | $ | — | | |
The effect of derivative instruments on the Fund's Statement of Operations for the year ended March 31, 2011:
| | | Amount of Realized Gain or (Loss)
and Change in Unrealized Appreciation or
(Depreciation) on Derivatives | |
| | | Risk Exposure | | Net Realized
Gain (Loss) | | Change in
Unrealized
Appreciation
(Depreciation) | |
| Futures Contracts | | Interest Rate Risk | | $ | (71,003 | ) | | $ | (10,805 | ) | |
Repurchase Agreements
The Fund may engage in repurchase agreement transactions with institutions that the Investment Manager has determined are creditworthy. The Fund, through the custodian, receives delivery of the underlying securities collateralizing a repurchase agreement. The Investment Manager is responsible for determining that the collateral is at least equal, at all times, to the value of the repurchase obligation including interest. A repurchase agreement transaction involves certain risks in the event of default or insolvency of the counterparty.
21
Columbia Asset Allocation Fund II, March 31, 2011
These risks include possible delays in or restrictions on the Fund's ability to dispose of the underlying securities and a possible decline in the value of the underlying securities during the period while the Fund seeks to assert its rights.
Delayed Delivery Securities
The Fund may trade securities on other than normal settlement terms, including securities purchased or sold on a "when-issued" basis. This may increase the risk if the other party to the transaction fails to deliver and causes the Fund to subsequently invest at less advantageous prices. The Fund identifies within its portfolio of investments cash or liquid securities in an amount equal to the delayed delivery commitment.
Treasury Inflation Protected Securities
The Fund may invest in treasury inflation protected securities (TIPS). The principal amount of TIPS is adjusted periodically and is increased for inflation or decreased for deflation based on a monthly published index. Interest payments are based on the adjusted principal at the time the interest is paid. These adjustments are recorded as interest income in the Statement of Operations.
Security Transactions
Security transactions are accounted for on the trade date. Cost is determined and gains (losses) are based upon the specific identification method for both financial statement and federal income tax purposes.
Income Recognition
Interest income is recorded on the accrual basis. Market premium and discount are amortized and accreted, respectively, on all debt securities, unless otherwise noted. Original issue discount is accreted to interest income over the life of the security with a corresponding increase in the cost basis, if any.
Corporate actions and dividend income are recorded on the ex-date.
The Fund receives information regarding the character of distributions received from real estate investment trusts (REITs) on an annual basis. Distributions received from REITs are allocated among dividend income, capital gain and return of capital based upon such information or based on management's estimates if actual information has not yet been reported. Management's estimates are subsequently adjusted when the actual character of the distributions are disclosed by the REITs which could result in a proportionate increase in returns of capital to shareholders.
Awards from class action litigation are recorded as a reduction of cost if the Fund still owns the applicable securities on the payment date. If the Fund no longer owns the applicable securities, the proceeds are recorded as realized gains.
Income and capital gain distributions from the Underlying Funds, if any, are recorded on the ex-dividend date.
Expenses
General expenses of the Trust are allocated to the Fund and other series of the Trust based upon relative net assets or other expense allocation methodologies determined by the nature of the expense. Expenses directly attributable to a specific class of shares are charged to that share class. Expenses directly attributable to the Fund are charged to the Fund.
Determination of Class Net Asset Value
All income, expenses (other than class-specific expenses which are charged directly to a share class, as shown in the Statement of Operations) and realized and unrealized gains (losses) are allocated to each class of the Fund on a daily basis, based on the relative net assets of each class, for purposes of determining the net asset value of each class.
Federal Income Tax Status
The Fund intends to qualify each year as a regulated investment company under Subchapter M of the Internal Revenue Code, as amended, and will distribute substantially all of its taxable income, if any, for its tax year, and as such will not be subject to federal income taxes. In addition, the Fund intends to distribute in each calendar year substantially all of its net investment income, capital gains and certain other amounts, if any, such that the Fund should not be subject to federal excise tax. Therefore, no federal income or excise tax provision is recorded.
Distributions to Shareholders
Distributions from net investment income are declared and paid quarterly. Net realized capital gains, if any, are distributed at least annually. Income distributions and capital gain distributions are determined in accordance with federal income tax regulations which may differ from GAAP.
22
Columbia Asset Allocation Fund II, March 31, 2011
Indemnifications
Under the Trust's organizational documents and, in some cases, by contract, its officers and directors are indemnified against certain liabilities arising out of the performance of their duties to the Fund. In addition, certain of the Fund's contracts with its service providers contain general indemnification clauses. The Fund's maximum exposure under these arrangements is unknown since the amount of any future claims that may be made against the Fund cannot be determined and the Fund has no historical basis for predicting the likelihood of any such claims.
Note 3. Fees and Compensation Paid to Affiliates
Investment Management Fee
Under an Investment Management Services Agreement (IMSA), the Investment Manager determines which securities will be purchased, held or sold. The management fee is based on the annual rate of 0.60% of the Fund's average daily net assets.
Prior to the Closing, Columbia Management Advisors, LLC (Columbia), an indirect, wholly owned subsidiary of Bank of America Corporation (BOA), provided investment management services to the Fund under the same fee structure.
Effective October 22, 2010, the Investment Manager has contractually agreed to waive a portion of its management fee through January 31, 2012 so that the effective advisory fee rate will be a blend of (i) 0.00% on assets invested in other Columbia Funds, exchange-traded funds or third party mutual funds, and (ii) 0.60% on other assets.
For the year ended March 31, 2011, management fees of $253,804 were waived for the Fund and the annualized effective management fee rate, net of fee waivers, was 0.34% of the Fund's average daily net assets.
Administration Fee
Effective upon the Closing, the Investment Manager provides administration and accounting services to the Fund under an Administrative Services Agreement, including services previously performed under the Pricing and Bookkeeping Oversight and Services Agreement (the Services Agreement) as discussed in the Pricing and Bookkeeping Fees note below. Effective October 22, 2010, the Fund pays an annual administration fee equal to 0.02% of the Fund's average daily net assets.
Prior to October 22, 2010, the annual administration fee was equal to 0.12% of the Fund's average daily net assets less the fees payable by the Fund as described under the Pricing and Bookkeeping Fees note below. Prior to the Closing, Columbia provided administrative services to the Fund at the same fee rate.
For the year ended March 31, 2011, the Fund's effective administration fee rate was 0.08% of the Fund's average daily net assets.
Pricing and Bookkeeping Fees
Prior to the Closing, the Fund entered into a Financial Reporting Services Agreement (the Financial Reporting Services Agreement) with State Street Bank and Trust Company (State Street) and Columbia pursuant to which State Street provides financial reporting services to the Fund. The Fund also entered into an Accounting Services Agreement (collectively with the Financial Reporting Services Agreement, the State Street Agreements) with State Street and Columbia pursuant to which State Street provides accounting services to the Fund. Upon the Closing, Columbia assigned and delegated its rights and obligations under the State Street Agreements to the Investment Manager. Under the State Street Agreements, the Fund pays State Street an annual fee of $38,000 paid monthly plus an additional monthly fee based on an annualized percentage rate of average daily net assets of the Fund for the month. The aggregate fee will not exceed $140,000 per year (exclusive of out-of-pocket expenses and charges). The Fund also reimburses State Street for certain out-of-pocket expenses and charges.
Also prior to the Closing, the Fund entered into the Services Agreement with Columbia. Under the Services Agreement, Columbia provided services related to Fund expenses and the requirements of the Sarbanes-Oxley Act of 2002, and provided oversight of the accounting and financial reporting services provided by State Street. Under the Services Agreement, the Fund reimbursed Columbia for out-of-pocket expenses and charges, including fees payable to third parties, such as for pricing the Fund's portfolio securities, incurred by Columbia in the performance of services under the Services Agreement. The Services Agreement was terminated upon the Closing. These services are now provided under the Administrative Services Agreement discussed above.
Transfer Agent Fee
In connection with the Closing, RiverSource Service Corporation, a wholly owned subsidiary of Ameriprise Financial, provides transfer agency services to the Fund under a Transfer Agency Agreement and
23
Columbia Asset Allocation Fund II, March 31, 2011
changed its name to Columbia Management Investment Services Corp. (the Transfer Agent). The Transfer Agent has contracted with Boston Financial Data Services (BFDS) to serve as sub-transfer agent.
The Transfer Agent receives monthly account-based service fees based on the number of open accounts and is reimbursed by the Fund for the fees and expenses the Transfer Agent pays to financial intermediaries that maintain omnibus accounts with the Fund that is a percentage of the average aggregate value of the Fund's shares maintained in each such omnibus account (other than omnibus accounts for which American Enterprise Investment Services Inc. is the broker of record or accounts where the beneficial shareholder is a customer of Ameriprise Financial Services, Inc., which are paid a per account fee). The Transfer Agent pays the fees of BFDS for services as sub-transfer agent and, is not entitled to reimbursement for such fees from the Fund (with the exception of out-of pocket fees). The Transfer Agent also receives compensation from fees for various shareholder services and reimbursements for certain out-of -pocket expenses
Prior to the Closing, Columbia Management Services, Inc., an affiliate of Columbia and an indirect, wholly owned subsidiary of BOA, provided transfer agency services to the Fund and contracted with BFDS to serve as sub-transfer agent, under the same fee structure.
For the year ended March 31, 2011 the Fund's effective transfer agent fee rate for each class was 0.17% of the Fund's average daily net assets.
An annual minimum account balance fee of $20 may apply to certain accounts with a value below the Fund's initial minimum investment requirements to reduce the impact of small accounts on transfer agent fees. These minimum account balance fees are recorded as part of expense reductions on the Statement of Operations. For the year ended March 31, 2011, no minimum account balance fees were charged by the Fund.
Underwriting Discounts, Service and Distribution Fees
In connection with the Closing, RiverSource Fund Distributors, Inc., an indirect wholly owned subsidiary of Ameriprise Financial, provides distribution and shareholder services to the Fund and changed its name to Columbia Management Investment Distributors, Inc. (the Distributor). Pursuant to Rule 12b-1 under the 1940 Act, the Board of Trustees has approved, and the Fund has adopted, distribution and shareholder service plans (the Plans) which set the distribution and service fees for the Fund. These fees are calculated daily and are intended to compensate the Distributor and/or eligible selling and/or servicing agents for selling shares of the Fund and providing services to investors.
The Plans require the payment of a combined distribution and shareholder servicing fee for the Class A shares of the Fund. The Plans also require the payment of a monthly shareholder servicing fee and distribution fee for the Class B and Class C shares of the Fund. A substantial portion of the expenses incurred pursuant to these plans is paid to affiliates of the Distributor. The annual rates in effect and plan limits, as a percentage of average daily net assets are as follows:
| | | Current
Rate | | Plan
Limit | |
Class A Combined Distribution
and Shareholder Servicing Plan | | | 0.25 | % | | | 0.25 | % | |
Class B and Class C Shareholder
Servicing Plans | | | 0.25 | % | | | 0.25 | % | |
Class B and Class C
Distribution Plans | | | 0.75 | % | | | 0.75 | % | |
Prior to the Closing, Columbia Management Distributors, Inc., an affiliate of Columbia and an indirect, wholly owned subsidiary of BOA, was the principal underwriter of the Fund's shares. There were no changes to the underwriting discount structure of the Fund or the service or distribution fee rates paid by the Fund as a result of the Transaction.
Sales Charges
Sales charges, including front-end and CDSC's, received by the Distributor for distributing Fund shares were $2,563 for Class A and $1,894 for Class B shares for the year ended March 31, 2011.
Fee Waivers and Expense Reimbursements
Effective October 22, 2010, the Investment Manager and certain of its affiliates have contractually agreed to waive fees or reimburse expenses, through January 31, 2012, so that the Fund's ordinary operating expenses (excluding certain expenses described below), after giving effect to any balance credits or overdraft charges from the Fund's custodian, do not exceed the annual rates of 0.51%, 1.26%, 1.26%, and 0.26% of the Fund's average daily net assets attributable to Class A, Class B, Class C and Class Z shares,
24
Columbia Asset Allocation Fund II, March 31, 2011
respectively. The following expenses are excluded from the Fund's ordinary operating expenses when calculating the cap, and therefore will be paid by the Fund: taxes (including foreign transaction taxes), expenses associated with investment in other pooled investment vehicles (including exchange traded funds and other affiliated and unaffiliated mutual funds), transaction costs and brokerage commissions, costs related to any securities lending program, dividend expenses associated with securities sold short, inverse floater program fees and expenses, transaction charges and interest on borrowed money, interest, extraordinary expenses, investment management services fees and any other expenses the exclusion of which is specifically approved by the Fund's Board. This agreement may be modified or amended only with approval from all parties. Merger costs are treated as extraordinary expenses and therefore not subject to the Fund's expense limits.
For the period May 1, 2010 through October 21, 2010, the Investment Manager voluntarily agreed to reimburse a portion of the Fund's expenses so that the Fund's ordinary operating expenses (excluding any distribution and service fees, brokerage commissions, interest, taxes and extraordinary expenses, but including custodian charges relating to overdrafts, if any), after giving effect to any balance credits from the Fund's custodian, did not exceed 0.95% of the Fund's average daily net assets on an annualized basis. Prior to May 1, 2010, Columbia voluntarily reimbursed a portion of the Fund's expenses in the same manner.
Fees Paid to Officers and Trustees
In connection with the Closing, all officers of the Fund are employees of the Investment Manager or its affiliates and, with the exception of the Fund's Chief Compliance Officer, receive no compensation from the Fund. The Board of Trustees has appointed a Chief Compliance Officer to the Fund in accordance with federal securities regulations. The Fund, along with other affiliated funds, pays its pro-rata share of the expenses associated with the Chief Compliance Officer. The Fund's expenses for the Chief Compliance Officer will not exceed $15,000 per year. Prior to the Closing, all officers of the Fund were employees of Columbia or its affiliates and the Fund paid its pro-rata share of the expenses for the Chief Compliance Officer under the same fee structure.
Trustees are compensated for their services to the Fund, as set forth on the Statement of Operations. The Trust's eligible Trustees may participate in a non-qualified deferred compensation plan which may be terminated at any time. Any payments to plan participants are paid solely out of the Fund's assets. Income earned on the plan participant's deferral account is based on the rate of return of the eligible mutual funds selected by the participant or, if no funds are selected, on the rate of return of Columbia Money Market Fund (formerly known as RiverSource Cash Management Fund). Prior to the Closing, if no funds were selected, income earned on the plan participant's deferral account was based on the rate of return of BofA Treasury Reserves. Trustees' fees deferred during the current period as well as any gains or losses on the trustees' deferred compensation balances as a result of market fluctuations are included in "Trustees' fees" on the Statement of Operations. Liabilities under the deferred compensation plan are included in "Trustees' fees" on the Statement of Assets and Liabilities.
Note 4. Custody Credits
The Fund has an agreement with its custodian bank under which custody fees may be reduced by balance credits. These credits are recorded as part of expense reductions on the Statement of Operations. The Fund could have invested a portion of the assets utilized in connection with the expense offset arrangement in an income-producing asset if it had not entered into such an agreement. For the year ended March 31, 2011, these custody credits reduced total expenses by $273 for the Fund.
Note 5. Portfolio Information
The cost of purchases and proceeds from sales of securities, excluding short-term obligations, aggregated $202,260,161 and $197,723,510, respectively, for the year ended March 31, 2011, of which $13,764,370 and $33,770,173, respectively, were U.S. Government securities.
Note 6. Regulatory Settlements
During the year ended March 31, 2010, the Fund received payments totaling $1,914 resulting from certain regulatory settlements with third parties in which the Fund had participated. The payments have been included in "Increase from regulatory settlements" in the Statement of Changes in Net Assets.
Note 7. Shareholder Concentration
As of March 31, 2011, two shareholder accounts owned 83.9% of the outstanding shares of the Fund. Purchase and redemption activity of these accounts may have a significant effect on the operations of the Fund.
25
Columbia Asset Allocation Fund II, March 31, 2011
Note 8. Line of Credit
Prior to March 28, 2011, the Fund and other affiliated funds participated in a $280,000,000 committed, unsecured revolving line of credit provided by State Street. Effective March 28, 2011, the commitment was reduced to $225,000,000. The maximum amount that may be borrowed by any fund is limited to the lesser of $200,000,000 and the Fund's borrowing limit set forth in the Fund's registration statement. Borrowings are available for short-term liquidity or temporary or emergency purposes.
Effective October 14, 2010, interest is charged to each participating fund based on the fund's borrowings at a rate per annum equal to the greater of the Federal Funds Rate plus 1.25% or the overnight LIBOR Rate plus 1.25%. In addition, a commitment fee of 0.125% per annum is accrued and apportioned among the participating funds pro rata based on their relative net assets.
Prior to October 14, 2010, interest was charged to each participating fund at the same rates. In addition, a commitment fee of 0.15% per annum was accrued and apportioned among the participating funds pro rata based on their relative net assets.
For the year ended March 31, 2011, the Fund did not borrow under these arrangements.
Note 9. Federal Tax Information
The timing and character of income and capital gain distributions are determined in accordance with income tax regulations, which may differ from GAAP. Reclassifications are made to the Fund's capital accounts for permanent tax differences to reflect income and gains available for distribution (or available capital loss carryforwards) under income tax regulations.
For the year ended March 31, 2011, permanent book and tax basis differences resulting primarily from differing treatments for non-deductible merger fees and short-term gain distributions from underlying funds were identified and reclassified among the components of the Fund's net assets as follows:
Undistributed
Net Investment
Income | | Accumulated
Net Realized
Gain | | Paid-In Capital | |
| $ | 6,324,949 | | | $ | (6,282,453 | ) | | $ | (42,496 | ) | |
Net investment income and net realized gains (losses), as disclosed on the Statement of Operations, and net assets were not affected by this reclassification.
The tax character of distributions paid during the years ended March 31, 2011 and March 31, 2010 was as follows:
| | | March 31, | |
| Distributions paid from | | 2011 | | 2010 | |
| Ordinary Income* | | $ | 8,533,875 | | | $ | 2,061,504 | | |
| Long-Term Capital Gains | | $ | 549,139 | | | | — | | |
* For tax purposes short-term capital gain distributions, if any, are considered ordinary income distributions.
As of March 31, 2011, the components of distributable earnings on a tax basis were as follows:
Undistributed
Ordinary
Income | | Undistributed
Long-Term
Capital Gains | | Net Unrealized
Depreciation* | |
| $ | 71,400 | | | $ | 3,052,477 | | | $ | (1,996,121 | ) | |
* The differences between book-basis and tax-basis net unrealized depreciation are primarily due to deferral of losses from wash sales.
Unrealized appreciation and depreciation at March 31, 2011, based on cost of investments for federal income tax purposes were:
| Unrealized appreciation | | $ | 1,402,701 | | |
| Unrealized depreciation | | | (3,398,822 | ) | |
| Net unrealized depreciation | | $ | (1,996,121 | ) | |
Capital loss carryforwards of $16,794,584 were utilized during the year ended March 31, 2011.
Management of the Fund has concluded that there are no significant uncertain tax positions that would require recognition in the financial statements. However, management's conclusion may be subject to review and adjustment at a later date based on factors including, but not limited to, new tax laws, regulations, and administrative interpretations (including relevant court decisions). The Fund's federal tax returns for the prior three fiscal years remain subject to examination by the Internal Revenue Service.
26
Columbia Asset Allocation Fund II, March 31, 2011
Note 10. Significant Risks and Contingencies
Allocation Risk
The Fund uses an asset allocation strategy in pursuing its investment objective. There is a risk that the Fund's allocation among asset classes or investments will cause the Fund to under-perform other funds with similar investment objectives, or that the investments themselves will not produce the returns expected.
Asset-Backed Securities Risk
The value of asset-backed securities may be affected by, among other factors, changes in interest rates, the market's assessment of the quality of underlying assets, the creditworthiness of the servicer for the underlying assets, factors concerning the interests in and structure of the issuer or the originator of the underlying assets, or the creditworthiness or rating of the entities that provide any supporting letters of credit, surety bonds, derivative instruments, or other credit enhancement. The value of asset-backed securities also will be affected by the exhaustion, termination or expiration of any credit enhancement. Most asset-backed securities are subject to prepayment risk, which is the possibility that the underlying debt may be refinanced or prepaid prior to maturity during periods of declining or low interest rates, causing the Fund to have to reinvest the money received in securities that have lower yields. In addition, the impact of prepayments on the value of asset-backed securities may be difficult to predict and may result in greater volatility.
Mortgage-Backed Securities Risk
The value of mortgage-backed securities may be affected by, among other things, changes in interest rates, factors concerning the interests in and structure of the issuer or the originator of the mortgages, the creditworthiness of the entities that provide any supporting letters of credit, surety bonds or other credit enhancements or the quality of underlying assets or the market's assessment thereof. Mortgage-backed securities are subject to prepayment risk, which is the possibility that the underlying mortgage may be refinanced or prepaid prior to maturity during periods of declining or low interest rates, causing the Fund to have to reinvest the money received in securities that have lower yields. In addition, the impact of prepayments on the value of mortgage-backed securities may be difficult to predict and may result in greater volatility.
Investing in Other Funds Risk
The performance of the Underlying Funds in which the Fund invests could be adversely affected if other entities that invest in the same Underlying Funds make relatively large investments or redemptions in the Underlying Funds. Because the expenses and costs of an Underlying Fund are shared by its investors, redemptions by other investors in the Underlying Fund could result in decreased economies of scale and increased operating expenses for the Underlying Fund. The Fund, and its shareholders, indirectly bear a portion of the expenses of the Underlying Funds. These transactions might also result in higher brokerage, tax or other costs for the Fund. This risk may be particularly important when one investor owns a substantial portion of any Underlying Fund. In addition, the Investment Manager has the authority to change the Underlying Funds in which the Fund invests or to change the percentage of the Fund's investments allocated to each Underlying Fund. If an Underlying Fund pays fees to the Investment Manager or its affiliates, such as investment management fees, this could result in the Investment Manager having a potential conflict of interest in selecting the Underlying Funds in which the Fund invests or in determining the percentage of the Fund's investments allocated to each Underlying Fund. There are also circumstances in which the Investment Manager's fiduciary duties to the Fund may conflict with its fiduciary duties to the Underlying Funds.
Note 11. Subsequent Events
Management has evaluated the events and transactions that have occurred through the date the financial statements were issued. Other than as noted below, there were no items requiring adjustment of the financial statements or additional disclosure.
In August 2010, the Board of Trustees approved a proposal to merge the Fund into Columbia LifeGoal Balanced Growth Portfolio. The proposal was approved at a special meeting of shareholders held on February 15, 2011. The merger, which was a tax-free reorganization for U.S. federal income tax purposes, was effective May 2, 2011.
Effective May 16, 2011, the line of credit commitment with State Street was reduced to $150,000,000, and the maximum amount that may be borrowed by any fund was limited to the lesser of $120,000,000 and the Fund's borrowing limit set forth in the Fund's registration statement.
27
Columbia Asset Allocation Fund II, March 31, 2011
Note 12. Information Regarding Pending and Settled Legal Proceedings
In June 2004, an action captioned John E. Gallus et al. v. American Express Financial Corp. and American Express Financial Advisors Inc. was filed in the United States District Court for the District of Arizona. The plaintiffs allege that they are investors in several American Express Company (now known as RiverSource) mutual funds and they purport to bring the action derivatively on behalf of those funds under the Investment Company Act of 1940. The plaintiffs allege that fees allegedly paid to the defendants by the funds for investment advisory and administrative services are excessive. The plaintiffs seek remedies including restitution and rescission of investment advisory and distribution agreements. The plaintiffs voluntarily agreed to transfer this case to the United States District Court for the District of Minnesota (the District Court). In response to defendants' motion to dismiss the complaint, the District Court dismissed one of plaintiffs' four claims and granted plaintiffs limited discovery. Defendants moved for summary judgment in April 2007. Summary judgment was granted in the defendants' favor on July 9, 2007. The plaintiffs filed a notice of appeal with the Eighth Circuit Court of Appeals (the Eighth Circuit) on August 8, 2007. On April 8, 2009, the Eighth Circuit reversed summary judgment and remanded to the District Court for further proceedings. On August 6, 2009, defendants filed a writ of certiorari with the U.S. Supreme Court (the Supreme Court), asking the Supreme Court to stay the District Court proceedings while the Supreme Court considers and rules in a case captioned Jones v. Harris Associates, which involves issues of law similar to those presented in the Gallus case. On March 30, 2010, the Supreme Court issued its ruling in Jones v. Harris Associates, and on April 5, 2010, the Supreme Court vacated the Eighth Circuit's decision in the Gallus case and remanded the case to the Eighth Circuit for further consideration in light of the Supreme Court's decision in Jones v. Harris Associates. On June 4, 2010, the Eighth Circuit remanded the Gallus case to the District Court for further consideration in light of the Supreme Court's decision in Jones v. Harris Associates. On December 9, 2010, the District Court reinstated its July 9, 2007 summary judgment order in favor of the defendants. On January 10, 2011 plaintiffs filed a notice of appeal with the Eighth Circuit.
In December 2005, without admitting or denying the allegations, American Express Financial Corporation (AEFC, which is now known as Ameriprise Financial, Inc. (Ameriprise Financial)), entered into settlement agreements with the Securities and Exchange Commission (SEC) and Minnesota Department of Commerce (MDOC) related to market timing activities. As a result, AEFC was censured and ordered to cease and desist from committing or causing any violations of certain provisions of the Investment Advisers Act of 1940, the Investment Company Act of 1940, and various Minnesota laws. AEFC agreed to pay disgorgement of $10 million and civil money penalties of $7 million. AEFC also agreed to retain an independent distribution consultant to assist in developing a plan for distribution of all disgorgement and civil penalties ordered by the SEC in accordance with various undertakings detailed at http://www.sec.gov/litigation/admin/ia-2451.pdf. Ameriprise Financial and its affiliates have cooperated with the SEC and the MDOC in these legal proceedings, and have made regular reports to the funds' Boards of Directors/Trustees.
Ameriprise Financial and certain of its affiliates have historically been involved in a number of legal, arbitration and regulatory proceedings, including routine litigation, class actions, and governmental actions, concerning matters arising in connection with the conduct of their business activities. Ameriprise Financial believes that the Funds are not currently the subject of, and that neither Ameriprise Financial nor any of its affiliates are the subject of, any pending legal, arbitration or regulatory proceedings that are likely to have a material adverse effect on the Funds or the ability of Ameriprise Financial or its affiliates to perform under their contracts with the Funds. Ameriprise Financial is required to make 10-Q, 10-K and, as necessary, 8-K filings with the Securities and Exchange Commission on legal and regulatory matters that relate to Ameriprise Financial and its affiliates. Copies of these filings may be obtained by accessing the SEC website at www.sec.gov.
There can be no assurance that these matters, or the adverse publicity associated with them, will not result in increased fund redemptions, reduced sale of fund shares or other adverse consequences to the Funds. Further, although we believe proceedings are not likely to have a material adverse effect on the Funds or the ability of Ameriprise Financial or its affiliates to perform under their contracts with the Funds, these proceedings are subject to uncertainties and, as such, we are unable to estimate the possible loss or range of loss that may result. An adverse outcome in one or more of these proceedings could result in adverse judgments, settlements, fines, penalties or other relief that could have a material adverse effect on the consolidated financial condition or results of operations of Ameriprise Financial.
28
Report of Independent Registered Public Accounting Firm
To the Trustees of Columbia Funds Series Trust and the Shareholders of Columbia Asset Allocation Fund II
In our opinion, the accompanying statement of assets and liabilities, including the investment portfolio, and the related statements of operations and of changes in net assets and the financial highlights present fairly, in all material respects, the financial position of Columbia Asset Allocation Fund II (the "Fund") (a series of Columbia Funds Series Trust) at March 31, 2011, and the results of its operations, the changes in its net assets and the financial highlights for each of the periods indicated, in conformity with accounting principles generally accepted in the United States of America. These financial statements and financial highlights (hereafter referred to as "financial statements") are the responsibility of the Fund's management. Our responsibility is to express an opinion on these financial statements based on our audits. We conducted our audits of these financial statements in accordance with the standards of the Public Company Accounting Oversight Board (United States). Those standards require that we plan and perform the audit to obtain reasonable assurance about whether the financial statements are free of material misstatement. An audit includes examining, on a test basis, evidence supporting the amounts and disclosures in the financial statements, assessing the accounting principles used and significant estimates made by management, and evaluating the overall financial statement presentation. We believe that our audits, which included confirmation of securities at March 31, 2011 by correspondence with the custodian and brokers, provide a reasonable basis for our opinion.
As disclosed in Note 11, the Fund was merged into the Columbia LifeGoal Balanced Growth Portfolio on May 2, 2011.
PricewaterhouseCoopers LLP
Boston, Massachusetts
May 20, 2011
29
Federal Income Tax Information (Unaudited) – Columbia Asset Allocation Fund II
The Fund hereby designates as a capital gain dividend with respect to the fiscal year ended March 31, 2011, $3,781,697, or, if subsequently determined to be different, the net capital gain of such year.
10.02% of the ordinary income distributed by the Fund for the fiscal year ended March 31, 2011, qualifies for the corporate dividends received deduction.
For non-corporate shareholders 11.44%, or the maximum amount allowable under the Jobs and Growth Tax Relief Reconciliation Act of 2003, of ordinary income distributed by the Fund for the fiscal year ended March 31, 2011 may represent qualified dividend income.
The Fund will notify shareholders in January 2012 of amounts for use in preparing 2011 income tax returns.
30
Fund Governance
The Trustees serve terms of indefinite duration. The names, addresses and birth years of the Trustees and Officers of the Funds in the Columbia Funds Series Trust, the year each was first elected or appointed to office, their principal business occupations during at least the last five years, the number of Funds overseen by each Trustee and other directorships they hold are shown below. Each officer listed below serves as an officer of each Fund in the Columbia Funds Series Trust.
Independent Trustees
Name, Address and Year of Birth,
Position with Funds, Year First
Elected or Appointed to Office | | Principal Occupation(s) During Past Five Years, Number of Funds in the Columbia
Funds Complex Overseen by Trustee, Other Directorships Held
| |
| Edward J. Boudreau, Jr. (Born 1944) | |
|
c/o Columbia Management
Investment Advisers, LLC
225 Franklin Street
Boston, MA 02110
Trustee (since 2005) | | Managing Director—E.J. Boudreau & Associates (consulting), from 2000 through current; oversees 41; Trustee—BofA Funds Series Trust. | |
|
| William P. Carmichael (Born 1943) | |
|
c/o Columbia Management
Investment Advisers, LLC
225 Franklin Street
Boston, MA 02110
Trustee (since 1999) | | Retired; oversees 41; Director—Cobra Electronics Corporation (electronic equipment manufacturer); Director—McMoRan Exploration Company (oil and gas exploration and development); Director—The Finish Line (athletic shoes and apparel); Trustee—BofA Funds Series Trust. | |
|
| William A. Hawkins (Born 1942) | |
|
c/o Columbia Management
Investment Advisers, LLC
225 Franklin Street
Boston, MA 02110
Trustee (since 2005) | | Managing Director—Overton Partners (financial consulting), August 2010 to present; President and Chief Executive Officer—California General Bank, N.A., from January 2008 through August 2010; oversees 41; Trustee—BofA Funds Series Trust. | |
|
| R. Glenn Hilliard (Born 1943) | |
|
c/o Columbia Management
Investment Advisers, LLC
225 Franklin Street
Boston, MA 02110
Trustee (since 2005) | | Chairman and Chief Executive Officer—Hilliard Group LLC (investing and consulting), from April 2003 through current; oversees 41; Trustee—BofA Funds Series Trust. | |
|
| John J. Nagorniak (Born 1944) | |
|
c/o Columbia Management
Investment Advisers, LLC
225 Franklin Street
Boston, MA 02110
Trustee (since 2008) | | Retired; President and Director—Foxstone Financial, Inc. (consulting), 2000 through December 2007; Director—Mellon Financial Corporation affiliates (investing), 2000 through 2007; Chairman—Franklin Portfolio Associates (investing—Mellon affiliate), 1982 through 2007; oversees 41; Director—MIT Investment Company; Trustee—MIT 401k Plan; ; Trustee—Research Foundation of CFA Institute; Trustee—BofA Funds Series Trust. | |
|
31
Fund Governance (continued)
Independent Trustees (continued)
Name, Address and Year of Birth,
Position with Funds, Year First
Elected or Appointed to Office | | Principal Occupation(s) During Past Five Years, Number of Funds in the Columbia
Funds Complex Overseen by Trustee, Other Directorships Held
| |
| Minor M. Shaw (Born 1947) | |
|
c/o Columbia Management
Investment Advisers, LLC
225 Franklin Street
Boston, MA 02110
Trustee (since 2003) | | President—Micco Corporation and Mickel Investment Group; oversees 41; Board Member—Piedmont Natural Gas; Trustee—BofA Funds Series Trust. | |
|
Interested Trustee
| Anthony M. Santomero1 (Born 1946) | |
|
c/o Columbia Management
Investment Advisers, LLC
225 Franklin Street
Boston, MA 02110
Trustee (since 2008) | | Richard K. Mellon Professor Emeritus of Finance, The Wharton School, University of Pennsylvania, from 2002 through current; Senior Advisor—McKinsey & Company (consulting), July 2006 through January 2008; President and Chief Executive Officer—Federal Reserve Bank of Philadelphia, July 2000 through April 2006; oversees 41; Director—Renaissance Reinsurance Ltd; Trustee—Penn Mutual Life Insurance Company; Director—Citigroup, Inc.; Director—Citibank, N.A.; Trustee—BofA Funds Series Trust. | |
|
1 Dr. Santomero is currently deemed by the Columbia Funds to be an "interested person" (as defined in the 1940 Act) of the Funds because he serves as a Director of Citigroup, Inc. and Citibank, N.A., companies that may directly or through subsidiaries and affiliates engage from time-to-time in brokerage execution, principal transactions and lending relationships with the Columbia Funds or other funds or accounts advised/managed by Columbia Management Investment Advisers, LLC.
The Statement of Additional Information includes additional information about the Trustees of the Funds and is available, without charge, upon request by calling 800-345-6611.
Officers
| Name, Year of Birth and Address | | Principal Occupation(s) During the Past Five Years | |
| J. Kevin Connaughton (Born 1964) | |
|
225 Franklin Street
Boston, MA 02110
President (since 2009) | | Senior Vice President and General Manager—Mutual Fund Products, Columbia Management Investment Advisers, LLC since May 2010; President, Columbia Funds, since 2009, and RiverSource Funds, since May 2010 (previously Senior Vice President and Chief Financial Officer, Columbia Funds, from June 2008 to January 2009, Treasurer, Columbia Funds, from October 2003 to May 2008, and senior officer of various other affiliated funds since 2000); Managing Director, Columbia Management Advisors, LLC from December 2004 to April 2010. | |
|
| Michael G. Clarke (Born 1969) | |
|
225 Franklin Street
Boston, MA 02110
Treasurer (since 2011) and
Chief Financial Officer (since 2009) | | Vice President, Columbia Management Investment Advisers, LLC since May 2010; Managing Director of Fund Administration, Columbia Management Advisors, LLC, from September 2004 to April 2010; senior officer of Columbia Funds and affiliated funds since 2002. | |
|
32
Fund Governance (continued)
Officers (continued)
| Name, Year of Birth and Address | | Principal Occupation(s) During the Past Five Years | |
| Scott R. Plummer (Born 1959) | |
|
5228 Ameriprise Financial Center
Minneapolis, MN 55474
Senior Vice President and
Chief Legal Officer (since 2010) | | Chief Legal Officer and Assistant Secretary, Columbia Management Investment Advisers, LLC since June 2005; Vice President and Lead Chief Counsel—Asset Management, Ameriprise Financial, Inc. since May 2010 (previously Vice President and Chief Counsel—Asset Management, from 2005 to April 2010, and Vice President—Asset Management Compliance from 2004 to 2005); Vice President, Chief Counsel and Assistant Secretary, Columbia Management Investment Distributors, Inc. since 2008; Vice President, General Counsel and Secretary, Ameriprise Certificate Company since 2005; Chief Counsel, RiverSource Distributors, Inc. since 2006; Vice President, General Counsel and Secretary, RiverSource Funds, since December 2006; Senior Vice President, Secretary and Chief Legal Officer, Columbia Funds, since May 2010. | |
|
| Linda J. Wondrack (Born 1964) | |
|
225 Franklin Street
Boston, MA 02110
Senior Vice President and
Chief Compliance Officer (since 2007) | | Vice President and Chief Compliance Officer, Columbia Management Investment Advisers, LLC since May 2010; Chief Compliance Officer, Columbia Funds, since 2007, and RiverSource Funds, since May 2010; Director (Columbia Management Group, LLC and Investment Product Group Compliance), Bank of America, from June 2005 to April 2010. | |
|
| William F. Truscott (Born 1960) | |
|
53600 Ameriprise Financial Center
Minneapolis, MN 55474
Senior Vice President (since 2010) | | Chairman of the Board, Columbia Management Investment Advisers, LLC since May 2010 (previously President, Chairman of the Board and Chief Investment Officer, from 2001 to April 2010); Chief Executive Officer, U.S. Asset Management & President, Annuities, Ameriprise Financial, Inc. since May 2010 (previously President—U.S. Asset Management and Chief Investment Officer from 2005 to April 2010, and Senior Vice President—Chief Investment Officer, from 2001 to 2005); Director, President and Chief Executive Officer, Ameriprise Certificate Company since 2006; Director, Columbia Management Investment Distributors, Inc. since May 2010 (previously Chairman of the Board and Chief Executive Officer from 2008 to April 2010); Chairman of the Board and Chief Executive Officer, RiverSource Distributors, Inc. since 2006. | |
|
| Colin Moore (Born 1958) | |
|
One Financial Center
Boston, MA 02111
Senior Vice President (since 2010) | | Director and Chief Investment Officer, Columbia Management Investment Advisers, LLC since May 2010; Manager, Managing Director and Chief Investment Officer of Columbia Management Advisors, LLC from 2007 to April 2010; Head of Equities, Columbia Management Advisors, LLC from 2002 to 2007. | |
|
| Michael A. Jones (Born 1959) | |
|
225 Franklin Street
Boston, MA 02110
Senior Vice President (since 2010) | | President and Director, Columbia Management Investment Advisers, LLC since May 2010; President and Director, Columbia Management Investment Distributors, Inc. since May 2010; Manager, Chairman, Chief Executive Officer and President, Columbia Management Advisors, LLC from 2007 to April 2010; Chief Executive Officer, President and Director, Columbia Management Distributors, Inc. from November 2006 to April 2010; previously, co-president and senior managing director at Robeco Investment Management. | |
|
33
Fund Governance (continued)
Officers (continued)
| Name, Year of Birth and Address | | Principal Occupation(s) During the Past Five Years | |
| Christopher O. Petersen (Born 1970) | |
|
5228 Ameriprise Financial Center
Minneapolis, MN 55474
Vice President and
Secretary (since 2011) | | Vice President and Chief Counsel, Ameriprise Financial since January 2010 (formerly Vice President and Group Counsel or Counsel from April 2004 to January 2010); Assistant Secretary of RiverSource Funds since January 2007. | |
|
| Amy Johnson (Born 1965) | |
|
5228 Ameriprise Financial Center
Minneapolis, MN 55474
Vice President (since 2010) | | Senior Vice President and Chief Operating Officer, Columbia Management Investment Advisers, LLC since May 2010 (previously Chief Administrative Officer, from 2009 until April 2010, Vice President—Asset Management and Trust Company Services, from 2006 to 2009, and Vice President—Operations and Compliance from 2004 to 2006). | |
|
| Joseph F. DiMaria (Born 1968) | |
|
225 Franklin Street
Boston, MA 02110
Vice President (since 2011) and
Chief Accounting Officer (since 2008) | | Vice President, Mutual Fund Administration, Columbia Management Investment Advisers, LLC, since May 2010; Director of Fund Administration, Columbia Management Advisors, LLC from January 2006 to April 2010; Head of Tax/Compliance and Assistant Treasurer, Columbia Management Advisors, LLC, from November 2004 to December 2005. | |
|
| Paul B. Goucher (Born 1968) | |
|
5228 Ameriprise Financial Center
Minneapolis, MN 55474
Vice President and
Assistant Treasurer (since 2010) | | Vice President and Chief Counsel of Ameriprise Financial since January 2010 (formerly Vice President and Group Counsel from November 2008 to January 2010); Director, Managing Director and General Counsel of J. & W. Seligman & Co. Incorporated (Seligman) from July 2008 to November 2008 and Managing Director and Associate General Counsel of Seligman from January 2005 to July 2008. | |
|
| Michael E. DeFao (Born 1968) | |
|
5228 Ameriprise Financial Center
Minneapolis, MN 55474
Vice President and
Assistant Treasurer (since 2011) | | Vice President and Chief Counsel, Ameriprise Financial since May 2010; Associate General Counsel Bank of America from June 2005 to April 2010 | |
|
| Stephen T. Welsh (Born 1957) | |
|
225 Franklin Street
Boston, MA 02110
Vice President (since 2006) | | President and Director, Columbia Management Investment Services Corp. since May 2010; President and Director, Columbia Management Services, Inc. from July 2004 to April 2010; Managing Director, Columbia Management Distributors, Inc. from August 2007 to April 2010. | |
|
34
Shareholder Meeting Results
At a Joint Special Meeting of Shareholders held on February 15, 2011, shareholders of the Fund considered the proposals described below.
Proposal 1. Shareholders of the Fund approved an Agreement and Plan of Reorganization pursuant to which the Fund will transfer its assets to Columbia LifeGoal® Balanced Growth Portfolio (the "Buying Fund") in exchange for shares of the Buying Fund and the assumption by the Buying Fund of all of the liabilities of the Fund, as follows:
| Votes For | | Votes Against | | Abstentions | | Broker Non-Votes | |
| 2,459,958 | | | 34,525 | | | | 32,898 | | | | 175,379 | | |
The Reorganization was effective on May 2, 2011.
Proposal 2. Shareholders of Columbia Funds Series Trust elected each of the nominees for trustees to the Board of Trustees of Columbia Funds Series Trust, each to hold office for an indefinite term, as follows:
| Trustee | | Votes For | | Votes Withheld | | Abstentions | |
| Kathleen Blatz | | | 2,145,636,122 | | | | 248,012,438 | | | | 0 | | |
| Edward J. Boudreau, Jr. | | | 2,145,430,114 | | | | 248,218,446 | | | | 0 | | |
| Pamela G. Carlton | | | 2,145,515,949 | | | | 248,132,612 | | | | 0 | | |
| William P. Carmichael | | | 2,145,038,695 | | | | 248,609,866 | | | | 0 | | |
| Patricia M. Flynn | | | 2,145,843,563 | | | | 247,804,997 | | | | 0 | | |
| William A. Hawkins | | | 2,145,359,401 | | | | 248,289,160 | | | | 0 | | |
| R. Glenn Hilliard | | | 2,145,079,400 | | | | 248,569,161 | | | | 0 | | |
| Stephen R. Lewis, Jr. | | | 2,145,092,209 | | | | 248,556,351 | | | | 0 | | |
| John F. Maher | | | 2,145,621,338 | | | | 248,027,223 | | | | 0 | | |
| John J. Nagorniak | | | 2,145,337,494 | | | | 248,311,067 | | | | 0 | | |
| Catherine James Paglia | | | 2,145,615,254 | | | | 248,033,306 | | | | 0 | | |
| Leroy C. Richie | | | 2,145,042,120 | | | | 248,606,441 | | | | 0 | | |
| Anthony M. Santomero | | | 2,145,088,174 | | | | 248,560,386 | | | | 0 | | |
| Minor M. Shaw | | | 2,145,430,762 | | | | 248,217,798 | | | | 0 | | |
| Alison Taunton-Rigby | | | 2,145,393,384 | | | | 248,255,177 | | | | 0 | | |
| William F. Truscott | | | 2,144,907,223 | | | | 248,741,338 | | | | 0 | | |
35
This page intentionally left blank.
Important Information About This Report
The fund mails one shareholder report to each shareholder address. If you would like more than one report, please call shareholder services at 1-800-345-6611 and additional reports will be sent to you. This report has been prepared for shareholders of Columbia Asset Allocation Fund II.
A description of the policies and procedures that the fund uses to determine how to vote proxies and a copy of the fund's voting records are available (i) at www.columbiamanagement.com, (ii) on the Securities and Exchange Commission's website at www.sec.gov, and (iii) without charge, upon request, by calling 1-800-368-0346. Information regarding how the fund voted proxies relating to portfolio securities during the 12-month period ended June 30 is available from the SEC's website. Information regarding how the fund voted proxies relating to portfolio securities is also available from the fund's website, www.columbiamanagement.com.
The fund files a complete schedule of portfolio holdings with the SEC for the first and third quarters of each fiscal year on Form N-Q. The fund's Form N-Q is available on the SEC's website at www.sec.gov and may be reviewed and copied at the SEC's Public Reference Room in Washington, D.C. Information on the operation of the Public Reference Room may be obtained by calling 1-800-SEC-0330.
Transfer Agent
Columbia Management Investment
Services Corp.
P.O. Box 8081
Boston, MA 02266-8081
1-800-345-6611
Distributor
Columbia Management Investment
Distributors, Inc.
225 Franklin Street
Boston, MA 02110
Investment Manager
Columbia Management Investment Advisers, LLC
225 Franklin Street
Boston, MA 02110
37

PRSRT STD
U.S. Postage
PAID
Holliston, MA
Permit NO. 20
Columbia Asset Allocation Fund II
P. O. Box 8081
Boston, MA 02266-8081
columbiamanagement.com
This information is for use with concurrent or prior delivery of a fund prospectus. Investors should consider the investment objectives, risks, charges and expenses of a mutual fund carefully before investing. For a free prospectus, which contains this and other important information about the funds, visit columbiamanagement.com. Read the prospectus carefully before investing. The Fund is distributed by Columbia Management Investment Distributors, Inc., member FINRA, and managed by Columbia Management Investment Advisers, LLC.
© 2011 Columbia Management Investment Advisers, LLC. All rights reserved.
C-1111 A (05/11)

Columbia Masters International Equity Portfolio
Annual Report for the Period Ended March 31, 2011
Not FDIC insured • No bank guarantee • May lose value
Table of Contents
| Portfolio Profile | | | 1 | | |
|
| Economic Update | | | 2 | | |
|
| Performance Information | | | 4 | | |
|
| Understanding Your Expenses | | | 5 | | |
|
| Portfolio Managers' Report | | | 6 | | |
|
| Investment Portfolio | | | 8 | | |
|
Statement of Assets and
Liabilities | | | 9 | | |
|
| Statement of Operations | | | 11 | | |
|
Statement of Changes in
Net Assets | | | 12 | | |
|
| Financial Highlights | | | 14 | | |
|
| Notes to Financial Statements | | | 19 | | |
|
Report of Independent Registered
Public Accounting Firm | | | 27 | | |
|
| Federal Income Tax Information | | | 28 | | |
|
| Fund Governance | | | 29 | | |
|
| Shareholder Meeting Results | | | 33 | | |
|
Important Information About
This Report | | | 37 | | |
|
The views expressed in this report reflect the current views of the respective parties. These views are not guarantees of future performance and involve certain risks, uncertainties and assumptions that are difficult to predict, so actual outcomes and results may differ significantly from the views expressed. These views are subject to change at any time based upon economic, market or other conditions and the respective parties disclaim any responsibility to update such views. These views may not be relied on as investment advice and, because investment decisions for a Columbia Fund are based on numerous factors, may not be relied on as an indication of trading intent on behalf of any particular Columbia Fund. References to specific securities should not be construed as a recommendation or investment advice.
President's Message

Dear Shareholder:
The Columbia Management story began over 100 years ago, and today, we are one of the nation's largest dedicated asset managers. The recent acquisition by Ameriprise Financial, Inc. brings together the talents, resources and capabilities of Columbia Management with those of RiverSource Investments, Threadneedle (acquired by Ameriprise in 2003) and Seligman Investments (acquired by Ameriprise in 2008) to build a best-in-class asset management business that we believe is truly greater than its parts.
RiverSource Investments traces its roots to 1894 when its then newly-founded predecessor, Investors Syndicate, offered a face-amount savings certificate that gave small investors the opportunity to build a safe and secure fund for retirement, education or other special needs. A mutual fund pioneer, Investors Syndicate launched Investors Mutual Fund in 1940. In the decades that followed, its mutual fund products and services lineup grew to include a full spectrum of styles and specialties. More than 110 years later, RiverSource continues to be a trusted financial products leader.
Threadneedle, a leader in global asset management and one of Europe's largest asset managers, offers sophisticated international experience from a dedicated U.K. management team. Headquartered in London, it is named for Threadneedle Street in the heart of the city's financial district, where British investors pioneered international and global investing. Threadneedle was acquired in 2003 and today operates as an affiliate of Columbia Management.
Seligman Investments' beginnings date back to the establishment of the investment firm J. & W. Seligman & Co. in 1864. In the years that followed, Seligman played a major role in the geographical expansion and industrial development of the United States. In 1874, President Ulysses S. Grant named Seligman as fiscal agent for the U.S. Navy—an appointment that would last through World War I. Seligman helped finance the westward path of the railroads and the building of the Panama Canal. The firm organized its first investment company in 1929 and began managing its first mutual fund in 1930. In 2008, J. & W. Seligman & Co. Incorporated was acquired and Seligman Investments became an offering brand of RiverSource Investments, LLC.
We are proud of the rich and distinctive history of these firms, the strength and breadth of products and services they offer, and the combined cultures of pioneering spirit and forward thinking. Together we are committed to providing more for our shareholders than ever before.
> A singular focus on our shareholders
Our business is asset management, so investors are our first priority. We dedicate our resources to identifying timely investment opportunities and provide a comprehensive choice of equity, fixed-income and alternative investments to help meet your individual needs.
> First-class research and thought leadership
We are dedicated to helping you take advantage of today's opportunities and anticipate tomorrow's. We stay abreast of the latest investment trends and ideas, using our collective insight to evaluate events and transform them into solutions you can use.
> A disciplined investment approach
We aren't distracted by passing fads. Our teams adhere to a rigorous investment process that helps ensure the integrity of our products and enables you and your financial advisor to match our solutions to your objectives with confidence.
When you choose Columbia Management, you can be confident that we will take the time to understand your needs and help you and your financial advisor identify the solutions that are right for you. Because at Columbia Management, we don't consider ourselves successful unless you are.
Sincerely,

J. Kevin Connaughton
President, Columbia Funds
Investors should consider the investment objectives, risks, charges and expenses of a mutual fund carefully before investing. For a free prospectus, which contains this and other important information about the funds, visit www.columbiamanagement.com. The prospectus should be read carefully before investing.
Columbia Funds are distributed by Columbia Management Investment Distributors, Inc., member FINRA, and managed by Columbia Management Investment Advisers, LLC.
© 2011 Columbia Management Investment Advisers, LLC. All rights reserved.
Portfolio Profile – Columbia Masters International Equity Portfolio
Summary
g For the 12-month period that ended March 31, 2011, the portfolio's Class A shares returned 12.08% without sales charge.
g The portfolio outperformed its benchmark, the MSCI EAFE Index (Net)1, but fell slightly behind the average return of the funds in its peer group, the Lipper International Multi-Cap Core Funds Classification2.
g We believe that stock selection generally accounted for the portfolio's advantage against its benchmark.
Portfolio Management
Fred Copper has co-managed the portfolio since 2010 and has been associated with the portfolio's adviser or the portfolio's previous adviser or its predecessors since 2005.
Colin Moore has co-managed the portfolio since 2009 and has been associated with the portfolio's adviser or the portfolio's previous adviser or its predecessors since 2002.
1The Morgan Stanley Capital International Europe, Australasia, Far East (MSCI EAFE) Index (Net) is a free float-adjusted market capitalization Index that is designed to measure the equity market performance of developed markets, excluding the U.S. & Canada. As of December 31, 2010, the MSCI EAFE Index (Net) consisted of the following 22 developed market country indices: Australia, Austria, Belgium, Denmark, Finland, France, Germany, Greece, Hong Kong, Ireland, Israel, Italy, Japan, the Netherlands, New Zealand, Norway, Portugal, Singapore, Spain, Sweden, Switzerland, and the United Kingdom.
2Lipper Inc., a widely respected data provider in the industry, calculates an average total return (assuming reinvestment of distributions) for mutual funds with investment objectives similar to those of the portfolio. Lipper makes no adjustment for the effect of sales loads.
Indices are not available for investment, are not professionally managed and do not reflect sales charges, fees, brokerage commissions, taxes or other expenses of investing. Securities in the portfolio may not match those in an index.
Performance data quoted represents past performance and current performance may be lower or higher. Past performance is no guarantee of future results. The investment return and principal value will fluctuate so that shares, when redeemed, may be worth more or less than the original cost. Please visit www.columbiamanagement.com for daily and most recent month-end performance updates.
Summary
1-year return as of 03/31/11
| | | | +12.08% | |
|
|  | | | Class A shares
(without sales charge) | |
|
| | | | +10.42% | |
|
|  | | | MSCI EAFE Index (Net)1 | |
|
Morningstar Style BoxTM

The Morningstar Style BoxTM is based on the Fund's portfolio holdings. For equity funds, the vertical axis shows the market capitalization of the stocks owned, and the horizontal axis shows investment style (value, blend or growth). Information shown is based on the most recent data provided by Morningstar.
© 2011 Morningstar, Inc. All rights reserved. The Morningstar information contained herein: (1) is proprietary to Morningstar and/or its content providers; (2) may not be copied or distributed; and (3) is not warranted to be accurate, complete or timely. Neither Morningstar nor its content providers are responsible for any damages or losses arising from any use of this information.
1
Economic Update – Columbia Masters International Equity Portfolio
Summary
For the 12-month period that ended March 31, 2011
g Despite intermittent volatility, stock markets around the world gained ground, as measured by the S&P 500 Index, the MSCI EAFE Index (Net) and the MSCI Emerging Markets Index (Net).
| S&P Index | | MSCI EAFE
Index | |
|
 | |  | |
|
| MSCI EM Index | |
|
 | |
|
As the world shed concerns that key economies might lapse back into recession, the World Bank reported that global gross domestic product (GDP) rose 3.9% in 2010. The improvement over 2009 was more notable in high-income developed economies than in emerging-market countries, which had less ground to make up. Emerging market countries expanded by an estimated 7%, contributing nearly half of all global growth in 2010. This two-speed global recovery is likely to result in slower growth in 2011, but global growth should remain solid at 3.3% to 3.6%1—higher in emerging market economies, led by China and India.
Robust expansion in the Asia Pacific region
Asian Pacific economies led the global economy in 2010 and are poised to continue in that role. Exports from markets such as Singapore and South Korea have been solid and domestic demand continues to strengthen. Labor markets are healthy, income is rising and confidence runs high across the region. Higher oil prices pose a downside risk to the current expansion, because it could erode demand for Asian exports and increase the risk of inflation. However, if growth exceeds expectations in the United States or Europe, the picture gets even better for Asia.
Austerity measures weigh on Europe
Growth in the developed world was hampered by a debt crisis in Europe's weakest nations. However, the European Union took steps to manage debt restructuring in an orderly fashion and fear subsided—at least for now. In addition, austerity measures were introduced in Greece, Ireland, Portugal and Spain. Public employment and government spending were cut back sharply. Layoffs and pay cuts have been met with resistance, but their necessity is hard to dispute.
Inflation a growing worry
As demand picked up and commodity prices began to rise across the globe, inflation has become a growing worry in both fast-growing emerging markets and slower-growth developed countries. In developed market economies, inflation is generally an external force, resulting from higher commodity prices, especially for food and energy. In emerging markets, excess demand is driving inflation concerns and policymakers have begun to shift their focus from stimulating growth to taming inflation. However, rising food prices are also a problem in Asia since food accounts for a greater percentage of household budgets than it does in more developed areas of the world.
Stocks stall, then pick up steam
Despite a period of volatility in the summer of 2010, as the world sought to digest a mounting debt crisis within euro zone countries, it was a good year for stock markets around the world. The U.S. stock market returned 15.65% for the 12-month period, as measured by the S&P 500 Index2. Outside the U.S., stock market returns were also positive. The MSCI EAFE Index (Net)3, a broad gauge of stock market performance in foreign developed markets, gained 10.42% (in U.S. dollars) for the period. Although the European Union took steps early in the year to rein in debt problems
1World Bank estimate, January 12, 2011.
2The Standard & Poor's (S&P) 500 Index tracks the performance of 500 widely held, large-capitalization U.S. stocks.
3The Morgan Stanley Capital International Europe, Australasia, Far East (MSCI EAFE) Index (Net) is a free float-adjusted market capitalization index that is designed to measure the equity market performance of developed markets, excluding the U.S. & Canada. As of December 31, 2010, the MSCI EAFE Index (Net) consisted of the following 22 developed market country indices: Australia, Austria, Belgium, Denmark, Finland, France, Germany, Greece, Hong Kong, Ireland, Israel, Italy, Japan, the Netherlands, New Zealand, Norway, Portugal, Singapore, Spain, Sweden, Switzerland and the United Kingdom.
2
Economic Update (continued) – Columbia Masters International Equity Portfolio
in Greece, Ireland and Spain, recent revelations that Portugal may also need a bailout hampered returns from European markets. The impact of an earthquake, tsunami and a nuclear power plant debacle took a significant bite out of Japan's returns in March, and Japan is a major component of the index. Emerging markets remained resilient, despite mounting fears about rising inflation. The MSCI Emerging Markets Index (Net)4 returned 18.46% (in U.S. dollars), led by strong performances from Eastern European markets.
Past performance is no guarantee of future results.
4The Morgan Stanley Capital International Emerging Markets (MSCI EM) Index (Net) is a free float-adjusted market capitalization index that is designed to measure equity market performance of emerging markets. As of December 31, 2010, the MSCI EM Index (Net) consisted of the following 21 emerging market country indices: Brazil, Chile, China, Colombia, Czech Republic, Egypt, Hungary, India, Indonesia, Korea, Malaysia, Mexico, Morocco, Peru, Philippines, Poland, Russia, South Africa, Taiwan, Thailand and Turkey.
Indices are not available for investment, are not professionally managed and do not reflect sales charges, fees, brokerage commissions, taxes or other expenses of investing. Securities in the fund may not match those in an index.
3
Performance Information – Columbia Masters International Equity Portfolio
Performance data quoted represents past performance and current performance may be lower or higher. Past performance is no guarantee of future results. The investment return and principal value will fluctuate so that shares, when redeemed, may be worth more or less than the original cost. Please visit www.columbiamanagement.com for daily and most recent month-end performance updates.
Performance of a $10,000 investment 02/15/06 – 03/31/11
The chart above shows the change in value of a hypothetical $10,000 investment in Class A shares of Columbia Masters International Equity Portfolio during the stated time period, and does not reflect the deduction of taxes that a shareholder may pay on portfolio distributions or on the redemption of portfolio shares.
Performance of a $10,000 investment 02/15/06 – 03/31/11 ($)
| Sales charge | | without | | with | |
| Class A | | | 10,946 | | | | 10,317 | | |
| Class B | | | 10,549 | | | | 10,461 | | |
| Class C | | | 10,538 | | | | 10,538 | | |
| Class R | | | 10,789 | | | | n/a | | |
| Class Z | | | 11,080 | | | | n/a | | |
Average annual total return as of 03/31/11 (%)
| Share class | | A | | B | | C | | R | | Z | |
| Inception | | 02/15/06 | | 02/15/06 | | 02/15/06 | | 02/15/06 | | 02/15/06 | |
| Sales charge | | without | | with | | without | | with | | without | | with | | without | | without | |
| 1-year | | | 12.08 | | | | 5.67 | | | | 11.18 | | | | 6.18 | | | | 11.19 | | | | 10.19 | | | | 11.62 | | | | 12.28 | | |
| 5-year | | | 1.30 | | | | 0.10 | | | | 0.56 | | | | 0.22 | | | | 0.56 | | | | 0.56 | | | | 1.01 | | | | 1.55 | | |
| Life | | | 1.78 | | | | 0.61 | | | | 1.05 | | | | 0.88 | | | | 1.03 | | | | 1.03 | | | | 1.49 | | | | 2.02 | | |
The "with sales charge" returns include the maximum initial sales charge of 5.75% for Class A shares, the applicable contingent deferred sales charge of 5.00% in the first year, declining to 1.00% in the sixth year and eliminated thereafter for Class B shares and 1.00% for Class C shares for the first year only. The "without sales charge" returns do not include the effect of sales charges. If they had, returns would be lower.
Performance results reflect any fee waivers or reimbursements of portfolio expenses by the Investment Manager and/or any of its affiliates. Absent these fee waivers or expense reimbursement arrangements, performance results would have been lower.
All results shown assume the reinvestment of distributions. Class Z shares are sold at net asset value with no distribution and service (Rule 12b-1) fees. Class R shares are sold at net asset value with a distribution (Rule 12b-1) fee. Class Z and Class R shares have limited eligibility and the investment minimum requirements may vary. Please see the portfolio's prospectus for details. Performance for different share classes will vary based on differences in sales charges and fees associated with each class.
The tables do not reflect the deduction of taxes that a shareholder may pay on portfolio distributions or on the redemption of portfolio shares.
4
Understanding Your Expenses – Columbia Masters International Equity Portfolio
As a portfolio shareholder, you incur two types of costs. There are transaction costs, which generally include sales charges on purchases and may include redemption fees or exchange fees. There are also ongoing costs, which generally include investment advisory fees, distribution and service (Rule 12b-1) fees and other portfolio expenses. The information on this page is intended to help you understand the ongoing costs of investing in the portfolio and to compare these costs with the ongoing costs of investing in other mutual funds.
Analyzing your portfolio's expenses by share class
To illustrate these ongoing costs, we have provided an example and calculated the expenses paid by investors in each share class during the period. The information in the following table is based on an initial investment of $1,000, which is invested at the beginning of the period and held for the entire period. Expense information is calculated two ways and each method provides you with different information. The amount listed in the "Actual" column is calculated using the portfolio's actual operating expenses and total return for the period. The amount listed in the "Hypothetical" column for each share class assumes that the return each year is 5% before expenses and is calculated based on the portfolio's actual operating expenses. You should not use the hypothetical account values and expenses to estimate either your actual account balance at the end of the period or the expenses you paid during this period.
Compare with other funds
Since all mutual funds are required to include the same hypothetical calculations about expenses in shareholder reports, you can use this information to compare the ongoing cost of investing in the portfolio with other funds. To do so, compare the 5% hypothetical example with the 5% hypothetical examples that appear in the shareholder reports of other funds. As you compare hypothetical examples of other funds, it is important to note that hypothetical examples are meant to highlight the ongoing costs of investing in a fund and do not reflect any transaction costs, such as sales charges, redemption fees or exchange fees.
As a shareholder of the underlying funds in which it invests, the portfolio will bear its allocable share of the costs and expenses of these underlying funds. These costs and expenses are not included in the portfolio's annualized expense ratios used to calculate the expense information below.
Estimating your actual expenses
To estimate the expenses that you paid over the period, first you will need your account balance at the end of the period:
g For shareholders who receive their account statements from Columbia Management Investment Services Corp., your account balance is available online at www.columbiamanagement.com or by calling Shareholder Services at 800.345.6611.
g For shareholders who receive their account statements from their financial intermediary, contact your financial intermediary to obtain your account balance.
1. Divide your ending account balance by $1,000. For example, if an account balance was $8,600 at the end of the period, the result would be 8.6.
2. In the section of the table below titled "Expenses paid during the period," locate the amount for your share class. You will find this number in the column labeled "Actual." Multiply this number by the result from step 1. Your answer is an estimate of the expenses you paid on your account during the period.
If the value of your account falls below the minimum initial investment requirement applicable to you, your account may be subject to a $20 annual fee. This fee is not included in the accompanying table. If you are subject to the fee, keep it in mind when you are estimating the ongoing expenses of investing in the portfolio and when comparing the expenses of this portfolio with other funds.
10/01/10 – 03/31/11
| | | Account value at the
beginning of the period ($) | | Account value at the
end of the period ($) | | Expenses paid
during the period ($) | | Portfolio's annualized
expense ratio (%)* | |
| | | Actual | | Hypothetical | | Actual | | Hypothetical | | Actual | | Hypothetical | | Actual | |
| Class A | | | 1,000.00 | | | | 1,000.00 | | | | 1,083.70 | | | | 1,023.68 | | | | 1.30 | | | | 1.26 | | | | 0.25 | | |
| Class B | | | 1,000.00 | | | | 1,000.00 | | | | 1,079.40 | | | | 1,019.95 | | | | 5.18 | | | | 5.04 | | | | 1.00 | | |
| Class C | | | 1,000.00 | | | | 1,000.00 | | | | 1,079.50 | | | | 1,019.95 | | | | 5.18 | | | | 5.04 | | | | 1.00 | | |
| Class R | | | 1,000.00 | | | | 1,000.00 | | | | 1,080.70 | | | | 1,022.44 | | | | 2.59 | | | | 2.52 | | | | 0.50 | | |
| Class Z | | | 1,000.00 | | | | 1,000.00 | | | | 1,084.30 | | | | 1,024.93 | | | | — | | | | — | | | | 0.00 | | |
Expenses paid during the period are equal to the annualized expense ratio for the share class, multiplied by the average account value over the period, then multiplied by the number of days in the portfolio's most recent fiscal half-year and divided by 365.
Had the Investment Manager and/or any of its affiliates not waived fees or reimbursed a portion of expenses, account value at the end of the period would have been reduced.
It is important to note that the expense amounts shown in the table are meant to highlight only ongoing costs of investing in the portfolio and do not reflect any transaction costs, such as sales charges, redemption fees or exchange fees. Therefore, the hypothetical examples provided may not help you determine the relative total costs of owning shares of different funds. If these transaction costs were included, your costs would have been higher.
* Columbia Masters International Equity Portfolio's expense ratios do not include fees and expenses incurred by the underlying funds.
5
Portfolio Managers' Report – Columbia Masters International Equity Portfolio
Performance data quoted represents past performance and current performance may be lower or higher. Past performance is no guarantee of future results. The investment return and principal value will fluctuate so that shares, when redeemed, may be worth more or less than the original cost. Please visit www.columbiamanagement.com for daily and most recent month-end performance updates.
Net asset value per share
as of 03/31/11 ($)
| Class A | | | 8.78 | | |
| Class B | | | 8.78 | | |
| Class C | | | 8.77 | | |
| Class R | | | 8.76 | | |
| Class Z | | | 8.78 | | |
Distributions declared per share
04/01/10 – 03/31/11 ($)
| Class A | | | 0.39 | | |
| Class B | | | 0.29 | | |
| Class C | | | 0.29 | | |
| Class R | | | 0.36 | | |
| Class Z | | | 0.43 | | |
For the 12-month period that ended March 31, 2011, the portfolio's Class A shares returned 12.08% without sales charge. The portfolio outperformed its benchmark, the MSCI EAFE Index (Net), which returned 10.42% over the same period. The average return of the funds in the portfolio's peer group, the Lipper International Multi-Cap Core Funds Classification, was 12.48%. Effective January 11, 2011, the portfolio invests in shares of four Columbia funds: Columbia Acorn International, Columbia Emerging Markets Fund, Columbia Pacific/Asia Fund and Columbia European Equity Fund. The portfolio had previously been invested in the shares of two Columbia funds, generally dividing its assets as follows: Columbia Multi-Advisor International Equity Fund—80% and Columbia Acorn International—20%. This allocation drove the portfolio's results for the majority of the one-year period.
Columbia Acorn International drove strong returns
The portfolio's strong showing compared to its benchmark was largely due to its investment in Columbia Acorn International, which returned 20.08% for the period, driven by top contributors in the energy, materials and telecommunication services sectors. Exposure to Iceland, Norway, Sweden and Chile also helped the portfolio's return. Through its investment in the Columbia Multi-Advisor International Equity Fund, the portfolio generated positive results from telecommunication services and financial stocks and exposure to Japan, Switzerland and Canada.
The Columbia Multi-Advisor International Equity Fund, which made up the majority of the portfolio during most of the period, returned a benchmark-beating 11.08% during the period. However, its return was below the average return of funds in the portfolio's peer group, which generally accounted for the shortfall to that comparative measure. Holdings in information technology, consumer discretionary and consumer staples stocks, as well as exposure to Greece, Ireland, India and Taiwan, hurt returns. Among detractors from the performance of Columbia Acorn International were consumer staples stocks and country exposure to Malaysia and Greece.
New portfolio structure
As noted above, we added to the line-up of funds represented in the portfolio to provide an even broader diversification among international, emerging market and Pacific/Asian regional markets. The additional fund options are intended to improve the portfolio's opportunity to achieve its objective of capital appreciation by investing directly in mutual funds with regional specializations or with differing market capitalization concentrations within similar regions. The portfolio management team remains unchanged.
Looking ahead
Historically low interest rates across most of the developed world and reasonably robust economic data are a favorable backdrop for global stock markets. Despite these generally favorable conditions for stock markets, we are mindful of short-term concerns that give us reason to be cautious going forward. The impact of an earthquake and tsunami in Japan and resulting nuclear plant fallout, escalating unrest in the Middle East and an ongoing sovereign credit crisis that likely will claim Portugal next is yet to be fully absorbed by global economies and stock markets. However, we believe the portfolio is well-positioned to weather this challenging environment with its expanded pool of underlying fund options.
6
Portfolio Managers' Report (continued) – Columbia Masters International Equity Portfolio
Portfolio characteristics and holdings are subject to change periodically and may not be representative of current characteristics and holdings. The outlook for this portfolio may differ from that presented for other Columbia Funds.
Asset allocation cannot eliminate the risk of fluctuating prices and uncertain returns.
The portfolio is a "fund of funds." A fund of funds bears its allocable share of the costs and expenses of the underlying funds in which it invests. Such funds are thus subject to two levels of fees and a potentially higher expense ratio than would be associated with an investment in an investment fund that invests and trades directly in financial instruments under the direction of a single manager. Risks, among others, include stock market fluctuations due to business and economic developments.
Stocks of small- and mid-cap companies may pose special risks, including possible illiquidity and greater price volatility than stocks of larger, more established companies.
Value stocks are stocks of companies that may have experienced adverse business or industry developments or may be subject to special risks that have caused the stocks to be out of favor. If the manager's assessment of a company's prospects is wrong, the price of its stock may not approach the value the manager has placed on it.
International investing involves special risks, including foreign taxation, currency risks, risks associated with possible differences in financial standards and other risks associated with future political and economic developments.
Investing in emerging markets may involve greater risks than investing in more developed countries. In addition, concentration of investments in a single region may result in greater volatility.
7
Investment Portfolio – Columbia Masters International Equity Portfolio
March 31, 2011
| Investment Companies (a) – 100.2% | |
| | | Shares | | Value ($) | |
| Columbia Acorn International, | |
| Class I | | | 131,453 | | | | 5,451,374 | | |
| Columbia Emerging Markets Fund, | |
| Class I | | | 946,956 | | | | 10,871,056 | | |
| Columbia European Equity Fund, | |
| Class I | | | 10,523,236 | | | | 65,033,598 | | |
| Columbia Pacific/Asia Fund, | |
| Class I | | | 3,164,686 | | | | 27,247,949 | | |
Total Investment Companies
(cost of $104,029,646) | | | 108,603,977 | | |
Total Investments – 100.2%
(cost of $104,029,646) (b) | | | 108,603,977 | | |
| Other Assets & Liabilities, Net – (0.2)% | | | (201,054 | ) | |
| Net Assets – 100.0% | | | 108,402,923 | | |
Notes to Investment Portfolio:
(a) Mutual funds registered under the Investment Company Act of 1940, as amended, and advised by Columbia Management Investment Advisers, LLC or its affiliates.
(b) Cost for federal income tax purposes is $106,817,796.
Generally accepted accounting principles (GAAP) require disclosure regarding the inputs and valuation techniques used to measure fair value and any changes in valuation inputs or techniques. In addition, investments shall be disclosed by major category.
The Portfolio categorizes its fair value measurements according to a three-level hierarchy that maximizes the use of observable inputs and minimizes the use of unobservable inputs by prioritizing that the most observable input be used when available. Observable inputs are those that market participants would use in pricing an investment based on market data obtained from sources independent of the reporting entity. Unobservable inputs are those that reflect the Portfolio's assumptions about the information market participants would use in pricing an investment. An investment's level within the fair value hierarchy is based on the lowest level of any input that is deemed significant to the asset or liability's fair value measurement. The input levels are not necessarily an indication of the risk or liquidity associated with investments at that level. For example, certain U.S. government securities are generally high quality and liquid, however, they are reflected as Level 2 because the inputs used to determine fair value may not always be quoted prices in an active market.
Fair value inputs are summarized in the three broad levels listed below:
• Level 1—Valuations based on quoted prices for investments in active markets that the Portfolio has the ability to access at the measurement date (including NAV for open-end mutual funds). Valuation adjustments are not applied to Level 1 investments.
• Level 2—Valuations based on other significant observable inputs (including quoted prices for similar securities, interest rates, prepayment speeds, credit risks, etc.).
• Level 3—Valuations based on significant unobservable inputs (including the Portfolio's own assumptions and judgment in determining the fair value of investments).
Inputs that are used in determining fair value of an investment may include price information, credit data, volatility statistics, and other factors. These inputs can be either observable or unobservable. The availability of observable inputs can vary between investments, and is affected by various factors such as the type of investment, and the volume and level of activity for that investment or similar investments in the marketplace. The inputs will be considered by the Investment Manager, along with any other relevant factors in the calculation of an investment's fair value. The Portfolio uses prices and inputs that are current as of the measurement date, which may include periods of market dislocations. During these periods, the availability of prices and inputs may be reduced for many investments. This condition could cause an investment to be reclassified between the various levels within the hierarchy. Non-U.S. equity securities actively traded in foreign markets may be reflected in Level 2 despite the availability of closing prices, because the Portfolio evaluates and determines whether those closing prices reflect fair value at the close of the New York Stock Exchange (NYSE) or require adjustment, as described in Note 2 to the financial statements—Security Valuation.
Investments falling into the Level 3 category are primarily supported by quoted prices from brokers and dealers participating in the market for those investments. However, these may be classified as Level 3 investments due to lack of market transparency and corroboration to support these quoted prices. Additionally, valuation models may be used as the pricing source for any remaining investments classified as Level 3. These models rely on one or more significant unobservable inputs and/or significant assumptions by the Investment Manager. Inputs used in valuations may include, but are not limited to, financial statement analysis, capital account balances, discount rates and estimated cash flows, and comparable company data.
The following table is a summary of the inputs used to value the Portfolio's investments as of March 31, 2011:
| Description | | Quoted
Prices
(Level 1) | | Other
Significant
Observable
Inputs
(Level 2) | | Significant
Unobservable
Inputs
(Level 3) | | Total | |
Total Investment
Companies | | $ | 108,603,977 | | | $ | — | | | $ | — | | | $ | 108,603,977 | | |
| Total Investments | | $ | 108,603,977 | | | $ | — | | | $ | — | | | $ | 108,603,977 | | |
There were no significant transfers of financial assets between Levels 1 and 2 during the period.
See Accompanying Notes to Financial Statements.
8
Statement of Assets and Liabilities – Columbia Masters International Equity Portfolio
March 31, 2011
| | | | | ($) | |
| Assets | | Affiliated investments, at identified cost | | | 104,029,646 | | |
| | | Affiliated investments, at value | | | 108,603,977 | | |
| | | Receivable for: | | | | | |
| | | Investments sold | | | 45,265 | | |
| | | Portfolio shares sold | | | 14,224 | | |
| | | Expense reimbursement due from Investment Manager | | | 25,683 | | |
| | | Prepaid expenses | | | 206 | | |
| | | Total Assets | | | 108,689,355 | | |
| Liabilities | | Payable for: | | | | | |
| | | Portfolio shares repurchased | | | 131,707 | | |
| | | Pricing and bookkeeping fees | | | 4,014 | | |
| | | Transfer agent fee | | | 34,338 | | |
| | | Trustees' fees | | | 38,602 | | |
| | | Audit fee | | | 17,300 | | |
| | | Legal fee | | | 27,355 | | |
| | | Custody fee | | | 839 | | |
| | | Distribution and service fees | | | 19,083 | | |
| | | Chief compliance officer expenses | | | 207 | | |
| | | Other liabilities | | | 12,987 | | |
| | | Total Liabilities | | | 286,432 | | |
| | | Net Assets | | | 108,402,923 | | |
| Net Assets Consist of | | Paid-in capital | | | 194,608,010 | | |
| | | Accumulated net realized loss | | | (90,779,418 | ) | |
| | | Net unrealized appreciation (depreciation) on investments | | | 4,574,331 | | |
| | | Net Assets | | | 108,402,923 | | |
See Accompanying Notes to Financial Statements.
9
Statement of Assets and Liabilities (continued) – Columbia Masters International Equity Portfolio
March 31, 2011
| Class A | | Net assets | | $ | 41,237,181 | | |
| | | Shares outstanding | | | 4,698,080 | | |
| | | Net asset value per share (a) | | $ | 8.78 | | |
| | | Maximum sales charge | | | 5.75 | % | |
| | | Maximum offering price per share ($8.78/0.9425) (b) | | $ | 9.32 | | |
| Class B | | Net assets | | $ | 3,143,018 | | |
| | | Shares outstanding | | | 358,152 | | |
| | | Net asset value and offering price per share (a) | | $ | 8.78 | | |
| Class C | | Net assets | | $ | 8,990,123 | | |
| | | Shares outstanding | | | 1,025,480 | | |
| | | Net asset value and offering price per share (a) | | $ | 8.77 | | |
| Class R | | Net assets | | $ | 19,566 | | |
| | | Shares outstanding | | | 2,233 | | |
| | | Net asset value, offering and redemption price per share | | $ | 8.76 | | |
| Class Z | | Net assets | | $ | 55,013,035 | | |
| | | Shares outstanding | | | 6,264,160 | | |
| | | Net asset value, offering and redemption price per share | | $ | 8.78 | | |
(a) Redemption price per share is equal to net asset value less any applicable contingent deferred sales charge.
(b) On sales of $50,000 or more the offering price is reduced.
See Accompanying Notes to Financial Statements.
10
Statement of Operations – Columbia Masters International Equity Portfolio
For the Year Ended March 31, 2011
| | | | | ($) | |
| Investment Income | | Dividends from affiliates | | | 2,363,828 | | |
| | | Total Investment Income | | | 2,363,828 | | |
| Expenses | | Distribution fee: | | | | | |
| | | Class B | | | 25,546 | | |
| | | Class C | | | 70,263 | | |
| | | Class R | | | 125 | | |
| | | Service fee: | | | | | |
| | | Class B | | | 8,511 | | |
| | | Class C | | | 23,396 | | |
| | | Distribution and service fees: | | | | | |
| | | Class A | | | 112,843 | | |
| | | Transfer agent fee | | | 172,441 | | |
| | | Pricing and bookkeeping fees | | | 27,115 | | |
| | | Trustees' fees | | | 30,131 | | |
| | | Custody fee | | | 5,386 | | |
| | | Registration fees | | | 63,004 | | |
| | | Audit fee | | | 25,941 | | |
| | | Legal fees | | | 40,116 | | |
| | | Reports to shareholders | | | 91,961 | | |
| | | Chief compliance officer expenses | | | 1,096 | | |
| | | Other expenses | | | 6,753 | | |
| | | Total Expenses | | | 704,628 | | |
| | | Fees waived or expenses reimbursed by Investment Manager | | | (463,944 | ) | |
| | | Expense reductions | | | (1 | ) | |
| | | Net Expenses | | | 240,683 | | |
| | | Net Investment Income | | | 2,123,145 | | |
| Net Realized and Unrealized Gain (Loss) on Investments | | Net realized loss on affiliated investments | | | (32,550,340 | ) | |
| | | Net change in unrealized appreciation (depreciation) on investments | | | 42,289,227 | | |
| | | Net Gain | | | 9,738,887 | | |
| | | Net Increase Resulting from Operations | | | 11,862,032 | | |
See Accompanying Notes to Financial Statements.
11
Statement of Changes in Net Assets – Columbia Masters International Equity Portfolio
| | | | | Year Ended March 31, | |
| Increase (Decrease) in Net Assets | | | | 2011 ($) | | 2010 ($) | |
| Operations | | Net investment income | | | 2,123,145 | | | | 5,124,789 | | |
| | | Net realized loss on investments | | | (32,550,340 | ) | | | (22,127,081 | ) | |
| | | Net change in unrealized appreciation (depreciation)
on investments | | | 42,289,227 | | | | 75,038,404 | | |
| | | Net increase resulting from operations | | | 11,862,032 | | | | 58,036,112 | | |
| Distributions to Shareholders | | From net investment income: | | | | | |
| | | Class A | | | (2,202,252 | ) | | | (1,162,782 | ) | |
| | | Class B | | | (124,341 | ) | | | (29,094 | ) | |
| | | Class C | | | (338,096 | ) | | | (79,794 | ) | |
| | | Class R | | | (1,323 | ) | | | (433 | ) | |
| | | Class Z | | | (3,064,636 | ) | | | (1,875,064 | ) | |
| | | Total distributions to shareholders | | | (5,730,648 | ) | | | (3,147,167 | ) | |
| | | Net Capital Stock Transactions | | | (34,562,344 | ) | | | (33,028,724 | ) | |
| | | Redemption fees | | | — | | | | 938 | | |
| | | Total increase (decrease) in net assets | | | (28,430,960 | ) | | | 21,861,159 | | |
| Net Assets | | Beginning of period | | | 136,833,883 | | | | 114,972,724 | | |
| | | End of period | | | 108,402,923 | | | | 136,833,883 | | |
| | | Undistributed net investment income at end of period | | | — | | | | 3,552,388 | | |
See Accompanying Notes to Financial Statements.
12
Statement of Changes in Net Assets (continued) – Columbia Masters International Equity Portfolio
| | | Capital Stock Activity | |
| | | Year Ended
March 31, 2011 | | Year Ended
March 31, 2010 | |
| | | Shares | | Dollars ($) | | Shares | | Dollars ($) | |
| Class A | |
| Subscriptions | | | 262,902 | | | | 2,132,786 | | | | 860,237 | | | | 6,474,067 | | |
| Distributions reinvested | | | 223,830 | | | | 1,698,913 | | | | 148,393 | | | | 1,091,724 | | |
| Redemptions | | | (2,218,381 | ) | | | (17,966,365 | ) | | | (2,688,107 | ) | | | (20,377,765 | ) | |
| Net decrease | | | (1,731,649 | ) | | | (14,134,666 | ) | | | (1,679,477 | ) | | | (12,811,974 | ) | |
| Class B | |
| Subscriptions | | | 8,062 | | | | 64,000 | | | | 45,790 | | | | 340,223 | | |
| Distributions reinvested | | | 12,356 | | | | 92,087 | | | | 3,423 | | | | 25,770 | | |
| Redemptions | | | (144,060 | ) | | | (1,173,513 | ) | | | (128,083 | ) | | | (968,770 | ) | |
| Net decrease | | | (123,642 | ) | | | (1,017,426 | ) | | | (78,870 | ) | | | (602,777 | ) | |
| Class C | |
| Subscriptions | | | 53,320 | | | | 427,667 | | | | 88,936 | | | | 682,997 | | |
| Distributions reinvested | | | 32,952 | | | | 249,551 | | | | 7,447 | | | | 56,125 | | |
| Redemptions | | | (343,277 | ) | | | (2,768,247 | ) | | | (489,572 | ) | | | (3,645,416 | ) | |
| Net decrease | | | (257,005 | ) | | | (2,091,029 | ) | | | (393,189 | ) | | | (2,906,294 | ) | |
| Class R | |
| Subscriptions | | | 1,589 | | | | 13,173 | | | | 3,559 | | | | 27,333 | | |
| Distributions reinvested | | | 99 | | | | 740 | | | | 58 | | | | 431 | | |
| Redemptions | | | (3,279 | ) | | | (26,273 | ) | | | (4,632 | ) | | | (35,426 | ) | |
| Net decrease | | | (1,591 | ) | | | (12,360 | ) | | | (1,015 | ) | | | (7,662 | ) | |
| Class Z | |
| Subscriptions | | | 616,761 | | | | 5,026,829 | | | | 1,509,342 | | | | 11,298,156 | | |
| Distributions reinvested | | | 22,151 | | | | 167,907 | | | | 14,075 | | | | 104,306 | | |
| Redemptions | | | (2,764,352 | ) | | | (22,501,599 | ) | | | (3,692,821 | ) | | | (28,102,479 | ) | |
| Net decrease | | | (2,125,440 | ) | | | (17,306,863 | ) | | | (2,169,404 | ) | | | (16,700,017 | ) | |
See Accompanying Notes to Financial Statements.
13
Financial Highlights – Columbia Masters International Equity Portfolio
Selected data for a share outstanding throughout each period is as follows:
| | | Year Ended March 31, | |
| Class A Shares | | 2011 | | 2010 | | 2009 | | 2008 | | 2007 | |
| Net Asset Value, Beginning of Period | | $ | 8.24 | | | $ | 5.49 | | | $ | 11.14 | | | $ | 11.69 | | | $ | 10.26 | | |
| Income from Investment Operations: | |
| Net investment income (a) | | | 0.15 | | | | 0.27 | | | | 0.05 | | | | 0.17 | | | | 0.15 | | |
Net realized and unrealized gain (loss) on investments
and capital gains distributions received | | | 0.78 | | | | 2.64 | | | | (5.14 | ) | | | 0.11 | | | | 1.63 | | |
| Total from investment operations | | | 0.93 | | | | 2.91 | | | | (5.09 | ) | | | 0.28 | | | | 1.78 | | |
| Less Distributions to Shareholders: | |
| From net investment income | | | (0.39 | ) | | | (0.16 | ) | | | — | | | | (0.13 | ) | | | (0.07 | ) | |
| From net realized gains | | | — | | | | — | | | | (0.56 | ) | | | (0.70 | ) | | | (0.28 | ) | |
| Total distributions to shareholders | | | (0.39 | ) | | | (0.16 | ) | | | (0.56 | ) | | | (0.83 | ) | | | (0.35 | ) | |
| Redemption Fees: | |
| Redemption fees added to paid-in-capital | | | — | | | | — | (a)(b) | | | — | (a)(b) | | | — | (a)(b) | | | — | (a)(b) | |
| Net Asset Value, End of Period | | $ | 8.78 | | | $ | 8.24 | | | $ | 5.49 | | | $ | 11.14 | | | $ | 11.69 | | |
| Total return (c)(d) | | | 12.08 | % | | | 53.33 | % | | | (48.03 | )% | | | 1.76 | % | | | 17.39 | % | |
| Ratios to Average Net Assets/Supplemental Data: | |
| Net expenses (e)(f) | | | 0.25 | % | | | 0.25 | % | | | 0.25 | % | | | 0.25 | % | | | 0.25 | % | |
| Waiver/Reimbursement | | | 0.40 | % | | | 0.28 | % | | | 0.26 | % | | | 0.22 | % | | | 0.59 | % | |
| Net investment income (e) | | | 1.80 | % | | | 3.50 | % | | | 0.56 | % | | | 1.39 | % | | | 1.31 | % | |
| Portfolio turnover rate | | | 95 | % | | | 2 | % | | | 20 | % | | | 3 | % | | | 1 | % | |
| Net assets, end of period (000s) | | $ | 41,237 | | | $ | 53,013 | | | $ | 44,548 | | | $ | 119,670 | | | $ | 75,289 | | |
(a) Per share data was calculated using the average shares outstanding during the period.
(b) Rounds to less than $0.01 per share.
(c) Total return at net asset value assuming all distributions reinvested and no initial sales charge or contingent deferred sales charge.
(d) Had the Investment Manager and/or any of its affiliates not waived fees or reimbursed a portion of expenses, total return would have been reduced.
(e) The benefits derived from expense reductions had an impact of less than 0.01%.
(f) Does not include expenses of the investment companies in which the Portfolio invests, if these expenses were included, the expense ratios would have been higher.
See Accompanying Notes to Financial Statements.
14
Financial Highlights – Columbia Masters International Equity Portfolio
Selected data for a share outstanding throughout each period is as follows:
| | | Year Ended March 31, | |
| Class B Shares | | 2011 | | 2010 | | 2009 | | 2008 | | 2007 | |
| Net Asset Value, Beginning of Period | | $ | 8.20 | | | $ | 5.43 | | | $ | 11.09 | | | $ | 11.66 | | | $ | 10.26 | | |
| Income from Investment Operations: | |
| Net investment income (loss) (a) | | | 0.08 | | | | 0.21 | | | | (0.01 | ) | | | 0.07 | | | | 0.10 | | |
Net realized and unrealized gain (loss) on investments
and capital gains distributions received | | | 0.79 | | | | 2.62 | | | | (5.09 | ) | | | 0.12 | | | | 1.59 | | |
| Total from investment operations | | | 0.87 | | | | 2.83 | | | | (5.10 | ) | | | 0.19 | | | | 1.69 | | |
| Less Distributions to Shareholders: | |
| From net investment income | | | (0.29 | ) | | | (0.06 | ) | | | — | | | | (0.06 | ) | | | (0.01 | ) | |
| From net realized gains | | | — | | | | — | | | | (0.56 | ) | | | (0.70 | ) | | | (0.28 | ) | |
| Total distributions to shareholders | | | (0.29 | ) | | | (0.06 | ) | | | (0.56 | ) | | | (0.76 | ) | | | (0.29 | ) | |
| Redemption Fees: | |
| Redemption fees added to paid-in-capital | | | — | | | | — | (a)(b) | | | — | (a)(b) | | | — | (a)(b) | | | — | (a)(b) | |
| Net Asset Value, End of Period | | $ | 8.78 | | | $ | 8.20 | | | $ | 5.43 | | | $ | 11.09 | | | $ | 11.66 | | |
| Total return (c)(d) | | | 11.18 | % | | | 52.13 | % | | | (48.35 | )% | | | 1.03 | % | | | 16.50 | % | |
| Ratios to Average Net Assets/Supplemental Data: | |
| Net expenses (e)(f) | | | 1.00 | % | | | 1.00 | % | | | 1.00 | % | | | 1.00 | % | | | 1.00 | % | |
| Waiver/Reimbursement | | | 0.40 | % | | | 0.28 | % | | | 0.26 | % | | | 0.22 | % | | | 0.59 | % | |
| Net investment income (loss) (e) | | | 1.05 | % | | | 2.73 | % | | | (0.18 | )% | | | 0.55 | % | | | 0.93 | % | |
| Portfolio turnover rate | | | 95 | % | | | 2 | % | | | 20 | % | | | 3 | % | | | 1 | % | |
| Net assets, end of period (000s) | | $ | 3,143 | | | $ | 3,950 | | | $ | 3,043 | | | $ | 7,490 | | | $ | 5,960 | | |
(a) Per share data was calculated using the average shares outstanding during the period.
(b) Rounds to less than $0.01 per share.
(c) Total return at net asset value assuming all distributions reinvested and no contingent deferred sales charge.
(d) Had the Investment Manager and/or any of its affiliates not waived fees or reimbursed a portion of expenses, total return would have been reduced.
(e) The benefits derived from expense reductions had an impact of less than 0.01%.
(f) Does not include expenses of the investment companies in which the Portfolio invests, if these expenses were included, the expense ratios would have been higher.
See Accompanying Notes to Financial Statements.
15
Financial Highlights – Columbia Masters International Equity Portfolio
Selected data for a share outstanding throughout each period is as follows:
| | | Year Ended March 31, | |
| Class C Shares | | 2011 | | 2010 | | 2009 | | 2008 | | 2007 | |
| Net Asset Value, Beginning of Period | | $ | 8.19 | | | $ | 5.42 | | | $ | 11.08 | | | $ | 11.66 | | | $ | 10.25 | | |
| Income from Investment Operations: | |
| Net investment income (loss) (a) | | | 0.09 | | | | 0.21 | | | | (0.02 | ) | | | 0.07 | | | | 0.10 | | |
Net realized and unrealized gain (loss) on investments
and capital gains distributions received | | | 0.78 | | | | 2.62 | | | | (5.08 | ) | | | 0.11 | | | | 1.60 | | |
| Total from investment operations | | | 0.87 | | | | 2.83 | | | | (5.10 | ) | | | 0.18 | | | | 1.70 | | |
| Less Distributions to Shareholders: | |
| From net investment income | | | (0.29 | ) | | | (0.06 | ) | | | — | | | | (0.06 | ) | | | (0.01 | ) | |
| From net realized gains | | | — | | | | — | | | | (0.56 | ) | | | (0.70 | ) | | | (0.28 | ) | |
| Total distributions to shareholders | | | (0.29 | ) | | | (0.06 | ) | | | (0.56 | ) | | | (0.76 | ) | | | (0.29 | ) | |
| Redemption Fees: | |
| Redemption fees added to paid-in-capital | | | — | | | | — | (a)(b) | | | — | (a)(b) | | | — | (a)(b) | | | — | (a)(b) | |
| Net Asset Value, End of Period | | $ | 8.77 | | | $ | 8.19 | | | $ | 5.42 | | | $ | 11.08 | | | $ | 11.66 | | |
| Total return (c)(d) | | | 11.19 | % | | | 52.22 | % | | | (48.39 | )% | | | 0.94 | % | | | 16.61 | % | |
| Ratios to Average Net Assets/Supplemental Data: | |
| Net expenses (e)(f) | | | 1.00 | % | | | 1.00 | % | | | 1.00 | % | | | 1.00 | % | | | 1.00 | % | |
| Waiver/Reimbursement | | | 0.40 | % | | | 0.28 | % | | | 0.26 | % | | | 0.22 | % | | | 0.59 | % | |
| Net investment income (loss) (e) | | | 1.05 | % | | | 2.77 | % | | | (0.19 | )% | | | 0.60 | % | | | 0.88 | % | |
| Portfolio turnover rate | | | 95 | % | | | 2 | % | | | 20 | % | | | 3 | % | | | 1 | % | |
| Net assets, end of period (000s) | | $ | 8,990 | | | $ | 10,506 | | | $ | 9,087 | | | $ | 27,656 | | | $ | 21,210 | | |
(a) Per share data was calculated using the average shares outstanding during the period.
(b) Rounds to less than $0.01 per share.
(c) Total return at net asset value assuming all distributions reinvested and no contingent deferred sales charge.
(d) Had the Investment Manager and/or any of its affiliates not waived fees or reimbursed a portion of expenses, total return would have been reduced.
(e) The benefits derived from expense reductions had an impact of less than 0.01%.
(f) Does not include expenses of the investment companies in which the Portfolio invests, if these expenses were included, the expense ratios would have been higher.
See Accompanying Notes to Financial Statements.
16
Financial Highlights – Columbia Masters International Equity Portfolio
Selected data for a share outstanding throughout each period is as follows:
| | | Year Ended March 31, | |
| Class R Shares | | 2011 | | 2010 | | 2009 | | 2008 | | 2007 | |
| Net Asset Value, Beginning of Period | | $ | 8.22 | | | $ | 5.47 | | | $ | 11.12 | | | $ | 11.68 | | | $ | 10.26 | | |
| Income from Investment Operations: | |
| Net investment income (a) | | | 0.14 | | | | 0.28 | | | | 0.02 | | | | 0.15 | | | | 0.16 | | |
Net realized and unrealized gain (loss) on investments
and capital gains distributions received | | | 0.76 | | | | 2.59 | | | | (5.11 | ) | | | 0.09 | | | | 1.59 | | |
| Total from investment operations | | | 0.90 | | | | 2.87 | | | | (5.09 | ) | | | 0.24 | | | | 1.75 | | |
| Less Distributions to Shareholders: | |
| From net investment income | | | (0.36 | ) | | | (0.12 | ) | | | — | | | | (0.10 | ) | | | (0.05 | ) | |
| From net realized gains | | | — | | | | — | | | | (0.56 | ) | | | (0.70 | ) | | | (0.28 | ) | |
| Total distributions to shareholders | | | (0.36 | ) | | | (0.12 | ) | | | (0.56 | ) | | | (0.80 | ) | | | (0.33 | ) | |
| Redemption Fees: | |
| Redemption fees added to paid-in-capital | | | — | | | | — | (a)(b) | | | — | (a)(b) | | | — | (a)(b) | | | — | (a)(b) | |
| Net Asset Value, End of Period | | $ | 8.76 | | | $ | 8.22 | | | $ | 5.47 | | | $ | 11.12 | | | $ | 11.68 | | |
| Total return (c)(d) | | | 11.62 | % | | | 52.81 | % | | | (48.12 | )% | | | 1.48 | % | | | 17.09 | % | |
| Ratios to Average Net Assets/Supplemental Data: | |
| Net expenses (e)(f) | | | 0.50 | % | | | 0.50 | % | | | 0.50 | % | | | 0.50 | % | | | 0.50 | % | |
| Waiver/Reimbursement | | | 0.40 | % | | | 0.28 | % | | | 0.26 | % | | | 0.22 | % | | | 0.59 | % | |
| Net investment income (e) | | | 1.75 | % | | | 3.78 | % | | | 0.26 | % | | | 1.22 | % | | | 1.46 | % | |
| Portfolio turnover rate | | | 95 | % | | | 2 | % | | | 20 | % | | | 3 | % | | | 1 | % | |
| Net assets, end of period (000s) | | $ | 20 | | | $ | 31 | | | $ | 26 | | | $ | 44 | | | $ | 12 | | |
(a) Per share data was calculated using the average shares outstanding during the period.
(b) Rounds to less than $0.01 per share.
(c) Total return at net asset value assuming all distributions reinvested.
(d) Had the Investment Manager and/or any of its affiliates not waived fees or reimbursed a portion of expenses, total return would have been reduced.
(e) The benefits derived from expense reductions had an impact of less than 0.01%.
(f) Does not include expenses of the investment companies in which the Portfolio invests, if these expenses were included, the expense ratios would have been higher.
See Accompanying Notes to Financial Statements.
17
Financial Highlights – Columbia Masters International Equity Portfolio
Selected data for a share outstanding throughout each period is as follows:
| | | Year Ended March 31, | |
| Class Z Shares | | 2011 | | 2010 | | 2009 | | 2008 | | 2007 | |
| Net Asset Value, Beginning of Period | | $ | 8.26 | | | $ | 5.52 | | | $ | 11.16 | | | $ | 11.70 | | | $ | 10.26 | | |
| Income from Investment Operations: | |
| Net investment income (a) | | | 0.17 | | | | 0.29 | | | | 0.07 | | | | 0.23 | | | | 0.12 | | |
Net realized and unrealized gain (loss) on investments
and capital gains distributions received | | | 0.78 | | | | 2.64 | | | | (5.15 | ) | | | 0.08 | | | | 1.69 | | |
| Total from investment operations | | | 0.95 | | | | 2.93 | | | | (5.08 | ) | | | 0.31 | | | | 1.81 | | |
| Less Distributions to Shareholders: | |
| From net investment income | | | (0.43 | ) | | | (0.19 | ) | | | — | | | | (0.15 | ) | | | (0.09 | ) | |
| From net realized gains | | | — | | | | — | | | | (0.56 | ) | | | (0.70 | ) | | | (0.28 | ) | |
| Total distributions to shareholders | | | (0.43 | ) | | | (0.19 | ) | | | (0.56 | ) | | | (0.85 | ) | | | (0.37 | ) | |
| Redemption Fees: | |
| Redemption fees added to paid-in-capital | | | — | | | | — | (a)(b) | | | — | (a)(b) | | | — | (a)(b) | | | — | (a)(b) | |
| Net Asset Value, End of Period | | $ | 8.78 | | | $ | 8.26 | | | $ | 5.52 | | | $ | 11.16 | | | $ | 11.70 | | |
| Total return (c)(d) | | | 12.28 | % | | | 53.58 | % | | | (47.84 | )% | | | 2.03 | % | | | 17.69 | % | |
| Ratios to Average Net Assets/Supplemental Data: | |
| Net expenses (e)(f) | | | — | | | | — | | | | — | | | | — | | | | — | | |
| Waiver/Reimbursement | | | 0.40 | % | | | 0.28 | % | | | 0.26 | % | | | 0.22 | % | | | 0.59 | % | |
| Net investment income (e) | | | 2.04 | % | | | 3.77 | % | | | 0.83 | % | | | 1.89 | % | | | 0.93 | % | |
| Portfolio turnover rate | | | 95 | % | | | 2 | % | | | 20 | % | | | 3 | % | | | 1 | % | |
| Net assets, end of period (000s) | | $ | 55,013 | | | $ | 69,334 | | | $ | 58,268 | | | $ | 89,568 | | | $ | 31,029 | | |
(a) Per share data was calculated using the average shares outstanding during the period.
(b) Rounds to less than $0.01 per share.
(c) Total return at net asset value assuming all distributions reinvested.
(d) Had the Investment Manager and/or any of its affiliates not waived fees or reimbursed a portion of expenses, total return would have been reduced.
(e) The benefits derived from expense reductions had an impact of less than 0.01%.
(f) Does not include expenses of the investment companies in which the Portfolio invests, if these expenses were included, the expense ratios would have been higher.
See Accompanying Notes to Financial Statements.
18
Notes to Financial Statements – Columbia Masters International Equity Portfolio
March 31, 2011
Note 1. Organization
Columbia Masters International Equity Portfolio (the Portfolio), a series of Columbia Funds Series Trust (the Trust), is a diversified portfolio. The Trust is registered under the Investment Company Act of 1940, as amended (the 1940 Act), as an open-end management investment company organized as a Delaware statutory trust.
After the close of business on April 30, 2010, Ameriprise Financial, Inc. (Ameriprise Financial) acquired a portion of the asset management business of Columbia Management Group, LLC (the Transaction), including the business of managing the Portfolio. In connection with the closing of the Transaction (the Closing), RiverSource Investments, LLC, a wholly owned subsidiary of Ameriprise Financial, became the investment manager of the Portfolio and changed its name to Columbia Management Investment Advisers, LLC (the Investment Manager).
Investment Objective
The Portfolio seeks capital appreciation. The Portfolio generally invests in shares of Columbia Emerging Markets Fund, Columbia Pacific/Asia Fund, Columbia European Equity Fund and Columbia Acorn International (the Underlying Funds). The Underlying Funds are advised by the Investment Manager, or its affiliates. The financial statements of the Underlying Funds in which the Portfolio invests should be read in conjunction with the Portfolio's financial statements and are available at www.columbiamanagement.com.
Portfolio Shares
The Trust has unlimited authorized shares of beneficial interest. The Portfolio offers Class A, Class B, Class C, Class R and Class Z shares. All share classes have identical voting, dividend and liquidation rights. Each share class has its own expense structure and sales charges, as applicable.
Class A shares are subject to a maximum front-end sales charge of 5.75% based on the initial investment amount. Class A shares purchased without an initial sales charge in accounts aggregating $1 million to $50 million at the time of purchase are subject to a 1.00% contingent deferred sales charge (CDSC) if the shares are sold within 18 months of purchase, charged as follows: 1.00% CDSC if redeemed within 12 months of purchase, and 0.50% CDSC if redeemed more than 12, but less than 18 months after purchase.
The Portfolio no longer accepts investments by new or existing investors in the Portfolio's Class B shares, except in connection with the reinvestment of any dividend and/or capital gain distributions in Class B shares of the Portfolio and exchanges by existing Class B shareholders of other funds within the Columbia Family of Funds. Class B shares are subject to a maximum CDSC of 5.00% based upon the holding period after purchase. Class B shares will generally convert to Class A shares eight years after purchase.
Class C shares are subject to a 1.00% CDSC on shares redeemed within one year of purchase.
Class R shares are not subject to sales charges and are available only to qualifying institutional investors.
Class Z shares are not subject to sales charges and are available only to certain investors, as described in the Portfolio's prospectus.
Note 2. Summary of Significant Accounting Policies
The preparation of financial statements in accordance with U.S. generally accepted accounting principles (GAAP) requires management to make certain estimates and assumptions that affect the reported amounts of assets and liabilities, the disclosure of contingent assets and liabilities at the date of the financial statements and the reported amounts of revenue and expenses during the reporting period. Actual results could differ from those estimates.
The following is a summary of significant accounting policies consistently followed by the Portfolio in the preparation of its financial statements.
Security Valuation
Investments in the Underlying Funds are valued at the net asset value of the shares of each respective Underlying Fund determined as of the close of the New York Stock Exchange on the valuation date.
Security Transactions
Security transactions are accounted for on the trade date. Cost is determined and gains (losses) are based upon the specific identification method for both financial statement and federal income tax purposes.
Income Recognition
Income and capital gain distributions from the Underlying Funds, if any, are recorded on the ex-dividend date.
Expenses
General expenses of the Trust are allocated to the Portfolio and other series of the Trust based upon relative net assets or other expense allocation methodologies determined by the nature of the expense.
19
Columbia Masters International Equity Portfolio, March 31, 2011
Expenses directly attributable to a specific class of shares are charged to that share class. Expenses directly attributable to the Portfolio are charged to the Portfolio.
Determination of Class Net Asset Value
All income, expenses (other than class-specific expenses which are charged directly to a share class, as shown in the Statement of Operations) and realized and unrealized gains (losses) are allocated to each class of the Portfolio on a daily basis, based on the relative net assets of each class, for purposes of determining the net asset value of each class.
Federal Income Tax Status
The Portfolio intends to qualify each year as a regulated investment company under Subchapter M of the Internal Revenue Code, as amended, and will distribute substantially all of its taxable income, if any, for its tax year, and as such will not be subject to federal income taxes. In addition, the Portfolio intends to distribute in each calendar year substantially all of its net investment income, capital gains and certain other amounts, if any, such that the Portfolio should not be subject to federal excise tax. Therefore, no federal income or excise tax provision is recorded.
Distributions to Shareholders
Distributions from net investment income, if any, are declared and paid semi-annually. Net realized capital gains, if any, are distributed at least annually. Income distributions and capital gain distributions are determined in accordance with federal income tax regulations which differ from GAAP.
Indemnifications
Under the Trust's organizational documents and, in some cases, by contract, its officers and directors are indemnified against certain liabilities arising out of the performance of their duties to the Portfolio. In addition, certain of the Portfolio's contracts with its service providers contain general indemnification clauses. The Portfolio's maximum exposure under these arrangements is unknown since the amount of any future claims that may be made against the Portfolio cannot be determined and the Portfolio has no historical basis for predicting the likelihood of any such claims.
Note 3. Fees and Compensation Paid to Affiliates
Investment Advisory Fee
Under an Investment Management Services Agreement (IMSA), the Investment Manager determines which securities will be purchased, held or sold. The Portfolio does not pay a fee to the Investment Manager for its investment management services.
Prior to the Closing, Columbia Management Advisors, LLC (Columbia), an indirect, wholly owned subsidiary of Bank of America Corporation (BOA), provided investment management services to the Portfolio under the same fee structure.
Administration Fee
Effective upon the Closing, the Investment Manager provides administration and accounting services to the Portfolio under an Administrative Services Agreement, including services previously performed under the Pricing and Bookkeeping Oversight and Services Agreement (the Services Agreement) as discussed in the Pricing and Bookkeeping Fees note below. Effective January 11, 2011, the Portfolio pays an annual administration fee equal to 0.02% of the Portfolio's average daily net assets, less the fees payable by the Portfolio as described under the Pricing and Bookkeeping Fees note below. In the event the administration fees paid to the Investment Manager is not sufficient to cover the bookkeeping fees, the Investment Manager pays the additional bookkeeping fees on behalf of the Portfolio.
Prior to January 11, 2011, the Investment Manager did not receive any compensation from the Portfolio for its administration services.
Prior to the Closing, Columbia provided administrative services to the Portfolio. Columbia did not receive any compensation from the Portfolio for its administrative services.
Pricing and Bookkeeping Fees
Prior to the Closing, the Portfolio entered into a Financial Reporting Services Agreement (the Financial Reporting Services Agreement) with State Street Bank and Trust Company (State Street) and Columbia pursuant to which State Street provides financial reporting services to the Portfolio. The Portfolio also entered into an Accounting Services Agreement (collectively with the Financial Reporting Services Agreement, the State Street Agreements) with State Street and Columbia pursuant to which State Street provides accounting services to the Portfolio. Upon the Closing, Columbia assigned and delegated its rights and obligations under the State Street
20
Columbia Masters International Equity Portfolio, March 31, 2011
Agreements to the Investment Manager. Under the State Street Agreements, the Portfolio pays State Street an annual fee of $26,000 paid monthly. The Portfolio also reimburses State Street for certain out-of-pocket expenses and charges.
Also prior to the Closing, the Portfolio entered into the Services Agreement with Columbia. Under the Services Agreement, Columbia provided services related to Portfolio expenses and the requirements of the Sarbanes-Oxley Act of 2002, and provided oversight of the accounting and financial reporting services provided by State Street. Under the Services Agreement, the Portfolio reimbursed Columbia for out-of-pocket expenses and charges, including fees payable to third parties, such as for pricing the Portfolio's portfolio securities, incurred by Columbia in the performance of services under the Services Agreement. The Services Agreement was terminated upon the Closing. These services are now provided under the Administrative Services Agreement discussed above.
Transfer Agent Fee
In connection with the Closing, RiverSource Service Corporation, a wholly owned subsidiary of Ameriprise Financial, provides transfer agency services to the Portfolio under a Transfer Agency Agreement and changed its name to Columbia Management Investment Services Corp. (the Transfer Agent). The Transfer Agent has contracted with Boston Financial Data Services (BFDS) to serve as sub-transfer agent.
The Transfer Agent receives monthly account-based service fees based on the number of open accounts and is reimbursed by the Portfolio for the fees and expenses the Transfer Agent pays to financial intermediaries that maintain omnibus accounts with the Portfolio that is a percentage of the average aggregate value of the Portfolio's shares maintained in each such omnibus account (other than omnibus accounts for which American Enterprise Investment Services Inc. is the broker of record or accounts where the beneficial shareholder is a customer of Ameriprise Financial Services, Inc., which are paid a per account fee). The Transfer Agent pays the fees of BFDS for services as sub-transfer agent and, is not entitled to reimbursement for such fees from the Portfolio (with the exception of out-of pocket fees). The Transfer Agent also receives compensation from fees for various shareholder services and reimbursements for certain out-of -pocket expenses.
Prior to the Closing, Columbia Management Services, Inc., an affiliate of Columbia and an indirect, wholly owned subsidiary of BOA, provided transfer agency services to the Portfolio and contracted with BFDS to serve as sub-transfer agent, under the same fee structure.
For the year ended March 31, 2011, the Portfolio's effective transfer agent fee rate for was 0.15% of the Portfolio's average daily net assets.
An annual minimum account balance fee of $20 may apply to certain accounts with a value below the Portfolio's initial minimum investment requirements to reduce the impact of small accounts on transfer agent fees. These minimum account balance fees are recorded as part of expense reductions on the Statement of Operations. For the year ended March 31, 2011, no minimum account balance fees were charged by the Portfolio.
Underwriting Discounts, Service and Distribution Fees
In connection with the Closing, RiverSource Fund Distributors, Inc., an indirect wholly owned subsidiary of Ameriprise Financial, provides distribution and shareholder services to the Portfolio and changed its name to Columbia Management Investment Distributors, Inc. (the Distributor). Pursuant to Rule 12b-1 under the 1940 Act, the Board of Trustees has approved, and the Portfolio has adopted, distribution and shareholder service plans (the Plans) which set the distribution and service fees for the Portfolio. These fees are calculated daily and are intended to compensate the Distributor and/or eligible selling and/or servicing agents for selling shares of the Portfolio and providing services to investors.
The Plans require the payment of a combined distribution and shareholder servicing fee for the Class A shares. The Plans also require the payment of a monthly distribution fee for the Class B, Class C and Class R shares of the Portfolio and a monthly shareholder servicing fee for the Class B and Class C shares of the Portfolio. A substantial portion of the expenses incurred pursuant to these plans may be paid to affiliates of the Distributor. The annual
21
Columbia Masters International Equity Portfolio, March 31, 2011
rates in effect and plan limits, as a percentage of average daily net assets are as follows:
| | | Current
Fee
Rate | | Plan
Limit | |
Class A Combined Distribution and
Shareholder Servicing Plan | | | 0.25 | % | | | 0.25 | % | |
Class B and Class C Shareholder
Servicing Plans | | | 0.25 | % | | | 0.25 | % | |
Class B and Class C
Distribution Plans | | | 0.75 | % | | | 0.75 | % | |
| Class R Distribution Plan | | | 0.50 | % | | | 0.50 | % | |
Prior to the Closing, Columbia Management Distributors, Inc., an affiliate of Columbia and an indirect, wholly owned subsidiary of BOA, was the principal underwriter of the Portfolio's shares. There were no changes to the underwriting discount structure of the Portfolio or the service or distribution fee rates paid by the Portfolio as a result of the Transaction.
Sales Charges
Sales charges, including front-end and CDSC's, received by the Distributor for distributing Portfolio shares were $1,571 for Class A, $7,811 for Class B and $287 for Class C shares for the year ended March 31, 2011.
Fee Waivers and Expense Reimbursements
Effective January 11, 2011, the Investment Manager and certain of its affiliates have contractually agreed to waive fees or reimburse expenses, through July 31, 2012, so that the Portfolio's ordinary operating expenses (excluding certain expenses described below), after giving effect to any balance credits or overdraft charges from the Portfolio's custodian, do not exceed the annual rates of 0.25%, 1.00%, 1.00%, 0.50% and 0.00% of the Portfolio's average daily net assets attributable to Class A, Class B, Class C, Class R and Class Z shares, respectively. The following expenses are excluded from the Portfolio's ordinary operating expenses when calculating the cap, and therefore will be paid by the Portfolio: taxes (including foreign transaction taxes), expenses associated with investment in other pooled investment vehicles (including exchange traded funds and other affiliated and unaffiliated mutual funds), transaction costs and brokerage commissions, costs related to any securities lending program, dividend expenses associated with securities sold short, inverse floater program fees and expenses, transaction charges and interest on borrowed money, interest, extraordinary expenses and any other expenses the exclusion of which is specifically approved by the Portfolio's Board. This agreement may be modified or amended only with approval from all parties.
For the period August 1, 2010 through January 10, 2011, the Investment Manager voluntarily agreed to bear a portion of the Portfolio's expenses so that the Portfolio's ordinary operating expenses (excluding any distribution and service fees, brokerage commissions, interest, taxes and extraordinary expenses, but including custodian charges relating to overdrafts, if any), after giving effect to any balance credits from the Portfolio's custodian, do not exceed 0.00% of the Portfolio's average net assets. For the period May 1, 2010 through July 31, 2010, the Investment Manager contractually agreed to bear a portion of the Portfolio's expenses at the same rate. Prior to May 1, 2010, Columbia contractually agreed to reimburse a portion of the Portfolio's expenses at the same rate.
Fees Paid to Officers and Trustees
In connection with the Closing, all officers of the Portfolio are employees of the Investment Manager or its affiliates and, with the exception of the Portfolio's Chief Compliance Officer, receive no compensation from the Portfolio. The Board of Trustees has appointed a Chief Compliance Officer to the Portfolio in accordance with federal securities regulations. The Portfolio, along with other affiliated funds, pays its pro-rata share of the expenses associated with the Chief Compliance Officer. The Portfolio's expenses for the Chief Compliance Officer will not exceed $15,000 per year. Prior to the Closing, all officers of the Portfolio were employees of Columbia or its affiliates and the Portfolio paid its pro-rata share of the expenses for the Chief Compliance Officer under the same fee structure.
Trustees are compensated for their services to the Portfolio, as set forth on the Statement of Operations. The Trust's eligible Trustees may participate in a non-qualified deferred compensation plan which may be terminated at any time. Any payments to plan participants are paid solely out of the Portfolio's assets. Income earned on the plan participant's deferral account is based on the rate of return of the eligible mutual funds selected by the participant or, if no funds are selected, on the rate of return of Columbia Money Market Fund (formerly known as RiverSource Cash Management Fund). Prior to the Closing, if no funds were selected, income earned on the plan participant's deferral account was based on the rate of return of BofA Treasury Reserves. Trustees' fees deferred during the current period as well as any gains or losses on the trustees' deferred compensation balances as a result of market fluctuations are included in "Trustees' fees" on the Statement of Operations.
22
Columbia Masters International Equity Portfolio, March 31, 2011
Liabilities under the deferred compensation plan are included in "Trustees' fees" on the Statement of Assets and Liabilities.
Note 4. Custody Credits
The Portfolio has an agreement with its custodian bank under which custody fees may be reduced by balance credits. These credits are recorded as part of expense reductions on the Statement of Operations. The Portfolio could have invested a portion of the assets utilized in connection with the expense offset arrangement in an income-producing asset if it had not entered into such an agreement. For the year ended March 31, 2011, these custody credits reduced total expenses by $1 for the Portfolio.
Note 5. Portfolio Information
The cost of purchases and proceeds from sales of securities, excluding short-term obligations, aggregated $108,941,412 and $149,380,329, respectively, for the year ended March 31, 2011.
Note 6. Shareholder Concentration
As of March 31, 2011, one shareholder account owned 45.8% of the outstanding shares of the Portfolio. Purchase and redemption activity of this account may have a significant effect on the operations of the Portfolio.
Note 7. Line of Credit
Prior to March 28, 2011, the Portfolio and other affiliated funds participated in a $280,000,000 committed, unsecured revolving line of credit provided by State Street. Effective March 28, 2011, the commitment was reduced to $225,000,000. The maximum amount that may be borrowed by any fund is limited to the lesser of $200,000,000 and the Portfolio's borrowing limit set forth in the Portfolio's registration statement. Borrowings are available for short-term liquidity or temporary or emergency purposes.
Effective October 14, 2010, interest is charged to each participating fund based on the fund's borrowings at a rate per annum equal to the greater of the Federal Funds Rate plus 1.25% or the overnight LIBOR Rate plus 1.25%. In addition, a commitment fee of 0.125% per annum is accrued and apportioned among the participating funds pro rata based on their relative net assets.
Prior to October 14, 2010, interest was charged to each participating fund at the same rates. In addition, a commitment fee of 0.15% per annum was accrued and apportioned among the participating funds pro rata based on their relative net assets.
For the year ended March 31, 2011, the Portfolio did not borrow under these arrangements.
Note 8. Federal Tax Information
The timing and character of income and capital gain distributions are determined in accordance with income tax regulations, which may differ from GAAP. Reclassifications are made to the Portfolio's capital accounts for permanent tax differences to reflect income and gains available for distribution (or available capital loss carryforwards) under income tax regulations.
For the year ended March 31, 2011, permanent book and tax basis differences resulting primarily from differing treatments for return of capital distribution were identified and reclassified among the components of the Portfolio's net assets as follows:
Overdistributed
Net Investment
Income | | Accumulated
Net Realized
Loss | | Paid-In Capital | |
| $ | 55,115 | | | $ | (1 | ) | | $ | (55,114 | ) | |
Net investment income and net realized gains (losses), as disclosed on the Statement of Operations, and net assets were not affected by this reclassification.
The tax character of distributions paid during the years ended March 31, 2011 and March 31, 2010 was as follows:
| | | March 31, | |
| Distributions paid from: | | 2011 | | 2010 | |
| Ordinary Income* | | $ | 5,730,648 | | | $ | 3,147,167 | | |
* For tax purposes short-term capital gain distributions, if any, are considered ordinary income distributions.
As of March 31, 2011, the components of distributable earnings on a tax basis were as follows:
Undistributed
Ordinary
Income | | Undistributed
Long-Term
Capital Gains | | Net Unrealized
Appreciation* | |
| $ | — | | | $ | — | | | $ | 1,786,181 | | |
* The differences between book-basis and tax-basis net unrealized appreciation are primarily due to deferral of losses from wash sales.
23
Columbia Masters International Equity Portfolio, March 31, 2011
Unrealized appreciation and depreciation at March 31, 2011, based on cost of investments for federal income tax purposes were:
| Unrealized appreciation | | $ | 2,151,876 | | |
| Unrealized depreciation | | | (365,695 | ) | |
| Net unrealized appreciation | | $ | 1,786,181 | | |
The following capital loss carryforwards may be available to reduce taxable income arising from future net realized gains on investments, if any, to the extent permitted by the Internal Revenue Code:
| Year of Expiration | | Capital Loss
Carryforwards | |
| 2017 | | $ | 4,980,942 | | |
| 2018 | | | 25,984,153 | | |
| 2019 | | | 19,955,661 | | |
| | | $ | 50,920,756 | | |
Under current tax rules, certain currency and capital losses realized after October 31 may be deferred and treated as occurring on the first day of the following fiscal year. As of March 31, 2011, post-October capital losses of $37,070,512 attributed to security transactions were deferred to April 1, 2011.
Management of the Portfolio has concluded that there are no significant uncertain tax positions that would require recognition in the financial statements. However, management's conclusion may be subject to review and adjustment at a later date based on factors including, but not limited to, new tax laws, regulations, and administrative interpretations (including relevant court decisions). The Portfolio's federal tax returns for the prior three fiscal years remain subject to examination by the Internal Revenue Service.
Note 9. Significant Risks and Contingencies
Allocation Risk
The Portfolio uses an asset allocation strategy in pursuing its investment objective. There is a risk that the Portfolio's allocation among asset classes or investments will cause the Portfolio to under-perform other funds with similar investment objectives, or that the investments themselves will not produce the returns expected.
Investing in Other Funds Risk
The performance of the Underlying Funds in which the Portfolio invests could be adversely affected if other entities investing in the same Underlying Funds make relatively large investments or redemptions in the Underlying Funds. Because the expenses and costs of the Underlying Funds are shared by the Portfolio, redemptions by other investors in the Underlying Funds could result in decreased economies of scale and increased operating expenses for the Portfolio. In addition, Columbia has the authority to change the Underlying Funds in which the Portfolio invests or to change the percentage of the Portfolio's investments allocated to each Underlying Fund. If an Underlying Fund pays fees to Columbia, such fees could result in Columbia having a potential conflict of interest in selecting the Underlying Funds in which the Portfolio invests or in determining the percentage of the Portfolio's investments allocated to each Underlying Fund.
Smaller Company Securities Risk
Securities of small- or mid-capitalization companies ("smaller companies") may have a higher potential for gains than securities of large-capitalization companies but also may involve more risk. Smaller companies may be more vulnerable to market downturns and adverse economic events than larger, more established companies because smaller companies may have more limited financial resources and business operations. Their securities may trade less frequently and in smaller volumes and may be less liquid and fluctuate more sharply in value than securities of larger companies.
Value Securities Risk
Certain Underlying Funds invest in value securities, which are securities of companies that may have experienced adverse business, industry or other developments that have caused the securities to be potentially undervalued. There is the risk that the market value of a portfolio security may not meet Columbia's future value assessment of that security. There is also a risk that it may take longer than expected for the value of these investments to rise to the believed value. In addition, value securities at times may not perform as well as growth securities or the stock market in general.
Foreign Securities Risk
Certain Underlying Funds invest in foreign securities which involves certain additional risks. These risks may involve foreign currency exchange rate fluctuations, adverse political and economic
24
Columbia Masters International Equity Portfolio, March 31, 2011
developments or foreign governmental laws or restrictions. In addition, the liquidity of foreign securities may be more limited than that of domestic securities. Investments in emerging market countries are subject to additional risk as these countries are more likely to experience high levels of inflation, deflation or currency devaluation which could hurt their economies and securities markets.
Note 10. Subsequent Events
Management has evaluated the events and transactions that have occurred through the date the financial statements were issued. Other than as noted below, there were no items requiring adjustment of the financial statements or additional disclosure.
Effective May 16, 2011, the line of credit commitment with State Street was reduced to $150,000,000, and the maximum amount that may be borrowed by any fund was limited to the lesser of $120,000,000 and the Fund's borrowing limit set forth in the Fund's registration statement.
Note 11. Information Regarding Pending and Settled Legal Proceedings
In June 2004, an action captioned John E. Gallus et al. v. American Express Financial Corp. and American Express Financial Advisors Inc. was filed in the United States District Court for the District of Arizona. The plaintiffs allege that they are investors in several American Express Company (now known as RiverSource) mutual funds and they purport to bring the action derivatively on behalf of those funds under the Investment Company Act of 1940. The plaintiffs allege that fees allegedly paid to the defendants by the funds for investment advisory and administrative services are excessive. The plaintiffs seek remedies including restitution and rescission of investment advisory and distribution agreements. The plaintiffs voluntarily agreed to transfer this case to the United States District Court for the District of Minnesota (the District Court). In response to defendants' motion to dismiss the complaint, the District Court dismissed one of plaintiffs' four claims and granted plaintiffs limited discovery. Defendants moved for summary judgment in April 2007. Summary judgment was granted in the defendants' favor on July 9, 2007. The plaintiffs filed a notice of appeal with the Eighth Circuit Court of Appeals (the Eighth Circuit) on August 8, 2007. On April 8, 2009, the Eighth Circuit reversed summary judgment and remanded to the District Court for further proceedings. On August 6, 2009, defendants filed a writ of certiorari with the U.S. Supreme Court (the Supreme Court), asking the Supreme Court to stay the District Court proceedings while the Supreme Court considers and rules in a case captioned Jones v. Harris Associates, which involves issues of law similar to those presented in the Gallus case. On March 30, 2010, the Supreme Court issued its ruling in Jones v. Harris Associates, and on April 5, 2010, the Supreme Court vacated the Eighth Circuit's decision in the Gallus case and remanded the case to the Eighth Circuit for further consideration in light of the Supreme Court's decision in Jones v. Harris Associates. On June 4, 2010, the Eighth Circuit remanded the Gallus case to the District Court for further consideration in light of the Supreme Court's decision in Jones v. Harris Associates. On December 9, 2010, the District Court reinstated its July 9, 2007 summary judgment order in favor of the defendants. On January 10, 2011, plaintiffs filed a notice of appeal with the Eighth Circuit.
In December 2005, without admitting or denying the allegations, American Express Financial Corporation (AEFC, which is now known as Ameriprise Financial, Inc. (Ameriprise Financial)), entered into settlement agreements with the Securities and Exchange Commission (SEC) and Minnesota Department of Commerce (MDOC) related to market timing activities. As a result, AEFC was censured and ordered to cease and desist from committing or causing any violations of certain provisions of the Investment Advisers Act of 1940, the Investment Company Act of 1940, and various Minnesota laws. AEFC agreed to pay disgorgement of $10 million and civil money penalties of $7 million. AEFC also agreed to retain an independent distribution consultant to assist in developing a plan for distribution of all disgorgement and civil penalties ordered by the SEC in accordance with various undertakings detailed at http://www.sec.gov/litigation/admin/ia-2451.pdf. Ameriprise Financial and its affiliates have cooperated with the SEC and the MDOC in these legal proceedings, and have made regular reports to the funds' Boards of Directors/Trustees.
Ameriprise Financial and certain of its affiliates have historically been involved in a number of legal, arbitration and regulatory proceedings, including routine litigation, class actions, and governmental actions, concerning matters arising in connection with the conduct of their business activities. Ameriprise Financial believes that the Funds are not currently the subject of, and that neither Ameriprise Financial nor any of its affiliates are the subject of, any pending legal, arbitration or regulatory proceedings that are likely to have a material adverse effect on the Funds or the ability of Ameriprise Financial or its affiliates to perform under their contracts with the Funds. Ameriprise Financial is required to make 10-Q, 10-K and, as necessary, 8-K filings with the Securities and Exchange Commission on legal and regulatory matters that relate to
25
Columbia Masters International Equity Portfolio, March 31, 2011
Ameriprise Financial and its affiliates. Copies of these filings may be obtained by accessing the SEC website at www.sec.gov.
There can be no assurance that these matters, or the adverse publicity associated with them, will not result in increased fund redemptions, reduced sale of fund shares or other adverse consequences to the Funds. Further, although we believe proceedings are not likely to have a material adverse effect on the Funds or the ability of Ameriprise Financial or its affiliates to perform under their contracts with the Funds, these proceedings are subject to uncertainties and, as such, we are unable to estimate the possible loss or range of loss that may result. An adverse outcome in one or more of these proceedings could result in adverse judgments, settlements, fines, penalties or other relief that could have a material adverse effect on the consolidated financial condition or results of operations of Ameriprise Financial.
26
Report of Independent Registered Public Accounting Firm
To the Trustees of Columbia Funds Series Trust and the Shareholders of Columbia Masters International Equity Portfolio
In our opinion, the accompanying statement of assets and liabilities, including the investment portfolio, and the related statements of operations and of changes in net assets and the financial highlights present fairly, in all material respects, the financial position of Columbia Masters International Equity Portfolio (the "Portfolio") (a series of Columbia Funds Series Trust) at March 31, 2011, and the results of its operations, the changes in its net assets, and the financial highlights for the periods indicated, in conformity with accounting principles generally accepted in the United States of America. These financial statements and financial highlights (hereafter referred to as "financial statements") are the responsibility of the Portfolio's management. Our responsibility is to express an opinion on these financial statements based on our audits. We conducted our audits of these financial statements in accordance with the standards of the Public Company Accounting Oversight Board (United States). Those standards require that we plan and perform the audit to obtain reasonable assurance about whether the financial statements are free of material misstatement. An audit includes examining, on a test basis, evidence supporting the amounts and disclosures in the financial statements, assessing the accounting principles used and significant estimates made by management, and evaluating the overall financial statement presentation. We believe that our audits, which included confirmation of securities at March 31, 2011 by correspondence with the transfer agents of the underlying Funds, provide a reasonable basis for our opinion.
PricewaterhouseCoopers LLP
Boston, Massachusetts
May 20, 2011
27
Federal Income Tax Information (Unaudited) – Columbia Masters International Equity Portfolio
For non-corporate shareholders 76.32%, or the maximum amount allowable under the Jobs and Growth Tax Relief Reconciliation Act of 2003, of ordinary income distributed by the Portfolio for the fiscal year ended March 31, 2011 may represent qualified dividend income.
The Portfolio will notify shareholders in January 2012 of amounts for use in preparing 2011 income tax returns
28
Fund Governance
The Trustees serve terms of indefinite duration. The names, addresses and birth years of the Trustees and Officers of the Funds in the Columbia Funds Series Trust, the year each was first elected or appointed to office, their principal business occupations during at least the last five years, the number of Funds overseen by each Trustee and other directorships they hold are shown below. Each officer listed below serves as an officer of each Fund in the Columbia Funds Series Trust.
Independent Trustees
Name, Address and Year of Birth,
Position with Funds, Year First
Elected or Appointed to Office | | Principal Occupation(s) During Past Five Years, Number of Funds in the Columbia
Funds Complex Overseen by Trustee, Other Directorships Held
| |
| Edward J. Boudreau, Jr. (Born 1944) | |
|
c/o Columbia Management
Investment Advisers, LLC
225 Franklin Street
Boston, MA 02110
Trustee (since 2005) | | Managing Director—E.J. Boudreau & Associates (consulting), from 2000 through current; oversees 41; Trustee—BofA Funds Series Trust. | |
|
| William P. Carmichael (Born 1943) | |
|
c/o Columbia Management
Investment Advisers, LLC
225 Franklin Street
Boston, MA 02110
Trustee (since 1999) | | Retired; oversees 41; Director—Cobra Electronics Corporation (electronic equipment manufacturer); Director—McMoRan Exploration Company (oil and gas exploration and development); Director—The Finish Line (athletic shoes and apparel); Trustee—BofA Funds Series Trust. | |
|
| William A. Hawkins (Born 1942) | |
|
c/o Columbia Management
Investment Advisers, LLC
225 Franklin Street
Boston, MA 02110
Trustee (since 2005) | | Managing Director—Overton Partners (financial consulting), August 2010 to present; President and Chief Executive Officer—California General Bank, N.A., from January 2008 through August 2010; oversees 41; Trustee—BofA Funds Series Trust. | |
|
| R. Glenn Hilliard (Born 1943) | |
|
c/o Columbia Management
Investment Advisers, LLC
225 Franklin Street
Boston, MA 02110
Trustee (since 2005) | | Chairman and Chief Executive Officer—Hilliard Group LLC (investing and consulting), from April 2003 through current; oversees 41; Trustee—BofA Funds Series Trust. | |
|
| John J. Nagorniak (Born 1944) | |
|
c/o Columbia Management
Investment Advisers, LLC
225 Franklin Street
Boston, MA 02110
Trustee (since 2008) | | Retired; President and Director—Foxstone Financial, Inc. (consulting), 2000 through December 2007; Director—Mellon Financial Corporation affiliates (investing), 2000 through 2007; Chairman—Franklin Portfolio Associates (investing—Mellon affiliate), 1982 through 2007; oversees 41; Director—MIT Investment Company; Trustee—MIT 401k Plan; Trustee—Research Foundation of CFA Institute; Trustee—BofA Funds Series Trust. | |
|
29
Fund Governance (continued)
Independent Trustees (continued)
Name, Address and Year of Birth,
Position with Funds, Year First
Elected or Appointed to Office | | Principal Occupation(s) During Past Five Years, Number of Funds in the Columbia
Funds Complex Overseen by Trustee, Other Directorships Held
| |
| Minor M. Shaw (Born 1947) | |
|
c/o Columbia Management
Investment Advisers, LLC
225 Franklin Street
Boston, MA 02110
Trustee (since 2003) | | President—Micco Corporation and Mickel Investment Group; oversees 41; Board Member—Piedmont Natural Gas; Trustee—BofA Funds Series Trust. | |
|
Interested Trustee
| Anthony M. Santomero1 (Born 1946) | |
|
c/o Columbia Management
Investment Advisers, LLC
225 Franklin Street
Boston, MA 02110
Trustee (since 2008) | | Richard K. Mellon Professor Emeritus of Finance, The Wharton School, University of Pennsylvania, from 2002 through current; Senior Advisor—McKinsey & Company (consulting), July 2006 through January 2008; President and Chief Executive Officer—Federal Reserve Bank of Philadelphia, July 2000 through April 2006; oversees 41; Director—Renaissance Reinsurance Ltd; Trustee—Penn Mutual Life Insurance Company; Director—Citigroup, Inc.; Director—Citibank, N.A.; Trustee—BofA Funds Series Trust. | |
|
1 Dr. Santomero is currently deemed by the Columbia Funds to be an "interested person" (as defined in the 1940 Act) of the Funds because he serves as a Director of Citigroup, Inc. and Citibank, N.A., companies that may directly or through subsidiaries and affiliates engage from time-to-time in brokerage execution, principal transactions and lending relationships with the Columbia Funds or other funds or accounts advised/managed by Columbia Management Investment Advisers, LLC.
The Statement of Additional Information includes additional information about the Trustees of the Funds and is available, without charge, upon request by calling 800-345-6611.
Officers
| Name, Year of Birth and Address | | Principal Occupation(s) During the Past Five Years | |
| J. Kevin Connaughton (Born 1964) | |
|
225 Franklin Street
Boston, MA 02110
President (since 2009) | | Senior Vice President and General Manager—Mutual Fund Products, Columbia Management Investment Advisers, LLC since May 2010; President, Columbia Funds, since 2009, and RiverSource Funds, since May 2010 (previously Senior Vice President and Chief Financial Officer, Columbia Funds, from June 2008 to January 2009, Treasurer, Columbia Funds, from October 2003 to May 2008, and senior officer of various other affiliated funds since 2000); Managing Director, Columbia Management Advisors, LLC from December 2004 to April 2010. | |
|
| Michael G. Clarke (Born 1969) | |
|
225 Franklin Street
Boston, MA 02110
Treasurer (since 2011) and
Chief Financial Officer (since 2009) | | Vice President, Columbia Management Investment Advisers, LLC since May 2010; Managing Director of Fund Administration, Columbia Management Advisors, LLC, from September 2004 to April 2010; senior officer of Columbia Funds and affiliated funds since 2002. | |
|
30
Fund Governance (continued)
Officers (continued)
| Name, Year of Birth and Address | | Principal Occupation(s) During the Past Five Years | |
| Scott R. Plummer (Born 1959) | |
|
5228 Ameriprise Financial Center
Minneapolis, MN 55474
Senior Vice President and Chief Legal Officer (since 2010) | | Chief Legal Officer and Assistant Secretary, Columbia Management Investment Advisers, LLC since June 2005; Vice President and Lead Chief Counsel—Asset Management, Ameriprise Financial, Inc. since May 2010 (previously Vice President and Chief Counsel—Asset Management, from 2005 to April 2010, and Vice President—Asset Management Compliance from 2004 to 2005); Vice President, Chief Counsel and Assistant Secretary, Columbia Management Investment Distributors, Inc. since 2008; Vice President, General Counsel and Secretary, Ameriprise Certificate Company since 2005; Chief Counsel, RiverSource Distributors, Inc. since 2006; Vice President, General Counsel and Secretary, RiverSource Funds, since December 2006; Senior Vice President, Secretary and Chief Legal Officer, Columbia Funds, since May 2010. | |
|
| Linda J. Wondrack (Born 1964) | |
|
225 Franklin Street
Boston, MA 02110
Senior Vice President and
Chief Compliance Officer (since 2007) | | Vice President and Chief Compliance Officer, Columbia Management Investment Advisers, LLC since May 2010; Chief Compliance Officer, Columbia Funds, since 2007, and RiverSource Funds, since May 2010; Director (Columbia Management Group, LLC and Investment Product Group Compliance), Bank of America, from June 2005 to April 2010. | |
|
| William F. Truscott (Born 1960) | |
|
53600 Ameriprise Financial Center
Minneapolis, MN 55474
Senior Vice President (since 2010) | | Chairman of the Board, Columbia Management Investment Advisers, LLC since May 2010 (previously President, Chairman of the Board and Chief Investment Officer, from 2001 to April 2010); Chief Executive Officer, U.S. Asset Management & President, Annuities, Ameriprise Financial, Inc. since May 2010 (previously President—U.S. Asset Management and Chief Investment Officer from 2005 to April 2010, and Senior Vice President—Chief Investment Officer, from 2001 to 2005); Director, President and Chief Executive Officer, Ameriprise Certificate Company since 2006; Director, Columbia Management Investment Distributors, Inc. since May 2010 (previously Chairman of the Board and Chief Executive Officer from 2008 to April 2010); Chairman of the Board and Chief Executive Officer, RiverSource Distributors, Inc. since 2006. | |
|
| Colin Moore (Born 1958) | |
|
One Financial Center
Boston, MA 02111
Senior Vice President (since 2010) | | Director and Chief Investment Officer, Columbia Management Investment Advisers, LLC since May 2010; Manager, Managing Director and Chief Investment Officer of Columbia Management Advisors, LLC from 2007 to April 2010; Head of Equities, Columbia Management Advisors, LLC from 2002 to 2007. | |
|
| Michael A. Jones (Born 1959) | |
|
225 Franklin Street
Boston, MA 02110
Senior Vice President (since 2010) | | President and Director, Columbia Management Investment Advisers, LLC since May 2010; President and Director, Columbia Management Investment Distributors, Inc. since May 2010; Manager, Chairman, Chief Executive Officer and President, Columbia Management Advisors, LLC from 2007 to April 2010; Chief Executive Officer, President and Director, Columbia Management Distributors, Inc. from November 2006 to April 2010; previously, co-president and senior managing director at Robeco Investment Management. | |
|
31
Fund Governance (continued)
Officers (continued)
| Name, Year of Birth and Address | | Principal Occupation(s) During the Past Five Years | |
| Christopher O. Petersen (Born 1970) | |
|
5228 Ameriprise Financial Center
Minneapolis, MN 55474
Vice President and Secretary (since 2011) | | Vice President and Chief Counsel, Ameriprise Financial since January 2010 (formerly Vice President and Group Counsel or Counsel from April 2004 to January 2010); Assistant Secretary of RiverSource Funds since January 2007. | |
|
| Amy Johnson (Born 1965) | |
|
5228 Ameriprise Financial Center
Minneapolis, MN 55474
Vice President (since 2010) | | Senior Vice President and Chief Operating Officer, Columbia Management Investment Advisers, LLC since May 2010 (previously Chief Administrative Officer, from 2009 until April 2010, Vice President—Asset Management and Trust Company Services, from 2006 to 2009, and Vice President—Operations and Compliance from 2004 to 2006). | |
|
| Joseph F. DiMaria (Born 1968) | |
|
225 Franklin Street
Boston, MA 02110
Vice President (since 2011) and
Chief Accounting Officer (since 2008) | | Vice President, Mutual Fund Administration, Columbia Management Investment Advisers, LLC, since May 2010; Director of Fund Administration, Columbia Management Advisors, LLC from January 2006 to April 2010; Head of Tax/Compliance and Assistant Treasurer, Columbia Management Advisors, LLC, from November 2004 to December 2005. | |
|
| Paul B. Goucher (Born 1968) | |
|
5228 Ameriprise Financial Center
Minneapolis, MN 55474
Vice President and Assistant Treasurer (since 2010) | | Vice President and Chief Counsel of Ameriprise Financial since January 2010 (formerly Vice President and Group Counsel from November 2008 to January 2010); Director, Managing Director and General Counsel of J. & W. Seligman & Co. Incorporated (Seligman) from July 2008 to November 2008 and Managing Director and Associate General Counsel of Seligman from January 2005 to July 2008. | |
|
| Michael E. DeFao (Born 1968) | |
|
5228 Ameriprise Financial Center
Minneapolis, MN 55474
Vice President and Assistant Treasurer (since 2011) | | Vice President and Chief Counsel, Ameriprise Financial since May 2010; Associate General Counsel Bank of America from June 2005 to April 2010 | |
|
| Stephen T. Welsh (Born 1957) | |
|
225 Franklin Street
Boston, MA 02110
Vice President (since 2006) | | President and Director, Columbia Management Investment Services Corp. since May 2010; President and Director, Columbia Management Services, Inc. from July 2004 to April 2010; Managing Director, Columbia Management Distributors, Inc. from August 2007 to April 2010. | |
|
32
Shareholder Meeting Results
At a Joint Special Meeting of Shareholders held on February 15, 2011, shareholders of the series of Columbia Funds Series Trust, including the Portfolio, elected each of the nominees for trustees to the Board of Trustees of Columbia Funds Series Trust, each to hold office for an indefinite term, as follows:
| Trustee | | Votes For | | Votes Withheld | | Abstentions | |
| Kathleen Blatz | | | 2,145,636,122 | | | | 248,012,438 | | | | 0 | | |
| Edward J. Boudreau, Jr. | | | 2,145,430,114 | | | | 248,218,446 | | | | 0 | | |
| Pamela G. Carlton | | | 2,145,515,949 | | | | 248,132,612 | | | | 0 | | |
| William P. Carmichael | | | 2,145,038,695 | | | | 248,609,866 | | | | 0 | | |
| Patricia M. Flynn | | | 2,145,843,563 | | | | 247,804,997 | | | | 0 | | |
| William A. Hawkins | | | 2,145,359,401 | | | | 248,289,160 | | | | 0 | | |
| R. Glenn Hilliard | | | 2,145,079,400 | | | | 248,569,161 | | | | 0 | | |
| Stephen R. Lewis, Jr. | | | 2,145,092,209 | | | | 248,556,351 | | | | 0 | | |
| John F. Maher | | | 2,145,621,338 | | | | 248,027,223 | | | | 0 | | |
| John J. Nagorniak | | | 2,145,337,494 | | | | 248,311,067 | | | | 0 | | |
| Catherine James Paglia | | | 2,145,615,254 | | | | 248,033,306 | | | | 0 | | |
| Leroy C. Richie | | | 2,145,042,120 | | | | 248,606,441 | | | | 0 | | |
| Anthony M. Santomero | | | 2,145,088,174 | | | | 248,560,386 | | | | 0 | | |
| Minor M. Shaw | | | 2,145,430,762 | | | | 248,217,798 | | | | 0 | | |
| Alison Taunton-Rigby | | | 2,145,393,384 | | | | 248,255,177 | | | | 0 | | |
| William F. Truscott | | | 2,144,907,223 | | | | 248,741,338 | | | | 0 | | |
33
This page intentionally left blank.
This page intentionally left blank.
This page intentionally left blank.
Important Information About This Report
The portfolio mails one shareholder report to each shareholder address. If you would like more than one report, please call shareholder services at 1-800-345-6611 and additional reports will be sent to you. This report has been prepared for shareholders of Columbia Masters International Equity Portfolio.
A description of the policies and procedures that the portfolio uses to determine how to vote proxies and a copy of the portfolio's voting records are available (i) at www.columbiamanagement.com, (ii) on the Securities and Exchange Commission's website at www.sec.gov, and (iii) without charge, upon request, by calling 1-800-368-0346. Information regarding how the portfolio voted proxies relating to portfolio securities during the 12-month period ended June 30 is available from the SEC's website. Information regarding how the portfolio voted proxies relating to portfolio securities is also available from the portfolio's website, www.columbiamanagement.com.
The portfolio files a complete schedule of portfolio holdings with the SEC for the first and third quarters of each fiscal year on Form N-Q. The portfolio's Form N-Q is available on the SEC's website at www.sec.gov and may be reviewed and copied at the SEC's Public Reference Room in Washington, D.C. Information on the operation of the Public Reference Room may be obtained by calling 1-800-SEC-0330.
Transfer Agent
Columbia Management Investment
Services Corp.
P.O. Box 8081
Boston, MA 02266-8081
1-800-345-6611
Distributor
Columbia Management Investment
Distributors, Inc.
225 Franklin Street
Boston, MA 02110
Investment Manager
Columbia Management Investment Advisers, LLC
225 Franklin Street
Boston, MA 02110
37

PRSRT STD
U.S. Postage
PAID
Holliston, MA
Permit NO. 20
Columbia Masters International Equity Portfolio
P. O. Box 8081
Boston, MA 02266-8081
columbiamanagement.com
This information is for use with concurrent or prior delivery of a fund prospectus. Investors should consider the investment objectives, risks, charges and expenses of a mutual fund carefully before investing. For a free prospectus, which contains this and other important information about the funds, visit columbiamanagement.com. Read the prospectus carefully before investing. The Fund is distributed by Columbia Management Investment Distributors, Inc., member FINRA, and managed by Columbia Management Investment Advisers, LLC.
© 2011 Columbia Management Investment Advisers, LLC. All rights reserved.
C-1116 A (05/11)
Item 2. Code of Ethics.
(a) The registrant has adopted a code of ethics that applies to the registrant’s principal executive officer, principal financial officer, principal accounting officer or controller, or persons performing similar functions, regardless of whether these individuals are employed by the registrant or a third party.
(b) During the period covered by this report, there were not any amendments to a provision of the code of ethics adopted in 2(a) above.
(c) During the period covered by this report, there were no waivers, including any implicit waivers, from a provision of the code of ethics described in 2(a) above that relates to one or more of the items set forth in paragraph (b) of this item’s instructions.
Item 3. Audit Committee Financial Expert.
The registrant’s Board of Trustees has determined that William P. Carmichael qualifies as an audit committee financial expert, as defined in Item 3 of Form N-CSR and is “independent” (as defined in Item 3 of Form N-CSR).
Item 4. Principal Accountant Fees and Services.
Fee information below is disclosed for the sixteen series of the registrant whose report to stockholders are included in this annual filing. Fee information for 2010 also includes one series that changed its fiscal year end from March 31 to August 31 and two series that liquidated in 2009.
(a) Audit Fees. Aggregate Audit Fees billed by the principal accountant for professional services rendered during the fiscal years ended March 31, 2011 and March 31, 2010 are approximately as follows:
2011 | | 2010 | |
$ | 379,000 | | $ | 485,600 | |
| | | | | |
Audit Fees include amounts related to the audit of the registrant’s annual financial statements or services that are normally provided by the accountant in connection with statutory and regulatory filings or engagements for those fiscal years. Fiscal years 2011
and 2010 also include audit fees for the review and provision of consent in connection with filing Form N-1A for new share classes.
(b) Audit-Related Fees. Aggregate Audit-Related Fees billed to the registrant by the principal accountant for professional services rendered during the fiscal years ended March 31, 2011 and March 31, 2010 are approximately as follows:
2011 | | 2010 | |
$ | 96,400 | | $ | 82,800 | |
| | | | | |
Audit-Related Fees include amounts for assurance and related services by the principal accountant that are reasonably related to the performance of the audit of the registrant’s financial statements and are not reported in Audit Fees above. In both fiscal years 2011 and 2010, Audit-Related Fees consist of agreed-upon procedures performed for semi-annual shareholder reports. Fiscal year 2011 also includes Audit-Related Fees for agreed- upon procedures related to fund mergers.
During the fiscal years ended March 31, 2011 and March 31, 2010, there were no Audit-Related Fees billed by the registrant’s principal accountant to the registrant’s investment adviser (not including any sub-adviser whose role is primarily portfolio management and is subcontracted with or overseen by another investment adviser) and any entity controlling, controlled by, or under common control with the adviser that provides ongoing services to the registrant for an engagement that related directly to the operations and financial reporting of the registrant.
(c) Tax Fees. Aggregate Tax Fees billed by the principal accountant to the registrant for professional services rendered during the fiscal years ended March 31, 2011 and March 31, 2010 are approximately as follows:
2011 | | 2010 | |
$ | 67,200 | | $ | 96,500 | |
| | | | | |
Tax Fees include amounts for the review of annual tax returns, the review of required shareholder distribution calculations and typically include amounts for professional services by the principal accountant for tax compliance, tax advice and tax planning. In fiscal year 2010, Tax Fees also include agreed-upon procedures related to fund mergers and the review of final tax returns.
During the fiscal years ended March 31, 2011 and March 31, 2010, there were no Tax Fees billed by the registrant’s principal accountant to the registrant’s investment adviser (not including any sub-adviser whose role is primarily portfolio management and is subcontracted with or overseen by another investment adviser) and any entity controlling, controlled by, or under common control with the adviser that provides ongoing services to the registrant for an engagement that related directly to the operations and financial reporting of the registrant.
(d) All Other Fees. Aggregate All Other Fees billed by the principal accountant to the registrant for professional services rendered during the fiscal years ended March 31, 2011 and March 31, 2010 are approximately as follows:
All Other Fees include amounts for products and services provided by the principal accountant, other than the services reported in paragraphs (a) through (c) above.
Aggregate All Other Fees billed by the registrant’s principal accountant to the registrant’s investment adviser (not including any sub-adviser whose role is primarily portfolio management and is subcontracted with or overseen by another investment adviser) and any entity controlling, controlled by, or under common control with the adviser that provides ongoing services to the registrant for an engagement that related directly to the operations and financial reporting of the registrant during the fiscal years ended March 31, 2011 and March 31, 2010 are approximately as follows:
2011 | | 2010 | |
$ | 495,300 | | $ | 1,499,400 | |
| | | | | |
In both fiscal years 2011 and 2010, All Other Fees consist of fees billed for internal control examinations of the registrant’s transfer agent and investment advisor. Fiscal year 2010 also includes fees for agreed upon procedures related to the sale of the long-term asset management business and fees related to the review of revenue modeling schedules.
(e)(1) Audit Committee Pre-Approval Policies and Procedures
The registrant’s Audit Committee is required to pre-approve the engagement of the registrant’s independent accountants to provide audit and non-audit services to the registrant and non-audit services to its investment adviser (not including any sub-adviser whose role is primarily portfolio management and is subcontracted with or overseen by another investment adviser) or any entity controlling, controlled by or under common control with such investment adviser that provides ongoing services to the registrant (“Adviser Affiliates”), if the engagement relates directly to the operations and financial reporting of the registrant.
The Audit Committee has adopted a Policy for Engagement of Independent Accountants for Audit and Non-Audit Services (“Policy”). The Policy sets forth the understanding of the Audit Committee regarding the engagement of the registrant’s independent accountants to provide (i) audit and permissible audit-related, tax and other services to the registrant (collectively “Fund Services”); (ii) non-audit services to the registrant’s investment adviser (not including any sub-adviser whose role is primarily portfolio management and is subcontracted with or overseen by another investment adviser) and Adviser Affiliates, if the engagement relates directly to the operations or
financial reporting of a Fund (collectively “Fund-related Adviser Services”); and (iii) certain other audit and non-audit services to the registrant’s investment adviser (not including any sub-adviser whose role is primarily portfolio management and is subcontracted with or overseen by another investment adviser) and Adviser Affiliates. Unless a type of service receives general pre-approval under the Policy, it requires specific pre-approval by the Audit Committee if it is to be provided by the independent accountants. Pre-approval of non-audit services to the registrant, the registrant’s investment adviser (not including any sub-adviser whose role is primarily portfolio management and is subcontracted with or overseen by another investment adviser) and Adviser Affiliates may be waived provided that the “de minimis” requirements set forth under paragraph (c)(7)(i)(C) of Rule 2-01 of Regulation S-X are met.
Under the Policy, the Audit Committee may delegate pre-approval authority to any pre-designated member or members who are Independent Trustees/Directors. The member(s) to whom such authority is delegated must report, for informational purposes only, any pre-approval decisions to the Audit Committee at its next regular meeting. The Audit Committee’s responsibilities with respect to the pre-approval of services performed by the independent accountants may not be delegated to management.
The Policy requires the Fund Treasurer and/or Director of Board Administration to submit to the Audit Committee, on an annual basis, a schedule of the types of services that are subject to general pre-approval. The schedule(s) provide a description of each type of service that is subject to general pre-approval and, where possible, will provide estimated fee caps for each instance of providing each service. The Audit Committees will review and approve the types of services and review the projected fees for the next fiscal year and may add to, or subtract from, the list of general pre-approved services from time to time based on subsequent determinations. That approval acknowledges that the Audit Committee is in agreement with the specific types of services that the independent accountants will be permitted to perform.
The Fund Treasurer and/or Director of Board Administration shall report to the Audit Committee at each of its regular meetings regarding all Fund Services or Fund-related Adviser Services initiated since the last such report was rendered, including a general description of the services, actual billed and projected fees, and the means by which such Fund Services or Fund-related Adviser Services were pre-approved by the Audit Committee.
*****
(e)(2) The percentage of services described in paragraphs (b) through (d) of this Item approved pursuant to the “de minimis” exception under paragraph (c)(7)(i)(C) of Rule 2-01 of Regulation S-X during both fiscal years ended March 31, 2011 and March 31, 2010 was zero.
(f) Not applicable.
(g) The aggregate non-audit fees billed by the registrant’s accountant for services rendered to the registrant, and rendered to the registrant’s investment adviser (not including any sub-adviser whose role is primarily portfolio management and is subcontracted with or overseen by another investment adviser), and any entity controlling, controlled by, or under common control with the adviser that provides ongoing services to the registrant for the fiscal years ended March 31, 2011 and March 31, 2010 are approximately as follows:
2011 | | 2010 | |
$ | 658,900 | | $ | 1,678,700 | |
| | | | | |
(h) The registrant’s Audit Committee of the Board of Directors has considered whether the provision of non-audit services that were rendered to the registrant’s adviser (not including any sub-adviser whose role is primarily portfolio management and is subcontracted with or overseen by another investment adviser), and any entity controlling, controlled by, or under common control with the investment adviser that provides ongoing services to the registrant that were not pre-approved pursuant to paragraph (c)(7)(ii) of Rule 2-01 of Regulation S-X, is compatible with maintaining the principal accountant’s independence.
Item 5. Audit Committee of Listed Registrants.
Not applicable.
Item 6. Investments
(a) The registrant’s “Schedule I — Investments in securities of unaffiliated issuers” (as set forth in 17 CFR 210.12-12) is included in Item 1 of this Form N-CSR.
(b) Not applicable.
Item 7. Disclosure of Proxy Voting Policies and Procedures for Closed-End Management Investment Companies.
Not applicable.
Item 8. Portfolio Managers of Closed-End Management Investment Companies.
Not applicable.
Item 9. Purchases of Equity Securities by Closed-End Management Investment Company and Affiliated Purchasers.
Not applicable.
Item 10. Submission of Matters to a Vote of Security Holders.
There were no material changes to the procedures by which shareholders may recommend nominees to the registrant’s board of directors.
Item 11. Controls and Procedures.
(a) The registrant’s principal executive officer and principal financial officers, based on their evaluation of the registrant’s disclosure controls and procedures as of a date within 90 days of the filing of this report, have concluded that such controls and procedures are adequately designed to ensure that material information required to be disclosed by the registrant in Form N-CSR is accumulated and communicated to the registrant’s management, including the principal executive officer and principal financial officer, or persons performing similar functions, as appropriate to allow timely decisions regarding required disclosure.
(b) There was no change in the registrant’s internal control over financial reporting that occurred during the registrant’s second fiscal quarter of the period covered by this report that has materially affected, or is reasonably likely to materially affect, the registrant’s internal control over financial reporting.
Item 12. Exhibits.
(a)(1) Code of ethics required to be disclosed under Item 2 of Form N-CSR attached hereto as Exhibit 99.CODE ETH.
(a)(2) Certifications pursuant to Rule 30a-2(a) under the Investment Company Act of 1940 (17 CFR 270.30a-2(a)) attached hereto as Exhibit 99.CERT.
(a)(3) Not applicable.
(b) Certification pursuant to Rule 30a-2(b) under the Investment Company Act of 1940 (17 CFR 270.30a-2(b)) attached hereto as Exhibit 99.906CERT.
SIGNATURES
Pursuant to the requirements of the Securities Exchange Act of 1934 and the Investment Company Act of 1940, the registrant has duly caused this report to be signed on its behalf by the undersigned, thereunto duly authorized.
(registrant) | | Columbia Funds Series Trust | |
| | | |
| | | |
By (Signature and Title) | | /s/ J. Kevin Connaughton | |
| | J. Kevin Connaughton, President | |
| | |
| | |
Date | | May 20, 2011 | |
| | | | | |
Pursuant to the requirements of the Securities Exchange Act of 1934 and the Investment Company Act of 1940, this report has been signed below by the following persons on behalf of the registrant and in the capacities and on the dates indicated.
By (Signature and Title) | | /s/ J. Kevin Connaughton | |
| | J. Kevin Connaughton, President | |
| | | | |
| | | | |
Date | | May 20, 2011 | |
| | | | | |
By (Signature and Title) | | /s/ Michael G. Clarke | |
| | Michael G. Clarke, Chief Financial Officer | |
| | | | |
| | | | |
Date | | May 20, 2011 | |
| | | | | |