UNITED STATES
SECURITIES AND EXCHANGE COMMISSION
Washington, D.C. 20549
FORM N-CSR
CERTIFIED SHAREHOLDER REPORT OF REGISTERED
MANAGEMENT INVESTMENT COMPANIES
Investment Company Act file number | 811-09645 |
|
Columbia Funds Series Trust |
(Exact name of registrant as specified in charter) |
|
50606 Ameriprise Financial Center Minneapolis, MN | | 55474 |
(Address of principal executive offices) | | (Zip code) |
|
Christopher O. Petersen, Esq. c/o Columbia Management Investment Advisers, LLC 225 Franklin Street Boston, MA 02110 |
(Name and address of agent for service) |
|
Registrant’s telephone number, including area code: | (800) 345-6611 | |
|
Date of fiscal year end: | February 28 | |
|
Date of reporting period: | February 28, 2014 | |
| | | | | | | | |
Form N-CSR is to be used by management investment companies to file reports with the Commission not later than 10 days after the transmission to stockholders of any report that is required to be transmitted to stockholders under Rule 30e-1 under the Investment Company Act of 1940 (17 CFR 270.30e-1). The Commission may use the information provided on Form N-CSR in its regulatory, disclosure review, inspection, and policymaking roles.
A registrant is required to disclose the information specified by Form N-CSR, and the Commission will make this information public. A registrant is not required to respond to the collection of information contained in Form N-CSR unless the Form displays a currently valid Office of Management and Budget (“OMB”) control number. Please direct comments concerning the accuracy of the information collection burden estimate and any suggestions for reducing the burden to Secretary, Securities and Exchange Commission, 450 Fifth Street, NW, Washington, DC 20549-0609. The OMB has reviewed this collection of information under the clearance requirements of 44 U.S.C. § 3507.
Item 1. Reports to Stockholders.
Annual Report
February 28, 2014

Columbia Large Cap Index Fund
Not FDIC insured • No bank guarantee • May lose value
 Dear Shareholders,
Equities recovered
In the final months of 2013, the U.S. economy embraced a robust recovery. After five years of only modest progress, the pace of economic growth picked up, job gains continued, manufacturing activity accelerated and a rebound in the housing market showed staying power. Growth, as measured by gross domestic product, was 4.1% in the third quarter, with expectations for a solid fourth quarter. Job growth averaged close to 200,000 monthly. Industrial production rose at a rate of 3.3%, considerably higher than the 12-month average of 2.5%. Factories were busier than at any point since the 2008/2009 recession, with capacity utilization at 79%. Orders for durable goods were strong, bolstered by rising auto sales. Holiday spending was solid, especially online sales, which rose 10% year over year, despite a shorter season.
Against this backdrop, the Federal Reserve's (the Fed's) announcement that it would slowly retreat from its monthly bond buying program and a bipartisan budget deal in Washington were welcome news for investors. Stocks climbed to new highs in the fourth quarter, while bonds retreated as yields moved higher. Small-cap stocks outperformed large- and mid-cap stocks, led by significant gains from the industrials, technology and consumer discretionary sectors. All 10 sectors of the S&P 500 Index delivered positive returns, although telecommunications and utilities posted only modest gains.
Fixed-income retreated
Improved economic data drove interest rates higher over the fourth quarter, credit spreads narrowed and the dollar weakened against most developed market currencies. Against this backdrop, most non-Treasury, fixed-income sectors delivered positive returns. Outgoing Fed chairman Ben Bernanke expressed concern about the persistently low level of core inflation, but gains in the labor market and reduced unemployment led to the Fed's decision to taper its bond-buying program gradually beginning in January 2014.
As the stock market soared, the riskiest sectors of the fixed-income markets fared the best. U.S. and foreign high-yield bonds were the strongest performers, followed by emerging-market and U.S. investment-grade corporate bonds. U.S. mortgage-backed securities (MBS) and securitized bonds produced negative total returns, as did U.S. Treasuries and developed world government bonds. Treasury inflation-protected bonds were the period's biggest losers. Investment-grade municipals delivered fractional gains, as better economic conditions helped steady state finances.
Stay on track with Columbia Management
Backed by more than 100 years of experience, Columbia Management is one of the nation's largest asset managers. At the heart of our success and, most importantly, that of our investors, are highly talented industry professionals, brought together by a unique way of working. At Columbia Management, reaching our performance goals matters, and how we reach them matters just as much.
Visit columbiamanagement.com for:
> The Columbia Management Perspectives blog, offering insights on current market events and investment opportunities
> Detailed up-to-date fund performance and portfolio information
> Quarterly fund commentaries
> Columbia Management Investor, our award-winning quarterly newsletter for shareholders
Thank you for your continued support of the Columbia Funds. We look forward to serving your investment needs for many years to come.
Best Regards,

J. Kevin Connaughton
President, Columbia Funds
Investing involves risk including the risk of loss of principal.
The S&P 500 Index, an unmanaged index, measures the performance of 500 widely held, large-capitalization U.S. stocks and is frequently used as a general measure of market performance. The Dow Jones Industrial Average is a price weighted average of 30 actively traded shares of blue chip US industrial corporations listed on the New York Stock Exchange. Indices are not available for investment, are not professionally managed and do not reflect sales charges, fees, brokerage commissions, taxes or other expenses of investing.
Investors should consider the investment objectives, risks, charges and expenses of a mutual fund carefully before investing. For a free prospectus and, if available, a summary prospectus, which contains this and other important information about a fund, visit columbiamanagement.com. The prospectus should be read carefully before investing.
Columbia Funds are distributed by Columbia Management Investment Distributors, Inc., member FINRA, and managed by Columbia Management Investment Advisers, LLC.
© 2014 Columbia Management Investment Advisers, LLC. All rights reserved.
Columbia Large Cap Index Fund
Performance Overview | | | 2 | | |
Manager Discussion of Fund Performance | | | 4 | | |
Understanding Your Fund's Expenses | | | 6 | | |
Portfolio of Investments | | | 7 | | |
Statement of Assets and Liabilities | | | 19 | | |
Statement of Operations | | | 21 | | |
Statement of Changes in Net Assets | | | 22 | | |
Financial Highlights | | | 24 | | |
Notes to Financial Statements | | | 29 | | |
Report of Independent Registered
Public Accounting Firm | | | 36 | | |
Federal Income Tax Information | | | 37 | | |
Trustees and Officers | | | 38 | | |
Important Information About This Report | | | 45 | | |
Fund Investment Manager
Columbia Management Investment
Advisers, LLC
225 Franklin Street
Boston, MA 02110
Fund Distributor
Columbia Management Investment
Distributors, Inc.
225 Franklin Street
Boston, MA 02110
Fund Transfer Agent
Columbia Management Investment
Services Corp.
P.O. Box 8081
Boston, MA 02266-8081
For more information about any of the funds, please visit columbiamanagement.com or call 800.345.6611. Customer Service Representatives are available to answer your questions Monday through Friday from 8 a.m. to 7 p.m. Eastern time.
The views expressed in this report reflect the current views of the respective parties. These views are not guarantees of future performance and involve certain risks, uncertainties and assumptions that are difficult to predict, so actual outcomes and results may differ significantly from the views expressed. These views are subject to change at any time based upon economic, market or other conditions and the respective parties disclaim any responsibility to update such views. These views may not be relied on as investment advice and, because investment decisions for a Columbia Fund are based on numerous factors, may not be relied on as an indication of trading intent on behalf of any particular Columbia Fund. References to specific securities should not be construed as a recommendation or investment advice.
Columbia Large Cap Index Fund
Performance Summary
> Columbia Large Cap Index Fund (the Fund) Class A shares returned 24.80% for the 12-month period that ended February 28, 2014.
> The Fund's benchmark, the S&P 500 Index, returned 25.37% for the same time period.
> Mutual funds, unlike unmanaged indices, incur operating expenses, which accounted for the Fund's underperformance relative to the benchmark.
Average Annual Total Returns (%) (for period ended February 28, 2014)
| | Inception | | 1 Year | | 5 Years | | 10 Years | |
Class A | | 10/10/95 | | | 24.80 | | | | 22.50 | | | | 6.75 | | |
Class B* | | 09/23/05 | | | | | | | | | | | | | |
Excluding sales charges | | | | | | | 23.88 | | | | 21.59 | | | | 5.96 | | |
Including sales charges | | | | | | | 18.88 | | | | 21.40 | | | | 5.96 | | |
Class I* | | 11/16/11 | | | 25.12 | | | | 22.78 | | | | 6.98 | | |
Class R5* | | 11/08/12 | | | 25.14 | | | | 22.82 | | | | 7.02 | | |
Class Z | | 12/15/93 | | | 25.09 | | | | 22.81 | | | | 7.02 | | |
S&P 500 Index | | | | | | | 25.37 | | | | 23.00 | | | | 7.16 | | |
Returns for Class B are shown with and without the applicable contingent deferred sales charge (CDSC) of 5.00% in the first year, declining to 1.00% in the sixth year and eliminated thereafter. The Fund's other classes are not subject to sales charges and have limited eligibility. Please see the Fund's prospectus for details. Performance for different share classes will vary based on differences in sales charges and fees associated with each class. All results shown assume reinvestment of distributions during the period. Returns do not reflect the deduction of taxes that a shareholder may pay on Fund distributions or on the redemption of Fund shares. Performance results reflect the effect of any fee waivers or reimbursements of Fund expenses by Columbia Management Investment Advisers, LLC and/or any of its affiliates. Absent these fee waivers or expense reimbursement arrangements, performance results would have been lower.
The performance information shown represents past performance and is not a guarantee of future results. The investment return and principal value of your investment will fluctuate so that your shares, when redeemed, may be worth more or less than their original cost. Current performance may be lower or higher than the performance information shown. You may obtain performance information current to the most recent month-end by contacting your financial intermediary, visiting columbiamanagement.com or calling 800.345.6611.
*The returns shown for periods prior to the share class inception date (including returns for the Life of the Fund, if shown, which are since Fund inception) include the returns of the Fund's oldest share class. These returns are adjusted to reflect any higher class-related operating expenses of the newer share classes, as applicable. Please visit columbiamanagement.com/mutual-funds/appended-performance for more information.
The S&P 500 Index, an unmanaged index, measures the performance of 500 widely held, large-capitalization U.S. stocks and is frequently used as a general measure of market performance.
Indices are not available for investment, are not professionally managed and do not reflect sales charges, fees, brokerage commissions, taxes or other expenses of investing. Securities in the Fund may not match those in an index.
Annual Report 2014
2
Columbia Large Cap Index Fund
Performance Overview (continued)
Performance of a Hypothetical $10,000 Investment (March 1, 2004 – February 28, 2014)
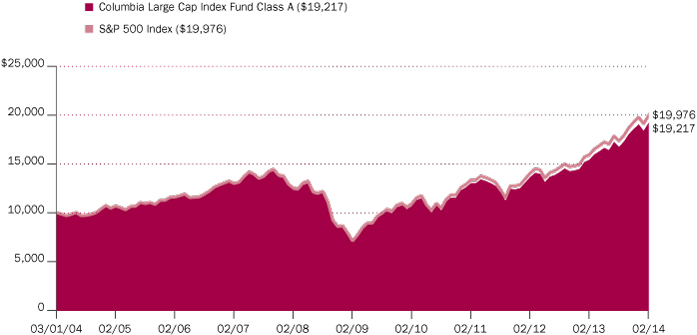
The chart above shows the change in value of a hypothetical $10,000 investment in Class A shares of Columbia Large Cap Index Fund during the stated time period, and does not reflect the deduction of taxes that a shareholder may pay on Fund distributions or on the redemption of Fund shares.
Annual Report 2014
3
Columbia Large Cap Index Fund
Manager Discussion of Fund Performance
For the 12-month period that ended February 28, 2014, the Fund's Class A shares returned 24.80%. The Fund's benchmark, the S&P 500 Index, returned 25.37% for the same period. Mutual funds, unlike unmanaged indices, incur operating expenses, which helped to account for the Fund's underperformance relative to the benchmark.
U.S. Equity Market Posted Strong Gains
Following a strong first quarter of 2013 when investors turned attention to the modest but continued strengthening of the U.S. economy, volatility heightened in the second calendar quarter, as uncertainty about the global economy, monetary policy and the impact of the sequester's spending cuts weighed on investors. While consumers weathered the domestic drag well, businesses remained cautious, keeping inventories, capital expenditures and staffs lean. U.S. equities delivered positive returns during the third quarter of 2013 despite threats of military action in Syria, rumblings from Iran and an impending showdown over the U.S. debt ceiling. Still, robust economic growth continued to elude the U.S. economy, which merely plodded along. The Federal Reserve (the Fed) unsettled investors with a hint that it was ready to taper its purchase of U.S. Treasury and mortgage securities. However, the Fed's decision to not take any action at its September 2013 meeting rallied stocks to new highs. In the final months of 2013, the U.S. economy embraced a healthy recovery, with job gains continuing, manufacturing activity accelerating and a rebound in housing showing staying power. Against this backdrop, the Fed's announcement in mid-December that it would slowly retreat from its monthly bond purchases and a bipartisan budget deal in Washington D.C. were welcome news for investors, and U.S. equities climbed to new highs.
The benchmark posted a new all-time high on January 15, 2014 but reacted poorly to reports of lower Chinese manufacturing and fell for the month overall. However, the bear market only lasted 11 days — ending on February 3. U.S. equities subsequently regained losses and set another all-time high. Global concerns heightened amidst conflict in the Ukraine, but investors generally remained positive on U.S. equities given strong corporate earnings reports and guidance.
Benchmark Enjoyed Broad-Based Gains
All ten sectors of the benchmark posted positive returns during the 12 months ended February 28, 2014. In terms of total return, health care, consumer discretionary and industrials were the best relative performers. On the basis of impact, which takes weightings and total returns into account, information technology, health care and financials were the biggest contributors to the benchmark's return. The top performing industries for the annual period were airlines, biotechnology, auto components, internet and catalog retail and aerospace and defense.
Conversely, telecommunication services and utilities, traditionally considered defensive sectors, were the weakest sectors from both a total return perspective and on the basis of impact. Each, though, still generated positive, albeit more modest, returns. The worst performing industries for the annual period were personal products, diversified telecommunication services, metals and mining, tobacco, and trading companies and distributors.
Top individual contributors within the benchmark included information technology giants Google, Microsoft and Apple, financials company Wells
Portfolio Management
Alfred Alley III, CFA
Vadim Shteyn
Morningstar Style BoxTM

The Morningstar Style BoxTM is based on a fund's portfolio holdings. For equity funds, the vertical axis shows the market capitalization of the stocks owned, and the horizontal axis shows investment style (value, blend, or growth). Information shown is based on the most recent data provided by Morningstar.
© 2014 Morningstar, Inc. All rights reserved. The Morningstar information contained herein: (1) is proprietary to Morningstar and/or its content providers; (2) may not be copied or distributed; and (3) is not warranted to be accurate, complete or timely. Neither Morningstar nor its content providers are responsible for any damages or losses arising from any use of this information.
Top Ten Holdings (%)
(at February 28, 2014) | |
Apple, Inc. | | | 2.8 | | |
Exxon Mobil Corp. | | | 2.5 | | |
Google, Inc., Class A | | | 2.0 | | |
Microsoft Corp. | | | 1.7 | | |
Johnson & Johnson | | | 1.6 | | |
General Electric Co. | | | 1.5 | | |
Wells Fargo & Co. | | | 1.3 | | |
Chevron Corp. | | | 1.3 | | |
Procter & Gamble Co. (The) | | | 1.3 | | |
JPMorgan Chase & Co. | | | 1.3 | | |
Percentages indicated are based upon total investments (excluding Money Market Funds).
For further detail about these holdings, please refer to the section entitled "Portfolio of Investments."
Fund holdings are as of the date given, are subject to change at any time, and are not recommendations to buy or sell any security.
Annual Report 2014
4
Columbia Large Cap Index Fund
Manager Discussion of Fund Performance (continued)
Fargo and biopharmaceutical company Gilead Sciences. Top detractors were information technology company International Business Machines, tobacco company Philip Morris International, gold mining company Newmont Mining, telecommunication services giant AT&T and medical device company Intuitive Surgical.
As always, each sector and stock in the benchmark was represented in the Fund with approximately the same weighting as in the benchmark and therefore had a similar effect.
Index Additions and Deletions Drove Portfolio Changes
During the annual period, there were 18 additions and 18 deletions to the benchmark and the Fund's portfolio. Among those stocks added to the benchmark and Fund were social networking website Facebook; consumer discretionary companies Mohawk Industries, Michael Kors Holdings and Tractor Supply; real estate investment trusts General Growth Properties and Macerich; airline Delta Air Lines; pharmaceuticals companies Vertex Pharmaceuticals, Zoetis and Regeneron Pharmaceuticals; auto manufacturer General Motors; rail company Kansas City Southern; media conglomerate News Corporation; and energy services company Transocean.
Deletions included semiconductor companies Teradyne and Advanced Micro Devices; consumer staples companies H.J. Heinz and Dean Foods; retailers Abercrombie & Fitch and J.C. Penney; information technology-related companies JDS Uniphase, Dell and BMC Software; financials-related companies NYSE Euronext and First Horizon National; telecommunications companies Sprint Nextel and MetroPCS Communications; and health care-related companies Coventry Health Care and Life Technologies.
The Fund used equity index futures on an opportunistic basis to equitize cash balances held in the portfolio for trading and redemption purposes. The percentage of Fund assets held in these instruments changed daily due to changes in the Fund's cash position but was generally minimal in size and impact.
Looking Ahead
We do not anticipate any changes in the portfolio beyond the customary quarterly rebalancings and stock substitutions we make to align the Fund with the benchmark.
From a broad perspective, following developed equity markets performing strongly relative to other asset classes in 2013, we currently believe U.S. equities have the potential to perform well in 2014, albeit perhaps not as well as last year. While valuations for most U.S. stocks did not appear as cheap at the end of February 2014 as they were 12 months prior, we believe they were still fairly valued, especially relative to fixed income. Indeed, we believe corporate earnings have been strong and guidance has been encouraging for the most part. Balance sheets remain healthy at this time with high cash levels and low debt. We currently believe the U.S. economy may continue to benefit from an improving labor market, a strengthening housing market, reduced fiscal drag, normalization of monetary policy, an improving eurozone recovery and aggressive Japanese economic stimulus. There will almost certainly be challenges along the way, such as geopolitical risk and the unknown impact of ongoing Fed tapering, but we believe developed equity markets, especially U.S. equity markets, may still provide reasonably attractive returns in the coming months.
Portfolio Breakdown (%)
(at February 28, 2014) | |
Common Stocks | | | 98.7 | | |
Consumer Discretionary | | | 12.3 | | |
Consumer Staples | | | 9.3 | | |
Energy | | | 9.9 | | |
Financials | | | 15.7 | | |
Health Care | | | 13.5 | | |
Industrials | | | 10.6 | | |
Information Technology | | | 18.5 | | |
Materials | | | 3.5 | | |
Telecommunication Services | | | 2.5 | | |
Utilities | | | 2.9 | | |
Money Market Funds | | | 1.3 | | |
Total | | | 100.0 | | |
Percentages indicated are based upon total investments. The Fund's portfolio composition is subject to change.
Investment Risks
Risks include stock market fluctuations and changes in the values of specific fund holdings due to economic and business developments. See the Fund's prospectus for information on these and other risks.
Annual Report 2014
5
Columbia Large Cap Index Fund
Understanding Your Fund's Expenses
(Unaudited)
As an investor, you incur two types of costs. There are transaction costs, which generally include sales charges on purchases and may include redemption fees. There are also ongoing costs, which generally include management fees, distribution and/or service fees, and other fund expenses. The following information is intended to help you understand your ongoing costs (in dollars) of investing in the Fund and to help you compare these costs with the ongoing costs of investing in other mutual funds.
Analyzing Your Fund's Expenses
To illustrate these ongoing costs, we have provided examples and calculated the expenses paid by investors in each share class of the Fund during the period. The actual and hypothetical information in the table is based on an initial investment of $1,000 at the beginning of the period indicated and held for the entire period. Expense information is calculated two ways and each method provides you with different information. The amount listed in the "Actual" column is calculated using the Fund's actual operating expenses and total return for the period. You may use the Actual information, together with the amount invested, to estimate the expenses that you paid over the period. Simply divide your account value by $1,000 (for example, an $8,600 account value divided by $1,000 = 8.6), then multiply the results by the expenses paid during the period under the "Actual" column. The amount listed in the "Hypothetical" column assumes a 5% annual rate of return before expenses (which is not the Fund's actual return) and then applies the Fund's actual expense ratio for the period to the hypothetical return. You should not use the hypothetical account values and expenses to estimate either your actual account balance at the end of the period or the expenses you paid during the period. See "Compare With Other Funds" below for details on how to use the hypothetical data.
Compare With Other Funds
Since all mutual funds are required to include the same hypothetical calculations about expenses in shareholder reports, you can use this information to compare the ongoing cost of investing in the Fund with other funds. To do so, compare the hypothetical example with the 5% hypothetical examples that appear in the shareholder reports of other funds. As you compare hypothetical examples of other funds, it is important to note that hypothetical examples are meant to highlight the ongoing costs of investing in a fund only and do not reflect any transaction costs, such as sales charges, or redemption or exchange fees. Therefore, the hypothetical calculations are useful in comparing ongoing costs only, and will not help you determine the relative total costs of owning different funds. If transaction costs were included in these calculations, your costs would be higher.
September 1, 2013 – February 28, 2014
| | Account Value at the Beginning
of the Period ($) | | Account Value at the End of the
Period ($) | | Expenses Paid During the
Period ($) | | Fund's Annualized
Expense Ratio (%) | |
| | Actual | | Hypothetical | | Actual | | Hypothetical | | Actual | | Hypothetical | | Actual | |
Class A | | | 1,000.00 | | | | 1,000.00 | | | | 1,148.00 | | | | 1,022.69 | | | | 2.41 | | | | 2.27 | | | | 0.45 | | |
Class B | | | 1,000.00 | | | | 1,000.00 | | | | 1,144.00 | | | | 1,018.95 | | | | 6.41 | | | | 6.04 | | | | 1.20 | | |
Class I | | | 1,000.00 | | | | 1,000.00 | | | | 1,149.50 | | | | 1,023.93 | | | | 1.07 | | | | 1.01 | | | | 0.20 | | |
Class R5 | | | 1,000.00 | | | | 1,000.00 | | | | 1,149.60 | | | | 1,023.93 | | | | 1.07 | | | | 1.01 | | | | 0.20 | | |
Class Z | | | 1,000.00 | | | | 1,000.00 | | | | 1,149.50 | | | | 1,023.93 | | | | 1.07 | | | | 1.01 | | | | 0.20 | | |
Expenses paid during the period are equal to the annualized expense ratio for each class as indicated above, multiplied by the average account value over the period and then multiplied by the number of days in the Fund's most recent fiscal half year and divided by 365.
Expenses do not include fees and expenses incurred indirectly by the Fund from the underlying funds in which the Fund may invest (also referred to as "acquired funds"), including affiliated and non-affiliated pooled investment vehicles (including mutual funds and exchange-traded funds).
Had Columbia Management Investment Advisers, LLC and/or certain of its affiliates not waived/reimbursed certain fees and expenses, account value at the end of the period would have been reduced.
Annual Report 2014
6
Columbia Large Cap Index Fund
Portfolio of Investments
February 28, 2014
(Percentages represent value of investments compared to net assets)
Common Stocks 97.3%
Issuer | | Shares | | Value ($) | |
Consumer Discretionary 12.1% | |
Auto Components 0.4% | |
BorgWarner, Inc. | | | 42,594 | | | | 2,617,402 | | |
Delphi Automotive PLC | | | 52,397 | | | | 3,488,068 | | |
Goodyear Tire & Rubber Co. (The) | | | 46,190 | | | | 1,241,125 | | |
Johnson Controls, Inc. | | | 128,213 | | | | 6,333,722 | | |
Total | | | | | 13,680,317 | | |
Automobiles 0.7% | |
Ford Motor Co. | | | 738,236 | | | | 11,361,452 | | |
General Motors Co.(a) | | | 243,909 | | | | 8,829,506 | | |
Harley-Davidson, Inc. | | | 41,404 | | | | 2,735,148 | | |
Total | | | | | 22,926,106 | | |
Distributors 0.1% | |
Genuine Parts Co. | | | 28,883 | | | | 2,544,303 | | |
Diversified Consumer Services 0.1% | |
Graham Holdings Co., Class B | | | 806 | | | | 579,272 | | |
H&R Block, Inc. | | | 51,140 | | | | 1,618,070 | | |
Total | | | | | 2,197,342 | | |
Hotels, Restaurants & Leisure 1.7% | |
Carnival Corp. | | | 81,957 | | | | 3,250,415 | | |
Chipotle Mexican Grill, Inc.(a) | | | 5,809 | | | | 3,283,305 | | |
Darden Restaurants, Inc. | | | 24,439 | | | | 1,247,855 | | |
International Game Technology | | | 46,578 | | | | 702,862 | | |
Marriott International, Inc., Class A | | | 42,047 | | | | 2,280,209 | | |
McDonald's Corp. | | | 186,206 | | | | 17,717,501 | | |
Starbucks Corp. | | | 141,047 | | | | 10,008,695 | | |
Starwood Hotels & Resorts
Worldwide, Inc. | | | 35,847 | | | | 2,955,944 | | |
Wyndham Worldwide Corp. | | | 24,383 | | | | 1,777,033 | | |
Wynn Resorts Ltd. | | | 15,103 | | | | 3,662,326 | | |
Yum! Brands, Inc. | | | 83,365 | | | | 6,175,679 | | |
Total | | | | | 53,061,824 | | |
Household Durables 0.4% | |
D.R. Horton, Inc. | | | 53,190 | | | | 1,306,346 | | |
Garmin Ltd. | | | 23,002 | | | | 1,234,287 | | |
Harman International Industries, Inc. | | | 12,640 | | | | 1,323,787 | | |
Leggett & Platt, Inc. | | | 26,412 | | | | 846,505 | | |
Lennar Corp., Class A | | | 31,300 | | | | 1,373,444 | | |
Mohawk Industries, Inc.(a) | | | 11,400 | | | | 1,613,442 | | |
Common Stocks (continued)
Issuer | | Shares | | Value ($) | |
Newell Rubbermaid, Inc. | | | 53,756 | | | | 1,726,105 | | |
PulteGroup, Inc. | | | 64,534 | | | | 1,354,569 | | |
Whirlpool Corp. | | | 14,704 | | | | 2,126,640 | | |
Total | | | | | 12,905,125 | | |
Internet & Catalog Retail 1.4% | |
Amazon.com, Inc.(a) | | | 69,386 | | | | 25,124,671 | | |
Expedia, Inc. | | | 19,269 | | | | 1,513,194 | | |
Netflix, Inc.(a) | | | 11,092 | | | | 4,942,928 | | |
priceline.com, Inc.(a) | | | 9,619 | | | | 12,974,492 | | |
TripAdvisor, Inc.(a) | | | 20,726 | | | | 2,077,574 | | |
Total | | | | | 46,632,859 | | |
Leisure Equipment & Products 0.1% | |
Hasbro, Inc. | | | 21,602 | | | | 1,191,567 | | |
Mattel, Inc. | | | 63,320 | | | | 2,362,469 | | |
Total | | | | | 3,554,036 | | |
Media 3.6% | |
Cablevision Systems Corp., Class A | | | 40,058 | | | | 705,021 | | |
CBS Corp., Class B Non Voting | | | 104,463 | | | | 7,007,378 | | |
Comcast Corp., Class A | | | 487,761 | | | | 25,212,366 | | |
DIRECTV(a) | | | 91,461 | | | | 7,097,374 | | |
Discovery Communications, Inc.,
Class A(a) | | | 42,242 | | | | 3,519,603 | | |
Gannett Co., Inc. | | | 42,670 | | | | 1,269,432 | | |
Interpublic Group of Companies, Inc. (The) | | | 77,915 | | | | 1,380,654 | | |
News Corp., Class A(a) | | | 93,181 | | | | 1,708,008 | | |
Omnicom Group, Inc. | | | 48,163 | | | | 3,644,976 | | |
Scripps Networks Interactive, Inc.,
Class A | | | 20,527 | | | | 1,667,613 | | |
Time Warner Cable, Inc. | | | 52,743 | | | | 7,402,480 | | |
Time Warner, Inc. | | | 169,327 | | | | 11,366,921 | | |
Twenty-First Century Fox, Inc., Class A | | | 367,289 | | | | 12,318,873 | | |
Viacom, Inc., Class B | | | 75,961 | | | | 6,664,059 | | |
Walt Disney Co. (The) | | | 305,884 | | | | 24,718,486 | | |
Total | | | | | 115,683,244 | | |
Multiline Retail 0.7% | |
Dollar General Corp.(a) | | | 55,151 | | | | 3,303,545 | | |
Dollar Tree, Inc.(a) | | | 38,943 | | | | 2,132,908 | | |
Family Dollar Stores, Inc. | | | 18,112 | | | | 1,186,336 | | |
Kohl's Corp. | | | 37,650 | | | | 2,115,554 | | |
The accompanying Notes to Financial Statements are an integral part of this statement.
Annual Report 2014
7
Columbia Large Cap Index Fund
Portfolio of Investments (continued)
February 28, 2014
Common Stocks (continued)
Issuer | | Shares | | Value ($) | |
Macy's, Inc. | | | 68,971 | | | | 3,990,662 | | |
Nordstrom, Inc. | | | 26,767 | | | | 1,645,635 | | |
Target Corp. | | | 118,313 | | | | 7,399,295 | | |
Total | | | | | 21,773,935 | | |
Specialty Retail 2.1% | |
AutoNation, Inc.(a) | | | 12,094 | | | | 636,628 | | |
AutoZone, Inc.(a) | | | 6,367 | | | | 3,428,247 | | |
Bed Bath & Beyond, Inc.(a) | | | 40,171 | | | | 2,724,397 | | |
Best Buy Co., Inc. | | | 51,144 | | | | 1,361,965 | | |
CarMax, Inc.(a) | | | 41,790 | | | | 2,023,890 | | |
GameStop Corp., Class A | | | 21,862 | | | | 815,671 | | |
Gap, Inc. (The) | | | 49,555 | | | | 2,168,031 | | |
Home Depot, Inc. (The) | | | 263,542 | | | | 21,618,350 | | |
L Brands, Inc. | | | 45,636 | | | | 2,570,676 | | |
Lowe's Companies, Inc. | | | 195,753 | | | | 9,793,523 | | |
O'Reilly Automotive, Inc.(a) | | | 20,079 | | | | 3,028,917 | | |
PetSmart, Inc. | | | 19,411 | | | | 1,301,702 | | |
Ross Stores, Inc. | | | 40,572 | | | | 2,953,642 | | |
Staples, Inc. | | | 123,643 | | | | 1,680,308 | | |
Tiffany & Co. | | | 20,594 | | | | 1,920,390 | | |
TJX Companies, Inc. (The) | | | 133,113 | | | | 8,181,125 | | |
Tractor Supply Co. | | | 26,130 | | | | 1,843,733 | | |
Urban Outfitters, Inc.(a) | | | 20,420 | | | | 764,525 | | |
Total | | | | | 68,815,720 | | |
Textiles, Apparel & Luxury Goods 0.8% | |
Coach, Inc. | | | 52,484 | | | | 2,561,744 | | |
Fossil Group, Inc.(a) | | | 9,191 | | | | 1,056,138 | | |
Michael Kors Holdings Ltd.(a) | | | 33,570 | | | | 3,290,867 | | |
Nike, Inc., Class B | | | 139,849 | | | | 10,950,177 | | |
PVH Corp. | | | 15,280 | | | | 1,931,850 | | |
Ralph Lauren Corp. | | | 11,150 | | | | 1,796,042 | | |
VF Corp. | | | 65,852 | | | | 3,858,269 | | |
Total | | | | | 25,445,087 | | |
Total Consumer Discretionary | | | | | 389,219,898 | | |
Consumer Staples 9.2% | |
Beverages 2.0% | |
Beam, Inc. | | | 30,537 | | | | 2,533,350 | | |
Brown-Forman Corp., Class B | | | 30,349 | | | | 2,543,246 | | |
Coca-Cola Co. (The) | | | 710,774 | | | | 27,151,567 | | |
Common Stocks (continued)
Issuer | | Shares | | Value ($) | |
Coca-Cola Enterprises, Inc. | | | 45,180 | | | | 2,127,074 | | |
Constellation Brands, Inc., Class A(a) | | | 31,167 | | | | 2,525,462 | | |
Dr. Pepper Snapple Group, Inc. | | | 37,549 | | | | 1,956,678 | | |
Molson Coors Brewing Co., Class B | | | 29,569 | | | | 1,680,406 | | |
Monster Beverage Corp.(a) | | | 25,428 | | | | 1,881,672 | | |
PepsiCo, Inc. | | | 287,037 | | | | 22,983,053 | | |
Total | | | | | 65,382,508 | | |
Food & Staples Retailing 2.3% | |
Costco Wholesale Corp. | | | 81,798 | | | | 9,554,006 | | |
CVS Caremark Corp. | | | 222,758 | | | | 16,292,520 | | |
Kroger Co. (The) | | | 97,382 | | | | 4,084,201 | | |
Safeway, Inc. | | | 46,176 | | | | 1,729,291 | | |
SYSCO Corp. | | | 108,849 | | | | 3,920,741 | | |
Wal-Mart Stores, Inc. | | | 302,801 | | | | 22,619,235 | | |
Walgreen Co. | | | 162,972 | | | | 11,073,948 | | |
Whole Foods Market, Inc. | | | 69,635 | | | | 3,763,772 | | |
Total | | | | | 73,037,714 | | |
Food Products 1.5% | |
Archer-Daniels-Midland Co. | | | 123,147 | | | | 4,999,768 | | |
Campbell Soup Co. | | | 33,606 | | | | 1,455,476 | | |
ConAgra Foods, Inc. | | | 78,952 | | | | 2,242,237 | | |
General Mills, Inc. | | | 118,729 | | | | 5,940,012 | | |
Hershey Co. (The) | | | 28,053 | | | | 2,968,569 | | |
Hormel Foods Corp. | | | 25,187 | | | | 1,195,123 | | |
JM Smucker Co. (The) | | | 19,691 | | | | 1,969,297 | | |
Kellogg Co. | | | 48,139 | | | | 2,921,556 | | |
Kraft Foods Group, Inc. | | | 111,533 | | | | 6,164,429 | | |
McCormick & Co., Inc. | | | 24,703 | | | | 1,640,279 | | |
Mead Johnson Nutrition Co. | | | 37,828 | | | | 3,084,873 | | |
Mondelez International, Inc., Class A | | | 328,237 | | | | 11,169,905 | | |
Tyson Foods, Inc., Class A | | | 50,857 | | | | 2,006,309 | | |
Total | | | | | 47,757,833 | | |
Household Products 1.9% | |
Clorox Co. (The) | | | 24,174 | | | | 2,109,907 | | |
Colgate-Palmolive Co. | | | 164,525 | | | | 10,337,106 | | |
Kimberly-Clark Corp. | | | 71,429 | | | | 7,882,190 | | |
Procter & Gamble Co. (The) | | | 508,755 | | | | 40,018,668 | | |
Total | | | | | 60,347,871 | | |
The accompanying Notes to Financial Statements are an integral part of this statement.
Annual Report 2014
8
Columbia Large Cap Index Fund
Portfolio of Investments (continued)
February 28, 2014
Common Stocks (continued)
Issuer | | Shares | | Value ($) | |
Personal Products 0.1% | |
Avon Products, Inc. | | | 81,189 | | | | 1,255,994 | | |
Estee Lauder Companies, Inc. (The),
Class A | | | 47,928 | | | | 3,299,363 | | |
Total | | | | | 4,555,357 | | |
Tobacco 1.4% | |
Altria Group, Inc. | | | 374,313 | | | | 13,572,589 | | |
Lorillard, Inc. | | | 68,941 | | | | 3,382,245 | | |
Philip Morris International, Inc. | | | 299,857 | | | | 24,261,430 | | |
Reynolds American, Inc. | | | 58,690 | | | | 2,983,213 | | |
Total | | | | | 44,199,477 | | |
Total Consumer Staples | | | | | 295,280,760 | | |
Energy 9.8% | |
Energy Equipment & Services 1.9% | |
Baker Hughes, Inc. | | | 82,977 | | | | 5,250,785 | | |
Cameron International Corp.(a) | | | 44,511 | | | | 2,851,375 | | |
Diamond Offshore Drilling, Inc. | | | 13,008 | | | | 615,278 | | |
Ensco PLC, Class A | | | 43,695 | | | | 2,300,979 | | |
FMC Technologies, Inc.(a) | | | 44,261 | | | | 2,223,673 | | |
Halliburton Co. | | | 158,772 | | | | 9,050,004 | | |
Helmerich & Payne, Inc. | | | 20,038 | | | | 1,978,752 | | |
Nabors Industries Ltd. | | | 48,612 | | | | 1,119,048 | | |
National Oilwell Varco, Inc. | | | 80,107 | | | | 6,171,443 | | |
Noble Corp. PLC | | | 47,450 | | | | 1,473,323 | | |
Rowan Companies PLC, Class A(a) | | | 23,270 | | | | 776,287 | | |
Schlumberger Ltd. | | | 246,485 | | | | 22,923,105 | | |
Transocean Ltd. | | | 63,460 | | | | 2,690,704 | | |
Total | | | | | 59,424,756 | | |
Oil, Gas & Consumable Fuels 7.9% | |
Anadarko Petroleum Corp. | | | 94,209 | | | | 7,928,629 | | |
Apache Corp. | | | 74,725 | | | | 5,924,945 | | |
Cabot Oil & Gas Corp. | | | 78,803 | | | | 2,758,105 | | |
Chesapeake Energy Corp. | | | 94,585 | | | | 2,450,697 | | |
Chevron Corp. | | | 359,930 | | | | 41,510,727 | | �� |
ConocoPhillips | | | 229,314 | | | | 15,249,381 | | |
CONSOL Energy, Inc. | | | 42,873 | | | | 1,719,207 | | |
Denbury Resources, Inc. | | | 68,608 | | | | 1,122,427 | | |
Devon Energy Corp. | | | 71,419 | | | | 4,600,812 | | |
Common Stocks (continued)
Issuer | | Shares | | Value ($) | |
EOG Resources, Inc. | | | 51,072 | | | | 9,674,058 | | |
EQT Corp. | | | 28,200 | | | | 2,884,578 | | |
Exxon Mobil Corp.(b) | | | 817,614 | | | | 78,711,796 | | |
Hess Corp. | | | 53,247 | | | | 4,261,357 | | |
Kinder Morgan Management LLC(c) | | | 1 | | | | 42 | | |
Kinder Morgan, Inc. | | | 126,012 | | | | 4,013,482 | | |
Marathon Oil Corp. | | | 130,380 | | | | 4,367,730 | | |
Marathon Petroleum Corp. | | | 56,340 | | | | 4,732,560 | | |
Murphy Oil Corp. | | | 32,888 | | | | 1,952,561 | | |
Newfield Exploration Co.(a) | | | 25,490 | | | | 718,563 | | |
Noble Energy, Inc. | | | 67,265 | | | | 4,625,141 | | |
Occidental Petroleum Corp. | | | 150,859 | | | | 14,560,911 | | |
ONEOK, Inc. | | | 38,632 | | | | 2,284,697 | | |
Peabody Energy Corp. | | | 50,497 | | | | 886,727 | | |
Phillips 66 | | | 112,190 | | | | 8,398,543 | | |
Pioneer Natural Resources Co. | | | 26,671 | | | | 5,365,672 | | |
QEP Resources, Inc. | | | 33,556 | | | | 970,775 | | |
Range Resources Corp. | | | 30,569 | | | | 2,630,463 | | |
Southwestern Energy Co.(a) | | | 65,650 | | | | 2,713,971 | | |
Spectra Energy Corp. | | | 125,421 | | | | 4,675,695 | | |
Tesoro Corp. | | | 24,883 | | | | 1,269,282 | | |
Valero Energy Corp. | | | 101,008 | | | | 4,846,364 | | |
Williams Companies, Inc. (The) | | | 127,935 | | | | 5,283,716 | | |
WPX Energy, Inc.(a) | | | 37,595 | | | | 662,424 | | |
Total | | | | | 253,756,038 | | |
Total Energy | | | | | 313,180,794 | | |
Financials 15.5% | |
Capital Markets 2.1% | |
Ameriprise Financial, Inc.(d) | | | 36,391 | | | | 3,966,255 | | |
Bank of New York Mellon Corp. (The) | | | 214,947 | | | | 6,878,304 | | |
BlackRock, Inc. | | | 23,787 | | | | 7,251,229 | | |
Charles Schwab Corp. (The) | | | 217,145 | | | | 5,756,514 | | |
E*TRADE Financial Corp.(a) | | | 53,739 | | | | 1,207,515 | | |
Franklin Resources, Inc. | | | 75,575 | | | | 4,024,369 | | |
Goldman Sachs Group, Inc. (The) | | | 78,891 | | | | 13,131,407 | | |
Invesco Ltd. | | | 82,988 | | | | 2,846,488 | | |
Legg Mason, Inc. | | | 19,879 | | | | 913,639 | | |
Morgan Stanley | | | 259,300 | | | | 7,986,440 | | |
The accompanying Notes to Financial Statements are an integral part of this statement.
Annual Report 2014
9
Columbia Large Cap Index Fund
Portfolio of Investments (continued)
February 28, 2014
Common Stocks (continued)
Issuer | | Shares | | Value ($) | |
Northern Trust Corp. | | | 42,047 | | | | 2,600,607 | | |
State Street Corp. | | | 82,171 | | | | 5,396,170 | | |
T. Rowe Price Group, Inc. | | | 48,850 | | | | 3,965,154 | | |
Total | | | | | 65,924,091 | | |
Commercial Banks 2.7% | |
BB&T Corp. | | | 131,957 | | | | 4,987,975 | | |
Comerica, Inc. | | | 34,255 | | | | 1,650,406 | | |
Fifth Third Bancorp | | | 165,223 | | | | 3,584,513 | | |
Huntington Bancshares, Inc. | | | 155,422 | | | | 1,481,172 | | |
KeyCorp | | | 167,830 | | | | 2,210,321 | | |
M&T Bank Corp. | | | 24,397 | | | | 2,844,446 | | |
PNC Financial Services Group, Inc. (The) | | | 99,585 | | | | 8,144,061 | | |
Regions Financial Corp. | | | 257,828 | | | | 2,743,290 | | |
SunTrust Banks, Inc. | | | 100,170 | | | | 3,774,406 | | |
U.S. Bancorp | | | 341,820 | | | | 14,062,475 | | |
Wells Fargo & Co. | | | 897,179 | | | | 41,647,049 | | |
Zions Bancorporation | | | 34,571 | | | | 1,078,615 | | |
Total | | | | | 88,208,729 | | |
Consumer Finance 1.0% | |
American Express Co. | | | 172,421 | | | | 15,738,589 | | |
Capital One Financial Corp. | | | 107,897 | | | | 7,922,877 | | |
Discover Financial Services | | | 89,659 | | | | 5,144,633 | | |
SLM Corp. | | | 81,664 | | | | 1,955,036 | | |
Total | | | | | 30,761,135 | | |
Diversified Financial Services 4.9% | |
Bank of America Corp. | | | 1,996,297 | | | | 32,998,789 | | |
Berkshire Hathaway, Inc., Class B(a) | | | 336,895 | | | | 39,005,703 | | |
Citigroup, Inc. | | | 567,651 | | | | 27,604,868 | | |
CME Group, Inc. | | | 59,011 | | | | 4,356,192 | | |
IntercontinentalExchange Group, Inc. | | | 21,521 | | | | 4,494,446 | | |
JPMorgan Chase & Co. | | | 703,582 | | | | 39,977,529 | | |
Leucadia National Corp. | | | 58,659 | | | | 1,638,932 | | |
McGraw Hill Financial, Inc. | | | 50,689 | | | | 4,037,886 | | |
Moody's Corp. | | | 35,416 | | | | 2,797,864 | | |
NASDAQ OMX Group, Inc. (The) | | | 21,653 | | | | 831,259 | | |
Total | | | | | 157,743,468 | | |
Insurance 2.8% | |
ACE Ltd. | | | 63,647 | | | | 6,229,132 | | |
Aflac, Inc. | | | 87,209 | | | | 5,588,353 | | |
Common Stocks (continued)
Issuer | | Shares | | Value ($) | |
Allstate Corp. (The) | | | 85,147 | | | | 4,620,076 | | |
American International Group, Inc. | | | 275,563 | | | | 13,714,770 | | |
Aon PLC | | | 56,354 | | | | 4,823,902 | | |
Assurant, Inc. | | | 13,609 | | | | 893,159 | | |
Chubb Corp. (The) | | | 47,105 | | | | 4,120,745 | | |
Cincinnati Financial Corp. | | | 27,585 | | | | 1,293,185 | | |
Genworth Financial, Inc., Class A(a) | | | 92,498 | | | | 1,437,419 | | |
Hartford Financial Services
Group, Inc. (The) | | | 83,693 | | | | 2,945,157 | | |
Lincoln National Corp. | | | 49,111 | | | | 2,461,934 | | |
Loews Corp. | | | 57,234 | | | | 2,488,534 | | |
Marsh & McLennan Companies, Inc. | | | 102,685 | | | | 4,945,310 | | |
MetLife, Inc. | | | 209,833 | | | | 10,632,238 | | |
Principal Financial Group, Inc. | | | 51,225 | | | | 2,323,054 | | |
Progressive Corp. (The) | | | 103,327 | | | | 2,530,478 | | |
Prudential Financial, Inc. | | | 86,643 | | | | 7,328,265 | | |
Torchmark Corp. | | | 16,931 | | | | 1,312,322 | | |
Travelers Companies, Inc. (The) | | | 68,164 | | | | 5,714,870 | | |
Unum Group | | | 48,897 | | | | 1,700,638 | | |
XL Group PLC | | | 52,925 | | | | 1,608,920 | | |
Total | | | | | 88,712,461 | | |
Real Estate Investment Trusts (REITs) 1.9% | |
American Tower Corp. | | | 73,843 | | | | 6,015,989 | | |
Apartment Investment & Management
Co., Class A | | | 27,334 | | | | 817,013 | | |
AvalonBay Communities, Inc. | | | 22,792 | | | | 2,939,484 | | |
Boston Properties, Inc. | | | 28,633 | | | | 3,219,208 | | |
Equity Residential | | | 62,715 | | | | 3,666,946 | | |
General Growth Properties, Inc. | | | 100,600 | | | | 2,215,212 | | |
HCP, Inc. | | | 85,408 | | | | 3,311,268 | | |
Health Care REIT, Inc. | | | 54,028 | | | | 3,173,605 | | |
Host Hotels & Resorts, Inc. | | | 141,550 | | | | 2,784,289 | | |
Kimco Realty Corp. | | | 76,701 | | | | 1,707,364 | | |
Macerich Co. (The) | | | 26,288 | | | | 1,580,698 | | |
Plum Creek Timber Co., Inc. | | | 33,091 | | | | 1,432,509 | | |
ProLogis, Inc. | | | 93,349 | | | | 3,845,045 | | |
Public Storage | | | 27,068 | | | | 4,574,492 | | |
Simon Property Group, Inc. | | | 58,090 | | | | 9,369,336 | | |
Ventas, Inc. | | | 55,023 | | | | 3,435,086 | | |
The accompanying Notes to Financial Statements are an integral part of this statement.
Annual Report 2014
10
Columbia Large Cap Index Fund
Portfolio of Investments (continued)
February 28, 2014
Common Stocks (continued)
Issuer | | Shares | | Value ($) | |
Vornado Realty Trust | | | 32,560 | | | | 3,135,203 | | |
Weyerhaeuser Co. | | | 109,051 | | | | 3,218,095 | | |
Total | | | | | 60,440,842 | | |
Real Estate Management & Development —% | |
CBRE Group, Inc., Class A(a) | | | 52,125 | | | | 1,456,894 | | |
Thrifts & Mortgage Finance 0.1% | |
Hudson City Bancorp, Inc. | | | 89,009 | | | | 845,585 | | |
People's United Financial, Inc. | | | 59,480 | | | | 842,832 | | |
Total | | | | | 1,688,417 | | |
Total Financials | | | | | 494,936,037 | | |
Health Care 13.3% | |
Biotechnology 2.6% | |
Alexion Pharmaceuticals, Inc.(a) | | | 36,713 | | | | 6,490,858 | | |
Amgen, Inc. | | | 141,163 | | | | 17,507,035 | | |
Biogen Idec, Inc.(a) | | | 44,205 | | | | 15,059,760 | | |
Celgene Corp.(a) | | | 77,104 | | | | 12,394,468 | | |
Gilead Sciences, Inc.(a) | | | 287,001 | | | | 23,760,813 | | |
Regeneron Pharmaceuticals, Inc.(a) | | | 14,724 | | | | 4,895,730 | | |
Vertex Pharmaceuticals, Inc.(a) | | | 43,750 | | | | 3,537,625 | | |
Total | | | | | 83,646,289 | | |
Health Care Equipment & Supplies 2.1% | |
Abbott Laboratories | | | 289,391 | | | | 11,511,974 | | |
Baxter International, Inc. | | | 101,574 | | | | 7,059,393 | | |
Becton Dickinson and Co. | | | 36,316 | | | | 4,184,330 | | |
Boston Scientific Corp.(a) | | | 249,924 | | | | 3,274,004 | | |
CareFusion Corp.(a) | | | 39,548 | | | | 1,602,880 | | |
Covidien PLC | | | 86,110 | | | | 6,195,615 | | |
CR Bard, Inc. | | | 14,591 | | | | 2,103,439 | | |
DENTSPLY International, Inc. | | | 26,708 | | | | 1,212,009 | | |
Edwards Lifesciences Corp.(a) | | | 20,466 | | | | 1,427,708 | | |
Intuitive Surgical, Inc.(a) | | | 7,142 | | | | 3,176,976 | | |
Medtronic, Inc. | | | 186,854 | | | | 11,072,968 | | |
St. Jude Medical, Inc. | | | 54,609 | | | | 3,676,278 | | |
Stryker Corp. | | | 55,238 | | | | 4,432,297 | | |
Varian Medical Systems, Inc.(a) | | | 19,803 | | | | 1,660,085 | | |
Zimmer Holdings, Inc. | | | 31,999 | | | | 3,002,786 | | |
Total | | | | | 65,592,742 | | |
Common Stocks (continued)
Issuer | | Shares | | Value ($) | |
Health Care Providers & Services 2.0% | |
Aetna, Inc. | | | 68,805 | | | | 5,002,812 | | |
AmerisourceBergen Corp. | | | 43,072 | | | | 2,922,435 | | |
Cardinal Health, Inc. | | | 63,926 | | | | 4,572,627 | | |
CIGNA Corp. | | | 51,755 | | | | 4,119,180 | | |
DaVita HealthCare Partners, Inc.(a) | | | 33,034 | | | | 2,270,427 | | |
Express Scripts Holding Co.(a) | | | 150,817 | | | | 11,358,028 | | |
Five Star Quality Care, Inc.(c)(e) | | | — | | | | 1 | | |
Humana, Inc. | | | 29,188 | | | | 3,282,483 | | |
Laboratory Corp. of America Holdings(a) | | | 16,358 | | | | 1,530,127 | | |
McKesson Corp. | | | 42,982 | | | | 7,609,963 | | |
Patterson Companies, Inc. | | | 15,582 | | | | 641,355 | | |
Quest Diagnostics, Inc. | | | 27,238 | | | | 1,443,614 | | |
Tenet Healthcare Corp.(a) | | | 18,585 | | | | 819,970 | | |
UnitedHealth Group, Inc. | | | 188,408 | | | | 14,558,286 | | |
WellPoint, Inc. | | | 55,284 | | | | 5,008,178 | | |
Total | | | | | 65,139,486 | | |
Health Care Technology 0.1% | |
Cerner Corp.(a) | | | 55,266 | | | | 3,391,675 | | |
Life Sciences Tools & Services 0.5% | |
Agilent Technologies, Inc. | | | 61,923 | | | | 3,525,276 | | |
PerkinElmer, Inc. | | | 21,020 | | | | 952,627 | | |
Thermo Fisher Scientific, Inc. | | | 74,150 | | | | 9,234,641 | | |
Waters Corp.(a) | | | 15,908 | | | | 1,772,151 | | |
Total | | | | | 15,484,695 | | |
Pharmaceuticals 6.0% | |
AbbVie, Inc. | | | 297,737 | | | | 15,157,791 | | |
Actavis PLC(a) | | | 32,554 | | | | 7,188,574 | | |
Allergan, Inc. | | | 55,640 | | | | 7,066,280 | | |
Bristol-Myers Squibb Co. | | | 308,190 | | | | 16,571,376 | | |
Eli Lilly & Co. | | | 185,543 | | | | 11,060,218 | | |
Forest Laboratories, Inc.(a) | | | 44,379 | | | | 4,330,059 | | |
Hospira, Inc.(a) | | | 31,033 | | | | 1,343,108 | | |
Johnson & Johnson | | | 528,074 | | | | 48,646,177 | | |
Merck & Co., Inc. | | | 546,858 | | | | 31,165,438 | | |
Mylan, Inc.(a) | | | 71,651 | | | | 3,981,646 | | |
Perrigo Co. PLC | | | 24,894 | | | | 4,093,569 | | |
The accompanying Notes to Financial Statements are an integral part of this statement.
Annual Report 2014
11
Columbia Large Cap Index Fund
Portfolio of Investments (continued)
February 28, 2014
Common Stocks (continued)
Issuer | | Shares | | Value ($) | |
Pfizer, Inc. | | | 1,212,997 | | | | 38,949,334 | | |
Zoetis, Inc. | | | 93,557 | | | | 2,902,138 | | |
Total | | | | | 192,455,708 | | |
Total Health Care | | | | | 425,710,595 | | |
Industrials 10.4% | |
Aerospace & Defense 2.7% | |
Boeing Co. (The) | | | 129,407 | | | | 16,683,150 | | |
General Dynamics Corp. | | | 62,618 | | | | 6,859,176 | | |
Honeywell International, Inc. | | | 146,882 | | | | 13,871,536 | | |
L-3 Communications Holdings, Inc. | | | 16,569 | | | | 1,912,063 | | |
Lockheed Martin Corp. | | | 50,357 | | | | 8,172,941 | | |
Northrop Grumman Corp. | | | 41,560 | | | | 5,030,007 | | |
Precision Castparts Corp. | | | 27,211 | | | | 7,017,173 | | |
Raytheon Co. | | | 59,789 | | | | 5,853,941 | | |
Rockwell Collins, Inc. | | | 25,312 | | | | 2,089,252 | | |
Textron, Inc. | | | 52,625 | | | | 2,089,212 | | |
United Technologies Corp. | | | 157,992 | | | | 18,488,224 | | |
Total | | | | | 88,066,675 | | |
Air Freight & Logistics 0.7% | |
CH Robinson Worldwide, Inc. | | | 28,377 | | | | 1,471,631 | | |
Expeditors International of Washington, Inc. | | | 38,473 | | | | 1,520,068 | | |
FedEx Corp. | | | 55,704 | | | | 7,427,014 | | |
United Parcel Service, Inc., Class B | | | 133,802 | | | | 12,814,218 | | |
Total | | | | | 23,232,931 | | |
Airlines 0.2% | |
Delta Air Lines, Inc. | | | 160,100 | | | | 5,316,921 | | |
Southwest Airlines Co. | | | 130,391 | | | | 2,925,974 | | |
Total | | | | | 8,242,895 | | |
Building Products 0.1% | |
Allegion PLC(a) | | | 16,732 | | | | 909,384 | | |
Masco Corp. | | | 66,811 | | | | 1,560,037 | | |
Total | | | | | 2,469,421 | | |
Commercial Services & Supplies 0.5% | |
ADT Corp. (The) | | | 37,437 | | | | 1,149,690 | | |
Cintas Corp. | | | 18,851 | | | | 1,143,502 | | |
Iron Mountain, Inc. | | | 31,849 | | | | 866,293 | | |
Pitney Bowes, Inc. | | | 37,821 | | | | 962,544 | | |
Republic Services, Inc. | | | 50,556 | | | | 1,724,465 | | |
Stericycle, Inc.(a) | | | 16,035 | | | | 1,827,990 | | |
Common Stocks (continued)
Issuer | | Shares | | Value ($) | |
Tyco International Ltd. | | | 87,085 | | | | 3,673,245 | | |
Waste Management, Inc. | | | 81,669 | | | | 3,389,264 | | |
Total | | | | | 14,736,993 | | |
Construction & Engineering 0.2% | |
Fluor Corp. | | | 30,597 | | | | 2,377,081 | | |
Jacobs Engineering Group, Inc.(a) | | | 24,662 | | | | 1,495,750 | | |
Quanta Services, Inc.(a) | | | 40,377 | | | | 1,421,674 | | |
Total | | | | | 5,294,505 | | |
Electrical Equipment 0.7% | |
AMETEK, Inc. | | | 45,815 | | | | 2,439,191 | | |
Eaton Corp. PLC | | | 88,786 | | | | 6,633,202 | | |
Emerson Electric Co. | | | 131,733 | | | | 8,596,895 | | |
Rockwell Automation, Inc. | | | 25,940 | | | | 3,186,470 | | |
Roper Industries, Inc. | | | 18,596 | | | | 2,521,989 | | |
Total | | | | | 23,377,747 | | |
Industrial Conglomerates 2.3% | |
3M Co. | | | 119,718 | | | | 16,129,606 | | |
Danaher Corp. | | | 112,222 | | | | 8,583,861 | | |
General Electric Co. | | | 1,893,561 | | | | 48,228,999 | | |
Total | | | | | 72,942,466 | | |
Machinery 1.7% | |
Caterpillar, Inc. | | | 119,101 | | | | 11,549,224 | | |
Cummins, Inc. | | | 32,602 | | | | 4,757,284 | | |
Deere & Co. | | | 71,648 | | | | 6,156,713 | | |
Dover Corp. | | | 31,910 | | | | 3,009,113 | | |
Flowserve Corp. | | | 26,104 | | | | 2,119,906 | | |
Illinois Tool Works, Inc. | | | 76,445 | | | | 6,306,712 | | |
Ingersoll-Rand PLC | | | 50,146 | | | | 3,065,926 | | |
Joy Global, Inc. | | | 19,906 | | | | 1,094,830 | | |
PACCAR, Inc. | | | 66,260 | | | | 4,362,558 | | |
Pall Corp. | | | 20,729 | | | | 1,782,694 | | |
Parker Hannifin Corp. | | | 27,936 | | | | 3,367,685 | | |
Pentair Ltd. | | | 37,325 | | | | 3,016,233 | | |
Snap-On, Inc. | | | 10,903 | | | | 1,222,990 | | |
Stanley Black & Decker, Inc. | | | 29,049 | | | | 2,412,229 | | |
Xylem, Inc. | | | 34,510 | | | | 1,357,969 | | |
Total | | | | | 55,582,066 | | |
Professional Services 0.2% | |
Dun & Bradstreet Corp. (The) | | | 7,128 | | | | 707,169 | | |
Equifax, Inc. | | | 22,774 | | | | 1,595,546 | | |
The accompanying Notes to Financial Statements are an integral part of this statement.
Annual Report 2014
12
Columbia Large Cap Index Fund
Portfolio of Investments (continued)
February 28, 2014
Common Stocks (continued)
Issuer | | Shares | | Value ($) | |
Nielsen Holdings NV | | | 47,355 | | | | 2,241,786 | | |
Robert Half International, Inc. | | | 25,929 | | | | 1,061,533 | | |
Total | | | | | 5,606,034 | | |
Road & Rail 0.9% | |
CSX Corp. | | | 189,703 | | | | 5,256,670 | | |
Kansas City Southern | | | 20,637 | | | | 1,938,227 | | |
Norfolk Southern Corp. | | | 57,836 | | | | 5,315,707 | | |
Ryder System, Inc. | | | 9,831 | | | | 740,471 | | |
Union Pacific Corp. | | | 86,224 | | | | 15,553,085 | | |
Total | | | | | 28,804,160 | | |
Trading Companies & Distributors 0.2% | |
Fastenal Co. | | | 51,103 | | | | 2,411,551 | | |
WW Grainger, Inc. | | | 11,542 | | | | 2,943,441 | | |
Total | | | | | 5,354,992 | | |
Total Industrials | | | | | 333,710,885 | | |
Information Technology 18.3% | |
Communications Equipment 1.7% | |
Cisco Systems, Inc. | | | 1,000,674 | | | | 21,814,693 | | |
F5 Networks, Inc.(a) | | | 14,533 | | | | 1,632,637 | | |
Harris Corp. | | | 20,023 | | | | 1,478,098 | | |
Juniper Networks, Inc.(a) | | | 94,526 | | | | 2,527,625 | | |
Motorola Solutions, Inc. | | | 43,101 | | | | 2,853,286 | | |
QUALCOMM, Inc. | | | 316,219 | | | | 23,808,129 | | |
Total | | | | | 54,114,468 | | |
Computers & Peripherals 3.8% | |
Apple, Inc. | | | 168,397 | | | | 88,617,237 | | |
EMC Corp. | | | 385,143 | | | | 10,156,221 | | |
Hewlett-Packard Co. | | | 359,693 | | | | 10,747,627 | | |
NetApp, Inc. | | | 63,794 | | | | 2,577,916 | | |
SanDisk Corp. | | | 42,275 | | | | 3,141,032 | | |
Seagate Technology PLC | | | 61,041 | | | | 3,185,730 | | |
Western Digital Corp. | | | 39,406 | | | | 3,427,928 | | |
Total | | | | | 121,853,691 | | |
Electronic Equipment, Instruments & Components 0.4% | |
Amphenol Corp., Class A | | | 29,634 | | | | 2,608,385 | | |
Corning, Inc. | | | 270,865 | | | | 5,219,569 | | |
FLIR Systems, Inc. | | | 26,519 | | | | 905,359 | | |
Jabil Circuit, Inc. | | | 34,599 | | | | 640,427 | | |
TE Connectivity Ltd. | | | 76,821 | | | | 4,500,174 | | |
Total | | | | | 13,873,914 | | |
Common Stocks (continued)
Issuer | | Shares | | Value ($) | |
Internet Software & Services 3.4% | |
Akamai Technologies, Inc.(a) | | | 33,497 | | | | 2,047,672 | | |
eBay, Inc.(a) | | | 218,048 | | | | 12,814,681 | | |
Facebook, Inc., Class A(a) | | | 307,850 | | | | 21,075,411 | | |
Google, Inc., Class A(a) | | | 52,534 | | | | 63,862,957 | | |
VeriSign, Inc.(a) | | | 24,107 | | | | 1,328,537 | | |
Yahoo!, Inc.(a) | | | 176,569 | | | | 6,827,923 | | |
Total | | | | | 107,957,181 | | |
IT Services 3.6% | |
Accenture PLC, Class A | | | 118,997 | | | | 9,918,400 | | |
Alliance Data Systems Corp.(a) | | | 9,100 | | | | 2,594,501 | | |
Automatic Data Processing, Inc. | | | 90,090 | | | | 7,007,200 | | |
Cognizant Technology Solutions Corp.,
Class A(a) | | | 56,626 | | | | 5,892,502 | | |
Computer Sciences Corp. | | | 27,563 | | | | 1,741,982 | | |
Fidelity National Information Services, Inc. | | | 54,513 | | | | 3,031,468 | | |
Fiserv, Inc.(a) | | | 48,264 | | | | 2,801,725 | | |
International Business Machines Corp. | | | 191,012 | | | | 35,369,692 | | |
MasterCard, Inc., Class A | | | 193,850 | | | | 15,066,022 | | |
Paychex, Inc. | | | 60,814 | | | | 2,539,593 | | |
Teradata Corp.(a) | | | 30,558 | | | | 1,403,223 | | |
Total System Services, Inc. | | | 31,272 | | | | 952,545 | | |
Visa, Inc., Class A | | | 95,306 | | | | 21,533,438 | | |
Western Union Co. (The) | | | 103,369 | | | | 1,729,363 | | |
Xerox Corp. | | | 216,595 | | | | 2,380,379 | | |
Total | | | | | 113,962,033 | | |
Semiconductors & Semiconductor Equipment 2.0% | |
Altera Corp. | | | 60,082 | | | | 2,181,578 | | |
Analog Devices, Inc. | | | 58,204 | | | | 2,957,927 | | |
Applied Materials, Inc. | | | 225,382 | | | | 4,273,243 | | |
Broadcom Corp., Class A | | | 101,016 | | | | 3,002,196 | | |
First Solar, Inc.(a) | | | 13,225 | | | | 754,751 | | |
Intel Corp. | | | 930,390 | | | | 23,036,456 | | |
KLA-Tencor Corp. | | | 31,194 | | | | 2,032,289 | | |
Lam Research Corp.(a) | | | 30,369 | | | | 1,570,988 | | |
Linear Technology Corp. | | | 43,823 | | | | 2,052,669 | | |
LSI Corp. | | | 102,014 | | | | 1,131,335 | | |
Microchip Technology, Inc. | | | 37,135 | | | | 1,691,499 | | |
Micron Technology, Inc.(a) | | | 196,886 | | | | 4,762,672 | | |
NVIDIA Corp. | | | 108,294 | | | | 1,990,444 | | |
The accompanying Notes to Financial Statements are an integral part of this statement.
Annual Report 2014
13
Columbia Large Cap Index Fund
Portfolio of Investments (continued)
February 28, 2014
Common Stocks (continued)
Issuer | | Shares | | Value ($) | |
Texas Instruments, Inc. | | | 204,879 | | | | 9,211,360 | | |
Xilinx, Inc. | | | 50,241 | | | | 2,622,580 | | |
Total | | | | | 63,271,987 | | |
Software 3.4% | |
Adobe Systems, Inc.(a) | | | 87,033 | | | | 5,971,334 | | |
Autodesk, Inc.(a) | | | 42,233 | | | | 2,215,543 | | |
CA, Inc. | | | 60,814 | | | | 2,037,269 | | |
Citrix Systems, Inc.(a) | | | 34,902 | | | | 2,095,865 | | |
Electronic Arts, Inc.(a) | | | 57,851 | | | | 1,653,960 | | |
Intuit, Inc. | | | 53,308 | | | | 4,166,020 | | |
Microsoft Corp. | | | 1,421,817 | | | | 54,469,809 | | |
Oracle Corp. | | | 656,785 | | | | 25,686,861 | | |
Red Hat, Inc.(a) | | | 35,461 | | | | 2,091,845 | | |
Salesforce.com, Inc.(a) | | | 103,842 | | | | 6,476,626 | | |
Symantec Corp. | | | 130,290 | | | | 2,798,629 | | |
Total | | | | | 109,663,761 | | |
Total Information Technology | | | | | 584,697,035 | | |
Materials 3.4% | |
Chemicals 2.5% | |
Air Products & Chemicals, Inc. | | | 39,520 | | | | 4,794,566 | | |
Airgas, Inc. | | | 12,433 | | | | 1,340,277 | | |
CF Industries Holdings, Inc. | | | 10,747 | | | | 2,696,422 | | |
Dow Chemical Co. (The) | | | 226,992 | | | | 11,056,780 | | |
Eastman Chemical Co. | | | 28,827 | | | | 2,520,345 | | |
Ecolab, Inc. | | | 50,758 | | | | 5,469,175 | | |
EI du Pont de Nemours & Co. | | | 173,312 | | | | 11,546,045 | | |
FMC Corp. | | | 24,965 | | | | 1,926,799 | | |
International Flavors & Fragrances, Inc. | | | 15,261 | | | | 1,431,329 | | |
LyondellBasell Industries NV, Class A | | | 81,748 | | | | 7,200,364 | | |
Monsanto Co. | | | 98,437 | | | | 10,830,039 | | |
Mosaic Co. (The) | | | 63,793 | | | | 3,116,926 | | |
PPG Industries, Inc. | | | 26,577 | | | | 5,257,462 | | |
Praxair, Inc. | | | 55,077 | | | | 7,180,389 | | |
Sherwin-Williams Co. (The) | | | 16,141 | | | | 3,235,948 | | |
Sigma-Aldrich Corp. | | | 22,389 | | | | 2,113,745 | | |
Total | | | | | 81,716,611 | | |
Construction Materials 0.1% | |
Vulcan Materials Co. | | | 24,329 | | | | 1,652,669 | | |
Common Stocks (continued)
Issuer | | Shares | | Value ($) | |
Containers & Packaging 0.2% | |
Avery Dennison Corp. | | | 18,089 | | | | 901,194 | | |
Ball Corp. | | | 27,077 | | | | 1,504,398 | | |
Bemis Co., Inc. | | | 19,284 | | | | 757,476 | | |
MeadWestvaco Corp. | | | 33,277 | | | | 1,245,558 | | |
Owens-Illinois, Inc.(a) | | | 30,892 | | | | 1,047,857 | | |
Sealed Air Corp. | | | 36,729 | | | | 1,250,255 | | |
Total | | | | | 6,706,738 | | |
Metals & Mining 0.5% | |
Alcoa, Inc. | | | 200,180 | | | | 2,350,113 | | |
Allegheny Technologies, Inc. | | | 20,213 | | | | 642,369 | | |
Cliffs Natural Resources, Inc. | | | 28,668 | | | | 574,220 | | |
Freeport-McMoRan Copper & Gold, Inc. | | | 194,281 | | | | 6,337,446 | | |
Newmont Mining Corp. | | | 93,181 | | | | 2,167,390 | | |
Nucor Corp. | | | 59,540 | | | | 2,991,290 | | |
United States Steel Corp. | | | 27,100 | | | | 656,362 | | |
Total | | | | | 15,719,190 | | |
Paper & Forest Products 0.1% | |
International Paper Co. | | | 83,020 | | | | 4,058,848 | | |
Total Materials | | | | | 109,854,056 | | |
Telecommunication Services 2.4% | |
Diversified Telecommunication Services 2.3% | |
AT&T, Inc. | | | 985,975 | | | | 31,482,182 | | |
CenturyLink, Inc. | | | 110,627 | | | | 3,458,200 | | |
Frontier Communications Corp. | | | 187,071 | | | | 912,906 | | |
Verizon Communications, Inc. | | | 771,476 | | | | 36,706,828 | | |
Windstream Holdings, Inc. | | | 111,578 | | | | 894,856 | | |
Total | | | | | 73,454,972 | | |
Wireless Telecommunication Services 0.1% | |
Crown Castle International Corp.(a) | | | 62,518 | | | | 4,745,116 | | |
Total Telecommunication Services | | | | | 78,200,088 | | |
Utilities 2.9% | |
Electric Utilities 1.6% | |
American Electric Power Co., Inc. | | | 91,215 | | | | 4,578,993 | | |
Duke Energy Corp. | | | 132,137 | | | | 9,365,871 | | |
Edison International | | | 60,996 | | | | 3,194,361 | | |
Entergy Corp. | | | 33,365 | | | | 2,129,354 | | |
Exelon Corp. | | | 160,403 | | | | 4,877,855 | | |
The accompanying Notes to Financial Statements are an integral part of this statement.
Annual Report 2014
14
Columbia Large Cap Index Fund
Portfolio of Investments (continued)
February 28, 2014
Common Stocks (continued)
Issuer | | Shares | | Value ($) | |
FirstEnergy Corp. | | | 78,287 | | | | 2,409,674 | | |
NextEra Energy, Inc. | | | 80,583 | | | | 7,364,480 | | |
Northeast Utilities | | | 58,956 | | | | 2,620,594 | | |
Pepco Holdings, Inc. | | | 46,769 | | | | 953,620 | | |
Pinnacle West Capital Corp. | | | 20,589 | | | | 1,145,778 | | |
PPL Corp. | | | 117,966 | | | | 3,809,122 | | |
Southern Co. (The) | | | 165,052 | | | | 6,989,952 | | |
Xcel Energy, Inc. | | | 93,161 | | | | 2,821,847 | | |
Total | | | | | 52,261,501 | | |
Gas Utilities 0.1% | |
AGL Resources, Inc. | | | 22,233 | | | | 1,045,840 | | |
Independent Power Producers & Energy Traders 0.1% | |
AES Corp. (The) | | | 122,873 | | | | 1,677,217 | | |
NRG Energy, Inc. | | | 60,518 | | | | 1,759,258 | | |
Total | | | | | 3,436,475 | | |
Multi-Utilities 1.1% | |
Ameren Corp. | | | 45,419 | | | | 1,835,382 | | |
CenterPoint Energy, Inc. | | | 80,209 | | | | 1,896,943 | | |
CMS Energy Corp. | | | 49,766 | | | | 1,414,847 | | |
Consolidated Edison, Inc. | | | 54,809 | | | | 3,072,044 | | |
Dominion Resources, Inc. | | | 108,625 | | | | 7,538,575 | | |
DTE Energy Co. | | | 33,107 | | | | 2,375,758 | | |
Common Stocks (continued)
Issuer | | Shares | | Value ($) | |
Integrys Energy Group, Inc. | | | 14,917 | | | | 854,297 | | |
NiSource, Inc. | | | 58,652 | | | | 2,042,263 | | |
PG&E Corp. | | | 84,099 | | | | 3,705,402 | | |
Public Service Enterprise Group, Inc. | | | 94,690 | | | | 3,471,335 | | |
SCANA Corp. | | | 26,286 | | | | 1,301,157 | | |
Sempra Energy | | | 42,553 | | | | 4,019,982 | | |
TECO Energy, Inc. | | | 38,220 | | | | 641,332 | | |
Wisconsin Energy Corp. | | | 42,405 | | | | 1,864,124 | | |
Total | | | | | 36,033,441 | | |
Total Utilities | | | | | 92,777,257 | | |
Total Common Stocks
(Cost: $2,115,099,448) | | | | | 3,117,567,405 | | |
Money Market Funds 1.3%
| | | Shares | | Value ($) | |
Columbia Short-Term Cash Fund,
0.098%(d)(f) | | | 42,522,199 | | | | 42,522,199 | | |
Total Money Market Funds
(Cost: $42,522,199) | | | | | 42,522,199 | | |
Total Investments
(Cost: $2,157,621,647) | | | | | 3,160,089,604 | | |
Other Assets & Liabilities, Net | | | | | 43,426,435 | | |
Net Assets | | | | | 3,203,516,039 | | |
Investments in Derivatives
Futures Contracts Outstanding at February 28, 2014
At February 28, 2014, securities totaling $5,006,040 were pledged as collateral to cover initial margin requirements on open futures contracts.
Contract Description | | Number of
Contracts
Long (Short) | | Trading
Currency | | Notional
Market
Value ($) | | Expiration
Date | | Unrealized
Appreciation ($) | | Unrealized
Depreciation ($) | |
S&P 500 | | | 175 | | | USD | | | | | 81,270,000 | | | 03/2014 | | | 636,044 | | | | — | | |
Notes to Portfolio of Investments
(a) Non-income producing.
(b) This security, or a portion of this security, has been pledged as collateral in connection with open futures contracts. These values are denoted within the Investments in Derivatives section of the Portfolio of Investments.
The accompanying Notes to Financial Statements are an integral part of this statement.
Annual Report 2014
15
Columbia Large Cap Index Fund
Portfolio of Investments (continued)
February 28, 2014
Notes to Portfolio of Investments (continued)
(c) Identifies issues considered by the Investment Manager to be illiquid as to their marketability. The aggregate value of such securities at February 28, 2014 was $43, representing less than 0.01% of net assets. Information concerning such security holdings at February 28, 2014 is as follows:
Security Description | | Acquisition Dates | | Cost ($) | |
Five Star Quality Care, Inc. | | 01/02/2002 | | | 2 | | |
Kinder Morgan Management LLC | | 09/26/2002 - 05/20/2008 | | | 14 | | |
(d) As defined in the Investment Company Act of 1940, an affiliated company is one in which the Fund owns 5% or more of its outstanding voting securities, or a company which is under common ownership or control with the Fund. Holdings and transactions in these affiliated companies during the year ended February 28, 2014, are as follows:
Issuer | | Beginning
Cost ($) | | Purchase
Cost ($) | | Proceeds
From Sales ($) | | Realized
Gain (Loss) ($) | | Ending
Cost ($) | | Dividends —
Affiliated
Issuers ($) | | Value ($) | |
Ameriprise Financial, Inc. | | | 1,159,328 | | | | 64,717 | | | | (123,278 | ) | | | 78,648 | | | | 1,179,415 | | | | 76,117 | | | | 3,966,255 | | |
Columbia Short-Term
Cash Fund | | | 57,654,389 | | | | 336,740,994 | | | | (351,873,184 | ) | | | — | | | | 42,522,199 | | | | 60,542 | | | | 42,522,199 | | |
Total | | | 58,813,717 | | | | 336,805,711 | | | | (351,996,462 | ) | | | 78,648 | | | | 43,701,614 | | | | 136,659 | | | | 46,488,454 | | |
(e) Represents fractional shares.
(f) The rate shown is the seven-day current annualized yield at February 28, 2014.
Currency Legend
USD US Dollar
Fair Value Measurements
Generally accepted accounting principles (GAAP) require disclosure regarding the inputs and valuation techniques used to measure fair value and any changes in valuation inputs or techniques. In addition, investments shall be disclosed by major category.
The Fund categorizes its fair value measurements according to a three-level hierarchy that maximizes the use of observable inputs and minimizes the use of unobservable inputs by prioritizing that the most observable input be used when available. Observable inputs are those that market participants would use in pricing an investment based on market data obtained from sources independent of the reporting entity. Unobservable inputs are those that reflect the Fund's assumptions about the information market participants would use in pricing an investment. An investment's level within the fair value hierarchy is based on the lowest level of any input that is deemed significant to the asset or liability's fair value measurement. The input levels are not necessarily an indication of the risk or liquidity associated with investments at that level. For example, certain U.S. government securities are generally high quality and liquid, however, they are reflected as Level 2 because the inputs used to determine fair value may not always be quoted prices in an active market.
Fair value inputs are summarized in the three broad levels listed below:
> Level 1 — Valuations based on quoted prices for investments in active markets that the Fund has the ability to access at the measurement date (including NAV for open-end mutual funds). Valuation adjustments are not applied to Level 1 investments.
> Level 2 — Valuations based on other significant observable inputs (including quoted prices for similar securities, interest rates, prepayment speeds, credit risks, etc.).
> Level 3 — Valuations based on significant unobservable inputs (including the Fund's own assumptions and judgment in determining the fair value of investments).
Inputs that are used in determining fair value of an investment may include price information, credit data, volatility statistics, and other factors. These inputs can be either observable or unobservable. The availability of observable inputs can vary between investments, and is affected by various factors such as the type of investment, and the volume and level of activity for that investment or similar investments in the marketplace. The inputs will be considered by the Investment Manager, along with any other relevant factors in the calculation of an investment's fair value. The Fund uses prices and inputs that are current as of the measurement date, which may include periods of market dislocations. During these periods, the availability of prices and inputs may be reduced for many investments. This condition could cause an investment to be reclassified between the various levels within the hierarchy.
The accompanying Notes to Financial Statements are an integral part of this statement.
Annual Report 2014
16
Columbia Large Cap Index Fund
Portfolio of Investments (continued)
February 28, 2014
Fair Value Measurements (continued)
Investments falling into the Level 3 category are primarily supported by quoted prices from brokers and dealers participating in the market for those investments. However, these may be classified as Level 3 investments due to lack of market transparency and corroboration to support these quoted prices. Additionally, valuation models may be used as the pricing source for any remaining investments classified as Level 3. These models may rely on one or more significant unobservable inputs and/or significant assumptions by the Investment Manager. Inputs used in valuations may include, but are not limited to, financial statement analysis, capital account balances, discount rates and estimated cash flows, and comparable company data.
Under the direction of the Fund's Board of Trustees (the Board), the Investment Manager's Valuation Committee (the Committee) is responsible for overseeing the valuation procedures approved by the Board. The Committee consists of voting and non-voting members from various groups within the Investment Manager's organization, including operations and accounting, trading and investments, compliance, risk management and legal.
The Committee meets at least monthly to review and approve valuation matters, which may include a description of specific valuation determinations, data regarding pricing information received from approved pricing vendors and brokers and the results of Board-approved valuation control policies and procedures (the Policies). The Policies address, among other things, instances when market quotations are or are not readily available, including recommendations of third party pricing vendors and a determination of appropriate pricing methodologies; events that require specific valuation determinations and assessment of fair value techniques; securities with a potential for stale pricing, including those that are illiquid, restricted, or in default; and the effectiveness of third party pricing vendors, including periodic reviews of vendors. The Committee meets more frequently, as needed, to discuss additional valuation matters, which may include the need to review back-testing results, review time-sensitive information or approve related valuation actions. The Committee reports to the Board, with members of the Committee meeting with the Board at each of its regularly scheduled meetings to discuss valuation matters and actions during the period, similar to those described earlier.
For investments categorized as Level 3, the Committee monitors information similar to that described above, which may include: (i) data specific to the issuer or comparable issuers, (ii) general market or specific sector news and (iii) quoted prices and specific or similar security transactions. The Committee considers this data and any changes from prior periods in order to assess the reasonableness of observable and unobservable inputs, any assumptions or internal models used to value those securities and changes in fair value. This data is also used to corroborate, when available, information received from approved pricing vendors and brokers. Various factors impact the frequency of monitoring this information (which may occur as often as daily). However, the Committee may determine that changes to inputs, assumptions and models are not required as a result of the monitoring procedures performed.
The accompanying Notes to Financial Statements are an integral part of this statement.
Annual Report 2014
17
Columbia Large Cap Index Fund
Portfolio of Investments (continued)
February 28, 2014
Fair Value Measurements (continued)
The following table is a summary of the inputs used to value the Fund's investments at February 28, 2014:
Description | | Level 1
Quoted Prices in Active
Markets for Identical
Assets ($) | | Level 2
Other Significant
Observable Inputs ($) | | Level 3
Significant
Unobservable Inputs ($) | | Total ($) | |
Equity Securities | |
Common Stocks | |
Consumer Discretionary | | | 389,219,898 | | | | — | | | | — | | | | 389,219,898 | | |
Consumer Staples | | | 295,280,760 | | | | — | | | | — | | | | 295,280,760 | | |
Energy | | | 313,180,752 | | | | 42 | | | | — | | | | 313,180,794 | | |
Financials | | | 494,936,037 | | | | — | | | | — | | | | 494,936,037 | | |
Health Care | | | 425,710,594 | | | | 1 | | | | — | | | | 425,710,595 | | |
Industrials | | | 333,710,885 | | | | — | | | | — | | | | 333,710,885 | | |
Information Technology | | | 584,697,035 | | | | — | | | | — | | | | 584,697,035 | | |
Materials | | | 109,854,056 | | | | — | | | | — | | | | 109,854,056 | | |
Telecommunication Services | | | 78,200,088 | | | | — | | | | — | | | | 78,200,088 | | |
Utilities | | | 92,777,257 | | | | — | | | | — | | | | 92,777,257 | | |
Total Equity Securities | | | 3,117,567,362 | | | | 43 | | | | — | | | | 3,117,567,405 | | |
Mutual Funds | |
Money Market Funds | | | 42,522,199 | | | | — | | | | — | | | | 42,522,199 | | |
Total Mutual Funds | | | 42,522,199 | | | | — | | | | — | | | | 42,522,199 | | |
Investments in Securities | | | 3,160,089,561 | | | | 43 | | | | — | | | | 3,160,089,604 | | |
Derivatives | |
Assets | |
Futures Contracts | | | 636,044 | | | | — | | | | — | | | | 636,044 | | |
Total | | | 3,160,725,605 | | | | 43 | | | | — | | | | 3,160,725,648 | | |
See the Portfolio of Investments for all investment classifications not indicated in the table.
The Fund's assets assigned to the Level 2 input category are generally valued using the market approach, in which a security's value is determined through reference to prices and information from market transactions for similar or identical assets.
There were no transfers of financial assets between levels during the period.
Derivative instruments are valued at unrealized appreciation (depreciation).
The accompanying Notes to Financial Statements are an integral part of this statement.
Annual Report 2014
18
Columbia Large Cap Index Fund
Statement of Assets and Liabilities
February 28, 2014
Assets | |
Investments, at value | |
Unaffiliated issuers (identified cost $2,113,920,033) | | $ | 3,113,601,150 | | |
Affiliated issuers (identified cost $43,701,614) | | | 46,488,454 | | |
Total investments (identified cost $2,157,621,647) | | | 3,160,089,604 | | |
Receivable for: | |
Capital shares sold | | | 38,833,074 | | |
Dividends | | | 6,868,192 | | |
Variation margin | | | 102,269 | | |
Expense reimbursement due from Investment Manager | | | 28 | | |
Total assets | | | 3,205,893,167 | | |
Liabilities | |
Payable for: | |
Capital shares purchased | | | 2,200,966 | | |
Variation margin | | | 1,278 | | |
Investment management fees | | | 8,655 | | |
Distribution and/or service fees | | | 5,214 | | |
Administration fees | | | 8,655 | | |
Compensation of board members | | | 150,917 | | |
Other expenses | | | 1,443 | | |
Total liabilities | | | 2,377,128 | | |
Net assets applicable to outstanding capital stock | | $ | 3,203,516,039 | | |
Represented by | |
Paid-in capital | | $ | 2,233,061,216 | | |
Undistributed net investment income | | | 8,262,504 | | |
Accumulated net realized loss | | | (40,911,682 | ) | |
Unrealized appreciation (depreciation) on: | |
Investments — unaffiliated issuers | | | 999,681,117 | | |
Investments — affiliated issuers | | | 2,786,840 | | |
Futures contracts | | | 636,044 | | |
Total — representing net assets applicable to outstanding capital stock | | $ | 3,203,516,039 | | |
The accompanying Notes to Financial Statements are an integral part of this statement.
Annual Report 2014
19
Columbia Large Cap Index Fund
Statement of Assets and Liabilities (continued)
February 28, 2014
Class A | |
Net assets | | $ | 796,430,220 | | |
Shares outstanding | | | 22,214,261 | | |
Net asset value per share | | $ | 35.85 | | |
Class B | |
Net assets | | $ | 261,170 | | |
Shares outstanding | | | 7,269 | | |
Net asset value per share | | $ | 35.93 | | |
Class I | |
Net assets | | $ | 3,717 | | |
Shares outstanding | | | 103 | | |
Net asset value per share(a) | | $ | 36.01 | | |
Class R5 | |
Net assets | | $ | 98,439,230 | | |
Shares outstanding | | | 2,700,807 | | |
Net asset value per share | | $ | 36.45 | | |
Class Z | |
Net assets | | $ | 2,308,381,702 | | |
Shares outstanding | | | 64,113,695 | | |
Net asset value per share | | $ | 36.00 | | |
(a) Net asset value per share rounds to this amount due to fractional shares outstanding.
The accompanying Notes to Financial Statements are an integral part of this statement.
Annual Report 2014
20
Columbia Large Cap Index Fund
Statement of Operations
Year Ended February 28, 2014
Net investment income | |
Income: | |
Dividends — unaffiliated issuers | | $ | 58,580,180 | | |
Dividends — affiliated issuers | | | 136,659 | | |
Interest | | | 1,394 | | |
Foreign taxes withheld | | | (5,478 | ) | |
Total income | | | 58,712,755 | | |
Expenses: | |
Investment management fees | | | 2,824,934 | | |
Distribution and/or service fees | |
Class A | | | 1,638,462 | | |
Class B | | | 2,793 | | |
Administration fees | | | 2,824,934 | | |
Compensation of board members | | | 76,770 | | |
Other | | | 13,586 | | |
Total expenses | | | 7,381,479 | | |
Fees waived or expenses reimbursed by Investment Manager and its affiliates | | | (90,356 | ) | |
Expense reductions | | | (8,770 | ) | |
Total net expenses | | | 7,282,353 | | |
Net investment income | | | 51,430,402 | | |
Realized and unrealized gain (loss) — net | |
Net realized gain (loss) on: | |
Investments — unaffiliated issuers | | | (8,797,068 | ) | |
Investments — affiliated issuers | | | 78,648 | | |
Futures contracts | | | 15,465,910 | | |
Net realized gain | | | 6,747,490 | | |
Net change in unrealized appreciation (depreciation) on: | |
Investments — unaffiliated issuers | | | 567,859,445 | | |
Investments — affiliated issuers | | | 1,397,867 | | |
Futures contracts | | | (1,830,784 | ) | |
Net change in unrealized appreciation (depreciation) | | | 567,426,528 | | |
Net realized and unrealized gain | | | 574,174,018 | | |
Net increase in net assets resulting from operations | | $ | 625,604,420 | | |
The accompanying Notes to Financial Statements are an integral part of this statement.
Annual Report 2014
21
Columbia Large Cap Index Fund
Statement of Changes in Net Assets
| | | Year Ended
February 28,
2014 | | Year Ended
February 28,
2013(a) | |
Operations | |
Net investment income | | $ | 51,430,402 | | | $ | 50,933,486 | | |
Net realized gain | | | 6,747,490 | | | | 747,045,567 | | |
Net change in unrealized appreciation (depreciation) | | | 567,426,528 | | | | (468,195,514 | ) | |
Net increase in net assets resulting from operations | | | 625,604,420 | | | | 329,783,539 | | |
Distributions to shareholders | |
Net investment income | |
Class A | | | (10,466,528 | ) | | | (10,203,246 | ) | |
Class B | | | (2,117 | ) | | | (7,896 | ) | |
Class I | | | (61 | ) | | | (66 | ) | |
Class R5 | | | (1,139,886 | ) | | | (50 | ) | |
Class Z | | | (37,934,014 | ) | | | (42,594,114 | ) | |
Total distributions to shareholders | | | (49,542,606 | ) | | | (52,805,372 | ) | |
Increase (decrease) in net assets from capital stock activity | | | 121,836,159 | | | | (1,393,088,952 | ) | |
Total increase (decrease) in net assets | | | 697,897,973 | | | | (1,116,110,785 | ) | |
Net assets at beginning of year | | | 2,505,618,066 | | | | 3,621,728,851 | | |
Net assets at end of year | | $ | 3,203,516,039 | | | $ | 2,505,618,066 | | |
Undistributed net investment income | | $ | 8,262,504 | | | $ | 6,887,066 | | |
(a) Class R5 shares are for the period from November 8, 2012 (commencement of operations) to February 28, 2013.
The accompanying Notes to Financial Statements are an integral part of this statement.
Annual Report 2014
22
Columbia Large Cap Index Fund
Statement of Changes in Net Assets (continued)
| | | Year Ended February 28, 2014 | | Year Ended February 28, 2013(a) | |
| | | Shares | | Dollars ($) | | Shares | | Dollars ($) | |
Capital stock activity | |
Class A shares | |
Subscriptions(b) | | | 9,195,065 | | | | 304,489,416 | | | | 6,742,663 | | | | 183,652,453 | | |
Distributions reinvested | | | 292,428 | | | | 9,969,572 | | | | 360,059 | | | | 9,790,803 | | |
Redemptions | | | (5,931,914 | ) | | | (194,976,467 | ) | | | (6,367,900 | ) | | | (171,641,000 | ) | |
Net increase | | | 3,555,579 | | | | 119,482,521 | | | | 734,822 | | | | 21,802,256 | | |
Class B shares | |
Subscriptions | | | 77 | | | | 2,589 | | | | 1,184 | | | | 31,844 | | |
Distributions reinvested | | | 58 | | | | 1,986 | | | | 212 | | | | 5,783 | | |
Redemptions(b) | | | (7,445 | ) | | | (229,990 | ) | | | (36,162 | ) | | | (975,990 | ) | |
Net decrease | | | (7,310 | ) | | | (225,415 | ) | | | (34,766 | ) | | | (938,363 | ) | |
Class R5 shares | |
Subscriptions | | | 2,961,184 | | | | 100,202,156 | | | | 92 | | | | 2,500 | | |
Distributions reinvested | | | 29,415 | | | | 1,037,128 | | | | — | | | | — | | |
Redemptions | | | (289,884 | ) | | | (10,149,666 | ) | | | — | | | | — | | |
Net increase | | | 2,700,715 | | | | 91,089,618 | | | | 92 | | | | 2,500 | | |
Class Z shares | |
Subscriptions | | | 12,109,711 | | | | 403,555,317 | | | | 17,960,330 | | | | 489,325,782 | | |
Distributions reinvested | | | 848,375 | | | | 29,003,243 | | | | 1,139,550 | | | | 31,077,280 | | |
Redemptions | | | (15,825,212 | ) | | | (521,069,125 | ) | | | (71,115,547 | ) | | | (1,934,358,407 | ) | |
Net decrease | | | (2,867,126 | ) | | | (88,510,565 | ) | | | (52,015,667 | ) | | | (1,413,955,345 | ) | |
Total net increase (decrease) | | | 3,381,858 | | | | 121,836,159 | | | | (51,315,519 | ) | | | (1,393,088,952 | ) | |
(a) Class R5 shares are for the period from November 8, 2012 (commencement of operations) to February 28, 2013.
(b) Includes conversions of Class B shares to Class A shares, if any.
The accompanying Notes to Financial Statements are an integral part of this statement.
Annual Report 2014
23
Columbia Large Cap Index Fund
The following tables are intended to help you understand the Fund's financial performance. Certain information reflects financial results for a single share of a class held for the periods shown. Per share net investment income (loss) amounts are calculated based on average shares outstanding during the period. Total return assumes reinvestment of all dividends and distributions, if any. Total return does not reflect payment of sales charges, if any, and is not annualized for periods of less than one year.
| | | | | Year Ended | | | |
| | | Year Ended February 28, | | February 29, | | Year Ended February 28, | |
Class A | | 2014 | | 2013 | | 2012 | | 2011 | | 2010 | |
Per share data | |
Net asset value, beginning of period | | $ | 29.16 | | | $ | 26.35 | | | $ | 25.62 | | | $ | 21.30 | | | $ | 14.14 | | |
Income from investment operations: | |
Net investment income | | | 0.53 | | | | 0.50 | | | | 0.42 | | | | 0.37 | | | | 0.34 | | |
Net realized and unrealized gain | | | 6.67 | | | | 2.88 | | | | 0.74 | | | | 4.30 | | | | 7.15 | | |
Total from investment operations | | | 7.20 | | | | 3.38 | | | | 1.16 | | | | 4.67 | | | | 7.49 | | |
Less distributions to shareholders: | |
Net investment income | | | (0.51 | ) | | | (0.57 | ) | | | (0.43 | ) | | | (0.35 | ) | | | (0.33 | ) | |
Total distributions to shareholders | | | (0.51 | ) | | | (0.57 | ) | | | (0.43 | ) | | | (0.35 | ) | | | (0.33 | ) | |
Proceeds from regulatory settlements | | | — | | | | — | | | | — | | | | — | | | | 0.00 | (a) | |
Net asset value, end of period | | $ | 35.85 | | | $ | 29.16 | | | $ | 26.35 | | | $ | 25.62 | | | $ | 21.30 | | |
Total return | | | 24.80 | % | | | 12.98 | % | | | 4.67 | % | | | 22.09 | % | | | 53.09 | % | |
Ratios to average net assets(b) | |
Total gross expenses | | | 0.45 | % | | | 0.45 | %(c) | | | 0.45 | % | | | 0.45 | % | | | 0.45 | %(c) | |
Total net expenses(d) | | | 0.45 | %(e) | | | 0.44 | %(c)(e) | | | 0.42 | %(e) | | | 0.39 | % | | | 0.39 | %(c) | |
Net investment income | | | 1.63 | % | | | 1.85 | % | | | 1.72 | % | | | 1.64 | % | | | 1.75 | % | |
Supplemental data | |
Net assets, end of period (in thousands) | | $ | 796,430 | | | $ | 544,128 | | | $ | 472,381 | | | $ | 383,538 | | | $ | 268,091 | | |
Portfolio turnover | | | 3 | % | | | 7 | % | | | 6 | % | | | 2 | % | | | 7 | % | |
Notes to Financial Highlights
(a) Rounds to zero.
(b) In addition to the fees and expenses which the Fund bears directly, the Fund indirectly bears a pro rata share of the fees and expenses of the acquired funds in which it invests. Such indirect expenses are not included in the reported expense ratios.
(c) Ratios include line of credit interest expense which rounds to less than 0.01%.
(d) Total net expenses include the impact of certain waivers/reimbursements made by the Investment Manager and certain of its affiliates, if applicable.
(e) The benefits derived from expense reductions had an impact of less than 0.01%.
The accompanying Notes to Financial Statements are an integral part of this statement.
Annual Report 2014
24
Columbia Large Cap Index Fund
Financial Highlights (continued)
| | | | | Year Ended | | | |
| | | Year Ended February 28, | | February 29, | | Year Ended February 28, | |
Class B | | 2014 | | 2013 | | 2012 | | 2011 | | 2010 | |
Per share data | |
Net asset value, beginning of period | | $ | 29.24 | | | $ | 26.44 | | | $ | 25.70 | | | $ | 21.37 | | | $ | 14.20 | | |
Income from investment operations: | |
Net investment income | | | 0.28 | | | | 0.28 | | | | 0.22 | | | | 0.20 | | | | 0.19 | | |
Net realized and unrealized gain | | | 6.69 | | | | 2.89 | | | | 0.76 | | | | 4.32 | | | | 7.18 | | |
Total from investment operations | | | 6.97 | | | | 3.17 | | | | 0.98 | | | | 4.52 | | | | 7.37 | | |
Less distributions to shareholders: | |
Net investment income | | | (0.28 | ) | | | (0.37 | ) | | | (0.24 | ) | | | (0.19 | ) | | | (0.20 | ) | |
Total distributions to shareholders | | | (0.28 | ) | | | (0.37 | ) | | | (0.24 | ) | | | (0.19 | ) | | | (0.20 | ) | |
Proceeds from regulatory settlements | | | — | | | | — | | | | — | | | | — | | | | 0.00 | (a) | |
Net asset value, end of period | | $ | 35.93 | | | $ | 29.24 | | | $ | 26.44 | | | $ | 25.70 | | | $ | 21.37 | | |
Total return | | | 23.88 | % | | | 12.08 | % | | | 3.90 | % | | | 21.22 | % | | | 51.94 | % | |
Ratios to average net assets(b) | |
Total gross expenses | | | 1.20 | % | | | 1.20 | %(c) | | | 1.20 | % | | | 1.20 | % | | | 1.20 | %(c) | |
Total net expenses(d) | | | 1.20 | %(e) | | | 1.18 | %(c)(e) | | | 1.17 | %(e) | | | 1.14 | % | | | 1.14 | %(c) | |
Net investment income | | | 0.86 | % | | | 1.04 | % | | | 0.90 | % | | | 0.87 | % | | | 1.01 | % | |
Supplemental data | |
Net assets, end of period (in thousands) | | $ | 261 | | | $ | 426 | | | $ | 1,305 | | | $ | 3,550 | | | $ | 3,769 | | |
Portfolio turnover | | | 3 | % | | | 7 | % | | | 6 | % | | | 2 | % | | | 7 | % | |
Notes to Financial Highlights
(a) Rounds to zero.
(b) In addition to the fees and expenses which the Fund bears directly, the Fund indirectly bears a pro rata share of the fees and expenses of the acquired funds in which it invests. Such indirect expenses are not included in the reported expense ratios.
(c) Ratios include line of credit interest expense which rounds to less than 0.01%.
(d) Total net expenses include the impact of certain waivers/reimbursements made by the Investment Manager and certain of its affiliates, if applicable.
(e) The benefits derived from expense reductions had an impact of less than 0.01%.
The accompanying Notes to Financial Statements are an integral part of this statement.
Annual Report 2014
25
Columbia Large Cap Index Fund
Financial Highlights (continued)
| | | | | Year Ended | |
| | | Year Ended February 28, | | February 29, | |
Class I | | 2014 | | 2013 | | 2012(a) | |
Per share data | |
Net asset value, beginning of period | | $ | 29.28 | | | $ | 26.45 | | | $ | 24.22 | | |
Income from investment operations: | |
Net investment income | | | 0.62 | | | | 0.57 | | | | 0.15 | | |
Net realized and unrealized gain | | | 6.70 | | | | 2.89 | | | | 2.49 | | |
Total from investment operations | | | 7.32 | | | | 3.46 | | | | 2.64 | | |
Less distributions to shareholders: | |
Net investment income | | | (0.59 | ) | | | (0.63 | ) | | | (0.41 | ) | |
Total distributions to shareholders | | | (0.59 | ) | | | (0.63 | ) | | | (0.41 | ) | |
Net asset value, end of period | | $ | 36.01 | | | $ | 29.28 | | | $ | 26.45 | | |
Total return | | | 25.12 | % | | | 13.28 | % | | | 11.08 | % | |
Ratios to average net assets(b) | |
Total gross expenses | | | 0.22 | % | | | 0.22 | %(c) | | | 0.15 | %(d) | |
Total net expenses(e) | | | 0.20 | % | | | 0.19 | %(c) | | | 0.15 | %(d) | |
Net investment income | | | 1.88 | % | | | 2.09 | % | | | 2.06 | %(d) | |
Supplemental data | |
Net assets, end of period (in thousands) | | $ | 4 | | | $ | 3 | | | $ | 3 | | |
Portfolio turnover | | | 3 | % | | | 7 | % | | | 6 | % | |
Notes to Financial Highlights
(a) For the period from November 16, 2011 (commencement of operations) to February 29, 2012.
(b) In addition to the fees and expenses which the Fund bears directly, the Fund indirectly bears a pro rata share of the fees and expenses of the acquired funds in which it invests. Such indirect expenses are not included in the reported expense ratios.
(c) Ratios include line of credit interest expense which rounds to less than 0.01%.
(d) Annualized.
(e) Total net expenses include the impact of certain waivers/reimbursements made by the Investment Manager and certain of its affiliates, if applicable.
The accompanying Notes to Financial Statements are an integral part of this statement.
Annual Report 2014
26
Columbia Large Cap Index Fund
Financial Highlights (continued)
| | | Year Ended February 28, | |
Class R5 | | 2014 | | 2013(a) | |
Per share data | |
Net asset value, beginning of period | | $ | 29.63 | | | $ | 27.28 | | |
Income from investment operations: | |
Net investment income | | | 0.68 | | | | 0.21 | | |
Net realized and unrealized gain | | | 6.74 | | | | 2.68 | | |
Total from investment operations | | | 7.42 | | | | 2.89 | | |
Less distributions to shareholders: | |
Net investment income | | | (0.60 | ) | | | (0.54 | ) | |
Total distributions to shareholders | | | (0.60 | ) | | | (0.54 | ) | |
Net asset value, end of period | | $ | 36.45 | | | $ | 29.63 | | |
Total return | | | 25.14 | % | | | 10.73 | % | |
Ratios to average net assets(b) | |
Total gross expenses | | | 0.20 | % | | | 0.14 | %(c) | |
Total net expenses(d) | | | 0.20 | % | | | 0.14 | %(c) | |
Net investment income | | | 1.96 | % | | | 2.48 | %(c) | |
Supplemental data | |
Net assets, end of period (in thousands) | | $ | 98,439 | | | $ | 3 | | |
Portfolio turnover | | | 3 | % | | | 7 | % | |
Notes to Financial Highlights
(a) For the period from November 8, 2012 (commencement of operations) to February 28, 2013.
(b) In addition to the fees and expenses which the Fund bears directly, the Fund indirectly bears a pro rata share of the fees and expenses of the acquired funds in which it invests. Such indirect expenses are not included in the reported expense ratios.
(c) Annualized.
(d) Total net expenses include the impact of certain waivers/reimbursements made by the Investment Manager and certain of its affiliates, if applicable.
The accompanying Notes to Financial Statements are an integral part of this statement.
Annual Report 2014
27
Columbia Large Cap Index Fund
Financial Highlights (continued)
| | | | | Year Ended | | | |
| | | Year Ended February 28, | | February 29, | | Year Ended February 28, | |
Class Z | | 2014 | | 2013 | | 2012 | | 2011 | | 2010 | |
Per share data | |
Net asset value, beginning of period | | $ | 29.28 | | | $ | 26.45 | | | $ | 25.72 | | | $ | 21.37 | | | $ | 14.18 | | |
Income from investment operations: | |
Net investment income | | | 0.62 | | | | 0.57 | | | | 0.48 | | | | 0.43 | | | | 0.38 | | |
Net realized and unrealized gain | | | 6.69 | | | | 2.89 | | | | 0.74 | | | | 4.33 | | | | 7.19 | | |
Total from investment operations | | | 7.31 | | | | 3.46 | | | | 1.22 | | | | 4.76 | | | | 7.57 | | |
Less distributions to shareholders: | |
Net investment income | | | (0.59 | ) | | | (0.63 | ) | | | (0.49 | ) | | | (0.41 | ) | | | (0.38 | ) | |
Total distributions to shareholders | | | (0.59 | ) | | | (0.63 | ) | | | (0.49 | ) | | | (0.41 | ) | | | (0.38 | ) | |
Proceeds from regulatory settlements | | | — | | | | — | | | | — | | | | — | | | | 0.00 | (a) | |
Net asset value, end of period | | $ | 36.00 | | | $ | 29.28 | | | $ | 26.45 | | | $ | 25.72 | | | $ | 21.37 | | |
Total return | | | 25.09 | % | | | 13.28 | % | | | 4.91 | % | | | 22.44 | % | | | 53.49 | % | |
Ratios to average net assets(b) | |
Total gross expenses | | | 0.20 | % | | | 0.20 | %(c) | | | 0.20 | % | | | 0.20 | % | | | 0.20 | %(c) | |
Total net expenses(d) | | | 0.20 | %(e) | | | 0.19 | %(c)(e) | | | 0.16 | %(e) | | | 0.14 | % | | | 0.14 | %(c) | |
Net investment income | | | 1.88 | % | | | 2.06 | % | | | 1.95 | % | | | 1.88 | % | | | 2.00 | % | |
Supplemental data | |
Net assets, end of period (in thousands) | | $ | 2,308,382 | | | $ | 1,961,058 | | | $ | 3,148,041 | | | $ | 3,050,979 | | | $ | 2,412,760 | | |
Portfolio turnover | | | 3 | % | | | 7 | % | | | 6 | % | | | 2 | % | | | 7 | % | |
Notes to Financial Highlights
(a) Rounds to zero.
(b) In addition to the fees and expenses which the Fund bears directly, the Fund indirectly bears a pro rata share of the fees and expenses of the acquired funds in which it invests. Such indirect expenses are not included in the reported expense ratios.
(c) Ratios include line of credit interest expense which rounds to less than 0.01%.
(d) Total net expenses include the impact of certain waivers/reimbursements made by the Investment Manager and certain of its affiliates, if applicable.
(e) The benefits derived from expense reductions had an impact of less than 0.01%.
The accompanying Notes to Financial Statements are an integral part of this statement.
Annual Report 2014
28
Columbia Large Cap Index Fund
Notes to Financial Statements
February 28, 2014
Note 1. Organization
Columbia Large Cap Index Fund (the Fund), a series of Columbia Funds Series Trust (the Trust), is a diversified fund. The Trust is registered under the Investment Company Act of 1940, as amended (the 1940 Act), as an open-end management investment company organized as a Delaware statutory trust.
Fund Shares
The Trust may issue an unlimited number of shares (without par value). The Fund offers Class A, Class B, Class I, Class R5 and Class Z shares. Although all share classes generally have identical voting, dividend and liquidation rights, each share class votes separately when required by law. Different share classes pay different distribution amounts to the extent the expenses of such share classes differ, and distributions in liquidation will be proportional to the net asset value of each share class. Each share class has its own expense structure and sales charges, as applicable.
Class A shares have no sales charge.
Class B shares may be subject to a maximum contingent deferred sales charge (CDSC) of 5.00% based upon the holding period after purchase. Class B shares will generally convert to Class A shares eight years after purchase. The Fund no longer accepts investments by new or existing investors in the Fund's Class B shares, except in connection with the reinvestment of any dividend and/or capital gain distributions in Class B shares of the Fund and exchanges by existing Class B shareholders of certain other funds within the Columbia Family of Funds.
Class I shares are not subject to sales charges and are available only to the Columbia Family of Funds.
Class R5 shares are not subject to sales charges and are generally available only to investors purchasing through authorized investment professionals and omnibus retirement plans.
Class Z shares are not subject to sales charges and are available only to certain eligible investors, which are subject to different investment minimums.
Note 2. Summary of Significant Accounting Policies
Use of Estimates
The preparation of financial statements in accordance with U.S. generally accepted accounting principles (GAAP) requires management to make certain estimates and assumptions that affect the reported amounts of assets and liabilities, the disclosure of contingent assets and liabilities at the date of the financial statements and the reported amounts
of revenue and expenses during the reporting period. Actual results could differ from those estimates.
The following is a summary of significant accounting policies consistently followed by the Fund in the preparation of its financial statements.
Security Valuation
All equity securities are valued at the close of business of the New York Stock Exchange (NYSE). Equity securities are valued at the last quoted sales price on the principal exchange or market on which they trade, except for securities traded on the NASDAQ Stock Market, which are valued at the NASDAQ official close price. Unlisted securities or listed securities for which there were no sales during the day are valued at the mean of the latest quoted bid and ask prices on such exchanges or markets.
Foreign equity securities are valued based on quotations from the principal market in which such securities are normally traded. If any foreign share prices are not readily available as a result of limited share activity the securities are valued at the mean of the latest quoted bid and ask prices on such exchanges or markets. Foreign currency exchange rates are generally determined at 4:00 p.m. Eastern (U.S.) time. However, many securities markets and exchanges outside the U.S. close prior to the close of the NYSE; therefore, the closing prices for securities in such markets or on such exchanges may not fully reflect events that occur after such close but before the close of the NYSE. In those situations, foreign securities will be fair valued pursuant to the policy adopted by the Board of Trustees (the Board), including utilizing a third party pricing service to determine these fair values. The third party pricing service takes into account multiple factors, including, but not limited to, movements in the U.S. securities markets, certain depositary receipts, futures contracts and foreign exchange rates that have occurred subsequent to the close of the foreign exchange or market, to determine a good faith estimate that reasonably reflects the current market conditions as of the close of the NYSE. The fair value of a security is likely to be different from the quoted or published price, if available.
Investments in open-end investment companies, including money market funds, are valued at net asset value.
Futures and options on futures contracts are valued based upon the settlement price established each day by the board of trade or exchange on which they are traded.
Investments for which market quotations are not readily available, or that have quotations which management believes are not reliable, are valued at fair value as determined in good faith under consistently applied procedures established by and
Annual Report 2014
29
Columbia Large Cap Index Fund
Notes to Financial Statements (continued)
February 28, 2014
under the general supervision of the Board. If a security or class of securities (such as foreign securities) is valued at fair value, such value is likely to be different from the last quoted market price for the security.
The determination of fair value often requires significant judgment. To determine fair value, management may use assumptions including but not limited to future cash flows and estimated risk premiums. Multiple inputs from various sources may be used to determine fair value.
Derivative Instruments
The Fund invests in certain derivative instruments, as detailed below, to meet its investment objectives. Derivatives are instruments whose values depend on, or are derived from, in whole or in part, the value of one or more other assets, such as securities, currencies, commodities or indices. Derivative instruments may be used to maintain cash reserves while maintaining exposure to certain other assets, to offset anticipated declines in values of investments, to facilitate trading, to reduce transaction costs and to pursue higher investment returns. The Fund may also use derivative instruments to mitigate certain investment risks, such as foreign currency exchange rate risk, interest rate risk and credit risk. Derivatives may involve various risks, including the potential inability of the counterparty to fulfill its obligation under the terms of the contract, the potential for an illiquid secondary market (making it difficult for the Fund to sell, including at favorable prices) and the potential for market movements which may expose the Fund to gains or losses in excess of the amount shown in the Statement of Assets and Liabilities. The notional amounts of derivative instruments, if applicable, are not recorded in the financial statements.
A derivative instrument may suffer a mark to market loss if the value of the contract decreases due to an unfavorable change in the market rates or values of the underlying instrument. Losses can also occur if the counterparty does not perform under the contract. The Fund's risk of loss from counterparty credit risk on over-the-counter derivatives is generally limited to the aggregate unrealized gain netted against any collateral held by the Fund and the amount of any initial margin held by the counterparty. With exchange traded or centrally cleared derivatives, there is minimal counterparty credit risk to the Fund since the exchange's clearinghouse, as counterparty to such instruments, guarantees against a possible default. The clearinghouse stands between the buyer and the seller of the contract; therefore, the counterparty credit risk is limited to failure of the clearinghouse. However, credit risk still exists in exchange traded or centrally cleared derivatives with respect to initial and variation margin that is held in a broker's customer accounts. While brokers are required to segregate customer
margin from their own assets, in the event that a broker becomes insolvent or goes into bankruptcy and at that time there is a shortfall in the aggregate amount of margin held by the broker for all its clients, U.S. bankruptcy laws will typically allocate that shortfall on a pro-rata basis across all the broker's customers, potentially resulting in losses to the Fund.
In order to better define its contractual rights and to secure rights that will help the Fund mitigate its counterparty risk, the Fund may enter into an International Swaps and Derivatives Association, Inc. Master Agreement (ISDA Master Agreement) or similar agreement with its derivative contract counterparties. An ISDA Master Agreement is an agreement between the Fund and a counterparty that governs over-the-counter derivatives and forward foreign currency exchange contracts and typically contains, among other things, collateral posting terms and netting provisions in the event of a default and/or termination event. Under an ISDA Master Agreement, the Fund may, under certain circumstances, offset with the counterparty certain derivative instrument's payables and/or receivables with collateral held and/or posted and create one single net payment. The provisions of the ISDA Master Agreement typically permit a single net payment in the event of default (close-out netting) including the bankruptcy or insolvency of the counterparty. Note, however, that bankruptcy or insolvency laws of a particular jurisdiction may impose restrictions on or prohibitions against the right of offset in bankruptcy, insolvency or other events.
Collateral (margin) requirements differ by type of derivative. Margin requirements are established by the exchange or clearinghouse for exchange traded and centrally cleared derivatives. Brokers can ask for margin in excess of the minimum in certain circumstances. Collateral terms are contract specific for over-the-counter derivatives. For over-the-counter derivatives traded under an ISDA Master Agreement, the collateral requirements are typically calculated by netting the mark to market amount for each transaction under such agreement and comparing that amount to the value of any variation margin currently pledged by the Fund and/or the counterparty. Generally, the amount of collateral due from or to a party has to exceed a minimum transfer amount threshold (e.g., $500,000) before a transfer has to be made. To the extent amounts due to the Fund from its counterparties are not fully collateralized, contractually or otherwise, the Fund bears the risk of loss from counterparty nonperformance. The Fund attempts to mitigate counterparty risk by only entering into agreements with counterparties that it believes have the financial resources to honor their obligations and by monitoring the financial stability of those counterparties.
Annual Report 2014
30
Columbia Large Cap Index Fund
Notes to Financial Statements (continued)
February 28, 2014
Certain ISDA Master Agreements allow counterparties to over-the-counter derivatives to terminate derivative contracts prior to maturity in the event the Fund's net assets decline by a stated percentage over a specified time period or the Fund fails to meet the terms of the ISDA Master Agreement, which would cause the Fund to accelerate payment of any net liability owed to the counterparty. The Fund also has termination rights if the counterparty fails to meet the terms of the ISDA Master Agreement. In addition to considering counterparty credit risk, the Fund would consider terminating the derivative contracts based on whether termination would result in a net liability owed from the counterparty.
For financial reporting purposes, the Fund does not offset derivative assets and derivative liabilities that are subject to netting arrangements in the Statement of Assets and Liabilities.
Futures Contracts
Futures contracts are exchange traded and represent commitments for the future purchase or sale of an asset at a specified price on a specified date. The Fund bought and sold futures contracts to maintain appropriate equity market exposure while keeping sufficient cash to accommodate daily redemptions. These instruments may be used for other purposes in future periods. Upon entering into futures contracts, the Fund bears risks that it may not achieve the anticipated benefits of the futures contracts and may realize a loss. Additional risks include counterparty credit risk, the possibility of an illiquid market, and that a change in the value of the contract or option may not correlate with changes in the value of the underlying asset.
Upon entering into a futures contract, the Fund pledges cash or securities with the broker in an amount sufficient to meet the initial margin requirement. The initial margin deposit must be maintained at an established level over the life of the contract. Cash deposited as initial margin is recorded in the Statement of Assets and Liabilities as margin deposits. Securities deposited as initial margin are designated in the Portfolio of Investments. Subsequent payments (variation margin) are made or received by the Fund each day. The variation margin payments are equal to the daily change in the contract value and are recorded as variation margin receivable or payable and are offset in unrealized gains or losses. The Fund recognizes a realized gain or loss when the contract is closed or expires. Futures contracts involve, to varying degrees, risk of loss in excess of the variation margin disclosed in the Statement of Assets and Liabilities.
Effects of Derivative Transactions in the Financial Statements
The following tables are intended to provide additional information about the effect of derivatives on the financial statements of the Fund, including: the fair value of derivatives by risk category and the location of those fair values in the Statement of Assets and Liabilities; the impact of derivative transactions over the period in the Statement of Operations including realized gains or losses and unrealized gains or losses. The derivative schedules following the Portfolio of Investments present additional information regarding derivative instruments outstanding at the end of the period, if any.
The following table is a summary of the fair value of derivative instruments at February 28, 2014:
Asset Derivatives | |
Risk Exposure
Category | | Statement of Assets and
Liabilities Location | | Fair Value ($) | |
Equity risk | | Net assets — unrealized
appreciation on futures
contracts | | | 636,044 | * | |
*Includes cumulative appreciation (depreciation) as reported in the tables following the Portfolio of Investments. Only the current day's variation margin is reported in receivables or payables in the Statement of Assets and Liabilities.
The following table indicates the effect of derivative instruments in the Statement of Operations for the year ended February 28, 2014:
Amount of Realized Gain (Loss) on Derivatives Recognized in Income | |
Risk Exposure Category | | Futures Contracts ($) | |
Equity risk | | | 15,465,910 | | |
Change in Unrealized Appreciation (Depreciation) on
Derivatives Recognized in Income | |
Risk Exposure Category | | Futures Contracts ($) | |
Equity risk | | | (1,830,784 | ) | |
The following table is a summary of the volume of derivative instruments for the year ended February 28, 2014:
Derivative Instrument | | Contracts Opened | |
Futures contracts | | | 1,361 | | |
Security Transactions
Security transactions are accounted for on the trade date. Cost is determined and gains (losses) are based upon the specific identification method for both financial statement and federal income tax purposes.
Annual Report 2014
31
Columbia Large Cap Index Fund
Notes to Financial Statements (continued)
February 28, 2014
Income Recognition
Corporate actions and dividend income are generally recorded net of any non-reclaimable tax withholdings, on the ex-dividend date or upon receipt of ex-dividend notification in the case of certain foreign securities.
The Fund may receive distributions from holdings in business development companies (BDCs), exchange traded funds (ETFs) and real estate investment trusts (REITs), which report information on the character of their distributions annually. These distributions are allocated to dividend income, capital gain and return of capital based on estimates made by the Fund's management if actual information has not yet been reported. Return of capital is recorded as a reduction of the cost basis of securities held. If the Fund no longer owns the applicable securities, return of capital is recorded as a realized gain. Management's estimates are subsequently adjusted when the actual character of the distributions is disclosed by the BDCs, ETFs and REITs, which could result in a proportionate change in return of capital to shareholders.
Awards from class action litigation are recorded as a reduction of cost basis if the Fund still owns the applicable securities on the payment date. If the Fund no longer owns the applicable securities, the proceeds are recorded as realized gains.
Expenses
General expenses of the Trust are allocated to the Fund and other funds of the Trust based upon relative net assets or other expense allocation methodologies determined by the nature of the expense. Expenses directly attributable to the Fund are charged to the Fund. Expenses directly attributable to a specific class of shares are charged to that share class.
Determination of Class Net Asset Value
All income, expenses (other than class-specific expenses, which are charged to that share class, as shown in the Statement of Operations) and realized and unrealized gains (losses) are allocated to each class of the Fund on a daily basis, based on the relative net assets of each class, for purposes of determining the net asset value of each class.
Federal Income Tax Status
The Fund intends to qualify each year as a regulated investment company under Subchapter M of the Internal Revenue Code, as amended, and will distribute substantially all of its taxable income (including net short-term capital gains), if any, for its tax year, and as such will not be subject to federal income taxes. In addition, the Fund intends to distribute in each calendar year substantially all of its net investment income, capital gains and certain other amounts, if any, such that the Fund should not be subject to federal excise tax. Therefore, no federal income or excise tax provision is recorded.
Foreign Taxes
The Fund may be subject to foreign taxes on income, gains on investments or currency repatriation, a portion of which may be recoverable. The Fund will accrue such taxes and recoveries, as applicable, based upon its current interpretation of tax rules and regulations that exist in the markets in which it invests.
Realized gains in certain countries may be subject to foreign taxes at the Fund level, based on statutory rates. The Fund accrues for such foreign taxes on realized and unrealized gains at the appropriate rate for each jurisdiction, as applicable. The amount, if any, is disclosed as a liability on the Statement of Assets and Liabilities.
Distributions to Shareholders
Distributions from net investment income, if any, are declared and paid semi-annually. Net realized capital gains, if any, are distributed at least annually. Income distributions and capital gain distributions are determined in accordance with federal income tax regulations, which may differ from GAAP.
Guarantees and Indemnifications
Under the Trust's organizational documents and, in some cases, by contract, its officers and trustees are indemnified against certain liabilities arising out of the performance of their duties to the Trust or its funds. In addition, certain of the Fund's contracts with its service providers contain general indemnification clauses. The Fund's maximum exposure under these arrangements is unknown since the amount of any future claims that may be made against the Fund cannot be determined, and the Fund has no historical basis for predicting the likelihood of any such claims.
Note 3. Fees and Compensation Paid to Affiliates
Investment Management Fees
Under an Investment Management Services Agreement, Columbia Management Investment Advisers, LLC (the Investment Manager), a wholly-owned subsidiary of Ameriprise Financial, Inc. (Ameriprise Financial), determines which securities will be purchased, held or sold. The investment management fee is an annual fee that is equal to 0.10% of the Fund's average daily net assets.
Administration Fees
Under an Administrative Services Agreement, the Investment Manager also serves as the Fund Administrator. The Fund pays the Fund Administrator an annual fee for administration and accounting services equal to 0.10% of the Fund's average daily net assets.
Annual Report 2014
32
Columbia Large Cap Index Fund
Notes to Financial Statements (continued)
February 28, 2014
The Investment Manager, from the administration fee it receives from the Fund, pays all operating expenses of the Fund, with the exception of brokerage fees and commissions, interest, fees and expenses of Trustees who are not officers, directors or employees of the Investment Manager or its affiliates, distribution and/or shareholder servicing and plan administration fees and any extraordinary non-recurring expenses that may arise, including litigation.
Other Expenses
Other expenses are for, among other things, miscellaneous expenses of the Fund or the Board, including payments to a company providing limited administrative services to the Fund and the Board. That company's expenses include boardroom and office expense, employee compensation, employee health and retirement benefits, and certain other expenses. For the year ended February 28, 2014, other expenses paid to this company were $7,675.
Compensation of Board Members
Board members are compensated for their services to the Fund as disclosed in the Statement of Operations. Under a Deferred Compensation Plan (the Plan), the Board members who are not "interested persons" of the Fund, as defined under the 1940 Act, may elect to defer payment of up to 100% of their compensation. Deferred amounts are treated as though equivalent dollar amounts had been invested in shares of certain funds managed by the Investment Manager. The Fund's liability for these amounts is adjusted for market value changes and remains in the Fund until distributed in accordance with the Plan.
Transfer Agent Fees
Under a Transfer and Dividend Disbursing Agent Agreement, Columbia Management Investment Services Corp. (the Transfer Agent), an affiliate of the Investment Manager and a wholly-owned subsidiary of Ameriprise Financial, is responsible for providing transfer agency services to the Fund. The Transfer Agent has contracted with Boston Financial Data Services (BFDS) to serve as sub-transfer agent.
The transfer agent fees are payable by the Investment Manager. The Transfer Agent pays the fees of BFDS for services as sub-transfer agent and is not entitled to reimbursement for such fees from the Fund. The Transfer Agent also receives compensation from fees for various shareholder services and reimbursements for certain out-of-pocket expenses.
An annual minimum account balance fee of $20 may apply to certain accounts with a value below the applicable share class's initial minimum investment requirements to reduce the impact of small accounts on transfer agent fees. These minimum account balance fees are recorded as part of expense
reductions in the Statement of Operations. For the year ended February 28, 2014, these minimum account balance fees reduced total expenses by $8,770.
Distribution and Service Fees
The Fund has an agreement with Columbia Management Investment Distributors, Inc. (the Distributor), an affiliate of the Investment Manager and a wholly-owned subsidiary of Ameriprise Financial, for distribution and shareholder services. The Board has approved, and the Fund has adopted, distribution and shareholder service plans (the Plans) applicable to certain share classes, which set the distribution and service fees for the Fund. These fees are calculated daily and are intended to compensate the Distributor and/or eligible selling and/or servicing agents for selling shares of the Fund and providing services to investors.
Under the Plans, the Fund pays a monthly combined distribution and service fee to the Distributor at the maximum annual rate of 0.25% of the average daily net assets attributable to Class A shares of the Fund. Also under the Plans, the Fund pays a monthly service fee at the maximum annual rate of 0.25% of the average daily net assets attributable to Class B shares of the Fund and the payment of a monthly distribution fee at the maximum annual rate of 0.75% of the average daily net assets attributable to Class B shares of the Fund.
Expenses Waived/Reimbursed by the Investment Manager and its Affiliates
The Investment Manager and certain of its affiliates have contractually agreed to waive fees and/or reimburse expenses (excluding certain fees and expenses described below) for the period disclosed below, unless sooner terminated at the sole discretion of the Board, so that the Fund's net operating expenses, after giving effect to fees waived/expenses reimbursed and any balance credits and/or overdraft charges from the Fund's custodian, do not exceed the following annual rates as a percentage of the class' average daily net assets:
| | | Fee Rates Contractual
through
June 30, 2014 | |
Class A | | | 0.45 | % | |
Class B | | | 1.20 | | |
Class I | | | 0.20 | | |
Class R5 | | | 0.20 | | |
Class Z | | | 0.20 | | |
Under the agreement governing these fee waivers and/or expense reimbursement arrangements, the following fees and expenses are excluded from the waiver/reimbursement commitment, and therefore will be paid by the Fund, if applicable: taxes (including foreign transaction taxes),
Annual Report 2014
33
Columbia Large Cap Index Fund
Notes to Financial Statements (continued)
February 28, 2014
expenses associated with investments in affiliated and non-affiliated pooled investment vehicles (including mutual funds and exchange traded funds), transaction costs and brokerage commissions, costs related to any securities lending program, dividend expenses associated with securities sold short, inverse floater program fees and expenses, transaction charges and interest on borrowed money, interest, extraordinary expenses and any other expenses the exclusion of which is specifically approved by the Board. This agreement may be modified or amended only with approval from all parties.
Note 4. Federal Tax Information
The timing and character of income and capital gain distributions are determined in accordance with income tax regulations, which may differ from GAAP because of temporary or permanent book to tax differences.
At February 28, 2014, these differences are primarily due to differing treatment for capital loss carryforwards, deferral/reversal of wash sales losses, Trustees' deferred compensation, post-October capital losses, re-characterization of distributions for investments and derivative investments. To the extent these differences are permanent, reclassifications are made among the components of the Fund's net assets in the Statement of Assets and Liabilities. Temporary differences do not require reclassifications. In the Statement of Assets and Liabilities the following reclassifications were made:
Undistributed net investment income | | $ | (512,358 | ) | |
Accumulated net realized loss | | | 512,361 | | |
Paid-in capital | | | (3 | ) | |
Net investment income and net realized gains (losses), as disclosed in the Statement of Operations, and net assets were not affected by this reclassification.
The tax character of distributions paid during the years indicated was as follows:
Year Ended February 28, | | 2014 | | 2013 | |
Ordinary income | | $ | 49,542,606 | | | $ | 52,805,372 | | |
Short-term capital gain distributions, if any, are considered ordinary income distributions for tax purposes.
At February 28, 2014, the components of distributable earnings on a tax basis were as follows:
Undistributed ordinary income | | $ | 8,386,531 | | |
Unrealized appreciation | | | 971,851,943 | | |
At February 28, 2014, the cost of investments for federal income tax purposes was $2,188,237,661 and the aggregate
gross unrealized appreciation and depreciation based on that cost was:
Unrealized appreciation | | $ | 1,152,307,007 | | |
Unrealized depreciation | | | (180,455,064 | ) | |
Net unrealized appreciation | | $ | 971,851,943 | | |
The following capital loss carryforward, determined at February 28, 2014, may be available to reduce taxable income arising from future net realized gains on investments, if any, to the extent permitted by the Internal Revenue Code:
Year of Expiration | | Amount | |
2017 | | $ | 189,279 | | |
For the year ended February 28, 2014, $12,571,370 of capital loss carryforward was utilized.
Under current tax rules, regulated investment companies can elect to treat certain late-year ordinary losses incurred and post-October capital losses (capital losses realized after October 31) as arising on the first day of the following taxable year. As of February 28, 2014, the Fund will elect to treat post-October capital losses of $9,470,345 as arising on March 1, 2014.
Management of the Fund has concluded that there are no significant uncertain tax positions that would require recognition in the financial statements. However, management's conclusion may be subject to review and adjustment at a later date based on factors including, but not limited to, new tax laws, regulations, and administrative interpretations (including relevant court decisions). Generally, the Fund's federal tax returns for the prior three fiscal years remain subject to examination by the Internal Revenue Service.
Note 5. Portfolio Information
The cost of purchases and proceeds from sales of securities, excluding short-term obligations, aggregated to $199,438,186 and $84,909,986, respectively, for the year ended February 28, 2014.
Note 6. Affiliated Money Market Fund
The Fund invests its daily cash balances in Columbia Short-Term Cash Fund, an affiliated money market fund established for the exclusive use by the Fund and other affiliated funds. The income earned by the Fund from such investments is included as "Dividends — affiliated issuers" in the Statement of Operations. As an investing fund, the Fund indirectly bears its proportionate share of the expenses of Columbia Short-Term Cash Fund.
Annual Report 2014
34
Columbia Large Cap Index Fund
Notes to Financial Statements (continued)
February 28, 2014
Note 7. Shareholder Concentration
At February 28, 2014, one unaffiliated shareholder account owned 15.7% of the outstanding shares of the Fund. The Fund has no knowledge about whether any portion of those shares was owned beneficially by such account. Affiliated shareholder accounts owned 12.1% of the outstanding shares of the Fund. Subscription and redemption activity by concentrated accounts may have a significant effect on the operations of the Fund.
Note 8. Line of Credit
The Fund has entered into a revolving credit facility with a syndicate of banks led by JPMorgan Chase Bank N.A. whereby the Fund may borrow for the temporary funding of shareholder redemptions or for other temporary or emergency purposes. The credit facility agreement, as amended, which is a collective agreement between the Fund and certain other funds managed by the Investment Manager, severally and not jointly, permits collective borrowings up to $500 million. Interest is charged to each participating fund based on its borrowings at a rate equal to the higher of (i) the overnight federal funds rate plus 1.00% or (ii) the one-month LIBOR rate plus 1.00%. Each borrowing under the credit facility matures no later than 60 days after the date of borrowing. Effective December 10, 2013, the Fund also pays a commitment fee equal to its pro rata share of the amount of the credit facility at a rate of 0.075% per annum. Prior to December 10, 2013, the commitment fee was charged at the annual rate of 0.08% per annum. The commitment fee is included in other expenses in the Statement of Operations.
The Fund had no borrowings during the year ended February 28, 2014.
Note 9. Subsequent Events
Management has evaluated the events and transactions that have occurred through the date the financial statements were issued and noted no items requiring adjustment of the financial statements or additional disclosure.
Note 10. Information Regarding Pending and Settled Legal Proceedings
In December 2005, without admitting or denying the allegations, American Express Financial Corporation (AEFC, which is now known as Ameriprise Financial, Inc. (Ameriprise Financial)) entered into settlement agreements with the Securities and Exchange Commission (SEC) and Minnesota Department of Commerce (MDOC) related to market timing activities. As a result, AEFC was censured and ordered to cease and desist from committing or causing any violations of certain provisions of the Investment Advisers Act of 1940, the Investment Company Act of 1940, and various Minnesota laws.
AEFC agreed to pay disgorgement of $10 million and civil money penalties of $7 million. AEFC also agreed to retain an independent distribution consultant to assist in developing a plan for distribution of all disgorgement and civil penalties ordered by the SEC in accordance with various undertakings detailed at www.sec.gov/litigation/admin/ia-2451.pdf. Ameriprise Financial and its affiliates have cooperated with the SEC and the MDOC in these legal proceedings, and have made regular reports to the Funds' Boards of Trustees.
Ameriprise Financial and certain of its affiliates have historically been involved in a number of legal, arbitration and regulatory proceedings, including routine litigation, class actions, and governmental actions, concerning matters arising in connection with the conduct of their business activities. Ameriprise Financial believes that the Funds are not currently the subject of, and that neither Ameriprise Financial nor any of its affiliates are the subject of, any pending legal, arbitration or regulatory proceedings that are likely to have a material adverse effect on the Funds or the ability of Ameriprise Financial or its affiliates to perform under their contracts with the Funds. Ameriprise Financial is required to make 10-Q, 10-K and, as necessary, 8-K filings with the Securities and Exchange Commission on legal and regulatory matters that relate to Ameriprise Financial and its affiliates. Copies of these filings may be obtained by accessing the SEC website at www.sec.gov.
There can be no assurance that these matters, or the adverse publicity associated with them, will not result in increased fund redemptions, reduced sale of fund shares or other adverse consequences to the Funds. Further, although we believe proceedings are not likely to have a material adverse effect on the Funds or the ability of Ameriprise Financial or its affiliates to perform under their contracts with the Funds, these proceedings are subject to uncertainties and, as such, we are unable to estimate the possible loss or range of loss that may result. An adverse outcome in one or more of these proceedings could result in adverse judgments, settlements, fines, penalties or other relief that could have a material adverse effect on the consolidated financial condition or results of operations of Ameriprise Financial.
Annual Report 2014
35
Columbia Large Cap Index Fund
Report of Independent Registered Public Accounting Firm
To the Trustees of Columbia Funds Series Trust and the Shareholders of
Columbia Large Cap Index Fund
In our opinion, the accompanying statement of assets and liabilities, including the portfolio of investments, and the related statements of operations and of changes in net assets and the financial highlights present fairly, in all material respects, the financial position of Columbia Large Cap Index Fund (the "Fund", a series of Columbia Funds Series Trust) at February 28, 2014, and the results of its operations, the changes in its net assets and the financial highlights for each of the periods indicated, in conformity with accounting principles generally accepted in the United States of America. These financial statements and financial highlights (hereafter referred to as "financial statements") are the responsibility of the Fund's management; our responsibility is to express an opinion on these financial statements based on our audits. We conducted our audits of these financial statements in accordance with the standards of the Public Company Accounting Oversight Board (United States). Those standards require that we plan and perform the audit to obtain reasonable assurance about whether the financial statements are free of material misstatement. An audit includes examining, on a test basis, evidence supporting the amounts and disclosures in the financial statements, assessing the accounting principles used and significant estimates made by management, and evaluating the overall financial statement presentation. We believe that our audits, which included confirmation of securities at February 28, 2014 by correspondence with the custodian, brokers and transfer agent, provide a reasonable basis for our opinion.
PricewaterhouseCoopers LLP
Minneapolis, Minnesota
April 21, 2014
Annual Report 2014
36
Columbia Large Cap Index Fund
Federal Income Tax Information
(Unaudited)
The Fund hereby designates the following tax attributes for the fiscal year ended February 28, 2014. Shareholders will be notified in early 2015 of the amounts for use in preparing 2014 income tax returns.
Tax Designations:
| Qualified Dividend Income | | | 100.00 | % | |
| Dividends Received Deduction | | | 100.00 | % | |
Qualified Dividend Income. For taxable, non-corporate shareholders, the percentage of ordinary income dividends paid during the fiscal year that represents qualified dividend income subject to reduced tax rates.
Dividends Received Deduction. The percentage of ordinary income dividends paid during the fiscal year that qualifies for the corporate dividends received deduction.
Annual Report 2014
37
Columbia Large Cap Index Fund
Shareholders elect the Board that oversees the Funds' operations. The Board appoints officers who are responsible for day-to-day business decisions based on policies set by the Board. The following table provides basic biographical information about the Funds' Board members, including their principal occupations during the past five years, although specific titles for individuals may have varied over the period. Under current Board policy, members may serve through the end of the calendar year in which he or she reaches either the mandatory retirement age established by the Board or the fifteenth anniversary of the first Board meeting they attended as a member of the Board.
Independent Trustees
Name,
Address,
Year of Birth | | Position Held With
Funds and Length of
Service | | Principal Occupation(s)
During Past Five Years
and Other Relevant
Professional Experience | | Number of
Funds in the
Fund Family
Overseen by
Board Member | | Other Present or Past
Directorships/
Trusteeships
(Within Past 5 Years) | |
Kathleen Blatz
901 S. Marquette Ave.
Minneapolis, MN 55402
1954 | | Board member since 1/06 for RiverSource Funds and since 6/11 for Nations Funds | | Attorney; Chief Justice, Minnesota Supreme
Court, 1998-2006 | | | 131 | | | Trustee, BlueCross BlueShield of Minnesota since 2009 | |
Edward J. Boudreau, Jr.
901 S. Marquette Ave.
Minneapolis, MN 55402
1944 | | Board member since 6/11 for RiverSource Funds and since 1/05 for Nations Funds | | Managing Director, E.J. Boudreau & Associates (consulting) since 2000; Chairman and Chief Executive Officer, John Hancock Funds (mutual funds), 1989-2000 | | | 129 | | | Former Trustee, BofA Funds Series Trust (11 funds), 2005-2011 | |
Pamela G. Carlton
901 S. Marquette Ave.
Minneapolis, MN 55402
1954 | | Board member since 7/07 for RiverSource Funds and since 6/11 for Nations Funds | | President, Springboard — Partners in Cross Cultural Leadership (consulting company) since 2003; Director or Management Director of US Equity Research, Chase Asset Management, 1996-2003; Investment Banker, Morgan Stanley, 1982-1996 | | | 131 | | | None | |
William P. Carmichael
901 S. Marquette Ave.
Minneapolis, MN 55402
1943 | | Chair of the Board since 1/14, Board member since 6/11 for RiverSource Funds and since 2003 for Nations Funds | | Retired; Co-founder, The Succession Fund (provides exit strategies to owners of privately held companies); previously, Senior Vice President, Sara Lee Corporation; Senior Vice President and Chief Financial officer, Beatrice Foods Company; Vice President, Esmark, Inc.; Associate, Price Waterhouse | | | 131 | | | Director, Cobra Electronics Corporation (electronic equipment manufacturer); The Finish Line (athletic shoes and apparel) since July 2003; Director, International Textile Corp. since 2012; former Director, McMoRan Exploration Company (oil and gas exploration and development) 2010-2013; former Trustee, BofA Funds Series Trust (11 funds), 2009-2011; Director, Spectrum Brands, Inc. (consumer products), 2002-2009; Director, Simmons Company (bedding), 2004-2010 | |
Annual Report 2014
38
Columbia Large Cap Index Fund
Trustees and Officers (continued)
Independent Trustees (continued)
Name,
Address,
Year of Birth | | Position Held With
Funds and Length of
Service | | Principal Occupation(s)
During Past Five Years
and Other Relevant
Professional Experience | | Number of
Funds in the
Fund Family
Overseen by
Board Member | | Other Present or Past
Directorships/
Trusteeships
(Within Past 5 Years) | |
Patricia M. Flynn
901 S. Marquette Ave.
Minneapolis, MN 55402
1950 | | Board member since 11/04 for RiverSource Funds and since 6/11 for Nations Funds | | Trustee Professor of Economics and Management, Bentley University since 1976 (also teaches and conducts research on corporate governance); Dean, McCallum Graduate School of Business, Bentley University, 1992-2002 | | | 131 | | | None | |
William A. Hawkins
901 S. Marquette Ave.
Minneapolis, MN 55402
1942 | | Board member since 6/11 for RiverSource Funds and since 1/05 for Nations Funds | | Managing Director, Overton Partners (financial consulting), since August 2010; President and Chief Executive Officer, California General Bank, N.A., January 2008-August 2010 | | | 129 | | | Trustee, BofA Funds Series Trust (11 funds) | |
R. Glenn Hilliard
901 S. Marquette Ave.
Minneapolis, MN 55402
1943 | | Board member since 6/11 for RiverSource Funds and since 1/05 for Nations Funds | | Chairman and Chief Executive Officer, Hilliard Group LLC (investing and consulting) since April 2003; Non-Executive Director & Chairman, CNO Financial Group, Inc. (insurance), September 2003-May 2011 | | | 129 | | | Chairman, BofA Fund Series Trust (11 funds); former Director, CNO Financial Group, Inc. (insurance), 2003-2011 | |
Stephen R. Lewis, Jr.
901 S. Marquette Ave.
Minneapolis, MN 55402
1939 | | Board member for RiverSource Funds since 1/02 and since 6/11 for Nations Funds, Board Chair 1/07-12/13 | | President Emeritus and Professor of Economics Emeritus, Carleton College since 2002 | | | 131 | | | Director, Valmont Industries, Inc. (irrigation systems manufacturer), 2002-2013 | |
Catherine James Paglia
901 S. Marquette Ave.
Minneapolis, MN 55402
1952 | | Board member since 11/04 for RiverSource Funds and since 6/11 for Nations Funds | | Director, Enterprise Asset Management, Inc. (private real estate and asset management company) since September 1998 | | | 131 | | | Director, Valmont Industries, Inc. (irrigation systems manufacturer) since 2012 | |
Leroy C. Richie
901 S. Marquette Ave.
Minneapolis, MN 55402
1941 | | Board member since 2000 for Legacy Seligman Funds, since 11/08 for RiverSource Funds and since 6/11 for Nations Funds | | Counsel, Lewis & Munday, P.C. (law firm) since 2004; Vice President and General Counsel, Automotive Legal Affairs, Chrysler Corporation, 1993-1997 | | | 131 | | | Lead Outside Director, Digital Ally, Inc. (digital imaging) since September 2005; Director, Infinity, Inc. (oil and gas exploration and production) since 1994; Director, OGE Energy Corp. (energy and energy services) since November 2007 | |
Minor M. Shaw
901 S. Marquette Ave.
Minneapolis, MN 55402
1947 | | Board member since 6/11 for RiverSource Funds and since 2003 for Nations Funds | | President, Micco LLC (private investments) since 2011; President, Micco Corp. since 1998 | | | 129 | | | Director, Piedmont Natural Gas; Director, BlueCross BlueShield of South Carolina since April 2008; Director, National Association of Corporate Directors, Carolinas Chapter, since 2013; former Trustee, BofA Funds Series Trust (11 funds) | |
Annual Report 2014
39
Columbia Large Cap Index Fund
Trustees and Officers (continued)
Independent Trustees (continued)
Name,
Address,
Year of Birth | | Position Held With
Funds and Length of
Service | | Principal Occupation(s)
During Past Five Years
and Other Relevant
Professional Experience | | Number of
Funds in the
Fund Family
Overseen by
Board Member | | Other Present or Past
Directorships/
Trusteeships
(Within Past 5 Years) | |
Alison Taunton-Rigby
901 S. Marquette Ave.
Minneapolis, MN 55402
1944 | | Board member since 11/02 for RiverSource Funds and since 6/11 for Nations Funds | | Chief Executive Officer and Director, RiboNovix, Inc., (biotechnology) 2003-2010 | | | 131 | | | Director, Healthways, Inc. (health and wellbeing solutions) since 2005; Director, ICI Mutual Insurance Company, RRG since 2011; Director, Abt
Associates (government contractor) since 2001; Director, Boston Children's Hospital since 2002 | |
Interested Trustee Not Affiliated with Investment Manager*
Name,
Address,
Year of Birth | | Position Held With
Funds and Length of
Service | | Principal Occupation(s)
During Past Five Years
and Other Relevant
Professional Experience | | Number of
Funds in the
Fund Family
Overseen by
Board Member | | Other Present or Past
Directorships/
Trusteeships
(Within Past 5 Years) | |
Anthony M. Santomero
901 S. Marquette Ave.
Minneapolis, MN 55402
1946 | | Board member since 6/11 for RiverSource Funds and since 1/08 for Nations Funds | | Richard K. Mellon Professor Emeritus of Finance, The Wharton School, University of Pennsylvania, since 2002; Senior Advisor, McKinsey & Company (consulting), 2006-2008 | | | 129 | | | Director, Renaissance Reinsurance Ltd. since May 2008; Trustee, Penn Mutual Life Insurance Company since March 2008; Director, Citigroup Inc. since 2009; Director, Citibank, N.A. since 2009; former Trustee, BofA Funds Series Trust (11 funds), 2008-2011 | |
* Dr. Santomero is not an affiliated person of the Investment Manager or Ameriprise Financial. However, he is currently deemed by the Funds to be an "interested person" (as defined in the 1940 Act) of the Funds because he serves as a Director of Citigroup Inc. and Citibank, N.A., companies that may directly or through subsidiaries and affiliates engage from time-to-time in brokerage execution, principal transactions and lending relationships with the Funds or accounts advised/managed by the Investment Manager.
Annual Report 2014
40
Columbia Large Cap Index Fund
Trustees and Officers (continued)
Interested Trustee Affiliated with Investment Manager*
Name,
Address,
Year of Birth | | Position Held With
Funds and Length of
Service | | Principal Occupation(s)
During Past Five Years
and Other Relevant
Professional Experience | | Number of
Funds in the
Fund Family
Overseen by
Board Member | | Other Present or Past
Directorships/
Trusteeships
(Within Past 5 Years) | |
William F. Truscott
53600 Ameriprise
Financial Center
Minneapolis, MN 55474
1960 | | Board member since 11/01 for RiverSource Funds and since 6/11 for Nations Funds; Senior Vice President since 2002 for RiverSource Funds and since 5/10 for Nations Funds | | Chairman of the Board and President, Columbia Management Investment Advisers, LLC since May 2010 and February 2012, respectively (previously President and Chief Investment Officer, 2001-April 2010); Chief Executive Officer, Global Asset Management, Ameriprise Financial, Inc. since September 2012 (previously Chief Executive Officer, U.S. Asset Management & President, Annuities, May 2010-September 2012 and President — U.S. Asset Management and Chief Investment Officer, 2005-April 2010); Director and Chief Executive Officer, Columbia Management Investment Distributors, Inc. since May 2010 and February 2012, respectively (previously Chairman of the Board and Chief Executive Officer, 2006-April 2010); Chairman of the Board and Chief Executive Officer, RiverSource Distributors, Inc. since 2006; Director, Threadneedle Asset Management Holdings, SARL since 2014; President and Chief Executive Officer, Ameriprise Certificate Company, 2006-August 2012 | | | 183 | | | Former Director, Ameriprise Certificate Company, 2006-January 2013 | |
* Interested person (as defined under the 1940 Act) by reason of being an officer, director, security holder and/or employee of the Investment Manager or Ameriprise Financial.
The SAI has additional information about the Fund's Board members and is available, without charge, upon request by calling 800.345.6611; contacting your financial intermediary or visiting columbiamanagement.com.
Annual Report 2014
41
Columbia Large Cap Index Fund
Trustees and Officers (continued)
The Board has appointed officers who are responsible for day-to-day business decisions based on policies it has established. The officers serve at the pleasure of the Board. In addition to Mr. Truscott, who is Senior Vice President, the Funds' other officers are:
Officers
Name,
Address and
Year of Birth | | Position and Year
First Appointed to
Position for any Fund
in the Columbia
Funds Complex or a
Predecessor Thereof | | Principal Occupation(s) During Past Five Years | |
J. Kevin Connaughton
225 Franklin Street
Boston, MA 02110
Born 1964 | | President and Principal Executive Officer (2009) | | Managing Director and General Manager — Mutual Fund Products, Columbia Management Investment Advisers, LLC since May 2010; and President, Columbia Funds since 2009; Managing Director, Columbia Management Advisors, LLC, December 2004 – April 2010; Senior Vice President and Chief Financial Officer, Columbia Funds, June 2008 – January 2009; and senior officer of Columbia Funds and affiliated funds since 2003 | |
Michael G. Clarke
225 Franklin Street
Boston, MA 02110
Born 1969 | | Treasurer (2011) and Chief Financial Officer (2009) | | Vice President — Mutual Fund Administration, Columbia Management Investment Advisers, LLC, since May 2010;Managing Director of Fund Administration, Columbia Management Advisors, LLC, September 2004 – April 2010; and senior officer of Columbia Funds and affiliated funds since 2002 | |
Scott R. Plummer
5228 Ameriprise Financial Center
Minneapolis, MN 55474
Born 1959 | | Senior Vice President (2006), Chief Legal Officer (2006) and Assistant Secretary (2011) | | Senior Vice President and Assistant General Counsel — Global Asset Management, Ameriprise Financial since February 2014 (previously, Senior Vice President and Lead Chief Counsel — Asset Management, 2012 – February 2014; Vice President and Lead Chief Counsel — Asset Management, 2010 – 2012; and Vice President and Chief Counsel — Asset Management, 2005 – 2010); Senior Vice President, Chief Legal Officer and Assistant Secretary, Columbia Management Investment Advisers, LLC since June 2005; Vice President, Chief Counsel and Assistant Secretary, Columbia Management Investment Distributors, Inc. since 2008; Vice President, General Counsel and Secretary, Ameriprise Certificate Company since 2005; Chief Counsel, RiverSource Distributors, Inc. since 2006; senior officer of Columbia Funds and affiliated funds since 2006 | |
Thomas P. McGuire
225 Franklin Street
Boston, MA 02110
Born 1972 | | Chief Compliance Officer (2012) | | Vice President — Asset Management Compliance, Ameriprise Financial, Inc. since May 2010; Chief Compliance Officer, Ameriprise Certificate Company, since September 2010; Compliance Executive, Bank of America, 2005 – April 2010 | |
Colin Moore
225 Franklin Street
Boston, MA 02110
Born 1958 | | Senior Vice President (2010) | | Executive Vice President and Global Chief Investment Officer, Ameriprise Financial, Inc. since July 2013; Director and Global Chief Investment Officer, Columbia Management Investment Advisers, LLC since May 2010; Manager, Managing Director and Chief Investment Officer, Columbia Management Advisors, LLC, 2007 – April 2010 | |
Michael E. DeFao
225 Franklin Street
Boston, MA 02110
Born 1968 | | Vice President (2011) and Assistant Secretary (2010) | | Vice President and Chief Counsel, Ameriprise Financial, Inc. since May 2010; Associate General Counsel, Bank of America 2005 – April 2010 | |
Joseph F. DiMaria
225 Franklin Street
Boston, MA 02110
Born 1968 | | Vice President (2011) and Chief Accounting Officer (2008) | | Vice President — Mutual Fund Treasurer, Columbia Management Investment Advisers, LLC since May 2010; Director of Fund Administration, Columbia Management Advisors, LLC, 2006 – April 2010 | |
Paul B. Goucher
100 Park Avenue
New York, NY 10017
Born 1968 | | Vice President (2011) and Assistant Secretary (2008) | | Vice President and Lead Chief Counsel, Ameriprise Financial, Inc. since November 2008 and January 2013, respectively (previously Chief Counsel, January 2010 – January 2013, and Group Counsel, November 2008 – January 2010); Director, Managing Director and General Counsel, J. & W. Seligman & Co. Incorporated, July 2008 – November 2008 | |
Amy Johnson
5228 Ameriprise Financial
Center
Minneapolis, MN 55474
Born 1965 | | Vice President (2006) | | Managing Director and Chief Operating Officer, Columbia Management Investment Advisers, LLC since May 2010 (previously Chief Administrative Officer, 2009 – April 2010, and Vice President — Asset Management and Trust Company Services, 2006 – 2009) | |
Annual Report 2014
42
Columbia Large Cap Index Fund
Trustees and Officers (continued)
Officers (continued)
Name,
Address and
Year of Birth | | Position and Year
First Appointed to
Position for any Fund
in the Columbia
Funds Complex or a
Predecessor Thereof | | Principal Occupation(s) During Past Five Years | |
Paul D. Pearson
5228 Ameriprise Financial
Center
Minneapolis, MN 55474
Born 1956 | | Vice President (2011) and Assistant Treasurer (1999) | | Vice President — Investment Accounting, Columbia Management Investment Advisers, LLC since May 2010; Vice President — Managed Assets, Investment Accounting, Ameriprise Financial, Inc., 1998 – April 2010 | |
Christopher O. Petersen
5228 Ameriprise Financial Center
Minneapolis, MN 55474
Born 1970 | | Vice President and Secretary (2010) | | Vice President and Chief Counsel, Ameriprise Financial, Inc., since January 2010 (previously Vice President and Group Counsel or Counsel, 2004 – January 2010); officer of Columbia Funds and affiliated funds since 2007 | |
Stephen T. Welsh
225 Franklin Street
Boston, MA 02110
Born 1957 | | Vice President (2006) | | President and Director, Columbia Management Investment Services Corp. since May 2010; President and Director, Columbia Management Services, Inc., 2004 – April 2010; Managing Director, Columbia Management Distributors, Inc., 2007 – April 2010 | |
Annual Report 2014
43
This page intentionally left blank.
Annual Report 2014
44
Columbia Large Cap Index Fund
Important Information About This Report
Each fund mails one shareholder report to each shareholder address. If you would like more than one report, please call shareholder services at 800.345.6611 and additional reports will be sent to you.
The policy of the Board is to vote the proxies of the companies in which each fund holds investments consistent with the procedures as stated in the Statement of Additional Information (SAI). You may obtain a copy of the SAI without charge by calling 800.345.6611; contacting your financial intermediary; visiting columbiamanagement.com; or searching the website of the Securities and Exchange Commission (SEC) at sec.gov. Information regarding how each fund voted proxies relating to portfolio securities is filed with the SEC by August 31 for the most recent 12-month period ending June 30 of that year, and is available without charge by visiting columbiamanagement.com; or searching the website of the SEC at sec.gov.
Each fund files a complete schedule of portfolio holdings with the SEC for the first and third quarters of each fiscal year on Form N-Q. Each fund's Form N-Q is available on the SEC's website at sec.gov and may be reviewed and copied at the SEC's Public Reference Room in Washington, D.C. Information on the operation of the Public Reference Room may be obtained by calling 800.SEC.0330. Each fund's complete schedule of portfolio holdings, as filed on Form N-Q, can also be obtained without charge, upon request, by calling 800.345.6611.
Annual Report 2014
45

Columbia Large Cap Index Fund
P.O. Box 8081
Boston, MA 02266-8081
columbiamanagement.com
This information is for use with concurrent or prior delivery of a fund prospectus. Please read and consider the investment objectives, risks, charges and expenses for any fund carefully before investing. For a prospectus and, if available, a summary prospectus, which contains this and other important information about the Fund go to columbiamanagement.com. The Fund is distributed by Columbia Management Investment Distributors, Inc., member FINRA, and managed by Columbia Management Investment Advisers, LLC.
© 2014 Columbia Management Investment Advisers, LLC. All rights reserved.
ANN175_02_D01_(04/14)
Annual Report
February 28, 2014

Columbia Marsico Focused Equities Fund
Not FDIC insured • No bank guarantee • May lose value
 Dear Shareholders,
Equities recovered
In the final months of 2013, the U.S. economy embraced a robust recovery. After five years of only modest progress, the pace of economic growth picked up, job gains continued, manufacturing activity accelerated and a rebound in the housing market showed staying power. Growth, as measured by gross domestic product, was 4.1% in the third quarter, with expectations for a solid fourth quarter. Job growth averaged close to 200,000 monthly. Industrial production rose at a rate of 3.3%, considerably higher than the 12-month average of 2.5%. Factories were busier than at any point since the 2008/2009 recession, with capacity utilization at 79%. Orders for durable goods were strong, bolstered by rising auto sales. Holiday spending was solid, especially online sales, which rose 10% year over year, despite a shorter season.
Against this backdrop, the Federal Reserve's (the Fed's) announcement that it would slowly retreat from its monthly bond buying program and a bipartisan budget deal in Washington were welcome news for investors. Stocks climbed to new highs in the fourth quarter, while bonds retreated as yields moved higher. Small-cap stocks outperformed large- and mid-cap stocks, led by significant gains from the industrials, technology and consumer discretionary sectors. All 10 sectors of the S&P 500 Index delivered positive returns, although telecommunications and utilities posted only modest gains.
Fixed-income retreated
Improved economic data drove interest rates higher over the fourth quarter, credit spreads narrowed and the dollar weakened against most developed market currencies. Against this backdrop, most non-Treasury, fixed-income sectors delivered positive returns. Outgoing Fed chairman Ben Bernanke expressed concern about the persistently low level of core inflation, but gains in the labor market and reduced unemployment led to the Fed's decision to taper its bond-buying program gradually beginning in January 2014.
As the stock market soared, the riskiest sectors of the fixed-income markets fared the best. U.S. and foreign high-yield bonds were the strongest performers, followed by emerging-market and U.S. investment-grade corporate bonds. U.S. mortgage-backed securities (MBS) and securitized bonds produced negative total returns, as did U.S. Treasuries and developed world government bonds. Treasury inflation-protected bonds were the period's biggest losers. Investment-grade municipals delivered fractional gains, as better economic conditions helped steady state finances.
Stay on track with Columbia Management
Backed by more than 100 years of experience, Columbia Management is one of the nation's largest asset managers. At the heart of our success and, most importantly, that of our investors, are highly talented industry professionals, brought together by a unique way of working. At Columbia Management, reaching our performance goals matters, and how we reach them matters just as much.
Visit columbiamanagement.com for:
> The Columbia Management Perspectives blog, offering insights on current market events and investment opportunities
> Detailed up-to-date fund performance and portfolio information
> Quarterly fund commentaries
> Columbia Management Investor, our award-winning quarterly newsletter for shareholders
Thank you for your continued support of the Columbia Funds. We look forward to serving your investment needs for many years to come.
Best Regards,

J. Kevin Connaughton
President, Columbia Funds
Investing involves risk including the risk of loss of principal.
The S&P 500 Index, an unmanaged index, measures the performance of 500 widely held, large-capitalization U.S. stocks and is frequently used as a general measure of market performance. The Dow Jones Industrial Average is a price weighted average of 30 actively traded shares of blue chip US industrial corporations listed on the New York Stock Exchange. Indices are not available for investment, are not professionally managed and do not reflect sales charges, fees, brokerage commissions, taxes or other expenses of investing.
Investors should consider the investment objectives, risks, charges and expenses of a mutual fund carefully before investing. For a free prospectus and, if available, a summary prospectus, which contains this and other important information about a fund, visit columbiamanagement.com. The prospectus should be read carefully before investing.
Columbia Funds are distributed by Columbia Management Investment Distributors, Inc., member FINRA, and managed by Columbia Management Investment Advisers, LLC.
© 2014 Columbia Management Investment Advisers, LLC. All rights reserved.
Columbia Marsico Focused Equities Fund
Performance Overview | | | 2 | | |
Manager Discussion of Fund Performance | | | 4 | | |
Understanding Your Fund's Expenses | | | 6 | | |
Portfolio of Investments | | | 7 | | |
Statement of Assets and Liabilities | | | 11 | | |
Statement of Operations | | | 13 | | |
Statement of Changes in Net Assets | | | 14 | | |
Financial Highlights | | | 16 | | |
Notes to Financial Statements | | | 23 | | |
Report of Independent Registered
Public Accounting Firm | | | 30 | | |
Federal Income Tax Information | | | 31 | | |
Trustees and Officers | | | 32 | | |
Important Information About This Report | | | 41 | | |
Fund Investment Manager
Columbia Management Investment
Advisers, LLC
225 Franklin Street
Boston, MA 02110
Fund Distributor
Columbia Management Investment
Distributors, Inc.
225 Franklin Street
Boston, MA 02110
Fund Transfer Agent
Columbia Management Investment
Services Corp.
P.O. Box 8081
Boston, MA 02266-8081
For more information about any of the funds, please visit columbiamanagement.com or call 800.345.6611. Customer Service Representatives are available to answer your questions Monday through Friday from 8 a.m. to 7 p.m. Eastern time.
The views expressed in this report reflect the current views of the respective parties. These views are not guarantees of future performance and involve certain risks, uncertainties and assumptions that are difficult to predict, so actual outcomes and results may differ significantly from the views expressed. These views are subject to change at any time based upon economic, market or other conditions and the respective parties disclaim any responsibility to update such views. These views may not be relied on as investment advice and, because investment decisions for a Columbia Fund are based on numerous factors, may not be relied on as an indication of trading intent on behalf of any particular Columbia Fund. References to specific securities should not be construed as a recommendation or investment advice.
Columbia Marsico Focused Equities Fund
Performance Summary
> Columbia Marsico Focused Equities Fund (the Fund) Class A shares returned 34.77% excluding sales charges for the 12-month period that ended February 28, 2014.
> The Fund outperformed its benchmark, the S&P 500 Index, which returned 25.37% for the same time period.
> An emphasis on the health care and consumer discretionary sectors plus favorable stock selection in those sectors and information technology generally accounted for the significant performance advantage over the benchmark.
Average Annual Total Returns (%) (for period ended February 28, 2014)
| | | Inception | | 1 Year | | 5 Years | | 10 Years | |
Class A | | 12/31/97 | | | | | | | | | | | | | |
Excluding sales charges | | | | | | | 34.77 | | | | 22.63 | | | | 7.85 | | |
Including sales charges | | | | | | | 27.03 | | | | 21.19 | | | | 7.21 | | |
Class B | | 12/31/97 | | | | | | | | | | | | | |
Excluding sales charges | | | | | | | 33.71 | | | | 21.72 | | | | 7.04 | | |
Including sales charges | | | | | | | 28.85 | | | | 21.54 | | | | 7.04 | | |
Class C | | 12/31/97 | | | | | | | | | | | | | |
Excluding sales charges | | | | | | | 33.75 | | | | 21.72 | | | | 7.04 | | |
Including sales charges | | | | | | | 32.78 | | | | 21.72 | | | | 7.04 | | |
Class I* | | 09/27/10 | | | 35.39 | | | | 23.09 | | | | 8.05 | | |
Class R4* | | 11/08/12 | | | 35.07 | | | | 22.70 | | | | 7.88 | | |
Class R5* | | 12/11/13 | | | 34.87 | | | | 22.65 | | | | 7.86 | | |
Class Z | | 12/31/97 | | | 35.08 | | | | 22.94 | | | | 8.12 | | |
S&P 500 Index | | | | | | | 25.37 | | | | 23.00 | | | | 7.16 | | |
Returns for Class A are shown with and without the maximum initial sales charge of 5.75%. Returns for Class B are shown with and without the applicable contingent deferred sales charge (CDSC) of 5.00% in the first year, declining to 1.00% in the sixth year and eliminated thereafter. Returns for Class C are shown with and without the 1.00% CDSC for the first year only. The Fund's other classes are not subject to sales charges and have limited eligibility. Please see the Fund's prospectus for details. Performance for different share classes will vary based on differences in sales charges and fees associated with each class. All results shown assume reinvestment of distributions during the period. Returns do not reflect the deduction of taxes that a shareholder may pay on Fund distributions or on the redemption of Fund shares. Performance results reflect the effect of any fee waivers or reimbursements of Fund expenses by Columbia Management Investment Advisers, LLC and/or any of its affiliates. Absent these fee waivers or expense reimbursement arrangements, performance results would have been lower.
The performance information shown represents past performance and is not a guarantee of future results. The investment return and principal value of your investment will fluctuate so that your shares, when redeemed, may be worth more or less than their original cost. Current performance may be lower or higher than the performance information shown. You may obtain performance information current to the most recent month-end by contacting your financial intermediary, visiting columbiamanagement.com or calling 800.345.6611.
*The returns shown for periods prior to the share class inception date (including returns for the Life of the Fund, if shown, which are since Fund inception) include the returns of the Fund's oldest share class. Since the Fund launched more than one share class at its inception, Class A shares were used. These returns are adjusted to reflect any higher class-related operating expenses of the newer share classes, as applicable. Please visit columbiamanagement.com/mutual-funds/appended-performance for more information.
The S&P 500 Index, an unmanaged index, measures the performance of 500 widely held, large-capitalization U.S. stocks and is frequently used as a general measure of market performance.
Indices are not available for investment, are not professionally managed and do not reflect sales charges, fees, brokerage commissions, taxes or other expenses of investing. Securities in the Fund may not match those in an index.
Annual Report 2014
2
Columbia Marsico Focused Equities Fund
Performance Overview (continued)
Performance of a Hypothetical $10,000 Investment (March 1, 2004 – February 28, 2014)
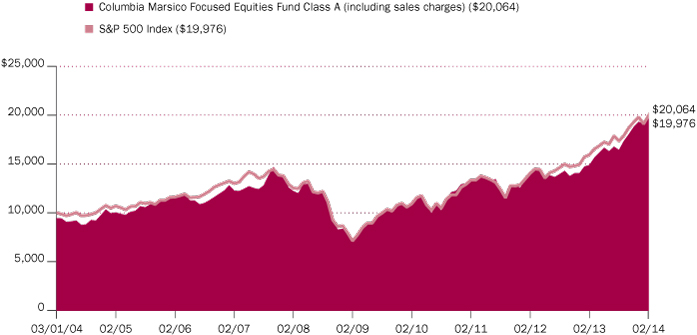
The chart above shows the change in value of a hypothetical $10,000 investment in Class A shares of Columbia Marsico Focused Equities Fund during the stated time period, and does not reflect the deduction of taxes that a shareholder may pay on Fund distributions or on the redemption of Fund shares.
Annual Report 2014
3
Columbia Marsico Focused Equities Fund
Manager Discussion of Fund Performance
For the 12-month period that ended February 28, 2014, the Fund's Class A shares returned 34.77% excluding sales charges. The Fund's benchmark, the S&P 500 Index, returned 25.37% for the same time period. The Fund benefited from overweight allocations in the health care and consumer discretionary sectors. Stock selection in both sectors, as well as in information technology, also aided relative results. Stock selection in the industrials and consumer staples sectors detracted from returns.
Stocks Rose in a Favorable Market Environment
Despite a string of weak job gains at the end of 2013 — and a difficult winter, which affected job growth, construction activity and the housing market — the U.S. economy expanded at a respectable pace over the 12-month period that ended February 28, 2014. Pent-up demand, low mortgage rates and an improving labor market helped home sales advance, and foreclosure activity trended downward. After a brief pullback, manufacturing activity picked up midway through the period and remained solid. Businesses remained profitable and household finances were healthy, with lower debt loads and stronger credit conditions.
Even though a host of concerns weighed on investors, stock prices moved higher as central banks continued to pour liquidity into the financial markets. Investors shrugged off concerns regarding tax increases and enforced federal spending cuts, another showdown over the U.S. debt ceiling and the possibility of an attack on Syria. Midway through the period, the Federal Reserve's (the Fed's) talk about removing monetary support briefly dampened investor enthusiasm. However, once the Fed chose not to act until 2014, the market rally rebooted. In fact, U.S. equities posted their most significant gains since the late 1990s.
Contributors and Detractors
In a period of generally rising stock prices, the Fund's results were aided by its emphasis on health care and consumer discretionary stocks, the strongest performing sectors in the benchmark. In health care, we favored pharmaceutical and biotechnology companies, attracted by the quality of the science they are using to treat diseases that were considered untreatable just a few years ago. We are seeing a variety of emerging therapeutic pathways and believe we are in the early stages of a paradigm shift in disease treatment, in which highly specialized compounds are developed to treat specific genetic targets. Gilead Sciences and Biogen Idec are two such companies. Gilead Sciences is a world leader in therapeutics for viral diseases. We believe the company has the potential to experience increased growth from the upcoming launch of a new drug franchise for Hepatitis C. Biogen Idec is a leader in developing treatments for multiple sclerosis (MS). During the period, the company received Food & Drug Administration approval for Tecfidera, the first oral medication that could allow thousands of MS patients to stop receiving drugs by needle or intravenously.
In the consumer discretionary sector, Wynn Resorts and Chipotle Mexican Grill were standout performers. Wynn Resorts generated strong revenues from its Macau casino resorts and its stock price rose. Chipotle Mexican Grill experienced underlying strength in its business and we sold it at a gain. Discount fashion retailer TJX Companies and online travel reservation company priceline.com also generated strong returns.
Portfolio Management
Marsico Capital Management, LLC
Thomas Marsico
Coralie Witter, CFA
Morningstar Style BoxTM

The Morningstar Style BoxTM is based on a fund's portfolio holdings. For equity funds, the vertical axis shows the market capitalization of the stocks owned, and the horizontal axis shows investment style (value, blend, or growth). Information shown is based on the most recent data provided by Morningstar.
© 2014 Morningstar, Inc. All rights reserved. The Morningstar information contained herein: (1) is proprietary to Morningstar and/or its content providers; (2) may not be copied or distributed; and (3) is not warranted to be accurate, complete or timely. Neither Morningstar nor its content providers are responsible for any damages or losses arising from any use of this information.
Top Ten Holdings (%)
(at February 28, 2014) | |
Biogen Idec, Inc. | | | 8.3 | | |
Gilead Sciences, Inc. | | | 7.9 | | |
Google, Inc., Class A | | | 7.5 | | |
Visa, Inc., Class A | | | 5.9 | | |
Monsanto Co. | | | 5.8 | | |
Facebook, Inc., Class A | | | 4.8 | | |
priceline.com, Inc. | | | 4.5 | | |
Wynn Resorts Ltd. | | | 4.3 | | |
Sherwin-Williams Co. (The) | | | 4.3 | | |
Canadian Pacific Railway Ltd. | | | 4.0 | | |
Percentages indicated are based upon total investments (excluding Money Market Funds).
For further detail about these holdings, please refer to the section entitled "Portfolio of Investments."
Fund holdings are as of the date given, are subject to change at any time, and are not recommendations to buy or sell any security.
Annual Report 2014
4
Columbia Marsico Focused Equities Fund
Manager Discussion of Fund Performance (continued)
Stock selection in the information technology sector also aided performance. Online social media holding Facebook was a meaningful contributor to performance. Strong advertising revenues in the company's mobile business benefited Facebook shares. Positions in Visa and Google further aided performance. We also did well to avoid the weakest performing sectors of the benchmark — telecommunication services and utilities — and by underweighting staples and energy, which underperformed.
Stock selection in the industrials sector detracted from performance. Aerospace company Boeing and power systems firm Rolls-Royce Holdings each posted double-digit stock price declines. The Fund's position in Boeing was sold. In the consumer staples sector, Anheuser-Busch InBev posted a negative return as Brazil, one of the company's core markets, experienced weakness, and was sold from the portfolio. Shares of Green Mountain Coffee Roasters declined, detracting from results. Individual disappointments included eBay and athletic apparel company lululemon athletica. eBay reported softness in its international business, while lululemon athletica faced several challenges during the period, including quality control and the resignation of its CEO. We sold both positions.
During the period, we significantly reduced the Fund's exposure to financials and increased investments in the information technology and materials sectors.
Looking Ahead
We believe we are currently entering a period of low inflation and modest economic growth. Against this backdrop, we believe that companies with steadily expanding earnings, strong cash flow, increasing margins, rising market share, improving profitability, the development of innovative products and the effective allocation of capital to fuel further growth may be positioned to outperform their peers. These are the characteristics we seek in holdings we select for the Fund. As of period-end, the Fund's largest sector allocations included consumer discretionary, information technology, health care and materials. The Fund had no exposure to the utilities or telecommunication services sectors.
Portfolio Breakdown (%)
(at February 28, 2014) | |
Common Stocks | | | 98.0 | | |
Consumer Discretionary | | | 25.2 | | |
Consumer Staples | | | 1.8 | | |
Energy | | | 5.1 | | |
Financials | | | 3.1 | | |
Health Care | | | 22.9 | | |
Industrials | | | 6.4 | | |
Information Technology | | | 23.7 | | |
Materials | | | 9.8 | | |
Money Market Funds | | | 2.0 | | |
Total | | | 100.0 | | |
Percentages indicated are based upon total investments. The Fund's portfolio composition is subject to change.
Investment Risks
The Fund is subject to stock market fluctuations. By maintaining a relatively concentrated portfolio of 20 – 35 stocks, the Fund may be subject to greater risk than a fund that is more fully diversified. The Fund may invest up to 25% of its total assets in foreign securities, including emerging market securities. International investing involves special risks, including foreign taxation, currency risks, risks associated with possible differences in financial standards, and other monetary and political risks. See the Fund's prospectus for more information on these and other risks.
Annual Report 2014
5
Columbia Marsico Focused Equities Fund
Understanding Your Fund's Expenses
(Unaudited)
As an investor, you incur two types of costs. There are transaction costs, which generally include sales charges on purchases and may include redemption fees. There are also ongoing costs, which generally include management fees, distribution and/or service fees, and other fund expenses. The following information is intended to help you understand your ongoing costs (in dollars) of investing in the Fund and to help you compare these costs with the ongoing costs of investing in other mutual funds.
Analyzing Your Fund's Expenses
To illustrate these ongoing costs, we have provided examples and calculated the expenses paid by investors in each share class of the Fund during the period. The actual and hypothetical information in the table is based on an initial investment of $1,000 at the beginning of the period indicated and held for the entire period. Expense information is calculated two ways and each method provides you with different information. The amount listed in the "Actual" column is calculated using the Fund's actual operating expenses and total return for the period. You may use the Actual information, together with the amount invested, to estimate the expenses that you paid over the period. Simply divide your account value by $1,000 (for example, an $8,600 account value divided by $1,000 = 8.6), then multiply the results by the expenses paid during the period under the "Actual" column. The amount listed in the "Hypothetical" column assumes a 5% annual rate of return before expenses (which is not the Fund's actual return) and then applies the Fund's actual expense ratio for the period to the hypothetical return. You should not use the hypothetical account values and expenses to estimate either your actual account balance at the end of the period or the expenses you paid during the period. See "Compare With Other Funds" below for details on how to use the hypothetical data.
Compare With Other Funds
Since all mutual funds are required to include the same hypothetical calculations about expenses in shareholder reports, you can use this information to compare the ongoing cost of investing in the Fund with other funds. To do so, compare the hypothetical example with the 5% hypothetical examples that appear in the shareholder reports of other funds. As you compare hypothetical examples of other funds, it is important to note that hypothetical examples are meant to highlight the ongoing costs of investing in a fund only and do not reflect any transaction costs, such as sales charges, or redemption or exchange fees. Therefore, the hypothetical calculations are useful in comparing ongoing costs only, and will not help you determine the relative total costs of owning different funds. If transaction costs were included in these calculations, your costs would be higher.
September 1, 2013 – February 28, 2014
| | | Account Value at the Beginning
of the Period ($) | | Account Value at the End of the
Period ($) | | Expenses Paid During the
Period ($) | | Fund's Annualized
Expense Ratio (%) | |
| | | Actual | | Hypothetical | | Actual | | Hypothetical | | Actual | | Hypothetical | | Actual | |
Class A | | | 1,000.00 | | | | 1,000.00 | | | | 1,221.60 | | | | 1,018.85 | | | | 6.76 | | | | 6.14 | | | | 1.22 | | |
Class B | | | 1,000.00 | | | | 1,000.00 | | | | 1,217.20 | | | | 1,015.11 | | | | 10.89 | | | | 9.90 | | | | 1.97 | | |
Class C | | | 1,000.00 | | | | 1,000.00 | | | | 1,216.70 | | | | 1,015.11 | | | | 10.89 | | | | 9.90 | | | | 1.97 | | |
Class I | | | 1,000.00 | | | | 1,000.00 | | | | 1,224.10 | | | | 1,021.29 | | | | 4.05 | | | | 3.68 | | | | 0.73 | | |
Class R4 | | | 1,000.00 | | | | 1,000.00 | | | | 1,222.80 | | | | 1,020.09 | | | | 5.38 | | | | 4.89 | | | | 0.97 | | |
Class R5 | | | 1,000.00 | | | | 1,000.00 | | | | 1,085.90 | * | | | 1,020.89 | | | | 1.81 | * | | | 4.08 | | | | 0.81 | * | |
Class Z | | | 1,000.00 | | | | 1,000.00 | | | | 1,222.90 | | | | 1,020.09 | | | | 5.38 | | | | 4.89 | | | | 0.97 | | |
*For the period December 11, 2013 through February 28, 2014. Class R5 shares commenced operations on December 11, 2013.
Expenses paid during the period are equal to the annualized expense ratio for each class as indicated above, multiplied by the average account value over the period and then multiplied by the number of days in the Fund's most recent fiscal half year and divided by 365.
Expenses do not include fees and expenses incurred indirectly by the Fund from the underlying funds in which the Fund may invest (also referred to as "acquired funds"), including affiliated and non-affiliated pooled investment vehicles (including mutual funds and exchange-traded funds).
Had Columbia Management Investment Advisers, LLC and/or certain of its affiliates not waived/reimbursed certain fees and expenses, account value at the end of the period would have been reduced.
Annual Report 2014
6
Columbia Marsico Focused Equities Fund
Portfolio of Investments
February 28, 2014
(Percentages represent value of investments compared to net assets)
Common Stocks 100.2%
Issuer | | Shares | | Value ($) | |
Consumer Discretionary 25.7% | |
Hotels, Restaurants & Leisure 9.4% | |
Starbucks Corp. | | | 200,000 | | | | 14,192,000 | | |
Starwood Hotels & Resorts Worldwide, Inc. | | | 533,181 | | | | 43,966,105 | | |
Wynn Resorts Ltd. | | | 207,108 | | | | 50,221,619 | | |
Total | | | | | 108,379,724 | | |
Internet & Catalog Retail 4.5% | |
priceline.com, Inc.(a) | | | 38,957 | | | | 52,546,760 | | |
Media 6.9% | |
Comcast Corp., Class A | | | 721,902 | | | | 37,315,114 | | |
Walt Disney Co. (The) | | | 531,798 | | | | 42,974,597 | | |
Total | | | | | 80,289,711 | | |
Specialty Retail 4.9% | |
Home Depot, Inc. (The) | | | 215,681 | | | | 17,692,312 | | |
TJX Companies, Inc. (The) | | | 635,852 | | | | 39,079,464 | | |
Total | | | | | 56,771,776 | | |
Total Consumer Discretionary | | | | | 297,987,971 | | |
Consumer Staples 1.8% | |
Food Products 1.8% | |
Green Mountain Coffee Roasters, Inc. | | | 189,515 | | | | 20,804,957 | | |
Total Consumer Staples | | | | | 20,804,957 | | |
Energy 5.2% | |
Energy Equipment & Services 2.5% | |
Schlumberger Ltd. | | | 317,021 | | | | 29,482,953 | | |
Oil, Gas & Consumable Fuels 2.7% | |
Continental Resources, Inc.(a) | | | 258,189 | | | | 30,858,749 | | |
Total Energy | | | | | 60,341,702 | | |
Financials 3.2% | |
Consumer Finance 3.2% | |
American Express Co. | | | 406,330 | | | | 37,089,802 | | |
Total Financials | | | | | 37,089,802 | | |
Health Care 23.4% | |
Biotechnology 19.2% | |
Biogen Idec, Inc.(a) | | | 282,850 | | | | 96,361,338 | | |
Celgene Corp.(a) | | | 214,871 | | | | 34,540,513 | | |
Gilead Sciences, Inc.(a) | | | 1,105,181 | | | | 91,497,935 | | |
Total | | | | | 222,399,786 | | |
Common Stocks (continued)
Issuer | | Shares | | Value ($) | |
Health Care Providers & Services 3.1% | |
UnitedHealth Group, Inc. | | | 455,755 | | | | 35,216,189 | | |
Pharmaceuticals 1.1% | |
Pacira Pharmaceuticals, Inc.(a) | | | 162,440 | | | | 12,709,306 | | |
Total Health Care | | | | | 270,325,281 | | |
Industrials 6.6% | |
Aerospace & Defense 2.6% | |
General Dynamics Corp. | | | 186,393 | | | | 20,417,489 | | |
Rolls-Royce Holdings PLC | | | 566,041 | | | | 9,469,167 | | |
Total | | | | | 29,886,656 | | |
Road & Rail 4.0% | |
Canadian Pacific Railway Ltd. | | | 295,228 | | | | 46,350,796 | | |
Total Industrials | | | | | 76,237,452 | | |
Information Technology 24.2% | |
Internet Software & Services 14.0% | |
Facebook, Inc., Class A(a) | | | 821,168 | | | | 56,217,161 | | |
Google, Inc., Class A(a) | | | 71,864 | | | | 87,361,471 | | |
Yahoo!, Inc.(a) | | | 468,407 | | | | 18,113,299 | | |
Total | | | | | 161,691,931 | | |
IT Services 5.9% | |
Visa, Inc., Class A | | | 302,256 | | | | 68,291,721 | | |
Semiconductors & Semiconductor Equipment 2.3% | |
| ASML Holding NV | | | 316,271 | | | | 27,243,584 | | |
Software 2.0% | |
Salesforce.com, Inc.(a) | | | 367,147 | | | | 22,898,958 | | |
Total Information Technology | | | | | 280,126,194 | | |
Materials 10.1% | |
Chemicals 10.1% | |
Monsanto Co. | | | 607,069 | | | | 66,789,731 | | |
Sherwin-Williams Co. (The) | | | 247,630 | | | | 49,644,863 | | |
Total | | | | | 116,434,594 | | |
Total Materials | | | | | 116,434,594 | | |
Total Common Stocks
(Cost: $793,173,143) | | | | | 1,159,347,953 | | |
The accompanying Notes to Financial Statements are an integral part of this statement.
Annual Report 2014
7
Columbia Marsico Focused Equities Fund
Portfolio of Investments (continued)
February 28, 2014
Money Market Funds 2.0%
| | | Shares | | Value ($) | |
Columbia Short-Term Cash Fund,
0.098%(b)(c) | | | 23,368,987 | | | | 23,368,987 | | |
Total Money Market Funds
(Cost: $23,368,987) | | | | | 23,368,987 | | |
Total Investments
(Cost: $816,542,130) | | | | | 1,182,716,940 | | |
Other Assets & Liabilities, Net | | | | | (25,178,745 | ) | |
Net Assets | | | | | 1,157,538,195 | | |
Notes to Portfolio of Investments
(a) Non-income producing.
(b) The rate shown is the seven-day current annualized yield at February 28, 2014.
(c) As defined in the Investment Company Act of 1940, an affiliated company is one in which the Fund owns 5% or more of its outstanding voting securities, or a company which is under common ownership or control with the Fund. Holdings and transactions in these affiliated companies during the year ended February 28, 2014, are as follows:
Issuer | | Beginning
Cost ($) | | Purchase
Cost ($) | | Proceeds
From Sales ($) | | Ending
Cost ($) | | Dividends —
Affiliated
Issuers ($) | | Value ($) | |
Columbia Short-Term Cash Fund | | | 43,733,734 | | | | 797,547,613 | | | | (817,912,360 | ) | | | 23,368,987 | | | | 23,657 | | | | 23,368,987 | | |
Fair Value Measurements
Generally accepted accounting principles (GAAP) require disclosure regarding the inputs and valuation techniques used to measure fair value and any changes in valuation inputs or techniques. In addition, investments shall be disclosed by major category.
The Fund categorizes its fair value measurements according to a three-level hierarchy that maximizes the use of observable inputs and minimizes the use of unobservable inputs by prioritizing that the most observable input be used when available. Observable inputs are those that market participants would use in pricing an investment based on market data obtained from sources independent of the reporting entity. Unobservable inputs are those that reflect the Fund's assumptions about the information market participants would use in pricing an investment. An investment's level within the fair value hierarchy is based on the lowest level of any input that is deemed significant to the asset or liability's fair value measurement. The input levels are not necessarily an indication of the risk or liquidity associated with investments at that level. For example, certain U.S. government securities are generally high quality and liquid, however, they are reflected as Level 2 because the inputs used to determine fair value may not always be quoted prices in an active market.
Fair value inputs are summarized in the three broad levels listed below:
> Level 1 — Valuations based on quoted prices for investments in active markets that the Fund has the ability to access at the measurement date (including NAV for open-end mutual funds). Valuation adjustments are not applied to Level 1 investments.
> Level 2 — Valuations based on other significant observable inputs (including quoted prices for similar securities, interest rates, prepayment speeds, credit risks, etc.).
> Level 3 — Valuations based on significant unobservable inputs (including the Fund's own assumptions and judgment in determining the fair value of investments).
Inputs that are used in determining fair value of an investment may include price information, credit data, volatility statistics, and other factors. These inputs can be either observable or unobservable. The availability of observable inputs can vary between investments, and is affected by various factors such as the type of investment, and the volume and level of activity for that investment or similar investments in the marketplace. The inputs will be considered by the Investment Manager, along with any other relevant factors in the calculation of an investment's fair value. The Fund uses prices and inputs that are current as of the measurement date, which may include periods of market dislocations. During these periods, the availability of prices and inputs may be reduced for many investments. This condition could cause an investment to be reclassified between the various levels within the hierarchy.
The accompanying Notes to Financial Statements are an integral part of this statement.
Annual Report 2014
8
Columbia Marsico Focused Equities Fund
Portfolio of Investments (continued)
February 28, 2014
Fair Value Measurements (continued)
Foreign equity securities actively traded in markets where there is a significant delay in the local close relative to the New York Stock Exchange (NYSE) are classified as Level 2. The values of these securities may include an adjustment to reflect the impact of significant market movements following the close of local trading, as described in Note 2 to the financial statements — Security Valuation.
Investments falling into the Level 3 category are primarily supported by quoted prices from brokers and dealers participating in the market for those investments. However, these may be classified as Level 3 investments due to lack of market transparency and corroboration to support these quoted prices. Additionally, valuation models may be used as the pricing source for any remaining investments classified as Level 3. These models may rely on one or more significant unobservable inputs and/or significant assumptions by the Investment Manager. Inputs used in valuations may include, but are not limited to, financial statement analysis, capital account balances, discount rates and estimated cash flows, and comparable company data.
Under the direction of the Fund's Board of Trustees (the Board), the Investment Manager's Valuation Committee (the Committee) is responsible for overseeing the valuation procedures approved by the Board. The Committee consists of voting and non-voting members from various groups within the Investment Manager's organization, including operations and accounting, trading and investments, compliance, risk management and legal.
The Committee meets at least monthly to review and approve valuation matters, which may include a description of specific valuation determinations, data regarding pricing information received from approved pricing vendors and brokers and the results of Board-approved valuation control policies and procedures (the Policies). The Policies address, among other things, instances when market quotations are or are not readily available, including recommendations of third party pricing vendors and a determination of appropriate pricing methodologies; events that require specific valuation determinations and assessment of fair value techniques; securities with a potential for stale pricing, including those that are illiquid, restricted, or in default; and the effectiveness of third party pricing vendors, including periodic reviews of vendors. The Committee meets more frequently, as needed, to discuss additional valuation matters, which may include the need to review back-testing results, review time-sensitive information or approve related valuation actions. The Committee reports to the Board, with members of the Committee meeting with the Board at each of its regularly scheduled meetings to discuss valuation matters and actions during the period, similar to those described earlier.
For investments categorized as Level 3, the Committee monitors information similar to that described above, which may include: (i) data specific to the issuer or comparable issuers, (ii) general market or specific sector news and (iii) quoted prices and specific or similar security transactions. The Committee considers this data and any changes from prior periods in order to assess the reasonableness of observable and unobservable inputs, any assumptions or internal models used to value those securities and changes in fair value. This data is also used to corroborate, when available, information received from approved pricing vendors and brokers. Various factors impact the frequency of monitoring this information (which may occur as often as daily). However, the Committee may determine that changes to inputs, assumptions and models are not required as a result of the monitoring procedures performed.
The accompanying Notes to Financial Statements are an integral part of this statement.
Annual Report 2014
9
Columbia Marsico Focused Equities Fund
Portfolio of Investments (continued)
February 28, 2014
Fair Value Measurements (continued)
The following table is a summary of the inputs used to value the Fund's investments at February 28, 2014:
Description | | Level 1
Quoted Prices in Active
Markets for Identical
Assets ($) | | Level 2
Other Significant
Observable Inputs ($) | | Level 3
Significant
Unobservable Inputs ($) | | Total ($) | |
Equity Securities | |
Common Stocks | |
Consumer Discretionary | | | 297,987,971 | | | | — | | | | — | | | | 297,987,971 | | |
Consumer Staples | | | 20,804,957 | | | | — | | | | — | | | | 20,804,957 | | |
Energy | | | 60,341,702 | | | | — | | | | — | | | | 60,341,702 | | |
Financials | | | 37,089,802 | | | | — | | | | — | | | | 37,089,802 | | |
Health Care | | | 270,325,281 | | | | — | | | | — | | | | 270,325,281 | | |
Industrials | | | 66,768,285 | | | | 9,469,167 | | | | — | | | | 76,237,452 | | |
Information Technology | | | 280,126,194 | | | | — | | | | — | | | | 280,126,194 | | |
Materials | | | 116,434,594 | | | | — | | | | — | | | | 116,434,594 | | |
Total Equity Securities | | | 1,149,878,786 | | | | 9,469,167 | | | | — | | | | 1,159,347,953 | | |
Mutual Funds | |
Money Market Funds | | | 23,368,987 | | | | — | | | | — | | | | 23,368,987 | | |
Total Mutual Funds | | | 23,368,987 | | | | — | | | | — | | | | 23,368,987 | | |
Total | | | 1,173,247,773 | | | | 9,469,167 | | | | — | | | | 1,182,716,940 | | |
See the Portfolio of Investments for all investment classifications not indicated in the table.
The Fund's assets assigned to the Level 2 input category are generally valued using the market approach, in which a security's value is determined through reference to prices and information from market transactions for similar or identical assets. These assets include certain foreign securities for which a third party statistical pricing service may be employed for purposes of fair market valuation. The models utilized by the third party statistical pricing service take into account a security's correlation to available market data including, but not limited to, intraday index, ADR, and ETF movements.
There were no transfers of financial assets between levels during the period.
The accompanying Notes to Financial Statements are an integral part of this statement.
Annual Report 2014
10
Columbia Marsico Focused Equities Fund
Statement of Assets and Liabilities
February 28, 2014
Assets | |
Investments, at value | |
Unaffiliated issuers (identified cost $793,173,143) | | $ | 1,159,347,953 | | |
Affiliated issuers (identified cost $23,368,987) | | | 23,368,987 | | |
Total investments (identified cost $816,542,130) | | | 1,182,716,940 | | |
Receivable for: | |
Investments sold | | | 5,827,045 | | |
Capital shares sold | | | 898,530 | | |
Dividends | | | 477,322 | | |
Reclaims | | | 125,995 | | |
Expense reimbursement due from Investment Manager | | | 89 | | |
Prepaid expenses | | | 2,315 | | |
Other assets | | | 11,167 | | |
Total assets | | | 1,190,059,403 | | |
Liabilities | |
Payable for: | |
Investments purchased | | | 29,860,661 | | |
Capital shares purchased | | | 2,232,288 | | |
Investment management fees | | | 21,604 | | |
Distribution and/or service fees | | | 11,178 | | |
Transfer agent fees | | | 198,118 | | |
Administration fees | | | 1,799 | | |
Compensation of board members | | | 132,789 | | |
Other expenses | | | 62,771 | | |
Total liabilities | | | 32,521,208 | | |
Net assets applicable to outstanding capital stock | | $ | 1,157,538,195 | | |
Represented by | |
Paid-in capital | | $ | 706,930,109 | | |
Excess of distributions over net investment income | | | (132,615 | ) | |
Accumulated net realized gain | | | 84,570,213 | | |
Unrealized appreciation (depreciation) on: | |
Investments | | | 366,174,810 | | |
Foreign currency translations | | | (4,322 | ) | |
Total — representing net assets applicable to outstanding capital stock | | $ | 1,157,538,195 | | |
The accompanying Notes to Financial Statements are an integral part of this statement.
Annual Report 2014
11
Columbia Marsico Focused Equities Fund
Statement of Assets and Liabilities (continued)
February 28, 2014
Class A | |
Net assets | | $ | 598,790,957 | | |
Shares outstanding | | | 28,224,332 | | |
Net asset value per share | | $ | 21.22 | | |
Maximum offering price per share(a) | | $ | 22.51 | | |
Class B | |
Net assets | | $ | 10,640,343 | | |
Shares outstanding | | | 596,582 | | |
Net asset value per share | | $ | 17.84 | | |
Class C | |
Net assets | | $ | 246,746,935 | | |
Shares outstanding | | | 13,755,671 | | |
Net asset value per share | | $ | 17.94 | | |
Class I | |
Net assets | | $ | 2,693 | | |
Shares outstanding | | | 121 | | |
Net asset value per share(b) | | $ | 22.18 | | |
Class R4 | |
Net assets | | $ | 5,254,586 | | |
Shares outstanding | | | 234,379 | | |
Net asset value per share | | $ | 22.42 | | |
Class R5 | |
Net assets | | $ | 6,220,251 | | |
Shares outstanding | | | 276,595 | | |
Net asset value per share | | $ | 22.49 | | |
Class Z | |
Net assets | | $ | 289,882,430 | | |
Shares outstanding | | | 13,154,591 | | |
Net asset value per share | | $ | 22.04 | | |
(a) The maximum offering price per share is calculated by dividing the net asset value per share by 1.0 minus the maximum sales charge of 5.75%.
(b) Net asset value per share rounds to this amount due to fractional shares outstanding.
The accompanying Notes to Financial Statements are an integral part of this statement.
Annual Report 2014
12
Columbia Marsico Focused Equities Fund
Statement of Operations
Year Ended February 28, 2014
Net investment income | |
Income: | |
Dividends — unaffiliated issuers | | $ | 15,078,830 | | |
Dividends — affiliated issuers | | | 23,657 | | |
Interest | | | 232 | | |
Foreign taxes withheld | | | (233,954 | ) | |
Total income | | | 14,868,765 | | |
Expenses: | |
Investment management fees | | | 8,815,272 | | |
Distribution and/or service fees | |
Class A | | | 1,824,136 | | |
Class B | | | 126,428 | | |
Class C | | | 2,350,314 | | |
Transfer agent fees | |
Class A | | | 1,490,681 | | |
Class B | | | 25,807 | | |
Class C | | | 480,310 | | |
Class R4 | | | 5,621 | | |
Class R5 | | | 21 | | |
Class Z | | | 686,324 | | |
Administration fees | | | 733,158 | | |
Compensation of board members | | | 53,414 | | |
Custodian fees | | | 17,310 | | |
Printing and postage fees | | | 114,730 | | |
Registration fees | | | 60,597 | | |
Professional fees | | | 42,167 | | |
Line of credit interest expense | | | 7,368 | | |
Other | | | 122,607 | | |
Total expenses | | | 16,956,265 | | |
Fees waived or expenses reimbursed by Investment Manager and its affiliates | | | (89 | ) | |
Expense reductions | | | (3,952 | ) | |
Total net expenses | | | 16,952,224 | | |
Net investment loss | | | (2,083,459 | ) | |
Realized and unrealized gain (loss) — net | |
Net realized gain (loss) on: | |
Investments | | | 374,679,472 | | |
Foreign currency translations | | | (19,793 | ) | |
Net realized gain | | | 374,659,679 | | |
Net change in unrealized appreciation (depreciation) on: | |
Investments | | | 27,366,002 | | |
Foreign currency translations | | | (4,322 | ) | |
Net change in unrealized appreciation (depreciation) | | | 27,361,680 | | |
Net realized and unrealized gain | | | 402,021,359 | | |
Net increase in net assets resulting from operations | | $ | 399,937,900 | | |
The accompanying Notes to Financial Statements are an integral part of this statement.
Annual Report 2014
13
Columbia Marsico Focused Equities Fund
Statement of Changes in Net Assets
| | | Year Ended
February 28,
2014(a) | | Year Ended
February 28,
2013(b) | |
Operations | |
Net investment income (loss) | | $ | (2,083,459 | ) | | $ | 4,819,757 | | |
Net realized gain | | | 374,659,679 | | | | 368,927,579 | | |
Net change in unrealized appreciation (depreciation) | | | 27,361,680 | | | | (253,060,145 | ) | |
Net increase in net assets resulting from operations | | | 399,937,900 | | | | 120,687,191 | | |
Distributions to shareholders | |
Net investment income | |
Class A | | | — | | | | (4,477,020 | ) | |
Class I | | | — | | | | (24 | ) | |
Class R4 | | | — | | | | (19 | ) | |
Class Z | | | — | | | | (2,956,813 | ) | |
Net realized gains | |
Class A | | | (170,605,553 | ) | | | (187,615,794 | ) | |
Class B | | | (3,454,473 | ) | | | (3,841,675 | ) | |
Class C | | | (67,788,644 | ) | | | (51,321,227 | ) | |
Class I | | | (751 | ) | | | (555 | ) | |
Class R4 | | | (908,593 | ) | | | (339 | ) | |
Class R5 | | | (467 | ) | | | — | | |
Class Z | | | (75,591,871 | ) | | | (95,628,685 | ) | |
Total distributions to shareholders | | | (318,350,352 | ) | | | (345,842,151 | ) | |
Increase (decrease) in net assets from capital stock activity | | | (501,168,509 | ) | | | (649,517,051 | ) | |
Total decrease in net assets | | | (419,580,961 | ) | | | (874,672,011 | ) | |
Net assets at beginning of year | | | 1,577,119,156 | | | | 2,451,791,167 | | |
Net assets at end of year | | $ | 1,157,538,195 | | | $ | 1,577,119,156 | | |
Excess of distributions over net investment income | | $ | (132,615 | ) | | $ | (2,335,566 | ) | |
(a) Class R5 shares are for the period from December 11, 2013 (commencement of operations) to February 28, 2014.
(b) Class R4 shares are for the period from November 8, 2012 (commencement of operations) to February 28, 2013.
The accompanying Notes to Financial Statements are an integral part of this statement.
Annual Report 2014
14
Columbia Marsico Focused Equities Fund
Statement of Changes in Net Assets (continued)
| | | Year Ended February 28, 2014(a) | | Year Ended February 28, 2013(b) | |
| | | Shares | | Dollars ($) | | Shares | | Dollars ($) | |
Capital stock activity | |
Class A shares | |
Subscriptions(c) | | | 7,067,886 | | | | 150,566,827 | | | | 6,980,940 | | | | 155,143,861 | | |
Distributions reinvested | | | 6,258,648 | | | | 125,665,169 | | | | 7,681,988 | | | | 157,483,656 | | |
Redemptions | | | (29,842,200 | ) | | | (664,540,582 | ) | | | (16,957,060 | ) | | | (388,145,892 | ) | |
Net decrease | | | (16,515,666 | ) | | | (388,308,586 | ) | | | (2,294,132 | ) | | | (75,518,375 | ) | |
Class B shares | |
Subscriptions | | | 102,567 | | | | 1,739,618 | | | | 115,842 | | | | 2,125,284 | | |
Distributions reinvested | | | 93,608 | | | | 1,579,933 | | | | 89,978 | | | | 1,641,505 | | |
Redemptions(c) | | | (407,274 | ) | | | (7,720,689 | ) | | | (483,235 | ) | | | (9,837,671 | ) | |
Net decrease | | | (211,099 | ) | | | (4,401,138 | ) | | | (277,415 | ) | | | (6,070,882 | ) | |
Class C shares | |
Subscriptions | | | 2,357,613 | | | | 40,917,705 | | | | 1,743,011 | | | | 32,705,231 | | |
Distributions reinvested | | | 1,885,234 | | | | 31,909,674 | | | | 1,301,180 | | | | 23,722,704 | | |
Redemptions | | | (2,735,924 | ) | | | (52,329,957 | ) | | | (2,730,710 | ) | | | (54,773,353 | ) | |
Net increase | | | 1,506,923 | | | | 20,497,422 | | | | 313,481 | | | | 1,654,582 | | |
Class R4 shares | |
Subscriptions | | | 210,609 | | | | 4,907,728 | | | | 110 | | | | 2,500 | | |
Distributions reinvested | | | 43,577 | | | | 907,917 | | | | — | | | | — | | |
Redemptions | | | (19,917 | ) | | | (458,531 | ) | | | — | | | | — | | |
Net increase | | | 234,269 | | | | 5,357,114 | | | | 110 | | | | 2,500 | | |
Class R5 shares | |
Subscriptions | | | 276,595 | | | | 6,200,928 | | | | — | | | | — | | |
Net increase | | | 276,595 | | | | 6,200,928 | | | | — | | | | — | | |
Class Z shares | |
Subscriptions | | | 2,967,890 | | | | 66,185,831 | | | | 5,199,659 | | | | 120,644,765 | | |
Distributions reinvested | | | 2,588,091 | | | | 53,355,729 | | | | 3,304,164 | | | | 70,353,848 | | |
Redemptions | | | (11,247,022 | ) | | | (260,055,809 | ) | | | (31,257,022 | ) | | | (760,583,489 | ) | |
Net decrease | | | (5,691,041 | ) | | | (140,514,249 | ) | | | (22,753,199 | ) | | | (569,584,876 | ) | |
Total net decrease | | | (20,400,019 | ) | | | (501,168,509 | ) | | | (25,011,155 | ) | | | (649,517,051 | ) | |
(a) Class R5 shares are for the period from December 11, 2013 (commencement of operations) to February 28, 2014.
(b) Class R4 shares are for the period from November 8, 2012 (commencement of operations) to February 28, 2013.
(c) Includes conversions of Class B shares to Class A shares, if any.
The accompanying Notes to Financial Statements are an integral part of this statement.
Annual Report 2014
15
Columbia Marsico Focused Equities Fund
The following tables are intended to help you understand the Fund's financial performance. Certain information reflects financial results for a single share of a class held for the periods shown. Per share net investment income (loss) amounts are calculated based on average shares outstanding during the period. Total return assumes reinvestment of all dividends and distributions, if any. Total return does not reflect payment of sales charges, if any, and is not annualized for periods of less than one year.
| | | | | Year Ended | | | |
| | | Year Ended February 28, | | February 29, | | Year Ended February 28, | |
Class A | | 2014 | | 2013 | | 2012 | | 2011 | | 2010 | |
Per share data | |
Net asset value, beginning of period | | $ | 20.84 | | | $ | 24.18 | | | $ | 23.53 | | | $ | 18.99 | | | $ | 12.76 | | |
Income from investment operations: | |
Net investment income (loss) | | | (0.02 | ) | | | 0.06 | | | | 0.02 | | | | 0.00 | (a) | | | 0.01 | | |
Net realized and unrealized gain | | | 6.50 | | | | 1.28 | | | | 0.95 | | | | 4.54 | | | | 6.25 | | |
Total from investment operations | | | 6.48 | | | | 1.34 | | | | 0.97 | | | | 4.54 | | | | 6.26 | | |
Less distributions to shareholders: | |
Net investment income | | | — | | | | (0.11 | ) | | | (0.01 | ) | | | — | | | | (0.02 | ) | |
Net realized gains | | | (6.10 | ) | | | (4.57 | ) | | | (0.31 | ) | | | — | | | | — | | |
Tax return of capital | | | — | | | | — | | | | — | | | | — | | | | (0.01 | ) | |
Total distributions to shareholders | | | (6.10 | ) | | | (4.68 | ) | | | (0.32 | ) | | | — | | | | (0.03 | ) | |
Proceeds from regulatory settlements | | | — | | | | — | | | | — | | | | — | | | | 0.00 | (a) | |
Net asset value, end of period | | $ | 21.22 | | | $ | 20.84 | | | $ | 24.18 | | | $ | 23.53 | | | $ | 18.99 | | |
Total return | | | 34.77 | % | | | 6.84 | % | | | 4.26 | % | | | 23.91 | % | | | 49.12 | % | |
Ratios to average net assets(b) | |
Total gross expenses | | | 1.21 | %(c) | | | 1.34 | % | | | 1.36 | % | | | 1.30 | %(c) | | | 1.31 | %(c) | |
Total net expenses(d) | | | 1.21 | %(c)(e) | | | 1.29 | %(e) | | | 1.36 | %(e) | | | 1.30 | %(c)(e) | | | 1.30 | %(c)(e) | |
Net investment income (loss) | | | (0.07 | %) | | | 0.28 | % | | | 0.09 | % | | | 0.01 | % | | | 0.03 | % | |
Supplemental data | |
Net assets, end of period (in thousands) | | $ | 598,791 | | | $ | 932,546 | | | $ | 1,137,240 | | | $ | 1,370,199 | | | $ | 1,599,661 | | |
Portfolio turnover | | | 95 | % | | | 76 | % | | | 90 | % | | | 77 | % | | | 77 | % | |
Notes to Financial Highlights
(a) Rounds to zero.
(b) In addition to the fees and expenses which the Fund bears directly, the Fund indirectly bears a pro rata share of the fees and expenses of the acquired funds in which it invests. Such indirect expenses are not included in the reported expense ratios.
(c) Ratios include line of credit interest expense which rounds to less than 0.01%.
(d) Total net expenses include the impact of certain waivers/reimbursements made by the Investment Manager and certain of its affiliates, if applicable.
(e) The benefits derived from expense reductions had an impact of less than 0.01%.
The accompanying Notes to Financial Statements are an integral part of this statement.
Annual Report 2014
16
Columbia Marsico Focused Equities Fund
Financial Highlights (continued)
| | | | | Year Ended | | | |
| | | Year Ended February 28, | | February 29, | | Year Ended February 28, | |
Class B | | 2014 | | 2013 | | 2012 | | 2011 | | 2010 | |
Per share data | |
Net asset value, beginning of period | | $ | 18.35 | | | $ | 21.88 | | | $ | 21.48 | | | $ | 17.46 | | | $ | 11.80 | | |
Income from investment operations: | |
Net investment loss | | | (0.16 | ) | | | (0.09 | ) | | | (0.15 | ) | | | (0.14 | ) | | | (0.11 | ) | |
Net realized and unrealized gain | | | 5.61 | | | | 1.13 | | | | 0.86 | | | | 4.16 | | | | 5.77 | | |
Total from investment operations | | | 5.45 | | | | 1.04 | | | | 0.71 | | | | 4.02 | | | | 5.66 | | |
Less distributions to shareholders: | |
Net realized gains | | | (5.96 | ) | | | (4.57 | ) | | | (0.31 | ) | | | — | | | | — | | |
Tax return of capital | | | — | | | | — | | | | — | | | | — | | | | (0.00 | )(a) | |
Total distributions to shareholders | | | (5.96 | ) | | | (4.57 | ) | | | (0.31 | ) | | | — | | | | (0.00 | )(a) | |
Proceeds from regulatory settlements | | | — | | | | — | | | | — | | | | — | | | | 0.00 | (a) | |
Net asset value, end of period | | $ | 17.84 | | | $ | 18.35 | | | $ | 21.88 | | | $ | 21.48 | | | $ | 17.46 | | |
Total return | | | 33.71 | % | | | 6.09 | % | | | 3.44 | % | | | 23.02 | % | | | 48.02 | % | |
Ratios to average net assets(b) | |
Total gross expenses | | | 1.96 | %(c) | | | 2.09 | % | | | 2.12 | % | | | 2.05 | %(c) | | | 2.06 | %(c) | |
Total net expenses(d) | | | 1.96 | %(c)(e) | | | 2.04 | %(e) | | | 2.12 | %(e) | | | 2.05 | %(c)(e) | | | 2.05 | %(c)(e) | |
Net investment loss | | | (0.84 | %) | | | (0.46 | %) | | | (0.70 | %) | | | (0.74 | %) | | | (0.72 | %) | |
Supplemental data | |
Net assets, end of period (in thousands) | | $ | 10,640 | | | $ | 14,818 | | | $ | 23,745 | | | $ | 45,196 | | | $ | 62,935 | | |
Portfolio turnover | | | 95 | % | | | 76 | % | | | 90 | % | | | 77 | % | | | 77 | % | |
Notes to Financial Highlights
(a) Rounds to zero.
(b) In addition to the fees and expenses which the Fund bears directly, the Fund indirectly bears a pro rata share of the fees and expenses of the acquired funds in which it invests. Such indirect expenses are not included in the reported expense ratios.
(c) Ratios include line of credit interest expense which rounds to less than 0.01%.
(d) Total net expenses include the impact of certain waivers/reimbursements made by the Investment Manager and certain of its affiliates, if applicable.
(e) The benefits derived from expense reductions had an impact of less than 0.01%.
The accompanying Notes to Financial Statements are an integral part of this statement.
Annual Report 2014
17
Columbia Marsico Focused Equities Fund
Financial Highlights (continued)
| | | | | Year Ended | | | |
| | | Year Ended February 28, | | February 29, | | Year Ended February 28, | |
Class C | | 2014 | | 2013 | | 2012 | | 2011 | | 2010 | |
Per share data | |
Net asset value, beginning of period | | $ | 18.42 | | | $ | 21.96 | | | $ | 21.55 | | | $ | 17.52 | | | $ | 11.84 | | |
Income from investment operations: | |
Net investment loss | | | (0.16 | ) | | | (0.10 | ) | | | (0.14 | ) | | | (0.14 | ) | | | (0.11 | ) | |
Net realized and unrealized gain | | | 5.64 | | | | 1.13 | | | | 0.86 | | | | 4.17 | | | | 5.79 | | |
Total from investment operations | | | 5.48 | | | | 1.03 | | | | 0.72 | | | | 4.03 | | | | 5.68 | | |
Less distributions to shareholders: | |
Net realized gains | | | (5.96 | ) | | | (4.57 | ) | | | (0.31 | ) | | | — | | | | — | | |
Tax return of capital | | | — | | | | — | | | | — | | | | — | | | | (0.00 | )(a) | |
Total distributions to shareholders | | | (5.96 | ) | | | (4.57 | ) | | | (0.31 | ) | | | — | | | | (0.00 | )(a) | |
Proceeds from regulatory settlements | | | — | | | | — | | | | — | | | | — | | | | 0.00 | (a) | |
Net asset value, end of period | | $ | 17.94 | �� | | $ | 18.42 | | | $ | 21.96 | | | $ | 21.55 | | | $ | 17.52 | | |
Total return | | | 33.75 | % | | | 6.02 | % | | | 3.47 | % | | | 23.00 | % | | | 48.02 | % | |
Ratios to average net assets(b) | |
Total gross expenses | | | 1.96 | %(c) | | | 2.09 | % | | | 2.11 | % | | | 2.05 | %(c) | | | 2.06 | %(c) | |
Total net expenses(d) | | | 1.96 | %(c)(e) | | | 2.04 | %(e) | | | 2.11 | %(e) | | | 2.05 | %(c)(e) | | | 2.05 | %(c)(e) | |
Net investment loss | | | (0.85 | %) | | | (0.47 | %) | | | (0.66 | %) | | | (0.73 | %) | | | (0.72 | %) | |
Supplemental data | |
Net assets, end of period (in thousands) | | $ | 246,747 | | | $ | 225,678 | | | $ | 262,048 | | | $ | 304,857 | | | $ | 298,344 | | |
Portfolio turnover | | | 95 | % | | | 76 | % | | | 90 | % | | | 77 | % | | | 77 | % | |
Notes to Financial Highlights
(a) Rounds to zero.
(b) In addition to the fees and expenses which the Fund bears directly, the Fund indirectly bears a pro rata share of the fees and expenses of the acquired funds in which it invests. Such indirect expenses are not included in the reported expense ratios.
(c) Ratios include line of credit interest expense which rounds to less than 0.01%.
(d) Total net expenses include the impact of certain waivers/reimbursements made by the Investment Manager and certain of its affiliates, if applicable.
(e) The benefits derived from expense reductions had an impact of less than 0.01%.
The accompanying Notes to Financial Statements are an integral part of this statement.
Annual Report 2014
18
Columbia Marsico Focused Equities Fund
Financial Highlights (continued)
| | | | | Year Ended | | Year Ended | |
| | | Year Ended February 28, | | February 29, | | February 28, | |
Class I | | 2014 | | 2013 | | 2012 | | 2011(a) | |
Per share data | |
Net asset value, beginning of period | | $ | 21.53 | | | $ | 24.81 | | | $ | 24.04 | | | $ | 20.59 | | |
Income from investment operations: | |
Net investment income | | | 0.09 | | | | 0.17 | | | | 0.10 | | | | 0.00 | (b) | |
Net realized and unrealized gain | | | 6.74 | | | | 1.32 | | | | 1.07 | | | | 3.52 | | |
Total from investment operations | | | 6.83 | | | | 1.49 | | | | 1.17 | | | | 3.52 | | |
Less distributions to shareholders: | |
Net investment income | | | — | | | | (0.20 | ) | | | (0.09 | ) | | | (0.07 | ) | |
Net realized gains | | | (6.18 | ) | | | (4.57 | ) | | | (0.31 | ) | | | — | | |
Total distributions to shareholders | | | (6.18 | ) | | | (4.77 | ) | | | (0.40 | ) | | | (0.07 | ) | |
Net asset value, end of period | | $ | 22.18 | | | $ | 21.53 | | | $ | 24.81 | | | $ | 24.04 | | |
Total return | | | 35.39 | % | | | 7.29 | % | | | 5.04 | % | | | 17.09 | % | |
Ratios to average net assets(c) | |
Total gross expenses | | | 0.73 | %(d) | | | 0.88 | % | | | 0.91 | % | | | 0.89 | %(e) | |
Total net expenses(f) | | | 0.73 | %(d) | | | 0.86 | % | | | 0.91 | %(g) | | | 0.89 | %(e)(g) | |
Net investment income | | | 0.40 | % | | | 0.71 | % | | | 0.44 | % | | | 0.00 | %(b)(e) | |
Supplemental data | |
Net assets, end of period (in thousands) | | $ | 3 | | | $ | 3 | | | $ | 3 | | | $ | 28,852 | | |
Portfolio turnover | | | 95 | % | | | 76 | % | | | 90 | % | | | 77 | % | |
Notes to Financial Highlights
(a) For the period from September 27, 2010 (commencement of operations) to February 28, 2011.
(b) Rounds to zero.
(c) In addition to the fees and expenses which the Fund bears directly, the Fund indirectly bears a pro rata share of the fees and expenses of the acquired funds in which it invests. Such indirect expenses are not included in the reported expense ratios.
(d) Ratios include line of credit interest expense which rounds to less than 0.01%.
(e) Annualized.
(f) Total net expenses include the impact of certain waivers/reimbursements made by the Investment Manager and certain of its affiliates, if applicable.
(g) The benefits derived from expense reductions had an impact of less than 0.01%.
The accompanying Notes to Financial Statements are an integral part of this statement.
Annual Report 2014
19
Columbia Marsico Focused Equities Fund
Financial Highlights (continued)
| | | Year Ended February 28, | |
Class R4 | | 2014 | | 2013(a) | |
Per share data | |
Net asset value, beginning of period | | $ | 21.72 | | | $ | 22.72 | | |
Income from investment operations: | |
Net investment income | | | 0.00 | (b) | | | 0.01 | | |
Net realized and unrealized gain | | | 6.84 | | | | 2.25 | | |
Total from investment operations | | | 6.84 | | | | 2.26 | | |
Less distributions to shareholders: | |
Net investment income | | | — | | | | (0.18 | ) | |
Net realized gains | | | (6.14 | ) | | | (3.08 | ) | |
Total distributions to shareholders | | | (6.14 | ) | | | (3.26 | ) | |
Net asset value, end of period | | $ | 22.42 | | | $ | 21.72 | | |
Total return | | | 35.07 | % | | | 10.88 | % | |
Ratios to average net assets(c) | |
Total gross expenses | | | 0.97 | %(d) | | | 1.03 | %(e) | |
Total net expenses(f) | | | 0.97 | %(d)(g) | | | 0.99 | %(e) | |
Net investment income | | | 0.02 | % | | | 0.18 | %(e) | |
Supplemental data | |
Net assets, end of period (in thousands) | | $ | 5,255 | | | $ | 2 | | |
Portfolio turnover | | | 95 | % | | | 76 | % | |
Notes to Financial Highlights
(a) For the period from November 8, 2012 (commencement of operations) to February 28, 2013.
(b) Rounds to zero.
(c) In addition to the fees and expenses which the Fund bears directly, the Fund indirectly bears a pro rata share of the fees and expenses of the acquired funds in which it invests. Such indirect expenses are not included in the reported expense ratios.
(d) Ratios include line of credit interest expense which rounds to less than 0.01%.
(e) Annualized.
(f) Total net expenses include the impact of certain waivers/reimbursements made by the Investment Manager and certain of its affiliates, if applicable.
(g) The benefits derived from expense reductions had an impact of less than 0.01%.
The accompanying Notes to Financial Statements are an integral part of this statement.
Annual Report 2014
20
Columbia Marsico Focused Equities Fund
Financial Highlights (continued)
Class R5 | | Year Ended
February 28,
2014(a) | |
Per share data | |
Net asset value, beginning of period | | $ | 25.48 | | |
Income from investment operations: | |
Net investment income | | | (0.00 | )(b) | |
Net realized and unrealized gain | | | 1.77 | | |
Total from investment operations | | | 1.77 | | |
Less distributions to shareholders: | |
Net realized gains | | | (4.76 | ) | |
Total distributions to shareholders | | | (4.76 | ) | |
Net asset value, end of period | | $ | 22.49 | | |
Total return | | | 8.59 | % | |
Ratios to average net assets(c) | |
Total gross expenses | | | 0.81 | %(d)(e) | |
Total net expenses(f) | | | 0.81 | %(d)(e) | |
Net investment loss | | | (0.02 | %)(d) | |
Supplemental data | |
Net assets, end of period (in thousands) | | $ | 6,220 | | |
Portfolio turnover | | | 95 | % | |
Notes to Financial Highlights
(a) For the period from December 11, 2013 (commencement of operations) to February 28, 2014.
(b) Rounds to zero.
(c) In addition to the fees and expenses which the Fund bears directly, the Fund indirectly bears a pro rata share of the fees and expenses of the acquired funds in which it invests. Such indirect expenses are not included in the reported expense ratios.
(d) Annualized.
(e) Ratios include line of credit interest expense which rounds to less than 0.01%.
(f) Total net expenses include the impact of certain waivers/reimbursements made by the Investment Manager and certain of its affiliates, if applicable.
The accompanying Notes to Financial Statements are an integral part of this statement.
Annual Report 2014
21
Columbia Marsico Focused Equities Fund
Financial Highlights (continued)
| | | | | Year Ended | | | |
| | | Year Ended February 28, | | February 29, | | Year Ended February 28, | |
Class Z | | 2014 | | 2013 | | 2012 | | 2011 | | 2010 | |
Per share data | |
Net asset value, beginning of period | | $ | 21.44 | | | $ | 24.73 | | | $ | 24.05 | | | $ | 19.39 | | | $ | 13.02 | | |
Income from investment operations: | |
Net investment income | | | 0.04 | | | | 0.13 | | | | 0.08 | | | | 0.06 | | | | 0.05 | | |
Net realized and unrealized gain | | | 6.70 | | | | 1.31 | | | | 0.97 | | | | 4.64 | | | | 6.39 | | |
Total from investment operations | | | 6.74 | | | | 1.44 | | | | 1.05 | | | | 4.70 | | | | 6.44 | | |
Less distributions to shareholders: | |
Net investment income | | | — | | | | (0.16 | ) | | | (0.06 | ) | | | (0.04 | ) | | | (0.05 | ) | |
Net realized gains | | | (6.14 | ) | | | (4.57 | ) | | | (0.31 | ) | | | — | | | | — | | |
Tax return of capital | | | — | | | | — | | | | — | | | | — | | | | (0.02 | ) | |
Total distributions to shareholders | | | (6.14 | ) | | | (4.73 | ) | | | (0.37 | ) | | | (0.04 | ) | | | (0.07 | ) | |
Proceeds from regulatory settlements | | | — | | | | — | | | | — | | | | — | | | | 0.00 | (a) | |
Net asset value, end of period | | $ | 22.04 | | | $ | 21.44 | | | $ | 24.73 | | | $ | 24.05 | | | $ | 19.39 | | |
Total return | | | 35.08 | % | | | 7.12 | % | | | 4.51 | % | | | 24.23 | % | | | 49.53 | % | |
Ratios to average net assets(b) | |
Total gross expenses | | | 0.96 | %(c) | | | 1.09 | % | | | 1.11 | % | | | 1.05 | %(c) | | | 1.06 | %(c) | |
Total net expenses(d) | | | 0.96 | %(c)(e) | | | 1.04 | %(e) | | | 1.11 | %(e) | | | 1.05 | %(c)(e) | | | 1.05 | %(c)(e) | |
Net investment income | | | 0.16 | % | | | 0.55 | % | | | 0.34 | % | | | 0.28 | % | | | 0.28 | % | |
Supplemental data | |
Net assets, end of period (in thousands) | | $ | 289,882 | | | $ | 404,071 | | | $ | 1,028,756 | | | $ | 1,101,015 | | | $ | 995,452 | | |
Portfolio turnover | | | 95 | % | | | 76 | % | | | 90 | % | | | 77 | % | | | 77 | % | |
Notes to Financial Highlights
(a) Rounds to zero.
(b) In addition to the fees and expenses which the Fund bears directly, the Fund indirectly bears a pro rata share of the fees and expenses of the acquired funds in which it invests. Such indirect expenses are not included in the reported expense ratios.
(c) Ratios include line of credit interest expense which rounds to less than 0.01%.
(d) Total net expenses include the impact of certain waivers/reimbursements made by the Investment Manager and certain of its affiliates, if applicable.
(e) The benefits derived from expense reductions had an impact of less than 0.01%.
The accompanying Notes to Financial Statements are an integral part of this statement.
Annual Report 2014
22
Columbia Marsico Focused Equities Fund
Notes to Financial Statements
February 28, 2014
Note 1. Organization
Columbia Marsico Focused Equities Fund (the Fund), a series of Columbia Funds Series Trust (the Trust), is a non-diversified fund. The Trust is registered under the Investment Company Act of 1940, as amended (the 1940 Act), as an open-end management investment company organized as a Delaware statutory trust.
Fund Shares
The Trust may issue an unlimited number of shares (without par value). The Fund offers Class A, Class B, Class C, Class I, Class R4, Class R5 and Class Z shares. Although all share classes generally have identical voting, dividend and liquidation rights, each share class votes separately when required by law. Different share classes pay different distribution amounts to the extent the expenses of such share classes differ, and distributions in liquidation will be proportional to the net asset value of each share class. Each share class has its own expense structure and sales charges, as applicable.
Class A shares are subject to a maximum front-end sales charge of 5.75% based on the initial investment amount. Class A shares purchased without an initial sales charge in accounts aggregating $1 million to $50 million at the time of purchase are subject to a contingent deferred sales charge (CDSC) if the shares are sold within 18 months of purchase, charged as follows: 1.00% CDSC if redeemed within 12 months of purchase, and 0.50% CDSC if redeemed more than 12, but less than 18, months after purchase.
Class B shares may be subject to a maximum CDSC of 5.00% based upon the holding period after purchase. Class B shares will generally convert to Class A shares eight years after purchase. The Fund no longer accepts investments by new or existing investors in the Fund's Class B shares, except in connection with the reinvestment of any dividend and/or capital gain distributions in Class B shares of the Fund and exchanges by existing Class B shareholders of certain other funds within the Columbia Family of Funds.
Class C shares are subject to a 1.00% CDSC on shares redeemed within one year of purchase.
Class I shares are not subject to sales charges and are available only to the Columbia Family of Funds.
Class R4 shares are not subject to sales charges and are generally available only to omnibus retirement plans and certain other eligible investors.
Class R5 shares are not subject to sales charges and are generally available only to investors purchasing through authorized investment professionals and omnibus retirement plans. Class R5 shares commenced operations on December 11, 2013.
Class Z shares are not subject to sales charges and are available only to certain eligible investors, which are subject to different investment minimums.
Note 2. Summary of Significant Accounting Policies
Use of Estimates
The preparation of financial statements in accordance with U.S. generally accepted accounting principles (GAAP) requires management to make certain estimates and assumptions that affect the reported amounts of assets and liabilities, the disclosure of contingent assets and liabilities at the date of the financial statements and the reported amounts of revenue and expenses during the reporting period. Actual results could differ from those estimates.
The following is a summary of significant accounting policies consistently followed by the Fund in the preparation of its financial statements.
Security Valuation
All equity securities are valued at the close of business of the New York Stock Exchange (NYSE). Equity securities are valued at the last quoted sales price on the principal exchange or market on which they trade, except for securities traded on the NASDAQ Stock Market, which are valued at the NASDAQ official close price. Unlisted securities or listed securities for which there were no sales during the day are valued at the mean of the latest quoted bid and ask prices on such exchanges or markets.
Foreign equity securities are valued based on quotations from the principal market in which such securities are normally traded. If any foreign share prices are not readily available as a result of limited share activity the securities are valued at the mean of the latest quoted bid and ask prices on such exchanges or markets. Foreign currency exchange rates are generally determined at 4:00 p.m. Eastern (U.S.) time. However, many securities markets and exchanges outside the U.S. close prior to the close of the NYSE; therefore, the closing prices for securities in such markets or on such exchanges may not fully reflect events that occur after such close but before the close of the NYSE. In those situations, foreign securities will be fair valued pursuant to the policy adopted by the Board of Trustees (the Board), including utilizing a third party pricing service to determine these fair values. The third party pricing service takes into account multiple factors, including, but not limited to, movements in the U.S. securities markets, certain depositary receipts, futures contracts and foreign exchange rates that have occurred subsequent to the close of the foreign exchange or market, to determine a good faith estimate that reasonably reflects the
Annual Report 2014
23
Columbia Marsico Focused Equities Fund
Notes to Financial Statements (continued)
February 28, 2014
current market conditions as of the close of the NYSE. The fair value of a security is likely to be different from the quoted or published price, if available.
Investments in open-end investment companies, including money market funds, are valued at net asset value.
Investments for which market quotations are not readily available, or that have quotations which management believes are not reliable, are valued at fair value as determined in good faith under consistently applied procedures established by and under the general supervision of the Board. If a security or class of securities (such as foreign securities) is valued at fair value, such value is likely to be different from the last quoted market price for the security.
The determination of fair value often requires significant judgment. To determine fair value, management may use assumptions including but not limited to future cash flows and estimated risk premiums. Multiple inputs from various sources may be used to determine fair value.
Foreign Currency Transactions and Translations
The values of all assets and liabilities denominated in foreign currencies are translated into U.S. dollars at that day's exchange rates. Net realized and unrealized gains (losses) on foreign currency transactions and translations include gains (losses) arising from the fluctuation in exchange rates between trade and settlement dates on securities transactions, gains (losses) arising from the disposition of foreign currency and currency gains (losses) between the accrual and payment dates on dividends, interest income and foreign withholding taxes.
For financial statement purposes, the Fund does not distinguish that portion of gains (losses) on investments which is due to changes in foreign exchange rates from that which is due to changes in market prices of the investments. Such fluctuations are included with the net realized and unrealized gains (losses) on investments in the Statement of Operations.
Security Transactions
Security transactions are accounted for on the trade date. Cost is determined and gains (losses) are based upon the specific identification method for both financial statement and federal income tax purposes.
Income Recognition
Corporate actions and dividend income are generally recorded net of any non-reclaimable tax withholdings, on the ex-dividend date or upon receipt of ex-dividend notification in the case of certain foreign securities.
The Fund may receive distributions from holdings in business development companies (BDCs), exchange traded funds (ETFs) and real estate investment trusts (REITs), which report
information on the character of their distributions annually. These distributions are allocated to dividend income, capital gain and return of capital based on estimates made by the Fund's management if actual information has not yet been reported. Return of capital is recorded as a reduction of the cost basis of securities held. If the Fund no longer owns the applicable securities, return of capital is recorded as a realized gain. Management's estimates are subsequently adjusted when the actual character of the distributions is disclosed by the BDCs, ETFs and REITs, which could result in a proportionate change in return of capital to shareholders.
Awards from class action litigation are recorded as a reduction of cost basis if the Fund still owns the applicable securities on the payment date. If the Fund no longer owns the applicable securities, the proceeds are recorded as realized gains.
Expenses
General expenses of the Trust are allocated to the Fund and other funds of the Trust based upon relative net assets or other expense allocation methodologies determined by the nature of the expense. Expenses directly attributable to the Fund are charged to the Fund. Expenses directly attributable to a specific class of shares are charged to that share class.
Determination of Class Net Asset Value
All income, expenses (other than class-specific expenses, which are charged to that share class, as shown in the Statement of Operations) and realized and unrealized gains (losses) are allocated to each class of the Fund on a daily basis, based on the relative net assets of each class, for purposes of determining the net asset value of each class.
Federal Income Tax Status
The Fund intends to qualify each year as a regulated investment company under Subchapter M of the Internal Revenue Code, as amended, and will distribute substantially all of its taxable income (including net short-term capital gains), if any, for its tax year, and as such will not be subject to federal income taxes. In addition, the Fund intends to distribute in each calendar year substantially all of its net investment income, capital gains and certain other amounts, if any, such that the Fund should not be subject to federal excise tax. Therefore, no federal income or excise tax provision is recorded.
Foreign Taxes
The Fund may be subject to foreign taxes on income, gains on investments or currency repatriation, a portion of which may be recoverable. The Fund will accrue such taxes and recoveries, as applicable, based upon its current interpretation of tax rules and regulations that exist in the markets in which it invests.
Annual Report 2014
24
Columbia Marsico Focused Equities Fund
Notes to Financial Statements (continued)
February 28, 2014
Realized gains in certain countries may be subject to foreign taxes at the Fund level, based on statutory rates. The Fund accrues for such foreign taxes on realized and unrealized gains at the appropriate rate for each jurisdiction, as applicable. The amount, if any, is disclosed as a liability on the Statement of Assets and Liabilities.
Distributions to Shareholders
Distributions from net investment income, if any, are declared and paid semi-annually. Net realized capital gains, if any, are distributed at least annually. Income distributions and capital gain distributions are determined in accordance with federal income tax regulations, which may differ from GAAP.
Guarantees and Indemnifications
Under the Trust's organizational documents and, in some cases, by contract, its officers and trustees are indemnified against certain liabilities arising out of the performance of their duties to the Trust or its funds. In addition, certain of the Fund's contracts with its service providers contain general indemnification clauses. The Fund's maximum exposure under these arrangements is unknown since the amount of any future claims that may be made against the Fund cannot be determined, and the Fund has no historical basis for predicting the likelihood of any such claims.
Note 3. Fees and Compensation Paid to Affiliates
Investment Management Fees
Under an Investment Management Services Agreement, Columbia Management Investment Advisers, LLC (the Investment Manager), a wholly-owned subsidiary of Ameriprise Financial, Inc. (Ameriprise Financial), is responsible for the ultimate oversight of investments made by the Fund. The Fund's subadviser (see Subadvisory Agreement below) has the primary responsibility for the day-to-day portfolio management of the Fund. The investment management fee is an annual fee that is equal to a percentage of the Fund's average daily net assets that declines from 0.71% to 0.54% as the Fund's net assets increase. The effective investment management fee rate for the year ended February 28, 2014 was 0.67% of the Fund's average daily net assets.
Subadvisory Agreement
The Investment Manager has entered into a Subadvisory Agreement with Marsico Capital Management, LLC (Marsico) to subadvise the assets of the Fund. The Investment Manager compensates Marsico to manage the investment of the Fund's assets.
Administration Fees
Under an Administrative Services Agreement, the Investment Manager also serves as the Fund Administrator. The Fund pays the Fund Administrator an annual fee for administration and accounting services equal to a percentage of the Fund's average daily net assets that declines from 0.06% to 0.03% as the Fund's net assets increase. The effective administration fee rate for the year ended February 28, 2014 was 0.06% of the Fund's average daily net assets.
Other Expenses
Other expenses are for, among other things, miscellaneous expenses of the Fund or the Board, including payments to a company providing limited administrative services to the Fund and the Board. That company's expenses include boardroom and office expense, employee compensation, employee health and retirement benefits, and certain other expenses. For the year ended February 28, 2014, other expenses paid to this company were $4,660.
Compensation of Board Members
Board members are compensated for their services to the Fund as disclosed in the Statement of Operations. Under a Deferred Compensation Plan (the Plan), the Board members who are not "interested persons" of the Fund, as defined under the 1940 Act, may elect to defer payment of up to 100% of their compensation. Deferred amounts are treated as though equivalent dollar amounts had been invested in shares of certain funds managed by the Investment Manager. The Fund's liability for these amounts is adjusted for market value changes and remains in the Fund until distributed in accordance with the Plan.
Transfer Agent Fees
Under a Transfer and Dividend Disbursing Agent Agreement, Columbia Management Investment Services Corp. (the Transfer Agent), an affiliate of the Investment Manager and a wholly-owned subsidiary of Ameriprise Financial, is responsible for providing transfer agency services to the Fund. The Transfer Agent has contracted with Boston Financial Data Services (BFDS) to serve as sub-transfer agent.
The Transfer Agent receives monthly account-based service fees based on the number of open accounts and also receives sub-transfer agency fees based on a percentage of the average aggregate value of the Fund's shares maintained in omnibus accounts (other than omnibus accounts for which American Enterprise Investment Services Inc. is the broker of record or accounts where the beneficial shareholder is a customer of Ameriprise Financial Services, Inc., which are paid a per account fee). The Transfer Agent pays the fees of BFDS for
Annual Report 2014
25
Columbia Marsico Focused Equities Fund
Notes to Financial Statements (continued)
February 28, 2014
services as sub-transfer agent and is not entitled to reimbursement for such fees from the Fund (with the exception of out-of-pocket fees).
The Transfer Agent also receives compensation from fees for various shareholder services and reimbursements for certain out-of-pocket fees. Class I shares do not pay transfer agent fees. Total transfer agent fees for Class R5 shares are subject to an annual limitation of not more than 0.05% of the average daily net assets attributable to Class R5 shares.
For the year ended February 28, 2014, the Fund's effective transfer agent fee rates as a percentage of average daily net assets of each class were as follows:
Class A | | | 0.20 | % | |
Class B | | | 0.20 | | |
Class C | | | 0.20 | | |
Class R4 | | | 0.21 | | |
Class R5* | | | 0.05 | | |
Class Z | | | 0.20 | | |
*Annualized.
An annual minimum account balance fee of $20 may apply to certain accounts with a value below the applicable share class's initial minimum investment requirements to reduce the impact of small accounts on transfer agent fees. These minimum account balance fees are recorded as part of expense reductions in the Statement of Operations. For the year ended February 28, 2014, these minimum account balance fees reduced total expenses by $3,952.
Distribution and Service Fees
The Fund has an agreement with Columbia Management Investment Distributors, Inc. (the Distributor), an affiliate of the Investment Manager and a wholly-owned subsidiary of Ameriprise Financial, for distribution and shareholder services. The Board has approved, and the Fund has adopted, distribution and shareholder service plans (the Plans) applicable to certain share classes, which set the distribution and service fees for the Fund. These fees are calculated daily and are intended to compensate the Distributor and/or eligible selling and/or servicing agents for selling shares of the Fund and providing services to investors.
Under the Plans, the Fund pays a monthly combined distribution and service fee to the Distributor at the maximum annual rate of 0.25% of the average daily net assets attributable to Class A shares of the Fund. Also under the Plans, the Fund pays a monthly service fee at the maximum annual rate of 0.25% of the average daily net assets attributable to Class B and Class C shares of the Fund and the
payment of a monthly distribution fee at the maximum annual rate of 0.75% of the average daily net assets attributable to Class B and Class C shares of the Fund.
Sales Charges
Sales charges, including front-end charges and CDSCs, received by the Distributor for distributing Fund shares were $223,410 for Class A, $4,833 for Class B and $5,299 for Class C shares for the year ended February 28, 2014.
Expenses Waived/Reimbursed by the Investment Manager and its Affiliates
The Investment Manager and certain of its affiliates have contractually agreed to waive fees and/or reimburse expenses (excluding certain fees and expenses described below) for the periods disclosed below, unless sooner terminated at the sole discretion of the Board, so that the Fund's net operating expenses, after giving effect to fees waived/expenses reimbursed and any balance credits and/or overdraft charges from the Fund's custodian, do not exceed the following annual rates as a percentage of the class' average daily net assets:
| | | July 1, 2013
through
June 30, 2014 | | Prior to
July 1, 2013 | |
Class A | | | 1.24 | % | | | 1.25 | % | |
Class B | | | 1.99 | | | | 2.00 | | |
Class C | | | 1.99 | | | | 2.00 | | |
Class I | | | 0.84 | | | | 0.84 | | |
Class R4 | | | 0.99 | | | | 1.00 | | |
Class R5 | | | 0.89 | * | | | — | | |
Class Z | | | 0.99 | | | | 1.00 | | |
*Annual rate is contractual from December 11, 2013 (the commencement of operations of Class R5 shares) through June 30, 2014.
Under the agreement governing these fee waivers and/or expense reimbursement arrangements, the following fees and expenses are excluded from the waiver/reimbursement commitment, and therefore will be paid by the Fund, if applicable: taxes (including foreign transaction taxes), expenses associated with investments in affiliated and non-affiliated pooled investment vehicles (including mutual funds and exchange traded funds), transaction costs and brokerage commissions, costs related to any securities lending program, dividend expenses associated with securities sold short, inverse floater program fees and expenses, transaction charges and interest on borrowed money, interest, extraordinary expenses and any other expenses the exclusion of which is specifically approved by the Board. This agreement may be modified or amended only with approval from all parties.
Annual Report 2014
26
Columbia Marsico Focused Equities Fund
Notes to Financial Statements (continued)
February 28, 2014
Note 4. Federal Tax Information
The timing and character of income and capital gain distributions are determined in accordance with income tax regulations, which may differ from GAAP because of temporary or permanent book to tax differences.
At February 28, 2014, these differences are primarily due to differing treatment for deferral/reversal of wash sales losses, Trustees' deferred compensation, foreign currency transactions, net operating loss reclassification and earnings and profits distributed to shareholders on the redemption of shares. To the extent these differences are permanent, reclassifications are made among the components of the Fund's net assets in the Statement of Assets and Liabilities. Temporary differences do not require reclassifications. In the Statement of Assets and Liabilities the following reclassifications were made:
Excess of distributions over net investment income | | $ | 4,286,410 | | |
Accumulated net realized gain | | | (71,322,553 | ) | |
Paid-in capital | | | 67,036,143 | | |
Net investment income and net realized gains (losses), as disclosed in the Statement of Operations, and net assets were not affected by this reclassification.
The tax character of distributions paid during the years indicated was as follows:
Year Ended February 28, | | 2014 | | 2013 | |
Ordinary income | | $ | 46,585,152 | | | $ | 30,660,079 | | |
Long-term capital gains | | | 271,765,200 | | | | 315,182,072 | | |
Total | | $ | 318,350,352 | | | $ | 345,842,151 | | |
Short-term capital gain distributions, if any, are considered ordinary income distributions for tax purposes.
At February 28, 2014, the components of distributable earnings on a tax basis were as follows:
Undistributed ordinary income | | $ | 7,238,254 | | |
Undistributed accumulated long-term gain | | | 78,710,131 | | |
Unrealized appreciation | | | 364,796,638 | | |
At February 28, 2014, the cost of investments for federal income tax purposes was $817,920,302 and the aggregate gross unrealized appreciation and depreciation based on that cost was:
Unrealized appreciation | | $ | 368,839,042 | | |
Unrealized depreciation | | | (4,042,404 | ) | |
Net unrealized appreciation | | $ | 364,796,638 | | |
Management of the Fund has concluded that there are no significant uncertain tax positions that would require recognition in the financial statements. However,
management's conclusion may be subject to review and adjustment at a later date based on factors including, but not limited to, new tax laws, regulations, and administrative interpretations (including relevant court decisions). Generally, the Fund's federal tax returns for the prior three fiscal years remain subject to examination by the Internal Revenue Service.
Note 5. Portfolio Information
The cost of purchases and proceeds from sales of securities, excluding short-term obligations, aggregated to $1,228,274,308 and $2,034,947,840, respectively, for the year ended February 28, 2014.
Note 6. Affiliated Money Market Fund
The Fund invests its daily cash balances in Columbia Short-Term Cash Fund, an affiliated money market fund established for the exclusive use by the Fund and other affiliated funds. The income earned by the Fund from such investments is included as "Dividends — affiliated issuers" in the Statement of Operations. As an investing fund, the Fund indirectly bears its proportionate share of the expenses of Columbia Short-Term Cash Fund.
Note 7. Shareholder Concentration
At February 28, 2014, one unaffiliated shareholder account owned 34.8% of the outstanding shares of the Fund. The Fund has no knowledge about whether any portion of those shares was owned beneficially by such account. Subscription and redemption activity by concentrated accounts may have a significant effect on the operations of the Fund.
Note 8. Line of Credit
The Fund has entered into a revolving credit facility with a syndicate of banks led by JPMorgan Chase Bank N.A. whereby the Fund may borrow for the temporary funding of shareholder redemptions or for other temporary or emergency purposes. The credit facility agreement, as amended, which is a collective agreement between the Fund and certain other funds managed by the Investment Manager, severally and not jointly, permits collective borrowings up to $500 million. Interest is charged to each participating fund based on its borrowings at a rate equal to the higher of (i) the overnight federal funds rate plus 1.00% or (ii) the one-month LIBOR rate plus 1.00%. Each borrowing under the credit facility matures no later than 60 days after the date of borrowing. Effective December 10, 2013, the Fund also pays a commitment fee equal to its pro rata share of the amount of the credit facility at a rate of 0.075% per annum. Prior to December 10, 2013, the commitment fee was charged at the annual rate of 0.08% per annum. The commitment fee is included in other expenses in the Statement of Operations.
Annual Report 2014
27
Columbia Marsico Focused Equities Fund
Notes to Financial Statements (continued)
February 28, 2014
For the year ended February 28, 2014, the average daily loan balance outstanding on days when borrowing existed was $11,936,842 at a weighted average interest rate of 1.17%. Interest expense incurred by the Fund is recorded as line of credit interest expense in the Statement of Operations.
Note 9. Significant Risks
Consumer Discretionary Sector Risk
Sector risk occurs when a fund invests a significant portion of its assets in securities of companies conducting business in a related group of industries within an economic sector. Companies in the same economic sector may be similarly affected by economic, regulatory, political or market events or conditions, making a fund more vulnerable to unfavorable developments in that economic sector than funds that invest more broadly. The Fund may be more susceptible to the particular risks that may affect companies in the consumer discretionary sector than if it were invested in a wider variety of companies in unrelated sectors.
Health Care Sector Risk
Sector risk occurs when a fund invests a significant portion of its assets in securities of companies conducting business in a related group of industries within an economic sector. Companies in the same economic sector may be similarly affected by economic, regulatory, political or market events or conditions, making a fund more vulnerable to unfavorable developments in that economic sector than funds that invest more broadly. The Fund may be more susceptible to the particular risks that may affect companies in the health care sector than if it were invested in a wider variety of companies in unrelated sectors.
Information Technology Sector Risk
Sector risk occurs when a fund invests a significant portion of its assets in securities of companies conducting business in a related group of industries within an economic sector. Companies in the same economic sector may be similarly affected by economic, regulatory, political or market events or conditions, making a fund more vulnerable to unfavorable developments in that economic sector than funds that invest more broadly. The Fund may be more susceptible to the particular risks that may affect companies in the information technology sector than if it were invested in a wider variety of companies in unrelated sectors.
Non-Diversification Risk
A non-diversified fund is permitted to invest a greater percentage of its total assets in fewer issuers than a diversified
fund. The Fund may, therefore, have a greater risk of loss from a few issuers than a similar fund that invests more broadly.
Note 10. Subsequent Events
Management has evaluated the events and transactions that have occurred through the date the financial statements were issued and noted no items requiring adjustment of the financial statements or additional disclosure.
Note 11. Information Regarding Pending and Settled Legal Proceedings
In December 2005, without admitting or denying the allegations, American Express Financial Corporation (AEFC, which is now known as Ameriprise Financial, Inc. (Ameriprise Financial)) entered into settlement agreements with the Securities and Exchange Commission (SEC) and Minnesota Department of Commerce (MDOC) related to market timing activities. As a result, AEFC was censured and ordered to cease and desist from committing or causing any violations of certain provisions of the Investment Advisers Act of 1940, the Investment Company Act of 1940, and various Minnesota laws. AEFC agreed to pay disgorgement of $10 million and civil money penalties of $7 million. AEFC also agreed to retain an independent distribution consultant to assist in developing a plan for distribution of all disgorgement and civil penalties ordered by the SEC in accordance with various undertakings detailed at www.sec.gov/litigation/admin/ia-2451.pdf. Ameriprise Financial and its affiliates have cooperated with the SEC and the MDOC in these legal proceedings, and have made regular reports to the Funds' Boards of Trustees.
Ameriprise Financial and certain of its affiliates have historically been involved in a number of legal, arbitration and regulatory proceedings, including routine litigation, class actions, and governmental actions, concerning matters arising in connection with the conduct of their business activities. Ameriprise Financial believes that the Funds are not currently the subject of, and that neither Ameriprise Financial nor any of its affiliates are the subject of, any pending legal, arbitration or regulatory proceedings that are likely to have a material adverse effect on the Funds or the ability of Ameriprise Financial or its affiliates to perform under their contracts with the Funds. Ameriprise Financial is required to make 10-Q, 10-K and, as necessary, 8-K filings with the Securities and Exchange Commission on legal and regulatory matters that relate to Ameriprise Financial and its affiliates. Copies of these filings may be obtained by accessing the SEC website at www.sec.gov.
There can be no assurance that these matters, or the adverse publicity associated with them, will not result in increased
Annual Report 2014
28
Columbia Marsico Focused Equities Fund
Notes to Financial Statements (continued)
February 28, 2014
fund redemptions, reduced sale of fund shares or other adverse consequences to the Funds. Further, although we believe proceedings are not likely to have a material adverse effect on the Funds or the ability of Ameriprise Financial or its affiliates to perform under their contracts with the Funds, these proceedings are subject to uncertainties and, as such, we are unable to estimate the possible loss or range of loss that may result. An adverse outcome in one or more of these proceedings could result in adverse judgments, settlements, fines, penalties or other relief that could have a material adverse effect on the consolidated financial condition or results of operations of Ameriprise Financial.
Annual Report 2014
29
Columbia Marsico Focused Equities Fund
Report of Independent Registered Public Accounting Firm
To the Trustees of Columbia Funds Series Trust and the Shareholders of
Columbia Marsico Focused Equities Fund
In our opinion, the accompanying statement of assets and liabilities, including the portfolio of investments, and the related statements of operations and of changes in net assets and the financial highlights present fairly, in all material respects, the financial position of Columbia Marsico Focused Equities Fund (the "Fund", a series of Columbia Funds Series Trust) at February 28, 2014, and the results of its operations, the changes in its net assets and the financial highlights for each of the periods indicated, in conformity with accounting principles generally accepted in the United States of America. These financial statements and financial highlights (hereafter referred to as "financial statements") are the responsibility of the Fund's management; our responsibility is to express an opinion on these financial statements based on our audits. We conducted our audits of these financial statements in accordance with the standards of the Public Company Accounting Oversight Board (United States). Those standards require that we plan and perform the audit to obtain reasonable assurance about whether the financial statements are free of material misstatement. An audit includes examining, on a test basis, evidence supporting the amounts and disclosures in the financial statements, assessing the accounting principles used and significant estimates made by management, and evaluating the overall financial statement presentation. We believe that our audits, which included confirmation of securities at February 28, 2014 by correspondence with the custodian, brokers and transfer agent, provide a reasonable basis for our opinion.
PricewaterhouseCoopers LLP
Minneapolis, Minnesota
April 21, 2014
Annual Report 2014
30
Columbia Marsico Focused Equities Fund
Federal Income Tax Information
(Unaudited)
The Fund hereby designates the following tax attributes for the fiscal year ended February 28, 2014. Shareholders will be notified in early 2015 of the amounts for use in preparing 2014 income tax returns.
Tax Designations:
| Qualified Dividend Income | | | 23.96 | % | |
| Dividends Received Deduction | | | 20.71 | % | |
Capital Gain Dividend | | $ | 327,888,840 | | |
Qualified Dividend Income. For taxable, non-corporate shareholders, the percentage of ordinary income dividends paid during the fiscal year that represents qualified dividend income subject to reduced tax rates.
Dividends Received Deduction. The percentage of ordinary income dividends paid during the fiscal year that qualifies for the corporate dividends received deduction.
Capital Gain Dividend. The Fund designates as a capital gain dividend the amount reflected above, or if subsequently determined to be different, the net capital gain of such fiscal period. The Fund also designates as capital gain dividends, to the extent necessary to fully distribute such capital gains, earnings and profits distributed to shareholders on the redemption of shares.
Annual Report 2014
31
Columbia Marsico Focused Equities Fund
Shareholders elect the Board that oversees the Funds' operations. The Board appoints officers who are responsible for day-to-day business decisions based on policies set by the Board. The following table provides basic biographical information about the Funds' Board members, including their principal occupations during the past five years, although specific titles for individuals may have varied over the period. Under current Board policy, members may serve through the end of the calendar year in which he or she reaches either the mandatory retirement age established by the Board or the fifteenth anniversary of the first Board meeting they attended as a member of the Board.
Independent Trustees
Name,
Address,
Year of Birth | | Position Held With
Funds and Length of
Service | | Principal Occupation(s)
During Past Five Years
and Other Relevant
Professional Experience | | Number of
Funds in the
Fund Family
Overseen by
Board Member | | Other Present or Past
Directorships/
Trusteeships
(Within Past 5 Years) | |
Kathleen Blatz
901 S. Marquette Ave.
Minneapolis, MN 55402
1954 | | Board member since 1/06 for RiverSource Funds and since 6/11 for Nations Funds | | Attorney; Chief Justice, Minnesota Supreme
Court, 1998-2006 | | | 131 | | | Trustee, BlueCross BlueShield of Minnesota since 2009 | |
Edward J. Boudreau, Jr.
901 S. Marquette Ave.
Minneapolis, MN 55402
1944 | | Board member since 6/11 for RiverSource Funds and since 1/05 for Nations Funds | | Managing Director, E.J. Boudreau & Associates (consulting) since 2000; Chairman and Chief Executive Officer, John Hancock Funds (mutual funds), 1989-2000 | | | 129 | | | Former Trustee, BofA Funds Series Trust (11 funds), 2005-2011 | |
Pamela G. Carlton
901 S. Marquette Ave.
Minneapolis, MN 55402
1954 | | Board member since 7/07 for RiverSource Funds and since 6/11 for Nations Funds | | President, Springboard — Partners in Cross Cultural Leadership (consulting company) since 2003; Director or Management Director of US Equity Research, Chase Asset Management, 1996-2003; Investment Banker, Morgan Stanley, 1982-1996 | | | 131 | | | None | |
William P. Carmichael
901 S. Marquette Ave.
Minneapolis, MN 55402
1943 | | Chair of the Board since 1/14, Board member since 6/11 for RiverSource Funds and since 2003 for Nations Funds | | Retired; Co-founder, The Succession Fund (provides exit strategies to owners of privately held companies); previously, Senior Vice President, Sara Lee Corporation; Senior Vice President and Chief Financial officer, Beatrice Foods Company; Vice President, Esmark, Inc.; Associate, Price Waterhouse | | | 131 | | | Director, Cobra Electronics Corporation (electronic equipment manufacturer); The Finish Line (athletic shoes and apparel) since July 2003; Director, International Textile Corp. since 2012; former Director, McMoRan Exploration Company (oil and gas exploration and development) 2010-2013; former Trustee, BofA Funds Series Trust (11 funds), 2009-2011; Director, Spectrum Brands, Inc. (consumer products), 2002-2009; Director, Simmons Company (bedding), 2004-2010 | |
Annual Report 2014
32
Columbia Marsico Focused Equities Fund
Trustees and Officers (continued)
Independent Trustees (continued)
Name,
Address,
Year of Birth | | Position Held With
Funds and Length of
Service | | Principal Occupation(s)
During Past Five Years
and Other Relevant
Professional Experience | | Number of
Funds in the
Fund Family
Overseen by
Board Member | | Other Present or Past
Directorships/
Trusteeships
(Within Past 5 Years) | |
Patricia M. Flynn
901 S. Marquette Ave.
Minneapolis, MN 55402
1950 | | Board member since 11/04 for RiverSource Funds and since 6/11 for Nations Funds | | Trustee Professor of Economics and Management, Bentley University since 1976 (also teaches and conducts research on corporate governance); Dean, McCallum Graduate School of Business, Bentley University, 1992-2002 | | | 131 | | | None | |
William A. Hawkins
901 S. Marquette Ave.
Minneapolis, MN 55402
1942 | | Board member since 6/11 for RiverSource Funds and since 1/05 for Nations Funds | | Managing Director, Overton Partners (financial consulting), since August 2010; President and Chief Executive Officer, California General Bank, N.A., January 2008-August 2010 | | | 129 | | | Trustee, BofA Funds Series Trust (11 funds) | |
R. Glenn Hilliard
901 S. Marquette Ave.
Minneapolis, MN 55402
1943 | | Board member since 6/11 for RiverSource Funds and since 1/05 for Nations Funds | | Chairman and Chief Executive Officer, Hilliard Group LLC (investing and consulting) since April 2003; Non-Executive Director & Chairman, CNO Financial Group, Inc. (insurance), September 2003-May 2011 | | | 129 | | | Chairman, BofA Fund Series Trust (11 funds); former Director, CNO Financial Group, Inc. (insurance), 2003-2011 | |
Stephen R. Lewis, Jr.
901 S. Marquette Ave.
Minneapolis, MN 55402
1939 | | Board member for RiverSource Funds since 1/02 and since 6/11 for Nations Funds, Board Chair 1/07-12/13 | | President Emeritus and Professor of Economics Emeritus, Carleton College since 2002 | | | 131 | | | Director, Valmont Industries, Inc. (irrigation systems manufacturer), 2002-2013 | |
Catherine James Paglia
901 S. Marquette Ave.
Minneapolis, MN 55402
1952 | | Board member since 11/04 for RiverSource Funds and since 6/11 for Nations Funds | | Director, Enterprise Asset Management, Inc. (private real estate and asset management company) since September 1998 | | | 131 | | | Director, Valmont Industries, Inc. (irrigation systems manufacturer) since 2012 | |
Leroy C. Richie
901 S. Marquette Ave.
Minneapolis, MN 55402
1941 | | Board member since 2000 for Legacy Seligman Funds, since 11/08 for RiverSource Funds and since 6/11 for Nations Funds | | Counsel, Lewis & Munday, P.C. (law firm) since 2004; Vice President and General Counsel, Automotive Legal Affairs, Chrysler Corporation, 1993-1997 | | | 131 | | | Lead Outside Director, Digital Ally, Inc. (digital imaging) since September 2005; Director, Infinity, Inc. (oil and gas exploration and production) since 1994; Director, OGE Energy Corp. (energy and energy services) since November 2007 | |
Minor M. Shaw
901 S. Marquette Ave.
Minneapolis, MN 55402
1947 | | Board member since 6/11 for RiverSource Funds and since 2003 for Nations Funds | | President, Micco LLC (private investments) since 2011; President, Micco Corp. since 1998 | | | 129 | | | Director, Piedmont Natural Gas; Director, BlueCross BlueShield of South Carolina since April 2008; Director, National Association of Corporate Directors, Carolinas Chapter, since 2013; former Trustee, BofA Funds Series Trust (11 funds) | |
Annual Report 2014
33
Columbia Marsico Focused Equities Fund
Trustees and Officers (continued)
Independent Trustees (continued)
Name,
Address,
Year of Birth | | Position Held With
Funds and Length of
Service | | Principal Occupation(s)
During Past Five Years
and Other Relevant
Professional Experience | | Number of
Funds in the
Fund Family
Overseen by
Board Member | | Other Present or Past
Directorships/
Trusteeships
(Within Past 5 Years) | |
Alison Taunton-Rigby
901 S. Marquette Ave.
Minneapolis, MN 55402
1944 | | Board member since 11/02 for RiverSource Funds and since 6/11 for Nations Funds | | Chief Executive Officer and Director, RiboNovix, Inc., (biotechnology) 2003-2010 | | | 131 | | | Director, Healthways, Inc. (health and wellbeing solutions) since 2005; Director, ICI Mutual Insurance Company, RRG since 2011; Director, Abt
Associates (government contractor) since 2001; Director, Boston Children's Hospital since 2002 | |
Interested Trustee Not Affiliated with Investment Manager*
Name,
Address,
Year of Birth | | Position Held With
Funds and Length of
Service | | Principal Occupation(s)
During Past Five Years
and Other Relevant
Professional Experience | | Number of
Funds in the
Fund Family
Overseen by
Board Member | | Other Present or Past
Directorships/
Trusteeships
(Within Past 5 Years) | |
Anthony M. Santomero
901 S. Marquette Ave.
Minneapolis, MN 55402
1946 | | Board member since 6/11 for RiverSource Funds and since 1/08 for Nations Funds | | Richard K. Mellon Professor Emeritus of Finance, The Wharton School, University of Pennsylvania, since 2002; Senior Advisor, McKinsey & Company (consulting), 2006-2008 | | | 129 | | | Director, Renaissance Reinsurance Ltd. since May 2008; Trustee, Penn Mutual Life Insurance Company since March 2008; Director, Citigroup Inc. since 2009; Director, Citibank, N.A. since 2009; former Trustee, BofA Funds Series Trust (11 funds), 2008-2011 | |
* Dr. Santomero is not an affiliated person of the Investment Manager or Ameriprise Financial. However, he is currently deemed by the Funds to be an "interested person" (as defined in the 1940 Act) of the Funds because he serves as a Director of Citigroup Inc. and Citibank, N.A., companies that may directly or through subsidiaries and affiliates engage from time-to-time in brokerage execution, principal transactions and lending relationships with the Funds or accounts advised/managed by the Investment Manager.
Annual Report 2014
34
Columbia Marsico Focused Equities Fund
Trustees and Officers (continued)
Interested Trustee Affiliated with Investment Manager*
Name,
Address,
Year of Birth | | Position Held With
Funds and Length of
Service | | Principal Occupation(s)
During Past Five Years
and Other Relevant
Professional Experience | | Number of
Funds in the
Fund Family
Overseen by
Board Member | | Other Present or Past
Directorships/
Trusteeships
(Within Past 5 Years) | |
William F. Truscott
53600 Ameriprise
Financial Center
Minneapolis, MN 55474
1960 | | Board member since 11/01 for RiverSource Funds and since 6/11 for Nations Funds; Senior Vice President since 2002 for RiverSource Funds and since 5/10 for Nations Funds | | Chairman of the Board and President, Columbia Management Investment Advisers, LLC since May 2010 and February 2012, respectively (previously President and Chief Investment Officer, 2001-April 2010); Chief Executive Officer, Global Asset Management, Ameriprise Financial, Inc. since September 2012 (previously Chief Executive Officer, U.S. Asset Management & President, Annuities, May 2010-September 2012 and President — U.S. Asset Management and Chief Investment Officer, 2005-April 2010); Director and Chief Executive Officer, Columbia Management Investment Distributors, Inc. since May 2010 and February 2012, respectively (previously Chairman of the Board and Chief Executive Officer, 2006-April 2010); Chairman of the Board and Chief Executive Officer, RiverSource Distributors, Inc. since 2006; Director, Threadneedle Asset Management Holdings, SARL since 2014; President and Chief Executive Officer, Ameriprise Certificate Company, 2006-August 2012 | | | 183 | | | Former Director, Ameriprise Certificate Company, 2006-January 2013 | |
* Interested person (as defined under the 1940 Act) by reason of being an officer, director, security holder and/or employee of the Investment Manager or Ameriprise Financial.
The SAI has additional information about the Fund's Board members and is available, without charge, upon request by calling 800.345.6611; contacting your financial intermediary; or visiting columbiamanagement.com.
Annual Report 2014
35
Columbia Marsico Focused Equities Fund
Trustees and Officers (continued)
The Board has appointed officers who are responsible for day-to-day business decisions based on policies it has established. The officers serve at the pleasure of the Board. In addition to Mr. Truscott, who is Senior Vice President, the Funds' other officers are:
Officers
Name,
Address and
Year of Birth | | Position and Year
First Appointed to
Position for any Fund
in the Columbia
Funds Complex or a
Predecessor Thereof | | Principal Occupation(s) During Past Five Years | |
J. Kevin Connaughton
225 Franklin Street
Boston, MA 02110
Born 1964 | | President and Principal Executive Officer (2009) | | Managing Director and General Manager — Mutual Fund Products, Columbia Management Investment Advisers, LLC since May 2010; and President, Columbia Funds since 2009; Managing Director, Columbia Management Advisors, LLC, December 2004 – April 2010; Senior Vice President and Chief Financial Officer, Columbia Funds, June 2008 – January 2009; and senior officer of Columbia Funds and affiliated funds since 2003 | |
Michael G. Clarke
225 Franklin Street
Boston, MA 02110
Born 1969 | | Treasurer (2011) and Chief Financial Officer (2009) | | Vice President — Mutual Fund Administration, Columbia Management Investment Advisers, LLC, since May 2010;Managing Director of Fund Administration, Columbia Management Advisors, LLC, September 2004 – April 2010; and senior officer of Columbia Funds and affiliated funds since 2002 | |
Scott R. Plummer
5228 Ameriprise Financial Center
Minneapolis, MN 55474
Born 1959 | | Senior Vice President (2006), Chief Legal Officer (2006) and Assistant Secretary (2011) | | Senior Vice President and Assistant General Counsel — Global Asset Management, Ameriprise Financial since February 2014 (previously, Senior Vice President and Lead Chief Counsel — Asset Management, 2012 – February 2014; Vice President and Lead Chief Counsel — Asset Management, 2010 – 2012; and Vice President and Chief Counsel — Asset Management, 2005 – 2010); Senior Vice President, Chief Legal Officer and Assistant Secretary, Columbia Management Investment Advisers, LLC since June 2005; Vice President, Chief Counsel and Assistant Secretary, Columbia Management Investment Distributors, Inc. since 2008; Vice President, General Counsel and Secretary, Ameriprise Certificate Company since 2005; Chief Counsel, RiverSource Distributors, Inc. since 2006; senior officer of Columbia Funds and affiliated funds since 2006 | |
Thomas P. McGuire
225 Franklin Street
Boston, MA 02110
Born 1972 | | Chief Compliance Officer (2012) | | Vice President — Asset Management Compliance, Ameriprise Financial, Inc. since May 2010; Chief Compliance Officer, Ameriprise Certificate Company, since September 2010; Compliance Executive, Bank of America, 2005 – April 2010 | |
Colin Moore
225 Franklin Street
Boston, MA 02110
Born 1958 | | Senior Vice President (2010) | | Executive Vice President and Global Chief Investment Officer, Ameriprise Financial, Inc. since July 2013; Director and Global Chief Investment Officer, Columbia Management Investment Advisers, LLC since May 2010; Manager, Managing Director and Chief Investment Officer, Columbia Management Advisors, LLC, 2007 – April 2010 | |
Michael E. DeFao
225 Franklin Street
Boston, MA 02110
Born 1968 | | Vice President (2011) and Assistant Secretary (2010) | | Vice President and Chief Counsel, Ameriprise Financial, Inc. since May 2010; Associate General Counsel, Bank of America 2005 – April 2010 | |
Joseph F. DiMaria
225 Franklin Street
Boston, MA 02110
Born 1968 | | Vice President (2011) and Chief Accounting Officer (2008) | | Vice President — Mutual Fund Treasurer, Columbia Management Investment Advisers, LLC since May 2010; Director of Fund Administration, Columbia Management Advisors, LLC, 2006 – April 2010 | |
Paul B. Goucher
100 Park Avenue
New York, NY 10017
Born 1968 | | Vice President (2011) and Assistant Secretary (2008) | | Vice President and Lead Chief Counsel, Ameriprise Financial, Inc. since November 2008 and January 2013, respectively (previously Chief Counsel, January 2010 – January 2013, and Group Counsel, November 2008 – January 2010); Director, Managing Director and General Counsel, J. & W. Seligman & Co. Incorporated, July 2008 – November 2008 | |
Amy Johnson
5228 Ameriprise Financial
Center
Minneapolis, MN 55474
Born 1965 | | Vice President (2006) | | Managing Director and Chief Operating Officer, Columbia Management Investment Advisers, LLC since May 2010 (previously Chief Administrative Officer, 2009 – April 2010, and Vice President — Asset Management and Trust Company Services, 2006 – 2009) | |
Annual Report 2014
36
Columbia Marsico Focused Equities Fund
Trustees and Officers (continued)
Officers (continued)
Name,
Address and
Year of Birth | | Position and Year
First Appointed to
Position for any Fund
in the Columbia
Funds Complex or a
Predecessor Thereof | | Principal Occupation(s) During Past Five Years | |
Paul D. Pearson
5228 Ameriprise Financial
Center
Minneapolis, MN 55474
Born 1956 | | Vice President (2011) and Assistant Treasurer (1999) | | Vice President — Investment Accounting, Columbia Management Investment Advisers, LLC since May 2010; Vice President — Managed Assets, Investment Accounting, Ameriprise Financial, Inc., 1998 – April 2010 | |
Christopher O. Petersen
5228 Ameriprise Financial Center
Minneapolis, MN 55474
Born 1970 | | Vice President and Secretary (2010) | | Vice President and Chief Counsel, Ameriprise Financial, Inc., since January 2010 (previously Vice President and Group Counsel or Counsel, 2004 – January 2010); officer of Columbia Funds and affiliated funds since 2007 | |
Stephen T. Welsh
225 Franklin Street
Boston, MA 02110
Born 1957 | | Vice President (2006) | | President and Director, Columbia Management Investment Services Corp. since May 2010; President and Director, Columbia Management Services, Inc., 2004 – April 2010; Managing Director, Columbia Management Distributors, Inc., 2007 – April 2010 | |
Annual Report 2014
37
This page intentionally left blank.
Annual Report 2014
38
This page intentionally left blank.
Annual Report 2014
39
This page intentionally left blank.
Annual Report 2014
40
Columbia Marsico Focused Equities Fund
Important Information About This Report
Each fund mails one shareholder report to each shareholder address. If you would like more than one report, please call shareholder services at 800.345.6611 and additional reports will be sent to you.
The policy of the Board is to vote the proxies of the companies in which each fund holds investments consistent with the procedures as stated in the Statement of Additional Information (SAI). You may obtain a copy of the SAI without charge by calling 800.345.6611; contacting your financial intermediary; visiting columbiamanagement.com; or searching the website of the Securities and Exchange Commission (SEC) at sec.gov. Information regarding how each fund voted proxies relating to portfolio securities is filed with the SEC by August 31 for the most recent 12-month period ending June 30 of that year, and is available without charge by visiting columbiamanagement.com; or searching the website of the SEC at sec.gov.
Each fund files a complete schedule of portfolio holdings with the SEC for the first and third quarters of each fiscal year on Form N-Q. Each fund's Form N-Q is available on the SEC's website at sec.gov and may be reviewed and copied at the SEC's Public Reference Room in Washington, D.C. Information on the operation of the Public Reference Room may be obtained by calling 800.SEC.0330. Each fund's complete schedule of portfolio holdings, as filed on Form N-Q, can also be obtained without charge, upon request, by calling 800.345.6611.
Annual Report 2014
41

Columbia Marsico Focused Equities Fund
P.O. Box 8081
Boston, MA 02266-8081
columbiamanagement.com
This information is for use with concurrent or prior delivery of a fund prospectus. Please read and consider the investment objectives, risks, charges and expenses for any fund carefully before investing. For a prospectus and, if available, a summary prospectus, which contains this and other important information about the Fund go to columbiamanagement.com. The Fund is distributed by Columbia Management Investment Distributors, Inc., member FINRA, and managed by Columbia Management Investment Advisers, LLC.
© 2014 Columbia Management Investment Advisers, LLC. All rights reserved.
ANN186_02_D01_(04/14)
Annual Report
February 28, 2014

Columbia Marsico Global Fund
Not FDIC insured • No bank guarantee • May lose value
 Dear Shareholders,
Equities recovered
In the final months of 2013, the U.S. economy embraced a robust recovery. After five years of only modest progress, the pace of economic growth picked up, job gains continued, manufacturing activity accelerated and a rebound in the housing market showed staying power. Growth, as measured by gross domestic product, was 4.1% in the third quarter, with expectations for a solid fourth quarter. Job growth averaged close to 200,000 monthly. Industrial production rose at a rate of 3.3%, considerably higher than the 12-month average of 2.5%. Factories were busier than at any point since the 2008/2009 recession, with capacity utilization at 79%. Orders for durable goods were strong, bolstered by rising auto sales. Holiday spending was solid, especially online sales, which rose 10% year over year, despite a shorter season.
Against this backdrop, the Federal Reserve's (the Fed's) announcement that it would slowly retreat from its monthly bond buying program and a bipartisan budget deal in Washington were welcome news for investors. Stocks climbed to new highs in the fourth quarter, while bonds retreated as yields moved higher. Small-cap stocks outperformed large- and mid-cap stocks, led by significant gains from the industrials, technology and consumer discretionary sectors. All 10 sectors of the S&P 500 Index delivered positive returns, although telecommunications and utilities posted only modest gains.
Fixed-income retreated
Improved economic data drove interest rates higher over the fourth quarter, credit spreads narrowed and the dollar weakened against most developed market currencies. Against this backdrop, most non-Treasury, fixed-income sectors delivered positive returns. Outgoing Fed chairman Ben Bernanke expressed concern about the persistently low level of core inflation, but gains in the labor market and reduced unemployment led to the Fed's decision to taper its bond-buying program gradually beginning in January 2014.
As the stock market soared, the riskiest sectors of the fixed-income markets fared the best. U.S. and foreign high-yield bonds were the strongest performers, followed by emerging-market and U.S. investment-grade corporate bonds. U.S. mortgage-backed securities (MBS) and securitized bonds produced negative total returns, as did U.S. Treasuries and developed world government bonds. Treasury inflation-protected bonds were the period's biggest losers. Investment-grade municipals delivered fractional gains, as better economic conditions helped steady state finances.
Stay on track with Columbia Management
Backed by more than 100 years of experience, Columbia Management is one of the nation's largest asset managers. At the heart of our success and, most importantly, that of our investors, are highly talented industry professionals, brought together by a unique way of working. At Columbia Management, reaching our performance goals matters, and how we reach them matters just as much.
Visit columbiamanagement.com for:
> The Columbia Management Perspectives blog, offering insights on current market events and investment opportunities
> Detailed up-to-date fund performance and portfolio information
> Quarterly fund commentaries
> Columbia Management Investor, our award-winning quarterly newsletter for shareholders
Thank you for your continued support of the Columbia Funds. We look forward to serving your investment needs for many years to come.
Best Regards,

J. Kevin Connaughton
President, Columbia Funds
Investing involves risk including the risk of loss of principal.
The S&P 500 Index, an unmanaged index, measures the performance of 500 widely held, large-capitalization U.S. stocks and is frequently used as a general measure of market performance. The Dow Jones Industrial Average is a price weighted average of 30 actively traded shares of blue chip US industrial corporations listed on the New York Stock Exchange. Indices are not available for investment, are not professionally managed and do not reflect sales charges, fees, brokerage commissions, taxes or other expenses of investing.
Investors should consider the investment objectives, risks, charges and expenses of a mutual fund carefully before investing. For a free prospectus and, if available, a summary prospectus, which contains this and other important information about a fund, visit columbiamanagement.com. The prospectus should be read carefully before investing.
Columbia Funds are distributed by Columbia Management Investment Distributors, Inc., member FINRA, and managed by Columbia Management Investment Advisers, LLC.
© 2014 Columbia Management Investment Advisers, LLC. All rights reserved.
Columbia Marsico Global Fund
Performance Overview | | | 2 | | |
Manager Discussion of Fund Performance | | | 4 | | |
Understanding Your Fund's Expenses | | | 7 | | |
Portfolio of Investments | | | 8 | | |
Statement of Assets and Liabilities | | | 11 | | |
Statement of Operations | | | 13 | | |
Statement of Changes in Net Assets | | | 14 | | |
Financial Highlights | | | 16 | | |
Notes to Financial Statements | | | 22 | | |
Report of Independent Registered
Public Accounting Firm | | | 28 | | |
Federal Income Tax Information | | | 29 | | |
Trustees and Officers | | | 30 | | |
Important Information About This Report | | | 37 | | |
Fund Investment Manager
Columbia Management Investment
Advisers, LLC
225 Franklin Street
Boston, MA 02110
Fund Distributor
Columbia Management Investment
Distributors, Inc.
225 Franklin Street
Boston, MA 02110
Fund Transfer Agent
Columbia Management Investment
Services Corp.
P.O. Box 8081
Boston, MA 02266-8081
For more information about any of the funds, please visit columbiamanagement.com or call 800.345.6611. Customer Service Representatives are available to answer your questions Monday through Friday from 8 a.m. to 7 p.m. Eastern time.
The views expressed in this report reflect the current views of the respective parties. These views are not guarantees of future performance and involve certain risks, uncertainties and assumptions that are difficult to predict, so actual outcomes and results may differ significantly from the views expressed. These views are subject to change at any time based upon economic, market or other conditions and the respective parties disclaim any responsibility to update such views. These views may not be relied on as investment advice and, because investment decisions for a Columbia Fund are based on numerous factors, may not be relied on as an indication of trading intent on behalf of any particular Columbia Fund. References to specific securities should not be construed as a recommendation or investment advice.
Columbia Marsico Global Fund
Performance Summary
> Columbia Marsico Global Fund (the Fund) Class A shares returned 35.05% excluding sales charges for the 12-month period ended February 28, 2014.
> The Fund significantly outperformed its benchmark, the MSCI All Country World Index (Net), which returned 18.16% for the same time period.
> Sector allocation and stock selection in the consumer discretionary, health care, information technology, industrials and energy sectors aided relative results.
Average Annual Total Returns (%) (for period ended February 28, 2014)
| | | Inception | | 1 Year | | 5 Years | | Life | |
Class A | | 04/30/08 | | | | | | | |
Excluding sales charges | | | | | 35.05 | | | | 24.48 | | | | 7.05 | | |
Including sales charges | | | | | 27.26 | | | | 23.03 | | | | 5.97 | | |
Class C | | 04/30/08 | | | | | | | |
Excluding sales charges | | | | | 34.01 | | | | 23.55 | | | | 6.26 | | |
Including sales charges | | | | | 33.01 | | | | 23.55 | | | | 6.26 | | |
Class R | | 04/30/08 | | | 34.55 | | | | 24.15 | | | | 6.78 | | |
Class R4* | | 01/08/14 | | | 35.03 | | | | 24.47 | | | | 7.05 | | |
Class R5* | | 01/08/14 | | | 35.03 | | | | 24.47 | | | | 7.05 | | |
Class Z | | 04/30/08 | | | 35.32 | | | | 24.78 | | | | 7.31 | | |
MSCI All Country World Index (Net) | | | | | 18.16 | | | | 19.58 | | | | 3.43 | | |
Returns for Class A are shown with and without the maximum initial sales charge of 5.75%. Returns for Class C are shown with and without the 1.00% contingent deferred sales charge for the first year only. The Fund's other classes are not subject to sales charges and have limited eligibility. Please see the Fund's prospectus for details. Performance for different share classes will vary based on differences in sales charges and fees associated with each class. All results shown assume reinvestment of distributions during the period. Returns do not reflect the deduction of taxes that a shareholder may pay on Fund distributions or on the redemption of Fund shares. Performance results reflect the effect of any fee waivers or reimbursements of Fund expenses by Columbia Management Investment Advisers, LLC and/or any of its affiliates. Absent these fee waivers or expense reimbursement arrangements, performance results would have been lower.
The performance information shown represents past performance and is not a guarantee of future results. The investment return and principal value of your investment will fluctuate so that your shares, when redeemed, may be worth more or less than their original cost. Current performance may be lower or higher than the performance information shown. You may obtain performance information current to the most recent month-end by contacting your financial intermediary, visiting columbiamanagement.com or calling 800.345.6611.
*The returns shown for periods prior to the share class inception date (including returns for the Life of the Fund, if shown, which are since Fund inception) include the returns of the Fund's oldest share class. Since the Fund launched more than one share class at its inception, Class A shares were used. These returns are adjusted to reflect any higher class-related operating expenses of the newer share classes, as applicable. Please visit columbiamanagement.com/mutual-funds/appended-performance for more information.
The MSCI All Country World Index (Net) is a free float-adjusted market capitalization weighted index that is designed to measure the equity market performance of developed and emerging markets. The index consists of 45 country indices comprising 24 developed and 21 emerging market country indices.
Indices are not available for investment, are not professionally managed and do not reflect sales charges, fees, brokerage commissions, taxes (except the MSCI All Country World Index (Net), which reflects reinvested dividends net of withholding taxes) or other expenses of investing. Securities in the Fund may not match those in an index.
Annual Report 2014
2
Columbia Marsico Global Fund
Performance Overview (continued)
Performance of a Hypothetical $10,000 Investment (April 30, 2008 – February 28, 2014)
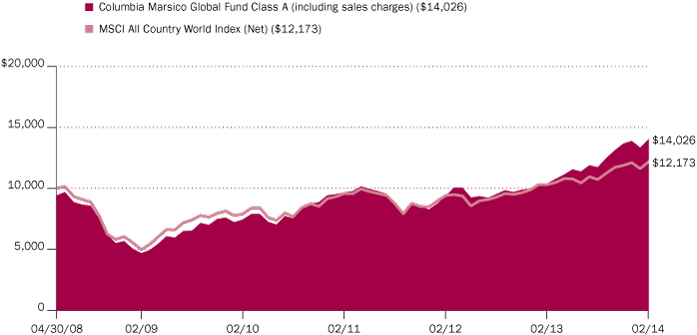
The chart above shows the change in value of a hypothetical $10,000 investment in Class A shares of Columbia Marsico Global Fund during the stated time period, and does not reflect the deduction of taxes that a shareholder may pay on Fund distributions or on the redemption of Fund shares.
Annual Report 2014
3
Columbia Marsico Global Fund
Manager Discussion of Fund Performance
For the 12-month period that ended February 28, 2014, the Fund's Class A shares returned 35.05% excluding sales charges. The Fund significantly outperformed its benchmark, the MSCI All Country World Index (Net), which returned 18.16% for the same time period. The Fund had more exposure than the benchmark to the strongest performing sectors of the market during the period. Strong stock selection also contributed to the Fund's results. Stock selection in consumer staples and certain retail holdings detracted from overall Fund performance.
Stocks Rose in a Favorable Market Environment
Despite a string of weak job gains at the end of 2013 — and a difficult winter, which affected job growth, construction activity and the housing market — the U.S. economy expanded at a respectable pace over the 12-month period that ended February 28, 2014. Pent-up demand, low mortgage rates and an improving labor market helped home sales advance, and foreclosure activity trended downward. After a brief pullback, manufacturing activity picked up midway through the period and remained solid. Businesses remained profitable and household finances were healthy, with lower debt loads and stronger credit conditions.
Even though a host of concerns weighed on investors, stock prices moved higher as central banks continued to pour liquidity into the financial markets. Investors shrugged off concerns regarding tax increases and enforced federal spending cuts, another showdown over the U.S. debt ceiling and the possibility of an attack on Syria. Midway through the period, the Federal Reserve's (the Fed's) talk about removing monetary support briefly dampened investor enthusiasm. However, once the Fed chose not to act until 2014, the market rally rebooted. In fact, U.S. equities posted their most significant gains since the late 1990s.
Consumer Discretionary and Health Care Holdings Aided Results
The Fund's exposure to the consumer discretionary sector was nearly three times its weight in the benchmark. The allocation had a significantly positive effect on performance as consumer discretionary was one of the strongest performing sectors for the period. Stock selection within consumer discretionary was also strong, led by investments in automobile manufacturers and consumer service companies. Shares of luxury electric car manufacturer Tesla Motors rose and were a material contributor to performance. We sold Tesla Motors as it reached our internal price target. Within the consumer services industry, Potbelly and Starbucks performed well. Germany-based media company Kabel Deutschland Holding also contributed materially to results. All three stocks were sold during the period.
The Fund also benefited from an overweight allocation in health care, as it was the strongest performing sector within the benchmark during the reporting period. We favored pharmaceutical and biotechnology companies, attracted by the quality of the science they are using to treat diseases that were considered untreatable just a few years ago. We see a variety of emerging therapeutic pathways, and we believe we are in the early stages of a paradigm shift in disease treatment, in which highly-specialized compounds are developed to treat specific genetic targets. In this regard, Gilead Sciences and Biogen Idec were strong performers. Gilead Sciences is a world leader in therapeutics for viral diseases.
Portfolio Management
Marsico Capital Management, LLC
James Gendelman
Thomas Marsico
Morningstar Style BoxTM

The Morningstar Style BoxTM is based on a fund's portfolio holdings. For equity funds, the vertical axis shows the market capitalization of the stocks owned, and the horizontal axis shows investment style (value, blend, or growth). Information shown is based on the most recent data provided by Morningstar.
© 2014 Morningstar, Inc. All rights reserved. The Morningstar information contained herein: (1) is proprietary to Morningstar and/or its content providers; (2) may not be copied or distributed; and (3) is not warranted to be accurate, complete or timely. Neither Morningstar nor its content providers are responsible for any damages or losses arising from any use of this information.
Investment Risks
International investing may involve special risks, including foreign taxation, currency risks, risks associated with possible differences in financial standards, and other monetary and political risks associated with political and economic developments. Investing in emerging markets may involve greater risks than investing in more developed countries. In addition, concentration of investments in a single region may result in greater volatility. See the Fund's prospectus for more information on these and other risks.
Annual Report 2014
4
Columbia Marsico Global Fund
Manager Discussion of Fund Performance (continued)
We believe the company may be likely to experience increased growth with the upcoming launch of a new drug franchise for Hepatitis C. Biogen Idec is the leader in developing treatments for multiple sclerosis (MS). During the period, the company received Food & Drug Administration approval for Tecfidera, the first oral medication that could allow thousands of MS patients to stop taking drugs by needle or intravenously.
Several of the Fund's Internet services and e-commerce holdings posted strong returns, including Russian e-commerce payment service provider QIWI, Google and Facebook. We sold QIWI prior to period-end. Within the industrials sector, Lockheed Martin and Precision Castparts posted stock price gains and were sold.
The Fund was also aided by stock selection and an underweight allocation to the energy sector, which was a relatively poor performing sector of the benchmark. The Fund also benefited from underweight allocations to the materials, consumer staples and financials sectors.
Active currency management is not a central facet of the investment process, but fluctuations in major world currencies can affect performance. In this period, the Fund had no exposure to securities denominated in the Japanese yen, the Australian dollar and the Brazilian real. This positioning aided performance because all three currencies weakened during the period.
Few Disappointments
Stock selection in the consumer staples sector detracted from relative performance. Brewer Anheuser-Busch InBev posted a negative return early in the reporting period as one of the company's core markets, Brazil, experienced weakness and was sold. Within the retailing industry, Hermes posted a negative return as concerns regarding slower global growth weighed on luxury goods providers. Auto parts provider LKQ posted a negative return and was sold. During the period, we increased the Fund's allocations to the information technology, materials, consumer discretionary and energy sectors. We reduced the Fund's allocations to financials, consumer staples and health care. Fund repositioning contributed to modestly higher cash levels at times throughout the period, and this uninvested cash weighed on performance as the equity market rose.
Looking Ahead
We believe we are currently in a period of low inflation and modest economic growth. Against this backdrop, we believe that companies with steadily expanding earnings, strong cash flow, increasing margins, rising market share, improving profitability, the development of innovative products and the effective allocation of capital to fuel further growth may be positioned to outperform their peers. These are the characteristics we seek to identify in holdings we select for the Fund. As of period-end, the Fund's largest sector allocations included consumer discretionary, information technology, industrials and health care. The Fund had no exposure to the financials, utilities or telecommunication services sectors.
Top Ten Holdings (%)
(at February 28, 2014) | |
Wynn Macau Ltd. (Hong Kong) | | | 5.6 | | |
Canadian Pacific Railway Ltd.
(Canada) | | | 5.1 | | |
priceline.com, Inc.
(United States) | | | 4.5 | | |
Google, Inc., Class A
(United States) | | | 4.4 | | |
Gilead Sciences, Inc.
(United States) | | | 4.3 | | |
Biogen Idec, Inc.
(United States) | | | 3.9 | | |
Facebook, Inc., Class A
(United States) | | | 3.6 | | |
TJX Companies, Inc. (The)
(United States) | | | 3.6 | | |
Salesforce.com, Inc.
(United States) | | | 3.5 | | |
Roche Holding AG, Genusschein
Shares (Switzerland) | | | 3.4 | | |
Percentages indicated are based upon total investments (excluding Money Market Funds).
For further detail about these holdings, please refer to the section entitled "Portfolio of Investments."
Fund holdings are as of the date given, are subject to change at any time, and are not recommendations to buy or sell any security.
Country Breakdown (%)
(at February 28, 2014) | |
Canada | | | 6.4 | | |
France | | | 7.5 | | |
Germany | | | 1.8 | | |
Hong Kong | | | 5.4 | | |
India | | | 2.1 | | |
Italy | | | 2.2 | | |
Mexico | | | 3.0 | | |
Netherlands | | | 2.5 | | |
Switzerland | | | 3.3 | | |
United Kingdom | | | 6.2 | | |
United States(a) | | | 59.6 | | |
Total | | | 100.0 | | |
Percentages indicated are based upon total investments. The Fund's portfolio composition is subject to change.
(a) Includes investments in Money Market Funds.
Annual Report 2014
5
Columbia Marsico Global Fund
Manager Discussion of Fund Performance (continued)
Summary of Investments in Securities
by Industry (%)
(at February 28, 2014) | |
Aerospace & Defense | | | 9.3 | | |
Automobiles | | | 3.9 | | |
Biotechnology | | | 7.9 | | |
Chemicals | | | 6.2 | | |
Commercial Services &
Supplies | | | 1.7 | | |
Energy Equipment & Services | | | 2.7 | | |
Food & Staples Retailing | | | 2.7 | | |
Food Products | | | 0.8 | | |
Health Care Equipment &
Supplies | | | 1.5 | | |
Hotels, Restaurants & Leisure | | | 13.7 | | |
Internet & Catalog Retail | | | 4.4 | | |
Internet Software & Services | | | 8.8 | | |
IT Services | | | 3.0 | | |
Media | | | 4.7 | | |
Oil, Gas & Consumable Fuels | | | 2.8 | | |
Pharmaceuticals | | | 4.8 | | |
Road & Rail | | | 4.9 | | |
Semiconductors &
Semiconductor Equipment | | | 2.5 | | |
Software | | | 3.4 | | |
Specialty Retail | | | 3.5 | | |
Textiles, Apparel &
Luxury Goods | | | 4.2 | | |
Money Market Funds | | | 2.8 | | |
Total | | | 100.2 | | |
Percentages indicated are based upon net assets. The Fund's portfolio composition is subject to change.
Annual Report 2014
6
Columbia Marsico Global Fund
Understanding Your Fund's Expenses
(Unaudited)
As an investor, you incur two types of costs. There are transaction costs, which generally include sales charges on purchases and may include redemption fees. There are also ongoing costs, which generally include management fees, distribution and/or service fees, and other fund expenses. The following information is intended to help you understand your ongoing costs (in dollars) of investing in the Fund and to help you compare these costs with the ongoing costs of investing in other mutual funds.
Analyzing Your Fund's Expenses
To illustrate these ongoing costs, we have provided examples and calculated the expenses paid by investors in each share class of the Fund during the period. The actual and hypothetical information in the table is based on an initial investment of $1,000 at the beginning of the period indicated and held for the entire period. Expense information is calculated two ways and each method provides you with different information. The amount listed in the "Actual" column is calculated using the Fund's actual operating expenses and total return for the period. You may use the Actual information, together with the amount invested, to estimate the expenses that you paid over the period. Simply divide your account value by $1,000 (for example, an $8,600 account value divided by $1,000 = 8.6), then multiply the results by the expenses paid during the period under the "Actual" column. The amount listed in the "Hypothetical" column assumes a 5% annual rate of return before expenses (which is not the Fund's actual return) and then applies the Fund's actual expense ratio for the period to the hypothetical return. You should not use the hypothetical account values and expenses to estimate either your actual account balance at the end of the period or the expenses you paid during the period. See "Compare With Other Funds" below for details on how to use the hypothetical data.
Compare With Other Funds
Since all mutual funds are required to include the same hypothetical calculations about expenses in shareholder reports, you can use this information to compare the ongoing cost of investing in the Fund with other funds. To do so, compare the hypothetical example with the 5% hypothetical examples that appear in the shareholder reports of other funds. As you compare hypothetical examples of other funds, it is important to note that hypothetical examples are meant to highlight the ongoing costs of investing in a fund only and do not reflect any transaction costs, such as sales charges, or redemption or exchange fees. Therefore, the hypothetical calculations are useful in comparing ongoing costs only, and will not help you determine the relative total costs of owning different funds. If transaction costs were included in these calculations, your costs would be higher.
September 1, 2013 – February 28, 2014
| | | Account Value at the Beginning
of the Period ($) | | Account Value at the End of the
Period ($) | | Expenses Paid During the
Period ($) | | Fund's Annualized
Expense Ratio (%) | |
| | | Actual | | Hypothetical | | Actual | | Hypothetical | | Actual | | Hypothetical | | Actual | |
Class A | | | 1,000.00 | | | | 1,000.00 | | | | 1,196.30 | | | | 1,017.45 | | | | 8.21 | | | | 7.54 | | | | 1.50 | | |
Class C | | | 1,000.00 | | | | 1,000.00 | | | | 1,191.60 | | | | 1,013.71 | | | | 12.29 | | | | 11.30 | | | | 2.25 | | |
Class R | | | 1,000.00 | | | | 1,000.00 | | | | 1,194.80 | | | | 1,016.21 | | | | 9.58 | | | | 8.80 | | | | 1.75 | | |
Class R4 | | | 1,000.00 | | | | 1,000.00 | | | | 1,015.80 | * | | | 1,018.70 | | | | 1.73 | * | | | 6.29 | | | | 1.25 | * | |
Class R5 | | | 1,000.00 | | | | 1,000.00 | | | | 1,015.80 | * | | | 1,018.95 | | | | 1.66 | * | | | 6.04 | | | | 1.20 | * | |
Class Z | | | 1,000.00 | | | | 1,000.00 | | | | 1,197.80 | | | | 1,018.70 | | | | 6.85 | | | | 6.29 | | | | 1.25 | | |
*For the period January 8, 2014 through February 28, 2014. Class R4 and Class R5 shares commenced operations on January 8, 2014.
Expenses paid during the period are equal to the annualized expense ratio for each class as indicated above, multiplied by the average account value over the period and then multiplied by the number of days in the Fund's most recent fiscal half year and divided by 365.
Expenses do not include fees and expenses incurred indirectly by the Fund from the underlying funds in which the Fund may invest (also referred to as "acquired funds"), including affiliated and non-affiliated pooled investment vehicles (including mutual funds and exchange-traded funds).
Had Columbia Management Investment Advisers, LLC and/or certain of its affiliates not waived/reimbursed certain fees and expenses, account value at the end of the period would have been reduced.
Annual Report 2014
7
Columbia Marsico Global Fund
Portfolio of Investments
February 28, 2014
(Percentages represent value of investments compared to net assets)
Common Stocks 97.4%
Issuer | | Shares | | Value ($) | |
Canada 6.4% | |
Canadian Pacific Railway Ltd. | | | 15,900 | | | | 2,494,920 | | |
Novadaq Technologies, Inc.(a) | | | 36,123 | | | | 736,909 | | |
Total | | | | | 3,231,829 | | |
France 7.5% | |
Hermes International | | | 2,975 | | | | 958,843 | | |
Safran SA | | | 21,734 | | | | 1,530,272 | | |
Zodiac Aerospace | | | 37,452 | | | | 1,322,617 | | |
Total | | | | | 3,811,732 | | |
Germany 1.8% | |
Bayerische Motoren Werke AG | | | 7,812 | | | | 907,921 | | |
Hong Kong 5.4% | |
Wynn Macau Ltd. | | | 569,200 | | | | 2,747,611 | | |
India 2.1% | |
Tata Motors Ltd., ADR | | | 29,869 | | | | 1,041,831 | | |
Italy 2.3% | |
Luxottica Group, SpA, ADR | | | 20,561 | | | | 1,142,986 | | |
Mexico 3.0% | |
Alsea SAB de CV | | | 483,900 | | | | 1,499,786 | | |
Netherlands 2.5% | |
| ASML Holding NV | | | 14,532 | | | | 1,251,786 | | |
Switzerland 3.3% | |
Roche Holding AG, Genusschein Shares | | | 5,485 | | | | 1,692,586 | | |
United Kingdom 6.2% | |
British Sky Broadcasting Group PLC | | | 79,289 | | | | 1,248,070 | | |
Domino's Pizza Group PLC | | | 139,305 | | | | 1,303,998 | | |
Rolls-Royce Holdings PLC | | | 34,469 | | | | 576,624 | | |
Total | | | | | 3,128,692 | | |
United States 56.9% | |
Biogen Idec, Inc.(a) | | | 5,626 | | | | 1,916,666 | | |
Continental Resources, Inc.(a) | | | 11,958 | | | | 1,429,220 | | |
Common Stocks (continued)
Issuer | | Shares | | Value ($) | |
Facebook, Inc., Class A(a) | | | 26,071 | | | | 1,784,821 | | |
General Dynamics Corp. | | | 11,487 | | | | 1,258,286 | | |
Gilead Sciences, Inc.(a) | | | 25,344 | | | | 2,098,230 | | |
Google, Inc., Class A(a) | | | 1,790 | | | | 2,176,013 | | |
Green Mountain Coffee Roasters, Inc. | | | 3,877 | | | | 425,617 | | |
Monsanto Co. | | | 15,309 | | | | 1,684,296 | | |
Pacira Pharmaceuticals, Inc.(a) | | | 9,418 | | | | 736,864 | | |
priceline.com, Inc.(a) | | | 1,648 | | | | 2,222,888 | | |
Pricesmart, Inc. | | | 13,510 | | | | 1,374,372 | | |
Salesforce.com, Inc.(a) | | | 27,459 | | | | 1,712,618 | | |
Schlumberger Ltd. | | | 14,818 | | | | 1,378,074 | | |
Sherwin-Williams Co. (The) | | | 7,119 | | | | 1,427,217 | | |
Starwood Hotels & Resorts Worldwide, Inc. | | | 16,943 | | | | 1,397,120 | | |
TJX Companies, Inc. (The) | | | 28,522 | | | | 1,752,962 | | |
Tyco International Ltd. | | | 20,442 | | | | 862,244 | | |
Visa, Inc., Class A | | | 6,770 | | | | 1,529,614 | | |
Walt Disney Co. (The) | | | 14,017 | | | | 1,132,714 | | |
Yahoo!, Inc.(a) | | | 12,611 | | | | 487,667 | | |
Total | | | | | 28,787,503 | | |
Total Common Stocks
(Cost: $43,519,196) | | | | | 49,244,263 | | |
Money Market Funds 2.8%
| | | Shares | | Value ($) | |
Columbia Short-Term Cash Fund,
0.098%(b)(c) | | | 1,435,339 | | | | 1,435,339 | | |
Total Money Market Funds
(Cost: $1,435,339) | | | | | 1,435,339 | | |
Total Investments
(Cost: $44,954,535) | | | | | 50,679,602 | | |
Other Assets & Liabilities, Net | | | | | (122,766 | ) | |
Net Assets | | | | | 50,556,836 | | |
The accompanying Notes to Financial Statements are an integral part of this statement.
Annual Report 2014
8
Columbia Marsico Global Fund
Portfolio of Investments (continued)
February 28, 2014
Notes to Portfolio of Investments
(a) Non-income producing.
(b) The rate shown is the seven-day current annualized yield at February 28, 2014.
(c) As defined in the Investment Company Act of 1940, an affiliated company is one in which the Fund owns 5% or more of its outstanding voting securities, or a company which is under common ownership or control with the Fund. Holdings and transactions in these affiliated companies during the year ended February 28, 2014, are as follows:
Issuer | | Beginning
Cost ($) | | Purchase
Cost ($) | | Proceeds
From Sales ($) | | Ending
Cost ($) | | Dividends —
Affiliated
Issuers ($) | | Value ($) | |
Columbia Short-Term Cash Fund | | | 1,904,236 | | | | 30,969,831 | | | | (31,438,728 | ) | | | 1,435,339 | | | | 2,575 | | | | 1,435,339 | | |
Abbreviation Legend
ADR American Depositary Receipt
Fair Value Measurements
Generally accepted accounting principles (GAAP) require disclosure regarding the inputs and valuation techniques used to measure fair value and any changes in valuation inputs or techniques. In addition, investments shall be disclosed by major category.
The Fund categorizes its fair value measurements according to a three-level hierarchy that maximizes the use of observable inputs and minimizes the use of unobservable inputs by prioritizing that the most observable input be used when available. Observable inputs are those that market participants would use in pricing an investment based on market data obtained from sources independent of the reporting entity. Unobservable inputs are those that reflect the Fund's assumptions about the information market participants would use in pricing an investment. An investment's level within the fair value hierarchy is based on the lowest level of any input that is deemed significant to the asset or liability's fair value measurement. The input levels are not necessarily an indication of the risk or liquidity associated with investments at that level. For example, certain U.S. government securities are generally high quality and liquid, however, they are reflected as Level 2 because the inputs used to determine fair value may not always be quoted prices in an active market.
Fair value inputs are summarized in the three broad levels listed below:
> Level 1 — Valuations based on quoted prices for investments in active markets that the Fund has the ability to access at the measurement date (including NAV for open-end mutual funds). Valuation adjustments are not applied to Level 1 investments.
> Level 2 — Valuations based on other significant observable inputs (including quoted prices for similar securities, interest rates, prepayment speeds, credit risks, etc.).
> Level 3 — Valuations based on significant unobservable inputs (including the Fund's own assumptions and judgment in determining the fair value of investments).
Inputs that are used in determining fair value of an investment may include price information, credit data, volatility statistics, and other factors. These inputs can be either observable or unobservable. The availability of observable inputs can vary between investments, and is affected by various factors such as the type of investment, and the volume and level of activity for that investment or similar investments in the marketplace. The inputs will be considered by the Investment Manager, along with any other relevant factors in the calculation of an investment's fair value. The Fund uses prices and inputs that are current as of the measurement date, which may include periods of market dislocations. During these periods, the availability of prices and inputs may be reduced for many investments. This condition could cause an investment to be reclassified between the various levels within the hierarchy.
Foreign equity securities actively traded in markets where there is a significant delay in the local close relative to the New York Stock Exchange (NYSE) are classified as Level 2. The values of these securities may include an adjustment to reflect the impact of significant market movements following the close of local trading, as described in Note 2 to the financial statements — Security Valuation.
Investments falling into the Level 3 category are primarily supported by quoted prices from brokers and dealers participating in the market for those investments. However, these may be classified as Level 3 investments due to lack of market transparency and corroboration to support these quoted prices. Additionally, valuation models may be used as the pricing source for any remaining investments classified as Level 3. These models may rely on one or more significant unobservable inputs and/or significant assumptions by the Investment Manager. Inputs used in valuations may include, but are not limited to, financial statement analysis, capital account balances, discount rates and estimated cash flows, and comparable company data.
Under the direction of the Fund's Board of Trustees (the Board), the Investment Manager's Valuation Committee (the Committee) is responsible for overseeing the valuation procedures approved by the Board. The Committee consists of voting and non-voting members from various groups within the Investment Manager's organization, including operations and accounting, trading and investments, compliance, risk management and legal.
The accompanying Notes to Financial Statements are an integral part of this statement.
Annual Report 2014
9
Columbia Marsico Global Fund
Portfolio of Investments (continued)
February 28, 2014
Fair Value Measurements (continued)
The Committee meets at least monthly to review and approve valuation matters, which may include a description of specific valuation determinations, data regarding pricing information received from approved pricing vendors and brokers and the results of Board-approved valuation control policies and procedures (the Policies). The Policies address, among other things, instances when market quotations are or are not readily available, including recommendations of third party pricing vendors and a determination of appropriate pricing methodologies; events that require specific valuation determinations and assessment of fair value techniques; securities with a potential for stale pricing, including those that are illiquid, restricted, or in default; and the effectiveness of third party pricing vendors, including periodic reviews of vendors. The Committee meets more frequently, as needed, to discuss additional valuation matters, which may include the need to review back-testing results, review time-sensitive information or approve related valuation actions. The Committee reports to the Board, with members of the Committee meeting with the Board at each of its regularly scheduled meetings to discuss valuation matters and actions during the period, similar to those described earlier.
For investments categorized as Level 3, the Committee monitors information similar to that described above, which may include: (i) data specific to the issuer or comparable issuers, (ii) general market or specific sector news and (iii) quoted prices and specific or similar security transactions. The Committee considers this data and any changes from prior periods in order to assess the reasonableness of observable and unobservable inputs, any assumptions or internal models used to value those securities and changes in fair value. This data is also used to corroborate, when available, information received from approved pricing vendors and brokers. Various factors impact the frequency of monitoring this information (which may occur as often as daily). However, the Committee may determine that changes to inputs, assumptions and models are not required as a result of the monitoring procedures performed.
The following table is a summary of the inputs used to value the Fund's investments at February 28, 2014:
Description | | Level 1
Quoted Prices in Active
Markets for Identical
Assets ($) | | Level 2
Other Significant
Observable Inputs ($) | | Level 3
Significant
Unobservable Inputs ($) | | Total ($) | |
Equity Securities | |
Common Stocks | |
Consumer Discretionary | | | 10,190,287 | | | | 7,166,443 | | | | — | | | | 17,356,730 | | |
Consumer Staples | | | 1,799,989 | | | | — | | | | — | | | | 1,799,989 | | |
Energy | | | 2,807,294 | | | | — | | | | — | | | | 2,807,294 | | |
Health Care | | | 5,488,669 | | | | 1,692,586 | | | | — | | | | 7,181,255 | | |
Industrials | | | 4,615,450 | | | | 3,429,512 | | | | — | | | | 8,044,962 | | |
Information Technology | | | 8,942,520 | | | | — | | | | — | | | | 8,942,520 | | |
Materials | | | 3,111,513 | | | | — | | | | — | | | | 3,111,513 | | |
Total Equity Securities | | | 36,955,722 | | | | 12,288,541 | | | | — | | | | 49,244,263 | | |
Mutual Funds | |
Money Market Funds | | | 1,435,339 | | | | — | | | | — | | | | 1,435,339 | | |
Total Mutual Funds | | | 1,435,339 | | | | — | | | | — | | | | 1,435,339 | | |
Total | | | 38,391,061 | | | | 12,288,541 | | | | — | | | | 50,679,602 | | |
See the Portfolio of Investments for all investment classifications not indicated in the table.
The Fund's assets assigned to the Level 2 input category are generally valued using the market approach, in which a security's value is determined through reference to prices and information from market transactions for similar or identical assets. These assets include certain foreign securities for which a third party statistical pricing service may be employed for purposes of fair market valuation. The models utilized by the third party statistical pricing service take into account a security's correlation to available market data including, but not limited to, intraday index, ADR, and ETF movements.
There were no transfers of financial assets between levels during the period.
The accompanying Notes to Financial Statements are an integral part of this statement.
Annual Report 2014
10
Columbia Marsico Global Fund
Statement of Assets and Liabilities
February 28, 2014
Assets | |
Investments, at value | |
Unaffiliated issuers (identified cost $43,519,196) | | $ | 49,244,263 | | |
Affiliated issuers (identified cost $1,435,339) | | | 1,435,339 | | |
Total investments (identified cost $44,954,535) | | | 50,679,602 | | |
Receivable for: | |
Investments sold | | | 2,785,937 | | |
Capital shares sold | | | 260,070 | | |
Dividends | | | 17,836 | | |
Reclaims | | | 16,967 | | |
Prepaid expenses | | | 1,079 | | |
Other assets | | | 24,097 | | |
Total assets | | | 53,785,588 | | |
Liabilities | |
Foreign currency (cost $1,008) | | | 1,012 | | |
Payable for: | |
Investments purchased | | | 3,036,375 | | |
Capital shares purchased | | | 117,174 | | |
Investment management fees | | | 1,086 | | |
Distribution and/or service fees | | | 410 | | |
Transfer agent fees | | | 5,548 | | |
Administration fees | | | 110 | | |
Compensation of board members | | | 29,217 | | |
Expense reimbursement due to Investment Manager | | | 6 | | |
Other expenses | | | 37,814 | | |
Total liabilities | | | 3,228,752 | | |
Net assets applicable to outstanding capital stock | | $ | 50,556,836 | | |
Represented by | |
Paid-in capital | | $ | 41,116,170 | | |
Excess of distributions over net investment income | | | (29,293 | ) | |
Accumulated net realized gain | | | 3,743,268 | | |
Unrealized appreciation (depreciation) on: | |
Investments | | | 5,725,067 | | |
Foreign currency translations | | | 1,624 | | |
Total — representing net assets applicable to outstanding capital stock | | $ | 50,556,836 | | |
The accompanying Notes to Financial Statements are an integral part of this statement.
Annual Report 2014
11
Columbia Marsico Global Fund
Statement of Assets and Liabilities (continued)
February 28, 2014
Class A | |
Net assets | | $ | 25,902,154 | | |
Shares outstanding | | | 1,843,816 | | |
Net asset value per share | | $ | 14.05 | | |
Maximum offering price per share(a) | | $ | 14.91 | | |
Class C | |
Net assets | | $ | 7,422,987 | | |
Shares outstanding | | | 543,041 | | |
Net asset value per share | | $ | 13.67 | | |
Class R | |
Net assets | | $ | 2,352,539 | | |
Shares outstanding | | | 168,970 | | |
Net asset value per share | | $ | 13.92 | | |
Class R4 | |
Net assets | | $ | 1,482,054 | | |
Shares outstanding | | | 104,565 | | |
Net asset value per share | | $ | 14.17 | | |
Class R5 | |
Net assets | | $ | 2,540 | | |
Shares outstanding | | | 179 | | |
Net asset value per share(b) | | $ | 14.17 | | |
Class Z | |
Net assets | | $ | 13,394,562 | | |
Shares outstanding | | | 945,104 | | |
Net asset value per share | | $ | 14.17 | | |
(a) The maximum offering price per share is calculated by dividing the net asset value per share by 1.0 minus the maximum sales charge of 5.75%.
(b) Net asset value per share rounds to this amount due to fractional shares outstanding.
The accompanying Notes to Financial Statements are an integral part of this statement.
Annual Report 2014
12
Columbia Marsico Global Fund
Statement of Operations
Year Ended February 28, 2014
Net investment income | |
Income: | |
Dividends — unaffiliated issuers | | $ | 343,119 | | |
Dividends — affiliated issuers | | | 2,575 | | |
Foreign taxes withheld | | | (23,934 | ) | |
Total income | | | 321,760 | | |
Expenses: | |
Investment management fees | | | 252,327 | | |
Distribution and/or service fees | |
Class A | | | 44,502 | | |
Class C | | | 38,963 | | |
Class R | | | 10,046 | | |
Transfer agent fees | |
Class A | | | 26,320 | | |
Class C | | | 5,793 | | |
Class R | | | 2,945 | | |
Class R4(a) | | | 193 | | |
Class Z | | | 12,105 | | |
Administration fees | | | 25,552 | | |
Compensation of board members | | | 15,081 | | |
Custodian fees | | | 5,425 | | |
Printing and postage fees | | | 24,750 | | |
Registration fees | | | 57,239 | | |
Professional fees | | | 44,382 | | |
Other | | | 21,848 | | |
Total expenses | | | 587,471 | | |
Fees waived or expenses reimbursed by Investment Manager and its affiliates | | | (90,302 | ) | |
Total net expenses | | | 497,169 | | |
Net investment loss | | | (175,409 | ) | |
Realized and unrealized gain (loss) — net | |
Net realized gain (loss) on: | |
Investments | | | 5,703,301 | | |
Foreign currency translations | | | 1,355 | | |
Net realized gain | | | 5,704,656 | | |
Net change in unrealized appreciation (depreciation) on: | |
Investments | | | 3,787,829 | | |
Foreign currency translations | | | 1,675 | | |
Net change in unrealized appreciation (depreciation) | | | 3,789,504 | | |
Net realized and unrealized gain | | | 9,494,160 | | |
Net increase in net assets resulting from operations | | $ | 9,318,751 | | |
(a) For the period from January 8, 2014 (commencement of operations) to February 28, 2014.
The accompanying Notes to Financial Statements are an integral part of this statement.
Annual Report 2014
13
Columbia Marsico Global Fund
Statement of Changes in Net Assets
| | | Year Ended
February 28,
2014 | | Year Ended
February 28,
2013 | |
Operations | |
Net investment loss | | $ | (175,409 | ) | | $ | (63,521 | ) | |
Net realized gain | | | 5,704,656 | | | | 1,110,715 | | |
Net change in unrealized appreciation (depreciation) | | | 3,789,504 | | | | 444,035 | | |
Net increase in net assets resulting from operations | | | 9,318,751 | | | | 1,491,229 | | |
Distributions to shareholders | |
Net realized gains | |
Class A | | | (804,813 | ) | | | — | | |
Class C | | | (166,058 | ) | | | — | | |
Class R | | | (75,117 | ) | | | — | | |
Class Z | | | (397,428 | ) | | | — | | |
Total distributions to shareholders | | | (1,443,416 | ) | | | — | | |
Increase (decrease) in net assets from capital stock activity | | | 23,577,435 | | | | 9,181,802 | | |
Total increase in net assets | | | 31,452,770 | | | | 10,673,031 | | |
Net assets at beginning of year | | | 19,104,066 | | | | 8,431,035 | | |
Net assets at end of year | | $ | 50,556,836 | | | $ | 19,104,066 | | |
Excess of distributions over net investment income | | $ | (29,293 | ) | | $ | (54,091 | ) | |
The accompanying Notes to Financial Statements are an integral part of this statement.
Annual Report 2014
14
Columbia Marsico Global Fund
Statement of Changes in Net Assets (continued)
| | | Year Ended February 28, 2014(a) | | Year Ended February 28, 2013 | |
| | | Shares | | Dollars ($) | | Shares | | Dollars ($) | |
Capital stock activity | |
Class A shares | |
Subscriptions | | | 1,049,052 | | | | 13,400,823 | | | | 839,765 | | | | 8,497,513 | | |
Distributions reinvested | | | 51,041 | | | | 694,671 | | | | — | | | | — | | |
Redemptions | | | (240,126 | ) | | | (3,170,487 | ) | | | (245,776 | ) | | | (2,456,822 | ) | |
Net increase | | | 859,967 | | | | 10,925,007 | | | | 593,989 | | | | 6,040,691 | | |
Class C shares | |
Subscriptions | | | 310,059 | | | | 4,080,661 | | | | 65,211 | | | | 638,876 | | |
Distributions reinvested | | | 7,590 | | | | 100,724 | | | | — | | | | — | | |
Redemptions | | | (20,590 | ) | | | (243,674 | ) | | | (30,288 | ) | | | (302,304 | ) | |
Net increase | | | 297,059 | | | | 3,937,711 | | | | 34,923 | | | | 336,572 | | |
Class R shares | |
Subscriptions | | | 16,140 | | | | 207,063 | | | | 30,075 | | | | 313,224 | | |
Distributions reinvested | | | 1,391 | | | | 18,775 | | | | — | | | | — | | |
Redemptions | | | (2,417 | ) | | | (32,052 | ) | | | (3 | ) | | | (35 | ) | |
Net increase | | | 15,114 | | | | 193,786 | | | | 30,072 | | | | 313,189 | | |
Class R4 shares | |
Subscriptions | | | 106,637 | | | | 1,420,629 | | | | — | | | | — | | |
Redemptions | | | (2,072 | ) | | | (28,099 | ) | | | — | | | | — | | |
Net increase | | | 104,565 | | | | 1,392,530 | | | | — | | | | — | | |
Class R5 shares | |
Subscriptions | | | 179 | | | | 2,500 | | | | — | | | | — | | |
Net increase | | | 179 | | | | 2,500 | | | | — | | | | — | | |
Class Z shares | |
Subscriptions | | | 584,378 | | | | 7,509,466 | | | | 284,021 | | | | 2,898,398 | | |
Distributions reinvested | | | 15,635 | | | | 214,665 | | | | — | | | | — | | |
Redemptions | | | (46,964 | ) | | | (598,230 | ) | | | (39,285 | ) | | | (407,048 | ) | |
Net increase | | | 553,049 | | | | 7,125,901 | | | | 244,736 | | | | 2,491,350 | | |
Total net increase | | | 1,829,933 | | | | 23,577,435 | | | | 903,720 | | | | 9,181,802 | | |
(a) Class R4 and Class R5 shares are for the period from January 8, 2014 (commencement of operations) to February 28, 2014.
The accompanying Notes to Financial Statements are an integral part of this statement.
Annual Report 2014
15
Columbia Marsico Global Fund
The following tables are intended to help you understand the Fund's financial performance. Certain information reflects financial results for a single share of a class held for the periods shown. Per share net investment income (loss) amounts are calculated based on average shares outstanding during the period. Total return assumes reinvestment of all dividends and distributions, if any. Total return does not reflect payment of sales charges, if any, and is not annualized for periods of less than one year.
| | | Year Ended February 28, | | Year Ended
February 29, | | Year Ended February 28, | |
Class A | | 2014 | | 2013 | | 2012 | | 2011 | | 2010 | |
Per share data | |
Net asset value, beginning of period | | $ | 10.78 | | | $ | 9.71 | | | $ | 10.16 | | | $ | 7.85 | | | $ | 4.98 | | |
Income from investment operations: | |
Net investment loss | | | (0.06 | ) | | | (0.04 | ) | | | (0.05 | ) | | | (0.05 | ) | | | (0.03 | ) | |
Net realized and unrealized gain (loss) | | | 3.82 | | | | 1.11 | | | | (0.28 | ) | | | 2.42 | | | | 2.93 | | |
Total from investment operations | | | 3.76 | | | | 1.07 | | | | (0.33 | ) | | | 2.37 | | | | 2.90 | | |
Less distributions to shareholders: | |
Net investment income | | | — | | | | — | | | | (0.01 | ) | | | (0.06 | ) | | | (0.03 | ) | |
Net realized gains | | | (0.49 | ) | | | — | | | | (0.10 | ) | | | — | | | | — | | |
Tax return of capital | | | — | | | | — | | | | (0.01 | ) | | | — | | | | — | | |
Total distributions to shareholders | | | (0.49 | ) | | | — | | | | (0.12 | ) | | | (0.06 | ) | | | (0.03 | ) | |
Redemption fees: | |
Redemption fees added to paid-in capital | | | — | | | | — | | | | — | | | | — | | | | 0.00 | (a) | |
Net asset value, end of period | | $ | 14.05 | | | $ | 10.78 | | | $ | 9.71 | | | $ | 10.16 | | | $ | 7.85 | | |
Total return | | | 35.05 | % | | | 11.02 | % | | | (3.27 | %) | | | 30.23 | % | | | 58.22 | % | |
Ratios to average net assets(b) | |
Total gross expenses | | | 1.80 | % | | | 2.18 | % | | | 3.58 | % | | | 5.38 | % | | | 5.44 | % | |
Total net expenses(c) | | | 1.51 | % | | | 1.57 | % | | | 1.60 | % | | | 1.60 | %(d) | | | 1.60 | %(d) | |
Net investment loss | | | (0.50 | %) | | | (0.41 | %) | | | (0.50 | %) | | | (0.59 | %) | | | (0.42 | %) | |
Supplemental data | |
Net assets, end of period (in thousands) | | $ | 25,902 | | | $ | 10,610 | | | $ | 3,786 | | | $ | 3,343 | | | $ | 1,990 | | |
Portfolio turnover | | | 149 | % | | | 98 | % | | | 112 | % | | | 104 | % | | | 137 | % | |
Notes to Financial Highlights
(a) Rounds to zero.
(b) In addition to the fees and expenses which the Fund bears directly, the Fund indirectly bears a pro rata share of the fees and expenses of the acquired funds in which it invests. Such indirect expenses are not included in the reported expense ratios.
(c) Total net expenses include the impact of certain waivers/reimbursements made by the Investment Manager and certain of its affiliates, if applicable.
(d) The benefits derived from expense reductions had an impact of less than 0.01%.
The accompanying Notes to Financial Statements are an integral part of this statement.
Annual Report 2014
16
Columbia Marsico Global Fund
Financial Highlights (continued)
| | | Year Ended February 28, | | Year Ended
February 29, | | Year Ended February 28, | |
Class C | | 2014 | | 2013 | | 2012 | | 2011 | | 2010 | |
Per share data | |
Net asset value, beginning of period | | $ | 10.51 | | | $ | 9.53 | | | $ | 10.04 | | | $ | 7.78 | | | $ | 4.95 | | |
Income from investment operations: | |
Net investment loss | | | (0.15 | ) | | | (0.11 | ) | | | (0.11 | ) | | | (0.12 | ) | | | (0.08 | ) | |
Net realized and unrealized gain (loss) | | | 3.71 | | | | 1.09 | | | | (0.30 | ) | | | 2.39 | | | | 2.91 | | |
Total from investment operations | | | 3.56 | | | | 0.98 | | | | (0.41 | ) | | | 2.27 | | | | 2.83 | | |
Less distributions to shareholders: | |
Net investment income | | | — | | | | — | | | | (0.00 | )(a) | | | (0.01 | ) | | | — | | |
Net realized gains | | | (0.40 | ) | | | — | | | | (0.10 | ) | | | — | | | | — | | |
Tax return of capital | | | — | | | | — | | | | (0.00 | )(a) | | | — | | | | — | | |
Total distributions to shareholders | | | (0.40 | ) | | | — | | | | (0.10 | ) | | | (0.01 | ) | | | — | | |
Redemption fees: | |
Redemption fees added to paid-in capital | | | — | | | | — | | | | — | | | | — | | | | 0.00 | (a) | |
Net asset value, end of period | | $ | 13.67 | | | $ | 10.51 | | | $ | 9.53 | | | $ | 10.04 | | | $ | 7.78 | | |
Total return | | | 34.01 | % | | | 10.28 | % | | | (4.04 | %) | | | 29.14 | % | | | 57.17 | % | |
Ratios to average net assets(b) | |
Total gross expenses | | | 2.54 | % | | | 3.03 | % | | | 4.32 | % | | | 6.13 | % | | | 6.19 | % | |
Total net expenses(c) | | | 2.26 | % | | | 2.32 | % | | | 2.35 | % | | | 2.35 | %(d) | | | 2.35 | %(d) | |
Net investment loss | | | (1.24 | %) | | | (1.10 | %) | | | (1.25 | %) | | | (1.33 | %) | | | (1.15 | %) | |
Supplemental data | |
Net assets, end of period (in thousands) | | $ | 7,423 | | | $ | 2,586 | | | $ | 2,012 | | | $ | 2,051 | | | $ | 1,426 | | |
Portfolio turnover | | | 149 | % | | | 98 | % | | | 112 | % | | | 104 | % | | | 137 | % | |
Notes to Financial Highlights
(a) Rounds to zero.
(b) In addition to the fees and expenses which the Fund bears directly, the Fund indirectly bears a pro rata share of the fees and expenses of the acquired funds in which it invests. Such indirect expenses are not included in the reported expense ratios.
(c) Total net expenses include the impact of certain waivers/reimbursements made by the Investment Manager and certain of its affiliates, if applicable.
(d) The benefits derived from expense reductions had an impact of less than 0.01%.
The accompanying Notes to Financial Statements are an integral part of this statement.
Annual Report 2014
17
Columbia Marsico Global Fund
Financial Highlights (continued)
| | | Year Ended February 28, | | Year Ended
February 29, | | Year Ended February 28, | |
Class R | | 2014 | | 2013 | | 2012 | | 2011 | | 2010 | |
Per share data | |
Net asset value, beginning of period | | $ | 10.70 | | | $ | 9.65 | | | $ | 10.13 | | | $ | 7.83 | | | $ | 4.97 | | |
Income from investment operations: | |
Net investment loss | | | (0.09 | ) | | | (0.06 | ) | | | (0.07 | ) | | | (0.07 | ) | | | (0.05 | ) | |
Net realized and unrealized gain (loss) | | | 3.77 | | | | 1.11 | | | | (0.30 | ) | | | 2.41 | | | | 2.93 | | |
Total from investment operations | | | 3.68 | | | | 1.05 | | | | (0.37 | ) | | | 2.34 | | | | 2.88 | | |
Less distributions to shareholders: | |
Net investment income | | | — | | | | — | | | | (0.00 | )(a) | | | (0.04 | ) | | | (0.02 | ) | |
Net realized gains | | | (0.46 | ) | | | — | | | | (0.10 | ) | | | — | | | | — | | |
Tax return of capital | | | — | | | | — | | | | (0.01 | ) | | | — | | | | — | | |
Total distributions to shareholders | | | (0.46 | ) | | | — | | | | (0.11 | ) | | | (0.04 | ) | | | (0.02 | ) | |
Redemption fees: | |
Redemption fees added to paid-in capital | | | — | | | | — | | | | — | | | | — | | | | 0.00 | (a) | |
Net asset value, end of period | | $ | 13.92 | | | $ | 10.70 | | | $ | 9.65 | | | $ | 10.13 | | | $ | 7.83 | | |
Total return | | | 34.55 | % | | | 10.88 | % | | | (3.62 | %) | | | 29.94 | % | | | 57.86 | % | |
Ratios to average net assets(b) | |
Total gross expenses | | | 2.06 | % | | | 2.53 | % | | | 3.82 | % | | | 5.63 | % | | | 5.69 | % | |
Total net expenses(c) | | | 1.77 | % | | | 1.82 | % | | | 1.85 | % | | | 1.85 | %(d) | | | 1.85 | %(d) | |
Net investment loss | | | (0.69 | %) | | | (0.61 | %) | | | (0.75 | %) | | | (0.82 | %) | | | (0.62 | %) | |
Supplemental data | |
Net assets, end of period (in thousands) | | $ | 2,353 | | | $ | 1,645 | | | $ | 1,195 | | | $ | 1,245 | | | $ | 984 | | |
Portfolio turnover | | | 149 | % | | | 98 | % | | | 112 | % | | | 104 | % | | | 137 | % | |
Notes to Financial Highlights
(a) Rounds to zero.
(b) In addition to the fees and expenses which the Fund bears directly, the Fund indirectly bears a pro rata share of the fees and expenses of the acquired funds in which it invests. Such indirect expenses are not included in the reported expense ratios.
(c) Total net expenses include the impact of certain waivers/reimbursements made by the Investment Manager and certain of its affiliates, if applicable.
(d) The benefits derived from expense reductions had an impact of less than 0.01%.
The accompanying Notes to Financial Statements are an integral part of this statement.
Annual Report 2014
18
Columbia Marsico Global Fund
Financial Highlights (continued)
Class R4 | | Year Ended
February 28,
2014(a) | |
Per share data | |
Net asset value, beginning of period | | $ | 13.95 | | |
Income from investment operations: | |
Net investment loss | | | (0.01 | ) | |
Net realized and unrealized gain | | | 0.23 | | |
Total from investment operations | | | 0.22 | | |
Net asset value, end of period | | $ | 14.17 | | |
Total return | | | 1.58 | % | |
Ratios to average net assets(b) | |
Total gross expenses | | | 1.47 | %(c) | |
Total net expenses(d) | | | 1.25 | %(c) | |
Net investment loss | | | (0.33 | %)(c) | |
Supplemental data | |
Net assets, end of period (in thousands) | | $ | 1,482 | | |
Portfolio turnover | | | 149 | % | |
Notes to Financial Highlights
(a) For the period from January 8, 2014 (commencement of operations) to February 28, 2014.
(b) In addition to the fees and expenses which the Fund bears directly, the Fund indirectly bears a pro rata share of the fees and expenses of the acquired funds in which it invests. Such indirect expenses are not included in the reported expense ratios.
(c) Annualized.
(d) Total net expenses include the impact of certain waivers/reimbursements made by the Investment Manager and certain of its affiliates, if applicable.
The accompanying Notes to Financial Statements are an integral part of this statement.
Annual Report 2014
19
Columbia Marsico Global Fund
Financial Highlights (continued)
Class R5 | | Year Ended
February 28,
2014(a) | |
Per share data | |
Net asset value, beginning of period | | $ | 13.95 | | |
Income from investment operations: | |
Net investment loss | | | (0.01 | ) | |
Net realized and unrealized gain | | | 0.23 | | |
Total from investment operations | | | 0.22 | | |
Net asset value, end of period | | $ | 14.17 | | |
Total return | | | 1.58 | % | |
Ratios to average net assets(b) | |
Total gross expenses | | | 1.38 | %(c) | |
Total net expenses(d) | | | 1.20 | %(c) | |
Net investment loss | | | (0.37 | %)(c) | |
Supplemental data | |
Net assets, end of period (in thousands) | | $ | 3 | | |
Portfolio turnover | | | 149 | % | |
Notes to Financial Highlights
(a) For the period from January 8, 2014 (commencement of operations) to February 28, 2014.
(b) In addition to the fees and expenses which the Fund bears directly, the Fund indirectly bears a pro rata share of the fees and expenses of the acquired funds in which it invests. Such indirect expenses are not included in the reported expense ratios.
(c) Annualized.
(d) Total net expenses include the impact of certain waivers/reimbursements made by the Investment Manager and certain of its affiliates, if applicable.
The accompanying Notes to Financial Statements are an integral part of this statement.
Annual Report 2014
20
Columbia Marsico Global Fund
Financial Highlights (continued)
| | | Year Ended February 28, | | Year Ended
February 29, | | Year Ended February 28, | |
Class Z | | 2014 | | 2013 | | 2012 | | 2011 | | 2010 | |
Per share data | |
Net asset value, beginning of period | | $ | 10.87 | | | $ | 9.76 | | | $ | 10.20 | | | $ | 7.88 | | | $ | 4.99 | | |
Income from investment operations: | |
Net investment loss | | | (0.04 | ) | | | (0.02 | ) | | | (0.02 | ) | | | (0.03 | ) | | | (0.01 | ) | |
Net realized and unrealized gain (loss) | | | 3.86 | | | | 1.13 | | | | (0.30 | ) | | | 2.43 | | | | 2.94 | | |
Total from investment operations | | | 3.82 | | | | 1.11 | | | | (0.32 | ) | | | 2.40 | | | | 2.93 | | |
Less distributions to shareholders: | |
Net investment income | | | — | | | | — | | | | (0.01 | ) | | | (0.08 | ) | | | (0.04 | ) | |
Net realized gains | | | (0.52 | ) | | | — | | | | (0.10 | ) | | | — | | | | — | | |
Tax return of capital | | | — | | | | — | | | | (0.01 | ) | | | — | | | | — | | |
Total distributions to shareholders | | | (0.52 | ) | | | — | | | | (0.12 | ) | | | (0.08 | ) | | | (0.04 | ) | |
Redemption fees: | |
Redemption fees added to paid-in capital | | | — | | | | — | | | | — | | | | — | | | | 0.00 | (a) | |
Net asset value, end of period | | $ | 14.17 | | | $ | 10.87 | | | $ | 9.76 | | | $ | 10.20 | | | $ | 7.88 | | |
Total return | | | 35.32 | % | | | 11.37 | % | | | (3.12 | %) | | | 30.47 | % | | | 58.79 | % | |
Ratios to average net assets(b) | |
Total gross expenses | | | 1.54 | % | | | 1.88 | % | | | 3.32 | % | | | 5.13 | % | | | 5.19 | % | |
Total net expenses(c) | | | 1.26 | % | | | 1.32 | % | | | 1.35 | % | | | 1.35 | %(d) | | | 1.35 | %(d) | |
Net investment loss | | | (0.29 | %) | | | (0.19 | %) | | | (0.25 | %) | | | (0.33 | %) | | | (0.13 | %) | |
Supplemental data | |
Net assets, end of period (in thousands) | | $ | 13,395 | | | $ | 4,263 | | | $ | 1,438 | | | $ | 1,557 | | | $ | 1,136 | | |
Portfolio turnover | | | 149 | % | | | 98 | % | | | 112 | % | | | 104 | % | | | 137 | % | |
Notes to Financial Highlights
(a) Rounds to zero.
(b) In addition to the fees and expenses which the Fund bears directly, the Fund indirectly bears a pro rata share of the fees and expenses of the acquired funds in which it invests. Such indirect expenses are not included in the reported expense ratios.
(c) Total net expenses include the impact of certain waivers/reimbursements made by the Investment Manager and certain of its affiliates, if applicable.
(d) The benefits derived from expense reductions had an impact of less than 0.01%.
The accompanying Notes to Financial Statements are an integral part of this statement.
Annual Report 2014
21
Columbia Marsico Global Fund
Notes to Financial Statements
February 28, 2014
Note 1. Organization
Columbia Marsico Global Fund (the Fund), a series of Columbia Funds Series Trust (the Trust), is a diversified fund. The Trust is registered under the Investment Company Act of 1940, as amended (the 1940 Act), as an open-end management investment company organized as a Delaware statutory trust.
Fund Shares
The Trust may issue an unlimited number of shares (without par value). The Fund offers Class A, Class C, Class R, Class R4, Class R5 and Class Z shares. Although all share classes generally have identical voting, dividend and liquidation rights, each share class votes separately when required by law. Different share classes pay different distribution amounts to the extent the expenses of such share classes differ, and distributions in liquidation will be proportional to the net asset value of each share class. Each share class has its own expense structure and sales charges, as applicable.
Class A shares are subject to a maximum front-end sales charge of 5.75% based on the initial investment amount. Class A shares purchased without an initial sales charge in accounts aggregating $1 million to $50 million at the time of purchase are subject to a contingent deferred sales charge (CDSC) if the shares are sold within 18 months of purchase, charged as follows: 1.00% CDSC if redeemed within 12 months of purchase, and 0.50% CDSC if redeemed more than 12, but less than 18, months after purchase.
Class C shares are subject to a 1.00% CDSC on shares redeemed within one year of purchase.
Class R shares are not subject to sales charges and are generally available only to certain retirement plans and other eligible investors.
Class R4 shares are not subject to sales charges and are generally available only to omnibus retirement plans and certain other eligible investors. Class R4 shares commenced operations on January 8, 2014.
Class R5 shares are not subject to sales charges and are generally available only to investors purchasing through authorized investment professionals and omnibus retirement plans. Class R5 shares commenced operations on January 8, 2014.
Class Z shares are not subject to sales charges and are available only to certain eligible investors, which are subject to different investment minimums.
Note 2. Summary of Significant Accounting Policies
Use of Estimates
The preparation of financial statements in accordance with U.S. generally accepted accounting principles (GAAP) requires management to make certain estimates and assumptions that affect the reported amounts of assets and liabilities, the disclosure of contingent assets and liabilities at the date of the financial statements and the reported amounts of revenue and expenses during the reporting period. Actual results could differ from those estimates.
The following is a summary of significant accounting policies consistently followed by the Fund in the preparation of its financial statements.
Security Valuation
All equity securities are valued at the close of business of the New York Stock Exchange (NYSE). Equity securities are valued at the last quoted sales price on the principal exchange or market on which they trade, except for securities traded on the NASDAQ Stock Market, which are valued at the NASDAQ official close price. Unlisted securities or listed securities for which there were no sales during the day are valued at the mean of the latest quoted bid and ask prices on such exchanges or markets.
Foreign equity securities are valued based on quotations from the principal market in which such securities are normally traded. If any foreign share prices are not readily available as a result of limited share activity the securities are valued at the mean of the latest quoted bid and ask prices on such exchanges or markets. Foreign currency exchange rates are generally determined at 4:00 p.m. Eastern (U.S.) time. However, many securities markets and exchanges outside the U.S. close prior to the close of the NYSE; therefore, the closing prices for securities in such markets or on such exchanges may not fully reflect events that occur after such close but before the close of the NYSE. In those situations, foreign securities will be fair valued pursuant to the policy adopted by the Board of Trustees (the Board), including utilizing a third party pricing service to determine these fair values. The third party pricing service takes into account multiple factors, including, but not limited to, movements in the U.S. securities markets, certain depositary receipts, futures contracts and foreign exchange rates that have occurred subsequent to the close of the foreign exchange or market, to determine a good faith estimate that reasonably reflects the current market conditions as of the close of the NYSE. The fair value of a security is likely to be different from the quoted or published price, if available.
Annual Report 2014
22
Columbia Marsico Global Fund
Notes to Financial Statements (continued)
February 28, 2014
Investments in open-end investment companies, including money market funds, are valued at net asset value.
Investments for which market quotations are not readily available, or that have quotations which management believes are not reliable, are valued at fair value as determined in good faith under consistently applied procedures established by and under the general supervision of the Board. If a security or class of securities (such as foreign securities) is valued at fair value, such value is likely to be different from the last quoted market price for the security.
The determination of fair value often requires significant judgment. To determine fair value, management may use assumptions including but not limited to future cash flows and estimated risk premiums. Multiple inputs from various sources may be used to determine fair value.
Foreign Currency Transactions and Translations
The values of all assets and liabilities denominated in foreign currencies are translated into U.S. dollars at that day's exchange rates. Net realized and unrealized gains (losses) on foreign currency transactions and translations include gains (losses) arising from the fluctuation in exchange rates between trade and settlement dates on securities transactions, gains (losses) arising from the disposition of foreign currency and currency gains (losses) between the accrual and payment dates on dividends, interest income and foreign withholding taxes.
For financial statement purposes, the Fund does not distinguish that portion of gains (losses) on investments which is due to changes in foreign exchange rates from that which is due to changes in market prices of the investments. Such fluctuations are included with the net realized and unrealized gains (losses) on investments in the Statement of Operations.
Security Transactions
Security transactions are accounted for on the trade date. Cost is determined and gains (losses) are based upon the specific identification method for both financial statement and federal income tax purposes.
Income Recognition
Corporate actions and dividend income are generally recorded net of any non-reclaimable tax withholdings, on the ex-dividend date or upon receipt of ex-dividend notification in the case of certain foreign securities.
Awards from class action litigation are recorded as a reduction of cost basis if the Fund still owns the applicable securities on the payment date. If the Fund no longer owns the applicable securities, the proceeds are recorded as realized gains.
Expenses
General expenses of the Trust are allocated to the Fund and other funds of the Trust based upon relative net assets or other expense allocation methodologies determined by the nature of the expense. Expenses directly attributable to the Fund are charged to the Fund. Expenses directly attributable to a specific class of shares are charged to that share class.
Determination of Class Net Asset Value
All income, expenses (other than class-specific expenses, which are charged to that share class, as shown in the Statement of Operations) and realized and unrealized gains (losses) are allocated to each class of the Fund on a daily basis, based on the relative net assets of each class, for purposes of determining the net asset value of each class.
Federal Income Tax Status
The Fund intends to qualify each year as a regulated investment company under Subchapter M of the Internal Revenue Code, as amended, and will distribute substantially all of its taxable income (including net short-term capital gains), if any, for its tax year, and as such will not be subject to federal income taxes. In addition, the Fund intends to distribute in each calendar year substantially all of its net investment income, capital gains and certain other amounts, if any, such that the Fund should not be subject to federal excise tax. Therefore, no federal income or excise tax provision is recorded.
Foreign Taxes
The Fund may be subject to foreign taxes on income, gains on investments or currency repatriation, a portion of which may be recoverable. The Fund will accrue such taxes and recoveries, as applicable, based upon its current interpretation of tax rules and regulations that exist in the markets in which it invests.
Realized gains in certain countries may be subject to foreign taxes at the Fund level, based on statutory rates. The Fund accrues for such foreign taxes on realized and unrealized gains at the appropriate rate for each jurisdiction, as applicable. The amount, if any, is disclosed as a liability on the Statement of Assets and Liabilities.
Distributions to Shareholders
Distributions from net investment income, if any, are declared and paid semi-annually. Net realized capital gains, if any, are distributed at least annually. Income distributions and capital gain distributions are determined in accordance with federal income tax regulations, which may differ from GAAP.
Annual Report 2014
23
Columbia Marsico Global Fund
Notes to Financial Statements (continued)
February 28, 2014
Guarantees and Indemnifications
Under the Trust's organizational documents and, in some cases, by contract, its officers and trustees are indemnified against certain liabilities arising out of the performance of their duties to the Trust or its funds. In addition, certain of the Fund's contracts with its service providers contain general indemnification clauses. The Fund's maximum exposure under these arrangements is unknown since the amount of any future claims that may be made against the Fund cannot be determined, and the Fund has no historical basis for predicting the likelihood of any such claims.
Note 3. Fees and Compensation Paid to Affiliates
Investment Management Fees
Under an Investment Management Services Agreement, Columbia Management Investment Advisers, LLC (the Investment Manager), a wholly-owned subsidiary of Ameriprise Financial, Inc. (Ameriprise Financial), is responsible for the ultimate oversight of investments made by the Fund. The Fund's subadviser (see Subadvisory Agreement below) has the primary responsibility for the day-to-day portfolio management of the Fund. The investment management fee is an annual fee that is equal to a percentage of the Fund's average daily net assets that declines from 0.79% to 0.62% as the Fund's net assets increase. The effective investment management fee rate for the year ended February 28, 2014 was 0.79% of the Fund's average daily net assets.
Subadvisory Agreement
The Investment Manager has entered into a Subadvisory Agreement with Marsico Capital Management, LLC (Marsico) to subadvise the assets of the Fund. The Investment Manager compensates Marsico to manage the investment of the Fund's assets.
Administration Fees
Under an Administrative Services Agreement, the Investment Manager also serves as the Fund Administrator. The Fund pays the Fund Administrator an annual fee for administration and accounting services equal to a percentage of the Fund's average daily net assets that declines from 0.08% to 0.05% as the Fund's net assets increase. The effective administration fee rate for the year ended February 28, 2014 was 0.08% of the Fund's average daily net assets.
Other Expenses
Other expenses are for, among other things, miscellaneous expenses of the Fund or the Board, including payments to a company providing limited administrative services to the Fund and the Board. That company's expenses include boardroom and office expense, employee compensation, employee health
and retirement benefits, and certain other expenses. For the year ended February 28, 2014, other expenses paid to this company were $1,494.
Compensation of Board Members
Board members are compensated for their services to the Fund as disclosed in the Statement of Operations. Under a Deferred Compensation Plan (the Plan), the Board members who are not "interested persons" of the Fund, as defined under the 1940 Act, may elect to defer payment of up to 100% of their compensation. Deferred amounts are treated as though equivalent dollar amounts had been invested in shares of certain funds managed by the Investment Manager. The Fund's liability for these amounts is adjusted for market value changes and remains in the Fund until distributed in accordance with the Plan.
Transfer Agent Fees
Under a Transfer and Dividend Disbursing Agent Agreement, Columbia Management Investment Services Corp. (the Transfer Agent), an affiliate of the Investment Manager and a wholly-owned subsidiary of Ameriprise Financial, is responsible for providing transfer agency services to the Fund. The Transfer Agent has contracted with Boston Financial Data Services (BFDS) to serve as sub-transfer agent.
The Transfer Agent receives monthly account-based service fees based on the number of open accounts and also receives sub-transfer agency fees based on a percentage of the average aggregate value of the Fund's shares maintained in omnibus accounts (other than omnibus accounts for which American Enterprise Investment Services Inc. is the broker of record or accounts where the beneficial shareholder is a customer of Ameriprise Financial Services, Inc., which are paid a per account fee). The Transfer Agent pays the fees of BFDS for services as sub-transfer agent and is not entitled to reimbursement for such fees from the Fund (with the exception of out-of-pocket fees).
The Transfer Agent also receives compensation from fees for various shareholder services and reimbursements for certain out-of-pocket fees. Total transfer agent fees for Class R5 shares are subject to an annual limitation of not more than 0.05% of the average daily net assets attributable to Class R5 shares.
For the year ended February 28, 2014, the Fund's effective transfer agent fee rates as a percentage of average daily net assets of each class were as follows:
Class A | | | 0.15 | % | |
Class C | | | 0.15 | | |
Class R | | | 0.15 | | |
Class R4* | | | 0.16 | | |
Class R5* | | | 0.05 | | |
Class Z | | | 0.15 | | |
*Annualized.
Annual Report 2014
24
Columbia Marsico Global Fund
Notes to Financial Statements (continued)
February 28, 2014
An annual minimum account balance fee of $20 may apply to certain accounts with a value below the applicable share class's initial minimum investment requirements to reduce the impact of small accounts on transfer agent fees. These minimum account balance fees are recorded as part of expense reductions in the Statement of Operations. For the year ended February 28, 2014, no minimum account balance fees were charged by the Fund.
Distribution and Service Fees
The Fund has an agreement with Columbia Management Investment Distributors, Inc. (the Distributor), an affiliate of the Investment Manager and a wholly-owned subsidiary of Ameriprise Financial, for distribution and shareholder services. The Board has approved, and the Fund has adopted, distribution and shareholder service plans (the Plans) applicable to certain share classes, which set the distribution and service fees for the Fund. These fees are calculated daily and are intended to compensate the Distributor and/or eligible selling and/or servicing agents for selling shares of the Fund and providing services to investors.
Under the Plans, the Fund pays a monthly combined distribution and service fee to the Distributor at the maximum annual rate of 0.25% of the average daily net assets attributable to Class A shares of the Fund. Also under the Plans, the Fund pays a monthly service fee at the maximum annual rate of 0.25% of the average daily net assets attributable to Class C shares of the Fund and the payment of a monthly distribution fee at the maximum annual rate of 0.75% and 0.50% of the average daily net assets attributable to Class C and Class R shares, respectively.
Sales Charges
Sales charges, including front-end charges and CDSCs, received by the Distributor for distributing Fund shares were $77,717 for Class A and $115 for Class C shares for the year ended February 28, 2014.
Expenses Waived/Reimbursed by the Investment Manager and its Affiliates
The Investment Manager and certain of its affiliates have contractually agreed to waive fees and/or reimburse expenses (excluding certain fees and expenses described below) for the periods disclosed below, unless sooner terminated at the sole discretion of the Board, so that the Fund's net operating expenses, after giving effect to fees waived/expenses reimbursed and any balance credits and/or overdraft charges
from the Fund's custodian, do not exceed the following annual rates as a percentage of the class' average daily net assets:
| | | July 1, 2013
through
June 30, 2014 | | Prior to
July 1, 2013 | |
Class A | | | 1.50 | % | | | 1.56 | % | |
Class C | | | 2.25 | | | | 2.31 | | |
Class R | | | 1.75 | | | | 1.81 | | |
Class R4 | | | 1.25 | * | | | — | | |
Class R5 | | | 1.20 | * | | | — | | |
Class Z | | | 1.25 | | | | 1.31 | | |
*Annual rate is contractual from January 8, 2014 (the commencement of operations of each share class) through December 31, 2014.
Under the agreement governing these fee waivers and/or expense reimbursement arrangements, the following fees and expenses are excluded from the waiver/reimbursement commitment, and therefore will be paid by the Fund, if applicable: taxes (including foreign transaction taxes), expenses associated with investments in affiliated and non-affiliated pooled investment vehicles (including mutual funds and exchange traded funds), transaction costs and brokerage commissions, costs related to any securities lending program, dividend expenses associated with securities sold short, inverse floater program fees and expenses, transaction charges and interest on borrowed money, interest, extraordinary expenses and any other expenses the exclusion of which is specifically approved by the Board. This agreement may be modified or amended only with approval from all parties.
Note 4. Federal Tax Information
The timing and character of income and capital gain distributions are determined in accordance with income tax regulations, which may differ from GAAP because of temporary or permanent book to tax differences.
At February 28, 2014, these differences are primarily due to differing treatment for deferral/reversal of wash sales losses, Trustees' deferred compensation, foreign currency transactions and net operating loss reclassification. To the extent these differences are permanent, reclassifications are made among the components of the Fund's net assets in the Statement of Assets and Liabilities. Temporary differences do not require reclassifications. In the Statement of Assets and Liabilities the following reclassifications were made:
Excess of distributions over net investment income | | $ | 200,207 | | |
Accumulated net realized gain | | | (200,206 | ) | |
Paid-in capital | | | (1 | ) | |
Annual Report 2014
25
Columbia Marsico Global Fund
Notes to Financial Statements (continued)
February 28, 2014
Net investment income and net realized gains (losses), as disclosed in the Statement of Operations, and net assets were not affected by this reclassification.
The tax character of distributions paid during the years indicated was as follows:
| | | Year Ended
February 28,
2014 | | Year Ended
February 28,
2013 | |
Ordinary income | | $ | 765,372 | | | $ | — | | |
Long-term capital gains | | | 678,044 | | | | — | | |
Total | | $ | 1,443,416 | | | $ | — | | |
Short-term capital gain distributions, if any, are considered ordinary income distributions for tax purposes.
At February 28, 2014, the components of distributable earnings on a tax basis were as follows:
Undistributed ordinary income | | $ | 1,608,339 | | |
Undistributed accumulated long-term gain | | | 2,140,184 | | |
Unrealized appreciation | | | 5,719,812 | | |
At February 28, 2014, the cost of investments for federal income tax purposes was $44,959,790 and the aggregate gross unrealized appreciation and depreciation based on that cost was:
Unrealized appreciation | | $ | 5,931,998 | | |
Unrealized depreciation | | | (212,186 | ) | |
Net unrealized appreciation | | $ | 5,719,812 | | |
For the year ended February 28, 2014, $311,493 of capital loss carryforward was utilized.
Management of the Fund has concluded that there are no significant uncertain tax positions that would require recognition in the financial statements. However, management's conclusion may be subject to review and adjustment at a later date based on factors including, but not limited to, new tax laws, regulations, and administrative interpretations (including relevant court decisions). Generally, the Fund's federal tax returns for the prior three fiscal years remain subject to examination by the Internal Revenue Service.
Note 5. Portfolio Information
The cost of purchases and proceeds from sales of securities, excluding short-term obligations, aggregated to $67,517,433 and $44,647,030, respectively, for the year ended February 28, 2014.
Note 6. Affiliated Money Market Fund
The Fund invests its daily cash balances in Columbia Short-Term Cash Fund, an affiliated money market fund established for the exclusive use by the Fund and other affiliated funds.
The income earned by the Fund from such investments is included as "Dividends — affiliated issuers" in the Statement of Operations. As an investing fund, the Fund indirectly bears its proportionate share of the expenses of Columbia Short-Term Cash Fund.
Note 7. Shareholder Concentration
At February 28, 2014, three unaffiliated shareholder accounts owned an aggregate of 46.1% of the outstanding shares of the Fund. The Fund has no knowledge about whether any portion of those shares was owned beneficially by such accounts. Affiliated shareholder accounts owned 39.1% of the outstanding shares of the Fund. Subscription and redemption activity by concentrated accounts may have a significant effect on the operations of the Fund.
Note 8. Line of Credit
The Fund has entered into a revolving credit facility with a syndicate of banks led by JPMorgan Chase Bank N.A. whereby the Fund may borrow for the temporary funding of shareholder redemptions or for other temporary or emergency purposes. The credit facility agreement, as amended, which is a collective agreement between the Fund and certain other funds managed by the Investment Manager, severally and not jointly, permits collective borrowings up to $500 million. Interest is charged to each participating fund based on its borrowings at a rate equal to the higher of (i) the overnight federal funds rate plus 1.00% or (ii) the one-month LIBOR rate plus 1.00%. Each borrowing under the credit facility matures no later than 60 days after the date of borrowing. Effective December 10, 2013, the Fund also pays a commitment fee equal to its pro rata share of the amount of the credit facility at a rate of 0.075% per annum. Prior to December 10, 2013, the commitment fee was charged at the annual rate of 0.08% per annum. The commitment fee is included in other expenses in the Statement of Operations.
The Fund had no borrowings during the year ended February 28, 2014.
Note 9. Significant Risks
Consumer Discretionary Sector Risk
Sector risk occurs when a fund invests a significant portion of its assets in securities of companies conducting business in a related group of industries within an economic sector. Companies in the same economic sector may be similarly affected by economic, regulatory, political or market events or conditions, making a fund more vulnerable to unfavorable developments in that economic sector than funds that invest more broadly. The Fund may be more susceptible to the particular risks that may affect companies in the consumer
Annual Report 2014
26
Columbia Marsico Global Fund
Notes to Financial Statements (continued)
February 28, 2014
discretionary sector than if it were invested in a wider variety of companies in unrelated sectors.
Foreign Securities Risk
Investing in foreign securities may include certain risks and considerations not typically associated with investing in U.S. securities, such as fluctuating currency values and changing local and regional economic, political and social conditions, which may result in greater market volatility. In addition, certain foreign securities may not be as liquid as U.S. securities. Investing in emerging markets may accentuate these risks.
Investments in emerging market countries are subject to additional risk. The risk of foreign investments is typically increased in less developed countries. These countries are also more likely to experience high levels of inflation, deflation or currency devaluation which could hurt their economies and securities markets.
Note 10. Subsequent Events
Management has evaluated the events and transactions that have occurred through the date the financial statements were issued and noted no items requiring adjustment of the financial statements or additional disclosure.
Note 11. Information Regarding Pending and Settled Legal Proceedings
In December 2005, without admitting or denying the allegations, American Express Financial Corporation (AEFC, which is now known as Ameriprise Financial, Inc. (Ameriprise Financial)) entered into settlement agreements with the Securities and Exchange Commission (SEC) and Minnesota Department of Commerce (MDOC) related to market timing activities. As a result, AEFC was censured and ordered to cease and desist from committing or causing any violations of certain provisions of the Investment Advisers Act of 1940, the Investment Company Act of 1940, and various Minnesota laws. AEFC agreed to pay disgorgement of $10 million and civil money penalties of $7 million. AEFC also agreed to retain an independent distribution consultant to assist in developing a plan for distribution of all disgorgement and civil penalties ordered by the SEC in accordance with various undertakings detailed at www.sec.gov/litigation/admin/ia-2451.pdf. Ameriprise Financial and its affiliates have cooperated with the SEC and the MDOC in these legal proceedings, and have made regular reports to the Funds' Boards of Trustees.
Ameriprise Financial and certain of its affiliates have historically been involved in a number of legal, arbitration and regulatory proceedings, including routine litigation, class actions, and governmental actions, concerning matters arising in connection with the conduct of their business activities.
Ameriprise Financial believes that the Funds are not currently the subject of, and that neither Ameriprise Financial nor any of its affiliates are the subject of, any pending legal, arbitration or regulatory proceedings that are likely to have a material adverse effect on the Funds or the ability of Ameriprise Financial or its affiliates to perform under their contracts with the Funds. Ameriprise Financial is required to make 10-Q, 10-K and, as necessary, 8-K filings with the Securities and Exchange Commission on legal and regulatory matters that relate to Ameriprise Financial and its affiliates. Copies of these filings may be obtained by accessing the SEC website at www.sec.gov.
There can be no assurance that these matters, or the adverse publicity associated with them, will not result in increased fund redemptions, reduced sale of fund shares or other adverse consequences to the Funds. Further, although we believe proceedings are not likely to have a material adverse effect on the Funds or the ability of Ameriprise Financial or its affiliates to perform under their contracts with the Funds, these proceedings are subject to uncertainties and, as such, we are unable to estimate the possible loss or range of loss that may result. An adverse outcome in one or more of these proceedings could result in adverse judgments, settlements, fines, penalties or other relief that could have a material adverse effect on the consolidated financial condition or results of operations of Ameriprise Financial.
Annual Report 2014
27
Columbia Marsico Global Fund
Report of Independent Registered Public Accounting Firm
To the Trustees of Columbia Funds Series Trust and the Shareholders of
Columbia Marsico Global Fund
In our opinion, the accompanying statement of assets and liabilities, including the portfolio of investments, and the related statements of operations and of changes in net assets and the financial highlights present fairly, in all material respects, the financial position of Columbia Marsico Global Fund (the "Fund", a series of Columbia Funds Series Trust) at February 28, 2014, and the results of its operations, the changes in its net assets and the financial highlights for each of the periods indicated, in conformity with accounting principles generally accepted in the United States of America. These financial statements and financial highlights (hereafter referred to as "financial statements") are the responsibility of the Fund's management; our responsibility is to express an opinion on these financial statements based on our audits. We conducted our audits of these financial statements in accordance with the standards of the Public Company Accounting Oversight Board (United States). Those standards require that we plan and perform the audit to obtain reasonable assurance about whether the financial statements are free of material misstatement. An audit includes examining, on a test basis, evidence supporting the amounts and disclosures in the financial statements, assessing the accounting principles used and significant estimates made by management, and evaluating the overall financial statement presentation. We believe that our audits, which included confirmation of securities at February 28, 2014 by correspondence with the custodian, brokers and transfer agent, provide a reasonable basis for our opinion.
PricewaterhouseCoopers LLP
Minneapolis, Minnesota
April 21, 2014
Annual Report 2014
28
Columbia Marsico Global Fund
Federal Income Tax Information
(Unaudited)
The Fund hereby designates the following tax attributes for the fiscal year ended February 28, 2014. Shareholders will be notified in early 2015 of the amounts for use in preparing 2014 income tax returns.
Tax Designations:
| Qualified Dividend Income | | | 36.71 | % | |
| Dividends Received Deduction | | | 16.37 | % | |
Capital Gain Dividend | | $ | 2,959,139 | | |
Qualified Dividend Income. For taxable, non-corporate shareholders, the percentage of ordinary income dividends paid during the fiscal year that represents qualified dividend income subject to reduced tax rates.
Dividends Received Deduction. The percentage of ordinary income dividends paid during the fiscal year that qualifies for the corporate dividends received deduction.
Capital Gain Dividend. The Fund designates as a capital gain dividend the amount reflected above, or if subsequently determined to be different, the net capital gain of such fiscal period. The Fund also designates as capital gain dividends, to the extent necessary to fully distribute such capital gains, earnings and profits distributed to shareholders on the redemption of shares.
Annual Report 2014
29
Columbia Marsico Global Fund
Shareholders elect the Board that oversees the Funds' operations. The Board appoints officers who are responsible for day-to-day business decisions based on policies set by the Board. The following table provides basic biographical information about the Funds' Board members, including their principal occupations during the past five years, although specific titles for individuals may have varied over the period. Under current Board policy, members may serve through the end of the calendar year in which he or she reaches either the mandatory retirement age established by the Board or the fifteenth anniversary of the first Board meeting they attended as a member of the Board.
Independent Trustees
Name,
Address,
Year of Birth | | Position Held With
Funds and Length of
Service | | Principal Occupation(s)
During Past Five Years
and Other Relevant
Professional Experience | | Number of
Funds in the
Fund Family
Overseen by
Board Member | | Other Present or Past
Directorships/
Trusteeships
(Within Past 5 Years) | |
Kathleen Blatz
901 S. Marquette Ave.
Minneapolis, MN 55402
1954 | | Board member since 1/06 for RiverSource Funds and since 6/11 for Nations Funds | | Attorney; Chief Justice, Minnesota Supreme
Court, 1998-2006 | | | 131 | | | Trustee, BlueCross BlueShield of Minnesota since 2009 | |
Edward J. Boudreau, Jr.
901 S. Marquette Ave.
Minneapolis, MN 55402
1944 | | Board member since 6/11 for RiverSource Funds and since 1/05 for Nations Funds | | Managing Director, E.J. Boudreau & Associates (consulting) since 2000; Chairman and Chief Executive Officer, John Hancock Funds (mutual funds), 1989-2000 | | | 129 | | | Former Trustee, BofA Funds Series Trust (11 funds), 2005-2011 | |
Pamela G. Carlton
901 S. Marquette Ave.
Minneapolis, MN 55402
1954 | | Board member since 7/07 for RiverSource Funds and since 6/11 for Nations Funds | | President, Springboard — Partners in Cross Cultural Leadership (consulting company) since 2003; Director or Management Director of US Equity Research, Chase Asset Management, 1996-2003; Investment Banker, Morgan Stanley, 1982-1996 | | | 131 | | | None | |
William P. Carmichael
901 S. Marquette Ave.
Minneapolis, MN 55402
1943 | | Chair of the Board since 1/14, Board member since 6/11 for RiverSource Funds and since 2003 for Nations Funds | | Retired; Co-founder, The Succession Fund (provides exit strategies to owners of privately held companies); previously, Senior Vice President, Sara Lee Corporation; Senior Vice President and Chief Financial officer, Beatrice Foods Company; Vice President, Esmark, Inc.; Associate, Price Waterhouse | | | 131 | | | Director, Cobra Electronics Corporation (electronic equipment manufacturer); The Finish Line (athletic shoes and apparel) since July 2003; Director, International Textile Corp. since 2012; former Director, McMoRan Exploration Company (oil and gas exploration and development) 2010-2013; former Trustee, BofA Funds Series Trust (11 funds), 2009-2011; Director, Spectrum Brands, Inc. (consumer products), 2002-2009; Director, Simmons Company (bedding), 2004-2010 | |
Annual Report 2014
30
Columbia Marsico Global Fund
Trustees and Officers (continued)
Independent Trustees (continued)
Name,
Address,
Year of Birth | | Position Held With
Funds and Length of
Service | | Principal Occupation(s)
During Past Five Years
and Other Relevant
Professional Experience | | Number of
Funds in the
Fund Family
Overseen by
Board Member | | Other Present or Past
Directorships/
Trusteeships
(Within Past 5 Years) | |
Patricia M. Flynn
901 S. Marquette Ave.
Minneapolis, MN 55402
1950 | | Board member since 11/04 for RiverSource Funds and since 6/11 for Nations Funds | | Trustee Professor of Economics and Management, Bentley University since 1976 (also teaches and conducts research on corporate governance); Dean, McCallum Graduate School of Business, Bentley University, 1992-2002 | | | 131 | | | None | |
William A. Hawkins
901 S. Marquette Ave.
Minneapolis, MN 55402
1942 | | Board member since 6/11 for RiverSource Funds and since 1/05 for Nations Funds | | Managing Director, Overton Partners (financial consulting), since August 2010; President and Chief Executive Officer, California General Bank, N.A., January 2008-August 2010 | | | 129 | | | Trustee, BofA Funds Series Trust (11 funds) | |
R. Glenn Hilliard
901 S. Marquette Ave.
Minneapolis, MN 55402
1943 | | Board member since 6/11 for RiverSource Funds and since 1/05 for Nations Funds | | Chairman and Chief Executive Officer, Hilliard Group LLC (investing and consulting) since April 2003; Non-Executive Director & Chairman, CNO Financial Group, Inc. (insurance), September 2003-May 2011 | | | 129 | | | Chairman, BofA Fund Series Trust (11 funds); former Director, CNO Financial Group, Inc. (insurance), 2003-2011 | |
Stephen R. Lewis, Jr.
901 S. Marquette Ave.
Minneapolis, MN 55402
1939 | | Board member for RiverSource Funds since 1/02 and since 6/11 for Nations Funds, Board Chair 1/07-12/13 | | President Emeritus and Professor of Economics Emeritus, Carleton College since 2002 | | | 131 | | | Director, Valmont Industries, Inc. (irrigation systems manufacturer), 2002-2013 | |
Catherine James Paglia
901 S. Marquette Ave.
Minneapolis, MN 55402
1952 | | Board member since 11/04 for RiverSource Funds and since 6/11 for Nations Funds | | Director, Enterprise Asset Management, Inc. (private real estate and asset management company) since September 1998 | | | 131 | | | Director, Valmont Industries, Inc. (irrigation systems manufacturer) since 2012 | |
Leroy C. Richie
901 S. Marquette Ave.
Minneapolis, MN 55402
1941 | | Board member since 2000 for Legacy Seligman Funds, since 11/08 for RiverSource Funds and since 6/11 for Nations Funds | | Counsel, Lewis & Munday, P.C. (law firm) since 2004; Vice President and General Counsel, Automotive Legal Affairs, Chrysler Corporation, 1993-1997 | | | 131 | | | Lead Outside Director, Digital Ally, Inc. (digital imaging) since September 2005; Director, Infinity, Inc. (oil and gas exploration and production) since 1994; Director, OGE Energy Corp. (energy and energy services) since November 2007 | |
Minor M. Shaw
901 S. Marquette Ave.
Minneapolis, MN 55402
1947 | | Board member since 6/11 for RiverSource Funds and since 2003 for Nations Funds | | President, Micco LLC (private investments) since 2011; President, Micco Corp. since 1998 | | | 129 | | | Director, Piedmont Natural Gas; Director, BlueCross BlueShield of South Carolina since April 2008; Director, National Association of Corporate Directors, Carolinas Chapter, since 2013; former Trustee, BofA Funds Series Trust (11 funds) | |
Annual Report 2014
31
Columbia Marsico Global Fund
Trustees and Officers (continued)
Independent Trustees (continued)
Name,
Address,
Year of Birth | | Position Held With
Funds and Length of
Service | | Principal Occupation(s)
During Past Five Years
and Other Relevant
Professional Experience | | Number of
Funds in the
Fund Family
Overseen by
Board Member | | Other Present or Past
Directorships/
Trusteeships
(Within Past 5 Years) | |
Alison Taunton-Rigby
901 S. Marquette Ave.
Minneapolis, MN 55402
1944 | | Board member since 11/02 for RiverSource Funds and since 6/11 for Nations Funds | | Chief Executive Officer and Director, RiboNovix, Inc., (biotechnology) 2003-2010 | | | 131 | | | Director, Healthways, Inc. (health and wellbeing solutions) since 2005; Director, ICI Mutual Insurance Company, RRG since 2011; Director, Abt
Associates (government contractor) since 2001; Director, Boston Children's Hospital since 2002 | |
Interested Trustee Not Affiliated with Investment Manager*
Name,
Address,
Year of Birth | | Position Held With
Funds and Length of
Service | | Principal Occupation(s)
During Past Five Years
and Other Relevant
Professional Experience | | Number of
Funds in the
Fund Family
Overseen by
Board Member | | Other Present or Past
Directorships/
Trusteeships
(Within Past 5 Years) | |
Anthony M. Santomero
901 S. Marquette Ave.
Minneapolis, MN 55402
1946 | | Board member since 6/11 for RiverSource Funds and since 1/08 for Nations Funds | | Richard K. Mellon Professor Emeritus of Finance, The Wharton School, University of Pennsylvania, since 2002; Senior Advisor, McKinsey & Company (consulting), 2006-2008 | | | 129 | | | Director, Renaissance Reinsurance Ltd. since May 2008; Trustee, Penn Mutual Life Insurance Company since March 2008; Director, Citigroup Inc. since 2009; Director, Citibank, N.A. since 2009; former Trustee, BofA Funds Series Trust (11 funds), 2008-2011 | |
* Dr. Santomero is not an affiliated person of the Investment Manager or Ameriprise Financial. However, he is currently deemed by the Funds to be an "interested person" (as defined in the 1940 Act) of the Funds because he serves as a Director of Citigroup Inc. and Citibank, N.A., companies that may directly or through subsidiaries and affiliates engage from time-to-time in brokerage execution, principal transactions and lending relationships with the Funds or accounts advised/managed by the Investment Manager.
Annual Report 2014
32
Columbia Marsico Global Fund
Trustees and Officers (continued)
Interested Trustee Affiliated with Investment Manager*
Name,
Address,
Year of Birth | | Position Held With
Funds and Length of
Service | | Principal Occupation(s)
During Past Five Years
and Other Relevant
Professional Experience | | Number of
Funds in the
Fund Family
Overseen by
Board Member | | Other Present or Past
Directorships/
Trusteeships
(Within Past 5 Years) | |
William F. Truscott
53600 Ameriprise
Financial Center
Minneapolis, MN 55474
1960 | | Board member since 11/01 for RiverSource Funds and since 6/11 for Nations Funds; Senior Vice President since 2002 for RiverSource Funds and since 5/10 for Nations Funds | | Chairman of the Board and President, Columbia Management Investment Advisers, LLC since May 2010 and February 2012, respectively (previously President and Chief Investment Officer, 2001-April 2010); Chief Executive Officer, Global Asset Management, Ameriprise Financial, Inc. since September 2012 (previously Chief Executive Officer, U.S. Asset Management & President, Annuities, May 2010-September 2012 and President — U.S. Asset Management and Chief Investment Officer, 2005-April 2010); Director and Chief Executive Officer, Columbia Management Investment Distributors, Inc. since May 2010 and February 2012, respectively (previously Chairman of the Board and Chief Executive Officer, 2006-April 2010); Chairman of the Board and Chief Executive Officer, RiverSource Distributors, Inc. since 2006; Director, Threadneedle Asset Management Holdings, SARL since 2014; President and Chief Executive Officer, Ameriprise Certificate Company, 2006-August 2012 | | | 183 | | | Former Director, Ameriprise Certificate Company, 2006-January 2013 | |
* Interested person (as defined under the 1940 Act) by reason of being an officer, director, security holder and/or employee of the Investment Manager or Ameriprise Financial.
The SAI has additional information about the Fund's Board members and is available, without charge, upon request by calling 800.345.6611; contacting your financial intermediary; or visiting columbiamanagement.com.
Annual Report 2014
33
Columbia Marsico Global Fund
Trustees and Officers (continued)
The Board has appointed officers who are responsible for day-to-day business decisions based on policies it has established. The officers serve at the pleasure of the Board. In addition to Mr. Truscott, who is Senior Vice President, the Funds' other officers are:
Officers
Name,
Address and
Year of Birth | | Position and Year
First Appointed to
Position for any Fund
in the Columbia
Funds Complex or a
Predecessor Thereof | | Principal Occupation(s) During Past Five Years | |
J. Kevin Connaughton
225 Franklin Street
Boston, MA 02110
Born 1964 | | President and Principal Executive Officer (2009) | | Managing Director and General Manager — Mutual Fund Products, Columbia Management Investment Advisers, LLC since May 2010; and President, Columbia Funds since 2009; Managing Director, Columbia Management Advisors, LLC, December 2004 – April 2010; Senior Vice President and Chief Financial Officer, Columbia Funds, June 2008 – January 2009; and senior officer of Columbia Funds and affiliated funds since 2003 | |
Michael G. Clarke
225 Franklin Street
Boston, MA 02110
Born 1969 | | Treasurer (2011) and Chief Financial Officer (2009) | | Vice President — Mutual Fund Administration, Columbia Management Investment Advisers, LLC, since May 2010;Managing Director of Fund Administration, Columbia Management Advisors, LLC, September 2004 – April 2010; and senior officer of Columbia Funds and affiliated funds since 2002 | |
Scott R. Plummer
5228 Ameriprise Financial Center
Minneapolis, MN 55474
Born 1959 | | Senior Vice President (2006), Chief Legal Officer (2006) and Assistant Secretary (2011) | | Senior Vice President and Assistant General Counsel — Global Asset Management, Ameriprise Financial since February 2014 (previously, Senior Vice President and Lead Chief Counsel — Asset Management, 2012 – February 2014; Vice President and Lead Chief Counsel — Asset Management, 2010 – 2012; and Vice President and Chief Counsel — Asset Management, 2005 – 2010); Senior Vice President, Chief Legal Officer and Assistant Secretary, Columbia Management Investment Advisers, LLC since June 2005; Vice President, Chief Counsel and Assistant Secretary, Columbia Management Investment Distributors, Inc. since 2008; Vice President, General Counsel and Secretary, Ameriprise Certificate Company since 2005; Chief Counsel, RiverSource Distributors, Inc. since 2006; senior officer of Columbia Funds and affiliated funds since 2006 | |
Thomas P. McGuire
225 Franklin Street
Boston, MA 02110
Born 1972 | | Chief Compliance Officer (2012) | | Vice President — Asset Management Compliance, Ameriprise Financial, Inc. since May 2010; Chief Compliance Officer, Ameriprise Certificate Company, since September 2010; Compliance Executive, Bank of America, 2005 – April 2010 | |
Colin Moore
225 Franklin Street
Boston, MA 02110
Born 1958 | | Senior Vice President (2010) | | Executive Vice President and Global Chief Investment Officer, Ameriprise Financial, Inc. since July 2013; Director and Global Chief Investment Officer, Columbia Management Investment Advisers, LLC since May 2010; Manager, Managing Director and Chief Investment Officer, Columbia Management Advisors, LLC, 2007 – April 2010 | |
Michael E. DeFao
225 Franklin Street
Boston, MA 02110
Born 1968 | | Vice President (2011) and Assistant Secretary (2010) | | Vice President and Chief Counsel, Ameriprise Financial, Inc. since May 2010; Associate General Counsel, Bank of America 2005 – April 2010 | |
Joseph F. DiMaria
225 Franklin Street
Boston, MA 02110
Born 1968 | | Vice President (2011) and Chief Accounting Officer (2008) | | Vice President — Mutual Fund Treasurer, Columbia Management Investment Advisers, LLC since May 2010; Director of Fund Administration, Columbia Management Advisors, LLC, 2006 – April 2010 | |
Paul B. Goucher
100 Park Avenue
New York, NY 10017
Born 1968 | | Vice President (2011) and Assistant Secretary (2008) | | Vice President and Lead Chief Counsel, Ameriprise Financial, Inc. since November 2008 and January 2013, respectively (previously Chief Counsel, January 2010 – January 2013, and Group Counsel, November 2008 – January 2010); Director, Managing Director and General Counsel, J. & W. Seligman & Co. Incorporated, July 2008 – November 2008 | |
Amy Johnson
5228 Ameriprise Financial
Center
Minneapolis, MN 55474
Born 1965 | | Vice President (2006) | | Managing Director and Chief Operating Officer, Columbia Management Investment Advisers, LLC since May 2010 (previously Chief Administrative Officer, 2009 – April 2010, and Vice President — Asset Management and Trust Company Services, 2006 – 2009) | |
Annual Report 2014
34
Columbia Marsico Global Fund
Trustees and Officers (continued)
Officers (continued)
Name,
Address and
Year of Birth | | Position and Year
First Appointed to
Position for any Fund
in the Columbia
Funds Complex or a
Predecessor Thereof | | Principal Occupation(s) During Past Five Years | |
Paul D. Pearson
5228 Ameriprise Financial
Center
Minneapolis, MN 55474
Born 1956 | | Vice President (2011) and Assistant Treasurer (1999) | | Vice President — Investment Accounting, Columbia Management Investment Advisers, LLC since May 2010; Vice President — Managed Assets, Investment Accounting, Ameriprise Financial, Inc., 1998 – April 2010 | |
Christopher O. Petersen
5228 Ameriprise Financial Center
Minneapolis, MN 55474
Born 1970 | | Vice President and Secretary (2010) | | Vice President and Chief Counsel, Ameriprise Financial, Inc., since January 2010 (previously Vice President and Group Counsel or Counsel, 2004 – January 2010); officer of Columbia Funds and affiliated funds since 2007 | |
Stephen T. Welsh
225 Franklin Street
Boston, MA 02110
Born 1957 | | Vice President (2006) | | President and Director, Columbia Management Investment Services Corp. since May 2010; President and Director, Columbia Management Services, Inc., 2004 – April 2010; Managing Director, Columbia Management Distributors, Inc., 2007 – April 2010 | |
Annual Report 2014
35
This page intentionally left blank.
Annual Report 2014
36
Columbia Marsico Global Fund
Important Information About This Report
Each fund mails one shareholder report to each shareholder address. If you would like more than one report, please call shareholder services at 800.345.6611 and additional reports will be sent to you.
The policy of the Board is to vote the proxies of the companies in which each fund holds investments consistent with the procedures as stated in the Statement of Additional Information (SAI). You may obtain a copy of the SAI without charge by calling 800.345.6611; contacting your financial intermediary; visiting columbiamanagement.com; or searching the website of the Securities and Exchange Commission (SEC) at sec.gov. Information regarding how each fund voted proxies relating to portfolio securities is filed with the SEC by August 31 for the most recent 12-month period ending June 30 of that year, and is available without charge by visiting columbiamanagement.com; or searching the website of the SEC at sec.gov.
Each fund files a complete schedule of portfolio holdings with the SEC for the first and third quarters of each fiscal year on Form N-Q. Each fund's Form N-Q is available on the SEC's website at sec.gov and may be reviewed and copied at the SEC's Public Reference Room in Washington, D.C. Information on the operation of the Public Reference Room may be obtained by calling 800.SEC.0330. Each fund's complete schedule of portfolio holdings, as filed on Form N-Q, can also be obtained without charge, upon request, by calling 800.345.6611.
Annual Report 2014
37

Columbia Marsico Global Fund
P.O. Box 8081
Boston, MA 02266-8081
columbiamanagement.com
This information is for use with concurrent or prior delivery of a fund prospectus. Please read and consider the investment objectives, risks, charges and expenses for any fund carefully before investing. For a prospectus and, if available, a summary prospectus, which contains this and other important information about the Fund go to columbiamanagement.com. The Fund is distributed by Columbia Management Investment Distributors, Inc., member FINRA, and managed by Columbia Management Investment Advisers, LLC.
© 2014 Columbia Management Investment Advisers, LLC. All rights reserved.
ANN187_02_D01_(04/14)
Annual Report
February 28, 2014

Columbia Marsico International Opportunities Fund
Not FDIC insured • No bank guarantee • May lose value
 Dear Shareholders,
Equities recovered
In the final months of 2013, the U.S. economy embraced a robust recovery. After five years of only modest progress, the pace of economic growth picked up, job gains continued, manufacturing activity accelerated and a rebound in the housing market showed staying power. Growth, as measured by gross domestic product, was 4.1% in the third quarter, with expectations for a solid fourth quarter. Job growth averaged close to 200,000 monthly. Industrial production rose at a rate of 3.3%, considerably higher than the 12-month average of 2.5%. Factories were busier than at any point since the 2008/2009 recession, with capacity utilization at 79%. Orders for durable goods were strong, bolstered by rising auto sales. Holiday spending was solid, especially online sales, which rose 10% year over year, despite a shorter season.
Against this backdrop, the Federal Reserve's (the Fed's) announcement that it would slowly retreat from its monthly bond buying program and a bipartisan budget deal in Washington were welcome news for investors. Stocks climbed to new highs in the fourth quarter, while bonds retreated as yields moved higher. Small-cap stocks outperformed large- and mid-cap stocks, led by significant gains from the industrials, technology and consumer discretionary sectors. All 10 sectors of the S&P 500 Index delivered positive returns, although telecommunications and utilities posted only modest gains.
Fixed-income retreated
Improved economic data drove interest rates higher over the fourth quarter, credit spreads narrowed and the dollar weakened against most developed market currencies. Against this backdrop, most non-Treasury, fixed-income sectors delivered positive returns. Outgoing Fed chairman Ben Bernanke expressed concern about the persistently low level of core inflation, but gains in the labor market and reduced unemployment led to the Fed's decision to taper its bond-buying program gradually beginning in January 2014.
As the stock market soared, the riskiest sectors of the fixed-income markets fared the best. U.S. and foreign high-yield bonds were the strongest performers, followed by emerging-market and U.S. investment-grade corporate bonds. U.S. mortgage-backed securities (MBS) and securitized bonds produced negative total returns, as did U.S. Treasuries and developed world government bonds. Treasury inflation-protected bonds were the period's biggest losers. Investment-grade municipals delivered fractional gains, as better economic conditions helped steady state finances.
Stay on track with Columbia Management
Backed by more than 100 years of experience, Columbia Management is one of the nation's largest asset managers. At the heart of our success and, most importantly, that of our investors, are highly talented industry professionals, brought together by a unique way of working. At Columbia Management, reaching our performance goals matters, and how we reach them matters just as much.
Visit columbiamanagement.com for:
> The Columbia Management Perspectives blog, offering insights on current market events and investment opportunities
> Detailed up-to-date fund performance and portfolio information
> Quarterly fund commentaries
> Columbia Management Investor, our award-winning quarterly newsletter for shareholders
Thank you for your continued support of the Columbia Funds. We look forward to serving your investment needs for many years to come.
Best Regards,

J. Kevin Connaughton
President, Columbia Funds
Investing involves risk including the risk of loss of principal.
The S&P 500 Index, an unmanaged index, measures the performance of 500 widely held, large-capitalization U.S. stocks and is frequently used as a general measure of market performance. The Dow Jones Industrial Average is a price weighted average of 30 actively traded shares of blue chip US industrial corporations listed on the New York Stock Exchange. Indices are not available for investment, are not professionally managed and do not reflect sales charges, fees, brokerage commissions, taxes or other expenses of investing.
Investors should consider the investment objectives, risks, charges and expenses of a mutual fund carefully before investing. For a free prospectus and, if available, a summary prospectus, which contains this and other important information about a fund, visit columbiamanagement.com. The prospectus should be read carefully before investing.
Columbia Funds are distributed by Columbia Management Investment Distributors, Inc., member FINRA, and managed by Columbia Management Investment Advisers, LLC.
© 2014 Columbia Management Investment Advisers, LLC. All rights reserved.
Columbia Marsico International Opportunities Fund
Performance Overview | | | 2 | | |
Manager Discussion of Fund Performance | | | 4 | | |
Understanding Your Fund's Expenses | | | 7 | | |
Portfolio of Investments | | | 8 | | |
Statement of Assets and Liabilities | | | 12 | | |
Statement of Operations | | | 14 | | |
Statement of Changes in Net Assets | | | 15 | | |
Financial Highlights | | | 17 | | |
Notes to Financial Statements | | | 24 | | |
Report of Independent Registered
Public Accounting Firm | | | 30 | | |
Federal Income Tax Information | | | 31 | | |
Trustees and Officers | | | 32 | | |
Important Information About This Report | | | 41 | | |
Fund Investment Manager
Columbia Management Investment
Advisers, LLC
225 Franklin Street
Boston, MA 02110
Fund Distributor
Columbia Management Investment
Distributors, Inc.
225 Franklin Street
Boston, MA 02110
Fund Transfer Agent
Columbia Management Investment
Services Corp.
P.O. Box 8081
Boston, MA 02266-8081
For more information about any of the funds, please visit columbiamanagement.com or call 800.345.6611. Customer Service Representatives are available to answer your questions Monday through Friday from 8 a.m. to 7 p.m. Eastern time.
The views expressed in this report reflect the current views of the respective parties. These views are not guarantees of future performance and involve certain risks, uncertainties and assumptions that are difficult to predict, so actual outcomes and results may differ significantly from the views expressed. These views are subject to change at any time based upon economic, market or other conditions and the respective parties disclaim any responsibility to update such views. These views may not be relied on as investment advice and, because investment decisions for a Columbia Fund are based on numerous factors, may not be relied on as an indication of trading intent on behalf of any particular Columbia Fund. References to specific securities should not be construed as a recommendation or investment advice.
Columbia Marsico International Opportunities Fund
Performance Summary
> Columbia Marsico International Opportunities Fund (the Fund) Class A shares returned 14.80% excluding sales charges for the 12-month period ended February 28, 2014.
> The Fund underperformed its benchmark, the MSCI EAFE Index (Net), which returned 19.28% for the same time period.
> Stock selection in the consumer staples, financials, information technology, industrials and health care sectors accounted for much of the Fund's shortfall relative to the benchmark.
Average Annual Total Returns (%) (for period ended February 28, 2014)
| | | Inception | | 1 Year | | 5 Years | | 10 Years | |
Class A | | 08/01/00 | | | | | | | | | | | | | |
Excluding sales charges | | | | | | | 14.80 | | | | 16.35 | | | | 5.88 | | |
Including sales charges | | | | | | | 8.23 | | | | 14.98 | | | | 5.25 | | |
Class B | | 08/01/00 | | | | | | | | | | | | | |
Excluding sales charges | | | | | | | 13.89 | | | | 15.49 | | | | 5.09 | | |
Including sales charges | | | | | | | 8.89 | | | | 15.26 | | | | 5.09 | | |
Class C | | 08/01/00 | | | | | | | | | | | | | |
Excluding sales charges | | | | | | | 13.89 | | | | 15.45 | | | | 5.08 | | |
Including sales charges | | | | | | | 12.89 | | | | 15.45 | | | | 5.08 | | |
Class I* | | 09/27/10 | | | 15.18 | | | | 16.80 | | | | 6.08 | | |
Class R* | | 01/23/06 | | | 14.51 | | | | 16.08 | | | | 5.62 | | |
Class R4* | | 11/08/12 | | | 15.04 | | | | 16.42 | | | | 5.91 | | |
Class Z | | 08/01/00 | | | 14.94 | | | | 16.65 | | | | 6.13 | | |
MSCI EAFE Index (Net) | | | | | | | 19.28 | | | | 17.60 | | | | 6.66 | | |
Returns for Class A are shown with and without the maximum initial sales charge of 5.75%. Returns for Class B are shown with and without the applicable contingent deferred sales charge (CDSC) of 5.00% in the first year, declining to 1.00% in the sixth year and eliminated thereafter. Returns for Class C are shown with and without the 1.00% CDSC for the first year only. The Fund's other classes are not subject to sales charges and have limited eligibility. Please see the Fund's prospectus for details. Performance for different share classes will vary based on differences in sales charges and fees associated with each class. All results shown assume reinvestment of distributions during the period. Returns do not reflect the deduction of taxes that a shareholder may pay on Fund distributions or on the redemption of Fund shares. Performance results reflect the effect of any fee waivers or reimbursements of Fund expenses by Columbia Management Investment Advisers, LLC and/or any of its affiliates. Absent these fee waivers or expense reimbursement arrangements, performance results would have been lower.
The performance information shown represents past performance and is not a guarantee of future results. The investment return and principal value of your investment will fluctuate so that your shares, when redeemed, may be worth more or less than their original cost. Current performance may be lower or higher than the performance information shown. You may obtain performance information current to the most recent month-end by contacting your financial intermediary, visiting columbiamanagement.com or calling 800.345.6611.
*The returns shown for periods prior to the share class inception date (including returns for the Life of the Fund, if shown, which are since Fund inception) include the returns of the Fund's oldest share class. Since the Fund launched more than one share class at its inception, Class A shares were used. These returns are adjusted to reflect any higher class-related operating expenses of the newer share classes, as applicable. Please visit columbiamanagement.com/mutual-funds/appended-performance for more information.
The MSCI EAFE Index (Net) is a free float-adjusted market capitalization index that is designed to measure the equity market performance of developed markets, excluding the U.S. and Canada. The index is compiled from a composite of securities markets of Europe, Australasia and the Far East and is widely recognized by investors in foreign markets as the measurement index for portfolios of non-North American securities.
Indices are not available for investment, are not professionally managed and do not reflect sales charges, fees, brokerage commissions, taxes (except the MSCI EAFE Index (Net), which reflects reinvested dividends net of withholding taxes) or other expenses of investing. Securities in the Fund may not match those in an index.
Annual Report 2014
2
Columbia Marsico International Opportunities Fund
Performance Overview (continued)
Performance of a Hypothetical $10,000 Investment (March 1, 2004 – February 28, 2014)
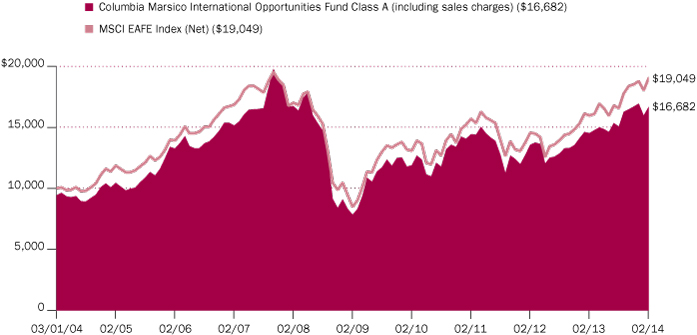
The chart above shows the change in value of a hypothetical $10,000 investment in Class A shares of Columbia Marsico International Opportunities Fund during the stated time period, and does not reflect the deduction of taxes that a shareholder may pay on Fund distributions or on the redemption of Fund shares.
Annual Report 2014
3
Columbia Marsico International Opportunities Fund
Manager Discussion of Fund Performance
For the 12-month period that ended February 28, 2014, the Fund's Class A shares returned 14.80% excluding sales charges. The Fund's benchmark, the MSCI EAFE Index (Net), returned 19.28% for the same time period. Stock selection in the consumer staples, financials, information technology, industrials and health care sectors accounted for much of the Fund's shortfall relative to the benchmark. An underweight relative to the benchmark in the strong-performing telecommunication services sector also detracted from relative results. Stock selection in, and an overweight to, the consumer discretionary sector aided performance, as did an overweight in information technology and an underweight in materials, the weakest performing sector in the benchmark.
Stocks Rose in a Favorable Market Environment
Despite a string of weak job gains at the end of 2013 — and a difficult winter, which affected job growth, construction activity and the housing market — the U.S. economy expanded at a respectable pace over the 12-month period that ended February 28, 2014. Pent-up demand, low mortgage rates and an improving labor market helped home sales advance, and foreclosure activity trended downward. After a brief pullback, manufacturing activity picked up midway through the period and remained solid. Businesses remained profitable and household finances were healthy, with lower debt loads and stronger credit conditions.
Even though a host of concerns weighed on investors, stock prices moved higher as central banks continued to pour liquidity into the financial markets. Investors shrugged off concerns regarding tax increases and enforced federal spending cuts, another showdown over the U.S. debt ceiling and the possibility of an attack on Syria. Midway through the period, the Federal Reserve's (the Fed's) talk about removing monetary support briefly dampened investor enthusiasm. However, once the Fed chose not to act until 2014, the market rally rebooted. In fact, U.S. equities posted their most significant gains since the late 1990s.
Disappointments in Consumer Staples, Financials, Technology and Health Care
Stock selection in the consumer staples sector detracted from relative performance. Premium spirits firm Remy Cointreau posted a negative return as sales in China, a key market for the company's cognac, slowed, and we sold the stock. Jeronimo Martins, a grocer, suffered margin pressures as competition in Poland increased.
Stock selection in the financials sector also detracted from results. Brazilian real estate company BR Malls Participacoes posted a double-digit decline prior to being sold. Banks BNP Paribas and Mizuho Financial also posted negative returns and were sold.
Pharmaceutical holdings Shire and GlaxoSmithKline posted weak returns and were sold in favor of investments in which we have higher conviction. Athletic apparel company lululemon athletica declined sharply prior to being sold from the Fund and was a significant detractor from performance. The firm faced several challenges during the period, including quality control and the resignation of its CEO. An underweight in telecommunication services also hurt results, as the sector was the strongest performer in the benchmark.
Portfolio Management
Marsico Capital Management, LLC
James Gendelman
Munish Malhotra, CFA
Morningstar Style BoxTM
The Morningstar Style BoxTM is based on a fund's portfolio holdings. For equity funds, the vertical axis shows the market capitalization of the stocks owned, and the horizontal axis shows investment style (value, blend, or growth). Information shown is based on the most recent data provided by Morningstar.
© 2014 Morningstar, Inc. All rights reserved. The Morningstar information contained herein: (1) is proprietary to Morningstar and/or its content providers; (2) may not be copied or distributed; and (3) is not warranted to be accurate, complete or timely. Neither Morningstar nor its content providers are responsible for any damages or losses arising from any use of this information.
Top Ten Holdings (%)
(at February 28, 2014) | |
Roche Holding AG, Genusschein
Shares (Switzerland) | | | 4.8 | | |
Liberty Global PLC, Series C
(United Kingdom) | | | 4.6 | | |
Canadian Pacific Railway Ltd.
(Canada) | | | 4.6 | | |
Gilead Sciences, Inc.
(United States) | | | 4.5 | | |
ASML Holding NV (Netherlands) | | | 4.2 | | |
Cie Financiere Richemont SA,
Class A, Registered Shares
(Switzerland) | | | 4.0 | | |
Naspers Ltd., Class N
(South Africa) | | | 3.7 | | |
Sands China Ltd. (Hong Kong) | | | 3.3 | | |
ARM Holdings PLC
(United Kingdom) | | | 3.3 | | |
AIA Group Ltd. (Hong Kong) | | | 3.2 | | |
Percentages indicated are based upon total investments (excluding Money Market Funds).
For further detail about these holdings, please refer to the section entitled "Portfolio of Investments."
Fund holdings are as of the date given, are subject to change at any time, and are not recommendations to buy or sell any security.
Annual Report 2014
4
Columbia Marsico International Opportunities Fund
Manager Discussion of Fund Performance (continued)
Consumer Discretionary a Positive Contributor to Results
Stock selection and an overweight allocation to the consumer discretionary sector were primary positive contributors to results. The sector was a strong performer within the benchmark, and the Fund benefited from its above-benchmark exposure. Rakuten, a Japan-based e-commerce company, posted a strong return as consumer spending improved. Among the Fund's media holdings, Naspers, Kabel Deutschland and Liberty Global all performed well. Kabel Deutschland was sold during the reporting period. In the information technology sector, Yandex, Russia's leading search engine, and payments processor Wirecard posted gains. Yandex's business grew as more Russian consumers adopted mobile technology. Wirecard benefited from growth in European ecommerce and electronic payments. An overweight in information technology and underweight in energy also added to results. Glencore Xtrata, a Switzerland-headquartered mining and commodity trading company, posted a double-digit positive return and was sold. Materials was the weakest performing sector of the benchmark and the Fund benefited from selling its few materials-related holdings prior to period-end.
Looking Ahead
We believe we are currently entering a period of low inflation and modest economic growth. Against this backdrop, we believe that companies with steadily expanding earnings, strong cash flow, increasing margins, rising market share, improving profitability, the development of innovative products and the effective allocation of capital to fuel further growth may be positioned to outperform their peers. These are the characteristics we seek in holdings we select for the Fund.
During the period, the Fund increased its allocations to the consumer discretionary, information technology and health care sectors, while reducing exposure to the financials, consumer staples, materials and telecommunication services sectors. As of period-end, the Fund's largest sector allocations included consumer discretionary, information technology, industrials and health care. The Fund had no exposure to the materials, utilities or telecommunication services sectors.
Country Breakdown (%)
(at February 28, 2014) | |
Canada | | | 8.7 | | |
China | | | 5.4 | | |
France | | | 4.0 | | |
Germany | | | 6.5 | | |
Hong Kong | | | 6.1 | | |
India | | | 1.9 | | |
Japan | | | 7.3 | | |
Mexico | | | 1.6 | | |
Netherlands | | | 6.0 | | |
Philippines | | | 0.5 | | |
Portugal | | | 0.3 | | |
Russian Federation | | | 1.5 | | |
South Africa | | | 3.4 | | |
Switzerland | | | 8.2 | | |
Taiwan | | | 2.5 | | |
United Kingdom | | | 14.3 | | |
United States(a) | | | 21.8 | | |
Total | | | 100.0 | | |
Percentages indicated are based upon total investments. The Fund's portfolio composition is subject to change.
(a) Includes investments in Money Market Funds.
Investment Risks
International investing involves special risks, including foreign taxation, currency risks, risk associated with possible differences in financial standards and other monetary and political risks. Since the Fund maintains a relatively concentrated portfolio, it may be subject to greater risk than a fund that is more fully diversified. See the Fund's prospectus for more information on these and other risks.
Annual Report 2014
5
Columbia Marsico International Opportunities Fund
Manager Discussion of Fund Performance (continued)
Summary of Investments in Securities
by Industry (%)
(at February 28, 2014) | |
Aerospace & Defense | | | 4.1 | | |
Automobiles | | | 3.9 | | |
Biotechnology | | | 4.2 | | |
Capital Markets | | | 1.4 | | |
Diversified Financial Services | | | 1.4 | | |
Electrical Equipment | | | 2.2 | | |
Electronic Equipment,
Instruments & Components | | | 1.5 | | |
Energy Equipment & Services | | | 4.0 | | |
Food & Staples Retailing | | | 0.8 | | |
Health Care Equipment &
Supplies | | | 1.4 | | |
Hotels, Restaurants & Leisure | | | 7.0 | | |
Insurance | | | 4.4 | | |
Internet & Catalog Retail | | | 9.4 | | |
Internet Software & Services | | | 6.2 | | |
IT Services | | | 5.1 | | |
Media | | | 10.0 | | |
Multiline Retail | | | 2.1 | | |
Pharmaceuticals | | | 4.5 | | |
Road & Rail | | | 4.3 | | |
Semiconductors &
Semiconductor Equipment | | | 9.5 | | |
Textiles, Apparel & Luxury
Goods | | | 6.3 | | |
Money Market Funds | | | 7.6 | | |
Total | | | 101.3 | | |
Percentages indicated are based upon net assets. The Fund's portfolio composition is subject to change.
Annual Report 2014
6
Columbia Marsico International Opportunities Fund
Understanding Your Fund's Expenses
(Unaudited)
As an investor, you incur two types of costs. There are transaction costs, which generally include sales charges on purchases and may include redemption fees. There are also ongoing costs, which generally include management fees, distribution and/or service fees, and other fund expenses. The following information is intended to help you understand your ongoing costs (in dollars) of investing in the Fund and to help you compare these costs with the ongoing costs of investing in other mutual funds.
Analyzing Your Fund's Expenses
To illustrate these ongoing costs, we have provided examples and calculated the expenses paid by investors in each share class of the Fund during the period. The actual and hypothetical information in the table is based on an initial investment of $1,000 at the beginning of the period indicated and held for the entire period. Expense information is calculated two ways and each method provides you with different information. The amount listed in the "Actual" column is calculated using the Fund's actual operating expenses and total return for the period. You may use the Actual information, together with the amount invested, to estimate the expenses that you paid over the period. Simply divide your account value by $1,000 (for example, an $8,600 account value divided by $1,000 = 8.6), then multiply the results by the expenses paid during the period under the "Actual" column. The amount listed in the "Hypothetical" column assumes a 5% annual rate of return before expenses (which is not the Fund's actual return) and then applies the Fund's actual expense ratio for the period to the hypothetical return. You should not use the hypothetical account values and expenses to estimate either your actual account balance at the end of the period or the expenses you paid during the period. See "Compare With Other Funds" below for details on how to use the hypothetical data.
Compare With Other Funds
Since all mutual funds are required to include the same hypothetical calculations about expenses in shareholder reports, you can use this information to compare the ongoing cost of investing in the Fund with other funds. To do so, compare the hypothetical example with the 5% hypothetical examples that appear in the shareholder reports of other funds. As you compare hypothetical examples of other funds, it is important to note that hypothetical examples are meant to highlight the ongoing costs of investing in a fund only and do not reflect any transaction costs, such as sales charges, or redemption or exchange fees. Therefore, the hypothetical calculations are useful in comparing ongoing costs only, and will not help you determine the relative total costs of owning different funds. If transaction costs were included in these calculations, your costs would be higher.
September 1, 2013 – February 28, 2014
| | | Account Value at the Beginning
of the Period ($) | | Account Value at the End of the
Period ($) | | Expenses Paid During the
Period ($) | | Fund's Annualized
Expense Ratio (%) | |
| | | Actual | | Hypothetical | | Actual | | Hypothetical | | Actual | | Hypothetical | | Actual | |
Class A | | | 1,000.00 | | | | 1,000.00 | | | | 1,107.20 | | | | 1,017.95 | | | | 7.35 | | | | 7.04 | | | | 1.40 | | |
Class B | | | 1,000.00 | | | | 1,000.00 | | | | 1,102.90 | | | | 1,014.21 | | | | 11.27 | | | | 10.80 | | | | 2.15 | | |
Class C | | | 1,000.00 | | | | 1,000.00 | | | | 1,101.90 | | | | 1,014.21 | | | | 11.27 | | | | 10.80 | | | | 2.15 | | |
Class I | | | 1,000.00 | | | | 1,000.00 | | | | 1,108.70 | | | | 1,020.14 | | | | 5.05 | | | | 4.84 | | | | 0.96 | | |
Class R | | | 1,000.00 | | | | 1,000.00 | | | | 1,105.60 | | | | 1,016.70 | | | | 8.66 | | | | 8.30 | | | | 1.65 | | |
Class R4 | | | 1,000.00 | | | | 1,000.00 | | | | 1,108.30 | | | | 1,019.25 | | | | 5.99 | | | | 5.74 | | | | 1.14 | | |
Class Z | | | 1,000.00 | | | | 1,000.00 | | | | 1,108.10 | | | | 1,019.20 | | | | 6.04 | | | | 5.79 | | | | 1.15 | | |
Expenses paid during the period are equal to the annualized expense ratio for each class as indicated above, multiplied by the average account value over the period and then multiplied by the number of days in the Fund's most recent fiscal half year and divided by 365.
Expenses do not include fees and expenses incurred indirectly by the Fund from the underlying funds in which the Fund may invest (also referred to as "acquired funds"), including affiliated and non-affiliated pooled investment vehicles (including mutual funds and exchange-traded funds).
Annual Report 2014
7
Columbia Marsico International Opportunities Fund
Portfolio of Investments
February 28, 2014
(Percentages represent value of investments compared to net assets)
Common Stocks 93.7%
Issuer | | Shares | | Value ($) | |
Canada 8.8% | |
Canadian Pacific Railway Ltd. | | | 51,517 | | | | 8,083,698 | | |
Dollarama, Inc. | | | 49,805 | | | | 3,883,917 | | |
IMAX Corp.(a) | | | 74,699 | | | | 1,998,198 | | |
Novadaq Technologies, Inc.(a) | | | 134,529 | | | | 2,744,392 | | |
Total | | | | | 16,710,205 | | |
China 5.4% | |
Anton Oilfield Services Group Ltd. | | | 2,784,000 | | | | 1,929,633 | | |
Baidu, Inc., ADR(a) | | | 24,871 | | | | 4,251,200 | | |
Qunar Cayman Islands Ltd., ADR(a) | | | 68,008 | | | | 2,073,564 | | |
Youku Tudou, Inc., ADR(a) | | | 62,394 | | | | 2,070,857 | | |
Total | | | | | 10,325,254 | | |
France 4.1% | |
Safran SA | | | 55,215 | | | | 3,887,640 | | |
Zodiac Aerospace | | | 107,764 | | | | 3,805,684 | | |
Total | | | | | 7,693,324 | | |
Germany 6.6% | |
Adidas AG | | | 41,213 | | | | 4,801,205 | | |
Bayerische Motoren Werke AG | | | 32,359 | | | | 3,760,805 | | |
Wirecard AG | | | 82,979 | | | | 3,893,077 | | |
Total | | | | | 12,455,087 | | |
Hong Kong 6.2% | |
AIA Group Ltd. | | | 1,175,600 | | | | 5,759,904 | | |
Sands China Ltd. | | | 704,000 | | | | 5,911,628 | | |
Total | | | | | 11,671,532 | | |
India 1.9% | |
Tata Motors Ltd., ADR | | | 101,920 | | | | 3,554,970 | | |
Japan 7.4% | |
Japan Exchange Group, Inc. | | | 110,500 | | | | 2,636,451 | | |
Keyence Corp. | | | 6,700 | | | | 2,885,196 | | |
Rakuten, Inc. | | | 313,900 | | | | 4,512,540 | | |
Start Today Co., Ltd. | | | 162,700 | | | | 4,018,985 | | |
Total | | | | | 14,053,172 | | |
Mexico 1.7% | |
Alsea SAB de CV | | | 1,011,628 | | | | 3,135,412 | | |
Netherlands 6.1% | |
| ASML Holding NV | | | 85,926 | | | | 7,477,963 | | |
Common Stocks (continued)
Issuer | | Shares | | Value ($) | |
Sensata Technologies Holding NV(a) | | | 101,119 | | | | 4,109,476 | | |
Total | | | | | 11,587,439 | | |
Philippines 0.5% | |
Puregold Price Club, Inc. | | | 978,600 | | | | 1,025,027 | | |
Portugal 0.3% | |
Jeronimo Martins SGPS SA | | | 32,485 | | | | 552,193 | | |
Russian Federation 1.5% | |
Yandex NV, Class A(a) | | | 74,774 | | | | 2,804,025 | | |
South Africa 3.4% | |
Naspers Ltd., Class N | | | 53,949 | | | | 6,506,896 | | |
Switzerland 8.3% | |
Cie Financiere Richemont SA, Class A,
Registered Shares | | | 71,252 | | | | 7,096,845 | | |
Roche Holding AG, Genusschein Shares | | | 27,703 | | | | 8,548,714 | | |
Total | | | | | 15,645,559 | | |
Taiwan 2.5% | |
Taiwan Semiconductor Manufacturing Co.,
Ltd., ADR | | | 263,070 | | | | 4,753,675 | | |
United Kingdom 14.5% | |
ARM Holdings PLC | | | 342,040 | | | | 5,784,911 | | |
| ASOS PLC(a) | | | 13,512 | | | | 1,574,807 | | |
Domino's Pizza Group PLC | | | 458,322 | | | | 4,290,233 | | |
Hargreaves Lansdown PLC | | | 115,874 | | | | 2,710,696 | | |
Liberty Global PLC, Class C(a) | | | 96,984 | | | | 8,210,665 | | |
Rightmove PLC | | | 48,555 | | | | 2,240,030 | | |
St. James's Place PLC | | | 176,857 | | | | 2,591,366 | | |
Total | | | | | 27,402,708 | | |
United States 14.5% | |
Gilead Sciences, Inc.(a) | | | 97,282 | | | | 8,053,977 | | |
MasterCard, Inc., Class A | | | 73,554 | | | | 5,716,617 | | |
priceline.com, Inc.(a) | | | 4,105 | | | | 5,536,988 | | |
Schlumberger Ltd. | | | 60,821 | | | | 5,656,353 | | |
Yahoo!, Inc.(a) | | | 66,938 | | | | 2,588,492 | | |
Total | | | | | 27,552,427 | | |
Total Common Stocks
(Cost: $143,547,986) | | | | | 177,428,905 | | |
The accompanying Notes to Financial Statements are an integral part of this statement.
Annual Report 2014
8
Columbia Marsico International Opportunities Fund
Portfolio of Investments (continued)
February 28, 2014
Money Market Funds 7.6%
| | | Shares | | Value ($) | |
Columbia Short-Term Cash Fund,
0.098%(b)(c) | | | 14,356,974 | | | | 14,356,974 | | |
Total Money Market Funds
(Cost: $14,356,974) | | | | | 14,356,974 | | |
Total Investments
(Cost: $157,904,960) | | | | | 191,785,879 | | |
Other Assets & Liabilities, Net | | | | | (2,463,077 | ) | |
Net Assets | | | | | 189,322,802 | | |
Notes to Portfolio of Investments
(a) Non-income producing.
(b) The rate shown is the seven-day current annualized yield at February 28, 2014.
(c) As defined in the Investment Company Act of 1940, an affiliated company is one in which the Fund owns 5% or more of its outstanding voting securities, or a company which is under common ownership or control with the Fund. Holdings and transactions in these affiliated companies during the year ended February 28, 2014, are as follows:
Issuer | | Beginning
Cost ($) | | Purchase
Cost ($) | | Proceeds
From Sales ($) | | Ending
Cost ($) | | Dividends —
Affiliated
Issuers ($) | | Value ($) | |
Columbia Short-Term Cash Fund | | | 9,973,643 | | | | 197,887,684 | | | | (193,504,353 | ) | | | 14,356,974 | | | | 6,691 | | | | 14,356,974 | | |
Abbreviation Legend
ADR American Depositary Receipt
Fair Value Measurements
Generally accepted accounting principles (GAAP) require disclosure regarding the inputs and valuation techniques used to measure fair value and any changes in valuation inputs or techniques. In addition, investments shall be disclosed by major category.
The Fund categorizes its fair value measurements according to a three-level hierarchy that maximizes the use of observable inputs and minimizes the use of unobservable inputs by prioritizing that the most observable input be used when available. Observable inputs are those that market participants would use in pricing an investment based on market data obtained from sources independent of the reporting entity. Unobservable inputs are those that reflect the Fund's assumptions about the information market participants would use in pricing an investment. An investment's level within the fair value hierarchy is based on the lowest level of any input that is deemed significant to the asset or liability's fair value measurement. The input levels are not necessarily an indication of the risk or liquidity associated with investments at that level. For example, certain U.S. government securities are generally high quality and liquid, however, they are reflected as Level 2 because the inputs used to determine fair value may not always be quoted prices in an active market.
Fair value inputs are summarized in the three broad levels listed below:
> Level 1 — Valuations based on quoted prices for investments in active markets that the Fund has the ability to access at the measurement date (including NAV for open-end mutual funds). Valuation adjustments are not applied to Level 1 investments.
> Level 2 — Valuations based on other significant observable inputs (including quoted prices for similar securities, interest rates, prepayment speeds, credit risks, etc.).
> Level 3 — Valuations based on significant unobservable inputs (including the Fund's own assumptions and judgment in determining the fair value of investments).
Inputs that are used in determining fair value of an investment may include price information, credit data, volatility statistics, and other factors. These inputs can be either observable or unobservable. The availability of observable inputs can vary between investments, and is affected by various factors such as the type of investment, and the volume and level of activity for that investment or similar investments in the marketplace. The inputs will be considered by the Investment Manager, along with any other relevant factors in the calculation of an investment's fair value. The Fund uses prices and inputs that are current as of the measurement date, which may include periods of market dislocations. During these periods, the availability of prices and inputs may be reduced for many investments. This condition could cause an investment to be reclassified between the various levels within the hierarchy.
The accompanying Notes to Financial Statements are an integral part of this statement.
Annual Report 2014
9
Columbia Marsico International Opportunities Fund
Portfolio of Investments (continued)
February 28, 2014
Fair Value Measurements (continued)
Foreign equity securities actively traded in markets where there is a significant delay in the local close relative to the New York Stock Exchange (NYSE) are classified as Level 2. The values of these securities may include an adjustment to reflect the impact of significant market movements following the close of local trading, as described in Note 2 to the financial statements — Security Valuation.
Investments falling into the Level 3 category are primarily supported by quoted prices from brokers and dealers participating in the market for those investments. However, these may be classified as Level 3 investments due to lack of market transparency and corroboration to support these quoted prices. Additionally, valuation models may be used as the pricing source for any remaining investments classified as Level 3. These models may rely on one or more significant unobservable inputs and/or significant assumptions by the Investment Manager. Inputs used in valuations may include, but are not limited to, financial statement analysis, capital account balances, discount rates and estimated cash flows, and comparable company data.
Under the direction of the Fund's Board of Trustees (the Board), the Investment Manager's Valuation Committee (the Committee) is responsible for overseeing the valuation procedures approved by the Board. The Committee consists of voting and non-voting members from various groups within the Investment Manager's organization, including operations and accounting, trading and investments, compliance, risk management and legal.
The Committee meets at least monthly to review and approve valuation matters, which may include a description of specific valuation determinations, data regarding pricing information received from approved pricing vendors and brokers and the results of Board-approved valuation control policies and procedures (the Policies). The Policies address, among other things, instances when market quotations are or are not readily available, including recommendations of third party pricing vendors and a determination of appropriate pricing methodologies; events that require specific valuation determinations and assessment of fair value techniques; securities with a potential for stale pricing, including those that are illiquid, restricted, or in default; and the effectiveness of third party pricing vendors, including periodic reviews of vendors. The Committee meets more frequently, as needed, to discuss additional valuation matters, which may include the need to review back-testing results, review time-sensitive information or approve related valuation actions. The Committee reports to the Board, with members of the Committee meeting with the Board at each of its regularly scheduled meetings to discuss valuation matters and actions during the period, similar to those described earlier.
For investments categorized as Level 3, the Committee monitors information similar to that described above, which may include: (i) data specific to the issuer or comparable issuers, (ii) general market or specific sector news and (iii) quoted prices and specific or similar security transactions. The Committee considers this data and any changes from prior periods in order to assess the reasonableness of observable and unobservable inputs, any assumptions or internal models used to value those securities and changes in fair value. This data is also used to corroborate, when available, information received from approved pricing vendors and brokers. Various factors impact the frequency of monitoring this information (which may occur as often as daily). However, the Committee may determine that changes to inputs, assumptions and models are not required as a result of the monitoring procedures performed.
The accompanying Notes to Financial Statements are an integral part of this statement.
Annual Report 2014
10
Columbia Marsico International Opportunities Fund
Portfolio of Investments (continued)
February 28, 2014
Fair Value Measurements (continued)
The following table is a summary of the inputs used to value the Fund's investments at February 28, 2014:
Description | | Level 1
Quoted Prices in Active
Markets for Identical
Assets ($) | | Level 2
Other Significant
Observable Inputs ($) | | Level 3
Significant
Unobservable Inputs ($) | | Total ($) | |
Equity Securities | |
Common Stocks | |
Consumer Discretionary | | | 28,393,715 | | | | 44,713,974 | | | | — | | | | 73,107,689 | | |
Consumer Staples | | | — | | | | 1,577,220 | | | | — | | | | 1,577,220 | | |
Energy | | | 5,656,353 | | | | 1,929,633 | | | | — | | | | 7,585,986 | | |
Financials | | | — | | | | 13,698,417 | | | | — | | | | 13,698,417 | | |
Health Care | | | 10,798,369 | | | | 8,548,714 | | | | — | | | | 19,347,083 | | |
Industrials | | | 12,193,174 | | | | 7,693,324 | | | | — | | | | 19,886,498 | | |
Information Technology | | | 22,184,866 | | | | 20,041,146 | | | | — | | | | 42,226,012 | | |
Total Equity Securities | | | 79,226,477 | | | | 98,202,428 | | | | — | | | | 177,428,905 | | |
Mutual Funds | |
Money Market Funds | | | 14,356,974 | | | | — | | | | — | | | | 14,356,974 | | |
Total Mutual Funds | | | 14,356,974 | | | | — | | | | — | | | | 14,356,974 | | |
Total | | | 93,583,451 | | | | 98,202,428 | | | | — | | | | 191,785,879 | | |
See the Portfolio of Investments for all investment classifications not indicated in the table.
The Fund's assets assigned to the Level 2 input category are generally valued using the market approach, in which a security's value is determined through reference to prices and information from market transactions for similar or identical assets. These assets include certain foreign securities for which a third party statistical pricing service may be employed for purposes of fair market valuation. The models utilized by the third party statistical pricing service take into account a security's correlation to available market data including, but not limited to, intraday index, ADR, and ETF movements.
There were no transfers of financial assets between levels during the period.
The accompanying Notes to Financial Statements are an integral part of this statement.
Annual Report 2014
11
Columbia Marsico International Opportunities Fund
Statement of Assets and Liabilities
February 28, 2014
Assets | |
Investments, at value | |
Unaffiliated issuers (identified cost $143,547,986) | | $ | 177,428,905 | | |
Affiliated issuers (identified cost $14,356,974) | | | 14,356,974 | | |
Total investments (identified cost $157,904,960) | | | 191,785,879 | | |
Receivable for: | |
Investments sold | | | 8,398,213 | | |
Capital shares sold | | | 184,681 | | |
Dividends | | | 30,877 | | |
Reclaims | | | 248,625 | | |
Prepaid expenses | | | 1,083 | | |
Total assets | | | 200,649,358 | | |
Liabilities | |
Payable for: | |
Investments purchased | | | 11,033,466 | | |
Capital shares purchased | | | 132,112 | | |
Investment management fees | | | 4,077 | | |
Distribution and/or service fees | | | 1,175 | | |
Transfer agent fees | | | 24,400 | | |
Administration fees | | | 413 | | |
Compensation of board members | | | 80,510 | | |
Other expenses | | | 50,403 | | |
Total liabilities | | | 11,326,556 | | |
Net assets applicable to outstanding capital stock | | $ | 189,322,802 | | |
Represented by | |
Paid-in capital | | $ | 757,522,464 | | |
Undistributed net investment income | | | 202,181 | | |
Accumulated net realized loss | | | (602,302,585 | ) | |
Unrealized appreciation (depreciation) on: | |
Investments | | | 33,880,919 | | |
Foreign currency translations | | | 19,823 | | |
Total — representing net assets applicable to outstanding capital stock | | $ | 189,322,802 | | |
The accompanying Notes to Financial Statements are an integral part of this statement.
Annual Report 2014
12
Columbia Marsico International Opportunities Fund
Statement of Assets and Liabilities (continued)
February 28, 2014
Class A | |
Net assets | | $ | 93,345,702 | | |
Shares outstanding | | | 6,849,716 | | |
Net asset value per share | | $ | 13.63 | | |
Maximum offering price per share(a) | | $ | 14.46 | | |
Class B | |
Net assets | | $ | 3,816,188 | | |
Shares outstanding | | | 301,790 | | |
Net asset value per share | | $ | 12.65 | | |
Class C | |
Net assets | | $ | 15,478,084 | | |
Shares outstanding | | | 1,223,265 | | |
Net asset value per share | | $ | 12.65 | | |
Class I | |
Net assets | | $ | 3,149 | | |
Shares outstanding | | | 224 | | |
Net asset value per share(b) | | $ | 14.08 | | |
Class R | |
Net assets | | $ | 960,375 | | |
Shares outstanding | | | 71,098 | | |
Net asset value per share | | $ | 13.51 | | |
Class R4 | |
Net assets | | $ | 230,088 | | |
Shares outstanding | | | 16,410 | | |
Net asset value per share | | $ | 14.02 | | |
Class Z | |
Net assets | | $ | 75,489,216 | | |
Shares outstanding | | | 5,413,653 | | |
Net asset value per share | | $ | 13.94 | | |
(a) The maximum offering price per share is calculated by dividing the net asset value per share by 1.0 minus the maximum sales charge of 5.75%.
(b) Net asset value per share rounds to this amount due to fractional shares outstanding.
The accompanying Notes to Financial Statements are an integral part of this statement.
Annual Report 2014
13
Columbia Marsico International Opportunities Fund
Statement of Operations
Year Ended February 28, 2014
Net investment income | |
Income: | |
Dividends — unaffiliated issuers | | $ | 5,266,529 | | |
Dividends — affiliated issuers | | | 6,691 | | |
Foreign taxes withheld | | | (574,685 | ) | |
Total income | | | 4,698,535 | | |
Expenses: | |
Investment management fees | | | 1,990,750 | | |
Distribution and/or service fees | |
Class A | | | 222,032 | | |
Class B | | | 46,221 | | |
Class C | | | 168,210 | | |
Class R | | | 4,914 | | |
Transfer agent fees | |
Class A | | | 151,961 | | |
Class B | | | 7,980 | | |
Class C | | | 28,967 | | |
Class R | | | 1,691 | | |
Class R4 | | | 250 | | |
Class Z | | | 250,858 | | |
Administration fees | | | 201,595 | | |
Compensation of board members | | | 27,015 | | |
Custodian fees | | | 52,981 | | |
Printing and postage fees | | | 40,392 | | |
Registration fees | | | 56,881 | | |
Professional fees | | | 45,047 | | |
Line of credit interest expense | | | 4,976 | | |
Other | | | 50,116 | | |
Total expenses | | | 3,352,837 | | |
Expense reductions | | | (740 | ) | |
Total net expenses | | | 3,352,097 | | |
Net investment income | | | 1,346,438 | | |
Realized and unrealized gain (loss) — net | |
Net realized gain (loss) on: | |
Investments | | | 74,253,702 | | |
Foreign currency translations | | | (176,524 | ) | |
Net realized gain | | | 74,077,178 | | |
Net change in unrealized appreciation (depreciation) on: | |
Investments | | | (39,648,917 | ) | |
Foreign currency translations | | | 39,274 | | |
Net change in unrealized appreciation (depreciation) | | | (39,609,643 | ) | |
Net realized and unrealized gain | | | 34,467,535 | | |
Net increase in net assets resulting from operations | | $ | 35,813,973 | | |
The accompanying Notes to Financial Statements are an integral part of this statement.
Annual Report 2014
14
Columbia Marsico International Opportunities Fund
Statement of Changes in Net Assets
| | | Year Ended
February 28,
2014 | | Year Ended
February 28,
2013(a) | |
Operations | |
Net investment income | | $ | 1,346,438 | | | $ | 5,437,453 | | |
Net realized gain | | | 74,077,178 | | | | 57,600,993 | | |
Net change in unrealized appreciation (depreciation) | | | (39,609,643 | ) | | | (41,675,364 | ) | |
Net increase in net assets resulting from operations | | | 35,813,973 | | | | 21,363,082 | | |
Distributions to shareholders | |
Net investment income | |
Class A | | | (1,182,566 | ) | | | — | | |
Class B | | | (61,428 | ) | | | — | | |
Class C | | | (228,213 | ) | | | — | | |
Class I | | | (40 | ) | | | — | | |
Class R | | | (13,571 | ) | | | — | | |
Class R4 | | | (2,043 | ) | | | — | | |
Class Z | | | (2,337,733 | ) | | | — | | |
Total distributions to shareholders | | | (3,825,594 | ) | | | — | | |
Increase (decrease) in net assets from capital stock activity | | | (208,664,068 | ) | | | (247,398,822 | ) | |
Total decrease in net assets | | | (176,675,689 | ) | | | (226,035,740 | ) | |
Net assets at beginning of year | | | 365,998,491 | | | | 592,034,231 | | |
Net assets at end of year | | $ | 189,322,802 | | | $ | 365,998,491 | | |
Undistributed net investment income | | $ | 202,181 | | | $ | 1,698,106 | | |
(a) Class R4 shares are for the period from November 8, 2012 (commencement of operations) to February 28, 2013.
The accompanying Notes to Financial Statements are an integral part of this statement.
Annual Report 2014
15
Columbia Marsico International Opportunities Fund
Statement of Changes in Net Assets (continued)
| | | Year Ended February 28, 2014 | | Year Ended February 28, 2013(a) | |
| | | Shares | | Dollars ($) | | Shares | | Dollars ($) | |
Capital stock activity | |
Class A shares | |
Subscriptions(b) | | | 1,126,356 | | | | 14,523,089 | | | | 1,016,881 | | | | 11,285,228 | | |
Distributions reinvested | | | 86,253 | | | | 1,042,804 | | | | — | | | | — | | |
Redemptions | | | (1,500,126 | ) | | | (19,205,047 | ) | | | (2,754,250 | ) | | | (30,480,105 | ) | |
Net decrease | | | (287,517 | ) | | | (3,639,154 | ) | | | (1,737,369 | ) | | | (19,194,877 | ) | |
Class B shares | |
Subscriptions | | | 9,326 | | | | 114,197 | | | | 2,689 | | | | 27,821 | | |
Distributions reinvested | | | 3,886 | | | | 43,832 | | | | — | | | | — | | |
Redemptions(b) | | | (212,873 | ) | | | (2,524,595 | ) | | | (293,158 | ) | | | (3,070,607 | ) | |
Net decrease | | | (199,661 | ) | | | (2,366,566 | ) | | | (290,469 | ) | | | (3,042,786 | ) | |
Class C shares | |
Subscriptions | | | 45,178 | | | | 538,390 | | | | 25,275 | | | | 264,079 | | |
Distributions reinvested | | | 15,745 | | | | 177,765 | | | | — | | | | — | | |
Redemptions | | | (560,161 | ) | | | (6,592,971 | ) | | | (720,687 | ) | | | (7,571,568 | ) | |
Net decrease | | | (499,238 | ) | | | (5,876,816 | ) | | | (695,412 | ) | | | (7,307,489 | ) | |
Class R shares | |
Subscriptions | | | 10,517 | | | | 133,019 | | | | 16,220 | | | | 179,911 | | |
Distributions reinvested | | | 1,125 | | | | 13,513 | | | | — | | | | — | | |
Redemptions | | | (29,684 | ) | | | (373,282 | ) | | | (73,644 | ) | | | (815,024 | ) | |
Net decrease | | | (18,042 | ) | | | (226,750 | ) | | | (57,424 | ) | | | (635,113 | ) | |
Class R4 shares | |
Subscriptions | | | 17,600 | | | | 228,755 | | | | 224 | | | | 2,500 | | |
Distributions reinvested | | | 161 | | | | 2,003 | | | | — | | | | — | | |
Redemptions | | | (1,575 | ) | | | (20,685 | ) | | | — | | | | — | | |
Net increase | | | 16,186 | | | | 210,073 | | | | 224 | | | | 2,500 | | |
Class Z shares | |
Subscriptions | | | 484,226 | | | | 6,310,430 | | | | 1,344,611 | | | | 14,977,512 | | |
Distributions reinvested | | | 72,625 | | | | 896,915 | | | | — | | | | — | | |
Redemptions | | | (15,795,159 | ) | | | (203,972,200 | ) | | | (20,592,493 | ) | | | (232,198,569 | ) | |
Net decrease | | | (15,238,308 | ) | | | (196,764,855 | ) | | | (19,247,882 | ) | | | (217,221,057 | ) | |
Total net decrease | | | (16,226,580 | ) | | | (208,664,068 | ) | | | (22,028,332 | ) | | | (247,398,822 | ) | |
(a) Class R4 shares are for the period from November 8, 2012 (commencement of operations) to February 28, 2013
(b) Includes conversions of Class B shares to Class A shares, if any.
The accompanying Notes to Financial Statements are an integral part of this statement.
Annual Report 2014
16
Columbia Marsico International Opportunities Fund
The following tables are intended to help you understand the Fund's financial performance. Certain information reflects financial results for a single share of a class held for the periods shown. Per share net investment income (loss) amounts are calculated based on average shares outstanding during the period. Total return assumes reinvestment of all dividends and distributions, if any. Total return does not reflect payment of sales charges, if any, and is not annualized for periods of less than one year.
| | | | | Year Ended | | | |
| | | Year Ended February 28, | | February 29, | | Year Ended February 28, | |
Class A | | 2014 | | 2013 | | 2012 | | 2011 | | 2010 | |
Per share data | |
Net asset value, beginning of period | | $ | 12.04 | | | $ | 11.24 | | | $ | 11.96 | | | $ | 10.00 | | | $ | 6.76 | | |
Income from investment operations: | |
Net investment income | | | 0.02 | | | | 0.12 | | | | 0.01 | | | | 0.05 | | | | 0.05 | | |
Net realized and unrealized gain (loss) | | | 1.74 | | | | 0.68 | | | | (0.73 | ) | | | 2.08 | | | | 3.44 | | |
Total from investment operations | | | 1.76 | | | | 0.80 | | | | (0.72 | ) | | | 2.13 | | | | 3.49 | | |
Less distributions to shareholders: | |
Net investment income | | | (0.17 | ) | | | — | | | | — | | | | (0.17 | ) | | | (0.25 | ) | |
Total distributions to shareholders | | | (0.17 | ) | | | — | | | | — | | | | (0.17 | ) | | | (0.25 | ) | |
Redemption fees: | |
Redemption fees added to paid-in capital | | | — | | | | — | | | | — | | | | — | | | | 0.00 | (a) | |
Net asset value, end of period | | $ | 13.63 | | | $ | 12.04 | | | $ | 11.24 | | | $ | 11.96 | | | $ | 10.00 | | |
Total return | | | 14.80 | % | | | 7.12 | % | | | (6.02 | %) | | | 21.39 | % | | | 51.97 | % | |
Ratios to average net assets(b) | |
Total gross expenses | | | 1.41 | %(c) | | | 1.49 | %(c) | | | 1.53 | % | | | 1.51 | %(c) | | | 1.47 | % | |
Total net expenses(d) | | | 1.41 | %(c)(e) | | | 1.49 | %(c)(e) | | | 1.53 | %(e) | | | 1.51 | %(c)(e) | | | 1.47 | %(e) | |
Net investment income | | | 0.16 | % | | | 1.10 | % | | | 0.06 | % | | | 0.47 | % | | | 0.50 | % | |
Supplemental data | |
Net assets, end of period (in thousands) | | $ | 93,346 | | | $ | 85,963 | | | $ | 99,757 | | | $ | 141,821 | | | $ | 168,801 | | |
Portfolio turnover | | | 141 | % | | | 73 | % | | | 86 | % | | | 105 | % | | | 116 | % | |
Notes to Financial Highlights
(a) Rounds to zero.
(b) In addition to the fees and expenses which the Fund bears directly, the Fund indirectly bears a pro rata share of the fees and expenses of the acquired funds in which it invests. Such indirect expenses are not included in the reported expense ratios.
(c) Ratios include line of credit interest expense which rounds to less than 0.01%.
(d) Total net expenses include the impact of certain waivers/reimbursements made by the Investment Manager and certain of its affiliates, if applicable.
(e) The benefits derived from expense reductions had an impact of less than 0.01%.
The accompanying Notes to Financial Statements are an integral part of this statement.
Annual Report 2014
17
Columbia Marsico International Opportunities Fund
Financial Highlights (continued)
| | | | | Year Ended | | | |
| | | Year Ended February 28, | | February 29, | | Year Ended February 28, | |
Class B | | 2014 | | 2013 | | 2012 | | 2011 | | 2010 | |
Per share data | |
Net asset value, beginning of period | | $ | 11.26 | | | $ | 10.58 | | | $ | 11.35 | | | $ | 9.51 | | | $ | 6.38 | | |
Income from investment operations: | |
Net investment income (loss) | | | (0.06 | ) | | | 0.04 | | | | (0.07 | ) | | | (0.03 | ) | | | (0.03 | ) | |
Net realized and unrealized gain (loss) | | | 1.61 | | | | 0.64 | | | | (0.70 | ) | | | 1.98 | | | | 3.27 | | |
Total from investment operations | | | 1.55 | | | | 0.68 | | | | (0.77 | ) | | | 1.95 | | | | 3.24 | | |
Less distributions to shareholders: | |
Net investment income | | | (0.16 | ) | | | — | | | | — | | | | (0.11 | ) | | | (0.11 | ) | |
Total distributions to shareholders | | | (0.16 | ) | | | — | | | | — | | | | (0.11 | ) | | | (0.11 | ) | |
Redemption fees: | |
Redemption fees added to paid-in capital | | | — | | | | — | | | | — | | | | — | | | | 0.00 | (a) | |
Net asset value, end of period | | $ | 12.65 | | | $ | 11.26 | | | $ | 10.58 | | | $ | 11.35 | | | $ | 9.51 | | |
Total return | | | 13.89 | % | | | 6.43 | % | | | (6.78 | %) | | | 20.50 | % | | | 50.91 | % | |
Ratios to average net assets(b) | |
Total gross expenses | | | 2.16 | %(c) | | | 2.24 | %(c) | | | 2.27 | % | | | 2.26 | %(c) | | | 2.22 | % | |
Total net expenses(d) | | | 2.16 | %(c)(e) | | | 2.24 | %(c)(e) | | | 2.27 | %(e) | | | 2.26 | %(c)(e) | | | 2.22 | %(e) | |
Net investment income (loss) | | | (0.47 | %) | | | 0.40 | % | | | (0.65 | %) | | | (0.27 | %) | | | (0.35 | %) | |
Supplemental data | |
Net assets, end of period (in thousands) | | $ | 3,816 | | | $ | 5,645 | | | $ | 8,381 | | | $ | 14,862 | | | $ | 17,810 | | |
Portfolio turnover | | | 141 | % | | | 73 | % | | | 86 | % | | | 105 | % | | | 116 | % | |
Notes to Financial Highlights
(a) Rounds to zero.
(b) In addition to the fees and expenses which the Fund bears directly, the Fund indirectly bears a pro rata share of the fees and expenses of the acquired funds in which it invests. Such indirect expenses are not included in the reported expense ratios.
(c) Ratios include line of credit interest expense which rounds to less than 0.01%.
(d) Total net expenses include the impact of certain waivers/reimbursements made by the Investment Manager and certain of its affiliates, if applicable.
(e) The benefits derived from expense reductions had an impact of less than 0.01%.
The accompanying Notes to Financial Statements are an integral part of this statement.
Annual Report 2014
18
Columbia Marsico International Opportunities Fund
Financial Highlights (continued)
| | | | | Year Ended | | | |
| | | Year Ended February 28, | | February 29, | | Year Ended February 28, | |
Class C | | 2014 | | 2013 | | 2012 | | 2011 | | 2010 | |
Per share data | |
Net asset value, beginning of period | | $ | 11.26 | | | $ | 10.59 | | | $ | 11.36 | | | $ | 9.51 | | | $ | 6.39 | | |
Income from investment operations: | |
Net investment income (loss) | | | (0.06 | ) | | | 0.04 | | | | (0.07 | ) | | | (0.03 | ) | | | (0.03 | ) | |
Net realized and unrealized gain (loss) | | | 1.61 | | | | 0.63 | | | | (0.70 | ) | | | 1.99 | | | | 3.26 | | |
Total from investment operations | | | 1.55 | | | | 0.67 | | | | (0.77 | ) | | | 1.96 | | | | 3.23 | | |
Less distributions to shareholders: | |
Net investment income | | | (0.16 | ) | | | — | | | | — | | | | (0.11 | ) | | | (0.11 | ) | |
Total distributions to shareholders | | | (0.16 | ) | | | — | | | | — | | | | (0.11 | ) | | | (0.11 | ) | |
Redemption fees: | |
Redemption fees added to paid-in capital | | | — | | | | — | | | | — | | | | — | | | | 0.00 | (a) | |
Net asset value, end of period | | $ | 12.65 | | | $ | 11.26 | | | $ | 10.59 | | | $ | 11.36 | | | $ | 9.51 | | |
Total return | | | 13.89 | % | | | 6.33 | % | | | (6.78 | %) | | | 20.60 | % | | | 50.67 | % | |
Ratios to average net assets(b) | |
Total gross expenses | | | 2.16 | %(c) | | | 2.24 | %(c) | | | 2.28 | % | | | 2.26 | %(c) | | | 2.22 | % | |
Total net expenses(d) | | | 2.16 | %(c)(e) | | | 2.24 | %(c)(e) | | | 2.28 | %(e) | | | 2.26 | %(c)(e) | | | 2.22 | %(e) | |
Net investment income (loss) | | | (0.52 | %) | | | 0.37 | % | | | (0.68 | %) | | | (0.30 | %) | | | (0.35 | %) | |
Supplemental data | |
Net assets, end of period (in thousands) | | $ | 15,478 | | | $ | 19,402 | | | $ | 25,608 | | | $ | 39,789 | | | $ | 44,466 | | |
Portfolio turnover | | | 141 | % | | | 73 | % | | | 86 | % | | | 105 | % | | | 116 | % | |
Notes to Financial Highlights
(a) Rounds to zero.
(b) In addition to the fees and expenses which the Fund bears directly, the Fund indirectly bears a pro rata share of the fees and expenses of the acquired funds in which it invests. Such indirect expenses are not included in the reported expense ratios.
(c) Ratios include line of credit interest expense which rounds to less than 0.01%.
(d) Total net expenses include the impact of certain waivers/reimbursements made by the Investment Manager and certain of its affiliates, if applicable.
(e) The benefits derived from expense reductions had an impact of less than 0.01%.
The accompanying Notes to Financial Statements are an integral part of this statement.
Annual Report 2014
19
Columbia Marsico International Opportunities Fund
Financial Highlights (continued)
| | | | | Year Ended | | Year Ended | |
| | | Year Ended February 28, | | February 29, | | February 28, | |
Class I | | 2014 | | 2013 | | 2012 | | 2011(a) | |
Per share data | |
Net asset value, beginning of period | | $ | 12.40 | | | $ | 11.52 | | | $ | 12.14 | | | $ | 11.18 | | |
Income from investment operations: | |
Net investment income (loss) | | | 0.07 | | | | 0.17 | | | | 0.12 | | | | (0.01 | ) | |
Net realized and unrealized gain (loss) | | | 1.79 | | | | 0.71 | | | | (0.74 | ) | | | 1.17 | | |
Total from investment operations | | | 1.86 | | | | 0.88 | | | | (0.62 | ) | | | 1.16 | | |
Less distributions to shareholders: | |
Net investment income | | | (0.18 | ) | | | — | | | | — | | | | (0.20 | ) | |
Total distributions to shareholders | | | (0.18 | ) | | | — | | | | — | | | | (0.20 | ) | |
Net asset value, end of period | | $ | 14.08 | | | $ | 12.40 | | | $ | 11.52 | | | $ | 12.14 | | |
Total return | | | 15.18 | % | | | 7.64 | % | | | (5.11 | %) | | | 10.44 | % | |
Ratios to average net assets(b) | |
Total gross expenses | | | 0.99 | %(c) | | | 1.04 | %(c) | | | 1.12 | % | | | 1.10 | %(c)(d) | |
Total net expenses(e) | | | 0.99 | %(c) | | | 1.04 | %(c) | | | 1.12 | %(f) | | | 1.10 | %(c)(d)(f) | |
Net investment income (loss) | | | 0.56 | % | | | 1.50 | % | | | 1.00 | % | | | (0.24 | %)(d) | |
Supplemental data | |
Net assets, end of period (in thousands) | | $ | 3 | | | $ | 3 | | | $ | 3 | | | $ | 34,072 | | |
Portfolio turnover | | | 141 | % | | | 73 | % | | | 86 | % | | | 105 | % | |
Notes to Financial Highlights
(a) For the period from September 27, 2010 (commencement of operations) to February 28, 2011.
(b) In addition to the fees and expenses which the Fund bears directly, the Fund indirectly bears a pro rata share of the fees and expenses of the acquired funds in which it invests. Such indirect expenses are not included in the reported expense ratios.
(c) Ratios include line of credit interest expense which rounds to less than 0.01%.
(d) Annualized.
(e) Total net expenses include the impact of certain waivers/reimbursements made by the Investment Manager and certain of its affiliates, if applicable.
(f) The benefits derived from expense reductions had an impact of less than 0.01%.
The accompanying Notes to Financial Statements are an integral part of this statement.
Annual Report 2014
20
Columbia Marsico International Opportunities Fund
Financial Highlights (continued)
| | | | | Year Ended | | | |
| | | Year Ended February 28, | | February 29, | | Year Ended February 28, | |
Class R | | 2014 | | 2013 | | 2012 | | 2011 | | 2010 | |
Per share data | |
Net asset value, beginning of period | | $ | 11.96 | | | $ | 11.19 | | | $ | 11.94 | | | $ | 9.99 | | | $ | 6.73 | | |
Income from investment operations: | |
Net investment income (loss) | | | (0.00 | )(a) | | | 0.10 | | | | (0.02 | ) | | | 0.01 | | | | 0.01 | | |
Net realized and unrealized gain (loss) | | | 1.71 | | | | 0.67 | | | | (0.73 | ) | | | 2.09 | | | | 3.45 | | |
Total from investment operations | | | 1.71 | | | | 0.77 | | | | (0.75 | ) | | | 2.10 | | | | 3.46 | | |
Less distributions to shareholders: | |
Net investment income | | | (0.16 | ) | | | — | | | | — | | | | (0.15 | ) | | | (0.20 | ) | |
Total distributions to shareholders | | | (0.16 | ) | | | — | | | | — | | | | (0.15 | ) | | | (0.20 | ) | |
Redemption fees: | |
Redemption fees added to paid-in capital | | | — | | | | — | | | | — | | | | — | | | | 0.00 | (a) | |
Net asset value, end of period | | $ | 13.51 | | | $ | 11.96 | | | $ | 11.19 | | | $ | 11.94 | | | $ | 9.99 | | |
Total return | | | 14.51 | % | | | 6.88 | % | | | (6.28 | %) | | | 21.08 | % | | | 51.73 | % | |
Ratios to average net assets(b) | |
Total gross expenses | | | 1.66 | %(c) | | | 1.74 | %(c) | | | 1.77 | % | | | 1.76 | %(c) | | | 1.72 | % | |
Total net expenses(d) | | | 1.66 | %(c)(e) | | | 1.74 | %(c)(e) | | | 1.77 | %(e) | | | 1.76 | %(c)(e) | | | 1.72 | %(e) | |
Net investment income (loss) | | | (0.04 | %) | | | 0.88 | % | | | (0.17 | %) | | | 0.12 | % | | | 0.15 | % | |
Supplemental data | |
Net assets, end of period (in thousands) | | $ | 960 | | | $ | 1,067 | | | $ | 1,640 | | | $ | 3,020 | | | $ | 3,327 | | |
Portfolio turnover | | | 141 | % | | | 73 | % | | | 86 | % | | | 105 | % | | | 116 | % | |
Notes to Financial Highlights
(a) Rounds to zero.
(b) In addition to the fees and expenses which the Fund bears directly, the Fund indirectly bears a pro rata share of the fees and expenses of the acquired funds in which it invests. Such indirect expenses are not included in the reported expense ratios.
(c) Ratios include line of credit interest expense which rounds to less than 0.01%.
(d) Total net expenses include the impact of certain waivers/reimbursements made by the Investment Manager and certain of its affiliates, if applicable.
(e) The benefits derived from expense reductions had an impact of less than 0.01%.
The accompanying Notes to Financial Statements are an integral part of this statement.
Annual Report 2014
21
Columbia Marsico International Opportunities Fund
Financial Highlights (continued)
| | | Year Ended February 28, | |
Class R4 | | 2014 | | 2013(a) | |
Per share data | |
Net asset value, beginning of period | | $ | 12.36 | | | $ | 11.17 | | |
Income from investment operations: | |
Net investment income | | | 0.01 | | | | 0.03 | | |
Net realized and unrealized gain | | | 1.83 | | | | 1.16 | | |
Total from investment operations | | | 1.84 | | | | 1.19 | | |
Less distributions to shareholders: | |
Net investment income | | | (0.18 | ) | | | — | | |
Total distributions to shareholders | | | (0.18 | ) | | | — | | |
Net asset value, end of period | | $ | 14.02 | | | $ | 12.36 | | |
Total return | | | 15.04 | % | | | 10.65 | % | |
Ratios to average net assets(b) | |
Total gross expenses | | | 1.16 | %(c) | | | 1.15 | %(c)(d) | |
Total net expenses(e) | | | 1.16 | %(c)(f) | | | 1.15 | %(c)(d) | |
Net investment income | | | 0.09 | % | | | 0.93 | %(d) | |
Supplemental data | |
Net assets, end of period (in thousands) | | $ | 230 | | | $ | 3 | | |
Portfolio turnover | | | 141 | % | | | 73 | % | |
Notes to Financial Highlights
(a) For the period from November 8, 2012 (commencement of operations) to February 28, 2013.
(b) In addition to the fees and expenses which the Fund bears directly, the Fund indirectly bears a pro rata share of the fees and expenses of the acquired funds in which it invests. Such indirect expenses are not included in the reported expense ratios.
(c) Ratios include line of credit interest expense which rounds to less than 0.01%.
(d) Annualized.
(e) Total net expenses include the impact of certain waivers/reimbursements made by the Investment Manager and certain of its affiliates, if applicable.
(f) The benefits derived from expense reductions had an impact of less than 0.01%.
The accompanying Notes to Financial Statements are an integral part of this statement.
Annual Report 2014
22
Columbia Marsico International Opportunities Fund
Financial Highlights (continued)
| | | | | Year Ended | | | |
| | | Year Ended February 28, | | February 29, | | Year Ended February 28, | |
Class Z | | 2014 | | 2013 | | 2012 | | 2011 | | 2010 | |
Per share data | |
Net asset value, beginning of period | | $ | 12.30 | | | $ | 11.44 | | | $ | 12.15 | | | $ | 10.15 | | | $ | 6.87 | | |
Income from investment operations: | |
Net investment income | | | 0.12 | | | | 0.16 | | | | 0.04 | | | | 0.07 | | | | 0.06 | | |
Net realized and unrealized gain (loss) | | | 1.69 | | | | 0.70 | | | | (0.75 | ) | | | 2.13 | | | | 3.52 | | |
Total from investment operations | | | 1.81 | | | | 0.86 | | | | (0.71 | ) | | | 2.20 | | | | 3.58 | | |
Less distributions to shareholders: | |
Net investment income | | | (0.17 | ) | | | — | | | | — | | | | (0.20 | ) | | | (0.30 | ) | |
Total distributions to shareholders | | | (0.17 | ) | | | — | | | | — | | | | (0.20 | ) | | | (0.30 | ) | |
Redemption fees: | |
Redemption fees added to paid-in capital | | | — | | | | — | | | | — | | | | — | | | | 0.00 | (a) | |
Net asset value, end of period | | $ | 13.94 | | | $ | 12.30 | | | $ | 11.44 | | | $ | 12.15 | | | $ | 10.15 | | |
Total return | | | 14.94 | % | | | 7.52 | % | | | (5.84 | %) | | | 21.75 | % | | | 52.47 | % | |
Ratios to average net assets(b) | |
Total gross expenses | | | 1.15 | %(c) | | | 1.24 | %(c) | | | 1.28 | % | | | 1.26 | %(c) | | | 1.22 | % | |
Total net expenses(d) | | | 1.15 | %(c)(e) | | | 1.24 | %(c)(e) | | | 1.28 | %(e) | | | 1.26 | %(c)(e) | | | 1.22 | %(e) | |
Net investment income | | | 0.93 | % | | | 1.40 | % | | | 0.38 | % | | | 0.67 | % | | | 0.65 | % | |
Supplemental data | |
Net assets, end of period (in thousands) | | $ | 75,489 | | | $ | 253,916 | | | $ | 456,645 | | | $ | 945,793 | | | $ | 968,569 | | |
Portfolio turnover | | | 141 | % | | | 73 | % | | | 86 | % | | | 105 | % | | | 116 | % | |
Notes to Financial Highlights
(a) Rounds to zero.
(b) In addition to the fees and expenses which the Fund bears directly, the Fund indirectly bears a pro rata share of the fees and expenses of the acquired funds in which it invests. Such indirect expenses are not included in the reported expense ratios.
(c) Ratios include line of credit interest expense which rounds to less than 0.01%.
(d) Total net expenses include the impact of certain waivers/reimbursements made by the Investment Manager and certain of its affiliates, if applicable.
(e) The benefits derived from expense reductions had an impact of less than 0.01%.
The accompanying Notes to Financial Statements are an integral part of this statement.
Annual Report 2014
23
Columbia Marsico International Opportunities Fund
Notes to Financial Statements
February 28, 2014
Note 1. Organization
Columbia Marsico International Opportunities Fund (the Fund), a series of Columbia Funds Series Trust (the Trust), is a diversified fund. The Trust is registered under the Investment Company Act of 1940, as amended (the 1940 Act), as an open-end management investment company organized as a Delaware statutory trust.
Fund Shares
The Trust may issue an unlimited number of shares (without par value). The Fund offers Class A, Class B, Class C, Class I, Class R, Class R4 and Class Z shares. Although all share classes generally have identical voting, dividend and liquidation rights, each share class votes separately when required by law. Different share classes pay different distribution amounts to the extent the expenses of such share classes differ, and distributions in liquidation will be proportional to the net asset value of each share class. Each share class has its own expense structure and sales charges, as applicable.
Class A shares are subject to a maximum front-end sales charge of 5.75% based on the initial investment amount. Class A shares purchased without an initial sales charge in accounts aggregating $1 million to $50 million at the time of purchase are subject to a contingent deferred sales charge (CDSC) if the shares are sold within 18 months of purchase, charged as follows: 1.00% CDSC if redeemed within 12 months of purchase, and 0.50% CDSC if redeemed more than 12, but less than 18, months after purchase.
Class B shares may be subject to a maximum CDSC of 5.00% based upon the holding period after purchase. Class B shares will generally convert to Class A shares eight years after purchase. The Fund no longer accepts investments by new or existing investors in the Fund's Class B shares, except in connection with the reinvestment of any dividend and/or capital gain distributions in Class B shares of the Fund and exchanges by existing Class B shareholders of certain other funds within the Columbia Family of Funds.
Class C shares are subject to a 1.00% CDSC on shares redeemed within one year of purchase.
Class I shares are not subject to sales charges and are available only to the Columbia Family of Funds.
Class R shares are not subject to sales charges and are generally available only to certain retirement plans and other eligible investors.
Class R4 shares are not subject to sales charges and are generally available only to omnibus retirement plans and certain other eligible investors.
Class Z shares are not subject to sales charges and are available only to certain eligible investors, which are subject to different investment minimums.
Note 2. Summary of Significant Accounting Policies
Use of Estimates
The preparation of financial statements in accordance with U.S. generally accepted accounting principles (GAAP) requires management to make certain estimates and assumptions that affect the reported amounts of assets and liabilities, the disclosure of contingent assets and liabilities at the date of the financial statements and the reported amounts of revenue and expenses during the reporting period. Actual results could differ from those estimates.
The following is a summary of significant accounting policies consistently followed by the Fund in the preparation of its financial statements.
Security Valuation
All equity securities are valued at the close of business of the New York Stock Exchange (NYSE). Equity securities are valued at the last quoted sales price on the principal exchange or market on which they trade, except for securities traded on the NASDAQ Stock Market, which are valued at the NASDAQ official close price. Unlisted securities or listed securities for which there were no sales during the day are valued at the mean of the latest quoted bid and ask prices on such exchanges or markets.
Foreign equity securities are valued based on quotations from the principal market in which such securities are normally traded. If any foreign share prices are not readily available as a result of limited share activity the securities are valued at the mean of the latest quoted bid and ask prices on such exchanges or markets. Foreign currency exchange rates are generally determined at 4:00 p.m. Eastern (U.S.) time. However, many securities markets and exchanges outside the U.S. close prior to the close of the NYSE; therefore, the closing prices for securities in such markets or on such exchanges may not fully reflect events that occur after such close but before the close of the NYSE. In those situations, foreign securities will be fair valued pursuant to the policy adopted by the Board of Trustees (the Board), including utilizing a third party pricing service to determine these fair values. The third party pricing service takes into account multiple factors, including, but not limited to, movements in the U.S. securities markets, certain depositary receipts, futures contracts and foreign exchange rates that have occurred subsequent to the close of the foreign exchange or market, to
Annual Report 2014
24
Columbia Marsico International Opportunities Fund
Notes to Financial Statements (continued)
February 28, 2014
determine a good faith estimate that reasonably reflects the current market conditions as of the close of the NYSE. The fair value of a security is likely to be different from the quoted or published price, if available.
Investments in open-end investment companies, including money market funds, are valued at net asset value.
Investments for which market quotations are not readily available, or that have quotations which management believes are not reliable, are valued at fair value as determined in good faith under consistently applied procedures established by and under the general supervision of the Board. If a security or class of securities (such as foreign securities) is valued at fair value, such value is likely to be different from the last quoted market price for the security.
The determination of fair value often requires significant judgment. To determine fair value, management may use assumptions including but not limited to future cash flows and estimated risk premiums. Multiple inputs from various sources may be used to determine fair value.
Foreign Currency Transactions and Translations
The values of all assets and liabilities denominated in foreign currencies are translated into U.S. dollars at that day's exchange rates. Net realized and unrealized gains (losses) on foreign currency transactions and translations include gains (losses) arising from the fluctuation in exchange rates between trade and settlement dates on securities transactions, gains (losses) arising from the disposition of foreign currency and currency gains (losses) between the accrual and payment dates on dividends, interest income and foreign withholding taxes.
For financial statement purposes, the Fund does not distinguish that portion of gains (losses) on investments which is due to changes in foreign exchange rates from that which is due to changes in market prices of the investments. Such fluctuations are included with the net realized and unrealized gains (losses) on investments in the Statement of Operations.
Security Transactions
Security transactions are accounted for on the trade date. Cost is determined and gains (losses) are based upon the specific identification method for both financial statement and federal income tax purposes.
Income Recognition
Corporate actions and dividend income are generally recorded net of any non-reclaimable tax withholdings, on the ex-dividend date or upon receipt of ex-dividend notification in the case of certain foreign securities.
Awards from class action litigation are recorded as a reduction of cost basis if the Fund still owns the applicable securities on the payment date. If the Fund no longer owns the applicable securities, the proceeds are recorded as realized gains.
Expenses
General expenses of the Trust are allocated to the Fund and other funds of the Trust based upon relative net assets or other expense allocation methodologies determined by the nature of the expense. Expenses directly attributable to the Fund are charged to the Fund. Expenses directly attributable to a specific class of shares are charged to that share class.
Determination of Class Net Asset Value
All income, expenses (other than class-specific expenses, which are charged to that share class, as shown in the Statement of Operations) and realized and unrealized gains (losses) are allocated to each class of the Fund on a daily basis, based on the relative net assets of each class, for purposes of determining the net asset value of each class.
Federal Income Tax Status
The Fund intends to qualify each year as a regulated investment company under Subchapter M of the Internal Revenue Code, as amended, and will distribute substantially all of its taxable income (including net short-term capital gains), if any, for its tax year, and as such will not be subject to federal income taxes. In addition, the Fund intends to distribute in each calendar year substantially all of its net investment income, capital gains and certain other amounts, if any, such that the Fund should not be subject to federal excise tax. Therefore, no federal income or excise tax provision is recorded.
Foreign Taxes
The Fund may be subject to foreign taxes on income, gains on investments or currency repatriation, a portion of which may be recoverable. The Fund will accrue such taxes and recoveries, as applicable, based upon its current interpretation of tax rules and regulations that exist in the markets in which it invests.
Realized gains in certain countries may be subject to foreign taxes at the Fund level, based on statutory rates. The Fund accrues for such foreign taxes on realized and unrealized gains at the appropriate rate for each jurisdiction, as applicable. The amount, if any, is disclosed as a liability on the Statement of Assets and Liabilities.
Distributions to Shareholders
Distributions from net investment income, if any, are declared and paid semi-annually. Net realized capital gains, if any, are
Annual Report 2014
25
Columbia Marsico International Opportunities Fund
Notes to Financial Statements (continued)
February 28, 2014
distributed at least annually. Income distributions and capital gain distributions are determined in accordance with federal income tax regulations, which may differ from GAAP.
Guarantees and Indemnifications
Under the Trust's organizational documents and, in some cases, by contract, its officers and trustees are indemnified against certain liabilities arising out of the performance of their duties to the Trust or its funds. In addition, certain of the Fund's contracts with its service providers contain general indemnification clauses. The Fund's maximum exposure under these arrangements is unknown since the amount of any future claims that may be made against the Fund cannot be determined, and the Fund has no historical basis for predicting the likelihood of any such claims.
Note 3. Fees and Compensation Paid to Affiliates
Investment Management Fees
Under an Investment Management Services Agreement, Columbia Management Investment Advisers, LLC (the Investment Manager), a wholly-owned subsidiary of Ameriprise Financial, Inc. (Ameriprise Financial), is responsible for the ultimate oversight of investments made by the Fund. The Fund's subadviser (see Subadvisory Agreement below) has the primary responsibility for the day-to-day portfolio management of the Fund. The investment management fee is an annual fee that is equal to a percentage of the Fund's average daily net assets that declines from 0.79% to 0.62% as the Fund's net assets increase. The effective investment management fee rate for the year ended February 28, 2014 was 0.79% of the Fund's average daily net assets.
Subadvisory Agreement
The Investment Manager has entered into a Subadvisory Agreement with Marsico Capital Management, LLC (Marsico) to subadvise the assets of the Fund. The Investment Manager compensates Marsico to manage the investment of the Fund's assets.
Administration Fees
Under an Administrative Services Agreement, the Investment Manager also serves as the Fund Administrator. The Fund pays the Fund Administrator an annual fee for administration and accounting services equal to a percentage of the Fund's average daily net assets that declines from 0.08% to 0.05% as the Fund's net assets increase. The effective administration fee rate for the year ended February 28, 2014 was 0.08% of the Fund's average daily net assets.
Other Expenses
Other expenses are for, among other things, miscellaneous expenses of the Fund or the Board, including payments to a company providing limited administrative services to the Fund and the Board. That company's expenses include boardroom and office expense, employee compensation, employee health and retirement benefits, and certain other expenses. For the year ended February 28, 2014, other expenses paid to this company were $2,083.
Compensation of Board Members
Board members are compensated for their services to the Fund as disclosed in the Statement of Operations. Under a Deferred Compensation Plan (the Plan), the Board members who are not "interested persons" of the Fund, as defined under the 1940 Act, may elect to defer payment of up to 100% of their compensation. Deferred amounts are treated as though equivalent dollar amounts had been invested in shares of certain funds managed by the Investment Manager. The Fund's liability for these amounts is adjusted for market value changes and remains in the Fund until distributed in accordance with the Plan.
Transfer Agent Fees
Under a Transfer and Dividend Disbursing Agent Agreement, Columbia Management Investment Services Corp. (the Transfer Agent), an affiliate of the Investment Manager and a wholly-owned subsidiary of Ameriprise Financial, is responsible for providing transfer agency services to the Fund. The Transfer Agent has contracted with Boston Financial Data Services (BFDS) to serve as sub-transfer agent.
The Transfer Agent receives monthly account-based service fees based on the number of open accounts and also receives sub-transfer agency fees based on a percentage of the average aggregate value of the Fund's shares maintained in omnibus accounts (other than omnibus accounts for which American Enterprise Investment Services Inc. is the broker of record or accounts where the beneficial shareholder is a customer of Ameriprise Financial Services, Inc., which are paid a per account fee). The Transfer Agent pays the fees of BFDS for services as sub-transfer agent and is not entitled to reimbursement for such fees from the Fund (with the exception of out-of-pocket fees).
The Transfer Agent also receives compensation from fees for various shareholder services and reimbursements for certain out-of-pocket fees. Class I shares do not pay transfer agent fees.
Annual Report 2014
26
Columbia Marsico International Opportunities Fund
Notes to Financial Statements (continued)
February 28, 2014
For the year ended February 28, 2014, the Fund's effective transfer agent fee rates as a percentage of average daily net assets of each class were as follows:
Class A | | | 0.17 | % | |
Class B | | | 0.17 | | |
Class C | | | 0.17 | | |
Class R | | | 0.17 | | |
Class R4 | | | 0.17 | | |
Class Z | | | 0.18 | | |
An annual minimum account balance fee of $20 may apply to certain accounts with a value below the applicable share class's initial minimum investment requirements to reduce the impact of small accounts on transfer agent fees. These minimum account balance fees are recorded as part of expense reductions in the Statement of Operations. For the year ended February 28, 2014, these minimum account balance fees reduced total expenses by $740.
Distribution and Service Fees
The Fund has an agreement with Columbia Management Investment Distributors, Inc. (the Distributor), an affiliate of the Investment Manager and a wholly-owned subsidiary of Ameriprise Financial, for distribution and shareholder services. The Board has approved, and the Fund has adopted, distribution and shareholder service plans (the Plans) applicable to certain share classes, which set the distribution and service fees for the Fund. These fees are calculated daily and are intended to compensate the Distributor and/or eligible selling and/or servicing agents for selling shares of the Fund and providing services to investors.
Under the Plans, the Fund pays a monthly combined distribution and service fee to the Distributor at the maximum annual rate of 0.25% of the average daily net assets attributable to Class A shares of the Fund. Also under the Plans, the Fund pays a monthly service fee at the maximum annual rate of 0.25% of the average daily net assets attributable to Class B and Class C shares of the Fund and the payment of a monthly distribution fee at the maximum annual rates of 0.75%, 0.75% and 0.50% of the average daily net assets attributable to Class B, Class C and Class R shares, respectively.
Sales Charges
Sales charges, including front-end charges and CDSCs, received by the Distributor for distributing Fund shares were $17,910 for Class A, $2,354 for Class B and $230 for Class C shares for the year ended February 28, 2014.
Expenses Waived/Reimbursed by the Investment Manager and its Affiliates
The Investment Manager and certain of its affiliates have contractually agreed to waive fees and/or reimburse expenses (excluding certain fees and expenses described below) for the periods disclosed below, unless sooner terminated at the sole discretion of the Board, so that the Fund's net operating expenses, after giving effect to fees waived/expenses reimbursed and any balance credits and/or overdraft charges from the Fund's custodian, do not exceed the following annual rates as a percentage of the class' average daily net assets:
| | | July 1, 2013
through
June 30, 2014 | | Prior to
July 1, 2013 | |
Class A | | | 1.48 | % | | | 1.49 | % | |
Class B | | | 2.23 | | | | 2.24 | | |
Class C | | | 2.23 | | | | 2.24 | | |
Class I | | | 1.09 | | | | 1.11 | | |
Class R | | | 1.73 | | | | 1.74 | | |
Class R4 | | | 1.23 | | | | 1.24 | | |
Class Z | | | 1.23 | | | | 1.24 | | |
Under the agreement governing these fee waivers and/or expense reimbursement arrangements, the following fees and expenses are excluded from the waiver/reimbursement commitment, and therefore will be paid by the Fund, if applicable: taxes (including foreign transaction taxes), expenses associated with investments in affiliated and non-affiliated pooled investment vehicles (including mutual funds and exchange-traded funds), transaction costs and brokerage commissions, costs related to any securities lending program, dividend expenses associated with securities sold short, inverse floater program fees and expenses, transaction charges and interest on borrowed money, interest, extraordinary expenses and any other expenses the exclusion of which is specifically approved by the Board. This agreement may be modified or amended only with approval from all parties.
Note 4. Federal Tax Information
The timing and character of income and capital gain distributions are determined in accordance with income tax regulations, which may differ from GAAP because of temporary or permanent book to tax differences.
At February 28, 2014, these differences are primarily due to differing treatment for capital loss carryforwards, deferral/reversal of wash sales losses, Trustees' deferred compensation, foreign currency transactions, passive foreign investment company (PFIC) holdings, and post-October capital losses. To the extent these differences are permanent, reclassifications are made among the components of the
Annual Report 2014
27
Columbia Marsico International Opportunities Fund
Notes to Financial Statements (continued)
February 28, 2014
Fund's net assets in the Statement of Assets and Liabilities. Temporary differences do not require reclassifications. In the Statement of Assets and Liabilities the following reclassifications were made:
Undistributed net investment income | | $ | 983,231 | | |
Accumulated net realized loss | | | (1,001,231 | ) | |
Paid-in capital | | | 18,000 | | |
Net investment income and net realized gains (losses), as disclosed in the Statement of Operations, and net assets were not affected by this reclassification.
The tax character of distributions paid during the years indicated was as follows:
Year Ended February 28, | | 2014 | | 2013 | |
Ordinary income | | $ | 3,825,594 | | | | — | | |
Short-term capital gain distributions, if any, are considered ordinary income distributions for tax purposes.
For the year ended February 28, 2013, there were no distributions.
At February 28, 2014, the components of distributable earnings on a tax basis were as follows:
Undistributed ordinary income | | $ | 282,685 | | |
Unrealized appreciation | | | 32,955,242 | | |
At February 28, 2014, the cost of investments for federal income tax purposes was $158,830,637 and the aggregate gross unrealized appreciation and depreciation based on that cost was:
Unrealized appreciation | | $ | 33,121,081 | | |
Unrealized depreciation | | | (165,839 | ) | |
Net unrealized appreciation | | $ | 32,955,242 | | |
The following capital loss carryforward, determined at February 28, 2014, may be available to reduce taxable income arising from future net realized gains on investments, if any, to the extent permitted by the Internal Revenue Code:
Year of Expiration | | Amount | |
2017 | | $ | 179,501,886 | | |
2018 | | | 420,548,594 | | |
Total | | $ | 600,050,480 | | |
For the year ended February 28, 2014, $71,240,775 of capital loss carryforward was utilized.
Under current tax rules, regulated investment companies can elect to treat certain late-year ordinary losses incurred and post-October capital losses (capital losses realized after October 31) as arising on the first day of the following taxable year. As of February 28, 2014, the Fund will elect to
treat post-October capital losses of $1,326,428 as arising on March 1, 2014.
Management of the Fund has concluded that there are no significant uncertain tax positions that would require recognition in the financial statements. However, management's conclusion may be subject to review and adjustment at a later date based on factors including, but not limited to, new tax laws, regulations, and administrative interpretations (including relevant court decisions). Generally, the Fund's federal tax returns for the prior three fiscal years remain subject to examination by the Internal Revenue Service.
Note 5. Portfolio Information
The cost of purchases and proceeds from sales of securities, excluding short-term obligations, aggregated to $343,844,548 and $562,523,134, respectively, for the year ended February 28, 2014.
Note 6. Affiliated Money Market Fund
The Fund invests its daily cash balances in Columbia Short-Term Cash Fund, an affiliated money market fund established for the exclusive use by the Fund and other affiliated funds. The income earned by the Fund from such investments is included as "Dividends — affiliated issuers" in the Statement of Operations. As an investing fund, the Fund indirectly bears its proportionate share of the expenses of Columbia Short-Term Cash Fund.
Note 7. Shareholder Concentration
At February 28, 2014, two unaffiliated shareholder accounts owned an aggregate of 32.3% of the outstanding shares of the Fund. The Fund has no knowledge about whether any portion of those shares was owned beneficially by such accounts. Subscription and redemption activity by concentrated accounts may have a significant effect on the operations of the Fund.
Note 8. Line of Credit
The Fund has entered into a revolving credit facility with a syndicate of banks led by JPMorgan Chase Bank N.A. whereby the Fund may borrow for the temporary funding of shareholder redemptions or for other temporary or emergency purposes. The credit facility agreement, as amended, which is a collective agreement between the Fund and certain other funds managed by the Investment Manager, severally and not jointly, permits collective borrowings up to $500 million. Interest is charged to each participating fund based on its borrowings at a rate equal to the higher of (i) the overnight federal funds rate plus 1.00% or (ii) the one-month LIBOR rate plus 1.00%. Each borrowing under the credit facility
Annual Report 2014
28
Columbia Marsico International Opportunities Fund
Notes to Financial Statements (continued)
February 28, 2014
matures no later than 60 days after the date of borrowing. Effective December 10, 2013, the Fund also pays a commitment fee equal to its pro rata share of the amount of the credit facility at a rate of 0.075% per annum. Prior to December 10, 2013, the commitment fee was charged at the annual rate of 0.08% per annum. The commitment fee is included in other expenses in the Statement of Operations.
For the year ended February 28, 2014, the average daily loan balance outstanding on days when borrowing existed was $4,690,625 at a weighted average interest rate of 1.19%. Interest expense incurred by the Fund is recorded as line of credit interest expense in the Statement of Operations.
Note 9. Significant Risks
Foreign Securities Risk
Investing in foreign securities may include certain risks and considerations not typically associated with investing in U.S. securities, such as fluctuating currency values and changing local and regional economic, political and social conditions, which may result in greater market volatility. In addition, certain foreign securities may not be as liquid as U.S. securities. Investing in emerging markets may accentuate these risks.
Investments in emerging market countries are subject to additional risk. The risk of foreign investments is typically increased in less developed countries. These countries are also more likely to experience high levels of inflation, deflation or currency devaluation which could hurt their economies and securities markets.
Note 10. Subsequent Events
Management has evaluated the events and transactions that have occurred through the date the financial statements were issued and noted no items requiring adjustment of the financial statements or additional disclosure.
Note 11. Information Regarding Pending and Settled Legal Proceedings
In December 2005, without admitting or denying the allegations, American Express Financial Corporation (AEFC, which is now known as Ameriprise Financial, Inc. (Ameriprise Financial)) entered into settlement agreements with the Securities and Exchange Commission (SEC) and Minnesota Department of Commerce (MDOC) related to market timing activities. As a result, AEFC was censured and ordered to cease and desist from committing or causing any violations of certain provisions of the Investment Advisers Act of 1940, the Investment Company Act of 1940, and various Minnesota laws. AEFC agreed to pay disgorgement of $10 million and civil money penalties of $7 million. AEFC also agreed to retain an independent distribution consultant to assist in developing a
plan for distribution of all disgorgement and civil penalties ordered by the SEC in accordance with various undertakings detailed at www.sec.gov/litigation/admin/ia-2451.pdf. Ameriprise Financial and its affiliates have cooperated with the SEC and the MDOC in these legal proceedings, and have made regular reports to the Funds' Boards of Trustees.
Ameriprise Financial and certain of its affiliates have historically been involved in a number of legal, arbitration and regulatory proceedings, including routine litigation, class actions, and governmental actions, concerning matters arising in connection with the conduct of their business activities. Ameriprise Financial believes that the Funds are not currently the subject of, and that neither Ameriprise Financial nor any of its affiliates are the subject of, any pending legal, arbitration or regulatory proceedings that are likely to have a material adverse effect on the Funds or the ability of Ameriprise Financial or its affiliates to perform under their contracts with the Funds. Ameriprise Financial is required to make 10-Q, 10-K and, as necessary, 8-K filings with the Securities and Exchange Commission on legal and regulatory matters that relate to Ameriprise Financial and its affiliates. Copies of these filings may be obtained by accessing the SEC website at www.sec.gov.
There can be no assurance that these matters, or the adverse publicity associated with them, will not result in increased fund redemptions, reduced sale of fund shares or other adverse consequences to the Funds. Further, although we believe proceedings are not likely to have a material adverse effect on the Funds or the ability of Ameriprise Financial or its affiliates to perform under their contracts with the Funds, these proceedings are subject to uncertainties and, as such, we are unable to estimate the possible loss or range of loss that may result. An adverse outcome in one or more of these proceedings could result in adverse judgments, settlements, fines, penalties or other relief that could have a material adverse effect on the consolidated financial condition or results of operations of Ameriprise Financial.
Annual Report 2014
29
Columbia Marsico International Opportunities Fund
Report of Independent Registered Public Accounting Firm
To the Trustees of Columbia Funds Series Trust and the Shareholders of
Columbia Marsico International Opportunities Fund
In our opinion, the accompanying statement of assets and liabilities, including the portfolio of investments, and the related statements of operations and of changes in net assets and the financial highlights present fairly, in all material respects, the financial position of Columbia Marsico International Opportunities Fund (the "Fund", a series of Columbia Funds Series Trust) at February 28, 2014, and the results of its operations, the changes in its net assets and the financial highlights for each of the periods indicated, in conformity with accounting principles generally accepted in the United States of America. These financial statements and financial highlights (hereafter referred to as "financial statements") are the responsibility of the Fund's management; our responsibility is to express an opinion on these financial statements based on our audits. We conducted our audits of these financial statements in accordance with the standards of the Public Company Accounting Oversight Board (United States). Those standards require that we plan and perform the audit to obtain reasonable assurance about whether the financial statements are free of material misstatement. An audit includes examining, on a test basis, evidence supporting the amounts and disclosures in the financial statements, assessing the accounting principles used and significant estimates made by management, and evaluating the overall financial statement presentation. We believe that our audits, which included confirmation of securities at February 28, 2014 by correspondence with the custodian, brokers and transfer agent, and the application of alternative auditing procedures where such confirmations had not been received, provide a reasonable basis for our opinion.
PricewaterhouseCoopers LLP
Minneapolis, Minnesota
April 21, 2014
Annual Report 2014
30
Columbia Marsico International Opportunities Fund
Federal Income Tax Information
(Unaudited)
The Fund hereby designates the following tax attributes for the fiscal year ended February 28, 2014. Shareholders will be notified in early 2015 of the amounts for use in preparing 2014 income tax returns.
Tax Designations:
| Qualified Dividend Income | | | 31.57 | % | |
| Dividends Received Deduction | | | 0.90 | % | |
Foreign Taxes Paid | | $ | 424,074 | | |
Foreign Source Income | | $ | 5,225,625 | | |
Qualified Dividend Income. For taxable, non-corporate shareholders, the percentage of ordinary income dividends paid during the fiscal year that represents qualified dividend income subject to reduced tax rates.
Dividends Received Deduction. The percentage of ordinary income dividends paid during the fiscal year that qualifies for the corporate dividends received deduction.
Foreign Taxes. The Fund makes the election to pass through to shareholders the foreign taxes paid. These taxes, and the corresponding foreign source income, are provided.
Annual Report 2014
31
Columbia Marsico International Opportunities Fund
Shareholders elect the Board that oversees the Funds' operations. The Board appoints officers who are responsible for day-to-day business decisions based on policies set by the Board. The following table provides basic biographical information about the Funds' Board members, including their principal occupations during the past five years, although specific titles for individuals may have varied over the period. Under current Board policy, members may serve through the end of the calendar year in which he or she reaches either the mandatory retirement age established by the Board or the fifteenth anniversary of the first Board meeting they attended as a member of the Board.
Independent Trustees
Name,
Address,
Year of Birth | | Position Held With
Funds and Length of
Service | | Principal Occupation(s)
During Past Five Years
and Other Relevant
Professional Experience | | Number of
Funds in the
Fund Family
Overseen by
Board Member | | Other Present or Past
Directorships/
Trusteeships
(Within Past 5 Years) | |
Kathleen Blatz
901 S. Marquette Ave.
Minneapolis, MN 55402
1954 | | Board member since 1/06 for RiverSource Funds and since 6/11 for Nations Funds | | Attorney; Chief Justice, Minnesota Supreme
Court, 1998-2006 | | | 131 | | | Trustee, BlueCross BlueShield of Minnesota since 2009 | |
Edward J. Boudreau, Jr.
901 S. Marquette Ave.
Minneapolis, MN 55402
1944 | | Board member since 6/11 for RiverSource Funds and since 1/05 for Nations Funds | | Managing Director, E.J. Boudreau & Associates (consulting) since 2000; Chairman and Chief Executive Officer, John Hancock Funds (mutual funds), 1989-2000 | | | 129 | | | Former Trustee, BofA Funds Series Trust (11 funds), 2005-2011 | |
Pamela G. Carlton
901 S. Marquette Ave.
Minneapolis, MN 55402
1954 | | Board member since 7/07 for RiverSource Funds and since 6/11 for Nations Funds | | President, Springboard — Partners in Cross Cultural Leadership (consulting company) since 2003; Director or Management Director of US Equity Research, Chase Asset Management, 1996-2003; Investment Banker, Morgan Stanley, 1982-1996 | | | 131 | | | None | |
William P. Carmichael
901 S. Marquette Ave.
Minneapolis, MN 55402
1943 | | Chair of the Board since 1/14, Board member since 6/11 for RiverSource Funds and since 2003 for Nations Funds | | Retired; Co-founder, The Succession Fund (provides exit strategies to owners of privately held companies); previously, Senior Vice President, Sara Lee Corporation; Senior Vice President and Chief Financial officer, Beatrice Foods Company; Vice President, Esmark, Inc.; Associate, Price Waterhouse | | | 131 | | | Director, Cobra Electronics Corporation (electronic equipment manufacturer); The Finish Line (athletic shoes and apparel) since July 2003; Director, International Textile Corp. since 2012; former Director, McMoRan Exploration Company (oil and gas exploration and development) 2010-2013; former Trustee, BofA Funds Series Trust (11 funds), 2009-2011; Director, Spectrum Brands, Inc. (consumer products), 2002-2009; Director, Simmons Company (bedding), 2004-2010 | |
Annual Report 2014
32
Columbia Marsico International Opportunities Fund
Trustees and Officers (continued)
Independent Trustees (continued)
Name,
Address,
Year of Birth | | Position Held With
Funds and Length of
Service | | Principal Occupation(s)
During Past Five Years
and Other Relevant
Professional Experience | | Number of
Funds in the
Fund Family
Overseen by
Board Member | | Other Present or Past
Directorships/
Trusteeships
(Within Past 5 Years) | |
Patricia M. Flynn
901 S. Marquette Ave.
Minneapolis, MN 55402
1950 | | Board member since 11/04 for RiverSource Funds and since 6/11 for Nations Funds | | Trustee Professor of Economics and Management, Bentley University since 1976 (also teaches and conducts research on corporate governance); Dean, McCallum Graduate School of Business, Bentley University, 1992-2002 | | | 131 | | | None | |
William A. Hawkins
901 S. Marquette Ave.
Minneapolis, MN 55402
1942 | | Board member since 6/11 for RiverSource Funds and since 1/05 for Nations Funds | | Managing Director, Overton Partners (financial consulting), since August 2010; President and Chief Executive Officer, California General Bank, N.A., January 2008-August 2010 | | | 129 | | | Trustee, BofA Funds Series Trust (11 funds) | |
R. Glenn Hilliard
901 S. Marquette Ave.
Minneapolis, MN 55402
1943 | | Board member since 6/11 for RiverSource Funds and since 1/05 for Nations Funds | | Chairman and Chief Executive Officer, Hilliard Group LLC (investing and consulting) since April 2003; Non-Executive Director & Chairman, CNO Financial Group, Inc. (insurance), September 2003-May 2011 | | | 129 | | | Chairman, BofA Fund Series Trust (11 funds); former Director, CNO Financial Group, Inc. (insurance), 2003-2011 | |
Stephen R. Lewis, Jr.
901 S. Marquette Ave.
Minneapolis, MN 55402
1939 | | Board member for RiverSource Funds since 1/02 and since 6/11 for Nations Funds, Board Chair 1/07-12/13 | | President Emeritus and Professor of Economics Emeritus, Carleton College since 2002 | | | 131 | | | Director, Valmont Industries, Inc. (irrigation systems manufacturer), 2002-2013 | |
Catherine James Paglia
901 S. Marquette Ave.
Minneapolis, MN 55402
1952 | | Board member since 11/04 for RiverSource Funds and since 6/11 for Nations Funds | | Director, Enterprise Asset Management, Inc. (private real estate and asset management company) since September 1998 | | | 131 | | | Director, Valmont Industries, Inc. (irrigation systems manufacturer) since 2012 | |
Leroy C. Richie
901 S. Marquette Ave.
Minneapolis, MN 55402
1941 | | Board member since 2000 for Legacy Seligman Funds, since 11/08 for RiverSource Funds and since 6/11 for Nations Funds | | Counsel, Lewis & Munday, P.C. (law firm) since 2004; Vice President and General Counsel, Automotive Legal Affairs, Chrysler Corporation, 1993-1997 | | | 131 | | | Lead Outside Director, Digital Ally, Inc. (digital imaging) since September 2005; Director, Infinity, Inc. (oil and gas exploration and production) since 1994; Director, OGE Energy Corp. (energy and energy services) since November 2007 | |
Minor M. Shaw
901 S. Marquette Ave.
Minneapolis, MN 55402
1947 | | Board member since 6/11 for RiverSource Funds and since 2003 for Nations Funds | | President, Micco LLC (private investments) since 2011; President, Micco Corp. since 1998 | | | 129 | | | Director, Piedmont Natural Gas; Director, BlueCross BlueShield of South Carolina since April 2008; Director, National Association of Corporate Directors, Carolinas Chapter, since 2013; former Trustee, BofA Funds Series Trust (11 funds) | |
Annual Report 2014
33
Columbia Marsico International Opportunities Fund
Trustees and Officers (continued)
Independent Trustees (continued)
Name,
Address,
Year of Birth | | Position Held With
Funds and Length of
Service | | Principal Occupation(s)
During Past Five Years
and Other Relevant
Professional Experience | | Number of
Funds in the
Fund Family
Overseen by
Board Member | | Other Present or Past
Directorships/
Trusteeships
(Within Past 5 Years) | |
Alison Taunton-Rigby
901 S. Marquette Ave.
Minneapolis, MN 55402
1944 | | Board member since 11/02 for RiverSource Funds and since 6/11 for Nations Funds | | Chief Executive Officer and Director, RiboNovix, Inc., (biotechnology) 2003-2010 | | | 131 | | | Director, Healthways, Inc. (health and wellbeing solutions) since 2005; Director, ICI Mutual Insurance Company, RRG since 2011; Director, Abt
Associates (government contractor) since 2001; Director, Boston Children's Hospital since 2002 | |
Interested Trustee Not Affiliated with Investment Manager*
Name,
Address,
Year of Birth | | Position Held With
Funds and Length of
Service | | Principal Occupation(s)
During Past Five Years
and Other Relevant
Professional Experience | | Number of
Funds in the
Fund Family
Overseen by
Board Member | | Other Present or Past
Directorships/
Trusteeships
(Within Past 5 Years) | |
Anthony M. Santomero
901 S. Marquette Ave.
Minneapolis, MN 55402
1946 | | Board member since 6/11 for RiverSource Funds and since 1/08 for Nations Funds | | Richard K. Mellon Professor Emeritus of Finance, The Wharton School, University of Pennsylvania, since 2002; Senior Advisor, McKinsey & Company (consulting), 2006-2008 | | | 129 | | | Director, Renaissance Reinsurance Ltd. since May 2008; Trustee, Penn Mutual Life Insurance Company since March 2008; Director, Citigroup Inc. since 2009; Director, Citibank, N.A. since 2009; former Trustee, BofA Funds Series Trust (11 funds), 2008-2011 | |
* Dr. Santomero is not an affiliated person of the Investment Manager or Ameriprise Financial. However, he is currently deemed by the Funds to be an "interested person" (as defined in the 1940 Act) of the Funds because he serves as a Director of Citigroup Inc. and Citibank, N.A., companies that may directly or through subsidiaries and affiliates engage from time-to-time in brokerage execution, principal transactions and lending relationships with the Funds or accounts advised/managed by the Investment Manager.
Annual Report 2014
34
Columbia Marsico International Opportunities Fund
Trustees and Officers (continued)
Interested Trustee Affiliated with Investment Manager*
Name,
Address,
Year of Birth | | Position Held With
Funds and Length of
Service | | Principal Occupation(s)
During Past Five Years
and Other Relevant
Professional Experience | | Number of
Funds in the
Fund Family
Overseen by
Board Member | | Other Present or Past
Directorships/
Trusteeships
(Within Past 5 Years) | |
William F. Truscott
53600 Ameriprise
Financial Center
Minneapolis, MN 55474
1960 | | Board member since 11/01 for RiverSource Funds and since 6/11 for Nations Funds; Senior Vice President since 2002 for RiverSource Funds and since 5/10 for Nations Funds | | Chairman of the Board and President, Columbia Management Investment Advisers, LLC since May 2010 and February 2012, respectively (previously President and Chief Investment Officer, 2001-April 2010); Chief Executive Officer, Global Asset Management, Ameriprise Financial, Inc. since September 2012 (previously Chief Executive Officer, U.S. Asset Management & President, Annuities, May 2010-September 2012 and President — U.S. Asset Management and Chief Investment Officer, 2005-April 2010); Director and Chief Executive Officer, Columbia Management Investment Distributors, Inc. since May 2010 and February 2012, respectively (previously Chairman of the Board and Chief Executive Officer, 2006-April 2010); Chairman of the Board and Chief Executive Officer, RiverSource Distributors, Inc. since 2006; Director, Threadneedle Asset Management Holdings, SARL since 2014; President and Chief Executive Officer, Ameriprise Certificate Company, 2006-August 2012 | | | 183 | | | Former Director, Ameriprise Certificate Company, 2006-January 2013 | |
* Interested person (as defined under the 1940 Act) by reason of being an officer, director, security holder and/or employee of the Investment Manager or Ameriprise Financial.
The SAI has additional information about the Fund's Board members and is available, without charge, upon request by calling 800.345.6611; contacting your financial intermediary; or visiting columbiamanagement.com.
Annual Report 2014
35
Columbia Marsico International Opportunities Fund
Trustees and Officers (continued)
The Board has appointed officers who are responsible for day-to-day business decisions based on policies it has established. The officers serve at the pleasure of the Board. In addition to Mr. Truscott, who is Senior Vice President, the Funds' other officers are:
Officers
Name,
Address and
Year of Birth | | Position and Year
First Appointed to
Position for any Fund
in the Columbia
Funds Complex or a
Predecessor Thereof | | Principal Occupation(s) During Past Five Years | |
J. Kevin Connaughton
225 Franklin Street
Boston, MA 02110
Born 1964 | | President and Principal Executive Officer (2009) | | Managing Director and General Manager — Mutual Fund Products, Columbia Management Investment Advisers, LLC since May 2010; and President, Columbia Funds since 2009; Managing Director, Columbia Management Advisors, LLC, December 2004 – April 2010; Senior Vice President and Chief Financial Officer, Columbia Funds, June 2008 – January 2009; and senior officer of Columbia Funds and affiliated funds since 2003 | |
Michael G. Clarke
225 Franklin Street
Boston, MA 02110
Born 1969 | | Treasurer (2011) and Chief Financial Officer (2009) | | Vice President — Mutual Fund Administration, Columbia Management Investment Advisers, LLC, since May 2010;Managing Director of Fund Administration, Columbia Management Advisors, LLC, September 2004 – April 2010; and senior officer of Columbia Funds and affiliated funds since 2002 | |
Scott R. Plummer
5228 Ameriprise Financial Center
Minneapolis, MN 55474
Born 1959 | | Senior Vice President (2006), Chief Legal Officer (2006) and Assistant Secretary (2011) | | Senior Vice President and Assistant General Counsel — Global Asset Management, Ameriprise Financial since February 2014 (previously, Senior Vice President and Lead Chief Counsel — Asset Management, 2012 – February 2014; Vice President and Lead Chief Counsel — Asset Management, 2010 – 2012; and Vice President and Chief Counsel — Asset Management, 2005 – 2010); Senior Vice President, Chief Legal Officer and Assistant Secretary, Columbia Management Investment Advisers, LLC since June 2005; Vice President, Chief Counsel and Assistant Secretary, Columbia Management Investment Distributors, Inc. since 2008; Vice President, General Counsel and Secretary, Ameriprise Certificate Company since 2005; Chief Counsel, RiverSource Distributors, Inc. since 2006; senior officer of Columbia Funds and affiliated funds since 2006 | |
Thomas P. McGuire
225 Franklin Street
Boston, MA 02110
Born 1972 | | Chief Compliance Officer (2012) | | Vice President — Asset Management Compliance, Ameriprise Financial, Inc. since May 2010; Chief Compliance Officer, Ameriprise Certificate Company, since September 2010; Compliance Executive, Bank of America, 2005 – April 2010 | |
Colin Moore
225 Franklin Street
Boston, MA 02110
Born 1958 | | Senior Vice President (2010) | | Executive Vice President and Global Chief Investment Officer, Ameriprise Financial, Inc. since July 2013; Director and Global Chief Investment Officer, Columbia Management Investment Advisers, LLC since May 2010; Manager, Managing Director and Chief Investment Officer, Columbia Management Advisors, LLC, 2007 – April 2010 | |
Michael E. DeFao
225 Franklin Street
Boston, MA 02110
Born 1968 | | Vice President (2011) and Assistant Secretary (2010) | | Vice President and Chief Counsel, Ameriprise Financial, Inc. since May 2010; Associate General Counsel, Bank of America 2005 – April 2010 | |
Joseph F. DiMaria
225 Franklin Street
Boston, MA 02110
Born 1968 | | Vice President (2011) and Chief Accounting Officer (2008) | | Vice President — Mutual Fund Treasurer, Columbia Management Investment Advisers, LLC since May 2010; Director of Fund Administration, Columbia Management Advisors, LLC, 2006 – April 2010 | |
Paul B. Goucher
100 Park Avenue
New York, NY 10017
Born 1968 | | Vice President (2011) and Assistant Secretary (2008) | | Vice President and Lead Chief Counsel, Ameriprise Financial, Inc. since November 2008 and January 2013, respectively (previously Chief Counsel, January 2010 – January 2013, and Group Counsel, November 2008 – January 2010); Director, Managing Director and General Counsel, J. & W. Seligman & Co. Incorporated, July 2008 – November 2008 | |
Amy Johnson
5228 Ameriprise Financial
Center
Minneapolis, MN 55474
Born 1965 | | Vice President (2006) | | Managing Director and Chief Operating Officer, Columbia Management Investment Advisers, LLC since May 2010 (previously Chief Administrative Officer, 2009 – April 2010, and Vice President — Asset Management and Trust Company Services, 2006 – 2009) | |
Annual Report 2014
36
Columbia Marsico International Opportunities Fund
Trustees and Officers (continued)
Officers (continued)
Name,
Address and
Year of Birth | | Position and Year
First Appointed to
Position for any Fund
in the Columbia
Funds Complex or a
Predecessor Thereof | | Principal Occupation(s) During Past Five Years | |
Paul D. Pearson
5228 Ameriprise Financial
Center
Minneapolis, MN 55474
Born 1956 | | Vice President (2011) and Assistant Treasurer (1999) | | Vice President — Investment Accounting, Columbia Management Investment Advisers, LLC since May 2010; Vice President — Managed Assets, Investment Accounting, Ameriprise Financial, Inc., 1998 – April 2010 | |
Christopher O. Petersen
5228 Ameriprise Financial Center
Minneapolis, MN 55474
Born 1970 | | Vice President and Secretary (2010) | | Vice President and Chief Counsel, Ameriprise Financial, Inc., since January 2010 (previously Vice President and Group Counsel or Counsel, 2004 – January 2010); officer of Columbia Funds and affiliated funds since 2007 | |
Stephen T. Welsh
225 Franklin Street
Boston, MA 02110
Born 1957 | | Vice President (2006) | | President and Director, Columbia Management Investment Services Corp. since May 2010; President and Director, Columbia Management Services, Inc., 2004 – April 2010; Managing Director, Columbia Management Distributors, Inc., 2007 – April 2010 | |
Annual Report 2014
37
This page intentionally left blank.
Annual Report 2014
38
This page intentionally left blank.
Annual Report 2014
39
This page intentionally left blank.
Annual Report 2014
40
Columbia Marsico International Opportunities Fund
Important Information About This Report
Each fund mails one shareholder report to each shareholder address. If you would like more than one report, please call shareholder services at 800.345.6611 and additional reports will be sent to you.
The policy of the Board is to vote the proxies of the companies in which each fund holds investments consistent with the procedures as stated in the Statement of Additional Information (SAI). You may obtain a copy of the SAI without charge by calling 800.345.6611; contacting your financial intermediary; visiting columbiamanagement.com; or searching the website of the Securities and Exchange Commission (SEC) at sec.gov. Information regarding how each fund voted proxies relating to portfolio securities is filed with the SEC by August 31 for the most recent 12-month period ending June 30 of that year, and is available without charge by visiting columbiamanagement.com; or searching the website of the SEC at sec.gov.
Each fund files a complete schedule of portfolio holdings with the SEC for the first and third quarters of each fiscal year on Form N-Q. Each fund's Form N-Q is available on the SEC's website at sec.gov and may be reviewed and copied at the SEC's Public Reference Room in Washington, D.C. Information on the operation of the Public Reference Room may be obtained by calling 800.SEC.0330. Each fund's complete schedule of portfolio holdings, as filed on Form N-Q, can also be obtained without charge, upon request, by calling 800.345.6611.
Annual Report 2014
41

Columbia Marsico International Opportunities Fund
P.O. Box 8081
Boston, MA 02266-8081
columbiamanagement.com
This information is for use with concurrent or prior delivery of a fund prospectus. Please read and consider the investment objectives, risks, charges and expenses for any fund carefully before investing. For a prospectus and, if available, a summary prospectus, which contains this and other important information about the Fund go to columbiamanagement.com. The Fund is distributed by Columbia Management Investment Distributors, Inc., member FINRA, and managed by Columbia Management Investment Advisers, LLC.
© 2014 Columbia Management Investment Advisers, LLC. All rights reserved.
ANN189_02_D01_(04/14)
Annual Report
February 28, 2014

Columbia Mid Cap Index Fund
Not FDIC insured • No bank guarantee • May lose value
 Dear Shareholders,
Equities recovered
In the final months of 2013, the U.S. economy embraced a robust recovery. After five years of only modest progress, the pace of economic growth picked up, job gains continued, manufacturing activity accelerated and a rebound in the housing market showed staying power. Growth, as measured by gross domestic product, was 4.1% in the third quarter, with expectations for a solid fourth quarter. Job growth averaged close to 200,000 monthly. Industrial production rose at a rate of 3.3%, considerably higher than the 12-month average of 2.5%. Factories were busier than at any point since the 2008/2009 recession, with capacity utilization at 79%. Orders for durable goods were strong, bolstered by rising auto sales. Holiday spending was solid, especially online sales, which rose 10% year over year, despite a shorter season.
Against this backdrop, the Federal Reserve's (the Fed's) announcement that it would slowly retreat from its monthly bond buying program and a bipartisan budget deal in Washington were welcome news for investors. Stocks climbed to new highs in the fourth quarter, while bonds retreated as yields moved higher. Small-cap stocks outperformed large- and mid-cap stocks, led by significant gains from the industrials, technology and consumer discretionary sectors. All 10 sectors of the S&P 500 Index delivered positive returns, although telecommunications and utilities posted only modest gains.
Fixed-income retreated
Improved economic data drove interest rates higher over the fourth quarter, credit spreads narrowed and the dollar weakened against most developed market currencies. Against this backdrop, most non-Treasury, fixed-income sectors delivered positive returns. Outgoing Fed chairman Ben Bernanke expressed concern about the persistently low level of core inflation, but gains in the labor market and reduced unemployment led to the Fed's decision to taper its bond-buying program gradually beginning in January 2014.
As the stock market soared, the riskiest sectors of the fixed-income markets fared the best. U.S. and foreign high-yield bonds were the strongest performers, followed by emerging-market and U.S. investment-grade corporate bonds. U.S. mortgage-backed securities (MBS) and securitized bonds produced negative total returns, as did U.S. Treasuries and developed world government bonds. Treasury inflation-protected bonds were the period's biggest losers. Investment-grade municipals delivered fractional gains, as better economic conditions helped steady state finances.
Stay on track with Columbia Management
Backed by more than 100 years of experience, Columbia Management is one of the nation's largest asset managers. At the heart of our success and, most importantly, that of our investors, are highly talented industry professionals, brought together by a unique way of working. At Columbia Management, reaching our performance goals matters, and how we reach them matters just as much.
Visit columbiamanagement.com for:
> The Columbia Management Perspectives blog, offering insights on current market events and investment opportunities
> Detailed up-to-date fund performance and portfolio information
> Quarterly fund commentaries
> Columbia Management Investor, our award-winning quarterly newsletter for shareholders
Thank you for your continued support of the Columbia Funds. We look forward to serving your investment needs for many years to come.
Best Regards,

J. Kevin Connaughton
President, Columbia Funds
Investing involves risk including the risk of loss of principal.
The S&P 500 Index, an unmanaged index, measures the performance of 500 widely held, large-capitalization U.S. stocks and is frequently used as a general measure of market performance. The Dow Jones Industrial Average is a price weighted average of 30 actively traded shares of blue chip US industrial corporations listed on the New York Stock Exchange. Indices are not available for investment, are not professionally managed and do not reflect sales charges, fees, brokerage commissions, taxes or other expenses of investing.
Investors should consider the investment objectives, risks, charges and expenses of a mutual fund carefully before investing. For a free prospectus and, if available, a summary prospectus, which contains this and other important information about a fund, visit columbiamanagement.com. The prospectus should be read carefully before investing.
Columbia Funds are distributed by Columbia Management Investment Distributors, Inc., member FINRA, and managed by Columbia Management Investment Advisers, LLC.
© 2014 Columbia Management Investment Advisers, LLC. All rights reserved.
Columbia Mid Cap Index Fund
Performance Overview | | | 2 | | |
Manager Discussion of Fund Performance | | | 4 | | |
Understanding Your Fund's Expenses | | | 6 | | |
Portfolio of Investments | | | 7 | | |
Statement of Assets and Liabilities | | | 17 | | |
Statement of Operations | | | 19 | | |
Statement of Changes in Net Assets | | | 20 | | |
Financial Highlights | | | 22 | | |
Notes to Financial Statements | | | 26 | | |
Report of Independent Registered
Public Accounting Firm | �� | | 33 | | |
Federal Income Tax Information | | | 34 | | |
Trustees and Officers | | | 35 | | |
Important Information About This Report | | | 41 | | |
Fund Investment Manager
Columbia Management Investment
Advisers, LLC
225 Franklin Street
Boston, MA 02110
Fund Distributor
Columbia Management Investment
Distributors, Inc.
225 Franklin Street
Boston, MA 02110
Fund Transfer Agent
Columbia Management Investment
Services Corp.
P.O. Box 8081
Boston, MA 02266-8081
For more information about any of the funds, please visit columbiamanagement.com or call 800.345.6611. Customer Service Representatives are available to answer your questions Monday through Friday from 8 a.m. to 7 p.m. Eastern time.
The views expressed in this report reflect the current views of the respective parties. These views are not guarantees of future performance and involve certain risks, uncertainties and assumptions that are difficult to predict, so actual outcomes and results may differ significantly from the views expressed. These views are subject to change at any time based upon economic, market or other conditions and the respective parties disclaim any responsibility to update such views. These views may not be relied on as investment advice and, because investment decisions for a Columbia Fund are based on numerous factors, may not be relied on as an indication of trading intent on behalf of any particular Columbia Fund. References to specific securities should not be construed as a recommendation or investment advice.
Columbia Mid Cap Index Fund
Performance Summary
> Columbia Mid Cap Index Fund (the Fund) Class A shares returned 26.04% for the 12-month period that ended February 28, 2014.
> The Fund's benchmark, the unmanaged S&P MidCap 400 Index, returned 26.58% for the same time period.
> Mutual funds, unlike unmanaged indices, incur operating expenses, which accounted for the Fund's underperformance relative to the benchmark.
Average Annual Total Returns (%) (for period ended February 28, 2014)
| | | Inception | | 1 Year | | 5 Years | | 10 Years | |
Class A | | 05/31/00 | | | 26.04 | | | | 26.40 | | | | 9.76 | | |
Class I* | | 09/27/10 | | | 26.36 | | | | 26.72 | | | | 10.04 | | |
Class R5* | | 11/08/12 | | | 26.38 | | | | 26.73 | | | | 10.04 | | |
Class Z | | 03/31/00 | | | 26.25 | | | | 26.69 | | | | 10.03 | | |
S&P MidCap 400 Index | | | | | | | 26.58 | | | | 26.95 | | | | 10.15 | | |
All results shown assume reinvestment of distributions during the period. Returns do not reflect the deduction of taxes that a shareholder may pay on Fund distributions or on the redemption of Fund shares. Performance results reflect the effect of any fee waivers or reimbursements of Fund expenses by Columbia Management Investment Advisers, LLC and/or any of its affiliates. Absent these fee waivers or expense reimbursement arrangements, performance results would have been lower.
The performance information shown represents past performance and is not a guarantee of future results. The investment return and principal value of your investment will fluctuate so that your shares, when redeemed, may be worth more or less than their original cost. Current performance may be lower or higher than the performance information shown. You may obtain performance information current to the most recent month-end by contacting your financial intermediary, visiting columbiamanagement.com or calling 800.345.6611.
*The returns shown for periods prior to the share class inception date (including returns for the Life of the Fund, if shown, which are since Fund inception) include the returns of the Fund's oldest share class. These returns are adjusted to reflect any higher class-related operating expenses of the newer share classes, as applicable. Please visit columbiamanagement.com/mutual-funds/appended-performance for more information.
The S&P MidCap 400 Index is a market-value weighted index that tracks the performance of 400 mid-cap U.S. companies.
Indices are not available for investment, are not professionally managed and do not reflect sales charges, fees, brokerage commissions, taxes or other expenses of investing. Securities in the Fund may not match those in an index.
Annual Report 2014
2
Columbia Mid Cap Index Fund
Performance Overview (continued)
Performance of a Hypothetical $10,000 Investment (March 1, 2004 – February 28, 2014)
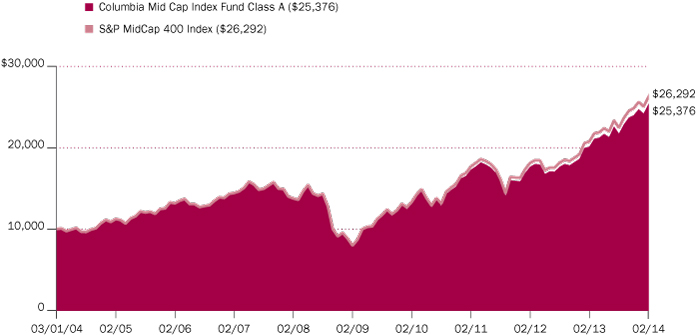
The chart above shows the change in value of a hypothetical $10,000 investment in Class A shares of Columbia Mid Cap Index Fund during the stated time period, and does not reflect the deduction of taxes that a shareholder may pay on Fund distributions or on the redemption of Fund shares.
Annual Report 2014
3
Columbia Mid Cap Index Fund
Manager Discussion of Fund Performance
For the 12-month period that ended February 28, 2014, the Fund's Class A shares returned 26.04%. The Fund's benchmark, the unmanaged S&P MidCap 400 Index, returned 26.58% for the same time period. Mutual funds, unlike unmanaged indices, incur operating expenses, which helped to account for the Fund's underperformance relative to the benchmark.
U.S. Equity Market Posted Strong Gains
Following a strong first quarter of 2013 when investors turned attention to the modest but continued strengthening of the U.S. economy, volatility heightened in the second calendar quarter, as uncertainty about the global economy, monetary policy and the impact of the sequester's spending cuts weighed on investors. While consumers weathered the domestic drag well, businesses remained cautious, keeping inventories, capital expenditures and staffs lean. U.S. equities delivered positive returns during the third quarter of 2013 despite threats of military action in Syria, rumblings from Iran and an impending showdown over the U.S. debt ceiling. Still, robust economic growth continued to elude the U.S. economy, which merely plodded along. The Federal Reserve (the Fed) unsettled investors with a hint that it was ready to taper its purchase of U.S. Treasury and mortgage securities. However, the Fed's decision to not take any action at its September 2013 meeting rallied stocks to new highs. In the final months of 2013, the U.S. economy embraced a healthy recovery, with job gains continuing, manufacturing activity accelerating and a rebound in housing showing staying power. Against this backdrop, the Fed's announcement in mid-December that it would slowly retreat from its monthly bond purchases and a bipartisan budget deal in Washington D.C. were welcome news for investors, and U.S. equities climbed to new highs.
Along with the U.S. equity market broadly, the benchmark reacted poorly to reports of lower Chinese manufacturing and fell in January 2014. However, the decline was short-lived, with U.S. equities subsequently regaining losses in February, bringing the benchmark to the best year-to-date 2014 increase among the U.S. equity market capitalization indices. Global concerns heightened amidst conflict in the Ukraine, but investors generally remained positive on U.S. equities given strong corporate earnings reports and guidance.
Benchmark Enjoyed Broad-Based Gains
All ten sectors of the benchmark posted double-digit positive returns during the 12 months ended February 28, 2014. In terms of total return, health care, consumer staples and consumer discretionary were the best relative performers. On the basis of impact, which takes weightings and total returns into account, industrials, financials and consumer discretionary were the biggest contributors to the benchmark return. The top performing industries for the annual period were pharmaceuticals, textiles, apparel and luxury goods, biotechnology, auto components and airlines.
Conversely, telecommunication services and energy were the weakest sectors from both a total return perspective and on the basis of impact. Each, though, still generated positive, albeit more modest, returns. The worst performing industries for the annual period were air freight and logistics, internet software and services, multiline retail, wireless telecommunication services and construction and engineering.
Portfolio Management
Alfred Alley III, CFA
Vadim Shteyn
Morningstar Style BoxTM

The Morningstar Style BoxTM is based on a fund's portfolio holdings. For equity funds, the vertical axis shows the market capitalization of the stocks owned, and the horizontal axis shows investment style (value, blend, or growth). Information shown is based on the most recent data provided by Morningstar.
© 2014 Morningstar, Inc. All rights reserved. The Morningstar information contained herein: (1) is proprietary to Morningstar and/or its content providers; (2) may not be copied or distributed; and (3) is not warranted to be accurate, complete or timely. Neither Morningstar nor its content providers are responsible for any damages or losses arising from any use of this information.
Top Ten Holdings (%)
(at February 28, 2014) | |
Green Mountain Coffee
Roasters, Inc. | | | 0.9 | | |
Endo Health Solutions, Inc. | | | 0.7 | | |
Henry Schein, Inc. | | | 0.7 | | |
Cimarex Energy Co. | | | 0.6 | | |
Affiliated Managers Group, Inc. | | | 0.6 | | |
Trimble Navigation Ltd. | | | 0.6 | | |
Equinix, Inc. | | | 0.6 | | |
Church & Dwight Co., Inc. | | | 0.6 | | |
SL Green Realty Corp. | | | 0.6 | | |
Advance Auto Parts, Inc. | | | 0.6 | | |
Percentages indicated are based upon total investments (excluding Money Market Funds).
For further detail about these holdings, please refer to the section entitled "Portfolio of Investments."
Fund holdings are as of the date given, are subject to change at any time, and are not recommendations to buy or sell any security.
Annual Report 2014
4
Columbia Mid Cap Index Fund
Manager Discussion of Fund Performance (continued)
Top individual contributors within the benchmark included biotechnology company Vertex Pharmaceuticals, specialty coffee and coffee maker company Green Mountain Coffee Roasters, specialty pharmaceuticals company Endo International, branded performance apparel and accessories company Under Armour and specialty finance solutions company Alliance Data Systems. Top detractors were web-based information technology systems provider Rackspace Hosting, petroleum products refiner HollyFrontier, Internet exchange services provider Equinix, casual apparel retailer American Eagle Outfitters and department store retailer J.C. Penney.
As always, each sector and stock in the benchmark was represented in the Fund with approximately the same weighting as in the benchmark and therefore had a similar effect.
Benchmark Additions and Deletions Drove Portfolio Changes
During the annual period, there were 31 additions and 31 deletions to the benchmark and the Fund's portfolio. Among those stocks added to the Index and Fund were Hain Celestial Group, Abercrombie & Fitch, J.C. Penney, Apollo Group, Domino's Pizza, Dean Foods, 3-D Systems, Brunswick, JDS Uniphase, Advanced Micro Devices and Kilroy Realty. Deletions included Harris Teeter Supermarkets, Scholastic, Aeropostale, Saks, Monster Worldwide, Barnes & Noble, Tellabs, Kansas City Southern, Macerich, Alliance Data and Arch Coal.
The Fund used equity index futures on an opportunistic basis to equitize cash balances held in the portfolio for trading and redemption purposes. The percentage of Fund assets held in these instruments changed daily due to changes in the Fund's cash position but was generally minimal in size and impact.
Looking Ahead
We do not anticipate any changes in the portfolio beyond the customary quarterly rebalancings and stock substitutions we make to align the Fund with the benchmark.
From a broad perspective, following developed equity markets performing strongly relative to other asset classes in 2013, we currently believe U.S. equities have the potential to perform well in 2014, albeit perhaps not as well as last year. While valuations for most U.S. stocks did not appear as cheap at the end of February 2014 as they were 12 months prior, we believe they were still fairly valued, especially relative to fixed income. Indeed, we believe corporate earnings have been strong and guidance has been encouraging for the most part. Balance sheets remain healthy at this time with high cash levels and low debt. We currently believe the U.S. economy may continue to benefit from an improving labor market, a strengthening housing market, reduced fiscal drag, normalization of monetary policy, an improving eurozone recovery and aggressive Japanese economic stimulus. There will almost certainly be challenges along the way, such as geopolitical risk and the unknown impact of ongoing Fed tapering, but we believe developed equity markets, especially U.S. equity markets may still provide reasonably attractive returns in the coming months.
Portfolio Breakdown (%)
(at February 28, 2014) | |
Common Stocks | | | 97.8 | | |
Consumer Discretionary | | | 12.8 | | |
Consumer Staples | | | 4.0 | | |
Energy | | | 5.4 | | |
Financials | | | 22.2 | | |
Health Care | | | 9.4 | | |
Industrials | | | 16.4 | | |
Information Technology | | | 15.7 | | |
Materials | | | 7.0 | | |
Telecommunication Services | | | 0.4 | | |
Utilities | | | 4.5 | | |
Money Market Funds | | | 2.2 | | |
Total | | | 100.0 | | |
Percentages indicated are based upon total investments. The Fund's portfolio composition is subject to change.
Investment Risks
Share prices of mid-capitalization companies tend to be more volatile than those of larger companies. See the Fund's prospectus for information on these and other risks.
Annual Report 2014
5
Columbia Mid Cap Index Fund
Understanding Your Fund's Expenses
(Unaudited)
As an investor, you incur two types of costs. There are transaction costs, which generally include sales charges on purchases and may include redemption fees. There are also ongoing costs, which generally include management fees, distribution and/or service fees, and other fund expenses. The following information is intended to help you understand your ongoing costs (in dollars) of investing in the Fund and to help you compare these costs with the ongoing costs of investing in other mutual funds.
Analyzing Your Fund's Expenses
To illustrate these ongoing costs, we have provided examples and calculated the expenses paid by investors in each share class of the Fund during the period. The actual and hypothetical information in the table is based on an initial investment of $1,000 at the beginning of the period indicated and held for the entire period. Expense information is calculated two ways and each method provides you with different information. The amount listed in the "Actual" column is calculated using the Fund's actual operating expenses and total return for the period. You may use the Actual information, together with the amount invested, to estimate the expenses that you paid over the period. Simply divide your account value by $1,000 (for example, an $8,600 account value divided by $1,000 = 8.6), then multiply the results by the expenses paid during the period under the "Actual" column. The amount listed in the "Hypothetical" column assumes a 5% annual rate of return before expenses (which is not the Fund's actual return) and then applies the Fund's actual expense ratio for the period to the hypothetical return. You should not use the hypothetical account values and expenses to estimate either your actual account balance at the end of the period or the expenses you paid during the period. See "Compare With Other Funds" below for details on how to use the hypothetical data.
Compare With Other Funds
Since all mutual funds are required to include the same hypothetical calculations about expenses in shareholder reports, you can use this information to compare the ongoing cost of investing in the Fund with other funds. To do so, compare the hypothetical example with the 5% hypothetical examples that appear in the shareholder reports of other funds. As you compare hypothetical examples of other funds, it is important to note that hypothetical examples are meant to highlight the ongoing costs of investing in a fund only and do not reflect any transaction costs, such as sales charges, or redemption or exchange fees. Therefore, the hypothetical calculations are useful in comparing ongoing costs only, and will not help you determine the relative total costs of owning different funds. If transaction costs were included in these calculations, your costs would be higher.
September 1, 2013 – February 28, 2014
| | | Account Value at the Beginning
of the Period ($) | | Account Value at the End of the
Period ($) | | Expenses Paid During the
Period ($) | | Fund's Annualized
Expense Ratio (%) | |
| | | Actual | | Hypothetical | | Actual | | Hypothetical | | Actual | | Hypothetical | | Actual | |
Class A | | | 1,000.00 | | | | 1,000.00 | | | | 1,167.50 | | | | 1,022.69 | | | | 2.43 | | | | 2.27 | | | | 0.45 | | |
Class I | | | 1,000.00 | | | | 1,000.00 | | | | 1,168.80 | | | | 1,023.93 | | | | 1.08 | | | | 1.01 | | | | 0.20 | | |
Class R5 | | | 1,000.00 | | | | 1,000.00 | | | | 1,169.40 | | | | 1,023.93 | | | | 1.08 | | | | 1.01 | | | | 0.20 | | |
Class Z | | | 1,000.00 | | | | 1,000.00 | | | | 1,168.80 | | | | 1,023.93 | | | | 1.08 | | | | 1.01 | | | | 0.20 | | |
Expenses paid during the period are equal to the annualized expense ratio for each class as indicated above, multiplied by the average account value over the period and then multiplied by the number of days in the Fund's most recent fiscal half year and divided by 365.
Expenses do not include fees and expenses incurred indirectly by the Fund from the underlying funds in which the Fund may invest (also referred to as "acquired funds"), including affiliated and non-affiliated pooled investment vehicles (including mutual funds and exchange-traded funds).
Had Columbia Management Investment Advisers, LLC and/or certain of its affiliates not waived/reimbursed certain fees and expenses, account value at the end of the period would have been reduced.
Annual Report 2014
6
Columbia Mid Cap Index Fund
Portfolio of Investments
February 28, 2014
(Percentages represent value of investments compared to net assets)
Common Stocks 97.4%
Issuer | | Shares | | Value ($) | |
Consumer Discretionary 12.7% | |
Auto Components 0.3% | |
Gentex Corp. | | | 337,733 | | | | 10,594,684 | | |
Automobiles 0.1% | |
Thor Industries, Inc. | | | 104,504 | | | | 5,853,269 | | |
Distributors 0.5% | |
LKQ Corp.(a) | | | 701,357 | | | | 19,560,847 | | |
Diversified Consumer Services 0.9% | |
Apollo Education Group, Inc., Class A(a) | | | 232,900 | | | | 7,762,557 | | |
DeVry Education Group, Inc. | | | 132,798 | | | | 5,578,844 | | |
Matthews International Corp., Class A | | | 63,646 | | | | 2,611,396 | | |
Service Corp. International | | | 494,551 | | | | 9,243,158 | | |
Sotheby's | | | 160,312 | | | | 7,536,267 | | |
Total | | | | | 32,732,222 | | |
Hotels, Restaurants & Leisure 1.6% | |
Bally Technologies, Inc.(a) | | | 90,958 | | | | 6,162,404 | | |
Bob Evans Farms, Inc. | | | 63,629 | | | | 3,292,164 | | |
Brinker International, Inc. | | | 156,359 | | | | 8,599,745 | | |
Cheesecake Factory, Inc. (The) | | | 112,255 | | | | 5,334,358 | | |
Domino's Pizza, Inc. | | | 130,030 | | | | 10,280,172 | | |
International Speedway Corp., Class A | | | 65,059 | | | | 2,194,440 | | |
Life Time Fitness, Inc.(a) | | | 91,539 | | | | 4,320,641 | | |
Panera Bread Co., Class A(a) | | | 62,441 | | | | 11,321,802 | | |
Scientific Games Corp., Class A(a) | | | 113,277 | | | | 1,517,912 | | |
Wendy's Co. (The) | | | 608,008 | | | | 5,824,717 | | |
Total | | | | | 58,848,355 | | |
Household Durables 1.8% | |
Jarden Corp.(a) | | | 279,051 | | | | 17,153,265 | | |
KB Home | | | 193,576 | | | | 3,948,951 | | |
MDC Holdings, Inc. | | | 91,248 | | | | 2,846,025 | | |
NVR, Inc.(a) | | | 9,760 | | | | 11,633,920 | | |
Tempur Sealy International, Inc.(a) | | | 141,114 | | | | 7,319,583 | | |
Toll Brothers, Inc.(a) | | | 370,786 | | | | 14,464,362 | | |
Tupperware Brands Corp. | | | 118,170 | | | | 9,288,162 | | |
Total | | | | | 66,654,268 | | |
Internet & Catalog Retail 0.1% | |
HSN, Inc. | | | 77,729 | | | | 4,457,758 | | |
Common Stocks (continued)
Issuer | | Shares | | Value ($) | |
Leisure Equipment & Products 0.8% | |
Brunswick Corp. | | | 212,230 | | | | 9,505,782 | | |
Polaris Industries, Inc. | | | 150,304 | | | | 20,145,245 | | |
Total | | | | | 29,651,027 | | |
Media 1.2% | |
AMC Networks, Inc., Class A(a) | | | 138,244 | | | | 10,509,309 | | |
Cinemark Holdings, Inc. | | | 242,193 | | | | 7,125,318 | | |
DreamWorks Animation SKG, Inc.,
Class A(a) | | | 166,160 | | | | 4,969,846 | | |
John Wiley & Sons, Inc., Class A | | | 108,054 | | | | 6,270,374 | | |
Lamar Advertising Co., Class A(a) | | | 152,319 | | | | 8,165,821 | | |
Meredith Corp. | | | 86,588 | | | | 4,052,318 | | |
New York Times Co. (The), Class A | | | 293,469 | | | | 4,818,761 | | |
Total | | | | | 45,911,747 | | |
Multiline Retail 0.2% | |
Big Lots, Inc.(a) | | | 136,000 | | | | 4,018,800 | | |
JCPenney Co., Inc.(a) | | | 710,700 | | | | 5,173,896 | | |
Total | | | | | 9,192,696 | | |
Specialty Retail 3.8% | |
Aaron's, Inc. | | | 177,989 | | | | 5,469,602 | | |
Abercrombie & Fitch Co., Class A | | | 178,270 | | | | 7,064,840 | | |
Advance Auto Parts, Inc. | | | 169,935 | | | | 21,642,922 | | |
American Eagle Outfitters, Inc. | | | 395,884 | | | | 5,752,194 | | |
ANN, Inc.(a) | | | 107,138 | | | | 3,819,470 | | |
Ascena Retail Group, Inc.(a) | | | 300,409 | | | | 5,494,481 | | |
Cabela's, Inc.(a) | | | 108,670 | | | | 7,206,994 | | |
Chico's FAS, Inc. | | | 370,458 | | | | 6,123,671 | | |
CST Brands, Inc. | | | 176,360 | | | | 5,736,991 | | |
Dick's Sporting Goods, Inc. | | | 237,730 | | | | 12,758,969 | | |
Foot Locker, Inc. | | | 346,427 | | | | 14,449,470 | | |
Guess?, Inc. | | | 138,678 | | | | 4,207,490 | | |
Murphy USA, Inc.(a) | | | 103,570 | | | | 4,200,799 | | |
Office Depot, Inc.(a) | | | 1,113,542 | | | | 5,489,762 | | |
Rent-A-Center, Inc. | | | 124,907 | | | | 3,140,162 | | |
Signet Jewelers Ltd. | | | 187,205 | | | | 17,887,438 | | |
Williams-Sonoma, Inc. | | | 207,688 | | | | 12,095,749 | | |
Total | | | | | 142,541,004 | | |
The accompanying Notes to Financial Statements are an integral part of this statement.
Annual Report 2014
7
Columbia Mid Cap Index Fund
Portfolio of Investments (continued)
February 28, 2014
Common Stocks (continued)
Issuer | | Shares | | Value ($) | |
Textiles, Apparel & Luxury Goods 1.4% | |
Carter's, Inc. | | | 127,202 | | | | 9,582,127 | | |
Deckers Outdoor Corp.(a) | | | 80,622 | | | | 5,994,246 | | |
Hanesbrands, Inc. | | | 231,280 | | | | 16,948,198 | | |
Under Armour, Inc., Class A(a) | | | 187,350 | | | | 21,198,652 | | |
Total | | | | | 53,723,223 | | |
Total Consumer Discretionary | | | | | 479,721,100 | | |
Consumer Staples 4.0% | |
Food & Staples Retailing 0.3% | |
SUPERVALU, Inc.(a) | | | 460,131 | | | | 2,977,048 | | |
United Natural Foods, Inc.(a) | | | 115,451 | | | | 8,356,343 | | |
Total | | | | | 11,333,391 | | |
Food Products 2.6% | |
Dean Foods Co.(a) | | | 220,225 | | | | 3,257,128 | | |
Flowers Foods, Inc. | | | 408,671 | | | | 8,406,363 | | |
Green Mountain Coffee Roasters, Inc. | | | 305,980 | | | | 33,590,484 | | |
Hain Celestial Group, Inc. (The)(a) | | | 111,500 | | | | 9,956,950 | | |
Hillshire Brands Co. (The) | | | 286,999 | | | | 10,776,812 | | |
Ingredion, Inc. | | | 178,916 | | | | 11,779,829 | | |
Lancaster Colony Corp. | | | 45,165 | | | | 4,073,883 | | |
Post Holdings, Inc.(a) | | | 76,301 | | | | 4,358,313 | | |
Tootsie Roll Industries, Inc. | | | 48,688 | | | | 1,416,824 | | |
WhiteWave Foods Co. (The), Class A(a) | | | 404,600 | | | | 11,450,180 | | |
Total | | | | | 99,066,766 | | |
Household Products 1.0% | |
Church & Dwight Co., Inc. | | | 323,981 | | | | 22,024,228 | | |
Energizer Holdings, Inc. | | | 145,303 | | | | 14,143,794 | | |
Total | | | | | 36,168,022 | | |
Tobacco 0.1% | |
Universal Corp. | | | 54,155 | | | | 3,122,036 | | |
Total Consumer Staples | | | | | 149,690,215 | | |
Energy 5.4% | |
Energy Equipment & Services 2.7% | |
Atwood Oceanics, Inc.(a) | | | 134,555 | | | | 6,376,561 | | |
CARBO Ceramics, Inc. | | | 46,354 | | | | 5,750,214 | | |
Dresser-Rand Group, Inc.(a) | | | 178,036 | | | | 9,672,696 | | |
Dril-Quip, Inc.(a) | | | 94,990 | | | | 10,217,124 | | |
Common Stocks (continued)
Issuer | | Shares | | Value ($) | |
Helix Energy Solutions Group, Inc.(a) | | | 229,548 | | | | 5,426,515 | | |
Oceaneering International, Inc. | | | 252,446 | | | | 18,070,085 | | |
Oil States International, Inc.(a) | | | 128,638 | | | | 12,210,319 | | |
Patterson-UTI Energy, Inc. | | | 336,483 | | | | 9,795,020 | | |
Superior Energy Services, Inc. | | | 372,139 | | | | 11,011,593 | | |
Tidewater, Inc. | | | 115,707 | | | | 5,637,245 | | |
Unit Corp.(a) | | | 101,968 | | | | 6,260,835 | | |
Total | | | | | 100,428,207 | | |
Oil, Gas & Consumable Fuels 2.7% | |
Alpha Natural Resources, Inc.(a) | | | 515,510 | | | | 2,768,289 | | |
Bill Barrett Corp.(a) | | | 114,341 | | | | 2,897,401 | | |
Cimarex Energy Co. | | | 202,660 | | | | 23,449,788 | | |
Energen Corp. | | | 169,595 | | | | 13,642,222 | | |
Gulfport Energy Corp.(a) | | | 196,140 | | | | 12,964,854 | | |
HollyFrontier Corp. | | | 463,580 | | | | 21,125,340 | | |
Rosetta Resources, Inc.(a) | | | 142,902 | | | | 6,340,562 | | |
SM Energy Co. | | | 156,279 | | | | 11,525,576 | | |
World Fuel Services Corp. | | | 168,630 | | | | 7,591,723 | | |
Total | | | | | 102,305,755 | | |
Total Energy | | | | | 202,733,962 | | |
Financials 22.1% | |
Capital Markets 2.3% | |
Affiliated Managers Group, Inc.(a) | | | 123,567 | | | | 23,236,774 | | |
Eaton Vance Corp. | | | 283,102 | | | | 10,712,580 | | |
Federated Investors, Inc., Class B | | | 219,740 | | | | 6,020,876 | | |
Greenhill & Co., Inc. | | | 60,946 | | | | 3,246,593 | | |
Janus Capital Group, Inc. | | | 348,590 | | | | 3,900,722 | | |
Raymond James Financial, Inc. | | | 287,546 | | | | 15,176,678 | | |
SEI Investments Co. | | | 334,385 | | | | 11,225,305 | | |
Waddell & Reed Financial, Inc., Class A | | | 199,286 | | | | 13,890,234 | | |
Total | | | | | 87,409,762 | | |
Commercial Banks 4.4% | |
Associated Banc-Corp. | | | 379,199 | | | | 6,328,831 | | |
BancorpSouth, Inc. | | | 195,470 | | | | 4,677,597 | | |
Bank of Hawaii Corp. | | | 103,836 | | | | 6,069,214 | | |
Cathay General Bancorp | | | 171,515 | | | | 4,358,196 | | |
City National Corp. | | | 110,457 | | | | 8,265,497 | | |
The accompanying Notes to Financial Statements are an integral part of this statement.
Annual Report 2014
8
Columbia Mid Cap Index Fund
Portfolio of Investments (continued)
February 28, 2014
Common Stocks (continued)
Issuer | | Shares | | Value ($) | |
Commerce Bancshares, Inc. | | | 190,089 | | | | 8,489,375 | | |
Cullen/Frost Bankers, Inc. | | | 122,769 | | | | 9,163,478 | | |
East West Bancorp, Inc. | | | 334,347 | | | | 11,932,844 | | |
First Horizon National Corp. | | | 551,440 | | | | 6,600,737 | | |
First Niagara Financial Group, Inc. | | | 825,869 | | | | 7,490,632 | | |
FirstMerit Corp. | | | 385,066 | | | | 7,993,970 | | |
Fulton Financial Corp. | | | 448,975 | | | | 5,526,882 | | |
Hancock Holding Co. | | | 191,531 | | | | 6,600,158 | | |
International Bancshares Corp. | | | 133,232 | | | | 3,088,318 | | |
Prosperity Bancshares, Inc. | | | 132,315 | | | | 8,376,863 | | |
Signature Bank(a) | | | 110,361 | | | | 14,449,566 | | |
SVB Financial Group(a) | | | 106,557 | | | | 13,416,592 | | |
Synovus Financial Corp. | | | 2,268,425 | | | | 7,894,119 | | |
TCF Financial Corp. | | | 384,639 | | | | 6,200,381 | | |
Trustmark Corp. | | | 156,730 | | | | 3,781,895 | | |
Valley National Bancorp | | | 465,771 | | | | 4,694,972 | | |
Webster Financial Corp. | | | 210,745 | | | | 6,526,773 | | |
Westamerica Bancorporation | | | 62,153 | | | | 3,125,053 | | |
Total | | | | | 165,051,943 | | |
Diversified Financial Services 0.6% | |
CBOE Holdings, Inc. | | | 203,458 | | | | 10,992,836 | | |
MSCI, Inc.(a) | | | 276,267 | | | | 12,075,630 | | |
Total | | | | | 23,068,466 | | |
Insurance 4.9% | |
Alleghany Corp.(a) | | | 39,108 | | | | 15,076,134 | | |
American Financial Group, Inc. | | | 166,767 | | | | 9,532,402 | | |
Arthur J Gallagher & Co. | | | 306,878 | | | | 14,177,764 | | |
Aspen Insurance Holdings Ltd. | | | 153,064 | | | | 5,749,084 | | |
Brown & Brown, Inc. | | | 278,203 | | | | 8,373,910 | | |
Everest Re Group Ltd. | | | 111,760 | | | | 16,679,062 | | |
Fidelity National Financial, Inc., Class A | | | 639,848 | | | | 21,153,375 | | |
First American Financial Corp. | | | 246,645 | | | | 6,644,616 | | |
Hanover Insurance Group, Inc. (The) | | | 102,320 | | | | 6,020,509 | | |
HCC Insurance Holdings, Inc. | | | 233,768 | | | | 10,262,415 | | |
Kemper Corp. | | | 119,561 | | | | 4,636,576 | | |
Mercury General Corp. | | | 84,591 | | | | 3,831,972 | | |
Old Republic International Corp. | | | 564,136 | | | | 8,777,956 | | |
Primerica, Inc. | | | 127,895 | | | | 5,732,254 | | |
Common Stocks (continued)
Issuer | | Shares | | Value ($) | |
Protective Life Corp. | | | 183,335 | | | | 9,559,087 | | |
Reinsurance Group of America, Inc. | | | 164,699 | | | | 12,680,176 | | |
RenaissanceRe Holdings Ltd. | | | 103,600 | | | | 9,894,836 | | |
StanCorp Financial Group, Inc. | | | 102,628 | | | | 6,791,921 | | |
WR Berkley Corp. | | | 255,283 | | | | 10,527,871 | | |
Total | | | | | 186,101,920 | | |
Real Estate Investment Trusts (REITs) 8.7% | |
Alexandria Real Estate Equities, Inc. | | | 167,081 | | | | 12,105,018 | | |
American Campus Communities, Inc. | | | 244,443 | | | | 9,029,724 | | |
BioMed Realty Trust, Inc. | | | 448,205 | | | | 9,268,879 | | |
BRE Properties, Inc. | | | 180,088 | | | | 11,124,036 | | |
Camden Property Trust | | | 199,037 | | | | 13,275,768 | | |
Corporate Office Properties Trust | | | 203,881 | | | | 5,437,506 | | |
Corrections Corp. of America | | | 270,325 | | | | 9,015,339 | | |
Duke Realty Corp. | | | 760,169 | | | | 12,770,839 | | |
Equity One, Inc. | | | 147,605 | | | | 3,424,436 | | |
Essex Property Trust, Inc. | | | 88,718 | | | | 14,838,086 | | |
Extra Space Storage, Inc. | | | 256,585 | | | | 12,598,324 | | |
Federal Realty Investment Trust | | | 151,723 | | | | 16,888,287 | | |
Highwoods Properties, Inc. | | | 209,754 | | | | 7,909,823 | | |
Home Properties, Inc. | | | 132,697 | | | | 7,821,161 | | |
Hospitality Properties Trust | | | 346,053 | | | | 9,170,405 | | |
Kilroy Realty Corp. | | | 191,435 | | | | 11,011,341 | | |
Liberty Property Trust | | | 341,981 | | | | 13,084,193 | | |
Mack-Cali Realty Corp. | | | 205,348 | | | | 4,568,993 | | |
Mid-America Apartment Communities, Inc. | | | 174,470 | | | | 11,801,151 | | |
National Retail Properties, Inc. | | | 284,358 | | | | 10,205,609 | | |
Omega Healthcare Investors, Inc. | | | 285,880 | | | | 9,136,725 | | |
Potlatch Corp. | | | 94,517 | | | | 3,746,654 | | |
Rayonier, Inc. | | | 294,615 | | | | 13,873,420 | | |
Realty Income Corp. | | | 480,920 | | | | 21,362,466 | | |
Regency Centers Corp. | | | 215,378 | | | | 10,934,741 | | |
Senior Housing Properties Trust | | | 438,985 | | | | 9,789,366 | | |
SL Green Realty Corp. | | | 221,367 | | | | 21,988,384 | | |
Taubman Centers, Inc. | | | 148,329 | | | | 10,449,778 | | |
UDR, Inc. | | | 585,067 | | | | 15,100,579 | | |
Weingarten Realty Investors | | | 261,757 | | | | 7,983,589 | | |
Total | | | | | 329,714,620 | | |
The accompanying Notes to Financial Statements are an integral part of this statement.
Annual Report 2014
9
Columbia Mid Cap Index Fund
Portfolio of Investments (continued)
February 28, 2014
Common Stocks (continued)
Issuer | | Shares | | Value ($) | |
Real Estate Management & Development 0.5% | |
Alexander & Baldwin, Inc. | | | 99,636 | | | | 4,146,850 | | |
Jones Lang LaSalle, Inc. | | | 103,648 | | | | 12,769,434 | | |
Total | | | | | 16,916,284 | | |
Thrifts & Mortgage Finance 0.7% | |
Astoria Financial Corp. | | | 196,035 | | | | 2,685,680 | | |
New York Community Bancorp, Inc. | | | 1,028,644 | | | | 16,437,731 | | |
Washington Federal, Inc. | | | 237,489 | | | | 5,324,503 | | |
Total | | | | | 24,447,914 | | |
Total Financials | | | | | 832,710,909 | | |
Health Care 9.3% | |
Biotechnology 0.7% | |
Cubist Pharmaceuticals, Inc.(a) | | | 172,840 | | | | 13,744,237 | | |
United Therapeutics Corp.(a) | | | 107,798 | | | | 10,932,873 | | |
Total | | | | | 24,677,110 | | |
Health Care Equipment & Supplies 2.8% | |
Align Technology, Inc.(a) | | | 165,510 | | | | 8,661,138 | | |
Cooper Companies, Inc. (The) | | | 114,252 | | | | 14,648,249 | | |
Hill-Rom Holdings, Inc. | | | 136,864 | | | | 5,177,565 | | |
Hologic, Inc.(a) | | | 637,236 | | | | 13,879,000 | | |
IDEXX Laboratories, Inc.(a) | | | 121,086 | | | | 15,244,727 | | |
Masimo Corp.(a) | | | 120,057 | | | | 3,067,456 | | |
ResMed, Inc. | | | 331,477 | | | | 14,591,618 | | |
Sirona Dental Systems, Inc.(a) | | | 128,000 | | | | 9,018,880 | | |
STERIS Corp. | | | 137,328 | | | | 6,337,687 | | |
Teleflex, Inc. | | | 96,027 | | | | 9,793,794 | | |
Thoratec Corp.(a) | | | 132,890 | | | | 4,935,535 | | |
Total | | | | | 105,355,649 | | |
Health Care Providers & Services 2.9% | |
Community Health Systems, Inc.(a) | | | 264,458 | | | | 10,977,652 | | |
Health Net, Inc.(a) | | | 185,484 | | | | 6,315,730 | | |
Henry Schein, Inc.(a) | | | 200,290 | | | | 23,842,522 | | |
LifePoint Hospitals, Inc.(a) | | | 109,737 | | | | 5,953,232 | | |
Mednax, Inc.(a) | | | 234,652 | | | | 14,271,535 | | |
Omnicare, Inc. | | | 240,227 | | | | 14,149,370 | | |
Owens & Minor, Inc. | | | 147,240 | | | | 5,112,173 | | |
Universal Health Services, Inc., Class B | | | 208,648 | | | | 16,750,261 | | |
Common Stocks (continued)
Issuer | | Shares | | Value ($) | |
VCA Antech, Inc.(a) | | | 207,102 | | | | 6,413,949 | | |
WellCare Health Plans, Inc.(a) | | | 101,966 | | | | 6,303,538 | | |
Total | | | | | 110,089,962 | | |
Health Care Technology 0.3% | |
Allscripts-Misys Healthcare
Solutions, Inc.(a) | | | 370,533 | | | | 6,880,798 | | |
HMS Holdings Corp.(a) | | | 205,921 | | | | 4,213,144 | | |
Total | | | | | 11,093,942 | | |
Life Sciences Tools & Services 1.3% | |
Bio-Rad Laboratories, Inc., Class A(a) | | | 46,901 | | | | 6,083,998 | | |
Charles River Laboratories
International, Inc.(a) | | | 112,258 | | | | 6,669,248 | | |
Covance, Inc.(a) | | | 131,052 | | | | 13,571,745 | | |
Mettler-Toledo International, Inc.(a) | | | 69,241 | | | | 17,016,668 | | |
Techne Corp. | | | 77,421 | | | | 6,878,081 | | |
Total | | | | | 50,219,740 | | |
Pharmaceuticals 1.3% | |
Endo International PLC(a) | | | 319,162 | | | | 25,475,511 | | |
Mallinckrodt PLC(a) | | | 134,650 | | | | 9,114,458 | | |
Salix Pharmaceuticals Ltd.(a) | | | 146,730 | | | | 15,835,102 | | |
Total | | | | | 50,425,071 | | |
Total Health Care | | | | | 351,861,474 | | |
Industrials 16.4% | |
Aerospace & Defense 1.7% | |
Alliant Techsystems, Inc. | | | 74,277 | | | | 10,011,797 | | |
B/E Aerospace, Inc.(a) | | | 229,744 | | | | 19,355,932 | | |
Esterline Technologies Corp.(a) | | | 73,193 | | | | 7,882,886 | | |
Exelis, Inc. | | | 439,315 | | | | 8,975,206 | | |
Huntington Ingalls Industries, Inc. | | | 115,219 | | | | 11,675,141 | | |
Triumph Group, Inc. | | | 121,442 | | | | 7,918,018 | | |
Total | | | | | 65,818,980 | | |
Air Freight & Logistics 0.1% | |
UTi Worldwide, Inc. | | | 212,655 | | | | 2,092,525 | | |
Airlines 0.5% | |
Alaska Air Group, Inc. | | | 162,098 | | | | 14,044,171 | | |
JetBlue Airways Corp.(a) | | | 507,286 | | | | 4,479,335 | | |
Total | | | | | 18,523,506 | | |
The accompanying Notes to Financial Statements are an integral part of this statement.
Annual Report 2014
10
Columbia Mid Cap Index Fund
Portfolio of Investments (continued)
February 28, 2014
Common Stocks (continued)
Issuer | | Shares | | Value ($) | |
Building Products 1.0% | |
AO Smith Corp. | | | 178,810 | | | | 8,886,857 | | |
Fortune Brands Home & Security, Inc. | | | 387,821 | | | | 18,126,754 | | |
Lennox International, Inc. | | | 106,282 | | | | 9,765,190 | | |
Total | | | | | 36,778,801 | | |
Commercial Services & Supplies 1.7% | |
Brink's Co. (The) | | | 112,603 | | | | 3,424,257 | | |
Clean Harbors, Inc.(a) | | | 128,840 | | | | 6,088,978 | | |
Copart, Inc.(a) | | | 260,734 | | | | 9,498,540 | | |
Deluxe Corp. | | | 117,802 | | | | 5,946,645 | | |
Herman Miller, Inc. | | | 137,579 | | | | 3,876,976 | | |
HNI Corp. | | | 105,605 | | | | 3,754,258 | | |
Mine Safety Appliances Co. | | | 73,736 | | | | 3,793,717 | | |
Rollins, Inc. | | | 149,776 | | | | 4,472,311 | | |
RR Donnelley & Sons Co. | | | 461,578 | | | | 8,829,987 | | |
Waste Connections, Inc. | | | 288,224 | | | | 12,471,453 | | |
Total | | | | | 62,157,122 | | |
Construction & Engineering 0.7% | |
AECOM Technology Corp.(a) | | | 229,068 | | | | 7,316,432 | | |
Granite Construction, Inc. | | | 84,322 | | | | 3,099,677 | | |
KBR, Inc. | | | 345,597 | | | | 9,545,389 | | |
URS Corp. | | | 174,721 | | | | 8,124,526 | | |
Total | | | | | 28,086,024 | | |
Electrical Equipment 1.1% | |
Acuity Brands, Inc. | | | 100,202 | | | | 14,133,492 | | |
General Cable Corp. | | | 116,110 | | | | 3,573,866 | | |
Hubbell, Inc., Class B | | | 125,515 | | | | 15,004,063 | | |
Regal-Beloit Corp. | | | 105,184 | | | | 7,751,009 | | |
Total | | | | | 40,462,430 | | |
Industrial Conglomerates 0.3% | |
Carlisle Companies, Inc. | | | 148,444 | | | | 11,774,578 | | |
Machinery 5.4% | |
AGCO Corp. | | | 211,301 | | | | 11,089,076 | | |
CLARCOR, Inc. | | | 116,838 | | | | 6,768,425 | | |
Crane Co. | | | 113,925 | | | | 8,136,524 | | |
Donaldson Co., Inc. | | | 313,925 | | | | 13,448,547 | | |
Graco, Inc. | | | 142,822 | | | | 11,144,401 | | |
Harsco Corp. | | | 188,234 | | | | 4,728,438 | | |
IDEX Corp. | | | 189,263 | | | | 14,207,973 | | |
Common Stocks (continued)
Issuer | | Shares | | Value ($) | |
ITT Corp. | | | 211,662 | | | | 9,291,962 | | |
Kennametal, Inc. | | | 182,996 | | | | 8,004,245 | | |
Lincoln Electric Holdings, Inc. | | | 190,405 | | | | 14,274,663 | | |
Nordson Corp. | | | 140,856 | | | | 10,305,025 | | |
Oshkosh Corp. | | | 201,620 | | | | 11,659,685 | | |
SPX Corp. | | | 105,843 | | | | 11,397,174 | | |
Terex Corp. | | | 259,965 | | | | 11,576,241 | | |
Timken Co. (The) | | | 185,455 | | | | 11,194,064 | | |
Trinity Industries, Inc. | | | 182,243 | | | | 13,086,870 | | |
Valmont Industries, Inc. | | | 62,511 | | | | 9,103,477 | | |
Wabtec Corp. | | | 224,670 | | | | 17,832,058 | | |
Woodward, Inc. | | | 141,377 | | | | 6,162,623 | | |
Total | | | | | 203,411,471 | | |
Marine 0.4% | |
Kirby Corp.(a) | | | 132,418 | | | | 13,852,247 | | |
Matson, Inc. | | | 99,995 | | | | 2,411,880 | | |
Total | | | | | 16,264,127 | | |
Professional Services 1.1% | |
Corporate Executive Board Co. (The) | | | 78,408 | | | | 5,863,350 | | |
FTI Consulting, Inc.(a) | | | 93,803 | | | | 2,738,110 | | |
Manpowergroup, Inc. | | | 184,307 | | | | 14,405,435 | | |
Towers Watson & Co. | | | 150,610 | | | | 16,431,551 | | |
Total | | | | | 39,438,446 | | |
Road & Rail 1.3% | |
Con-way, Inc. | | | 132,703 | | | | 5,061,292 | | |
Genesee & Wyoming, Inc., Class A(a) | | | 118,504 | | | | 11,722,416 | | |
JB Hunt Transport Services, Inc. | | | 214,470 | | | | 15,413,959 | | |
Landstar System, Inc. | | | 106,668 | | | | 6,155,810 | | |
Old Dominion Freight Line, Inc.(a) | | | 162,890 | | | | 8,672,264 | | |
Werner Enterprises, Inc. | | | 106,604 | | | | 2,755,713 | | |
Total | | | | | 49,781,454 | | |
Trading Companies & Distributors 1.1% | |
GATX Corp. | | | 107,768 | | | | 6,993,066 | | |
MSC Industrial Direct Co., Inc., Class A | | | 112,430 | | | | 9,706,082 | | |
United Rentals, Inc.(a) | | | 217,550 | | | | 19,218,367 | | |
Watsco, Inc. | | | 63,193 | | | | 6,216,927 | | |
Total | | | | | 42,134,442 | | |
Total Industrials | | | | | 616,723,906 | | |
The accompanying Notes to Financial Statements are an integral part of this statement.
Annual Report 2014
11
Columbia Mid Cap Index Fund
Portfolio of Investments (continued)
February 28, 2014
Common Stocks (continued)
Issuer | | Shares | | Value ($) | |
Information Technology 15.7% | |
Communications Equipment 1.0% | |
ADTRAN, Inc. | | | 134,626 | | | | 3,527,201 | | |
Ciena Corp.(a) | | | 240,692 | | | | 5,913,803 | | |
InterDigital, Inc. | | | 96,124 | | | | 2,931,782 | | |
JDS Uniphase Corp.(a) | | | 543,260 | | | | 7,486,123 | | |
Plantronics, Inc. | | | 102,129 | | | | 4,532,485 | | |
Polycom, Inc.(a) | | | 333,520 | | | | 4,455,827 | | |
Riverbed Technology, Inc.(a) | | | 377,801 | | | | 8,417,406 | | |
Total | | | | | 37,264,627 | | |
Computers & Peripherals 1.1% | |
3D Systems Corp.(a) | | | 223,030 | | | | 16,941,359 | | |
Diebold, Inc. | | | 148,982 | | | | 5,570,437 | | |
Lexmark International, Inc., Class A | | | 144,900 | | | | 6,106,086 | | |
NCR Corp.(a) | | | 388,250 | | | | 13,219,912 | | |
Total | | | | | 41,837,794 | | |
Electronic Equipment, Instruments & Components 2.5% | |
Arrow Electronics, Inc.(a) | | | 235,006 | | | | 13,308,390 | | |
Avnet, Inc. | | | 320,970 | | | | 13,971,824 | | |
Ingram Micro, Inc., Class A(a) | | | 359,646 | | | | 10,591,575 | | |
Itron, Inc.(a) | | | 91,363 | | | | 3,197,705 | | |
Knowles Corp.(a)(b) | | | 198,780 | | | | 6,390,777 | | |
National Instruments Corp. | | | 227,786 | | | | 6,598,960 | | |
Tech Data Corp.(a) | | | 88,084 | | | | 5,073,638 | | |
Trimble Navigation Ltd.(a) | | | 601,598 | | | | 22,950,964 | | |
Vishay Intertechnology, Inc. | | | 316,118 | | | | 4,469,909 | | |
Zebra Technologies Corp., Class A(a) | | | 117,265 | | | | 8,090,112 | | |
Total | | | | | 94,643,854 | | |
Internet Software & Services 1.2% | |
AOL, Inc.(a) | | | 183,120 | | | | 8,016,994 | | |
Conversant, Inc.(a) | | | 146,395 | | | | 3,639,380 | | |
Equinix, Inc.(a) | | | 116,147 | | | | 22,063,284 | | |
Rackspace Hosting, Inc.(a) | | | 267,486 | | | | 9,835,460 | | |
Total | | | | | 43,555,118 | | |
IT Services 2.9% | |
Acxiom Corp.(a) | | | 175,253 | | | | 6,524,669 | | |
Broadridge Financial Solutions, Inc. | | | 278,052 | | | | 10,499,244 | | |
Convergys Corp. | | | 237,334 | | | | 4,858,227 | | |
CoreLogic, Inc.(a) | | | 218,667 | | | | 7,128,544 | | |
Common Stocks (continued)
Issuer | | Shares | | Value ($) | |
DST Systems, Inc. | | | 68,857 | | | | 6,471,181 | | |
Gartner, Inc.(a) | | | 215,037 | | | | 14,957,974 | | |
Global Payments, Inc. | | | 170,057 | | | | 11,960,109 | | |
Jack Henry & Associates, Inc. | | | 199,668 | | | | 11,606,701 | | |
Leidos Holdings, Inc. | | | 169,922 | | | | 7,588,717 | | |
Mantech International Corp., Class A | | | 55,461 | | | | 1,623,343 | | |
NeuStar, Inc., Class A(a) | | | 146,095 | | | | 5,233,123 | | |
Science Applications International Corp. | | | 97,214 | | | | 3,626,082 | | |
VeriFone Systems, Inc.(a) | | | 254,916 | | | | 7,379,818 | | |
WEX, Inc.(a) | | | 90,737 | | | | 8,785,156 | | |
Total | | | | | 108,242,888 | | |
Semiconductors & Semiconductor Equipment 2.6% | |
Advanced Micro Devices, Inc.(a) | | | 1,435,260 | | | | 5,324,814 | | |
Atmel Corp.(a) | | | 993,664 | | | | 8,008,932 | | |
Cree, Inc.(a) | | | 281,618 | | | | 17,299,794 | | |
Cypress Semiconductor Corp. | | | 324,360 | | | | 3,175,484 | | |
Fairchild Semiconductor
International, Inc.(a) | | | 296,323 | | | | 4,172,228 | | |
Integrated Device Technology, Inc.(a) | | | 321,711 | | | | 3,792,973 | | |
International Rectifier Corp.(a) | | | 165,877 | | | | 4,470,385 | | |
Intersil Corp., Class A | | | 297,876 | | | | 3,788,983 | | |
RF Micro Devices, Inc.(a) | | | 658,799 | | | | 4,664,297 | | |
Semtech Corp.(a) | | | 160,151 | | | | 3,995,767 | | |
Silicon Laboratories, Inc.(a) | | | 92,552 | | | | 4,809,927 | | |
Skyworks Solutions, Inc.(a) | | | 438,004 | | | | 15,531,622 | | |
SunEdison, Inc.(a) | | | 572,291 | | | | 10,507,263 | | |
Teradyne, Inc.(a) | | | 447,060 | | | | 9,066,377 | | |
Total | | | | | 98,608,846 | | |
Software 4.4% | |
ACI Worldwide, Inc.(a) | | | 89,986 | | | | 5,401,860 | | |
Advent Software, Inc. | | | 94,032 | | | | 2,886,782 | | |
ANSYS, Inc.(a) | | | 216,143 | | | | 18,052,263 | | |
Cadence Design Systems, Inc.(a) | | | 671,333 | | | | 10,291,535 | | |
CommVault Systems, Inc.(a) | | | 103,665 | | | | 7,140,445 | | |
Compuware Corp. | | | 505,327 | | | | 5,533,331 | | |
Concur Technologies, Inc.(a) | | | 109,895 | | | | 13,566,538 | | |
Factset Research Systems, Inc. | | | 93,504 | | | | 9,845,036 | | |
Fair Isaac Corp. | | | 80,692 | | | | 4,335,581 | | |
Fortinet, Inc.(a) | | | 319,500 | | | | 7,396,425 | | |
The accompanying Notes to Financial Statements are an integral part of this statement.
Annual Report 2014
12
Columbia Mid Cap Index Fund
Portfolio of Investments (continued)
February 28, 2014
Common Stocks (continued)
Issuer | | Shares | | Value ($) | |
Informatica Corp.(a) | | | 253,164 | | | | 10,521,496 | | |
Mentor Graphics Corp. | | | 227,317 | | | | 4,919,140 | | |
MICROS Systems, Inc.(a) | | | 175,632 | | | | 9,749,332 | | |
PTC, Inc.(a) | | | 278,760 | | | | 10,958,056 | | |
Rovi Corp.(a) | | | 238,417 | | | | 5,922,278 | | |
SolarWinds, Inc.(a) | | | 152,503 | | | | 7,042,589 | | |
Solera Holdings, Inc. | | | 160,650 | | | | 10,991,673 | | |
Synopsys, Inc.(a) | | | 360,246 | | | | 14,553,938 | | |
TIBCO Software, Inc.(a) | | | 357,641 | | | | 7,792,997 | | |
Total | | | | | 166,901,295 | | |
Total Information Technology | | | | | 591,054,422 | | |
Materials 6.9% | |
Chemicals 2.7% | |
Albemarle Corp. | | | 189,909 | | | | 12,532,095 | | |
Ashland, Inc. | | | 168,220 | | | | 15,874,921 | | |
Cabot Corp. | | | 139,109 | | | | 7,531,361 | | |
Cytec Industries, Inc. | | | 82,731 | | | | 7,832,144 | | |
Intrepid Potash, Inc.(a) | | | 129,083 | | | | 1,911,719 | | |
Minerals Technologies, Inc. | | | 80,375 | | | | 4,300,063 | | |
NewMarket Corp. | | | 26,563 | | | | 9,819,544 | | |
Olin Corp. | | | 185,623 | | | | 4,861,466 | | |
RPM International, Inc. | | | 310,201 | | | | 12,985,014 | | |
Scotts Miracle-Gro Co., Class A | | | 102,497 | | | | 5,853,604 | | |
Sensient Technologies Corp. | | | 116,790 | | | | 6,123,300 | | |
Valspar Corp. (The) | | | 188,104 | | | | 14,060,774 | | |
Total | | | | | 103,686,005 | | |
Construction Materials 0.6% | |
Eagle Materials, Inc. | | | 116,500 | | | | 10,298,600 | | |
Martin Marietta Materials, Inc. | | | 107,889 | | | | 13,160,300 | | |
Total | | | | | 23,458,900 | | |
Containers & Packaging 1.7% | |
AptarGroup, Inc. | | | 153,682 | | | | 10,169,138 | | |
Greif, Inc., Class A | | | 71,083 | | | | 3,558,415 | | |
Packaging Corp. of America | | | 228,819 | | | | 16,678,617 | | |
Rock-Tenn Co., Class A | | | 168,112 | | | | 18,764,661 | | |
Silgan Holdings, Inc. | | | 102,085 | | | | 4,921,518 | | |
Sonoco Products Co. | | | 237,876 | | | | 9,986,035 | | |
Total | | | | | 64,078,384 | | |
Common Stocks (continued)
Issuer | | Shares | | Value ($) | |
Metals & Mining 1.5% | |
Carpenter Technology Corp. | | | 123,542 | | | | 7,307,509 | | |
Commercial Metals Co. | | | 273,012 | | | | 5,282,782 | | |
Compass Minerals International, Inc. | | | 78,104 | | | | 6,666,177 | | |
Reliance Steel & Aluminum Co. | | | 180,441 | | | | 12,500,953 | | |
Royal Gold, Inc. | | | 151,885 | | | | 10,436,018 | | |
Steel Dynamics, Inc. | | | 517,959 | | | | 9,033,205 | | |
Worthington Industries, Inc. | | | 123,550 | | | | 4,924,703 | | |
Total | | | | | 56,151,347 | | |
Paper & Forest Products 0.4% | |
Domtar Corp. | | | 75,633 | | | | 8,378,623 | | |
Louisiana-Pacific Corp.(a) | | | 329,277 | | | | 6,187,115 | | |
Total | | | | | 14,565,738 | | |
Total Materials | | | | | 261,940,374 | | |
Telecommunication Services 0.4% | |
Diversified Telecommunication Services 0.3% | |
tw telecom, Inc.(a) | | | 336,111 | | | | 10,288,358 | | |
Wireless Telecommunication Services 0.1% | |
Telephone & Data Systems, Inc. | | | 230,305 | | | | 5,248,651 | | |
Total Telecommunication Services | | | | | 15,537,009 | | |
Utilities 4.5% | |
Electric Utilities 1.6% | |
Cleco Corp. | | | 141,039 | | | | 6,971,558 | | |
Great Plains Energy, Inc. | | | 358,236 | | | | 9,410,860 | | |
Hawaiian Electric Industries, Inc. | | | 232,416 | | | | 5,905,690 | | |
IDACORP, Inc. | | | 117,189 | | | | 6,584,850 | | |
OGE Energy Corp. | | | 462,988 | | | | 16,667,568 | | |
PNM Resources, Inc. | | | 185,820 | | | | 4,859,193 | | |
Westar Energy, Inc. | | | 296,661 | | | | 10,151,739 | | |
Total | | | | | 60,551,458 | | |
Gas Utilities 1.5% | |
Atmos Energy Corp. | | | 230,747 | | | | 10,637,437 | | |
National Fuel Gas Co. | | | 195,245 | | | | 14,666,804 | | |
ONE Gas, Inc.(a) | | | 120,300 | | | | 4,087,794 | | |
Questar Corp. | | | 408,462 | | | | 9,700,972 | | |
UGI Corp. | | | 266,224 | | | | 11,897,551 | | |
WGL Holdings, Inc. | | | 120,735 | | | | 4,852,340 | | |
Total | | | | | 55,842,898 | | |
The accompanying Notes to Financial Statements are an integral part of this statement.
Annual Report 2014
13
Columbia Mid Cap Index Fund
Portfolio of Investments (continued)
February 28, 2014
Common Stocks (continued)
Issuer | | Shares | | Value ($) | |
Multi-Utilities 1.1% | |
Alliant Energy Corp. | | | 258,818 | | | | 14,038,288 | | |
Black Hills Corp. | | | 103,752 | | | | 5,883,776 | | |
MDU Resources Group, Inc. | | | 440,606 | | | | 14,962,980 | | |
Vectren Corp. | | | 192,210 | | | | 7,394,319 | | |
Total | | | | | 42,279,363 | | |
Water Utilities 0.3% | |
Aqua America, Inc. | | | 412,308 | | | | 10,386,038 | | |
Total Utilities | | | | | 169,059,757 | | |
Total Common Stocks
(Cost: $2,323,060,897) | | | | | 3,671,033,128 | | |
Money Market Funds 2.2%
| | | Shares | | Value ($) | |
Columbia Short-Term Cash Fund,
0.098%(c)(d) | | | 84,086,540 | | | | 84,086,540 | | |
Total Money Market Funds
(Cost: $84,086,540) | | | | | 84,086,540 | | |
Total Investments
(Cost: $2,407,147,437) | | | | | 3,755,119,668 | | |
Other Assets & Liabilities, Net | | | | | 16,447,563 | | |
Net Assets | | | | | 3,771,567,231 | | |
Investments in Derivatives
Futures Contracts Outstanding at February 28, 2014
At February 28, 2014, cash totaling $4,168,750 was pledged as collateral to cover initial margin requirements on open futures contracts.
Contract Description | | Number of
Contracts
Long (Short) | | Trading
Currency | | Notional
Market
Value ($) | | Expiration
Date | | Unrealized
Appreciation ($) | | Unrealized
Depreciation ($) | |
S&P MID 400 EMINI | | | 724 | | | USD | | | | | 99,492,080 | | | 03/2014 | | | 5,050,784 | | | | — | | |
Notes to Portfolio of Investments
(a) Non-income producing.
(b) Represents a security purchased on a when-issued or delayed delivery basis.
(c) The rate shown is the seven-day current annualized yield at February 28, 2014.
(d) As defined in the Investment Company Act of 1940, an affiliated company is one in which the Fund owns 5% or more of its outstanding voting securities, or a company which is under common ownership or control with the Fund. Holdings and transactions in these affiliated companies during the year ended February 28, 2014, are as follows:
Issuer | | Beginning
Cost ($) | | Purchase
Cost ($) | | Proceeds
From Sales ($) | | Ending
Cost ($) | | Dividends —
Affiliated
Issuers ($) | | Value ($) | |
Columbia Short-Term Cash Fund | | | 115,637,033 | | | | 990,149,720 | | | | (1,021,700,213 | ) | | | 84,086,540 | | | | 102,799 | | | | 84,086,540 | | |
Currency Legend
USD US Dollar
The accompanying Notes to Financial Statements are an integral part of this statement.
Annual Report 2014
14
Columbia Mid Cap Index Fund
Portfolio of Investments (continued)
February 28, 2014
Fair Value Measurements
Generally accepted accounting principles (GAAP) require disclosure regarding the inputs and valuation techniques used to measure fair value and any changes in valuation inputs or techniques. In addition, investments shall be disclosed by major category.
The Fund categorizes its fair value measurements according to a three-level hierarchy that maximizes the use of observable inputs and minimizes the use of unobservable inputs by prioritizing that the most observable input be used when available. Observable inputs are those that market participants would use in pricing an investment based on market data obtained from sources independent of the reporting entity. Unobservable inputs are those that reflect the Fund's assumptions about the information market participants would use in pricing an investment. An investment's level within the fair value hierarchy is based on the lowest level of any input that is deemed significant to the asset or liability's fair value measurement. The input levels are not necessarily an indication of the risk or liquidity associated with investments at that level. For example, certain U.S. government securities are generally high quality and liquid, however, they are reflected as Level 2 because the inputs used to determine fair value may not always be quoted prices in an active market.
Fair value inputs are summarized in the three broad levels listed below:
> Level 1 — Valuations based on quoted prices for investments in active markets that the Fund has the ability to access at the measurement date (including NAV for open-end mutual funds). Valuation adjustments are not applied to Level 1 investments.
> Level 2 — Valuations based on other significant observable inputs (including quoted prices for similar securities, interest rates, prepayment speeds, credit risks, etc.).
> Level 3 — Valuations based on significant unobservable inputs (including the Fund's own assumptions and judgment in determining the fair value of investments).
Inputs that are used in determining fair value of an investment may include price information, credit data, volatility statistics, and other factors. These inputs can be either observable or unobservable. The availability of observable inputs can vary between investments, and is affected by various factors such as the type of investment, and the volume and level of activity for that investment or similar investments in the marketplace. The inputs will be considered by the Investment Manager, along with any other relevant factors in the calculation of an investment's fair value. The Fund uses prices and inputs that are current as of the measurement date, which may include periods of market dislocations. During these periods, the availability of prices and inputs may be reduced for many investments. This condition could cause an investment to be reclassified between the various levels within the hierarchy.
Investments falling into the Level 3 category are primarily supported by quoted prices from brokers and dealers participating in the market for those investments. However, these may be classified as Level 3 investments due to lack of market transparency and corroboration to support these quoted prices. Additionally, valuation models may be used as the pricing source for any remaining investments classified as Level 3. These models may rely on one or more significant unobservable inputs and/or significant assumptions by the Investment Manager. Inputs used in valuations may include, but are not limited to, financial statement analysis, capital account balances, discount rates and estimated cash flows, and comparable company data.
Under the direction of the Fund's Board of Trustees (the Board), the Investment Manager's Valuation Committee (the Committee) is responsible for overseeing the valuation procedures approved by the Board. The Committee consists of voting and non-voting members from various groups within the Investment Manager's organization, including operations and accounting, trading and investments, compliance, risk management and legal.
The Committee meets at least monthly to review and approve valuation matters, which may include a description of specific valuation determinations, data regarding pricing information received from approved pricing vendors and brokers and the results of Board-approved valuation control policies and procedures (the Policies). The Policies address, among other things, instances when market quotations are or are not readily available, including recommendations of third party pricing vendors and a determination of appropriate pricing methodologies; events that require specific valuation determinations and assessment of fair value techniques; securities with a potential for stale pricing, including those that are illiquid, restricted, or in default; and the effectiveness of third party pricing vendors, including periodic reviews of vendors. The Committee meets more frequently, as needed, to discuss additional valuation matters, which may include the need to review back-testing results, review time-sensitive information or approve related valuation actions. The Committee reports to the Board, with members of the Committee meeting with the Board at each of its regularly scheduled meetings to discuss valuation matters and actions during the period, similar to those described earlier.
For investments categorized as Level 3, the Committee monitors information similar to that described above, which may include: (i) data specific to the issuer or comparable issuers, (ii) general market or specific sector news and (iii) quoted prices and specific or similar security transactions. The Committee considers this data and any changes from prior periods in order to assess the reasonableness of observable and unobservable inputs, any assumptions or internal models used to value those securities and changes in fair value. This data is also used to corroborate, when available, information received from approved pricing vendors and brokers. Various factors impact the frequency of monitoring this information (which may occur as often as daily). However, the Committee may determine that changes to inputs, assumptions and models are not required as a result of the monitoring procedures performed.
The accompanying Notes to Financial Statements are an integral part of this statement.
Annual Report 2014
15
Columbia Mid Cap Index Fund
Portfolio of Investments (continued)
February 28, 2014
Fair Value Measurements (continued)
The following table is a summary of the inputs used to value the Fund's investments at February 28, 2014:
Description | | Level 1
Quoted Prices in Active
Markets for Identical
Assets ($) | | Level 2
Other Significant
Observable Inputs ($) | | Level 3
Significant
Unobservable Inputs ($) | | Total ($) | |
Equity Securities | |
Common Stocks | |
Consumer Discretionary | | | 479,721,100 | | | | — | | | | — | | | | 479,721,100 | | |
Consumer Staples | | | 149,690,215 | | | | — | | | | — | | | | 149,690,215 | | |
Energy | | | 202,733,962 | | | | — | | | | — | | | | 202,733,962 | | |
Financials | | | 832,710,909 | | | | — | | | | — | | | | 832,710,909 | | |
Health Care | | | 351,861,474 | | | | — | | | | — | | | | 351,861,474 | | |
Industrials | | | 616,723,906 | | | | — | | | | — | | | | 616,723,906 | | |
Information Technology | | | 591,054,422 | | | | — | | | | — | | | | 591,054,422 | | |
Materials | | | 261,940,374 | | | | — | | | | — | | | | 261,940,374 | | |
Telecommunication Services | | | 15,537,009 | | | | — | | | | — | | | | 15,537,009 | | |
Utilities | | | 169,059,757 | | | | — | | | | — | | | | 169,059,757 | | |
Total Equity Securities | | | 3,671,033,128 | | | | — | | | | — | | | | 3,671,033,128 | | |
Mutual Funds | |
Money Market Funds | | | 84,086,540 | | | | — | | | | — | | | | 84,086,540 | | |
Total Mutual Funds | | | 84,086,540 | | | | — | | | | — | | | | 84,086,540 | | |
Investments in Securities | | | 3,755,119,668 | | | | — | | | | — | | | | 3,755,119,668 | | |
Derivatives | |
Assets | |
Futures Contracts | | | 5,050,784 | | | | — | | | | — | | | | 5,050,784 | | |
Total | | | 3,760,170,452 | | | | — | | | | — | | | | 3,760,170,452 | | |
See the Portfolio of Investments for all investment classifications not indicated in the table.
There were no transfers of financial assets between levels during the period.
Derivative instruments are valued at unrealized appreciation (depreciation).
The accompanying Notes to Financial Statements are an integral part of this statement.
Annual Report 2014
16
Columbia Mid Cap Index Fund
Statement of Assets and Liabilities
February 28, 2014
Assets | |
Investments, at value | |
Unaffiliated issuers (identified cost $2,323,060,897) | | $ | 3,671,033,128 | | |
Affiliated issuers (identified cost $84,086,540) | | | 84,086,540 | | |
Total investments (identified cost $2,407,147,437) | | | 3,755,119,668 | | |
Margin deposits | | | 4,168,750 | | |
Receivable for: | |
Investments sold | | | 4,492,393 | | |
Capital shares sold | | | 19,341,940 | | |
Dividends | | | 4,483,697 | | |
Variation margin | | | 137,336 | | |
Expense reimbursement due from Investment Manager | | | 20,218 | | |
Prepaid expenses | | | 4,204 | | |
Total assets | | | 3,787,768,206 | | |
Liabilities | |
Payable for: | |
Investments purchased | | | 4,089,926 | | |
Investments purchased on a delayed delivery basis | | | 6,390,280 | | |
Capital shares purchased | | | 4,605,238 | | |
Investment management fees | | | 10,259 | | |
Distribution and/or service fees | | | 6,528 | | |
Transfer agent fees | | | 852,714 | | |
Administration fees | | | 10,259 | | |
Compensation of board members | | | 121,617 | | |
Other expenses | | | 114,154 | | |
Total liabilities | | | 16,200,975 | | |
Net assets applicable to outstanding capital stock | | $ | 3,771,567,231 | | |
Represented by | |
Paid-in capital | | $ | 2,380,402,183 | | |
Undistributed net investment income | | | 4,374,005 | | |
Accumulated net realized gain | | | 33,768,028 | | |
Unrealized appreciation (depreciation) on: | |
Investments | | | 1,347,972,231 | | |
Futures contracts | | | 5,050,784 | | |
Total — representing net assets applicable to outstanding capital stock | | $ | 3,771,567,231 | | |
The accompanying Notes to Financial Statements are an integral part of this statement.
Annual Report 2014
17
Columbia Mid Cap Index Fund
Statement of Assets and Liabilities (continued)
February 28, 2014
Class A | |
Net assets | | $ | 970,804,868 | | |
Shares outstanding | | | 62,684,059 | | |
Net asset value per share | | $ | 15.49 | | |
Class I | |
Net assets | | $ | 3,785 | | |
Shares outstanding | | | 245 | | |
Net asset value per share(a) | | $ | 15.43 | | |
Class R5 | |
Net assets | | $ | 504,849,726 | | |
Shares outstanding | | | 32,241,149 | | |
Net asset value per share | | $ | 15.66 | | |
Class Z | |
Net assets | | $ | 2,295,908,852 | | |
Shares outstanding | | | 148,760,638 | | |
Net asset value per share | | $ | 15.43 | | |
(a) Net asset value per share rounds to this amount due to fractional shares outstanding.
The accompanying Notes to Financial Statements are an integral part of this statement.
Annual Report 2014
18
Columbia Mid Cap Index Fund
Statement of Operations
Year Ended February 28, 2014
Net investment income | |
Income: | |
Dividends — unaffiliated issuers | | $ | 45,007,694 | | |
Dividends — affiliated issuers | | | 102,799 | | |
Total income | | | 45,110,493 | | |
Expenses: | |
Investment management fees | | | 3,214,924 | | |
Distribution and/or service fees | |
Class A | | | 1,934,445 | | |
Transfer agent fees | |
Class A | | | 1,496,763 | | |
Class R5 | | | 148,207 | | |
Class Z | | | 4,141,767 | | |
Administration fees | | | 3,214,924 | | |
Compensation of board members | | | 77,572 | | |
Custodian fees | | | 33,585 | | |
Printing and postage fees | | | 169,665 | | |
Registration fees | | | 66,894 | | |
Licensing fees | | | 21,070 | | |
Professional fees | | | 57,956 | | |
Other | | | 124,474 | | |
Total expenses | | | 14,702,246 | | |
Fees waived or expenses reimbursed by Investment Manager and its affiliates | | | (6,337,793 | ) | |
Expense reductions | | | (160 | ) | |
Total net expenses | | | 8,364,293 | | |
Net investment income | | | 36,746,200 | | |
Realized and unrealized gain (loss) — net | |
Net realized gain (loss) on: | |
Investments | | | 135,718,863 | | |
Futures contracts | | | 20,702,331 | | |
Net realized gain | | | 156,421,194 | | |
Net change in unrealized appreciation (depreciation) on: | |
Investments | | | 556,823,471 | | |
Futures contracts | | | (124,347 | ) | |
Net change in unrealized appreciation (depreciation) | | | 556,699,124 | | |
Net realized and unrealized gain | | | 713,120,318 | | |
Net increase in net assets resulting from operations | | $ | 749,866,518 | | |
The accompanying Notes to Financial Statements are an integral part of this statement.
Annual Report 2014
19
Columbia Mid Cap Index Fund
Statement of Changes in Net Assets
| | | Year Ended
February 28,
2014 | | Year Ended
February 28,
2013(a) | |
Operations | |
Net investment income | | $ | 36,746,200 | | | $ | 32,733,982 | | |
Net realized gain | | | 156,421,194 | | | | 50,742,834 | | |
Net change in unrealized appreciation (depreciation) | | | 556,699,124 | | | | 176,819,150 | | |
Net increase in net assets resulting from operations | | | 749,866,518 | | | | 260,295,966 | | |
Distributions to shareholders | |
Net investment income | |
Class A | | | (6,693,234 | ) | | | (6,065,718 | ) | |
Class I | | | (38 | ) | | | (44 | ) | |
Class R5 | | | (4,651,402 | ) | | | (36 | ) | |
Class Z | | | (21,708,037 | ) | | | (26,090,852 | ) | |
Net realized gains | |
Class A | | | (27,529,261 | ) | | | (22,364,190 | ) | |
Class I | | | (122 | ) | | | (133 | ) | |
Class R5 | | | (12,560,033 | ) | | | (71 | ) | |
Class Z | | | (71,839,464 | ) | | | (80,303,779 | ) | |
Total distributions to shareholders | | | (144,981,591 | ) | | | (134,824,823 | ) | |
Increase (decrease) in net assets from capital stock activity | | | 559,531,734 | | | | (506,077,072 | ) | |
Total increase (decrease) in net assets | | | 1,164,416,661 | | | | (380,605,929 | ) | |
Net assets at beginning of year | | | 2,607,150,570 | | | | 2,987,756,499 | | |
Net assets at end of year | | $ | 3,771,567,231 | | | $ | 2,607,150,570 | | |
Undistributed net investment income | | $ | 4,374,005 | | | $ | 1,657,924 | | |
(a) Class R5 shares are for the period from November 8, 2012 (commencement of operations) to February 28, 2013.
The accompanying Notes to Financial Statements are an integral part of this statement.
Annual Report 2014
20
Columbia Mid Cap Index Fund
Statement of Changes in Net Assets (continued)
| | | Year Ended February 28, 2014 | | Year Ended February 28, 2013(a) | |
| | | Shares | | Dollars ($) | | Shares | | Dollars ($) | |
Capital stock activity | |
Class A shares | |
Subscriptions | | | 32,504,952 | | | | 462,759,080 | | | | 22,853,756 | | | | 272,819,581 | | |
Distributions reinvested | | | 2,225,447 | | | | 31,996,628 | | | | 2,376,962 | | | | 27,417,562 | | |
Redemptions | | | (18,254,055 | ) | | | (259,317,650 | ) | | | (18,508,967 | ) | | | (220,888,204 | ) | |
Net increase | | | 16,476,344 | | | | 235,438,058 | | | | 6,721,751 | | | | 79,348,939 | | |
Class R5 shares | |
Subscriptions | | | 37,420,766 | | | | 523,232,848 | | | | 212 | | | | 2,500 | | |
Distributions reinvested | | | 1,151,063 | | | | 17,031,261 | | | | — | | | | — | | |
Redemptions | | | (6,330,892 | ) | | | (93,569,039 | ) | | | — | | | | — | | |
Net increase | | | 32,240,937 | | | | 446,695,070 | | | | 212 | | | | 2,500 | | |
Class Z shares | |
Subscriptions | | | 42,311,877 | | | | 599,526,779 | | | | 59,274,784 | | | | 705,258,535 | | |
Distributions reinvested | | | 4,062,613 | | | | 57,960,240 | | | | 5,520,124 | | | | 63,483,810 | | |
Redemptions | | | (55,297,746 | ) | | | (780,088,413 | ) | | | (119,041,735 | ) | | | (1,354,170,856 | ) | |
Net decrease | | | (8,923,256 | ) | | | (122,601,394 | ) | | | (54,246,827 | ) | | | (585,428,511 | ) | |
Total net increase (decrease) | | | 39,794,025 | | | | 559,531,734 | | | | (47,524,864 | ) | | | (506,077,072 | ) | |
(a) Class R5 shares are for the period from November 8, 2012 (commencement of operations) to February 28, 2013.
The accompanying Notes to Financial Statements are an integral part of this statement.
Annual Report 2014
21
Columbia Mid Cap Index Fund
The following tables are intended to help you understand the Fund's financial performance. Certain information reflects financial results for a single share of a class held for the periods shown. Per share net investment income (loss) amounts are calculated based on average shares outstanding during the period. Total return assumes reinvestment of all dividends and distributions, if any. Total return does not reflect payment of sales charges, if any, and is not annualized for periods of less than one year.
| | | | | Year Ended | | | |
| | | Year Ended February 28, | | February 29, | | Year Ended February 28, | |
Class A | | 2014 | | 2013 | | 2012 | | 2011 | | 2010 | |
Per share data | |
Net asset value, beginning of period | | $ | 12.82 | | | $ | 11.92 | | | $ | 12.33 | | | $ | 9.44 | | | $ | 5.73 | | |
Income from investment operations: | |
Net investment income | | | 0.14 | | | | 0.14 | | | | 0.10 | | | | 0.09 | | | | 0.09 | | |
Net realized and unrealized gain | | | 3.14 | | | | 1.45 | | | | 0.10 | | | | 2.94 | | | | 3.71 | | |
Total from investment operations | | | 3.28 | | | | 1.59 | | | | 0.20 | | | | 3.03 | | | | 3.80 | | |
Less distributions to shareholders: | |
Net investment income | | | (0.11 | ) | | | (0.15 | ) | | | (0.09 | ) | | | (0.09 | ) | | | (0.09 | ) | |
Net realized gains | | | (0.50 | ) | | | (0.54 | ) | | | (0.52 | ) | | | (0.05 | ) | | | — | | |
Total distributions to shareholders | | | (0.61 | ) | | | (0.69 | ) | | | (0.61 | ) | | | (0.14 | ) | | | (0.09 | ) | |
Net asset value, end of period | | $ | 15.49 | | | $ | 12.82 | | | $ | 11.92 | | | $ | 12.33 | | | $ | 9.44 | | |
Total return | | | 26.04 | % | | | 14.03 | % | | | 2.12 | % | | | 32.16 | % | | | 66.35 | % | |
Ratios to average net assets(a) | |
Total gross expenses | | | 0.66 | % | | | 0.66 | % | | | 0.66 | % | | | 0.50 | % | | | 0.49 | % | |
Total net expenses(b) | | | 0.45 | %(c) | | | 0.45 | %(c) | | | 0.45 | %(c) | | | 0.45 | %(c) | | | 0.43 | %(c) | |
Net investment income | | | 0.95 | % | | | 1.18 | % | | | 0.83 | % | | | 0.83 | % | | | 1.10 | % | |
Supplemental data | |
Net assets, end of period (in thousands) | | $ | 970,805 | | | $ | 592,450 | | | $ | 470,550 | | | $ | 339,724 | | | $ | 168,264 | | |
Portfolio turnover | | | 14 | % | | | 20 | % | | | 15 | % | | | 10 | % | | | 15 | % | |
Notes to Financial Highlights
(a) In addition to the fees and expenses which the Fund bears directly, the Fund indirectly bears a pro rata share of the fees and expenses of the acquired funds in which it invests. Such indirect expenses are not included in the reported expense ratios.
(b) Total net expenses include the impact of certain waivers/reimbursements made by the Investment Manager and certain of its affiliates, if applicable.
(c) The benefits derived from expense reductions had an impact of less than 0.01%.
The accompanying Notes to Financial Statements are an integral part of this statement.
Annual Report 2014
22
Columbia Mid Cap Index Fund
Financial Highlights (continued)
| | | | | Year Ended | | Year Ended | |
| | | Year Ended February 28, | | February 29, | | February 28, | |
Class I | | 2014 | | 2013 | | 2012 | | 2011(a) | |
Per share data | |
Net asset value, beginning of period | | $ | 12.77 | | | $ | 11.88 | | | $ | 12.29 | | | $ | 10.19 | | |
Income from investment operations: | |
Net investment income | | | 0.17 | | | | 0.17 | | | | 0.12 | | | | 0.04 | | |
Net realized and unrealized gain | | | 3.14 | | | | 1.44 | | | | 0.11 | | | | 2.22 | | |
Total from investment operations | | | 3.31 | | | | 1.61 | | | | 0.23 | | | | 2.26 | | |
Less distributions to shareholders: | |
Net investment income | | | (0.15 | ) | | | (0.18 | ) | | | (0.12 | ) | | | (0.11 | ) | |
Net realized gains | | | (0.50 | ) | | | (0.54 | ) | | | (0.52 | ) | | | (0.05 | ) | |
Total distributions to shareholders | | | (0.65 | ) | | | (0.72 | ) | | | (0.64 | ) | | | (0.16 | ) | |
Net asset value, end of period | | $ | 15.43 | | | $ | 12.77 | | | $ | 11.88 | | | $ | 12.29 | | |
Total return | | | 26.36 | % | | | 14.34 | % | | | 2.40 | % | | | 22.27 | % | |
Ratios to average net assets(b) | |
Total gross expenses | | | 0.21 | % | | | 0.24 | % | | | 0.20 | % | | | 0.23 | %(c) | |
Total net expenses(d) | | | 0.20 | % | | | 0.15 | % | | | 0.19 | % | | | 0.19 | %(c)(e) | |
Net investment income | | | 1.21 | % | | | 1.48 | % | | | 1.08 | % | | | 0.92 | %(c) | |
Supplemental data | |
Net assets, end of period (in thousands) | | $ | 4 | | | $ | 3 | | | $ | 3 | | | $ | 3 | | |
Portfolio turnover | | | 14 | % | | | 20 | % | | | 15 | % | | | 10 | % | |
Notes to Financial Highlights
(a) For the period from September 27, 2010 (commencement of operations) to February 28, 2011.
(b) In addition to the fees and expenses which the Fund bears directly, the Fund indirectly bears a pro rata share of the fees and expenses of the acquired funds in which it invests. Such indirect expenses are not included in the reported expense ratios.
(c) Annualized.
(d) Total net expenses include the impact of certain waivers/reimbursements made by the Investment Manager and certain of its affiliates, if applicable.
(e) The benefits derived from expense reductions had an impact of less than 0.01%.
The accompanying Notes to Financial Statements are an integral part of this statement.
Annual Report 2014
23
Columbia Mid Cap Index Fund
Financial Highlights (continued)
| | | Year Ended February 28, | |
Class R5 | | 2014 | | 2013(a) | |
Per share data | |
Net asset value, beginning of period | | $ | 12.95 | | | $ | 11.81 | | |
Income from investment operations: | |
Net investment income | | | 0.17 | | | | 0.07 | | |
Net realized and unrealized gain | | | 3.19 | | | | 1.57 | | |
Total from investment operations | | | 3.36 | | | | 1.64 | | |
Less distributions to shareholders: | |
Net investment income | | | (0.15 | ) | | | (0.16 | ) | |
Net realized gains | | | (0.50 | ) | | | (0.34 | ) | |
Total distributions to shareholders | | | (0.65 | ) | | | (0.50 | ) | |
Net asset value, end of period | | $ | 15.66 | | | $ | 12.95 | | |
Total return | | | 26.38 | % | | | 14.34 | % | |
Ratios to average net assets(b) | |
Total gross expenses | | | 0.27 | % | | | 0.21 | %(c) | |
Total net expenses(d) | | | 0.20 | % | | | 0.16 | %(c) | |
Net investment income | | | 1.16 | % | | | 1.82 | %(c) | |
Supplemental data | |
Net assets, end of period (in thousands) | | $ | 504,850 | | | $ | 3 | | |
Portfolio turnover | | | 14 | % | | | 20 | % | |
Notes to Financial Highlights
(a) For the period from November 8, 2012 (commencement of operations) to February 28, 2013.
(b) In addition to the fees and expenses which the Fund bears directly, the Fund indirectly bears a pro rata share of the fees and expenses of the acquired funds in which it invests. Such indirect expenses are not included in the reported expense ratios.
(c) Annualized.
(d) Total net expenses include the impact of certain waivers/reimbursements made by the Investment Manager and certain of its affiliates, if applicable.
The accompanying Notes to Financial Statements are an integral part of this statement.
Annual Report 2014
24
Columbia Mid Cap Index Fund
Financial Highlights (continued)
| | | | | Year Ended | | | |
| | | Year Ended February 28, | | February 29, | | Year Ended February 28, | |
Class Z | | 2014 | | 2013 | | 2012 | | 2011 | | 2010 | |
Per share data | |
Net asset value, beginning of period | | $ | 12.78 | | | $ | 11.88 | | | $ | 12.29 | | | $ | 9.41 | | | $ | 5.71 | | |
Income from investment operations: | |
Net investment income | | | 0.17 | | | | 0.16 | | | | 0.12 | | | | 0.11 | | | | 0.11 | | |
Net realized and unrealized gain | | | 3.13 | | | | 1.45 | | | | 0.11 | | | | 2.93 | | | | 3.69 | | |
Total from investment operations | | | 3.30 | | | | 1.61 | | | | 0.23 | | | | 3.04 | | | | 3.80 | | |
Less distributions to shareholders: | |
Net investment income | | | (0.15 | ) | | | (0.17 | ) | | | (0.12 | ) | | | (0.11 | ) | | | (0.10 | ) | |
Net realized gains | | | (0.50 | ) | | | (0.54 | ) | | | (0.52 | ) | | | (0.05 | ) | | | — | | |
Total distributions to shareholders | | | (0.65 | ) | | | (0.71 | ) | | | (0.64 | ) | | | (0.16 | ) | | | (0.10 | ) | |
Net asset value, end of period | | $ | 15.43 | | | $ | 12.78 | | | $ | 11.88 | | | $ | 12.29 | | | $ | 9.41 | | |
Total return | | | 26.25 | % | | | 14.35 | % | | | 2.39 | % | | | 32.45 | % | | | 66.71 | % | |
Ratios to average net assets(a) | |
Total gross expenses | | | 0.41 | % | | | 0.41 | % | | | 0.41 | % | | | 0.25 | % | | | 0.24 | % | |
Total net expenses(b) | | | 0.20 | %(c) | | | 0.20 | %(c) | | | 0.20 | %(c) | | | 0.20 | %(c) | | | 0.18 | %(c) | |
Net investment income | | | 1.21 | % | | | 1.39 | % | | | 1.07 | % | | | 1.08 | % | | | 1.36 | % | |
Supplemental data | |
Net assets, end of period (in thousands) | | $ | 2,295,909 | | | $ | 2,014,694 | | | $ | 2,517,203 | | | $ | 2,479,455 | | | $ | 1,791,140 | | |
Portfolio turnover | | | 14 | % | | | 20 | % | | | 15 | % | | | 10 | % | | | 15 | % | |
Notes to Financial Highlights
(a) In addition to the fees and expenses which the Fund bears directly, the Fund indirectly bears a pro rata share of the fees and expenses of the acquired funds in which it invests. Such indirect expenses are not included in the reported expense ratios.
(b) Total net expenses include the impact of certain waivers/reimbursements made by the Investment Manager and certain of its affiliates, if applicable.
(c) The benefits derived from expense reductions had an impact of less than 0.01%.
The accompanying Notes to Financial Statements are an integral part of this statement.
Annual Report 2014
25
Columbia Mid Cap Index Fund
Notes to Financial Statements
February 28, 2014
Note 1. Organization
Columbia Mid Cap Index Fund (the Fund), a series of Columbia Funds Series Trust (the Trust), is a diversified fund. The Trust is registered under the Investment Company Act of 1940, as amended (the 1940 Act), as an open-end management investment company organized as a Delaware statutory trust.
Fund Shares
The Trust may issue an unlimited number of shares (without par value). The Fund offers Class A, Class I, Class R5 and Class Z shares. Although all share classes generally have identical voting, dividend and liquidation rights, each share class votes separately when required by law. Different share classes pay different distribution amounts to the extent the expenses of such share classes differ, and distributions in liquidation will be proportional to the net asset value of each share class. Each share class has its own expense structure and sales charges, as applicable.
Class A shares have no sales charge.
Class I shares are not subject to sales charges and are available only to the Columbia Family of Funds.
Class R5 shares are not subject to sales charges and are generally available only to investors purchasing through authorized investment professionals and omnibus retirement plans.
Class Z shares are not subject to sales charges and are available only to certain eligible investors, which are subject to different investment minimums.
Note 2. Summary of Significant Accounting Policies
Use of Estimates
The preparation of financial statements in accordance with U.S. generally accepted accounting principles (GAAP) requires management to make certain estimates and assumptions that affect the reported amounts of assets and liabilities, the disclosure of contingent assets and liabilities at the date of the financial statements and the reported amounts of revenue and expenses during the reporting period. Actual results could differ from those estimates.
The following is a summary of significant accounting policies consistently followed by the Fund in the preparation of its financial statements.
Security Valuation
All equity securities are valued at the close of business of the New York Stock Exchange (NYSE). Equity securities are valued at the last quoted sales price on the principal exchange
or market on which they trade, except for securities traded on the NASDAQ Stock Market, which are valued at the NASDAQ official close price. Unlisted securities or listed securities for which there were no sales during the day are valued at the mean of the latest quoted bid and ask prices on such exchanges or markets.
Foreign equity securities are valued based on quotations from the principal market in which such securities are normally traded. If any foreign share prices are not readily available as a result of limited share activity the securities are valued at the mean of the latest quoted bid and ask prices on such exchanges or markets. Foreign currency exchange rates are generally determined at 4:00 p.m. Eastern (U.S.) time. However, many securities markets and exchanges outside the U.S. close prior to the close of the NYSE; therefore, the closing prices for securities in such markets or on such exchanges may not fully reflect events that occur after such close but before the close of the NYSE. In those situations, foreign securities will be fair valued pursuant to the policy adopted by the Board of Trustees (the Board), including utilizing a third party pricing service to determine these fair values. The third party pricing service takes into account multiple factors, including, but not limited to, movements in the U.S. securities markets, certain depositary receipts, futures contracts and foreign exchange rates that have occurred subsequent to the close of the foreign exchange or market, to determine a good faith estimate that reasonably reflects the current market conditions as of the close of the NYSE. The fair value of a security is likely to be different from the quoted or published price, if available.
Investments in open-end investment companies, including money market funds, are valued at net asset value.
Futures and options on futures contracts are valued based upon the settlement price established each day by the board of trade or exchange on which they are traded.
Investments for which market quotations are not readily available, or that have quotations which management believes are not reliable, are valued at fair value as determined in good faith under consistently applied procedures established by and under the general supervision of the Board. If a security or class of securities (such as foreign securities) is valued at fair value, such value is likely to be different from the last quoted market price for the security.
The determination of fair value often requires significant judgment. To determine fair value, management may use assumptions including but not limited to future cash flows and estimated risk premiums. Multiple inputs from various sources may be used to determine fair value.
Annual Report 2014
26
Columbia Mid Cap Index Fund
Notes to Financial Statements (continued)
February 28, 2014
Derivative Instruments
The Fund invests in certain derivative instruments, as detailed below, to meet its investment objectives. Derivatives are instruments whose values depend on, or are derived from, in whole or in part, the value of one or more other assets, such as securities, currencies, commodities or indices. Derivative instruments may be used to maintain cash reserves while maintaining exposure to certain other assets, to offset anticipated declines in values of investments, to facilitate trading, to reduce transaction costs and to pursue higher investment returns. The Fund may also use derivative instruments to mitigate certain investment risks, such as foreign currency exchange rate risk, interest rate risk and credit risk. Derivatives may involve various risks, including the potential inability of the counterparty to fulfill its obligation under the terms of the contract, the potential for an illiquid secondary market (making it difficult for the Fund to sell, including at favorable prices) and the potential for market movements which may expose the Fund to gains or losses in excess of the amount shown in the Statement of Assets and Liabilities. The notional amounts of derivative instruments, if applicable, are not recorded in the financial statements.
A derivative instrument may suffer a mark to market loss if the value of the contract decreases due to an unfavorable change in the market rates or values of the underlying instrument. Losses can also occur if the counterparty does not perform under the contract. The Fund's risk of loss from counterparty credit risk on over-the-counter derivatives is generally limited to the aggregate unrealized gain netted against any collateral held by the Fund and the amount of any variation margin held by the counterparty. With exchange traded or centrally cleared derivatives, there is minimal counterparty credit risk to the Fund since the exchange's clearinghouse, as counterparty to such instruments, guarantees against a possible default. The clearinghouse stands between the buyer and the seller of the contract; therefore, the counterparty credit risk is limited to failure of the clearinghouse. However, credit risk still exists in exchange traded or centrally cleared derivatives with respect to initial and variation margin that is held in a broker's customer accounts. While brokers are required to segregate customer margin from their own assets, in the event that a broker becomes insolvent or goes into bankruptcy and at that time there is a shortfall in the aggregate amount of margin held by the broker for all its clients, U.S. bankruptcy laws will typically allocate that shortfall on a pro-rata basis across all the broker's customers, potentially resulting in losses to the Fund.
In order to better define its contractual rights and to secure rights that will help the Fund mitigate its counterparty risk, the Fund may enter into an International Swaps and Derivatives Association, Inc. Master Agreement (ISDA Master
Agreement) or similar agreement with its derivative contract counterparties. An ISDA Master Agreement is an agreement between the Fund and a counterparty that governs over-the-counter derivatives and forward foreign currency exchange contracts and typically contains, among other things, collateral posting terms and netting provisions in the event of a default and/or termination event. Under an ISDA Master Agreement, the Fund may, under certain circumstances, offset with the counterparty certain derivative instrument's payables and/or receivables with collateral held and/or posted and create one single net payment. The provisions of the ISDA Master Agreement typically permit a single net payment in the event of default (close-out netting) including the bankruptcy or insolvency of the counterparty. Note, however, that bankruptcy or insolvency laws of a particular jurisdiction may impose restrictions on or prohibitions against the right of offset in bankruptcy, insolvency or other events.
Collateral (margin) requirements differ by type of derivative. Margin requirements are established by the exchange or clearinghouse for exchange traded and centrally cleared derivatives. Brokers can ask for margin in excess of the minimum in certain circumstances. Collateral terms are contract specific for over-the-counter derivatives. For over-the-counter derivatives traded under an ISDA Master Agreement, the collateral requirements are typically calculated by netting the mark to market amount for each transaction under such agreement and comparing that amount to the value of any variation margin currently pledged by the Fund and/or the counterparty. Generally, the amount of collateral due from or to a party has to exceed a minimum transfer amount threshold (e.g., $500,000) before a transfer has to be made. To the extent amounts due to the Fund from its counterparties are not fully collateralized, contractually or otherwise, the Fund bears the risk of loss from counterparty nonperformance. The Fund attempts to mitigate counterparty risk by only entering into agreements with counterparties that it believes have the financial resources to honor their obligations and by monitoring the financial stability of those counterparties.
Certain ISDA Master Agreements allow counterparties to over-the-counter derivatives to terminate derivative contracts prior to maturity in the event the Fund's net assets decline by a stated percentage over a specified time period or the Fund fails to meet the terms of the ISDA Master Agreement, which would cause the Fund to accelerate payment of any net liability owed to the counterparty. The Fund also has termination rights if the counterparty fails to meet the terms of the ISDA Master Agreement. In addition to considering counterparty credit risk, the Fund would consider terminating the derivative contracts based on whether termination would result in a net liability owed from the counterparty.
Annual Report 2014
27
Columbia Mid Cap Index Fund
Notes to Financial Statements (continued)
February 28, 2014
For financial reporting purposes, the Fund does not offset derivative assets and derivative liabilities that are subject to netting arrangements in the Statement of Assets and Liabilities.
Futures Contracts
Futures contracts are exchange traded and represent commitments for the future purchase or sale of an asset at a specified price on a specified date. The Fund bought and sold futures contracts to maintain appropriate equity market exposure while keeping sufficient cash to accommodate daily redemptions. These instruments may be used for other purposes in future periods. Upon entering into futures contracts, the Fund bears risks that it may not achieve the anticipated benefits of the futures contracts and may realize a loss. Additional risks include counterparty credit risk, the possibility of an illiquid market, and that a change in the value of the contract or option may not correlate with changes in the value of the underlying asset.
Upon entering into a futures contract, the Fund pledges cash or securities with the broker in an amount sufficient to meet the initial margin requirement. The initial margin deposit must be maintained at an established level over the life of the contract. Cash deposited as initial margin is recorded in the Statement of Assets and Liabilities as margin deposits. Securities deposited as initial margin are designated in the Portfolio of Investments. Subsequent payments (variation margin) are made or received by the Fund each day. The variation margin payments are equal to the daily change in the contract value and are recorded as variation margin receivable or payable and are offset in unrealized gains or losses. The Fund recognizes a realized gain or loss when the contract is closed or expires. Futures contracts involve, to varying degrees, risk of loss in excess of the variation margin disclosed in the Statement of Assets and Liabilities.
Effects of Derivative Transactions in the Financial Statements
The following tables are intended to provide additional information about the effect of derivatives on the financial statements of the Fund, including: the fair value of derivatives by risk category and the location of those fair values in the Statement of Assets and Liabilities; the impact of derivative transactions over the period in the Statement of Operations including realized gains or losses and unrealized gains or losses. The derivative schedules following the Portfolio of Investments present additional information regarding derivative instruments outstanding at the end of the period, if any.
The following table is a summary of the fair value of derivative instruments at February 28, 2014:
Asset Derivatives | |
Risk Exposure
Category | | Statement of Assets and
Liabilities Location | |
Fair Value ($) | |
Equity risk
| | Net assets — unrealized
appreciation on
futures contracts | | | 5,050,784
| * | |
*Includes cumulative appreciation (depreciation) as reported in the tables following the Portfolio of Investments. Only the current day's variation margin is reported in receivables or payables in the Statement of Assets and Liabilities.
The following table indicates the effect of derivative instruments in the Statement of Operations for the year ended February 28, 2014:
Amount of Realized Gain (Loss) on Derivatives Recognized in Income | |
Risk Exposure Category | | Futures Contracts ($) | |
Equity risk | | | 20,702,331 | | |
Change in Unrealized Appreciation (Depreciation) on
Derivatives Recognized in Income | |
Risk Exposure Category | | Futures Contracts ($) | |
The following table is a summary of the volume of derivative instruments for the year ended February 28, 2014:
Derivative Instrument | | Contracts Opened | |
Futures contracts | | | 9,085 | | |
Security Transactions
Security transactions are accounted for on the trade date. Cost is determined and gains (losses) are based upon the specific identification method for both financial statement and federal income tax purposes.
Income Recognition
Corporate actions and dividend income are generally recorded net of any non-reclaimable tax withholdings, on the ex-dividend date or upon receipt of ex-dividend notification in the case of certain foreign securities.
The Fund may receive distributions from holdings in business development companies (BDCs), exchange traded funds (ETFs) and real estate investment trusts (REITs), which report information on the character of their distributions annually. These distributions are allocated to dividend income, capital gain and return of capital based on estimates made by the Fund's management if actual information has not yet been reported. Return of capital is recorded as a reduction of the cost basis of securities held. If the Fund no longer owns the applicable securities, return of capital is recorded as a realized gain. Management's estimates are subsequently adjusted when
Annual Report 2014
28
Columbia Mid Cap Index Fund
Notes to Financial Statements (continued)
February 28, 2014
the actual character of the distributions is disclosed by the BDCs, ETFs and REITs, which could result in a proportionate change in return of capital to shareholders.
Awards from class action litigation are recorded as a reduction of cost basis if the Fund still owns the applicable securities on the payment date. If the Fund no longer owns the applicable securities, the proceeds are recorded as realized gains.
Expenses
General expenses of the Trust are allocated to the Fund and other funds of the Trust based upon relative net assets or other expense allocation methodologies determined by the nature of the expense. Expenses directly attributable to the Fund are charged to the Fund. Expenses directly attributable to a specific class of shares are charged to that share class.
Determination of Class Net Asset Value
All income, expenses (other than class-specific expenses, which are charged to that share class, as shown in the Statement of Operations) and realized and unrealized gains (losses) are allocated to each class of the Fund on a daily basis, based on the relative net assets of each class, for purposes of determining the net asset value of each class.
Federal Income Tax Status
The Fund intends to qualify each year as a regulated investment company under Subchapter M of the Internal Revenue Code, as amended, and will distribute substantially all of its taxable income (including net short-term capital gains), if any, for its tax year, and as such will not be subject to federal income taxes. In addition, the Fund intends to distribute in each calendar year substantially all of its net investment income, capital gains and certain other amounts, if any, such that the Fund should not be subject to federal excise tax. Therefore, no federal income or excise tax provision is recorded.
Distributions to Shareholders
Distributions from net investment income, if any, are declared and paid semi-annually. Net realized capital gains, if any, are distributed at least annually. Income distributions and capital gain distributions are determined in accordance with federal income tax regulations, which may differ from GAAP.
Guarantees and Indemnifications
Under the Trust's organizational documents and, in some cases, by contract, its officers and trustees are indemnified against certain liabilities arising out of the performance of their duties to the Trust or its funds. In addition, certain of the Fund's contracts with its service providers contain general indemnification clauses. The Fund's maximum exposure under these arrangements is unknown since the amount of any future claims that may be made against the Fund cannot be
determined, and the Fund has no historical basis for predicting the likelihood of any such claims.
Note 3. Fees and Compensation Paid to Affiliates
Investment Management Fees
Under an Investment Management Services Agreement, Columbia Management Investment Advisers, LLC (the Investment Manager), a wholly-owned subsidiary of Ameriprise Financial, Inc. (Ameriprise Financial), determines which securities will be purchased, held or sold. The investment management fee is an annual fee that is equal to 0.10% of the Fund's average daily net assets.
Administration Fees
Under an Administrative Services Agreement, the Investment Manager also serves as the Fund Administrator. The Fund pays the Fund Administrator an annual fee for administration and accounting services equal to 0.10% of the Fund's average daily net assets.
Other Expenses
Other expenses are for, among other things, miscellaneous expenses of the Fund or the Board, including payments to a company providing limited administrative services to the Fund and the Board. That company's expenses include boardroom and office expense, employee compensation, employee health and retirement benefits, and certain other expenses. For the year ended February 28, 2014, other expenses paid to this company were $8,375.
Compensation of Board Members
Board members are compensated for their services to the Fund as disclosed in the Statement of Operations. Under a Deferred Compensation Plan (the Plan), the Board members who are not "interested persons" of the Fund, as defined under the 1940 Act, may elect to defer payment of up to 100% of their compensation. Deferred amounts are treated as though equivalent dollar amounts had been invested in shares of certain funds managed by the Investment Manager. The Fund's liability for these amounts is adjusted for market value changes and remains in the Fund until distributed in accordance with the Plan.
Transfer Agent Fees
Under a Transfer and Dividend Disbursing Agent Agreement, Columbia Management Investment Services Corp. (the Transfer Agent), an affiliate of the Investment Manager and a wholly-owned subsidiary of Ameriprise Financial, is responsible for providing transfer agency services to the Fund. The Transfer Agent has contracted with Boston Financial Data Services (BFDS) to serve as sub-transfer agent.
Annual Report 2014
29
Columbia Mid Cap Index Fund
Notes to Financial Statements (continued)
February 28, 2014
The Transfer Agent receives monthly account-based service fees based on the number of open accounts and also receives sub-transfer agency fees based on a percentage of the average aggregate value of the Fund's shares maintained in omnibus accounts (other than omnibus accounts for which American Enterprise Investment Services Inc. is the broker of record or accounts where the beneficial shareholder is a customer of Ameriprise Financial Services, Inc., which are paid a per account fee). The Transfer Agent pays the fees of BFDS for services as sub-transfer agent and is not entitled to reimbursement for such fees from the Fund (with the exception of out-of-pocket fees).
The Transfer Agent also receives compensation from fees for various shareholder services and reimbursements for certain out-of-pocket fees. Class I shares do not pay transfer agent fees. Total transfer agent fees for Class R5 shares are subject to an annual limitation of not more than 0.05% of the average daily net assets attributable to Class R5 shares.
For the year ended February 28, 2014, the Fund's effective transfer agent fee rates as a percentage of average daily net assets of each class were as follows:
Class A | | | 0.19 | % | |
Class R5 | | | 0.05 | | |
Class Z | | | 0.19 | | |
An annual minimum account balance fee of $20 may apply to certain accounts with a value below the applicable share class's initial minimum investment requirements to reduce the impact of small accounts on transfer agent fees. These minimum account balance fees are recorded as part of expense reductions in the Statement of Operations. For the year ended February 28, 2014, these minimum account balance fees reduced total expenses by $160.
Distribution and Service Fees
The Fund has an agreement with Columbia Management Investment Distributors, Inc. (the Distributor), an affiliate of the Investment Manager and a wholly-owned subsidiary of Ameriprise Financial, for distribution and shareholder services. The Board has approved, and the Fund has adopted, distribution and shareholder service plans (the Plans) applicable to certain share classes, which set the distribution and service fees for the Fund. These fees are calculated daily and are intended to compensate the Distributor and/or eligible selling and/or servicing agents for selling shares of the Fund and providing services to investors.
Under the Plans, the Fund pays a monthly combined distribution and service fee to the Distributor at the maximum annual rate of 0.25% of the average daily net assets attributable to Class A shares of the Fund.
Expenses Waived/Reimbursed by the Investment Manager and its Affiliates
The Investment Manager and certain of its affiliates have contractually agreed to waive fees and/or reimburse expenses (excluding certain fees and expenses described below) for the period disclosed below, unless sooner terminated at the sole discretion of the Board, so that the Fund's net operating expenses, after giving effect to fees waived/expenses reimbursed and any balance credits and/or overdraft charges from the Fund's custodian, do not exceed the following annual rates as a percentage of the class' average daily net assets:
| | | Fee Rates Contractual
through
June 30, 2014 | |
Class A | | | 0.45 | % | |
Class I | | | 0.20 | | |
Class R5 | | | 0.20 | | |
Class Z | | | 0.20 | | |
Under the agreement governing these fee waivers and/or expense reimbursement arrangements, the following fees and expenses are excluded from the waiver/reimbursement commitment, and therefore will be paid by the Fund, if applicable: taxes (including foreign transaction taxes), expenses associated with investments in affiliated and non-affiliated pooled investment vehicles (including mutual funds and exchange traded funds), transaction costs and brokerage commissions, costs related to any securities lending program, dividend expenses associated with securities sold short, inverse floater program fees and expenses, transaction charges and interest on borrowed money, interest, extraordinary expenses and any other expenses the exclusion of which is specifically approved by the Board. This agreement may be modified or amended only with approval from all parties.
Note 4. Federal Tax Information
The timing and character of income and capital gain distributions are determined in accordance with income tax regulations, which may differ from GAAP because of temporary or permanent book to tax differences.
At February 28, 2014, these differences are primarily due to differing treatment for deferral/reversal of wash sales losses, Trustees' deferred compensation, derivative investments, and earnings and profits distributed to shareholders on the redemption of shares. To the extent these differences are permanent, reclassifications are made among the components of the Fund's net assets in the Statement of Assets and Liabilities. Temporary differences do not require
Annual Report 2014
30
Columbia Mid Cap Index Fund
Notes to Financial Statements (continued)
February 28, 2014
reclassifications. In the Statement of Assets and Liabilities the following reclassifications were made:
Undistributed net investment income | | $ | (977,408 | ) | |
Accumulated net realized gain | | | (12,229,975 | ) | |
Paid-in capital | | | 13,207,383 | | |
Net investment income and net realized gains (losses), as disclosed in the Statement of Operations, and net assets were not affected by this reclassification.
The tax character of distributions paid during the years indicated was as follows:
Year Ended February 28, | | 2014 | | 2013 | |
Ordinary income | | $ | 44,152,563 | | | $ | 33,428,068 | | |
Long-term capital gains | | | 100,829,028 | | | | 101,396,755 | | |
Total | | $ | 144,981,591 | | | $ | 134,824,823 | | |
Short-term capital gain distributions, if any, are considered ordinary income distributions for tax purposes.
At February 28, 2014, the components of distributable earnings on a tax basis were as follows:
Undistributed ordinary income | | $ | 9,524,899 | | |
Undistributed accumulated long-term gain | | | 51,231,098 | | |
Unrealized appreciation | | | 1,330,531,275 | | |
At February 28, 2014, the cost of investments for federal income tax purposes was $2,424,588,393 and the aggregate gross unrealized appreciation and depreciation based on that cost was:
Unrealized appreciation | | $ | 1,370,870,225 | | |
Unrealized depreciation | | | (40,338,950 | ) | |
Net unrealized appreciation | | $ | 1,330,531,275 | | |
Management of the Fund has concluded that there are no significant uncertain tax positions that would require recognition in the financial statements. However, management's conclusion may be subject to review and adjustment at a later date based on factors including, but not limited to, new tax laws, regulations, and administrative interpretations (including relevant court decisions). Generally, the Fund's federal tax returns for the prior three fiscal years remain subject to examination by the Internal Revenue Service.
Note 5. Portfolio Information
The cost of purchases and proceeds from sales of securities, excluding short-term obligations, aggregated to $893,393,981 and $434,068,686, respectively, for the year ended February 28, 2014.
Note 6. Affiliated Money Market Fund
The Fund invests its daily cash balances in Columbia Short-Term Cash Fund, an affiliated money market fund established for the exclusive use by the Fund and other affiliated funds. The income earned by the Fund from such investments is included as "Dividends — affiliated issuers" in the Statement of Operations. As an investing fund, the Fund indirectly bears its proportionate share of the expenses of Columbia Short-Term Cash Fund.
Note 7. Shareholder Concentration
At February 28, 2014, one unaffiliated shareholder account owned 24.0% of the outstanding shares of the Fund. The Fund has no knowledge about whether any portion of those shares was owned beneficially by such account. Subscription and redemption activity by concentrated accounts may have a significant effect on the operations of the Fund.
Note 8. Line of Credit
The Fund has entered into a revolving credit facility with a syndicate of banks led by JPMorgan Chase Bank N.A. whereby the Fund may borrow for the temporary funding of shareholder redemptions or for other temporary or emergency purposes. The credit facility agreement, as amended, which is a collective agreement between the Fund and certain other funds managed by the Investment Manager, severally and not jointly, permits collective borrowings up to $500 million. Interest is charged to each participating fund based on its borrowings at a rate equal to the higher of (i) the overnight federal funds rate plus 1.00% or (ii) the one-month LIBOR rate plus 1.00%. Each borrowing under the credit facility matures no later than 60 days after the date of borrowing. Effective December 10, 2013, the Fund also pays a commitment fee equal to its pro rata share of the amount of the credit facility at a rate of 0.075% per annum. Prior to December 10, 2013, the commitment fee was charged at the annual rate of 0.08% per annum. The commitment fee is included in other expenses in the Statement of Operations.
The Fund had no borrowings during the year ended February 28, 2014.
Note 9. Significant Risks
Financial Sector Risk
Sector risk occurs when a fund invests a significant portion of its assets in securities of companies conducting business in a related group of industries within an economic sector. Companies in the same economic sector may be similarly affected by economic, regulatory, political or market events or conditions, making a fund more vulnerable to unfavorable developments in that economic sector than funds that invest
Annual Report 2014
31
Columbia Mid Cap Index Fund
Notes to Financial Statements (continued)
February 28, 2014
more broadly. The Fund may be more susceptible to the particular risks that may affect companies in the financial sector than if it were invested in a wider variety of companies in unrelated sectors.
Note 10. Subsequent Events
Management has evaluated the events and transactions that have occurred through the date the financial statements were issued and noted no items requiring adjustment of the financial statements or additional disclosure.
Note 11. Information Regarding Pending and Settled Legal Proceedings
In December 2005, without admitting or denying the allegations, American Express Financial Corporation (AEFC, which is now known as Ameriprise Financial, Inc. (Ameriprise Financial)) entered into settlement agreements with the Securities and Exchange Commission (SEC) and Minnesota Department of Commerce (MDOC) related to market timing activities. As a result, AEFC was censured and ordered to cease and desist from committing or causing any violations of certain provisions of the Investment Advisers Act of 1940, the Investment Company Act of 1940, and various Minnesota laws. AEFC agreed to pay disgorgement of $10 million and civil money penalties of $7 million. AEFC also agreed to retain an independent distribution consultant to assist in developing a plan for distribution of all disgorgement and civil penalties ordered by the SEC in accordance with various undertakings detailed at www.sec.gov/litigation/admin/ia-2451.pdf. Ameriprise Financial and its affiliates have cooperated with the SEC and the MDOC in these legal proceedings, and have made regular reports to the Funds' Boards of Trustees.
Ameriprise Financial and certain of its affiliates have historically been involved in a number of legal, arbitration and regulatory proceedings, including routine litigation, class actions, and governmental actions, concerning matters arising in connection with the conduct of their business activities. Ameriprise Financial believes that the Funds are not currently the subject of, and that neither Ameriprise Financial nor any of its affiliates are the subject of, any pending legal, arbitration or regulatory proceedings that are likely to have a material adverse effect on the Funds or the ability of Ameriprise Financial or its affiliates to perform under their contracts with the Funds. Ameriprise Financial is required to make 10-Q, 10-K and, as necessary, 8-K filings with the Securities and Exchange Commission on legal and regulatory matters that relate to Ameriprise Financial and its affiliates. Copies of these filings may be obtained by accessing the SEC website at www.sec.gov.
There can be no assurance that these matters, or the adverse publicity associated with them, will not result in increased fund redemptions, reduced sale of fund shares or other adverse consequences to the Funds. Further, although we believe proceedings are not likely to have a material adverse effect on the Funds or the ability of Ameriprise Financial or its affiliates to perform under their contracts with the Funds, these proceedings are subject to uncertainties and, as such, we are unable to estimate the possible loss or range of loss that may result. An adverse outcome in one or more of these proceedings could result in adverse judgments, settlements, fines, penalties or other relief that could have a material adverse effect on the consolidated financial condition or results of operations of Ameriprise Financial.
Annual Report 2014
32
Columbia Mid Cap Index Fund
Report of Independent Registered Public Accounting Firm
To the Trustees of Columbia Funds Series Trust and the Shareholders of
Columbia Mid Cap Index Fund
In our opinion, the accompanying statement of assets and liabilities, including the portfolio of investments, and the related statements of operations and of changes in net assets and the financial highlights present fairly, in all material respects, the financial position of Columbia Mid Cap Index Fund (the "Fund", a series of Columbia Funds Series Trust) at February 28, 2014, and the results of its operations, the changes in its net assets and the financial highlights for each of the periods indicated, in conformity with accounting principles generally accepted in the United States of America. These financial statements and financial highlights (hereafter referred to as "financial statements") are the responsibility of the Fund's management; our responsibility is to express an opinion on these financial statements based on our audits. We conducted our audits of these financial statements in accordance with the standards of the Public Company Accounting Oversight Board (United States). Those standards require that we plan and perform the audit to obtain reasonable assurance about whether the financial statements are free of material misstatement. An audit includes examining, on a test basis, evidence supporting the amounts and disclosures in the financial statements, assessing the accounting principles used and significant estimates made by management, and evaluating the overall financial statement presentation. We believe that our audits, which included confirmation of securities at February 28, 2014 by correspondence with the custodian, brokers and transfer agent, provide a reasonable basis for our opinion.
PricewaterhouseCoopers LLP
Minneapolis, Minnesota
April 21, 2014
Annual Report 2014
33
Columbia Mid Cap Index Fund
Federal Income Tax Information
(Unaudited)
The Fund hereby designates the following tax attributes for the fiscal year ended February 28, 2014. Shareholders will be notified in early 2015 of the amounts for use in preparing 2014 income tax returns.
Tax Designations:
| Qualified Dividend Income | | | 70.42 | % | |
| Dividends Received Deduction | | | 70.55 | % | |
Capital Gain Dividend | | $ | 147,926,637 | | |
Qualified Dividend Income. For taxable, non-corporate shareholders, the percentage of ordinary income dividends paid during the fiscal year that represents qualified dividend income subject to reduced tax rates.
Dividends Received Deduction. The percentage of ordinary income dividends paid during the fiscal year that qualifies for the corporate dividends received deduction.
Capital Gain Dividend. The Fund designates as a capital gain dividend the amount reflected above, or if subsequently determined to be different, the net capital gain of such fiscal period. The Fund also designates as capital gain dividends, to the extent necessary to fully distribute such capital gains, earnings and profits distributed to shareholders on the redemption of shares.
Annual Report 2014
34
Columbia Mid Cap Index Fund
Shareholders elect the Board that oversees the Funds' operations. The Board appoints officers who are responsible for day-to-day business decisions based on policies set by the Board. The following table provides basic biographical information about the Funds' Board members, including their principal occupations during the past five years, although specific titles for individuals may have varied over the period. Under current Board policy, members may serve through the end of the calendar year in which he or she reaches either the mandatory retirement age established by the Board or the fifteenth anniversary of the first Board meeting they attended as a member of the Board.
Independent Trustees
Name,
Address,
Year of Birth | | Position Held With
Funds and Length of
Service | | Principal Occupation(s)
During Past Five Years
and Other Relevant
Professional Experience | | Number of
Funds in the
Fund Family
Overseen by
Board Member | | Other Present or Past
Directorships/
Trusteeships
(Within Past 5 Years) | |
Kathleen Blatz
901 S. Marquette Ave.
Minneapolis, MN 55402
1954 | | Board member since 1/06 for RiverSource Funds and since 6/11 for Nations Funds | | Attorney; Chief Justice, Minnesota Supreme
Court, 1998-2006 | | | 131 | | | Trustee, BlueCross BlueShield of Minnesota since 2009 | |
Edward J. Boudreau, Jr.
901 S. Marquette Ave.
Minneapolis, MN 55402
1944 | | Board member since 6/11 for RiverSource Funds and since 1/05 for Nations Funds | | Managing Director, E.J. Boudreau & Associates (consulting) since 2000; Chairman and Chief Executive Officer, John Hancock Funds (mutual funds), 1989-2000 | | | 129 | | | Former Trustee, BofA Funds Series Trust (11 funds), 2005-2011 | |
Pamela G. Carlton
901 S. Marquette Ave.
Minneapolis, MN 55402
1954 | | Board member since 7/07 for RiverSource Funds and since 6/11 for Nations Funds | | President, Springboard — Partners in Cross Cultural Leadership (consulting company) since 2003; Director or Management Director of US Equity Research, Chase Asset Management, 1996-2003; Investment Banker, Morgan Stanley, 1982-1996 | | | 131 | | | None | |
William P. Carmichael
901 S. Marquette Ave.
Minneapolis, MN 55402
1943 | | Chair of the Board since 1/14, Board member since 6/11 for RiverSource Funds and since 2003 for Nations Funds | | Retired; Co-founder, The Succession Fund (provides exit strategies to owners of privately held companies); previously, Senior Vice President, Sara Lee Corporation; Senior Vice President and Chief Financial officer, Beatrice Foods Company; Vice President, Esmark, Inc.; Associate, Price Waterhouse | | | 131 | | | Director, Cobra Electronics Corporation (electronic equipment manufacturer); The Finish Line (athletic shoes and apparel) since July 2003; Director, International Textile Corp. since 2012; former Director, McMoRan Exploration Company (oil and gas exploration and development) 2010-2013; former Trustee, BofA Funds Series Trust (11 funds), 2009-2011; Director, Spectrum Brands, Inc. (consumer products), 2002-2009; Director, Simmons Company (bedding), 2004-2010 | |
Annual Report 2014
35
Columbia Mid Cap Index Fund
Trustees and Officers (continued)
Independent Trustees (continued)
Name,
Address,
Year of Birth | | Position Held With
Funds and Length of
Service | | Principal Occupation(s)
During Past Five Years
and Other Relevant
Professional Experience | | Number of
Funds in the
Fund Family
Overseen by
Board Member | | Other Present or Past
Directorships/
Trusteeships
(Within Past 5 Years) | |
Patricia M. Flynn
901 S. Marquette Ave.
Minneapolis, MN 55402
1950 | | Board member since 11/04 for RiverSource Funds and since 6/11 for Nations Funds | | Trustee Professor of Economics and Management, Bentley University since 1976 (also teaches and conducts research on corporate governance); Dean, McCallum Graduate School of Business, Bentley University, 1992-2002 | | | 131 | | | None | |
William A. Hawkins
901 S. Marquette Ave.
Minneapolis, MN 55402
1942 | | Board member since 6/11 for RiverSource Funds and since 1/05 for Nations Funds | | Managing Director, Overton Partners (financial consulting), since August 2010; President and Chief Executive Officer, California General Bank, N.A., January 2008-August 2010 | | | 129 | | | Trustee, BofA Funds Series Trust (11 funds) | |
R. Glenn Hilliard
901 S. Marquette Ave.
Minneapolis, MN 55402
1943 | | Board member since 6/11 for RiverSource Funds and since 1/05 for Nations Funds | | Chairman and Chief Executive Officer, Hilliard Group LLC (investing and consulting) since April 2003; Non-Executive Director & Chairman, CNO Financial Group, Inc. (insurance), September 2003-May 2011 | | | 129 | | | Chairman, BofA Fund Series Trust (11 funds); former Director, CNO Financial Group, Inc. (insurance), 2003-2011 | |
Stephen R. Lewis, Jr.
901 S. Marquette Ave.
Minneapolis, MN 55402
1939 | | Board member for RiverSource Funds since 1/02 and since 6/11 for Nations Funds, Board Chair 1/07-12/13 | | President Emeritus and Professor of Economics Emeritus, Carleton College since 2002 | | | 131 | | | Director, Valmont Industries, Inc. (irrigation systems manufacturer), 2002-2013 | |
Catherine James Paglia
901 S. Marquette Ave.
Minneapolis, MN 55402
1952 | | Board member since 11/04 for RiverSource Funds and since 6/11 for Nations Funds | | Director, Enterprise Asset Management, Inc. (private real estate and asset management company) since September 1998 | | | 131 | | | Director, Valmont Industries, Inc. (irrigation systems manufacturer) since 2012 | |
Leroy C. Richie
901 S. Marquette Ave.
Minneapolis, MN 55402
1941 | | Board member since 2000 for Legacy Seligman Funds, since 11/08 for RiverSource Funds and since 6/11 for Nations Funds | | Counsel, Lewis & Munday, P.C. (law firm) since 2004; Vice President and General Counsel, Automotive Legal Affairs, Chrysler Corporation, 1993-1997 | | | 131 | | | Lead Outside Director, Digital Ally, Inc. (digital imaging) since September 2005; Director, Infinity, Inc. (oil and gas exploration and production) since 1994; Director, OGE Energy Corp. (energy and energy services) since November 2007 | |
Minor M. Shaw
901 S. Marquette Ave.
Minneapolis, MN 55402
1947 | | Board member since 6/11 for RiverSource Funds and since 2003 for Nations Funds | | President, Micco LLC (private investments) since 2011; President, Micco Corp. since 1998 | | | 129 | | | Director, Piedmont Natural Gas; Director, BlueCross BlueShield of South Carolina since April 2008; Director, National Association of Corporate Directors, Carolinas Chapter, since 2013; former Trustee, BofA Funds Series Trust (11 funds) | |
Annual Report 2014
36
Columbia Mid Cap Index Fund
Trustees and Officers (continued)
Independent Trustees (continued)
Name,
Address,
Year of Birth | | Position Held With
Funds and Length of
Service | | Principal Occupation(s)
During Past Five Years
and Other Relevant
Professional Experience | | Number of
Funds in the
Fund Family
Overseen by
Board Member | | Other Present or Past
Directorships/
Trusteeships
(Within Past 5 Years) | |
Alison Taunton-Rigby
901 S. Marquette Ave.
Minneapolis, MN 55402
1944 | | Board member since 11/02 for RiverSource Funds and since 6/11 for Nations Funds | | Chief Executive Officer and Director, RiboNovix, Inc., (biotechnology) 2003-2010 | | | 131 | | | Director, Healthways, Inc. (health and wellbeing solutions) since 2005; Director, ICI Mutual Insurance Company, RRG since 2011; Director, Abt Associates (government contractor) since 2001; Director, Boston Children's Hospital since 2002 | |
Interested Trustee Not Affiliated with Investment Manager*
Name,
Address,
Year of Birth | | Position Held With
Funds and Length of
Service | | Principal Occupation(s)
During Past Five Years
and Other Relevant
Professional Experience | | Number of
Funds in the
Fund Family
Overseen by
Board Member | | Other Present or Past
Directorships/
Trusteeships
(Within Past 5 Years) | |
Anthony M. Santomero
901 S. Marquette Ave.
Minneapolis, MN 55402
1946 | | Board member since 6/11 for RiverSource Funds and since 1/08 for Nations Funds | | Richard K. Mellon Professor Emeritus of Finance, The Wharton School, University of Pennsylvania, since 2002; Senior Advisor, McKinsey & Company (consulting), 2006-2008 | | | 129 | | | Director, Renaissance Reinsurance Ltd. since May 2008; Trustee, Penn Mutual Life Insurance Company since March 2008; Director, Citigroup Inc. since 2009; Director, Citibank, N.A. since 2009; former Trustee, BofA Funds Series Trust (11 funds), 2008-2011 | |
* Dr. Santomero is not an affiliated person of the Investment Manager or Ameriprise Financial. However, he is currently deemed by the Funds to be an "interested person" (as defined in the 1940 Act) of the Funds because he serves as a Director of Citigroup Inc. and Citibank, N.A., companies that may directly or through subsidiaries and affiliates engage from time-to-time in brokerage execution, principal transactions and lending relationships with the Funds or accounts advised/managed by the Investment Manager.
Annual Report 2014
37
Columbia Mid Cap Index Fund
Trustees and Officers (continued)
Interested Trustee Affiliated with Investment Manager*
Name,
Address,
Year of Birth | | Position Held With
Funds and Length of
Service | | Principal Occupation(s)
During Past Five Years
and Other Relevant
Professional Experience | | Number of
Funds in the
Fund Family
Overseen by
Board Member | | Other Present or Past
Directorships/
Trusteeships
(Within Past 5 Years) | |
William F. Truscott
53600 Ameriprise
Financial Center
Minneapolis, MN 55474
1960 | | Board member since 11/01 for RiverSource Funds and since 6/11 for Nations Funds; Senior Vice President since 2002 for RiverSource Funds and since 5/10 for Nations Funds | | Chairman of the Board and President, Columbia Management Investment Advisers, LLC since May 2010 and February 2012, respectively (previously President and Chief Investment Officer, 2001-April 2010); Chief Executive Officer, Global Asset Management, Ameriprise Financial, Inc. since September 2012 (previously Chief Executive Officer, U.S. Asset Management & President, Annuities, May 2010-September 2012 and President — U.S. Asset Management and Chief Investment Officer, 2005-April 2010); Director and Chief Executive Officer, Columbia Management Investment Distributors, Inc. since May 2010 and February 2012, respectively (previously Chairman of the Board and Chief Executive Officer, 2006-April 2010); Chairman of the Board and Chief Executive Officer, RiverSource Distributors, Inc. since 2006; Director, Threadneedle Asset Management Holdings, SARL since 2014; President and Chief Executive Officer, Ameriprise Certificate Company, 2006-August 2012 | | | 183 | | | Former Director, Ameriprise Certificate Company, 2006-January 2013 | |
* Interested person (as defined under the 1940 Act) by reason of being an officer, director, security holder and/or employee of the Investment Manager or Ameriprise Financial.
The SAI has additional information about the Fund's Board members and is available, without charge, upon request by calling 800.345.6611; contacting your financial intermediary or visiting columbiamanagement.com.
Annual Report 2014
38
Columbia Mid Cap Index Fund
Trustees and Officers (continued)
The Board has appointed officers who are responsible for day-to-day business decisions based on policies it has established. The officers serve at the pleasure of the Board. In addition to Mr. Truscott, who is Senior Vice President, the Funds' other officers are:
Officers
Name,
Address and
Year of Birth | | Position and Year
First Appointed to
Position for any Fund
in the Columbia
Funds Complex or a
Predecessor Thereof | | Principal Occupation(s) During Past Five Years | |
J. Kevin Connaughton
225 Franklin Street
Boston, MA 02110
Born 1964 | | President and Principal Executive Officer (2009) | | Managing Director and General Manager — Mutual Fund Products, Columbia Management Investment Advisers, LLC since May 2010; and President, Columbia Funds since 2009; Managing Director, Columbia Management Advisors, LLC, December 2004 – April 2010; Senior Vice President and Chief Financial Officer, Columbia Funds, June 2008 – January 2009; and senior officer of Columbia Funds and affiliated funds since 2003 | |
Michael G. Clarke
225 Franklin Street
Boston, MA 02110
Born 1969 | | Treasurer (2011) and Chief Financial Officer (2009) | | Vice President — Mutual Fund Administration, Columbia Management Investment Advisers, LLC, since May 2010;Managing Director of Fund Administration, Columbia Management Advisors, LLC, September 2004 – April 2010; and senior officer of Columbia Funds and affiliated funds since 2002 | |
Scott R. Plummer
5228 Ameriprise Financial Center
Minneapolis, MN 55474
Born 1959 | | Senior Vice President (2006), Chief Legal Officer (2006) and Assistant Secretary (2011) | | Senior Vice President and Assistant General Counsel — Global Asset Management, Ameriprise Financial since February 2014 (previously, Senior Vice President and Lead Chief Counsel — Asset Management, 2012 – February 2014; Vice President and Lead Chief Counsel — Asset Management, 2010 – 2012; and Vice President and Chief Counsel — Asset Management, 2005 – 2010); Senior Vice President, Chief Legal Officer and Assistant Secretary, Columbia Management Investment Advisers, LLC since June 2005; Vice President, Chief Counsel and Assistant Secretary, Columbia Management Investment Distributors, Inc. since 2008; Vice President, General Counsel and Secretary, Ameriprise Certificate Company since 2005; Chief Counsel, RiverSource Distributors, Inc. since 2006; senior officer of Columbia Funds and affiliated funds since 2006 | |
Thomas P. McGuire
225 Franklin Street
Boston, MA 02110
Born 1972 | | Chief Compliance Officer (2012) | | Vice President — Asset Management Compliance, Ameriprise Financial, Inc. since May 2010; Chief Compliance Officer, Ameriprise Certificate Company, since September 2010; Compliance Executive, Bank of America, 2005 – April 2010 | |
Colin Moore
225 Franklin Street
Boston, MA 02110
Born 1958 | | Senior Vice President (2010) | | Executive Vice President and Global Chief Investment Officer, Ameriprise Financial, Inc. since July 2013; Director and Global Chief Investment Officer, Columbia Management Investment Advisers, LLC since May 2010; Manager, Managing Director and Chief Investment Officer, Columbia Management Advisors, LLC, 2007 – April 2010 | |
Michael E. DeFao
225 Franklin Street
Boston, MA 02110
Born 1968 | | Vice President (2011) and Assistant Secretary (2010) | | Vice President and Chief Counsel, Ameriprise Financial, Inc. since May 2010; Associate General Counsel, Bank of America 2005 – April 2010 | |
Joseph F. DiMaria
225 Franklin Street
Boston, MA 02110
Born 1968 | | Vice President (2011) and Chief Accounting Officer (2008) | | Vice President — Mutual Fund Treasurer, Columbia Management Investment Advisers, LLC since May 2010; Director of Fund Administration, Columbia Management Advisors, LLC, 2006 – April 2010 | |
Paul B. Goucher
100 Park Avenue
New York, NY 10017
Born 1968 | | Vice President (2011) and Assistant Secretary (2008) | | Vice President and Lead Chief Counsel, Ameriprise Financial, Inc. since November 2008 and January 2013, respectively (previously Chief Counsel, January 2010 – January 2013, and Group Counsel, November 2008 – January 2010); Director, Managing Director and General Counsel, J. & W. Seligman & Co. Incorporated, July 2008 – November 2008 | |
Amy Johnson
5228 Ameriprise Financial
Center
Minneapolis, MN 55474
Born 1965 | | Vice President (2006) | | Managing Director and Chief Operating Officer, Columbia Management Investment Advisers, LLC since May 2010 (previously Chief Administrative Officer, 2009 – April 2010, and Vice President — Asset Management and Trust Company Services, 2006 – 2009) | |
Annual Report 2014
39
Columbia Mid Cap Index Fund
Trustees and Officers (continued)
Officers (continued)
Name,
Address and
Year of Birth | | Position and Year
First Appointed to
Position for any Fund
in the Columbia
Funds Complex or a
Predecessor Thereof | | Principal Occupation(s) During Past Five Years | |
Paul D. Pearson
5228 Ameriprise Financial
Center
Minneapolis, MN 55474
Born 1956 | | Vice President (2011) and Assistant Treasurer (1999) | | Vice President — Investment Accounting, Columbia Management Investment Advisers, LLC since May 2010; Vice President — Managed Assets, Investment Accounting, Ameriprise Financial, Inc., 1998 – April 2010 | |
Christopher O. Petersen
5228 Ameriprise Financial Center
Minneapolis, MN 55474
Born 1970 | | Vice President and Secretary (2010) | | Vice President and Chief Counsel, Ameriprise Financial, Inc., since January 2010 (previously Vice President and Group Counsel or Counsel, 2004 – January 2010); officer of Columbia Funds and affiliated funds since 2007 | |
Stephen T. Welsh
225 Franklin Street
Boston, MA 02110
Born 1957 | | Vice President (2006) | | President and Director, Columbia Management Investment Services Corp. since May 2010; President and Director, Columbia Management Services, Inc., 2004 – April 2010; Managing Director, Columbia Management Distributors, Inc., 2007 – April 2010 | |
Annual Report 2014
40
Columbia Mid Cap Index Fund
Important Information About This Report
Each fund mails one shareholder report to each shareholder address. If you would like more than one report, please call shareholder services at 800.345.6611 and additional reports will be sent to you.
The policy of the Board is to vote the proxies of the companies in which each fund holds investments consistent with the procedures as stated in the Statement of Additional Information (SAI). You may obtain a copy of the SAI without charge by calling 800.345.6611; contacting your financial intermediary; visiting columbiamanagement.com; or searching the website of the Securities and Exchange Commission (SEC) at sec.gov. Information regarding how each fund voted proxies relating to portfolio securities is filed with the SEC by August 31 for the most recent 12-month period ending June 30 of that year, and is available without charge by visiting columbiamanagement.com; or searching the website of the SEC at sec.gov.
Each fund files a complete schedule of portfolio holdings with the SEC for the first and third quarters of each fiscal year on Form N-Q. Each fund's Form N-Q is available on the SEC's website at sec.gov and may be reviewed and copied at the SEC's Public Reference Room in Washington, D.C. Information on the operation of the Public Reference Room may be obtained by calling 800.SEC.0330. Each fund's complete schedule of portfolio holdings, as filed on Form N-Q, can also be obtained without charge, upon request, by calling 800.345.6611.
Annual Report 2014
41

Columbia Mid Cap Index Fund
P.O. Box 8081
Boston, MA 02266-8081
columbiamanagement.com
This information is for use with concurrent or prior delivery of a fund prospectus. Please read and consider the investment objectives, risks, charges and expenses for any fund carefully before investing. For a prospectus and, if available, a summary prospectus, which contains this and other important information about the Fund go to columbiamanagement.com. The Fund is distributed by Columbia Management Investment Distributors, Inc., member FINRA, and managed by Columbia Management Investment Advisers, LLC.
© 2014 Columbia Management Investment Advisers, LLC. All rights reserved.
ANN196_02_D01_(04/14)
Annual Report
February 28, 2014

Columbia Mid Cap Value Fund
Not FDIC insured • No bank guarantee • May lose value
 Dear Shareholders,
Equities recovered
In the final months of 2013, the U.S. economy embraced a robust recovery. After five years of only modest progress, the pace of economic growth picked up, job gains continued, manufacturing activity accelerated and a rebound in the housing market showed staying power. Growth, as measured by gross domestic product, was 4.1% in the third quarter, with expectations for a solid fourth quarter. Job growth averaged close to 200,000 monthly. Industrial production rose at a rate of 3.3%, considerably higher than the 12-month average of 2.5%. Factories were busier than at any point since the 2008/2009 recession, with capacity utilization at 79%. Orders for durable goods were strong, bolstered by rising auto sales. Holiday spending was solid, especially online sales, which rose 10% year over year, despite a shorter season.
Against this backdrop, the Federal Reserve's (the Fed's) announcement that it would slowly retreat from its monthly bond buying program and a bipartisan budget deal in Washington were welcome news for investors. Stocks climbed to new highs in the fourth quarter, while bonds retreated as yields moved higher. Small-cap stocks outperformed large- and mid-cap stocks, led by significant gains from the industrials, technology and consumer discretionary sectors. All 10 sectors of the S&P 500 Index delivered positive returns, although telecommunications and utilities posted only modest gains.
Fixed-income retreated
Improved economic data drove interest rates higher over the fourth quarter, credit spreads narrowed and the dollar weakened against most developed market currencies. Against this backdrop, most non-Treasury, fixed-income sectors delivered positive returns. Outgoing Fed chairman Ben Bernanke expressed concern about the persistently low level of core inflation, but gains in the labor market and reduced unemployment led to the Fed's decision to taper its bond-buying program gradually beginning in January 2014.
As the stock market soared, the riskiest sectors of the fixed-income markets fared the best. U.S. and foreign high-yield bonds were the strongest performers, followed by emerging-market and U.S. investment-grade corporate bonds. U.S. mortgage-backed securities (MBS) and securitized bonds produced negative total returns, as did U.S. Treasuries and developed world government bonds. Treasury inflation-protected bonds were the period's biggest losers. Investment-grade municipals delivered fractional gains, as better economic conditions helped steady state finances.
Stay on track with Columbia Management
Backed by more than 100 years of experience, Columbia Management is one of the nation's largest asset managers. At the heart of our success and, most importantly, that of our investors, are highly talented industry professionals, brought together by a unique way of working. At Columbia Management, reaching our performance goals matters, and how we reach them matters just as much.
Visit columbiamanagement.com for:
> The Columbia Management Perspectives blog, offering insights on current market events and investment opportunities
> Detailed up-to-date fund performance and portfolio information
> Quarterly fund commentaries
> Columbia Management Investor, our award-winning quarterly newsletter for shareholders
Thank you for your continued support of the Columbia Funds. We look forward to serving your investment needs for many years to come.
Best Regards,

J. Kevin Connaughton
President, Columbia Funds
Investing involves risk including the risk of loss of principal.
The S&P 500 Index, an unmanaged index, measures the performance of 500 widely held, large-capitalization U.S. stocks and is frequently used as a general measure of market performance. The Dow Jones Industrial Average is a price weighted average of 30 actively traded shares of blue chip US industrial corporations listed on the New York Stock Exchange. Indices are not available for investment, are not professionally managed and do not reflect sales charges, fees, brokerage commissions, taxes or other expenses of investing.
Investors should consider the investment objectives, risks, charges and expenses of a mutual fund carefully before investing. For a free prospectus and, if available, a summary prospectus, which contains this and other important information about a fund, visit columbiamanagement.com. The prospectus should be read carefully before investing.
Columbia Funds are distributed by Columbia Management Investment Distributors, Inc., member FINRA, and managed by Columbia Management Investment Advisers, LLC.
© 2014 Columbia Management Investment Advisers, LLC. All rights reserved.
Columbia Mid Cap Value Fund
Performance Overview | | | 2 | | |
Manager Discussion of Fund Performance | | | 4 | | |
Understanding Your Fund's Expenses | | | 6 | | |
Portfolio of Investments | | | 7 | | |
Statement of Assets and Liabilities | | | 12 | | |
Statement of Operations | | | 15 | | |
Statement of Changes in Net Assets | | | 16 | | |
Financial Highlights | | | 19 | | |
Notes to Financial Statements | | | 30 | | |
Report of Independent Registered
Public Accounting Firm | | | 36 | | |
Federal Income Tax Information | | | 37 | | |
Trustees and Officers | | | 38 | | |
Important Information About This Report | | | 45 | | |
Fund Investment Manager
Columbia Management Investment
Advisers, LLC
225 Franklin Street
Boston, MA 02110
Fund Distributor
Columbia Management Investment
Distributors, Inc.
225 Franklin Street
Boston, MA 02110
Fund Transfer Agent
Columbia Management Investment
Services Corp.
P.O. Box 8081
Boston, MA 02266-8081
For more information about any of the funds, please visit columbiamanagement.com or call 800.345.6611. Customer Service Representatives are available to answer your questions Monday through Friday from 8 a.m. to 7 p.m. Eastern time.
The views expressed in this report reflect the current views of the respective parties. These views are not guarantees of future performance and involve certain risks, uncertainties and assumptions that are difficult to predict, so actual outcomes and results may differ significantly from the views expressed. These views are subject to change at any time based upon economic, market or other conditions and the respective parties disclaim any responsibility to update such views. These views may not be relied on as investment advice and, because investment decisions for a Columbia Fund are based on numerous factors, may not be relied on as an indication of trading intent on behalf of any particular Columbia Fund. References to specific securities should not be construed as a recommendation or investment advice.
Columbia Mid Cap Value Fund
Performance Summary
> Columbia Mid Cap Value Fund (the Fund) Class A shares returned 30.10% excluding sales charges for the 12-month period that ended February 28, 2014.
> The Fund outperformed its benchmark, the Russell Midcap Value Index, which returned 26.50% for the same time period.
> Bottom-up security selection, which focused on mid-cap companies with attractive stock valuations and the potential for improved operating profit margins, drove the Fund's performance advantage over its benchmark.
Average Annual Total Returns (%) (for period ended February 28, 2014)
| | Inception | | 1 Year | | 5 Years | | 10 Years | |
Class A | | 11/20/01 | | | | | | | | | | | | | |
Excluding sales charges | | | | | | | 30.10 | | | | 25.68 | | | | 9.49 | | |
Including sales charges | | | | | | | 22.60 | | | | 24.20 | | | | 8.84 | | |
Class B | | 11/20/01 | | | | | | | | | | | | | |
Excluding sales charges | | | | | | | 29.16 | | | | 24.74 | | | | 8.67 | | |
Including sales charges | | | | | | | 24.16 | | | | 24.58 | | | | 8.67 | | |
Class C | | 11/20/01 | | | | | | | | | | | | | |
Excluding sales charges | | | | | | | 29.11 | | | | 24.76 | | | | 8.67 | | |
Including sales charges | | | | | | | 28.11 | | | | 24.76 | | | | 8.67 | | |
Class I* | | 09/27/10 | | | 30.59 | | | | 26.06 | | | | 9.65 | | |
Class K* | | 03/07/11 | | | 30.26 | | | | 25.81 | | | | 9.54 | | |
Class R* | | 01/23/06 | | | 29.77 | | | | 25.36 | | | | 9.21 | | |
Class R4* | | 11/08/12 | | | 30.40 | | | | 25.78 | | | | 9.53 | | |
Class R5* | | 11/08/12 | | | 30.64 | | | | 25.83 | | | | 9.55 | | |
Class W* | | 09/27/10 | | | 30.02 | | | | 25.68 | | | | 9.48 | | |
Class Y* | | 07/15/09 | | | 30.65 | | | | 26.08 | | | | 9.66 | | |
Class Z | | 11/20/01 | | | 30.37 | | | | 26.00 | | | | 9.76 | | |
Russell Midcap Value Index | | | | | | | 26.50 | | | | 28.09 | | | | 10.09 | | |
Returns for Class A are shown with and without the maximum initial sales charge of 5.75%. Returns for Class B are shown with and without the applicable contingent deferred sales charge (CDSC) of 5.00% in the first year, declining to 1.00% in the sixth year and eliminated thereafter. Returns for Class C are shown with and without the 1.00% CDSC for the first year only. The Fund's other classes are not subject to sales charges and have limited eligibility. Please see the Fund's prospectus for details. Performance for different share classes will vary based on differences in sales charges and fees associated with each class. All results shown assume reinvestment of distributions during the period. Returns do not reflect the deduction of taxes that a shareholder may pay on Fund distributions or on the redemption of Fund shares. Performance results reflect the effect of any fee waivers or reimbursements of Fund expenses by Columbia Management Investment Advisers, LLC and/or any of its affiliates. Absent these fee waivers or expense reimbursement arrangements, performance results would have been lower.
The performance information shown represents past performance and is not a guarantee of future results. The investment return and principal value of your investment will fluctuate so that your shares, when redeemed, may be worth more or less than their original cost. Current performance may be lower or higher than the performance information shown. You may obtain performance information current to the most recent month-end by contacting your financial intermediary, visiting columbiamanagement.com or calling 800.345.6611.
*The returns shown for periods prior to the share class inception date (including returns for the Life of the Fund, if shown, which are since Fund inception) include the returns of the Fund's oldest share class. Since the Fund launched more than one share class at its inception, Class A shares were used. These returns are adjusted to reflect any higher class-related operating expenses of the newer share classes, as applicable. Please visit columbiamanagement.com/mutual-funds/appended-performance for more information.
The Russell Midcap Value Index, an unmanaged index, measures the performance of those Russell Midcap Index companies with lower price-to-book ratios and forecasted growth values.
Indices are not available for investment, are not professionally managed and do not reflect sales charges, fees, brokerage commissions, taxes or other expenses of investing. Securities in the Fund may not match those in an index.
Annual Report 2014
2
Columbia Mid Cap Value Fund
Performance Overview (continued)
Performance of a Hypothetical $10,000 Investment (March 1, 2004 – February 28, 2014)
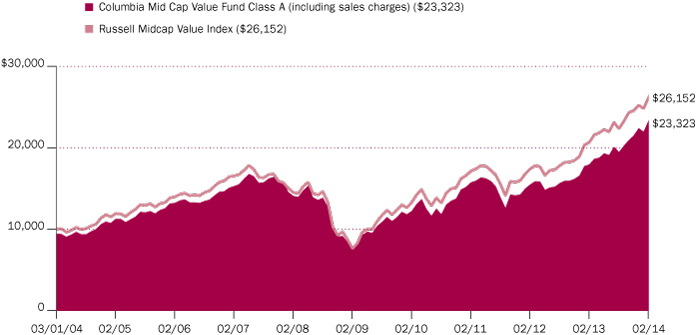
The chart above shows the change in value of a hypothetical $10,000 investment in Class A shares of Columbia Mid Cap Value Fund during the stated time period, and does not reflect the deduction of taxes that a shareholder may pay on Fund distributions or on the redemption of Fund shares.
Annual Report 2014
3
Columbia Mid Cap Value Fund
Manager Discussion of Fund Performance
For the 12-month period that ended February 28, 2014, the Fund's Class A shares returned 30.10% excluding sales charges. The Fund outperformed its benchmark, the Russell Midcap Value Index, which returned 26.50% for the same time period. Bottom-up security selection, which focused on mid-cap companies with attractive stock valuations and the potential for improved operating profit margins, drove the Fund's performance advantage over its benchmark.
Stocks Rose in Favorable Market Environment
Stocks rose to record levels over the 12 months that ended February 28, 2014, aided by an improving U.S. economy, as evidenced by continued job gains, a pickup in manufacturing and a rebound in housing. Intermittent weak economic data, political uncertainty and fears of military conflict did little to slow the market's momentum. Stocks dipped midway through the period after the U.S. Federal Reserve (the Fed) hinted that it was ready to taper its bond buying but quickly recovered when those plans were pushed out to 2014. The budget stalemate in Washington and subsequent federal government shutdown last fall also pressured returns, but the rally rebooted once Congress reached a bipartisan agreement. The market paused again in January in the midst of severe winter weather that dampened job growth. But stocks took off again in February after reassurance from new Fed Chair Janet Yellen that monetary policy was unlikely to change, leaving stocks with solid double-digit returns for the year.
Financials, Health Care and Materials Stocks Aided Results
In financials, the Fund benefited from favorable stock selection, particularly in insurance, and from a sizable underweight in real estate investment trusts (REITs), which lagged as interest rates rose. The top individual contributor in the sector, however, was online broker TD Ameritrade Holding, whose share price rose as the market rally boosted trading activity and asset growth.
In health care, a large overweight and triple-digit gains in pharmaceuticals aided performance. Standouts included Ireland-based biopharmaceutical company Jazz Pharmaceuticals, whose stock benefited from easing concern around potential generic competition and an acquisition that investors liked; Forest Laboratories, whose shares were aided by new management's cost cutting and a late-period buyout offer from specialty pharmaceutical Actavis; and Actavis itself. Actavis shares rose when the company received approval to launch a generic version of a well-known asthma medicine and later offered to buy Forest Labs.
In materials, security selection in both the chemicals and containers and packaging segments helped relative results. Top individual contributors included Packaging Corp. of America, which saw gains in its stock price from improved end-market demand, more rational supply for containerboard and better-than-expected results from a recent acquisition. In addition, shares of Netherlands-based aircraft-leasing company AerCap Holdings advanced after the company announced it would buy the commercial aircraft-leasing subsidiary of insurer American International Group. Jazz, Actavis and AerCap were out-of-benchmark positions.
Cash and Consumer Staples Detracted from Results
A small cash position in a strong up market and slight underperformance from stock selection in the consumer staples sector detracted from relative
Portfolio Management
David Hoffman
Diane Sobin, CFA
Morningstar Style BoxTM
The Morningstar Style BoxTM is based on a fund's portfolio holdings. For equity funds, the vertical axis shows the market capitalization of the stocks owned, and the horizontal axis shows investment style (value, blend, or growth). Information shown is based on the most recent data provided by Morningstar.
© 2014 Morningstar, Inc. All rights reserved. The Morningstar information contained herein: (1) is proprietary to Morningstar and/or its content providers; (2) may not be copied or distributed; and (3) is not warranted to be accurate, complete or timely. Neither Morningstar nor its content providers are responsible for any damages or losses arising from any use of this information.
Top Ten Holdings (%)
(at February 28, 2014) | |
Raymond James Financial, Inc. | | | 2.0 | | |
Forest Laboratories, Inc. | | | 1.8 | | |
Fifth Third Bancorp | | | 1.8 | | |
Zimmer Holdings, Inc. | | | 1.8 | | |
Portland General Electric Co. | | | 1.7 | | |
Hartford Financial Services
Group, Inc. (The) | | | 1.7 | | |
Host Hotels & Resorts, Inc. | | | 1.7 | | |
TD Ameritrade Holding Corp. | | | 1.6 | | |
Noble Energy, Inc. | | | 1.6 | | |
SL Green Realty Corp. | | | 1.6 | | |
Percentages indicated are based upon total investments (excluding Money Market Funds).
For further detail about these holdings, please refer to the section entitled "Portfolio of Investments."
Fund holdings are as of the date given, are subject to change at any time, and are not recommendations to buy or sell any security.
Annual Report 2014
4
Columbia Mid Cap Value Fund
Manager Discussion of Fund Performance (continued)
performance. Individual disappointments included REIT Rayonier, whose shares declined amid news that pricing in its specialty cellulose business would not be as robust as anticipated. Shares of retailer Abercrombie & Fitch fell late in the period after the company reported weaker-than-expected same-store sales comparisons and higher-than-expected e-commerce expenses. An investment in energy equipment provider Cameron International also declined due to a string of disappointments related to its execution in the drilling business. Finally, an out-of-benchmark stake in Citrix Systems, known for its remote access software, suffered after the company missed earnings estimates and lowered its earnings guidance. Both Abercrombie & Fitch and Citrix were sold.
Looking Ahead
Given the market's recent rise, we are somewhat cautious looking ahead. At present, we maintain our conviction around housing, energy infrastructure, travel and leisure, basic materials, and certain financial stocks, areas with, in our opinion, earnings well below normal levels and the potential for above-market returns. However, over the past year, we became more selective, pruning or eliminating stocks that we believe had elevated valuations or diminished opportunity for long-term fundamental improvement and adding to what we viewed as higher-conviction names as well as companies we believed were suffering from temporary company-specific setbacks. By period end, the Fund had fewer holdings and bigger average stock positions.
Portfolio Breakdown (%)
(at February 28, 2014) | |
Common Stocks | | | 96.4 | | |
Consumer Discretionary | | | 10.2 | | |
Consumer Staples | | | 1.5 | | |
Energy | | | 9.3 | | |
Financials | | | 28.7 | | |
Health Care | | | 7.7 | | |
Industrials | | | 11.9 | | |
Information Technology | | | 9.7 | | |
Materials | | | 5.1 | | |
Telecommunication Services | | | 1.5 | | |
Utilities | | | 10.8 | | |
Money Market Funds | | | 3.6 | | |
Total | | | 100.0 | | |
Percentages indicated are based upon total investments. The Fund's portfolio composition is subject to change.
Investment Risks
Share prices of mid-capitalization companies tend to be more volatile than those of larger companies. See the Fund's prospectus for information on these and other risks.
Annual Report 2014
5
Columbia Mid Cap Value Fund
Understanding Your Fund's Expenses
(Unaudited)
As an investor, you incur two types of costs. There are transaction costs, which generally include sales charges on purchases and may include redemption fees. There are also ongoing costs, which generally include management fees, distribution and/or service fees, and other fund expenses. The following information is intended to help you understand your ongoing costs (in dollars) of investing in the Fund and to help you compare these costs with the ongoing costs of investing in other mutual funds.
Analyzing Your Fund's Expenses
To illustrate these ongoing costs, we have provided examples and calculated the expenses paid by investors in each share class of the Fund during the period. The actual and hypothetical information in the table is based on an initial investment of $1,000 at the beginning of the period indicated and held for the entire period. Expense information is calculated two ways and each method provides you with different information. The amount listed in the "Actual" column is calculated using the Fund's actual operating expenses and total return for the period. You may use the Actual information, together with the amount invested, to estimate the expenses that you paid over the period. Simply divide your account value by $1,000 (for example, an $8,600 account value divided by $1,000 = 8.6), then multiply the results by the expenses paid during the period under the "Actual" column. The amount listed in the "Hypothetical" column assumes a 5% annual rate of return before expenses (which is not the Fund's actual return) and then applies the Fund's actual expense ratio for the period to the hypothetical return. You should not use the hypothetical account values and expenses to estimate either your actual account balance at the end of the period or the expenses you paid during the period. See "Compare With Other Funds" below for details on how to use the hypothetical data.
Compare With Other Funds
Since all mutual funds are required to include the same hypothetical calculations about expenses in shareholder reports, you can use this information to compare the ongoing cost of investing in the Fund with other funds. To do so, compare the hypothetical example with the 5% hypothetical examples that appear in the shareholder reports of other funds. As you compare hypothetical examples of other funds, it is important to note that hypothetical examples are meant to highlight the ongoing costs of investing in a fund only and do not reflect any transaction costs, such as sales charges, or redemption or exchange fees. Therefore, the hypothetical calculations are useful in comparing ongoing costs only, and will not help you determine the relative total costs of owning different funds. If transaction costs were included in these calculations, your costs would be higher.
September 1, 2013 – February 28, 2014
| | | Account Value at the Beginning
of the Period ($) | | Account Value at the End of the
Period ($) | | Expenses Paid During the
Period ($) | | Fund's Annualized
Expense Ratio (%) | |
| | Actual | | Hypothetical | | Actual | | Hypothetical | | Actual | | Hypothetical | | Actual | |
Class A | | | 1,000.00 | | | | 1,000.00 | | | | 1,197.70 | | | | 1,019.10 | | | | 6.41 | | | | 5.89 | | | | 1.17 | | |
Class B | | | 1,000.00 | | | | 1,000.00 | | | | 1,193.90 | | | | 1,015.36 | | | | 10.50 | | | | 9.65 | | | | 1.92 | | |
Class C | | | 1,000.00 | | | | 1,000.00 | | | | 1,193.80 | | | | 1,015.36 | | | | 10.50 | | | | 9.65 | | | | 1.92 | | |
Class I | | | 1,000.00 | | | | 1,000.00 | | | | 1,200.30 | | | | 1,021.29 | | | | 4.00 | | | | 3.68 | | | | 0.73 | | |
Class K | | | 1,000.00 | | | | 1,000.00 | | | | 1,199.20 | | | | 1,019.80 | | | | 5.65 | | | | 5.19 | | | | 1.03 | | |
Class R | | | 1,000.00 | | | | 1,000.00 | | | | 1,196.70 | | | | 1,017.85 | | | | 7.78 | | | | 7.14 | | | | 1.42 | | |
Class R4 | | | 1,000.00 | | | | 1,000.00 | | | | 1,199.70 | | | | 1,020.44 | | | | 4.94 | | | | 4.53 | | | | 0.90 | | |
Class R5 | | | 1,000.00 | | | | 1,000.00 | | | | 1,200.40 | | | | 1,020.94 | | | | 4.39 | | | | 4.03 | | | | 0.80 | | |
Class W | | | 1,000.00 | | | | 1,000.00 | | | | 1,197.70 | | | | 1,019.25 | | | | 6.25 | | | | 5.74 | | | | 1.14 | | |
Class Y | | | 1,000.00 | | | | 1,000.00 | | | | 1,201.00 | | | | 1,021.24 | | | | 4.06 | | | | 3.73 | | | | 0.74 | | |
Class Z | | | 1,000.00 | | | | 1,000.00 | | | | 1,199.50 | | | | 1,020.34 | | | | 5.04 | | | | 4.63 | | | | 0.92 | | |
Expenses paid during the period are equal to the annualized expense ratio for each class as indicated above, multiplied by the average account value over the period and then multiplied by the number of days in the Fund's most recent fiscal half year and divided by 365.
Expenses do not include fees and expenses incurred indirectly by the Fund from the underlying funds in which the Fund may invest (also referred to as "acquired funds"), including affiliated and non-affiliated pooled investment vehicles (including mutual funds and exchange-traded funds).
Annual Report 2014
6
Columbia Mid Cap Value Fund
Portfolio of Investments
February 28, 2014
(Percentages represent value of investments compared to net assets)
Common Stocks 95.8%
Issuer | | Shares | | Value ($) | |
Consumer Discretionary 10.1% | |
Auto Components 1.3% | |
TRW Automotive Holdings Corp.(a) | | | 622,050 | | | | 51,207,156 | | |
Automobiles 1.0% | |
Harley-Davidson, Inc. | | | 557,311 | | | | 36,815,965 | | |
Diversified Consumer Services 0.5% | |
Houghton Mifflin Harcourt Co.(a) | | | 1,014,114 | | | | 20,606,796 | | |
Hotels, Restaurants & Leisure 2.5% | |
Royal Caribbean Cruises Ltd. | | | 798,650 | | | | 42,272,545 | | |
Starwood Hotels & Resorts Worldwide, Inc. | | | 652,075 | | | | 53,770,104 | | |
Total | | | | | 96,042,649 | | |
Household Durables 1.3% | |
D.R. Horton, Inc. | | | 2,003,825 | | | | 49,213,942 | | |
Media 1.8% | |
DISH Network Corp., Class A(a) | | | 672,848 | | | | 39,590,376 | | |
Interpublic Group of Companies,
Inc. (The) | | | 1,759,725 | | | | 31,182,327 | | |
Total | | | | | 70,772,703 | | |
Multiline Retail 0.9% | |
Macy's, Inc. | | | 609,000 | | | | 35,236,740 | | |
Specialty Retail 0.8% | |
Sally Beauty Holdings, Inc.(a) | | | 1,096,000 | | | | 31,455,200 | | |
Total Consumer Discretionary | | | | | 391,351,151 | | |
Consumer Staples 1.5% | |
Food Products 1.5% | |
Hershey Co. (The) | | | 240,075 | | | | 25,404,736 | | |
JM Smucker Co. (The) | | | 335,690 | | | | 33,572,357 | | |
Total | | | | | 58,977,093 | | |
Total Consumer Staples | | | | | 58,977,093 | | |
Energy 9.3% | |
Energy Equipment & Services 3.8% | |
Cameron International Corp.(a) | | | 338,450 | | | | 21,681,107 | | |
Frank's International NV | | | 529,727 | | | | 12,522,746 | | |
Oceaneering International, Inc. | | | 287,275 | | | | 20,563,145 | | |
Superior Energy Services, Inc. | | | 1,484,400 | | | | 43,923,396 | | |
Weatherford International Ltd.(a) | | | 2,874,950 | | | | 47,925,416 | | |
Total | | | | | 146,615,810 | | |
Oil, Gas & Consumable Fuels 5.5% | |
Cabot Oil & Gas Corp. | | | 726,350 | | | | 25,422,250 | | |
Common Stocks (continued)
Issuer | | Shares | | Value ($) | |
Cimarex Energy Co. | | | 343,765 | | | | 39,777,048 | | |
HollyFrontier Corp. | | | 335,400 | | | | 15,284,178 | | |
Marathon Petroleum Corp. | | | 517,800 | | | | 43,495,200 | | |
Noble Energy, Inc. | | | 853,225 | | | | 58,667,751 | | |
Whiting Petroleum Corp.(a) | | | 448,816 | | | | 30,838,148 | | |
Total | | | | | 213,484,575 | | |
Total Energy | | | | | 360,100,385 | | |
Financials 28.5% | |
Capital Markets 3.4% | |
Raymond James Financial, Inc. | | | 1,370,550 | | | | 72,337,629 | | |
TD Ameritrade Holding Corp. | | | 1,761,125 | | | | 58,874,409 | | |
Total | | | | | 131,212,038 | | |
Commercial Banks 8.6% | |
CIT Group, Inc. | | | 1,079,025 | | | | 52,526,937 | | |
City National Corp. | | | 555,312 | | | | 41,553,997 | | |
Cullen/Frost Bankers, Inc. | | | 519,400 | | | | 38,768,016 | | |
East West Bancorp, Inc. | | | 1,245,150 | | | | 44,439,404 | | |
Fifth Third Bancorp | | | 3,007,451 | | | | 65,246,649 | | |
M&T Bank Corp. | | | 407,675 | | | | 47,530,828 | | |
Zions Bancorporation | | | 1,314,383 | | | | 41,008,750 | | |
Total | | | | | 331,074,581 | | |
Insurance 6.8% | |
Aon PLC | | | 582,000 | | | | 49,819,200 | | |
Brown & Brown, Inc. | | | 1,495,375 | | | | 45,010,787 | | |
Hartford Financial Services Group,
Inc. (The) | | | 1,765,618 | | | | 62,132,097 | | |
Lincoln National Corp. | | | 1,055,075 | | | | 52,890,910 | | |
Principal Financial Group, Inc. | | | 1,143,202 | | | | 51,844,211 | | |
Total | | | | | 261,697,205 | | |
Real Estate Investment Trusts (REITs) 8.7% | |
Colony Financial, Inc. | | | 802,175 | | | | 18,113,112 | | |
Extra Space Storage, Inc. | | | 459,554 | | | | 22,564,101 | | |
Host Hotels & Resorts, Inc. | | | 3,152,272 | | | | 62,005,190 | | |
Rayonier, Inc. | | | 883,859 | | | | 41,620,920 | | |
SL Green Realty Corp. | | | 582,175 | | | | 57,827,443 | | |
Taubman Centers, Inc. | | | 641,950 | | | | 45,225,378 | | |
UDR, Inc. | | | 1,873,825 | | | | 48,363,423 | | |
Weyerhaeuser Co. | | | 1,457,761 | | | | 43,018,527 | | |
Total | | | | | 338,738,094 | | |
The accompanying Notes to Financial Statements are an integral part of this statement.
Annual Report 2014
7
Columbia Mid Cap Value Fund
Portfolio of Investments (continued)
February 28, 2014
Common Stocks (continued)
Issuer | | Shares | | Value ($) | |
Real Estate Management & Development 1.0% | |
CBRE Group, Inc., Class A(a) | | | 1,452,361 | | | | 40,593,490 | | |
Total Financials | | | | | 1,103,315,408 | | |
Health Care 7.7% | |
Health Care Equipment & Supplies 3.0% | |
Teleflex, Inc. | | | 488,350 | | | | 49,806,816 | | |
Zimmer Holdings, Inc. | | | 693,250 | | | | 65,054,580 | | |
Total | | | | | 114,861,396 | | |
Health Care Providers & Services 0.7% | |
Community Health Systems, Inc.(a) | | | 689,925 | | | | 28,638,787 | | |
Pharmaceuticals 4.0% | |
Forest Laboratories, Inc.(a) | | | 695,150 | | | | 67,825,785 | | |
Jazz Pharmaceuticals PLC(a) | | | 368,625 | | | | 56,010,726 | | |
Salix Pharmaceuticals Ltd.(a) | | | 290,300 | | | | 31,329,176 | | |
Total | | | | | 155,165,687 | | |
Total Health Care | | | | | 298,665,870 | | |
Industrials 11.8% | |
Airlines 0.9% | |
United Continental Holdings, Inc.(a) | | | 805,125 | | | | 36,198,420 | | |
Building Products 1.3% | |
USG Corp.(a) | | | 1,429,175 | | | | 50,492,753 | | |
Electrical Equipment 0.8% | |
Babcock & Wilcox Co. (The) | | | 897,100 | | | | 29,568,416 | | |
Industrial Conglomerates 1.0% | |
Carlisle Companies, Inc. | | | 479,425 | | | | 38,027,991 | | |
Machinery 3.2% | |
Crane Co. | | | 474,775 | | | | 33,908,430 | | |
Dover Corp. | | | 438,703 | | | | 41,369,693 | | |
Manitowoc Co., Inc. (The) | | | 712,950 | | | | 22,058,673 | | |
Navistar International Corp.(a) | | | 746,875 | | | | 28,007,813 | | |
Total | | | | | 125,344,609 | | |
Road & Rail 1.8% | |
Hertz Global Holdings, Inc.(a) | | | 1,351,650 | | | | 37,859,716 | | |
Ryder System, Inc. | | | 426,525 | | | | 32,125,863 | | |
Total | | | | | 69,985,579 | | |
Trading Companies & Distributors 2.8% | |
AerCap Holdings NV(a) | | | 1,168,844 | | | | 50,260,292 | | |
United Rentals, Inc.(a) | | | 342,975 | | | | 30,298,412 | | |
Common Stocks (continued)
Issuer | | Shares | | Value ($) | |
WESCO International, Inc.(a) | | | 315,425 | | | | 27,192,789 | | |
Total | | | | | 107,751,493 | | |
Total Industrials | | | | | 457,369,261 | | |
Information Technology 9.6% | |
Communications Equipment 0.9% | |
Aruba Networks, Inc.(a) | | | 729,525 | | | | 14,962,558 | | |
F5 Networks, Inc.(a) | | | 171,100 | | | | 19,221,374 | | |
Total | | | | | 34,183,932 | | |
Electronic Equipment, Instruments & Components 1.3% | |
Arrow Electronics, Inc.(a) | | | 434,700 | | | | 24,617,061 | | |
FLIR Systems, Inc. | | | 717,850 | | | | 24,507,399 | | |
Total | | | | | 49,124,460 | | |
IT Services 1.0% | |
Xerox Corp. | | | 3,724,700 | | | | 40,934,453 | | |
Semiconductors & Semiconductor Equipment 4.4% | |
Avago Technologies Ltd. | | | 439,725 | | | | 27,131,033 | | |
KLA-Tencor Corp. | | | 465,350 | | | | 30,317,552 | | |
Lam Research Corp.(a) | | | 641,425 | | | | 33,180,915 | | |
Micron Technology, Inc.(a) | | | 1,546,725 | | | | 37,415,278 | | |
NXP Semiconductor NV(a) | | | 468,175 | | | | 26,325,480 | | |
Skyworks Solutions, Inc.(a) | | | 436,675 | | | | 15,484,496 | | |
Total | | | | | 169,854,754 | | |
Software 2.0% | |
Autodesk, Inc.(a) | | | 542,575 | | | | 28,463,484 | | |
Electronic Arts, Inc.(a) | | | 885,075 | | | | 25,304,294 | | |
PTC, Inc.(a) | | | 619,150 | | | | 24,338,787 | | |
Total | | | | | 78,106,565 | | |
Total Information Technology | | | | | 372,204,164 | | |
Materials 5.1% | |
Chemicals 2.3% | |
International Flavors & Fragrances, Inc. | | | 300,450 | | | | 28,179,205 | | |
Methanex Corp. | | | 303,175 | | | | 21,322,298 | | |
PPG Industries, Inc. | | | 195,300 | | | | 38,634,246 | | |
Total | | | | | 88,135,749 | | |
Containers & Packaging 1.9% | |
Packaging Corp. of America | | | 626,475 | | | | 45,663,763 | | |
Sealed Air Corp. | | | 807,925 | | | | 27,501,767 | | |
Total | | | | | 73,165,530 | | |
The accompanying Notes to Financial Statements are an integral part of this statement.
Annual Report 2014
8
Columbia Mid Cap Value Fund
Portfolio of Investments (continued)
February 28, 2014
Common Stocks (continued)
Issuer | | Shares | | Value ($) | |
Metals & Mining 0.9% | |
Steel Dynamics, Inc. | | | 1,933,275 | | | | 33,716,316 | | |
Total Materials | | | | | 195,017,595 | | |
Telecommunication Services 1.5% | |
Wireless Telecommunication Services 1.5% | |
SBA Communications Corp., Class A(a) | | | 483,150 | | | | 45,981,386 | | |
Telephone & Data Systems, Inc. | | | 456,075 | | | | 10,393,949 | | |
Total | | | | | 56,375,335 | | |
Total Telecommunication Services | | | | | 56,375,335 | | |
Utilities 10.7% | |
Electric Utilities 5.1% | |
Edison International | | | 748,250 | | | | 39,185,853 | | |
Great Plains Energy, Inc. | | | 1,956,950 | | | | 51,409,076 | | |
Portland General Electric Co. | | | 1,985,875 | | | | 63,150,825 | | |
PPL Corp. | | | 1,361,925 | | | | 43,976,558 | | |
Total | | | | | 197,722,312 | | |
Gas Utilities 0.9% | |
Questar Corp. | | | 1,513,475 | | | | 35,945,031 | | |
Independent Power Producers & Energy Traders 2.8% | |
AES Corp. (The) | | | 4,009,775 | | | | 54,733,429 | | |
NRG Energy, Inc. | | | 1,780,700 | | | | 51,764,949 | | |
Total | | | | | 106,498,378 | | |
Common Stocks (continued)
Issuer | | Shares | | Value ($) | |
Multi-Utilities 1.9% | |
CMS Energy Corp. | | | 1,388,800 | | | | 39,483,584 | | |
Sempra Energy | | | 368,574 | | | | 34,819,186 | | |
Total | | | | | 74,302,770 | | |
Total Utilities | | | | | 414,468,491 | | |
Total Common Stocks
(Cost: $2,481,659,240) | | | | | 3,707,844,753 | | |
Money Market Funds 3.6%
| | | Shares | | Value ($) | |
Columbia Short-Term Cash Fund,
0.098%(b)(c) | | | 139,344,865 | | | | 139,344,865 | | |
Total Money Market Funds
(Cost: $139,344,865) | | | | | 139,344,865 | | |
Total Investments
(Cost: $2,621,004,105) | | | | | 3,847,189,618 | | |
Other Assets & Liabilities, Net | | | | | 23,451,382 | | |
Net Assets | | | | | 3,870,641,000 | | |
Notes to Portfolio of Investments
(a) Non-income producing.
(b) The rate shown is the seven-day current annualized yield at February 28, 2014.
(c) As defined in the Investment Company Act of 1940, an affiliated company is one in which the Fund owns 5% or more of its outstanding voting securities, or a company which is under common ownership or control with the Fund. Holdings and transactions in these affiliated companies during the year ended February 28, 2014, are as follows:
Issuer | | Beginning
Cost ($) | | Purchase
Cost ($) | | Proceeds
From Sales ($) | | Ending
Cost ($) | | Dividends —
Affiliated
Issuers ($) | | Value ($) | |
Columbia Short-Term Cash Fund | | | 51,855,363 | | | | 1,155,054,850 | | | | (1,067,565,348 | ) | | | 139,344,865 | | | | 94,661 | | | | 139,344,865 | | |
The accompanying Notes to Financial Statements are an integral part of this statement.
Annual Report 2014
9
Columbia Mid Cap Value Fund
Portfolio of Investments (continued)
February 28, 2014
Fair Value Measurements
Generally accepted accounting principles (GAAP) require disclosure regarding the inputs and valuation techniques used to measure fair value and any changes in valuation inputs or techniques. In addition, investments shall be disclosed by major category.
The Fund categorizes its fair value measurements according to a three-level hierarchy that maximizes the use of observable inputs and minimizes the use of unobservable inputs by prioritizing that the most observable input be used when available. Observable inputs are those that market participants would use in pricing an investment based on market data obtained from sources independent of the reporting entity. Unobservable inputs are those that reflect the Fund's assumptions about the information market participants would use in pricing an investment. An investment's level within the fair value hierarchy is based on the lowest level of any input that is deemed significant to the asset or liability's fair value measurement. The input levels are not necessarily an indication of the risk or liquidity associated with investments at that level. For example, certain U.S. government securities are generally high quality and liquid, however, they are reflected as Level 2 because the inputs used to determine fair value may not always be quoted prices in an active market.
Fair value inputs are summarized in the three broad levels listed below:
> Level 1 — Valuations based on quoted prices for investments in active markets that the Fund has the ability to access at the measurement date (including NAV for open-end mutual funds). Valuation adjustments are not applied to Level 1 investments.
> Level 2 — Valuations based on other significant observable inputs (including quoted prices for similar securities, interest rates, prepayment speeds, credit risks, etc.).
> Level 3 — Valuations based on significant unobservable inputs (including the Fund's own assumptions and judgment in determining the fair value of investments).
Inputs that are used in determining fair value of an investment may include price information, credit data, volatility statistics, and other factors. These inputs can be either observable or unobservable. The availability of observable inputs can vary between investments, and is affected by various factors such as the type of investment, and the volume and level of activity for that investment or similar investments in the marketplace. The inputs will be considered by the Investment Manager, along with any other relevant factors in the calculation of an investment's fair value. The Fund uses prices and inputs that are current as of the measurement date, which may include periods of market dislocations. During these periods, the availability of prices and inputs may be reduced for many investments. This condition could cause an investment to be reclassified between the various levels within the hierarchy.
Investments falling into the Level 3 category are primarily supported by quoted prices from brokers and dealers participating in the market for those investments. However, these may be classified as Level 3 investments due to lack of market transparency and corroboration to support these quoted prices. Additionally, valuation models may be used as the pricing source for any remaining investments classified as Level 3. These models may rely on one or more significant unobservable inputs and/or significant assumptions by the Investment Manager. Inputs used in valuations may include, but are not limited to, financial statement analysis, capital account balances, discount rates and estimated cash flows, and comparable company data.
Under the direction of the Fund's Board of Trustees (the Board), the Investment Manager's Valuation Committee (the Committee) is responsible for overseeing the valuation procedures approved by the Board. The Committee consists of voting and non-voting members from various groups within the Investment Manager's organization, including operations and accounting, trading and investments, compliance, risk management and legal.
The Committee meets at least monthly to review and approve valuation matters, which may include a description of specific valuation determinations, data regarding pricing information received from approved pricing vendors and brokers and the results of Board-approved valuation control policies and procedures (the Policies). The Policies address, among other things, instances when market quotations are or are not readily available, including recommendations of third party pricing vendors and a determination of appropriate pricing methodologies; events that require specific valuation determinations and assessment of fair value techniques; securities with a potential for stale pricing, including those that are illiquid, restricted, or in default; and the effectiveness of third party pricing vendors, including periodic reviews of vendors. The Committee meets more frequently, as needed, to discuss additional valuation matters, which may include the need to review back-testing results, review time-sensitive information or approve related valuation actions. The Committee reports to the Board, with members of the Committee meeting with the Board at each of its regularly scheduled meetings to discuss valuation matters and actions during the period, similar to those described earlier.
For investments categorized as Level 3, the Committee monitors information similar to that described above, which may include: (i) data specific to the issuer or comparable issuers, (ii) general market or specific sector news and (iii) quoted prices and specific or similar security transactions. The Committee considers this data and any changes from prior periods in order to assess the reasonableness of observable and unobservable inputs, any assumptions or internal models used to value those securities and changes in fair value. This data is also used to corroborate, when available, information received from approved pricing vendors and brokers. Various factors impact the frequency of monitoring this information (which may occur as often as daily). However, the Committee may determine that changes to inputs, assumptions and models are not required as a result of the monitoring procedures performed.
The accompanying Notes to Financial Statements are an integral part of this statement.
Annual Report 2014
10
Columbia Mid Cap Value Fund
Portfolio of Investments (continued)
February 28, 2014
Fair Value Measurements (continued)
The following table is a summary of the inputs used to value the Fund's investments at February 28, 2014:
Description | | Level 1
Quoted Prices in Active
Markets for Identical
Assets ($) | | Level 2
Other Significant
Observable Inputs ($) | | Level 3
Significant
Unobservable Inputs ($) | | Total ($) | |
Equity Securities | |
Common Stocks | |
Consumer Discretionary | | | 391,351,151 | | | | — | | | | — | | | | 391,351,151 | | |
Consumer Staples | | | 58,977,093 | | | | — | | | | — | | | | 58,977,093 | | |
Energy | | | 360,100,385 | | | | — | | | | — | | | | 360,100,385 | | |
Financials | | | 1,103,315,408 | | | | — | | | | — | | | | 1,103,315,408 | | |
Health Care | | | 298,665,870 | | | | — | | | | — | | | | 298,665,870 | | |
Industrials | | | 457,369,261 | | | | — | | | | — | | | | 457,369,261 | | |
Information Technology | | | 372,204,164 | | | | — | | | | — | | | | 372,204,164 | | |
Materials | | | 195,017,595 | | | | — | | | | — | | | | 195,017,595 | | |
Telecommunication Services | | | 56,375,335 | | | | — | | | | — | | | | 56,375,335 | | |
Utilities | | | 414,468,491 | | | | — | | | | — | | | | 414,468,491 | | |
Total Equity Securities | | | 3,707,844,753 | | | | — | | | | — | | | | 3,707,844,753 | | |
Mutual Funds | |
Money Market Funds | | | 139,344,865 | | | | — | | | | — | | | | 139,344,865 | | |
Total Mutual Funds | | | 139,344,865 | | | | — | | | | — | | | | 139,344,865 | | |
Total | | | 3,847,189,618 | | | | — | | | | — | | | | 3,847,189,618 | | |
See the Portfolio of Investments for all investment classifications not indicated in the table.
There were no transfers of financial assets between levels during the period.
The accompanying Notes to Financial Statements are an integral part of this statement.
Annual Report 2014
11
Columbia Mid Cap Value Fund
Statement of Assets and Liabilities
February 28, 2014
Assets | |
Investments, at value | |
Unaffiliated issuers (identified cost $2,481,659,240) | | $ | 3,707,844,753 | | |
Affiliated issuers (identified cost $139,344,865) | | | 139,344,865 | | |
Total investments (identified cost $2,621,004,105) | | | 3,847,189,618 | | |
Receivable for: | |
Investments sold | | | 38,570,188 | | |
Capital shares sold | | | 2,123,477 | | |
Dividends | | | 3,841,829 | | |
Prepaid expenses | | | 4,733 | | |
Other assets | | | 982 | | |
Total assets | | | 3,891,730,827 | | |
Liabilities | |
Payable for: | |
Investments purchased | | | 15,219,539 | | |
Capital shares purchased | | | 4,746,885 | | |
Investment management fees | | | 69,548 | | |
Distribution and/or service fees | | | 12,429 | | |
Transfer agent fees | | | 693,144 | | |
Administration fees | | | 5,262 | | |
Plan administration fees | | | 3 | | |
Compensation of board members | | | 142,636 | | |
Other expenses | | | 200,381 | | |
Total liabilities | | | 21,089,827 | | |
Net assets applicable to outstanding capital stock | | $ | 3,870,641,000 | | |
Represented by | |
Paid-in capital | | $ | 2,348,400,004 | | |
Excess of distributions over net investment income | | | (142,532 | ) | |
Accumulated net realized gain | | | 296,198,015 | | |
Unrealized appreciation (depreciation) on: | |
Investments | | | 1,226,185,513 | | |
Total — representing net assets applicable to outstanding capital stock | | $ | 3,870,641,000 | | |
The accompanying Notes to Financial Statements are an integral part of this statement.
Annual Report 2014
12
Columbia Mid Cap Value Fund
Statement of Assets and Liabilities (continued)
February 28, 2014
Class A | |
Net assets | | $ | 1,098,949,198 | | |
Shares outstanding | | | 58,949,762 | | |
Net asset value per share | | $ | 18.64 | | |
Maximum offering price per share(a) | | $ | 19.78 | | |
Class B | |
Net assets | | $ | 15,034,457 | | |
Shares outstanding | | | 836,401 | | |
Net asset value per share | | $ | 17.98 | | |
Class C | |
Net assets | | $ | 133,281,557 | | |
Shares outstanding | | | 7,383,328 | | |
Net asset value per share | | $ | 18.05 | | |
Class I | |
Net assets | | $ | 87,661,645 | | |
Shares outstanding | | | 4,701,846 | | |
Net asset value per share | | $ | 18.64 | | |
Class K | |
Net assets | | $ | 16,410 | | |
Shares outstanding | | | 878 | | |
Net asset value per share(b) | | $ | 18.70 | | |
Class R | |
Net assets | | $ | 62,085,325 | | |
Shares outstanding | | | 3,336,309 | | |
Net asset value per share | | $ | 18.61 | | |
Class R4 | |
Net assets | | $ | 10,579,557 | | |
Shares outstanding | | | 558,239 | | |
Net asset value per share | | $ | 18.95 | | |
Class R5 | |
Net assets | | $ | 28,245,128 | | |
Shares outstanding | | | 1,490,086 | | |
Net asset value per share | | $ | 18.96 | | |
Class W | |
Net assets | | $ | 645,145 | | |
Shares outstanding | | | 34,606 | | |
Net asset value per share | | $ | 18.64 | | |
Class Y | |
Net assets | | $ | 10,175,412 | | |
Shares outstanding | | | 545,703 | | |
Net asset value per share | | $ | 18.65 | | |
The accompanying Notes to Financial Statements are an integral part of this statement.
Annual Report 2014
13
Columbia Mid Cap Value Fund
Statement of Assets and Liabilities (continued)
February 28, 2014
Class Z | |
Net assets | | $ | 2,423,967,166 | | |
Shares outstanding | | | 129,821,048 | | |
Net asset value per share | | $ | 18.67 | | |
(a) The maximum offering price per share is calculated by dividing the net asset value per share by 1.0 minus the maximum sales charge of 5.75%.
(b) Net asset value per share rounds to this amount due to fractional shares outstanding.
The accompanying Notes to Financial Statements are an integral part of this statement.
Annual Report 2014
14
Columbia Mid Cap Value Fund
Statement of Operations
Year Ended February 28, 2014
Net investment income | |
Income: | |
Dividends — unaffiliated issuers | | $ | 55,090,140 | | |
Dividends — affiliated issuers | | | 94,661 | | |
Foreign taxes withheld | | | (64,496 | ) | |
Total income | | | 55,120,305 | | |
Expenses: | |
Investment management fees | | | 25,236,516 | | |
Distribution and/or service fees | |
Class A | | | 2,617,048 | | |
Class B | | | 158,182 | | |
Class C | | | 1,228,029 | | |
Class R | | | 306,478 | | |
Class W | | | 165,640 | | |
Transfer agent fees | |
Class A | | | 1,997,358 | | |
Class B | | | 30,214 | | |
Class C | | | 234,264 | | |
Class K | | | 8 | | |
Class R | | | 117,005 | | |
Class R4 | | | 81,501 | | |
Class R5 | | | 3,475 | | |
Class W | | | 126,820 | | |
Class Z | | | 4,445,367 | | |
Administration fees | | | 1,911,227 | | |
Plan administration fees | |
Class K | | | 38 | | |
Compensation of board members | | | 93,486 | | |
Custodian fees | | | 25,264 | | |
Printing and postage fees | | | 439,340 | | |
Registration fees | | | 107,231 | | |
Professional fees | | | 66,458 | | |
Other | | | 190,295 | | |
Total expenses | | | 39,581,244 | | |
Expense reductions | | | (10,250 | ) | |
Total net expenses | | | 39,570,994 | | |
Net investment income | | | 15,549,311 | | |
Realized and unrealized gain (loss) — net | |
Net realized gain (loss) on: | |
Investments | | | 682,569,989 | | |
Net realized gain | | | 682,569,989 | | |
Net change in unrealized appreciation (depreciation) on: | |
Investments | | | 316,029,652 | | |
Net change in unrealized appreciation (depreciation) | | | 316,029,652 | | |
Net realized and unrealized gain | | | 998,599,641 | | |
Net increase in net assets resulting from operations | | $ | 1,014,148,952 | | |
The accompanying Notes to Financial Statements are an integral part of this statement.
Annual Report 2014
15
Columbia Mid Cap Value Fund
Statement of Changes in Net Assets
| | | Year Ended
February 28,
2014 | | Year Ended
February 28,
2013(a) | |
Operations | |
Net investment income | | $ | 15,549,311 | | | $ | 33,104,848 | | |
Net realized gain | | | 682,569,989 | | | | 323,437,559 | | |
Net change in unrealized appreciation (depreciation) | | | 316,029,652 | | | | 198,899,713 | | |
Net increase in net assets resulting from operations | | | 1,014,148,952 | | | | 555,442,120 | | |
Distributions to shareholders | |
Net investment income | |
Class A | | | (4,065,780 | ) | | | (7,170,777 | ) | |
Class B | | | — | | | | (20,221 | ) | |
Class C | | | (21 | ) | | | (129,220 | ) | |
Class I | | | (1,162,726 | ) | | | (1,819,725 | ) | |
Class K | | | (82 | ) | | | (108 | ) | |
Class R | | | (98,634 | ) | | | (314,169 | ) | |
Class R4 | | | (176,861 | ) | | | (7 | ) | |
Class R5 | | | (39,699 | ) | | | (8 | ) | |
Class W | | | (262,882 | ) | | | (515,159 | ) | |
Class Y | | | (59,760 | ) | | | (9,251 | ) | |
Class Z | | | (14,749,869 | ) | | | (22,426,154 | ) | |
Net realized gains | |
Class A | | | (110,660,927 | ) | | | — | | |
Class B | | | (1,645,296 | ) | | | — | | |
Class C | | | (13,376,576 | ) | | | — | | |
Class I | | | (8,972,565 | ) | | | — | | |
Class K | | | (1,686 | ) | | | — | | |
Class R | | | (6,445,418 | ) | | | — | | |
Class R4 | | | (1,168,173 | ) | | | — | | |
Class R5 | | | (1,491,804 | ) | | | — | | |
Class W | | | (2,213,063 | ) | | | — | | |
Class Y | | | (908,198 | ) | | | — | | |
Class Z | | | (240,782,029 | ) | | | — | | |
Total distributions to shareholders | | | (408,282,049 | ) | | | (32,404,799 | ) | |
Increase (decrease) in net assets from capital stock activity | | | (461,124,890 | ) | | | (842,012,844 | ) | |
Total increase (decrease) in net assets | | | 144,742,013 | | | | (318,975,523 | ) | |
Net assets at beginning of year | | | 3,725,898,987 | | | | 4,044,874,510 | | |
Net assets at end of year | | $ | 3,870,641,000 | | | $ | 3,725,898,987 | | |
Undistributed (excess of distributions over) net investment income | | $ | (142,532 | ) | | $ | 2,485,205 | | |
(a) Class R4 and Class R5 shares are for the period from November 8, 2012 (commencement of operations) to February 28, 2013.
The accompanying Notes to Financial Statements are an integral part of this statement.
Annual Report 2014
16
Columbia Mid Cap Value Fund
Statement of Changes in Net Assets (continued)
| | | Year Ended February 28, 2014 | | Year Ended February 28, 2013(a) | |
| | | Shares | | Dollars ($) | | Shares | | Dollars ($) | |
Capital stock activity | |
Class A shares | |
Subscriptions(b) | | | 9,169,646 | | | | 160,138,369 | | | | 8,635,469 | | | | 123,597,572 | | |
Distributions reinvested | | | 6,160,842 | | | | 106,256,843 | | | | 471,483 | | | | 6,604,196 | | |
Redemptions | | | (18,258,395 | ) | | | (320,107,786 | ) | | | (28,860,994 | ) | | | (408,951,908 | ) | |
Net decrease | | | (2,927,907 | ) | | | (53,712,574 | ) | | | (19,754,042 | ) | | | (278,750,140 | ) | |
Class B shares | |
Subscriptions | | | 43,753 | | | | 736,390 | | | | 18,573 | | | | 256,399 | | |
Distributions reinvested | | | 88,045 | | | | 1,467,788 | | | | 1,294 | | | | 17,749 | | |
Redemptions(b) | | | (372,363 | ) | | | (6,310,149 | ) | | | (624,470 | ) | | | (8,597,881 | ) | |
Net decrease | | | (240,565 | ) | | | (4,105,971 | ) | | | (604,603 | ) | | | (8,323,733 | ) | |
Class C shares | |
Subscriptions | | | 669,422 | | | | 11,370,828 | | | | 336,505 | | | | 4,749,574 | | |
Distributions reinvested | | | 629,478 | | | | 10,538,700 | | | | 7,236 | | | | 99,746 | | |
Redemptions | | | (1,294,360 | ) | | | (22,036,287 | ) | | | (2,208,566 | ) | | | (30,709,256 | ) | |
Net increase (decrease) | | | 4,540 | | | | (126,759 | ) | | | (1,864,825 | ) | | | (25,859,936 | ) | |
Class I shares | |
Subscriptions | | | 29,438 | | | | 513,418 | | | | 2,101,736 | | | | 29,687,470 | | |
Distributions reinvested | | | 589,320 | | | | 10,133,695 | | | | 129,936 | | | | 1,819,598 | | |
Redemptions | | | (5,922,674 | ) | | | (109,296,578 | ) | | | (2,547,087 | ) | | | (36,055,306 | ) | |
Net decrease | | | (5,303,916 | ) | | | (98,649,465 | ) | | | (315,415 | ) | | | (4,548,238 | ) | |
Class K shares | |
Distributions reinvested | | | 17 | | | | 289 | | | | 1 | | | | 18 | | |
Net increase | | | 17 | | | | 289 | | | | 1 | | | | 18 | | |
Class R shares | |
Subscriptions | | | 1,191,523 | | | | 20,737,688 | | | | 1,119,132 | | | | 15,985,362 | | |
Distributions reinvested | | | 366,748 | | | | 6,319,443 | | | | 21,819 | | | | 304,895 | | |
Redemptions | | | (1,904,641 | ) | | | (33,275,221 | ) | | | (3,225,643 | ) | | | (45,873,020 | ) | |
Net decrease | | | (346,370 | ) | | | (6,218,090 | ) | | | (2,084,692 | ) | | | (29,582,763 | ) | |
Class R4 shares | |
Subscriptions | | | 5,532,458 | | | | 97,518,368 | | | | 176 | | | | 2,500 | | |
Distributions reinvested | | | 77,048 | | | | 1,344,672 | | | | — | | | | — | | |
Redemptions | | | (5,051,443 | ) | | | (96,987,634 | ) | | | — | | | | — | | |
Net increase | | | 558,063 | | | | 1,875,406 | | | | 176 | | | | 2,500 | | |
Class R5 shares | |
Subscriptions | | | 1,504,220 | | | | 27,603,379 | | | | 175 | | | | 2,500 | | |
Distributions reinvested | | | 87,217 | | | | 1,531,135 | | | | 1 | | | | 8 | | |
Redemptions | | | (101,527 | ) | | | (1,867,200 | ) | | | — | | | | — | | |
Net increase | | | 1,489,910 | | | | 27,267,314 | | | | 176 | | | | 2,508 | | |
The accompanying Notes to Financial Statements are an integral part of this statement.
Annual Report 2014
17
Columbia Mid Cap Value Fund
Statement of Changes in Net Assets (continued)
| | | Year Ended February 28, 2014 | | Year Ended February 28, 2013(a) | |
| | | Shares | | Dollars ($) | | Shares | | Dollars ($) | |
Capital stock activity (continued) | |
Class W shares | |
Subscriptions | | | 1,891,459 | | | | 33,155,124 | | | | 1,499,020 | | | | 21,790,489 | | |
Distributions reinvested | | | 144,261 | | | | 2,474,953 | | | | 36,737 | | | | 515,108 | | |
Redemptions | | | (6,966,374 | ) | | | (128,096,278 | ) | | | (2,132,169 | ) | | | (29,795,402 | ) | |
Net decrease | | | (4,930,654 | ) | | | (92,466,201 | ) | | | (596,412 | ) | | | (7,489,805 | ) | |
Class Y shares | |
Subscriptions | | | 332,077 | | | | 5,769,301 | | | | 324,062 | | | | 4,836,824 | | |
Distributions reinvested | | | 56,000 | | | | 965,514 | | | | 625 | | | | 9,079 | | |
Redemptions | | | (152,803 | ) | | | (2,663,342 | ) | | | (16,552 | ) | | | (254,762 | ) | |
Net increase | | | 235,274 | | | | 4,071,473 | | | | 308,135 | | | | 4,591,141 | | |
Class Z shares | |
Subscriptions | | | 13,105,450 | | | | 228,177,668 | | | | 39,469,984 | | | | 550,791,418 | | |
Distributions reinvested | | | 11,926,461 | | | | 205,872,527 | | | | 1,267,831 | | | | 17,779,812 | | |
Redemptions | | | (38,453,702 | ) | | | (673,110,507 | ) | | | (74,156,868 | ) | | | (1,060,625,626 | ) | |
Net decrease | | | (13,421,791 | ) | | | (239,060,312 | ) | | | (33,419,053 | ) | | | (492,054,396 | ) | |
Total net decrease | | | (24,883,399 | ) | | | (461,124,890 | ) | | | (58,330,554 | ) | | | (842,012,844 | ) | |
(a) Class R4 and Class R5 shares are for the period from November 8, 2012 (commencement of operations) to February 28, 2013.
(b) Includes conversions of Class B shares to Class A shares, if any.
The accompanying Notes to Financial Statements are an integral part of this statement.
Annual Report 2014
18
Columbia Mid Cap Value Fund
The following tables are intended to help you understand the Fund's financial performance. Certain information reflects financial results for a single share of a class held for the periods shown. Per share net investment income (loss) amounts are calculated based on average shares outstanding during the period. Total return assumes reinvestment of all dividends and distributions, if any. Total return does not reflect payment of sales charges, if any, and is not annualized for periods of less than one year.
| | | | | Year Ended | | | |
| | | Year Ended February 28, | | February 29, | | Year Ended February 28, | |
Class A | | 2014 | | 2013 | | 2012 | | 2011 | | 2010 | |
Per share data | |
Net asset value, beginning of period | | $ | 16.02 | | | $ | 13.91 | | | $ | 14.24 | | | $ | 11.18 | | | $ | 6.87 | | |
Income from investment operations: | |
Net investment income | | | 0.05 | | | | 0.11 | | | | 0.07 | | | | 0.13 | (a) | | | 0.07 | | |
Net realized and unrealized gain (loss) | | | 4.60 | | | | 2.10 | | | | (0.33 | ) | | | 3.07 | | | | 4.32 | | |
Total from investment operations | | | 4.65 | | | | 2.21 | | | | (0.26 | ) | | | 3.20 | | | | 4.39 | | |
Less distributions to shareholders: | |
Net investment income | | | (0.07 | ) | | | (0.10 | ) | | | (0.07 | ) | | | (0.14 | ) | | | (0.07 | ) | |
Net realized gains | | | (1.96 | ) | | | — | | | | — | | | | — | | | | — | | |
Tax return of capital | | | — | | | | — | | | | — | | | | — | | | | (0.01 | ) | |
Total distributions to shareholders | | | (2.03 | ) | | | (0.10 | ) | | | (0.07 | ) | | | (0.14 | ) | | | (0.08 | ) | |
Proceeds from regulatory settlements | | | — | | | | — | | | | 0.00 | (b) | | | 0.00 | (b) | | | 0.00 | (b) | |
Net asset value, end of period | | $ | 18.64 | | | $ | 16.02 | | | $ | 13.91 | | | $ | 14.24 | | | $ | 11.18 | | |
Total return | | | 30.10 | % | | | 16.03 | % | | | (1.75 | %) | | | 28.87 | % | | | 64.09 | % | |
Ratios to average net assets(c) | |
Total gross expenses | | | 1.17 | % | | | 1.19 | % | | | 1.18 | % | | | 1.13 | % | | | 1.17 | % | |
Total net expenses(d) | | | 1.17 | %(e) | | | 1.19 | %(e) | | | 1.18 | %(e) | | | 1.13 | %(e) | | | 1.17 | %(e) | |
Net investment income | | | 0.27 | % | | | 0.75 | % | | | 0.59 | % | | | 1.05 | % | | | 0.71 | % | |
Supplemental data | |
Net assets, end of period (in thousands) | | $ | 1,098,949 | | | $ | 991,510 | | | $ | 1,135,303 | | | $ | 1,511,519 | | | $ | 1,441,388 | | |
Portfolio turnover | | | 48 | % | | | 36 | % | | | 39 | % | | | 50 | % | | | 56 | % | |
Notes to Financial Highlights
(a) Net investment income per share reflects special dividends. The effect of these dividends amounted to $0.08 per share.
(b) Rounds to zero.
(c) In addition to the fees and expenses which the Fund bears directly, the Fund indirectly bears a pro rata share of the fees and expenses of the acquired funds in which it invests. Such indirect expenses are not included in the reported expense ratios.
(d) Total net expenses include the impact of certain waivers/reimbursements made by the Investment Manager and certain of its affiliates, if applicable.
(e) The benefits derived from expense reductions had an impact of less than 0.01%.
The accompanying Notes to Financial Statements are an integral part of this statement.
Annual Report 2014
19
Columbia Mid Cap Value Fund
Financial Highlights (continued)
| | | | | Year Ended | | | |
| | | Year Ended February 28, | | February 29, | | Year Ended February 28, | |
Class B | | 2014 | | 2013 | | 2012 | | 2011 | | 2010 | |
Per share data | |
Net asset value, beginning of period | | $ | 15.56 | | | $ | 13.52 | | | $ | 13.89 | | | $ | 10.94 | | | $ | 6.73 | | |
Income from investment operations: | |
Net investment income (loss) | | | (0.08 | ) | | | 0.00 | (a) | | | (0.02 | ) | | | 0.03 | (b) | | | (0.00 | )(a) | |
Net realized and unrealized gain (loss) | | | 4.46 | | | | 2.06 | | | | (0.34 | ) | | | 3.01 | | | | 4.23 | | |
Total from investment operations | | | 4.38 | | | | 2.06 | | | | (0.36 | ) | | | 3.04 | | | | 4.23 | | |
Less distributions to shareholders: | |
Net investment income | | | — | | | | (0.02 | ) | | | (0.01 | ) | | | (0.09 | ) | | | (0.02 | ) | |
Net realized gains | | | (1.96 | ) | | | — | | | | — | | | | — | | | | — | | |
Tax return of capital | | | — | | | | — | | | | — | | | | — | | | | (0.00 | )(a) | |
Total distributions to shareholders | | | (1.96 | ) | | | (0.02 | ) | | | (0.01 | ) | | | (0.09 | ) | | | (0.02 | ) | |
Proceeds from regulatory settlements | | | — | | | | — | | | | 0.00 | (a) | | | 0.00 | (a) | | | 0.00 | (a) | |
Net asset value, end of period | | $ | 17.98 | | | $ | 15.56 | | | $ | 13.52 | | | $ | 13.89 | | | $ | 10.94 | | |
Total return | | | 29.16 | % | | | 15.22 | % | | | (2.55 | %) | | | 27.89 | % | | | 62.86 | % | |
Ratios to average net assets(c) | |
Total gross expenses | | | 1.92 | % | | | 1.94 | % | | | 1.93 | % | | | 1.88 | % | | | 1.92 | % | |
Total net expenses(d) | | | 1.92 | %(e) | | | 1.94 | %(e) | | | 1.93 | %(e) | | | 1.88 | %(e) | | | 1.92 | %(e) | |
Net investment income (loss) | | | (0.48 | %) | | | 0.01 | % | | | (0.19 | %) | | | 0.28 | % | | | (0.01 | %) | |
Supplemental data | |
Net assets, end of period (in thousands) | | $ | 15,034 | | | $ | 16,759 | | | $ | 22,740 | | | $ | 44,651 | | | $ | 68,110 | | |
Portfolio turnover | | | 48 | % | | | 36 | % | | | 39 | % | | | 50 | % | | | 56 | % | |
Notes to Financial Highlights
(a) Rounds to zero.
(b) Net investment income per share reflects special dividends. The effect of these dividends amounted to $0.08 per share.
(c) In addition to the fees and expenses which the Fund bears directly, the Fund indirectly bears a pro rata share of the fees and expenses of the acquired funds in which it invests. Such indirect expenses are not included in the reported expense ratios.
(d) Total net expenses include the impact of certain waivers/reimbursements made by the Investment Manager and certain of its affiliates, if applicable.
(e) The benefits derived from expense reductions had an impact of less than 0.01%.
The accompanying Notes to Financial Statements are an integral part of this statement.
Annual Report 2014
20
Columbia Mid Cap Value Fund
Financial Highlights (continued)
| | | | | Year Ended | | | |
| | | Year Ended February 28, | | February 29, | | Year Ended February 28, | |
Class C | | 2014 | | 2013 | | 2012 | | 2011 | | 2010 | |
Per share data | |
Net asset value, beginning of period | | $ | 15.62 | | | $ | 13.57 | | | $ | 13.94 | | | $ | 10.98 | | | $ | 6.75 | | |
Income from investment operations: | |
Net investment income (loss) | | | (0.08 | ) | | | 0.00 | (a) | | | (0.02 | ) | | | 0.04 | (b) | | | (0.00 | )(a) | |
Net realized and unrealized gain (loss) | | | 4.47 | | | | 2.07 | | | | (0.34 | ) | | | 3.01 | | | | 4.25 | | |
Total from investment operations | | | 4.39 | | | | 2.07 | | | | (0.36 | ) | | | 3.05 | | | | 4.25 | | |
Less distributions to shareholders: | |
Net investment income | | | — | | | | (0.02 | ) | | | (0.01 | ) | | | (0.09 | ) | | | (0.02 | ) | |
Net realized gains | | | (1.96 | ) | | | — | | | | — | | | | — | | | | — | | |
Tax return of capital | | | — | | | | — | | | | — | | | | — | | | | (0.00 | )(a) | |
Total distributions to shareholders | | | (1.96 | ) | | | (0.02 | ) | | | (0.01 | ) | | | (0.09 | ) | | | (0.02 | ) | |
Proceeds from regulatory settlements | | | — | | | | — | | | | 0.00 | (a) | | | 0.00 | (a) | | | 0.00 | (a) | |
Net asset value, end of period | | $ | 18.05 | | | $ | 15.62 | | | $ | 13.57 | | | $ | 13.94 | | | $ | 10.98 | | |
Total return | | | 29.11 | % | | | 15.24 | % | | | (2.54 | %) | | | 27.88 | % | | | 62.97 | % | |
Ratios to average net assets(c) | |
Total gross expenses | | | 1.92 | % | | | 1.94 | % | | | 1.93 | % | | | 1.88 | % | | | 1.92 | % | |
Total net expenses(d) | | | 1.92 | %(e) | | | 1.94 | %(e) | | | 1.93 | %(e) | | | 1.88 | %(e) | | | 1.92 | %(e) | |
Net investment income (loss) | | | (0.49 | %) | | | 0.00 | %(a) | | | (0.17 | %) | | | 0.30 | % | | | (0.03 | %) | |
Supplemental data | |
Net assets, end of period (in thousands) | | $ | 133,282 | | | $ | 115,248 | | | $ | 125,463 | | | $ | 173,457 | | | $ | 181,941 | | |
Portfolio turnover | | | 48 | % | | | 36 | % | | | 39 | % | | | 50 | % | | | 56 | % | |
Notes to Financial Highlights
(a) Rounds to zero.
(b) Net investment income per share reflects special dividends. The effect of these dividends amounted to $0.08 per share.
(c) In addition to the fees and expenses which the Fund bears directly, the Fund indirectly bears a pro rata share of the fees and expenses of the acquired funds in which it invests. Such indirect expenses are not included in the reported expense ratios.
(d) Total net expenses include the impact of certain waivers/reimbursements made by the Investment Manager and certain of its affiliates, if applicable.
(e) The benefits derived from expense reductions had an impact of less than 0.01%.
The accompanying Notes to Financial Statements are an integral part of this statement.
Annual Report 2014
21
Columbia Mid Cap Value Fund
Financial Highlights (continued)
| | | | | Year Ended | | Year Ended | |
| | | Year Ended February 28, | | February 29, | | February 28, | |
Class I | | 2014 | | 2013 | | 2012 | | 2011(a) | |
Per share data | |
Net asset value, beginning of period | | $ | 16.03 | | | $ | 13.91 | | | $ | 14.24 | | | $ | 11.68 | | |
Income from investment operations: | |
Net investment income | | | 0.12 | | | | 0.17 | | | | 0.13 | | | | 0.03 | | |
Net realized and unrealized gain (loss) | | | 4.59 | | | | 2.12 | | | | (0.33 | ) | | | 2.58 | | |
Total from investment operations | | | 4.71 | | | | 2.29 | | | | (0.20 | ) | | | 2.61 | | |
Less distributions to shareholders: | |
Net investment income | | | (0.14 | ) | | | (0.17 | ) | | | (0.13 | ) | | | (0.05 | ) | |
Net realized gains | | | (1.96 | ) | | | — | | | | — | | | | — | | |
Total distributions to shareholders | | | (2.10 | ) | | | (0.17 | ) | | | (0.13 | ) | | | (0.05 | ) | |
Proceeds from regulatory settlements | | | — | | | | — | | | | 0.00 | (b) | | | — | | |
Net asset value, end of period | | $ | 18.64 | | | $ | 16.03 | | | $ | 13.91 | | | $ | 14.24 | | |
Total return | | | 30.59 | % | | | 16.61 | % | | | (1.32 | %) | | | 22.40 | % | |
Ratios to average net assets(c) | |
Total gross expenses | | | 0.73 | % | | | 0.74 | % | | | 0.73 | % | | | 0.72 | %(d) | |
Total net expenses(e) | | | 0.73 | % | | | 0.74 | % | | | 0.73 | % | | | 0.72 | %(d) | |
Net investment income | | | 0.69 | % | | | 1.19 | % | | | 1.03 | % | | | 0.53 | %(d) | |
Supplemental data | |
Net assets, end of period (in thousands) | | $ | 87,662 | | | $ | 160,368 | | | $ | 143,562 | | | $ | 150,603 | | |
Portfolio turnover | | | 48 | % | | | 36 | % | | | 39 | % | | | 50 | % | |
Notes to Financial Highlights
(a) For the period from September 27, 2010 (commencement of operations) to February 28, 2011.
(b) Rounds to zero.
(c) In addition to the fees and expenses which the Fund bears directly, the Fund indirectly bears a pro rata share of the fees and expenses of the acquired funds in which it invests. Such indirect expenses are not included in the reported expense ratios.
(d) Annualized.
(e) Total net expenses include the impact of certain waivers/reimbursements made by the Investment Manager and certain of its affiliates, if applicable.
The accompanying Notes to Financial Statements are an integral part of this statement.
Annual Report 2014
22
Columbia Mid Cap Value Fund
Financial Highlights (continued)
| | | Year Ended February 28, | | Year Ended
February 29, | |
Class K | | 2014 | | 2013 | | 2012(a) | |
Per share data | |
Net asset value, beginning of period | | $ | 16.07 | | | $ | 13.94 | | | $ | 14.06 | | |
Income from investment operations: | |
Net investment income | | | 0.07 | | | | 0.13 | | | | 0.11 | | |
Net realized and unrealized gain (loss) | | | 4.61 | | | | 2.13 | | | | (0.15 | ) | |
Total from investment operations | | | 4.68 | | | | 2.26 | | | | (0.04 | ) | |
Less distributions to shareholders: | |
Net investment income | | | (0.09 | ) | | | (0.13 | ) | | | (0.08 | ) | |
Net realized gains | | | (1.96 | ) | | | — | | | | — | | |
Total distributions to shareholders | | | (2.05 | ) | | | (0.13 | ) | | | (0.08 | ) | |
Proceeds from regulatory settlements | | | — | | | | — | | | | 0.00 | (b) | |
Net asset value, end of period | | $ | 18.70 | | | $ | 16.07 | | | $ | 13.94 | | |
Total return | | | 30.26 | % | | | 16.31 | % | | | (0.23 | %) | |
Ratios to average net assets(c) | |
Total gross expenses | | | 1.03 | % | | | 1.04 | % | | | 1.05 | %(d) | |
Total net expenses(e) | | | 1.03 | % | | | 1.01 | % | | | 1.03 | %(d) | |
Net investment income | | | 0.40 | % | | | 0.93 | % | | | 0.86 | %(d) | |
Supplemental data | |
Net assets, end of period (in thousands) | | $ | 16 | | | $ | 14 | | | $ | 12 | | |
Portfolio turnover | | | 48 | % | | | 36 | % | | | 39 | % | |
Notes to Financial Highlights
(a) For the period from March 7, 2011 (commencement of operations) to February 29, 2012.
(b) Rounds to zero.
(c) In addition to the fees and expenses which the Fund bears directly, the Fund indirectly bears a pro rata share of the fees and expenses of the acquired funds in which it invests. Such indirect expenses are not included in the reported expense ratios.
(d) Annualized.
(e) Total net expenses include the impact of certain waivers/reimbursements made by the Investment Manager and certain of its affiliates, if applicable.
The accompanying Notes to Financial Statements are an integral part of this statement.
Annual Report 2014
23
Columbia Mid Cap Value Fund
Financial Highlights (continued)
| | | | | Year Ended | | | |
| | | Year Ended February 28, | | February 29, | | Year Ended February 28, | |
Class R | | 2014 | | 2013 | | 2012 | | 2011 | | 2010 | |
Per share data | |
Net asset value, beginning of period | | $ | 16.00 | | | $ | 13.89 | | | $ | 14.23 | | | $ | 11.18 | | | $ | 6.87 | | |
Income from investment operations: | |
Net investment income | | | 0.00 | (a) | | | 0.07 | | | | 0.01 | | | | 0.10 | (b) | | | 0.04 | | |
Net realized and unrealized gain (loss) | | | 4.59 | | | | 2.11 | | | | (0.31 | ) | | | 3.07 | | | | 4.33 | | |
Total from investment operations | | | 4.59 | | | | 2.18 | | | | (0.30 | ) | | | 3.17 | | | | 4.37 | | |
Less distributions to shareholders: | |
Net investment income | | | (0.02 | ) | | | (0.07 | ) | | | (0.04 | ) | | | (0.12 | ) | | | (0.05 | ) | |
Net realized gains | | | (1.96 | ) | | | — | | | | — | | | | — | | | | — | | |
Tax return of capital | | | — | | | | — | | | | — | | | | — | | | | (0.01 | ) | |
Total distributions to shareholders | | | (1.98 | ) | | | (0.07 | ) | | | (0.04 | ) | | | (0.12 | ) | | | (0.06 | ) | |
Proceeds from regulatory settlements | | | — | | | | — | | | | 0.00 | (a) | | | 0.00 | (a) | | | 0.00 | (a) | |
Net asset value, end of period | | $ | 18.61 | | | $ | 16.00 | | | $ | 13.89 | | | $ | 14.23 | | | $ | 11.18 | | |
Total return | | | 29.77 | % | | | 15.76 | % | | | (2.04 | %) | | | 28.53 | % | | | 63.69 | % | |
Ratios to average net assets(c) | |
Total gross expenses | | | 1.42 | % | | | 1.44 | % | | | 1.45 | % | | | 1.38 | % | | | 1.42 | % | |
Total net expenses(d) | | | 1.42 | %(e) | | | 1.44 | %(e) | | | 1.43 | %(e) | | | 1.38 | %(e) | | | 1.42 | %(e) | |
Net investment income | | | 0.02 | % | | | 0.50 | % | | | 0.15 | % | | | 0.80 | % | | | 0.44 | % | |
Supplemental data | |
Net assets, end of period (in thousands) | | $ | 62,085 | | | $ | 58,923 | | | $ | 80,096 | | | $ | 337,001 | | | $ | 276,046 | | |
Portfolio turnover | | | 48 | % | | | 36 | % | | | 39 | % | | | 50 | % | | | 56 | % | |
Notes to Financial Highlights
(a) Rounds to zero.
(b) Net investment income per share reflects special dividends. The effect of these dividends amounted to $0.08 per share.
(c) In addition to the fees and expenses which the Fund bears directly, the Fund indirectly bears a pro rata share of the fees and expenses of the acquired funds in which it invests. Such indirect expenses are not included in the reported expense ratios.
(d) Total net expenses include the impact of certain waivers/reimbursements made by the Investment Manager and certain of its affiliates, if applicable.
(e) The benefits derived from expense reductions had an impact of less than 0.01%.
The accompanying Notes to Financial Statements are an integral part of this statement.
Annual Report 2014
24
Columbia Mid Cap Value Fund
Financial Highlights (continued)
| | | Year Ended February 28, | |
Class R4 | | 2014 | | 2013(a) | |
Per share data | |
Net asset value, beginning of period | | $ | 16.26 | | | $ | 14.24 | | |
Income from investment operations: | |
Net investment income | | | 0.09 | | | | 0.06 | | |
Net realized and unrealized gain | | | 4.67 | | | | 2.00 | | |
Total from investment operations | | | 4.76 | | | | 2.06 | | |
Less distributions to shareholders: | |
Net investment income | | | (0.11 | ) | | | (0.04 | ) | |
Net realized gains | | | (1.96 | ) | | | — | | |
Total distributions to shareholders | | | (2.07 | ) | | | (0.04 | ) | |
Net asset value, end of period | | $ | 18.95 | | | $ | 16.26 | | |
Total return | | | 30.40 | % | | | 14.49 | % | |
Ratios to average net assets(b) | |
Total gross expenses | | | 0.92 | % | | | 0.85 | %(c) | |
Total net expenses(d) | | | 0.92 | %(e) | | | 0.85 | %(c) | |
Net investment income | | | 0.48 | % | | | 1.19 | %(c) | |
Supplemental data | |
Net assets, end of period (in thousands) | | $ | 10,580 | | | $ | 3 | | |
Portfolio turnover | | | 48 | % | | | 36 | % | |
Notes to Financial Highlights
(a) For the period from November 8, 2012 (commencement of operations) to February 28, 2013.
(b) In addition to the fees and expenses which the Fund bears directly, the Fund indirectly bears a pro rata share of the fees and expenses of the acquired funds in which it invests. Such indirect expenses are not included in the reported expense ratios.
(c) Annualized.
(d) Total net expenses include the impact of certain waivers/reimbursements made by the Investment Manager and certain of its affiliates, if applicable.
(e) The benefits derived from expense reductions had an impact of less than 0.01%.
The accompanying Notes to Financial Statements are an integral part of this statement.
Annual Report 2014
25
Columbia Mid Cap Value Fund
Financial Highlights (continued)
| | | Year Ended February 28, | |
Class R5 | | 2014 | | 2013(a) | |
Per share data | |
Net asset value, beginning of period | | $ | 16.26 | | | $ | 14.24 | | |
Income from investment operations: | |
Net investment income | | | 0.12 | | | | 0.06 | | |
Net realized and unrealized gain | | | 4.67 | | | | 2.00 | | |
Total from investment operations | | | 4.79 | | | | 2.06 | | |
Less distributions to shareholders: | |
Net investment income | | | (0.13 | ) | | | (0.04 | ) | |
Net realized gains | | | (1.96 | ) | | | — | | |
Total distributions to shareholders | | | (2.09 | ) | | | (0.04 | ) | |
Net asset value, end of period | | $ | 18.96 | | | $ | 16.26 | | |
Total return | | | 30.64 | % | | | 14.52 | % | |
Ratios to average net assets(b) | |
Total gross expenses | | | 0.80 | % | | | 0.77 | %(c) | |
Total net expenses(d) | | | 0.80 | % | | | 0.77 | %(c) | |
Net investment income | | | 0.67 | % | | | 1.28 | %(c) | |
Supplemental data | |
Net assets, end of period (in thousands) | | $ | 28,245 | | | $ | 3 | | |
Portfolio turnover | | | 48 | % | | | 36 | % | |
Notes to Financial Highlights
(a) For the period from November 8, 2012 (commencement of operations) to February 28, 2013.
(b) In addition to the fees and expenses which the Fund bears directly, the Fund indirectly bears a pro rata share of the fees and expenses of the acquired funds in which it invests. Such indirect expenses are not included in the reported expense ratios.
(c) Annualized.
(d) Total net expenses include the impact of certain waivers/reimbursements made by the Investment Manager and certain of its affiliates, if applicable.
The accompanying Notes to Financial Statements are an integral part of this statement.
Annual Report 2014
26
Columbia Mid Cap Value Fund
Financial Highlights (continued)
| | | | | Year Ended | | Year Ended | |
| | | Year Ended February 28, | | February 29, | | February 28, | |
Class W | | 2014 | | 2013 | | 2012 | | 2011(a) | |
Per share data | |
Net asset value, beginning of period | | $ | 16.03 | | | $ | 13.91 | | | $ | 14.24 | | | $ | 11.69 | | |
Income from investment operations: | |
Net investment income | | | 0.04 | | | | 0.11 | | | | 0.09 | | | | 0.02 | | |
Net realized and unrealized gain (loss) | | | 4.60 | | | | 2.11 | | | | (0.35 | ) | | | 2.57 | | |
Total from investment operations | | | 4.64 | | | | 2.22 | | | | (0.26 | ) | | | 2.59 | | |
Less distributions to shareholders: | |
Net investment income | | | (0.07 | ) | | | (0.10 | ) | | | (0.07 | ) | | | (0.04 | ) | |
Net realized gains | | | (1.96 | ) | | | — | | | | — | | | | — | | |
Total distributions to shareholders | | | (2.03 | ) | | | (0.10 | ) | | | (0.07 | ) | | | (0.04 | ) | |
Proceeds from regulatory settlements | | | — | | | | — | | | | 0.00 | (b) | | | — | | |
Net asset value, end of period | | $ | 18.64 | | | $ | 16.03 | | | $ | 13.91 | | | $ | 14.24 | | |
Total return | | | 30.02 | % | | | 16.09 | % | | | (1.74 | %) | | | 22.17 | % | |
Ratios to average net assets(c) | |
Total gross expenses | | | 1.16 | % | | | 1.19 | % | | | 1.19 | % | | | 1.14 | %(d) | |
Total net expenses(e) | | | 1.16 | %(f) | | | 1.19 | %(f) | | | 1.19 | %(f) | | | 1.14 | %(d)(f) | |
Net investment income | | | 0.21 | % | | | 0.74 | % | | | 0.69 | % | | | 0.34 | %(d) | |
Supplemental data | |
Net assets, end of period (in thousands) | | $ | 645 | | | $ | 79,581 | | | $ | 77,367 | | | $ | 3 | | |
Portfolio turnover | | | 48 | % | | | 36 | % | | | 39 | % | | | 50 | % | |
Notes to Financial Highlights
(a) For the period from September 27, 2010 (commencement of operations) to February 28, 2011.
(b) Rounds to zero.
(c) In addition to the fees and expenses which the Fund bears directly, the Fund indirectly bears a pro rata share of the fees and expenses of the acquired funds in which it invests. Such indirect expenses are not included in the reported expense ratios.
(d) Annualized.
(e) Total net expenses include the impact of certain waivers/reimbursements made by the Investment Manager and certain of its affiliates, if applicable.
(f) The benefits derived from expense reductions had an impact of less than 0.01%.
The accompanying Notes to Financial Statements are an integral part of this statement.
Annual Report 2014
27
Columbia Mid Cap Value Fund
Financial Highlights (continued)
| | | | | Year Ended | | | |
| | | Year Ended February 28, | | February 29, | | Year Ended February 28, | |
Class Y | | 2014 | | 2013 | | 2012 | | 2011 | | 2010(a) | |
Per share data | |
Net asset value, beginning of period | | $ | 16.03 | | | $ | 13.91 | | | $ | 14.24 | | | $ | 11.18 | | | $ | 8.86 | | |
Income from investment operations: | |
Net investment income | | | 0.12 | | | | 0.18 | | | | 0.13 | | | | 0.16 | (b) | | | 0.08 | | |
Net realized and unrealized gain (loss) | | | 4.60 | | | | 2.09 | | | | (0.34 | ) | | | 3.08 | | | | 2.31 | | |
Total from investment operations | | | 4.72 | | | | 2.27 | | | | (0.21 | ) | | | 3.24 | | | | 2.39 | | |
Less distributions to shareholders: | |
Net investment income | | | (0.14 | ) | | | (0.15 | ) | | | (0.12 | ) | | | (0.18 | ) | | | (0.06 | ) | |
Net realized gains | | | (1.96 | ) | | | — | | | | — | | | | — | | | | — | | |
Tax return of capital | | | — | | | | — | | | | — | | | | — | | | | (0.01 | ) | |
Total distributions to shareholders | | | (2.10 | ) | | | (0.15 | ) | | | (0.12 | ) | | | (0.18 | ) | | | (0.07 | ) | |
Proceeds from regulatory settlements | | | — | | | | — | | | | 0.00 | (c) | | | 0.00 | (c) | | | 0.00 | (c) | |
Net asset value, end of period | | $ | 18.65 | | | $ | 16.03 | | | $ | 13.91 | | | $ | 14.24 | | | $ | 11.18 | | |
Total return | | | 30.65 | % | | | 16.50 | % | | | (1.40 | %) | | | 29.23 | % | | | 27.00 | % | |
Ratios to average net assets(d) | |
Total gross expenses | | | 0.73 | % | | | 0.77 | % | | | 0.82 | % | | | 0.81 | % | | | 0.76 | %(e) | |
Total net expenses(f) | | | 0.73 | % | | | 0.77 | % | | | 0.82 | % | | | 0.81 | %(g) | | | 0.76 | %(e)(g) | |
Net investment income | | | 0.69 | % | | | 1.19 | % | | | 0.97 | % | | | 1.25 | % | | | 1.28 | %(e) | |
Supplemental data | |
Net assets, end of period (in thousands) | | $ | 10,175 | | | $ | 4,975 | | | $ | 32 | | | $ | 33 | | | $ | 13 | | |
Portfolio turnover | | | 48 | % | | | 36 | % | | | 39 | % | | | 50 | % | | | 56 | % | |
Notes to Financial Highlights
(a) For the period from July 15, 2009 (commencement of operations) to February 28, 2010.
(b) Net investment income per share reflects special dividends. The effect of these dividends amounted to $0.08 per share.
(c) Rounds to zero.
(d) In addition to the fees and expenses which the Fund bears directly, the Fund indirectly bears a pro rata share of the fees and expenses of the acquired funds in which it invests. Such indirect expenses are not included in the reported expense ratios.
(e) Annualized.
(f) Total net expenses include the impact of certain waivers/reimbursements made by the Investment Manager and certain of its affiliates, if applicable.
(g) The benefits derived from expense reductions had an impact of less than 0.01%.
The accompanying Notes to Financial Statements are an integral part of this statement.
Annual Report 2014
28
Columbia Mid Cap Value Fund
Financial Highlights (continued)
| | | | | Year Ended | | | |
| | | Year Ended February 28, | | February 29, | | Year Ended February 28, | |
Class Z | | 2014 | | 2013 | | 2012 | | 2011 | | 2010 | |
Per share data | |
Net asset value, beginning of period | | $ | 16.05 | | | $ | 13.93 | | | $ | 14.26 | | | $ | 11.20 | | | $ | 6.88 | | |
Income from investment operations: | |
Net investment income | | | 0.09 | | | | 0.14 | | | | 0.11 | | | | 0.16 | (a) | | | 0.09 | | |
Net realized and unrealized gain (loss) | | | 4.60 | | | | 2.12 | | | | (0.33 | ) | | | 3.07 | | | | 4.33 | | |
Total from investment operations | | | 4.69 | | | | 2.26 | | | | (0.22 | ) | | | 3.23 | | | | 4.42 | | |
Less distributions to shareholders: | |
Net investment income | | | (0.11 | ) | | | (0.14 | ) | | | (0.11 | ) | | | (0.17 | ) | | | (0.09 | ) | |
Net realized gains | | | (1.96 | ) | | | — | | | | — | | | | — | | | | — | | |
Tax return of capital | | | — | | | | — | | | | — | | | | — | | | | (0.01 | ) | |
Total distributions to shareholders | | | (2.07 | ) | | | (0.14 | ) | | | (0.11 | ) | | | (0.17 | ) | | | (0.10 | ) | |
Proceeds from regulatory settlements | | | — | | | | — | | | | 0.00 | (b) | | | 0.00 | (b) | | | 0.00 | (b) | |
Net asset value, end of period | | $ | 18.67 | | | $ | 16.05 | | | $ | 13.93 | | | $ | 14.26 | | | $ | 11.20 | | |
Total return | | | 30.37 | % | | | 16.36 | % | | | (1.50 | %) | | | 29.14 | % | | | 64.55 | % | |
Ratios to average net assets(c) | |
Total gross expenses | | | 0.92 | % | | | 0.94 | % | | | 0.93 | % | | | 0.88 | % | | | 0.92 | % | |
Total net expenses(d) | | | 0.92 | %(e) | | | 0.94 | %(e) | | | 0.93 | %(e) | | | 0.88 | %(e) | | | 0.92 | %(e) | |
Net investment income | | | 0.52 | % | | | 1.01 | % | | | 0.85 | % | | | 1.30 | % | | | 0.95 | % | |
Supplemental data | |
Net assets, end of period (in thousands) | | $ | 2,423,967 | | | $ | 2,298,515 | | | $ | 2,460,299 | | | $ | 2,859,249 | | | $ | 2,419,305 | | |
Portfolio turnover | | | 48 | % | | | 36 | % | | | 39 | % | | | 50 | % | | | 56 | % | |
Notes to Financial Highlights
(a) Net investment income per share reflects special dividends. The effect of these dividends amounted to $0.08 per share.
(b) Rounds to zero.
(c) In addition to the fees and expenses which the Fund bears directly, the Fund indirectly bears a pro rata share of the fees and expenses of the acquired funds in which it invests. Such indirect expenses are not included in the reported expense ratios.
(d) Total net expenses include the impact of certain waivers/reimbursements made by the Investment Manager and certain of its affiliates, if applicable.
(e) The benefits derived from expense reductions had an impact of less than 0.01%.
The accompanying Notes to Financial Statements are an integral part of this statement.
Annual Report 2014
29
Columbia Mid Cap Value Fund
Notes to Financial Statements
February 28, 2014
Note 1. Organization
Columbia Mid Cap Value Fund (the Fund), a series of Columbia Funds Series Trust (the Trust), is a diversified fund. The Trust is registered under the Investment Company Act of 1940, as amended (the 1940 Act), as an open-end management investment company organized as a Delaware statutory trust.
Fund Shares
The Trust may issue an unlimited number of shares (without par value). The Fund offers Class A, Class B, Class C, Class I, Class K, Class R, Class R4, Class R5, Class W, Class Y and Class Z shares. Although all share classes generally have identical voting, dividend and liquidation rights, each share class votes separately when required by law. Different share classes pay different distribution amounts to the extent the expenses of such share classes differ, and distributions in liquidation will be proportional to the net asset value of each share class. Each share class has its own expense structure and sales charges, as applicable.
Class A shares are subject to a maximum front-end sales charge of 5.75% based on the initial investment amount. Class A shares purchased without an initial sales charge in accounts aggregating $1 million to $50 million at the time of purchase are subject to a contingent deferred sales charge (CDSC) if the shares are sold within 18 months of purchase, charged as follows: 1.00% CDSC if redeemed within 12 months of purchase, and 0.50% CDSC if redeemed more than 12, but less than 18, months after purchase.
Class B shares may be subject to a maximum CDSC of 5.00% based upon the holding period after purchase. Class B shares will generally convert to Class A shares eight years after purchase. The Fund no longer accepts investments by new or existing investors in the Fund's Class B shares, except in connection with the reinvestment of any dividend and/or capital gain distributions in Class B shares of the Fund and exchanges by existing Class B shareholders of certain other funds within the Columbia Family of Funds.
Class C shares are subject to a 1.00% CDSC on shares redeemed within one year of purchase.
Class I shares are not subject to sales charges and are available only to the Columbia Family of Funds.
Class K shares are not subject to sales charges, however this share class is closed to new investors.
Class R shares are not subject to sales charges and are generally available only to certain retirement plans and other eligible investors.
Class R4 shares are not subject to sales charges and are generally available only to omnibus retirement plans and certain other eligible investors.
Class R5 shares are not subject to sales charges and are generally available only to investors purchasing through authorized investment professionals and omnibus retirement plans.
Class W shares are not subject to sales charges and are available only to investors purchasing through authorized investment programs managed by investment professionals, including discretionary managed account programs.
Class Y shares are not subject to sales charges and are generally available only to certain retirement plans.
Class Z shares are not subject to sales charges and are available only to certain eligible investors, which are subject to different investment minimums.
Note 2. Summary of Significant Accounting Policies
Use of Estimates
The preparation of financial statements in accordance with U.S. generally accepted accounting principles (GAAP) requires management to make certain estimates and assumptions that affect the reported amounts of assets and liabilities, the disclosure of contingent assets and liabilities at the date of the financial statements and the reported amounts of revenue and expenses during the reporting period. Actual results could differ from those estimates.
The following is a summary of significant accounting policies consistently followed by the Fund in the preparation of its financial statements.
Security Valuation
All equity securities are valued at the close of business of the New York Stock Exchange (NYSE). Equity securities are valued at the last quoted sales price on the principal exchange or market on which they trade, except for securities traded on the NASDAQ Stock Market, which are valued at the NASDAQ official close price. Unlisted securities or listed securities for which there were no sales during the day are valued at the mean of the latest quoted bid and ask prices on such exchanges or markets.
Foreign equity securities are valued based on quotations from the principal market in which such securities are normally traded. If any foreign share prices are not readily available as a result of limited share activity the securities are valued at the mean of the latest quoted bid and ask prices on such exchanges or markets. Foreign currency exchange rates are generally determined at 4:00 p.m. Eastern (U.S.) time. However, many securities markets and exchanges outside the U.S. close prior to the close of the NYSE; therefore, the closing prices for securities in such markets or on such
Annual Report 2014
30
Columbia Mid Cap Value Fund
Notes to Financial Statements (continued)
February 28, 2014
exchanges may not fully reflect events that occur after such close but before the close of the NYSE. In those situations, foreign securities will be fair valued pursuant to the policy adopted by the Board of Trustees (the Board), including utilizing a third party pricing service to determine these fair values. The third party pricing service takes into account multiple factors, including, but not limited to, movements in the U.S. securities markets, certain depositary receipts, futures contracts and foreign exchange rates that have occurred subsequent to the close of the foreign exchange or market, to determine a good faith estimate that reasonably reflects the current market conditions as of the close of the NYSE. The fair value of a security is likely to be different from the quoted or published price, if available.
Investments in open-end investment companies, including money market funds, are valued at net asset value.
Investments for which market quotations are not readily available, or that have quotations which management believes are not reliable, are valued at fair value as determined in good faith under consistently applied procedures established by and under the general supervision of the Board. If a security or class of securities (such as foreign securities) is valued at fair value, such value is likely to be different from the last quoted market price for the security.
The determination of fair value often requires significant judgment. To determine fair value, management may use assumptions including but not limited to future cash flows and estimated risk premiums. Multiple inputs from various sources may be used to determine fair value.
Security Transactions
Security transactions are accounted for on the trade date. Cost is determined and gains (losses) are based upon the specific identification method for both financial statement and federal income tax purposes.
Income Recognition
Corporate actions and dividend income are generally recorded net of any non-reclaimable tax withholdings, on the ex-dividend date or upon receipt of ex-dividend notification in the case of certain foreign securities.
The Fund may receive distributions from holdings in business development companies (BDCs), exchange traded funds (ETFs) and real estate investment trusts (REITs), which report information on the character of their distributions annually. These distributions are allocated to dividend income, capital gain and return of capital based on estimates made by the Fund's management if actual information has not yet been reported. Return of capital is recorded as a reduction of the cost basis of securities held. If the Fund no longer owns the
applicable securities, return of capital is recorded as a realized gain. Management's estimates are subsequently adjusted when the actual character of the distributions is disclosed by the BDCs, ETFs and REITs, which could result in a proportionate change in return of capital to shareholders.
Awards from class action litigation are recorded as a reduction of cost basis if the Fund still owns the applicable securities on the payment date. If the Fund no longer owns the applicable securities, the proceeds are recorded as realized gains.
Expenses
General expenses of the Trust are allocated to the Fund and other funds of the Trust based upon relative net assets or other expense allocation methodologies determined by the nature of the expense. Expenses directly attributable to the Fund are charged to the Fund. Expenses directly attributable to a specific class of shares are charged to that share class.
Determination of Class Net Asset Value
All income, expenses (other than class-specific expenses, which are charged to that share class, as shown in the Statement of Operations) and realized and unrealized gains (losses) are allocated to each class of the Fund on a daily basis, based on the relative net assets of each class, for purposes of determining the net asset value of each class.
Federal Income Tax Status
The Fund intends to qualify each year as a regulated investment company under Subchapter M of the Internal Revenue Code, as amended, and will distribute substantially all of its taxable income (including net short-term capital gains), if any, for its tax year, and as such will not be subject to federal income taxes. In addition, the Fund intends to distribute in each calendar year substantially all of its net investment income, capital gains and certain other amounts, if any, such that the Fund should not be subject to federal excise tax. Therefore, no federal income or excise tax provision is recorded.
Foreign Taxes
The Fund may be subject to foreign taxes on income, gains on investments or currency repatriation, a portion of which may be recoverable. The Fund will accrue such taxes and recoveries, as applicable, based upon its current interpretation of tax rules and regulations that exist in the markets in which it invests.
Realized gains in certain countries may be subject to foreign taxes at the Fund level, based on statutory rates. The Fund accrues for such foreign taxes on realized and unrealized gains at the appropriate rate for each jurisdiction, as applicable. The amount, if any, is disclosed as a liability on the Statement of Assets and Liabilities.
Annual Report 2014
31
Columbia Mid Cap Value Fund
Notes to Financial Statements (continued)
February 28, 2014
Distributions to Shareholders
Distributions from net investment income, if any, are declared and paid each calendar quarter. Net realized capital gains, if any, are distributed at least annually. Income distributions and capital gain distributions are determined in accordance with federal income tax regulations, which may differ from GAAP.
Guarantees and Indemnifications
Under the Trust's organizational documents and, in some cases, by contract, its officers and trustees are indemnified against certain liabilities arising out of the performance of their duties to the Trust or its funds. In addition, certain of the Fund's contracts with its service providers contain general indemnification clauses. The Fund's maximum exposure under these arrangements is unknown since the amount of any future claims that may be made against the Fund cannot be determined, and the Fund has no historical basis for predicting the likelihood of any such claims.
Note 3. Fees and Compensation Paid to Affiliates
Investment Management Fees
Under an Investment Management Services Agreement, Columbia Management Investment Advisers, LLC (the Investment Manager), a wholly-owned subsidiary of Ameriprise Financial, Inc. (Ameriprise Financial), determines which securities will be purchased, held or sold. The investment management fee is an annual fee that is equal to a percentage of the Fund's average daily net assets that declines from 0.76% to 0.62% as the Fund's net assets increase. The effective investment management fee rate for the year ended February 28, 2014 was 0.66% of the Fund's average daily net assets.
The Investment Manager has entered into a personnel-sharing arrangement with its affiliate, Threadneedle Investments (Threadneedle). Threadneedle, like the Investment Manager, is a wholly-owned subsidiary of Ameriprise Financial and is an SEC-registered investment adviser. Pursuant to this arrangement, certain employees of Threadneedle serve as "associated persons" of the Investment Manager and, in this capacity, subject to the oversight and supervision of the Investment Manager and consistent with the investment objectives, policies and limitations set forth in the Fund's prospectus and Statement of Additional Information (SAI), may provide research and related services, and discretionary investment management services (including acting as portfolio managers) to the Fund on behalf of the Investment Manager.
Administration Fees
Under an Administrative Services Agreement, the Investment Manager also serves as the Fund Administrator. The Fund pays the Fund Administrator an annual fee for administration and accounting services equal to a percentage of the Fund's average daily net assets that declines from 0.06% to 0.03% as the Fund's net assets increase. The effective administration fee rate for the year ended February 28, 2014 was 0.05% of the Fund's average daily net assets.
Other Expenses
Other expenses are for, among other things, miscellaneous expenses of the Fund or the Board, including payments to a company providing limited administrative services to the Fund and the Board. That company's expenses include boardroom and office expense, employee compensation, employee health and retirement benefits, and certain other expenses. For the year ended February 28, 2014, other expenses paid to this company were $10,145.
Compensation of Board Members
Board members are compensated for their services to the Fund as disclosed in the Statement of Operations. Under a Deferred Compensation Plan (the Plan), the Board members who are not "interested persons" of the Fund, as defined under the 1940 Act, may elect to defer payment of up to 100% of their compensation. Deferred amounts are treated as though equivalent dollar amounts had been invested in shares of certain funds managed by the Investment Manager. The Fund's liability for these amounts is adjusted for market value changes and remains in the Fund until distributed in accordance with the Plan.
Transfer Agent Fees
Under a Transfer and Dividend Disbursing Agent Agreement, Columbia Management Investment Services Corp. (the Transfer Agent), an affiliate of the Investment Manager and a wholly-owned subsidiary of Ameriprise Financial, is responsible for providing transfer agency services to the Fund. The Transfer Agent has contracted with Boston Financial Data Services (BFDS) to serve as sub-transfer agent.
The Transfer Agent receives monthly account-based service fees based on the number of open accounts and also receives sub-transfer agency fees based on a percentage of the average aggregate value of the Fund's shares maintained in omnibus accounts (other than omnibus accounts for which American Enterprise Investment Services Inc. is the broker of record or accounts where the beneficial shareholder is a customer of Ameriprise Financial Services, Inc., which are paid a per account fee). The Transfer Agent pays the fees of BFDS for
Annual Report 2014
32
Columbia Mid Cap Value Fund
Notes to Financial Statements (continued)
February 28, 2014
services as sub-transfer agent and is not entitled to reimbursement for such fees from the Fund (with the exception of out-of-pocket fees).
The Transfer Agent also receives compensation from fees for various shareholder services and reimbursements for certain out-of-pocket fees. Class I shares do not pay transfer agent fees. Total transfer agent fees for Class K and Class R5 shares are subject to an annual limitation of not more than 0.05% of the average daily net assets attributable to each share class. Class Y shares are not subject to transfer agent fees.
For the year ended February 28, 2014, the Fund's effective transfer agent fee rates as a percentage of average daily net assets of each class were as follows:
Class A | | | 0.19 | % | |
Class B | | | 0.19 | | |
Class C | | | 0.19 | | |
Class K | | | 0.05 | | |
Class R | | | 0.19 | | |
Class R4 | | | 0.19 | | |
Class R5 | | | 0.05 | | |
Class W | | | 0.19 | | |
Class Z | | | 0.19 | | |
An annual minimum account balance fee of $20 may apply to certain accounts with a value below the applicable share class's initial minimum investment requirements to reduce the impact of small accounts on transfer agent fees. These minimum account balance fees are recorded as part of expense reductions in the Statement of Operations. For the year ended February 28, 2014, these minimum account balance fees reduced total expenses by $10,250.
Plan Administration Fees
Under a Plan Administration Services Agreement with the Transfer Agent, the Fund pays an annual fee at a rate of 0.25% of the Fund's average daily net assets attributable to Class K shares for the provision of various administrative, recordkeeping, communication and educational services.
Distribution and Service Fees
The Fund has an agreement with Columbia Management Investment Distributors, Inc. (the Distributor), an affiliate of the Investment Manager and a wholly-owned subsidiary of Ameriprise Financial, for distribution and shareholder services. The Board has approved, and the Fund has adopted, distribution and shareholder service plans (the Plans) applicable to certain share classes, which set the distribution and service fees for the Fund. These fees are calculated daily and are intended to compensate the Distributor and/or eligible selling and/or servicing agents for selling shares of the Fund and providing services to investors.
Under the Plans, the Fund pays a monthly combined distribution and service fee to the Distributor at the maximum annual rate of 0.25% of the average daily net assets attributable to Class A shares of the Fund. Also under the Plans, the Fund pays a monthly service fee at the maximum annual rate of 0.25% of the average daily net assets attributable to Class B, Class C and Class W shares of the Fund and the payment of a monthly distribution fee at the maximum annual rates of 0.75%, 0.75%, 0.50%, 0.25% of the average daily net assets attributable to Class B, Class C, Class R and Class W shares, respectively.
Although the Fund may pay a distribution fee up to 0.25% of the Fund's average daily net assets attributable to Class W shares and a service fee of up to 0.25% of the Fund's average daily net assets attributable to Class W shares, the aggregate fee shall not exceed 0.25% of the Fund's average daily net assets attributable to Class W shares.
Sales Charges
Sales charges, including front-end charges and CDSCs, received by the Distributor for distributing Fund shares were $261,357 for Class A, $3,978 for Class B and $1,434 for Class C shares for the year ended February 28, 2014.
Expenses Waived/Reimbursed by the Investment Manager and its Affiliates
The Investment Manager and certain of its affiliates have contractually agreed to waive fees and/or reimburse expenses (excluding certain fees and expenses described below) for the periods disclosed below, unless sooner terminated at the sole discretion of the Board, so that the Fund's net operating expenses, after giving effect to fees waived/expenses reimbursed and any balance credits and/or overdraft charges from the Fund's custodian, do not exceed the following annual rates as a percentage of the class' average daily net assets:
| | | July 1, 2013
through
June 30, 2014 | | Prior to
July 1, 2013 | |
Class A | | | 1.26 | % | | | 1.27 | % | |
Class B | | | 2.01 | | | | 2.02 | | |
Class C | | | 2.01 | | | | 2.02 | | |
Class I | | | 0.86 | | | | 0.87 | | |
Class K | | | 1.16 | | | | 1.17 | | |
Class R | | | 1.51 | | | | 1.52 | | |
Class R4 | | | 1.01 | | | | 1.02 | | |
Class R5 | | | 0.91 | | | | 0.92 | | |
Class W | | | 1.26 | | | | 1.27 | | |
Class Y | | | 0.86 | | | | 0.87 | | |
Class Z | | | 1.01 | | | | 1.02 | | |
Annual Report 2014
33
Columbia Mid Cap Value Fund
Notes to Financial Statements (continued)
February 28, 2014
Under the agreement governing these fee waivers and/or expense reimbursement arrangements, the following fees and expenses are excluded from the waiver/reimbursement commitment, and therefore will be paid by the Fund, if applicable: taxes (including foreign transaction taxes), expenses associated with investments in affiliated and non-affiliated pooled investment vehicles (including mutual funds and exchange traded funds), transaction costs and brokerage commissions, costs related to any securities lending program, dividend expenses associated with securities sold short, inverse floater program fees and expenses, transaction charges and interest on borrowed money, interest, extraordinary expenses and any other expenses the exclusion of which is specifically approved by the Board. This agreement may be modified or amended only with approval from all parties.
Note 4. Federal Tax Information
The timing and character of income and capital gain distributions are determined in accordance with income tax regulations, which may differ from GAAP because of temporary or permanent book to tax differences.
At February 28, 2014, these differences are primarily due to differing treatment for deferral/reversal of wash sales losses, Trustees' deferred compensation and distribution reclassifications. To the extent these differences are permanent, reclassifications are made among the components of the Fund's net assets in the Statement of Assets and Liabilities. Temporary differences do not require reclassifications. In the Statement of Assets and Liabilities the following reclassifications were made:
Undistributed excess of distributions over net
investment income | | $ | 2,439,266
| | |
Accumulated net realized gain | | | (2,439,266 | ) | |
Paid-in capital | | | — | | |
Net investment income and net realized gains (losses), as disclosed in the Statement of Operations, and net assets were not affected by this reclassification.
The tax character of distributions paid during the years indicated was as follows:
Year Ended February 28, | | 2014 | | 2013 | |
Ordinary income | | $ | 67,161,795 | | | $ | 32,404,799 | | |
Long-term capital gains | | | 341,120,254 | | | | — | | |
Total | | $ | 408,282,049 | | | $ | 32,404,799 | | |
Short-term capital gain distributions, if any, are considered ordinary income distributions for tax purposes.
At February 28, 2014, the components of distributable earnings on a tax basis were as follows:
Undistributed ordinary income | | $ | 70,356,794 | | |
Undistributed accumulated long-term gain | | | 232,360,028 | | |
Unrealized appreciation | | | 1,219,666,706 | | |
At February 28, 2014, the cost of investments for federal income tax purposes was $2,627,522,912 and the aggregate gross unrealized appreciation and depreciation based on that cost was:
Unrealized appreciation | | $ | 1,233,856,661 | | |
Unrealized depreciation | | | (14,189,955 | ) | |
Net unrealized appreciation | | $ | 1,219,666,706 | | |
Management of the Fund has concluded that there are no significant uncertain tax positions that would require recognition in the financial statements. However, management's conclusion may be subject to review and adjustment at a later date based on factors including, but not limited to, new tax laws, regulations, and administrative interpretations (including relevant court decisions). Generally, the Fund's federal tax returns for the prior three fiscal years remain subject to examination by the Internal Revenue Service.
Note 5. Portfolio Information
The cost of purchases and proceeds from sales of securities, excluding short-term obligations, aggregated to $1,811,188,155 and $2,784,701,085, respectively, for the year ended February 28, 2014.
Note 6. Affiliated Money Market Fund
The Fund invests its daily cash balances in Columbia Short-Term Cash Fund, an affiliated money market fund established for the exclusive use by the Fund and other affiliated funds. The income earned by the Fund from such investments is included as "Dividends — affiliated issuers" in the Statement of Operations. As an investing fund, the Fund indirectly bears its proportionate share of the expenses of Columbia Short-Term Cash Fund.
Note 7. Shareholder Concentration
At February 28, 2014, two unaffiliated shareholder accounts owned an aggregate of 37.9% of the outstanding shares of the Fund. The Fund has no knowledge about whether any portion of those shares was owned beneficially by such accounts. Subscription and redemption activity by concentrated accounts may have a significant effect on the operations of the Fund.
Note 8. Line of Credit
The Fund has entered into a revolving credit facility with a syndicate of banks led by JPMorgan Chase Bank N.A.
Annual Report 2014
34
Columbia Mid Cap Value Fund
Notes to Financial Statements (continued)
February 28, 2014
whereby the Fund may borrow for the temporary funding of shareholder redemptions or for other temporary or emergency purposes. The credit facility agreement, as amended, which is a collective agreement between the Fund and certain other funds managed by the Investment Manager, severally and not jointly, permits collective borrowings up to $500 million. Interest is charged to each participating fund based on its borrowings at a rate equal to the higher of (i) the overnight federal funds rate plus 1.00% or (ii) the one-month LIBOR rate plus 1.00%. Each borrowing under the credit facility matures no later than 60 days after the date of borrowing. Effective December 10, 2013, the Fund also pays a commitment fee equal to its pro rata share of the amount of the credit facility at a rate of 0.075% per annum. Prior to December 10, 2013, the commitment fee was charged at the annual rate of 0.08% per annum. The commitment fee is included in other expenses in the Statement of Operations.
The Fund had no borrowings during the year ended February 28, 2014.
Note 9. Significant Risks
Financial Sector Risk
Sector risk occurs when a fund invests a significant portion of its assets in securities of companies conducting business in a related group of industries within an economic sector. Companies in the same economic sector may be similarly affected by economic, regulatory, political or market events or conditions, making a fund more vulnerable to unfavorable developments in that economic sector than funds that invest more broadly. The Fund may be more susceptible to the particular risks that may affect companies in the financial sector than if it were invested in a wider variety of companies in unrelated sectors.
Note 10. Subsequent Events
Management has evaluated the events and transactions that have occurred through the date the financial statements were issued and noted no items requiring adjustment of the financial statements or additional disclosure.
Note 11. Information Regarding Pending and Settled Legal Proceedings
In December 2005, without admitting or denying the allegations, American Express Financial Corporation (AEFC, which is now known as Ameriprise Financial, Inc. (Ameriprise Financial)) entered into settlement agreements with the Securities and Exchange Commission (SEC) and Minnesota Department of Commerce (MDOC) related to market timing activities. As a result, AEFC was censured and ordered to cease and desist from committing or causing any violations of certain provisions
of the Investment Advisers Act of 1940, the Investment Company Act of 1940, and various Minnesota laws. AEFC agreed to pay disgorgement of $10 million and civil money penalties of $7 million. AEFC also agreed to retain an independent distribution consultant to assist in developing a plan for distribution of all disgorgement and civil penalties ordered by the SEC in accordance with various undertakings detailed at www.sec.gov/litigation/admin/ia-2451.pdf. Ameriprise Financial and its affiliates have cooperated with the SEC and the MDOC in these legal proceedings, and have made regular reports to the Funds' Boards of Trustees.
Ameriprise Financial and certain of its affiliates have historically been involved in a number of legal, arbitration and regulatory proceedings, including routine litigation, class actions, and governmental actions, concerning matters arising in connection with the conduct of their business activities. Ameriprise Financial believes that the Funds are not currently the subject of, and that neither Ameriprise Financial nor any of its affiliates are the subject of, any pending legal, arbitration or regulatory proceedings that are likely to have a material adverse effect on the Funds or the ability of Ameriprise Financial or its affiliates to perform under their contracts with the Funds. Ameriprise Financial is required to make 10-Q, 10-K and, as necessary, 8-K filings with the Securities and Exchange Commission on legal and regulatory matters that relate to Ameriprise Financial and its affiliates. Copies of these filings may be obtained by accessing the SEC website at www.sec.gov.
There can be no assurance that these matters, or the adverse publicity associated with them, will not result in increased fund redemptions, reduced sale of fund shares or other adverse consequences to the Funds. Further, although we believe proceedings are not likely to have a material adverse effect on the Funds or the ability of Ameriprise Financial or its affiliates to perform under their contracts with the Funds, these proceedings are subject to uncertainties and, as such, we are unable to estimate the possible loss or range of loss that may result. An adverse outcome in one or more of these proceedings could result in adverse judgments, settlements, fines, penalties or other relief that could have a material adverse effect on the consolidated financial condition or results of operations of Ameriprise Financial.
Annual Report 2014
35
Columbia Mid Cap Value Fund
Report of Independent Registered Public Accounting Firm
To the Trustees of Columbia Funds Series Trust and the Shareholders of
Columbia Mid Cap Value Fund
In our opinion, the accompanying statement of assets and liabilities, including the portfolio of investments, and the related statements of operations and of changes in net assets and the financial highlights present fairly, in all material respects, the financial position of Columbia Mid Cap Value Fund (the "Fund", a series of Columbia Funds Series Trust) at February 28, 2014, and the results of its operations, the changes in its net assets and the financial highlights for each of the periods indicated, in conformity with accounting principles generally accepted in the United States of America. These financial statements and financial highlights (hereafter referred to as "financial statements") are the responsibility of the Fund's management; our responsibility is to express an opinion on these financial statements based on our audits. We conducted our audits of these financial statements in accordance with the standards of the Public Company Accounting Oversight Board (United States). Those standards require that we plan and perform the audit to obtain reasonable assurance about whether the financial statements are free of material misstatement. An audit includes examining, on a test basis, evidence supporting the amounts and disclosures in the financial statements, assessing the accounting principles used and significant estimates made by management, and evaluating the overall financial statement presentation. We believe that our audits, which included confirmation of securities at February 28, 2014 by correspondence with the custodian, brokers and transfer agent, provide a reasonable basis for our opinion.
PricewaterhouseCoopers LLP
Minneapolis, Minnesota
April 21, 2014
Annual Report 2014
36
Columbia Mid Cap Value Fund
Federal Income Tax Information
(Unaudited)
The Fund hereby designates the following tax attributes for the fiscal year ended February 28, 2014. Shareholders will be notified in early 2015 of the amounts for use in preparing 2014 income tax returns.
Tax Designations:
| Qualified Dividend Income | | | 38.09 | % | |
| Dividends Received Deduction | | | 35.56 | % | |
Capital Gain Dividend | | $ | 588,674,830 | | |
Qualified Dividend Income. For taxable, non-corporate shareholders, the percentage of ordinary income dividends paid during the fiscal year that represents qualified dividend income subject to reduced tax rates.
Dividends Received Deduction. The percentage of ordinary income dividends paid during the fiscal year that qualifies for the corporate dividends received deduction.
Capital Gain Dividend. The Fund designates as a capital gain dividend the amount reflected above, or if subsequently determined to be different, the net capital gain of such fiscal period. The Fund also designates as capital gain dividends, to the extent necessary to fully distribute such capital gains, earnings and profits distributed to shareholders on the redemption of shares.
Annual Report 2014
37
Columbia Mid Cap Value Fund
Shareholders elect the Board that oversees the Funds' operations. The Board appoints officers who are responsible for day-to-day business decisions based on policies set by the Board. The following table provides basic biographical information about the Funds' Board members, including their principal occupations during the past five years, although specific titles for individuals may have varied over the period. Under current Board policy, members may serve through the end of the calendar year in which he or she reaches either the mandatory retirement age established by the Board or the fifteenth anniversary of the first Board meeting they attended as a member of the Board.
Independent Trustees
Name,
Address,
Year of Birth | | Position Held With
Funds and Length of
Service | | Principal Occupation(s)
During Past Five Years
and Other Relevant
Professional Experience | | Number of
Funds in the
Fund Family
Overseen by
Board Member | | Other Present or Past
Directorships/
Trusteeships
(Within Past 5 Years) | |
Kathleen Blatz
901 S. Marquette Ave.
Minneapolis, MN 55402
1954 | | Board member since 1/06 for RiverSource Funds and since 6/11 for Nations Funds | | Attorney; Chief Justice, Minnesota Supreme
Court, 1998-2006 | | | 131 | | | Trustee, BlueCross BlueShield of Minnesota since 2009 | |
Edward J. Boudreau, Jr.
901 S. Marquette Ave.
Minneapolis, MN 55402
1944 | | Board member since 6/11 for RiverSource Funds and since 1/05 for Nations Funds | | Managing Director, E.J. Boudreau & Associates (consulting) since 2000; Chairman and Chief Executive Officer, John Hancock Funds (mutual funds), 1989-2000 | | | 129 | | | Former Trustee, BofA Funds Series Trust (11 funds), 2005-2011 | |
Pamela G. Carlton
901 S. Marquette Ave.
Minneapolis, MN 55402
1954 | | Board member since 7/07 for RiverSource Funds and since 6/11 for Nations Funds | | President, Springboard — Partners in Cross Cultural Leadership (consulting company) since 2003; Director or Management Director of US Equity Research, Chase Asset Management, 1996-2003; Investment Banker, Morgan Stanley, 1982-1996 | | | 131 | | | None | |
William P. Carmichael
901 S. Marquette Ave.
Minneapolis, MN 55402
1943 | | Chair of the Board since 1/14, Board member since 6/11 for RiverSource Funds and since 2003 for Nations Funds | | Retired; Co-founder, The Succession Fund (provides exit strategies to owners of privately held companies); previously, Senior Vice President, Sara Lee Corporation; Senior Vice President and Chief Financial officer, Beatrice Foods Company; Vice President, Esmark, Inc.; Associate, Price Waterhouse | | | 131 | | | Director, Cobra Electronics Corporation (electronic equipment manufacturer); The Finish Line (athletic shoes and apparel) since July 2003; Director, International Textile Corp. since 2012; former Director, McMoRan Exploration Company (oil and gas exploration and development) 2010-2013; former Trustee, BofA Funds Series Trust (11 funds), 2009-2011; Director, Spectrum Brands, Inc. (consumer products), 2002-2009; Director, Simmons Company (bedding), 2004-2010 | |
Annual Report 2014
38
Columbia Mid Cap Value Fund
Trustees and Officers (continued)
Independent Trustees (continued)
Name,
Address,
Year of Birth | | Position Held With
Funds and Length of
Service | | Principal Occupation(s)
During Past Five Years
and Other Relevant
Professional Experience | | Number of
Funds in the
Fund Family
Overseen by
Board Member | | Other Present or Past
Directorships/
Trusteeships
(Within Past 5 Years) | |
Patricia M. Flynn
901 S. Marquette Ave.
Minneapolis, MN 55402
1950 | | Board member since 11/04 for RiverSource Funds and since 6/11 for Nations Funds | | Trustee Professor of Economics and Management, Bentley University since 1976 (also teaches and conducts research on corporate governance); Dean, McCallum Graduate School of Business, Bentley University, 1992-2002 | | | 131 | | | None | |
William A. Hawkins
901 S. Marquette Ave.
Minneapolis, MN 55402
1942 | | Board member since 6/11 for RiverSource Funds and since 1/05 for Nations Funds | | Managing Director, Overton Partners (financial consulting), since August 2010; President and Chief Executive Officer, California General Bank, N.A., January 2008-August 2010 | | | 129 | | | Trustee, BofA Funds Series Trust (11 funds) | |
R. Glenn Hilliard
901 S. Marquette Ave.
Minneapolis, MN 55402
1943 | | Board member since 6/11 for RiverSource Funds and since 1/05 for Nations Funds | | Chairman and Chief Executive Officer, Hilliard Group LLC (investing and consulting) since April 2003; Non-Executive Director & Chairman, CNO Financial Group, Inc. (insurance), September 2003-May 2011 | | | 129 | | | Chairman, BofA Fund Series Trust (11 funds); former Director, CNO Financial Group, Inc. (insurance), 2003-2011 | |
Stephen R. Lewis, Jr.
901 S. Marquette Ave.
Minneapolis, MN 55402
1939 | | Board member for RiverSource Funds since 1/02 and since 6/11 for Nations Funds, Board Chair 1/07-12/13 | | President Emeritus and Professor of Economics Emeritus, Carleton College since 2002 | | | 131 | | | Director, Valmont Industries, Inc. (irrigation systems manufacturer), 2002-2013 | |
Catherine James Paglia
901 S. Marquette Ave.
Minneapolis, MN 55402
1952 | | Board member since 11/04 for RiverSource Funds and since 6/11 for Nations Funds | | Director, Enterprise Asset Management, Inc. (private real estate and asset management company) since September 1998 | | | 131 | | | Director, Valmont Industries, Inc. (irrigation systems manufacturer) since 2012 | |
Leroy C. Richie
901 S. Marquette Ave.
Minneapolis, MN 55402
1941 | | Board member since 2000 for Legacy Seligman Funds, since 11/08 for RiverSource Funds and since 6/11 for Nations Funds | | Counsel, Lewis & Munday, P.C. (law firm) since 2004; Vice President and General Counsel, Automotive Legal Affairs, Chrysler Corporation, 1993-1997 | | | 131 | | | Lead Outside Director, Digital Ally, Inc. (digital imaging) since September 2005; Director, Infinity, Inc. (oil and gas exploration and production) since 1994; Director, OGE Energy Corp. (energy and energy services) since November 2007 | |
Minor M. Shaw
901 S. Marquette Ave.
Minneapolis, MN 55402
1947 | | Board member since 6/11 for RiverSource Funds and since 2003 for Nations Funds | | President, Micco LLC (private investments) since 2011; President, Micco Corp. since 1998 | | | 129 | | | Director, Piedmont Natural Gas; Director, BlueCross BlueShield of South Carolina since April 2008; Director, National Association of Corporate Directors, Carolinas Chapter, since 2013; former Trustee, BofA Funds Series Trust (11 funds) | |
Annual Report 2014
39
Columbia Mid Cap Value Fund
Trustees and Officers (continued)
Independent Trustees (continued)
Name,
Address,
Year of Birth | | Position Held With
Funds and Length of
Service | | Principal Occupation(s)
During Past Five Years
and Other Relevant
Professional Experience | | Number of
Funds in the
Fund Family
Overseen by
Board Member | | Other Present or Past
Directorships/
Trusteeships
(Within Past 5 Years) | |
Alison Taunton-Rigby
901 S. Marquette Ave.
Minneapolis, MN 55402
1944 | | Board member since 11/02 for RiverSource Funds and since 6/11 for Nations Funds | | Chief Executive Officer and Director, RiboNovix, Inc., (biotechnology) 2003-2010 | | | 131 | | | Director, Healthways, Inc. (health and wellbeing solutions) since 2005; Director, ICI Mutual Insurance Company, RRG since 2011; Director, Abt
Associates (government contractor) since 2001; Director, Boston Children's Hospital since 2002 | |
Interested Trustee Not Affiliated with Investment Manager*
Name,
Address,
Year of Birth | | Position Held With
Funds and Length of
Service | | Principal Occupation(s)
During Past Five Years
and Other Relevant
Professional Experience | | Number of
Funds in the
Fund Family
Overseen by
Board Member | | Other Present or Past
Directorships/
Trusteeships
(Within Past 5 Years) | |
Anthony M. Santomero
901 S. Marquette Ave.
Minneapolis, MN 55402
1946 | | Board member since 6/11 for RiverSource Funds and since 1/08 for Nations Funds | | Richard K. Mellon Professor Emeritus of Finance, The Wharton School, University of Pennsylvania, since 2002; Senior Advisor, McKinsey & Company (consulting), 2006-2008 | | | 129 | | | Director, Renaissance Reinsurance Ltd. since May 2008; Trustee, Penn Mutual Life Insurance Company since March 2008; Director, Citigroup Inc. since 2009; Director, Citibank, N.A. since 2009; former Trustee, BofA Funds Series Trust (11 funds), 2008-2011 | |
* Dr. Santomero is not an affiliated person of the Investment Manager or Ameriprise Financial. However, he is currently deemed by the Funds to be an "interested person" (as defined in the 1940 Act) of the Funds because he serves as a Director of Citigroup Inc. and Citibank, N.A., companies that may directly or through subsidiaries and affiliates engage from time-to-time in brokerage execution, principal transactions and lending relationships with the Funds or accounts advised/managed by the Investment Manager.
Annual Report 2014
40
Columbia Mid Cap Value Fund
Trustees and Officers (continued)
Interested Trustee Affiliated with Investment Manager*
Name,
Address,
Year of Birth | | Position Held With
Funds and Length of
Service | | Principal Occupation(s)
During Past Five Years
and Other Relevant
Professional Experience | | Number of
Funds in the
Fund Family
Overseen by
Board Member | | Other Present or Past
Directorships/
Trusteeships
(Within Past 5 Years) | |
William F. Truscott
53600 Ameriprise
Financial Center
Minneapolis, MN 55474
1960 | | Board member since 11/01 for RiverSource Funds and since 6/11 for Nations Funds; Senior Vice President since 2002 for RiverSource Funds and since 5/10 for Nations Funds | | Chairman of the Board and President, Columbia Management Investment Advisers, LLC since May 2010 and February 2012, respectively (previously President and Chief Investment Officer, 2001-April 2010); Chief Executive Officer, Global Asset Management, Ameriprise Financial, Inc. since September 2012 (previously Chief Executive Officer, U.S. Asset Management & President, Annuities, May 2010-September 2012 and President — U.S. Asset Management and Chief Investment Officer, 2005-April 2010); Director and Chief Executive Officer, Columbia Management Investment Distributors, Inc. since May 2010 and February 2012, respectively (previously Chairman of the Board and Chief Executive Officer, 2006-April 2010); Chairman of the Board and Chief Executive Officer, RiverSource Distributors, Inc. since 2006; Director, Threadneedle Asset Management Holdings, SARL since 2014; President and Chief Executive Officer, Ameriprise Certificate Company, 2006-August 2012 | | | 183 | | | Former Director, Ameriprise Certificate Company, 2006-January 2013 | |
* Interested person (as defined under the 1940 Act) by reason of being an officer, director, security holder and/or employee of the Investment Manager or Ameriprise Financial.
The SAI has additional information about the Fund's Board members and is available, without charge, upon request by calling 800.345.6611; contacting your financial intermediary or visiting columbiamanagement.com.
Annual Report 2014
41
Columbia Mid Cap Value Fund
Trustees and Officers (continued)
The Board has appointed officers who are responsible for day-to-day business decisions based on policies it has established. The officers serve at the pleasure of the Board. In addition to Mr. Truscott, who is Senior Vice President, the Funds' other officers are:
Officers
Name,
Address and
Year of Birth | | Position and Year
First Appointed to
Position for any Fund
in the Columbia
Funds Complex or a
Predecessor Thereof | | Principal Occupation(s) During Past Five Years | |
J. Kevin Connaughton
225 Franklin Street
Boston, MA 02110
Born 1964 | | President and Principal Executive Officer (2009) | | Managing Director and General Manager — Mutual Fund Products, Columbia Management Investment Advisers, LLC since May 2010; and President, Columbia Funds since 2009; Managing Director, Columbia Management Advisors, LLC, December 2004 – April 2010; Senior Vice President and Chief Financial Officer, Columbia Funds, June 2008 – January 2009; and senior officer of Columbia Funds and affiliated funds since 2003 | |
Michael G. Clarke
225 Franklin Street
Boston, MA 02110
Born 1969 | | Treasurer (2011) and Chief Financial Officer (2009) | | Vice President — Mutual Fund Administration, Columbia Management Investment Advisers, LLC, since May 2010;Managing Director of Fund Administration, Columbia Management Advisors, LLC, September 2004 – April 2010; and senior officer of Columbia Funds and affiliated funds since 2002 | |
Scott R. Plummer
5228 Ameriprise Financial Center
Minneapolis, MN 55474
Born 1959 | | Senior Vice President (2006), Chief Legal Officer (2006) and Assistant Secretary (2011) | | Senior Vice President and Assistant General Counsel — Global Asset Management, Ameriprise Financial since February 2014 (previously, Senior Vice President and Lead Chief Counsel — Asset Management, 2012 – February 2014; Vice President and Lead Chief Counsel — Asset Management, 2010 – 2012; and Vice President and Chief Counsel — Asset Management, 2005 – 2010); Senior Vice President, Chief Legal Officer and Assistant Secretary, Columbia Management Investment Advisers, LLC since June 2005; Vice President, Chief Counsel and Assistant Secretary, Columbia Management Investment Distributors, Inc. since 2008; Vice President, General Counsel and Secretary, Ameriprise Certificate Company since 2005; Chief Counsel, RiverSource Distributors, Inc. since 2006; senior officer of Columbia Funds and affiliated funds since 2006 | |
Thomas P. McGuire
225 Franklin Street
Boston, MA 02110
Born 1972 | | Chief Compliance Officer (2012) | | Vice President — Asset Management Compliance, Ameriprise Financial, Inc. since May 2010; Chief Compliance Officer, Ameriprise Certificate Company, since September 2010; Compliance Executive, Bank of America, 2005 – April 2010 | |
Colin Moore
225 Franklin Street
Boston, MA 02110
Born 1958 | | Senior Vice President (2010) | | Executive Vice President and Global Chief Investment Officer, Ameriprise Financial, Inc. since July 2013; Director and Global Chief Investment Officer, Columbia Management Investment Advisers, LLC since May 2010; Manager, Managing Director and Chief Investment Officer, Columbia Management Advisors, LLC, 2007 – April 2010 | |
Michael E. DeFao
225 Franklin Street
Boston, MA 02110
Born 1968 | | Vice President (2011) and Assistant Secretary (2010) | | Vice President and Chief Counsel, Ameriprise Financial, Inc. since May 2010; Associate General Counsel, Bank of America 2005 – April 2010 | |
Joseph F. DiMaria
225 Franklin Street
Boston, MA 02110
Born 1968 | | Vice President (2011) and Chief Accounting Officer (2008) | | Vice President — Mutual Fund Treasurer, Columbia Management Investment Advisers, LLC since May 2010; Director of Fund Administration, Columbia Management Advisors, LLC, 2006 – April 2010 | |
Paul B. Goucher
100 Park Avenue
New York, NY 10017
Born 1968 | | Vice President (2011) and Assistant Secretary (2008) | | Vice President and Lead Chief Counsel, Ameriprise Financial, Inc. since November 2008 and January 2013, respectively (previously Chief Counsel, January 2010 – January 2013, and Group Counsel, November 2008 – January 2010); Director, Managing Director and General Counsel, J. & W. Seligman & Co. Incorporated, July 2008 – November 2008 | |
Amy Johnson
5228 Ameriprise Financial
Center
Minneapolis, MN 55474
Born 1965 | | Vice President (2006) | | Managing Director and Chief Operating Officer, Columbia Management Investment Advisers, LLC since May 2010 (previously Chief Administrative Officer, 2009 – April 2010, and Vice President — Asset Management and Trust Company Services, 2006 – 2009) | |
Annual Report 2014
42
Columbia Mid Cap Value Fund
Trustees and Officers (continued)
Officers (continued)
Name,
Address and
Year of Birth | | Position and Year
First Appointed to
Position for any Fund
in the Columbia
Funds Complex or a
Predecessor Thereof | | Principal Occupation(s) During Past Five Years | |
Paul D. Pearson
5228 Ameriprise Financial
Center
Minneapolis, MN 55474
Born 1956 | | Vice President (2011) and Assistant Treasurer (1999) | | Vice President — Investment Accounting, Columbia Management Investment Advisers, LLC since May 2010; Vice President — Managed Assets, Investment Accounting, Ameriprise Financial, Inc., 1998 – April 2010 | |
Christopher O. Petersen
5228 Ameriprise Financial Center
Minneapolis, MN 55474
Born 1970 | | Vice President and Secretary (2010) | | Vice President and Chief Counsel, Ameriprise Financial, Inc., since January 2010 (previously Vice President and Group Counsel or Counsel, 2004 – January 2010); officer of Columbia Funds and affiliated funds since 2007 | |
Stephen T. Welsh
225 Franklin Street
Boston, MA 02110
Born 1957 | | Vice President (2006) | | President and Director, Columbia Management Investment Services Corp. since May 2010; President and Director, Columbia Management Services, Inc., 2004 – April 2010; Managing Director, Columbia Management Distributors, Inc., 2007 – April 2010 | |
Annual Report 2014
43
This page intentionally left blank.
Annual Report 2014
44
Columbia Mid Cap Value Fund
Important Information About This Report
Each fund mails one shareholder report to each shareholder address. If you would like more than one report, please call shareholder services at 800.345.6611 and additional reports will be sent to you.
The policy of the Board is to vote the proxies of the companies in which each fund holds investments consistent with the procedures as stated in the Statement of Additional Information (SAI). You may obtain a copy of the SAI without charge by calling 800.345.6611; contacting your financial intermediary; visiting columbiamanagement.com; or searching the website of the Securities and Exchange Commission (SEC) at sec.gov. Information regarding how each fund voted proxies relating to portfolio securities is filed with the SEC by August 31 for the most recent 12-month period ending June 30 of that year, and is available without charge by visiting columbiamanagement.com; or searching the website of the SEC at sec.gov.
Each fund files a complete schedule of portfolio holdings with the SEC for the first and third quarters of each fiscal year on Form N-Q. Each fund's Form N-Q is available on the SEC's website at sec.gov and may be reviewed and copied at the SEC's Public Reference Room in Washington, D.C. Information on the operation of the Public Reference Room may be obtained by calling 800.SEC.0330. Each fund's complete schedule of portfolio holdings, as filed on Form N-Q, can also be obtained without charge, upon request, by calling 800.345.6611.
Annual Report 2014
45

Columbia Mid Cap Value Fund
P.O. Box 8081
Boston, MA 02266-8081
columbiamanagement.com
This information is for use with concurrent or prior delivery of a fund prospectus. Please read and consider the investment objectives, risks, charges and expenses for any fund carefully before investing. For a prospectus and, if available, a summary prospectus, which contains this and other important information about the Fund go to columbiamanagement.com. The Fund is distributed by Columbia Management Investment Distributors, Inc., member FINRA, and managed by Columbia Management Investment Advisers, LLC.
© 2014 Columbia Management Investment Advisers, LLC. All rights reserved.
ANN197_02_D01_(04/14)
Annual Report
February 28, 2014

Columbia Select Large Cap Equity Fund
(formerly Columbia Large Cap Core Fund)
Not FDIC insured • No bank guarantee • May lose value
 Dear Shareholders,
Equities recovered
In the final months of 2013, the U.S. economy embraced a robust recovery. After five years of only modest progress, the pace of economic growth picked up, job gains continued, manufacturing activity accelerated and a rebound in the housing market showed staying power. Growth, as measured by gross domestic product, was 4.1% in the third quarter, with expectations for a solid fourth quarter. Job growth averaged close to 200,000 monthly. Industrial production rose at a rate of 3.3%, considerably higher than the 12-month average of 2.5%. Factories were busier than at any point since the 2008/2009 recession, with capacity utilization at 79%. Orders for durable goods were strong, bolstered by rising auto sales. Holiday spending was solid, especially online sales, which rose 10% year over year, despite a shorter season.
Against this backdrop, the Federal Reserve's (the Fed's) announcement that it would slowly retreat from its monthly bond buying program and a bipartisan budget deal in Washington were welcome news for investors. Stocks climbed to new highs in the fourth quarter, while bonds retreated as yields moved higher. Small-cap stocks outperformed large- and mid-cap stocks, led by significant gains from the industrials, technology and consumer discretionary sectors. All 10 sectors of the S&P 500 Index delivered positive returns, although telecommunications and utilities posted only modest gains.
Fixed-income retreated
Improved economic data drove interest rates higher over the fourth quarter, credit spreads narrowed and the dollar weakened against most developed market currencies. Against this backdrop, most non-Treasury, fixed-income sectors delivered positive returns. Outgoing Fed chairman Ben Bernanke expressed concern about the persistently low level of core inflation, but gains in the labor market and reduced unemployment led to the Fed's decision to taper its bond-buying program gradually beginning in January 2014.
As the stock market soared, the riskiest sectors of the fixed-income markets fared the best. U.S. and foreign high-yield bonds were the strongest performers, followed by emerging-market and U.S. investment-grade corporate bonds. U.S. mortgage-backed securities (MBS) and securitized bonds produced negative total returns, as did U.S. Treasuries and developed world government bonds. Treasury inflation-protected bonds were the period's biggest losers. Investment-grade municipals delivered fractional gains, as better economic conditions helped steady state finances.
Stay on track with Columbia Management
Backed by more than 100 years of experience, Columbia Management is one of the nation's largest asset managers. At the heart of our success and, most importantly, that of our investors, are highly talented industry professionals, brought together by a unique way of working. At Columbia Management, reaching our performance goals matters, and how we reach them matters just as much.
Visit columbiamanagement.com for:
> The Columbia Management Perspectives blog, offering insights on current market events and investment opportunities
> Detailed up-to-date fund performance and portfolio information
> Quarterly fund commentaries
> Columbia Management Investor, our award-winning quarterly newsletter for shareholders
Thank you for your continued support of the Columbia Funds. We look forward to serving your investment needs for many years to come.
Best Regards,

J. Kevin Connaughton
President, Columbia Funds
Investing involves risk including the risk of loss of principal.
The S&P 500 Index, an unmanaged index, measures the performance of 500 widely held, large-capitalization U.S. stocks and is frequently used as a general measure of market performance. The Dow Jones Industrial Average is a price weighted average of 30 actively traded shares of blue chip US industrial corporations listed on the New York Stock Exchange. Indices are not available for investment, are not professionally managed and do not reflect sales charges, fees, brokerage commissions, taxes or other expenses of investing.
Investors should consider the investment objectives, risks, charges and expenses of a mutual fund carefully before investing. For a free prospectus and, if available, a summary prospectus, which contains this and other important information about a fund, visit columbiamanagement.com. The prospectus should be read carefully before investing.
Columbia Funds are distributed by Columbia Management Investment Distributors, Inc., member FINRA, and managed by Columbia Management Investment Advisers, LLC.
© 2014 Columbia Management Investment Advisers, LLC. All rights reserved.
Columbia Select Large Cap Equity Fund
Performance Overview | | | 2 | | |
Manager Discussion of Fund Performance | | | 4 | | |
Understanding Your Fund's Expenses | | | 6 | | |
Portfolio of Investments | | | 7 | | |
Statement of Assets and Liabilities | | | 11 | | |
Statement of Operations | | | 13 | | |
Statement of Changes in Net Assets | | | 14 | | |
Financial Highlights | | | 16 | | |
Notes to Financial Statements | | | 23 | | |
Report of Independent Registered
Public Accounting Firm | | | 31 | | |
Federal Income Tax Information | | | 32 | | |
Trustees and Officers | | | 33 | | |
Important Information About This Report | | | 41 | | |
Fund Investment Manager
Columbia Management Investment
Advisers, LLC
225 Franklin Street
Boston, MA 02110
Fund Distributor
Columbia Management Investment
Distributors, Inc.
225 Franklin Street
Boston, MA 02110
Fund Transfer Agent
Columbia Management Investment
Services Corp.
P.O. Box 8081
Boston, MA 02266-8081
For more information about any of the funds, please visit columbiamanagement.com or call 800.345.6611. Customer Service Representatives are available to answer your questions Monday through Friday from 8 a.m. to 7 p.m. Eastern time.
The views expressed in this report reflect the current views of the respective parties. These views are not guarantees of future performance and involve certain risks, uncertainties and assumptions that are difficult to predict, so actual outcomes and results may differ significantly from the views expressed. These views are subject to change at any time based upon economic, market or other conditions and the respective parties disclaim any responsibility to update such views. These views may not be relied on as investment advice and, because investment decisions for a Columbia Fund are based on numerous factors, may not be relied on as an indication of trading intent on behalf of any particular Columbia Fund. References to specific securities should not be construed as a recommendation or investment advice.
Columbia Select Large Cap Equity Fund
Performance Summary
> Columbia Select Large Cap Equity Fund (the Fund) Class A shares returned 23.89% excluding sales charges for the 12-month period that ended February 28, 2014.
> The Fund's benchmark, the S&P 500 Index, returned 25.37% for the same time period.
> Good overall stock selection, particularly within the consumer discretionary and health care sectors, aided performance. Disappointing results within the consumer staples and technology sectors accounted for the Fund's modest shortfall relative to the benchmark in a period of generally rising stock prices.
Average Annual Total Returns (%) (for period ended February 28, 2014)
| | | Inception | | 1 Year | | 5 Years | | 10 Years | |
Class A | | 08/02/99 | | | | | | | | | | | | | |
Excluding sales charges | | | | | | | 23.89 | | | | 20.46 | | | | 6.73 | | |
Including sales charges | | | | | | | 16.76 | | | | 19.03 | | | | 6.11 | | |
Class B | | 08/02/99 | | | | | | | | | | | | | |
Excluding sales charges | | | | | | | 22.99 | | | | 19.54 | | | | 5.93 | | |
Including sales charges | | | | | | | 18.76 | | | | 19.34 | | | | 5.93 | | |
Class C | | 08/02/99 | | | | | | | | | | | | | |
Excluding sales charges | | | | | | | 23.01 | | | | 19.56 | | | | 5.93 | | |
Including sales charges | | | | | | | 22.16 | | | | 19.56 | | | | 5.93 | | |
Class I* | | 09/27/10 | | | 24.51 | | | | 20.89 | | | | 7.06 | | |
Class R5* | | 11/08/12 | | | 24.40 | | | | 20.77 | | | | 7.01 | | |
Class W* | | 09/27/10 | | | 24.01 | | | | 20.49 | | | | 6.77 | | |
Class Z | | 10/02/98 | | | 24.25 | | | | 20.73 | | | | 6.99 | | |
S&P 500 Index | | | | | | | 25.37 | | | | 23.00 | | | | 7.16 | | |
Returns for Class A are shown with and without the maximum initial sales charge of 5.75%. Returns for Class B are shown with and without the applicable contingent deferred sales charge (CDSC) of 5.00% in the first year, declining to 1.00% in the sixth year and eliminated thereafter. Returns for Class C are shown with and without the 1.00% CDSC for the first year only. The Fund's other classes are not subject to sales charges and have limited eligibility. Please see the Fund's prospectus for details. Performance for different share classes will vary based on differences in sales charges and fees associated with each class. All results shown assume reinvestment of distributions during the period. Returns do not reflect the deduction of taxes that a shareholder may pay on Fund distributions or on the redemption of Fund shares. Performance results reflect the effect of any fee waivers or reimbursements of Fund expenses by Columbia Management Investment Advisers, LLC and/or any of its affiliates. Absent these fee waivers or expense reimbursement arrangements, performance results would have been lower.
The performance information shown represents past performance and is not a guarantee of future results. The investment return and principal value of your investment will fluctuate so that your shares, when redeemed, may be worth more or less than their original cost. Current performance may be lower or higher than the performance information shown. You may obtain performance information current to the most recent month-end by contacting your financial intermediary, visiting columbiamanagement.com or calling 800.345.6611.
*The returns shown for periods prior to the share class inception date (including returns for the Life of the Fund, if shown, which are since Fund inception) include the returns of the Fund's oldest share class. These returns are adjusted to reflect any higher class-related operating expenses of the newer share classes, as applicable. Please visit columbiamanagement.com/mutual-funds/appended-performance for more information.
The S&P 500 Index, an unmanaged index, measures the performance of 500 widely held, large-capitalization U.S. stocks and is frequently used as a general measure of market performance.
Indices are not available for investment, are not professionally managed and do not reflect sales charges, fees, brokerage commissions, taxes or other expenses of investing. Securities in the Fund may not match those in an index.
Annual Report 2014
2
Columbia Select Large Cap Equity Fund
Performance Overview (continued)
Performance of a Hypothetical $10,000 Investment (March 1, 2004 – February 28, 2014)
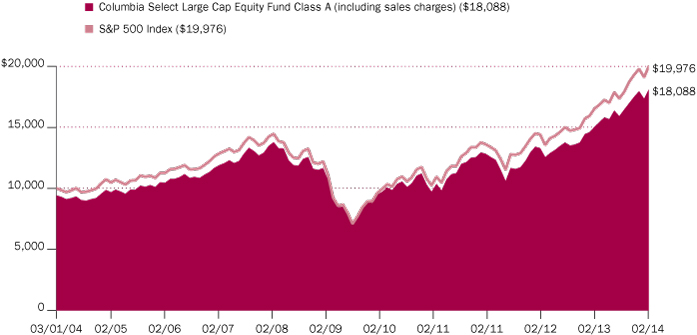
The chart above shows the change in value of a hypothetical $10,000 investment in Class A shares of Columbia Select Large Cap Equity Fund during the stated time period, and does not reflect the deduction of taxes that a shareholder may pay on Fund distributions or on the redemption of Fund shares.
Annual Report 2014
3
Columbia Select Large Cap Equity Fund
Manager Discussion of Fund Performance
For the 12-month period that ended February 28, 2014, the Fund's Class A shares returned 23.89% excluding sales charges. The Fund's benchmark, the S&P 500 Index, returned 25.37%. Good overall stock selection, particularly within the consumer discretionary and health care sectors, aided performance. Disappointing results within the consumer staples and technology sectors accounted for the Fund's modest shortfall relative to the benchmark in a period of generally rising stock prices.
Stocks Rose in a Favorable Market Environment
Steady job growth, a solid rebound in the housing market and increased manufacturing activity drove economic growth modestly higher over the 12-month period that ended February 28, 2014. Pent-up demand, low mortgage rates and an improving labor market helped home sales. Foreclosure activity also trended downward. After a brief pullback, manufacturing activity picked up midway through the period and remained strong through the end of the period. We believe business surveys and recent demand measures suggest that business spending may be poised to pick up.
Even though a host of concerns weighed on investors — the impact of tax increases and enforced federal spending cuts, another showdown over the U.S. debt ceiling, the possibility of an attack on Syria and uncertainty regarding the timing of the Federal Reserve's (the Fed's) next move on monetary policy — prices on stocks moved higher as central banks continued to pour liquidity into key markets. Midway through the period, the Fed's talk about removing monetary support dampened investor enthusiasm. However, once the Fed chose not to act until 2014, the market rally rebooted. In fact, U.S. equities posted their most significant gains since the late 1990s.
Contributors and Detractors
Stock selection in the consumer discretionary and health care sectors aided the Fund's performance in a year that was generally favorable for the equity markets all around. Within the consumer discretionary sector, a decision made last year to beef up media exposure was rewarded. Sizeable positions in Dish Networks, Viacom and TimeWarner Cable made a substantial contribution to the Fund's returns. Dish Networks, a satellite company with wireless spectrum, benefited from arms-length transactions that drove the implied value of the company's wireless assets a lot higher. Viacom benefited from a strong advertising environment, a ratings turnaround and a strong capital allocation program, through share buybacks and dividend growth. All of these factors contributed to the company's stock's rise over the course of the period. TimeWarner Cable was bought out by Comcast, which raised the value of its shares.
In the health care sector, Cardinal Health and Gilead were standout performers for the Fund. Cardinal Health, a drug distributor, benefited from the tilt toward generics and from a partnership with CVS, which has the potential to lower the company's cost profile. Gilead Sciences, a large biotech company, received final approval for its hepatitis C drug and an impressive launch of that drug aided its results.
Telecommunications stocks also aided the Fund's returns, with positive gains from SBA Communications and Vodafone, neither of which is in the benchmark. Verizon bought out Vodafone's remaining wireless stake and the market reacted positively to the transaction. The Fund sold the position during the period. SBA,
Portfolio Management
Peter Santoro, CFA
Craig Leopold, CFA
Morningstar Style BoxTM

The Morningstar Style BoxTM is based on a fund's portfolio holdings. For equity funds, the vertical axis shows the market capitalization of the stocks owned, and the horizontal axis shows investment style (value, blend, or growth). Information shown is based on the most recent data provided by Morningstar.
© 2014 Morningstar, Inc. All rights reserved. The Morningstar information contained herein: (1) is proprietary to Morningstar and/or its content providers; (2) may not be copied or distributed; and (3) is not warranted to be accurate, complete or timely. Neither Morningstar nor its content providers are responsible for any damages or losses arising from any use of this information.
Top Ten Holdings (%)
(at February 28, 2014) | |
Google, Inc., Class A | | | 4.1 | | |
JPMorgan Chase & Co. | | | 3.0 | | |
Amgen, Inc. | | | 2.9 | | |
CVS Caremark Corp. | | | 2.7 | | |
Citigroup, Inc. | | | 2.7 | | |
Cardinal Health, Inc. | | | 2.5 | | |
Honeywell International, Inc. | | | 2.5 | | |
Merck & Co., Inc. | | | 2.5 | | |
Verizon Communications, Inc. | | | 2.5 | | |
Microsoft Corp. | | | 2.4 | | |
Percentages indicated are based upon total investments (excluding Money Market Funds).
For further detail about these holdings, please refer to the section entitled "Portfolio of Investments."
Fund holdings are as of the date given, are subject to change at any time, and are not recommendations to buy or sell any security.
Annual Report 2014
4
Columbia Select Large Cap Equity Fund
Manager Discussion of Fund Performance (continued)
a tower company, benefited as wireless companies indicated a desire to upgrade their networks, putting the company in the sweet spot of its industry.
Consumer staples and technology stocks led the list of disappointments for the period. Within consumer staples, Phillip Morris, an overweight in the portfolio, lost ground as volume growth disappointed and currency exposure weighed on results. Within technology, positions in F5 and Citrix, both growth-oriented names, were bid down as technology spending slowed and the technology market shifted in favor of new technologies, such as web services and data centers.
Looking Ahead
After a strong 2013, we currently believe that cross correlations in the market will continue to widen as the economy picks up to a more normal pace of growth. We intend to look for higher quality companies with superior growth trends and the ability to generate high levels of cash flow. We expect to favor companies that we believe can grow independent of economic conditions, often by innovation. We look for companies whose managements we believe have demonstrated their concern for shareholders by re-structuring and streamlining operations and increasing dividend payouts.
Portfolio Breakdown (%)
(at February 28, 2014) | |
Common Stocks | | | 96.6 | | |
Consumer Discretionary | | | 11.7 | | |
Consumer Staples | | | 9.8 | | |
Energy | | | 8.7 | | |
Financials | | | 14.7 | | |
Health Care | | | 15.7 | | |
Industrials | | | 11.5 | | |
Information Technology | | | 17.0 | | |
Materials | | | 2.9 | | |
Telecommunication Services | | | 4.6 | | |
Limited Partnerships | | | 1.1 | | |
Money Market Funds | | | 2.3 | | |
Total | | | 100.0 | | |
Percentages indicated are based upon total investments. The Fund's portfolio composition is subject to change.
Investment Risks
The Fund is subject to stock market fluctuations and changes in the values of specific fund holdings due to economic and business developments. See the Fund's prospectus for information on these and other risks.
Annual Report 2014
5
Columbia Select Large Cap Equity Fund
Understanding Your Fund's Expenses
(Unaudited)
As an investor, you incur two types of costs. There are transaction costs, which generally include sales charges on purchases and may include redemption fees. There are also ongoing costs, which generally include management fees, distribution and/or service fees, and other fund expenses. The following information is intended to help you understand your ongoing costs (in dollars) of investing in the Fund and to help you compare these costs with the ongoing costs of investing in other mutual funds.
Analyzing Your Fund's Expenses
To illustrate these ongoing costs, we have provided examples and calculated the expenses paid by investors in each share class of the Fund during the period. The actual and hypothetical information in the table is based on an initial investment of $1,000 at the beginning of the period indicated and held for the entire period. Expense information is calculated two ways and each method provides you with different information. The amount listed in the "Actual" column is calculated using the Fund's actual operating expenses and total return for the period. You may use the Actual information, together with the amount invested, to estimate the expenses that you paid over the period. Simply divide your account value by $1,000 (for example, an $8,600 account value divided by $1,000 = 8.6), then multiply the results by the expenses paid during the period under the "Actual" column. The amount listed in the "Hypothetical" column assumes a 5% annual rate of return before expenses (which is not the Fund's actual return) and then applies the Fund's actual expense ratio for the period to the hypothetical return. You should not use the hypothetical account values and expenses to estimate either your actual account balance at the end of the period or the expenses you paid during the period. See "Compare With Other Funds" below for details on how to use the hypothetical data.
Compare With Other Funds
Since all mutual funds are required to include the same hypothetical calculations about expenses in shareholder reports, you can use this information to compare the ongoing cost of investing in the Fund with other funds. To do so, compare the hypothetical example with the 5% hypothetical examples that appear in the shareholder reports of other funds. As you compare hypothetical examples of other funds, it is important to note that hypothetical examples are meant to highlight the ongoing costs of investing in a fund only and do not reflect any transaction costs, such as sales charges, or redemption or exchange fees. Therefore, the hypothetical calculations are useful in comparing ongoing costs only, and will not help you determine the relative total costs of owning different funds. If transaction costs were included in these calculations, your costs would be higher.
September 1, 2013 – February 28, 2014
| | | Account Value at the Beginning
of the Period ($) | | Account Value at the End of the
Period ($) | | Expenses Paid During the
Period ($) | | Fund's Annualized
Expense Ratio (%) | |
| | | Actual | | Hypothetical | | Actual | | Hypothetical | | Actual | | Hypothetical | | Actual | |
Class A | | | 1,000.00 | | | | 1,000.00 | | | | 1,136.50 | | | | 1,019.05 | | | | 6.29 | | | | 5.94 | | | | 1.18 | | |
Class B | | | 1,000.00 | | | | 1,000.00 | | | | 1,132.60 | | | | 1,015.31 | | | | 10.26 | | | | 9.70 | | | | 1.93 | | |
Class C | | | 1,000.00 | | | | 1,000.00 | | | | 1,132.70 | | | | 1,015.31 | | | | 10.26 | | | | 9.70 | | | | 1.93 | | |
Class I | | | 1,000.00 | | | | 1,000.00 | | | | 1,139.60 | | | | 1,021.04 | | | | 4.16 | | | | 3.93 | | | | 0.78 | | |
Class R5 | | | 1,000.00 | | | | 1,000.00 | | | | 1,139.20 | | | | 1,020.79 | | | | 4.43 | | | | 4.18 | | | | 0.83 | | |
Class W | | | 1,000.00 | | | | 1,000.00 | | | | 1,137.50 | | | | 1,019.05 | | | | 6.29 | | | | 5.94 | | | | 1.18 | | |
Class Z | | | 1,000.00 | | | | 1,000.00 | | | | 1,138.10 | | | | 1,020.29 | | | | 4.96 | | | | 4.68 | | | | 0.93 | | |
Expenses paid during the period are equal to the annualized expense ratio for each class as indicated above, multiplied by the average account value over the period and then multiplied by the number of days in the Fund's most recent fiscal half year and divided by 365.
Expenses do not include fees and expenses incurred indirectly by the Fund from the underlying funds in which the Fund may invest (also referred to as "acquired funds"), including affiliated and non-affiliated pooled investment vehicles (including mutual funds and exchange-traded funds).
Had Columbia Management Investment Advisers, LLC and/or certain of its affiliates not waived/reimbursed certain fees and expenses, account value at the end of the period would have been reduced.
Annual Report 2014
6
Columbia Select Large Cap Equity Fund
Portfolio of Investments
February 28, 2014
(Percentages represent value of investments compared to net assets)
Common Stocks 97.1%
Issuer | | Shares | | Value ($) | |
Consumer Discretionary 11.8% | |
Auto Components 1.3% | |
Delphi Automotive PLC | | | 107,410 | | | | 7,150,284 | | |
Hotels, Restaurants & Leisure 2.3% | |
Starwood Hotels & Resorts Worldwide, Inc. | | | 153,340 | | | | 12,644,416 | | |
Household Durables 1.0% | |
Mohawk Industries, Inc.(a) | | | 38,950 | | | | 5,512,593 | | |
Internet & Catalog Retail 1.0% | |
Amazon.com, Inc.(a) | | | 15,010 | | | | 5,435,121 | | |
Media 6.2% | |
Comcast Corp., Class A | | | 176,380 | | | | 9,117,082 | | |
DISH Network Corp., Class A(a) | | | 126,023 | | | | 7,415,193 | | |
Time Warner Cable, Inc. | | | 49,830 | | | | 6,993,641 | | |
Viacom, Inc., Class B | | | 120,598 | | | | 10,580,063 | | |
Total | | | | | 34,105,979 | | |
Total Consumer Discretionary | | | | | 64,848,393 | | |
Consumer Staples 9.8% | |
Beverages 3.7% | |
Coca-Cola Enterprises, Inc. | | | 209,983 | | | | 9,886,000 | | |
Diageo PLC, ADR | | | 81,050 | | | | 10,188,795 | | |
Total | | | | | 20,074,795 | | |
Food & Staples Retailing 2.6% | |
CVS Caremark Corp. | | | 197,510 | | | | 14,445,882 | | |
Personal Products 1.6% | |
Estee Lauder Companies, Inc. (The),
Class A | | | 125,800 | | | | 8,660,072 | | |
Tobacco 1.9% | |
Philip Morris International, Inc. | | | 132,110 | | | | 10,689,020 | | |
Total Consumer Staples | | | | | 53,869,769 | | |
Energy 8.8% | |
Energy Equipment & Services 3.4% | |
National Oilwell Varco, Inc. | | | 84,530 | | | | 6,512,191 | | |
Schlumberger Ltd. | | | 132,090 | | | | 12,284,370 | | |
Total | | | | | 18,796,561 | | |
Oil, Gas & Consumable Fuels 5.4% | |
Chevron Corp. | | | 85,485 | | | | 9,858,985 | | |
ConocoPhillips | | | 139,220 | | | | 9,258,130 | | |
EOG Resources, Inc. | | | 54,527 | | | | 10,328,505 | | |
Total | | | | | 29,445,620 | | |
Total Energy | | | | | 48,242,181 | | |
Common Stocks (continued)
Issuer | | Shares | | Value ($) | |
Financials 14.7% | |
Capital Markets 1.7% | |
T. Rowe Price Group, Inc. | | | 117,090 | | | | 9,504,195 | | |
Commercial Banks 1.7% | |
Fifth Third Bancorp | | | 428,680 | | | | 9,300,213 | | |
Consumer Finance 1.2% | |
Capital One Financial Corp. | | | 89,940 | | | | 6,604,294 | | |
Diversified Financial Services 5.6% | |
Citigroup, Inc. | | | 295,870 | | | | 14,388,158 | | |
JPMorgan Chase & Co. | | | 288,681 | | | | 16,402,854 | | |
Total | | | | | 30,791,012 | | |
Insurance 4.5% | |
Marsh & McLennan Companies, Inc. | | | 168,580 | | | | 8,118,813 | | |
MetLife, Inc. | | | 164,880 | | | | 8,354,470 | | |
Prudential Financial, Inc. | | | 97,266 | | | | 8,226,758 | | |
Total | | | | | 24,700,041 | | |
Total Financials | | | | | 80,899,755 | | |
Health Care 15.8% | |
Biotechnology 5.5% | |
Amgen, Inc. | | | 125,610 | | | | 15,578,152 | | |
Cubist Pharmaceuticals, Inc.(a) | | | 25,650 | | | | 2,039,688 | | |
Gilead Sciences, Inc.(a) | | | 102,320 | | | | 8,471,073 | | |
Vertex Pharmaceuticals, Inc.(a) | | | 49,282 | | | | 3,984,942 | | |
Total | | | | | 30,073,855 | | |
Health Care Equipment & Supplies 3.5% | |
Covidien PLC | | | 159,720 | | | | 11,491,854 | | |
Zimmer Holdings, Inc. | | | 84,654 | | | | 7,943,931 | | |
Total | | | | | 19,435,785 | | |
Health Care Providers & Services 2.5% | |
Cardinal Health, Inc. | | | 190,420 | | | | 13,620,743 | | |
Pharmaceuticals 4.3% | |
AbbVie, Inc. | | | 197,420 | | | | 10,050,652 | | |
Merck & Co., Inc. | | | 233,960 | | | | 13,333,381 | | |
Total | | | | | 23,384,033 | | |
Total Health Care | | | | | 86,514,416 | | |
The accompanying Notes to Financial Statements are an integral part of this statement.
Annual Report 2014
7
Columbia Select Large Cap Equity Fund
Portfolio of Investments (continued)
February 28, 2014
Common Stocks (continued)
Issuer | | Shares | | Value ($) | |
Industrials 11.6% | |
Aerospace & Defense 5.7% | |
Boeing Co. (The) | | | 79,907 | | | | 10,301,610 | | |
Honeywell International, Inc. | | | 144,042 | | | | 13,603,327 | | |
Raytheon Co. | | | 77,720 | | | | 7,609,565 | | |
Total | | | | | 31,514,502 | | |
Industrial Conglomerates 1.8% | |
General Electric Co. | | | 387,490 | | | | 9,869,371 | | |
Machinery 2.8% | |
Ingersoll-Rand PLC | | | 126,100 | | | | 7,709,754 | | |
Pall Corp. | | | 86,880 | | | | 7,471,680 | | |
Total | | | | | 15,181,434 | | |
Professional Services 1.3% | |
Nielsen Holdings NV | | | 151,130 | | | | 7,154,494 | | |
Total Industrials | | | | | 63,719,801 | | |
Information Technology 17.1% | |
Computers & Peripherals 4.0% | |
Apple, Inc. | | | 21,960 | | | | 11,556,230 | | |
EMC Corp. | | | 398,154 | | | | 10,499,321 | | |
Total | | | | | 22,055,551 | | |
Internet Software & Services 5.0% | |
Equinix, Inc.(a) | | | 28,760 | | | | 5,463,250 | | |
Google, Inc., Class A(a) | | | 18,034 | | | | 21,923,032 | | |
Total | | | | | 27,386,282 | | |
Semiconductors & Semiconductor Equipment 4.3% | |
Avago Technologies Ltd. | | | 76,339 | | | | 4,710,116 | | |
Broadcom Corp., Class A | | | 308,330 | | | | 9,163,568 | | |
KLA-Tencor Corp. | | | 145,340 | | | | 9,468,901 | | |
Total | | | | | 23,342,585 | | |
Software 3.8% | |
Microsoft Corp. | | | 334,710 | | | | 12,822,740 | | |
Salesforce.com, Inc.(a) | | | 132,100 | | | | 8,239,077 | | |
Total | | | | | 21,061,817 | | |
Total Information Technology | | | | | 93,846,235 | | |
Common Stocks (continued)
Issuer | | Shares | | Value ($) | |
Materials 2.9% | |
Chemicals 2.9% | |
LyondellBasell Industries NV, Class A | | | 79,602 | | | | 7,011,344 | | |
Monsanto Co. | | | 80,410 | | | | 8,846,708 | | |
Total | | | | | 15,858,052 | | |
Total Materials | | | | | 15,858,052 | | |
Telecommunication Services 4.6% | |
Diversified Telecommunication Services 2.4% | |
Verizon Communications, Inc. | | | 279,360 | | | | 13,291,949 | | |
Wireless Telecommunication Services 2.2% | |
SBA Communications Corp., Class A(a) | | | 125,000 | | | | 11,896,250 | | |
Total Telecommunication Services | | | | | 25,188,199 | | |
Total Common Stocks
(Cost: $434,097,604) | | | | | 532,986,801 | | |
Limited Partnerships 1.1%
Energy 1.1% | |
Oil, Gas & Consumable Fuels 1.1% | |
Plains GP Holdings LP, Class A | | | 209,340 | | | | 5,861,520 | | |
Total Energy | | | | | 5,861,520 | | |
Total Limited Partnerships
(Cost: $5,657,574) | | | | | 5,861,520 | | |
Money Market Funds 2.3%
| | | Shares | | Value ($) | |
Columbia Short-Term Cash Fund,
0.098%(b)(c) | | | 12,685,848 | | | | 12,685,848 | | |
Total Money Market Funds
(Cost: $12,685,848) | | | | | 12,685,848 | | |
Total Investments
(Cost: $452,441,026) | | | | | 551,534,169 | | |
Other Assets & Liabilities, Net | | | | | (2,557,293 | ) | |
Net Assets | | | | | 548,976,876 | | |
The accompanying Notes to Financial Statements are an integral part of this statement.
Annual Report 2014
8
Columbia Select Large Cap Equity Fund
Portfolio of Investments (continued)
February 28, 2014
Notes to Portfolio of Investments
(a) Non-income producing.
(b) The rate shown is the seven-day current annualized yield at February 28, 2014.
(c) As defined in the Investment Company Act of 1940, an affiliated company is one in which the Fund owns 5% or more of its outstanding voting securities, or a company which is under common ownership or control with the Fund. Holdings and transactions in these affiliated companies during the year ended February 28, 2014, are as follows:
Issuer | | Beginning
Cost ($) | | Purchase
Cost ($) | | Proceeds
From Sales ($) | | Ending
Cost ($) | | Dividends —
Affiliated
Issuers ($) | | Value ($) | |
Columbia Short-Term Cash Fund | | | 11,840,690 | | | | 149,968,230 | | | | (149,123,072 | ) | | | 12,685,848 | | | | 14,174 | | | | 12,685,848 | | |
Abbreviation Legend
ADR American Depositary Receipt
Fair Value Measurements
Generally accepted accounting principles (GAAP) require disclosure regarding the inputs and valuation techniques used to measure fair value and any changes in valuation inputs or techniques. In addition, investments shall be disclosed by major category.
The Fund categorizes its fair value measurements according to a three-level hierarchy that maximizes the use of observable inputs and minimizes the use of unobservable inputs by prioritizing that the most observable input be used when available. Observable inputs are those that market participants would use in pricing an investment based on market data obtained from sources independent of the reporting entity. Unobservable inputs are those that reflect the Fund's assumptions about the information market participants would use in pricing an investment. An investment's level within the fair value hierarchy is based on the lowest level of any input that is deemed significant to the asset or liability's fair value measurement. The input levels are not necessarily an indication of the risk or liquidity associated with investments at that level. For example, certain U.S. government securities are generally high quality and liquid, however, they are reflected as Level 2 because the inputs used to determine fair value may not always be quoted prices in an active market.
Fair value inputs are summarized in the three broad levels listed below:
> Level 1 — Valuations based on quoted prices for investments in active markets that the Fund has the ability to access at the measurement date (including NAV for open-end mutual funds). Valuation adjustments are not applied to Level 1 investments.
> Level 2 — Valuations based on other significant observable inputs (including quoted prices for similar securities, interest rates, prepayment speeds, credit risks, etc.).
> Level 3 — Valuations based on significant unobservable inputs (including the Fund's own assumptions and judgment in determining the fair value of investments).
Inputs that are used in determining fair value of an investment may include price information, credit data, volatility statistics, and other factors. These inputs can be either observable or unobservable. The availability of observable inputs can vary between investments, and is affected by various factors such as the type of investment, and the volume and level of activity for that investment or similar investments in the marketplace. The inputs will be considered by the Investment Manager, along with any other relevant factors in the calculation of an investment's fair value. The Fund uses prices and inputs that are current as of the measurement date, which may include periods of market dislocations. During these periods, the availability of prices and inputs may be reduced for many investments. This condition could cause an investment to be reclassified between the various levels within the hierarchy.
Investments falling into the Level 3 category are primarily supported by quoted prices from brokers and dealers participating in the market for those investments. However, these may be classified as Level 3 investments due to lack of market transparency and corroboration to support these quoted prices. Additionally, valuation models may be used as the pricing source for any remaining investments classified as Level 3. These models may rely on one or more significant unobservable inputs and/or significant assumptions by the Investment Manager. Inputs used in valuations may include, but are not limited to, financial statement analysis, capital account balances, discount rates and estimated cash flows, and comparable company data.
Under the direction of the Fund's Board of Trustees (the Board), the Investment Manager's Valuation Committee (the Committee) is responsible for overseeing the valuation procedures approved by the Board. The Committee consists of voting and non-voting members from various groups within the Investment Manager's organization, including operations and accounting, trading and investments, compliance, risk management and legal.
The accompanying Notes to Financial Statements are an integral part of this statement.
Annual Report 2014
9
Columbia Select Large Cap Equity Fund
Portfolio of Investments (continued)
February 28, 2014
Fair Value Measurements (continued)
The Committee meets at least monthly to review and approve valuation matters, which may include a description of specific valuation determinations, data regarding pricing information received from approved pricing vendors and brokers and the results of Board-approved valuation control policies and procedures (the Policies). The Policies address, among other things, instances when market quotations are or are not readily available, including recommendations of third party pricing vendors and a determination of appropriate pricing methodologies; events that require specific valuation determinations and assessment of fair value techniques; securities with a potential for stale pricing, including those that are illiquid, restricted, or in default; and the effectiveness of third party pricing vendors, including periodic reviews of vendors. The Committee meets more frequently, as needed, to discuss additional valuation matters, which may include the need to review back-testing results, review time-sensitive information or approve related valuation actions. The Committee reports to the Board, with members of the Committee meeting with the Board at each of its regularly scheduled meetings to discuss valuation matters and actions during the period, similar to those described earlier.
For investments categorized as Level 3, the Committee monitors information similar to that described above, which may include: (i) data specific to the issuer or comparable issuers, (ii) general market or specific sector news and (iii) quoted prices and specific or similar security transactions. The Committee considers this data and any changes from prior periods in order to assess the reasonableness of observable and unobservable inputs, any assumptions or internal models used to value those securities and changes in fair value. This data is also used to corroborate, when available, information received from approved pricing vendors and brokers. Various factors impact the frequency of monitoring this information (which may occur as often as daily). However, the Committee may determine that changes to inputs, assumptions and models are not required as a result of the monitoring procedures performed.
The following table is a summary of the inputs used to value the Fund's investments at February 28, 2014:
Description | | Level 1
Quoted Prices in Active
Markets for Identical
Assets ($) | | Level 2
Other Significant
Observable Inputs ($) | | Level 3
Significant
Unobservable Inputs ($) | | Total ($) | |
Equity Securities | |
Common Stocks | |
Consumer Discretionary | | | 64,848,393 | | | | — | | | | — | | | | 64,848,393 | | |
Consumer Staples | | | 53,869,769 | | | | — | | | | — | | | | 53,869,769 | | |
Energy | | | 48,242,181 | | | | — | | | | — | | | | 48,242,181 | | |
Financials | | | 80,899,755 | | | | — | | | | — | | | | 80,899,755 | | |
Health Care | | | 86,514,416 | | | | — | | | | — | | | | 86,514,416 | | |
Industrials | | | 63,719,801 | | | | — | | | | — | | | | 63,719,801 | | |
Information Technology | | | 93,846,235 | | | | — | | | | — | | | | 93,846,235 | | |
Materials | | | 15,858,052 | | | | — | | | | — | | | | 15,858,052 | | |
Telecommunication Services | | | 25,188,199 | | | | — | | | | — | | | | 25,188,199 | | |
Total Equity Securities | | | 532,986,801 | | | | — | | | | — | | | | 532,986,801 | | |
Other | |
Limited Partnerships | | | 5,861,520 | | | | — | | | | — | | | | 5,861,520 | | |
Total Other | | | 5,861,520 | | | | — | | | | — | | | | 5,861,520 | | |
Mutual Funds | |
Money Market Funds | | | 12,685,848 | | | | — | | | | — | | | | 12,685,848 | | |
Total Mutual Funds | | | 12,685,848 | | | | — | | | | — | | | | 12,685,848 | | |
Total | | | 551,534,169 | | | | — | | | | — | | | | 551,534,169 | | |
See the Portfolio of Investments for all investment classifications not indicated in the table.
There were no transfers of financial assets between levels during the period.
The accompanying Notes to Financial Statements are an integral part of this statement.
Annual Report 2014
10
Columbia Select Large Cap Equity Fund
Statement of Assets and Liabilities
February 28, 2014
Assets | |
Investments, at value | |
Unaffiliated issuers (identified cost $439,755,178) | | $ | 538,848,321 | | |
Affiliated issuers (identified cost $12,685,848) | | | 12,685,848 | | |
Total investments (identified cost $452,441,026) | | | 551,534,169 | | |
Receivable for: | |
Investments sold | | | 23,679,178 | | |
Capital shares sold | | | 69,007 | | |
Dividends | | | 1,113,049 | | |
Reclaims | | | 4,002 | | |
Expense reimbursement due from Investment Manager | | | 243 | | |
Prepaid expenses | | | 1,398 | | |
Trustees' deferred compensation plan | | | 11,183 | | |
Other assets | | | 4,821 | | |
Total assets | | | 576,417,050 | | |
Liabilities | |
Payable for: | |
Investments purchased | | | 25,482,413 | | |
Capital shares purchased | | | 1,711,149 | | |
Investment management fees | | | 10,627 | | |
Distribution and/or service fees | | | 1,041 | | |
Transfer agent fees | | | 58,172 | | |
Administration fees | | | 896 | | |
Compensation of board members | | | 125,512 | | |
Other expenses | | | 39,181 | | |
Trustees' deferred compensation plan | | | 11,183 | | |
Total liabilities | | | 27,440,174 | | |
Net assets applicable to outstanding capital stock | | $ | 548,976,876 | | |
Represented by | |
Paid-in capital | | $ | 418,499,164 | | |
Undistributed net investment income | | | 359,002 | | |
Accumulated net realized gain | | | 31,026,078 | | |
Unrealized appreciation (depreciation) on: | |
Investments | | | 99,093,143 | | |
Foreign currency translations | | | (511 | ) | |
Total — representing net assets applicable to outstanding capital stock | | $ | 548,976,876 | | |
The accompanying Notes to Financial Statements are an integral part of this statement.
Annual Report 2014
11
Columbia Select Large Cap Equity Fund
Statement of Assets and Liabilities (continued)
February 28, 2014
Class A | |
Net assets | | $ | 133,449,899 | | |
Shares outstanding | | | 10,184,804 | | |
Net asset value per share | | $ | 13.10 | | |
Maximum offering price per share(a) | | $ | 13.90 | | |
Class B | |
Net assets | | $ | 447,534 | | |
Shares outstanding | | | 36,087 | | |
Net asset value per share | | $ | 12.40 | | |
Class C | |
Net assets | | $ | 4,245,004 | | |
Shares outstanding | | | 342,533 | | |
Net asset value per share | | $ | 12.39 | | |
Class I | |
Net assets | | $ | 155,624,049 | | |
Shares outstanding | | | 11,936,633 | | |
Net asset value per share | | $ | 13.04 | | |
Class R5 | |
Net assets | | $ | 65,899 | | |
Shares outstanding | | | 4,961 | | |
Net asset value per share | | $ | 13.28 | | |
Class W | |
Net assets | | $ | 2,775 | | |
Shares outstanding | | | 212 | | |
Net asset value per share(b) | | $ | 13.10 | | |
Class Z | |
Net assets | | $ | 255,141,716 | | |
Shares outstanding | | | 19,578,452 | | |
Net asset value per share | | $ | 13.03 | | |
(a) The maximum offering price per share is calculated by dividing the net asset value per share by 1.0 minus the maximum sales charge of 5.75%.
(b) Net asset value per share rounds to this amount due to fractional shares outstanding.
The accompanying Notes to Financial Statements are an integral part of this statement.
Annual Report 2014
12
Columbia Select Large Cap Equity Fund
Statement of Operations
Year Ended February 28, 2014
Net investment income | |
Income: | |
Dividends — unaffiliated issuers | | $ | 11,225,743 | | |
Dividends — affiliated issuers | | | 14,174 | | |
Interest | | | 70 | | |
Foreign taxes withheld | | | (6,806 | ) | |
Total income | | | 11,233,181 | | |
Expenses: | |
Investment management fees | | | 4,073,334 | | |
Distribution and/or service fees | |
Class A | | | 318,576 | | |
Class B | | | 6,074 | | |
Class C | | | 37,698 | | |
Class W | | | 8 | | |
Transfer agent fees | |
Class A | | | 240,420 | | |
Class B | | | 1,150 | | |
Class C | | | 7,114 | | |
Class R5 | | | 4 | | |
Class W | | | 6 | | |
Class Z | | | 586,586 | | |
Administration fees | | | 343,281 | | |
Compensation of board members | | | 39,987 | | |
Custodian fees | | | 8,899 | | |
Printing and postage fees | | | 48,007 | | |
Registration fees | | | 49,190 | | |
Professional fees | | | 39,550 | | |
Other | | | 67,439 | | |
Total expenses | | | 5,867,323 | | |
Fees waived or expenses reimbursed by Investment Manager and its affiliates | | | (278,009 | ) | |
Expense reductions | | | (4,440 | ) | |
Total net expenses | | | 5,584,874 | | |
Net investment income | | | 5,648,307 | | |
Realized and unrealized gain (loss) — net | |
Net realized gain (loss) on: | |
Investments | | | 133,807,998 | | |
Options contracts written | | | 22,712 | | |
Net realized gain | | | 133,830,710 | | |
Net change in unrealized appreciation (depreciation) on: | |
Investments | | | (12,248,823 | ) | |
Foreign currency translations | | | 217 | | |
Net change in unrealized appreciation (depreciation) | | | (12,248,606 | ) | |
Net realized and unrealized gain | | | 121,582,104 | | |
Net increase in net assets resulting from operations | | $ | 127,230,411 | | |
The accompanying Notes to Financial Statements are an integral part of this statement.
Annual Report 2014
13
Columbia Select Large Cap Equity Fund
Statement of Changes in Net Assets
| | | Year Ended
February 28,
2014 | | Year Ended
February 28,
2013(a) | |
Operations | |
Net investment income | | $ | 5,648,307 | | | $ | 7,330,040 | | |
Net realized gain | | | 133,830,710 | | | | 163,876,960 | | |
Net change in unrealized appreciation (depreciation) | | | (12,248,606 | ) | | | (78,364,643 | ) | |
Net increase in net assets resulting from operations | | | 127,230,411 | | | | 92,842,357 | | |
Distributions to shareholders | |
Net investment income | |
Class A | | | (1,096,374 | ) | | | (1,076,421 | ) | |
Class B | | | (617 | ) | | | (1,354 | ) | |
Class C | | | (4,346 | ) | | | (5,754 | ) | |
Class I | | | (1,717,106 | ) | | | (1,584,826 | ) | |
Class R5 | | | (32 | ) | | | (27 | ) | |
Class W | | | (28 | ) | | | (29 | ) | |
Class Z | | | (3,203,717 | ) | | | (5,353,527 | ) | |
Net realized gains | |
Class A | | | (41,518,042 | ) | | | (4,007,588 | ) | |
Class B | | | (193,521 | ) | | | (23,331 | ) | |
Class C | | | (1,306,620 | ) | | | (101,913 | ) | |
Class I | | | (44,307,566 | ) | | | (4,219,734 | ) | |
Class R5 | | | (885 | ) | | | (88 | ) | |
Class W | | | (1,084 | ) | | | (108 | ) | |
Class Z | | | (97,795,940 | ) | | | (15,036,075 | ) | |
Total distributions to shareholders | | | (191,145,878 | ) | | | (31,410,775 | ) | |
Increase (decrease) in net assets from capital stock activity | | | (13,254,355 | ) | | | (506,304,449 | ) | |
Total decrease in net assets | | | (77,169,822 | ) | | | (444,872,867 | ) | |
Net assets at beginning of year | | | 626,146,698 | | | | 1,071,019,565 | | |
Net assets at end of year | | $ | 548,976,876 | | | $ | 626,146,698 | | |
Undistributed net investment income | | $ | 359,002 | | | $ | 734,125 | | |
(a) Class R5 shares are for the period from November 8, 2012 (commencement of operations) to February 28, 2013.
The accompanying Notes to Financial Statements are an integral part of this statement.
Annual Report 2014
14
Columbia Select Large Cap Equity Fund
Statement of Changes in Net Assets (continued)
| | | Year Ended February 28, 2014 | | Year Ended February 28, 2013(a) | |
| | | Shares | | Dollars ($) | | Shares | | Dollars ($) | |
Capital stock activity | |
Class A shares | |
Subscriptions(b) | | | 2,641,852 | | | | 35,080,662 | | | | 476,836 | | | | 6,902,383 | | |
Distributions reinvested | | | 789,155 | | | | 10,346,973 | | | | 88,054 | | | | 1,257,399 | | |
Redemptions | | | (1,162,248 | ) | | | (16,964,059 | ) | | | (1,125,296 | ) | | | (16,403,955 | ) | |
Net increase (decrease) | | | 2,268,759 | | | | 28,463,576 | | | | (560,406 | ) | | | (8,244,173 | ) | |
Class B shares | |
Subscriptions | | | 12,360 | | | | 170,462 | | | | 3,698 | | | | 52,520 | | |
Distributions reinvested | | | 8,724 | | | | 108,867 | | | | 1,002 | | | | 13,798 | | |
Redemptions(b) | | | (32,835 | ) | | | (465,763 | ) | | | (16,725 | ) | | | (232,219 | ) | |
Net decrease | | | (11,751 | ) | | | (186,434 | ) | | | (12,025 | ) | | | (165,901 | ) | |
Class C shares | |
Subscriptions | | | 118,276 | | | | 1,566,061 | | | | 61,098 | | | | 857,831 | | |
Distributions reinvested | | | 79,271 | | | | 989,016 | | | | 5,707 | | | | 78,565 | | |
Redemptions | | | (89,884 | ) | | | (1,223,360 | ) | | | (27,016 | ) | | | (370,894 | ) | |
Net increase | | | 107,663 | | | | 1,331,717 | | | | 39,789 | | | | 565,502 | | |
Class I shares | |
Subscriptions | | | 986,643 | | | | 12,618,062 | | | | 603,974 | | | | 8,378,312 | | |
Distributions reinvested | | | 3,529,386 | | | | 46,023,546 | | | | 408,241 | | | | 5,804,411 | | |
Redemptions | | | (1,041,665 | ) | | | (15,429,517 | ) | | | (1,296,672 | ) | | | (18,797,963 | ) | |
Net increase (decrease) | | | 3,474,364 | | | | 43,212,091 | | | | (284,457 | ) | | | (4,615,240 | ) | |
Class R5 shares | |
Subscriptions | | | 4,788 | | | | 61,931 | | | | 173 | | | | 2,500 | | |
Net increase | | | 4,788 | | | | 61,931 | | | | 173 | | | | 2,500 | | |
Class Z shares | |
Subscriptions | | | 1,649,848 | | | | 22,220,429 | | | | 2,410,751 | | | | 34,663,296 | | |
Distributions reinvested | | | 2,497,113 | | | | 32,577,029 | | | | 292,445 | | | | 4,153,989 | | |
Redemptions | | | (9,215,154 | ) | | | (140,934,694 | ) | | | (36,835,629 | ) | | | (532,664,422 | ) | |
Net decrease | | | (5,068,193 | ) | | | (86,137,236 | ) | | | (34,132,433 | ) | | | (493,847,137 | ) | |
Total net increase (decrease) | | | 775,630 | | | | (13,254,355 | ) | | | (34,949,359 | ) | | | (506,304,449 | ) | |
(a) Class R5 shares are for the period from November 8, 2012 (commencement of operations) to February 28, 2013.
(b) Includes conversions of Class B shares to Class A shares, if any.
The accompanying Notes to Financial Statements are an integral part of this statement.
Annual Report 2014
15
Columbia Select Large Cap Equity Fund
The following tables are intended to help you understand the Fund's financial performance. Certain information reflects financial results for a single share of a class held for the periods shown. Per share net investment income (loss) amounts are calculated based on average shares outstanding during the period. Total return assumes reinvestment of all dividends and distributions, if any. Total return does not reflect payment of sales charges, if any, and is not annualized for periods of less than one year.
| | | | | Year Ended | | | |
| | | Year Ended February 28, | | February 29, | | Year Ended February 28, | |
Class A | | 2014 | | 2013 | | 2012 | | 2011 | | 2010 | |
Per share data | |
Net asset value, beginning of period | | $ | 15.21 | | | $ | 14.09 | | | $ | 13.73 | | | $ | 11.48 | | | $ | 7.95 | | |
Income from investment operations: | |
Net investment income | | | 0.11 | | | | 0.10 | | | | 0.10 | | | | 0.05 | | | | 0.08 | | |
Net realized and unrealized gain | | | 3.03 | | | | 1.66 | | | | 0.36 | | | | 2.26 | | | | 3.57 | | |
Total from investment operations | | | 3.14 | | | | 1.76 | | | | 0.46 | | | | 2.31 | | | | 3.65 | | |
Less distributions to shareholders: | |
Net investment income | | | (0.13 | ) | | | (0.13 | ) | | | (0.10 | ) | | | (0.06 | ) | | | (0.12 | ) | |
Net realized gains | | | (5.12 | ) | | | (0.51 | ) | | | — | | | | — | | | | — | | |
Total distributions to shareholders | | | (5.25 | ) | | | (0.64 | ) | | | (0.10 | ) | | | (0.06 | ) | | | (0.12 | ) | |
Proceeds from regulatory settlements | | | — | | | | — | | | | 0.00 | (a) | | | — | | | | 0.00 | (a) | |
Net asset value, end of period | | $ | 13.10 | | | $ | 15.21 | | | $ | 14.09 | | | $ | 13.73 | | | $ | 11.48 | | |
Total return | | | 23.89 | % | | | 12.83 | % | | | 3.45 | % | | | 20.16 | % | | | 45.99 | % | |
Ratios to average net assets(b) | |
Total gross expenses | | | 1.25 | % | | | 1.23 | % | | | 1.21 | %(c) | | | 1.20 | %(c) | | | 1.18 | %(c) | |
Total net expenses(d) | | | 1.19 | %(e) | | | 1.19 | %(e) | | | 1.16 | %(c)(e) | | | 1.20 | %(c)(e) | | | 1.18 | %(c)(e) | |
Net investment income | | | 0.75 | % | | | 0.70 | % | | | 0.77 | % | | | 0.38 | % | | | 0.78 | % | |
Supplemental data | |
Net assets, end of period (in thousands) | | $ | 133,450 | | | $ | 120,365 | | | $ | 119,434 | | | $ | 130,039 | | | $ | 131,652 | | |
Portfolio turnover | | | 184 | % | | | 147 | % | | | 197 | % | | | 171 | % | | | 165 | % | |
Notes to Financial Highlights
(a) Rounds to zero.
(b) In addition to the fees and expenses which the Fund bears directly, the Fund indirectly bears a pro rata share of the fees and expenses of the acquired funds in which it invests. Such indirect expenses are not included in the reported expense ratios.
(c) Ratios include line of credit interest expense which rounds to less than 0.01%.
(d) Total net expenses include the impact of certain waivers/reimbursements made by the Investment Manager and certain of its affiliates, if applicable.
(e) The benefits derived from expense reductions had an impact of less than 0.01%.
The accompanying Notes to Financial Statements are an integral part of this statement.
Annual Report 2014
16
Columbia Select Large Cap Equity Fund
Financial Highlights (continued)
| | | | | Year Ended | | | |
| | | Year Ended February 28, | | February 29, | | Year Ended February 28, | |
Class B | | 2014 | | 2013 | | 2012 | | 2011 | | 2010 | |
Per share data | |
Net asset value, beginning of period | | $ | 14.64 | | | $ | 13.59 | | | $ | 13.25 | | | $ | 11.11 | | | $ | 7.71 | | |
Income from investment operations: | |
Net investment income (loss) | | | (0.00 | )(a) | | | (0.01 | ) | | | (0.00 | )(a) | | | (0.04 | ) | | | 0.00 | (a) | |
Net realized and unrealized gain | | | 2.89 | | | | 1.60 | | | | 0.36 | | | | 2.18 | | | | 3.44 | | |
Total from investment operations | | | 2.89 | | | | 1.59 | | | | 0.36 | | | | 2.14 | | | | 3.44 | | |
Less distributions to shareholders: | |
Net investment income | | | (0.01 | ) | | | (0.03 | ) | | | (0.02 | ) | | | — | | | | (0.04 | ) | |
Net realized gains | | | (5.12 | ) | | | (0.51 | ) | | | — | | | | — | | | | — | | |
Total distributions to shareholders | | | (5.13 | ) | | | (0.54 | ) | | | (0.02 | ) | | | — | | | | (0.04 | ) | |
Proceeds from regulatory settlements | | | — | | | | — | | | | 0.00 | (a) | | | — | | | | 0.00 | (a) | |
Net asset value, end of period | | $ | 12.40 | | | $ | 14.64 | | | $ | 13.59 | | | $ | 13.25 | | | $ | 11.11 | | |
Total return | | | 22.99 | % | | | 11.93 | % | | | 2.72 | % | | | 19.26 | % | | | 44.74 | % | |
Ratios to average net assets(b) | |
Total gross expenses | | | 2.00 | % | | | 1.98 | % | | | 1.96 | %(c) | | | 1.95 | %(c) | | | 1.93 | %(c) | |
Total net expenses(d) | | | 1.94 | %(e) | | | 1.94 | %(e) | | | 1.91 | %(c)(e) | | | 1.95 | %(c)(e) | | | 1.93 | %(c)(e) | |
Net investment income (loss) | | | (0.01 | %) | | | (0.05 | %) | | | (0.04 | %) | | | (0.36 | %) | | | 0.04 | % | |
Supplemental data | |
Net assets, end of period (in thousands) | | $ | 448 | | | $ | 700 | | | $ | 813 | | | $ | 1,653 | | | $ | 2,696 | | |
Portfolio turnover | | | 184 | % | | | 147 | % | | | 197 | % | | | 171 | % | | | 165 | % | |
Notes to Financial Highlights
(a) Rounds to zero.
(b) In addition to the fees and expenses which the Fund bears directly, the Fund indirectly bears a pro rata share of the fees and expenses of the acquired funds in which it invests. Such indirect expenses are not included in the reported expense ratios.
(c) Ratios include line of credit interest expense which rounds to less than 0.01%.
(d) Total net expenses include the impact of certain waivers/reimbursements made by the Investment Manager and certain of its affiliates, if applicable.
(e) The benefits derived from expense reductions had an impact of less than 0.01%.
The accompanying Notes to Financial Statements are an integral part of this statement.
Annual Report 2014
17
Columbia Select Large Cap Equity Fund
Financial Highlights (continued)
| | | | | Year Ended | | | |
| | | Year Ended February 28, | | February 29, | | Year Ended February 28, | |
Class C | | 2014 | | 2013 | | 2012 | | 2011 | | 2010 | |
Per share data | |
Net asset value, beginning of period | | $ | 14.63 | | | $ | 13.58 | | | $ | 13.25 | | | $ | 11.11 | | | $ | 7.70 | | |
Income from investment operations: | |
Net investment income (loss) | | | 0.00 | (a) | | | (0.01 | ) | | | 0.00 | (a) | | | (0.04 | ) | | | 0.00 | (a) | |
Net realized and unrealized gain | | | 2.89 | | | | 1.60 | | | | 0.35 | | | | 2.18 | | | | 3.45 | | |
Total from investment operations | | | 2.89 | | | | 1.59 | | | | 0.35 | | | | 2.14 | | | | 3.45 | | |
Less distributions to shareholders: | |
Net investment income | | | (0.01 | ) | | | (0.03 | ) | | | (0.02 | ) | | | — | | | | (0.04 | ) | |
Net realized gains | | | (5.12 | ) | | | (0.51 | ) | | | — | | | | — | | | | — | | |
Total distributions to shareholders | | | (5.13 | ) | | | (0.54 | ) | | | (0.02 | ) | | | — | | | | (0.04 | ) | |
Proceeds from regulatory settlements | | | — | | | | — | | | | 0.00 | (a) | | | — | | | | 0.00 | (a) | |
Net asset value, end of period | | $ | 12.39 | | | $ | 14.63 | | | $ | 13.58 | | | $ | 13.25 | | | $ | 11.11 | | |
Total return | | | 23.01 | % | | | 11.94 | % | | | 2.64 | % | | | 19.26 | % | | | 44.93 | % | |
Ratios to average net assets(b) | |
Total gross expenses | | | 2.00 | % | | | 1.98 | % | | | 1.96 | %(c) | | | 1.95 | %(c) | | | 1.93 | %(c) | |
Total net expenses(d) | | | 1.94 | %(e) | | | 1.94 | %(e) | | | 1.91 | %(c)(e) | | | 1.95 | %(c)(e) | | | 1.93 | %(c)(e) | |
Net investment income (loss) | | | 0.01 | % | | | (0.04 | %) | | | 0.02 | % | | | (0.36 | %) | | | 0.03 | % | |
Supplemental data | |
Net assets, end of period (in thousands) | | $ | 4,245 | | | $ | 3,436 | | | $ | 2,649 | | | $ | 2,612 | | | $ | 2,449 | | |
Portfolio turnover | | | 184 | % | | | 147 | % | | | 197 | % | | | 171 | % | | | 165 | % | |
Notes to Financial Highlights
(a) Rounds to zero.
(b) In addition to the fees and expenses which the Fund bears directly, the Fund indirectly bears a pro rata share of the fees and expenses of the acquired funds in which it invests. Such indirect expenses are not included in the reported expense ratios.
(c) Ratios include line of credit interest expense which rounds to less than 0.01%.
(d) Total net expenses include the impact of certain waivers/reimbursements made by the Investment Manager and certain of its affiliates, if applicable.
(e) The benefits derived from expense reductions had an impact of less than 0.01%.
The accompanying Notes to Financial Statements are an integral part of this statement.
Annual Report 2014
18
Columbia Select Large Cap Equity Fund
Financial Highlights (continued)
| | | | | Year Ended | | Year Ended | |
| | | Year Ended February 28, | | February 29, | | February 28, | |
Class I | | 2014 | | 2013 | | 2012 | | 2011(a) | |
Per share data | |
Net asset value, beginning of period | | $ | 15.15 | | | $ | 14.04 | | | $ | 13.69 | | | $ | 11.78 | | |
Income from investment operations: | |
Net investment income | | | 0.17 | | | | 0.16 | | | | 0.15 | | | | 0.04 | | |
Net realized and unrealized gain | | | 3.03 | | | | 1.65 | | | | 0.36 | | | | 1.96 | | |
Total from investment operations | | | 3.20 | | | | 1.81 | | | | 0.51 | | | | 2.00 | | |
Less distributions to shareholders: | |
Net investment income | | | (0.19 | ) | | | (0.19 | ) | | | (0.16 | ) | | | (0.09 | ) | |
Net realized gains | | | (5.12 | ) | | | (0.51 | ) | | | — | | | | — | | |
Total distributions to shareholders | | | (5.31 | ) | | | (0.70 | ) | | | (0.16 | ) | | | (0.09 | ) | |
Proceeds from regulatory settlements | | | — | | | | — | | | | 0.00 | (b) | | | — | | |
Net asset value, end of period | | $ | 13.04 | | | $ | 15.15 | | | $ | 14.04 | | | $ | 13.69 | | |
Total return | | | 24.51 | % | | | 13.24 | % | | | 3.82 | % | | | 16.99 | % | |
Ratios to average net assets(c) | |
Total gross expenses | | | 0.81 | % | | | 0.79 | % | | | 0.76 | %(d) | | | 0.79 | %(d)(e) | |
Total net expenses(f) | | | 0.79 | % | | | 0.79 | % | | | 0.76 | %(d)(g) | | | 0.79 | %(d)(e)(g) | |
Net investment income | | | 1.16 | % | | | 1.11 | % | | | 1.18 | % | | | 0.64 | %(e) | |
Supplemental data | |
Net assets, end of period (in thousands) | | $ | 155,624 | | | $ | 128,241 | | | $ | 122,828 | | | $ | 135,677 | | |
Portfolio turnover | | | 184 | % | | | 147 | % | | | 197 | % | | | 171 | % | |
Notes to Financial Highlights
(a) For the period from September 27, 2010 (commencement of operations) to February 28, 2011.
(b) Rounds to zero.
(c) In addition to the fees and expenses which the Fund bears directly, the Fund indirectly bears a pro rata share of the fees and expenses of the acquired funds in which it invests. Such indirect expenses are not included in the reported expense ratios.
(d) Ratios include line of credit interest expense which rounds to less than 0.01%.
(e) Annualized.
(f) Total net expenses include the impact of certain waivers/reimbursements made by the Investment Manager and certain of its affiliates, if applicable.
(g) The benefits derived from expense reductions had an impact of less than 0.01%.
The accompanying Notes to Financial Statements are an integral part of this statement.
Annual Report 2014
19
Columbia Select Large Cap Equity Fund
Financial Highlights (continued)
| | | Year Ended February 28, | |
Class R5 | | 2014 | | 2013(a) | |
Per share data | |
Net asset value, beginning of period | | $ | 15.35 | | | $ | 14.45 | | |
Income from investment operations: | |
Net investment income | | | 0.23 | | | | 0.06 | | |
Net realized and unrealized gain | | | 3.00 | | | | 1.51 | | |
Total from investment operations | | | 3.23 | | | | 1.57 | | |
Less distributions to shareholders: | |
Net investment income | | | (0.18 | ) | | | (0.16 | ) | |
Net realized gains | | | (5.12 | ) | | | (0.51 | ) | |
Total distributions to shareholders | | | (5.30 | ) | | | (0.67 | ) | |
Net asset value, end of period | | $ | 13.28 | | | $ | 15.35 | | |
Total return | | | 24.40 | % | | | 11.15 | % | |
Ratios to average net assets(b) | |
Total gross expenses | | | 0.86 | % | | | 0.79 | %(c) | |
Total net expenses(d) | | | 0.83 | % | | | 0.79 | %(c) | |
Net investment income | | | 1.77 | % | | | 1.37 | %(c) | |
Supplemental data | |
Net assets, end of period (in thousands) | | $ | 66 | | | $ | 3 | | |
Portfolio turnover | | | 184 | % | | | 147 | % | |
Notes to Financial Highlights
(a) For the period from November 8, 2012 (commencement of operations) to February 28, 2013.
(b) In addition to the fees and expenses which the Fund bears directly, the Fund indirectly bears a pro rata share of the fees and expenses of the acquired funds in which it invests. Such indirect expenses are not included in the reported expense ratios.
(c) Annualized.
(d) Total net expenses include the impact of certain waivers/reimbursements made by the Investment Manager and certain of its affiliates, if applicable.
The accompanying Notes to Financial Statements are an integral part of this statement.
Annual Report 2014
20
Columbia Select Large Cap Equity Fund
Financial Highlights (continued)
| | | | | Year Ended | | Year Ended | |
| | | Year Ended February 28, | | February 29, | | February 28, | |
Class W | | 2014 | | 2013 | | 2012 | | 2011(a) | |
Per share data | |
Net asset value, beginning of period | | $ | 15.20 | | | $ | 14.09 | | | $ | 13.73 | | | $ | 11.80 | | |
Income from investment operations: | |
Net investment income | | | 0.11 | | | | 0.10 | | | | 0.11 | | | | 0.03 | | |
Net realized and unrealized gain | | | 3.04 | | | | 1.66 | | | | 0.36 | | | | 1.95 | | |
Total from investment operations | | | 3.15 | | | | 1.76 | | | | 0.47 | | | | 1.98 | | |
Less distributions to shareholders: | |
Net investment income | | | (0.13 | ) | | | (0.14 | ) | | | (0.11 | ) | | | (0.05 | ) | |
Net realized gains | | | (5.12 | ) | | | (0.51 | ) | | | — | | | | — | | |
Total distributions to shareholders | | | (5.25 | ) | | | (0.65 | ) | | | (0.11 | ) | | | (0.05 | ) | |
Proceeds from regulatory settlements | | | — | | | | — | | | | 0.00 | (b) | | | — | | |
Net asset value, end of period | | $ | 13.10 | | | $ | 15.20 | | | $ | 14.09 | | | $ | 13.73 | | |
Total return | | | 24.01 | % | | | 12.78 | % | | | 3.48 | % | | | 16.77 | % | |
Ratios to average net assets(c) | |
Total gross expenses | | | 1.21 | % | | | 1.20 | % | | | 1.18 | %(d) | | | 1.16 | %(d)(e) | |
Total net expenses(f) | | | 1.19 | %(g) | | | 1.17 | %(g) | | | 1.14 | %(d)(g) | | | 1.16 | %(d)(e)(g) | |
Net investment income | | | 0.75 | % | | | 0.72 | % | | | 0.81 | % | | | 0.50 | %(e) | |
Supplemental data | |
Net assets, end of period (in thousands) | | $ | 3 | | | $ | 3 | | | $ | 3 | | | $ | 3 | | |
Portfolio turnover | | | 184 | % | | | 147 | % | | | 197 | % | | | 171 | % | |
Notes to Financial Highlights
(a) For the period from September 27, 2010 (commencement of operations) to February 28, 2011.
(b) Rounds to zero.
(c) In addition to the fees and expenses which the Fund bears directly, the Fund indirectly bears a pro rata share of the fees and expenses of the acquired funds in which it invests. Such indirect expenses are not included in the reported expense ratios.
(d) Ratios include line of credit interest expense which rounds to less than 0.01%.
(e) Annualized.
(f) Total net expenses include the impact of certain waivers/reimbursements made by the Investment Manager and certain of its affiliates, if applicable.
(g) The benefits derived from expense reductions had an impact of less than 0.01%.
The accompanying Notes to Financial Statements are an integral part of this statement.
Annual Report 2014
21
Columbia Select Large Cap Equity Fund
Financial Highlights (continued)
| | | | | Year Ended | | | |
| | | Year Ended February 28, | | February 29, | | Year Ended February 28, | |
Class Z | | 2014 | | 2013 | | 2012 | | 2011 | | 2010 | |
Per share data | |
Net asset value, beginning of period | | $ | 15.15 | | | $ | 14.04 | | | $ | 13.69 | | | $ | 11.45 | | | $ | 7.93 | | |
Income from investment operations: | |
Net investment income | | | 0.15 | | | | 0.13 | | | | 0.13 | | | | 0.08 | | | | 0.11 | | |
Net realized and unrealized gain | | | 3.02 | | | | 1.66 | | | | 0.36 | | | | 2.25 | | | | 3.55 | | |
Total from investment operations | | | 3.17 | | | | 1.79 | | | | 0.49 | | | | 2.33 | | | | 3.66 | | |
Less distributions to shareholders: | |
Net investment income | | | (0.17 | ) | | | (0.17 | ) | | | (0.14 | ) | | | (0.09 | ) | | | (0.14 | ) | |
Net realized gains | | | (5.12 | ) | | | (0.51 | ) | | | — | | | | — | | | | — | | |
Total distributions to shareholders | | | (5.29 | ) | | | (0.68 | ) | | | (0.14 | ) | | | (0.09 | ) | | | (0.14 | ) | |
Proceeds from regulatory settlements | | | — | | | | — | | | | 0.00 | (a) | | | — | | | | 0.00 | (a) | |
Net asset value, end of period | | $ | 13.03 | | | $ | 15.15 | | | $ | 14.04 | | | $ | 13.69 | | | $ | 11.45 | | |
Total return | | | 24.25 | % | | | 13.08 | % | | | 3.65 | % | | | 20.40 | % | | | 46.30 | % | |
Ratios to average net assets(b) | |
Total gross expenses | | | 1.00 | % | | | 0.98 | % | | | 0.95 | %(c) | | | 0.95 | %(c) | | | 0.93 | %(c) | |
Total net expenses(d) | | | 0.94 | %(e) | | | 0.93 | %(e) | | | 0.91 | %(c)(e) | | | 0.95 | %(c)(e) | | | 0.93 | %(c)(e) | |
Net investment income | | | 1.00 | % | | | 0.90 | % | | | 0.99 | % | | | 0.64 | % | | | 1.03 | % | |
Supplemental data | |
Net assets, end of period (in thousands) | | $ | 255,142 | | | $ | 373,397 | | | $ | 825,292 | | | $ | 974,320 | | | $ | 988,640 | | |
Portfolio turnover | | | 184 | % | | | 147 | % | | | 197 | % | | | 171 | % | | | 165 | % | |
Notes to Financial Highlights
(a) Rounds to zero.
(b) In addition to the fees and expenses which the Fund bears directly, the Fund indirectly bears a pro rata share of the fees and expenses of the acquired funds in which it invests. Such indirect expenses are not included in the reported expense ratios.
(c) Ratios include line of credit interest expense which rounds to less than 0.01%.
(d) Total net expenses include the impact of certain waivers/reimbursements made by the Investment Manager and certain of its affiliates, if applicable.
(e) The benefits derived from expense reductions had an impact of less than 0.01%.
The accompanying Notes to Financial Statements are an integral part of this statement.
Annual Report 2014
22
Columbia Select Large Cap Equity Fund
Notes to Financial Statements
February 28, 2014
Note 1. Organization
Columbia Select Large Cap Equity Fund (formerly known as Columbia Large Cap Core Fund) (the Fund), a series of Columbia Funds Series Trust (the Trust), is a diversified fund. The Trust is registered under the Investment Company Act of 1940, as amended (the 1940 Act), as an open-end management investment company organized as a Delaware statutory trust. Effective December 11, 2013, Columbia Large Cap Core Fund was renamed Columbia Select Large Cap Equity Fund.
Fund Shares
The Trust may issue an unlimited number of shares (without par value). The Fund offers Class A, Class B, Class C, Class I, Class R5, Class W and Class Z shares. Although all share classes generally have identical voting, dividend and liquidation rights, each share class votes separately when required by law. Different share classes pay different distribution amounts to the extent the expenses of such share classes differ, and distributions in liquidation will be proportional to the net asset value of each share class. Each share class has its own expense structure and sales charges, as applicable.
Class A shares are subject to a maximum front-end sales charge of 5.75% based on the initial investment amount. Class A shares purchased without an initial sales charge in accounts aggregating $1 million to $50 million at the time of purchase are subject to a contingent deferred sales charge (CDSC) if the shares are sold within 18 months of purchase, charged as follows: 1.00% CDSC if redeemed within 12 months of purchase, and 0.50% CDSC if redeemed more than 12, but less than 18, months after purchase.
Class B shares may be subject to a maximum CDSC of 5.00% based upon the holding period after purchase. Class B shares will generally convert to Class A shares eight years after purchase. The Fund no longer accepts investments by new or existing investors in the Fund's Class B shares, except in connection with the reinvestment of any dividend and/or capital gain distributions in Class B shares of the Fund and exchanges by existing Class B shareholders of certain other funds within the Columbia Family of Funds.
Class C shares are subject to a 1.00% CDSC on shares redeemed within one year of purchase.
Class I shares are not subject to sales charges and are available only to the Columbia Family of Funds.
Class R5 shares are not subject to sales charges and are generally available only to investors purchasing through authorized investment professionals and omnibus retirement plans.
Class W shares are not subject to sales charges and are available only to investors purchasing through authorized investment programs managed by investment professionals, including discretionary managed account programs.
Class Z shares are not subject to sales charges and are available only to certain eligible investors, which are subject to different investment minimums.
Note 2. Summary of Significant Accounting Policies
Use of Estimates
The preparation of financial statements in accordance with U.S. generally accepted accounting principles (GAAP) requires management to make certain estimates and assumptions that affect the reported amounts of assets and liabilities, the disclosure of contingent assets and liabilities at the date of the financial statements and the reported amounts of revenue and expenses during the reporting period. Actual results could differ from those estimates.
The following is a summary of significant accounting policies consistently followed by the Fund in the preparation of its financial statements.
Security Valuation
All equity securities are valued at the close of business of the New York Stock Exchange (NYSE). Equity securities are valued at the last quoted sales price on the principal exchange or market on which they trade, except for securities traded on the NASDAQ Stock Market, which are valued at the NASDAQ official close price. Unlisted securities or listed securities for which there were no sales during the day are valued at the mean of the latest quoted bid and ask prices on such exchanges or markets.
Foreign equity securities are valued based on quotations from the principal market in which such securities are normally traded. If any foreign share prices are not readily available as a result of limited share activity the securities are valued at the mean of the latest quoted bid and ask prices on such exchanges or markets. Foreign currency exchange rates are generally determined at 4:00 p.m. Eastern (U.S.) time. However, many securities markets and exchanges outside the U.S. close prior to the close of the NYSE; therefore, the closing prices for securities in such markets or on such exchanges may not fully reflect events that occur after such close but before the close of the NYSE. In those situations, foreign securities will be fair valued pursuant to the policy adopted by the Board of Trustees (the Board), including utilizing a third party pricing service to determine these fair values. The third party pricing service takes into account
Annual Report 2014
23
Columbia Select Large Cap Equity Fund
Notes to Financial Statements (continued)
February 28, 2014
multiple factors, including, but not limited to, movements in the U.S. securities markets, certain depositary receipts, futures contracts and foreign exchange rates that have occurred subsequent to the close of the foreign exchange or market, to determine a good faith estimate that reasonably reflects the current market conditions as of the close of the NYSE. The fair value of a security is likely to be different from the quoted or published price, if available.
Investments in open-end investment companies, including money market funds, are valued at net asset value.
Option contracts are valued at the mean of the latest quoted bid and asked prices on their primary exchanges. Option contracts, including over-the-counter option contracts, with no readily available market value are valued using quotations obtained from independent brokers as of the close of the NYSE.
Investments for which market quotations are not readily available, or that have quotations which management believes are not reliable, are valued at fair value as determined in good faith under consistently applied procedures established by and under the general supervision of the Board. If a security or class of securities (such as foreign securities) is valued at fair value, such value is likely to be different from the last quoted market price for the security.
The determination of fair value often requires significant judgment. To determine fair value, management may use assumptions including but not limited to future cash flows and estimated risk premiums. Multiple inputs from various sources may be used to determine fair value.
Derivative Instruments
The Fund invests in certain derivative instruments, as detailed below, to meet its investment objectives. Derivatives are instruments whose values depend on, or are derived from, in whole or in part, the value of one or more other assets, such as securities, currencies, commodities or indices. Derivative instruments may be used to maintain cash reserves while maintaining exposure to certain other assets, to offset anticipated declines in values of investments, to facilitate trading, to reduce transaction costs and to pursue higher investment returns. The Fund may also use derivative instruments to mitigate certain investment risks, such as foreign currency exchange rate risk, interest rate risk and credit risk. Derivatives may involve various risks, including the potential inability of the counterparty to fulfill its obligation under the terms of the contract, the potential for an illiquid secondary market (making it difficult for the Fund to sell, including at favorable prices) and the potential for market movements which may expose the Fund to gains or losses in excess of the amount shown in the Statement of Assets and
Liabilities. The notional amounts of derivative instruments, if applicable, are not recorded in the financial statements.
A derivative instrument may suffer a mark to market loss if the value of the contract decreases due to an unfavorable change in the market rates or values of the underlying instrument. Losses can also occur if the counterparty does not perform under the contract. The Fund's risk of loss from counterparty credit risk on over-the-counter derivatives is generally limited to the aggregate unrealized gain netted against any collateral held by the Fund and the amount of any initial margin held by the counterparty. With exchange traded or centrally cleared derivatives, there is minimal counterparty credit risk to the Fund since the exchange's clearinghouse, as counterparty to such instruments, guarantees against a possible default. The clearinghouse stands between the buyer and the seller of the contract; therefore, the counterparty credit risk is limited to failure of the clearinghouse. However, credit risk still exists in exchange traded or centrally cleared derivatives with respect to initial and variation margin that is held in a broker's customer accounts. While brokers are required to segregate customer margin from their own assets, in the event that a broker becomes insolvent or goes into bankruptcy and at that time there is a shortfall in the aggregate amount of margin held by the broker for all its clients, U.S. bankruptcy laws will typically allocate that shortfall on a pro-rata basis across all the broker's customers, potentially resulting in losses to the Fund.
In order to better define its contractual rights and to secure rights that will help the Fund mitigate its counterparty risk, the Fund may enter into an International Swaps and Derivatives Association, Inc. Master Agreement (ISDA Master Agreement) or similar agreement with its derivative contract counterparties. An ISDA Master Agreement is an agreement between the Fund and a counterparty that governs over-the-counter derivatives and forward foreign currency exchange contracts and typically contains, among other things, collateral posting terms and netting provisions in the event of a default and/or termination event. Under an ISDA Master Agreement, the Fund may, under certain circumstances, offset with the counterparty certain derivative instrument's payables and/or receivables with collateral held and/or posted and create one single net payment. The provisions of the ISDA Master Agreement typically permit a single net payment in the event of default (close-out netting) including the bankruptcy or insolvency of the counterparty. Note, however, that bankruptcy or insolvency laws of a particular jurisdiction may impose restrictions on or prohibitions against the right of offset in bankruptcy, insolvency or other events.
Collateral (margin) requirements differ by type of derivative. Margin requirements are established by the exchange or
Annual Report 2014
24
Columbia Select Large Cap Equity Fund
Notes to Financial Statements (continued)
February 28, 2014
clearinghouse for exchange traded and centrally cleared derivatives. Brokers can ask for margin in excess of the minimum in certain circumstances. Collateral terms are contract specific for over-the-counter derivatives. For over-the-counter derivatives traded under an ISDA Master Agreement, the collateral requirements are typically calculated by netting the mark to market amount for each transaction under such agreement and comparing that amount to the value of any variation margin currently pledged by the Fund and/or the counterparty. Generally, the amount of collateral due from or to a party has to exceed a minimum transfer amount threshold (e.g., $500,000) before a transfer has to be made. To the extent amounts due to the Fund from its counterparties are not fully collateralized, contractually or otherwise, the Fund bears the risk of loss from counterparty nonperformance. The Fund attempts to mitigate counterparty risk by only entering into agreements with counterparties that it believes have the financial resources to honor their obligations and by monitoring the financial stability of those counterparties.
Certain ISDA Master Agreements allow counterparties to over-the-counter derivatives to terminate derivative contracts prior to maturity in the event the Fund's net assets decline by a stated percentage over a specified time period or the Fund fails to meet the terms of the ISDA Master Agreement, which would cause the Fund to accelerate payment of any net liability owed to the counterparty. The Fund also has termination rights if the counterparty fails to meet the terms of the ISDA Master Agreement. In addition to considering counterparty credit risk, the Fund would consider terminating the derivative contracts based on whether termination would result in a net liability owed from the counterparty.
For financial reporting purposes, the Fund does not offset derivative assets and derivative liabilities that are subject to netting arrangements in the Statement of Assets and Liabilities.
Options Contracts
Options are contracts which entitle the holder to purchase or sell securities or other identified assets at a specified price, or in the case of index option contracts, to receive or pay the difference between the index value and the strike price of the index option contract. Option contracts can be either exchange traded or over-the-counter. The Fund purchased and wrote option contracts to decrease the Fund's exposure to equity market risk and to increase return on investments and to protect gains. These instruments may be used for other purposes in future periods. Completion of transactions for option contracts traded in the over-the-counter market depends upon the performance of the other party. Cash collateral may be collected or posted by the Fund to secure certain
over-the-counter option contract trades. Cash collateral held or posted by the Fund for such option contract trades must be returned to the counterparty or the Fund upon closure, exercise or expiration of the contract.
Options contracts purchased are recorded as investments. When the Fund writes an options contract, the premium received is recorded as an asset and an amount equivalent to the premium is recorded as a liability in the Statement of Assets and Liabilities and is subsequently adjusted to reflect the current fair value of the option written. The Fund will realize a gain or loss when the option contract is closed or expires. When option contracts are exercised, the proceeds on sales for a written call or purchased put option contract, or the purchase cost for a written put or purchased call option contract, is adjusted by the amount of premium received or paid.
For over-the-counter options purchased, the Fund bears the risk of loss of the amount of the premiums paid plus the positive change in market values net of any collateral held by the Fund should the counterparty fail to perform under the contracts. Option contracts written by the Fund do not typically give rise to counterparty credit risk, as options written generally obligate the Fund and not the counterparty to perform. The risk in writing a call option contract is that the Fund gives up the opportunity for profit if the market price of the security increases above the strike price. The risk in writing a put option contract is that the Fund may incur a loss if the market price of the security decreases below the strike price and the option contract is exercised. Exercise of a written option could result in the Fund purchasing or selling a security or foreign currency when it otherwise would not, or at a price different from the current market value. In purchasing and writing options, the Fund bears the risk of an unfavorable change in the value of the underlying instrument or the risk that the Fund may not be able to enter into a closing transaction due to an illiquid market.
Contracts and premiums associated with options contracts written for the year ended February 28, 2014 are as follows:
| | | Calls | |
| | | Contracts | | Premiums ($) | |
Balance at February 28, 2013 | | | — | | | | — | | |
Opened | | | 620 | | | | 30,200 | | |
Closed | | | — | | | | — | | |
Expired | | | (550 | ) | | | (22,712 | ) | |
Exercised | | | (70 | ) | | | (7,488 | ) | |
Balance at February 28, 2014 | | | — | | | | — | | |
Annual Report 2014
25
Columbia Select Large Cap Equity Fund
Notes to Financial Statements (continued)
February 28, 2014
Effects of Derivative Transactions in the Financial Statements
The following tables are intended to provide additional information about the effect of derivatives on the financial statements of the Fund, including: the fair value of derivatives by risk category and the location of those fair values in the Statement of Assets and Liabilities; the impact of derivative transactions over the period in the Statement of Operations including realized gains or losses and unrealized gains or losses. The derivative schedules following the Portfolio of Investments present additional information regarding derivative instruments outstanding at the end of the period, if any.
At February 28, 2014, the Fund had no outstanding derivatives.
The following table indicates the effect of derivative instruments in the Statement of Operations for the year ended February 28, 2014:
Amount of Realized Gain (Loss) on Derivatives Recognized in Income | |
Risk Exposure Category | | Options Contracts Written ($) | |
Equity risk | | | 22,712 | | |
The following table is a summary of the volume of derivative instruments for the year ended February 28, 2014:
Derivative Instrument | | Contracts Opened | |
Options contracts | | | 620 | | |
Security Transactions
Security transactions are accounted for on the trade date. Cost is determined and gains (losses) are based upon the specific identification method for both financial statement and federal income tax purposes.
Income Recognition
Corporate actions and dividend income are generally recorded net of any non-reclaimable tax withholdings, on the ex-dividend date or upon receipt of ex-dividend notification in the case of certain foreign securities.
The Fund may receive distributions from holdings in business development companies (BDCs), exchange traded funds (ETFs) and real estate investment trusts (REITs), which report information on the character of their distributions annually. These distributions are allocated to dividend income, capital gain and return of capital based on estimates made by the Fund's management if actual information has not yet been reported. Return of capital is recorded as a reduction of the cost basis of securities held. If the Fund no longer owns the applicable securities, return of capital is recorded as a realized gain. Management's estimates are subsequently adjusted when the actual character of the distributions is disclosed by the
BDCs, ETFs and REITs, which could result in a proportionate change in return of capital to shareholders.
Awards from class action litigation are recorded as a reduction of cost basis if the Fund still owns the applicable securities on the payment date. If the Fund no longer owns the applicable securities, the proceeds are recorded as realized gains.
Expenses
General expenses of the Trust are allocated to the Fund and other funds of the Trust based upon relative net assets or other expense allocation methodologies determined by the nature of the expense. Expenses directly attributable to the Fund are charged to the Fund. Expenses directly attributable to a specific class of shares are charged to that share class.
Determination of Class Net Asset Value
All income, expenses (other than class-specific expenses, which are charged to that share class, as shown in the Statement of Operations) and realized and unrealized gains (losses) are allocated to each class of the Fund on a daily basis, based on the relative net assets of each class, for purposes of determining the net asset value of each class.
Federal Income Tax Status
The Fund intends to qualify each year as a regulated investment company under Subchapter M of the Internal Revenue Code, as amended, and will distribute substantially all of its taxable income (including net short-term capital gains), if any, for its tax year, and as such will not be subject to federal income taxes. In addition, the Fund intends to distribute in each calendar year substantially all of its net investment income, capital gains and certain other amounts, if any, such that the Fund should not be subject to federal excise tax. Therefore, no federal income or excise tax provision is recorded.
Foreign Taxes
The Fund may be subject to foreign taxes on income, gains on investments or currency repatriation, a portion of which may be recoverable. The Fund will accrue such taxes and recoveries, as applicable, based upon its current interpretation of tax rules and regulations that exist in the markets in which it invests.
Realized gains in certain countries may be subject to foreign taxes at the Fund level, based on statutory rates. The Fund accrues for such foreign taxes on realized and unrealized gains at the appropriate rate for each jurisdiction, as applicable. The amount, if any, is disclosed as a liability on the Statement of Assets and Liabilities.
Distributions to Shareholders
Distributions from net investment income, if any, are declared and paid semi-annually. Net realized capital gains, if any, are
Annual Report 2014
26
Columbia Select Large Cap Equity Fund
Notes to Financial Statements (continued)
February 28, 2014
distributed at least annually. Income distributions and capital gain distributions are determined in accordance with federal income tax regulations, which may differ from GAAP.
Guarantees and Indemnifications
Under the Trust's organizational documents and, in some cases, by contract, its officers and trustees are indemnified against certain liabilities arising out of the performance of their duties to the Trust or its funds. In addition, certain of the Fund's contracts with its service providers contain general indemnification clauses. The Fund's maximum exposure under these arrangements is unknown since the amount of any future claims that may be made against the Fund cannot be determined, and the Fund has no historical basis for predicting the likelihood of any such claims.
Note 3. Fees and Compensation Paid to Affiliates
Investment Management Fees
Under an Investment Management Services Agreement, Columbia Management Investment Advisers, LLC (the Investment Manager), a wholly-owned subsidiary of Ameriprise Financial, Inc. (Ameriprise Financial), determines which securities will be purchased, held or sold. The investment management fee is an annual fee that is equal to a percentage of the Fund's average daily net assets that declines from 0.71% to 0.54% as the Fund's net assets increase. The effective investment management fee rate for the year ended February 28, 2014 was 0.70% of the Fund's average daily net assets.
Administration Fees
Under an Administrative Services Agreement, the Investment Manager also serves as the Fund Administrator. The Fund pays the Fund Administrator an annual fee for administration and accounting services equal to a percentage of the Fund's average daily net assets that declines from 0.06% to 0.03% as the Fund's net assets increase. The effective administration fee rate for the year ended February 28, 2014 was 0.06% of the Fund's average daily net assets.
Other Expenses
Other expenses are for, among other things, miscellaneous expenses of the Fund or the Board, including payments to a company providing limited administrative services to the Fund and the Board. That company's expenses include boardroom and office expense, employee compensation, employee health and retirement benefits, and certain other expenses. For the year ended February 28, 2014, other expenses paid to this company were $2,804.
Compensation of Board Members
Board members are compensated for their services to the Fund as disclosed in the Statement of Operations. Under a Deferred Compensation Plan (the Plan), the Board members who are not "interested persons" of the Fund, as defined under the 1940 Act, may elect to defer payment of up to 100% of their compensation. Deferred amounts are treated as though equivalent dollar amounts had been invested in shares of certain funds managed by the Investment Manager. The Fund's liability for these amounts is adjusted for market value changes and remains in the Fund until distributed in accordance with the Plan.
Transfer Agent Fees
Under a Transfer and Dividend Disbursing Agent Agreement, Columbia Management Investment Services Corp. (the Transfer Agent), an affiliate of the Investment Manager and a wholly-owned subsidiary of Ameriprise Financial, is responsible for providing transfer agency services to the Fund. The Transfer Agent has contracted with Boston Financial Data Services (BFDS) to serve as sub-transfer agent.
The Transfer Agent receives monthly account-based service fees based on the number of open accounts and also receives sub-transfer agency fees based on a percentage of the average aggregate value of the Fund's shares maintained in omnibus accounts (other than omnibus accounts for which American Enterprise Investment Services Inc. is the broker of record or accounts where the beneficial shareholder is a customer of Ameriprise Financial Services, Inc., which are paid a per account fee). The Transfer Agent pays the fees of BFDS for services as sub-transfer agent and is not entitled to reimbursement for such fees from the Fund (with the exception of out-of-pocket fees).
The Transfer Agent also receives compensation from fees for various shareholder services and reimbursements for certain out-of-pocket fees. Class I shares do not pay transfer agent fees. Total transfer agent fees for Class R5 shares are subject to an annual limitation of not more than 0.05% of the average daily net assets attributable to Class R5 shares.
For the year ended February 28, 2014, the Fund's effective transfer agent fee rates as a percentage of average daily net assets of each class were as follows:
Class A | | | 0.19 | % | |
Class B | | | 0.19 | | |
Class C | | | 0.19 | | |
Class R5 | | | 0.05 | | |
Class W | | | 0.18 | | |
Class Z | | | 0.19 | | |
Annual Report 2014
27
Columbia Select Large Cap Equity Fund
Notes to Financial Statements (continued)
February 28, 2014
An annual minimum account balance fee of $20 may apply to certain accounts with a value below the applicable share class's initial minimum investment requirements to reduce the impact of small accounts on transfer agent fees. These minimum account balance fees are recorded as part of expense reductions in the Statement of Operations. For the year ended February 28, 2014, these minimum account balance fees reduced total expenses by $4,440.
Distribution and Service Fees
The Fund has an agreement with Columbia Management Investment Distributors, Inc. (the Distributor), an affiliate of the Investment Manager and a wholly-owned subsidiary of Ameriprise Financial, for distribution and shareholder services. The Board has approved, and the Fund has adopted, distribution and shareholder service plans (the Plans) applicable to certain share classes, which set the distribution and service fees for the Fund. These fees are calculated daily and are intended to compensate the Distributor and/or eligible selling and/or servicing agents for selling shares of the Fund and providing services to investors.
Under the Plans, the Fund pays a monthly combined distribution and service fee to the Distributor at the maximum annual rate of 0.25% of the average daily net assets attributable to Class A shares of the Fund. Also under the Plans, the Fund pays a monthly service fee at the maximum annual rate of 0.25% of the average daily net assets attributable to Class B, Class C and Class W shares of the Fund and the payment of a monthly distribution fee at the maximum annual rates of 0.75%, 0.75% and 0.25% of the average daily net assets attributable to Class B, Class C and Class W shares, respectively.
Although the Fund may pay a distribution fee up to 0.25% of the Fund's average daily net assets attributable to Class W shares and a service fee of up to 0.25% of the Fund's average daily net assets attributable to Class W shares, the aggregate fee shall not exceed 0.25% of the Fund's average daily net assets attributable to Class W shares.
Sales Charges
Sales charges, including front-end charges and CDSCs, received by the Distributor for distributing Fund shares were $44,359 for Class A, $414 for Class B and $170 for Class C shares for the year ended February 28, 2014.
Expenses Waived/Reimbursed by the Investment Manager and its Affiliates
The Investment Manager and certain of its affiliates have contractually agreed to waive fees and/or reimburse expenses (excluding certain fees and expenses described below) for the periods disclosed below, unless sooner terminated at the sole
discretion of the Board, so that the Fund's net operating expenses, after giving effect to fees waived/expenses reimbursed and any balance credits and/or overdraft charges from the Fund's custodian, do not exceed the following annual rates as a percentage of the class' average daily net assets:
| | | July 1, 2013
through
June 30, 2014 | | Prior to
July 1, 2013 | |
Class A | | | 1.18 | % | | | 1.20 | % | |
Class B | | | 1.93 | | | | 1.95 | | |
Class C | | | 1.93 | | | | 1.95 | | |
Class I | | | 0.78 | | | | 0.82 | | |
Class R5 | | | 0.83 | | | | 0.87 | | |
Class W | | | 1.18 | | | | 1.20 | | |
Class Z | | | 0.93 | | | | 0.95 | | |
Under the agreement governing these fee waivers and/or expense reimbursement arrangements, the following fees and expenses are excluded from the waiver/reimbursement commitment, and therefore will be paid by the Fund, if applicable: taxes (including foreign transaction taxes), expenses associated with investments in affiliated and non-affiliated pooled investment vehicles (including mutual funds and exchange traded funds), transaction costs and brokerage commissions, costs related to any securities lending program, dividend expenses associated with securities sold short, inverse floater program fees and expenses, transaction charges and interest on borrowed money, interest, extraordinary expenses and any other expenses the exclusion of which is specifically approved by the Board. This agreement may be modified or amended only with approval from all parties.
Note 4. Federal Tax Information
The timing and character of income and capital gain distributions are determined in accordance with income tax regulations, which may differ from GAAP because of temporary or permanent book to tax differences.
At February 28, 2014, these differences are primarily due to differing treatment for deferral/reversal of wash sales losses, Trustees' deferred compensation, and re-characterization of distributions for investments. To the extent these differences are permanent, reclassifications are made among the components of the Fund's net assets in the Statement of Assets and Liabilities. Temporary differences do not require reclassifications. In the Statement of Assets and Liabilities the following reclassifications were made:
Undistributed net investment income | | $ | (1,210 | ) | |
Accumulated net realized gain | | | 1,210 | | |
Paid-in capital | | | — | | |
Annual Report 2014
28
Columbia Select Large Cap Equity Fund
Notes to Financial Statements (continued)
February 28, 2014
Net investment income and net realized gains (losses), as disclosed in the Statement of Operations, and net assets were not affected by this reclassification.
The tax character of distributions paid during the years indicated was as follows:
Year Ended February 28, | | 2014 | | 2013 | |
Ordinary income | | $ | 60,010,986 | | | $ | 8,021,938 | | |
Long-term capital gains | | | 131,134,892 | | | | 23,388,837 | | |
Total | | $ | 191,145,878 | | | $ | 31,410,775 | | |
Short-term capital gain distributions, if any, are considered ordinary income distributions for tax purposes.
At February 28, 2014, the components of distributable earnings on a tax basis were as follows:
Undistributed ordinary income | | $ | 14,669,858 | | |
Undistributed accumulated long-term gain | | | 17,330,402 | | |
Unrealized appreciation | | | 98,614,685 | | |
At February 28, 2014, the cost of investments for federal income tax purposes was $452,919,484 and the aggregate gross unrealized appreciation and depreciation based on that cost was:
Unrealized appreciation | | $ | 100,846,980 | | |
Unrealized depreciation | | | (2,232,295 | ) | |
Net unrealized appreciation | | $ | 98,614,685 | | |
Management of the Fund has concluded that there are no significant uncertain tax positions that would require recognition in the financial statements. However, management's conclusion may be subject to review and adjustment at a later date based on factors including, but not limited to, new tax laws, regulations, and administrative interpretations (including relevant court decisions). Generally, the Fund's federal tax returns for the prior three fiscal years remain subject to examination by the Internal Revenue Service.
Note 5. Portfolio Information
The cost of purchases and proceeds from sales of securities, excluding short-term obligations, aggregated to $1,048,854,967 and $1,254,811,399, respectively, for the year ended February 28, 2014.
Note 6. Affiliated Money Market Fund
The Fund invests its daily cash balances in Columbia Short-Term Cash Fund, an affiliated money market fund established for the exclusive use by the Fund and other affiliated funds. The income earned by the Fund from such investments is included as "Dividends — affiliated issuers" in the Statement of Operations. As an investing fund, the Fund indirectly bears its proportionate share of the expenses of Columbia Short-Term Cash Fund.
Note 7. Shareholder Concentration
At February 28, 2014, one unaffiliated shareholder account owned 46.6% of the outstanding shares of the Fund. The Fund has no knowledge about whether any portion of those shares was owned beneficially by such account. Affiliated shareholder accounts owned 28.5% of the outstanding shares of the Fund. Subscription and redemption activity by concentrated accounts may have a significant effect on the operations of the Fund.
Note 8. Line of Credit
The Fund has entered into a revolving credit facility with a syndicate of banks led by JPMorgan Chase Bank N.A. whereby the Fund may borrow for the temporary funding of shareholder redemptions or for other temporary or emergency purposes. The credit facility agreement, as amended, which is a collective agreement between the Fund and certain other funds managed by the Investment Manager, severally and not jointly, permits collective borrowings up to $500 million. Interest is charged to each participating fund based on its borrowings at a rate equal to the higher of (i) the overnight federal funds rate plus 1.00% or (ii) the one-month LIBOR rate plus 1.00%. Each borrowing under the credit facility matures no later than 60 days after the date of borrowing. Effective December 10, 2013, the Fund also pays a commitment fee equal to its pro rata share of the amount of the credit facility at a rate of 0.075% per annum. Prior to December 10, 2013, the commitment fee was charged at the annual rate of 0.08% per annum. The commitment fee is included in other expenses in the Statement of Operations.
The Fund had no borrowings during the year ended February 28, 2014.
Note 9. Subsequent Events
Management has evaluated the events and transactions that have occurred through the date the financial statements were issued and noted no items requiring adjustment of the financial statements or additional disclosure.
Note 10. Information Regarding Pending and Settled Legal Proceedings
In December 2005, without admitting or denying the allegations, American Express Financial Corporation (AEFC, which is now known as Ameriprise Financial, Inc. (Ameriprise Financial)) entered into settlement agreements with the Securities and Exchange Commission (SEC) and Minnesota Department of Commerce (MDOC) related to market timing activities. As a result, AEFC was censured and ordered to cease and desist from committing or causing any violations of certain provisions of the Investment Advisers Act of 1940, the Investment Company Act of 1940, and various Minnesota laws.
Annual Report 2014
29
Columbia Select Large Cap Equity Fund
Notes to Financial Statements (continued)
February 28, 2014
AEFC agreed to pay disgorgement of $10 million and civil money penalties of $7 million. AEFC also agreed to retain an independent distribution consultant to assist in developing a plan for distribution of all disgorgement and civil penalties ordered by the SEC in accordance with various undertakings detailed at www.sec.gov/litigation/admin/ia-2451.pdf. Ameriprise Financial and its affiliates have cooperated with the SEC and the MDOC in these legal proceedings, and have made regular reports to the Funds' Boards of Trustees.
Ameriprise Financial and certain of its affiliates have historically been involved in a number of legal, arbitration and regulatory proceedings, including routine litigation, class actions, and governmental actions, concerning matters arising in connection with the conduct of their business activities. Ameriprise Financial believes that the Funds are not currently the subject of, and that neither Ameriprise Financial nor any of its affiliates are the subject of, any pending legal, arbitration or regulatory proceedings that are likely to have a material adverse effect on the Funds or the ability of Ameriprise Financial or its affiliates to perform under their contracts with the Funds. Ameriprise Financial is required to make 10-Q, 10-K and, as necessary, 8-K filings with the Securities and Exchange Commission on legal and regulatory matters that relate to Ameriprise Financial and its affiliates. Copies of these filings may be obtained by accessing the SEC website at www.sec.gov.
There can be no assurance that these matters, or the adverse publicity associated with them, will not result in increased fund redemptions, reduced sale of fund shares or other adverse consequences to the Funds. Further, although we believe proceedings are not likely to have a material adverse effect on the Funds or the ability of Ameriprise Financial or its affiliates to perform under their contracts with the Funds, these proceedings are subject to uncertainties and, as such, we are unable to estimate the possible loss or range of loss that may result. An adverse outcome in one or more of these proceedings could result in adverse judgments, settlements, fines, penalties or other relief that could have a material adverse effect on the consolidated financial condition or results of operations of Ameriprise Financial.
Annual Report 2014
30
Columbia Select Large Cap Equity Fund
Report of Independent Registered Public Accounting Firm
To the Trustees of Columbia Funds Series Trust and the Shareholders of
Columbia Select Large Cap Equity Fund (formerly Columbia Large Cap Core Fund)
In our opinion, the accompanying statement of assets and liabilities, including the portfolio of investments, and the related statements of operations and of changes in net assets and the financial highlights present fairly, in all material respects, the financial position of Columbia Select Large Cap Equity Fund (formerly Columbia Large Cap Core Fund) (the "Fund", a series of Columbia Funds Series Trust) at February 28, 2014, and the results of its operations, the changes in its net assets and the financial highlights for each of the periods indicated, in conformity with accounting principles generally accepted in the United States of America. These financial statements and financial highlights (hereafter referred to as "financial statements") are the responsibility of the Fund's management; our responsibility is to express an opinion on these financial statements based on our audits. We conducted our audits of these financial statements in accordance with the standards of the Public Company Accounting Oversight Board (United States). Those standards require that we plan and perform the audit to obtain reasonable assurance about whether the financial statements are free of material misstatement. An audit includes examining, on a test basis, evidence supporting the amounts and disclosures in the financial statements, assessing the accounting principles used and significant estimates made by management, and evaluating the overall financial statement presentation. We believe that our audits, which included confirmation of securities at February 28, 2014 by correspondence with the custodian, brokers and transfer agent, provide a reasonable basis for our opinion.
PricewaterhouseCoopers LLP
Minneapolis, Minnesota
April 21, 2014
Annual Report 2014
31
Columbia Select Large Cap Equity Fund
Federal Income Tax Information
(Unaudited)
The Fund hereby designates the following tax attributes for the fiscal year ended February 28, 2014. Shareholders will be notified in early 2015 of the amounts for use in preparing 2014 income tax returns.
Tax Designations:
| Qualified Dividend Income | | | 17.82 | % | |
| Dividends Received Deduction | | | 16.24 | % | |
Capital Gain Dividend | | $ | 69,174,333 | | |
Qualified Dividend Income. For taxable, non-corporate shareholders, the percentage of ordinary income dividends paid during the fiscal year that represents qualified dividend income subject to reduced tax rates.
Dividends Received Deduction. The percentage of ordinary income dividends paid during the fiscal year that qualifies for the corporate dividends received deduction.
Capital Gain Dividend. The Fund designates as a capital gain dividend the amount reflected above, or if subsequently determined to be different, the net capital gain of such fiscal period. The Fund also designates as capital gain dividends, to the extent necessary to fully distribute such capital gains, earnings and profits distributed to shareholders on the redemption of shares.
Annual Report 2014
32
Columbia Select Large Cap Equity Fund
Shareholders elect the Board that oversees the Funds' operations. The Board appoints officers who are responsible for day-to-day business decisions based on policies set by the Board. The following table provides basic biographical information about the Funds' Board members, including their principal occupations during the past five years, although specific titles for individuals may have varied over the period. Under current Board policy, members may serve through the end of the calendar year in which he or she reaches either the mandatory retirement age established by the Board or the fifteenth anniversary of the first Board meeting they attended as a member of the Board.
Independent Trustees
Name,
Address,
Year of Birth | | Position Held With
Funds and Length of
Service | | Principal Occupation(s)
During Past Five Years
and Other Relevant
Professional Experience | | Number of
Funds in the
Fund Family
Overseen by
Board Member | | Other Present or Past
Directorships/
Trusteeships
(Within Past 5 Years) | |
Kathleen Blatz
901 S. Marquette Ave.
Minneapolis, MN 55402
1954 | | Board member since 1/06 for RiverSource Funds and since 6/11 for Nations Funds | | Attorney; Chief Justice, Minnesota Supreme
Court, 1998-2006 | | | 131 | | | Trustee, BlueCross BlueShield of Minnesota since 2009 | |
Edward J. Boudreau, Jr.
901 S. Marquette Ave.
Minneapolis, MN 55402
1944 | | Board member since 6/11 for RiverSource Funds and since 1/05 for Nations Funds | | Managing Director, E.J. Boudreau & Associates (consulting) since 2000; Chairman and Chief Executive Officer, John Hancock Funds (mutual funds), 1989-2000 | | | 129 | | | Former Trustee, BofA Funds Series Trust (11 funds), 2005-2011 | |
Pamela G. Carlton
901 S. Marquette Ave.
Minneapolis, MN 55402
1954 | | Board member since 7/07 for RiverSource Funds and since 6/11 for Nations Funds | | President, Springboard — Partners in Cross Cultural Leadership (consulting company) since 2003; Director or Management Director of US Equity Research, Chase Asset Management, 1996-2003; Investment Banker, Morgan Stanley, 1982-1996 | | | 131 | | | None | |
William P. Carmichael
901 S. Marquette Ave.
Minneapolis, MN 55402
1943 | | Chair of the Board since 1/14, Board member since 6/11 for RiverSource Funds and since 2003 for Nations Funds | | Retired; Co-founder, The Succession Fund (provides exit strategies to owners of privately held companies); previously, Senior Vice President, Sara Lee Corporation; Senior Vice President and Chief Financial officer, Beatrice Foods Company; Vice President, Esmark, Inc.; Associate, Price Waterhouse | | | 131 | | | Director, Cobra Electronics Corporation (electronic equipment manufacturer); The Finish Line (athletic shoes and apparel) since July 2003; Director, International Textile Corp. since 2012; former Director, McMoRan Exploration Company (oil and gas exploration and development) 2010-2013; former Trustee, BofA Funds Series Trust (11 funds), 2009-2011; Director, Spectrum Brands, Inc. (consumer products), 2002-2009; Director, Simmons Company (bedding), 2004-2010 | |
Annual Report 2014
33
Columbia Select Large Cap Equity Fund
Trustees and Officers (continued)
Independent Trustees (continued)
Name,
Address,
Year of Birth | | Position Held With
Funds and Length of
Service | | Principal Occupation(s)
During Past Five Years
and Other Relevant
Professional Experience | | Number of
Funds in the
Fund Family
Overseen by
Board Member | | Other Present or Past
Directorships/
Trusteeships
(Within Past 5 Years) | |
Patricia M. Flynn
901 S. Marquette Ave.
Minneapolis, MN 55402
1950 | | Board member since 11/04 for RiverSource Funds and since 6/11 for Nations Funds | | Trustee Professor of Economics and Management, Bentley University since 1976 (also teaches and conducts research on corporate governance); Dean, McCallum Graduate School of Business, Bentley University, 1992-2002 | | | 131 | | | None | |
William A. Hawkins
901 S. Marquette Ave.
Minneapolis, MN 55402
1942 | | Board member since 6/11 for RiverSource Funds and since 1/05 for Nations Funds | | Managing Director, Overton Partners (financial consulting), since August 2010; President and Chief Executive Officer, California General Bank, N.A., January 2008-August 2010 | | | 129 | | | Trustee, BofA Funds Series Trust (11 funds) | |
R. Glenn Hilliard
901 S. Marquette Ave.
Minneapolis, MN 55402
1943 | | Board member since 6/11 for RiverSource Funds and since 1/05 for Nations Funds | | Chairman and Chief Executive Officer, Hilliard Group LLC (investing and consulting) since April 2003; Non-Executive Director & Chairman, CNO Financial Group, Inc. (insurance), September 2003-May 2011 | | | 129 | | | Chairman, BofA Fund Series Trust (11 funds); former Director, CNO Financial Group, Inc. (insurance), 2003-2011 | |
Stephen R. Lewis, Jr.
901 S. Marquette Ave.
Minneapolis, MN 55402
1939 | | Board member for RiverSource Funds since 1/02 and since 6/11 for Nations Funds, Board Chair 1/07-12/13 | | President Emeritus and Professor of Economics Emeritus, Carleton College since 2002 | | | 131 | | | Director, Valmont Industries, Inc. (irrigation systems manufacturer), 2002-2013 | |
Catherine James Paglia
901 S. Marquette Ave.
Minneapolis, MN 55402
1952 | | Board member since 11/04 for RiverSource Funds and since 6/11 for Nations Funds | | Director, Enterprise Asset Management, Inc. (private real estate and asset management company) since September 1998 | | | 131 | | | Director, Valmont Industries, Inc. (irrigation systems manufacturer) since 2012 | |
Leroy C. Richie
901 S. Marquette Ave.
Minneapolis, MN 55402
1941 | | Board member since 2000 for Legacy Seligman Funds, since 11/08 for RiverSource Funds and since 6/11 for Nations Funds | | Counsel, Lewis & Munday, P.C. (law firm) since 2004; Vice President and General Counsel, Automotive Legal Affairs, Chrysler Corporation, 1993-1997 | | | 131 | | | Lead Outside Director, Digital Ally, Inc. (digital imaging) since September 2005; Director, Infinity, Inc. (oil and gas exploration and production) since 1994; Director, OGE Energy Corp. (energy and energy services) since November 2007 | |
Minor M. Shaw
901 S. Marquette Ave.
Minneapolis, MN 55402
1947 | | Board member since 6/11 for RiverSource Funds and since 2003 for Nations Funds | | President, Micco LLC (private investments) since 2011; President, Micco Corp. since 1998 | | | 129 | | | Director, Piedmont Natural Gas; Director, BlueCross BlueShield of South Carolina since April 2008; Director, National Association of Corporate Directors, Carolinas Chapter, since 2013; former Trustee, BofA Funds Series Trust (11 funds) | |
Annual Report 2014
34
Columbia Select Large Cap Equity Fund
Trustees and Officers (continued)
Independent Trustees (continued)
Name,
Address,
Year of Birth | | Position Held With
Funds and Length of
Service | | Principal Occupation(s)
During Past Five Years
and Other Relevant
Professional Experience | | Number of
Funds in the
Fund Family
Overseen by
Board Member | | Other Present or Past
Directorships/
Trusteeships
(Within Past 5 Years) | |
Alison Taunton-Rigby
901 S. Marquette Ave.
Minneapolis, MN 55402
1944 | | Board member since 11/02 for RiverSource Funds and since 6/11 for Nations Funds | | Chief Executive Officer and Director, RiboNovix, Inc., (biotechnology) 2003-2010 | | | 131 | | | Director, Healthways, Inc. (health and wellbeing solutions) since 2005; Director, ICI Mutual Insurance Company, RRG since 2011; Director, Abt Associates (government contractor) since 2001; Director, Boston Children's Hospital since 2002 | |
Interested Trustee Not Affiliated with Investment Manager*
Name,
Address,
Year of Birth | | Position Held With
Funds and Length of
Service | | Principal Occupation(s)
During Past Five Years
and Other Relevant
Professional Experience | | Number of
Funds in the
Fund Family
Overseen by
Board Member | | Other Present or Past
Directorships/
Trusteeships
(Within Past 5 Years) | |
Anthony M. Santomero
901 S. Marquette Ave.
Minneapolis, MN 55402
1946 | | Board member since 6/11 for RiverSource Funds and since 1/08 for Nations Funds | | Richard K. Mellon Professor Emeritus of Finance, The Wharton School, University of Pennsylvania, since 2002; Senior Advisor, McKinsey & Company (consulting), 2006-2008 | | | 129 | | | Director, Renaissance Reinsurance Ltd. since May 2008; Trustee, Penn Mutual Life Insurance Company since March 2008; Director, Citigroup Inc. since 2009; Director, Citibank, N.A. since 2009; former Trustee, BofA Funds Series Trust (11 funds), 2008-2011 | |
* Dr. Santomero is not an affiliated person of the Investment Manager or Ameriprise Financial. However, he is currently deemed by the Funds to be an "interested person" (as defined in the 1940 Act) of the Funds because he serves as a Director of Citigroup Inc. and Citibank, N.A., companies that may directly or through subsidiaries and affiliates engage from time-to-time in brokerage execution, principal transactions and lending relationships with the Funds or accounts advised/managed by the Investment Manager.
Annual Report 2014
35
Columbia Select Large Cap Equity Fund
Trustees and Officers (continued)
Interested Trustee Affiliated with Investment Manager*
Name,
Address,
Year of Birth | | Position Held With
Funds and Length of
Service | | Principal Occupation(s)
During Past Five Years
and Other Relevant
Professional Experience | | Number of
Funds in the
Fund Family
Overseen by
Board Member | | Other Present or Past
Directorships/
Trusteeships
(Within Past 5 Years) | |
William F. Truscott
53600 Ameriprise
Financial Center
Minneapolis, MN 55474
1960 | | Board member since 11/01 for RiverSource Funds and since 6/11 for Nations Funds; Senior Vice President since 2002 for RiverSource Funds and since 5/10 for Nations Funds | | Chairman of the Board and President, Columbia Management Investment Advisers, LLC since May 2010 and February 2012, respectively (previously President and Chief Investment Officer, 2001-April 2010); Chief Executive Officer, Global Asset Management, Ameriprise Financial, Inc. since September 2012 (previously Chief Executive Officer, U.S. Asset Management & President, Annuities, May 2010-September 2012 and President — U.S. Asset Management and Chief Investment Officer, 2005-April 2010); Director and Chief Executive Officer, Columbia Management Investment Distributors, Inc. since May 2010 and February 2012, respectively (previously Chairman of the Board and Chief Executive Officer, 2006-April 2010); Chairman of the Board and Chief Executive Officer, RiverSource Distributors, Inc. since 2006; Director, Threadneedle Asset Management Holdings, SARL since 2014; President and Chief Executive Officer, Ameriprise Certificate Company, 2006-August 2012 | | | 183 | | | Former Director, Ameriprise Certificate Company, 2006-January 2013 | |
* Interested person (as defined under the 1940 Act) by reason of being an officer, director, security holder and/or employee of the Investment Manager or Ameriprise Financial.
The SAI has additional information about the Fund's Board members and is available, without charge, upon request by calling 800.345.6611; contacting your financial intermediary or visiting columbiamanagement.com.
Annual Report 2014
36
Columbia Select Large Cap Equity Fund
Trustees and Officers (continued)
The Board has appointed officers who are responsible for day-to-day business decisions based on policies it has established. The officers serve at the pleasure of the Board. In addition to Mr. Truscott, who is Senior Vice President, the Funds' other officers are:
Officers
Name,
Address and
Year of Birth | | Position and Year
First Appointed to
Position for any Fund
in the Columbia
Funds Complex or a
Predecessor Thereof | | Principal Occupation(s) During Past Five Years | |
J. Kevin Connaughton
225 Franklin Street
Boston, MA 02110
Born 1964 | | President and Principal Executive Officer (2009) | | Managing Director and General Manager — Mutual Fund Products, Columbia Management Investment Advisers, LLC since May 2010; and President, Columbia Funds since 2009; Managing Director, Columbia Management Advisors, LLC, December 2004 – April 2010; Senior Vice President and Chief Financial Officer, Columbia Funds, June 2008 – January 2009; and senior officer of Columbia Funds and affiliated funds since 2003 | |
Michael G. Clarke
225 Franklin Street
Boston, MA 02110
Born 1969 | | Treasurer (2011) and Chief Financial Officer (2009) | | Vice President — Mutual Fund Administration, Columbia Management Investment Advisers, LLC, since May 2010;Managing Director of Fund Administration, Columbia Management Advisors, LLC, September 2004 – April 2010; and senior officer of Columbia Funds and affiliated funds since 2002 | |
Scott R. Plummer
5228 Ameriprise Financial Center
Minneapolis, MN 55474
Born 1959 | | Senior Vice President (2006), Chief Legal Officer (2006) and Assistant Secretary (2011) | | Senior Vice President and Assistant General Counsel — Global Asset Management, Ameriprise Financial since February 2014 (previously, Senior Vice President and Lead Chief Counsel — Asset Management, 2012 – February 2014; Vice President and Lead Chief Counsel — Asset Management, 2010 – 2012; and Vice President and Chief Counsel — Asset Management, 2005 – 2010); Senior Vice President, Chief Legal Officer and Assistant Secretary, Columbia Management Investment Advisers, LLC since June 2005; Vice President, Chief Counsel and Assistant Secretary, Columbia Management Investment Distributors, Inc. since 2008; Vice President, General Counsel and Secretary, Ameriprise Certificate Company since 2005; Chief Counsel, RiverSource Distributors, Inc. since 2006; senior officer of Columbia Funds and affiliated funds since 2006 | |
Thomas P. McGuire
225 Franklin Street
Boston, MA 02110
Born 1972 | | Chief Compliance Officer (2012) | | Vice President — Asset Management Compliance, Ameriprise Financial, Inc. since May 2010; Chief Compliance Officer, Ameriprise Certificate Company, since September 2010; Compliance Executive, Bank of America, 2005 – April 2010 | |
Colin Moore
225 Franklin Street
Boston, MA 02110
Born 1958 | | Senior Vice President (2010) | | Executive Vice President and Global Chief Investment Officer, Ameriprise Financial, Inc. since July 2013; Director and Global Chief Investment Officer, Columbia Management Investment Advisers, LLC since May 2010; Manager, Managing Director and Chief Investment Officer, Columbia Management Advisors, LLC, 2007 – April 2010 | |
Michael E. DeFao
225 Franklin Street
Boston, MA 02110
Born 1968 | | Vice President (2011) and Assistant Secretary (2010) | | Vice President and Chief Counsel, Ameriprise Financial, Inc. since May 2010; Associate General Counsel, Bank of America 2005 – April 2010 | |
Joseph F. DiMaria
225 Franklin Street
Boston, MA 02110
Born 1968 | | Vice President (2011) and Chief Accounting Officer (2008) | | Vice President — Mutual Fund Treasurer, Columbia Management Investment Advisers, LLC since May 2010; Director of Fund Administration, Columbia Management Advisors, LLC, 2006 – April 2010 | |
Paul B. Goucher
100 Park Avenue
New York, NY 10017
Born 1968 | | Vice President (2011) and Assistant Secretary (2008) | | Vice President and Lead Chief Counsel, Ameriprise Financial, Inc. since November 2008 and January 2013, respectively (previously Chief Counsel, January 2010 – January 2013, and Group Counsel, November 2008 – January 2010); Director, Managing Director and General Counsel, J. & W. Seligman & Co. Incorporated, July 2008 – November 2008 | |
Amy Johnson
5228 Ameriprise Financial
Center
Minneapolis, MN 55474
Born 1965 | | Vice President (2006) | | Managing Director and Chief Operating Officer, Columbia Management Investment Advisers, LLC since May 2010 (previously Chief Administrative Officer, 2009 – April 2010, and Vice President — Asset Management and Trust Company Services, 2006 – 2009) | |
Annual Report 2014
37
Columbia Select Large Cap Equity Fund
Trustees and Officers (continued)
Officers (continued)
Name,
Address and
Year of Birth | | Position and Year
First Appointed to
Position for any Fund
in the Columbia
Funds Complex or a
Predecessor Thereof | | Principal Occupation(s) During Past Five Years | |
Paul D. Pearson
5228 Ameriprise Financial
Center
Minneapolis, MN 55474
Born 1956 | | Vice President (2011) and Assistant Treasurer (1999) | | Vice President — Investment Accounting, Columbia Management Investment Advisers, LLC since May 2010; Vice President — Managed Assets, Investment Accounting, Ameriprise Financial, Inc., 1998 – April 2010 | |
Christopher O. Petersen
5228 Ameriprise Financial Center
Minneapolis, MN 55474
Born 1970 | | Vice President and Secretary (2010) | | Vice President and Chief Counsel, Ameriprise Financial, Inc., since January 2010 (previously Vice President and Group Counsel or Counsel, 2004 – January 2010); officer of Columbia Funds and affiliated funds since 2007 | |
Stephen T. Welsh
225 Franklin Street
Boston, MA 02110
Born 1957 | | Vice President (2006) | | President and Director, Columbia Management Investment Services Corp. since May 2010; President and Director, Columbia Management Services, Inc., 2004 – April 2010; Managing Director, Columbia Management Distributors, Inc., 2007 – April 2010 | |
Annual Report 2014
38
This page intentionally left blank.
Annual Report 2014
39
This page intentionally left blank.
Annual Report 2014
40
Columbia Select Large Cap Equity Fund
Important Information About This Report
Each fund mails one shareholder report to each shareholder address. If you would like more than one report, please call shareholder services at 800.345.6611 and additional reports will be sent to you.
The policy of the Board is to vote the proxies of the companies in which each fund holds investments consistent with the procedures as stated in the Statement of Additional Information (SAI). You may obtain a copy of the SAI without charge by calling 800.345.6611; contacting your financial intermediary; visiting columbiamanagement.com; or searching the website of the Securities and Exchange Commission (SEC) at sec.gov. Information regarding how each fund voted proxies relating to portfolio securities is filed with the SEC by August 31 for the most recent 12-month period ending June 30 of that year, and is available without charge by visiting columbiamanagement.com; or searching the website of the SEC at sec.gov.
Each fund files a complete schedule of portfolio holdings with the SEC for the first and third quarters of each fiscal year on Form N-Q. Each fund's Form N-Q is available on the SEC's website at sec.gov and may be reviewed and copied at the SEC's Public Reference Room in Washington, D.C. Information on the operation of the Public Reference Room may be obtained by calling 800.SEC.0330. Each fund's complete schedule of portfolio holdings, as filed on Form N-Q, can also be obtained without charge, upon request, by calling 800.345.6611.
Annual Report 2014
41

Columbia Select Large Cap Equity Fund
P.O. Box 8081
Boston, MA 02266-8081
columbiamanagement.com
This information is for use with concurrent or prior delivery of a fund prospectus. Please read and consider the investment objectives, risks, charges and expenses for any fund carefully before investing. For a prospectus and, if available, a summary prospectus, which contains this and other important information about the Fund go to columbiamanagement.com. The Fund is distributed by Columbia Management Investment Distributors, Inc., member FINRA, and managed by Columbia Management Investment Advisers, LLC.
© 2014 Columbia Management Investment Advisers, LLC. All rights reserved.
ANN172_02_D01_(04/14)
Annual Report
February 28, 2014

Columbia Small Cap Value Fund II
Not FDIC insured • No bank guarantee • May lose value
 Dear Shareholders,
Equities recovered
In the final months of 2013, the U.S. economy embraced a robust recovery. After five years of only modest progress, the pace of economic growth picked up, job gains continued, manufacturing activity accelerated and a rebound in the housing market showed staying power. Growth, as measured by gross domestic product, was 4.1% in the third quarter, with expectations for a solid fourth quarter. Job growth averaged close to 200,000 monthly. Industrial production rose at a rate of 3.3%, considerably higher than the 12-month average of 2.5%. Factories were busier than at any point since the 2008/2009 recession, with capacity utilization at 79%. Orders for durable goods were strong, bolstered by rising auto sales. Holiday spending was solid, especially online sales, which rose 10% year over year, despite a shorter season.
Against this backdrop, the Federal Reserve's (the Fed's) announcement that it would slowly retreat from its monthly bond buying program and a bipartisan budget deal in Washington were welcome news for investors. Stocks climbed to new highs in the fourth quarter, while bonds retreated as yields moved higher. Small-cap stocks outperformed large- and mid-cap stocks, led by significant gains from the industrials, technology and consumer discretionary sectors. All 10 sectors of the S&P 500 Index delivered positive returns, although telecommunications and utilities posted only modest gains.
Fixed-income retreated
Improved economic data drove interest rates higher over the fourth quarter, credit spreads narrowed and the dollar weakened against most developed market currencies. Against this backdrop, most non-Treasury, fixed-income sectors delivered positive returns. Outgoing Fed chairman Ben Bernanke expressed concern about the persistently low level of core inflation, but gains in the labor market and reduced unemployment led to the Fed's decision to taper its bond-buying program gradually beginning in January 2014.
As the stock market soared, the riskiest sectors of the fixed-income markets fared the best. U.S. and foreign high-yield bonds were the strongest performers, followed by emerging-market and U.S. investment-grade corporate bonds. U.S. mortgage-backed securities (MBS) and securitized bonds produced negative total returns, as did U.S. Treasuries and developed world government bonds. Treasury inflation-protected bonds were the period's biggest losers. Investment-grade municipals delivered fractional gains, as better economic conditions helped steady state finances.
Stay on track with Columbia Management
Backed by more than 100 years of experience, Columbia Management is one of the nation's largest asset managers. At the heart of our success and, most importantly, that of our investors, are highly talented industry professionals, brought together by a unique way of working. At Columbia Management, reaching our performance goals matters, and how we reach them matters just as much.
Visit columbiamanagement.com for:
> The Columbia Management Perspectives blog, offering insights on current market events and investment opportunities
> Detailed up-to-date fund performance and portfolio information
> Quarterly fund commentaries
> Columbia Management Investor, our award-winning quarterly newsletter for shareholders
Thank you for your continued support of the Columbia Funds. We look forward to serving your investment needs for many years to come.
Best Regards,

J. Kevin Connaughton
President, Columbia Funds
Investing involves risk including the risk of loss of principal.
The S&P 500 Index, an unmanaged index, measures the performance of 500 widely held, large-capitalization U.S. stocks and is frequently used as a general measure of market performance. The Dow Jones Industrial Average is a price weighted average of 30 actively traded shares of blue chip US industrial corporations listed on the New York Stock Exchange. Indices are not available for investment, are not professionally managed and do not reflect sales charges, fees, brokerage commissions, taxes or other expenses of investing.
Investors should consider the investment objectives, risks, charges and expenses of a mutual fund carefully before investing. For a free prospectus and, if available, a summary prospectus, which contains this and other important information about a fund, visit columbiamanagement.com. The prospectus should be read carefully before investing.
Columbia Funds are distributed by Columbia Management Investment Distributors, Inc., member FINRA, and managed by Columbia Management Investment Advisers, LLC.
© 2014 Columbia Management Investment Advisers, LLC. All rights reserved.
Columbia Small Cap Value Fund II
Performance Overview | | | 2 | | |
Manager Discussion of Fund Performance | | | 4 | | |
Understanding Your Fund's Expenses | | | 6 | | |
Portfolio of Investments | | | 7 | | |
Statement of Assets and Liabilities | | | 12 | | |
Statement of Operations | | | 14 | | |
Statement of Changes in Net Assets | | | 15 | | |
Financial Highlights | | | 18 | | |
Notes to Financial Statements | | | 27 | | |
Report of Independent Registered
Public Accounting Firm | | | 33 | | |
Federal Income Tax Information | | | 34 | | |
Trustees and Officers | | | 35 | | |
Important Information About This Report | | | 41 | | |
Fund Investment Manager
Columbia Management Investment
Advisers, LLC
225 Franklin Street
Boston, MA 02110
Fund Distributor
Columbia Management Investment
Distributors, Inc.
225 Franklin Street
Boston, MA 02110
Fund Transfer Agent
Columbia Management Investment
Services Corp.
P.O. Box 8081
Boston, MA 02266-8081
For more information about any of the funds, please visit columbiamanagement.com or call 800.345.6611. Customer Service Representatives are available to answer your questions Monday through Friday from 8 a.m. to 7 p.m. Eastern time.
The views expressed in this report reflect the current views of the respective parties. These views are not guarantees of future performance and involve certain risks, uncertainties and assumptions that are difficult to predict, so actual outcomes and results may differ significantly from the views expressed. These views are subject to change at any time based upon economic, market or other conditions and the respective parties disclaim any responsibility to update such views. These views may not be relied on as investment advice and, because investment decisions for a Columbia Fund are based on numerous factors, may not be relied on as an indication of trading intent on behalf of any particular Columbia Fund. References to specific securities should not be construed as a recommendation or investment advice.
Columbia Small Cap Value Fund II
Performance Summary
> Columbia Small Cap Value Fund II (the Fund) Class A shares returned 29.93% excluding sales charges for the 12-month period that ended February 28, 2014.
> The Fund outperformed its benchmark, the Russell 2000 Value Index, which returned 26.19% for the same time period.
> Security selection, especially in the financials and materials sectors, generally accounted for the Fund's performance advantage over its benchmark.
Average Annual Total Returns (%) (for period ended February 28, 2014)
| | Inception | | 1 Year | | 5 Years | | 10 Years | |
Class A | | 05/01/02 | | | | | | | | | | | | | |
Excluding sales charges | | | | | | | 29.93 | | | | 26.34 | | | | 9.62 | | |
Including sales charges | | | | | | | 22.47 | | | | 24.85 | | | | 8.97 | | |
Class B | | 05/01/02 | | | | | | | | | | | | | |
Excluding sales charges | | | | | | | 28.91 | | | | 25.40 | | | | 8.79 | | |
Including sales charges | | | | | | | 23.91 | | | | 25.24 | | | | 8.79 | | |
Class C | | 05/01/02 | | | | | | | | | | | | | |
Excluding sales charges | | | | | | | 29.02 | | | | 25.39 | | | | 8.79 | | |
Including sales charges | | | | | | | 28.02 | | | | 25.39 | | | | 8.79 | | |
Class I* | | 09/27/10 | | | 30.48 | | | | 26.76 | | | | 9.80 | | |
Class R* | | 01/23/06 | | | 29.61 | | | | 26.03 | | | | 9.34 | | |
Class R4* | | 11/08/12 | | | 30.18 | | | | 26.41 | | | | 9.65 | | |
Class R5* | | 11/08/12 | | | 30.43 | | | | 26.47 | | | | 9.68 | | |
Class Y* | | 11/08/12 | | | 30.52 | | | | 26.49 | | | | 9.69 | | |
Class Z | | 05/01/02 | | | 30.26 | | | | 26.64 | | | | 9.89 | | |
Russell 2000 Value Index | | | | | | | 26.19 | | | | 25.14 | | | | 8.09 | | |
Returns for Class A are shown with and without the maximum initial sales charge of 5.75%. Returns for Class B are shown with and without the applicable contingent deferred sales charge (CDSC) of 5.00% in the first year, declining to 1.00% in the sixth year and eliminated thereafter. Returns for Class C are shown with and without the 1.00% CDSC for the first year only. The Fund's other classes are not subject to sales charges and have limited eligibility. Please see the Fund's prospectus for details. Performance for different share classes will vary based on differences in sales charges and fees associated with each class. All results shown assume reinvestment of distributions during the period. Returns do not reflect the deduction of taxes that a shareholder may pay on Fund distributions or on the redemption of Fund shares. Performance results reflect the effect of any fee waivers or reimbursements of Fund expenses by Columbia Management Investment Advisers, LLC and/or any of its affiliates. Absent these fee waivers or expense reimbursement arrangements, performance results would have been lower.
The performance information shown represents past performance and is not a guarantee of future results. The investment return and principal value of your investment will fluctuate so that your shares, when redeemed, may be worth more or less than their original cost. Current performance may be lower or higher than the performance information shown. You may obtain performance information current to the most recent month-end by contacting your financial intermediary, visiting columbiamanagement.com or calling 800.345.6611.
*The returns shown for periods prior to the share class inception date (including returns for the Life of the Fund, if shown, which are since Fund inception) include the returns of the Fund's oldest share class. Since the Fund launched more than one share class at its inception, Class A shares were used. These returns are adjusted to reflect any higher class-related operating expenses of the newer share classes, as applicable. Please visit columbiamanagement.com/mutual-funds/appended-performance for more information.
The Russell 2000 Value Index, an unmanaged index, tracks the performance of those Russell 2000 Index companies with lower price-to-book ratios and lower forecasted growth values.
Indices are not available for investment, are not professionally managed and do not reflect sales charges, fees, brokerage commissions, taxes or other expenses of investing. Securities in the Fund may not match those in an index.
Annual Report 2014
2
Columbia Small Cap Value Fund II
Performance Overview (continued)
Performance of a Hypothetical $10,000 Investment (March 1, 2004 – February 28, 2014)
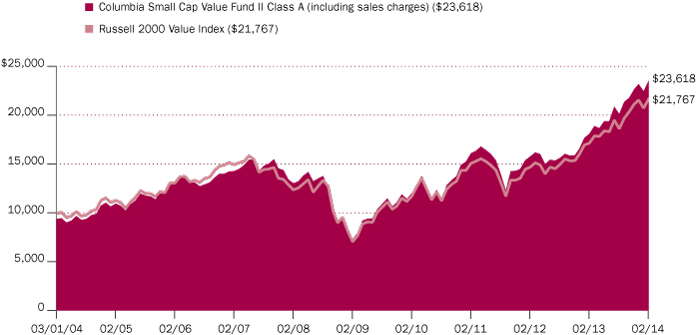
The chart above shows the change in value of a hypothetical $10,000 investment in Class A shares of Columbia Small Cap Value Fund II during the stated time period, and does not reflect the deduction of taxes that a shareholder may pay on Fund distributions or on the redemption of Fund shares.
Annual Report 2014
3
Columbia Small Cap Value Fund II
Manager Discussion of Fund Performance
For the 12-month period that ended February 28, 2014, the Fund's Class A shares returned 29.93% excluding sales charges. The Fund outperformed its benchmark, the Russell 2000 Value Index, which returned 26.19% for the same time period. Bottom-up security selection, which focused on attractively valued small-cap stocks with strong or improving earnings prospects, drove the Fund's outperformance.
Stocks Soared in Favorable Market Environment
Stocks rose to record levels over the 12 months ended February 28, 2014, buoyed by an improving U.S. economy, as evidenced by continued job gains, a pickup in manufacturing and a rebound in housing. Intermittent weak economic data, political uncertainty and fears of military conflict did little to derail the market's momentum. Stocks dipped midway through the period after the U.S. Federal Reserve (the Fed) hinted that it was ready to taper its bond buying, but quickly recovered when those plans were pushed out to 2014. The budget stalemate in Washington and subsequent federal government shutdown last fall also pressured returns, but the rally rebooted once Congress reached a bipartisan agreement. The market paused again in January in the midst of severe winter weather that dampened job growth. But stocks took off again in February after reassurance from new Fed Chair Janet Yellen that monetary policy was unlikely to change.
Biggest Gains Came from Financials and Materials
Stock selection in financials, a sector representing over one-third of the Fund and benchmark, gave the biggest boost to relative performance. Declining credit problems, higher interest rates and merger activity in the sector benefited many of the Fund's holdings. An underweight in real estate investment trusts (REITs), which lagged as interest rates rose, and positive security selection in the insurance industry were particularly helpful. In materials, stock selection in the paper and forest products and materials and mining segments contributed to relative results.
The Fund's top individual contributors came from a variety of sectors. In consumer staples, personal products stock Nu Skin Enterprises saw a robust gain, driven by good sales globally and new product rollouts. In consumer discretionary, auto components maker Tower International and jewelry retailer Zale aided results. Tower's steep stock appreciation was the result of good execution by management and moves — such as divestitures and debt pay down — aimed at creating shareholder value. Zale was in the midst of a turnaround when a late-period buyout announcement gave the stock a sharp boost. Zale was not in the portfolio at period end. In materials, an investment in pulp and paper company KapStone Paper and Packaging soared when it acquired a competitor. SunEdison, which develops and manages solar energy projects, was another standout performer. Successful solar project developments and plans to spin off its semiconductor business drove the share price much higher. Each of these stocks produced outsized gains for the year.
Energy and Technology Underperformed
Investments in the energy, information technology, telecommunications services and health care sectors detracted from relative performance. Among individual detractors was Midstates Petroleum Company, an independent exploration and production company. Its shares fell when the company encountered production
Portfolio Management
Christian Stadlinger, Ph.D., CFA
Jarl Ginsberg, CFA, CAIA
Morningstar Style BoxTM
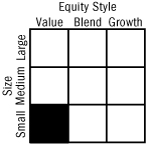
The Morningstar Style BoxTM is based on a fund's portfolio holdings. For equity funds, the vertical axis shows the market capitalization of the stocks owned, and the horizontal axis shows investment style (value, blend, or growth). Information shown is based on the most recent data provided by Morningstar.
© 2014 Morningstar, Inc. All rights reserved. The Morningstar information contained herein: (1) is proprietary to Morningstar and/or its content providers; (2) may not be copied or distributed; and (3) is not warranted to be accurate, complete or timely. Neither Morningstar nor its content providers are responsible for any damages or losses arising from any use of this information.
Top Ten Holdings (%)
(at February 28, 2014) | |
Helen of Troy Ltd. | | | 1.2 | | |
AMERISAFE, Inc. | | | 1.2 | | |
Constellium NV | | | 1.2 | | |
Kindred Healthcare, Inc. | | | 1.2 | | |
KapStone Paper and
Packaging Corp. | | | 1.2 | | |
Sterling Bancorp | | | 1.2 | | |
Neenah Paper, Inc. | | | 1.2 | | |
Amtrust Financial Services, Inc. | | | 1.1 | | |
Deluxe Corp. | | | 1.1 | | |
Prosperity Bancshares, Inc. | | | 1.1 | | |
Percentages indicated are based upon total investments (excluding Money Market Funds).
For further detail about these holdings, please refer to the section entitled "Portfolio of Investments."
Fund holdings are as of the date given, are subject to change at any time, and are not recommendations to buy or sell any security.
Annual Report 2014
4
Columbia Small Cap Value Fund II
Manager Discussion of Fund Performance (continued)
delays with existing wells and also increased debt to make acquisitions. Shares of casual dining restaurant chain Ruby Tuesday declined when same-store sales did not improve as expected. Within the industrials sector, Titan Machinery was a negative, due to pricing pressure in the construction equipment segment. We eliminated Midstates and Titan from the portfolio.
Looking Ahead
Going forward, we plan to keep our focus on attractively valued small-cap stocks that we believe to be improving or have strong earnings growth prospects. We are particularly interested in "out-of-the-limelight" companies that have been overlooked by Wall Street analysts, companies in out-of-favor industries and attractively valued companies showing evidence of improvement in their operations. Bottom-up security selection continues to drive sector allocations, which at period end included overweights versus the benchmark in materials, technology and health care, and underweights in financials, industrials, utilities and consumer staples.
Portfolio Breakdown (%)
(at February 28, 2014) | |
Common Stocks | | | 95.4 | | |
Consumer Discretionary | | | 10.6 | | |
Consumer Staples | | | 0.7 | | |
Energy | | | 6.4 | | |
Financials | | | 32.4 | | |
Health Care | | | 6.5 | | |
Industrials | | | 11.3 | | |
Information Technology | | | 14.3 | | |
Materials | | | 9.0 | | |
Utilities | | | 4.2 | | |
Money Market Funds | | | 4.6 | | |
Total | | | 100.0 | | |
Percentages indicated are based upon total investments. The Fund's portfolio composition is subject to change.
Investment Risks
Share prices of small-capitalization companies tend to be more volatile because small companies often have narrower markets, limited financial resources and stocks that are not as actively traded as large company stocks. See the Fund's prospectus for more information on these and other risks.
Annual Report 2014
5
Columbia Small Cap Value Fund II
Understanding Your Fund's Expenses
(Unaudited)
As an investor, you incur two types of costs. There are transaction costs, which generally include sales charges on purchases and may include redemption fees. There are also ongoing costs, which generally include management fees, distribution and/or service fees, and other fund expenses. The following information is intended to help you understand your ongoing costs (in dollars) of investing in the Fund and to help you compare these costs with the ongoing costs of investing in other mutual funds.
Analyzing Your Fund's Expenses
To illustrate these ongoing costs, we have provided examples and calculated the expenses paid by investors in each share class of the Fund during the period. The actual and hypothetical information in the table is based on an initial investment of $1,000 at the beginning of the period indicated and held for the entire period. Expense information is calculated two ways and each method provides you with different information. The amount listed in the "Actual" column is calculated using the Fund's actual operating expenses and total return for the period. You may use the Actual information, together with the amount invested, to estimate the expenses that you paid over the period. Simply divide your account value by $1,000 (for example, an $8,600 account value divided by $1,000 = 8.6), then multiply the results by the expenses paid during the period under the "Actual" column. The amount listed in the "Hypothetical" column assumes a 5% annual rate of return before expenses (which is not the Fund's actual return) and then applies the Fund's actual expense ratio for the period to the hypothetical return. You should not use the hypothetical account values and expenses to estimate either your actual account balance at the end of the period or the expenses you paid during the period. See "Compare With Other Funds" below for details on how to use the hypothetical data.
Compare With Other Funds
Since all mutual funds are required to include the same hypothetical calculations about expenses in shareholder reports, you can use this information to compare the ongoing cost of investing in the Fund with other funds. To do so, compare the hypothetical example with the 5% hypothetical examples that appear in the shareholder reports of other funds. As you compare hypothetical examples of other funds, it is important to note that hypothetical examples are meant to highlight the ongoing costs of investing in a fund only and do not reflect any transaction costs, such as sales charges, or redemption or exchange fees. Therefore, the hypothetical calculations are useful in comparing ongoing costs only, and will not help you determine the relative total costs of owning different funds. If transaction costs were included in these calculations, your costs would be higher.
September 1, 2013 – February 28, 2014
| | Account Value at the Beginning
of the Period ($) | | Account Value at the End of the
Period ($) | | Expenses Paid During the
Period ($) | | Fund's Annualized
Expense Ratio (%) | |
| | Actual | | Hypothetical | | Actual | | Hypothetical | | Actual | | Hypothetical | | Actual | |
Class A | | | 1,000.00 | | | | 1,000.00 | | | | 1,168.20 | | | | 1,018.50 | | | | 6.97 | | | | 6.49 | | | | 1.29 | | |
Class B | | | 1,000.00 | | | | 1,000.00 | | | | 1,163.20 | | | | 1,014.81 | | | | 10.95 | | | | 10.20 | | | | 2.03 | | |
Class C | | | 1,000.00 | | | | 1,000.00 | | | | 1,164.00 | | | | 1,014.76 | | | | 11.01 | | | | 10.25 | | | | 2.04 | | |
Class I | | | 1,000.00 | | | | 1,000.00 | | | | 1,170.60 | | | | 1,020.79 | | | | 4.49 | | | | 4.18 | | | | 0.83 | | |
Class R | | | 1,000.00 | | | | 1,000.00 | | | | 1,166.40 | | | | 1,017.25 | | | | 8.32 | | | | 7.75 | | | | 1.54 | | |
Class R4 | | | 1,000.00 | | | | 1,000.00 | | | | 1,169.20 | | | | 1,019.70 | | | | 5.68 | | | | 5.29 | | | | 1.05 | | |
Class R5 | | | 1,000.00 | | | | 1,000.00 | | | | 1,170.60 | | | | 1,020.49 | | | | 4.82 | | | | 4.48 | | | | 0.89 | | |
Class Y | | | 1,000.00 | | | | 1,000.00 | | | | 1,170.90 | | | | 1,020.74 | | | | 4.55 | | | | 4.23 | | | | 0.84 | | |
Class Z | | | 1,000.00 | | | | 1,000.00 | | | | 1,169.60 | | | | 1,019.75 | | | | 5.63 | | | | 5.24 | | | | 1.04 | | |
Expenses paid during the period are equal to the annualized expense ratio for each class as indicated above, multiplied by the average account value over the period and then multiplied by the number of days in the Fund's most recent fiscal half year and divided by 365.
Expenses do not include fees and expenses incurred indirectly by the Fund from the underlying funds in which the Fund may invest (also referred to as "acquired funds"), including affiliated and non-affiliated pooled investment vehicles (including mutual funds and exchange-traded funds).
Annual Report 2014
6
Columbia Small Cap Value Fund II
Portfolio of Investments
February 28, 2014
(Percentages represent value of investments compared to net assets)
Common Stocks 95.0%
Issuer | | Shares | | Value ($) | |
Consumer Discretionary 10.6% | |
Auto Components 2.8% | |
American Axle & Manufacturing
Holdings, Inc.(a) | | | 720,000 | | | | 13,917,600 | | |
Tenneco, Inc.(a) | | | 315,000 | | | | 18,975,600 | | |
Tower International, Inc.(a) | | | 730,000 | | | | 18,746,400 | | |
Total | | | | | 51,639,600 | | |
Hotels, Restaurants & Leisure 1.7% | |
Del Frisco's Restaurant Group, Inc.(a) | | | 516,261 | | | | 13,443,437 | | |
Intrawest Resorts Holdings I(a) | | | 183,745 | | | | 2,471,370 | | |
Sonic Corp.(a) | | | 750,000 | | | | 15,285,000 | | |
Total | | | | | 31,199,807 | | |
Household Durables 3.0% | |
Helen of Troy Ltd.(a) | | | 332,000 | | | | 21,682,920 | | |
KB Home | | | 800,000 | | | | 16,320,000 | | |
Standard Pacific Corp.(a) | | | 1,775,000 | | | | 16,170,250 | | |
Total | | | | | 54,173,170 | | |
Media 0.8% | |
Sinclair Broadcast Group, Inc., Class A | | | 500,000 | | | | 14,810,000 | | |
Specialty Retail 2.3% | |
Finish Line, Inc., Class A (The) | | | 600,000 | | | | 16,212,000 | | |
Office Depot, Inc.(a) | | | 2,421,000 | | | | 11,935,530 | | |
Sonic Automotive, Inc., Class A | | | 400,000 | | | | 9,504,000 | | |
Wet Seal, Inc. (The), Class A(a) | | | 2,100,000 | | | | 3,990,000 | | |
Total | | | | | 41,641,530 | | |
Total Consumer Discretionary | | | | | 193,464,107 | | |
Consumer Staples 0.7% | |
Personal Products 0.7% | |
Nu Skin Enterprises, Inc., Class A | | | 150,000 | | | | 12,528,000 | | |
Total Consumer Staples | | | | | 12,528,000 | | |
Energy 6.3% | |
Energy Equipment & Services 2.7% | |
Basic Energy Services, Inc.(a) | | | 232,000 | | | | 5,533,200 | | |
C&J Energy Services, Inc.(a) | | | 309,275 | | | | 7,994,759 | | |
Helix Energy Solutions Group, Inc.(a) | | | 600,000 | | | | 14,184,000 | | |
Hornbeck Offshore Services, Inc.(a) | | | 190,000 | | | | 8,124,400 | | |
Tesco Corp.(a) | | | 748,600 | | | | 14,200,942 | | |
Total | | | | | 50,037,301 | | |
Common Stocks (continued)
Issuer | | Shares | | Value ($) | |
Oil, Gas & Consumable Fuels 3.6% | |
Athlon Energy, Inc.(a) | | | 480,000 | | | | 17,836,800 | | |
Delek U.S. Holdings, Inc. | | | 450,000 | | | | 12,492,000 | | |
Gulfport Energy Corp.(a) | | | 255,700 | | | | 16,901,770 | | |
Midstates Petroleum Co., Inc.(a) | | | 422,288 | | | | 1,862,290 | | |
PDC Energy, Inc.(a) | | | 275,000 | | | | 17,085,750 | | |
Total | | | | | 66,178,610 | | |
Total Energy | | | | | 116,215,911 | | |
Financials 32.3% | |
Capital Markets 1.3% | |
Apollo Investment Corp. | | | 901,281 | | | | 7,714,966 | | |
Medley Capital Corp. | | | 1,130,579 | | | | 15,873,329 | | |
Total | | | | | 23,588,295 | | |
Commercial Banks 12.5% | |
Community Bank System, Inc. | | | 500,000 | | | | 18,215,000 | | |
FirstMerit Corp. | | | 640,000 | | | | 13,286,400 | | |
Independent Bank Corp. | | | 475,000 | | | | 17,475,250 | | |
PrivateBancorp, Inc. | | | 525,000 | | | | 15,151,500 | | |
Prosperity Bancshares, Inc. | | | 310,000 | | | | 19,626,100 | | |
Renasant Corp. | | | 670,000 | | | | 19,470,200 | | |
Sandy Spring Bancorp, Inc. | | | 575,000 | | | | 13,644,750 | | |
Sterling Bancorp(b) | | | 1,578,125 | | | | 20,263,125 | | |
Susquehanna Bancshares, Inc. | | | 1,347,001 | | | | 14,736,191 | | |
Umpqua Holdings Corp. | | | 1,020,391 | | | | 18,132,348 | | |
Union First Market Bankshares Corp. | | | 620,000 | | | | 15,686,000 | | |
Western Alliance Bancorp(a) | | | 770,000 | | | | 17,833,200 | | |
Wilshire Bancorp, Inc. | | | 1,232,400 | | | | 12,508,860 | | |
Wintrust Financial Corp. | | | 272,300 | | | | 12,602,044 | | |
Total | | | | | 228,630,968 | | |
Consumer Finance 0.4% | |
Green Dot Corp., Class A(a) | | | 361,695 | | | | 7,288,154 | | |
Diversified Financial Services 0.7% | |
PHH Corp.(a) | | | 497,300 | | | | 12,944,719 | | |
Insurance 6.8% | |
American Equity Investment Life
Holding Co. | | | 830,000 | | | | 18,143,800 | | |
AMERISAFE, Inc. | | | 480,000 | | | | 20,899,200 | | |
Amtrust Financial Services, Inc. | | | 525,000 | | | | 19,845,000 | | |
Argo Group International Holdings Ltd. | | | 303,482 | | | | 13,395,695 | | |
The accompanying Notes to Financial Statements are an integral part of this statement.
Annual Report 2014
7
Columbia Small Cap Value Fund II
Portfolio of Investments (continued)
February 28, 2014
Common Stocks (continued)
Issuer | | Shares | | Value ($) | |
CNO Financial Group, Inc. | | | 950,000 | | | | 17,347,000 | | |
Hilltop Holdings, Inc.(a) | | | 700,000 | | | | 17,157,000 | | |
Symetra Financial Corp. | | | 890,000 | | | | 17,533,000 | | |
Total | | | | | 124,320,695 | | |
Real Estate Investment Trusts (REITs) 8.1% | |
Altisource Residential Corp. | | | 289,100 | | | | 8,262,478 | | |
American Assets Trust, Inc. | | | 565,000 | | | | 18,684,550 | | |
Brandywine Realty Trust | | | 771,845 | | | | 11,307,529 | | |
CubeSmart | | | 740,000 | | | | 12,957,400 | | |
First Industrial Realty Trust, Inc. | | | 1,020,000 | | | | 19,624,800 | | |
Geo Group, Inc. (The) | | | 230,000 | | | | 7,412,900 | | |
Highwoods Properties, Inc. | | | 325,000 | | | | 12,255,750 | | |
Kilroy Realty Corp. | | | 244,000 | | | | 14,034,880 | | |
LaSalle Hotel Properties | | | 375,000 | | | | 11,752,500 | | |
Pennsylvania Real Estate Investment
Trust | | | 485,000 | | | | 9,098,600 | | |
PennyMac Mortgage Investment Trust | | | 490,000 | | | | 11,916,800 | | |
QTS Realty Trust Inc., Class A | | | 472,483 | | | | 12,076,666 | | |
Total | | | | | 149,384,853 | | |
Thrifts & Mortgage Finance 2.5% | |
EverBank Financial Corp. | | | 700,000 | | | | 12,544,000 | | |
MGIC Investment Corp.(a) | | | 1,280,000 | | | | 11,468,800 | | |
Oritani Financial Corp. | | | 742,259 | | | | 11,623,776 | | |
Radian Group, Inc. | | | 650,000 | | | | 10,107,500 | | |
Total | | | | | 45,744,076 | | |
Total Financials | | | | | 591,901,760 | | |
Health Care 6.5% | |
Health Care Equipment & Supplies 1.7% | |
CONMED Corp. | | | 420,000 | | | | 19,580,400 | | |
Symmetry Medical, Inc.(a) | | | 1,150,000 | | | | 12,167,000 | | |
Total | | | | | 31,747,400 | | |
Health Care Providers & Services 4.1% | |
Healthways, Inc.(a) | | | 805,032 | | | | 12,043,279 | | |
Kindred Healthcare, Inc. | | | 950,000 | | | | 20,577,000 | | |
LHC Group, Inc.(a) | | | 410,000 | | | | 9,659,600 | | |
PharMerica Corp.(a) | | | 597,900 | | | | 14,409,390 | | |
VCA Antech, Inc.(a) | | | 600,000 | | | | 18,582,000 | | |
Total | | | | | 75,271,269 | | |
Common Stocks (continued)
Issuer | | Shares | | Value ($) | |
Health Care Technology 0.7% | |
MedAssets, Inc.(a) | | | 515,000 | | | | 12,509,350 | | |
Total Health Care | | | | | 119,528,019 | | |
Industrials 11.2% | |
Airlines 1.7% | |
Alaska Air Group, Inc. | | | 135,000 | | | | 11,696,400 | | |
American Airlines Group, Inc.(a) | | | 525,000 | | | | 19,388,250 | | |
Total | | | | | 31,084,650 | | |
Building Products 0.9% | |
USG Corp.(a) | | | 463,229 | | | | 16,365,880 | | |
Commercial Services & Supplies 2.3% | |
Deluxe Corp. | | | 390,000 | | | | 19,687,200 | | |
Steelcase, Inc., Class A | | | 475,000 | | | | 7,063,250 | | |
United Stationers, Inc. | | | 360,000 | | | | 15,346,800 | | |
Total | | | | | 42,097,250 | | |
Construction & Engineering 1.5% | |
EMCOR Group, Inc. | | | 215,000 | | | | 10,057,700 | | |
MasTec, Inc.(a) | | | 415,000 | | | | 16,990,100 | | |
Total | | | | | 27,047,800 | | |
Machinery 1.6% | |
Trinity Industries, Inc. | | | 215,000 | | | | 15,439,150 | | |
Wabash National Corp.(a) | | | 1,000,000 | | | | 13,510,000 | | |
Total | | | | | 28,949,150 | | |
Professional Services 1.0% | |
Navigant Consulting, Inc.(a) | | | 1,125,000 | | | | 19,608,750 | | |
Road & Rail 1.5% | |
Heartland Express, Inc. | | | 450,000 | | | | 9,171,000 | | |
Swift Transportation Co.(a) | | | 750,000 | | | | 18,270,000 | | |
Total | | | | | 27,441,000 | | |
Trading Companies & Distributors 0.7% | |
United Rentals, Inc.(a) | | | 155,000 | | | | 13,692,700 | | |
Total Industrials | | | | | 206,287,180 | | |
Information Technology 14.2% | |
Communications Equipment 2.0% | |
Aruba Networks, Inc.(a) | | | 496,000 | | | | 10,172,960 | | |
Calix, Inc.(a) | | | 800,000 | | | | 6,360,000 | | |
Ciena Corp.(a) | | | 420,000 | | | | 10,319,400 | | |
Finisar Corp.(a) | | | 385,000 | | | | 9,124,500 | | |
Total | | | | | 35,976,860 | | |
The accompanying Notes to Financial Statements are an integral part of this statement.
Annual Report 2014
8
Columbia Small Cap Value Fund II
Portfolio of Investments (continued)
February 28, 2014
Common Stocks (continued)
Issuer | | Shares | | Value ($) | |
Electronic Equipment, Instruments & Components 1.2% | |
Anixter International, Inc. | | | 105,000 | | | | 11,229,750 | | |
Rogers Corp.(a) | | | 175,000 | | | | 11,322,500 | | |
Total | | | | | 22,552,250 | | |
Internet Software & Services 1.7% | |
Endurance International Group
Holdings, Inc.(a) | | | 1,225,000 | | | | 18,485,250 | | |
Saba Software, Inc.(a) | | | 961,302 | | | | 12,174,890 | | |
Total | | | | | 30,660,140 | | |
IT Services 1.7% | |
Global Cash Access Holdings, Inc.(a) | | | 1,625,000 | | | | 13,650,000 | | |
Unisys Corp.(a) | | | 500,000 | | | | 17,110,000 | | |
Total | | | | | 30,760,000 | | |
Semiconductors & Semiconductor Equipment 5.2% | |
Fairchild Semiconductor
International, Inc.(a) | | | 695,000 | | | | 9,785,600 | | |
Integrated Device Technology, Inc.(a) | | | 1,175,000 | | | | 13,853,250 | | |
Integrated Silicon Solution(a) | | | 800,000 | | | | 9,744,000 | | |
IXYS Corp. | | | 1,025,000 | | | | 11,295,500 | | |
Kulicke & Soffa Industries, Inc.(a) | | | 1,200,000 | | | | 13,848,000 | | |
Micrel, Inc. | | | 917,732 | | | | 9,581,122 | | |
Rudolph Technologies, Inc.(a) | | | 775,000 | | | | 8,889,250 | | |
SunEdison, Inc.(a) | | | 1,050,000 | | | | 19,278,000 | | |
Total | | | | | 96,274,722 | | |
Software 2.4% | |
BroadSoft, Inc.(a) | | | 450,000 | | | | 13,504,500 | | |
Envivio, Inc.(a) | | | 925,000 | | | | 3,339,250 | | |
EPIQ Systems, Inc. | | | 844,621 | | | | 11,976,725 | | |
Mentor Graphics Corp. | | | 700,000 | | | | 15,148,000 | | |
Total | | | | | 43,968,475 | | |
Total Information Technology | | | | | 260,192,447 | | |
Materials 9.0% | |
Chemicals 1.6% | |
OM Group, Inc. | | | 375,000 | | | | 11,850,000 | | |
Taminco Corp.(a) | | | 727,447 | | | | 16,527,596 | | |
Total | | | | | 28,377,596 | | |
Metals & Mining 2.8% | |
AK Steel Holding Corp.(a) | | | 800,000 | | | | 4,968,000 | | |
Constellium NV(a) | | | 750,000 | | | | 20,842,500 | | |
Common Stocks (continued)
Issuer | | Shares | | Value ($) | |
Materion Corp. | | | 404,730 | | | | 11,975,961 | | |
Worthington Industries, Inc. | | | 335,000 | | | | 13,353,100 | | |
Total | | | | | 51,139,561 | | |
Paper & Forest Products 4.6% | |
Boise Cascade Co.(a) | | | 468,224 | | | | 13,854,748 | | |
Clearwater Paper Corp.(a) | | | 243,000 | | | | 15,515,550 | | |
KapStone Paper and Packaging Corp.(a) | | | 645,000 | | | | 20,504,550 | | |
Louisiana-Pacific Corp.(a) | | | 790,000 | | | | 14,844,100 | | |
Neenah Paper, Inc. | | | 400,000 | | | | 20,084,000 | | |
Total | | | | | 84,802,948 | | |
Total Materials | | | | | 164,320,105 | | |
Utilities 4.2% | |
Electric Utilities 0.9% | |
UIL Holdings Corp. | | | 419,000 | | | | 16,223,680 | | |
Gas Utilities 2.3% | |
New Jersey Resources Corp. | | | 325,000 | | | | 14,628,250 | | |
South Jersey Industries, Inc. | | | 240,000 | | | | 13,723,200 | | |
Southwest Gas Corp. | | | 240,000 | | | | 12,964,800 | | |
Total | | | | | 41,316,250 | | |
Multi-Utilities 1.0% | |
Avista Corp. | | | 650,000 | | | | 19,240,000 | | |
Total Utilities | | | | | 76,779,930 | | |
Total Common Stocks
(Cost: $1,162,438,356) | | | | | 1,741,217,459 | | |
Money Market Funds 4.6%
| | | Shares | | Value ($) | |
Columbia Short-Term Cash Fund,
0.098%(b)(c) | | | 83,929,960 | | | | 83,929,960 | | |
Total Money Market Funds
(Cost: $83,929,960) | | | | | 83,929,960 | | |
Total Investments
(Cost: $1,246,368,316) | | | | | 1,825,147,419 | | |
Other Assets & Liabilities, Net | | | | | 7,737,792 | | |
Net Assets | | | | | 1,832,885,211 | | |
The accompanying Notes to Financial Statements are an integral part of this statement.
Annual Report 2014
9
Columbia Small Cap Value Fund II
Portfolio of Investments (continued)
February 28, 2014
Notes to Portfolio of Investments
(a) Non-income producing.
(b) As defined in the Investment Company Act of 1940, an affiliated company is one in which the Fund owns 5% or more of its outstanding voting securities, or a company which is under common ownership or control with the Fund. Holdings and transactions in these affiliated companies during the year ended February 28, 2014, are as follows:
Issuer | | Beginning
Cost ($) | | Purchase
Cost ($) | | Proceeds
From Sales ($) | | Realized
Gain (Loss) ($) | | Ending
Cost ($) | | Dividends —
Affiliated
Issuers ($) | | Value ($) | |
Columbia Short-Term
Cash Fund | | | 26,045,945 | | | | 452,560,076 | | | | (394,676,061 | ) | | | — | | | | 83,929,960 | | | | 49,162 | | | | 83,929,960 | | |
Sterling Bancorp* | | | 16,066,311 | | | | 600,675 | | | | (4,315,028 | ) | | | 246,798 | | | | 12,598,756 | | | | 590,515 | | | | 20,263,125 | | |
TMS International Corp.,
Class A* | | | 11,136,125 | | | | — | | | | (15,010,229 | ) | | | 3,874,104 | | | | — | | | | 171,891 | | | | — | | |
Total | | | 53,248,381 | | | | 453,160,751 | | | | (414,001,318 | ) | | | 4,120,902 | | | | 96,528,716 | | | | 811,568 | | | | 104,193,085 | | |
*Issuer was not an affiliate for the entire period ended February 28, 2014.
(c) The rate shown is the seven-day current annualized yield at February 28, 2014.
Fair Value Measurements
Generally accepted accounting principles (GAAP) require disclosure regarding the inputs and valuation techniques used to measure fair value and any changes in valuation inputs or techniques. In addition, investments shall be disclosed by major category.
The Fund categorizes its fair value measurements according to a three-level hierarchy that maximizes the use of observable inputs and minimizes the use of unobservable inputs by prioritizing that the most observable input be used when available. Observable inputs are those that market participants would use in pricing an investment based on market data obtained from sources independent of the reporting entity. Unobservable inputs are those that reflect the Fund's assumptions about the information market participants would use in pricing an investment. An investment's level within the fair value hierarchy is based on the lowest level of any input that is deemed significant to the asset or liability's fair value measurement. The input levels are not necessarily an indication of the risk or liquidity associated with investments at that level. For example, certain U.S. government securities are generally high quality and liquid, however, they are reflected as Level 2 because the inputs used to determine fair value may not always be quoted prices in an active market.
Fair value inputs are summarized in the three broad levels listed below:
> Level 1 — Valuations based on quoted prices for investments in active markets that the Fund has the ability to access at the measurement date (including NAV for open-end mutual funds). Valuation adjustments are not applied to Level 1 investments.
> Level 2 — Valuations based on other significant observable inputs (including quoted prices for similar securities, interest rates, prepayment speeds, credit risks, etc.).
> Level 3 — Valuations based on significant unobservable inputs (including the Fund's own assumptions and judgment in determining the fair value of investments).
Inputs that are used in determining fair value of an investment may include price information, credit data, volatility statistics, and other factors. These inputs can be either observable or unobservable. The availability of observable inputs can vary between investments, and is affected by various factors such as the type of investment, and the volume and level of activity for that investment or similar investments in the marketplace. The inputs will be considered by the Investment Manager, along with any other relevant factors in the calculation of an investment's fair value. The Fund uses prices and inputs that are current as of the measurement date, which may include periods of market dislocations. During these periods, the availability of prices and inputs may be reduced for many investments. This condition could cause an investment to be reclassified between the various levels within the hierarchy.
Investments falling into the Level 3 category are primarily supported by quoted prices from brokers and dealers participating in the market for those investments. However, these may be classified as Level 3 investments due to lack of market transparency and corroboration to support these quoted prices. Additionally, valuation models may be used as the pricing source for any remaining investments classified as Level 3. These models may rely on one or more significant unobservable inputs and/or significant assumptions by the Investment Manager. Inputs used in valuations may include, but are not limited to, financial statement analysis, capital account balances, discount rates and estimated cash flows, and comparable company data.
The accompanying Notes to Financial Statements are an integral part of this statement.
Annual Report 2014
10
Columbia Small Cap Value Fund II
Portfolio of Investments (continued)
February 28, 2014
Fair Value Measurements (continued)
Under the direction of the Fund's Board of Trustees (the Board), the Investment Manager's Valuation Committee (the Committee) is responsible for overseeing the valuation procedures approved by the Board. The Committee consists of voting and non-voting members from various groups within the Investment Manager's organization, including operations and accounting, trading and investments, compliance, risk management and legal.
The Committee meets at least monthly to review and approve valuation matters, which may include a description of specific valuation determinations, data regarding pricing information received from approved pricing vendors and brokers and the results of Board-approved valuation control policies and procedures (the Policies). The Policies address, among other things, instances when market quotations are or are not readily available, including recommendations of third party pricing vendors and a determination of appropriate pricing methodologies; events that require specific valuation determinations and assessment of fair value techniques; securities with a potential for stale pricing, including those that are illiquid, restricted, or in default; and the effectiveness of third party pricing vendors, including periodic reviews of vendors. The Committee meets more frequently, as needed, to discuss additional valuation matters, which may include the need to review back-testing results, review time-sensitive information or approve related valuation actions. The Committee reports to the Board, with members of the Committee meeting with the Board at each of its regularly scheduled meetings to discuss valuation matters and actions during the period, similar to those described earlier.
For investments categorized as Level 3, the Committee monitors information similar to that described above, which may include: (i) data specific to the issuer or comparable issuers, (ii) general market or specific sector news and (iii) quoted prices and specific or similar security transactions. The Committee considers this data and any changes from prior periods in order to assess the reasonableness of observable and unobservable inputs, any assumptions or internal models used to value those securities and changes in fair value. This data is also used to corroborate, when available, information received from approved pricing vendors and brokers. Various factors impact the frequency of monitoring this information (which may occur as often as daily). However, the Committee may determine that changes to inputs, assumptions and models are not required as a result of the monitoring procedures performed.
The following table is a summary of the inputs used to value the Fund's investments at February 28, 2014:
| Description | | Level 1
Quoted Prices in
Active Markets for
Identical Assets ($) | | Level 2
Other Significant
Observable Inputs ($) | | Level 3
Significant
Unobservable Inputs ($) | | Total ($) | |
Equity Securities | |
Common Stocks | |
Consumer Discretionary | | | 193,464,107 | | | | — | | | | — | | | | 193,464,107 | | |
Consumer Staples | | | 12,528,000 | | | | — | | | | — | | | | 12,528,000 | | |
Energy | | | 116,215,911 | | | | — | | | | — | | | | 116,215,911 | | |
Financials | | | 591,901,760 | | | | — | | | | — | | | | 591,901,760 | | |
Health Care | | | 119,528,019 | | | | — | | | | — | | | | 119,528,019 | | |
Industrials | | | 206,287,180 | | | | — | | | | — | | | | 206,287,180 | | |
Information Technology | | | 260,192,447 | | | | — | | | | — | | | | 260,192,447 | | |
Materials | | | 164,320,105 | | | | — | | | | — | | | | 164,320,105 | | |
Utilities | | | 76,779,930 | | | | — | | | | — | | | | 76,779,930 | | |
Total Equity Securities | | | 1,741,217,459 | | | | — | | | | — | | | | 1,741,217,459 | | |
Mutual Funds | |
Money Market Funds | | | 83,929,960 | | | | — | | | | — | | | | 83,929,960 | | |
Total Mutual Funds | | | 83,929,960 | | | | — | | | | — | | | | 83,929,960 | | |
Total | | | 1,825,147,419 | | | | — | | | | — | | | | 1,825,147,419 | | |
See the Portfolio of Investments for all investment classifications not indicated in the table.
There were no transfers of financial assets between levels during the period.
The accompanying Notes to Financial Statements are an integral part of this statement.
Annual Report 2014
11
Columbia Small Cap Value Fund II
Statement of Assets and Liabilities
February 28, 2014
Assets | |
Investments, at value | |
Unaffiliated issuers (identified cost $1,149,839,600) | | $ | 1,720,954,334 | | |
Affiliated issuers (identified cost $96,528,716) | | | 104,193,085 | | |
Total investments (identified cost $1,246,368,316) | | | 1,825,147,419 | | |
Receivable for: | |
Investments sold | | | 13,747,291 | | |
Capital shares sold | | | 3,153,733 | | |
Dividends | | | 1,699,086 | | |
Prepaid expenses | | | 2,580 | | |
Total assets | | | 1,843,750,109 | | |
Liabilities | |
Payable for: | |
Investments purchased | | | 9,080,982 | | |
Capital shares purchased | | | 1,209,689 | | |
Investment management fees | | | 36,899 | | |
Distribution and/or service fees | | | 2,817 | | |
Transfer agent fees | | | 360,856 | | |
Administration fees | | | 3,710 | | |
Compensation of board members | | | 93,868 | | |
Other expenses | | | 76,077 | | |
Total liabilities | | | 10,864,898 | | |
Net assets applicable to outstanding capital stock | | $ | 1,832,885,211 | | |
Represented by | |
Paid-in capital | | $ | 1,199,100,141 | | |
Excess of distributions over net investment income | | | (187,836 | ) | |
Accumulated net realized gain | | | 55,193,803 | | |
Unrealized appreciation (depreciation) on: | |
Investments — unaffiliated issuers | | | 571,114,734 | | |
Investments — affiliated issuers | | | 7,664,369 | | |
Total — representing net assets applicable to outstanding capital stock | | $ | 1,832,885,211 | | |
The accompanying Notes to Financial Statements are an integral part of this statement.
Annual Report 2014
12
Columbia Small Cap Value Fund II
Statement of Assets and Liabilities (continued)
February 28, 2014
Class A | |
Net assets | | $ | 299,724,896 | | |
Shares outstanding | | | 16,103,989 | | |
Net asset value per share | | $ | 18.61 | | |
Maximum offering price per share(a) | | $ | 19.75 | | |
Class B | |
Net assets | | $ | 1,976,555 | | |
Shares outstanding | | | 113,518 | | |
Net asset value per share | | $ | 17.41 | | |
Class C | |
Net assets | | $ | 17,202,567 | | |
Shares outstanding | | | 988,783 | | |
Net asset value per share | | $ | 17.40 | | |
Class I | |
Net assets | | $ | 4,006 | | |
Shares outstanding | | | 213 | | |
Net asset value per share(b) | | $ | 18.78 | | |
Class R | |
Net assets | | $ | 17,581,661 | | |
Shares outstanding | | | 950,793 | | |
Net asset value per share | | $ | 18.49 | | |
Class R4 | |
Net assets | | $ | 14,479,000 | | |
Shares outstanding | | | 759,537 | | |
Net asset value per share | | $ | 19.06 | | |
Class R5 | |
Net assets | | $ | 15,639,664 | | |
Shares outstanding | | | 820,316 | | |
Net asset value per share | | $ | 19.07 | | |
Class Y | |
Net assets | | $ | 27,954,768 | | |
Shares outstanding | | | 1,463,958 | | |
Net asset value per share | | $ | 19.10 | | |
Class Z | |
Net assets | | $ | 1,438,322,094 | | |
Shares outstanding | | | 76,612,915 | | |
Net asset value per share | | $ | 18.77 | | |
(a) The maximum offering price per share is calculated by dividing the net asset value per share by 1.0 minus the maximum sales charge of 5.75%.
(b) Net asset value per share rounds to this amount due to fractional shares outstanding.
The accompanying Notes to Financial Statements are an integral part of this statement.
Annual Report 2014
13
Columbia Small Cap Value Fund II
Statement of Operations
Year Ended February 28, 2014
Net investment income | |
Income: | |
Dividends — unaffiliated issuers | | $ | 23,216,153 | | |
Dividends — affiliated issuers | | | 811,568 | | |
Total income | | | 24,027,721 | | |
Expenses: | |
Investment management fees | | | 12,247,710 | | |
Distribution and/or service fees | |
Class A | | | 698,787 | | |
Class B | | | 20,298 | | |
Class C | | | 166,356 | | |
Class R | | | 84,119 | | |
Transfer agent fees | |
Class A | | | 550,196 | | |
Class B | | | 3,993 | | |
Class C | | | 32,734 | | |
Class R | | | 33,124 | | |
Class R4 | | | 6,028 | | |
Class R5 | | | 3,231 | | |
Class Z | | | 2,543,174 | | |
Administration fees | | | 1,232,271 | | |
Compensation of board members | | | 50,273 | | |
Custodian fees | | | 13,795 | | |
Printing and postage fees | | | 129,794 | | |
Registration fees | | | 63,567 | | |
Professional fees | | | 46,271 | | |
Other | | | 89,012 | | |
Total expenses | | | 18,014,733 | | |
Expense reductions | | | (120 | ) | |
Total net expenses | | | 18,014,613 | | |
Net investment income | | | 6,013,108 | | |
Realized and unrealized gain (loss) — net | |
Net realized gain (loss) on: | |
Investments — unaffiliated issuers | | | 195,440,787 | | |
Investments — affiliated issuers | | | 4,120,902 | | |
Net realized gain | | | 199,561,689 | | |
Net change in unrealized appreciation (depreciation) on: | |
Investments — unaffiliated issuers | | | 220,073,564 | | |
Investments — affiliated issuers | | | 6,915,818 | | |
Net change in unrealized appreciation (depreciation) | | | 226,989,382 | | |
Net realized and unrealized gain | | | 426,551,071 | | |
Net increase in net assets resulting from operations | | $ | 432,564,179 | | |
The accompanying Notes to Financial Statements are an integral part of this statement.
Annual Report 2014
14
Columbia Small Cap Value Fund II
Statement of Changes in Net Assets
| | | Year Ended
February 28,
2014 | | Year Ended
February 28,
2013(a) | |
Operations | |
Net investment income | | $ | 6,013,108 | | | $ | 14,136,091 | | |
Net realized gain | | | 199,561,689 | | | | 196,445,124 | | |
Net change in unrealized appreciation (depreciation) | | | 226,989,382 | | | | (7,305,584 | ) | |
Net increase in net assets resulting from operations | | | 432,564,179 | | | | 203,275,631 | | |
Distributions to shareholders | |
Net investment income | |
Class A | | | (772,853 | ) | | | (2,349,976 | ) | |
Class B | | | — | | | | (3,255 | ) | |
Class C | | | — | | | | (26,606 | ) | |
Class I | | | (137,910 | ) | | | (274,717 | ) | |
Class R | | | (7,309 | ) | | | (89,079 | ) | |
Class R4 | | | (19,625 | ) | | | (25 | ) | |
Class R5 | | | (63,189 | ) | | | (26 | ) | |
Class Y | | | (159,364 | ) | | | (27 | ) | |
Class Z | | | (6,696,389 | ) | | | (10,764,552 | ) | |
Net realized gains | |
Class A | | | (30,871,667 | ) | | | (6,552,473 | ) | |
Class B | | | (230,154 | ) | | | (43,346 | ) | |
Class C | | | (1,931,099 | ) | | | (354,355 | ) | |
Class I | | | (2,250,183 | ) | | | (492,523 | ) | |
Class R | | | (1,886,129 | ) | | | (339,078 | ) | |
Class R4 | | | (397,295 | ) | | | (56 | ) | |
Class R5 | | | (951,945 | ) | | | (56 | ) | |
Class Y | | | (2,319,283 | ) | | | (56 | ) | |
Class Z | | | (143,847,332 | ) | | | (22,798,039 | ) | |
Total distributions to shareholders | | | (192,541,726 | ) | | | (44,088,245 | ) | |
Increase (decrease) in net assets from capital stock activity | | | 138,145,001 | | | | (514,033,494 | ) | |
Total increase (decrease) in net assets | | | 378,167,454 | | | | (354,846,108 | ) | |
Net assets at beginning of year | | | 1,454,717,757 | | | | 1,809,563,865 | | |
Net assets at end of year | | $ | 1,832,885,211 | | | $ | 1,454,717,757 | | |
Undistributed (excess of distributions over) net investment income | | $ | (187,836 | ) | | $ | 927,915 | | |
(a) Class R4, Class R5 and Class Y shares are for the period from November 8, 2012 (commencement of operations) to February 28, 2013.
The accompanying Notes to Financial Statements are an integral part of this statement.
Annual Report 2014
15
Columbia Small Cap Value Fund II
Statement of Changes in Net Assets (continued)
| | | Year Ended February 28, 2014 | | Year Ended February 28, 2013(a) | |
| | | Shares | | Dollars ($) | | Shares | | Dollars ($) | |
Capital stock activity | |
Class A shares | |
Subscriptions(b) | | | 3,350,865 | | | | 59,374,596 | | | | 3,741,070 | | | | 54,524,154 | | |
Distributions reinvested | | | 1,669,672 | | | | 29,134,466 | | | | 583,298 | | | | 8,323,395 | | |
Redemptions | | | (4,912,107 | ) | | | (86,857,688 | ) | | | (24,756,419 | ) | | | (363,919,210 | ) | |
Net increase (decrease) | | | 108,430 | | | | 1,651,374 | | | | (20,432,051 | ) | | | (301,071,661 | ) | |
Class B shares | |
Subscriptions | | | 1,987 | | | | 33,053 | | | | 364 | | | | 4,913 | | |
Distributions reinvested | | | 12,425 | | | | 203,173 | | | | 2,994 | | | | 40,513 | | |
Redemptions(b) | | | (32,999 | ) | | | (554,894 | ) | | | (41,852 | ) | | | (574,462 | ) | |
Net decrease | | | (18,587 | ) | | | (318,668 | ) | | | (38,494 | ) | | | (529,036 | ) | |
Class C shares | |
Subscriptions | | | 40,256 | | | | 665,156 | | | | 20,218 | | | | 278,710 | | |
Distributions reinvested | | | 93,176 | | | | 1,524,897 | | | | 21,899 | | | | 296,075 | | |
Redemptions | | | (209,464 | ) | | | (3,463,672 | ) | | | (306,004 | ) | | | (4,227,095 | ) | |
Net decrease | | | (76,032 | ) | | | (1,273,619 | ) | | | (263,887 | ) | | | (3,652,310 | ) | |
Class I shares | |
Subscriptions | | | 714 | | | | 12,900 | | | | 838,970 | | | | 12,463,105 | | |
Distributions reinvested | | | 136,300 | | | | 2,387,632 | | | | 53,408 | | | | 767,133 | | |
Redemptions | | | (1,598,905 | ) | | | (28,593,218 | ) | | | (259,202 | ) | | | (3,924,399 | ) | |
Net increase (decrease) | | | (1,461,891 | ) | | | (26,192,686 | ) | | | 633,176 | | | | 9,305,839 | | |
Class R shares | |
Subscriptions | | | 420,127 | | | | 7,314,617 | | | | 306,892 | | | | 4,422,283 | | |
Distributions reinvested | | | 105,963 | | | | 1,840,003 | | | | 28,949 | | | | 411,082 | | |
Redemptions | | | (540,183 | ) | | | (9,451,987 | ) | | | (769,184 | ) | | | (11,143,741 | ) | |
Net decrease | | | (14,093 | ) | | | (297,367 | ) | | | (433,343 | ) | | | (6,310,376 | ) | |
Class R4 shares | |
Subscriptions | | | 793,382 | | | | 14,656,637 | | | | 173 | | | | 2,500 | | |
Distributions reinvested | | | 22,982 | | | | 416,552 | | | | — | | | | — | | |
Redemptions | | | (57,000 | ) | | | (1,052,317 | ) | | | — | | | | — | | |
Net increase | | | 759,364 | | | | 14,020,872 | | | | 173 | | | | 2,500 | | |
Class R5 shares | |
Subscriptions | | | 910,789 | | | | 16,791,439 | | | | 173 | | | | 2,500 | | |
Distributions reinvested | | | 55,719 | | | | 1,014,761 | | | | — | | | | — | | |
Redemptions | | | (146,365 | ) | | | (2,719,235 | ) | | | — | | | | — | | |
Net increase | | | 820,143 | | | | 15,086,965 | | | | 173 | | | | 2,500 | | |
The accompanying Notes to Financial Statements are an integral part of this statement.
Annual Report 2014
16
Columbia Small Cap Value Fund II
Statement of Changes in Net Assets (continued)
| | | Year Ended February 28, 2014 | | Year Ended February 28, 2013(a) | |
| | | Shares | | Dollars ($) | | Shares | | Dollars ($) | |
Capital stock activity (continued) | |
Class Y shares | |
Subscriptions | | | 1,469,600 | | | | 26,399,166 | | | | 173 | | | | 2,500 | | |
Distributions reinvested | | | 136,883 | | | | 2,478,272 | | | | — | | | | — | | |
Redemptions | | | (142,698 | ) | | | (2,621,939 | ) | | | — | | | | — | | |
Net increase | | | 1,463,785 | | | | 26,255,499 | | | | 173 | | | | 2,500 | | |
Class Z shares | |
Subscriptions | | | 20,042,772 | | | | 357,941,722 | | | | 16,561,724 | | | | 243,481,776 | | |
Distributions reinvested | | | 6,936,755 | | | | 122,130,226 | | | | 1,806,437 | | | | 25,950,757 | | |
Redemptions | | | (20,784,037 | ) | | | (370,859,317 | ) | | | (32,609,372 | ) | | | (481,215,983 | ) | |
Net increase (decrease) | | | 6,195,490 | | | | 109,212,631 | | | | (14,241,211 | ) | | | (211,783,450 | ) | |
Total net increase (decrease) | | | 7,776,609 | | | | 138,145,001 | | | | (34,775,291 | ) | | | (514,033,494 | ) | |
(a) Class R4, Class R5 and Class Y shares are for the period from November 8, 2012 (commencement of operations) to February 28, 2013.
(b) Includes conversions of Class B shares to Class A shares, if any.
The accompanying Notes to Financial Statements are an integral part of this statement.
Annual Report 2014
17
Columbia Small Cap Value Fund II
The following tables are intended to help you understand the Fund's financial performance. Certain information reflects financial results for a single share of a class held for the periods shown. Per share net investment income (loss) amounts are calculated based on average shares outstanding during the period. Total return assumes reinvestment of all dividends and distributions, if any. Total return does not reflect payment of sales charges, if any, and is not annualized for periods of less than one year.
| | | | | Year Ended | | | |
| | | Year Ended February 28, | | February 29, | | Year Ended February 28, | |
Class A | | 2014 | | 2013 | | 2012 | | 2011 | | 2010 | |
Per share data | |
Net asset value, beginning of period | | $ | 16.07 | | | $ | 14.44 | | | $ | 14.77 | | | $ | 11.05 | | | $ | 6.74 | | |
Income from investment operations: | |
Net investment income | | | 0.03 | | | | 0.11 | | | | 0.02 | | | | 0.00 | (a) | | | 0.04 | | |
Net realized and unrealized gain (loss) | | | 4.59 | | | | 1.96 | | | | (0.33 | ) | | | 3.74 | | | | 4.32 | | |
Total from investment operations | | | 4.62 | | | | 2.07 | | | | (0.31 | ) | | | 3.74 | | | | 4.36 | | |
Less distributions to shareholders: | |
Net investment income | | | (0.05 | ) | | | (0.12 | ) | | | (0.02 | ) | | | (0.02 | ) | | | (0.04 | ) | |
Net realized gains | | | (2.03 | ) | | | (0.32 | ) | | | — | | | | — | | | | — | | |
Tax return of capital | | | — | | | | — | | | | — | | | | — | | | | (0.01 | ) | |
Total distributions to shareholders | | | (2.08 | ) | | | (0.44 | ) | | | (0.02 | ) | | | (0.02 | ) | | | (0.05 | ) | |
Net asset value, end of period | | $ | 18.61 | | | $ | 16.07 | | | $ | 14.44 | | | $ | 14.77 | | | $ | 11.05 | | |
Total return | | | 29.93 | % | | | 14.70 | % | | | (2.08 | %) | | | 33.89 | % | | | 64.73 | % | |
Ratios to average net assets(b) | |
Total gross expenses | | | 1.29 | % | | | 1.33 | % | | | 1.37 | % | | | 1.36 | % | | | 1.32 | % | |
Total net expenses(c) | | | 1.29 | %(d) | | | 1.31 | %(d) | | | 1.31 | %(d) | | | 1.35 | %(d) | | | 1.32 | %(d) | |
Net investment income (loss) | | | 0.17 | % | | | 0.76 | % | | | 0.15 | % | | | (0.01 | %) | | | 0.44 | % | |
Supplemental data | |
Net assets, end of period (in thousands) | | $ | 299,725 | | | $ | 257,083 | | | $ | 525,941 | | | $ | 565,730 | | | $ | 414,901 | | |
Portfolio turnover | | | 36 | % | | | 42 | % | | | 41 | % | | | 60 | % | | | 70 | % | |
Notes to Financial Highlights
(a) Rounds to zero.
(b) In addition to the fees and expenses which the Fund bears directly, the Fund indirectly bears a pro rata share of the fees and expenses of the acquired funds in which it invests. Such indirect expenses are not included in the reported expense ratios.
(c) Total net expenses include the impact of certain waivers/reimbursements made by the Investment Manager and certain of its affiliates, if applicable.
(d) The benefits derived from expense reductions had an impact of less than 0.01%.
The accompanying Notes to Financial Statements are an integral part of this statement.
Annual Report 2014
18
Columbia Small Cap Value Fund II
Financial Highlights (continued)
| | | | | Year Ended | | | |
| | | Year Ended February 28, | | February 29, | | Year Ended February 28, | |
Class B | | 2014 | | 2013 | | 2012 | | 2011 | | 2010 | |
Per share data | |
Net asset value, beginning of period | | $ | 15.22 | | | $ | 13.70 | | | $ | 14.10 | | | $ | 10.61 | | | $ | 6.49 | | |
Income from investment operations: | |
Net investment income (loss) | | | (0.10 | ) | | | 0.00 | (a) | | | (0.08 | ) | | | (0.09 | ) | | | (0.03 | ) | |
Net realized and unrealized gain (loss) | | | 4.32 | | | | 1.87 | | | | (0.32 | ) | | | 3.58 | | | | 4.15 | | |
Total from investment operations | | | 4.22 | | | | 1.87 | | | | (0.40 | ) | | | 3.49 | | | | 4.12 | | |
Less distributions to shareholders: | |
Net investment income | | | — | | | | (0.03 | ) | | | — | | | | — | | | | — | | |
Net realized gains | | | (2.03 | ) | | | (0.32 | ) | | | — | | | | — | | | | — | | |
Total distributions to shareholders | | | (2.03 | ) | | | (0.35 | ) | | | — | | | | — | | | | — | | |
Net asset value, end of period | | $ | 17.41 | | | $ | 15.22 | | | $ | 13.70 | | | $ | 14.10 | | | $ | 10.61 | | |
Total return | | | 28.91 | % | | | 13.94 | % | | | (2.84 | %) | | | 32.89 | % | | | 63.48 | % | |
Ratios to average net assets(b) | |
Total gross expenses | | | 2.04 | % | | | 2.08 | % | | | 2.10 | % | | | 2.11 | % | | | 2.07 | % | |
Total net expenses(c) | | | 2.04 | %(d) | | | 2.06 | %(d) | | | 2.05 | %(d) | | | 2.10 | %(d) | | | 2.07 | %(d) | |
Net investment income (loss) | | | (0.57 | %) | | | 0.01 | % | | | (0.62 | %) | | | (0.77 | %) | | | (0.29 | %) | |
Supplemental data | |
Net assets, end of period (in thousands) | | $ | 1,977 | | | $ | 2,010 | | | $ | 2,337 | | | $ | 3,093 | | | $ | 3,031 | | |
Portfolio turnover | | | 36 | % | | | 42 | % | | | 41 | % | | | 60 | % | | | 70 | % | |
Notes to Financial Highlights
(a) Rounds to zero.
(b) In addition to the fees and expenses which the Fund bears directly, the Fund indirectly bears a pro rata share of the fees and expenses of the acquired funds in which it invests. Such indirect expenses are not included in the reported expense ratios.
(c) Total net expenses include the impact of certain waivers/reimbursements made by the Investment Manager and certain of its affiliates, if applicable.
(d) The benefits derived from expense reductions had an impact of less than 0.01%.
The accompanying Notes to Financial Statements are an integral part of this statement.
Annual Report 2014
19
Columbia Small Cap Value Fund II
Financial Highlights (continued)
| | | | | Year Ended | | | |
| | | Year Ended February 28, | | February 29, | | Year Ended February 28, | |
Class C | | 2014 | | 2013 | | 2012 | | 2011 | | 2010 | |
Per share data | |
Net asset value, beginning of period | | $ | 15.20 | | | $ | 13.69 | | | $ | 14.09 | | | $ | 10.60 | | | $ | 6.49 | | |
Income from investment operations: | |
Net investment income (loss) | | | (0.10 | ) | | | (0.00 | )(a) | | | (0.08 | ) | | | (0.09 | ) | | | (0.02 | ) | |
Net realized and unrealized gain (loss) | | | 4.33 | | | | 1.86 | | | | (0.32 | ) | | | 3.58 | | | | 4.13 | | |
Total from investment operations | | | 4.23 | | | | 1.86 | | | | (0.40 | ) | | | 3.49 | | | | 4.11 | | |
Less distributions to shareholders: | |
Net investment income | | | — | | | | (0.03 | ) | | | — | | | | — | | | | — | | |
Net realized gains | | | (2.03 | ) | | | (0.32 | ) | | | — | | | | — | | | | — | | |
Total distributions to shareholders | | | (2.03 | ) | | | (0.35 | ) | | | — | | | | — | | | | — | | |
Net asset value, end of period | | $ | 17.40 | | | $ | 15.20 | | | $ | 13.69 | | | $ | 14.09 | | | $ | 10.60 | | |
Total return | | | 29.02 | % | | | 13.87 | % | | | (2.84 | %) | | | 32.92 | % | | | 63.33 | % | |
Ratios to average net assets(b) | |
Total gross expenses | | | 2.04 | % | | | 2.08 | % | | | 2.10 | % | | | 2.11 | % | | | 2.07 | % | |
Total net expenses(c) | | | 2.04 | %(d) | | | 2.06 | %(d) | | | 2.06 | %(d) | | | 2.10 | %(d) | | | 2.07 | %(d) | |
Net investment income (loss) | | | (0.58 | %) | | | (0.00 | %)(a) | | | (0.62 | %) | | | (0.77 | %) | | | (0.27 | %) | |
Supplemental data | |
Net assets, end of period (in thousands) | | $ | 17,203 | | | $ | 16,190 | | | $ | 18,191 | | | $ | 23,321 | | | $ | 23,588 | | |
Portfolio turnover | | | 36 | % | | | 42 | % | | | 41 | % | | | 60 | % | | | 70 | % | |
Notes to Financial Highlights
(a) Rounds to zero.
(b) In addition to the fees and expenses which the Fund bears directly, the Fund indirectly bears a pro rata share of the fees and expenses of the acquired funds in which it invests. Such indirect expenses are not included in the reported expense ratios.
(c) Total net expenses include the impact of certain waivers/reimbursements made by the Investment Manager and certain of its affiliates, if applicable.
(d) The benefits derived from expense reductions had an impact of less than 0.01%.
The accompanying Notes to Financial Statements are an integral part of this statement.
Annual Report 2014
20
Columbia Small Cap Value Fund II
Financial Highlights (continued)
| | | | | Year Ended | | Year Ended | �� |
| | | Year Ended February 28, | | February 29, | | February 28, | |
Class I | | 2014 | | 2013 | | 2012 | | 2011(a) | |
Per share data | |
Net asset value, beginning of period | | $ | 16.20 | | | $ | 14.54 | | | $ | 14.87 | | | $ | 11.72 | | |
Income from investment operations: | |
Net investment income (loss) | | | 0.11 | | | | 0.17 | | | | 0.07 | | | | (0.01 | ) | |
Net realized and unrealized gain (loss) | | | 4.63 | | | | 1.99 | | | | (0.32 | ) | | | 3.23 | | |
Total from investment operations | | | 4.74 | | | | 2.16 | | | | (0.25 | ) | | | 3.22 | | |
Less distributions to shareholders: | |
Net investment income | | | (0.13 | ) | | | (0.18 | ) | | | (0.08 | ) | | | (0.07 | ) | |
Net realized gains | | | (2.03 | ) | | | (0.32 | ) | | | — | | | | — | | |
Total distributions to shareholders | | | (2.16 | ) | | | (0.50 | ) | | | (0.08 | ) | | | (0.07 | ) | |
Net asset value, end of period | | $ | 18.78 | | | $ | 16.20 | | | $ | 14.54 | | | $ | 14.87 | | |
Total return | | | 30.48 | % | | | 15.31 | % | | | (1.64 | %) | | | 27.55 | % | |
Ratios to average net assets(b) | |
Total gross expenses | | | 0.84 | % | | | 0.86 | % | | | 0.87 | % | | | 0.92 | %(c) | |
Total net expenses(d) | | | 0.84 | % | | | 0.86 | % | | | 0.87 | % | | | 0.92 | %(c)(e) | |
Net investment income (loss) | | | 0.60 | % | | | 1.18 | % | | | 0.52 | % | | | (0.12 | %)(c) | |
Supplemental data | |
Net assets, end of period (in thousands) | | $ | 4 | | | $ | 23,685 | | | $ | 12,055 | | | $ | 29,390 | | |
Portfolio turnover | | | 36 | % | | | 42 | % | | | 41 | % | | | 60 | % | |
Notes to Financial Highlights
(a) For the period from September 27, 2010 (commencement of operations) to February 28, 2011.
(b) In addition to the fees and expenses which the Fund bears directly, the Fund indirectly bears a pro rata share of the fees and expenses of the acquired funds in which it invests. Such indirect expenses are not included in the reported expense ratios.
(c) Annualized.
(d) Total net expenses include the impact of certain waivers/reimbursements made by the Investment Manager and certain of its affiliates, if applicable.
(e) The benefits derived from expense reductions had an impact of less than 0.01%.
The accompanying Notes to Financial Statements are an integral part of this statement.
Annual Report 2014
21
Columbia Small Cap Value Fund II
Financial Highlights (continued)
| | | | | Year Ended | | | |
| | | Year Ended February 28, | | February 29, | | Year Ended February 28, | |
Class R | | 2014 | | 2013 | | 2012 | | 2011 | | 2010 | |
Per share data | |
Net asset value, beginning of period | | $ | 15.98 | | | $ | 14.36 | | | $ | 14.71 | | | $ | 11.01 | | | $ | 6.72 | | |
Income from investment operations: | |
Net investment income (loss) | | | (0.01 | ) | | | 0.07 | | | | (0.02 | ) | | | (0.03 | ) | | | 0.02 | | |
Net realized and unrealized gain (loss) | | | 4.56 | | | | 1.96 | | | | (0.33 | ) | | | 3.73 | | | | 4.30 | | |
Total from investment operations | | | 4.55 | | | | 2.03 | | | | (0.35 | ) | | | 3.70 | | | | 4.32 | | |
Less distributions to shareholders: | |
Net investment income | | | (0.01 | ) | | | (0.09 | ) | | | — | | | | — | | | | (0.03 | ) | |
Net realized gains | | | (2.03 | ) | | | (0.32 | ) | | | — | | | | — | | | | — | | |
Tax return of capital | | | — | | | | — | | | | — | | | | — | | | | (0.00 | )(a) | |
Total distributions to shareholders | | | (2.04 | ) | | | (0.41 | ) | | | — | | | | — | | | | (0.03 | ) | |
Net asset value, end of period | | $ | 18.49 | | | $ | 15.98 | | | $ | 14.36 | | | $ | 14.71 | | | $ | 11.01 | | |
Total return | | | 29.61 | % | | | 14.47 | % | | | (2.38 | %) | | | 33.61 | % | | | 64.32 | % | |
Ratios to average net assets(b) | |
Total gross expenses | | | 1.54 | % | | | 1.58 | % | | | 1.60 | % | | | 1.61 | % | | | 1.57 | % | |
Total net expenses(c) | | | 1.54 | %(d) | | | 1.56 | %(d) | | | 1.56 | %(d) | | | 1.60 | %(d) | | | 1.57 | %(d) | |
Net investment income (loss) | | | (0.08 | %) | | | 0.50 | % | | | (0.12 | %) | | | (0.26 | %) | | | 0.20 | % | |
Supplemental data | |
Net assets, end of period (in thousands) | | $ | 17,582 | | | $ | 15,421 | | | $ | 20,081 | | | $ | 27,450 | | | $ | 22,755 | | |
Portfolio turnover | | | 36 | % | | | 42 | % | | | 41 | % | | | 60 | % | | | 70 | % | |
Notes to Financial Highlights
(a) Rounds to zero.
(b) In addition to the fees and expenses which the Fund bears directly, the Fund indirectly bears a pro rata share of the fees and expenses of the acquired funds in which it invests. Such indirect expenses are not included in the reported expense ratios.
(c) Total net expenses include the impact of certain waivers/reimbursements made by the Investment Manager and certain of its affiliates, if applicable.
(d) The benefits derived from expense reductions had an impact of less than 0.01%.
The accompanying Notes to Financial Statements are an integral part of this statement.
Annual Report 2014
22
Columbia Small Cap Value Fund II
Financial Highlights (continued)
| | | Year Ended February 28, | |
Class R4 | | 2014 | | 2013(a) | |
Per share data | |
Net asset value, beginning of period | | $ | 16.42 | | | $ | 14.41 | | |
Income from investment operations: | |
Net investment income | | | 0.07 | | | | 0.08 | | |
Net realized and unrealized gain | | | 4.69 | | | | 2.40 | | |
Total from investment operations | | | 4.76 | | | | 2.48 | | |
Less distributions to shareholders: | |
Net investment income | | | (0.09 | ) | | | (0.15 | ) | |
Net realized gains | | | (2.03 | ) | | | (0.32 | ) | |
Total distributions to shareholders | | | (2.12 | ) | | | (0.47 | ) | |
Net asset value, end of period | | $ | 19.06 | | | $ | 16.42 | | |
Total return | | | 30.18 | % | | | 17.60 | % | |
Ratios to average net assets(b) | |
Total gross expenses | | | 1.05 | % | | | 1.11 | %(c) | |
Total net expenses(d) | | | 1.05 | %(e) | | | 1.06 | %(c) | |
Net investment income | | | 0.38 | % | | | 1.73 | %(c) | |
Supplemental data | |
Net assets, end of period (in thousands) | | $ | 14,479 | | | $ | 3 | | |
Portfolio turnover | | | 36 | % | | | 42 | % | |
Notes to Financial Highlights
(a) For the period from November 8, 2012 (commencement of operations) to February 28, 2013.
(b) In addition to the fees and expenses which the Fund bears directly, the Fund indirectly bears a pro rata share of the fees and expenses of the acquired funds in which it invests. Such indirect expenses are not included in the reported expense ratios.
(c) Annualized.
(d) Total net expenses include the impact of certain waivers/reimbursements made by the Investment Manager and certain of its affiliates, if applicable.
(e) The benefits derived from expense reductions had an impact of less than 0.01%.
The accompanying Notes to Financial Statements are an integral part of this statement.
Annual Report 2014
23
Columbia Small Cap Value Fund II
Financial Highlights (continued)
| | | Year Ended February 28, | |
Class R5 | | 2014 | | 2013(a) | |
Per share data | |
Net asset value, beginning of period | | $ | 16.42 | | | $ | 14.41 | | |
Income from investment operations: | |
Net investment income | | | 0.09 | | | | 0.09 | | |
Net realized and unrealized gain | | | 4.71 | | | | 2.39 | | |
Total from investment operations | | | 4.80 | | | | 2.48 | | |
Less distributions to shareholders: | |
Net investment income | | | (0.12 | ) | | | (0.15 | ) | |
Net realized gains | | | (2.03 | ) | | | (0.32 | ) | |
Total distributions to shareholders | | | (2.15 | ) | | | (0.47 | ) | |
Net asset value, end of period | | $ | 19.07 | | | $ | 16.42 | | |
Total return | | | 30.43 | % | | | 17.63 | % | |
Ratios to average net assets(b) | |
Total gross expenses | | | 0.89 | % | | | 0.92 | %(c) | |
Total net expenses(d) | | | 0.89 | % | | | 0.92 | %(c) | |
Net investment income | | | 0.51 | % | | | 1.87 | %(c) | |
Supplemental data | |
Net assets, end of period (in thousands) | | $ | 15,640 | | | $ | 3 | | |
Portfolio turnover | | | 36 | % | | | 42 | % | |
Notes to Financial Highlights
(a) For the period from November 8, 2012 (commencement of operations) to February 28, 2013.
(b) In addition to the fees and expenses which the Fund bears directly, the Fund indirectly bears a pro rata share of the fees and expenses of the acquired funds in which it invests. Such indirect expenses are not included in the reported expense ratios.
(c) Annualized.
(d) Total net expenses include the impact of certain waivers/reimbursements made by the Investment Manager and certain of its affiliates, if applicable.
The accompanying Notes to Financial Statements are an integral part of this statement.
Annual Report 2014
24
Columbia Small Cap Value Fund II
Financial Highlights (continued)
| | | Year Ended February 28, | |
Class Y | | 2014 | | 2013(a) | |
Per share data | |
Net asset value, beginning of period | | $ | 16.44 | | | $ | 14.43 | | |
Income from investment operations: | |
Net investment income | | | 0.10 | | | | 0.09 | | |
Net realized and unrealized gain | | | 4.72 | | | | 2.40 | | |
Total from investment operations | | | 4.82 | | | | 2.49 | | |
Less distributions to shareholders: | |
Net investment income | | | (0.13 | ) | | | (0.16 | ) | |
Net realized gains | | | (2.03 | ) | | | (0.32 | ) | |
Total distributions to shareholders | | | (2.16 | ) | | | (0.48 | ) | |
Net asset value, end of period | | $ | 19.10 | | | $ | 16.44 | | |
Total return | | | 30.52 | % | | | 17.66 | % | |
Ratios to average net assets(b) | |
Total gross expenses | | | 0.84 | % | | | 0.87 | %(c) | |
Total net expenses(d) | | | 0.84 | % | | | 0.87 | %(c) | |
Net investment income | | | 0.53 | % | | | 1.92 | %(c) | |
Supplemental data | |
Net assets, end of period (in thousands) | | $ | 27,955 | | | $ | 3 | | |
Portfolio turnover | | | 36 | % | | | 42 | % | |
Notes to Financial Highlights
(a) For the period from November 8, 2012 (commencement of operations) to February 28, 2013.
(b) In addition to the fees and expenses which the Fund bears directly, the Fund indirectly bears a pro rata share of the fees and expenses of the acquired funds in which it invests. Such indirect expenses are not included in the reported expense ratios.
(c) Annualized.
(d) Total net expenses include the impact of certain waivers/reimbursements made by the Investment Manager and certain of its affiliates, if applicable.
The accompanying Notes to Financial Statements are an integral part of this statement.
Annual Report 2014
25
Columbia Small Cap Value Fund II
Financial Highlights (continued)
| | | | | Year Ended | | | |
| | | Year Ended February 28, | | February 29, | | Year Ended February 28, | |
Class Z | | 2014 | | 2013 | | 2012 | | 2011 | | 2010 | |
Per share data | |
Net asset value, beginning of period | | $ | 16.19 | | | $ | 14.54 | | | $ | 14.87 | | | $ | 11.11 | | | $ | 6.78 | | |
Income from investment operations: | |
Net investment income | | | 0.07 | | | | 0.15 | | | | 0.05 | | | | 0.03 | | | | 0.07 | | |
Net realized and unrealized gain (loss) | | | 4.64 | | | | 1.97 | | | | (0.33 | ) | | | 3.78 | | | | 4.33 | | |
Total from investment operations | | | 4.71 | | | | 2.12 | | | | (0.28 | ) | | | 3.81 | | | | 4.40 | | |
Less distributions to shareholders: | |
Net investment income | | | (0.10 | ) | | | (0.15 | ) | | | (0.05 | ) | | | (0.05 | ) | | | (0.06 | ) | |
Net realized gains | | | (2.03 | ) | | | (0.32 | ) | | | — | | | | — | | | | — | | |
Tax return of capital | | | — | | | | — | | | | — | | | | — | | | | (0.01 | ) | |
Total distributions to shareholders | | | (2.13 | ) | | | (0.47 | ) | | | (0.05 | ) | | | (0.05 | ) | | | (0.07 | ) | |
Net asset value, end of period | | $ | 18.77 | | | $ | 16.19 | | | $ | 14.54 | | | $ | 14.87 | | | $ | 11.11 | | |
Total return | | | 30.26 | % | | | 15.02 | % | | | (1.84 | %) | | | 34.31 | % | | | 64.94 | % | |
Ratios to average net assets(a) | |
Total gross expenses | | | 1.04 | % | | | 1.08 | % | | | 1.11 | % | | | 1.11 | % | | | 1.07 | % | |
Total net expenses(b) | | | 1.04 | %(c) | | | 1.06 | %(c) | | | 1.06 | %(c) | | | 1.10 | %(c) | | | 1.07 | %(c) | |
Net investment income | | | 0.42 | % | | | 1.01 | % | | | 0.40 | % | | | 0.23 | % | | | 0.68 | % | |
Supplemental data | |
Net assets, end of period (in thousands) | | $ | 1,438,322 | | | $ | 1,140,319 | | | $ | 1,230,960 | | | $ | 1,276,673 | | | $ | 951,951 | | |
Portfolio turnover | | | 36 | % | | | 42 | % | | | 41 | % | | | 60 | % | | | 70 | % | |
Notes to Financial Highlights
(a) In addition to the fees and expenses which the Fund bears directly, the Fund indirectly bears a pro rata share of the fees and expenses of the acquired funds in which it invests. Such indirect expenses are not included in the reported expense ratios.
(b) Total net expenses include the impact of certain waivers/reimbursements made by the Investment Manager and certain of its affiliates, if applicable.
(c) The benefits derived from expense reductions had an impact of less than 0.01%.
The accompanying Notes to Financial Statements are an integral part of this statement.
Annual Report 2014
26
Columbia Small Cap Value Fund II
Notes to Financial Statements
February 28, 2014
Note 1. Organization
Columbia Small Cap Value Fund II (the Fund), a series of Columbia Funds Series Trust (the Trust), is a diversified fund. The Trust is registered under the Investment Company Act of 1940, as amended (the 1940 Act), as an open-end management investment company organized as a Delaware statutory trust.
Fund Shares
The Trust may issue an unlimited number of shares (without par value). The Fund offers Class A, Class B, Class C, Class I, Class R, Class R4, Class R5, Class Y and Class Z shares. Although all share classes generally have identical voting, dividend and liquidation rights, each share class votes separately when required by law. Different share classes pay different distribution amounts to the extent the expenses of such share classes differ, and distributions in liquidation will be proportional to the net asset value of each share class. Each share class has its own expense structure and sales charges, as applicable.
Class A shares are subject to a maximum front-end sales charge of 5.75% based on the initial investment amount. Class A shares purchased without an initial sales charge in accounts aggregating $1 million to $50 million at the time of purchase are subject to a contingent deferred sales charge (CDSC) if the shares are sold within 18 months of purchase, charged as follows: 1.00% CDSC if redeemed within 12 months of purchase, and 0.50% CDSC if redeemed more than 12, but less than 18, months after purchase.
Class B shares may be subject to a maximum CDSC of 5.00% based upon the holding period after purchase. Class B shares will generally convert to Class A shares eight years after purchase. The Fund no longer accepts investments by new or existing investors in the Fund's Class B shares, except in connection with the reinvestment of any dividend and/or capital gain distributions in Class B shares of the Fund and exchanges by existing Class B shareholders of certain other funds within the Columbia Family of Funds.
Class C shares are subject to a 1.00% CDSC on shares redeemed within one year of purchase.
Class I shares are not subject to sales charges and are available only to the Columbia Family of Funds.
Class R shares are not subject to sales charges and are generally available only to certain retirement plans and other eligible investors.
Class R4 shares are not subject to sales charges and are generally available only to omnibus retirement plans and certain other eligible investors.
Class R5 shares are not subject to sales charges and are generally available only to investors purchasing through authorized investment professionals and omnibus retirement plans.
Class Y shares are not subject to sales charges and are generally available only to certain retirement plans.
Class Z shares are not subject to sales charges and are available only to certain eligible investors, which are subject to different investment minimums.
Note 2. Summary of Significant Accounting Policies
Use of Estimates
The preparation of financial statements in accordance with U.S. generally accepted accounting principles (GAAP) requires management to make certain estimates and assumptions that affect the reported amounts of assets and liabilities, the disclosure of contingent assets and liabilities at the date of the financial statements and the reported amounts of revenue and expenses during the reporting period. Actual results could differ from those estimates.
The following is a summary of significant accounting policies consistently followed by the Fund in the preparation of its financial statements.
Security Valuation
All equity securities are valued at the close of business of the New York Stock Exchange (NYSE). Equity securities are valued at the last quoted sales price on the principal exchange or market on which they trade, except for securities traded on the NASDAQ Stock Market, which are valued at the NASDAQ official close price. Unlisted securities or listed securities for which there were no sales during the day are valued at the mean of the latest quoted bid and ask prices on such exchanges or markets.
Foreign equity securities are valued based on quotations from the principal market in which such securities are normally traded. If any foreign share prices are not readily available as a result of limited share activity the securities are valued at the mean of the latest quoted bid and ask prices on such exchanges or markets. Foreign currency exchange rates are generally determined at 4:00 p.m. Eastern (U.S.) time. However, many securities markets and exchanges outside the U.S. close prior to the close of the NYSE; therefore, the closing prices for securities in such markets or on such exchanges may not fully reflect events that occur after such close but before the close of the NYSE. In those situations, foreign securities will be fair valued pursuant to the policy adopted by the Board of Trustees (the Board), including utilizing a third party pricing service to determine
Annual Report 2014
27
Columbia Small Cap Value Fund II
Notes to Financial Statements (continued)
February 28, 2014
these fair values. The third party pricing service takes into account multiple factors, including, but not limited to, movements in the U.S. securities markets, certain depositary receipts, futures contracts and foreign exchange rates that have occurred subsequent to the close of the foreign exchange or market, to determine a good faith estimate that reasonably reflects the current market conditions as of the close of the NYSE. The fair value of a security is likely to be different from the quoted or published price, if available.
Investments in open-end investment companies, including money market funds, are valued at net asset value.
Investments for which market quotations are not readily available, or that have quotations which management believes are not reliable, are valued at fair value as determined in good faith under consistently applied procedures established by and under the general supervision of the Board. If a security or class of securities (such as foreign securities) is valued at fair value, such value is likely to be different from the last quoted market price for the security.
The determination of fair value often requires significant judgment. To determine fair value, management may use assumptions including but not limited to future cash flows and estimated risk premiums. Multiple inputs from various sources may be used to determine fair value.
Security Transactions
Security transactions are accounted for on the trade date. Cost is determined and gains (losses) are based upon the specific identification method for both financial statement and federal income tax purposes.
Income Recognition
Corporate actions and dividend income are generally recorded net of any non-reclaimable tax withholdings, on the ex-dividend date or upon receipt of ex-dividend notification in the case of certain foreign securities.
The Fund may receive distributions from holdings in business development companies (BDCs), exchange traded funds (ETFs) and real estate investment trusts (REITs), which report information on the character of their distributions annually. These distributions are allocated to dividend income, capital gain and return of capital based on estimates made by the Fund's management if actual information has not yet been reported. Return of capital is recorded as a reduction of the cost basis of securities held. If the Fund no longer owns the applicable securities, return of capital is recorded as a realized gain. Management's estimates are subsequently adjusted when the actual character of the distributions is disclosed by the BDCs, ETFs and REITs, which could result in a proportionate change in return of capital to shareholders.
Awards from class action litigation are recorded as a reduction of cost basis if the Fund still owns the applicable securities on the payment date. If the Fund no longer owns the applicable securities, the proceeds are recorded as realized gains.
Expenses
General expenses of the Trust are allocated to the Fund and other funds of the Trust based upon relative net assets or other expense allocation methodologies determined by the nature of the expense. Expenses directly attributable to the Fund are charged to the Fund. Expenses directly attributable to a specific class of shares are charged to that share class.
Determination of Class Net Asset Value
All income, expenses (other than class-specific expenses, which are charged to that share class, as shown in the Statement of Operations) and realized and unrealized gains (losses) are allocated to each class of the Fund on a daily basis, based on the relative net assets of each class, for purposes of determining the net asset value of each class.
Federal Income Tax Status
The Fund intends to qualify each year as a regulated investment company under Subchapter M of the Internal Revenue Code, as amended, and will distribute substantially all of its taxable income (including net short-term capital gains), if any, for its tax year, and as such will not be subject to federal income taxes. In addition, the Fund intends to distribute in each calendar year substantially all of its net investment income, capital gains and certain other amounts, if any, such that the Fund should not be subject to federal excise tax. Therefore, no federal income or excise tax provision is recorded.
Distributions to Shareholders
Distributions from net investment income, if any, are declared and paid semi-annually. Net realized capital gains, if any, are distributed at least annually. Income distributions and capital gain distributions are determined in accordance with federal income tax regulations, which may differ from GAAP.
Guarantees and Indemnifications
Under the Trust's organizational documents and, in some cases, by contract, its officers and trustees are indemnified against certain liabilities arising out of the performance of their duties to the Trust or its funds. In addition, certain of the Fund's contracts with its service providers contain general indemnification clauses. The Fund's maximum exposure under these arrangements is unknown since the amount of any future claims that may be made against the Fund cannot be determined, and the Fund has no historical basis for predicting the likelihood of any such claims.
Annual Report 2014
28
Columbia Small Cap Value Fund II
Notes to Financial Statements (continued)
February 28, 2014
Note 3. Fees and Compensation Paid to Affiliates
Investment Management Fees
Under an Investment Management Services Agreement, Columbia Management Investment Advisers, LLC (the Investment Manager), a wholly-owned subsidiary of Ameriprise Financial, Inc. (Ameriprise Financial), determines which securities will be purchased, held or sold. The investment management fee is an annual fee that is equal to a percentage of the Fund's average daily net assets that declines from 0.79% to 0.70% as the Fund's net assets increase. The effective investment management fee rate for the year ended February 28, 2014 was 0.74% of the Fund's average daily net assets.
Administration Fees
Under an Administrative Services Agreement, the Investment Manager also serves as the Fund Administrator. The Fund pays the Fund Administrator an annual fee for administration and accounting services equal to a percentage of the Fund's average daily net assets that declines from 0.08% to 0.05% as the Fund's net assets increase. The effective administration fee rate for the year ended February 28, 2014 was 0.07% of the Fund's average daily net assets.
Other Expenses
Other expenses are for, among other things, miscellaneous expenses of the Fund or the Board, including payments to a company providing limited administrative services to the Fund and the Board. That company's expenses include boardroom and office expense, employee compensation, employee health and retirement benefits, and certain other expenses. For the year ended February 28, 2014, other expenses paid to this company were $5,080.
Compensation of Board Members
Board members are compensated for their services to the Fund as disclosed in the Statement of Operations. Under a Deferred Compensation Plan (the Plan), the Board members who are not "interested persons" of the Fund, as defined under the 1940 Act, may elect to defer payment of up to 100% of their compensation. Deferred amounts are treated as though equivalent dollar amounts had been invested in shares of certain funds managed by the Investment Manager. The Fund's liability for these amounts is adjusted for market value changes and remains in the Fund until distributed in accordance with the Plan.
Transfer Agent Fees
Under a Transfer and Dividend Disbursing Agent Agreement, Columbia Management Investment Services Corp. (the
Transfer Agent), an affiliate of the Investment Manager and a wholly-owned subsidiary of Ameriprise Financial, is responsible for providing transfer agency services to the Fund. The Transfer Agent has contracted with Boston Financial Data Services (BFDS) to serve as sub-transfer agent.
The Transfer Agent receives monthly account-based service fees based on the number of open accounts and also receives sub-transfer agency fees based on a percentage of the average aggregate value of the Fund's shares maintained in omnibus accounts (other than omnibus accounts for which American Enterprise Investment Services Inc. is the broker of record or accounts where the beneficial shareholder is a customer of Ameriprise Financial Services, Inc., which are paid a per account fee). The Transfer Agent pays the fees of BFDS for services as sub-transfer agent and is not entitled to reimbursement for such fees from the Fund (with the exception of out-of-pocket fees).
The Transfer Agent also receives compensation from fees for various shareholder services and reimbursements for certain out-of-pocket fees. Class I shares do not pay transfer agent fees. Total transfer agent fees for Class R5 shares are subject to an annual limitation of not more than 0.05% of the average daily net assets attributable to Class R5 shares. Class Y shares are not subject to transfer agent fees.
For the year ended February 28, 2014, the Fund's effective transfer agent fee rates as a percentage of average daily net assets of each class were as follows:
Class A | | | 0.20 | % | |
Class B | | | 0.20 | | |
Class C | | | 0.20 | | |
Class R | | | 0.20 | | |
Class R4 | | | 0.20 | | |
Class R5 | | | 0.05 | | |
Class Z | | | 0.20 | | |
An annual minimum account balance fee of $20 may apply to certain accounts with a value below the applicable share class's initial minimum investment requirements to reduce the impact of small accounts on transfer agent fees. These minimum account balance fees are recorded as part of expense reductions in the Statement of Operations. For the year ended February 28, 2014, these minimum account balance fees reduced total expenses by $120.
Distribution and Service Fees
The Fund has an agreement with Columbia Management Investment Distributors, Inc. (the Distributor), an affiliate of the Investment Manager and a wholly-owned subsidiary of Ameriprise Financial, for distribution and shareholder services. The Board has approved, and the Fund has adopted,
Annual Report 2014
29
Columbia Small Cap Value Fund II
Notes to Financial Statements (continued)
February 28, 2014
distribution and shareholder service plans (the Plans) applicable to certain share classes, which set the distribution and service fees for the Fund. These fees are calculated daily and are intended to compensate the Distributor and/or eligible selling and/or servicing agents for selling shares of the Fund and providing services to investors.
Under the Plans, the Fund pays a monthly combined distribution and service fee to the Distributor at the maximum annual rate of 0.25% of the average daily net assets attributable to Class A shares of the Fund. Also under the Plans, the Fund pays a monthly service fee at the maximum annual rate of 0.25% of the average daily net assets attributable to Class B and Class C shares of the Fund and the payment of a monthly distribution fee at the maximum annual rates of 0.75%, 0.75% and 0.50% of the average daily net assets attributable to Class B, Class C and Class R shares, respectively.
Sales Charges
Sales charges, including front-end charges and CDSCs, received by the Distributor for distributing Fund shares were $2,978 for Class A, $525 for Class B and $8 for Class C shares for the year ended February 28, 2014.
Expenses Waived/Reimbursed by the Investment Manager and its Affiliates
The Investment Manager and certain of its affiliates have contractually agreed to waive fees and/or reimburse expenses (excluding certain fees and expenses described below) for the period disclosed below, unless sooner terminated at the sole discretion of the Board, so that the Fund's net operating expenses, after giving effect to fees waived/expenses reimbursed and any balance credits and/or overdraft charges from the Fund's custodian, do not exceed the following annual rates as a percentage of the class' average daily net assets:
| | | Fee Rates Contractual
through
June 30, 2014 | |
Class A | | | 1.31 | % | |
Class B | | | 2.06 | | |
Class C | | | 2.06 | | |
Class I | | | 0.98 | | |
Class R | | | 1.56 | | |
Class R4 | | | 1.06 | | |
Class R5 | | | 1.03 | | |
Class Y | | | 0.98 | | |
Class Z | | | 1.06 | | |
Under the agreement governing these fee waivers and/or expense reimbursement arrangements, the following fees and expenses are excluded from the waiver/reimbursement
commitment, and therefore will be paid by the Fund, if applicable: taxes (including foreign transaction taxes), expenses associated with investments in affiliated and non-affiliated pooled investment vehicles (including mutual funds and exchange traded funds), transaction costs and brokerage commissions, costs related to any securities lending program, dividend expenses associated with securities sold short, inverse floater program fees and expenses, transaction charges and interest on borrowed money, interest, extraordinary expenses and any other expenses the exclusion of which is specifically approved by the Board. This agreement may be modified or amended only with approval from all parties.
Note 4. Federal Tax Information
The timing and character of income and capital gain distributions are determined in accordance with income tax regulations, which may differ from GAAP because of temporary or permanent book to tax differences.
At February 28, 2014, these differences are primarily due to differing treatment for deferral/reversal of wash sales losses, Trustees' deferred compensation, distribution reclassifications, post-October capital losses, late-year ordinary losses and re-characterization of distributions for investments. To the extent these differences are permanent, reclassifications are made among the components of the Fund's net assets in the Statement of Assets and Liabilities. Temporary differences do not require reclassifications. In the Statement of Assets and Liabilities the following reclassifications were made:
Excess of distributions over net investment income | | $ | 727,780 | | |
Accumulated net realized gain | | | (727,781 | ) | |
Paid-in capital | | | 1 | | |
Net investment income and net realized gains (losses), as disclosed in the Statement of Operations, and net assets were not affected by this reclassification.
The tax character of distributions paid during the years indicated was as follows:
Year Ended February 28, | | 2014 | | 2013 | |
Ordinary income | | $ | 14,672,433 | | | $ | 13,508,263 | | |
Long-term capital gains | | | 177,869,293 | | | | 30,579,982 | | |
Total | | $ | 192,541,726 | | | $ | 44,088,245 | | |
Short-term capital gain distributions, if any, are considered ordinary income distributions for tax purposes.
At February 28, 2014, the components of distributable earnings on a tax basis were as follows:
Undistributed accumulated long-term gain | | $ | 58,576,732 | | |
Unrealized appreciation | | | 576,739,336 | | |
Annual Report 2014
30
Columbia Small Cap Value Fund II
Notes to Financial Statements (continued)
February 28, 2014
At February 28, 2014, the cost of investments for federal income tax purposes was $1,248,408,083 and the aggregate gross unrealized appreciation and depreciation based on that cost was:
Unrealized appreciation | | $ | 594,032,714 | | |
Unrealized depreciation | | | (17,293,378 | ) | |
Net unrealized appreciation | | | 576,739,336 | | |
Under current tax rules, regulated investment companies can elect to treat certain late-year ordinary losses incurred and post-October capital losses (capital losses realized after October 31) as arising on the first day of the following taxable year. As of February 28, 2014, the Fund will elect to treat late-year ordinary losses of $93,684 and post-October capital losses of $1,343,162 as arising on March 1, 2014.
Management of the Fund has concluded that there are no significant uncertain tax positions that would require recognition in the financial statements. However, management's conclusion may be subject to review and adjustment at a later date based on factors including, but not limited to, new tax laws, regulations, and administrative interpretations (including relevant court decisions). Generally, the Fund's federal tax returns for the prior three fiscal years remain subject to examination by the Internal Revenue Service.
Note 5. Portfolio Information
The cost of purchases and proceeds from sales of securities, excluding short-term obligations, aggregated to $576,878,277 and $701,684,548, respectively, for the year ended February 28, 2014.
Note 6. Affiliated Money Market Fund
The Fund invests its daily cash balances in Columbia Short-Term Cash Fund, an affiliated money market fund established for the exclusive use by the Fund and other affiliated funds. The income earned by the Fund from such investments is included as "Dividends — affiliated issuers" in the Statement of Operations. As an investing fund, the Fund indirectly bears its proportionate share of the expenses of Columbia Short-Term Cash Fund.
Note 7. Shareholder Concentration
At February 28, 2014, three unaffiliated shareholder accounts owned an aggregate of 53.7% of the outstanding shares of the Fund. The Fund has no knowledge about whether any portion of those shares was owned beneficially by such accounts. Subscription and redemption activity by concentrated accounts may have a significant effect on the operations of the Fund.
Note 8. Line of Credit
The Fund has entered into a revolving credit facility with a syndicate of banks led by JPMorgan Chase Bank N.A. whereby the Fund may borrow for the temporary funding of shareholder redemptions or for other temporary or emergency purposes. The credit facility agreement, as amended, which is a collective agreement between the Fund and certain other funds managed by the Investment Manager, severally and not jointly, permits collective borrowings up to $500 million. Interest is charged to each participating fund based on its borrowings at a rate equal to the higher of (i) the overnight federal funds rate plus 1.00% or (ii) the one-month LIBOR rate plus 1.00%. Each borrowing under the credit facility matures no later than 60 days after the date of borrowing. Effective December 10, 2013, the Fund also pays a commitment fee equal to its pro rata share of the amount of the credit facility at a rate of 0.075% per annum. Prior to December 10, 2013, the commitment fee was charged at the annual rate of 0.08% per annum. The commitment fee is included in other expenses in the Statement of Operations.
The Fund had no borrowings during the year ended February 28, 2014.
Note 9. Significant Risks
Financial Sector Risk
Sector risk occurs when a fund invests a significant portion of its assets in securities of companies conducting business in a related group of industries within an economic sector. Companies in the same economic sector may be similarly affected by economic, regulatory, political or market events or conditions, making a fund more vulnerable to unfavorable developments in that economic sector than funds that invest more broadly. The Fund may be more susceptible to the particular risks that may affect companies in the financial sector than if it were invested in a wider variety of companies in unrelated sectors.
Note 10. Subsequent Events
Management has evaluated the events and transactions that have occurred through the date the financial statements were issued and noted no items requiring adjustment of the financial statements or additional disclosure.
Note 11. Information Regarding Pending and Settled Legal Proceedings
In December 2005, without admitting or denying the allegations, American Express Financial Corporation (AEFC, which is now known as Ameriprise Financial, Inc. (Ameriprise Financial)) entered into settlement agreements with the Securities and Exchange Commission (SEC) and Minnesota
Annual Report 2014
31
Columbia Small Cap Value Fund II
Notes to Financial Statements (continued)
February 28, 2014
Department of Commerce (MDOC) related to market timing activities. As a result, AEFC was censured and ordered to cease and desist from committing or causing any violations of certain provisions of the Investment Advisers Act of 1940, the Investment Company Act of 1940, and various Minnesota laws. AEFC agreed to pay disgorgement of $10 million and civil money penalties of $7 million. AEFC also agreed to retain an independent distribution consultant to assist in developing a plan for distribution of all disgorgement and civil penalties ordered by the SEC in accordance with various undertakings detailed at www.sec.gov/litigation/admin/ia-2451.pdf. Ameriprise Financial and its affiliates have cooperated with the SEC and the MDOC in these legal proceedings, and have made regular reports to the Funds' Boards of Trustees.
Ameriprise Financial and certain of its affiliates have historically been involved in a number of legal, arbitration and regulatory proceedings, including routine litigation, class actions, and governmental actions, concerning matters arising in connection with the conduct of their business activities. Ameriprise Financial believes that the Funds are not currently the subject of, and that neither Ameriprise Financial nor any of its affiliates are the subject of, any pending legal, arbitration or regulatory proceedings that are likely to have a material adverse effect on the Funds or the ability of Ameriprise Financial or its affiliates to perform under their contracts with the Funds. Ameriprise Financial is required to make 10-Q, 10-K and, as necessary, 8-K filings with the Securities and Exchange Commission on legal and regulatory matters that relate to Ameriprise Financial and its affiliates. Copies of these filings may be obtained by accessing the SEC website at www.sec.gov.
There can be no assurance that these matters, or the adverse publicity associated with them, will not result in increased fund redemptions, reduced sale of fund shares or other adverse consequences to the Funds. Further, although we believe proceedings are not likely to have a material adverse effect on the Funds or the ability of Ameriprise Financial or its affiliates to perform under their contracts with the Funds, these proceedings are subject to uncertainties and, as such, we are unable to estimate the possible loss or range of loss that may result. An adverse outcome in one or more of these proceedings could result in adverse judgments, settlements, fines, penalties or other relief that could have a material adverse effect on the consolidated financial condition or results of operations of Ameriprise Financial.
Annual Report 2014
32
Columbia Small Cap Value Fund II
Report of Independent Registered Public Accounting Firm
To the Trustees of Columbia Funds Series Trust and the Shareholders of
Columbia Small Cap Value Fund II
In our opinion, the accompanying statement of assets and liabilities, including the portfolio of investments, and the related statements of operations and of changes in net assets and the financial highlights present fairly, in all material respects, the financial position of Columbia Small Cap Value Fund II (the "Fund", a series of Columbia Funds Series Trust) at February 28, 2014, and the results of its operations, the changes in its net assets and the financial highlights for each of the periods indicated, in conformity with accounting principles generally accepted in the United States of America. These financial statements and financial highlights (hereafter referred to as "financial statements") are the responsibility of the Fund's management; our responsibility is to express an opinion on these financial statements based on our audits. We conducted our audits of these financial statements in accordance with the standards of the Public Company Accounting Oversight Board (United States). Those standards require that we plan and perform the audit to obtain reasonable assurance about whether the financial statements are free of material misstatement. An audit includes examining, on a test basis, evidence supporting the amounts and disclosures in the financial statements, assessing the accounting principles used and significant estimates made by management, and evaluating the overall financial statement presentation. We believe that our audits, which included confirmation of securities at February 28, 2014 by correspondence with the custodian, brokers and transfer agent, provide a reasonable basis for our opinion.
PricewaterhouseCoopers LLP
Minneapolis, Minnesota
April 21, 2014
Annual Report 2014
33
Columbia Small Cap Value Fund II
Federal Income Tax Information
(Unaudited)
The Fund hereby designates the following tax attributes for the fiscal year ended February 28, 2014. Shareholders will be notified in early 2015 of the amounts for use in preparing 2014 income tax returns.
Tax Designations:
| Qualified Dividend Income | | | 100.00 | % | |
| Dividends Received Deduction | | | 100.00 | % | |
Capital Gain Dividend | | $ | 202,226,795 | | |
Qualified Dividend Income. For taxable, non-corporate shareholders, the percentage of ordinary income dividends paid during the fiscal year that represents qualified dividend income subject to reduced tax rates.
Dividends Received Deduction. The percentage of ordinary income dividends paid during the fiscal year that qualifies for the corporate dividends received deduction.
Capital Gain Dividend. The Fund designates as a capital gain dividend the amount reflected above, or if subsequently determined to be different, the net capital gain of such fiscal period. The Fund also designates as capital gain dividends, to the extent necessary to fully distribute such capital gains, earnings and profits distributed to shareholders on the redemption of shares.
Annual Report 2014
34
Columbia Small Cap Value Fund II
Shareholders elect the Board that oversees the Funds' operations. The Board appoints officers who are responsible for day-to-day business decisions based on policies set by the Board. The following table provides basic biographical information about the Funds' Board members, including their principal occupations during the past five years, although specific titles for individuals may have varied over the period. Under current Board policy, members may serve through the end of the calendar year in which he or she reaches either the mandatory retirement age established by the Board or the fifteenth anniversary of the first Board meeting they attended as a member of the Board.
Independent Trustees
Name,
Address,
Year of Birth | | Position Held With
Funds and Length of
Service | | Principal Occupation(s)
During Past Five Years
and Other Relevant
Professional Experience | | Number of
Funds in the
Fund Family
Overseen by
Board Member | | Other Present or Past
Directorships/
Trusteeships
(Within Past 5 Years) | |
Kathleen Blatz
901 S. Marquette Ave.
Minneapolis, MN 55402
1954 | | Board member since 1/06 for RiverSource Funds and since 6/11 for Nations Funds | | Attorney; Chief Justice, Minnesota Supreme
Court, 1998-2006 | | | 131 | | | Trustee, BlueCross BlueShield of Minnesota since 2009 | |
Edward J. Boudreau, Jr.
901 S. Marquette Ave.
Minneapolis, MN 55402
1944 | | Board member since 6/11 for RiverSource Funds and since 1/05 for Nations Funds | | Managing Director, E.J. Boudreau & Associates (consulting) since 2000; Chairman and Chief Executive Officer, John Hancock Funds (mutual funds), 1989-2000 | | | 129 | | | Former Trustee, BofA Funds Series Trust (11 funds), 2005-2011 | |
Pamela G. Carlton
901 S. Marquette Ave.
Minneapolis, MN 55402
1954 | | Board member since 7/07 for RiverSource Funds and since 6/11 for Nations Funds | | President, Springboard — Partners in Cross Cultural Leadership (consulting company) since 2003; Director or Management Director of US Equity Research, Chase Asset Management, 1996-2003; Investment Banker, Morgan Stanley, 1982-1996 | | | 131 | | | None | |
William P. Carmichael
901 S. Marquette Ave.
Minneapolis, MN 55402
1943 | | Chair of the Board since 1/14, Board member since 6/11 for RiverSource Funds and since 2003 for Nations Funds | | Retired; Co-founder, The Succession Fund (provides exit strategies to owners of privately held companies); previously, Senior Vice President, Sara Lee Corporation; Senior Vice President and Chief Financial officer, Beatrice Foods Company; Vice President, Esmark, Inc.; Associate, Price Waterhouse | | | 131 | | | Director, Cobra Electronics Corporation (electronic equipment manufacturer); The Finish Line (athletic shoes and apparel) since July 2003; Director, International Textile Corp. since 2012; former Director, McMoRan Exploration Company (oil and gas exploration and development) 2010-2013; former Trustee, BofA Funds Series Trust (11 funds), 2009-2011; Director, Spectrum Brands, Inc. (consumer products), 2002-2009; Director, Simmons Company (bedding), 2004-2010 | |
Annual Report 2014
35
Columbia Small Cap Value Fund II
Trustees and Officers (continued)
Independent Trustees (continued)
Name,
Address,
Year of Birth | | Position Held With
Funds and Length of
Service | | Principal Occupation(s)
During Past Five Years
and Other Relevant
Professional Experience | | Number of
Funds in the
Fund Family
Overseen by
Board Member | | Other Present or Past
Directorships/
Trusteeships
(Within Past 5 Years) | |
Patricia M. Flynn
901 S. Marquette Ave.
Minneapolis, MN 55402
1950 | | Board member since 11/04 for RiverSource Funds and since 6/11 for Nations Funds | | Trustee Professor of Economics and Management, Bentley University since 1976 (also teaches and conducts research on corporate governance); Dean, McCallum Graduate School of Business, Bentley University, 1992-2002 | | | 131 | | | None | |
William A. Hawkins
901 S. Marquette Ave.
Minneapolis, MN 55402
1942 | | Board member since 6/11 for RiverSource Funds and since 1/05 for Nations Funds | | Managing Director, Overton Partners (financial consulting), since August 2010; President and Chief Executive Officer, California General Bank, N.A., January 2008-August 2010 | | | 129 | | | Trustee, BofA Funds Series Trust (11 funds) | |
R. Glenn Hilliard
901 S. Marquette Ave.
Minneapolis, MN 55402
1943 | | Board member since 6/11 for RiverSource Funds and since 1/05 for Nations Funds | | Chairman and Chief Executive Officer, Hilliard Group LLC (investing and consulting) since April 2003; Non-Executive Director & Chairman, CNO Financial Group, Inc. (insurance), September 2003-May 2011 | | | 129 | | | Chairman, BofA Fund Series Trust (11 funds); former Director, CNO Financial Group, Inc. (insurance), 2003-2011 | |
Stephen R. Lewis, Jr.
901 S. Marquette Ave.
Minneapolis, MN 55402
1939 | | Board member for RiverSource Funds since 1/02 and since 6/11 for Nations Funds, Board Chair 1/07-12/13 | | President Emeritus and Professor of Economics Emeritus, Carleton College since 2002 | | | 131 | | | Director, Valmont Industries, Inc. (irrigation systems manufacturer), 2002-2013 | |
Catherine James Paglia
901 S. Marquette Ave.
Minneapolis, MN 55402
1952 | | Board member since 11/04 for RiverSource Funds and since 6/11 for Nations Funds | | Director, Enterprise Asset Management, Inc. (private real estate and asset management company) since September 1998 | | | 131 | | | Director, Valmont Industries, Inc. (irrigation systems manufacturer) since 2012 | |
Leroy C. Richie
901 S. Marquette Ave.
Minneapolis, MN 55402
1941 | | Board member since 2000 for Legacy Seligman Funds, since 11/08 for RiverSource Funds and since 6/11 for Nations Funds | | Counsel, Lewis & Munday, P.C. (law firm) since 2004; Vice President and General Counsel, Automotive Legal Affairs, Chrysler Corporation, 1993-1997 | | | 131 | | | Lead Outside Director, Digital Ally, Inc. (digital imaging) since September 2005; Director, Infinity, Inc. (oil and gas exploration and production) since 1994; Director, OGE Energy Corp. (energy and energy services) since November 2007 | |
Minor M. Shaw
901 S. Marquette Ave.
Minneapolis, MN 55402
1947 | | Board member since 6/11 for RiverSource Funds and since 2003 for Nations Funds | | President, Micco LLC (private investments) since 2011; President, Micco Corp. since 1998 | | | 129 | | | Director, Piedmont Natural Gas; Director, BlueCross BlueShield of South Carolina since April 2008; Director, National Association of Corporate Directors, Carolinas Chapter, since 2013; former Trustee, BofA Funds Series Trust (11 funds) | |
Annual Report 2014
36
Columbia Small Cap Value Fund II
Trustees and Officers (continued)
Independent Trustees (continued)
Name,
Address,
Year of Birth | | Position Held With
Funds and Length of
Service | | Principal Occupation(s)
During Past Five Years
and Other Relevant
Professional Experience | | Number of
Funds in the
Fund Family
Overseen by
Board Member | | Other Present or Past
Directorships/
Trusteeships
(Within Past 5 Years) | |
Alison Taunton-Rigby
901 S. Marquette Ave.
Minneapolis, MN 55402
1944 | | Board member since 11/02 for RiverSource Funds and since 6/11 for Nations Funds | | Chief Executive Officer and Director, RiboNovix, Inc., (biotechnology) 2003-2010 | | | 131 | | | Director, Healthways, Inc. (health and wellbeing solutions) since 2005; Director, ICI Mutual Insurance Company, RRG since 2011; Director, Abt Associates (government contractor) since 2001; Director, Boston Children's Hospital since 2002 | |
Interested Trustee Not Affiliated with Investment Manager*
Name,
Address,
Year of Birth | | Position Held With
Funds and Length of
Service | | Principal Occupation(s)
During Past Five Years
and Other Relevant
Professional Experience | | Number of
Funds in the
Fund Family
Overseen by
Board Member | | Other Present or Past
Directorships/
Trusteeships
(Within Past 5 Years) | |
Anthony M. Santomero
901 S. Marquette Ave.
Minneapolis, MN 55402
1946 | | Board member since 6/11 for RiverSource Funds and since 1/08 for Nations Funds | | Richard K. Mellon Professor Emeritus of Finance, The Wharton School, University of Pennsylvania, since 2002; Senior Advisor, McKinsey & Company (consulting), 2006-2008 | | | 129 | | | Director, Renaissance Reinsurance Ltd. since May 2008; Trustee, Penn Mutual Life Insurance Company since March 2008; Director, Citigroup Inc. since 2009; Director, Citibank, N.A. since 2009; former Trustee, BofA Funds Series Trust (11 funds), 2008-2011 | |
* Dr. Santomero is not an affiliated person of the Investment Manager or Ameriprise Financial. However, he is currently deemed by the Funds to be an "interested person" (as defined in the 1940 Act) of the Funds because he serves as a Director of Citigroup Inc. and Citibank, N.A., companies that may directly or through subsidiaries and affiliates engage from time-to-time in brokerage execution, principal transactions and lending relationships with the Funds or accounts advised/managed by the Investment Manager.
Annual Report 2014
37
Columbia Small Cap Value Fund II
Trustees and Officers (continued)
Interested Trustee Affiliated with Investment Manager*
Name,
Address,
Year of Birth | | Position Held With
Funds and Length of
Service | | Principal Occupation(s)
During Past Five Years
and Other Relevant
Professional Experience | | Number of
Funds in the
Fund Family
Overseen by
Board Member | | Other Present or Past
Directorships/
Trusteeships
(Within Past 5 Years) | |
William F. Truscott
53600 Ameriprise
Financial Center
Minneapolis, MN 55474
1960 | | Board member since 11/01 for RiverSource Funds and since 6/11 for Nations Funds; Senior Vice President since 2002 for RiverSource Funds and since 5/10 for Nations Funds | | Chairman of the Board and President, Columbia Management Investment Advisers, LLC since May 2010 and February 2012, respectively (previously President and Chief Investment Officer, 2001-April 2010); Chief Executive Officer, Global Asset Management, Ameriprise Financial, Inc. since September 2012 (previously Chief Executive Officer, U.S. Asset Management & President, Annuities, May 2010-September 2012 and President — U.S. Asset Management and Chief Investment Officer, 2005-April 2010); Director and Chief Executive Officer, Columbia Management Investment Distributors, Inc. since May 2010 and February 2012, respectively (previously Chairman of the Board and Chief Executive Officer, 2006-April 2010); Chairman of the Board and Chief Executive Officer, RiverSource Distributors, Inc. since 2006; Director, Threadneedle Asset Management Holdings, SARL since 2014; President and Chief Executive Officer, Ameriprise Certificate Company, 2006-August 2012 | | | 183 | | | Former Director, Ameriprise Certificate Company, 2006-January 2013 | |
* Interested person (as defined under the 1940 Act) by reason of being an officer, director, security holder and/or employee of the Investment Manager or Ameriprise Financial.
The SAI has additional information about the Fund's Board members and is available, without charge, upon request by calling 800.345.6611; contacting your financial intermediary; or visiting columbiamanagement.com.
Annual Report 2014
38
Columbia Small Cap Value Fund II
Trustees and Officers (continued)
The Board has appointed officers who are responsible for day-to-day business decisions based on policies it has established. The officers serve at the pleasure of the Board. In addition to Mr. Truscott, who is Senior Vice President, the Funds' other officers are:
Officers
Name,
Address and
Year of Birth | | Position and Year
First Appointed to
Position for any Fund
in the Columbia
Funds Complex or a
Predecessor Thereof | | Principal Occupation(s) During Past Five Years | |
J. Kevin Connaughton
225 Franklin Street
Boston, MA 02110
Born 1964 | | President and Principal Executive Officer (2009) | | Managing Director and General Manager — Mutual Fund Products, Columbia Management Investment Advisers, LLC since May 2010; and President, Columbia Funds since 2009; Managing Director, Columbia Management Advisors, LLC, December 2004 – April 2010; Senior Vice President and Chief Financial Officer, Columbia Funds, June 2008 – January 2009; and senior officer of Columbia Funds and affiliated funds since 2003 | |
Michael G. Clarke
225 Franklin Street
Boston, MA 02110
Born 1969 | | Treasurer (2011) and Chief Financial Officer (2009) | | Vice President — Mutual Fund Administration, Columbia Management Investment Advisers, LLC, since May 2010;Managing Director of Fund Administration, Columbia Management Advisors, LLC, September 2004 – April 2010; and senior officer of Columbia Funds and affiliated funds since 2002 | |
Scott R. Plummer
5228 Ameriprise Financial Center
Minneapolis, MN 55474
Born 1959 | | Senior Vice President (2006), Chief Legal Officer (2006) and Assistant Secretary (2011) | | Senior Vice President and Assistant General Counsel — Global Asset Management, Ameriprise Financial since February 2014 (previously, Senior Vice President and Lead Chief Counsel — Asset Management, 2012 – February 2014; Vice President and Lead Chief Counsel — Asset Management, 2010 – 2012; and Vice President and Chief Counsel — Asset Management, 2005 – 2010); Senior Vice President, Chief Legal Officer and Assistant Secretary, Columbia Management Investment Advisers, LLC since June 2005; Vice President, Chief Counsel and Assistant Secretary, Columbia Management Investment Distributors, Inc. since 2008; Vice President, General Counsel and Secretary, Ameriprise Certificate Company since 2005; Chief Counsel, RiverSource Distributors, Inc. since 2006; senior officer of Columbia Funds and affiliated funds since 2006 | |
Thomas P. McGuire
225 Franklin Street
Boston, MA 02110
Born 1972 | | Chief Compliance Officer (2012) | | Vice President — Asset Management Compliance, Ameriprise Financial, Inc. since May 2010; Chief Compliance Officer, Ameriprise Certificate Company, since September 2010; Compliance Executive, Bank of America, 2005 – April 2010 | |
Colin Moore
225 Franklin Street
Boston, MA 02110
Born 1958 | | Senior Vice President (2010) | | Executive Vice President and Global Chief Investment Officer, Ameriprise Financial, Inc. since July 2013; Director and Global Chief Investment Officer, Columbia Management Investment Advisers, LLC since May 2010; Manager, Managing Director and Chief Investment Officer, Columbia Management Advisors, LLC, 2007 – April 2010 | |
Michael E. DeFao
225 Franklin Street
Boston, MA 02110
Born 1968 | | Vice President (2011) and Assistant Secretary (2010) | | Vice President and Chief Counsel, Ameriprise Financial, Inc. since May 2010; Associate General Counsel, Bank of America 2005 – April 2010 | |
Joseph F. DiMaria
225 Franklin Street
Boston, MA 02110
Born 1968 | | Vice President (2011) and Chief Accounting Officer (2008) | | Vice President — Mutual Fund Treasurer, Columbia Management Investment Advisers, LLC since May 2010; Director of Fund Administration, Columbia Management Advisors, LLC, 2006 – April 2010 | |
Paul B. Goucher
100 Park Avenue
New York, NY 10017
Born 1968 | | Vice President (2011) and Assistant Secretary (2008) | | Vice President and Lead Chief Counsel, Ameriprise Financial, Inc. since November 2008 and January 2013, respectively (previously Chief Counsel, January 2010 – January 2013, and Group Counsel, November 2008 – January 2010); Director, Managing Director and General Counsel, J. & W. Seligman & Co. Incorporated, July 2008 – November 2008 | |
Amy Johnson
5228 Ameriprise Financial
Center
Minneapolis, MN 55474
Born 1965 | | Vice President (2006) | | Managing Director and Chief Operating Officer, Columbia Management Investment Advisers, LLC since May 2010 (previously Chief Administrative Officer, 2009 – April 2010, and Vice President — Asset Management and Trust Company Services, 2006 – 2009) | |
Annual Report 2014
39
Columbia Small Cap Value Fund II
Trustees and Officers (continued)
Officers (continued)
Name,
Address and
Year of Birth | | Position and Year
First Appointed to
Position for any Fund
in the Columbia
Funds Complex or a
Predecessor Thereof | | Principal Occupation(s) During Past Five Years | |
Paul D. Pearson
5228 Ameriprise Financial
Center
Minneapolis, MN 55474
Born 1956 | | Vice President (2011) and Assistant Treasurer (1999) | | Vice President — Investment Accounting, Columbia Management Investment Advisers, LLC since May 2010; Vice President — Managed Assets, Investment Accounting, Ameriprise Financial, Inc., 1998 – April 2010 | |
Christopher O. Petersen
5228 Ameriprise Financial Center
Minneapolis, MN 55474
Born 1970 | | Vice President and Secretary (2010) | | Vice President and Chief Counsel, Ameriprise Financial, Inc., since January 2010 (previously Vice President and Group Counsel or Counsel, 2004 – January 2010); officer of Columbia Funds and affiliated funds since 2007 | |
Stephen T. Welsh
225 Franklin Street
Boston, MA 02110
Born 1957 | | Vice President (2006) | | President and Director, Columbia Management Investment Services Corp. since May 2010; President and Director, Columbia Management Services, Inc., 2004 – April 2010; Managing Director, Columbia Management Distributors, Inc., 2007 – April 2010 | |
Annual Report 2014
40
Columbia Small Cap Value Fund II
Important Information About This Report
Each fund mails one shareholder report to each shareholder address. If you would like more than one report, please call shareholder services at 800.345.6611 and additional reports will be sent to you.
The policy of the Board is to vote the proxies of the companies in which each fund holds investments consistent with the procedures as stated in the Statement of Additional Information (SAI). You may obtain a copy of the SAI without charge by calling 800.345.6611; contacting your financial intermediary; visiting columbiamanagement.com; or searching the website of the Securities and Exchange Commission (SEC) at sec.gov. Information regarding how each fund voted proxies relating to portfolio securities is filed with the SEC by August 31 for the most recent 12-month period ending June 30 of that year, and is available without charge by visiting columbiamanagement.com; or searching the website of the SEC at sec.gov.
Each fund files a complete schedule of portfolio holdings with the SEC for the first and third quarters of each fiscal year on Form N-Q. Each fund's Form N-Q is available on the SEC's website at sec.gov and may be reviewed and copied at the SEC's Public Reference Room in Washington, D.C. Information on the operation of the Public Reference Room may be obtained by calling 800.SEC.0330. Each fund's complete schedule of portfolio holdings, as filed on Form N-Q, can also be obtained without charge, upon request, by calling 800.345.6611.
Annual Report 2014
41

Columbia Small Cap Value Fund II
P.O. Box 8081
Boston, MA 02266-8081
columbiamanagement.com
This information is for use with concurrent or prior delivery of a fund prospectus. Please read and consider the investment objectives, risks, charges and expenses for any fund carefully before investing. For a prospectus and, if available, a summary prospectus, which contains this and other important information about the Fund go to columbiamanagement.com. The Fund is distributed by Columbia Management Investment Distributors, Inc., member FINRA, and managed by Columbia Management Investment Advisers, LLC.
© 2014 Columbia Management Investment Advisers, LLC. All rights reserved.
ANN230_02_D01_(04/14)
Annual Report
February 28, 2014

Columbia Convertible Securities Fund
Not FDIC insured • No bank guarantee • May lose value
 Dear Shareholders,
Equities recovered
In the final months of 2013, the U.S. economy embraced a robust recovery. After five years of only modest progress, the pace of economic growth picked up, job gains continued, manufacturing activity accelerated and a rebound in the housing market showed staying power. Growth, as measured by gross domestic product, was 4.1% in the third quarter, with expectations for a solid fourth quarter. Job growth averaged close to 200,000 monthly. Industrial production rose at a rate of 3.3%, considerably higher than the 12-month average of 2.5%. Factories were busier than at any point since the 2008/2009 recession, with capacity utilization at 79%. Orders for durable goods were strong, bolstered by rising auto sales. Holiday spending was solid, especially online sales, which rose 10% year over year, despite a shorter season.
Against this backdrop, the Federal Reserve's (the Fed's) announcement that it would slowly retreat from its monthly bond buying program and a bipartisan budget deal in Washington were welcome news for investors. Stocks climbed to new highs in the fourth quarter, while bonds retreated as yields moved higher. Small-cap stocks outperformed large- and mid-cap stocks, led by significant gains from the industrials, technology and consumer discretionary sectors. All 10 sectors of the S&P 500 Index delivered positive returns, although telecommunications and utilities posted only modest gains.
Fixed-income retreated
Improved economic data drove interest rates higher over the fourth quarter, credit spreads narrowed and the dollar weakened against most developed market currencies. Against this backdrop, most non-Treasury, fixed-income sectors delivered positive returns. Outgoing Fed chairman Ben Bernanke expressed concern about the persistently low level of core inflation, but gains in the labor market and reduced unemployment led to the Fed's decision to taper its bond-buying program gradually beginning in January 2014.
As the stock market soared, the riskiest sectors of the fixed-income markets fared the best. U.S. and foreign high-yield bonds were the strongest performers, followed by emerging-market and U.S. investment-grade corporate bonds. U.S. mortgage-backed securities (MBS) and securitized bonds produced negative total returns, as did U.S. Treasuries and developed world government bonds. Treasury inflation-protected bonds were the period's biggest losers. Investment-grade municipals delivered fractional gains, as better economic conditions helped steady state finances.
Stay on track with Columbia Management
Backed by more than 100 years of experience, Columbia Management is one of the nation's largest asset managers. At the heart of our success and, most importantly, that of our investors, are highly talented industry professionals, brought together by a unique way of working. At Columbia Management, reaching our performance goals matters, and how we reach them matters just as much.
Visit columbiamanagement.com for:
> The Columbia Management Perspectives blog, offering insights on current market events and investment opportunities
> Detailed up-to-date fund performance and portfolio information
> Quarterly fund commentaries
> Columbia Management Investor, our award-winning quarterly newsletter for shareholders
Thank you for your continued support of the Columbia Funds. We look forward to serving your investment needs for many years to come.
Best Regards,

J. Kevin Connaughton
President, Columbia Funds
Investing involves risk including the risk of loss of principal.
The S&P 500 Index, an unmanaged index, measures the performance of 500 widely held, large-capitalization U.S. stocks and is frequently used as a general measure of market performance. The Dow Jones Industrial Average is a price weighted average of 30 actively traded shares of blue chip US industrial corporations listed on the New York Stock Exchange. Indices are not available for investment, are not professionally managed and do not reflect sales charges, fees, brokerage commissions, taxes or other expenses of investing.
Investors should consider the investment objectives, risks, charges and expenses of a mutual fund carefully before investing. For a free prospectus and, if available, a summary prospectus, which contains this and other important information about a fund, visit columbiamanagement.com. The prospectus should be read carefully before investing.
Columbia Funds are distributed by Columbia Management Investment Distributors, Inc., member FINRA, and managed by Columbia Management Investment Advisers, LLC.
© 2014 Columbia Management Investment Advisers, LLC. All rights reserved.
Columbia Convertible Securities Fund
Performance Overview | | | 2 | | |
Manager Discussion of Fund Performance | | | 4 | | |
Understanding Your Fund's Expenses | | | 6 | | |
Portfolio of Investments | | | 7 | | |
Statement of Assets and Liabilities | | | 15 | | |
Statement of Operations | | | 17 | | |
Statement of Changes in Net Assets | | | 18 | | |
Financial Highlights | | | 21 | | |
Notes to Financial Statements | | | 30 | | |
Report of Independent Registered
Public Accounting Firm | | | 37 | | |
Federal Income Tax Information | | | 38 | | |
Trustees and Officers | | | 39 | | |
Important Information About This Report | | | 45 | | |
Fund Investment Manager
Columbia Management Investment
Advisers, LLC
225 Franklin Street
Boston, MA 02110
Fund Distributor
Columbia Management Investment
Distributors, Inc.
225 Franklin Street
Boston, MA 02110
Fund Transfer Agent
Columbia Management Investment
Services Corp.
P.O. Box 8081
Boston, MA 02266-8081
For more information about any of the funds, please visit columbiamanagement.com or call 800.345.6611. Customer Service Representatives are available to answer your questions Monday through Friday from 8 a.m. to 7 p.m. Eastern time.
The views expressed in this report reflect the current views of the respective parties. These views are not guarantees of future performance and involve certain risks, uncertainties and assumptions that are difficult to predict, so actual outcomes and results may differ significantly from the views expressed. These views are subject to change at any time based upon economic, market or other conditions and the respective parties disclaim any responsibility to update such views. These views may not be relied on as investment advice and, because investment decisions for a Columbia Fund are based on numerous factors, may not be relied on as an indication of trading intent on behalf of any particular Columbia Fund. References to specific securities should not be construed as a recommendation or investment advice.
Columbia Convertible Securities Fund
Performance Summary
> Columbia Convertible Securities Fund (the Fund) Class A shares returned 25.38% excluding sales charges for the 12-month period ended February 28, 2014.
> The Fund underperformed its benchmark, the Bank of America Merrill Lynch (BofAML) All Convertibles All Qualities Index, which returned 26.79% for the same 12-month period.
> Health care and technology holdings were strong contributors to returns. A few disappointments among individual holdings detracted from overall results vs. the benchmark.
Average Annual Total Returns (%) (for period ended February 28, 2014)
| | Inception | | 1 Year | | 5 Years | | 10 Years | |
Class A | | 09/25/87 | | | | | | | | | | | | | |
Excluding sales charges | | | | | | | 25.38 | | | | 17.52 | | | | 6.79 | | |
Including sales charges | | | | | | | 18.14 | | | | 16.12 | | | | 6.16 | | |
Class B | | 07/15/98 | | | | | | | | | | | | | |
Excluding sales charges | | | | | | | 24.37 | | | | 16.63 | | | | 5.99 | | |
Including sales charges | | | | | | | 19.37 | | | | 16.41 | | | | 5.99 | | |
Class C | | 10/21/96 | | | | | | | | | | | | | |
Excluding sales charges | | | | | | | 24.46 | | | | 16.63 | | | | 5.99 | | |
Including sales charges | | | | | | | 23.46 | | | | 16.63 | | | | 5.99 | | |
Class I* | | 09/27/10 | | | 25.90 | | | | 17.84 | | | | 6.93 | | |
Class R* | | 11/16/11 | | | 25.08 | | | | 17.13 | | | | 6.39 | | |
Class R4* | | 11/08/12 | | | 25.68 | | | | 17.60 | | | | 6.83 | | |
Class R5* | | 11/08/12 | | | 25.86 | | | | 17.65 | | | | 6.85 | | |
Class W* | | 11/16/11 | | | 25.41 | | | | 17.42 | | | | 6.65 | | |
Class Z | | 05/21/99 | | | 25.72 | | | | 17.82 | | | | 7.07 | | |
BofAML All Convertibles All Qualities Index | | | | | | | 26.79 | | | | 20.84 | | | | 7.34 | | |
Returns for Class A are shown with and without the maximum initial sales charge of 5.75%. Returns for Class B are shown with and without the applicable contingent deferred sales charge (CDSC) of 5.00% in the first year, declining to 1.00% in the sixth year and eliminated thereafter. Returns for Class C are shown with and without the 1.00% CDSC for the first year only. The Fund's other classes are not subject to sales charges and have limited eligibility. Please see the Fund's prospectus for details. Performance for different share classes will vary based on differences in sales charges and fees associated with each class. All results shown assume reinvestment of distributions during the period. Returns do not reflect the deduction of taxes that a shareholder may pay on Fund distributions or on the redemption of Fund shares. Performance results reflect the effect of any fee waivers or reimbursements of Fund expenses by Columbia Management Investment Advisers, LLC and/or any of its affiliates. Absent these fee waivers or expense reimbursement arrangements, performance results would have been lower.
The performance information shown represents past performance and is not a guarantee of future results. The investment return and principal value of your investment will fluctuate so that your shares, when redeemed, may be worth more or less than their original cost. Current performance may be lower or higher than the performance information shown. You may obtain performance information current to the most recent month-end by contacting your financial intermediary, visiting columbiamanagement.com or calling 800.345.6611.
*The returns shown for periods prior to the share class inception date (including returns for the Life of the Fund, if shown, which are since Fund inception) include the returns of the Fund's oldest share class. These returns are adjusted to reflect any higher class-related operating expenses of the newer share classes, as applicable. Please visit columbiamanagement.com/mutual-funds/appended-performance for more information.
The BofAML All Convertibles All Qualities Index measures the performance of U.S. dollar-denominated convertible securities not currently in bankruptcy with a total market value greater than $50 million at issuance.
Indices are not available for investment, are not professionally managed and do not reflect sales charges, fees, brokerage commissions, taxes or other expenses of investing. Securities in the Fund may not match those in an index.
Annual Report 2014
2
Columbia Convertible Securities Fund
Performance Overview (continued)
Performance of a Hypothetical $10,000 Investment (March 1, 2004 – February 28, 2014)
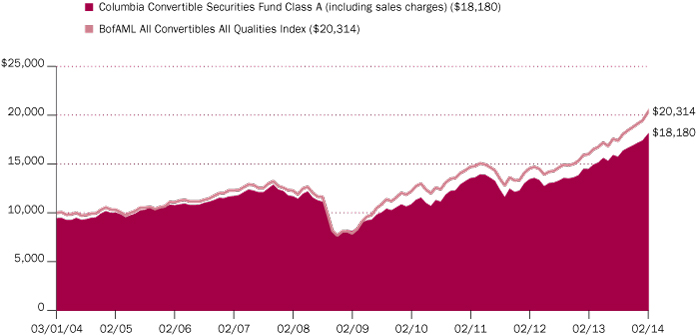
The chart above shows the change in value of a hypothetical $10,000 investment in Class A shares of Columbia Convertible Securities Fund during the stated time period, and does not reflect the deduction of taxes that a shareholder may pay on Fund distributions or on the redemption of Fund shares.
Annual Report 2014
3
Columbia Convertible Securities Fund
Manager Discussion of Fund Performance
For the 12-month period ended February 28, 2014, the Fund's Class A shares returned 25.38% excluding sales charges. The Fund underperformed its benchmark, the Bank of America Merrill Lynch (BofAML) All Convertibles All Qualities Index, which returned 26.79% for the same time period. Health care and technology holdings were positive contributors to returns. A few disappointments among individual holdings detracted from overall results vs. the benchmark.
A Favorable Market Environment
Steady job growth, a solid rebound in the housing market and increased manufacturing activity drove economic growth modestly higher over the 12-month period that ended February 28, 2014. Pent-up demand, low mortgage rates and an improving labor market helped home sales. Foreclosure activity also trended downward. After a brief pullback, manufacturing activity picked up midway through the period and remained strong. Business surveys and recent demand measures suggest to us that that business spending may be poised to pick up.
Even though a host of concerns weighed on investors — the impact of tax increases and enforced federal spending cuts, another showdown over the U.S. debt ceiling, the possibility of an attack on Syria and uncertainty regarding the timing of the Federal Reserve's next move on monetary policy — prices on stocks, convertible securities and other risky assets moved higher as central banks continued to pour liquidity into key markets. Convertible securities benefitted from the strong equity market as well as a healthy increase in new issuance — a largely welcomed event, even though some of the more recent issues have been of lower quality. Furthermore, the underlying equities for the companies represented in the convertibles universe outpaced broader equity markets, ultimately boosting returns for the asset class as a whole. Traditionally growth-oriented sectors, such as health care, information technology and especially, biotechnology, were some of the strongest contributors to gains while traditionally value-oriented sectors, including utilities, financials and consumer staples, were laggards.
Contributors and Detractors
The health care sector was the largest contributor to the Fund's returns, most notably in the biotechnology industry. Gilead Sciences, a leading provider of HIV therapies, benefitted by exceeding expectations and strong revenue growth. FDA approval of the company's promising treatment for Hepatitis C was a significant factor in the stock's sharp climb, on the heels of last year's solid performance. Pharmaceutical companies Mylan Laboratories and Salix Pharmaceuticals also aided results. In the technology sector, Micron Technology convertible logged a triple-digit gain, as the company benefited from a favorable memory environment, operational effectiveness and a pending competitor acquisition. Software companies Salesforce.com and Ciena also aided performance. Within the consumer discretionary sector, Priceline.com and General Motors were positive contributors to return.
Detractors from performance were less sector-specific. A position in Hornbeck Offshore Services, an energy marine transportation and service company, lost ground during the period as the company suffered from concerns about floater rig deliveries and excess supply in the deepwater market. Within biotechnology, Dendreon, which specializes in cancer therapies, declined as it struggled with
Portfolio Management
David King, CFA
Yan Jin
Top Ten Holdings (%)
(at February 28, 2014) | |
Micron Technology, Inc.,
2.125% 02/15/33 | | | 2.6
| | |
Gilead Sciences, Inc.,
1.625% 05/01/16 | | | 2.5
| | |
Bank of America Corp.,
7.250% | | | 2.0
| | |
priceline.com, Inc.,
1.000% 03/15/18 | | | 1.9
| | |
Salesforce.com, Inc.,
0.250% 04/01/18 | | | 1.7
| | |
Cubist Pharmaceuticals, Inc.,
1.875% 09/01/20 | | | 1.5
| | |
Jarden Corp.,
1.875% 09/15/18 | | | 1.5
| | |
Mylan, Inc.,
3.750% 09/15/15 | | | 1.3
| | |
Chesapeake Energy Corp.,
5.750% | | | 1.3
| | |
Intel Corp. | | | 1.2 | | |
Percentages indicated are based upon total investments (excluding Money Market Funds).
For further detail about these holdings, please refer to the section entitled "Portfolio of Investments."
Fund holdings are as of the date given, are subject to change at any time, and are not recommendations to buy or sell any security.
Annual Report 2014
4
Columbia Convertible Securities Fund
Manager Discussion of Fund Performance (continued)
prostrate cancer drug Provenge. Mining company James River Coal stumbled as it dealt with bankruptcy after coal prices declined and the company restructured its convertibles.
Flexible Approach a Plus
Our flexible and holistic approach allowed us to consider and include names across the entire convertible securities marketplace, which included several large equity-sensitive names that were leaders during the period. This flexibility aided performance relative to the benchmark. In addition, our focus on individual security research, rather than macro-driven allocations, aided results as correlations declined across most markets.
Looking Ahead
At this time, we believe that convertible securities remain an attractive option for income investors. We currently expect the pace of new convertibles issuance in the period ahead will exceed that of the past 12 months, and this trend should be welcomed by active managers. Correlations across markets have receded and are presently anticipated to remain low, which we believe may benefit individual security selection. Convertible securities are currently more equity sensitive than they have been historically, and any correction in the broader stock market may weigh on convertibles. In this environment, we currently intend to continue to focus on issue selection and to avoid large sector bets.
Portfolio Breakdown (%)
(at February 28, 2014) | |
Common Stocks | | | 4.9 | | |
Consumer Discretionary | | | 0.7 | | |
Health Care | | | 0.7 | | |
Information Technology | | | 3.5 | | |
Convertible Bonds | | | 72.5 | | |
Convertible Preferred Stocks | | | 19.0 | | |
Consumer Staples | | | 1.7 | | |
Energy | | | 2.3 | | |
Financials | | | 7.2 | | |
Health Care | | | 0.8 | | |
Industrials | | | 2.0 | | |
Telecommunication Services | | | 1.2 | | |
Utilities | | | 3.8 | | |
Money Market Funds | | | 3.6 | | |
Total | | | 100.0 | | |
Percentages indicated are based upon total investments. The Fund's portfolio composition is subject to change.
Investment Risks
Most convertible securities are not investment grade and are therefore more speculative in nature than securities with higher ratings. International investing involves increased risk and volatility due to potential political and economic instability, currency fluctuations, and differences in financial reporting and accounting standards and oversight. Risks are particularly significant in emerging markets. See the Fund's prospectus for information on these and other risks.
Annual Report 2014
5
Columbia Convertible Securities Fund
Understanding Your Fund's Expenses
(Unaudited)
As an investor, you incur two types of costs. There are transaction costs, which generally include sales charges on purchases and may include redemption fees. There are also ongoing costs, which generally include management fees, distribution and/or service fees, and other fund expenses. The following information is intended to help you understand your ongoing costs (in dollars) of investing in the Fund and to help you compare these costs with the ongoing costs of investing in other mutual funds.
Analyzing Your Fund's Expenses
To illustrate these ongoing costs, we have provided examples and calculated the expenses paid by investors in each share class of the Fund during the period. The actual and hypothetical information in the table is based on an initial investment of $1,000 at the beginning of the period indicated and held for the entire period. Expense information is calculated two ways and each method provides you with different information. The amount listed in the "Actual" column is calculated using the Fund's actual operating expenses and total return for the period. You may use the Actual information, together with the amount invested, to estimate the expenses that you paid over the period. Simply divide your account value by $1,000 (for example, an $8,600 account value divided by $1,000 = 8.6), then multiply the results by the expenses paid during the period under the "Actual" column. The amount listed in the "Hypothetical" column assumes a 5% annual rate of return before expenses (which is not the Fund's actual return) and then applies the Fund's actual expense ratio for the period to the hypothetical return. You should not use the hypothetical account values and expenses to estimate either your actual account balance at the end of the period or the expenses you paid during the period. See "Compare With Other Funds" below for details on how to use the hypothetical data.
Compare With Other Funds
Since all mutual funds are required to include the same hypothetical calculations about expenses in shareholder reports, you can use this information to compare the ongoing cost of investing in the Fund with other funds. To do so, compare the hypothetical example with the 5% hypothetical examples that appear in the shareholder reports of other funds. As you compare hypothetical examples of other funds, it is important to note that hypothetical examples are meant to highlight the ongoing costs of investing in a fund only and do not reflect any transaction costs, such as sales charges, or redemption or exchange fees. Therefore, the hypothetical calculations are useful in comparing ongoing costs only, and will not help you determine the relative total costs of owning different funds. If transaction costs were included in these calculations, your costs would be higher.
September 1, 2013 – February 28, 2014
| | Account Value at the Beginning
of the Period ($) | | Account Value at the End of the
Period ($) | | Expenses Paid During the
Period ($) | | Fund's Annualized
Expense Ratio (%) | |
| | Actual | | Hypothetical | | Actual | | Hypothetical | | Actual | | Hypothetical | | Actual | |
Class A | | | 1,000.00 | | | | 1,000.00 | | | | 1,155.10 | | | | 1,019.45 | | | | 5.91 | | | | 5.54 | | | | 1.10 | | |
Class B | | | 1,000.00 | | | | 1,000.00 | | | | 1,150.60 | | | | 1,015.71 | | | | 9.92 | | | | 9.30 | | | | 1.85 | | |
Class C | | | 1,000.00 | | | | 1,000.00 | | | | 1,150.70 | | | | 1,015.71 | | | | 9.92 | | | | 9.30 | | | | 1.85 | | |
Class I | | | 1,000.00 | | | | 1,000.00 | | | | 1,157.80 | | | | 1,021.64 | | | | 3.55 | | | | 3.33 | | | | 0.66 | | |
Class R | | | 1,000.00 | | | | 1,000.00 | | | | 1,154.40 | | | | 1,018.20 | | | | 7.25 | | | | 6.79 | | | | 1.35 | | |
Class R4 | | | 1,000.00 | | | | 1,000.00 | | | | 1,156.50 | | | | 1,020.69 | | | | 4.57 | | | | 4.28 | | | | 0.85 | | |
Class R5 | | | 1,000.00 | | | | 1,000.00 | | | | 1,157.50 | | | | 1,021.39 | | | | 3.82 | | | | 3.58 | | | | 0.71 | | |
Class W | | | 1,000.00 | | | | 1,000.00 | | | | 1,155.30 | | | | 1,019.45 | | | | 5.91 | | | | 5.54 | | | | 1.10 | | |
Class Z | | | 1,000.00 | | | | 1,000.00 | | | | 1,156.90 | | | | 1,020.69 | | | | 4.57 | | | | 4.28 | | | | 0.85 | | |
Expenses paid during the period are equal to the annualized expense ratio for each class as indicated above, multiplied by the average account value over the period and then multiplied by the number of days in the Fund's most recent fiscal half year and divided by 365.
Expenses do not include fees and expenses incurred indirectly by the Fund from the underlying funds in which the Fund may invest (also referred to as "acquired funds"), including affiliated and non-affiliated pooled investment vehicles (including mutual funds and exchange-traded funds).
Had Columbia Management Investment Advisers, LLC and/or certain of its affiliates not waived/reimbursed certain fees and expenses, account value at the end of the period would have been reduced.
Annual Report 2014
6
Columbia Convertible Securities Fund
Portfolio of Investments
February 28, 2014
(Percentages represent value of investments compared to net assets)
Common Stocks 4.9%
Issuer | | Shares | | Value ($) | |
Consumer Discretionary 0.7% | |
Automobiles 0.7% | |
General Motors Co.(a) | | | 200,000 | | | | 7,240,000 | | |
Total Consumer Discretionary | | | | | 7,240,000 | | |
Health Care 0.7% | |
Health Care Providers & Services 0.7% | |
WellPoint, Inc. | | | 72,500 | | | | 6,567,775 | | |
Total Health Care | | | | | 6,567,775 | | |
Information Technology 3.5% | |
Computers & Peripherals 0.5% | |
SanDisk Corp. | | | 65,000 | | | | 4,829,500 | | |
Semiconductors & Semiconductor Equipment 3.0% | |
Intel Corp. | | | 490,000 | | | | 12,132,400 | | |
Microchip Technology, Inc. | | | 180,000 | | | | 8,199,000 | | |
Xilinx, Inc. | | | 190,000 | | | | 9,918,000 | | |
Total | | | | | 30,249,400 | | |
Total Information Technology | | | | | 35,078,900 | | |
Total Common Stocks
(Cost: $46,246,189) | | | | | 48,886,675 | | |
Convertible Preferred Stocks 18.4% | |
Consumer Staples 1.7% | |
Food Products 1.7% | |
Bunge Ltd., 4.875% | | | 92,500 | | | | 9,721,288 | | |
Post Holdings, Inc., 3.750%(b) | | | 58,000 | | | | 7,489,656 | | |
Total | | | | | 17,210,944 | | |
Total Consumer Staples | | | | | 17,210,944 | | |
Energy 1.9% | |
Oil, Gas & Consumable Fuels 1.9% | |
Chesapeake Energy Corp., 5.000% | | | 73,100 | | | | 7,063,287 | | |
Chesapeake Energy Corp., 5.750%(b) | | | 10,880 | | | | 12,151,600 | | |
Total | | | | | 19,214,887 | | |
Total Energy | | | | | 19,214,887 | | |
Convertible Preferred Stocks (continued)
Issuer | | Shares | | Value ($) | |
Financials 7.3% | |
Capital Markets 1.0% | |
AMG Capital Trust II, 5.150% | | | 158,000 | | | | 9,633,071 | | |
Diversified Financial Services 2.0% | |
Bank of America Corp., 7.250% | | | 17,200 | | | | 19,832,288 | | |
Insurance 0.9% | |
MetLife, Inc., 5.000% | | | 320,500 | | | | 9,483,595 | | |
Real Estate Investment Trusts (REITs) 3.4% | |
Alexandria Real Estate Equities, Inc.,
7.000% | | | 363,200 | | | | 9,806,400 | | |
Health Care REIT, Inc., 6.500% | | | 176,300 | | | | 9,872,800 | | |
Weyerhaeuser Co., 6.375% | | | 174,800 | | | | 9,519,608 | | |
iStar Financial, Inc., 4.500% | | | 71,400 | | | | 4,743,673 | | |
Total | | | | | 33,942,481 | | |
Total Financials | | | | | 72,891,435 | | |
Health Care 0.5% | |
Health Care Equipment & Supplies 0.5% | |
Alere, Inc., 3.000% | | | 16,600 | | | | 4,899,490 | | |
Total Health Care | | | | | 4,899,490 | | |
Industrials 2.0% | |
Aerospace & Defense 0.8% | |
United Technologies Corp., 7.500% | | | 111,800 | | | | 7,431,346 | | |
Machinery 0.7% | |
Stanley Black & Decker, Inc., 6.250% | | | 69,200 | | | | 7,397,480 | | |
Road & Rail 0.5% | |
Genesee & Wyoming, Inc., 5.000% | | | 37,750 | | | | 4,977,715 | | |
Total Industrials | | | | | 19,806,541 | | |
Telecommunication Services 1.2% | |
Wireless Telecommunication Services 1.2% | |
Crown Castle International Corp., 4.500% | | | 119,290 | | | | 12,091,712 | | |
Total Telecommunication Services | | | | | 12,091,712 | | |
Utilities 3.8% | |
Electric Utilities 1.9% | |
NextEra Energy, Inc., 5.599% | | | 155,100 | | | | 9,424,574 | | |
PPL Corp., 8.750% | | | 185,300 | | | | 9,817,194 | | |
Total | | | | | 19,241,768 | | |
The accompanying Notes to Financial Statements are an integral part of this statement.
Annual Report 2014
7
Columbia Convertible Securities Fund
Portfolio of Investments (continued)
February 28, 2014
Convertible Preferred Stocks (continued)
Issuer | | Shares | | Value ($) | |
Multi-Utilities 1.9% | |
CenterPoint Energy, Inc., 3.719%(d) | | | 179,200 | | | | 9,620,800 | | |
Dominion Resources, Inc., 6.000% | | | 82,796 | | | | 4,734,275 | | |
Dominion Resources, Inc., 6.125% | | | 82,796 | | | | 4,736,759 | | |
Total | | | | | 19,091,834 | | |
Total Utilities | | | | | 38,333,602 | | |
Total Convertible Preferred Stocks
(Cost: $169,182,416) | | | | | 184,448,611 | | |
Convertible Bonds(e) 72.7%
Issuer | | Coupon
Rate | | Principal
Amount ($) | | Value ($) | |
Aerospace & Defense 1.0% | |
L-3 Communications Holdings, Inc.
08/01/35 | | | 3.000 | % | | | 7,850,000 | | | | 10,229,531 | | |
Airlines 1.5% | |
AirTran Holdings, Inc.
Senior Unsecured
11/01/16 | | | 5.250 | % | | | 4,000,000 | | | | 7,532,500 | | |
United Airlines, Inc.
Senior Unsecured
01/15/15 | | | 4.500 | % | | | 3,115,000 | | | | 7,456,531 | | |
Total | | | | | | | 14,989,031 | | |
Automotive 2.4% | |
Navistar International Corp.
Senior Subordinated Notes(b)
10/15/18 | | | 4.500 | % | | | 7,130,000 | | | | 7,396,234 | | |
Tesla Motors, Inc.
Senior Unsecured(f)
03/01/19 | | | 0.250 | % | | | 9,780,000 | | | | 9,669,975 | | |
Volkswagen International Finance NV(b)
11/09/15 | | | 5.500 | % | | EUR | 4,600,000 | | | | 7,362,108 | | |
Total | | | | | | | 24,428,317 | | |
Brokerage 0.7% | |
Walter Investment Management Corp.
Senior Subordinated Notes
11/01/19 | | | 4.500 | % | | | 8,000,000 | | | | 7,195,000 | | |
Building Materials 1.0% | |
Cemex SAB de CV
Subordinated Notes
03/15/18 | | | 3.750 | % | | | 6,540,000 | | | | 9,589,275 | | |
Convertible Bonds(e) (continued)
Issuer | | Coupon
Rate | | Principal
Amount ($) | | Value ($) | |
Chemicals —% | |
ShengdaTech, Inc.
Senior Notes(b)(g)(h)(i)
12/15/15 | | | 6.500 | % | | | 2,430,000 | | | | 24,300 | | |
Consumer Cyclical Services 0.6% | |
MasTec, Inc.
12/15/14 | | | 4.250 | % | | | 2,110,000 | | | | 5,590,181 | | |
Consumer Products 1.4% | |
Jarden Corp.
09/15/18 | | | 1.875 | % | | | 10,170,000 | | | | 14,498,606 | | |
Electric 1.6% | |
Covanta Holding Corp.
Senior Unsecured
06/01/14 | | | 3.250 | % | | | 3,050,000 | | | | 3,532,281 | | |
NRG Yield, Inc.(b)
02/01/19 | | | 3.500 | % | | | 4,850,000 | | | | 4,894,087 | | |
SunPower Corp.
Senior Unsecured(b)
06/01/18 | | | 0.750 | % | | | 5,040,000 | | | | 7,146,871 | | |
Total | | | | | | | 15,573,239 | | |
Gaming 1.0% | |
MGM Resorts International
04/15/15 | | | 4.250 | % | | | 6,550,000 | | | | 10,095,188 | | |
Health Care 5.0% | |
BioMarin Pharmaceutical, Inc.
Senior Subordinated Notes
10/15/20 | | | 1.500 | % | | | 4,230,000 | | | | 5,076,000 | | |
Brookdale Senior Living, Inc.
Senior Unsecured
06/15/18 | | | 2.750 | % | | | 5,830,000 | | | | 7,852,281 | | |
HeartWare International, Inc.
Senior Unsecured
12/15/17 | | | 3.500 | % | | | 5,740,000 | | | | 7,017,150 | | |
Hologic, Inc.
Senior Unsecured(d)
12/15/37 | | | 2.000 | % | | | 8,450,000 | | | | 9,696,375 | | |
Molina Healthcare, Inc.
Senior Notes(b)
01/15/20 | | | 1.125 | % | | | 5,350,000 | | | | 5,985,259 | | |
Omnicare, Inc.
04/01/42 | | | 3.750 | % | | | 4,520,000 | | | | 6,728,337 | | |
Teleflex, Inc.
Senior Subordinated Notes
08/01/17 | | | 3.875 | % | | | 4,440,000 | | | | 7,520,250 | | |
Total | | | | | | | 49,875,652 | | |
The accompanying Notes to Financial Statements are an integral part of this statement.
Annual Report 2014
8
Columbia Convertible Securities Fund
Portfolio of Investments (continued)
February 28, 2014
Convertible Bonds(e) (continued)
Issuer | | Coupon
Rate | | Principal
Amount ($) | | Value ($) | |
Home Construction 1.0% | |
Meritage Homes Corp.
09/15/32 | | | 1.875 | % | | | 8,820,000 | | | | 9,928,013 | | |
Independent Energy 1.6% | |
Endeavour International Corp.
07/15/16 | | | 5.500 | % | | | 4,990,000 | | | | 3,967,050 | | |
Newpark Resources, Inc.
Senior Unsecured
10/01/17 | | | 4.000 | % | | | 3,840,000 | | | | 4,923,264 | | |
Stone Energy Corp.
03/01/17 | | | 1.750 | % | | | 6,330,000 | | | | 7,326,975 | | |
Total | | | | | | | 16,217,289 | | |
Integrated Energy 1.4% | |
American Energy - Utica LLC PIK(b)
03/01/21 | | | 3.500 | % | | | 4,950,000 | | | | 4,893,570 | | |
GT Advanced Technologies, Inc.
Senior Unsecured
12/15/20 | | | 3.000 | % | | | 6,385,000 | | | | 9,088,090 | | |
Total | | | | | | | 13,981,660 | | |
Media Cable 1.0% | |
Liberty Media Corp.
Senior Unsecured(b)
10/15/23 | | | 1.375 | % | | | 10,165,000 | | | | 9,901,625 | | |
Media Non-Cable 0.5% | |
Liberty Interactive LLC
Senior Unsecured(b)
03/30/43 | | | 0.750 | % | | | 4,090,000 | | | | 5,176,877 | | |
Metals 2.9% | |
Alpha Natural Resources, Inc.
12/31/20 | | | 4.875 | % | | | 5,280,000 | | | | 4,956,600 | | |
Horsehead Holding Corp.
Senior Unsecured
07/01/17 | | | 3.800 | % | | | 2,670,000 | | | | 3,609,840 | | |
Jaguar Mining, Inc.
Senior Unsecured(g)(h)
03/31/16 | | | 5.500 | % | | | 3,500,000 | | | | 175,000 | | |
James River Coal Co.(b)(l)
06/01/18 | | | 10.000 | % | | | 5,352,000 | | | | 802,800 | | |
Molycorp, Inc.
Senior Unsecured
09/01/17 | | | 6.000 | % | | | 4,400,000 | | | | 3,572,800 | | |
Convertible Bonds(e) (continued)
Issuer | | Coupon
Rate | | Principal
Amount ($) | | Value ($) | |
Royal Gold, Inc.
Senior Unsecured
06/15/19 | | | 2.875 | % | | | 6,860,000 | | | | 7,313,583 | | |
United States Steel Corp.
Senior Unsecured
04/01/19 | | | 2.750 | % | | | 7,615,000 | | | | 9,147,519 | | |
Total | | | | | | | 29,578,142 | | |
Non-Captive Consumer 0.4% | |
DFC Global Corp.
Senior Unsecured
04/15/17 | | | 3.250 | % | | | 5,100,000 | | | | 4,093,923 | | |
Non-Captive Diversified 0.8% | |
Air Lease Corp.
Senior Unsecured
12/01/18 | | | 3.875 | % | | | 5,070,000 | | | | 7,620,844 | | |
Oil Field Services 1.7% | |
Cobalt International Energy, Inc.
Senior Unsecured
12/01/19 | | | 2.625 | % | | | 8,000,000 | | | | 7,725,600 | | |
Energy XXI Bermuda Ltd.
Senior Unsecured(b)
12/15/18 | | | 3.000 | % | | | 5,005,000 | | | | 4,817,312 | | |
Vantage Drilling Co.
Senior Unsecured(b)
07/15/43 | | | 5.500 | % | | | 4,592,000 | | | | 4,867,520 | | |
Total | | | | | | | 17,410,432 | | |
Other Financial Institutions 1.9% | |
Ares Capital Corp.
Senior Unsecured(b)
01/15/19 | | | 4.375 | % | | | 9,150,000 | | | | 9,752,711 | | |
Forest City Enterprises, Inc.
Senior Unsecured(b)
08/15/20 | | | 3.625 | % | | | 9,255,000 | | | | 9,738,851 | | |
Total | | | | | | | 19,491,562 | | |
Other Industry 0.5% | |
General Cable Corp.
Subordinated Notes(d)
11/15/29 | | | 5.000 | % | | | 4,260,000 | | | | 4,803,150 | | |
Pharmaceuticals 13.1% | |
Akorn, Inc.
Senior Unsecured
06/01/16 | | | 3.500 | % | | | 1,670,000 | | | | 4,971,381 | | |
The accompanying Notes to Financial Statements are an integral part of this statement.
Annual Report 2014
9
Columbia Convertible Securities Fund
Portfolio of Investments (continued)
February 28, 2014
Convertible Bonds(e) (continued)
Issuer | | Coupon
Rate | | Principal
Amount ($) | | Value ($) | |
Corsicanto Ltd.
01/15/32 | | | 3.500 | % | | | 5,650,000 | | | | 3,817,423 | | |
Cubist Pharmaceuticals, Inc.
Senior Unsecured(b)
09/01/20 | | | 1.875 | % | | | 12,000,000 | | | | 15,031,920 | | |
Dendreon Corp.
Senior Unsecured
01/15/16 | | | 2.875 | % | | | 10,020,000 | | | | 7,314,600 | | |
Gilead Sciences, Inc.
Senior Unsecured
05/01/16 | | | 1.625 | % | | | 6,550,000 | | | | 23,839,969 | | |
Incyte Corp., Ltd.
Senior Unsecured(b)
11/15/20 | | | 1.250 | % | | | 8,350,000 | | | | 12,083,786 | | |
InterMune, Inc.
Senior Unsecured
09/15/18 | | | 2.500 | % | | | 8,040,000 | | | | 9,798,750 | | |
Medicines Co. (The)
Senior Unsecured
06/01/17 | | | 1.375 | % | | | 4,580,000 | | | | 5,879,575 | | |
Mylan, Inc.
09/15/15 | | | 3.750 | % | | | 3,060,000 | | | | 12,785,063 | | |
PDL BioPharma, Inc
Senior Unsecured
02/01/18 | | | 4.000 | % | | | 9,310,000 | | | | 9,571,844 | | |
Pacira Pharmaceuticals, Inc.
Senior Unsecured
02/01/19 | | | 3.250 | % | | | 1,610,000 | | | | 5,116,451 | | |
Regeneron Pharmaceuticals, Inc.
Senior Unsecured
10/01/16 | | | 1.875 | % | | | 1,930,000 | | | | 7,642,626 | | |
Salix Pharmaceuticals Ltd.
Senior Notes
03/15/19 | | | 1.500 | % | | | 5,760,000 | | | | 10,184,400 | | |
Theravance, Inc.
Subordinated Notes
01/15/23 | | | 2.125 | % | | | 2,620,000 | | | | 3,894,997 | | |
Total | | | | | | | 131,932,785 | | |
Property & Casualty 0.9% | |
Radian Group, Inc.
Senior Unsecured
03/01/19 | | | 2.250 | % | | | 6,030,000 | | | | 9,455,794 | | |
Railroads 0.8% | |
Greenbrier Companies, Inc. (The)
Senior Unsecured
04/01/18 | | | 3.500 | % | | | 5,650,000 | | | | 7,645,156 | | |
Convertible Bonds(e) (continued)
Issuer | | Coupon
Rate | | Principal
Amount ($) | | Value ($) | |
Refining 0.6% | |
Clean Energy Fuels Corp.
Senior Unsecured(b)
10/01/18 | | | 5.250 | % | | | 6,210,000 | | | | 5,523,273 | | |
REITs 2.3% | |
American Residential Properties LP(b)
11/15/18 | | | 3.250 | % | | | 4,527,000 | | | | 4,836,466 | | |
Blackstone Mortgage Trust, Inc.
Senior Unsecured
12/01/18 | | | 5.250 | % | | | 7,430,000 | | | | 8,217,283 | | |
Starwood Property Trust, Inc.
Senior Unsecured
01/15/19 | | | 4.000 | % | | | 8,330,000 | | | | 9,569,087 | | |
Total | | | | | | | 22,622,836 | | |
Retailers 1.9% | |
priceline.com, Inc.
Senior Unsecured
03/15/18 | | | 1.000 | % | | | 12,160,000 | | | | 18,718,800 | | |
Technology 19.6% | |
Akamai Technologies, Inc.
Senior Unsecured(b)(c)
02/15/19 | | | 0.000 | % | | | 6,829,000 | | | | 6,914,363 | | |
Bottomline Technologies de, Inc.
Senior Unsecured
12/01/17 | | | 1.500 | % | | | 3,670,000 | | | | 4,873,613 | | |
Cardtronics, Inc.
Senior Unsecured(b)
12/01/20 | | | 1.000 | % | | | 5,950,000 | | | | 5,886,781 | | |
Ciena Corp.
Senior Unsecured(b)
10/15/18 | | | 3.750 | % | | | 6,290,000 | | | | 9,282,530 | | |
Concur Technologies, Inc.
Senior Unsecured(b)
06/15/18 | | | 0.500 | % | | | 5,418,000 | | | | 7,200,251 | | |
Cornerstone OnDemand, Inc.
Senior Unsecured(b)
07/01/18 | | | 1.500 | % | | | 3,720,000 | | | | 4,802,483 | | |
Ctrip.com International Ltd.
Senior Unsecured(b)
10/15/18 | | | 1.250 | % | | | 4,890,000 | | | | 5,003,081 | | |
Equinix, Inc.
Subordinated Notes
06/15/16 | | | 4.750 | % | | | 3,055,000 | | | | 7,099,056 | | |
Finisar Corp.
Senior Unsecured(b)
12/15/33 | | | 0.500 | % | | | 4,441,000 | | | | 4,802,675 | | |
The accompanying Notes to Financial Statements are an integral part of this statement.
Annual Report 2014
10
Columbia Convertible Securities Fund
Portfolio of Investments (continued)
February 28, 2014
Convertible Bonds(e) (continued)
Issuer | | Coupon
Rate | | Principal
Amount ($) | | Value ($) | |
Ixia
Senior Notes
12/15/15 | | | 3.000 | % | | | 4,600,000 | | | | 4,795,500 | | |
Mentor Graphics Corp.
04/01/31 | | | 4.000 | % | | | 5,970,000 | | | | 7,417,725 | | |
Micron Technology, Inc.
Senior Unsecured
02/15/33 | | | 2.125 | % | | | 11,200,000 | | | | 25,459,000 | | |
NQ Mobile, Inc.
Senior Unsecured(b)
10/15/18 | | | 4.000 | % | | | 3,845,000 | | | | 3,498,950 | | |
Novellus Systems, Inc.
05/15/41 | | | 2.625 | % | | | 5,970,000 | | | | 9,685,131 | | |
Nuance Communications, Inc.
Senior Unsecured
11/01/31 | | | 2.750 | % | | | 9,740,000 | | | | 9,654,775 | | |
Powerwave Technologies, Inc.
Subordinated Notes(h)
10/01/27 | | | 3.875 | % | | | 1,900,000 | | | | 190 | | |
Proofpoint, Inc.
Senior Unsecured(b)
12/15/18 | | | 1.250 | % | | | 3,947,000 | | | | 4,960,827 | | |
Rambus, Inc.
Senior Unsecured(b)
08/15/18 | | | 1.125 | % | | | 5,590,000 | | | | 5,826,178 | | |
Salesforce.com, Inc.
Senior Unsecured
01/15/15 | | | 0.750 | % | | | 1,730,000 | | | | 5,044,031 | | |
Salesforce.com, Inc.(b)
Senior Unsecured
04/01/18 | | | 0.250 | % | | | 14,220,000 | | | | 16,806,263 | | |
SanDisk Corp.
Senior Unsecured
08/15/17 | | | 1.500 | % | | | 4,720,000 | | | | 7,212,750 | | |
ServiceNow, Inc.
Senior Unsecured(b)(c)
11/01/18 | | | 0.000 | % | | �� | 4,255,000 | | | | 4,906,547 | | |
Shutterfly, Inc.
Senior Unsecured(b)
05/15/18 | | | 0.250 | % | | | 4,655,000 | | | | 5,144,706 | | |
SunEdison, Inc.
Senior Unsecured(b)
01/01/21 | | | 2.750 | % | | | 7,600,000 | | | | 11,078,900 | | |
Take-Two Interactive Software, Inc.
Senior Unsecured
07/01/18 | | | 1.000 | % | | | 6,195,000 | | | | 7,143,609 | | |
TiVo, Inc.
Senior Unsecured(b)
03/15/16 | | | 4.000 | % | | | 5,430,000 | | | | 7,422,131 | | |
Convertible Bonds(e) (continued)
Issuer | | Coupon
Rate | | Principal
Amount ($) | | Value ($) | |
Workday, Inc.
Senior Unsecured(b)
07/15/20 | | | 1.500 | % | | | 3,580,000 | | | | 5,328,937 | | |
Total | | | | | | | 197,250,983 | | |
Textile 0.7% | |
Iconix Brand Group, Inc.
Senior Subordinated Notes(b)
03/15/18 | | | 1.500 | % | | | 5,367,000 | | | | 7,489,326 | | |
Tobacco 0.7% | |
Vector Group Ltd.
Senior Unsecured(d)
01/15/19 | | | 2.500 | % | | | 5,800,000 | | | | 7,403,584 | | |
Transportation Services 1.5% | |
DryShips, Inc.
Senior Unsecured
12/01/14 | | | 5.000 | % | | | 4,890,000 | | | | 4,831,931 | | |
Wabash National Corp.
Senior Unsecured
05/01/18 | | | 3.375 | % | | | 3,520,000 | | | | 4,884,000 | | |
XPO Logistics, Inc.
Senior Unsecured
10/01/17 | | | 4.500 | % | | | 2,710,000 | | | | 5,366,938 | | |
Total | | | | | | | 15,082,869 | | |
Wireless 0.7% | |
SBA Communications Corp.
Senior Unsecured
10/01/14 | | | 4.000 | % | | | 2,275,000 | | | | 7,102,266 | | |
Total Convertible Bonds
(Cost: $634,002,654) | | | | | | | 730,519,509 | | |
Equity-Linked Notes 0.7%
| Issuer | | Coupon
Rate | | Shares | | Value ($) | |
Deutsche Bank AG(b)(c)
Senior Unsecured (linked to
common stock of Hornbeck
Offshore Services, Inc.)
12/03/14 | | | 0.000 | % | | | 91,750 | | | | 4,116,364 | | |
Goldman Sachs Group, Inc. (The)(b)
Senior Unsecured (linked to
common stock of Vertex
Pharmaceuticals, Inc.)
08/27/14 | | | 0.500 | % | | | 41,250 | | | | 3,223,288 | | |
Total Equity-Linked Notes
(Cost: $8,005,992) | | | | | | | 7,339,652 | | |
The accompanying Notes to Financial Statements are an integral part of this statement.
Annual Report 2014
11
Columbia Convertible Securities Fund
Portfolio of Investments (continued)
February 28, 2014
Money Market Funds 3.6%
| | | Shares | | Value ($) | |
Columbia Short-Term Cash Fund,
0.098%(j)(k) | | | 36,240,405 | | | | 36,240,405 | | |
Total Money Market Funds
(Cost: $36,240,405) | | | | | 36,240,405 | | |
Total Investments
(Cost: $893,677,656) | | | | | 1,007,434,852 | | |
Other Assets & Liabilities, Net | | | | | (2,623,943 | ) | |
Net Assets | | | | | 1,004,810,909 | | |
Notes to Portfolio of Investments
(a) Non-income producing.
(b) Security exempt from registration pursuant to Rule 144A under the Securities Act of 1933. This security may be resold in transactions exempt from registration, normally to qualified institutional buyers. At February 28, 2014, the value of these securities amounted to $263,571,407 or 26.23% of net assets.
(c) Zero coupon bond.
(d) Variable rate security.
(e) Principal amounts are denominated in United States Dollars unless otherwise noted.
(f) Represents a security purchased on a when-issued or delayed delivery basis.
(g) Identifies issues considered by the Investment Manager to be illiquid as to their marketability. The aggregate value of such securities at February 28, 2014 was $199,300, representing 0.02% of net assets. Information concerning such security holdings at February 28, 2014 is as follows:
Security Description | | Acquisition Dates | | Cost ($) | |
ShengdaTech, Inc.
Senior Notes
12/15/15 6.5000% | | 12/10/10 - 12/21/10 | | | 2,434,408 | | |
Jaquar Mining, Inc.
Senior Unsecured
03/31/16 5.500% | | 02/04/11 - 04/17/12 | | | 3,549,162 | | |
(h) Represents securities that have defaulted on payment of interest. The Fund has stopped accruing interest on these securities. At February 28, 2014, the value of these securities amounted to $199,490, which represents 0.02% of net assets.
(i) Represents fair value as determined in good faith under procedures approved by the Board of Trustees. At February 28, 2014, the value of these securities amounted to $24,300, which represents less than 0.01% of net assets.
(j) The rate shown is the seven-day current annualized yield at February 28, 2014.
(k) As defined in the Investment Company Act of 1940, an affiliated company is one in which the Fund owns 5% or more of its outstanding voting securities, or a company which is under common ownership or control with the Fund. Holdings and transactions in these affiliated companies during the year ended February 28, 2014, are as follows:
Issuer | | Beginning
Cost ($) | | Purchase
Cost ($) | | Proceeds
From Sales ($) | | Ending
Cost ($) | | Dividends —
Affiliated
Issuers ($) | | Value ($) | |
Columbia Short-Term Cash Fund | | | 7,891,361 | | | | 501,056,460 | | | | (472,707,416 | ) | | | 36,240,405 | | | | 19,613 | | | | 36,240,405 | | |
(l) Subsequent to February 28, 2014, security defaulted on payment of interest. The fund stopped accruing interest and wrote off any accrued balance in April 2014.
The accompanying Notes to Financial Statements are an integral part of this statement.
Annual Report 2014
12
Columbia Convertible Securities Fund
Portfolio of Investments (continued)
February 28, 2014
Abbreviation Legend
PIK Payment-in-Kind
Currency Legend
EUR Euro
Fair Value Measurements
Generally accepted accounting principles (GAAP) require disclosure regarding the inputs and valuation techniques used to measure fair value and any changes in valuation inputs or techniques. In addition, investments shall be disclosed by major category.
The Fund categorizes its fair value measurements according to a three-level hierarchy that maximizes the use of observable inputs and minimizes the use of unobservable inputs by prioritizing that the most observable input be used when available. Observable inputs are those that market participants would use in pricing an investment based on market data obtained from sources independent of the reporting entity. Unobservable inputs are those that reflect the Fund's assumptions about the information market participants would use in pricing an investment. An investment's level within the fair value hierarchy is based on the lowest level of any input that is deemed significant to the asset or liability's fair value measurement. The input levels are not necessarily an indication of the risk or liquidity associated with investments at that level. For example, certain U.S. government securities are generally high quality and liquid, however, they are reflected as Level 2 because the inputs used to determine fair value may not always be quoted prices in an active market.
Fair value inputs are summarized in the three broad levels listed below:
> Level 1 — Valuations based on quoted prices for investments in active markets that the Fund has the ability to access at the measurement date (including NAV for open-end mutual funds). Valuation adjustments are not applied to Level 1 investments.
> Level 2 — Valuations based on other significant observable inputs (including quoted prices for similar securities, interest rates, prepayment speeds, credit risks, etc.).
> Level 3 — Valuations based on significant unobservable inputs (including the Fund's own assumptions and judgment in determining the fair value of investments).
Inputs that are used in determining fair value of an investment may include price information, credit data, volatility statistics, and other factors. These inputs can be either observable or unobservable. The availability of observable inputs can vary between investments, and is affected by various factors such as the type of investment, and the volume and level of activity for that investment or similar investments in the marketplace. The inputs will be considered by the Investment Manager, along with any other relevant factors in the calculation of an investment's fair value. The Fund uses prices and inputs that are current as of the measurement date, which may include periods of market dislocations. During these periods, the availability of prices and inputs may be reduced for many investments. This condition could cause an investment to be reclassified between the various levels within the hierarchy.
Investments falling into the Level 3 category are primarily supported by quoted prices from brokers and dealers participating in the market for those investments. However, these may be classified as Level 3 investments due to lack of market transparency and corroboration to support these quoted prices. Additionally, valuation models may be used as the pricing source for any remaining investments classified as Level 3. These models may rely on one or more significant unobservable inputs and/or significant assumptions by the Investment Manager. Inputs used in valuations may include, but are not limited to, financial statement analysis, capital account balances, discount rates and estimated cash flows, and comparable company data.
Under the direction of the Fund's Board of Trustees (the Board), the Investment Manager's Valuation Committee (the Committee) is responsible for overseeing the valuation procedures approved by the Board. The Committee consists of voting and non-voting members from various groups within the Investment Manager's organization, including operations and accounting, trading and investments, compliance, risk management and legal.
The Committee meets at least monthly to review and approve valuation matters, which may include a description of specific valuation determinations, data regarding pricing information received from approved pricing vendors and brokers and the results of Board-approved valuation control policies and procedures (the Policies). The Policies address, among other things, instances when market quotations are or are not readily available, including recommendations of third party pricing vendors and a determination of appropriate pricing methodologies; events that require specific valuation determinations and assessment of fair value techniques; securities with a potential for stale pricing, including those that are illiquid, restricted, or in default; and the effectiveness of third party pricing vendors, including periodic reviews of vendors. The Committee meets more frequently, as needed, to discuss additional valuation matters, which may include the need to review back-testing results, review time-sensitive information or approve related valuation actions. The Committee reports to the Board, with members of the Committee meeting with the Board at each of its regularly scheduled meetings to discuss valuation matters and actions during the period, similar to those described earlier.
For investments categorized as Level 3, the Committee monitors information similar to that described above, which may include: (i) data specific to the issuer or comparable issuers, (ii) general market or specific sector news and (iii) quoted prices and specific or similar security transactions. The Committee considers this data and any changes from prior periods in order to assess the reasonableness of observable and unobservable inputs, any assumptions or internal models used to value those securities and changes in fair value. This data is also used to corroborate, when available, information received from approved pricing vendors and brokers. Various factors impact the frequency of
The accompanying Notes to Financial Statements are an integral part of this statement.
Annual Report 2014
13
Columbia Convertible Securities Fund
Portfolio of Investments (continued)
February 28, 2014
monitoring this information (which may occur as often as daily). However, the Committee may determine that changes to inputs, assumptions and models are not required as a result of the monitoring procedures performed.
Fair Value Measurements (continued)
The following table is a summary of the inputs used to value the Fund's investments at February 28, 2014:
Description | | Level 1
Quoted Prices in Active
Markets for Identical
Assets ($) | | Level 2
Other Significant
Observable Inputs ($) | | Level 3
Significant
Unobservable Inputs ($) | | Total ($) | |
Equity Securities | |
Common Stocks | |
Consumer Discretionary | | | 7,240,000 | | | | — | | | | — | | | | 7,240,000 | | |
Health Care | | | 6,567,775 | | | | — | | | | — | | | | 6,567,775 | | |
Information Technology | | | 35,078,900 | | | | — | | | | — | | | | 35,078,900 | | |
Convertible Preferred Stocks | |
Consumer Staples | | | — | | | | 17,210,944 | | | | — | | | | 17,210,944 | | |
Energy | | | — | | | | 23,331,251 | | | | — | | | | 23,331,251 | | |
Financials | | | 48,708,291 | | | | 24,183,144 | | | | — | | | | 72,891,435 | | |
Health Care | | | 4,899,490 | | | | 3,223,288 | | | | — | | | | 8,122,778 | | |
Industrials | | | 19,806,541 | | | | — | | | | — | | | | 19,806,541 | | |
Telecommunication Services | | | — | | | | 12,091,712 | | | | — | | | | 12,091,712 | | |
Utilities | | | 19,288,228 | | | | 19,045,374 | | | | — | | | | 38,333,602 | | |
Total Equity Securities | | | 141,589,225 | | | | 99,085,713 | | | | — | | | | 240,674,938 | | |
Bonds | |
Convertible Bonds | |
Chemicals | | | — | | | | — | | | | 24,300 | | | | 24,300 | | |
All other industries | | | — | | | | 730,495,209 | | | | — | | | | 730,495,209 | | |
Total Bonds | | | — | | | | 730,495,209 | | | | 24,300 | | | | 730,519,509 | | |
Mutual Funds | |
Money Market Funds | | | 36,240,405 | | | | — | | | | — | | | | 36,240,405 | | |
Total Mutual Funds | | | 36,240,405 | | | | — | | | | — | | | | 36,240,405 | | |
Total | | | 177,829,630 | | | | 829,580,922 | | | | 24,300 | | | | 1,007,434,852 | | |
See the Portfolio of Investments for all investment classifications not indicated in the table.
The Fund's assets assigned to the Level 2 input category are generally valued using the market approach, in which a security's value is determined through reference to prices and information from market transactions for similar or identical assets.
There were no transfers of financial assets between levels during the period.
The Fund does not hold any significant investments with unobservable inputs which are categorized as Level 3.
The Fund's assets assigned to the Level 3 category are valued utilizing the valuation technique deemed the most appropriate in the circumstances. Certain convertible bonds classified as Level 3 are valued using a market approach. To determine fair value for these securities, management considered various factors which may have included, but were not limited to, the halt price of the security, the movement in observed market prices for other securities from the issuer, the movement in certain foreign or domestic market indices, and the estimated earnings of the respective company and market multiples derived from a set of comparable companies. Significant increases (decreases) to any of these inputs would result in a significantly lower (higher) fair value measurement. Generally, a change in estimated earnings of the respective company may result in a change to the comparable companies and market multiples utilized.
Transfers in and/or out of Level 3 are determined based on the fair value at the beginning of the period for security positions held throughout the period.
The accompanying Notes to Financial Statements are an integral part of this statement.
Annual Report 2014
14
Columbia Convertible Securities Fund
Statement of Assets and Liabilities
February 28, 2014
Assets | |
Investments, at value | |
Unaffiliated issuers (identified cost $857,437,251) | | $ | 971,194,447 | | |
Affiliated issuers (identified cost $36,240,405) | | | 36,240,405 | | |
Total investments (identified cost $893,677,656) | | | 1,007,434,852 | | |
Restricted cash | | | 645,348 | | |
Receivable for: | |
Investments sold | | | 3,884,560 | | |
Capital shares sold | | | 2,823,182 | | |
Dividends | | | 392,150 | | |
Interest | | | 4,375,858 | | |
Reclaims | | | 9,075 | | |
Expense reimbursement due from Investment Manager | | | 4,735 | | |
Prepaid expenses | | | 1,690 | | |
Total assets | | | 1,019,571,450 | | |
Liabilities | |
Payable for: | |
Investments purchased | | | 4,005,469 | | |
Investments purchased on a delayed delivery basis | | | 9,780,000 | | |
Capital shares purchased | | | 674,076 | | |
Investment management fees | | | 20,180 | | |
Distribution and/or service fees | | | 3,291 | | |
Transfer agent fees | | | 117,452 | | |
Administration fees | | | 1,573 | | |
Compensation of board members | | | 104,444 | | |
Other expenses | | | 54,056 | | |
Total liabilities | | | 14,760,541 | | |
Net assets applicable to outstanding capital stock | | $ | 1,004,810,909 | | |
Represented by | |
Paid-in capital | | $ | 879,745,143 | | |
Undistributed net investment income | | | 2,090,211 | | |
Accumulated net realized gain | | | 9,213,603 | | |
Unrealized appreciation (depreciation) on: | |
Investments | | | 113,757,196 | | |
Foreign currency translations | | | 4,756 | | |
Total — representing net assets applicable to outstanding capital stock | | $ | 1,004,810,909 | | |
The accompanying Notes to Financial Statements are an integral part of this statement.
Annual Report 2014
15
Columbia Convertible Securities Fund
Statement of Assets and Liabilities (continued)
February 28, 2014
Class A | |
Net assets | | $ | 323,621,639 | | |
Shares outstanding | | | 16,835,389 | | |
Net asset value per share | | $ | 19.22 | | |
Maximum offering price per share(a) | | $ | 20.39 | | |
Class B | |
Net assets | | $ | 910,653 | | |
Shares outstanding | | | 48,276 | | |
Net asset value per share | | $ | 18.86 | | |
Class C | |
Net assets | | $ | 32,249,678 | | |
Shares outstanding | | | 1,683,008 | | |
Net asset value per share | | $ | 19.16 | | |
Class I | |
Net assets | | $ | 150,493,967 | | |
Shares outstanding | | | 7,807,931 | | |
Net asset value per share | | $ | 19.27 | | |
Class R | |
Net assets | | $ | 2,423,150 | | |
Shares outstanding | | | 126,167 | | |
Net asset value per share | | $ | 19.21 | | |
Class R4 | |
Net assets | | $ | 685,025 | | |
Shares outstanding | | | 35,358 | | |
Net asset value per share | | $ | 19.37 | | |
Class R5 | |
Net assets | | $ | 946,116 | | |
Shares outstanding | | | 48,846 | | |
Net asset value per share | | $ | 19.37 | | |
Class W | |
Net assets | | $ | 28,152,707 | | |
Shares outstanding | | | 1,466,647 | | |
Net asset value per share | | $ | 19.20 | | |
Class Z | |
Net assets | | $ | 465,327,974 | | |
Shares outstanding | | | 24,174,042 | | |
Net asset value per share | | $ | 19.25 | | |
(a) The maximum offering price per share is calculated by dividing the net asset value per share by 1.0 minus the maximum sales charge of 5.75%.
The accompanying Notes to Financial Statements are an integral part of this statement.
Annual Report 2014
16
Columbia Convertible Securities Fund
Statement of Operations
Year Ended February 28, 2014
Net investment income | |
Income: | |
Dividends — unaffiliated issuers | | $ | 7,267,814 | | |
Dividends — affiliated issuers | | | 19,613 | | |
Interest | | | 12,973,915 | | |
Foreign taxes withheld | | | (7,874 | ) | |
Total income | | | 20,253,468 | | |
Expenses: | |
Investment management fees | | | 4,920,665 | | |
Distribution and/or service fees | |
Class A | | | 633,451 | | |
Class B | | | 10,175 | | |
Class C | | | 221,110 | | |
Class R | | | 10,961 | | |
Class W | | | 69,467 | | |
Transfer agent fees | |
Class A | | | 627,203 | | |
Class B | | | 2,525 | | |
Class C | | | 54,627 | | |
Class R | | | 5,431 | | |
Class R4 | | | 347 | | |
Class R5 | | | 231 | | |
Class W | | | 68,900 | | |
Class Z | | | 425,301 | | |
Administration fees | | | 386,205 | | |
Compensation of board members | | | 36,774 | | |
Custodian fees | | | 7,462 | | |
Printing and postage fees | | | 83,306 | | |
Registration fees | | | 78,918 | | |
Professional fees | | | 35,504 | | |
Other | | | 42,825 | | |
Total expenses | | | 7,721,388 | | |
Fees waived or expenses reimbursed by Investment Manager and its affiliates | | | (1,386,820 | ) | |
Expense reductions | | | (1,710 | ) | |
Total net expenses | | | 6,332,858 | | |
Net investment income | | | 13,920,610 | | |
Realized and unrealized gain (loss) — net | |
Net realized gain (loss) on: | |
Investments | | | 56,068,614 | | |
Foreign currency translations | | | 11,020 | | |
Net realized gain | | | 56,079,634 | | |
Net change in unrealized appreciation (depreciation) on: | |
Investments | | | 85,520,132 | | |
Foreign currency translations | | | 4,756 | | |
Net change in unrealized appreciation (depreciation) | | | 85,524,888 | | |
Net realized and unrealized gain | | | 141,604,522 | | |
Net increase in net assets resulting from operations | | $ | 155,525,132 | | |
The accompanying Notes to Financial Statements are an integral part of this statement.
Annual Report 2014
17
Columbia Convertible Securities Fund
Statement of Changes in Net Assets
| | | Year Ended
February 28,
2014 | | Year Ended
February 28,
2013(a) | |
Operations | |
Net investment income | | $ | 13,920,610 | | | $ | 15,821,784 | | |
Net realized gain | | | 56,079,634 | | | | 13,379,194 | | |
Net change in unrealized appreciation (depreciation) | | | 85,524,888 | | | | 10,548,141 | | |
Net increase in net assets resulting from operations | | | 155,525,132 | | | | 39,749,119 | | |
Distributions to shareholders | |
Net investment income | |
Class A | | | (5,470,325 | ) | | | (5,824,316 | ) | |
Class B | | | (15,796 | ) | | | (48,373 | ) | |
Class C | | | (322,779 | ) | | | (426,422 | ) | |
Class I | | | (4,677,311 | ) | | | (5,875,875 | ) | |
Class R | | | (42,946 | ) | | | (55,704 | ) | |
Class R4 | | | (2,650 | ) | | | (22 | ) | |
Class R5 | | | (10,061 | ) | | | (23 | ) | |
Class W | | | (617,803 | ) | | | (748,268 | ) | |
Class Z | | | (3,403,510 | ) | | | (4,072,063 | ) | |
Total distributions to shareholders | | | (14,563,181 | ) | | | (17,051,066 | ) | |
Increase (decrease) in net assets from capital stock activity | | | 302,826,446 | | | | (31,063,283 | ) | |
Total increase (decrease) in net assets | | | 443,788,397 | | | | (8,365,230 | ) | |
Net assets at beginning of year | | | 561,022,512 | | | | 569,387,742 | | |
Net assets at end of year | | $ | 1,004,810,909 | | | $ | 561,022,512 | | |
Undistributed net investment income | | $ | 2,090,211 | | | $ | 2,089,221 | | |
(a) Class R4 and Class R5 Shares are for the period from November 8, 2012 (commencement of operations) to February 28, 2013.
The accompanying Notes to Financial Statements are an integral part of this statement.
Annual Report 2014
18
Columbia Convertible Securities Fund
Statement of Changes in Net Assets (continued)
| | | Year Ended February 28, 2014 | | Year Ended February 28, 2013(a) | |
| | | Shares | | Dollars ($) | | Shares | | Dollars ($) | |
Capital stock activity | |
Class A shares | |
Subscriptions(b) | | | 8,793,410 | | | | 154,082,393 | | | | 2,978,867 | | | | 45,049,079 | | |
Distributions reinvested | | | 183,612 | | | | 3,118,888 | | | | 182,375 | | | | 2,677,479 | | |
Redemptions | | | (5,676,984 | ) | | | (97,837,010 | ) | | | (2,882,841 | ) | | | (42,782,310 | ) | |
Net increase | | | 3,300,038 | | | | 59,364,271 | | | | 278,401 | | | | 4,944,248 | | |
Class B shares | |
Subscriptions | | | 5,964 | | | | 103,519 | | | | 9,141 | | | | 138,620 | | |
Distributions reinvested | | | 597 | | | | 9,894 | | | | 1,563 | | | | 22,517 | | |
Redemptions(b) | | | (45,001 | ) | | | (743,165 | ) | | | (134,684 | ) | | | (1,961,789 | ) | |
Net decrease | | | (38,440 | ) | | | (629,752 | ) | | | (123,980 | ) | | | (1,800,652 | ) | |
Class C shares | |
Subscriptions | | | 738,084 | | | | 13,076,747 | | | | 124,220 | | | | 1,848,364 | | |
Distributions reinvested | | | 10,144 | | | | 172,583 | | | | 13,916 | | | | 203,668 | | |
Redemptions | | | (192,142 | ) | | | (3,305,414 | ) | | | (357,837 | ) | | | (5,295,639 | ) | |
Net increase (decrease) | | | 556,086 | | | | 9,943,916 | | | | (219,701 | ) | | | (3,243,607 | ) | |
Class I shares | |
Subscriptions | | | 179,769 | | | | 3,030,442 | | | | 638,685 | | | | 9,415,136 | | |
Distributions reinvested | | | 277,612 | | | | 4,677,228 | | | | 399,546 | | | | 5,875,783 | | |
Redemptions | | | (4,123,467 | ) | | | (72,667,287 | ) | | | (1,957,488 | ) | | | (28,708,271 | ) | |
Net decrease | | | (3,666,086 | ) | | | (64,959,617 | ) | | | (919,257 | ) | | | (13,417,352 | ) | |
Class R shares | |
Subscriptions | | | 37,934 | | | | 652,380 | | | | 34,136 | | | | 502,970 | | |
Distributions reinvested | | | 584 | | | | 9,876 | | | | 828 | | | | 12,150 | | |
Redemptions | | | (33,220 | ) | | | (581,876 | ) | | | (52,085 | ) | | | (772,004 | ) | |
Net increase (decrease) | | | 5,298 | | | | 80,380 | | | | (17,121 | ) | | | (256,884 | ) | |
Class R4 shares | |
Subscriptions | | | 35,060 | | | | 642,022 | | | | 169 | | | | 2,500 | | |
Distributions reinvested | | | 145 | | | | 2,578 | | | | — | | | | — | | |
Redemptions | | | (16 | ) | | | (300 | ) | | | — | | | | — | | |
Net increase | | | 35,189 | | | | 644,300 | | | | 169 | | | | 2,500 | | |
Class R5 shares | |
Subscriptions | | | 55,914 | | | | 979,220 | | | | 169 | | | | 2,500 | | |
Distributions reinvested | | | 561 | | | | 9,985 | | | | — | | | | — | | |
Redemptions | | | (7,798 | ) | | | (139,816 | ) | | | — | | | | — | | |
Net increase | | | 48,677 | | | | 849,389 | | | | 169 | | | | 2,500 | | |
The accompanying Notes to Financial Statements are an integral part of this statement.
Annual Report 2014
19
Columbia Convertible Securities Fund
Statement of Changes in Net Assets (continued)
| | | Year Ended February 28, 2014 | | Year Ended February 28, 2013 | |
| | | Shares | | Dollars ($) | | Shares | | Dollars ($) | |
Capital stock activity (continued) | |
Class W shares | |
Subscriptions | | | 497,760 | | | | 8,597,156 | | | | 704,883 | | | | 10,370,297 | | |
Distributions reinvested | | | 36,682 | | | | 617,733 | | | | 50,873 | | | | 748,185 | | |
Redemptions | | | (768,943 | ) | | | (13,391,118 | ) | | | (978,875 | ) | | | (14,393,032 | ) | |
Net decrease | | | (234,501 | ) | | | (4,176,229 | ) | | | (223,119 | ) | | | (3,274,550 | ) | |
Class Z shares | |
Subscriptions | | | 19,068,281 | | | | 346,642,971 | | | | 3,470,807 | | | | 51,631,561 | | |
Distributions reinvested | | | 70,743 | | | | 1,203,526 | | | | 86,361 | | | | 1,266,808 | | |
Redemptions | | | (2,664,182 | ) | | | (46,136,709 | ) | | | (4,543,771 | ) | | | (66,917,855 | ) | |
Net increase (decrease) | | | 16,474,842 | | | | 301,709,788 | | | | (986,603 | ) | | | (14,019,486 | ) | |
Total net increase (decrease) | | | 16,481,103 | | | | 302,826,446 | | | | (2,211,042 | ) | | | (31,063,283 | ) | |
(a) Class R4 and Class R5 are for the period from November 8, 2012 (commencement of operations) to February 28, 2013.
(b) Includes conversions of Class B shares to Class A shares, if any.
The accompanying Notes to Financial Statements are an integral part of this statement.
Annual Report 2014
20
Columbia Convertible Securities Fund
The following tables are intended to help you understand the Fund's financial performance. Certain information reflects financial results for a single share of a class held for the periods shown. Per share net investment income (loss) amounts are calculated based on average shares outstanding during the period. Total return assumes reinvestment of all dividends and distributions, if any. Total return does not reflect payment of sales charges, if any, and is not annualized for periods of less than one year.
| | | | | Year Ended | | | |
| | | Year Ended February 28, | | February 29, | | Year Ended February 28, | |
Class A | | 2014 | | 2013 | | 2012 | | 2011 | | 2010 | |
Per share data | |
Net asset value, beginning of period | | $ | 15.68 | | | $ | 14.99 | | | $ | 15.55 | | | $ | 12.92 | | | $ | 9.93 | | |
Income from investment operations: | |
Net investment income | | | 0.34 | | | | 0.41 | | | | 0.42 | | | | 0.45 | | | | 0.34 | | |
Net realized and unrealized gain (loss) | | | 3.58 | | | | 0.73 | | | | (0.56 | ) | | | 2.67 | | | | 2.99 | | |
Total from investment operations | | | 3.92 | | | | 1.14 | | | | (0.14 | ) | | | 3.12 | | | | 3.33 | | |
Less distributions to shareholders: | |
Net investment income | | | (0.38 | ) | | | (0.45 | ) | | | (0.42 | ) | | | (0.49 | ) | | | (0.34 | ) | |
Total distributions to shareholders | | | (0.38 | ) | | | (0.45 | ) | | | (0.42 | ) | | | (0.49 | ) | | | (0.34 | ) | |
Proceeds from regulatory settlements | | | — | | | | — | | | | — | | | | — | | | | 0.00 | (a) | |
Net asset value, end of period | | $ | 19.22 | | | $ | 15.68 | | | $ | 14.99 | | | $ | 15.55 | | | $ | 12.92 | | |
Total return | | | 25.38 | % | | | 7.84 | % | | | (0.75 | %) | | | 24.72 | % | | | 33.91 | % | |
Ratios to average net assets(b) | |
Total gross expenses | | | 1.35 | % | | | 1.39 | % | | | 1.27 | % | | | 1.31 | %(c) | | | 1.24 | % | |
Total net expenses(d) | | | 1.12 | %(e) | | | 1.15 | %(e) | | | 1.12 | %(e) | | | 1.15 | %(c)(e) | | | 1.20 | %(e) | |
Net investment income | | | 1.97 | % | | | 2.80 | % | | | 2.86 | % | | | 3.27 | % | | | 2.88 | % | |
Supplemental data | |
Net assets, end of period (in thousands) | | $ | 323,622 | | | $ | 212,252 | | | $ | 198,721 | | | $ | 224,608 | | | $ | 191,414 | | |
Portfolio turnover | | | 76 | % | | | 71 | % | | | 66 | % | | | 118 | % | | | 117 | % | |
Notes to Financial Highlights
(a) Rounds to zero.
(b) In addition to the fees and expenses which the Fund bears directly, the Fund indirectly bears a pro rata share of the fees and expenses of the acquired funds in which it invests. Such indirect expenses are not included in the reported expense ratios.
(c) Ratios include line of credit interest expense which rounds to less than 0.01%.
(d) Total net expenses include the impact of certain waivers/reimbursements made by the Investment Manager and certain of its affiliates, if applicable.
(e) The benefits derived from expense reductions had an impact of less than 0.01%.
The accompanying Notes to Financial Statements are an integral part of this statement.
Annual Report 2014
21
Columbia Convertible Securities Fund
Financial Highlights (continued)
| | | | | Year Ended | | | |
| | | Year Ended February 28, | | February 29, | | Year Ended February 28, | |
Class B | | 2014 | | 2013 | | 2012 | | 2011 | | 2010 | |
Per share data | |
Net asset value, beginning of period | | $ | 15.40 | | | $ | 14.72 | | | $ | 15.28 | | | $ | 12.70 | | | $ | 9.77 | | |
Income from investment operations: | |
Net investment income | | | 0.21 | | | | 0.30 | | | | 0.30 | | | | 0.35 | | | | 0.24 | | |
Net realized and unrealized gain (loss) | | | 3.51 | | | | 0.72 | | | | (0.55 | ) | | | 2.62 | | | | 2.94 | | |
Total from investment operations | | | 3.72 | | | | 1.02 | | | | (0.25 | ) | | | 2.97 | | | | 3.18 | | |
Less distributions to shareholders: | |
Net investment income | | | (0.26 | ) | | | (0.34 | ) | | | (0.31 | ) | | | (0.39 | ) | | | (0.25 | ) | |
Total distributions to shareholders | | | (0.26 | ) | | | (0.34 | ) | | | (0.31 | ) | | | (0.39 | ) | | | (0.25 | ) | |
Proceeds from regulatory settlements | | | — | | | | — | | | | — | | | | — | | | | 0.00 | (a) | |
Net asset value, end of period | | $ | 18.86 | | | $ | 15.40 | | | $ | 14.72 | | | $ | 15.28 | | | $ | 12.70 | | |
Total return | | | 24.37 | % | | | 7.10 | % | | | (1.53 | %) | | | 23.83 | % | | | 32.86 | % | |
Ratios to average net assets(b) | |
Total gross expenses | | | 2.10 | % | | | 2.13 | % | | | 2.04 | % | | | 2.06 | %(c) | | | 1.99 | % | |
Total net expenses(d) | | | 1.88 | %(e) | | | 1.89 | %(e) | | | 1.88 | %(e) | | | 1.90 | %(c)(e) | | | 1.95 | %(e) | |
Net investment income | | | 1.23 | % | | | 2.07 | % | | | 2.04 | % | | | 2.61 | % | | | 2.10 | % | |
Supplemental data | |
Net assets, end of period (in thousands) | | $ | 911 | | | $ | 1,335 | | | $ | 3,102 | | | $ | 12,089 | | | $ | 24,126 | | |
Portfolio turnover | | | 76 | % | | | 71 | % | | | 66 | % | | | 118 | % | | | 117 | % | |
Notes to Financial Highlights
(a) Rounds to zero.
(b) In addition to the fees and expenses which the Fund bears directly, the Fund indirectly bears a pro rata share of the fees and expenses of the acquired funds in which it invests. Such indirect expenses are not included in the reported expense ratios.
(c) Ratios include line of credit interest expense which rounds to less than 0.01%.
(d) Total net expenses include the impact of certain waivers/reimbursements made by the Investment Manager and certain of its affiliates, if applicable.
(e) The benefits derived from expense reductions had an impact of less than 0.01%.
The accompanying Notes to Financial Statements are an integral part of this statement.
Annual Report 2014
22
Columbia Convertible Securities Fund
Financial Highlights (continued)
| | | | | Year Ended | | | |
| | | Year Ended February 28, | | February 29, | | Year Ended February 28, | |
Class C | | 2014 | | 2013 | | 2012 | | 2011 | | 2010 | |
Per share data | |
Net asset value, beginning of period | | $ | 15.63 | | | $ | 14.95 | | | $ | 15.51 | | | $ | 12.88 | | | $ | 9.91 | | |
Income from investment operations: | |
Net investment income | | | 0.21 | | | | 0.30 | | | | 0.31 | | | | 0.35 | | | | 0.25 | | |
Net realized and unrealized gain (loss) | | | 3.58 | | | | 0.72 | | | | (0.56 | ) | | | 2.67 | | | | 2.97 | | |
Total from investment operations | | | 3.79 | | | | 1.02 | �� | | | (0.25 | ) | | | 3.02 | | | | 3.22 | | |
Less distributions to shareholders: | |
Net investment income | | | (0.26 | ) | | | (0.34 | ) | | | (0.31 | ) | | | (0.39 | ) | | | (0.25 | ) | |
Total distributions to shareholders | | | (0.26 | ) | | | (0.34 | ) | | | (0.31 | ) | | | (0.39 | ) | | | (0.25 | ) | |
Proceeds from regulatory settlements | | | — | | | | — | | | | — | | | | — | | | | 0.00 | (a) | |
Net asset value, end of period | | $ | 19.16 | | | $ | 15.63 | | | $ | 14.95 | | | $ | 15.51 | | | $ | 12.88 | | |
Total return | | | 24.46 | % | | | 6.99 | % | | | (1.51 | %) | | | 23.88 | % | | | 32.80 | % | |
Ratios to average net assets(b) | |
Total gross expenses | | | 2.10 | % | | | 2.14 | % | | | 2.02 | % | | | 2.06 | %(c) | | | 1.99 | % | |
Total net expenses(d) | | | 1.87 | %(e) | | | 1.90 | %(e) | | | 1.87 | %(e) | | | 1.90 | %(c)(e) | | | 1.95 | %(e) | |
Net investment income | | | 1.21 | % | | | 2.05 | % | | | 2.10 | % | | | 2.53 | % | | | 2.12 | % | |
Supplemental data | |
Net assets, end of period (in thousands) | | $ | 32,250 | | | $ | 17,617 | | | $ | 20,127 | | | $ | 21,717 | | | $ | 20,103 | | |
Portfolio turnover | | | 76 | % | | | 71 | % | | | 66 | % | | | 118 | % | | | 117 | % | |
Notes to Financial Highlights
(a) Rounds to zero.
(b) In addition to the fees and expenses which the Fund bears directly, the Fund indirectly bears a pro rata share of the fees and expenses of the acquired funds in which it invests. Such indirect expenses are not included in the reported expense ratios.
(c) Ratios include line of credit interest expense which rounds to less than 0.01%.
(d) Total net expenses include the impact of certain waivers/reimbursements made by the Investment Manager and certain of its affiliates, if applicable.
(e) The benefits derived from expense reductions had an impact of less than 0.01%.
The accompanying Notes to Financial Statements are an integral part of this statement.
Annual Report 2014
23
Columbia Convertible Securities Fund
Financial Highlights (continued)
| | | | | Year Ended | | Year Ended | |
| | | Year Ended February 28, | | February 29, | | February 28, | |
Class I | | 2014 | | 2013 | | 2012 | | 2011(a) | |
Per share data | |
Net asset value, beginning of period | | $ | 15.72 | | | $ | 15.02 | | | $ | 15.58 | | | $ | 13.69 | | |
Income from investment operations: | |
Net investment income | | | 0.42 | | | | 0.48 | | | | 0.47 | | | | 0.17 | | |
Net realized and unrealized gain (loss) | | | 3.58 | | | | 0.72 | | | | (0.57 | ) | | | 1.86 | | |
Total from investment operations | | | 4.00 | | | | 1.20 | | | | (0.10 | ) | | | 2.03 | | |
Less distributions to shareholders: | |
Net investment income | | | (0.45 | ) | | | (0.50 | ) | | | (0.46 | ) | | | (0.14 | ) | |
Total distributions to shareholders | | | (0.45 | ) | | | (0.50 | ) | | | (0.46 | ) | | | (0.14 | ) | |
Net asset value, end of period | | $ | 19.27 | | | $ | 15.72 | | | $ | 15.02 | | | $ | 15.58 | | |
Total return | | | 25.90 | % | | | 8.29 | % | | | (0.43 | %) | | | 14.92 | % | |
Ratios to average net assets(b) | |
Total gross expenses | | | 0.85 | % | | | 0.89 | % | | | 0.84 | % | | | 0.90 | %(c) | |
Total net expenses(d) | | | 0.69 | % | | | 0.74 | % | | | 0.77 | % | | | 0.86 | %(c)(e) | |
Net investment income | | | 2.43 | % | | | 3.21 | % | | | 3.28 | % | | | 2.63 | %(c) | |
Supplemental data | |
Net assets, end of period (in thousands) | | $ | 150,494 | | | $ | 180,374 | | | $ | 186,160 | | | $ | 82,875 | | |
Portfolio turnover | | | 76 | % | | | 71 | % | | | 66 | % | | | 118 | % | |
Notes to Financial Highlights
(a) For the period from September 27, 2010 (commencement of operations) to February 28, 2011.
(b) In addition to the fees and expenses which the Fund bears directly, the Fund indirectly bears a pro rata share of the fees and expenses of the acquired funds in which it invests. Such indirect expenses are not included in the reported expense ratios.
(c) Annualized.
(d) Total net expenses include the impact of certain waivers/reimbursements made by the Investment Manager and certain of its affiliates, if applicable.
(e) The benefits derived from expense reductions had an impact of less than 0.01%.
The accompanying Notes to Financial Statements are an integral part of this statement.
Annual Report 2014
24
Columbia Convertible Securities Fund
Financial Highlights (continued)
| | | | | Year Ended | |
| | | Year Ended February 28, | | February 29, | |
Class R | | 2014 | | 2013 | | 2012(a) | |
Per share data | |
Net asset value, beginning of period | | $ | 15.67 | | | $ | 14.99 | | | $ | 13.80 | | |
Income from investment operations: | |
Net investment income | | | 0.30 | | | | 0.38 | | | | 0.11 | | |
Net realized and unrealized gain | | | 3.58 | | | | 0.72 | | | | 1.20 | (b) | |
Total from investment operations | | | 3.88 | | | | 1.10 | | | | 1.31 | | |
Less distributions to shareholders: | |
Net investment income | | | (0.34 | ) | | | (0.42 | ) | | | (0.12 | ) | |
Total distributions to shareholders | | | (0.34 | ) | | | (0.42 | ) | | | (0.12 | ) | |
Net asset value, end of period | | $ | 19.21 | | | $ | 15.67 | | | $ | 14.99 | | |
Total return | | | 25.08 | % | | | 7.55 | % | | | 9.57 | % | |
Ratios to average net assets(c) | |
Total gross expenses | | | 1.60 | % | | | 1.64 | % | | | 1.28 | %(d) | |
Total net expenses(e) | | | 1.37 | %(f) | | | 1.40 | %(f) | | | 1.20 | %(d) | |
Net investment income | | | 1.72 | % | | | 2.56 | % | | | 2.64 | %(d) | |
Supplemental data | |
Net assets, end of period (in thousands) | | $ | 2,423 | | | $ | 1,894 | | | $ | 2,068 | | |
Portfolio turnover | | | 76 | % | | | 71 | % | | | 66 | % | |
Notes to Financial Highlights
(a) For the period from November 16, 2011 (commencement of operations) to February 29, 2012.
(b) Calculation of the net gain (loss) per share (both realized and unrealized) does not correlate to the aggregate realized and unrealized gain (loss) presented in the Statement of Operations due to the timing of sales and repurchases of Fund shares in relation to fluctuations in the market value of the portfolio.
(c) In addition to the fees and expenses which the Fund bears directly, the Fund indirectly bears a pro rata share of the fees and expenses of the acquired funds in which it invests. Such indirect expenses are not included in the reported expense ratios.
(d) Annualized.
(e) Total net expenses include the impact of certain waivers/reimbursements made by the Investment Manager and certain of its affiliates, if applicable.
(f) The benefits derived from expense reductions had an impact of less than 0.01%.
The accompanying Notes to Financial Statements are an integral part of this statement.
Annual Report 2014
25
Columbia Convertible Securities Fund
Financial Highlights (continued)
| | | Year Ended February 28, | |
Class R4 | | 2014 | | 2013(a) | |
Per share data | |
Net asset value, beginning of period | | $ | 15.80 | | | $ | 14.75 | | |
Income from investment operations: | |
Net investment income | | | 0.37 | | | | 0.14 | | |
Net realized and unrealized gain | | | 3.62 | | | | 1.04 | | |
Total from investment operations | | | 3.99 | | | | 1.18 | | |
Less distributions to shareholders: | |
Net investment income | | | (0.42 | ) | | | (0.13 | ) | |
Total distributions to shareholders | | | (0.42 | ) | | | (0.13 | ) | |
Net asset value, end of period | | $ | 19.37 | | | $ | 15.80 | | |
Total return | | | 25.68 | % | | | 8.05 | % | |
Ratios to average net assets(b) | |
Total gross expenses | | | 1.10 | % | | | 1.24 | %(c) | |
Total net expenses(d) | | | 0.85 | %(e) | | | 0.92 | %(c) | |
Net investment income | | | 2.09 | % | | | 2.96 | %(c) | |
Supplemental data | |
Net assets, end of period (in thousands) | | $ | 685 | | | $ | 3 | | |
Portfolio turnover | | | 76 | % | | | 71 | % | |
Notes to Financial Highlights
(a) For the period from November 8, 2012 (commencement of operations) to February 28, 2013.
(b) In addition to the fees and expenses which the Fund bears directly, the Fund indirectly bears a pro rata share of the fees and expenses of the acquired funds in which it invests. Such indirect expenses are not included in the reported expense ratios.
(c) Annualized.
(d) Total net expenses include the impact of certain waivers/reimbursements made by the Investment Manager and certain of its affiliates, if applicable.
(e) The benefits derived from expense reductions had an impact of less than 0.01%.
The accompanying Notes to Financial Statements are an integral part of this statement.
Annual Report 2014
26
Columbia Convertible Securities Fund
Financial Highlights (continued)
| | | Year Ended February 28, | |
Class R5 | | 2014 | | 2013(a) | |
Per share data | |
Net asset value, beginning of period | | $ | 15.80 | | | $ | 14.75 | | |
Income from investment operations: | |
Net investment income | | | 0.40 | | | | 0.14 | | |
Net realized and unrealized gain | | | 3.62 | | | | 1.04 | | |
Total from investment operations | | | 4.02 | | | | 1.18 | | |
Less distributions to shareholders: | |
Net investment income | | | (0.45 | ) | | | (0.13 | ) | |
Total distributions to shareholders | | | (0.45 | ) | | | (0.13 | ) | |
Net asset value, end of period | | $ | 19.37 | | | $ | 15.80 | | |
Total return | | | 25.86 | % | | | 8.08 | % | |
Ratios to average net assets(b) | |
Total gross expenses | | | 0.90 | % | | | 1.01 | %(c) | |
Total net expenses(d) | | | 0.71 | % | | | 0.79 | %(c) | |
Net investment income | | | 2.25 | % | | | 3.09 | %(c) | |
Supplemental data | |
Net assets, end of period (in thousands) | | $ | 946 | | | $ | 3 | | |
Portfolio turnover | | | 76 | % | | | 71 | % | |
Notes to Financial Highlights
(a) For the period from November 8, 2012 (commencement of operations) to February 28, 2013.
(b) In addition to the fees and expenses which the Fund bears directly, the Fund indirectly bears a pro rata share of the fees and expenses of the acquired funds in which it invests. Such indirect expenses are not included in the reported expense ratios.
(c) Annualized.
(d) Total net expenses include the impact of certain waivers/reimbursements made by the Investment Manager and certain of its affiliates, if applicable.
The accompanying Notes to Financial Statements are an integral part of this statement.
Annual Report 2014
27
Columbia Convertible Securities Fund
Financial Highlights (continued)
| | | | | Year Ended | |
| | | Year Ended February 28, | | February 29, | |
Class W | | 2014 | | 2013 | | 2012(a) | |
Per share data | |
Net asset value, beginning of period | | $ | 15.66 | | | $ | 14.98 | | | $ | 13.80 | | |
Income from investment operations: | |
Net investment income | | | 0.34 | | | | 0.42 | | | | 0.14 | | |
Net realized and unrealized gain | | | 3.58 | | | | 0.72 | | | | 1.17 | (b) | |
Total from investment operations | | | 3.92 | | | | 1.14 | | | | 1.31 | | |
Less distributions to shareholders: | |
Net investment income | | | (0.38 | ) | | | (0.46 | ) | | | (0.13 | ) | |
Total distributions to shareholders | | | (0.38 | ) | | | (0.46 | ) | | | (0.13 | ) | |
Net asset value, end of period | | $ | 19.20 | | | $ | 15.66 | | | $ | 14.98 | | |
Total return | | | 25.41 | % | | | 7.87 | % | | | 9.56 | % | |
Ratios to average net assets(c) | |
Total gross expenses | | | 1.35 | % | | | 1.39 | % | | | 0.85 | %(d) | |
Total net expenses(e) | | | 1.12 | %(f) | | | 1.15 | %(f) | | | 0.77 | %(d) | |
Net investment income | | | 1.98 | % | | | 2.83 | % | | | 3.44 | %(d) | |
Supplemental data | |
Net assets, end of period (in thousands) | | $ | 28,153 | | | $ | 26,640 | | | $ | 28,830 | | |
Portfolio turnover | | | 76 | % | | | 71 | % | | | 66 | % | |
Notes to Financial Highlights
(a) For the period from November 16, 2011 (commencement of operations) to February 29, 2012.
(b) Calculation of the net gain (loss) per share (both realized and unrealized) does not correlate to the aggregate realized and unrealized gain (loss) presented in the Statement of Operations due to the timing of sales and repurchases of Fund shares in relation to fluctuations in the market value of the portfolio.
(c) In addition to the fees and expenses which the Fund bears directly, the Fund indirectly bears a pro rata share of the fees and expenses of the acquired funds in which it invests. Such indirect expenses are not included in the reported expense ratios.
(d) Annualized.
(e) Total net expenses include the impact of certain waivers/reimbursements made by the Investment Manager and certain of its affiliates, if applicable.
(f) The benefits derived from expense reductions had an impact of less than 0.01%.
The accompanying Notes to Financial Statements are an integral part of this statement.
Annual Report 2014
28
Columbia Convertible Securities Fund
Financial Highlights (continued)
| | | | | Year Ended | | | |
| | | Year Ended February 28, | | February 29, | | Year Ended February 28, | |
Class Z | | 2014 | | 2013 | | 2012 | | 2011 | | 2010 | |
Per share data | |
Net asset value, beginning of period | | $ | 15.70 | | | $ | 15.01 | | | $ | 15.58 | | | $ | 12.93 | | | $ | 9.94 | | |
Income from investment operations: | |
Net investment income | | | 0.38 | | | | 0.45 | | | | 0.45 | | | | 0.49 | | | | 0.37 | | |
Net realized and unrealized gain (loss) | | | 3.59 | | | | 0.73 | | | | (0.57 | ) | | | 2.68 | | | | 2.99 | | |
Total from investment operations | | | 3.97 | | | | 1.18 | | | | (0.12 | ) | | | 3.17 | | | | 3.36 | | |
Less distributions to shareholders: | |
Net investment income | | | (0.42 | ) | | | (0.49 | ) | | | (0.45 | ) | | | (0.52 | ) | | | (0.37 | ) | |
Total distributions to shareholders | | | (0.42 | ) | | | (0.49 | ) | | | (0.45 | ) | | | (0.52 | ) | | | (0.37 | ) | |
Proceeds from regulatory settlements | | | — | | | | — | | | | — | | | | — | | | | 0.00 | (a) | |
Net asset value, end of period | | $ | 19.25 | | | $ | 15.70 | | | $ | 15.01 | | | $ | 15.58 | | | $ | 12.93 | | |
Total return | | | 25.72 | % | | | 8.10 | % | | | (0.56 | %) | | | 25.17 | % | | | 34.20 | % | |
Ratios to average net assets(b) | |
Total gross expenses | | | 1.10 | % | | | 1.14 | % | | | 1.02 | % | | | 1.06 | %(c) | | | 0.99 | % | |
Total net expenses(d) | | | 0.87 | %(e) | | | 0.90 | %(e) | | | 0.87 | %(e) | | | 0.90 | %(c)(e) | | | 0.95 | %(e) | |
Net investment income | | | 2.18 | % | | | 3.06 | % | | | 3.08 | % | | | 3.52 | % | | | 3.12 | % | |
Supplemental data | |
Net assets, end of period (in thousands) | | $ | 465,328 | | | $ | 120,906 | | | $ | 130,380 | | | $ | 166,597 | | | $ | 198,457 | | |
Portfolio turnover | | | 76 | % | | | 71 | % | | | 66 | % | | | 118 | % | | | 117 | % | |
Notes to Financial Highlights
(a) Rounds to zero.
(b) In addition to the fees and expenses which the Fund bears directly, the Fund indirectly bears a pro rata share of the fees and expenses of the acquired funds in which it invests. Such indirect expenses are not included in the reported expense ratios.
(c) Ratios include line of credit interest expense which rounds to less than 0.01%.
(d) Total net expenses include the impact of certain waivers/reimbursements made by the Investment Manager and certain of its affiliates, if applicable.
(e) The benefits derived from expense reductions had an impact of less than 0.01%.
The accompanying Notes to Financial Statements are an integral part of this statement.
Annual Report 2014
29
Columbia Convertible Securities Fund
Notes to Financial Statements
February 28, 2014
Note 1. Organization
Columbia Convertible Securities Fund (the Fund), a series of Columbia Funds Series Trust (the Trust), is a diversified fund. The Trust is registered under the Investment Company Act of 1940, as amended (the 1940 Act), as an open-end management investment company organized as a Delaware statutory trust.
Fund Shares
The Trust may issue an unlimited number of shares (without par value). The Fund offers Class A, Class B, Class C, Class I, Class R, Class R4, Class R5, Class W and Class Z shares. Although all share classes generally have identical voting, dividend and liquidation rights, each share class votes separately when required by law. Different share classes pay different distribution amounts to the extent the expenses of such share classes differ, and distributions in liquidation will be proportional to the net asset value of each share class. Each share class has its own expense structure and sales charges, as applicable.
Class A shares are subject to a maximum front-end sales charge of 5.75% based on the initial investment amount. Class A shares purchased without an initial sales charge in accounts aggregating $1 million to $50 million at the time of purchase are subject to a contingent deferred sales charge (CDSC) if the shares are sold within 18 months of purchase, charged as follows: 1.00% CDSC if redeemed within 12 months of purchase, and 0.50% CDSC if redeemed more than 12, but less than 18, months after purchase.
Class B shares may be subject to a maximum CDSC of 5.00% based upon the holding period after purchase. Class B shares will generally convert to Class A shares eight years after purchase. The Fund no longer accepts investments by new or existing investors in the Fund's Class B shares, except in connection with the reinvestment of any dividend and/or capital gain distributions in Class B shares of the Fund and exchanges by existing Class B shareholders of certain other funds within the Columbia Family of Funds.
Class C shares are subject to a 1.00% CDSC on shares redeemed within one year of purchase.
Class I shares are not subject to sales charges and are available only to the Columbia Family of Funds.
Class R shares are not subject to sales charges and are generally available only to certain retirement plans and other eligible investors.
Class R4 shares are not subject to sales charges and are generally available only to omnibus retirement plans and certain other eligible investors.
Class R5 shares are not subject to sales charges and are generally available only to investors purchasing through authorized investment professionals and omnibus retirement plans.
Class W shares are not subject to sales charges and are available only to investors purchasing through authorized investment programs managed by investment professionals, including discretionary managed account programs.
Class Z shares are not subject to sales charges and are available only to certain eligible investors, which are subject to different investment minimums.
Note 2. Summary of Significant Accounting Policies
Use of Estimates
The preparation of financial statements in accordance with U.S. generally accepted accounting principles (GAAP) requires management to make certain estimates and assumptions that affect the reported amounts of assets and liabilities, the disclosure of contingent assets and liabilities at the date of the financial statements and the reported amounts of revenue and expenses during the reporting period. Actual results could differ from those estimates.
The following is a summary of significant accounting policies consistently followed by the Fund in the preparation of its financial statements.
Security Valuation
Debt securities generally are valued by pricing services approved by the Board of Trustees (the Board) based upon market transactions for normal, institutional-size trading units of similar securities. The services may use various pricing techniques which take into account appropriate factors such as yield, quality, coupon rate, maturity, type of issue, trading characteristics and other data, as well as broker quotes. Debt securities for which quotations are readily available may also be valued based upon an over-the-counter or exchange bid quotation.
All equity securities are valued at the close of business of the New York Stock Exchange (NYSE). Equity securities are valued at the last quoted sales price on the principal exchange or market on which they trade, except for securities traded on the NASDAQ Stock Market, which are valued at the NASDAQ official close price. Unlisted securities or listed securities for which there were no sales during the day are valued at the mean of the latest quoted bid and ask prices on such exchanges or markets.
Annual Report 2014
30
Columbia Convertible Securities Fund
Notes to Financial Statements (continued)
February 28, 2014
Foreign equity securities are valued based on quotations from the principal market in which such securities are normally traded. If any foreign share prices are not readily available as a result of limited share activity the securities are valued at the mean of the latest quoted bid and ask prices on such exchanges or markets. Foreign currency exchange rates are generally determined at 4:00 p.m. Eastern (U.S.) time. However, many securities markets and exchanges outside the U.S. close prior to the close of the NYSE; therefore, the closing prices for securities in such markets or on such exchanges may not fully reflect events that occur after such close but before the close of the NYSE. In those situations, foreign securities will be fair valued pursuant to the policy adopted by the Board, including utilizing a third party pricing service to determine these fair values. The third party pricing service takes into account multiple factors, including, but not limited to, movements in the U.S. securities markets, certain depositary receipts, futures contracts and foreign exchange rates that have occurred subsequent to the close of the foreign exchange or market, to determine a good faith estimate that reasonably reflects the current market conditions as of the close of the NYSE. The fair value of a security is likely to be different from the quoted or published price, if available.
Investments in open-end investment companies, including money market funds, are valued at net asset value.
Investments for which market quotations are not readily available, or that have quotations which management believes are not reliable, are valued at fair value as determined in good faith under consistently applied procedures established by and under the general supervision of the Board. If a security or class of securities (such as foreign securities) is valued at fair value, such value is likely to be different from the last quoted market price for the security.
The determination of fair value often requires significant judgment. To determine fair value, management may use assumptions including but not limited to future cash flows and estimated risk premiums. Multiple inputs from various sources may be used to determine fair value.
Foreign Currency Transactions and Translations
The values of all assets and liabilities denominated in foreign currencies are translated into U.S. dollars at that day's exchange rates. Net realized and unrealized gains (losses) on foreign currency transactions and translations include gains (losses) arising from the fluctuation in exchange rates between trade and settlement dates on securities transactions, gains (losses) arising from the disposition of foreign currency and currency gains (losses) between the accrual and payment dates on dividends, interest income and foreign withholding taxes.
For financial statement purposes, the Fund does not distinguish that portion of gains (losses) on investments which is due to changes in foreign exchange rates from that which is due to changes in market prices of the investments. Such fluctuations are included with the net realized and unrealized gains (losses) on investments in the Statement of Operations.
Delayed Delivery Securities
The Fund may trade securities on other than normal settlement terms, including securities purchased or sold on a "when-issued" basis. This may increase risk since the other party to the transaction may fail to deliver which could cause the Fund to subsequently invest at less advantageous prices. The Fund designates cash or liquid securities in an amount equal to the delayed delivery commitment.
Equity-Linked Notes
The Fund may invest in equity-linked notes (ELNs). An ELN is a debt instrument whose value is based on the value of a single equity security, basket of equity securities or an index of equity securities (each, an Underlying Equity). An ELN typically provides interest income, thereby offering a yield advantage over investing directly in an Underlying Equity. However, the holder of an ELN may have limited or no benefit from any appreciation in the Underlying Equity, but is exposed to various risks, including, without limitation, volatility, issuer and market risk. The Fund may purchase ELNs that trade on a securities exchange or those that trade on the over-the-counter markets, including securities offered and sold under Rule 144A of the Securities Act of 1933, as amended. The Fund may also purchase an ELN in a privately negotiated transaction with the issuer of the ELN (or its broker-dealer affiliate).
Security Transactions
Security transactions are accounted for on the trade date. Cost is determined and gains (losses) are based upon the specific identification method for both financial statement and federal income tax purposes.
Income Recognition
Interest income is recorded on an accrual basis. Market premiums and discounts, including original issue discounts, are amortized and accreted, respectively, over the expected life of the security on all debt securities, unless otherwise noted. For convertible securities, premiums attributable to the conversion feature are not amortized.
Corporate actions and dividend income are generally recorded net of any non-reclaimable tax withholdings, on the ex-dividend date or upon receipt of ex-dividend notification in the case of certain foreign securities.
Annual Report 2014
31
Columbia Convertible Securities Fund
Notes to Financial Statements (continued)
February 28, 2014
The Fund may receive distributions from holdings in business development companies (BDCs), exchange traded funds (ETFs) and real estate investment trusts (REITs), which report information on the character of their distributions annually. These distributions are allocated to dividend income, capital gain and return of capital based on estimates made by the Fund's management if actual information has not yet been reported. Return of capital is recorded as a reduction of the cost basis of securities held. If the Fund no longer owns the applicable securities, return of capital is recorded as a realized gain. Management's estimates are subsequently adjusted when the actual character of the distributions is disclosed by the BDCs, ETFs and REITs, which could result in a proportionate change in return of capital to shareholders.
Awards from class action litigation are recorded as a reduction of cost basis if the Fund still owns the applicable securities on the payment date. If the Fund no longer owns the applicable securities, the proceeds are recorded as realized gains.
Expenses
General expenses of the Trust are allocated to the Fund and other funds of the Trust based upon relative net assets or other expense allocation methodologies determined by the nature of the expense. Expenses directly attributable to the Fund are charged to the Fund. Expenses directly attributable to a specific class of shares are charged to that share class.
Determination of Class Net Asset Value
All income, expenses (other than class-specific expenses, which are charged to that share class, as shown in the Statement of Operations) and realized and unrealized gains (losses) are allocated to each class of the Fund on a daily basis, based on the relative net assets of each class, for purposes of determining the net asset value of each class.
Federal Income Tax Status
The Fund intends to qualify each year as a regulated investment company under Subchapter M of the Internal Revenue Code, as amended, and will distribute substantially all of its taxable income (including net short-term capital gains), if any, for its tax year, and as such will not be subject to federal income taxes. In addition, the Fund intends to distribute in each calendar year substantially all of its net investment income, capital gains and certain other amounts, if any, such that the Fund should not be subject to federal excise tax. Therefore, no federal income or excise tax provision is recorded.
Foreign Taxes
The Fund may be subject to foreign taxes on income, gains on investments or currency repatriation, a portion of which may be recoverable. The Fund will accrue such taxes and
recoveries, as applicable, based upon its current interpretation of tax rules and regulations that exist in the markets in which it invests.
Realized gains in certain countries may be subject to foreign taxes at the Fund level, based on statutory rates. The Fund accrues for such foreign taxes on realized and unrealized gains at the appropriate rate for each jurisdiction, as applicable. The amount, if any, is disclosed as a liability on the Statement of Assets and Liabilities.
Distributions to Shareholders
Distributions from net investment income, if any, are declared and paid each calendar quarter. Net realized capital gains, if any, are distributed at least annually. Income distributions and capital gain distributions are determined in accordance with federal income tax regulations, which may differ from GAAP.
Guarantees and Indemnifications
Under the Trust's organizational documents and, in some cases, by contract, its officers and trustees are indemnified against certain liabilities arising out of the performance of their duties to the Trust or its funds. In addition, certain of the Fund's contracts with its service providers contain general indemnification clauses. The Fund's maximum exposure under these arrangements is unknown since the amount of any future claims that may be made against the Fund cannot be determined, and the Fund has no historical basis for predicting the likelihood of any such claims.
Note 3. Fees and Compensation Paid to Affiliates
Investment Management Fees
Under an Investment Management Services Agreement, Columbia Management Investment Advisers, LLC (the Investment Manager), a wholly-owned subsidiary of Ameriprise Financial, Inc. (Ameriprise Financial), determines which securities will be purchased, held or sold. The investment management fee is an annual fee that is equal to a percentage of the Fund's average daily net assets that declines from 0.76% to 0.62% as the Fund's net assets increase. The effective investment management fee rate for the year ended February 28, 2014 was 0.75% of the Fund's average daily net assets.
Administration Fees
Under an Administrative Services Agreement, the Investment Manager also serves as the Fund Administrator. The Fund pays the Fund Administrator an annual fee for administration and accounting services equal to a percentage of the Fund's average daily net assets that declines from 0.06% to 0.05% as
Annual Report 2014
32
Columbia Convertible Securities Fund
Notes to Financial Statements (continued)
February 28, 2014
the Fund's net assets increase. The effective administration fee rate for the year ended February 28, 2014 was 0.06% of the Fund's average daily net assets.
Other Expenses
Other expenses are for, among other things, miscellaneous expenses of the Fund or the Board, including payments to a company providing limited administrative services to the Fund and the Board. That company's expenses include boardroom and office expense, employee compensation, employee health and retirement benefits, and certain other expenses. For the year ended February 28, 2014, other expenses paid to this company were $2,851.
Compensation of Board Members
Board members are compensated for their services to the Fund as disclosed in the Statement of Operations. Under a Deferred Compensation Plan (the Plan), the Board members who are not "interested persons" of the Fund, as defined under the 1940 Act, may elect to defer payment of up to 100% of their compensation. Deferred amounts are treated as though equivalent dollar amounts had been invested in shares of certain funds managed by the Investment Manager. The Fund's liability for these amounts is adjusted for market value changes and remains in the Fund until distributed in accordance with the Plan.
Transfer Agent Fees
Under a Transfer and Dividend Disbursing Agent Agreement, Columbia Management Investment Services Corp. (the Transfer Agent), an affiliate of the Investment Manager and a wholly-owned subsidiary of Ameriprise Financial, is responsible for providing transfer agency services to the Fund. The Transfer Agent has contracted with Boston Financial Data Services (BFDS) to serve as sub-transfer agent.
The Transfer Agent receives monthly account-based service fees based on the number of open accounts and also receives sub-transfer agency fees based on a percentage of the average aggregate value of the Fund's shares maintained in omnibus accounts (other than omnibus accounts for which American Enterprise Investment Services Inc. is the broker of record or accounts where the beneficial shareholder is a customer of Ameriprise Financial Services, Inc., which are paid a per account fee). The Transfer Agent pays the fees of BFDS for services as sub-transfer agent and is not entitled to reimbursement for such fees from the Fund (with the exception of out-of-pocket fees).
The Transfer Agent also receives compensation from fees for various shareholder services and reimbursements for certain out-of-pocket fees. Class I shares do not pay transfer agent
fees. Total transfer agent fees for Class R5 shares are subject to an annual limitation of not more than 0.05% of the average daily net assets attributable to Class R5 shares.
For the year ended February 28, 2014, the Fund's effective transfer agent fee rates as a percentage of average daily net assets of each class were as follows:
Class A | | | 0.25 | % | |
Class B | | | 0.25 | | |
Class C | | | 0.25 | | |
Class R | | | 0.25 | | |
Class R4 | | | 0.24 | | |
Class R5 | | | 0.05 | | |
Class W | | | 0.25 | | |
Class Z | | | 0.25 | | |
An annual minimum account balance fee of $20 may apply to certain accounts with a value below the applicable share class's initial minimum investment requirements to reduce the impact of small accounts on transfer agent fees. These minimum account balance fees are recorded as part of expense reductions in the Statement of Operations. For the year ended February 28, 2014, these minimum account balance fees reduced total expenses by $1,710.
Distribution and Service Fees
The Fund has an agreement with Columbia Management Investment Distributors, Inc. (the Distributor), an affiliate of the Investment Manager and a wholly-owned subsidiary of Ameriprise Financial, for distribution and shareholder services. The Board has approved, and the Fund has adopted, distribution and shareholder service plans (the Plans) applicable to certain share classes, which set the distribution and service fees for the Fund. These fees are calculated daily and are intended to compensate the Distributor and/or eligible selling and/or servicing agents for selling shares of the Fund and providing services to investors.
Under the Plans, the Fund pays a monthly combined distribution and service fee to the Distributor at the maximum annual rate of 0.25% of the average daily net assets attributable to Class A shares of the Fund. Also under the Plans, the Fund pays a monthly service fee at the maximum annual rate of 0.25% of the average daily net assets attributable to Class B, Class C and Class W shares of the Fund and the payment of a monthly distribution fee at the maximum annual rates of 0.75%, 0.75%, 0.50% and 0.25% of the average daily net assets attributable to Class B, Class C, Class R and Class W shares, respectively.
Although the Fund may pay a distribution fee up to 0.25% of the Fund's average daily net assets attributable to Class W shares
Annual Report 2014
33
Columbia Convertible Securities Fund
Notes to Financial Statements (continued)
February 28, 2014
and a service fee of up to 0.25% of the Fund's average daily net assets attributable to Class W shares, the aggregate fee shall not exceed 0.25% of the Fund's average daily net assets attributable to Class W shares.
Sales Charges
Sales charges, including front-end charges and CDSCs, received by the Distributor for distributing Fund shares were $241,781 for Class A, $669 for Class B and $2,683 for Class C shares for the year ended February 28, 2014.
Expenses Waived/Reimbursed by the Investment Manager and its Affiliates
The Investment Manager and certain of its affiliates have contractually agreed to waive fees and/or reimburse expenses (excluding certain fees and expenses described below) for the periods disclosed below, unless sooner terminated at the sole discretion of the Board, so that the Fund's net operating expenses, after giving effect to fees waived/expenses reimbursed and any balance credits and/or overdraft charges from the Fund's custodian, do not exceed the following annual rates as a percentage of the class' average daily net assets:
| | | July 1, 2013
through
June 30, 2014 | | Prior to
July 1, 2013 | |
Class A | | | 1.10 | % | | | 1.17 | % | |
Class B | | | 1.85 | | | | 1.92 | | |
Class C | | | 1.85 | | | | 1.92 | | |
Class I | | | 0.66 | | | | 0.74 | | |
Class R | | | 1.35 | | | | 1.42 | | |
Class R4 | | | 0.85 | | | | 0.92 | | |
Class R5 | | | 0.71 | | | | 0.79 | | |
Class W | | | 1.10 | | | | 1.17 | | |
Class Z | | | 0.85 | | | | 0.92 | | |
Under the agreement governing these fee waivers and/or expense reimbursement arrangements, the following fees and expenses are excluded from the waiver/reimbursement commitment, and therefore will be paid by the Fund, if applicable: taxes (including foreign transaction taxes), expenses associated with investments in affiliated and non-affiliated pooled investment vehicles (including mutual funds and exchange traded funds), transaction costs and brokerage commissions, costs related to any securities lending program, dividend expenses associated with securities sold short, inverse floater program fees and expenses, transaction charges and interest on borrowed money, interest, extraordinary expenses and any other expenses the exclusion of which is specifically approved by the Board. This
agreement may be modified or amended only with approval from all parties.
Note 4. Federal Tax Information
The timing and character of income and capital gain distributions are determined in accordance with income tax regulations, which may differ from GAAP because of temporary or permanent book to tax differences.
At February 28, 2014, these differences are primarily due to differing treatment for principal and/or interest of fixed income securities, deferral/reversal of wash sales losses, Trustees' deferred compensation, and foreign currency transactions. To the extent these differences are permanent, reclassifications are made among the components of the Fund's net assets in the Statement of Assets and Liabilities. Temporary differences do not require reclassifications. In the Statement of Assets and Liabilities the following reclassifications were made:
Undistributed net investment income | | $ | 643,561 | | |
Accumulated net realized gain | | | (643,560 | ) | |
Paid-in capital | | | (1 | ) | |
Net investment income and net realized gains (losses), as disclosed in the Statement of Operations, and net assets were not affected by this reclassification.
The tax character of distributions paid during the years indicated was as follows:
Year Ended February 28, | | 2014 | | 2013 | |
Ordinary income | | $ | 14,563,181 | | | $ | 17,051,066 | | |
Short-term capital gain distributions, if any, are considered ordinary income distributions for tax purposes.
At February 28, 2014, the components of distributable earnings on a tax basis were as follows:
Undistributed ordinary income | | $ | 5,117,085 | | |
Undistributed accumulated long-term gain | | | 9,261,752 | | |
Unrealized appreciation | | | 111,223,071 | | |
At February 28, 2014, the cost of investments for federal income tax purposes was $896,211,781 and the aggregate gross unrealized appreciation and depreciation based on that cost was:
Unrealized appreciation | | $ | 134,489,876 | | |
Unrealized depreciation | | | (23,266,805 | ) | |
Net unrealized appreciation | | $ | 111,223,071 | | |
For the year ended February 28, 2014, $46,078,769 of capital loss carryforward was utilized.
Annual Report 2014
34
Columbia Convertible Securities Fund
Notes to Financial Statements (continued)
February 28, 2014
Management of the Fund has concluded that there are no significant uncertain tax positions that would require recognition in the financial statements. However, management's conclusion may be subject to review and adjustment at a later date based on factors including, but not limited to, new tax laws, regulations, and administrative interpretations (including relevant court decisions). Generally, the Fund's federal tax returns for the prior three fiscal years remain subject to examination by the Internal Revenue Service.
Note 5. Portfolio Information
The cost of purchases and proceeds from sales of securities, excluding short-term obligations, aggregated to $771,797,828 and $493,450,007, respectively, for the year ended February 28, 2014.
Note 6. Affiliated Money Market Fund
The Fund invests its daily cash balances in Columbia Short-Term Cash Fund, an affiliated money market fund established for the exclusive use by the Fund and other affiliated funds. The income earned by the Fund from such investments is included as "Dividends — affiliated issuers" in the Statement of Operations. As an investing fund, the Fund indirectly bears its proportionate share of the expenses of Columbia Short-Term Cash Fund.
Note 7. Shareholder Concentration
At February 28, 2014, one unaffiliated shareholder account owned 23.1% of the outstanding shares of the Fund. The Fund has no knowledge about whether any portion of those shares was owned beneficially by such account. Affiliated shareholder accounts owned 24.2% of the outstanding shares of the Fund. Subscription and redemption activity by concentrated accounts may have a significant effect on the operations of the Fund.
Note 8. Line of Credit
The Fund has entered into a revolving credit facility with a syndicate of banks led by JPMorgan Chase Bank N.A. whereby the Fund may borrow for the temporary funding of shareholder redemptions or for other temporary or emergency purposes. The credit facility agreement, as amended, which is a collective agreement between the Fund and certain other funds managed by the Investment Manager, severally and not jointly, permits collective borrowings up to $500 million. Interest is charged to each participating fund based on its borrowings at a rate equal to the higher of (i) the overnight federal funds rate plus 1.00% or (ii) the one-month LIBOR rate plus 1.00%. Each borrowing under the credit facility matures no later than 60 days after the date of borrowing. Effective December 10, 2013, the Fund also pays a
commitment fee equal to its pro rata share of the amount of the credit facility at a rate of 0.075% per annum. Prior to December 10, 2013, the commitment fee was charged at the annual rate of 0.08% per annum. The commitment fee is included in other expenses in the Statement of Operations.
The Fund had no borrowings during the year ended February 28, 2014.
Note 9. Subsequent Events
Management has evaluated the events and transactions that have occurred through the date the financial statements were issued and noted no items requiring adjustment of the financial statements or additional disclosure.
Note 10. Information Regarding Pending and Settled Legal Proceedings
In December 2005, without admitting or denying the allegations, American Express Financial Corporation (AEFC, which is now known as Ameriprise Financial, Inc. (Ameriprise Financial)) entered into settlement agreements with the Securities and Exchange Commission (SEC) and Minnesota Department of Commerce (MDOC) related to market timing activities. As a result, AEFC was censured and ordered to cease and desist from committing or causing any violations of certain provisions of the Investment Advisers Act of 1940, the Investment Company Act of 1940, and various Minnesota laws. AEFC agreed to pay disgorgement of $10 million and civil money penalties of $7 million. AEFC also agreed to retain an independent distribution consultant to assist in developing a plan for distribution of all disgorgement and civil penalties ordered by the SEC in accordance with various undertakings detailed at www.sec.gov/litigation/admin/ia-2451.pdf. Ameriprise Financial and its affiliates have cooperated with the SEC and the MDOC in these legal proceedings, and have made regular reports to the Funds' Boards of Trustees.
Ameriprise Financial and certain of its affiliates have historically been involved in a number of legal, arbitration and regulatory proceedings, including routine litigation, class actions, and governmental actions, concerning matters arising in connection with the conduct of their business activities. Ameriprise Financial believes that the Funds are not currently the subject of, and that neither Ameriprise Financial nor any of its affiliates are the subject of, any pending legal, arbitration or regulatory proceedings that are likely to have a material adverse effect on the Funds or the ability of Ameriprise Financial or its affiliates to perform under their contracts with the Funds. Ameriprise Financial is required to make 10-Q, 10-K and, as necessary, 8-K filings with the Securities and Exchange Commission on legal and regulatory matters that relate to Ameriprise Financial and its affiliates. Copies of
Annual Report 2014
35
Columbia Convertible Securities Fund
Notes to Financial Statements (continued)
February 28, 2014
these filings may be obtained by accessing the SEC website at www.sec.gov.
There can be no assurance that these matters, or the adverse publicity associated with them, will not result in increased fund redemptions, reduced sale of fund shares or other adverse consequences to the Funds. Further, although we believe proceedings are not likely to have a material adverse effect on the Funds or the ability of Ameriprise Financial or its affiliates to perform under their contracts with the Funds, these proceedings are subject to uncertainties and, as such, we are unable to estimate the possible loss or range of loss that may result. An adverse outcome in one or more of these proceedings could result in adverse judgments, settlements, fines, penalties or other relief that could have a material adverse effect on the consolidated financial condition or results of operations of Ameriprise Financial.
Annual Report 2014
36
Columbia Convertible Securities Fund
Report of Independent Registered Public Accounting Firm
To the Trustees of Columbia Funds Series Trust and the Shareholders of
Columbia Convertible Securities Fund
In our opinion, the accompanying statement of assets and liabilities, including the portfolio of investments, and the related statements of operations and of changes in net assets and the financial highlights present fairly, in all material respects, the financial position of Columbia Convertible Securities Fund (the "Fund", a series of Columbia Funds Series Trust) at February 28, 2014, and the results of its operations, the changes in its net assets and the financial highlights for each of the periods indicated, in conformity with accounting principles generally accepted in the United States of America. These financial statements and financial highlights (hereafter referred to as "financial statements") are the responsibility of the Fund's management; our responsibility is to express an opinion on these financial statements based on our audits. We conducted our audits of these financial statements in accordance with the standards of the Public Company Accounting Oversight Board (United States). Those standards require that we plan and perform the audit to obtain reasonable assurance about whether the financial statements are free of material misstatement. An audit includes examining, on a test basis, evidence supporting the amounts and disclosures in the financial statements, assessing the accounting principles used and significant estimates made by management, and evaluating the overall financial statement presentation. We believe that our audits, which included confirmation of securities at February 28, 2014 by correspondence with the custodian, brokers and transfer agent, provide a reasonable basis for our opinion.
PricewaterhouseCoopers LLP
Minneapolis, Minnesota
April 21, 2014
Annual Report 2014
37
Columbia Convertible Securities Fund
Federal Income Tax Information
(Unaudited)
The Fund hereby designates the following tax attributes for the fiscal year ended February 28, 2014. Shareholders will be notified in early 2015 of the amounts for use in preparing 2014 income tax returns.
Tax Designations:
| Qualified Dividend Income | | | 22.71 | % | |
| Dividends Received Deduction | | | 22.16 | % | |
Capital Gain Dividend | | $ | 9,724,840 | | |
Qualified Dividend Income. For taxable, non-corporate shareholders, the percentage of ordinary income dividends paid during the fiscal year that represents qualified dividend income subject to reduced tax rates.
Dividends Received Deduction. The percentage of ordinary income dividends paid during the fiscal year that qualifies for the corporate dividends received deduction.
Capital Gain Dividend. The Fund designates as a capital gain dividend the amount reflected above, or if subsequently determined to be different, the net capital gain of such fiscal period. The Fund also designates as capital gain dividends, to the extent necessary to fully distribute such capital gains, earnings and profits distributed to shareholders on the redemption of shares.
Annual Report 2014
38
Columbia Convertible Securities Fund
Shareholders elect the Board that oversees the Funds' operations. The Board appoints officers who are responsible for day-to-day business decisions based on policies set by the Board. The following table provides basic biographical information about the Funds' Board members, including their principal occupations during the past five years, although specific titles for individuals may have varied over the period. Under current Board policy, members may serve through the end of the calendar year in which he or she reaches either the mandatory retirement age established by the Board or the fifteenth anniversary of the first Board meeting they attended as a member of the Board.
Independent Trustees
Name,
Address,
Year of Birth | | Position Held With
Funds and Length of
Service | | Principal Occupation(s)
During Past Five Years
and Other Relevant
Professional Experience | | Number of
Funds in the
Fund Family
Overseen by
Board Member | | Other Present or Past
Directorships/
Trusteeships
(Within Past 5 Years) | |
Kathleen Blatz
901 S. Marquette Ave.
Minneapolis, MN 55402
1954 | | Board member since 1/06 for RiverSource Funds and since 6/11 for Nations Funds | | Attorney; Chief Justice, Minnesota Supreme
Court, 1998-2006 | | | 131 | | | Trustee, BlueCross BlueShield of Minnesota since 2009 | |
Edward J. Boudreau, Jr.
901 S. Marquette Ave.
Minneapolis, MN 55402
1944 | | Board member since 6/11 for RiverSource Funds and since 1/05 for Nations Funds | | Managing Director, E.J. Boudreau & Associates (consulting) since 2000; Chairman and Chief Executive Officer, John Hancock Funds (mutual funds), 1989-2000 | | | 129 | | | Former Trustee, BofA Funds Series Trust (11 funds), 2005-2011 | |
Pamela G. Carlton
901 S. Marquette Ave.
Minneapolis, MN 55402
1954 | | Board member since 7/07 for RiverSource Funds and since 6/11 for Nations Funds | | President, Springboard — Partners in Cross Cultural Leadership (consulting company) since 2003; Director or Management Director of US Equity Research, Chase Asset Management, 1996-2003; Investment Banker, Morgan Stanley, 1982-1996 | | | 131 | | | None | |
William P. Carmichael
901 S. Marquette Ave.
Minneapolis, MN 55402
1943 | | Chair of the Board since 1/14, Board member since 6/11 for RiverSource Funds and since 2003 for Nations Funds | | Retired; Co-founder, The Succession Fund (provides exit strategies to owners of privately held companies); previously, Senior Vice President, Sara Lee Corporation; Senior Vice President and Chief Financial officer, Beatrice Foods Company; Vice President, Esmark, Inc.; Associate, Price Waterhouse | | | 131 | | | Director, Cobra Electronics Corporation (electronic equipment manufacturer); The Finish Line (athletic shoes and apparel) since July 2003; Director, International Textile Corp. since 2012; former Director, McMoRan Exploration Company (oil and gas exploration and development) 2010-2013; former Trustee, BofA Funds Series Trust (11 funds), 2009-2011; Director, Spectrum Brands, Inc. (consumer products), 2002-2009; Director, Simmons Company (bedding), 2004-2010 | |
Annual Report 2014
39
Columbia Convertible Securities Fund
Trustees and Officers (continued)
Independent Trustees (continued)
Name,
Address,
Year of Birth | | Position Held With
Funds and Length of
Service | | Principal Occupation(s)
During Past Five Years
and Other Relevant
Professional Experience | | Number of
Funds in the
Fund Family
Overseen by
Board Member | | Other Present or Past
Directorships/
Trusteeships
(Within Past 5 Years) | |
Patricia M. Flynn
901 S. Marquette Ave.
Minneapolis, MN 55402
1950 | | Board member since 11/04 for RiverSource Funds and since 6/11 for Nations Funds | | Trustee Professor of Economics and Management, Bentley University since 1976 (also teaches and conducts research on corporate governance); Dean, McCallum Graduate School of Business, Bentley University, 1992-2002 | | | 131 | | | None | |
William A. Hawkins
901 S. Marquette Ave.
Minneapolis, MN 55402
1942 | | Board member since 6/11 for RiverSource Funds and since 1/05 for Nations Funds | | Managing Director, Overton Partners (financial consulting), since August 2010; President and Chief Executive Officer, California General Bank, N.A., January 2008-August 2010 | | | 129 | | | Trustee, BofA Funds Series Trust (11 funds) | |
R. Glenn Hilliard
901 S. Marquette Ave.
Minneapolis, MN 55402
1943 | | Board member since 6/11 for RiverSource Funds and since 1/05 for Nations Funds | | Chairman and Chief Executive Officer, Hilliard Group LLC (investing and consulting) since April 2003; Non-Executive Director & Chairman, CNO Financial Group, Inc. (insurance), September 2003-May 2011 | | | 129 | | | Chairman, BofA Fund Series Trust (11 funds); former Director, CNO Financial Group, Inc. (insurance), 2003-2011 | |
Stephen R. Lewis, Jr.
901 S. Marquette Ave.
Minneapolis, MN 55402
1939 | | Board member for RiverSource Funds since 1/02 and since 6/11 for Nations Funds, Board Chair 1/07-12/13 | | President Emeritus and Professor of Economics Emeritus, Carleton College since 2002 | | | 131 | | | Director, Valmont Industries, Inc. (irrigation systems manufacturer), 2002-2013 | |
Catherine James Paglia
901 S. Marquette Ave.
Minneapolis, MN 55402
1952 | | Board member since 11/04 for RiverSource Funds and since 6/11 for Nations Funds | | Director, Enterprise Asset Management, Inc. (private real estate and asset management company) since September 1998 | | | 131 | | | Director, Valmont Industries, Inc. (irrigation systems manufacturer) since 2012 | |
Leroy C. Richie
901 S. Marquette Ave.
Minneapolis, MN 55402
1941 | | Board member since 2000 for Legacy Seligman Funds, since 11/08 for RiverSource Funds and since 6/11 for Nations Funds | | Counsel, Lewis & Munday, P.C. (law firm) since 2004; Vice President and General Counsel, Automotive Legal Affairs, Chrysler Corporation, 1993-1997 | | | 131 | | | Lead Outside Director, Digital Ally, Inc. (digital imaging) since September 2005; Director, Infinity, Inc. (oil and gas exploration and production) since 1994; Director, OGE Energy Corp. (energy and energy services) since November 2007 | |
Minor M. Shaw
901 S. Marquette Ave.
Minneapolis, MN 55402
1947 | | Board member since 6/11 for RiverSource Funds and since 2003 for Nations Funds | | President, Micco LLC (private investments) since 2011; President, Micco Corp. since 1998 | | | 129 | | | Director, Piedmont Natural Gas; Director, BlueCross BlueShield of South Carolina since April 2008; Director, National Association of Corporate Directors, Carolinas Chapter, since 2013; former Trustee, BofA Funds Series Trust (11 funds) | |
Annual Report 2014
40
Columbia Convertible Securities Fund
Trustees and Officers (continued)
Independent Trustees (continued)
Name,
Address,
Year of Birth | | Position Held With
Funds and Length of
Service | | Principal Occupation(s)
During Past Five Years
and Other Relevant
Professional Experience | | Number of
Funds in the
Fund Family
Overseen by
Board Member | | Other Present or Past
Directorships/
Trusteeships
(Within Past 5 Years) | |
Alison Taunton-Rigby
901 S. Marquette Ave.
Minneapolis, MN 55402
1944 | | Board member since 11/02 for RiverSource Funds and since 6/11 for Nations Funds | | Chief Executive Officer and Director, RiboNovix, Inc., (biotechnology) 2003-2010 | | | 131 | | | Director, Healthways, Inc. (health and wellbeing solutions) since 2005; Director, ICI Mutual Insurance Company, RRG since 2011; Director, Abt Associates (government contractor) since 2001; Director, Boston Children's Hospital since 2002 | |
Interested Trustee Not Affiliated with Investment Manager*
Name,
Address,
Year of Birth | | Position Held With
Funds and Length of
Service | | Principal Occupation(s)
During Past Five Years
and Other Relevant
Professional Experience | | Number of
Funds in the
Fund Family
Overseen by
Board Member | | Other Present or Past
Directorships/
Trusteeships
(Within Past 5 Years) | |
Anthony M. Santomero
901 S. Marquette Ave.
Minneapolis, MN 55402
1946 | | Board member since 6/11 for RiverSource Funds and since 1/08 for Nations Funds | | Richard K. Mellon Professor Emeritus of Finance, The Wharton School, University of Pennsylvania, since 2002; Senior Advisor, McKinsey & Company (consulting), 2006-2008 | | | 129 | | | Director, Renaissance Reinsurance Ltd. since May 2008; Trustee, Penn Mutual Life Insurance Company since March 2008; Director, Citigroup Inc. since 2009; Director, Citibank, N.A. since 2009; former Trustee, BofA Funds Series Trust (11 funds), 2008-2011 | |
* Dr. Santomero is not an affiliated person of the Investment Manager or Ameriprise Financial. However, he is currently deemed by the Funds to be an "interested person" (as defined in the 1940 Act) of the Funds because he serves as a Director of Citigroup Inc. and Citibank, N.A., companies that may directly or through subsidiaries and affiliates engage from time-to-time in brokerage execution, principal transactions and lending relationships with the Funds or accounts advised/managed by the Investment Manager.
Annual Report 2014
41
Columbia Convertible Securities Fund
Trustees and Officers (continued)
Interested Trustee Affiliated with Investment Manager*
Name,
Address,
Year of Birth | | Position Held With
Funds and Length of
Service | | Principal Occupation(s)
During Past Five Years
and Other Relevant
Professional Experience | | Number of
Funds in the
Fund Family
Overseen by
Board Member | | Other Present or Past
Directorships/
Trusteeships
(Within Past 5 Years) | |
William F. Truscott
53600 Ameriprise
Financial Center
Minneapolis, MN 55474
1960 | | Board member since 11/01 for RiverSource Funds and since 6/11 for Nations Funds; Senior Vice President since 2002 for RiverSource Funds and since 5/10 for Nations Funds | | Chairman of the Board and President, Columbia Management Investment Advisers, LLC since May 2010 and February 2012, respectively (previously President and Chief Investment Officer, 2001-April 2010); Chief Executive Officer, Global Asset Management, Ameriprise Financial, Inc. since September 2012 (previously Chief Executive Officer, U.S. Asset Management & President, Annuities, May 2010-September 2012 and President — U.S. Asset Management and Chief Investment Officer, 2005-April 2010); Director and Chief Executive Officer, Columbia Management Investment Distributors, Inc. since May 2010 and February 2012, respectively (previously Chairman of the Board and Chief Executive Officer, 2006-April 2010); Chairman of the Board and Chief Executive Officer, RiverSource Distributors, Inc. since 2006; Director, Threadneedle Asset Management Holdings, SARL since 2014; President and Chief Executive Officer, Ameriprise Certificate Company, 2006-August 2012 | | | 183 | | | Former Director, Ameriprise Certificate Company, 2006-January 2013 | |
* Interested person (as defined under the 1940 Act) by reason of being an officer, director, security holder and/or employee of the Investment Manager or Ameriprise Financial.
The SAI has additional information about the Fund's Board members and is available, without charge, upon request by calling 800.345.6611, contacting your financial intermediary or visiting columbiamanagement.com.
Annual Report 2014
42
Columbia Convertible Securities Fund
Trustees and Officers (continued)
The Board has appointed officers who are responsible for day-to-day business decisions based on policies it has established. The officers serve at the pleasure of the Board. In addition to Mr. Truscott, who is Senior Vice President, the Funds' other officers are:
Officers
Name,
Address and
Year of Birth | | Position and Year
First Appointed to
Position for any Fund
in the Columbia
Funds Complex or a
Predecessor Thereof | | Principal Occupation(s) During Past Five Years | |
J. Kevin Connaughton
225 Franklin Street
Boston, MA 02110
Born 1964 | | President and Principal Executive Officer (2009) | | Managing Director and General Manager Mutual Fund Products, Columbia Management Investment Advisers, LLC — since May 2010; and President, Columbia Funds since 2009; Managing Director, Columbia Management Advisors, LLC, December 2004 – April 2010; Senior Vice President and Chief Financial Officer, Columbia Funds, June 2008 – January 2009; and senior officer of Columbia Funds and affiliated funds since 2003 | |
Michael G. Clarke
225 Franklin Street
Boston, MA 02110
Born 1969 | | Treasurer (2011) and Chief Financial Officer (2009) | | Vice President — Mutual Fund Administration, Columbia Management Investment Advisers, LLC, since May 2010;Managing Director of Fund Administration, Columbia Management Advisors, LLC, September 2004 – April 2010; and senior officer of Columbia Funds and affiliated funds since 2002 | |
Scott R. Plummer
5228 Ameriprise Financial Center
Minneapolis, MN 55474
Born 1959 | | Senior Vice President (2006), Chief Legal Officer (2006) and Assistant Secretary (2011) | | Senior Vice President and Assistant General Counsel — Global Asset Management, Ameriprise Financial since February 2014 (previously, Senior Vice President and Lead Chief Counsel — Asset Management, 2012 – February 2014; Vice President and Lead Chief Counsel — Asset Management, 2010 – 2012; and Vice President and Chief Counsel — Asset Management, 2005 – 2010); Senior Vice President, Chief Legal Officer and Assistant Secretary, Columbia Management Investment Advisers, LLC since June 2005; Vice President, Chief Counsel and Assistant Secretary, Columbia Management Investment Distributors, Inc. since 2008; Vice President, General Counsel and Secretary, Ameriprise Certificate Company since 2005; Chief Counsel, RiverSource Distributors, Inc. since 2006; senior officer of Columbia Funds and affiliated funds since 2006 | |
Thomas P. McGuire
225 Franklin Street
Boston, MA 02110
Born 1972 | | Chief Compliance Officer (2012) | | Vice President — Asset Management Compliance, Ameriprise Financial, Inc. since May 2010; Chief Compliance Officer, Ameriprise Certificate Company, since September 2010; Compliance Executive, Bank of America, 2005 – April 2010 | |
Colin Moore
225 Franklin Street
Boston, MA 02110
Born 1958 | | Senior Vice President (2010) | | Executive Vice President and Global Chief Investment Officer, Ameriprise Financial, Inc. since July 2013; Director and Global Chief Investment Officer, Columbia Management Investment Advisers, LLC since May 2010; Manager, Managing Director and Chief Investment Officer, Columbia Management Advisors, LLC, 2007 – April 2010 | |
Michael E. DeFao
225 Franklin Street
Boston, MA 02110
Born 1968 | | Vice President (2011) and Assistant Secretary (2010) | | Vice President and Chief Counsel, Ameriprise Financial, Inc. since May 2010; Associate General Counsel, Bank of America 2005 – April 2010 | |
Joseph F. DiMaria
225 Franklin Street
Boston, MA 02110
Born 1968 | | Vice President (2011) and Chief Accounting Officer (2008) | | Vice President — Mutual Fund Treasurer, Columbia Management Investment Advisers, LLC since May 2010; Director of Fund Administration, Columbia Management Advisors, LLC, 2006 – April 2010 | |
Paul B. Goucher
100 Park Avenue
New York, NY 10017
Born 1968 | | Vice President (2011) and Assistant Secretary (2008) | | Vice President and Lead Chief Counsel, Ameriprise Financial, Inc. since November 2008 and January 2013, respectively (previously Chief Counsel, January 2010 – January 2013, and Group Counsel, November 2008 – January 2010); Director, Managing Director and General Counsel, J. & W. Seligman & Co. Incorporated, July 2008 – November 2008 | |
Amy Johnson
5228 Ameriprise Financial
Center
Minneapolis, MN 55474
Born 1965 | | Vice President (2006) | | Managing Director and Chief Operating Officer, Columbia Management Investment Advisers, LLC since May 2010 (previously Chief Administrative Officer, 2009 – April 2010, and Vice President — Asset Management and Trust Company Services, 2006 – 2009) | |
Annual Report 2014
43
Columbia Convertible Securities Fund
Trustees and Officers (continued)
Officers (continued)
Name,
Address and
Year of Birth | | Position and Year
First Appointed to
Position for any Fund
in the Columbia
Funds Complex or a
Predecessor Thereof | | Principal Occupation(s) During Past Five Years | |
Paul D. Pearson
5228 Ameriprise Financial
Center
Minneapolis, MN 55474
Born 1956 | | Vice President (2011) and Assistant Treasurer (1999) | | Vice President — Investment Accounting, Columbia Management Investment Advisers, LLC since May 2010; Vice President — Managed Assets, Investment Accounting, Ameriprise Financial, Inc., 1998 – April 2010 | |
Christopher O. Petersen
5228 Ameriprise Financial Center
Minneapolis, MN 55474
Born 1970 | | Vice President and Secretary (2010) | | Vice President and Chief Counsel, Ameriprise Financial, Inc., since January 2010 (previously Vice President and Group Counsel or Counsel, 2004 – January 2010); officer of Columbia Funds and affiliated funds since 2007 | |
Stephen T. Welsh
225 Franklin Street
Boston, MA 02110
Born 1957 | | Vice President (2006) | | President and Director, Columbia Management Investment Services Corp. since May 2010; President and Director, Columbia Management Services, Inc., 2004 – April 2010; Managing Director, Columbia Management Distributors, Inc., 2007 – April 2010 | |
Annual Report 2014
44
Columbia Convertible Securities Fund
Important Information About This Report
Each fund mails one shareholder report to each shareholder address. If you would like more than one report, please call shareholder services at 800.345.6611 and additional reports will be sent to you.
The policy of the Board is to vote the proxies of the companies in which each fund holds investments consistent with the procedures as stated in the Statement of Additional Information (SAI). You may obtain a copy of the SAI without charge by calling 800.345.6611; contacting your financial intermediary; visiting columbiamanagement.com; or searching the website of the Securities and Exchange Commission (SEC) at sec.gov. Information regarding how each fund voted proxies relating to portfolio securities is filed with the SEC by August 31 for the most recent 12-month period ending June 30 of that year, and is available without charge by visiting columbiamanagement.com; or searching the website of the SEC at sec.gov.
Each fund files a complete schedule of portfolio holdings with the SEC for the first and third quarters of each fiscal year on Form N-Q. Each fund's Form N-Q is available on the SEC's website at sec.gov and may be reviewed and copied at the SEC's Public Reference Room in Washington, D.C. Information on the operation of the Public Reference Room may be obtained by calling 800.SEC.0330. Each fund's complete schedule of portfolio holdings, as filed on Form N-Q, can also be obtained without charge, upon request, by calling 800.345.6611.
Annual Report 2014
45

Columbia Convertible Securities Fund
P.O. Box 8081
Boston, MA 02266-8081
columbiamanagement.com
This information is for use with concurrent or prior delivery of a fund prospectus. Please read and consider the investment objectives, risks, charges and expenses for any fund carefully before investing. For a prospectus and, if available, a summary prospectus, which contains this and other important information about the Fund go to columbiamanagement.com. The Fund is distributed by Columbia Management Investment Distributors, Inc., member FINRA, and managed by Columbia Management Investment Advisers, LLC.
© 2014 Columbia Management Investment Advisers, LLC. All rights reserved.
ANN134_02_D01_(04/14)
Annual Report
February 28, 2014

Columbia International Value Fund
Not FDIC insured • No bank guarantee • May lose value
 Dear Shareholders,
Equities recovered
In the final months of 2013, the U.S. economy embraced a robust recovery. After five years of only modest progress, the pace of economic growth picked up, job gains continued, manufacturing activity accelerated and a rebound in the housing market showed staying power. Growth, as measured by gross domestic product, was 4.1% in the third quarter, with expectations for a solid fourth quarter. Job growth averaged close to 200,000 monthly. Industrial production rose at a rate of 3.3%, considerably higher than the 12-month average of 2.5%. Factories were busier than at any point since the 2008/2009 recession, with capacity utilization at 79%. Orders for durable goods were strong, bolstered by rising auto sales. Holiday spending was solid, especially online sales, which rose 10% year over year, despite a shorter season.
Against this backdrop, the Federal Reserve's (the Fed's) announcement that it would slowly retreat from its monthly bond buying program and a bipartisan budget deal in Washington were welcome news for investors. Stocks climbed to new highs in the fourth quarter, while bonds retreated as yields moved higher. Small-cap stocks outperformed large- and mid-cap stocks, led by significant gains from the industrials, technology and consumer discretionary sectors. All 10 sectors of the S&P 500 Index delivered positive returns, although telecommunications and utilities posted only modest gains.
Fixed-income retreated
Improved economic data drove interest rates higher over the fourth quarter, credit spreads narrowed and the dollar weakened against most developed market currencies. Against this backdrop, most non-Treasury, fixed-income sectors delivered positive returns. Outgoing Fed chairman Ben Bernanke expressed concern about the persistently low level of core inflation, but gains in the labor market and reduced unemployment led to the Fed's decision to taper its bond-buying program gradually beginning in January 2014.
As the stock market soared, the riskiest sectors of the fixed-income markets fared the best. U.S. and foreign high-yield bonds were the strongest performers, followed by emerging-market and U.S. investment-grade corporate bonds. U.S. mortgage-backed securities (MBS) and securitized bonds produced negative total returns, as did U.S. Treasuries and developed world government bonds. Treasury inflation-protected bonds were the period's biggest losers. Investment-grade municipals delivered fractional gains, as better economic conditions helped steady state finances.
Stay on track with Columbia Management
Backed by more than 100 years of experience, Columbia Management is one of the nation's largest asset managers. At the heart of our success and, most importantly, that of our investors, are highly talented industry professionals, brought together by a unique way of working. At Columbia Management, reaching our performance goals matters, and how we reach them matters just as much.
Visit columbiamanagement.com for:
> The Columbia Management Perspectives blog, offering insights on current market events and investment opportunities
> Detailed up-to-date fund performance and portfolio information
> Quarterly fund commentaries
> Columbia Management Investor, our award-winning quarterly newsletter for shareholders
Thank you for your continued support of the Columbia Funds. We look forward to serving your investment needs for many years to come.
Best Regards,

J. Kevin Connaughton
President, Columbia Funds
Investing involves risk including the risk of loss of principal.
The S&P 500 Index, an unmanaged index, measures the performance of 500 widely held, large-capitalization U.S. stocks and is frequently used as a general measure of market performance. The Dow Jones Industrial Average is a price weighted average of 30 actively traded shares of blue chip US industrial corporations listed on the New York Stock Exchange. Indices are not available for investment, are not professionally managed and do not reflect sales charges, fees, brokerage commissions, taxes or other expenses of investing.
Investors should consider the investment objectives, risks, charges and expenses of a mutual fund carefully before investing. For a free prospectus and, if available, a summary prospectus, which contains this and other important information about a fund, visit columbiamanagement.com. The prospectus should be read carefully before investing.
Columbia Funds are distributed by Columbia Management Investment Distributors, Inc., member FINRA, and managed by Columbia Management Investment Advisers, LLC.
© 2014 Columbia Management Investment Advisers, LLC. All rights reserved.
Columbia International Value Fund
Performance Overview | | | 2 | | |
Manager Discussion of Fund Performance | | | 4 | | |
Understanding Your Fund's Expenses | | | 8 | | |
Portfolio of Investments | | | 9 | | |
Statement of Assets and Liabilities | | | 15 | | |
Statement of Operations | | | 17 | | |
Statement of Changes in Net Assets | | | 18 | | |
Financial Highlights | | | 20 | | |
Notes to Financial Statements | | | 28 | | |
Report of Independent Registered
Public Accounting Firm | | | 38 | | |
Federal Income Tax Information | | | 39 | | |
Trustees and Officers | | | 40 | | |
Approval of Investment Management
Services Agreement | | | 46 | | |
Important Information About This Report | | | 49 | | |
Fund Investment Manager
Columbia Management Investment
Advisers, LLC
225 Franklin Street
Boston, MA 02110
Fund Distributor
Columbia Management Investment
Distributors, Inc.
225 Franklin Street
Boston, MA 02110
Fund Transfer Agent
Columbia Management Investment
Services Corp.
P.O. Box 8081
Boston, MA 02266-8081
For more information about any of the funds, please visit columbiamanagement.com or call 800.345.6611. Customer Service Representatives are available to answer your questions Monday through Friday from 8 a.m. to 7 p.m. Eastern time.
The views expressed in this report reflect the current views of the respective parties. These views are not guarantees of future performance and involve certain risks, uncertainties and assumptions that are difficult to predict, so actual outcomes and results may differ significantly from the views expressed. These views are subject to change at any time based upon economic, market or other conditions and the respective parties disclaim any responsibility to update such views. These views may not be relied on as investment advice and, because investment decisions for a Columbia Fund are based on numerous factors, may not be relied on as an indication of trading intent on behalf of any particular Columbia Fund. References to specific securities should not be construed as a recommendation or investment advice.
Columbia International Value Fund
Performance Summary
> Columbia International Value Fund (the Fund) Class A shares returned 26.87% excluding sales charges for the 12-month period that ended February 28, 2014.
> The Fund outperformed its benchmark, the MSCI EAFE Value Index (Net), which returned 21.15% for the same period.
> Stock picking drove the Fund's strong performance for the period, with particularly good results in the consumer discretionary, health care and financials sectors. A position in U.S. stocks also aided relative results, as the United States is not included in the benchmark.
Average Annual Total Returns (%) (for period ended February 28, 2014)
| | Inception | | 1 Year | | 5 Years | | 10 Years | |
Class A | | 12/27/95 | | | | | | | | | | | | | |
Excluding sales charges | | | | | | | 26.87 | | | | 14.41 | | | | 6.00 | | |
Including sales charges | | | | | | | 19.61 | | | | 13.07 | | | | 5.37 | | |
Class B | | 05/22/98 | | | | | | | | | | | | | |
Excluding sales charges | | | | | | | 25.96 | | | | 13.59 | | | | 5.22 | | |
Including sales charges | | | | | | | 20.96 | | | | 13.35 | | | | 5.22 | | |
Class C | | 06/15/98 | | | | | | | | | | | | | |
Excluding sales charges | | | | | | | 25.88 | | | | 13.54 | | | | 5.20 | | |
Including sales charges | | | | | | | 24.88 | | | | 13.54 | | | | 5.20 | | |
Class I* | | 09/27/10 | | | 27.35 | | | | 13.88 | | | | 5.75 | | |
Class R* | | 09/27/10 | | | 26.50 | | | | 14.08 | | | | 5.70 | | |
Class R4* | | 11/08/12 | | | 27.21 | | | | 14.49 | | | | 6.04 | | |
Class R5* | | 11/08/12 | | | 27.34 | | | | 14.51 | | | | 6.05 | | |
Class Z | | 12/27/95 | | | 27.13 | | | | 14.67 | | | | 6.26 | | |
MSCI EAFE Value Index (Net) | | | | | | | 21.15 | | | | 17.86 | | | | 6.58 | | |
Returns for Class A are shown with and without the maximum initial sales charge of 5.75%. Returns for Class B are shown with and without the applicable contingent deferred sales charge (CDSC) of 5.00% in the first year, declining to 1.00% in the sixth year and eliminated thereafter. Returns for Class C are shown with and without the 1.00% CDSC for the first year only. The Fund's other classes are not subject to sales charges and have limited eligibility. Please see the Fund's prospectus for details. Performance for different share classes will vary based on differences in sales charges and fees associated with each class. All results shown assume reinvestment of distributions during the period. Returns do not reflect the deduction of taxes that a shareholder may pay on Fund distributions or on the redemption of Fund shares. Performance results reflect the effect of any fee waivers or reimbursements of Fund expenses by Columbia Management Investment Advisers, LLC and/or any of its affiliates. Absent these fee waivers or expense reimbursement arrangements, performance results would have been lower.
The performance information shown represents past performance and is not a guarantee of future results. The investment return and principal value of your investment will fluctuate so that your shares, when redeemed, may be worth more or less than their original cost. Current performance may be lower or higher than the performance information shown. You may obtain performance information current to the most recent month-end by contacting your financial intermediary, visiting columbiamanagement.com or calling 800.345.6611.
*The returns shown for periods prior to the share class inception date (including returns for the Life of the Fund, if shown, which are since Fund inception) include the returns of the Fund's oldest share class. Since the Fund launched more than one share class at its inception, Class A shares were used. These returns are adjusted to reflect any higher class-related operating expenses of the newer share classes, as applicable. Please visit columbiamanagement.com/mutual-funds/appended-performance for more information.
The MSCI EAFE Value Index (Net) is a subset of the MSCI EAFE Index (Net), and constituents of the index include securities from Europe, Australasia and the Far East. The index generally represents approximately 50% of the free float-adjusted market capitalization of the MSCI EAFE Index (Net), and consists of those securities classified by MSCI Inc. as most representing the value style, such as, higher book value-to-price ratios, higher forward earnings-to-price ratios, higher dividend yields and lower forecasted growth rates than securities representing the growth style.
Indices are not available for investment, are not professionally managed and do not reflect sales charges, fees, brokerage commissions, taxes (except the MSCI EAFE Value Index (Net), which reflects reinvested dividends net of withholding taxes) or other expenses of investing. Securities in the Fund may not match those in an index.
Annual Report 2014
2
Columbia International Value Fund
Performance Overview (continued)
Performance of a Hypothetical $10,000 Investment (March 1, 2004 – February 28, 2014)
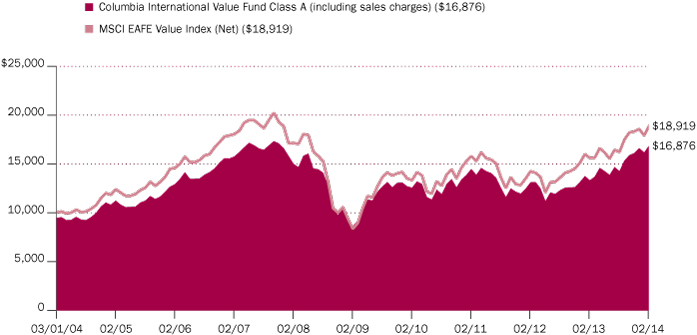
The chart above shows the change in value of a hypothetical $10,000 investment in Class A shares of Columbia International Value Fund during the stated time period, and does not reflect the deduction of taxes that a shareholder may pay on Fund distributions or on the redemption of Fund shares.
Annual Report 2014
3
Columbia International Value Fund
Manager Discussion of Fund Performance
For the 12-month period that ended February 28, 2014, the Fund's Class A shares returned 26.87% excluding sales charges. The Fund outperformed its benchmark, the MSCI EAFE Value Index (Net), which returned 21.15% for the same period. Stock selection drove the Fund's strong performance for the period, with particularly good results in the consumer discretionary health care and financials sectors. A position in U.S. stocks, which are not included in the benchmark, also aided relative results as the U.S. market was one of the strongest performers for the period.
Broad Rally in Global Stock Markets
Stocks celebrated a year of strong performance, as international equities posted solid returns for the 12-month period that ended February 28, 2014. Stabilizing economic growth, accommodating global bank policy and undemanding valuations triggered a rise in stock markets around the world. However, emerging markets did not participate in the rally. Fears of reduced capital flow, as the Federal Reserve winds down its stimulus, and developing unrest in Eastern Europe weighed on returns in emerging markets. Yet, most emerging markets turned positive in the final month of the period.
Top-performing international markets were clustered in Europe, with Ireland, Greece and Spain showing good results. Japan was a strong performer, helped by Prime Minister Abe's efforts to jumpstart a meaningful economic recovery after years of stagnation.
Contributors and Detractors
Stock selection helped the Fund edge out its benchmark for the period, and out-of-benchmark positions were the strongest performers. Within the consumer discretionary sector, auto-related stocks aided relative results. Kongsberg Automotive, a Norwegian company that makes parts and small trucks, and Fuji Heavy Industries, a Japanese manufacturer of autos and trucks, rose strongly. Fuji was a big beneficiary of government policy. In the financials sector, insurance stocks made a strong contribution to return. Overweights in Aviva and CNP Assurances helped the contribution of their strong performances for the period. Within the health care sector, Jazz Pharmaceuticals, a maker of cancer drugs and pain medications domiciled in Ireland, was a top contributor to performance. Recordati SpA, a pharmaceutical company based in Milan, Italy, also generated a strong return for the Fund. Neither stocks are included in the benchmark.
Stock selection in the telecommunications and utilities sectors generally detracted from relative performance. The Fund's lack of exposure to some of the best performers within the sectors, as represented by the benchmark, hampered results. An out-of-benchmark position in Energy Development, a geothermal power supplier in the Philippines, further weighed on returns as the company experienced a delay in bringing new power-generating utilities online.
Portfolio Management
Fred Copper, CFA
Daisuke Nomoto, CMA (SAAJ)
Effective June 2013, Mr. Copper was named a Portfolio Manager of the Fund as Columbia Management Investment Advisers, LLC assumed the day-to-day investment management responsibilities for the Fund. Prior to this change, Brandes Investment Partners, L.P. had served as the Fund's subadvisor. Effective August 2013, Mr. Nomoto was named a Portfolio Manager of the Fund.
Morningstar Style BoxTM
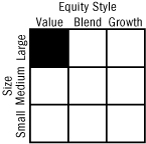
The Morningstar Style BoxTM is based on a fund's portfolio holdings. For equity funds, the vertical axis shows the market capitalization of the stocks owned, and the horizontal axis shows investment style (value, blend, or growth). Information shown is based on the most recent data provided by Morningstar.
© 2014 Morningstar, Inc. All rights reserved. The Morningstar information contained herein: (1) is proprietary to Morningstar and/or its content providers; (2) may not be copied or distributed; and (3) is not warranted to be accurate, complete or timely. Neither Morningstar nor its content providers are responsible for any damages or losses arising from any use of this information.
Investment Risks
International investing involves special risks, including foreign taxation, currency risks, risks associated with possible differences in financial standards and other monetary and political risks. See the Fund's prospectus for more information on these and other risks.
Annual Report 2014
4
Columbia International Value Fund
Manager Discussion of Fund Performance (continued)
The Fund uses currency contracts as part of its overall investment strategy, primarily to hedge benchmark relative currency risk. On occasion, some active currency positions may also be taken through the use of currency contracts. The currency hedging policy detracted from Fund results during the period as the currency exposures resulting from our active country positions would have outperformed the benchmark currency basket had we not hedged them. They performed as expected, however, which was to eliminate the active currency positions that resulted from our country/stock selection process, which to us simply represents uncompensated risk.
Looking Ahead
At this time, we are positive in our outlook for international stock markets in 2014. We believe the global economy is stabilizing at present, even though growth remains modest. Against that backdrop, we have currently positioned the Fund to respond to cyclical recovery in Europe and to ongoing monetary stimulus. Longer term, we remain concerned about the high level of debt in developed markets and the potential for slowing growth, which we believe is likely to result in greater volatility and pressure on equity returns around the world.
Top Ten Holdings (%)
(at February 28, 2014) | |
Royal Dutch Shell PLC, Class B
(United Kingdom) | | | 3.8 | | |
HSBC Holdings PLC
(United Kingdom) | | | 3.3 | | |
Allianz SE, Registered Shares
(Germany) | | | 2.2 | | |
GlaxoSmithKline PLC
(United Kingdom) | | | 2.2 | | |
BNP Paribas SA (France) | | | 2.2 | | |
Sumitomo Mitsui Financial
Group, Inc. (Japan) | | | 2.0 | | |
AXA SA (France) | | | 2.0 | | |
Total SA (France) | | | 1.8 | | |
Australia and New Zealand
Banking Group Ltd. (Australia) | | | 1.8 | | |
Sanofi (France) | | | 1.8 | | |
Percentages indicated are based upon total investments (excluding Money Market Funds).
For further detail about these holdings, please refer to the section entitled "Portfolio of Investments."
Fund holdings are as of the date given, are subject to change at any time, and are not recommendations to buy or sell any security.
Country Breakdown (%)
(at February 28, 2014) | |
Australia | | | 4.8 | | |
Belgium | | | 1.3 | | |
Canada | | | 0.6 | | |
Denmark | | | 0.6 | | |
France | | | 9.3 | | |
Germany | | | 9.7 | | |
Hong Kong | | | 1.0 | | |
Ireland | | | 4.2 | | |
Italy | | | 2.2 | | |
Japan | | | 20.1 | | |
Netherlands | | | 4.2 | | |
Norway | | | 1.5 | | |
Singapore | | | 1.5 | | |
South Korea | | | 2.3 | | |
Spain | | | 2.5 | | |
Sweden | | | 2.8 | | |
Switzerland | | | 5.8 | | |
Taiwan | | | 0.5 | | |
United Kingdom | | | 19.9 | | |
United States(a) | | | 5.2 | | |
Total | | | 100.0 | | |
Percentages indicated are based upon total investments. The Fund's portfolio composition is subject to change.
(a) Includes investments in Money Market Funds.
Annual Report 2014
5
Columbia International Value Fund
Manager Discussion of Fund Performance (continued)
Summary of Investments in Securities
by Industry (%)
(at February 28, 2014) | |
| Industry | | Percentage of
Net Assets (%) | |
Aerospace & Defense | | | 1.2 | | |
Auto Components | | | 4.0 | | |
Automobiles | | | 1.9 | | |
Beverages | | | 0.5 | | |
Biotechnology | | | 3.1 | | |
Capital Markets | | | 1.7 | | |
Chemicals | | | 1.4 | | |
Commercial Banks | | | 18.8 | | |
Commercial Services &
Supplies | | | 0.4 | | |
Communications Equipment | | | 0.5 | | |
Construction & Engineering | | | 0.2 | | |
Containers & Packaging | | | 1.3 | | |
Diversified Financial Services | | | 2.7 | | |
Diversified Telecommunication
Services | | | 0.9 | | |
Electric Utilities | | | 1.3 | | |
Electronic Equipment,
Instruments & Components | | | 0.8 | | |
Energy Equipment & Services | | | 0.3 | | |
Food & Staples Retailing | | | 2.1 | | |
Food Products | | | 0.4 | | |
Gas Utilities | | | 0.3 | | |
Health Care Equipment &
Supplies | | | 0.5 | | |
Household Durables | | | 1.8 | | |
Industrial Conglomerates | | | 2.7 | | |
Insurance | | | 10.3 | | |
Internet & Catalog Retail | | | 1.5 | | |
IT Services | | | 2.3 | | |
Machinery | | | 4.5 | | |
Media | | | 2.2 | | |
Metals & Mining | | | 3.0 | | |
Oil, Gas & Consumable Fuels | | | 9.5 | | |
Pharmaceuticals | | | 6.3 | | |
Professional Services | | | 1.2 | | |
Real Estate Management &
Development | | | 1.0 | | |
Road & Rail | | | 1.0 | | |
Semiconductors &
Semiconductor Equipment | | | 0.2 | | |
Specialty Retail | | | 0.2 | | |
Annual Report 2014
6
Columbia International Value Fund
Manager Discussion of Fund Performance (continued)
Summary of Investments in Securities
by Industry (%) (continued)
(at February 28, 2014) | |
| Industry | | Percentage of
Net Assets (%) | |
Textiles, Apparel & Luxury
Goods | | | 1.3 | | |
Tobacco | | | 0.7 | | |
Trading Companies &
Distributors | | | 1.8 | | |
Wireless Telecommunication
Services | | | 3.9 | | |
Money Market Funds | | | 0.4 | | |
Total | | | 100.1 | | |
Percentages indicated are based upon net assets. The Fund's portfolio composition is subject to change.
Annual Report 2014
7
Columbia International Value Fund
Understanding Your Fund's Expenses
(Unaudited)
As an investor, you incur two types of costs. There are transaction costs, which generally include sales charges on purchases and may include redemption fees. There are also ongoing costs, which generally include management fees, distribution and/or service fees, and other fund expenses. The following information is intended to help you understand your ongoing costs (in dollars) of investing in the Fund and to help you compare these costs with the ongoing costs of investing in other mutual funds.
Analyzing Your Fund's Expenses
To illustrate these ongoing costs, we have provided examples and calculated the expenses paid by investors in each share class of the Fund during the period. The actual and hypothetical information in the table is based on an initial investment of $1,000 at the beginning of the period indicated and held for the entire period. Expense information is calculated two ways and each method provides you with different information. The amount listed in the "Actual" column is calculated using the Fund's actual operating expenses and total return for the period. You may use the Actual information, together with the amount invested, to estimate the expenses that you paid over the period. Simply divide your account value by $1,000 (for example, an $8,600 account value divided by $1,000 = 8.6), then multiply the results by the expenses paid during the period under the "Actual" column. The amount listed in the "Hypothetical" column assumes a 5% annual rate of return before expenses (which is not the Fund's actual return) and then applies the Fund's actual expense ratio for the period to the hypothetical return. You should not use the hypothetical account values and expenses to estimate either your actual account balance at the end of the period or the expenses you paid during the period. See "Compare With Other Funds" below for details on how to use the hypothetical data.
Compare With Other Funds
Since all mutual funds are required to include the same hypothetical calculations about expenses in shareholder reports, you can use this information to compare the ongoing cost of investing in the Fund with other funds. To do so, compare the hypothetical example with the 5% hypothetical examples that appear in the shareholder reports of other funds. As you compare hypothetical examples of other funds, it is important to note that hypothetical examples are meant to highlight the ongoing costs of investing in a fund only and do not reflect any transaction costs, such as sales charges, or redemption or exchange fees. Therefore, the hypothetical calculations are useful in comparing ongoing costs only, and will not help you determine the relative total costs of owning different funds. If transaction costs were included in these calculations, your costs would be higher.
September 1, 2013 – February 28, 2014
| | Account Value at the Beginning
of the Period ($) | | Account Value at the End of the
Period ($) | | Expenses Paid During the
Period ($) | | Fund's Annualized
Expense Ratio (%) | |
| | Actual | | Hypothetical | | Actual | | Hypothetical | | Actual | | Hypothetical | | Actual | |
Class A | | | 1,000.00 | | | | 1,000.00 | | | | 1,184.80 | | | | 1,017.90 | | | | 7.68 | | | | 7.09 | | | | 1.41 | | |
Class B | | | 1,000.00 | | | | 1,000.00 | | | | 1,180.60 | | | | 1,014.16 | | | | 11.74 | | | | 10.85 | | | | 2.16 | | |
Class C | | | 1,000.00 | | | | 1,000.00 | | | | 1,180.50 | | | | 1,014.16 | | | | 11.74 | | | | 10.85 | | | | 2.16 | | |
Class I | | | 1,000.00 | | | | 1,000.00 | | | | 1,186.90 | | | | 1,020.19 | | | | 5.18 | | | | 4.78 | | | | 0.95 | | |
Class R | | | 1,000.00 | | | | 1,000.00 | | | | 1,183.20 | | | | 1,016.65 | | | | 9.04 | | | | 8.35 | | | | 1.66 | | |
Class R4 | | | 1,000.00 | | | | 1,000.00 | | | | 1,186.10 | | | | 1,019.25 | | | | 6.21 | | | | 5.74 | | | | 1.14 | | |
Class R5 | | | 1,000.00 | | | | 1,000.00 | | | | 1,186.40 | | | | 1,019.60 | | | | 5.83 | | | | 5.39 | | | | 1.07 | | |
Class Z | | | 1,000.00 | | | | 1,000.00 | | | | 1,186.30 | | | | 1,019.15 | | | | 6.32 | | | | 5.84 | | | | 1.16 | | |
Expenses paid during the period are equal to the annualized expense ratio for each class as indicated above, multiplied by the average account value over the period and then multiplied by the number of days in the Fund's most recent fiscal half year and divided by 365.
Expenses do not include fees and expenses incurred indirectly by the Fund from the underlying funds in which the Fund may invest (also referred to as "acquired funds"), including affiliated and non-affiliated pooled investment vehicles (including mutual funds and exchange-traded funds).
Had Columbia Management Investment Advisers, LLC and/or certain of its affiliates not waived/reimbursed certain fees and expenses, account value at the end of the period would have been reduced.
Annual Report 2014
8
Columbia International Value Fund
Portfolio of Investments
February 28, 2014
(Percentages represent value of investments compared to net assets)
Common Stocks 99.6%
Issuer | | Shares | | Value ($) | |
Australia 4.8% | |
Australia and New Zealand Banking
Group Ltd. | | | 169,301 | | | | 4,867,476 | | |
Commonwealth Bank of Australia | | | 16,087 | | | | 1,074,460 | | |
Macmahon Holdings Ltd.(a) | | | 4,150,382 | | | | 446,542 | | |
National Australia Bank Ltd. | | | 152,316 | | | | 4,736,868 | | |
Westpac Banking Corp. | | | 67,336 | | | | 2,020,887 | | |
Total | | | | | 13,146,233 | | |
Belgium 1.2% | |
Barco NV | | | 26,761 | | | | 2,118,776 | | |
Delhaize Group SA | | | 18,007 | | | | 1,295,198 | | |
Total | | | | | 3,413,974 | | |
Canada 0.6% | |
Cott Corp. | | | 150,901 | | | | 1,228,334 | | |
Eastern Platinum Ltd.(a) | | | 3,756,257 | | | | 305,304 | | |
Total | | | | | 1,533,638 | | |
Denmark 0.6% | |
Pandora A/S | | | 24,716 | | | | 1,675,010 | | |
France 9.3% | |
AXA SA | | | 203,492 | | | | 5,319,869 | | |
BNP Paribas SA | | | 72,004 | | | | 5,909,560 | | |
CNP Assurances | | | 159,281 | | | | 3,434,145 | | |
Metropole Television SA | | | 46,812 | | | | 1,088,756 | | |
Sanofi | | | 45,925 | | | | 4,775,191 | | |
Total SA | | | 75,483 | | | | 4,900,018 | | |
Total | | | | | 25,427,539 | | |
Germany 9.7% | |
Allianz SE, Registered Shares | | | 33,213 | | | | 5,945,956 | | |
Aurelius AG | | | 32,575 | | | | 1,286,624 | | |
Aurubis AG | | | 42,384 | | | | 2,359,412 | | |
BASF SE | | | 20,425 | | | | 2,351,830 | | |
Continental AG | | | 13,088 | | | | 3,185,828 | | |
Daimler AG, Registered Shares | | | 20,373 | | | | 1,898,720 | | |
Deutz AG(a) | | | 93,735 | | | | 1,022,251 | | |
Duerr AG | | | 24,259 | | | | 2,030,513 | | |
Freenet AG | | | 110,460 | | | | 3,734,703 | | |
Siemens AG, Registered Shares | | | 19,036 | | | | 2,542,407 | | |
Total | | | | | 26,358,244 | | |
Common Stocks (continued)
Issuer | | Shares | | Value ($) | |
Hong Kong 1.0% | |
Hongkong Land Holdings Ltd. | | | 188,000 | | | | 1,180,603 | | |
K Wah International Holdings Ltd. | | | 2,060,000 | | | | 1,599,327 | | |
Total | | | | | 2,779,930 | | |
Ireland 4.2% | |
DCC PLC | | | 40,954 | | | | 2,169,172 | | |
Dragon Oil PLC | | | 332,654 | | | | 3,372,914 | | |
Jazz Pharmaceuticals PLC(a) | | | 14,232 | | | | 2,162,481 | | |
Smurfit Kappa Group PLC | | | 129,815 | | | | 3,617,719 | | |
Total | | | | | 11,322,286 | | |
Italy 2.2% | |
ENI SpA | | | 126,758 | | | | 3,058,373 | | |
Recordati SpA | | | 156,631 | | | | 2,881,917 | | |
Total | | | | | 5,940,290 | | |
Japan 20.2% | |
Aisin Seiki Co., Ltd. | | | 53,400 | | | | 1,859,515 | | |
Central Japan Railway Co. | | | 22,800 | | | | 2,661,037 | | |
CyberAgent, Inc. | | | 38,748 | | | | 1,707,033 | | |
Daiichikosho Co., Ltd. | | | 104,100 | | | | 3,133,981 | | |
Fuji Heavy Industries Ltd. | | | 123,400 | | | | 3,349,642 | | |
Fuji Machine Manufacturing Co., Ltd. | | | 71,800 | | | | 620,758 | | |
Fujitsu General Ltd. | | | 167,000 | | | | 1,710,546 | | |
Fuyo General Lease Co., Ltd. | | | 74,500 | | | | 2,515,641 | | |
Hino Motors Ltd. | | | 158,000 | | | | 2,344,783 | | |
Iida Group Holdings Co., Ltd.(a) | | | 109,044 | | | | 1,658,628 | | |
IT Holdings Corp. | | | 176,200 | | | | 3,044,160 | | |
ITOCHU Corp. | | | 240,300 | | | | 2,994,597 | | |
Japan Tobacco, Inc. | | | 57,500 | | | | 1,831,360 | | |
Kanamoto Co., Ltd. | | | 65,000 | | | | 1,850,128 | | |
KDDI Corp. | | | 43,400 | | | | 2,654,155 | | |
Mitsubishi UFJ Financial Group, Inc. | | | 731,131 | | | | 4,236,652 | | |
NAC Co., Ltd. | | | 66,200 | | | | 1,064,755 | | |
Nakanishi, Inc. | | | 7,800 | | | | 1,268,192 | | |
Namura Shipbuilding Co., Ltd. | | | 145,300 | | | | 1,494,743 | | |
Nihon M&A Center, Inc. | | | 23,500 | | | | 1,895,901 | | |
NuFlare Technology, Inc. | | | 8,002 | | | | 575,145 | | |
Sumitomo Mitsui Financial Group, Inc. | | | 121,442 | | | | 5,452,509 | | |
Temp Holdings Co., Ltd. | | | 45,000 | | | | 1,330,605 | | |
The accompanying Notes to Financial Statements are an integral part of this statement.
Annual Report 2014
9
Columbia International Value Fund
Portfolio of Investments (continued)
February 28, 2014
Common Stocks (continued)
Issuer | | Shares | | Value ($) | |
Tokyo Gas Co., Ltd. | | | 174,000 | | | | 874,095 | | |
TS Tech Co., Ltd. | | | 67,700 | | | | 2,216,526 | | |
Yodogawa Steel Works Ltd. | | | 162,000 | | | | 675,927 | | |
Total | | | | | 55,021,014 | | |
Netherlands 4.2% | |
ING Groep NV-CVA(a) | | | 304,477 | | | | 4,442,251 | | |
Koninklijke Ahold NV | | | 236,933 | | | | 4,419,928 | | |
Koninklijke Philips NV | | | 77,334 | | | | 2,707,032 | | |
Total | | | | | 11,569,211 | | |
Norway 1.5% | |
Atea ASA | | | 82,153 | | | | 879,428 | | |
Electromagnetic GeoServices(a) | | | 630,803 | | | | 780,884 | | |
Kongsberg Automotive Holding ASA(a) | | | 2,552,136 | | | | 2,406,713 | | |
Total | | | | | 4,067,025 | | |
Singapore 1.5% | |
DBS Group Holdings Ltd. | | | 320,000 | | | | 4,174,445 | | |
South Korea 2.3% | |
GS Home Shopping, Inc. | | | 7,431 | | | | 1,805,761 | | |
Hyundai Home Shopping Network Corp. | | | 15,067 | | | | 2,372,885 | | |
LG Fashon Corp. | | | 53,480 | | | | 1,392,244 | | |
Youngone Holdings Co., Ltd. | | | 8,433 | | | | 584,211 | | |
Total | | | | | 6,155,101 | | |
Spain 2.5% | |
Banco Bilbao Vizcaya Argentaria SA | | | 266,280 | | | | 3,306,080 | | |
Iberdrola SA | | | 517,555 | | | | 3,441,175 | | |
Total | | | | | 6,747,255 | | |
Sweden 2.8% | |
MQ Holding AB | | | 117,031 | | | | 434,418 | | |
Nordea Bank AB | | | 256,229 | | | | 3,670,605 | | |
Saab AB, Class B | | | 127,160 | | | | 3,518,312 | | |
Total | | | | | 7,623,335 | | |
Switzerland 5.8% | |
Autoneum Holding AG | | | 7,017 | | | | 1,251,811 | | |
Baloise Holding AG, Registered Shares | | | 26,560 | | | | 3,424,564 | | |
Bucher Industries AG, Registered Shares | | | 5,507 | | | | 1,685,912 | | |
Georg Fischer AG, Registered Shares | | | 3,773 | | | | 3,024,406 | | |
Nestlé SA, Registered Shares | | | 14,864 | | | | 1,125,574 | | |
Common Stocks (continued)
Issuer | | Shares | | Value ($) | |
Novartis AG, Registered Shares | | | 16,608 | | | | 1,386,990 | | |
Zurich Insurance Group AG | | | 12,707 | | | | 3,893,731 | | |
Total | | | | | 15,792,988 | | |
Taiwan 0.5% | |
Wistron NeWeb Corp. | | | 510,000 | | | | 1,326,716 | | |
United Kingdom 19.9% | |
Amarin Corp. PLC, ADR(a) | | | 472,521 | | | | 822,186 | | |
Antofagasta PLC | | | 95,970 | | | | 1,447,163 | | |
Aviva PLC | | | 477,088 | | | | 3,783,629 | | |
Barclays PLC | | | 722,070 | | | | 3,048,250 | | |
| BP PLC | | | 491,968 | | | | 4,155,376 | | |
Crest Nicholson Holdings PLC(a) | | | 245,501 | | | | 1,570,006 | | |
GlaxoSmithKline PLC | | | 211,771 | | | | 5,927,496 | | |
HSBC Holdings PLC | | | 861,909 | | | | 9,088,527 | | |
Intermediate Capital Group PLC | | | 447,218 | | | | 3,370,751 | | |
Lancashire Holdings Ltd. | | | 177,235 | | | | 2,176,948 | | |
Rio Tinto PLC | | | 32,039 | | | | 1,841,568 | | |
Royal Dutch Shell PLC, Class B | | | 264,956 | | | | 10,324,488 | | |
Vodafone Group PLC | | | 856,285 | | | | 3,570,394 | | |
Vodafone Group PLC, ADR | | | 18,540 | | | | 770,685 | | |
Xchanging PLC | | | 758,756 | | | | 2,242,566 | | |
Total | | | | | 54,140,033 | | |
United States 4.8% | |
Ariad Pharmaceuticals, Inc.(a) | | | 58,924 | | | | 512,050 | | |
Auspex Pharmaceuticals, Inc.(a) | | | 32,128 | | | | 793,562 | | |
CF Industries Holdings, Inc. | | | 6,229 | | | | 1,562,856 | | |
Dynavax Technologies Corp.(a) | | | 368,281 | | | | 685,003 | | |
Gilead Sciences, Inc.(a) | | | 14,401 | | | | 1,192,259 | | |
Infinity Pharmaceuticals, Inc.(a) | | | 67,306 | | | | 1,055,358 | | |
Insmed, Inc.(a) | | | 42,436 | | | | 849,144 | | |
Keryx Biopharmaceuticals, Inc.(a) | | | 37,609 | | | | 603,624 | | |
Pharmacyclics, Inc.(a) | | | 4,543 | | | | 629,932 | | |
Stillwater Mining Co.(a) | | | 111,166 | | | | 1,505,188 | | |
Verizon Communications, Inc. | | | 41,287 | | | | 1,957,829 | | |
Verizon Communications, Inc. | | | 8,939 | | | | 425,324 | | |
Vertex Pharmaceuticals, Inc.(a) | | | 15,007 | | | | 1,213,466 | | |
Total | | | | | 12,985,595 | | |
Total Common Stocks
(Cost: $238,683,318) | | | | | 271,199,862 | | |
The accompanying Notes to Financial Statements are an integral part of this statement.
Annual Report 2014
10
Columbia International Value Fund
Portfolio of Investments (continued)
February 28, 2014
Exchange-Traded Funds 0.1%
| | | Shares | | Value ($) | |
iShares MSCI EAFE ETF | | | 4,011 | | | | 270,542 | | |
Total Exchange-Traded Funds
(Cost: $271,196) | | | | | 270,542 | | |
Money Market Funds 0.4%
| | | Shares | | Value ($) | |
Columbia Short-Term Cash Fund,
0.098%(b)(c) | | | 1,008,820 | | | | 1,008,820 | | |
Total Money Market Funds
(Cost: $1,008,820) | | | | | 1,008,820 | | |
Total Investments
(Cost: $239,963,334) | | | | | 272,479,224 | | |
Other Assets & Liabilities, Net | | | | | (142,450 | ) | |
Net Assets | | | | | 272,336,774 | | |
Investments in Derivatives
Forward Foreign Currency Exchange Contracts Open at February 28, 2014
Counterparty | | Exchange Date | | Currency to
be Delivered | | Currency to
be Received | | Unrealized
Appreciation ($) | | Unrealized
Depreciation ($) | |
Toronto Dominion
| | 03/27/14
| | | 1,511,000
CAD | | | | 1,352,639
USD | | | | —
| | | | (11,178
| ) | |
Toronto Dominion
| | 03/27/14
| | | 2,400,000
CHF | | | | 2,674,255
USD | | | | —
| | | | (55,068
| ) | |
Toronto Dominion
| | 03/27/14
| | | 2,955,000
DKK | | | | 537,648
USD | | | | —
| | | | (9,026
| ) | |
Toronto Dominion
| | 03/27/14
| | | 361,110,000
JPY | | | | 3,515,006
USD | | | | —
| | | | (33,717
| ) | |
Toronto Dominion
| | 03/27/14
| | | 6,458,869,000
KRW | | | | 5,948,215
USD | | | | —
| | | | (77,826
| ) | |
Toronto Dominion
| | 03/27/14
| | | 3,551,000
SEK | | | | 544,576
USD | | | | —
| | | | (9,040
| ) | |
Toronto Dominion
| | 03/27/14
| | | 80,360,000
TWD | | | | 2,651,753
USD | | | | —
| | | | (768
| ) | |
Toronto Dominion
| | 03/27/14
| | | 7,063,438
USD | | | | 8,063,000
AUD | | | | 120,082
| | | | —
| | |
Toronto Dominion
| | 03/27/14
| | | 530,705
USD | | | | 1,279,000
BRL | | | | 11,170
| | | | —
| | |
Toronto Dominion
| | 03/27/14
| | | 1,591,819
USD | | | | 1,167,000
EUR | | | | 18,964
| | | | —
| | |
Toronto Dominion
| | 03/27/14
| | | 15,644,300
USD | | | | 9,482,000
GBP | | | | 230,960
| | | | —
| | |
Toronto Dominion
| | 03/27/14
| | | 537,496
USD | | | | 6,449,955,000
IDR | | | | 17,884
| | | | —
| | |
Toronto Dominion
| | 03/27/14
| | | 817,246
USD | | | | 2,857,000
ILS | | | | 1,572
| | | | —
| | |
Toronto Dominion
| | 03/27/14
| | | 801,834
USD | | | | 985,000
NZD | | | | 22,555
| | | | —
| | |
Toronto Dominion
| | 03/27/14
| | | 812,888
USD | | | | 1,036,000
SGD | | | | 4,377
| | | | —
| | |
| | | | | | | | | | 427,564 | | | | (196,623 | ) | |
The accompanying Notes to Financial Statements are an integral part of this statement.
Annual Report 2014
11
Columbia International Value Fund
Portfolio of Investments (continued)
February 28, 2014
Notes to Portfolio of Investments
(a) Non-income producing.
(b) The rate shown is the seven-day current annualized yield at February 28, 2014.
(c) As defined in the Investment Company Act of 1940, an affiliated company is one in which the Fund owns 5% or more of its outstanding voting securities, or a company which is under common ownership or control with the Fund. Holdings and transactions in these affiliated companies during the year ended February 28, 2014, are as follows:
Issuer | | Beginning
Cost ($) | | Purchase
Cost ($) | | Proceeds
From Sales ($) | | Ending
Cost ($) | | Dividends —
Affiliated
Issuers ($) | | Value ($) | |
Columbia Short-Term Cash Fund | | | 8,630,043 | | | | 177,734,417 | | | | (185,355,640 | ) | | | 1,008,820 | | | | 2,487 | | | | 1,008,820 | | |
Abbreviation Legend
ADR American Depositary Receipt
Currency Legend
AUD Australian Dollar
BRL Brazilian Real
CAD Canadian Dollar
CHF Swiss Franc
DKK Danish Krone
EUR Euro
GBP British Pound
IDR Indonesian Rupiah
ILS Israeli Shekel
JPY Japanese Yen
KRW Korean Won
NZD New Zealand Dollar
SEK Swedish Krona
SGD Singapore Dollar
TWD Taiwan Dollar
USD US Dollar
The accompanying Notes to Financial Statements are an integral part of this statement.
Annual Report 2014
12
Columbia International Value Fund
Portfolio of Investments (continued)
February 28, 2014
Fair Value Measurements
Generally accepted accounting principles (GAAP) require disclosure regarding the inputs and valuation techniques used to measure fair value and any changes in valuation inputs or techniques. In addition, investments shall be disclosed by major category.
The Fund categorizes its fair value measurements according to a three-level hierarchy that maximizes the use of observable inputs and minimizes the use of unobservable inputs by prioritizing that the most observable input be used when available. Observable inputs are those that market participants would use in pricing an investment based on market data obtained from sources independent of the reporting entity. Unobservable inputs are those that reflect the Fund's assumptions about the information market participants would use in pricing an investment. An investment's level within the fair value hierarchy is based on the lowest level of any input that is deemed significant to the asset or liability's fair value measurement. The input levels are not necessarily an indication of the risk or liquidity associated with investments at that level. For example, certain U.S. government securities are generally high quality and liquid, however, they are reflected as Level 2 because the inputs used to determine fair value may not always be quoted prices in an active market.
Fair value inputs are summarized in the three broad levels listed below:
> Level 1 — Valuations based on quoted prices for investments in active markets that the Fund has the ability to access at the measurement date (including NAV for open-end mutual funds). Valuation adjustments are not applied to Level 1 investments.
> Level 2 — Valuations based on other significant observable inputs (including quoted prices for similar securities, interest rates, prepayment speeds, credit risks, etc.).
> Level 3 — Valuations based on significant unobservable inputs (including the Fund's own assumptions and judgment in determining the fair value of investments).
Inputs that are used in determining fair value of an investment may include price information, credit data, volatility statistics, and other factors. These inputs can be either observable or unobservable. The availability of observable inputs can vary between investments, and is affected by various factors such as the type of investment, and the volume and level of activity for that investment or similar investments in the marketplace. The inputs will be considered by the Investment Manager, along with any other relevant factors in the calculation of an investment's fair value. The Fund uses prices and inputs that are current as of the measurement date, which may include periods of market dislocations. During these periods, the availability of prices and inputs may be reduced for many investments. This condition could cause an investment to be reclassified between the various levels within the hierarchy.
Foreign equity securities actively traded in markets where there is a significant delay in the local close relative to the New York Stock Exchange (NYSE) are classified as Level 2. The values of these securities may include an adjustment to reflect the impact of significant market movements following the close of local trading, as described in Note 2 to the financial statements — Security Valuation.
Investments falling into the Level 3 category are primarily supported by quoted prices from brokers and dealers participating in the market for those investments. However, these may be classified as Level 3 investments due to lack of market transparency and corroboration to support these quoted prices. Additionally, valuation models may be used as the pricing source for any remaining investments classified as Level 3. These models may rely on one or more significant unobservable inputs and/or significant assumptions by the Investment Manager. Inputs used in valuations may include, but are not limited to, financial statement analysis, capital account balances, discount rates and estimated cash flows, and comparable company data.
Under the direction of the Fund's Board of Trustees (the Board), the Investment Manager's Valuation Committee (the Committee) is responsible for overseeing the valuation procedures approved by the Board. The Committee consists of voting and non-voting members from various groups within the Investment Manager's organization, including operations and accounting, trading and investments, compliance, risk management and legal.
The Committee meets at least monthly to review and approve valuation matters, which may include a description of specific valuation determinations, data regarding pricing information received from approved pricing vendors and brokers and the results of Board-approved valuation control policies and procedures (the Policies). The Policies address, among other things, instances when market quotations are or are not readily available, including recommendations of third party pricing vendors and a determination of appropriate pricing methodologies; events that require specific valuation determinations and assessment of fair value techniques; securities with a potential for stale pricing, including those that are illiquid, restricted, or in default; and the effectiveness of third party pricing vendors, including periodic reviews of vendors. The Committee meets more frequently, as needed, to discuss additional valuation matters, which may include the need to review back-testing results, review time-sensitive information or approve related valuation actions. The Committee reports to the Board, with members of the Committee meeting with the Board at each of its regularly scheduled meetings to discuss valuation matters and actions during the period, similar to those described earlier.
For investments categorized as Level 3, the Committee monitors information similar to that described above, which may include: (i) data specific to the issuer or comparable issuers, (ii) general market or specific sector news and (iii) quoted prices and specific or similar security transactions. The Committee considers this data and any changes from prior periods in order to assess the reasonableness of observable and unobservable inputs, any assumptions or internal models used to value those securities and changes in fair value. This data is also used to corroborate, when available, information received from approved pricing vendors and brokers. Various factors impact the frequency of monitoring this information (which may occur as often as daily). However, the Committee may determine that changes to inputs, assumptions and models are not required as a result of the monitoring procedures performed.
The accompanying Notes to Financial Statements are an integral part of this statement.
Annual Report 2014
13
Columbia International Value Fund
Portfolio of Investments (continued)
February 28, 2014
Fair Value Measurements (continued)
The following table is a summary of the inputs used to value the Fund's investments at February 28, 2014:
Description | | Level 1
Quoted Prices in Active
Markets for Identical
Assets ($) | | Level 2
Other Significant
Observable Inputs ($) | | Level 3
Significant
Unobservable Inputs ($) | | Total ($) | |
Equity Securities | |
Common Stocks | |
Consumer Discretionary | | | — | | | | 35,302,233 | | | | — | | | | 35,302,233 | | |
Consumer Staples | | | 1,228,334 | | | | 8,672,060 | | | | — | | | | 9,900,394 | | |
Energy | | | — | | | | 26,592,053 | | | | — | | | | 26,592,053 | | |
Financials | | | — | | | | 93,960,356 | | | | — | | | | 93,960,356 | | |
Health Care | | | 10,519,066 | | | | 16,239,786 | | | | — | | | | 26,758,852 | | |
Industrials | | | — | | | | 35,403,854 | | | | — | | | | 35,403,854 | | |
Information Technology | | | — | | | | 10,186,792 | | | | — | | | | 10,186,792 | | |
Materials | | | 3,373,348 | | | | 12,293,619 | | | | — | | | | 15,666,967 | | |
Telecommunication Services | | | 1,196,009 | | | | 11,917,082 | | | | — | | | | 13,113,091 | | |
Utilities | | | — | | | | 4,315,270 | | | | — | | | | 4,315,270 | | |
Exchange-Traded Funds | | | 270,542 | | | | — | | | | — | | | | 270,542 | | |
Total Equity Securities | | | 16,587,299 | | | | 254,883,105 | | | | — | | | | 271,470,404 | | |
Mutual Funds | |
Money Market Funds | | | 1,008,820 | | | | — | | | | — | | | | 1,008,820 | | |
Total Mutual Funds | | | 1,008,820 | | | | — | | | | — | | | | 1,008,820 | | |
Investments in Securities | | | 17,596,119 | | | | 254,883,105 | | | | — | | | | 272,479,224 | | |
Derivatives | |
Assets | |
Forward Foreign Currency
Exchange Contracts | | | — | | | | 427,564 | | | | — | | | | 427,564 | | |
Liabilities | |
Forward Foreign Currency
Exchange Contracts | | | — | | | | (196,623 | ) | | | — | | | | (196,623 | ) | |
Total | | | 17,596,119 | | | | 255,114,046 | | | | — | | | | 272,710,165 | | |
See the Portfolio of Investments for all investment classifications not indicated in the table.
The Fund's assets assigned to the Level 2 input category are generally valued using the market approach, in which a security's value is determined through reference to prices and information from market transactions for similar or identical assets. These assets include certain foreign securities for which a third party statistical pricing service may be employed for purposes of fair market valuation. The models utilized by the third party statistical pricing service take into account a security's correlation to available market data including, but not limited to, intraday index, ADR, and ETF movements.
There were no transfers of financial assets between levels during the period.
Derivative instruments are valued at unrealized appreciation (depreciation).
The accompanying Notes to Financial Statements are an integral part of this statement.
Annual Report 2014
14
Columbia International Value Fund
Statement of Assets and Liabilities
February 28, 2014
Assets | |
Investments, at value | |
Unaffiliated issuers (identified cost $238,954,514) | | $ | 271,470,404 | | |
Affiliated issuers (identified cost $1,008,820) | | | 1,008,820 | | |
Total investments (identified cost $239,963,334) | | | 272,479,224 | | |
Foreign currency (identified cost $217) | | | 217 | | |
Unrealized appreciation on forward foreign currency exchange contracts | | | 427,564 | | |
Receivable for: | |
Investments sold | | | 3,766,206 | | |
Capital shares sold | | | 317,221 | | |
Dividends | | | 1,258,675 | | |
Reclaims | | | 1,235,538 | | |
Prepaid expenses | | | 1,001 | | |
Total assets | | | 279,485,646 | | |
Liabilities | |
Unrealized depreciation on forward foreign currency exchange contracts | | | 196,623 | | |
Payable for: | |
Investments purchased | | | 37,017 | | |
Capital shares purchased | | | 6,666,588 | | |
Investment management fees | | | 6,006 | | |
Distribution and/or service fees | | | 1,548 | | |
Transfer agent fees | | | 50,066 | | |
Administration fees | | | 608 | | |
Compensation of board members | | | 116,955 | | |
Expense reimbursement due to Investment Manager | | | 977 | | |
Other expenses | | | 72,484 | | |
Total liabilities | | | 7,148,872 | | |
Net assets applicable to outstanding capital stock | | $ | 272,336,774 | | |
Represented by | |
Paid-in capital | | $ | 796,431,082 | | |
Undistributed net investment income | | | 2,610,510 | | |
Accumulated net realized loss | | | (559,518,826 | ) | |
Unrealized appreciation (depreciation) on: | |
Investments | | | 32,515,890 | | |
Foreign currency translations | | | 67,177 | | |
Forward foreign currency exchange contracts | | | 230,941 | | |
Total — representing net assets applicable to outstanding capital stock | | $ | 272,336,774 | | |
The accompanying Notes to Financial Statements are an integral part of this statement.
Annual Report 2014
15
Columbia International Value Fund
Statement of Assets and Liabilities (continued)
February 28, 2014
Class A | |
Net assets | | $ | 113,593,639 | | |
Shares outstanding | | | 7,305,640 | | |
Net asset value per share | | $ | 15.55 | | |
Maximum offering price per share(a) | | $ | 16.50 | | |
Class B | |
Net assets | | $ | 452,938 | | |
Shares outstanding | | | 30,306 | | |
Net asset value per share | | $ | 14.95 | | |
Class C | |
Net assets | | $ | 26,710,255 | | |
Shares outstanding | | | 1,793,483 | | |
Net asset value per share | | $ | 14.89 | | |
Class I | |
Net assets | | $ | 2,709 | | |
Shares outstanding | | | 179 | | |
Net asset value per share(b) | | $ | 15.09 | | |
Class R | |
Net assets | | $ | 205,274 | | |
Shares outstanding | | | 13,191 | | |
Net asset value per share | | $ | 15.56 | | |
Class R4 | |
Net assets | | $ | 2,069,759 | | |
Shares outstanding | | | 130,309 | | |
Net asset value per share(b) | | $ | 15.88 | | |
Class R5 | |
Net assets | | $ | 3,388,477 | | |
Shares outstanding | | | 213,539 | | |
Net asset value per share | | $ | 15.87 | | |
Class Z | |
Net assets | | $ | 125,913,723 | | |
Shares outstanding | | | 8,004,333 | | |
Net asset value per share | | $ | 15.73 | | |
(a) The maximum offering price per share is calculated by dividing the net asset value per share by 1.0 minus the maximum sales charge of 5.75%.
(b) Net asset value per share rounds to this amount due to fractional shares outstanding.
The accompanying Notes to Financial Statements are an integral part of this statement.
Annual Report 2014
16
Columbia International Value Fund
Statement of Operations
Year Ended February 28, 2014
Net investment income | |
Dividends — unaffiliated issuers | | $ | 1,856,705 | | |
Dividends — affiliated issuers | | | 242 | | |
Income allocated from Master Portfolio: | |
Dividends — unaffiliated issuers | | | 19,523,766 | | |
Dividends — affiliated issuers | | | 2,245 | | |
Interest | | | 13,790 | | |
Foreign taxes withheld | | | (2,068,592 | ) | |
Expenses allocated from Master Portfolio(a) | | | (3,265,456 | ) | |
Line of credit interest expense allocated from Master Portfolio | | | (5,741 | ) | |
Total income | | | 16,056,959 | | |
Expenses: | |
Investment management fees | | | 463,672 | | |
Distribution and/or service fees | |
Class A | | | 316,556 | | |
Class B | | | 4,936 | | |
Class C | | | 263,924 | | |
Class R | | | 705 | | |
Transfer agent fees | |
Class A | | | 235,502 | | |
Class B | | | 914 | | |
Class C | | | 48,899 | | |
Class R | | | 260 | | |
Class R4 | | | 1,134 | | |
Class R5 | | | 3,162 | | |
Class Z | | | 450,468 | | |
Administration fees | | | 358,512 | | |
Compensation of board members | | | 9,944 | | |
Custodian fees | | | 28,675 | | |
Printing and postage fees | | | 39,202 | | |
Registration fees | | | 61,346 | | |
Professional fees | | | 11,744 | | |
Line of credit interest expense | | | 155 | | |
Other | | | 15,876 | | |
Total expenses | | | 2,315,586 | | |
Fees waived or expenses reimbursed by Investment Manager and its affiliates(b) | | | (274,239 | ) | |
Expense reductions | | | (920 | ) | |
Total net expenses | | | 2,040,427 | | |
Net investment income | | | 14,016,532 | | |
Realized and unrealized gain (loss) — net | |
Investments | | | 4,611,307 | | |
Foreign currency translations | | | 27,437 | | |
Forward foreign currency exchange contracts | | | 359,747 | | |
Net realized gain (loss) allocated from Master Portfolio on: | |
Investments | | | (31,786,395 | ) | |
Foreign currency translations | | | (103,245 | ) | |
Forward foreign currency exchange contracts | | | 467,386 | | |
Options contracts written | | | 17,122 | | |
Net realized loss | | | (26,406,641 | ) | |
Net change in unrealized appreciation (depreciation): | |
Investments | | | 32,515,890 | | |
Foreign currency translations | | | 67,177 | | |
Forward foreign currency exchange contracts | | | 230,941 | | |
Net change in unrealized appreciation (depreciation) allocated from Master Portfolio on: | |
Investments | | | 80,482,374 | | |
Net change in unrealized appreciation (depreciation) | | | 113,296,382 | | |
Net realized and unrealized gain | | | 86,889,741 | | |
Net increase in net assets resulting from operations | | $ | 100,906,273 | | |
(a) Gross expenses allocated from Master Portfolio include the Fund's pro-rata portion of the Master Portfolio's investment management fees, administration fees, compensation of board members, custodian fees and other expenses.
(b) Includes fees waived or expenses reimbursed from Master Portfolio and allocated to Fund.
The accompanying Notes to Financial Statements are an integral part of this statement.
Annual Report 2014
17
Columbia International Value Fund
Statement of Changes in Net Assets
| | | Year Ended
February 28,
2014 | | Year Ended
February 28,
2013(a) | |
Operations | |
Net investment income | | $ | 14,016,532 | | | $ | 33,440,252 | | |
Net realized loss | | | (26,406,641 | ) | | | (136,568,784 | ) | |
Net change in unrealized appreciation (depreciation) | | | 113,296,382 | | | | 116,298,605 | | |
Net increase in net assets resulting from operations | | | 100,906,273 | | | | 13,170,073 | | |
Distributions to shareholders | |
Net investment income | |
Class A | | | (5,224,071 | ) | | | (6,459,913 | ) | |
Class B | | | (21,115 | ) | | | (16,623 | ) | |
Class C | | | (1,104,350 | ) | | | (822,662 | ) | |
Class I | | | (136 | ) | | | (92 | ) | |
Class R | | | (7,978 | ) | | | (3,062 | ) | |
Class R4 | | | (88,546 | ) | | | (93 | ) | |
Class R5 | | | (412,230 | ) | | | (95 | ) | |
Class Z | | | (6,141,628 | ) | | | (29,203,054 | ) | |
Tax return of capital | |
Class A | | | — | | | | (222,193 | ) | |
Class B | | | — | | | | (572 | ) | |
Class C | | | — | | | | (28,296 | ) | |
Class I | | | — | | | | (3 | ) | |
Class R | | | — | | | | (105 | ) | |
Class R4 | | | — | | | | (3 | ) | |
Class R5 | | | — | | | | (3 | ) | |
Class Z | | | — | | | | (1,004,458 | ) | |
Total distributions to shareholders | | | (13,000,054 | ) | | | (37,761,227 | ) | |
Increase (decrease) in net assets from capital stock activity | | | (465,549,679 | ) | | | (511,679,724 | ) | |
Total decrease in net assets | | | (377,643,460 | ) | | | (536,270,878 | ) | |
Net assets at beginning of year | | | 649,980,234 | | | | 1,186,251,112 | | |
Net assets at end of year | | $ | 272,336,774 | | | $ | 649,980,234 | | |
Undistributed net investment income | | $ | 2,610,510 | | | $ | (4,672,914 | ) | |
(a) Class R4 and Class R5 shares are for the period from November 8, 2012 (commencement of operations) to February 28, 2013.
The accompanying Notes to Financial Statements are an integral part of this statement.
Annual Report 2014
18
Columbia International Value Fund
Statement of Changes in Net Assets (continued)
| | | Year Ended February 28, 2014 | | Year Ended February 28, 2013(a) | |
| | | Shares | | Dollars ($) | | Shares | | Dollars ($) | |
Capital stock activity | |
Class A shares | |
Subscriptions(b) | | | 1,646,238 | | | | 21,934,027 | | | | 2,747,144 | | | | 34,280,047 | | |
Distributions reinvested | | | 253,224 | | | | 3,717,336 | | | | 355,352 | | | | 4,458,659 | | |
Redemptions | | | (7,741,276 | ) | | | (109,208,073 | ) | | | (7,141,317 | ) | | | (89,527,344 | ) | |
Net decrease | | | (5,841,814 | ) | | | (83,556,710 | ) | | | (4,038,821 | ) | | | (50,788,638 | ) | |
Class B shares | |
Subscriptions | | | 5,057 | | | | 62,262 | | | | 3,954 | | | | 46,229 | | |
Distributions reinvested | | | 1,315 | | | | 18,578 | | | | 1,199 | | | | 14,561 | | |
Redemptions(b) | | | (17,876 | ) | | | (246,890 | ) | | | (26,993 | ) | | | (324,804 | ) | |
Net decrease | | | (11,504 | ) | | | (166,050 | ) | | | (21,840 | ) | | | (264,014 | ) | |
Class C shares | |
Subscriptions | | | 155,209 | | | | 1,704,861 | | | | 116,197 | | | | 1,393,386 | | |
Distributions reinvested | | | 52,538 | | | | 739,728 | | | | 48,183 | | | | 583,499 | | |
Redemptions | | | (535,264 | ) | | | (7,344,198 | ) | | | (805,033 | ) | | | (9,611,764 | ) | |
Net decrease | | | (327,517 | ) | | | (4,899,609 | ) | | | (640,653 | ) | | | (7,634,879 | ) | |
Class R shares | |
Subscriptions | | | 5,216 | | | | 74,673 | | | | 7,905 | | | | 98,959 | | |
Distributions reinvested | | | 534 | | | | 7,855 | | | | 245 | | | | 3,086 | | |
Redemptions | | | (175 | ) | | | (2,553 | ) | | | (1,126 | ) | | | (13,522 | ) | |
Net increase | | | 5,575 | | | | 79,975 | | | | 7,024 | | | | 88,523 | | |
Class R4 shares | |
Subscriptions | | | 145,365 | | | | 2,230,240 | | | | 200 | | | | 2,500 | | |
Distributions reinvested | | | 5,901 | | | | 88,398 | | | | — | | | | — | | |
Redemptions | | | (21,157 | ) | | | (329,483 | ) | | | — | | | | — | | |
Net increase | | | 130,109 | | | | 1,989,155 | | | | 200 | | | | 2,500 | | |
Class R5 shares | |
Subscriptions | | | 604,487 | | | | 8,276,537 | | | | 53,142 | | | | 719,869 | | |
Distributions reinvested | | | 27,527 | | | | 412,080 | | | | — | | | | — | | |
Redemptions | | | (471,617 | ) | | | (7,257,758 | ) | | | — | | | | — | | |
Net increase | | | 160,397 | | | | 1,430,859 | | | | 53,142 | | | | 719,869 | | |
Class Z shares | |
Subscriptions | | | 3,622,263 | | | | 49,175,543 | | | | 16,323,796 | | | | 204,554,101 | | |
Distributions reinvested | | | 338,804 | | | | 5,027,852 | | | | 2,021,034 | | | | 25,616,171 | | |
Redemptions | | | (30,882,263 | ) | | | (434,630,694 | ) | | | (53,114,547 | ) | | | (683,973,357 | ) | |
Net decrease | | | (26,921,196 | ) | | | (380,427,299 | ) | | | (34,769,717 | ) | | | (453,803,085 | ) | |
Total net decrease | | | (32,805,950 | ) | | | (465,549,679 | ) | | | (39,410,665 | ) | | | (511,679,724 | ) | |
(a) Class R4 and Class R5 shares are for the period from November 8, 2012 (commencement of operations) to February 28, 2013.
(b) Includes conversions of Class B shares to Class A shares, if any.
The accompanying Notes to Financial Statements are an integral part of this statement.
Annual Report 2014
19
Columbia International Value Fund
The following tables are intended to help you understand the Fund's financial performance. Certain information reflects financial results for a single share of a class held for the periods shown. The per share amounts and percentages reflect income and expenses assuming inclusion of the Fund's proportionate share of the income and expenses of Columbia International Value Master Portfolio for all periods prior to the Fund's conversion to a stand-alone fund after the close of business on December 13, 2013. Per share net investment income (loss) amounts are calculated based on average shares outstanding during the period. Total return assumes reinvestment of all dividends and distributions, if any. Total return does not reflect payment of sales charges, if any, and is not annualized for periods of less than one year.
| | | | | Year Ended | | | |
| | | Year Ended February 28, | | February 29, | | Year Ended February 28, | |
Class A | | 2014 | | 2013 | | 2012 | | 2011 | | 2010 | |
Per share data | |
Net asset value, beginning of period | | $ | 12.85 | | | $ | 13.14 | | | $ | 15.12 | | | $ | 13.48 | | | $ | 9.40 | | |
Income from investment operations: | |
Net investment income | | | 0.41 | | | | 0.39 | | | | 0.39 | | | | 0.22 | | | | 0.33 | (a) | |
Net realized and unrealized gain (loss) | | | 3.00 | | | | (0.20 | ) | | | (1.88 | ) | | | 1.81 | | | | 3.96 | | |
Total from investment operations | | | 3.41 | | | | 0.19 | | | | (1.49 | ) | | | 2.03 | | | | 4.29 | | |
Less distributions to shareholders: | |
Net investment income | | | (0.71 | ) | | | (0.46 | ) | | | (0.49 | ) | | | (0.39 | ) | | | (0.21 | ) | |
Tax return of capital | | | — | | | | (0.02 | ) | | | — | | | | — | | | | — | | |
Total distributions to shareholders | | | (0.71 | ) | | | (0.48 | ) | | | (0.49 | ) | | | (0.39 | ) | | | (0.21 | ) | |
Proceeds from regulatory settlements | | | — | | | | — | | | | 0.00 | (b) | | | 0.00 | (b) | | | 0.00 | (b) | |
Redemption fees: | |
Redemption fees added to paid-in capital | | | — | | | | — | | | | — | | | | — | | | | 0.00 | (b) | |
Net asset value, end of period | | $ | 15.55 | | | $ | 12.85 | | | $ | 13.14 | | | $ | 15.12 | | | $ | 13.48 | | |
Total return | | | 26.87 | % | | | 1.56 | % | | | (9.51 | %) | | | 15.47 | % | | | 45.57 | % | |
Ratios to average net assets(c) | |
Total gross expenses | | | 1.48 | %(d) | | | 1.57 | %(d) | | | 1.53 | %(d) | | | 1.48 | %(d) | | | 1.42 | %(d) | |
Total net expenses(e) | | | 1.43 | %(d)(f) | | | 1.43 | %(d)(f) | | | 1.41 | %(d)(f) | | | 1.48 | %(d)(f) | | | 1.42 | %(d)(f) | |
Net investment income | | | 2.85 | % | | | 3.09 | % | | | 2.87 | % | | | 1.61 | % | | | 2.56 | % | |
Supplemental data | |
Net assets, end of period (in thousands) | | $ | 113,594 | | | $ | 168,944 | | | $ | 225,747 | | | $ | 367,847 | | | $ | 380,578 | | |
Portfolio turnover | | | 14 | %(g) | | | — | | | | — | | | | — | | | | — | | |
Portfolio turnover of Columbia International Value Fund
Master Portfolio | | | 100 | %(h) | | | 13 | % | | | 16 | % | | | 7 | % | | | 22 | % | |
Notes to Financial Highlights
(a) Net investment income per share reflects special dividends. The effect of these dividends amounted to $0.13 per share.
(b) Rounds to zero.
(c) In addition to the fees and expenses which the Fund bears directly, the Fund indirectly bears a pro rata share of the fees and expenses of the acquired funds in which it invests. Such indirect expenses are not included in the reported expense ratios.
(d) Ratios include line of credit interest expense which rounds to less than 0.01%.
(e) Total net expenses include the impact of certain waivers/reimbursements made by the Investment Manager and certain of its affiliates, if applicable.
(f) The benefits derived from expense reductions had an impact of less than 0.01%.
(g) Amount represents results after the Fund's conversion to a stand-alone structure.
(h) Amount represents results prior to the Fund's conversion to a stand-alone structure.
The accompanying Notes to Financial Statements are an integral part of this statement.
Annual Report 2014
20
Columbia International Value Fund
Financial Highlights (continued)
| | | | | Year Ended | | | |
| | | Year Ended February 28, | | February 29, | | Year Ended February 28, | |
Class B | | 2014 | | 2013 | | 2012 | | 2011 | | 2010 | |
Per share data | |
Net asset value, beginning of period | | $ | 12.39 | | | $ | 12.68 | | | $ | 14.61 | | | $ | 13.02 | | | $ | 9.09 | | |
Income from investment operations: | |
Net investment income | | | 0.26 | | | | 0.29 | | | | 0.27 | | | | 0.21 | | | | 0.24 | (a) | |
Net realized and unrealized gain (loss) | | | 2.92 | | | | (0.19 | ) | | | (1.81 | ) | | | 1.67 | | | | 3.82 | | |
Total from investment operations | | | 3.18 | | | | 0.10 | | | | (1.54 | ) | | | 1.88 | | | | 4.06 | | |
Less distributions to shareholders: | |
Net investment income | | | (0.62 | ) | | | (0.38 | ) | | | (0.39 | ) | | | (0.29 | ) | | | (0.13 | ) | |
Tax return of capital | | | — | | | | (0.01 | ) | | | — | | | | — | | | | — | | |
Total distributions to shareholders | | | (0.62 | ) | | | (0.39 | ) | | | (0.39 | ) | | | (0.29 | ) | | | (0.13 | ) | |
Proceeds from regulatory settlements | | | — | | | | — | | | | 0.00 | (b) | | | 0.00 | (b) | | | 0.00 | (b) | |
Redemption fees: | |
Redemption fees added to paid-in capital | | | — | | | | — | | | | — | | | | — | | | | 0.00 | (b) | |
Net asset value, end of period | | $ | 14.95 | | | $ | 12.39 | | | $ | 12.68 | | | $ | 14.61 | | | $ | 13.02 | | |
Total return | | | 25.96 | % | | | 0.84 | % | | | (10.28 | %) | | | 14.75 | % | | | 44.61 | % | |
Ratios to average net assets(c) | |
Total gross expenses | | | 2.23 | %(d) | | | 2.32 | %(d) | | | 2.27 | %(d) | | | 2.23 | %(d) | | | 2.17 | %(d) | |
Total net expenses(e) | | | 2.17 | %(d)(f) | | | 2.18 | %(d)(f) | | | 2.16 | %(d)(f) | | | 2.23 | %(d)(f) | | | 2.17 | %(d)(f) | |
Net investment income | | | 1.85 | % | | | 2.41 | % | | | 2.05 | % | | | 1.62 | % | | | 1.95 | % | |
Supplemental data | |
Net assets, end of period (in thousands) | | $ | 453 | | | $ | 518 | | | $ | 807 | | | $ | 1,437 | | | $ | 8,476 | | |
Portfolio turnover | | | 14 | %(g) | | | — | | | | — | | | | — | | | | — | | |
Portfolio turnover of Columbia International Value
Master Portfolio | | | 100 | %(h) | | | 13 | % | | | 16 | % | | | 7 | % | | | 22 | % | |
Notes to Financial Highlights
(a) Net investment income per share reflects special dividends. The effect of these dividends amounted to $0.13 per share.
(b) Rounds to zero.
(c) In addition to the fees and expenses which the Fund bears directly, the Fund indirectly bears a pro rata share of the fees and expenses of the acquired funds in which it invests. Such indirect expenses are not included in the reported expense ratios.
(d) Ratios include line of credit interest expense which rounds to less than 0.01%.
(e) Total net expenses include the impact of certain waivers/reimbursements made by the Investment Manager and certain of its affiliates, if applicable.
(f) The benefits derived from expense reductions had an impact of less than 0.01%.
(g) Amount represents results after the Fund's conversion to a stand-alone structure.
(h) Amount represents results prior to the Fund's conversion to a stand-alone structure.
The accompanying Notes to Financial Statements are an integral part of this statement.
Annual Report 2014
21
Columbia International Value Fund
Financial Highlights (continued)
| | | | | Year Ended | | | |
| | | Year Ended February 28, | | February 29, | | Year Ended February 28, | |
Class C | | 2014 | | 2013 | | 2012 | | 2011 | | 2010 | |
Per share data | |
Net asset value, beginning of period | | $ | 12.35 | | | $ | 12.64 | | | $ | 14.56 | | | $ | 12.99 | | | $ | 9.08 | | |
Income from investment operations: | |
Net investment income | | | 0.26 | | | | 0.28 | | | | 0.27 | | | | 0.12 | | | | 0.22 | (a) | |
Net realized and unrealized gain (loss) | | | 2.90 | | | | (0.18 | ) | | | (1.80 | ) | | | 1.74 | | | | 3.82 | | |
Total from investment operations | | | 3.16 | | | | 0.10 | | | | (1.53 | ) | | | 1.86 | | | | 4.04 | | |
Less distributions to shareholders: | |
Net investment income | | | (0.62 | ) | | | (0.38 | ) | | | (0.39 | ) | | | (0.29 | ) | | | (0.13 | ) | |
Tax return of capital | | | — | | | | (0.01 | ) | | | — | | | | — | | | | — | | |
Total distributions to shareholders | | | (0.62 | ) | | | (0.39 | ) | | | (0.39 | ) | | | (0.29 | ) | | | (0.13 | ) | |
Proceeds from regulatory settlements | | | — | | | | — | | | | 0.00 | (b) | | | 0.00 | (b) | | | 0.00 | (b) | |
Redemption fees: | |
Redemption fees added to paid-in capital | | | — | | | | — | | | | — | | | | — | | | | 0.00 | (b) | |
Net asset value, end of period | | $ | 14.89 | | | $ | 12.35 | | | $ | 12.64 | | | $ | 14.56 | | | $ | 12.99 | | |
Total return | | | 25.88 | % | | | 0.85 | % | | | (10.24 | %) | | | 14.62 | % | | | 44.44 | % | |
Ratios to average net assets(c) | |
Total gross expenses | | | 2.23 | %(d) | | | 2.32 | %(d) | | | 2.28 | %(d) | | | 2.23 | %(d) | | | 2.17 | %(d) | |
Total net expenses(e) | | | 2.17 | %(d)(f) | | | 2.18 | %(d)(f) | | | 2.16 | %(d)(f) | | | 2.23 | %(d)(f) | | | 2.17 | %(d)(f) | |
Net investment income | | | 1.91 | % | | | 2.35 | % | | | 2.10 | % | | | 0.89 | % | | | 1.81 | % | |
Supplemental data | |
Net assets, end of period (in thousands) | | $ | 26,710 | | | $ | 26,193 | | | $ | 34,910 | | | $ | 57,793 | | | $ | 63,914 | | |
Portfolio turnover | | | 14 | %(g) | | | — | | | | — | | | | — | | | | — | | |
Portfolio turnover of Columbia International Value
Master Fund | | | 100 | %(h) | | | 13 | % | | | 16 | % | | | 7 | % | | | 22 | % | |
Notes to Financial Highlights
(a) Net investment income per share reflects special dividends. The effect of these dividends amounted to $0.13 per share.
(b) Rounds to zero.
(c) In addition to the fees and expenses which the Fund bears directly, the Fund indirectly bears a pro rata share of the fees and expenses of the acquired funds in which it invests. Such indirect expenses are not included in the reported expense ratios.
(d) Ratios include line of credit interest expense which rounds to less than 0.01%.
(e) Total net expenses include the impact of certain waivers/reimbursements made by the Investment Manager and certain of its affiliates, if applicable.
(f) The benefits derived from expense reductions had an impact of less than 0.01%.
(g) Amount represents results after the Fund's conversion to a stand-alone structure.
(h) Amount represents results prior to the Fund's conversion to a stand-alone structure.
The accompanying Notes to Financial Statements are an integral part of this statement.
Annual Report 2014
22
Columbia International Value Fund
Financial Highlights (continued)
| | | | | Year Ended | | Year Ended | |
| | | Year Ended February 28, | | February 29, | | February 28, | |
Class I | | 2014 | | 2013 | | 2012 | | 2011(a) | |
Per share data | |
Net asset value, beginning of period | | $ | 12.48 | | | $ | 12.77 | | | $ | 15.27 | | | $ | 13.93 | | |
Income from investment operations: | |
Net investment income (loss) | | | 0.42 | | | | 0.40 | | | | 0.70 | | | | (0.00 | )(b) | |
Net realized and unrealized gain (loss) | | | 2.95 | | | | (0.16 | ) | | | (2.65 | ) | | | 1.67 | | |
Total from investment operations | | | 3.37 | | | | 0.24 | | | | (1.95 | ) | | | 1.67 | | |
Less distributions to shareholders: | |
Net investment income | | | (0.76 | ) | | | (0.51 | ) | | | (0.55 | ) | | | (0.33 | ) | |
Tax return of capital | | | — | | | | (0.02 | ) | | | — | | | | — | | |
Total distributions to shareholders | | | (0.76 | ) | | | (0.53 | ) | | | (0.55 | ) | | | (0.33 | ) | |
Proceeds from regulatory settlements | | | — | | | | — | | | | 0.00 | (b) | | | 0.00 | (b) | |
Net asset value, end of period | | $ | 15.09 | | | $ | 12.48 | | | $ | 12.77 | | | $ | 15.27 | | |
Total return | | | 27.35 | % | | | 2.00 | % | | | (12.47 | %) | | | 12.22 | % | |
Ratios to average net assets(c) | |
Total gross expenses | | | 1.00 | %(d) | | | 1.13 | %(d) | | | 1.06 | %(d) | | | 1.07 | %(d)(e) | |
Total net expenses(f) | | | 0.99 | %(d) | | | 1.04 | %(d) | | | 1.06 | %(d)(g) | | | 1.07 | %(d)(e)(g) | |
Net investment income (loss) | | | 3.00 | % | | | 3.31 | % | | | 4.77 | % | | | (0.05 | %)(e) | |
Supplemental data | |
Net assets, end of period (in thousands) | | $ | 3 | | | $ | 2 | | | $ | 2 | | | $ | 34,506 | | |
Portfolio turnover | | | 14 | %(h) | | | — | | | | — | | | | — | | |
Portfolio turnover of Columbia International Value
Master Portfolio | | | 100 | %(i) | | | 13 | % | | | 16 | % | | | 7 | % | |
Notes to Financial Highlights
(a) For the period from September 27, 2010 (commencement of operations) to February 28, 2011.
(b) Rounds to zero.
(c) In addition to the fees and expenses which the Fund bears directly, the Fund indirectly bears a pro rata share of the fees and expenses of the acquired funds in which it invests. Such indirect expenses are not included in the reported expense ratios.
(d) Ratios include line of credit interest expense which rounds to less than 0.01%.
(e) Annualized.
(f) Total net expenses include the impact of certain waivers/reimbursements made by the Investment Manager and certain of its affiliates, if applicable.
(g) The benefits derived from expense reductions had an impact of less than 0.01%.
(h) Amount represents results after the Fund's conversion to a stand-alone structure.
(i) Amount represents results prior to the Fund's conversion to a stand-alone structure.
The accompanying Notes to Financial Statements are an integral part of this statement.
Annual Report 2014
23
Columbia International Value Fund
Financial Highlights (continued)
| | | | | Year Ended | | Year Ended | |
| | | Year Ended February 28, | | February 29, | | February 28, | |
Class R | | 2014 | | 2013 | | 2012 | | 2011(a) | |
Per share data | |
Net asset value, beginning of period | | $ | 12.87 | | | $ | 13.15 | | | $ | 15.15 | | | $ | 13.78 | | |
Income from investment operations: | |
Net investment income | | | 0.31 | | | | 0.15 | | | | 0.25 | | | | 0.02 | | |
Net realized and unrealized gain (loss) | | | 3.06 | | | | 0.02 | (b) | | | (1.79 | ) | | | 1.60 | | |
Total from investment operations | | | 3.37 | | | | 0.17 | | | | (1.54 | ) | | | 1.62 | | |
Less distributions to shareholders: | |
Net investment income | | | (0.68 | ) | | | (0.44 | ) | | | (0.46 | ) | | | (0.25 | ) | |
Tax return of capital | | | — | | | | (0.01 | ) | | | — | | | | — | | |
Total distributions to shareholders | | | (0.68 | ) | | | (0.45 | ) | | | (0.46 | ) | | | (0.25 | ) | |
Proceeds from regulatory settlements | | | — | | | | — | | | | 0.00 | (c) | | | 0.00 | (c) | |
Net asset value, end of period | | $ | 15.56 | | | $ | 12.87 | | | $ | 13.15 | | | $ | 15.15 | | |
Total return | | | 26.50 | % | | | 1.39 | % | | | (9.90 | %) | | | 11.92 | % | |
Ratios to average net assets(d) | |
Total gross expenses | | | 1.71 | %(e) | | | 1.85 | %(e) | | | 1.86 | %(e) | | | 1.77 | %(e)(f) | |
Total net expenses(g) | | | 1.67 | %(e)(h) | | | 1.70 | %(e)(h) | | | 1.64 | %(e)(h) | | | 1.77 | %(e)(f)(h) | |
Net investment income | | | 2.13 | % | | | 1.16 | % | | | 1.94 | % | | | 0.40 | %(f) | |
Supplemental data | |
Net assets, end of period (in thousands) | | $ | 205 | | | $ | 98 | | | $ | 8 | | | $ | 3 | | |
Portfolio turnover | | | 14 | %(i) | | | — | | | | — | | | | — | | |
Portfolio turnover of Columbia International Value
Master Portfolio | | | 100 | %(j) | | | 13 | % | | | 16 | % | | | 7 | % | |
Notes to Financial Highlights
(a) For the period from September 27, 2010 (commencement of operations) to February 28, 2011.
(b) Calculation of the net gain (loss) per share (both realized and unrealized) does not correlate to the aggregate realized and unrealized gain (loss) presented in the Statement of Operations due to the timing of sales and repurchases of Fund shares in relation to fluctuations in the market value of the portfolio.
(c) Rounds to zero.
(d) In addition to the fees and expenses which the Fund bears directly, the Fund indirectly bears a pro rata share of the fees and expenses of the acquired funds in which it invests. Such indirect expenses are not included in the reported expense ratios.
(e) Ratios include line of credit interest expense which rounds to less than 0.01%.
(f) Annualized.
(g) Total net expenses include the impact of certain waivers/reimbursements made by the Investment Manager and certain of its affiliates, if applicable.
(h) The benefits derived from expense reductions had an impact of less than 0.01%.
(i) Amount represents results after the Fund's conversion to a stand-alone structure.
(j) Amount represents results prior to the Fund's conversion to a stand-alone structure.
The accompanying Notes to Financial Statements are an integral part of this statement.
Annual Report 2014
24
Columbia International Value Fund
Financial Highlights (continued)
| | | Year Ended February 28, | |
Class R4 | | 2014 | | 2013(a) | |
Per share data | |
Net asset value, beginning of period | | $ | 13.10 | | | $ | 12.51 | | |
Income from investment operations: | |
Net investment income | | | 0.30 | | | | 0.02 | | |
Net realized and unrealized gain | | | 3.22 | | | | 1.05 | (b) | |
Total from investment operations | | | 3.52 | | | | 1.07 | | |
Less distributions to shareholders: | |
Net investment income | | | (0.74 | ) | | | (0.46 | ) | |
Tax return of capital | | | — | | | | (0.02 | ) | |
Total distributions to shareholders | | | (0.74 | ) | | | (0.48 | ) | |
Net asset value, end of period | | $ | 15.88 | | | $ | 13.10 | | |
Total return | | | 27.21 | % | | | 8.64 | % | |
Ratios to average net assets(c) | |
Total gross expenses | | | 1.25 | %(d) | | | 1.31 | %(d)(e) | |
Total net expenses(f) | | | 1.17 | %(d)(g) | | | 1.21 | %(d)(e) | |
Net investment income | | | 2.09 | % | | | 0.59 | %(e) | |
Supplemental data | |
Net assets, end of period (in thousands) | | $ | 2,070 | | | $ | 3 | | |
Portfolio turnover | | | 14 | %(h) | | | — | | |
Portfolio turnover of Columbia International Value Master Portfolio | | | 100 | %(i) | | | 13 | % | |
Notes to Financial Highlights
(a) For the period from November 8, 2012 (commencement of operations) to February 28, 2013.
(b) Calculation of the net gain (loss) per share (both realized and unrealized) does not correlate to the aggregate realized and unrealized gain (loss) presented in the Statement of Operations due to the timing of sales and repurchases of Fund shares in relation to fluctuations in the market value of the portfolio.
(c) In addition to the fees and expenses which the Fund bears directly, the Fund indirectly bears a pro rata share of the fees and expenses of the acquired funds in which it invests. Such indirect expenses are not included in the reported expense ratios.
(d) Ratios include line of credit interest expense which rounds to less than 0.01%.
(e) Annualized.
(f) Total net expenses include the impact of certain waivers/reimbursements made by the Investment Manager and certain of its affiliates, if applicable.
(g) The benefits derived from expense reductions had an impact of less than 0.01%.
(h) Amount represents results after the Fund's conversion to a stand-alone structure.
(i) Amount represents results prior to the Fund's conversion to a stand-alone structure.
The accompanying Notes to Financial Statements are an integral part of this statement.
Annual Report 2014
25
Columbia International Value Fund
Financial Highlights (continued)
| | | Year Ended February 28, | |
Class R5 | | 2014 | | 2013(a) | |
Per share data | |
Net asset value, beginning of period | | $ | 13.09 | | | $ | 12.51 | | |
Income from investment operations: | |
Net investment income | | | 0.37 | | | | 0.07 | | |
Net realized and unrealized gain | | | 3.16 | | | | 1.00 | (b) | |
Total from investment operations | | | 3.53 | | | | 1.07 | | |
Less distributions to shareholders: | |
Net investment income | | | (0.75 | ) | | | (0.47 | ) | |
Tax return of capital | | | — | | | | (0.02 | ) | |
Total distributions to shareholders | | | (0.75 | ) | | | (0.49 | ) | |
Net asset value, end of period | | $ | 15.87 | | | $ | 13.09 | | |
Total return | | | 27.34 | % | | | 8.64 | % | |
Ratios to average net assets(c) | |
Total gross expenses | | | 1.09 | %(d) | | | 1.28 | %(d)(e) | |
Total net expenses(f) | | | 1.07 | %(d) | | | 1.09 | %(d)(e) | |
Net investment income | | | 2.49 | % | | | 1.88 | %(e) | |
Supplemental data | |
Net assets, end of period (in thousands) | | $ | 3,388 | | | $ | 696 | | |
Portfolio turnover | | | 14 | %(g) | | | — | | |
Portfolio turnover of Columbia International Value Master Portfolio | | | 100 | %(h) | | | 13 | % | |
Notes to Financial Highlights
(a) For the period from November 8, 2012 (commencement of operations) to February 28, 2013.
(b) Calculation of the net gain (loss) per share (both realized and unrealized) does not correlate to the aggregate realized and unrealized gain (loss) presented in the Statement of Operations due to the timing of sales and repurchases of Fund shares in relation to fluctuations in the market value of the portfolio.
(c) In addition to the fees and expenses which the Fund bears directly, the Fund indirectly bears a pro rata share of the fees and expenses of the acquired funds in which it invests. Such indirect expenses are not included in the reported expense ratios.
(d) Ratios include line of credit interest expense which rounds to less than 0.01%.
(e) Annualized.
(f) Total net expenses include the impact of certain waivers/reimbursements made by the Investment Manager and certain of its affiliates, if applicable.
(g) Amount represents results after the Fund's conversion to a stand-alone structure.
(h) Amount represents results prior to the Fund's conversion to a stand-alone structure.
The accompanying Notes to Financial Statements are an integral part of this statement.
Annual Report 2014
26
Columbia International Value Fund
Financial Highlights (continued)
| | | | | Year Ended | | | |
| | | Year Ended February 28, | | February 29, | | Year Ended February 28, | |
Class Z | | 2014 | | 2013 | | 2012 | | 2011 | | 2010 | |
Per share data | |
Net asset value, beginning of period | | $ | 12.99 | | | $ | 13.27 | | | $ | 15.28 | | | $ | 13.62 | | | $ | 9.49 | | |
Income from investment operations: | |
Net investment income | | | 0.58 | | | | 0.42 | | | | 0.42 | | | | 0.26 | | | | 0.36 | (a) | |
Net realized and unrealized gain (loss) | | | 2.90 | | | | (0.19 | ) | | | (1.90 | ) | | | 1.83 | | | | 4.01 | | |
Total from investment operations | | | 3.48 | | | | 0.23 | | | | (1.48 | ) | | | 2.09 | | | | 4.37 | | |
Less distributions to shareholders: | |
Net investment income | | | (0.74 | ) | | | (0.49 | ) | | | (0.53 | ) | | | (0.43 | ) | | | (0.24 | ) | |
Tax return of capital | | | — | | | | (0.02 | ) | | | — | | | | — | | | | — | | |
Total distributions to shareholders | | | (0.74 | ) | | | (0.51 | ) | | | (0.53 | ) | | | (0.43 | ) | | | (0.24 | ) | |
Proceeds from regulatory settlements | | | — | | | | — | | | | 0.00 | (b) | | | 0.00 | (b) | | | 0.00 | (b) | |
Redemption fees: | |
Redemption fees added to paid-in capital | | | — | | | | — | | | | — | | | | — | | | | 0.00 | (b) | |
Net asset value, end of period | | $ | 15.73 | | | $ | 12.99 | | | $ | 13.27 | | | $ | 15.28 | | | $ | 13.62 | | |
Total return | | | 27.13 | % | | | 1.86 | % | | | (9.35 | %) | | | 15.74 | % | | | 45.94 | % | |
Ratios to average net assets(c) | |
Total gross expenses | | | 1.26 | %(d) | | | 1.32 | %(d) | | | 1.27 | %(d) | | | 1.23 | %(d) | | | 1.17 | %(d) | |
Total net expenses(e) | | | 1.19 | %(d)(f) | | | 1.18 | %(d)(f) | | �� | 1.16 | %(d)(f) | | | 1.23 | %(d)(f) | | | 1.17 | %(d)(f) | |
Net investment income | | | 4.05 | % | | | 3.35 | % | | | 3.09 | % | | | 1.85 | % | | | 2.76 | % | |
Supplemental data | |
Net assets, end of period (in thousands) | | $ | 125,914 | | | $ | 453,526 | | | $ | 924,777 | | | $ | 1,277,799 | | | $ | 1,187,812 | | |
Portfolio turnover | | | 14 | %(g) | | | — | | | | — | | | | — | | | | — | | |
Portfolio turnover of Columbia International Value
Master Portfolio | | | 100 | %(h) | | | 13 | % | | | 16 | % | | | 7 | % | | | 22 | % | |
Notes to Financial Highlights
(a) Net investment income per share reflects special dividends. The effect of these dividends amounted to $0.13 per share.
(b) Rounds to zero.
(c) In addition to the fees and expenses which the Fund bears directly, the Fund indirectly bears a pro rata share of the fees and expenses of the acquired funds in which it invests. Such indirect expenses are not included in the reported expense ratios.
(d) Ratios include line of credit interest expense which rounds to less than 0.01%.
(e) Total net expenses include the impact of certain waivers/reimbursements made by the Investment Manager and certain of its affiliates, if applicable.
(f) The benefits derived from expense reductions had an impact of less than 0.01%.
(g) Amount represents results after the Fund's conversion to a stand-alone structure.
(h) Amount represents results prior to the Fund's conversion to a stand-alone structure.
The accompanying Notes to Financial Statements are an integral part of this statement.
Annual Report 2014
27
Columbia International Value Fund
Notes to Financial Statements
February 28, 2014
Note 1. Organization
Columbia International Value Fund (the Fund), a series of Columbia Funds Series Trust (the Trust), is a diversified fund. The Trust is registered under the Investment Company Act of 1940, as amended (the 1940 Act), as an open-end management investment company organized as a Delaware statutory trust.
Prior to December 16, 2013, the Fund operated in a master-feeder structure, investing all of its assets in Columbia International Value Master Portfolio (the Master Portfolio). After the close of business on December 13, 2013, the Master Portfolio was liquidated and the Fund redeemed in-kind its investments in the Master Portfolio and converted into a stand-alone fund, investing directly in individual portfolio securities rather than investing in the Master Portfolio.
Fund Shares
The Trust may issue an unlimited number of shares (without par value). The Fund offers Class A, Class B, Class C, Class I, Class R, Class R4, Class R5 and Class Z shares. Although all share classes generally have identical voting, dividend and liquidation rights, each share class votes separately when required by law. Different share classes pay different distribution amounts to the extent the expenses of such share classes differ, and distributions in liquidation will be proportional to the net asset value of each share class. Each share class has its own expense structure and sales charges, as applicable.
Class A shares are subject to a maximum front-end sales charge of 5.75% based on the initial investment amount. Class A shares purchased without an initial sales charge in accounts aggregating $1 million to $50 million at the time of purchase are subject to a contingent deferred sales charge (CDSC) if the shares are sold within 18 months of purchase, charged as follows: 1.00% CDSC if redeemed within 12 months of purchase, and 0.50% CDSC if redeemed more than 12, but less than 18, months after purchase.
Class B shares may be subject to a maximum CDSC of 5.00% based upon the holding period after purchase. Class B shares will generally convert to Class A shares eight years after purchase. The Fund no longer accepts investments by new or existing investors in the Fund's Class B shares, except in connection with the reinvestment of any dividend and/or capital gain distributions in Class B shares of the Fund and exchanges by existing Class B shareholders of certain other funds within the Columbia Family of Funds.
Class C shares are subject to a 1.00% CDSC on shares redeemed within one year of purchase.
Class I shares are not subject to sales charges and are available only to the Columbia Family of Funds.
Class R shares are not subject to sales charges and are generally available only to certain retirement plans and other eligible investors.
Class R4 shares are not subject to sales charges and are generally available only to omnibus retirement plans and certain other eligible investors.
Class R5 shares are not subject to sales charges and are generally available only to investors purchasing through authorized investment professionals and omnibus retirement plans.
Class Z shares are not subject to sales charges and are available only to certain eligible investors, which are subject to different investment minimums.
Note 2. Summary of Significant Accounting Policies
Use of Estimates
The preparation of financial statements in accordance with U.S. generally accepted accounting principles (GAAP) requires management to make certain estimates and assumptions that affect the reported amounts of assets and liabilities, the disclosure of contingent assets and liabilities at the date of the financial statements and the reported amounts of revenue and expenses during the reporting period. Actual results could differ from those estimates.
The following is a summary of significant accounting policies consistently followed by the Fund in the preparation of its financial statements.
All equity securities and exchange traded funds (ETFs) are valued at the close of business of the New York Stock Exchange (NYSE). Equity securities and ETFs are valued at the last quoted sales price on the principal exchange or market on which they trade, except for securities traded on the NASDAQ Stock Market, which are valued at the NASDAQ official close price. Unlisted securities or listed securities for which there were no sales during the day are valued at the mean of the latest quoted bid and ask prices on such exchanges or markets.
Foreign equity securities are valued based on quotations from the principal market in which such securities are normally traded. If any foreign share prices are not readily available as a result of limited share activity the securities are valued at the mean of the latest quoted bid and ask prices on such exchanges or markets. Foreign currency exchange rates are generally determined at 4:00 p.m. Eastern (U.S.) time.
Annual Report 2014
28
Columbia International Value Fund
Notes to Financial Statements (continued)
February 28, 2014
However, many securities markets and exchanges outside the U.S. close prior to the close of the NYSE; therefore, the closing prices for securities in such markets or on such exchanges may not fully reflect events that occur after such close but before the close of the NYSE. In those situations, foreign securities will be fair valued pursuant to the policy adopted by the Board of Trustees (the Board), including utilizing a third party pricing service to determine these fair values. The third party pricing service takes into account multiple factors, including, but not limited to, movements in the U.S. securities markets, certain depositary receipts, futures contracts and foreign exchange rates that have occurred subsequent to the close of the foreign exchange or market, to determine a good faith estimate that reasonably reflects the current market conditions as of the close of the NYSE. The fair value of a security is likely to be different from the quoted or published price, if available.
Investments in open-end investment companies, including money market funds, are valued at net asset value.
Forward foreign currency exchange contracts are marked-to-market based upon foreign currency exchange rates provided by a pricing service.
Option contracts are valued at the mean of the latest quoted bid and asked prices on their primary exchanges. Option contracts, including over-the-counter option contracts, with no readily available market value are valued using quotations obtained from independent brokers as of the close of the NYSE.
Investments for which market quotations are not readily available, or that have quotations which management believes are not reliable, are valued at fair value as determined in good faith under consistently applied procedures established by and under the general supervision of the Board. If a security or class of securities (such as foreign securities) is valued at fair value, such value is likely to be different from the last quoted market price for the security.
The determination of fair value often requires significant judgment. To determine fair value, management may use assumptions including but not limited to future cash flows and estimated risk premiums. Multiple inputs from various sources may be used to determine fair value.
Prior to December 16, 2013, the Fund invested all or substantially all of its assets in the Master Portfolio, an open-end management investment company having the same investment objectives as the Fund.
Foreign Currency Transactions and Translations
The values of all assets and liabilities denominated in foreign currencies are translated into U.S. dollars at that day's
exchange rates. Net realized and unrealized gains (losses) on foreign currency transactions and translations include gains (losses) arising from the fluctuation in exchange rates between trade and settlement dates on securities transactions, gains (losses) arising from the disposition of foreign currency and currency gains (losses) between the accrual and payment dates on dividends, interest income and foreign withholding taxes.
For financial statement purposes, the Fund does not distinguish that portion of gains (losses) on investments which is due to changes in foreign exchange rates from that which is due to changes in market prices of the investments. Such fluctuations are included with the net realized and unrealized gains (losses) on investments in the Statement of Operations.
Derivative Instruments
The Fund invests in certain derivative instruments, as detailed below, to meet its investment objectives. Derivatives are instruments whose values depend on, or are derived from, in whole or in part, the value of one or more other assets, such as securities, currencies, commodities or indices. Derivative instruments may be used to maintain cash reserves while maintaining exposure to certain other assets, to offset anticipated declines in values of investments, to facilitate trading, to reduce transaction costs and to pursue higher investment returns. The Fund may also use derivative instruments to mitigate certain investment risks, such as foreign currency exchange rate risk, interest rate risk and credit risk. Derivatives may involve various risks, including the potential inability of the counterparty to fulfill its obligation under the terms of the contract, the potential for an illiquid secondary market (making it difficult for the Fund to sell, including at favorable prices) and the potential for market movements which may expose the Fund to gains or losses in excess of the amount shown in the Statement of Assets and Liabilities. The notional amounts of derivative instruments, if applicable, are not recorded in the financial statements.
A derivative instrument may suffer a mark to market loss if the value of the contract decreases due to an unfavorable change in the market rates or values of the underlying instrument. Losses can also occur if the counterparty does not perform under the contract. The Fund's risk of loss from counterparty credit risk on over-the-counter derivatives is generally limited to the aggregate unrealized gain netted against any collateral held by the Fund and the amount of any initial margin held by the counterparty. With exchange traded or centrally cleared derivatives, there is minimal counterparty credit risk to the Fund since the exchange's clearinghouse, as counterparty to such instruments, guarantees against a possible default. The clearinghouse stands between the buyer and the seller of the contract; therefore, the counterparty credit risk is limited to failure of the clearinghouse. However, credit risk still exists in
Annual Report 2014
29
Columbia International Value Fund
Notes to Financial Statements (continued)
February 28, 2014
exchange traded or centrally cleared derivatives with respect to initial and variation margin that is held in a broker's customer accounts. While brokers are required to segregate customer margin from their own assets, in the event that a broker becomes insolvent or goes into bankruptcy and at that time there is a shortfall in the aggregate amount of margin held by the broker for all its clients, U.S. bankruptcy laws will typically allocate that shortfall on a pro-rata basis across all the broker's customers, potentially resulting in losses to the Fund.
In order to better define its contractual rights and to secure rights that will help the Fund mitigate its counterparty risk, the Fund may enter into an International Swaps and Derivatives Association, Inc. Master Agreement (ISDA Master Agreement) or similar agreement with its derivative contract counterparties. An ISDA Master Agreement is an agreement between the Fund and a counterparty that governs over-the-counter derivatives and forward foreign currency exchange contracts and typically contains, among other things, collateral posting terms and netting provisions in the event of a default and/or termination event. Under an ISDA Master Agreement, the Fund may, under certain circumstances, offset with the counterparty certain derivative instrument's payables and/or receivables with collateral held and/or posted and create one single net payment. The provisions of the ISDA Master Agreement typically permit a single net payment in the event of default (close-out netting) including the bankruptcy or insolvency of the counterparty. Note, however, that bankruptcy or insolvency laws of a particular jurisdiction may impose restrictions on or prohibitions against the right of offset in bankruptcy, insolvency or other events.
Collateral (margin) requirements differ by type of derivative. Margin requirements are established by the exchange or clearinghouse for exchange traded and centrally cleared derivatives. Brokers can ask for margin in excess of the minimum in certain circumstances. Collateral terms are contract specific for over-the-counter derivatives. For over-the-counter derivatives traded under an ISDA Master Agreement, the collateral requirements are typically calculated by netting the mark to market amount for each transaction under such agreement and comparing that amount to the value of any variation margin currently pledged by the Fund and/or the counterparty. Generally, the amount of collateral due from or to a party has to exceed a minimum transfer amount threshold (e.g., $500,000) before a transfer has to be made. To the extent amounts due to the Fund from its counterparties are not fully collateralized, contractually or otherwise, the Fund bears the risk of loss from counterparty nonperformance. The
Fund attempts to mitigate counterparty risk by only entering into agreements with counterparties that it believes have the financial resources to honor their obligations and by monitoring the financial stability of those counterparties.
Certain ISDA Master Agreements allow counterparties to over-the-counter derivatives to terminate derivative contracts prior to maturity in the event the Fund's net assets decline by a stated percentage over a specified time period or the Fund fails to meet the terms of the ISDA Master Agreement, which would cause the Fund to accelerate payment of any net liability owed to the counterparty. The Fund also has termination rights if the counterparty fails to meet the terms of the ISDA Master Agreement. In addition to considering counterparty credit risk, the Fund would consider terminating the derivative contracts based on whether termination would result in a net liability owed from the counterparty.
For financial reporting purposes, the Fund does not offset derivative assets and derivative liabilities that are subject to netting arrangements in the Statement of Assets and Liabilities.
Forward Foreign Currency Exchange Contracts
Forward foreign currency exchange contracts are over-the-counter agreements between two parties to buy and sell a currency at a set price on a future date. These contracts are typically intended to be used to minimize the exposure to foreign exchange rate fluctuations during the period between the trade and settlement dates of the contract. The Fund utilized forward foreign currency exchange contracts to hedge the currency exposure associated with some or all of the Fund's securities, to shift investment exposure from one currency to another and to shift U.S. dollar exposure to achieve a representative weighted mix of major currencies in its benchmark, and/or to recover an underweight country exposure in its portfolio. These instruments may be used for other purposes in future periods.
The values of forward foreign currency exchange contracts fluctuate with changes in foreign currency exchange rates. The Fund will record a realized gain or loss when the forward foreign currency exchange contract expires or is closed.
The use of forward foreign currency exchange contracts does not eliminate fluctuations in the prices of the Fund's portfolio securities. The risks of forward foreign currency exchange contracts include movement in the values of the foreign currencies relative to the U.S. dollar (or other foreign currencies) and the possibility that counterparties will not complete their contractual obligations, which may be in excess
Annual Report 2014
30
Columbia International Value Fund
Notes to Financial Statements (continued)
February 28, 2014
of the amount reflected, if any, in the Statement of Assets and Liabilities.
Options Contracts
Options are contracts which entitle the holder to purchase or sell securities or other identified assets at a specified price, or in the case of index option contracts, to receive or pay the difference between the index value and the strike price of the index option contract. Option contracts can be either exchange traded or over-the-counter. The Fund purchased and wrote option contracts to decrease the Fund's exposure to equity market risk, increase return on investments and to facilitate buying and selling of securities for investments. These instruments may be used for other purposes in future periods. Completion of transactions for option contracts traded in the over-the-counter market depends upon the performance of the other party. Cash collateral may be collected or posted by the Fund to secure certain over-the-counter option contract trades. Cash collateral held or posted by the Fund for such option contract trades must be returned to the counterparty or the Fund upon closure, exercise or expiration of the contract.
Options contracts purchased are recorded as investments. When the Fund writes an options contract, the premium received is recorded as an asset and an amount equivalent to the premium is recorded as a liability in the Statement of Assets and Liabilities and is subsequently adjusted to reflect the current fair value of the option written. The Fund will realize a gain or loss when the option contract is closed or expires. When option contracts are exercised, the proceeds on sales for a written call or purchased put option contract, or the purchase cost for a written put or purchased call option contract, is adjusted by the amount of premium received or paid.
For over-the-counter options purchased, the Fund bears the risk of loss of the amount of the premiums paid plus the positive change in market values net of any collateral held by the Fund should the counterparty fail to perform under the contracts. Option contracts written by the Fund do not typically give rise to counterparty credit risk, as options written generally obligate the Fund and not the counterparty to perform. The risk in writing a call option contract is that the Fund gives up the opportunity for profit if the market price of the security increases above the strike price and the option contract is exercised. The risk in writing a put option contract is that the Fund may incur a loss if the market price of the security decreases below the strike price and the option contract is exercised. Exercise of a written option could result in the Fund purchasing or selling a security or foreign currency when it otherwise would not, or at a price different from the current market value. In purchasing and writing options, the Fund bears the risk of an unfavorable change in the value of the underlying instrument or the risk that the Fund may not be able to enter into a closing transaction due to an illiquid market.
Contracts and premiums associated with options contracts written for the Year Ended February 28, 2014 are as follows:
| | | Calls | |
| | | Contracts | | Premiums ($) | |
Balance at February 28, 2013 | | | — | | | | — | | |
Opened | | | 3,159 | | | | 25,666 | | |
Closed | | | — | | | | — | | |
Expired | | | (1,030 | ) | | | (17,121 | ) | |
Exercised | | | (2,129 | ) | | | (8,545 | ) | |
Balance at February 28, 2014 | | | — | | | | — | | |
Offsetting of Derivative Assets and Derivative Liabilities
The following tables present the Fund's gross and net amount of assets and liabilities available for offset under netting arrangements as well as any related collateral received or pledged by the Fund as of February 28, 2014:
| | | | | | Net Amounts of | | Gross Amounts Not Offset in
the Statement of Assets and Liabilities | | | |
| | Gross
Amounts of
Recognized
Assets ($) | | Gross Amounts
Offset in the
Statement of
Assets and
Liabilities ($) | | Assets
Presented in the
Statement of
Assets and
Liabilities ($) | | Financial
Instruments ($)(a) | | Cash
Collateral
Received ($) | | Securities
Collateral
Received ($) | | Net
Amount ($)(b) | |
Asset Derivatives: | |
Forward Foreign Currency
Exchange Contracts | | | 427,564 | | | | — | | | | 427,564 | | | | 196,623 | | | | — | | | | — | | | | 230,941 | | |
Annual Report 2014
31
Columbia International Value Fund
Notes to Financial Statements (continued)
February 28, 2014
| | | | | | Net Amounts of | | Gross Amounts Not Offset in
the Statement of Assets and Liabilities | | | |
| | Gross
Amounts of
Recognized
Liabilities ($) | | Gross Amounts
Offset in the
Statement of
Assets and
Liabilities ($) | | Liabilities
Presented in the
Statement of
Assets and
Liabilities ($) | | Financial
Instruments ($)(c) | | Cash
Collateral
Pledged ($) | | Securities
Collateral
Pledged ($) | | Net
Amount ($)(d) | |
Liability Derivatives: | |
Forward Foreign Currency
Exchange Contracts | | | 196,623 | | | | — | | | | 196,623 | | | | 196,623 | | | | — | | | | — | | | | — | | |
(a) Represents the amount of assets that could be offset by liabilities with the same counterparty under master netting or similar agreements that management elects not to offset on the Statement of Assets and Liabilities.
(b) Represents the net amount due from counterparties in the event of default.
(c) Represents the amount of liabilities that could be offset by assets with the same counterparty under master netting or similar agreements that management elects not to offset on the Statement of Assets and Liabilities.
(d) Represents the net amount due to counterparties in the event of default.
Effects of Derivative Transactions in the Financial Statements
The following tables are intended to provide additional information about the effect of derivatives on the financial statements of the Fund, including: the fair value of derivatives by risk category and the location of those fair values in the Statement of Assets and Liabilities; the impact of derivative transactions over the period in the Statement of Operations including realized gains or losses and unrealized gains or losses. The derivative schedules following the Portfolio of Investments present additional information regarding derivative instruments outstanding at the end of the period, if any.
The following table is a summary of the fair value of derivative instruments at February 28, 2014:
Asset Derivatives | |
Risk Exposure
Category | | Statement of Assets and
Liabilities Location | | Fair Value ($) | |
Foreign exchange
risk
| | Unrealized appreciation on
forward foreign currency
exchange contracts | | | 427,564
| | |
Liability Derivatives | |
Risk Exposure
Category | | Statement of Assets and
Liabilities Location | |
Fair Value ($) | |
Foreign exchange
risk
| | Unrealized depreciation on
forward foreign currency
exchange contracts | | | 196,623
| | |
The following table indicates the effect of derivative instruments in the Statement of Operations for the year ended February 28, 2014:
Amount of Realized Gain (Loss) on Derivatives Recognized in Income | |
Risk Exposure
Category | | Forward Foreign
Currency Exchange
Contracts ($) | | Options
Contracts
Written and
Purchased ($) | | Total ($) | |
Equity risk | | | — | | | | 17,122 | | | | 17,122 | | |
Foreign exchange
risk | | | 827,133 | | | | — | | | | 827,133 | | |
Total | | | 827,133 | | | | 17,122 | | | | 844,255 | | |
Change in Unrealized Appreciation (Depreciation) on
Derivatives Recognized in Income | |
Risk Exposure
Category | | Forward Foreign
Currency Exchange
Contracts ($) | | | |
Foreign exchange
risk | | 230,941 | | | |
The following table is a summary of the volume of derivative instruments for the year ended February 28, 2014:
Derivative Instrument | | Contracts Opened | |
Forward foreign currency exchange contracts | | | 235 | | |
Options contracts | | | 3,159 | | |
Security Transactions
Security transactions are accounted for on the trade date. Cost is determined and gains (losses) are based upon the specific identification method for both financial statement and federal income tax purposes.
Annual Report 2014
32
Columbia International Value Fund
Notes to Financial Statements (continued)
February 28, 2014
Income Recognition
Corporate actions and dividend income are generally recorded net of any non-reclaimable tax withholdings, on the ex-dividend date or upon receipt of ex-dividend notification in the case of certain foreign securities.
Awards from class action litigation are recorded as a reduction of cost basis if the Fund still owns the applicable securities on the payment date. If the Fund no longer owns the applicable securities, the proceeds are recorded as realized gains.
Expenses
General expenses of the Trust are allocated to the Fund and other funds of the Trust based upon relative net assets or other expense allocation methodologies determined by the nature of the expense. Expenses directly attributable to the Fund are charged to the Fund. Expenses directly attributable to a specific class of shares are charged to that share class.
Determination of Class Net Asset Value
All income, expenses (other than class-specific expenses, which are charged to that share class, as shown in the Statement of Operations) and realized and unrealized gains (losses) are allocated to each class of the Fund on a daily basis, based on the relative net assets of each class, for purposes of determining the net asset value of each class.
Prior to December 16, 2013, the Fund recorded its proportionate share of investment income, realized and unrealized gains (losses) and expenses reported by the Master Portfolio on a daily basis. The investment income, realized and unrealized gains (losses) and expenses were allocated daily to investors of the Master Portfolio based upon the relative value of their investment in the Master Portfolio.
Federal Income Tax Status
The Fund intends to qualify each year as a regulated investment company under Subchapter M of the Internal Revenue Code, as amended, and will distribute substantially all of its taxable income (including net short-term capital gains), if any, for its tax year, and as such will not be subject to federal income taxes. In addition, the Fund intends to distribute in each calendar year substantially all of its net investment income, capital gains and certain other amounts, if any, such that the Fund should not be subject to federal excise tax. Therefore, no federal income or excise tax provision is recorded.
Foreign Taxes
The Fund may be subject to foreign taxes on income, gains on investments or currency repatriation, a portion of which may be recoverable. The Fund will accrue such taxes and
recoveries, as applicable, based upon its current interpretation of tax rules and regulations that exist in the markets in which it invests.
Realized gains in certain countries may be subject to foreign taxes at the Fund level, based on statutory rates. The Fund accrues for such foreign taxes on realized and unrealized gains at the appropriate rate for each jurisdiction, as applicable. The amount, if any, is disclosed as a liability on the Statement of Assets and Liabilities.
Distributions to Shareholders
Distributions from net investment income, if any, are declared and paid semi-annually. Net realized capital gains, if any, are distributed at least annually. Income distributions and capital gain distributions are determined in accordance with federal income tax regulations, which may differ from GAAP.
Guarantees and Indemnifications
Under the Trust's organizational documents and, in some cases, by contract, its officers and trustees are indemnified against certain liabilities arising out of the performance of their duties to the Trust or its funds. In addition, certain of the Fund's contracts with its service providers contain general indemnification clauses. The Fund's maximum exposure under these arrangements is unknown since the amount of any future claims that may be made against the Fund cannot be determined, and the Fund has no historical basis for predicting the likelihood of any such claims.
Note 3. Fees and Compensation Paid to Affiliates
Investment Management Fees
Under an Investment Management Services Agreement, Columbia Management Investment Advisers, LLC (the Investment Manager), a wholly-owned subsidiary of Ameriprise Financial, Inc. (Ameriprise Financial), determines which securities will be purchased, held or sold. Effective December 14, 2013, the investment management fee is an annual fee that is equal to a percentage of the Fund's average daily net assets that declines from 0.79% to 0.62% as the Fund's net assets increase. The effective investment management fee rate for the period December 14, 2013 to February 28, 2014 was 0.79% of the Fund's average daily net assets.
Prior to December 14, 2013, the Fund paid for investment management services indirectly through its investment in the Master Portfolio. The indirect effective investment management fee rate for the period March 1, 2013 to December 13, 2013 was 0.82% of the Fund's average daily net assets.
Annual Report 2014
33
Columbia International Value Fund
Notes to Financial Statements (continued)
February 28, 2014
Administration Fees
Under an Administrative Services Agreement, the Investment Manager also serves as the Fund Administrator. Effective December 14, 2013, the Fund pays the Fund Administrator an annual fee for administration and accounting services equal to a percentage of the Fund's average daily net assets that declines from 0.08% to 0.05% as the Fund's net assets increase. The effective administration fee rate for the period December 14, 2013 through February 28, 2014 was 0.08% of the Fund's average daily net assets.
Prior to December 14, 2013, the Fund paid for a portion of the administrative services directly and paid a portion indirectly through its investment in the Master Portfolio. For the period June 1, 2013 through December 13, 2013, the Fund paid the Fund Administrator an annual administration fee equal to 0.02% of the Fund's average daily net asset. Prior to June 1, 2013, the Fund paid the Fund Administrator an annual administration fee equal to 0.17% of the Fund's average daily net assets. The indirect effective administrative fee rate for the period March 1, 2013 to December 13, 2013 was 0.06 % of the Fund's average daily net assets.
Other Expenses
Other expenses are for, among other things, miscellaneous expenses of the Fund or the Board, including payments to a company providing limited administrative services to the Fund and the Board. That company's expenses include boardroom and office expense, employee compensation, employee health and retirement benefits, and certain other expenses. For the year ended February 28, 2014, other expenses paid to this company were $2,619.
Compensation of Board Members
Board members are compensated for their services to the Fund as disclosed in the Statement of Operations. Under a Deferred Compensation Plan (the Plan), the Board members who are not "interested persons" of the Fund, as defined under the 1940 Act, may elect to defer payment of up to 100% of their compensation. Deferred amounts are treated as though equivalent dollar amounts had been invested in shares of certain funds managed by the Investment Manager. The Fund's liability for these amounts is adjusted for market value changes and remains in the Fund until distributed in accordance with the Plan.
Transfer Agent Fees
Under a Transfer and Dividend Disbursing Agent Agreement, Columbia Management Investment Services Corp. (the Transfer Agent), an affiliate of the Investment Manager and a wholly-owned subsidiary of Ameriprise Financial, is
responsible for providing transfer agency services to the Fund. The Transfer Agent has contracted with Boston Financial Data Services (BFDS) to serve as sub-transfer agent.
The Transfer Agent receives monthly account-based service fees based on the number of open accounts and also receives sub-transfer agency fees based on a percentage of the average aggregate value of the Fund's shares maintained in omnibus accounts (other than omnibus accounts for which American Enterprise Investment Services Inc. is the broker of record or accounts where the beneficial shareholder is a customer of Ameriprise Financial Services, Inc., which are paid a per account fee). The Transfer Agent pays the fees of BFDS for services as sub-transfer agent and is not entitled to reimbursement for such fees from the Fund (with the exception of out-of-pocket fees).
The Transfer Agent also receives compensation from fees for various shareholder services and reimbursements for certain out-of-pocket fees. Class I shares do not pay transfer agent fees. Total transfer agent fees for Class R5 shares are subject to an annual limitation of not more than 0.05% of the average daily net assets attributable to Class R5 shares.
For the year ended February 28, 2014, the Fund's effective transfer agent fee rates as a percentage of average daily net assets of each class were as follows:
Class A | | | 0.19 | % | |
Class B | | | 0.19 | | |
Class C | | | 0.19 | | |
Class R | | | 0.18 | | |
Class R4 | | | 0.19 | | |
Class R5 | | | 0.05 | | |
Class Z | | | 0.19 | | |
An annual minimum account balance fee of $20 may apply to certain accounts with a value below the applicable share class's initial minimum investment requirements to reduce the impact of small accounts on transfer agent fees. These minimum account balance fees are recorded as part of expense reductions in the Statement of Operations. For the year ended February 28, 2014, these minimum account balance fees reduced total expenses by $920.
Distribution and Service Fees
The Fund has an agreement with Columbia Management Investment Distributors, Inc. (the Distributor), an affiliate of the Investment Manager and a wholly-owned subsidiary of Ameriprise Financial, for distribution and shareholder services. The Board has approved, and the Fund has adopted, distribution and shareholder service plans (the Plans) applicable to certain share classes, which set the distribution
Annual Report 2014
34
Columbia International Value Fund
Notes to Financial Statements (continued)
February 28, 2014
and service fees for the Fund. These fees are calculated daily and are intended to compensate the Distributor and/or eligible selling and/or servicing agents for selling shares of the Fund and providing services to investors.
Under the Plans, the Fund pays a monthly combined distribution and service fee to the Distributor at the maximum annual rate of 0.25% of the average daily net assets attributable to Class A shares of the Fund. Also under the Plans, the Fund pays a monthly service fee at the maximum annual rate of 0.25% of the average daily net assets attributable to Class B and Class C shares of the Fund and the payment of a monthly distribution fee at the maximum annual rates of 0.75%, 0.75% and 0.50% of the average daily net assets attributable to Class B, Class C and Class R shares, respectively.
Sales Charges
Sales charges, including front-end charges and CDSCs, received by the Distributor for distributing Fund shares were $60,678 for Class A, $657 for Class B, and $494 for Class C shares for the year ended February 28, 2014.
Expenses Waived/Reimbursed by the Investment Manager and its Affiliates
The Investment Manager and certain of its affiliates have contractually agreed to waive fees and/or reimburse expenses (excluding certain fees and expenses described below) for the periods disclosed below, unless sooner terminated at the sole discretion of the Board, so that the Fund's net operating expenses, after giving effect to fees waived/expenses reimbursed and any balance credits and/or overdraft charges from the Fund's custodian, do not exceed the following annual rates as a percentage of the class' average daily net assets:
| | | June 1, 2013
through
June 30, 2014 | | Prior to
June 1, 2013 | |
Class A | | | 1.41 | % | | | 1.46 | % | |
Class B | | | 2.16 | | | | 2.21 | | |
Class C | | | 2.16 | | | | 2.21 | | |
Class I | | | 1.02 | | | | 1.07 | | |
Class R | | | 1.66 | | | | 1.71 | | |
Class R4 | | | 1.16 | | | | 1.21 | | |
Class R5 | | | 1.07 | | | | 1.12 | | |
Class Z | | | 1.16 | | | | 1.21 | | |
Under the agreement governing these fee waivers and/or expense reimbursement arrangements, the following fees and expenses are excluded from the waiver/reimbursement commitment, and therefore will be paid by the Fund, if applicable: taxes (including foreign transaction taxes), expenses associated with investments in affiliated and
non-affiliated pooled investment vehicles (including mutual funds and exchange traded funds), transaction costs and brokerage commissions, costs related to any securities lending program, dividend expenses associated with securities sold short, inverse floater program fees and expenses, transaction charges and interest on borrowed money, interest, extraordinary expenses and any other expenses the exclusion of which is specifically approved by the Board. This agreement may be modified or amended only with approval from all parties.
Note 4. Federal Tax Information
The timing and character of income and capital gain distributions are determined in accordance with income tax regulations, which may differ from GAAP because of temporary or permanent book to tax differences.
At February 28, 2014, these differences are primarily due to differing treatment for capital loss carryforwards, deferral/reversal of wash sales losses, Trustees' deferred compensation, foreign currency transactions, passive foreign investment company (PFIC) holdings, derivative investments, and tax basis adjustment for property acquired from partnership. To the extent these differences are permanent, reclassifications are made among the components of the Fund's net assets in the Statement of Assets and Liabilities. Temporary differences do not require reclassifications. In the Statement of Assets and Liabilities the following reclassifications were made:
Undistributed net investment income | | $ | 6,266,946 | | |
Accumulated net realized loss | | | (5,932,971 | ) | |
Paid-in capital | | | (333,975 | ) | |
Net investment income and net realized gains (losses), as disclosed in the Statement of Operations, and net assets were not affected by this reclassification.
The tax character of distributions paid during the years indicated was as follows:
Year Ended February 28, | | 2014 | | 2013 | |
Ordinary income | | $ | 13,000,054 | | | $ | 36,505,594 | | |
Tax return of capital | | | — | | | | 1,255,633 | | |
Total | | $ | 13,000,054 | | | $ | 37,761,227 | | |
Short-term capital gain distributions, if any, are considered ordinary income distributions for tax purposes.
At February 28, 2014, the components of distributable earnings on a tax basis were as follows:
Undistributed ordinary income | | $ | 3,196,458 | | |
Unrealized appreciation | | | 30,672,216 | | |
Annual Report 2014
35
Columbia International Value Fund
Notes to Financial Statements (continued)
February 28, 2014
At February 28, 2014, the cost of investments for federal income tax purposes was $241,807,008 and the aggregate gross unrealized appreciation and depreciation based on that cost was:
Unrealized appreciation | | $ | 38,978,863 | | |
Unrealized depreciation | | | (8,306,647 | ) | |
Net unrealized appreciation | | $ | 30,672,216 | | |
The following capital loss carryforward, determined at February 28, 2014, may be available to reduce taxable income arising from future net realized gains on investments, if any, to the extent permitted by the Internal Revenue Code:
Year of Expiration | | Amount | |
2018 | | $ | 185,725,377 | | |
2019 | | | 68,376,538 | | |
Unlimited long-term | | | 303,823,987 | | |
Total | | $ | 557,925,902 | | |
Unlimited capital loss carryforwards are required to be utilized prior to any capital losses which carry an expiration date. As a result of this ordering rule, capital loss carryforwards which carry an expiration date may be more likely to expire unused.
Management of the Fund has concluded that there are no significant uncertain tax positions that would require recognition in the financial statements. However, management's conclusion may be subject to review and adjustment at a later date based on factors including, but not limited to, new tax laws, regulations, and administrative interpretations (including relevant court decisions). Generally, the Fund's federal tax returns for the prior three fiscal years remain subject to examination by the Internal Revenue Service.
Note 5. Portfolio Information
For the period December 14, 2013 through February 28, 2014, the cost of purchases and proceeds from sales of securities, excluding short-term obligations, for the Fund aggregated to $38,805,675 and $60,134,959, respectively.
For the period March 1, 2013 through December 13, 2013, the cost of purchases and proceeds from sales of securities, excluding short-term obligations, for the Master Portfolio in which the Fund invested aggregated to $491,116,643 and $982,511,256, respectively.
Note 6. Affiliated Money Market Fund
Effective December 16, 2013, the Fund invests its daily cash balances in Columbia Short-Term Cash Fund, an affiliated money market fund established for the exclusive use by the Fund and other affiliated funds. The income earned by the Fund
from such investments is included as "Dividends — affiliated issuers" in the Statement of Operations. As an investing fund, the Fund indirectly bears its proportionate share of the expenses of Columbia Short-Term Cash Fund.
Note 7. Shareholder Concentration
At February 28, 2014, two unaffiliated shareholder accounts owned an aggregate of 35.7% of the outstanding shares of the Fund. The Fund has no knowledge about whether any portion of those shares was owned beneficially by such accounts. Subscription and redemption activity by concentrated accounts may have a significant effect on the operations of the Fund.
Note 8. Line of Credit
The Fund has entered into a revolving credit facility with a syndicate of banks led by JPMorgan Chase Bank N.A. whereby the Fund may borrow for the temporary funding of shareholder redemptions or for other temporary or emergency purposes. The credit facility agreement, as amended, which is a collective agreement between the Fund and certain other funds managed by the Investment Manager, severally and not jointly, permits collective borrowings up to $500 million. Interest is charged to each participating fund based on its borrowings at a rate equal to the higher of (i) the overnight federal funds rate plus 1.00% or (ii) the one-month LIBOR rate plus 1.00%. Each borrowing under the credit facility matures no later than 60 days after the date of borrowing. Effective December 10, 2013, the Fund also pays a commitment fee equal to its pro rata share of the amount of the credit facility at a rate of 0.075% per annum. Prior to December 10, 2013, the commitment fee was charged at the annual rate of 0.08% per annum. The commitment fee is included in other expenses in the Statement of Operations.
For the year ended February 28, 2014, the average daily loan balance outstanding on days when borrowing existed was $1,200,000 at a weighted average interest rate of 1.16%. Interest expense incurred by the Fund is recorded as line of credit interest expense in the Statement of Operations.
Note 9. Significant Risks
Foreign Securities Risk
Investing in foreign securities may include certain risks and considerations not typically associated with investing in U.S. securities, such as fluctuating currency values and changing local and regional economic, political and social conditions, which may result in greater market volatility. In addition, certain foreign securities may not be as liquid as U.S. securities. Investing in emerging markets may accentuate these risks.
Investments in emerging market countries are subject to additional risk. The risk of foreign investments is typically
Annual Report 2014
36
Columbia International Value Fund
Notes to Financial Statements (continued)
February 28, 2014
increased in less developed countries. These countries are also more likely to experience high levels of inflation, deflation or currency devaluation which could hurt their economies and securities markets.
Financial Sector Risk
Sector risk occurs when a fund invests a significant portion of its assets in securities of companies conducting business in a related group of industries within an economic sector. Companies in the same economic sector may be similarly affected by economic, regulatory, political or market events or conditions, making a fund more vulnerable to unfavorable developments in that economic sector than funds that invest more broadly. The Fund may be more susceptible to the particular risks that may affect companies in the financial sector than if it were invested in a wider variety of companies in unrelated sectors.
Note 10. Subsequent Events
Management has evaluated the events and transactions that have occurred through the date the financial statements were issued and noted no items requiring adjustment of the financial statements or additional disclosure.
Note 11. Information Regarding Pending and Settled Legal Proceedings
In December 2005, without admitting or denying the allegations, American Express Financial Corporation (AEFC, which is now known as Ameriprise Financial, Inc. (Ameriprise Financial)) entered into settlement agreements with the Securities and Exchange Commission (SEC) and Minnesota Department of Commerce (MDOC) related to market timing activities. As a result, AEFC was censured and ordered to cease and desist from committing or causing any violations of certain provisions of the Investment Advisers Act of 1940, the Investment Company Act of 1940, and various Minnesota laws. AEFC agreed to pay disgorgement of $10 million and civil money penalties of $7 million. AEFC also agreed to retain an independent distribution consultant to assist in developing a plan for distribution of all disgorgement and civil penalties ordered by the SEC in accordance with various undertakings detailed at www.sec.gov/litigation/admin/ia-2451.pdf. Ameriprise Financial and its affiliates have cooperated with the SEC and the MDOC in these legal proceedings, and have made regular reports to the Funds' Boards of Trustees.
Ameriprise Financial and certain of its affiliates have historically been involved in a number of legal, arbitration and regulatory proceedings, including routine litigation, class actions, and governmental actions, concerning matters arising
in connection with the conduct of their business activities. Ameriprise Financial believes that the Funds are not currently the subject of, and that neither Ameriprise Financial nor any of its affiliates are the subject of, any pending legal, arbitration or regulatory proceedings that are likely to have a material adverse effect on the Funds or the ability of Ameriprise Financial or its affiliates to perform under their contracts with the Funds. Ameriprise Financial is required to make 10-Q, 10-K and, as necessary, 8-K filings with the Securities and Exchange Commission on legal and regulatory matters that relate to Ameriprise Financial and its affiliates. Copies of these filings may be obtained by accessing the SEC website at www.sec.gov.
There can be no assurance that these matters, or the adverse publicity associated with them, will not result in increased fund redemptions, reduced sale of fund shares or other adverse consequences to the Funds. Further, although we believe proceedings are not likely to have a material adverse effect on the Funds or the ability of Ameriprise Financial or its affiliates to perform under their contracts with the Funds, these proceedings are subject to uncertainties and, as such, we are unable to estimate the possible loss or range of loss that may result. An adverse outcome in one or more of these proceedings could result in adverse judgments, settlements, fines, penalties or other relief that could have a material adverse effect on the consolidated financial condition or results of operations of Ameriprise Financial.
Annual Report 2014
37
Columbia International Value Fund
Report of Independent Registered Public Accounting Firm
To the Trustees of Columbia Funds Series Trust and the Shareholders of
Columbia International Value Fund
In our opinion, the accompanying statement of assets and liabilities, including the portfolio of investments, and the related statements of operations and of changes in net assets and the financial highlights present fairly, in all material respects, the financial position of Columbia International Value Fund (the "Fund", a series of Columbia Funds Series Trust) at February 28, 2014, and the results of its operations, the changes in its net assets and the financial highlights for each of the periods indicated, in conformity with accounting principles generally accepted in the United States of America. These financial statements and financial highlights (hereafter referred to as "financial statements") are the responsibility of the Fund's management; our responsibility is to express an opinion on these financial statements based on our audits. We conducted our audits of these financial statements in accordance with the standards of the Public Company Accounting Oversight Board (United States). Those standards require that we plan and perform the audit to obtain reasonable assurance about whether the financial statements are free of material misstatement. An audit includes examining, on a test basis, evidence supporting the amounts and disclosures in the financial statements, assessing the accounting principles used and significant estimates made by management, and evaluating the overall financial statement presentation. We believe that our audits, which included confirmation of securities at February 28, 2014 by correspondence with the custodian, brokers and transfer agent, and the application of alternative auditing procedures where such confirmations had not been received, provide a reasonable basis for our opinion.
PricewaterhouseCoopers LLP
Minneapolis, Minnesota
April 21, 2014
Annual Report 2014
38
Columbia International Value Fund
Federal Income Tax Information
(Unaudited)
The Fund hereby designates the following tax attributes for the fiscal year ended February 28, 2014. Shareholders will be notified in early 2015 of the amounts for use in preparing 2014 income tax returns.
Tax Designations:
| Qualified Dividend Income | | | 100.00 | % | |
| Dividends Received Deduction | | | 0.15 | % | |
| Foreign Taxes Paid | | $ | 1,584,172 | | |
| Foreign Source Income | | $ | 21,019,407 | | |
Qualified Dividend Income. For taxable, non-corporate shareholders, the percentage of ordinary income dividends paid during the fiscal year that represents qualified dividend income subject to reduced tax rates.
Dividends Received Deduction. The percentage of ordinary income dividends paid during the fiscal year that qualifies for the corporate dividends received deduction.
Foreign Taxes. The Fund makes the election to pass through to shareholders the foreign taxes paid. These taxes, and the corresponding foreign source income, are provided.
Annual Report 2014
39
Columbia International Value Fund
Shareholders elect the Board that oversees the Funds' operations. The Board appoints officers who are responsible for day-to-day business decisions based on policies set by the Board. The following table provides basic biographical information about the Funds' Board members, including their principal occupations during the past five years, although specific titles for individuals may have varied over the period. Under current Board policy, members may serve through the end of the calendar year in which he or she reaches either the mandatory retirement age established by the Board or the fifteenth anniversary of the first Board meeting they attended as a member of the Board.
Independent Trustees
Name,
Address,
Year of Birth | | Position Held With
Funds and Length of
Service | | Principal Occupation(s)
During Past Five Years
and Other Relevant
Professional Experience | | Number of
Funds in the
Fund Family
Overseen by
Board Member | | Other Present or Past
Directorships/
Trusteeships
(Within Past 5 Years) | |
Kathleen Blatz
901 S. Marquette Ave.
Minneapolis, MN 55402
1954 | | Board member since 1/06 for RiverSource Funds and since 6/11 for Nations Funds | | Attorney; Chief Justice, Minnesota Supreme
Court, 1998-2006 | | | 131 | | | Trustee, BlueCross BlueShield of Minnesota since 2009 | |
Edward J. Boudreau, Jr.
901 S. Marquette Ave.
Minneapolis, MN 55402
1944 | | Board member since 6/11 for RiverSource Funds and since 1/05 for Nations Funds | | Managing Director, E.J. Boudreau & Associates (consulting) since 2000; Chairman and Chief Executive Officer, John Hancock Funds (mutual funds), 1989-2000 | | | 129 | | | Former Trustee, BofA Funds Series Trust (11 funds), 2005-2011 | |
Pamela G. Carlton
901 S. Marquette Ave.
Minneapolis, MN 55402
1954 | | Board member since 7/07 for RiverSource Funds and since 6/11 for Nations Funds | | President, Springboard — Partners in Cross Cultural Leadership (consulting company) since 2003; Director or Management Director of US Equity Research, Chase Asset Management, 1996-2003; Investment Banker, Morgan Stanley, 1982-1996 | | | 131 | | | None | |
William P. Carmichael
901 S. Marquette Ave.
Minneapolis, MN 55402
1943 | | Chair of the Board since 1/14, Board member since 6/11 for RiverSource Funds and since 2003 for Nations Funds | | Retired; Co-founder, The Succession Fund (provides exit strategies to owners of privately held companies); previously, Senior Vice President, Sara Lee Corporation; Senior Vice President and Chief Financial officer, Beatrice Foods Company; Vice President, Esmark, Inc.; Associate, Price Waterhouse | | | 131 | | | Director, Cobra Electronics Corporation (electronic equipment manufacturer); The Finish Line (athletic shoes and apparel) since July 2003; Director, International Textile Corp. since 2012; former Director, McMoRan Exploration Company (oil and gas exploration and development) 2010-2013; former Trustee, BofA Funds Series Trust (11 funds), 2009-2011; Director, Spectrum Brands, Inc. (consumer products), 2002-2009; Director, Simmons Company (bedding), 2004-2010 | |
Annual Report 2014
40
Columbia International Value Fund
Trustees and Officers (continued)
Independent Trustees (continued)
Name,
Address,
Year of Birth | | Position Held With
Funds and Length of
Service | | Principal Occupation(s)
During Past Five Years
and Other Relevant
Professional Experience | | Number of
Funds in the
Fund Family
Overseen by
Board Member | | Other Present or Past
Directorships/
Trusteeships
(Within Past 5 Years) | |
Patricia M. Flynn
901 S. Marquette Ave.
Minneapolis, MN 55402
1950 | | Board member since 11/04 for RiverSource Funds and since 6/11 for Nations Funds | | Trustee Professor of Economics and Management, Bentley University since 1976 (also teaches and conducts research on corporate governance); Dean, McCallum Graduate School of Business, Bentley University, 1992-2002 | | | 131 | | | None | |
William A. Hawkins
901 S. Marquette Ave.
Minneapolis, MN 55402
1942 | | Board member since 6/11 for RiverSource Funds and since 1/05 for Nations Funds | | Managing Director, Overton Partners (financial consulting), since August 2010; President and Chief Executive Officer, California General Bank, N.A., January 2008-August 2010 | | | 129 | | | Trustee, BofA Funds Series Trust (11 funds) | |
R. Glenn Hilliard
901 S. Marquette Ave.
Minneapolis, MN 55402
1943 | | Board member since 6/11 for RiverSource Funds and since 1/05 for Nations Funds | | Chairman and Chief Executive Officer, Hilliard Group LLC (investing and consulting) since April 2003; Non-Executive Director & Chairman, CNO Financial Group, Inc. (insurance), September 2003-May 2011 | | | 129 | | | Chairman, BofA Fund Series Trust (11 funds); former Director, CNO Financial Group, Inc. (insurance), 2003-2011 | |
Stephen R. Lewis, Jr.
901 S. Marquette Ave.
Minneapolis, MN 55402
1939 | | Board member for RiverSource Funds since 1/02 and since 6/11 for Nations Funds, Board Chair 1/07-12/13 | | President Emeritus and Professor of Economics Emeritus, Carleton College since 2002 | | | 131 | | | Director, Valmont Industries, Inc. (irrigation systems manufacturer), 2002-2013 | |
Catherine James Paglia
901 S. Marquette Ave.
Minneapolis, MN 55402
1952 | | Board member since 11/04 for RiverSource Funds and since 6/11 for Nations Funds | | Director, Enterprise Asset Management, Inc. (private real estate and asset management company) since September 1998 | | | 131 | | | Director, Valmont Industries, Inc. (irrigation systems manufacturer) since 2012 | |
Leroy C. Richie
901 S. Marquette Ave.
Minneapolis, MN 55402
1941 | | Board member since 2000 for Legacy Seligman Funds, since 11/08 for RiverSource Funds and since 6/11 for Nations Funds | | Counsel, Lewis & Munday, P.C. (law firm) since 2004; Vice President and General Counsel, Automotive Legal Affairs, Chrysler Corporation, 1993-1997 | | | 131 | | | Lead Outside Director, Digital Ally, Inc. (digital imaging) since September 2005; Director, Infinity, Inc. (oil and gas exploration and production) since 1994; Director, OGE Energy Corp. (energy and energy services) since November 2007 | |
Minor M. Shaw
901 S. Marquette Ave.
Minneapolis, MN 55402
1947 | | Board member since 6/11 for RiverSource Funds and since 2003 for Nations Funds | | President, Micco LLC (private investments) since 2011; President, Micco Corp. since 1998 | | | 129 | | | Director, Piedmont Natural Gas; Director, BlueCross BlueShield of South Carolina since April 2008; Director, National Association of Corporate Directors, Carolinas Chapter, since 2013; former Trustee, BofA Funds Series Trust (11 funds) | |
Annual Report 2014
41
Columbia International Value Fund
Trustees and Officers (continued)
Independent Trustees (continued)
Name,
Address,
Year of Birth | | Position Held With
Funds and Length of
Service | | Principal Occupation(s)
During Past Five Years
and Other Relevant
Professional Experience | | Number of
Funds in the
Fund Family
Overseen by
Board Member | | Other Present or Past
Directorships/
Trusteeships
(Within Past 5 Years) | |
Alison Taunton-Rigby
901 S. Marquette Ave.
Minneapolis, MN 55402
1944 | | Board member since 11/02 for RiverSource Funds and since 6/11 for Nations Funds | | Chief Executive Officer and Director, RiboNovix, Inc., (biotechnology) 2003-2010 | | | 131 | | | Director, Healthways, Inc. (health and wellbeing solutions) since 2005; Director, ICI Mutual Insurance Company, RRG since 2011; Director, Abt Associates (government contractor) since 2001; Director, Boston Children's Hospital since 2002 | |
Interested Trustee Not Affiliated with Investment Manager*
Name,
Address,
Year of Birth | | Position Held With
Funds and Length of
Service | | Principal Occupation(s)
During Past Five Years
and Other Relevant
Professional Experience | | Number of
Funds in the
Fund Family
Overseen by
Board Member | | Other Present or Past
Directorships/
Trusteeships
(Within Past 5 Years) | |
Anthony M. Santomero
901 S. Marquette Ave.
Minneapolis, MN 55402
1946 | | Board member since 6/11 for RiverSource Funds and since 1/08 for Nations Funds | | Richard K. Mellon Professor Emeritus of Finance, The Wharton School, University of Pennsylvania, since 2002; Senior Advisor, McKinsey & Company (consulting), 2006-2008 | | | 129 | | | Director, Renaissance Reinsurance Ltd. since May 2008; Trustee, Penn Mutual Life Insurance Company since March 2008; Director, Citigroup Inc. since 2009; Director, Citibank, N.A. since 2009; former Trustee, BofA Funds Series Trust (11 funds), 2008-2011 | |
* Dr. Santomero is not an affiliated person of the Investment Manager or Ameriprise Financial. However, he is currently deemed by the Funds to be an "interested person" (as defined in the 1940 Act) of the Funds because he serves as a Director of Citigroup Inc. and Citibank, N.A., companies that may directly or through subsidiaries and affiliates engage from time-to-time in brokerage execution, principal transactions and lending relationships with the Funds or accounts advised/managed by the Investment Manager.
Annual Report 2014
42
Columbia International Value Fund
Trustees and Officers (continued)
Interested Trustee Affiliated with Investment Manager*
Name,
Address,
Year of Birth | | Position Held With
Funds and Length of
Service | | Principal Occupation(s)
During Past Five Years
and Other Relevant
Professional Experience | | Number of
Funds in the
Fund Family
Overseen by
Board Member | | Other Present or Past
Directorships/
Trusteeships
(Within Past 5 Years) | |
William F. Truscott
53600 Ameriprise
Financial Center
Minneapolis, MN 55474
1960 | | Board member since 11/01 for RiverSource Funds and since 6/11 for Nations Funds; Senior Vice President since 2002 for RiverSource Funds and since 5/10 for Nations Funds | | Chairman of the Board and President, Columbia Management Investment Advisers, LLC since May 2010 and February 2012, respectively (previously President and Chief Investment Officer, 2001-April 2010); Chief Executive Officer, Global Asset Management, Ameriprise Financial, Inc. since September 2012 (previously Chief Executive Officer, U.S. Asset Management & President, Annuities, May 2010-September 2012 and President — U.S. Asset Management and Chief Investment Officer, 2005-April 2010); Director and Chief Executive Officer, Columbia Management Investment Distributors, Inc. since May 2010 and February 2012, respectively (previously Chairman of the Board and Chief Executive Officer, 2006-April 2010); Chairman of the Board and Chief Executive Officer, RiverSource Distributors, Inc. since 2006; Director, Threadneedle Asset Management Holdings, SARL since 2014; President and Chief Executive Officer, Ameriprise Certificate Company, 2006-August 2012 | | | 183 | | | Former Director, Ameriprise Certificate Company, 2006-January 2013 | |
* Interested person (as defined under the 1940 Act) by reason of being an officer, director, security holder and/or employee of the Investment Manager or Ameriprise Financial.
The SAI has additional information about the Fund's Board members and is available, without charge, upon request by calling 800.345.6611; contacting your financial intermediary; or visiting columbiamanagement.com.
Annual Report 2014
43
Columbia International Value Fund
Trustees and Officers (continued)
The Board has appointed officers who are responsible for day-to-day business decisions based on policies it has established. The officers serve at the pleasure of the Board. In addition to Mr. Truscott, who is Senior Vice President, the Funds' other officers are:
Officers
Name,
Address and
Year of Birth | | Position and Year
First Appointed to
Position for any Fund
in the Columbia
Funds Complex or a
Predecessor Thereof | | Principal Occupation(s) During Past Five Years | |
J. Kevin Connaughton
225 Franklin Street
Boston, MA 02110
Born 1964 | | President and Principal Executive Officer (2009) | | Managing Director and General Manager — Mutual Fund Products, Columbia Management Investment Advisers, LLC since May 2010; and President, Columbia Funds since 2009; Managing Director, Columbia Management Advisors, LLC, December 2004 – April 2010; Senior Vice President and Chief Financial Officer, Columbia Funds, June 2008 – January 2009; and senior officer of Columbia Funds and affiliated funds since 2003 | |
Michael G. Clarke
225 Franklin Street
Boston, MA 02110
Born 1969 | | Treasurer (2011) and Chief Financial Officer (2009) | | Vice President — Mutual Fund Administration, Columbia Management Investment Advisers, LLC, since May 2010;Managing Director of Fund Administration, Columbia Management Advisors, LLC, September 2004 – April 2010; and senior officer of Columbia Funds and affiliated funds since 2002 | |
Scott R. Plummer
5228 Ameriprise Financial Center
Minneapolis, MN 55474
Born 1959 | | Senior Vice President (2006), Chief Legal Officer (2006) and Assistant Secretary (2011) | | Senior Vice President and Assistant General Counsel — Global Asset Management, Ameriprise Financial since February 2014 (previously, Senior Vice President and Lead Chief Counsel — Asset Management, 2012 – February 2014; Vice President and Lead Chief Counsel — Asset Management, 2010 – 2012; and Vice President and Chief Counsel — Asset Management, 2005 – 2010); Senior Vice President, Chief Legal Officer and Assistant Secretary, Columbia Management Investment Advisers, LLC since June 2005; Vice President, Chief Counsel and Assistant Secretary, Columbia Management Investment Distributors, Inc. since 2008; Vice President, General Counsel and Secretary, Ameriprise Certificate Company since 2005; Chief Counsel, RiverSource Distributors, Inc. since 2006; senior officer of Columbia Funds and affiliated funds since 2006 | |
Thomas P. McGuire
225 Franklin Street
Boston, MA 02110
Born 1972 | | Chief Compliance Officer (2012) | | Vice President — Asset Management Compliance, Ameriprise Financial, Inc. since May 2010; Chief Compliance Officer, Ameriprise Certificate Company, since September 2010; Compliance Executive, Bank of America, 2005 – April 2010 | |
Colin Moore
225 Franklin Street
Boston, MA 02110
Born 1958 | | Senior Vice President (2010) | | Executive Vice President and Global Chief Investment Officer, Ameriprise Financial, Inc. since July 2013; Director and Global Chief Investment Officer, Columbia Management Investment Advisers, LLC since May 2010; Manager, Managing Director and Chief Investment Officer, Columbia Management Advisors, LLC, 2007 – April 2010 | |
Michael E. DeFao
225 Franklin Street
Boston, MA 02110
Born 1968 | | Vice President (2011) and Assistant Secretary (2010) | | Vice President and Chief Counsel, Ameriprise Financial, Inc. since May 2010; Associate General Counsel, Bank of America 2005 – April 2010 | |
Joseph F. DiMaria
225 Franklin Street
Boston, MA 02110
Born 1968 | | Vice President (2011) and Chief Accounting Officer (2008) | | Vice President — Mutual Fund Treasurer, Columbia Management Investment Advisers, LLC since May 2010; Director of Fund Administration, Columbia Management Advisors, LLC, 2006 – April 2010 | |
Paul B. Goucher
100 Park Avenue
New York, NY 10017
Born 1968 | | Vice President (2011) and Assistant Secretary (2008) | | Vice President and Lead Chief Counsel, Ameriprise Financial, Inc. since November 2008 and January 2013, respectively (previously Chief Counsel, January 2010 – January 2013, and Group Counsel, November 2008 – January 2010); Director, Managing Director and General Counsel, J. & W. Seligman & Co. Incorporated, July 2008 – November 2008 | |
Amy Johnson
5228 Ameriprise Financial
Center
Minneapolis, MN 55474
Born 1965 | | Vice President (2006) | | Managing Director and Chief Operating Officer, Columbia Management Investment Advisers, LLC since May 2010 (previously Chief Administrative Officer, 2009 – April 2010, and Vice President — Asset Management and Trust Company Services, 2006 – 2009) | |
Annual Report 2014
44
Columbia International Value Fund
Trustees and Officers (continued)
Officers (continued)
Name,
Address and
Year of Birth | | Position and Year
First Appointed to
Position for any Fund
in the Columbia
Funds Complex or a
Predecessor Thereof | | Principal Occupation(s) During Past Five Years | |
Paul D. Pearson
5228 Ameriprise Financial
Center
Minneapolis, MN 55474
Born 1956 | | Vice President (2011) and Assistant Treasurer (1999) | | Vice President — Investment Accounting, Columbia Management Investment Advisers, LLC since May 2010; Vice President — Managed Assets, Investment Accounting, Ameriprise Financial, Inc., 1998 – April 2010 | |
Christopher O. Petersen
5228 Ameriprise Financial Center
Minneapolis, MN 55474
Born 1970 | | Vice President and Secretary (2010) | | Vice President and Chief Counsel, Ameriprise Financial, Inc., since January 2010 (previously Vice President and Group Counsel or Counsel, 2004 – January 2010); officer of Columbia Funds and affiliated funds since 2007 | |
Stephen T. Welsh
225 Franklin Street
Boston, MA 02110
Born 1957 | | Vice President (2006) | | President and Director, Columbia Management Investment Services Corp. since May 2010; President and Director, Columbia Management Services, Inc., 2004 – April 2010; Managing Director, Columbia Management Distributors, Inc., 2007 – April 2010 | |
Annual Report 2014
45
Columbia International Value Fund
Approval of Investment Management
Services Agreement
Columbia Management Investment Advisers, LLC (Columbia Management or the Investment Manager), a wholly-owned subsidiary of Ameriprise Financial, Inc. (Ameriprise Financial), serves as the investment manager to Columbia International Value Fund (the Fund), effective December 16, 2013. On that date, Columbia International Value Master Portfolio (the Master Portfolio), in which the Fund had invested substantially all of its assets, was liquidated and terminated. Prior to that date, Columbia Management served as the investment manager to the Master Portfolio. Under an investment management services agreement (the IMS Agreement), Columbia Management provided investment advice and other services to the Master Portfolio and continues to do so to the Fund and other funds distributed by Columbia Management Investment Distributors, Inc. (collectively, the Funds). The Fund's IMS Agreement is substantially identical to the Master Portfolio's IMS Agreement that had previously been in effect.
The Fund's Board of Trustees (the Board), including the independent Board members (the Independent Trustees), at its April 15-17, 2013 in-person Board meeting (the April Meeting), considered the renewal of the IMS Agreement with the Master Portfolio for an additional one-year term. Discussion of the Board's consideration and renewal of the IMS Agreement with the Master Portfolio can be found in the Fund's semi-annual report to shareholders dated August 31, 2013. The Board, at its November 18-20, 2013 in-person Board meeting (the November Meeting, and together with the April Meeting, the Meetings), considered the approval of a new, substantially identical (save for the date of its effectiveness and changing the name from the Master Portfolio to the Fund) IMS Agreement with the Fund because of the liquidation and termination of the Master Portfolio (due to the elimination of the master-feeder structure).
On an annual basis, the Board, including the Independent Trustees, considers renewal of Fund IMS Agreements. Columbia Management prepared detailed reports for the Board and its Contracts Committee in January, March and April 2013, including reports based on analyses of data provided by an independent organization (Lipper) and a comprehensive response to each item of information requested by independent legal counsel to the Independent Trustees (Independent Legal Counsel) in a letter to the Investment Manager, to assist the Board in making this determination. All of the materials presented in January, March and April were first supplied in draft form to designated representatives of the Independent Trustees, i.e., Independent Legal Counsel, Fund Counsel, the Chair of the Board and the Chair of the Contracts Committee, and the final materials (including proposed additional breakpoints in IMS fees for certain Funds) were revised to reflect discussion and subsequent requests made by the Contracts Committee. In addition, throughout the year, the Board (or its committees) regularly meets with portfolio management teams and senior management personnel and reviews information prepared by Columbia Management addressing the services Columbia Management provides and Fund performance. Further, the Board retained an independent consulting firm, Bobroff Consulting (the Independent Consultant), to assist the Independent Trustees in their review of IMS fees, expense caps and Ameriprise Financial's profitability. The Board also accords appropriate weight to the work, deliberations and conclusions of the Contracts Committee, the Investment Review Committee and the Compliance Committee in determining whether to continue Fund IMS Agreements.
At the Meetings, Independent Legal Counsel reviewed with the Independent Trustees various factors relevant to the Board's consideration of advisory agreements, and the Board's legal responsibilities related to such consideration. Following an analysis and discussion of the factors identified below, the Board, including all of the Independent Trustees, approved the IMS Agreement with the Fund at the November Meeting.
Nature, Extent and Quality of Services Provided by Columbia Management and the Subadviser
The Board considered its analysis of various reports and presentations received by it and its Committees, at the November Meeting and as part of the IMS Agreement annual review process at the April Meeting, detailing the services performed by Columbia Management, as well as its history, reputation, expertise, resources and relative capabilities, and the qualifications of its personnel. The Board also recalled its analysis of the capabilities and financial condition of Columbia Management at the April Meeting.
The Board observed that it had previously considered Columbia Management's code of ethics and compliance program at the April Meeting and that the Chief Compliance Officer continues to monitor the code and the program, and that no material concerns have been reported. The Board also discussed the acceptability of the terms of the Fund IMS Agreement, including that the IMS Agreement with the Fund was substantially identical (save for the date of its effectiveness and changing the name from the Master Portfolio to the Fund) to the one reviewed and renewed by the Board at the April Meeting between Columbia Management and the Master Portfolio. The Board recalled its considerations regarding
Annual Report 2014
46
Columbia International Value Fund
Approval of Investment Management
Services Agreement (continued)
Columbia Management at the April Meeting, including its conclusion that Columbia Management was in a position to provide a high quality and level of services to the Master Portfolio and that no concerns, in this regard, have emerged since the April Meeting.
Based on the foregoing, and based on other information received (both oral and written) and other considerations, including, in particular, the performance of the Fund (discussed below), the Board concluded that Columbia Management was in a position to provide services of a reasonable high quality to the Fund.
Investment Performance
For purposes of evaluating the nature, extent and quality of services provided under the IMS Agreement, the Board carefully reviewed the investment performance of the Fund. In this regard, the Board considered its April review of the Fund's performance, during which the Independent Trustees observed that the Fund's investment performance had not met expectations for certain periods and that appropriate action (i.e., the termination of the Fund's former subadviser) had since been taken. Considering the limited period that the Fund has been managed by Columbia Management, the Board determined to revisit the Fund's performance during the annual review of IMS Agreements at its upcoming April 2014 meeting.
Comparative Fees, Costs of Services Provided and the Profits Realized by Columbia Management and its Affiliates from their Relationships with the Fund
The Board reviewed comparative fees and the costs of services to be provided under the Fund IMS Agreement. The Board recalled its review, at the April Meeting, of comparative fees and the costs of services provided under the Master Portfolio IMS Agreement. The Board observed that fees paid under the Fund IMS Agreement were identical to those paid under the Master Portfolio IMS Agreement that was reviewed and renewed at the April Meeting. The Board concluded that the Fund's advisory fees were fair and reasonable in light of the extent and quality of services to be provided by the Investment Manager.
Economies of Scale to be Realized
The Board recalled its review, at the April Meeting, of the economies of scale that might be realized by Columbia Management as the Fund grows and took note of the extent to which Fund shareholders might also benefit from such growth. In this regard, the Board took into account that IMS Agreement fees decline as Fund assets exceed various breakpoints, all of which have not been surpassed.
Based on the foregoing, the Board, including all of the Independent Trustees, concluded that fees payable under the IMS Agreement with the Fund were fair and reasonable in light of the extent and quality of services to be provided. In reaching this conclusion, no single factor was determinative. On November 20, 2013, the Board, including all of the Independent Trustees, approved the IMS Agreement between Columbia Management and the Fund.
Annual Report 2014
47
This page intentionally left blank.
Annual Report 2014
48
Columbia International Value Fund
Important Information About This Report
Each fund mails one shareholder report to each shareholder address. If you would like more than one report, please call shareholder services at 800.345.6611 and additional reports will be sent to you.
The policy of the Board is to vote the proxies of the companies in which each fund holds investments consistent with the procedures as stated in the Statement of Additional Information (SAI). You may obtain a copy of the SAI without charge by calling 800.345.6611; contacting your financial intermediary; visiting columbiamanagement.com; or searching the website of the Securities and Exchange Commission (SEC) at sec.gov. Information regarding how each fund voted proxies relating to portfolio securities is filed with the SEC by August 31 for the most recent 12-month period ending June 30 of that year, and is available without charge by visiting columbiamanagement.com; or searching the website of the SEC at sec.gov.
Each fund files a complete schedule of portfolio holdings with the SEC for the first and third quarters of each fiscal year on Form N-Q. Each fund's Form N-Q is available on the SEC's website at sec.gov and may be reviewed and copied at the SEC's Public Reference Room in Washington, D.C. Information on the operation of the Public Reference Room may be obtained by calling 800.SEC.0330. Each fund's complete schedule of portfolio holdings, as filed on Form N-Q, can also be obtained without charge, upon request, by calling 800.345.6611.
Annual Report 2014
49

Columbia International Value Fund
P.O. Box 8081
Boston, MA 02266-8081
columbiamanagement.com
This information is for use with concurrent or prior delivery of a fund prospectus. Please read and consider the investment objectives, risks, charges and expenses for any fund carefully before investing. For a prospectus and, if available, a summary prospectus, which contains this and other important information about the Fund go to columbiamanagement.com. The Fund is distributed by Columbia Management Investment Distributors, Inc., member FINRA, and managed by Columbia Management Investment Advisers, LLC.
© 2014 Columbia Management Investment Advisers, LLC. All rights reserved.
ANN170_02_D01_(04/14)
Annual Report
February 28, 2014

Columbia Marsico 21st Century Fund
Not FDIC insured • No bank guarantee • May lose value
 Dear Shareholders,
Equities recovered
In the final months of 2013, the U.S. economy embraced a robust recovery. After five years of only modest progress, the pace of economic growth picked up, job gains continued, manufacturing activity accelerated and a rebound in the housing market showed staying power. Growth, as measured by gross domestic product, was 4.1% in the third quarter, with expectations for a solid fourth quarter. Job growth averaged close to 200,000 monthly. Industrial production rose at a rate of 3.3%, considerably higher than the 12-month average of 2.5%. Factories were busier than at any point since the 2008/2009 recession, with capacity utilization at 79%. Orders for durable goods were strong, bolstered by rising auto sales. Holiday spending was solid, especially online sales, which rose 10% year over year, despite a shorter season.
Against this backdrop, the Federal Reserve's (the Fed's) announcement that it would slowly retreat from its monthly bond buying program and a bipartisan budget deal in Washington were welcome news for investors. Stocks climbed to new highs in the fourth quarter, while bonds retreated as yields moved higher. Small-cap stocks outperformed large- and mid-cap stocks, led by significant gains from the industrials, technology and consumer discretionary sectors. All 10 sectors of the S&P 500 Index delivered positive returns, although telecommunications and utilities posted only modest gains.
Fixed-income retreated
Improved economic data drove interest rates higher over the fourth quarter, credit spreads narrowed and the dollar weakened against most developed market currencies. Against this backdrop, most non-Treasury, fixed-income sectors delivered positive returns. Outgoing Fed chairman Ben Bernanke expressed concern about the persistently low level of core inflation, but gains in the labor market and reduced unemployment led to the Fed's decision to taper its bond-buying program gradually beginning in January 2014.
As the stock market soared, the riskiest sectors of the fixed-income markets fared the best. U.S. and foreign high-yield bonds were the strongest performers, followed by emerging-market and U.S. investment-grade corporate bonds. U.S. mortgage-backed securities (MBS) and securitized bonds produced negative total returns, as did U.S. Treasuries and developed world government bonds. Treasury inflation-protected bonds were the period's biggest losers. Investment-grade municipals delivered fractional gains, as better economic conditions helped steady state finances.
Stay on track with Columbia Management
Backed by more than 100 years of experience, Columbia Management is one of the nation's largest asset managers. At the heart of our success and, most importantly, that of our investors, are highly talented industry professionals, brought together by a unique way of working. At Columbia Management, reaching our performance goals matters, and how we reach them matters just as much.
Visit columbiamanagement.com for:
> The Columbia Management Perspectives blog, offering insights on current market events and investment opportunities
> Detailed up-to-date fund performance and portfolio information
> Quarterly fund commentaries
> Columbia Management Investor, our award-winning quarterly newsletter for shareholders
Thank you for your continued support of the Columbia Funds. We look forward to serving your investment needs for many years to come.
Best Regards,

J. Kevin Connaughton
President, Columbia Funds
Investing involves risk including the risk of loss of principal.
The S&P 500 Index, an unmanaged index, measures the performance of 500 widely held, large-capitalization U.S. stocks and is frequently used as a general measure of market performance. The Dow Jones Industrial Average is a price weighted average of 30 actively traded shares of blue chip US industrial corporations listed on the New York Stock Exchange. Indices are not available for investment, are not professionally managed and do not reflect sales charges, fees, brokerage commissions, taxes or other expenses of investing.
Investors should consider the investment objectives, risks, charges and expenses of a mutual fund carefully before investing. For a free prospectus and, if available, a summary prospectus, which contains this and other important information about a fund, visit columbiamanagement.com. The prospectus should be read carefully before investing.
Columbia Funds are distributed by Columbia Management Investment Distributors, Inc., member FINRA, and managed by Columbia Management Investment Advisers, LLC.
© 2014 Columbia Management Investment Advisers, LLC. All rights reserved.
Columbia Marsico 21st Century Fund
Performance Overview | | | 2 | | |
Manager Discussion of Fund Performance | | | 4 | | |
Understanding Your Fund's Expenses | | | 6 | | |
Portfolio of Investments | | | 7 | | |
Statement of Assets and Liabilities | | | 11 | | |
Statement of Operations | | | 13 | | |
Statement of Changes in Net Assets | | | 14 | | |
Financial Highlights | | | 16 | | |
Notes to Financial Statements | | | 23 | | |
Report of Independent Registered
Public Accounting Firm | | | 29 | | |
Trustees and Officers | | | 30 | | |
Important Information About This Report | | | 37 | | |
Fund Investment Manager
Columbia Management Investment
Advisers, LLC
225 Franklin Street
Boston, MA 02110
Fund Distributor
Columbia Management Investment
Distributors, Inc.
225 Franklin Street
Boston, MA 02110
Fund Transfer Agent
Columbia Management Investment
Services Corp.
P.O. Box 8081
Boston, MA 02266-8081
For more information about any of the funds, please visit columbiamanagement.com or call 800.345.6611. Customer Service Representatives are available to answer your questions Monday through Friday from 8 a.m. to 7 p.m. Eastern time.
The views expressed in this report reflect the current views of the respective parties. These views are not guarantees of future performance and involve certain risks, uncertainties and assumptions that are difficult to predict, so actual outcomes and results may differ significantly from the views expressed. These views are subject to change at any time based upon economic, market or other conditions and the respective parties disclaim any responsibility to update such views. These views may not be relied on as investment advice and, because investment decisions for a Columbia Fund are based on numerous factors, may not be relied on as an indication of trading intent on behalf of any particular Columbia Fund. References to specific securities should not be construed as a recommendation or investment advice.
Columbia Marsico 21st Century Fund
Performance Summary
> Columbia Marsico 21st Century Fund (the Fund) Class A shares returned 40.17% excluding sales charges for the 12-month period that ended February 28, 2014.
> The Fund significantly outperformed its benchmark, the Russell 3000 Index, which returned 26.74% for the same time period.
> Stock selection aided relative performance, particularly in the health care, consumer discretionary, consumer staples and information technology sectors. Fund results also benefited from an overweight position in the strong-performing consumer discretionary sector.
Average Annual Total Returns (%) (for period ended February 28, 2014)
| | Inception | | 1 Year | | 5 Years | | 10 Years | |
Class A | | 04/10/00 | | | | | | | | | | | | | |
Excluding sales charges | | | | | | | 40.17 | | | | 22.08 | | | | 8.11 | | |
Including sales charges | | | | | | | 32.13 | | | | 20.63 | | | | 7.47 | | |
Class B | | 04/10/00 | | | | | | | | | | | | | |
Excluding sales charges | | | | | | | 39.06 | | | | 21.14 | | | | 7.30 | | |
Including sales charges | | | | | | | 34.06 | | | | 20.95 | | | | 7.30 | | |
Class C | | 04/10/00 | | | | | | | | | | | | | |
Excluding sales charges | | | | | | | 39.06 | | | | 21.17 | | | | 7.31 | | |
Including sales charges | | | | | | | 38.06 | | | | 21.17 | | | | 7.31 | | |
Class R* | | 01/23/06 | | | 39.73 | | | | 21.77 | | | | 7.83 | | |
Class R4* | | 11/08/12 | | | 40.50 | | | | 22.16 | | | | 8.15 | | |
Class R5* | | 01/08/14 | | | 40.21 | | | | 22.09 | | | | 8.12 | | |
Class Z | | 04/10/00 | | | 40.48 | | | | 22.37 | | | | 8.38 | | |
Russell 3000 Index | | | | | | | 26.74 | | | | 23.86 | | | | 7.67 | | |
Returns for Class A are shown with and without the maximum initial sales charge of 5.75%. Returns for Class B are shown with and without the applicable contingent deferred sales charge (CDSC) of 5.00% in the first year, declining to 1.00% in the sixth year and eliminated thereafter. Returns for Class C are shown with and without the 1.00% CDSC for the first year only. The Fund's other classes are not subject to sales charges and have limited eligibility. Please see the Fund's prospectus for details. Performance for different share classes will vary based on differences in sales charges and fees associated with each class. All results shown assume reinvestment of distributions during the period. Returns do not reflect the deduction of taxes that a shareholder may pay on Fund distributions or on the redemption of Fund shares. Performance results reflect the effect of any fee waivers or reimbursements of Fund expenses by Columbia Management Investment Advisers, LLC and/or any of its affiliates. Absent these fee waivers or expense reimbursement arrangements, performance results would have been lower.
The performance information shown represents past performance and is not a guarantee of future results. The investment return and principal value of your investment will fluctuate so that your shares, when redeemed, may be worth more or less than their original cost. Current performance may be lower or higher than the performance information shown. You may obtain performance information current to the most recent month-end by contacting your financial intermediary, visiting columbiamanagement.com or calling 800.345.6611.
*The returns shown for periods prior to the share class inception date (including returns for the Life of the Fund, if shown, which are since Fund inception) include the returns of the Fund's oldest share class. Since the Fund launched more than one share class at its inception, Class A shares were used. These returns are adjusted to reflect any higher class-related operating expenses of the newer share classes, as applicable. Please visit columbiamanagement.com/mutual-funds/appended-performance for more information.
The Russell 3000 Index, an unmanaged index, measures the performance of the 3,000 largest U.S. companies based on total market capitalization, which represents approximately 98% of the investable U.S. equity market.
Indices are not available for investment, are not professionally managed and do not reflect sales charges, fees, brokerage commissions, taxes or other expenses of investing. Securities in the Fund may not match those in an index.
Annual Report 2014
2
Columbia Marsico 21st Century Fund
Performance Overview (continued)
Performance of a Hypothetical $10,000 Investment (March 1, 2004 – February 28, 2014)
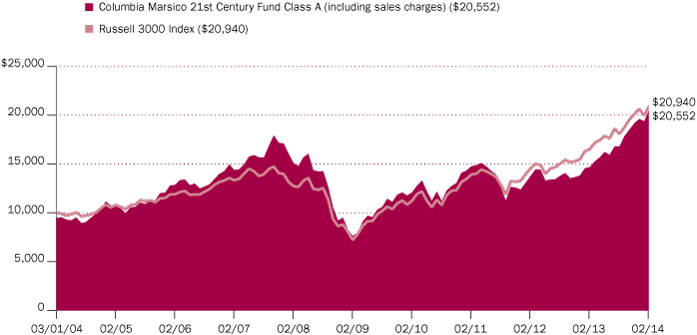
The chart above shows the change in value of a hypothetical $10,000 investment in Class A shares of Columbia Marsico 21st Century Fund during the stated time period, and does not reflect the deduction of taxes that a shareholder may pay on Fund distributions or on the redemption of Fund shares.
Annual Report 2014
3
Columbia Marsico 21st Century Fund
Manager Discussion of Fund Performance
For the 12-month period that ended February 28, 2014, the Fund's Class A shares returned 40.17% excluding sales charges. The Fund significantly outperformed its benchmark, the Russell 3000 Index, which returned 26.74% for the same time period. Stock selection in the health care sector, notably in the pharmaceutical and biotechnology industries, was a key driver of the Fund's performance. The Fund's performance was aided by good stock selection and a significant overweight in the strong-performing consumer discretionary sector. Stock selection in the consumer staples and information technology sectors also aided Fund results. Stock selection in industrials and materials detracted from relative returns.
Stocks Rose in a Favorable Market Environment
Despite a string of weak job gains at the end of 2013 — and a difficult winter, which affected job growth, construction activity and the housing market — the U.S. economy expanded at a respectable pace over the 12-month period that ended February 28, 2014. Pent-up demand, low mortgage rates and an improving labor market helped home sales advance, and foreclosure activity trended downward. After a brief pullback, manufacturing activity picked up midway through the period and remained solid. Businesses remained profitable and household finances were healthy, with lower debt loads and stronger credit conditions.
Even though a host of concerns weighed on investors, stock prices moved higher as central banks continued to pour liquidity into the financial markets. Investors shrugged off concerns regarding tax increases and enforced federal spending cuts, another showdown over the U.S. debt ceiling and the possibility of an attack on Syria. Midway through the period, the Federal Reserve's (the Fed's) talk about removing monetary support briefly dampened investor enthusiasm. However, once the Fed chose not to act until 2014, the market rally rebooted. In fact, U.S. equities posted their most significant gains since the late 1990s.
Contributors and Detractors
Stock selection in the health care sector was strong, led by investments in pharmaceutical and biotechnology companies. Our interest in these companies stems from the quality of the science they are using to treat diseases that were considered untreatable just a few years ago. We are seeing a variety of emerging therapeutic pathways and believe we are in the early stages of a paradigm shift in disease treatment, in which highly specialized compounds are developed to treat specific genetic targets. In this regard, Gilead Sciences, Biogen Idec and Incyte were strong performers. Gilead Sciences is a world leader in therapeutics for viral diseases. We believe the company will experience increased growth from the upcoming launch of a new drug franchise for Hepatitis C. Biogen Idec is a leader in developing treatments for multiple sclerosis (MS). During the period, the company received Food & Drug Administration approval for Tecfidera, the first oral medication that could allow thousands of MS patients to stop receiving drugs by needle or intravenously.
Fund results benefited from stock selection and a significant overweight in the consumer discretionary sector, which was the strongest performing sector within the benchmark. Investments in automobile manufacturers and consumer services companies generated strong results for the Fund. Luxury electric car manufacturer Tesla Motors' stock price rose, and we sold the stock as it reached our internal price target. Within the consumer services industry, hotel and casino
Portfolio Management
Marsico Capital Management, LLC
Brandon Geisler
Morningstar Style BoxTM

The Morningstar Style BoxTM is based on a fund's portfolio holdings. For equity funds, the vertical axis shows the market capitalization of the stocks owned, and the horizontal axis shows investment style (value, blend, or growth). Information shown is based on the most recent data provided by Morningstar.
© 2014 Morningstar, Inc. All rights reserved. The Morningstar information contained herein: (1) is proprietary to Morningstar and/or its content providers; (2) may not be copied or distributed; and (3) is not warranted to be accurate, complete or timely. Neither Morningstar nor its content providers are responsible for any damages or losses arising from any use of this information.
Top Ten Holdings (%)
(at February 28, 2014) | |
Gilead Sciences, Inc. | | | 5.6 | | |
Facebook, Inc., Class A | | | 5.4 | | |
Biogen Idec, Inc. | | | 4.8 | | |
Google, Inc., Class A | | | 3.8 | | |
Wynn Resorts Ltd. | | | 3.4 | | |
Sherwin-Williams Co. (The) | | | 3.1 | | |
Monsanto Co. | | | 3.1 | | |
Walt Disney Co. (The) | | | 3.1 | | |
Salesforce.com, Inc. | | | 3.0 | | |
Schlumberger Ltd. | | | 2.8 | | |
Percentages indicated are based upon total investments (excluding Money Market Funds and other cash equivalents).
For further detail about these holdings, please refer to the section entitled "Portfolio of Investments."
Fund holdings are as of the date given, are subject to change at any time, and are not recommendations to buy or sell any security.
Annual Report 2014
4
Columbia Marsico 21st Century Fund
Manager Discussion of Fund Performance (continued)
operator Wynn Resorts and Chipotle Mexican Grill performed well. We sold the latter from the portfolio.
In the consumer staples sector, beverage companies Constellation Brands and Green Mountain Coffee Roasters posted solid gains. Certain information technology firms also were material contributors to performance, including social media company Facebook, payment processor MasterCard and FleetCor Technologies, a provider of payment services including fuel cards and corporate lodging discount cards. The Fund had less exposure than the benchmark to the energy, telecommunication services, utilities, financials and consumer staples sectors, which also aided results.
The Fund's major disappointments were in the industrials and materials sectors. MRC Global, an industrial distributor of pipes, valves and fittings for the energy industry, posted a double-digit loss prior to being sold. While the Fund's transportation-related holdings such as railroad operator Genesee & Wyoming posted positive returns, they did not keep pace with the return of the transportation industry within the benchmark. Similarly, agricultural materials company Monsanto posted a positive return, but lagged the overall return of the benchmark. We continue to hold Monsanto as we believe the company's seeds, biotechnology traits and herbicides help improve agricultural productivity and reduce food costs.
Individual holdings Expedia and lululemon athletica detracted from performance. Online travel reservations company Expedia posted a loss due in part to weakness in its international business. lululemon athletica, an athletic apparel company, faced several challenges during the period, including quality control and the resignation of its CEO. We sold both positions.
During the period, the Fund increased its allocations to the information technology and health care sector and reduced exposure to the industrials, consumer discretionary and financials sectors.
Looking Ahead
We believe we are currently entering a period of low inflation and modest economic growth. Against this backdrop, we believe that companies with steadily expanding earnings, strong cash flows, increasing margins, rising market share, improving profitability, the development of innovative products and the effective allocation of capital to fuel further growth may be positioned to outperform their peers. These are the characteristics we seek in holdings we select for the Fund. As of period-end, the Fund's largest sector allocations included information technology, consumer discretionary, health care and industrials. The Fund had no exposure to the utilities sector.
Portfolio Breakdown (%)
(at February 28, 2014) | |
Common Stocks | | | 99.1 | | |
Consumer Discretionary | | | 20.9 | | |
Consumer Staples | | | 5.0 | | |
Energy | | | 4.4 | | |
Financials | | | 5.4 | | |
Health Care | | | 16.5 | | |
Industrials | | | 14.5 | | |
Information Technology | | | 24.2 | | |
Materials | | | 6.2 | | |
Telecommunication Services | | | 2.0 | | |
Money Market Funds | | | 0.9 | | |
Total | | | 100.0 | | |
Percentages indicated are based upon total investments. The Fund's portfolio composition is subject to change.
Investment Risks
The Fund is subject to stock market fluctuations. The Fund can invest, without limit, in foreign securities. International investing involves special risks, including foreign taxation, currency risks, risks associated with possible differences in financial standards, and other monetary and political risks. Share prices of small- and mid-capitalization companies tend to be more volatile than those of larger companies. The Fund also has potentially greater price volatility due to the Fund's concentration in a limited number of securities. See the Fund's prospectus for more information on these and other risks.
Annual Report 2014
5
Columbia Marsico 21st Century Fund
Understanding Your Fund's Expenses
(Unaudited)
As an investor, you incur two types of costs. There are transaction costs, which generally include sales charges on purchases and may include redemption fees. There are also ongoing costs, which generally include management fees, distribution and/or service fees, and other fund expenses. The following information is intended to help you understand your ongoing costs (in dollars) of investing in the Fund and to help you compare these costs with the ongoing costs of investing in other mutual funds.
Analyzing Your Fund's Expenses
To illustrate these ongoing costs, we have provided examples and calculated the expenses paid by investors in each share class of the Fund during the period. The actual and hypothetical information in the table is based on an initial investment of $1,000 at the beginning of the period indicated and held for the entire period. Expense information is calculated two ways and each method provides you with different information. The amount listed in the "Actual" column is calculated using the Fund's actual operating expenses and total return for the period. You may use the Actual information, together with the amount invested, to estimate the expenses that you paid over the period. Simply divide your account value by $1,000 (for example, an $8,600 account value divided by $1,000 = 8.6), then multiply the results by the expenses paid during the period under the "Actual" column. The amount listed in the "Hypothetical" column assumes a 5% annual rate of return before expenses (which is not the Fund's actual return) and then applies the Fund's actual expense ratio for the period to the hypothetical return. You should not use the hypothetical account values and expenses to estimate either your actual account balance at the end of the period or the expenses you paid during the period. See "Compare With Other Funds" below for details on how to use the hypothetical data.
Compare With Other Funds
Since all mutual funds are required to include the same hypothetical calculations about expenses in shareholder reports, you can use this information to compare the ongoing cost of investing in the Fund with other funds. To do so, compare the hypothetical example with the 5% hypothetical examples that appear in the shareholder reports of other funds. As you compare hypothetical examples of other funds, it is important to note that hypothetical examples are meant to highlight the ongoing costs of investing in a fund only and do not reflect any transaction costs, such as sales charges, or redemption or exchange fees. Therefore, the hypothetical calculations are useful in comparing ongoing costs only, and will not help you determine the relative total costs of owning different funds. If transaction costs were included in these calculations, your costs would be higher.
September 1, 2013 – February 28, 2014
| | Account Value at the Beginning
of the Period ($) | | Account Value at the End of the
Period ($) | | Expenses Paid During the
Period ($) | | Fund's Annualized
Expense Ratio (%) | |
| | Actual | | Hypothetical | | Actual | | Hypothetical | | Actual | | Hypothetical | | Actual | |
Class A | | | 1,000.00 | | | | 1,000.00 | | | | 1,225.70 | | | | 1,018.85 | | | | 6.77 | | | | 6.14 | | | | 1.22 | | |
Class B | | | 1,000.00 | | | | 1,000.00 | | | | 1,220.40 | | | | 1,015.11 | | | | 10.91 | | | | 9.90 | | | | 1.97 | | |
Class C | | | 1,000.00 | | | | 1,000.00 | | | | 1,221.20 | | | | 1,015.11 | | | | 10.91 | | | | 9.90 | | | | 1.97 | | |
Class R | | | 1,000.00 | | | | 1,000.00 | | | | 1,223.80 | | | | 1,017.60 | | | | 8.15 | | | | 7.39 | | | | 1.47 | | |
Class R4 | | | 1,000.00 | | | | 1,000.00 | | | | 1,226.90 | | | | 1,020.09 | | | | 5.39 | | | | 4.89 | | | | 0.97 | | |
Class R5 | | | 1,000.00 | | | | 1,000.00 | | | | 1,045.70 | * | | | 1,020.94 | | | | 1.12 | * | | | 4.03 | | | | 0.80 | * | |
Class Z | | | 1,000.00 | | | | 1,000.00 | | | | 1,227.10 | | | | 1,020.09 | | | | 5.39 | | | | 4.89 | | | | 0.97 | | |
*For the period January 8, 2014 through February 28, 2014. Class R5 shares commenced operations on January 8, 2014.
Expenses paid during the period are equal to the annualized expense ratio for each class as indicated above, multiplied by the average account value over the period and then multiplied by the number of days in the Fund's most recent fiscal half year and divided by 365.
Expenses do not include fees and expenses incurred indirectly by the Fund from the underlying funds in which the Fund may invest (also referred to as "acquired funds"), including affiliated and non-affiliated pooled investment vehicles (including mutual funds and exchange-traded funds).
Annual Report 2014
6
Columbia Marsico 21st Century Fund
Portfolio of Investments
February 28, 2014
(Percentages represent value of investments compared to net assets)
Common Stocks 99.2%
Issuer | | Shares | | Value ($) | |
Consumer Discretionary 20.9% | |
Distributors 1.7% | |
LKQ Corp.(a) | | | 689,104 | | | | 19,219,111 | | |
Hotels, Restaurants & Leisure 9.3% | |
Domino's Pizza, Inc. | | | 241,246 | | | | 19,072,909 | | |
Dunkin' Brands Group, Inc. | | | 229,876 | | | | 11,877,693 | | |
Hilton Worldwide Holdings, Inc.(a) | | | 911,304 | | | | 20,376,757 | | |
Panera Bread Co., Class A(a) | | | 93,680 | | | | 16,986,058 | | |
Wynn Resorts Ltd. | | | 158,864 | | | | 38,522,931 | | |
Total | | | | | 106,836,348 | | |
Internet & Catalog Retail 2.5% | |
Amazon.com, Inc.(a) | | | 30,555 | | | | 11,063,965 | | |
TripAdvisor, Inc.(a) | | | 173,904 | | | | 17,432,137 | | |
Total | | | | | 28,496,102 | | |
Media 5.3% | |
Twenty-First Century Fox, Inc., Class A | | | 779,211 | | | | 26,134,737 | | |
Walt Disney Co. (The) | | | 433,331 | | | | 35,017,478 | | |
Total | | | | | 61,152,215 | | |
Specialty Retail 1.5% | |
Tractor Supply Co. | | | 165,857 | | | | 11,702,870 | | |
Ulta Salon Cosmetics & Fragrance, Inc.(a) | | | 67,971 | | | | 6,096,319 | | |
Total | | | | | 17,799,189 | | |
Textiles, Apparel & Luxury Goods 0.6% | |
Deckers Outdoor Corp.(a) | | | 100,427 | | | | 7,466,747 | | |
Total Consumer Discretionary | | | | | 240,969,712 | | |
Consumer Staples 5.0% | |
Beverages 2.8% | |
Constellation Brands, Inc., Class A(a) | | | 393,725 | | | | 31,903,537 | | |
Food Products 2.2% | |
Green Mountain Coffee Roasters, Inc. | | | 236,707 | | | | 25,985,694 | | |
Total Consumer Staples | | | | | 57,889,231 | | |
Energy 4.4% | |
Energy Equipment & Services 2.8% | |
Schlumberger Ltd. | | | 345,759 | | | | 32,155,587 | | |
Oil, Gas & Consumable Fuels 1.6% | |
Antero Resources Corp.(a) | | | 315,309 | | | | 19,025,745 | | |
Total Energy | | | | | 51,181,332 | | |
Common Stocks (continued)
Issuer | | Shares | | Value ($) | |
Financials 5.4% | |
Capital Markets 1.8% | |
Morgan Stanley | | | 684,714 | | | | 21,089,191 | | |
Commercial Banks 2.6% | |
City National Corp. | | | 159,337 | | | | 11,923,187 | | |
First Republic Bank | | | 339,609 | | | | 17,649,480 | | |
Total | | | | | 29,572,667 | | |
Real Estate Management & Development 1.0% | |
Realogy Holdings Corp.(a) | | | 242,930 | | | | 11,529,458 | | |
Total Financials | | | | | 62,191,316 | | |
Health Care 16.6% | |
Biotechnology 14.4% | |
Alexion Pharmaceuticals, Inc.(a) | | | 94,680 | | | | 16,739,424 | | |
Biogen Idec, Inc.(a) | | | 159,912 | | | | 54,478,820 | | |
BioMarin Pharmaceutical, Inc.(a) | | | 224,639 | | | | 18,195,759 | | |
Gilead Sciences, Inc.(a) | | | 775,388 | | | | 64,194,373 | | |
Incyte Corp., Ltd.(a) | | | 185,153 | | | | 11,897,932 | | |
Total | | | | | 165,506,308 | | |
Health Care Equipment & Supplies 0.5% | |
Novadaq Technologies, Inc.(a) | | | 276,053 | | | | 5,631,481 | | |
Health Care Providers & Services 1.7% | |
Envision Healthcare Holdings, Inc.(a) | | | 585,518 | | | | 19,708,536 | | |
Total Health Care | | | | | 190,846,325 | | |
Industrials 14.5% | |
Aerospace & Defense 4.7% | |
B/E Aerospace, Inc.(a) | | | 261,149 | | | | 22,001,803 | | |
DigitalGlobe, Inc.(a) | | | 315,549 | | | | 9,807,263 | | |
TransDigm Group, Inc. | | | 128,243 | | | | 22,845,208 | | |
Total | | | | | 54,654,274 | | |
Airlines 2.1% | |
Delta Air Lines, Inc. | | | 359,089 | | | | 11,925,346 | | |
United Continental Holdings, Inc.(a) | | | 261,612 | | | | 11,762,075 | | |
Total | | | | | 23,687,421 | | |
Commercial Services & Supplies 1.0% | |
Copart, Inc.(a) | | | 325,208 | | | | 11,847,328 | | |
The accompanying Notes to Financial Statements are an integral part of this statement.
Annual Report 2014
7
Columbia Marsico 21st Century Fund
Portfolio of Investments (continued)
February 28, 2014
Common Stocks (continued)
Issuer | | Shares | | Value ($) | |
Professional Services 4.1% | |
IHS, Inc., Class A(a) | | | 207,625 | | | | 24,890,085 | | |
Robert Half International, Inc. | | | 137,895 | | | | 5,645,421 | | |
Verisk Analytics, Inc., Class A(a) | | | 268,731 | | | | 17,122,196 | | |
Total | | | | | 47,657,702 | | |
Road & Rail 2.6% | |
Genesee & Wyoming, Inc., Class A(a) | | | 300,515 | | | | 29,726,944 | | |
Total Industrials | | | | | 167,573,669 | | |
Information Technology 24.2% | |
Internet Software & Services 13.2% | |
Facebook, Inc., Class A(a) | | | 909,467 | | | | 62,262,111 | | |
Google, Inc., Class A(a) | | | 35,828 | | | | 43,554,308 | | |
LinkedIn Corp., Class A(a) | | | 72,634 | | | | 14,820,241 | | |
Yahoo!, Inc.(a) | | | 523,767 | | | | 20,254,070 | | |
Youku Tudou, Inc., ADR(a) | | | 204,189 | | | | 6,777,033 | | |
Zillow, Inc., Class A(a) | | | 60,801 | | | | 5,082,964 | | |
Total | | | | | 152,750,727 | | |
IT Services 4.4% | |
FleetCor Technologies, Inc.(a) | | | 140,472 | | | | 18,251,527 | | |
MasterCard, Inc., Class A | | | 412,631 | | | | 32,069,681 | | |
Total | | | | | 50,321,208 | | |
Semiconductors & Semiconductor Equipment 2.5% | |
ARM Holdings PLC | | | 716,290 | | | | 12,114,588 | | |
| ASML Holding NV | | | 188,520 | | | | 16,239,113 | | |
Total | | | | | 28,353,701 | | |
Common Stocks (continued)
Issuer | | Shares | | Value ($) | |
Software 4.1% | |
Salesforce.com, Inc.(a) | | | 553,542 | | | | 34,524,414 | | |
Splunk, Inc.(a) | | | 72,027 | | | | 6,680,504 | | |
Workday, Inc., Class A(a) | | | 60,754 | | | | 6,678,080 | | |
Total | | | | | 47,882,998 | | |
Total Information Technology | | | | | 279,308,634 | | |
Materials 6.2% | |
Chemicals 6.2% | |
Monsanto Co. | | | 319,128 | | | | 35,110,463 | | |
Sherwin-Williams Co. (The) | | | 178,900 | | | | 35,865,872 | | |
Total | | | | | 70,976,335 | | |
Total Materials | | | | | 70,976,335 | | |
Telecommunication Services 2.0% | |
Wireless Telecommunication Services 2.0% | |
SBA Communications Corp., Class A(a) | | | 236,980 | | | | 22,553,387 | | |
Total Telecommunication Services | | | | | 22,553,387 | | |
Total Common Stocks
(Cost: $822,034,058) | | | | | 1,143,489,941 | | |
Money Market Funds 0.9% | |
| | | Shares | | Value ($) | |
Columbia Short-Term Cash Fund,
0.098%(b)(c) | | | 10,487,581 | | | | 10,487,581 | | |
Total Money Market Funds
(Cost: $10,487,581) | | | | | 10,487,581 | | |
Total Investments
(Cost: $832,521,639) | | | | | 1,153,977,522 | | |
Other Assets & Liabilities, Net | | | | | (1,079,042 | ) | |
Net Assets | | | | | 1,152,898,480 | | |
Notes to Portfolio of Investments
(a) Non-income producing.
(b) The rate shown is the seven-day current annualized yield at February 28, 2014.
(c) As defined in the Investment Company Act of 1940, an affiliated company is one in which the Fund owns 5% or more of its outstanding voting securities, or a company which is under common ownership or control with the Fund. Holdings and transactions in these affiliated companies during the year ended February 28, 2014, are as follows:
Issuer | | Beginning
Cost ($) | | Purchase
Cost ($) | | Proceeds
From Sales ($) | | Ending
Cost ($) | | Dividends —
Affiliated
Issuers ($) | | Value ($) | |
Columbia Short-Term Cash Fund | | | 24,539,509 | | | | 510,480,078 | | | | (524,532,006 | ) | | | 10,487,581 | | | | 15,080 | | | | 10,487,581 | | |
The accompanying Notes to Financial Statements are an integral part of this statement.
Annual Report 2014
8
Columbia Marsico 21st Century Fund
Portfolio of Investments (continued)
February 28, 2014
Abbreviation Legend
ADR American Depositary Receipt
Fair Value Measurements
Generally accepted accounting principles (GAAP) require disclosure regarding the inputs and valuation techniques used to measure fair value and any changes in valuation inputs or techniques. In addition, investments shall be disclosed by major category.
The Fund categorizes its fair value measurements according to a three-level hierarchy that maximizes the use of observable inputs and minimizes the use of unobservable inputs by prioritizing that the most observable input be used when available. Observable inputs are those that market participants would use in pricing an investment based on market data obtained from sources independent of the reporting entity. Unobservable inputs are those that reflect the Fund's assumptions about the information market participants would use in pricing an investment. An investment's level within the fair value hierarchy is based on the lowest level of any input that is deemed significant to the asset or liability's fair value measurement. The input levels are not necessarily an indication of the risk or liquidity associated with investments at that level. For example, certain U.S. government securities are generally high quality and liquid, however, they are reflected as Level 2 because the inputs used to determine fair value may not always be quoted prices in an active market.
Fair value inputs are summarized in the three broad levels listed below:
> Level 1 — Valuations based on quoted prices for investments in active markets that the Fund has the ability to access at the measurement date (including NAV for open-end mutual funds). Valuation adjustments are not applied to Level 1 investments.
> Level 2 — Valuations based on other significant observable inputs (including quoted prices for similar securities, interest rates, prepayment speeds, credit risks, etc.).
> Level 3 — Valuations based on significant unobservable inputs (including the Fund's own assumptions and judgment in determining the fair value of investments).
Inputs that are used in determining fair value of an investment may include price information, credit data, volatility statistics, and other factors. These inputs can be either observable or unobservable. The availability of observable inputs can vary between investments, and is affected by various factors such as the type of investment, and the volume and level of activity for that investment or similar investments in the marketplace. The inputs will be considered by the Investment Manager, along with any other relevant factors in the calculation of an investment's fair value. The Fund uses prices and inputs that are current as of the measurement date, which may include periods of market dislocations. During these periods, the availability of prices and inputs may be reduced for many investments. This condition could cause an investment to be reclassified between the various levels within the hierarchy.
Foreign equity securities actively traded in markets where there is a significant delay in the local close relative to the New York Stock Exchange (NYSE) are classified as Level 2. The values of these securities may include an adjustment to reflect the impact of significant market movements following the close of local trading, as described in Note 2 to the financial statements — Security Valuation.
Investments falling into the Level 3 category are primarily supported by quoted prices from brokers and dealers participating in the market for those investments. However, these may be classified as Level 3 investments due to lack of market transparency and corroboration to support these quoted prices. Additionally, valuation models may be used as the pricing source for any remaining investments classified as Level 3. These models may rely on one or more significant unobservable inputs and/or significant assumptions by the Investment Manager. Inputs used in valuations may include, but are not limited to, financial statement analysis, capital account balances, discount rates and estimated cash flows, and comparable company data.
Under the direction of the Fund's Board of Trustees (the Board), the Investment Manager's Valuation Committee (the Committee) is responsible for overseeing the valuation procedures approved by the Board. The Committee consists of voting and non-voting members from various groups within the Investment Manager's organization, including operations and accounting, trading and investments, compliance, risk management and legal.
The Committee meets at least monthly to review and approve valuation matters, which may include a description of specific valuation determinations, data regarding pricing information received from approved pricing vendors and brokers and the results of Board-approved valuation control policies and procedures (the Policies). The Policies address, among other things, instances when market quotations are or are not readily available, including recommendations of third party pricing vendors and a determination of appropriate pricing methodologies; events that require specific valuation determinations and assessment of fair value techniques; securities with a potential for stale pricing, including those that are illiquid, restricted, or in default; and the effectiveness of third party pricing vendors, including periodic reviews of vendors. The Committee meets more frequently, as needed, to discuss additional valuation matters, which may include the need to review back-testing results, review time-sensitive information or approve related valuation actions. The Committee reports to the Board, with members of the Committee meeting with the Board at each of its regularly scheduled meetings to discuss valuation matters and actions during the period, similar to those described earlier.
The accompanying Notes to Financial Statements are an integral part of this statement.
Annual Report 2014
9
Columbia Marsico 21st Century Fund
Portfolio of Investments (continued)
February 28, 2014
Fair Value Measurements (continued)
For investments categorized as Level 3, the Committee monitors information similar to that described above, which may include: (i) data specific to the issuer or comparable issuers, (ii) general market or specific sector news and (iii) quoted prices and specific or similar security transactions. The Committee considers this data and any changes from prior periods in order to assess the reasonableness of observable and unobservable inputs, any assumptions or internal models used to value those securities and changes in fair value. This data is also used to corroborate, when available, information received from approved pricing vendors and brokers. Various factors impact the frequency of monitoring this information (which may occur as often as daily). However, the Committee may determine that changes to inputs, assumptions and models are not required as a result of the monitoring procedures performed.
The following table is a summary of the inputs used to value the Fund's investments at February 28, 2014:
Description | | Level 1
Quoted Prices in Active
Markets for Identical
Assets ($) | | Level 2
Other Significant
Observable Inputs ($) | | Level 3
Significant
Unobservable Inputs ($) | | Total ($) | |
Equity Securities | |
Common Stocks | |
Consumer Discretionary | | | 240,969,712 | | | | — | | | | — | | | | 240,969,712 | | |
Consumer Staples | | | 57,889,231 | | | | — | | | | — | | | | 57,889,231 | | |
Energy | | | 51,181,332 | | | | — | | | | — | | | | 51,181,332 | | |
Financials | | | 62,191,316 | | | | — | | | | — | | | | 62,191,316 | | |
Health Care | | | 190,846,325 | | | | — | | | | — | | | | 190,846,325 | | |
Industrials | | | 167,573,669 | | | | — | | | | — | | | | 167,573,669 | | |
Information Technology | | | 267,194,046 | | | | 12,114,588 | | | | — | | | | 279,308,634 | | |
Materials | | | 70,976,335 | | | | — | | | | — | | | | 70,976,335 | | |
Telecommunication Services | | | 22,553,387 | | | | — | | | | — | | | | 22,553,387 | | |
Total Equity Securities | | | 1,131,375,353 | | | | 12,114,588 | | | | — | | | | 1,143,489,941 | | |
Mutual Funds | |
Money Market Funds | | | 10,487,581 | | | | — | | | | — | | | | 10,487,581 | | |
Total Mutual Funds | | | 10,487,581 | | | | — | | | | — | | | | 10,487,581 | | |
Total | | | 1,141,862,934 | | | | 12,114,588 | | | | — | | | | 1,153,977,522 | | |
See the Portfolio of Investments for all investment classifications not indicated in the table.
The Fund's assets assigned to the Level 2 input category are generally valued using the market approach, in which a security's value is determined through reference to prices and information from market transactions for similar or identical assets. These assets include certain foreign securities for which a third party statistical pricing service may be employed for purposes of fair market valuation. The models utilized by the third party statistical pricing service take into account a security's correlation to available market data including, but not limited to, intraday index, ADR, and ETF movements.
There were no transfers of financial assets between levels during the period.
The accompanying Notes to Financial Statements are an integral part of this statement.
Annual Report 2014
10
Columbia Marsico 21st Century Fund
Statement of Assets and Liabilities
February 28, 2014
Assets | |
Investments, at value | |
Unaffiliated issuers (identified cost $822,034,058) | | $ | 1,143,489,941 | | |
Affiliated issuers (identified cost $10,487,581) | | | 10,487,581 | | |
Total investments (identified cost $832,521,639) | | | 1,153,977,522 | | |
Receivable for: | |
Investments sold | | | 18,533,709 | | |
Capital shares sold | | | 468,742 | | |
Dividends | | | 284,515 | | |
Reclaims | | | 43,247 | | |
Prepaid expenses | | | 1,338 | | |
Other assets | | | 12,203 | | |
Total assets | | | 1,173,321,276 | | |
Liabilities | |
Payable for: | |
Investments purchased | | | 18,256,740 | | |
Capital shares purchased | | | 1,733,568 | | |
Investment management fees | | | 21,543 | | |
Distribution and/or service fees | | | 13,184 | | |
Transfer agent fees | | | 211,192 | | |
Administration fees | | | 1,794 | | |
Compensation of board members | | | 106,673 | | |
Other expenses | | | 78,102 | | |
Total liabilities | | | 20,422,796 | | |
Net assets applicable to outstanding capital stock | | $ | 1,152,898,480 | | |
Represented by | |
Paid-in capital | | $ | 2,458,727,442 | | |
Excess of distributions over net investment income | | | (1,763,644 | ) | |
Accumulated net realized loss | | | (1,625,519,329 | ) | |
Unrealized appreciation (depreciation) on: | |
Investments | | | 321,455,883 | | |
Foreign currency translations | | | (1,872 | ) | |
Total — representing net assets applicable to outstanding capital stock | | $ | 1,152,898,480 | | |
The accompanying Notes to Financial Statements are an integral part of this statement.
Annual Report 2014
11
Columbia Marsico 21st Century Fund
Statement of Assets and Liabilities (continued)
February 28, 2014
Class A | |
Net assets | | $ | 581,858,619 | | |
Shares outstanding | | | 29,360,289 | | |
Net asset value per share | | $ | 19.82 | | |
Maximum offering price per share(a) | | $ | 21.03 | | |
Class B | |
Net assets | | $ | 50,971,779 | | |
Shares outstanding | | | 2,823,830 | | |
Net asset value per share | | $ | 18.05 | | |
Class C | |
Net assets | | $ | 269,583,414 | | |
Shares outstanding | | | 14,937,447 | | |
Net asset value per share | | $ | 18.05 | | |
Class R | |
Net assets | | $ | 24,699,972 | | |
Shares outstanding | | | 1,265,108 | | |
Net asset value per share | | $ | 19.52 | | |
Class R4 | |
Net assets | | $ | 227,780 | | |
Shares outstanding | | | 10,998 | | |
Net asset value per share | | $ | 20.71 | | |
Class R5 | |
Net assets | | $ | 2,614 | | |
Shares outstanding | | | 128 | | |
Net asset value per share(b) | | $ | 20.37 | | |
Class Z | |
Net assets | | $ | 225,554,302 | | |
Shares outstanding | | | 11,075,114 | | |
Net asset value per share | | $ | 20.37 | | |
(a) The maximum offering price per share is calculated by dividing the net asset value per share by 1.0 minus the maximum sales charge of 5.75%.
(b) Net asset value per share rounds to this amount due to fractional shares outstanding.
The accompanying Notes to Financial Statements are an integral part of this statement.
Annual Report 2014
12
Columbia Marsico 21st Century Fund
Statement of Operations
Year Ended February 28, 2014
Net investment income | |
Income: | |
Dividends — unaffiliated issuers | | $ | 6,689,462 | | |
Dividends — affiliated issuers | | | 15,080 | | |
Foreign taxes withheld | | | (45,817 | ) | |
Total income | | | 6,658,725 | | |
Expenses: | |
Investment management fees | | | 7,285,317 | | |
Distribution and/or service fees | |
Class A | | | 1,346,311 | | |
Class B | | | 511,226 | | |
Class C | | | 2,479,702 | | |
Class R | | | 116,088 | | |
Transfer agent fees | |
Class A | | | 1,075,508 | | |
Class B | | | 102,161 | | |
Class C | | | 495,198 | | |
Class R | | | 46,377 | | |
Class R4 | | | 363 | | |
Class Z | | | 409,833 | | |
Administration fees | | | 608,088 | | |
Compensation of board members | | | 44,033 | | |
Custodian fees | | | 18,303 | | |
Printing and postage fees | | | 164,323 | | |
Registration fees | | | 36,431 | | |
Professional fees | | | 36,854 | | |
Line of credit interest expense | | | 892 | | |
Other | | | 116,985 | | |
Total expenses | | | 14,893,993 | | |
Expense reductions | | | (1,600 | ) | |
Total net expenses | | | 14,892,393 | | |
Net investment loss | | | (8,233,668 | ) | |
Realized and unrealized gain (loss) — net | |
Net realized gain (loss) on: | |
Investments | | | 273,447,316 | | |
Foreign currency translations | | | 12,453 | | |
Net realized gain | | | 273,459,769 | | |
Net change in unrealized appreciation (depreciation) on: | |
Investments | | | 93,239,959 | | |
Foreign currency translations | | | 1,858 | | |
Net change in unrealized appreciation (depreciation) | | | 93,241,817 | | |
Net realized and unrealized gain | | | 366,701,586 | | |
Net increase in net assets resulting from operations | | $ | 358,467,918 | | |
The accompanying Notes to Financial Statements are an integral part of this statement.
Annual Report 2014
13
Columbia Marsico 21st Century Fund
Statement of Changes in Net Assets
| | | Year Ended
February 28,
2014 | | Year Ended
February 28,
2013(a) | |
Operations | |
Net investment loss | | $ | (8,233,668 | ) | | $ | (1,080,297 | ) | |
Net realized gain | | | 273,459,769 | | | | 231,173,098 | | |
Net change in unrealized appreciation (depreciation) | | | 93,241,817 | | | | (161,140,333 | ) | |
Net increase in net assets resulting from operations | | | 358,467,918 | | | | 68,952,468 | | |
Distributions to shareholders | |
Net investment income | |
Class A | | | — | | | | (121,266 | ) | |
Class R4 | | | — | | | | (7 | ) | |
Class Z | | | — | | | | (499,317 | ) | |
Total distributions to shareholders | | | — | | | | (620,590 | ) | |
Increase (decrease) in net assets from capital stock activity | | | (244,221,256 | ) | | | (736,286,595 | ) | |
Total increase (decrease) in net assets | | | 114,246,662 | | | | (667,954,717 | ) | |
Net assets at beginning of year | | | 1,038,651,818 | | | | 1,706,606,535 | | |
Net assets at end of year | | $ | 1,152,898,480 | | | $ | 1,038,651,818 | | |
Excess of distributions over net investment income | | $ | (1,763,644 | ) | | $ | (2,863,345 | ) | |
(a) Class R4 shares are for the period from November 8, 2012 (commencement of operations) to February 28, 2013.
The accompanying Notes to Financial Statements are an integral part of this statement.
Annual Report 2014
14
Columbia Marsico 21st Century Fund
Statement of Changes in Net Assets (continued)
| | | Year Ended February 28, 2014(a) | | Year Ended February 28, 2013(b) | |
| | | Shares | | Dollars ($) | | Shares | | Dollars ($) | |
Capital stock activity | |
Class A shares | |
Subscriptions(c) | | | 2,379,705 | | | | 40,165,532 | | | | 2,935,350 | | | | 39,345,751 | | |
Distributions reinvested | | | — | | | | — | | | | 8,190 | | | | 107,943 | | |
Redemptions | | | (10,242,751 | ) | | | (166,735,036 | ) | | | (26,997,107 | ) | | | (361,326,434 | ) | |
Net decrease | | | (7,863,046 | ) | | | (126,569,504 | ) | | | (24,053,567 | ) | | | (321,872,740 | ) | |
Class B shares | |
Subscriptions | | | 10,854 | | | | 166,346 | | | | 12,672 | | | | 159,307 | | |
Redemptions(c) | | | (1,256,756 | ) | | | (18,902,601 | ) | | | (1,878,016 | ) | | | (23,192,865 | ) | |
Net decrease | | | (1,245,902 | ) | | | (18,736,255 | ) | | | (1,865,344 | ) | | | (23,033,558 | ) | |
Class C shares | |
Subscriptions | | | 361,220 | | | | 5,630,721 | | | | 355,966 | | | | 4,406,138 | | |
Redemptions | | | (3,638,190 | ) | | | (54,347,508 | ) | | | (10,071,680 | ) | | | (124,268,382 | ) | |
Net decrease | | | (3,276,970 | ) | | | (48,716,787 | ) | | | (9,715,714 | ) | | | (119,862,244 | ) | |
Class R shares | |
Subscriptions | | | 297,146 | | | | 4,992,150 | | | | 306,394 | | | | 4,070,405 | | |
Redemptions | | | (661,105 | ) | | | (10,829,059 | ) | | | (975,144 | ) | | | (12,901,929 | ) | |
Net decrease | | | (363,959 | ) | | | (5,836,909 | ) | | | (668,750 | ) | | | (8,831,524 | ) | |
Class R4 shares | |
Subscriptions | | | 12,178 | | | | 186,985 | | | | 188 | | | | 2,500 | | |
Redemptions | | | (1,368 | ) | | | (24,726 | ) | | | — | | | | — | | |
Net increase | | | 10,810 | | | | 162,259 | | | | 188 | | | | 2,500 | | |
Class R5 shares | |
Subscriptions | | | 128 | | | | 2,500 | | | | — | | | | — | | |
Net increase | | | 128 | | | | 2,500 | | | | — | | | | — | | |
Class Z shares | |
Subscriptions | | | 1,958,565 | | | | 34,257,815 | | | | 2,756,504 | | | | 37,933,107 | | |
Distributions reinvested | | | — | | | | — | | | | 29,952 | | | | 404,045 | | |
Redemptions | | | (4,693,563 | ) | | | (78,784,375 | ) | | | (22,117,135 | ) | | | (301,026,181 | ) | |
Net decrease | | | (2,734,998 | ) | | | (44,526,560 | ) | | | (19,330,679 | ) | | | (262,689,029 | ) | |
Total net decrease | | | (15,473,937 | ) | | | (244,221,256 | ) | | | (55,633,866 | ) | | | (736,286,595 | ) | |
(a) Class R5 shares are for the period from January 8, 2014 (commencement of operations) to February 28, 2014.
(b) Class R4 shares are for the period from November 8, 2012 (commencement of operations) to February 28, 2013.
(c) Includes conversions of Class B shares to Class A shares, if any.
The accompanying Notes to Financial Statements are an integral part of this statement.
Annual Report 2014
15
Columbia Marsico 21st Century Fund
The following tables are intended to help you understand the Fund's financial performance. Certain information reflects financial results for a single share of a class held for the periods shown. Per share net investment income (loss) amounts are calculated based on average shares outstanding during the period. Total return assumes reinvestment of all dividends and distributions, if any. Total return does not reflect payment of sales charges, if any, and is not annualized for periods of less than one year.
| | | | | Year Ended | | | |
| | | Year Ended February 28, | | February 29, | | Year Ended February 28, | |
Class A | | 2014 | | 2013 | | 2012 | | 2011 | | 2010 | |
Per share data | |
Net asset value, beginning of period | | $ | 14.14 | | | $ | 13.25 | | | $ | 14.22 | | | $ | 11.63 | | | $ | 7.31 | | |
Income from investment operations: | |
Net investment income (loss) | | | (0.10 | ) | | | 0.01 | | | | (0.03 | ) | | | (0.06 | ) | | | (0.03 | ) | |
Net realized and unrealized gain (loss) | | | 5.78 | | | | 0.88 | | | | (0.94 | ) | | | 2.65 | | | | 4.35 | | |
Total from investment operations | | | 5.68 | | | | 0.89 | | | | (0.97 | ) | | | 2.59 | | | | 4.32 | | |
Less distributions to shareholders: | |
Net investment income | | | — | | | | (0.00 | )(a) | | | — | | | | — | | | | — | | |
Total distributions to shareholders | | | — | | | | (0.00 | )(a) | | | — | | | | — | | | | — | | |
Redemption fees: | |
Net asset value, end of period | | $ | 19.82 | | | $ | 14.14 | | | $ | 13.25 | | | $ | 14.22 | | | $ | 11.63 | | |
Total return | | | 40.17 | % | | | 6.74 | % | | | (6.82 | %) | | | 22.27 | %(b) | | | 59.10 | % | |
Ratios to average net assets(c) | |
Total gross expenses | | | 1.23 | %(d) | | | 1.36 | %(d) | | | 1.37 | %(d) | | | 1.31 | % | | | 1.31 | % | |
Total net expenses(e) | | | 1.23 | %(d)(f) | | | 1.35 | %(d)(f) | | | 1.37 | %(d)(f) | | | 1.31 | %(f) | | | 1.30 | %(f) | |
Net investment income (loss) | | | (0.60 | %) | | | 0.06 | % | | | (0.23 | %) | | | (0.47 | %) | | | (0.35 | %) | |
Supplemental data | |
Net assets, end of period (in thousands) | | $ | 581,859 | | | $ | 526,471 | | | $ | 811,890 | | | $ | 1,711,839 | | | $ | 1,993,000 | | |
Portfolio turnover | | | 99 | % | | | 65 | % | | | 104 | % | | | 87 | % | | | 119 | % | |
Notes to Financial Highlights
(a) Rounds to zero.
(b) Total return includes a reimbursement of a loss experienced by the Fund due to a compliance violation. The reimbursement had an impact of less than 0.01% on total return.
(c) In addition to the fees and expenses which the Fund bears directly, the Fund indirectly bears a pro rata share of the fees and expenses of the acquired funds in which it invests. Such indirect expenses are not included in the reported expense ratios.
(d) Ratios include line of credit interest expense which rounds to less than 0.01%.
(e) Total net expenses include the impact of certain waivers/reimbursements made by the Investment Manager and certain of its affiliates, if applicable.
(f) The benefits derived from expense reductions had an impact of less than 0.01%.
The accompanying Notes to Financial Statements are an integral part of this statement.
Annual Report 2014
16
Columbia Marsico 21st Century Fund
Financial Highlights (continued)
| | | | | Year Ended | | | |
| | | Year Ended February 28, | | February 29, | | Year Ended February 28, | |
Class B | | 2014 | | 2013 | | 2012 | | 2011 | | 2010 | |
Per share data | |
Net asset value, beginning of period | | $ | 12.98 | | | $ | 12.25 | | | $ | 13.25 | | | $ | 10.91 | | | $ | 6.92 | | |
Income from investment operations: | |
Net investment loss | | | (0.21 | ) | | | (0.08 | ) | | | (0.12 | ) | | | (0.14 | ) | | | (0.10 | ) | |
Net realized and unrealized gain (loss) | | | 5.28 | | | | 0.81 | | | | (0.88 | ) | | | 2.48 | | | | 4.09 | | |
Total from investment operations | | | 5.07 | | | | 0.73 | | | | (1.00 | ) | | | 2.34 | | | | 3.99 | | |
Net asset value, end of period | | $ | 18.05 | | | $ | 12.98 | | | $ | 12.25 | | | $ | 13.25 | | | $ | 10.91 | | |
Total return | | | 39.06 | % | | | 5.96 | % | | | (7.55 | %) | | | 21.45 | %(a) | | | 57.66 | % | |
Ratios to average net assets(b) | |
Total gross expenses | | | 1.98 | %(c) | | | 2.10 | %(c) | | | 2.12 | %(c) | | | 2.06 | % | | | 2.06 | % | |
Total net expenses(d) | | | 1.98 | %(c)(e) | | | 2.10 | %(c)(e) | | | 2.12 | %(c)(e) | | | 2.06 | %(e) | | | 2.05 | %(e) | |
Net investment loss | | | (1.35 | %) | | | (0.67 | %) | | | (0.97 | %) | | | (1.21 | %) | | | (1.10 | %) | |
Supplemental data | |
Net assets, end of period (in thousands) | | $ | 50,972 | | | $ | 52,823 | | | $ | 72,692 | | | $ | 110,427 | | | $ | 117,307 | | |
Portfolio turnover | | | 99 | % | | | 65 | % | | | 104 | % | | | 87 | % | | | 119 | % | |
Notes to Financial Highlights
(a) Total return includes a reimbursement of a loss experienced by the Fund due to a compliance violation. The reimbursement had an impact of less than 0.01% on total return.
(b) In addition to the fees and expenses which the Fund bears directly, the Fund indirectly bears a pro rata share of the fees and expenses of the acquired funds in which it invests. Such indirect expenses are not included in the reported expense ratios.
(c) Ratios include line of credit interest expense which rounds to less than 0.01%.
(d) Total net expenses include the impact of certain waivers/reimbursements made by the Investment Manager and certain of its affiliates, if applicable.
(e) The benefits derived from expense reductions had an impact of less than 0.01%.
The accompanying Notes to Financial Statements are an integral part of this statement.
Annual Report 2014
17
Columbia Marsico 21st Century Fund
Financial Highlights (continued)
| | | | | Year Ended | | | |
| | | Year Ended February 28, | | February 29, | | Year Ended February 28, | |
Class C | | 2014 | | 2013 | | 2012 | | 2011 | | 2010 | |
Per share data | |
Net asset value, beginning of period | | $ | 12.98 | | | $ | 12.25 | | | $ | 13.25 | | | $ | 10.91 | | | $ | 6.91 | | |
Income from investment operations: | |
Net investment loss | | | (0.21 | ) | | | (0.08 | ) | | | (0.12 | ) | | | (0.14 | ) | | | (0.10 | ) | |
Net realized and unrealized gain (loss) | | | 5.28 | | | | 0.81 | | | | (0.88 | ) | | | 2.48 | | | | 4.10 | | |
Total from investment operations | | | 5.07 | | | | 0.73 | | | | (1.00 | ) | | | 2.34 | | | | 4.00 | | |
Net asset value, end of period | | $ | 18.05 | | | $ | 12.98 | | | $ | 12.25 | | | $ | 13.25 | | | $ | 10.91 | | |
Total return | | | 39.06 | % | | | 5.96 | % | | | (7.55 | %) | | | 21.45 | %(a) | | | 57.89 | % | |
Ratios to average net assets(b) | |
Total gross expenses | | | 1.98 | %(c) | | | 2.10 | %(c) | | | 2.12 | %(c) | | | 2.06 | % | | | 2.06 | % | |
Total net expenses(d) | | | 1.98 | %(c)(e) | | | 2.10 | %(c)(e) | | | 2.12 | %(c)(e) | | | 2.06 | %(e) | | | 2.05 | %(e) | |
Net investment loss | | | (1.36 | %) | | | (0.68 | %) | | | (0.97 | %) | | | (1.22 | %) | | | (1.10 | %) | |
Supplemental data | |
Net assets, end of period (in thousands) | | $ | 269,583 | | | $ | 236,373 | | | $ | 342,021 | | | $ | 586,725 | | | $ | 660,457 | | |
Portfolio turnover | | | 99 | % | | | 65 | % | | | 104 | % | | | 87 | % | | | 119 | % | |
Notes to Financial Highlights
(a) Total return includes a reimbursement of a loss experienced by the Fund due to a compliance violation. The reimbursement had an impact of less than 0.01% on total return.
(b) In addition to the fees and expenses which the Fund bears directly, the Fund indirectly bears a pro rata share of the fees and expenses of the acquired funds in which it invests. Such indirect expenses are not included in the reported expense ratios.
(c) Ratios include line of credit interest expense which rounds to less than 0.01%.
(d) Total net expenses include the impact of certain waivers/reimbursements made by the Investment Manager and certain of its affiliates, if applicable.
(e) The benefits derived from expense reductions had an impact of less than 0.01%.
The accompanying Notes to Financial Statements are an integral part of this statement.
Annual Report 2014
18
Columbia Marsico 21st Century Fund
Financial Highlights (continued)
| | | | | Year Ended | | | |
| | | Year Ended February 28, | | February 29, | | Year Ended February 28, | |
Class R | | 2014 | | 2013 | | 2012 | | 2011 | | 2010 | |
Per share data | |
Net asset value, beginning of period | | $ | 13.97 | | | $ | 13.12 | | | $ | 14.11 | | | $ | 11.57 | | | $ | 7.29 | | |
Income from investment operations: | |
Net investment loss | | | (0.14 | ) | | | (0.02 | ) | | | (0.06 | ) | | | (0.09 | ) | | | (0.06 | ) | |
Net realized and unrealized gain (loss) | | | 5.69 | | | | 0.87 | | | | (0.93 | ) | | | 2.63 | | | | 4.34 | | |
Total from investment operations | | | 5.55 | | | | 0.85 | | | | (0.99 | ) | | | 2.54 | | | | 4.28 | | |
Net asset value, end of period | | $ | 19.52 | | | $ | 13.97 | | | $ | 13.12 | | | $ | 14.11 | | | $ | 11.57 | | |
Total return | | | 39.73 | % | | | 6.48 | % | | | (7.02 | %) | | | 21.95 | %(a) | | | 58.71 | % | |
Ratios to average net assets(b) | |
Total gross expenses | | | 1.48 | %(c) | | | 1.61 | %(c) | | | 1.62 | %(c) | | | 1.56 | % | | | 1.56 | % | |
Total net expenses(d) | | | 1.48 | %(c)(e) | | | 1.60 | %(c)(e) | | | 1.62 | %(c)(e) | | | 1.56 | %(e) | | | 1.55 | %(e) | |
Net investment loss | | | (0.85 | %) | | | (0.17 | %) | | | (0.46 | %) | | | (0.71 | %) | | | (0.59 | %) | |
Supplemental data | |
Net assets, end of period (in thousands) | | $ | 24,700 | | | $ | 22,756 | | | $ | 30,137 | | | $ | 40,468 | | | $ | 41,627 | | |
Portfolio turnover | | | 99 | % | | | 65 | % | | | 104 | % | | | 87 | % | | | 119 | % | |
Notes to Financial Highlights
(a) Total return includes a reimbursement of a loss experienced by the Fund due to a compliance violation. The reimbursement had an impact of less than 0.01% on total return.
(b) In addition to the fees and expenses which the Fund bears directly, the Fund indirectly bears a pro rata share of the fees and expenses of the acquired funds in which it invests. Such indirect expenses are not included in the reported expense ratios.
(c) Ratios include line of credit interest expense which rounds to less than 0.01%.
(d) Total net expenses include the impact of certain waivers/reimbursements made by the Investment Manager and certain of its affiliates, if applicable.
(e) The benefits derived from expense reductions had an impact of less than 0.01%.
The accompanying Notes to Financial Statements are an integral part of this statement.
Annual Report 2014
19
Columbia Marsico 21st Century Fund
Financial Highlights (continued)
| | | Year Ended February 28, | |
Class R4 | | 2014 | | 2013(a) | |
Per share data | |
Net asset value, beginning of period | | $ | 14.74 | | | $ | 13.29 | | |
Income from investment operations: | |
Net investment income (loss) | | | (0.06 | ) | | | 0.01 | | |
Net realized and unrealized gain | | | 6.03 | | | | 1.48 | | |
Total from investment operations | | | 5.97 | | | | 1.49 | | |
Less distributions to shareholders: | |
Net investment income | | | — | | | | (0.04 | ) | |
Total distributions to shareholders | | | — | | | | (0.04 | ) | |
Net asset value, end of period | | $ | 20.71 | | | $ | 14.74 | | |
Total return | | | 40.50 | % | | | 11.20 | % | |
Ratios to average net assets(b) | |
Total gross expenses | | | 0.98 | %(c) | | | 1.02 | %(c)(d) | |
Total net expenses(e) | | | 0.98 | %(c)(f) | | | 1.02 | %(c)(d) | |
Net investment income (loss) | | | (0.34 | %) | | | 0.28 | %(d) | |
Supplemental data | |
Net assets, end of period (in thousands) | | $ | 228 | | | $ | 3 | | |
Portfolio turnover | | | 99 | % | | | 65 | % | |
Notes to Financial Highlights
(a) For the period from November 8, 2012 (commencement of operations) to February 28, 2013.
(b) In addition to the fees and expenses which the Fund bears directly, the Fund indirectly bears a pro rata share of the fees and expenses of the acquired funds in which it invests. Such indirect expenses are not included in the reported expense ratios.
(c) Ratios include line of credit interest expense which rounds to less than 0.01%.
(d) Annualized.
(e) Total net expenses include the impact of certain waivers/reimbursements made by the Investment Manager and certain of its affiliates, if applicable.
(f) The benefits derived from expense reductions had an impact of less than 0.01%.
The accompanying Notes to Financial Statements are an integral part of this statement.
Annual Report 2014
20
Columbia Marsico 21st Century Fund
Financial Highlights (continued)
Class R5 | | Year Ended
February 28,
2014(a) | |
Per share data | |
Net asset value, beginning of period | | $ | 19.48 | | |
Income from investment operations: | |
Net investment loss | | | (0.01 | ) | |
Net realized and unrealized gain | | | 0.90 | | |
Total from investment operations | | | 0.89 | | |
Net asset value, end of period | | $ | 20.37 | | |
Total return | | | 4.57 | % | |
Ratios to average net assets(b) | |
Total gross expenses | | | 0.80 | %(c) | |
Total net expenses(d) | | | 0.80 | %(c) | |
Net investment loss | | | (0.51 | %)(c) | |
Supplemental data | |
Net assets, end of period (in thousands) | | $ | 3 | | |
Portfolio turnover | | | 99 | % | |
Notes to Financial Highlights
(a) For the period from January 8, 2014 (commencement of operations) to February 28, 2014.
(b) In addition to the fees and expenses which the Fund bears directly, the Fund indirectly bears a pro rata share of the fees and expenses of the acquired funds in which it invests. Such indirect expenses are not included in the reported expense ratios.
(c) Annualized.
(d) Total net expenses include the impact of certain waivers/reimbursements made by the Investment Manager and certain of its affiliates, if applicable.
The accompanying Notes to Financial Statements are an integral part of this statement.
Annual Report 2014
21
Columbia Marsico 21st Century Fund
Financial Highlights (continued)
| | | | | Year Ended | | | |
| | | Year Ended February 28, | | February 29, | | Year Ended February 28, | |
Class Z | | 2014 | | 2013 | | 2012 | | 2011 | | 2010 | |
Per share data | |
Net asset value, beginning of period | | $ | 14.50 | | | $ | 13.57 | | | $ | 14.54 | | | $ | 11.86 | | | $ | 7.44 | | |
Income from investment operations: | |
Net investment income (loss) | | | (0.06 | ) | | | 0.04 | | | | 0.01 | | | | (0.03 | ) | | | (0.01 | ) | |
Net realized and unrealized gain (loss) | | | 5.93 | | | | 0.92 | | | | (0.98 | ) | | | 2.71 | | | | 4.43 | | |
Total from investment operations | | | 5.87 | | | | 0.96 | | | | (0.97 | ) | | | 2.68 | | | | 4.42 | | |
Less distributions to shareholders: | |
Net investment income | | | — | | | | (0.03 | ) | | | — | | | | — | | | | (0.00 | )(a) | |
Total distributions to shareholders | | | — | | | | (0.03 | ) | | | — | | | | — | | | | (0.00 | )(a) | |
Redemption fees: | |
Net asset value, end of period | | $ | 20.37 | | | $ | 14.50 | | | $ | 13.57 | | | $ | 14.54 | | | $ | 11.86 | | |
Total return | | | 40.48 | % | | | 7.09 | % | | | (6.67 | %) | | | 22.60 | %(b) | | | 59.42 | % | |
Ratios to average net assets(c) | |
Total gross expenses | | | 0.98 | %(d) | | | 1.11 | %(d) | | | 1.12 | %(d) | | | 1.06 | % | | | 1.06 | % | |
Total net expenses(e) | | | 0.98 | %(d)(f) | | | 1.10 | %(d)(f) | | | 1.12 | %(d)(f) | | | 1.06 | %(f) | | | 1.05 | %(f) | |
Net investment income (loss) | | | (0.36 | %) | | | 0.27 | % | | | 0.04 | % | | | (0.20 | %) | | | (0.10 | %) | |
Supplemental data | |
Net assets, end of period (in thousands) | | $ | 225,554 | | | $ | 200,226 | | | $ | 449,867 | | | $ | 1,245,671 | | | $ | 1,008,937 | | |
Portfolio turnover | | | 99 | % | | | 65 | % | | | 104 | % | | | 87 | % | | | 119 | % | |
Notes to Financial Highlights
(a) Rounds to zero.
(b) Total return includes a reimbursement of a loss experienced by the Fund due to a compliance violation. The reimbursement had an impact of less than 0.01% on total return.
(c) In addition to the fees and expenses which the Fund bears directly, the Fund indirectly bears a pro rata share of the fees and expenses of the acquired funds in which it invests. Such indirect expenses are not included in the reported expense ratios.
(d) Ratios include line of credit interest expense which rounds to less than 0.01%.
(e) Total net expenses include the impact of certain waivers/reimbursements made by the Investment Manager and certain of its affiliates, if applicable.
(f) The benefits derived from expense reductions had an impact of less than 0.01%.
The accompanying Notes to Financial Statements are an integral part of this statement.
Annual Report 2014
22
Columbia Marsico 21st Century Fund
Notes to Financial Statements
February 28, 2014
Note 1. Organization
Columbia Marsico 21st Century Fund (the Fund), a series of Columbia Funds Series Trust (the Trust), is a diversified fund. The Trust is registered under the Investment Company Act of 1940, as amended (the 1940 Act), as an open-end management investment company organized as a Delaware statutory trust.
Fund Shares
The Trust may issue an unlimited number of shares (without par value). The Fund offers Class A, Class B, Class C, Class R, Class R4, Class R5 and Class Z shares. Although all share classes generally have identical voting, dividend and liquidation rights, each share class votes separately when required by law. Different share classes pay different distribution amounts to the extent the expenses of such share classes differ, and distributions in liquidation will be proportional to the net asset value of each share class. Each share class has its own expense structure and sales charges, as applicable.
Class A shares are subject to a maximum front-end sales charge of 5.75% based on the initial investment amount. Class A shares purchased without an initial sales charge in accounts aggregating $1 million to $50 million at the time of purchase are subject to a contingent deferred sales charge (CDSC) if the shares are sold within 18 months of purchase, charged as follows: 1.00% CDSC if redeemed within 12 months of purchase, and 0.50% CDSC if redeemed more than 12, but less than 18, months after purchase.
Class B shares may be subject to a maximum CDSC of 5.00% based upon the holding period after purchase. Class B shares will generally convert to Class A shares eight years after purchase. The Fund no longer accepts investments by new or existing investors in the Fund's Class B shares, except in connection with the reinvestment of any dividend and/or capital gain distributions in Class B shares of the Fund and exchanges by existing Class B shareholders of certain other funds within the Columbia Family of Funds.
Class C shares are subject to a 1.00% CDSC on shares redeemed within one year of purchase.
Class R shares are not subject to sales charges and are generally available only to certain retirement plans and other eligible investors.
Class R4 shares are not subject to sales charges and are generally available only to omnibus retirement plans and certain other eligible investors.
Class R5 shares are not subject to sales charges and are generally available only to investors purchasing through authorized investment professionals and omnibus retirement plans. Class R5 shares commenced operations on January 8, 2014.
Class Z shares are not subject to sales charges and are available only to certain eligible investors, which are subject to different investment minimums.
Note 2. Summary of Significant Accounting Policies
Use of Estimates
The preparation of financial statements in accordance with U.S. generally accepted accounting principles (GAAP) requires management to make certain estimates and assumptions that affect the reported amounts of assets and liabilities, the disclosure of contingent assets and liabilities at the date of the financial statements and the reported amounts of revenue and expenses during the reporting period. Actual results could differ from those estimates.
The following is a summary of significant accounting policies consistently followed by the Fund in the preparation of its financial statements.
Security Valuation
All equity securities are valued at the close of business of the New York Stock Exchange (NYSE). Equity securities are valued at the last quoted sales price on the principal exchange or market on which they trade, except for securities traded on the NASDAQ Stock Market, which are valued at the NASDAQ official close price. Unlisted securities or listed securities for which there were no sales during the day are valued at the mean of the latest quoted bid and ask prices on such exchanges or markets.
Foreign equity securities are valued based on quotations from the principal market in which such securities are normally traded. If any foreign share prices are not readily available as a result of limited share activity the securities are valued at the mean of the latest quoted bid and ask prices on such exchanges or markets. Foreign currency exchange rates are generally determined at 4:00 p.m. Eastern (U.S.) time. However, many securities markets and exchanges outside the U.S. close prior to the close of the NYSE; therefore, the closing prices for securities in such markets or on such exchanges may not fully reflect events that occur after such close but before the close of the NYSE. In those situations, foreign securities will be fair valued pursuant to the policy adopted by the Board of Trustees (the Board), including utilizing a third party pricing service to determine these fair values. The third party pricing service takes into account multiple factors, including, but not limited to, movements in the U.S. securities markets, certain depositary receipts, futures contracts and foreign exchange rates that have occurred subsequent to the close of the foreign exchange or market, to determine a good faith estimate that reasonably reflects the current market conditions as of the close of the NYSE. The
Annual Report 2014
23
Columbia Marsico 21st Century Fund
Notes to Financial Statements (continued)
February 28, 2014
fair value of a security is likely to be different from the quoted or published price, if available.
Investments in open-end investment companies, including money market funds, are valued at net asset value.
Investments for which market quotations are not readily available, or that have quotations which management believes are not reliable, are valued at fair value as determined in good faith under consistently applied procedures established by and under the general supervision of the Board. If a security or class of securities (such as foreign securities) is valued at fair value, such value is likely to be different from the last quoted market price for the security.
The determination of fair value often requires significant judgment. To determine fair value, management may use assumptions including but not limited to future cash flows and estimated risk premiums. Multiple inputs from various sources may be used to determine fair value.
Foreign Currency Transactions and Translations
The values of all assets and liabilities denominated in foreign currencies are translated into U.S. dollars at that day's exchange rates. Net realized and unrealized gains (losses) on foreign currency transactions and translations include gains (losses) arising from the fluctuation in exchange rates between trade and settlement dates on securities transactions, gains (losses) arising from the disposition of foreign currency and currency gains (losses) between the accrual and payment dates on dividends, interest income and foreign withholding taxes.
For financial statement purposes, the Fund does not distinguish that portion of gains (losses) on investments which is due to changes in foreign exchange rates from that which is due to changes in market prices of the investments. Such fluctuations are included with the net realized and unrealized gains (losses) on investments in the Statement of Operations.
Security Transactions
Security transactions are accounted for on the trade date. Cost is determined and gains (losses) are based upon the specific identification method for both financial statement and federal income tax purposes.
Income Recognition
Corporate actions and dividend income are generally recorded net of any non-reclaimable tax withholdings, on the ex-dividend date or upon receipt of ex-dividend notification in the case of certain foreign securities.
The Fund may receive distributions from holdings in business development companies (BDCs), exchange traded funds (ETFs) and real estate investment trusts (REITs), which report information on the character of their distributions annually.
These distributions are allocated to dividend income, capital gain and return of capital based on estimates made by the Fund's management if actual information has not yet been reported. Return of capital is recorded as a reduction of the cost basis of securities held. If the Fund no longer owns the applicable securities, return of capital is recorded as a realized gain. Management's estimates are subsequently adjusted when the actual character of the distributions is disclosed by the BDCs, ETFs and REITs, which could result in a proportionate change in return of capital to shareholders.
Awards from class action litigation are recorded as a reduction of cost basis if the Fund still owns the applicable securities on the payment date. If the Fund no longer owns the applicable securities, the proceeds are recorded as realized gains.
Expenses
General expenses of the Trust are allocated to the Fund and other funds of the Trust based upon relative net assets or other expense allocation methodologies determined by the nature of the expense. Expenses directly attributable to the Fund are charged to the Fund. Expenses directly attributable to a specific class of shares are charged to that share class.
Determination of Class Net Asset Value
All income, expenses (other than class-specific expenses, which are charged to that share class, as shown in the Statement of Operations) and realized and unrealized gains (losses) are allocated to each class of the Fund on a daily basis, based on the relative net assets of each class, for purposes of determining the net asset value of each class.
Federal Income Tax Status
The Fund intends to qualify each year as a regulated investment company under Subchapter M of the Internal Revenue Code, as amended, and will distribute substantially all of its taxable income (including net short-term capital gains), if any, for its tax year, and as such will not be subject to federal income taxes. In addition, the Fund intends to distribute in each calendar year substantially all of its net investment income, capital gains and certain other amounts, if any, such that the Fund should not be subject to federal excise tax. Therefore, no federal income or excise tax provision is recorded.
Foreign Taxes
The Fund may be subject to foreign taxes on income, gains on investments or currency repatriation, a portion of which may be recoverable. The Fund will accrue such taxes and recoveries, as applicable, based upon its current interpretation of tax rules and regulations that exist in the markets in which it invests.
Realized gains in certain countries may be subject to foreign taxes at the Fund level, based on statutory rates. The Fund
Annual Report 2014
24
Columbia Marsico 21st Century Fund
Notes to Financial Statements (continued)
February 28, 2014
accrues for such foreign taxes on realized and unrealized gains at the appropriate rate for each jurisdiction, as applicable. The amount, if any, is disclosed as a liability on the Statement of Assets and Liabilities.
Distributions to Shareholders
Distributions from net investment income, if any, are declared and paid semi-annually. Net realized capital gains, if any, are distributed at least annually. Income distributions and capital gain distributions are determined in accordance with federal income tax regulations, which may differ from GAAP.
Guarantees and Indemnifications
Under the Trust's organizational documents and, in some cases, by contract, its officers and trustees are indemnified against certain liabilities arising out of the performance of their duties to the Trust or its funds. In addition, certain of the Fund's contracts with its service providers contain general indemnification clauses. The Fund's maximum exposure under these arrangements is unknown since the amount of any future claims that may be made against the Fund cannot be determined, and the Fund has no historical basis for predicting the likelihood of any such claims.
Note 3. Fees and Compensation Paid to Affiliates
Investment Management Fees
Under an Investment Management Services Agreement, Columbia Management Investment Advisers, LLC (the Investment Manager), a wholly-owned subsidiary of Ameriprise Financial, Inc. (Ameriprise Financial), is responsible for the ultimate oversight of investments made by the Fund. The Fund's subadviser (see Subadvisory Agreement below) has the primary responsibility for the day-to-day portfolio management of the Fund. The investment management fee is an annual fee that is equal to a percentage of the Fund's average daily net assets that declines from 0.71% to 0.54% as the Fund's net assets increase. The effective investment management fee rate for the year ended February 28, 2014 was 0.68% of the Fund's average daily net assets.
Subadvisory Agreement
The Investment Manager has entered into a Subadvisory Agreement with Marsico Capital Management, LLC (Marsico) to subadvise the assets of the Fund. The Investment Manager compensates Marsico to manage the investment of the Fund's assets.
Administration Fees
Under an Administrative Services Agreement, the Investment Manager also serves as the Fund Administrator. The Fund pays
the Fund Administrator an annual fee for administration and accounting services equal to a percentage of the Fund's average daily net assets that declines from 0.06% to 0.03% as the Fund's net assets increase. The effective administration fee rate for the year ended February 28, 2014 was 0.06% of the Fund's average daily net assets.
Other Expenses
Other expenses are for, among other things, miscellaneous expenses of the Fund or the Board, including payments to a company providing limited administrative services to the Fund and the Board. That company's expenses include boardroom and office expense, employee compensation, employee health and retirement benefits, and certain other expenses. For the year ended February 28, 2014, other expenses paid to this company were $3,842.
Compensation of Board Members
Board members are compensated for their services to the Fund as disclosed in the Statement of Operations. Under a Deferred Compensation Plan (the Plan), the Board members who are not "interested persons" of the Fund, as defined under the 1940 Act, may elect to defer payment of up to 100% of their compensation. Deferred amounts are treated as though equivalent dollar amounts had been invested in shares of certain funds managed by the Investment Manager. The Fund's liability for these amounts is adjusted for market value changes and remains in the Fund until distributed in accordance with the Plan.
Transfer Agent Fees
Under a Transfer and Dividend Disbursing Agent Agreement, Columbia Management Investment Services Corp. (the Transfer Agent), an affiliate of the Investment Manager and a wholly-owned subsidiary of Ameriprise Financial, is responsible for providing transfer agency services to the Fund. The Transfer Agent has contracted with Boston Financial Data Services (BFDS) to serve as sub-transfer agent.
The Transfer Agent receives monthly account-based service fees based on the number of open accounts and also receives sub-transfer agency fees based on a percentage of the average aggregate value of the Fund's shares maintained in omnibus accounts (other than omnibus accounts for which American Enterprise Investment Services Inc. is the broker of record or accounts where the beneficial shareholder is a customer of Ameriprise Financial Services, Inc., which are paid a per account fee). The Transfer Agent pays the fees of BFDS for services as sub-transfer agent and is not entitled to reimbursement for such fees from the Fund (with the exception of out-of-pocket fees).
The Transfer Agent also receives compensation from fees for various shareholder services and reimbursements for certain
Annual Report 2014
25
Columbia Marsico 21st Century Fund
Notes to Financial Statements (continued)
February 28, 2014
out-of-pocket fees. Total transfer agent fees for Class R5 shares are subject to an annual limitation of not more than 0.05% of the average daily net assets attributable to Class R5 shares.
For the year ended February 28, 2014, the Fund's effective transfer agent fee rates as a percentage of average daily net assets of each class were as follows:
Class A | | | 0.20 | % | |
Class B | | | 0.20 | | |
Class C | | | 0.20 | | |
Class R | | | 0.20 | | |
Class R4 | | | 0.20 | | |
Class R5 | | | 0.05 | * | |
Class Z | | | 0.20 | | |
*Annualized.
An annual minimum account balance fee of $20 may apply to certain accounts with a value below the applicable share class's initial minimum investment requirements to reduce the impact of small accounts on transfer agent fees. These minimum account balance fees are recorded as part of expense reductions in the Statement of Operations. For the year ended February 28, 2014, these minimum account balance fees reduced total expenses by $1,600.
Distribution and Service Fees
The Fund has an agreement with Columbia Management Investment Distributors, Inc. (the Distributor), an affiliate of the Investment Manager and a wholly-owned subsidiary of Ameriprise Financial, for distribution and shareholder services. The Board has approved, and the Fund has adopted, distribution and shareholder service plans (the Plans) applicable to certain share classes, which set the distribution and service fees for the Fund. These fees are calculated daily and are intended to compensate the Distributor and/or eligible selling and/or servicing agents for selling shares of the Fund and providing services to investors.
Under the Plans, the Fund pays a monthly combined distribution and service fee to the Distributor at the maximum annual rate of 0.25% of the average daily net assets attributable to Class A shares of the Fund. Also under the Plans, the Fund pays a monthly service fee at the maximum annual rate of 0.25% of the average daily net assets attributable to Class B and Class C shares of the Fund and the payment of a monthly distribution fee at the maximum annual rates of 0.75%, 0.75% and 0.50% of the average daily net assets attributable to Class B, Class C and Class R shares, respectively.
Sales Charges
Sales charges, including front-end charges and CDSCs, received by the Distributor for distributing Fund shares were
$143,450 for Class A, $37,341 for Class B, and $2,191 for Class C shares for the year ended February 28, 2014.
Expenses Waived/Reimbursed by the Investment Manager and its Affiliates
The Investment Manager and certain of its affiliates have contractually agreed to waive fees and/or reimburse expenses (excluding certain fees and expenses described below) for the periods disclosed below, unless sooner terminated at the sole discretion of the Board, so that the Fund's net operating expenses, after giving effect to fees waived/expenses reimbursed and any balance credits and/or overdraft charges from the Fund's custodian, do not exceed the following annual rates as a percentage of the class' average daily net assets:
| | | July 1, 2013
through
June 30, 2014 | | Prior to
July 1, 2013 | |
Class A | | | 1.29 | % | | | 1.31 | % | |
Class B | | | 2.04 | | | | 2.06 | | |
Class C | | | 2.04 | | | | 2.06 | | |
Class R | | | 1.54 | | | | 1.56 | | |
Class R4 | | | 1.04 | | | | 1.06 | | |
Class R5 | | | 0.94 | * | | | — | | |
Class Z | | | 1.04 | | | | 1.06 | | |
*Annual rate is contractual from January 8, 2014 (the commencement of operations of Class R5 shares) through June 30, 2014.
Under the agreement governing these fee waivers and/or expense reimbursement arrangements, the following fees and expenses are excluded from the waiver/reimbursement commitment, and therefore will be paid by the Fund, if applicable: taxes (including foreign transaction taxes), expenses associated with investments in affiliated and non-affiliated pooled investment vehicles (including mutual funds and exchange traded funds), transaction costs and brokerage commissions, costs related to any securities lending program, dividend expenses associated with securities sold short, inverse floater program fees and expenses, transaction charges and interest on borrowed money, interest, extraordinary expenses and any other expenses the exclusion of which is specifically approved by the Board. This agreement may be modified or amended only with approval from all parties.
Note 4. Federal Tax Information
The timing and character of income and capital gain distributions are determined in accordance with income tax regulations, which may differ from GAAP because of temporary or permanent book to tax differences.
At February 28, 2014, these differences are primarily due to differing treatment for: capital loss carryforwards,
Annual Report 2014
26
Columbia Marsico 21st Century Fund
Notes to Financial Statements (continued)
February 28, 2014
deferral/reversal of wash sales losses, Trustees' deferred compensation, foreign currency transactions, net operating loss reclassification and late-year ordinary losses. To the extent these differences are permanent, reclassifications are made among the components of the Fund's net assets in the Statement of Assets and Liabilities. Temporary differences do not require reclassifications. In the Statement of Assets and Liabilities the following reclassifications were made:
Excess of distributions over net investment income | | $ | 9,333,369 | | |
Accumulated net realized loss | | | (12,455 | ) | |
Paid-in capital | | | (9,320,914 | ) | |
Net investment income and net realized gains (losses), as disclosed in the Statement of Operations, and net assets were not affected by this reclassification.
For the year ended February 28, 2014, there were no distributions.
At February 28, 2014, the components of distributable earnings on a tax basis were as follows:
Unrealized appreciation | | $ | 314,990,904 | | |
At February 28, 2014, the cost of investments for federal income tax purposes was $838,986,618 and the aggregate gross unrealized appreciation and depreciation based on that cost was:
Unrealized appreciation | | $ | 320,142,603 | | |
Unrealized depreciation | | | (5,151,699 | ) | |
Net unrealized appreciation | | $ | 314,990,904 | | |
The following capital loss carryforward, determined at February 28, 2014, may be available to reduce taxable income arising from future net realized gains on investments, if any, to the extent permitted by the Internal Revenue Code:
Year of Expiration | | Amount ($) | |
2017 | | | 92,071,658 | | |
2018 | | | 1,526,982,692 | | |
Total | | | 1,619,054,350 | | |
For the year ended February 28, 2014, $270,710,157 of capital loss carryforward was utilized.
Under current tax rules, regulated investment companies can elect to treat certain late-year ordinary losses incurred and post-October capital losses (capital losses realized after October 31) as arising on the first day of the following taxable year. As of February 28, 2014, the Fund will elect to treat late-year ordinary losses of $1,656,799 as arising on March 1, 2014.
Management of the Fund has concluded that there are no significant uncertain tax positions that would require recognition in the financial statements. However, management's
conclusion may be subject to review and adjustment at a later date based on factors including, but not limited to, new tax laws, regulations, and administrative interpretations (including relevant court decisions). Generally, the Fund's federal tax returns for the prior three fiscal years remain subject to examination by the Internal Revenue Service.
Note 5. Portfolio Information
The cost of purchases and proceeds from sales of securities, excluding short-term obligations, aggregated to $1,046,668,890 and $1,306,006,003, respectively, for the year ended February 28, 2014.
Note 6. Affiliated Money Market Fund
The Fund invests its daily cash balances in Columbia Short-Term Cash Fund, an affiliated money market fund established for the exclusive use by the Fund and other affiliated funds. The income earned by the Fund from such investments is included as "Dividends — affiliated issuers" in the Statement of Operations. As an investing fund, the Fund indirectly bears its proportionate share of the expenses of Columbia Short-Term Cash Fund.
Note 7. Shareholder Concentration
At February 28, 2014, one unaffiliated shareholder account owned 16.7% of the outstanding shares of the Fund. The Fund has no knowledge about whether any portion of those shares was owned beneficially by such account. Affiliated shareholder accounts owned 16.2% of the outstanding shares of the Fund. Subscription and redemption activity by concentrated accounts may have a significant effect on the operations of the Fund.
Note 8. Line of Credit
The Fund has entered into a revolving credit facility with a syndicate of banks led by JPMorgan Chase Bank N.A. whereby the Fund may borrow for the temporary funding of shareholder redemptions or for other temporary or emergency purposes. The credit facility agreement, as amended, which is a collective agreement between the Fund and certain other funds managed by the Investment Manager, severally and not jointly, permits collective borrowings up to $500 million. Interest is charged to each participating fund based on its borrowings at a rate equal to the higher of (i) the overnight federal funds rate plus 1.00% or (ii) the one-month LIBOR rate plus 1.00%. Each borrowing under the credit facility matures no later than 60 days after the date of borrowing. Effective December 10, 2013, the Fund also pays a commitment fee equal to its pro rata share of the amount of the credit facility at a rate of 0.075% per annum. Prior to December 10, 2013, the commitment fee was charged at the
Annual Report 2014
27
Columbia Marsico 21st Century Fund
Notes to Financial Statements (continued)
February 28, 2014
annual rate of 0.08% per annum. The commitment fee is included in other expenses in the Statement of Operations.
For the year ended February 28, 2014, the average daily loan balance outstanding on days when borrowing existed was $3,828,571 at a weighted average interest rate of 1.20%. Interest expense incurred by the Fund is recorded as line of credit interest expense in the Statement of Operations.
Note 9. Significant Risks
Consumer Discretionary Sector Risk
Sector risk occurs when a fund invests a significant portion of its assets in securities of companies conducting business in a related group of industries within an economic sector. Companies in the same economic sector may be similarly affected by economic, regulatory, political or market events or conditions, making a fund more vulnerable to unfavorable developments in that economic sector than funds that invest more broadly. The Fund may be more susceptible to the particular risks that may affect companies in the consumer discretionary sector than if it were invested in a wider variety of companies in unrelated sectors.
Information Technology Sector Risk
Sector risk occurs when a fund invests a significant portion of its assets in securities of companies conducting business in a related group of industries within an economic sector. Companies in the same economic sector may be similarly affected by economic, regulatory, political or market events or conditions, making a fund more vulnerable to unfavorable developments in that economic sector than funds that invest more broadly. The Fund may be more susceptible to the particular risks that may affect companies in the information technology sector than if it were invested in a wider variety of companies in unrelated sectors.
Note 10. Subsequent Events
Management has evaluated the events and transactions that have occurred through the date the financial statements were issued and noted no items requiring adjustment of the financial statements or additional disclosure.
Note 11. Information Regarding Pending and Settled Legal Proceedings
In December 2005, without admitting or denying the allegations, American Express Financial Corporation (AEFC, which is now known as Ameriprise Financial, Inc. (Ameriprise Financial)) entered into settlement agreements with the Securities and Exchange Commission (SEC) and Minnesota Department of Commerce (MDOC) related to market timing activities. As a result, AEFC was censured and ordered to cease
and desist from committing or causing any violations of certain provisions of the Investment Advisers Act of 1940, the Investment Company Act of 1940, and various Minnesota laws. AEFC agreed to pay disgorgement of $10 million and civil money penalties of $7 million. AEFC also agreed to retain an independent distribution consultant to assist in developing a plan for distribution of all disgorgement and civil penalties ordered by the SEC in accordance with various undertakings detailed at www.sec.gov/litigation/admin/ia-2451.pdf. Ameriprise Financial and its affiliates have cooperated with the SEC and the MDOC in these legal proceedings, and have made regular reports to the Funds' Boards of Trustees.
Ameriprise Financial and certain of its affiliates have historically been involved in a number of legal, arbitration and regulatory proceedings, including routine litigation, class actions, and governmental actions, concerning matters arising in connection with the conduct of their business activities. Ameriprise Financial believes that the Funds are not currently the subject of, and that neither Ameriprise Financial nor any of its affiliates are the subject of, any pending legal, arbitration or regulatory proceedings that are likely to have a material adverse effect on the Funds or the ability of Ameriprise Financial or its affiliates to perform under their contracts with the Funds. Ameriprise Financial is required to make 10-Q, 10-K and, as necessary, 8-K filings with the Securities and Exchange Commission on legal and regulatory matters that relate to Ameriprise Financial and its affiliates. Copies of these filings may be obtained by accessing the SEC website at www.sec.gov.
There can be no assurance that these matters, or the adverse publicity associated with them, will not result in increased fund redemptions, reduced sale of fund shares or other adverse consequences to the Funds. Further, although we believe proceedings are not likely to have a material adverse effect on the Funds or the ability of Ameriprise Financial or its affiliates to perform under their contracts with the Funds, these proceedings are subject to uncertainties and, as such, we are unable to estimate the possible loss or range of loss that may result. An adverse outcome in one or more of these proceedings could result in adverse judgments, settlements, fines, penalties or other relief that could have a material adverse effect on the consolidated financial condition or results of operations of Ameriprise Financial.
Annual Report 2014
28
Columbia Marsico 21st Century Fund
Report of Independent Registered Public Accounting Firm
To the Trustees of Columbia Funds Series Trust and the Shareholders of
Columbia Marsico 21st Century Fund
In our opinion, the accompanying statement of assets and liabilities, including the portfolio of investments, and the related statements of operations and of changes in net assets and the financial highlights present fairly, in all material respects, the financial position of Columbia Marsico 21st Century Fund (the "Fund", a series of Columbia Funds Series Trust) at February 28, 2014, and the results of its operations, the changes in its net assets and the financial highlights for each of the periods indicated, in conformity with accounting principles generally accepted in the United States of America. These financial statements and financial highlights (hereafter referred to as "financial statements") are the responsibility of the Fund's management; our responsibility is to express an opinion on these financial statements based on our audits. We conducted our audits of these financial statements in accordance with the standards of the Public Company Accounting Oversight Board (United States). Those standards require that we plan and perform the audit to obtain reasonable assurance about whether the financial statements are free of material misstatement. An audit includes examining, on a test basis, evidence supporting the amounts and disclosures in the financial statements, assessing the accounting principles used and significant estimates made by management, and evaluating the overall financial statement presentation. We believe that our audits, which included confirmation of securities at February 28, 2014 by correspondence with the custodian, brokers and transfer agent, provide a reasonable basis for our opinion.
PricewaterhouseCoopers LLP
Minneapolis, Minnesota
April 21, 2014
Annual Report 2014
29
Columbia Marsico 21st Century Fund
Shareholders elect the Board that oversees the Funds' operations. The Board appoints officers who are responsible for day-to-day business decisions based on policies set by the Board. The following table provides basic biographical information about the Funds' Board members, including their principal occupations during the past five years, although specific titles for individuals may have varied over the period. Under current Board policy, members may serve through the end of the calendar year in which he or she reaches either the mandatory retirement age established by the Board or the fifteenth anniversary of the first Board meeting they attended as a member of the Board.
Independent Trustees
Name,
Address,
Year of Birth | | Position Held With
Funds and Length of
Service | | Principal Occupation(s)
During Past Five Years
and Other Relevant
Professional Experience | | Number of
Funds in the
Fund Family
Overseen by
Board Member | | Other Present or Past
Directorships/
Trusteeships
(Within Past 5 Years) | |
Kathleen Blatz
901 S. Marquette Ave.
Minneapolis, MN 55402
1954 | | Board member since 1/06 for RiverSource Funds and since 6/11 for Nations Funds | | Attorney; Chief Justice, Minnesota Supreme
Court, 1998-2006 | | | 131 | | | Trustee, BlueCross BlueShield of Minnesota since 2009 | |
Edward J. Boudreau, Jr.
901 S. Marquette Ave.
Minneapolis, MN 55402
1944 | | Board member since 6/11 for RiverSource Funds and since 1/05 for Nations Funds | | Managing Director, E.J. Boudreau & Associates (consulting) since 2000; Chairman and Chief Executive Officer, John Hancock Funds (mutual funds), 1989-2000 | | | 129 | | | Former Trustee, BofA Funds Series Trust (11 funds), 2005-2011 | |
Pamela G. Carlton
901 S. Marquette Ave.
Minneapolis, MN 55402
1954 | | Board member since 7/07 for RiverSource Funds and since 6/11 for Nations Funds | | President, Springboard — Partners in Cross Cultural Leadership (consulting company) since 2003; Director or Management Director of US Equity Research, Chase Asset Management, 1996-2003; Investment Banker, Morgan Stanley, 1982-1996 | | | 131 | | | None | |
William P. Carmichael
901 S. Marquette Ave.
Minneapolis, MN 55402
1943 | | Chair of the Board since 1/14, Board member since 6/11 for RiverSource Funds and since 2003 for Nations Funds | | Retired; Co-founder, The Succession Fund (provides exit strategies to owners of privately held companies); previously, Senior Vice President, Sara Lee Corporation; Senior Vice President and Chief Financial officer, Beatrice Foods Company; Vice President, Esmark, Inc.; Associate, Price Waterhouse | | | 131 | | | Director, Cobra Electronics Corporation (electronic equipment manufacturer); The Finish Line (athletic shoes and apparel) since July 2003; Director, International Textile Corp. since 2012; former Director, McMoRan Exploration Company (oil and gas exploration and development) 2010-2013; former Trustee, BofA Funds Series Trust (11 funds), 2009-2011; Director, Spectrum Brands, Inc. (consumer products), 2002-2009; Director, Simmons Company (bedding), 2004-2010 | |
Annual Report 2014
30
Columbia Marsico 21st Century Fund
Trustees and Officers (continued)
Independent Trustees (continued)
Name,
Address,
Year of Birth | | Position Held With
Funds and Length of
Service | | Principal Occupation(s)
During Past Five Years
and Other Relevant
Professional Experience | | Number of
Funds in the
Fund Family
Overseen by
Board Member | | Other Present or Past
Directorships/
Trusteeships
(Within Past 5 Years) | |
Patricia M. Flynn
901 S. Marquette Ave.
Minneapolis, MN 55402
1950 | | Board member since 11/04 for RiverSource Funds and since 6/11 for Nations Funds | | Trustee Professor of Economics and Management, Bentley University since 1976 (also teaches and conducts research on corporate governance); Dean, McCallum Graduate School of Business, Bentley University, 1992-2002 | | | 131 | | | None | |
William A. Hawkins
901 S. Marquette Ave.
Minneapolis, MN 55402
1942 | | Board member since 6/11 for RiverSource Funds and since 1/05 for Nations Funds | | Managing Director, Overton Partners (financial consulting), since August 2010; President and Chief Executive Officer, California General Bank, N.A., January 2008-August 2010 | | | 129 | | | Trustee, BofA Funds Series Trust (11 funds) | |
R. Glenn Hilliard
901 S. Marquette Ave.
Minneapolis, MN 55402
1943 | | Board member since 6/11 for RiverSource Funds and since 1/05 for Nations Funds | | Chairman and Chief Executive Officer, Hilliard Group LLC (investing and consulting) since April 2003; Non-Executive Director & Chairman, CNO Financial Group, Inc. (insurance), September 2003-May 2011 | | | 129 | | | Chairman, BofA Fund Series Trust (11 funds); former Director, CNO Financial Group, Inc. (insurance), 2003-2011 | |
Stephen R. Lewis, Jr.
901 S. Marquette Ave.
Minneapolis, MN 55402
1939 | | Board member for RiverSource Funds since 1/02 and since 6/11 for Nations Funds, Board Chair 1/07-12/13 | | President Emeritus and Professor of Economics Emeritus, Carleton College since 2002 | | | 131 | | | Director, Valmont Industries, Inc. (irrigation systems manufacturer), 2002-2013 | |
Catherine James Paglia
901 S. Marquette Ave.
Minneapolis, MN 55402
1952 | | Board member since 11/04 for RiverSource Funds and since 6/11 for Nations Funds | | Director, Enterprise Asset Management, Inc. (private real estate and asset management company) since September 1998 | | | 131 | | | Director, Valmont Industries, Inc. (irrigation systems manufacturer) since 2012 | |
Leroy C. Richie
901 S. Marquette Ave.
Minneapolis, MN 55402
1941 | | Board member since 2000 for Legacy Seligman Funds, since 11/08 for RiverSource Funds and since 6/11 for Nations Funds | | Counsel, Lewis & Munday, P.C. (law firm) since 2004; Vice President and General Counsel, Automotive Legal Affairs, Chrysler Corporation, 1993-1997 | | | 131 | | | Lead Outside Director, Digital Ally, Inc. (digital imaging) since September 2005; Director, Infinity, Inc. (oil and gas exploration and production) since 1994; Director, OGE Energy Corp. (energy and energy services) since November 2007 | |
Minor M. Shaw
901 S. Marquette Ave.
Minneapolis, MN 55402
1947 | | Board member since 6/11 for RiverSource Funds and since 2003 for Nations Funds | | President, Micco LLC (private investments) since 2011; President, Micco Corp. since 1998 | | | 129 | | | Director, Piedmont Natural Gas; Director, BlueCross BlueShield of South Carolina since April 2008; Director, National Association of Corporate Directors, Carolinas Chapter, since 2013; former Trustee, BofA Funds Series Trust (11 funds) | |
Annual Report 2014
31
Columbia Marsico 21st Century Fund
Trustees and Officers (continued)
Independent Trustees (continued)
Name,
Address,
Year of Birth | | Position Held With
Funds and Length of
Service | | Principal Occupation(s)
During Past Five Years
and Other Relevant
Professional Experience | | Number of
Funds in the
Fund Family
Overseen by
Board Member | | Other Present or Past
Directorships/
Trusteeships
(Within Past 5 Years) | |
Alison Taunton-Rigby
901 S. Marquette Ave.
Minneapolis, MN 55402
1944 | | Board member since 11/02 for RiverSource Funds and since 6/11 for Nations Funds | | Chief Executive Officer and Director, RiboNovix, Inc., (biotechnology) 2003-2010 | | | 131 | | | Director, Healthways, Inc. (health and wellbeing solutions) since 2005; Director, ICI Mutual Insurance Company, RRG since 2011; Director, Abt Associates (government contractor) since 2001; Director, Boston Children's Hospital since 2002 | |
Interested Trustee Not Affiliated with Investment Manager*
Name,
Address,
Year of Birth | | Position Held With
Funds and Length of
Service | | Principal Occupation(s)
During Past Five Years
and Other Relevant
Professional Experience | | Number of
Funds in the
Fund Family
Overseen by
Board Member | | Other Present or Past
Directorships/
Trusteeships
(Within Past 5 Years) | |
Anthony M. Santomero
901 S. Marquette Ave.
Minneapolis, MN 55402
1946 | | Board member since 6/11 for RiverSource Funds and since 1/08 for Nations Funds | | Richard K. Mellon Professor Emeritus of Finance, The Wharton School, University of Pennsylvania, since 2002; Senior Advisor, McKinsey & Company (consulting), 2006-2008 | | | 129 | | | Director, Renaissance Reinsurance Ltd. since May 2008; Trustee, Penn Mutual Life Insurance Company since March 2008; Director, Citigroup Inc. since 2009; Director, Citibank, N.A. since 2009; former Trustee, BofA Funds Series Trust (11 funds), 2008-2011 | |
* Dr. Santomero is not an affiliated person of the Investment Manager or Ameriprise Financial. However, he is currently deemed by the Funds to be an "interested person" (as defined in the 1940 Act) of the Funds because he serves as a Director of Citigroup Inc. and Citibank, N.A., companies that may directly or through subsidiaries and affiliates engage from time-to-time in brokerage execution, principal transactions and lending relationships with the Funds or accounts advised/managed by the Investment Manager.
Annual Report 2014
32
Columbia Marsico 21st Century Fund
Trustees and Officers (continued)
Interested Trustee Affiliated with Investment Manager*
Name,
Address,
Year of Birth | | Position Held With
Funds and Length of
Service | | Principal Occupation(s)
During Past Five Years
and Other Relevant
Professional Experience | | Number of
Funds in the
Fund Family
Overseen by
Board Member | | Other Present or Past
Directorships/
Trusteeships
(Within Past 5 Years) | |
William F. Truscott
53600 Ameriprise
Financial Center
Minneapolis, MN 55474
1960 | | Board member since 11/01 for RiverSource Funds and since 6/11 for Nations Funds; Senior Vice President since 2002 for RiverSource Funds and since 5/10 for Nations Funds | | Chairman of the Board and President, Columbia Management Investment Advisers, LLC since May 2010 and February 2012, respectively (previously President and Chief Investment Officer, 2001-April 2010); Chief Executive Officer, Global Asset Management, Ameriprise Financial, Inc. since September 2012 (previously Chief Executive Officer, U.S. Asset Management & President, Annuities, May 2010-September 2012 and President — U.S. Asset Management and Chief Investment Officer, 2005-April 2010); Director and Chief Executive Officer, Columbia Management Investment Distributors, Inc. since May 2010 and February 2012, respectively (previously Chairman of the Board and Chief Executive Officer, 2006-April 2010); Chairman of the Board and Chief Executive Officer, RiverSource Distributors, Inc. since 2006; Director, Threadneedle Asset Management Holdings, SARL since 2014; President and Chief Executive Officer, Ameriprise Certificate Company, 2006-August 2012 | | | 183 | | | Former Director, Ameriprise Certificate Company, 2006-January 2013 | |
* Interested person (as defined under the 1940 Act) by reason of being an officer, director, security holder and/or employee of the Investment Manager or Ameriprise Financial.
The SAI has additional information about the Fund's Board members and is available, without charge, upon request by calling 800.345.6611; contacting your financial intermediary; or visiting columbiamanagement.com.
Annual Report 2014
33
Columbia Marsico 21st Century Fund
Trustees and Officers (continued)
The Board has appointed officers who are responsible for day-to-day business decisions based on policies it has established. The officers serve at the pleasure of the Board. In addition to Mr. Truscott, who is Senior Vice President, the Funds' other officers are:
Officers
Name,
Address and
Year of Birth | | Position and Year
First Appointed to
Position for any Fund
in the Columbia
Funds Complex or a
Predecessor Thereof | | Principal Occupation(s) During Past Five Years | |
J. Kevin Connaughton
225 Franklin Street
Boston, MA 02110
Born 1964 | | President and Principal Executive Officer (2009) | | Managing Director and General Manager — Mutual Fund Products, Columbia Management Investment Advisers, LLC since May 2010; and President, Columbia Funds since 2009; Managing Director, Columbia Management Advisors, LLC, December 2004 – April 2010; Senior Vice President and Chief Financial Officer, Columbia Funds, June 2008 – January 2009; and senior officer of Columbia Funds and affiliated funds since 2003 | |
Michael G. Clarke
225 Franklin Street
Boston, MA 02110
Born 1969 | | Treasurer (2011) and Chief Financial Officer (2009) | | Vice President — Mutual Fund Administration, Columbia Management Investment Advisers, LLC, since May 2010;Managing Director of Fund Administration, Columbia Management Advisors, LLC, September 2004 – April 2010; and senior officer of Columbia Funds and affiliated funds since 2002 | |
Scott R. Plummer
5228 Ameriprise Financial Center
Minneapolis, MN 55474
Born 1959 | | Senior Vice President (2006), Chief Legal Officer (2006) and Assistant Secretary (2011) | | Senior Vice President and Assistant General Counsel — Global Asset Management, Ameriprise Financial since February 2014 (previously, Senior Vice President and Lead Chief Counsel — Asset Management, 2012 – February 2014; Vice President and Lead Chief Counsel — Asset Management, 2010 – 2012; and Vice President and Chief Counsel — Asset Management, 2005 – 2010); Senior Vice President, Chief Legal Officer and Assistant Secretary, Columbia Management Investment Advisers, LLC since June 2005; Vice President, Chief Counsel and Assistant Secretary, Columbia Management Investment Distributors, Inc. since 2008; Vice President, General Counsel and Secretary, Ameriprise Certificate Company since 2005; Chief Counsel, RiverSource Distributors, Inc. since 2006; senior officer of Columbia Funds and affiliated funds since 2006 | |
Thomas P. McGuire
225 Franklin Street
Boston, MA 02110
Born 1972 | | Chief Compliance Officer (2012) | | Vice President — Asset Management Compliance, Ameriprise Financial, Inc. since May 2010; Chief Compliance Officer, Ameriprise Certificate Company, since September 2010; Compliance Executive, Bank of America, 2005 – April 2010 | |
Colin Moore
225 Franklin Street
Boston, MA 02110
Born 1958 | | Senior Vice President (2010) | | Executive Vice President and Global Chief Investment Officer, Ameriprise Financial, Inc. since July 2013; Director and Global Chief Investment Officer, Columbia Management Investment Advisers, LLC since May 2010; Manager, Managing Director and Chief Investment Officer, Columbia Management Advisors, LLC, 2007 – April 2010 | |
Michael E. DeFao
225 Franklin Street
Boston, MA 02110
Born 1968 | | Vice President (2011) and Assistant Secretary (2010) | | Vice President and Chief Counsel, Ameriprise Financial, Inc. since May 2010; Associate General Counsel, Bank of America 2005 – April 2010 | |
Joseph F. DiMaria
225 Franklin Street
Boston, MA 02110
Born 1968 | | Vice President (2011) and Chief Accounting Officer (2008) | | Vice President — Mutual Fund Treasurer, Columbia Management Investment Advisers, LLC since May 2010; Director of Fund Administration, Columbia Management Advisors, LLC, 2006 – April 2010 | |
Paul B. Goucher
100 Park Avenue
New York, NY 10017
Born 1968 | | Vice President (2011) and Assistant Secretary (2008) | | Vice President and Lead Chief Counsel, Ameriprise Financial, Inc. since November 2008 and January 2013, respectively (previously Chief Counsel, January 2010 – January 2013, and Group Counsel, November 2008 – January 2010); Director, Managing Director and General Counsel, J. & W. Seligman & Co. Incorporated, July 2008 – November 2008 | |
Amy Johnson
5228 Ameriprise Financial
Center
Minneapolis, MN 55474
Born 1965 | | Vice President (2006) | | Managing Director and Chief Operating Officer, Columbia Management Investment Advisers, LLC since May 2010 (previously Chief Administrative Officer, 2009 – April 2010, and Vice President — Asset Management and Trust Company Services, 2006 – 2009) | |
Annual Report 2014
34
Columbia Marsico 21st Century Fund
Trustees and Officers (continued)
Officers (continued)
Name,
Address and
Year of Birth | | Position and Year
First Appointed to
Position for any Fund
in the Columbia
Funds Complex or a
Predecessor Thereof | | Principal Occupation(s) During Past Five Years | |
Paul D. Pearson
5228 Ameriprise Financial
Center
Minneapolis, MN 55474
Born 1956 | | Vice President (2011) and Assistant Treasurer (1999) | | Vice President — Investment Accounting, Columbia Management Investment Advisers, LLC since May 2010; Vice President — Managed Assets, Investment Accounting, Ameriprise Financial, Inc., 1998 – April 2010 | |
Christopher O. Petersen
5228 Ameriprise Financial Center
Minneapolis, MN 55474
Born 1970 | | Vice President and Secretary (2010) | | Vice President and Chief Counsel, Ameriprise Financial, Inc., since January 2010 (previously Vice President and Group Counsel or Counsel, 2004 – January 2010); officer of Columbia Funds and affiliated funds since 2007 | |
Stephen T. Welsh
225 Franklin Street
Boston, MA 02110
Born 1957 | | Vice President (2006) | | President and Director, Columbia Management Investment Services Corp. since May 2010; President and Director, Columbia Management Services, Inc., 2004 – April 2010; Managing Director, Columbia Management Distributors, Inc., 2007 – April 2010 | |
Annual Report 2014
35
This page intentionally left blank.
Annual Report 2014
36
Columbia Marsico 21st Century Fund
Important Information About This Report
Each fund mails one shareholder report to each shareholder address. If you would like more than one report, please call shareholder services at 800.345.6611 and additional reports will be sent to you.
The policy of the Board is to vote the proxies of the companies in which each fund holds investments consistent with the procedures as stated in the Statement of Additional Information (SAI). You may obtain a copy of the SAI without charge by calling 800.345.6611; contacting your financial intermediary; visiting columbiamanagement.com; or searching the website of the Securities and Exchange Commission (SEC) at sec.gov. Information regarding how each fund voted proxies relating to portfolio securities is filed with the SEC by August 31 for the most recent 12-month period ending June 30 of that year, and is available without charge by visiting columbiamanagement.com; or searching the website of the SEC at sec.gov.
Each fund files a complete schedule of portfolio holdings with the SEC for the first and third quarters of each fiscal year on Form N-Q. Each fund's Form N-Q is available on the SEC's website at sec.gov and may be reviewed and copied at the SEC's Public Reference Room in Washington, D.C. Information on the operation of the Public Reference Room may be obtained by calling 800.SEC.0330. Each fund's complete schedule of portfolio holdings, as filed on Form N-Q, can also be obtained without charge, upon request, by calling 800.345.6611.
Annual Report 2014
37

Columbia Marsico 21st Century Fund
P.O. Box 8081
Boston, MA 02266-8081
columbiamanagement.com
This information is for use with concurrent or prior delivery of a fund prospectus. Please read and consider the investment objectives, risks, charges and expenses for any fund carefully before investing. For a prospectus and, if available, a summary prospectus, which contains this and other important information about the Fund go to columbiamanagement.com. The Fund is distributed by Columbia Management Investment Distributors, Inc., member FINRA, and managed by Columbia Management Investment Advisers, LLC.
© 2014 Columbia Management Investment Advisers, LLC. All rights reserved.
ANN184_02_D01_(04/14)
Annual Report
February 28, 2014

Columbia Small Cap Index Fund
Not FDIC insured • No bank guarantee • May lose value
 Dear Shareholders,
Equities recovered
In the final months of 2013, the U.S. economy embraced a robust recovery. After five years of only modest progress, the pace of economic growth picked up, job gains continued, manufacturing activity accelerated and a rebound in the housing market showed staying power. Growth, as measured by gross domestic product, was 4.1% in the third quarter, with expectations for a solid fourth quarter. Job growth averaged close to 200,000 monthly. Industrial production rose at a rate of 3.3%, considerably higher than the 12-month average of 2.5%. Factories were busier than at any point since the 2008/2009 recession, with capacity utilization at 79%. Orders for durable goods were strong, bolstered by rising auto sales. Holiday spending was solid, especially online sales, which rose 10% year over year, despite a shorter season.
Against this backdrop, the Federal Reserve's (the Fed's) announcement that it would slowly retreat from its monthly bond buying program and a bipartisan budget deal in Washington were welcome news for investors. Stocks climbed to new highs in the fourth quarter, while bonds retreated as yields moved higher. Small-cap stocks outperformed large- and mid-cap stocks, led by significant gains from the industrials, technology and consumer discretionary sectors. All 10 sectors of the S&P 500 Index delivered positive returns, although telecommunications and utilities posted only modest gains.
Fixed-income retreated
Improved economic data drove interest rates higher over the fourth quarter, credit spreads narrowed and the dollar weakened against most developed market currencies. Against this backdrop, most non-Treasury, fixed-income sectors delivered positive returns. Outgoing Fed chairman Ben Bernanke expressed concern about the persistently low level of core inflation, but gains in the labor market and reduced unemployment led to the Fed's decision to taper its bond-buying program gradually beginning in January 2014.
As the stock market soared, the riskiest sectors of the fixed-income markets fared the best. U.S. and foreign high-yield bonds were the strongest performers, followed by emerging-market and U.S. investment-grade corporate bonds. U.S. mortgage-backed securities (MBS) and securitized bonds produced negative total returns, as did U.S. Treasuries and developed world government bonds. Treasury inflation-protected bonds were the period's biggest losers. Investment-grade municipals delivered fractional gains, as better economic conditions helped steady state finances.
Stay on track with Columbia Management
Backed by more than 100 years of experience, Columbia Management is one of the nation's largest asset managers. At the heart of our success and, most importantly, that of our investors, are highly talented industry professionals, brought together by a unique way of working. At Columbia Management, reaching our performance goals matters, and how we reach them matters just as much.
Visit columbiamanagement.com for:
> The Columbia Management Perspectives blog, offering insights on current market events and investment opportunities
> Detailed up-to-date fund performance and portfolio information
> Quarterly fund commentaries
> Columbia Management Investor, our award-winning quarterly newsletter for shareholders
Thank you for your continued support of the Columbia Funds. We look forward to serving your investment needs for many years to come.
Best Regards,

J. Kevin Connaughton
President, Columbia Funds
Investing involves risk including the risk of loss of principal.
The S&P 500 Index, an unmanaged index, measures the performance of 500 widely held, large-capitalization U.S. stocks and is frequently used as a general measure of market performance. The Dow Jones Industrial Average is a price weighted average of 30 actively traded shares of blue chip US industrial corporations listed on the New York Stock Exchange. Indices are not available for investment, are not professionally managed and do not reflect sales charges, fees, brokerage commissions, taxes or other expenses of investing.
Investors should consider the investment objectives, risks, charges and expenses of a mutual fund carefully before investing. For a free prospectus and, if available, a summary prospectus, which contains this and other important information about a fund, visit columbiamanagement.com. The prospectus should be read carefully before investing.
Columbia Funds are distributed by Columbia Management Investment Distributors, Inc., member FINRA, and managed by Columbia Management Investment Advisers, LLC.
© 2014 Columbia Management Investment Advisers, LLC. All rights reserved.
Columbia Small Cap Index Fund
Performance Overview | | | 2 | | |
Manager Discussion of Fund Performance | | | 4 | | |
Understanding Your Fund's Expenses | | | 6 | | |
Portfolio of Investments | | | 7 | | |
Statement of Assets and Liabilities | | | 20 | | |
Statement of Operations | | | 22 | | |
Statement of Changes in Net Assets | | | 23 | | |
Financial Highlights | | | 25 | | |
Notes to Financial Statements | | | 31 | | |
Report of Independent Registered
Public Accounting Firm | | | 38 | | |
Federal Income Tax Information | | | 39 | | |
Trustees and Officers | | | 40 | | |
Important Information About This Report | | | 49 | | |
Fund Investment Manager
Columbia Management Investment
Advisers, LLC
225 Franklin Street
Boston, MA 02110
Fund Distributor
Columbia Management Investment
Distributors, Inc.
225 Franklin Street
Boston, MA 02110
Fund Transfer Agent
Columbia Management Investment
Services Corp.
P.O. Box 8081
Boston, MA 02266-8081
For more information about any of the funds, please visit columbiamanagement.com or call 800.345.6611. Customer Service Representatives are available to answer your questions Monday through Friday from 8 a.m. to 7 p.m. Eastern time.
The views expressed in this report reflect the current views of the respective parties. These views are not guarantees of future performance and involve certain risks, uncertainties and assumptions that are difficult to predict, so actual outcomes and results may differ significantly from the views expressed. These views are subject to change at any time based upon economic, market or other conditions and the respective parties disclaim any responsibility to update such views. These views may not be relied on as investment advice and, because investment decisions for a Columbia Fund are based on numerous factors, may not be relied on as an indication of trading intent on behalf of any particular Columbia Fund. References to specific securities should not be construed as a recommendation or investment advice.
Columbia Small Cap Index Fund
Performance Summary
> Columbia Small Cap Index Fund (the Fund) Class A shares returned 31.63% for the 12-month period that ended February 28, 2014.
> The Fund's benchmark, the unmanaged S&P SmallCap 600 Index, returned 32.30% for the same time period.
> Mutual funds, unlike unmanaged indices, incur operating expenses, which accounted for the Fund's underperformance relative to the benchmark.
Average Annual Total Returns (%) (for period ended February 28, 2014)
| | Inception | | 1 Year | | 5 Years | | 10 Years | |
Class A | | 10/15/96 | | | 31.63 | | | | 27.50 | | | | 9.77 | | |
Class B* | | 03/07/11 | | | | | | | |
Excluding sales charges | | | | | 30.64 | | | | 26.54 | | | | 8.95 | | |
Including sales charges | | | | | 25.64 | | | | 26.38 | | | | 8.95 | | |
Class I* | | 11/16/11 | | | 31.97 | | | | 27.65 | | | | 9.84 | | |
Class K* | | 03/07/11 | | | 31.65 | | | | 27.49 | | | | 9.77 | | |
Class R5* | | 11/08/12 | | | 32.01 | | | | 27.59 | | | | 9.81 | | |
Class Z | | 10/15/96 | | | 31.99 | | | | 27.81 | | | | 10.05 | | |
S&P SmallCap 600 Index | | | | | 32.30 | | | | 28.04 | | | | 10.18 | | |
Returns for Class B are shown with and without the applicable contingent deferred sales charge (CDSC) of 5.00% in the first year, declining to 1.00% in the sixth year and eliminated thereafter. The Fund's other classes are not subject to sales charges and have limited eligibility. Please see the Fund's prospectus for details. Performance for different share classes will vary based on differences in sales charges and fees associated with each class. All results shown assume reinvestment of distributions during the period. Returns do not reflect the deduction of taxes that a shareholder may pay on Fund distributions or on the redemption of Fund shares. Performance results reflect the effect of any fee waivers or reimbursements of Fund expenses by Columbia Management Investment Advisers, LLC and/or any of its affiliates. Absent these fee waivers or expense reimbursement arrangements, performance results would have been lower.
The performance information shown represents past performance and is not a guarantee of future results. The investment return and principal value of your investment will fluctuate so that your shares, when redeemed, may be worth more or less than their original cost. Current performance may be lower or higher than the performance information shown. You may obtain performance information current to the most recent month-end by contacting your financial intermediary, visiting columbiamanagement.com or calling 800.345.6611.
*The returns shown for periods prior to the share class inception date (including returns for the Life of the Fund, if shown, which are since Fund inception) include the returns of the Fund's oldest share class. Since the Fund launched more than one share class at its inception, Class A shares were used. These returns are adjusted to reflect any higher class-related operating expenses of the newer share classes, as applicable. Please visit columbiamanagement.com/mutual-funds/appended-performance for more information.
The S&P SmallCap 600 Index tracks the performance of 600 domestic companies traded on major stock exchanges. The S&P SmallCap 600 is heavily weighted with the stocks of companies with small market capitalizations.
Indices are not available for investment, are not professionally managed and do not reflect sales charges, fees, brokerage commissions, taxes or other expenses of investing. Securities in the Fund may not match those in an index.
Annual Report 2014
2
Columbia Small Cap Index Fund
Performance Overview (continued)
Performance of a Hypothetical $10,000 Investment (March 1, 2004 – February 28, 2014)
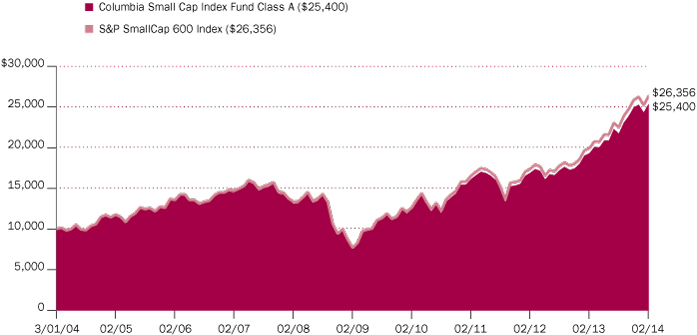
The chart above shows the change in value of a hypothetical $10,000 investment in Class A shares of Columbia Small Cap Index Fund during the stated time period, and does not reflect the deduction of taxes that a shareholder may pay on Fund distributions or on the redemption of Fund shares.
Annual Report 2014
3
Columbia Small Cap Index Fund
Manager Discussion of Fund Performance
For the 12-month period that ended February 28, 2014, the Fund's Class A shares returned 31.63%. The Fund's benchmark, the unmanaged S&P SmallCap 600 Index, returned 32.30% for the same time period. Mutual funds, unlike unmanaged indices, incur operating expenses, which helped to account for the Fund's underperformance relative to the benchmark.
U.S. Equity Market Posted Strong Gains
Following a strong first quarter of 2013 when investors turned attention to the modest but continued strengthening of the U.S. economy, volatility heightened in the second calendar quarter, as uncertainty about the global economy, monetary policy and the impact of the sequester's spending cuts weighed on investors. While consumers weathered the domestic drag well, businesses remained cautious, keeping inventories, capital expenditures and staffs lean. U.S. equities delivered positive returns during the third quarter of 2013 despite threats of military action in Syria, rumblings from Iran and an impending showdown over the U.S. debt ceiling. Still, robust economic growth continued to elude the U.S. economy, which merely plodded along. The Federal Reserve (the Fed) unsettled investors with a hint that it was ready to taper its purchase of U.S. Treasury and mortgage securities. However, the Fed's decision to not take any action at its September 2013 meeting rallied stocks to new highs. In the final months of 2013, the U.S. economy embraced a healthy recovery, with job gains continuing, manufacturing activity accelerating and a rebound in housing showing staying power. Against this backdrop, the Fed's announcement in mid-December that it would slowly retreat from its monthly bond purchases and a bipartisan budget deal in Washington D.C. were welcome news for investors, and U.S. equities climbed to new highs.
Along with the U.S. equity market broadly, the benchmark reacted poorly to reports of lower Chinese manufacturing and fell in January 2014. However, the decline was short-lived, with U.S. equities subsequently regaining losses in February, bringing the benchmark to the strongest annual increase among the U.S. equity market capitalization indices. Global concerns heightened amidst conflict in the Ukraine, but investors generally remained positive on U.S. equities given strong corporate earnings reports and guidance.
Benchmark Enjoyed Broad-Based Gains
All ten sectors of the benchmark posted double-digit positive returns during the 12 months ended February 28, 2014. In terms of total return, health care, information technology and consumer discretionary were the best relative performers. On the basis of impact, which takes weightings and total returns into account, information technology, consumer discretionary and financials were the biggest contributors to the benchmark's return. The top performing industries for the annual period were media; technology hardware, storage and peripherals; health care technology; pharmaceuticals; and multiline retail.
Conversely, utilities and telecommunication services, each traditionally considered a defensive sector, were the weakest sectors from both a total return perspective and on the basis of impact. Each, though, still generated positive, albeit more modest, returns. The worst performing industries for the annual period were tobacco, air freight and logistics, real estate investment trusts, consumer finance and real estate management and development.
Portfolio Management
Alfred Alley III, CFA
Vadim Shteyn
Morningstar Style BoxTM
The Morningstar Style BoxTM is based on a fund's portfolio holdings. For equity funds, the vertical axis shows the market capitalization of the stocks owned, and the horizontal axis shows investment style (value, blend, or growth). Information shown is based on the most recent data provided by Morningstar.
© 2014 Morningstar, Inc. All rights reserved. The Morningstar information contained herein: (1) is proprietary to Morningstar and/or its content providers; (2) may not be copied or distributed; and (3) is not warranted to be accurate, complete or timely. Neither Morningstar nor its content providers are responsible for any damages or losses arising from any use of this information.
Top Ten Holdings (%)
(at February 28, 2014) | |
FEI Co. | | | 0.6 | | |
Kate Spade & Co. | | | 0.6 | | |
Toro Co. (The) | | | 0.6 | | |
Teledyne Technologies, Inc. | | | 0.5 | | |
PolyOne Corp. | | | 0.5 | | |
Centene Corp. | | | 0.5 | | |
Questcor Pharmaceuticals, Inc. | | | 0.5 | | |
EnerSys, Inc. | | | 0.5 | | |
Arris Group, Inc. | | | 0.5 | | |
MAXIMUS, Inc. | | | 0.5 | | |
Percentages indicated are based upon total investments (excluding Money Market Funds).
For further detail about these holdings, please refer to the section entitled "Portfolio of Investments."
Fund holdings are as of the date given, are subject to change at any time, and are not recommendations to buy or sell any security.
Annual Report 2014
4
Columbia Small Cap Index Fund
Manager Discussion of Fund Performance (continued)
Top individual contributors within the benchmark included medical device manufacturer Align Technology, e-commerce retailer United Online, apparel and accessories designer Kate Spade, specialty pharmaceuticals company Questcor Pharmaceuticals and oil and gas exploration and production company Gulfport Energy. Top detractors were communications equipment company Ixia, insurance provider Tower Group International, semiconductor equipment manufacturer Ultratech, specialty apparel retailer Francesca's Holdings and pawn shop operator EZCORP.
As always, each sector and stock in the benchmark was represented in the Fund with approximately the same weighting as in the benchmark and therefore had a similar effect.
Benchmark Additions and Deletions Drove Portfolio Changes
During the annual period, there were 49 additions and 49 deletions to the benchmark and the Fund's portfolio. Among those stocks added to the benchmark and Fund were Boise Cascade, Arch Coal, Regis, Scholastic, Aeropostale, Sanmina, Monster Worldwide, Barnes & Noble, Forest Oil, QLogic, Atlas Air Worldwide and FTD. Deletions included Align Technology, Hain Celestial Group, Brunswick, OfficeMax, Gulfport Energy, Maidenform Brands, Volterra Semiconductor, American Greetings, Coldwater Creek, 3-D Systems, CEC Entertainment and Kilroy Realty.
The Fund used equity index futures on an opportunistic basis to equitize cash balances held in the portfolio for trading and redemption purposes. The percentage of Fund assets held in these instruments changed daily due to changes in the Fund's cash position but was generally minimal in size and impact.
Looking Ahead
We do not anticipate any changes in the portfolio beyond the customary quarterly rebalancings and stock substitutions we make to align the Fund with the benchmark.
From a broad perspective, following developed equity markets performing strongly relative to other asset classes in 2013, we currently believe U.S. equities may continue to perform well in 2014, albeit perhaps not as well as last year. While valuations for most U.S. stocks did not appear as cheap at the end of February 2014 as they were 12 months prior, we believe they were still fairly valued, in our view, especially relative to fixed income. Indeed, corporate earnings have been strong and guidance has been encouraging for the most part. Balance sheets remain healthy at this time with high cash levels and low debt. We presently believe the U.S. economy may continue to benefit from an improving labor market, a strengthening housing market, reduced fiscal drag, normalization of monetary policy, an improving eurozone recovery and aggressive Japanese economic stimulus. There will almost certainly be challenges along the way, such as geopolitical risk and the unknown impact of ongoing Fed tapering, but we believe developed equity markets, especially U.S. equity markets, may still provide reasonably attractive returns in the coming months.
Portfolio Breakdown (%)
(at February 28, 2014) | |
Common Stocks | | | 97.5 | | |
Consumer Discretionary | | | 15.4 | | |
Consumer Staples | | | 3.4 | | |
Energy | | | 4.3 | | |
Financials | | | 20.7 | | |
Health Care | | | 10.2 | | |
Industrials | | | 14.5 | | |
Information Technology | | | 18.6 | | |
Materials | | | 6.5 | | |
Telecommunication Services | | | 0.5 | | |
Utilities | | | 3.4 | | |
Money Market Funds | | | 2.5 | | |
Rights | | | 0.0 | (a) | |
Total | | | 100.0 | | |
Percentages indicated are based upon total investments. The Fund's portfolio composition is subject to change.
(a) Rounds to zero.
Investment Risks
Share prices of small capitalization companies tend to be more volatile because small companies often have narrower markets, limited financial resources and stocks that are not as actively traded as large company stocks. See the Fund's prospectus for information on these and other risks.
Annual Report 2014
5
Columbia Small Cap Index Fund
Understanding Your Fund's Expenses
(Unaudited)
As an investor, you incur two types of costs. There are transaction costs, which generally include sales charges on purchases and may include redemption fees. There are also ongoing costs, which generally include management fees, distribution and/or service fees, and other fund expenses. The following information is intended to help you understand your ongoing costs (in dollars) of investing in the Fund and to help you compare these costs with the ongoing costs of investing in other mutual funds.
Analyzing Your Fund's Expenses
To illustrate these ongoing costs, we have provided examples and calculated the expenses paid by investors in each share class of the Fund during the period. The actual and hypothetical information in the table is based on an initial investment of $1,000 at the beginning of the period indicated and held for the entire period. Expense information is calculated two ways and each method provides you with different information. The amount listed in the "Actual" column is calculated using the Fund's actual operating expenses and total return for the period. You may use the Actual information, together with the amount invested, to estimate the expenses that you paid over the period. Simply divide your account value by $1,000 (for example, an $8,600 account value divided by $1,000 = 8.6), then multiply the results by the expenses paid during the period under the "Actual" column. The amount listed in the "Hypothetical" column assumes a 5% annual rate of return before expenses (which is not the Fund's actual return) and then applies the Fund's actual expense ratio for the period to the hypothetical return. You should not use the hypothetical account values and expenses to estimate either your actual account balance at the end of the period or the expenses you paid during the period. See "Compare With Other Funds" below for details on how to use the hypothetical data.
Compare With Other Funds
Since all mutual funds are required to include the same hypothetical calculations about expenses in shareholder reports, you can use this information to compare the ongoing cost of investing in the Fund with other funds. To do so, compare the hypothetical example with the 5% hypothetical examples that appear in the shareholder reports of other funds. As you compare hypothetical examples of other funds, it is important to note that hypothetical examples are meant to highlight the ongoing costs of investing in a fund only and do not reflect any transaction costs, such as sales charges, or redemption or exchange fees. Therefore, the hypothetical calculations are useful in comparing ongoing costs only, and will not help you determine the relative total costs of owning different funds. If transaction costs were included in these calculations, your costs would be higher.
September 1, 2013 – February 28, 2014
| | Account Value at the Beginning
of the Period ($) | | Account Value at the End of the
Period ($) | | Expenses Paid During the
Period ($) | | Fund's Annualized
Expense Ratio (%) | |
| | Actual | | Hypothetical | | Actual | | Hypothetical | | Actual | | Hypothetical | | Actual | |
Class A | | | 1,000.00 | | | | 1,000.00 | | | | 1,169.10 | | | | 1,022.69 | | | | 2.43 | | | | 2.27 | | | | 0.45 | | |
Class B | | | 1,000.00 | | | | 1,000.00 | | | | 1,164.40 | | | | 1,018.95 | | | | 6.48 | | | | 6.04 | | | | 1.20 | | |
Class I | | | 1,000.00 | | | | 1,000.00 | | | | 1,170.60 | | | | 1,023.93 | | | | 1.08 | | | | 1.01 | | | | 0.20 | | |
Class K | | | 1,000.00 | | | | 1,000.00 | | | | 1,169.10 | | | | 1,022.69 | | | | 2.43 | | | | 2.27 | | | | 0.45 | | |
Class R5 | | | 1,000.00 | | | | 1,000.00 | | | | 1,170.50 | | | | 1,023.93 | | | | 1.08 | | | | 1.01 | | | | 0.20 | | |
Class Z | | | 1,000.00 | | | | 1,000.00 | | | | 1,170.60 | | | | 1,023.93 | | | | 1.08 | | | | 1.01 | | | | 0.20 | | |
Expenses paid during the period are equal to the annualized expense ratio for each class as indicated above, multiplied by the average account value over the period and then multiplied by the number of days in the Fund's most recent fiscal half year and divided by 365.
Expenses do not include fees and expenses incurred indirectly by the Fund from the underlying funds in which the Fund may invest (also referred to as "acquired funds"), including affiliated and non-affiliated pooled investment vehicles (including mutual funds and exchange-traded funds).
Had Columbia Management Investment Advisers, LLC and/or certain of its affiliates not waived/reimbursed certain fees and expenses, account value at the end of the period would have been reduced.
Annual Report 2014
6
Columbia Small Cap Index Fund
Portfolio of Investments
February 28, 2014
(Percentages represent value of investments compared to net assets)
Common Stocks 96.8%
Issuer | | Shares | | Value ($) | |
Consumer Discretionary 15.4% | |
Auto Components 0.6% | |
Dorman Products, Inc.(a) | | | 121,435 | | | | 6,997,085 | | |
Drew Industries, Inc. | | | 87,597 | | | | 4,313,276 | | |
Spartan Motors, Inc. | | | 136,926 | | | | 776,370 | | |
Standard Motor Products, Inc. | | | 83,399 | | | | 2,931,475 | | |
Superior Industries International, Inc. | | | 93,774 | | | | 1,714,189 | | |
Total | | | | | 16,732,395 | | |
Automobiles 0.1% | |
Winnebago Industries, Inc.(a) | | | 111,800 | | | | 2,980,588 | | |
Distributors 0.4% | |
Pool Corp. | | | 184,232 | | | | 10,770,203 | | |
VOXX International Corp.(a) | | | 78,874 | | | | 1,025,362 | | |
Total | | | | | 11,795,565 | | |
Diversified Consumer Services 0.8% | |
American Public Education, Inc.(a) | | | 70,264 | | | | 2,488,751 | | |
Capella Education Co. | | | 44,233 | | | | 2,940,610 | | |
Career Education Corp.(a) | | | 231,618 | | | | 1,711,657 | | |
Hillenbrand, Inc. | | | 251,955 | | | | 7,528,416 | | |
ITT Educational Services, Inc.(a) | | | 73,110 | | | | 2,268,603 | | |
Regis Corp. | | | 174,940 | | | | 2,459,656 | | |
Strayer Education, Inc.(a) | | | 43,395 | | | | 2,072,979 | | |
Universal Technical Institute, Inc. | | | 85,002 | | | | 1,150,077 | | |
Total | | | | | 22,620,749 | | |
Hotels, Restaurants & Leisure 3.2% | |
Biglari Holdings, Inc.(a) | | | 5,868 | | | | 2,634,673 | | |
BJ's Restaurants, Inc.(a) | | | 99,622 | | | | 2,759,530 | | |
Boyd Gaming Corp.(a) | | | 302,673 | | | | 3,517,060 | | |
Buffalo Wild Wings, Inc.(a) | | | 75,313 | | | | 10,920,385 | | |
Cracker Barrel Old Country Store, Inc. | | | 95,498 | | | | 9,497,276 | | |
DineEquity, Inc. | | | 64,861 | | | | 5,432,109 | | |
Interval Leisure Group, Inc. | | | 158,728 | | | | 4,315,814 | | |
Jack in the Box, Inc.(a) | | | 170,874 | | | | 9,816,711 | | |
Marcus Corp. (The) | | | 72,693 | | | | 1,025,698 | | |
Marriott Vacations Worldwide Corp.(a) | | | 122,187 | | | | 6,407,486 | | |
Monarch Casino & Resort, Inc.(a) | | | 38,985 | | | | 734,867 | | |
Multimedia Games Holdings Co., Inc.(a) | | | 118,677 | | | | 3,919,308 | | |
Papa John's International, Inc. | | | 127,876 | | | | 6,508,889 | | |
Common Stocks (continued)
Issuer | | Shares | | Value ($) | |
Pinnacle Entertainment, Inc.(a) | | | 237,414 | | | | 5,769,160 | | |
Red Robin Gourmet Burgers, Inc.(a) | | | 52,364 | | | | 4,080,727 | | |
Ruby Tuesday, Inc.(a) | | | 231,405 | | | | 1,418,513 | | |
Ruth's Hospitality Group, Inc. | | | 142,778 | | | | 1,764,736 | | |
Sonic Corp.(a) | | | 209,673 | | | | 4,273,136 | | |
Texas Roadhouse, Inc. | | | 240,458 | | | | 6,360,114 | | |
Total | | | | | 91,156,192 | | |
Household Durables 1.7% | |
Blyth, Inc. | | | 34,042 | | | | 332,931 | | |
Ethan Allen Interiors, Inc. | | | 104,372 | | | | 2,622,868 | | |
Helen of Troy Ltd.(a) | | | 120,808 | | | | 7,889,970 | | |
iRobot Corp.(a) | | | 115,765 | | | | 4,852,869 | | |
La-Z-Boy, Inc. | | | 210,277 | | | | 5,370,475 | | |
M/I Homes, Inc.(a) | | | 97,683 | | | | 2,432,307 | | |
Meritage Homes Corp.(a) | | | 144,921 | | | | 6,986,641 | | |
Ryland Group, Inc. (The) | | | 185,316 | | | | 8,633,872 | | |
Standard Pacific Corp.(a) | | | 600,197 | | | | 5,467,795 | | |
Universal Electronics, Inc.(a) | | | 62,369 | | | | 2,606,401 | | |
Total | | | | | 47,196,129 | | |
Internet & Catalog Retail 0.2% | |
Blue Nile, Inc.(a) | | | 51,352 | | | | 1,807,077 | | |
FTD Companies, Inc.(a) | | | 74,530 | | | | 2,314,902 | | |
Nutrisystem, Inc. | | | 115,202 | | | | 1,695,773 | | |
PetMed Express, Inc. | | | 80,968 | | | | 1,117,358 | | |
Total | | | | | 6,935,110 | | |
Leisure Equipment & Products 0.4% | |
Arctic Cat, Inc. | | | 53,929 | | | | 2,524,956 | | |
Callaway Golf Co. | | | 298,895 | | | | 2,516,696 | | |
JAKKS Pacific, Inc. | | | 68,873 | | | | 493,130 | | |
Sturm Ruger & Co., Inc. | | | 77,600 | | | | 4,946,224 | | |
Total | | | | | 10,481,006 | | |
Media 0.7% | |
EW Scripps Co., Class A(a) | | | 120,604 | | | | 2,366,251 | | |
Harte-Hanks, Inc. | | | 175,590 | | | | 1,402,964 | | |
Live Nation Entertainment, Inc.(a) | | | 567,475 | | | | 12,876,008 | | |
Scholastic Corp. | | | 103,590 | | | | 3,654,655 | | |
Sizmek, Inc.(a) | | | 85,303 | | | | 1,056,904 | | |
Total | | | | | 21,356,782 | | |
The accompanying Notes to Financial Statements are an integral part of this statement.
Annual Report 2014
7
Columbia Small Cap Index Fund
Portfolio of Investments (continued)
February 28, 2014
Common Stocks (continued)
Issuer | | Shares | | Value ($) | |
Multiline Retail 0.2% | |
Fred's, Inc., Class A | | | 137,009 | | | | 2,730,590 | | |
Tuesday Morning Corp.(a) | | | 148,602 | | | | 2,324,135 | | |
Total | | | | | 5,054,725 | | |
Specialty Retail 4.6% | |
Aeropostale, Inc.(a) | | | 314,770 | | | | 2,310,412 | | |
Barnes & Noble, Inc.(a) | | | 148,880 | | | | 2,852,541 | | |
Big 5 Sporting Goods Corp. | | | 71,525 | | | | 1,085,749 | | |
Brown Shoe Co., Inc. | | | 164,574 | | | | 4,045,229 | | |
Buckle, Inc. (The) | | | 112,411 | | | | 5,100,087 | | |
Cato Corp. (The), Class A | | | 107,955 | | | | 3,030,297 | | |
Children's Place Retail Stores, Inc. (The)(a) | | | 89,321 | | | | 4,838,519 | | |
Christopher & Banks Corp.(a) | | | 146,002 | | | | 972,373 | | |
Finish Line, Inc., Class A (The) | | | 197,007 | | | | 5,323,129 | | |
Francesca's Holdings Corp.(a) | | | 168,485 | | | | 3,297,251 | | |
Genesco, Inc.(a) | | | 96,172 | | | | 7,140,771 | | |
Group 1 Automotive, Inc. | | | 85,035 | | | | 5,676,937 | | |
Haverty Furniture Companies, Inc. | | | 80,356 | | | | 2,342,377 | | |
Hibbett Sports, Inc.(a) | | | 104,203 | | | | 5,973,958 | | |
Jos. A. Bank Clothiers, Inc.(a) | | | 112,241 | | | | 6,967,921 | | |
Kirkland's, Inc.(a) | | | 60,184 | | | | 1,064,053 | | |
Lithia Motors, Inc., Class A | | | 90,332 | | | | 5,728,855 | | |
Lumber Liquidators Holdings, Inc.(a) | | | 110,668 | | | | 11,872,463 | | |
MarineMax, Inc.(a) | | | 98,489 | | | | 1,418,242 | | |
Men's Wearhouse, Inc. (The) | | | 182,100 | | | | 9,795,159 | | |
Monro Muffler Brake, Inc. | | | 119,661 | | | | 7,140,172 | | |
Outerwall, Inc.(a) | | | 101,908 | | | | 7,207,953 | | |
PEP Boys-Manny, Moe & Jack (The)(a) | | | 212,942 | | | | 2,680,940 | | |
Select Comfort Corp.(a) | | | 221,551 | | | | 4,001,211 | | |
Sonic Automotive, Inc., Class A | | | 137,351 | | | | 3,263,460 | | |
Stage Stores, Inc. | | | 127,422 | | | | 2,522,956 | | |
Stein Mart, Inc. | | | 112,511 | | | | 1,529,024 | | |
Vitamin Shoppe, Inc.(a) | | | 121,963 | | | | 5,706,649 | | |
Zale Corp.(a) | | | 131,742 | | | | 2,862,754 | | |
Zumiez, Inc.(a) | | | 88,558 | | | | 2,104,138 | | |
Total | | | | | 129,855,580 | | |
Textiles, Apparel & Luxury Goods 2.5% | |
Crocs, Inc.(a) | | | 354,668 | | | | 5,401,594 | | |
G-III Apparel Group Ltd.(a) | | | 66,260 | | | | 4,604,407 | | |
Common Stocks (continued)
Issuer | | Shares | | Value ($) | |
Iconix Brand Group, Inc.(a) | | | 206,841 | | | | 8,323,282 | | |
Kate Spade & Co.(a) | | | 492,264 | | | | 16,845,274 | | |
Movado Group, Inc. | | | 72,343 | | | | 2,848,144 | | |
Oxford Industries, Inc. | | | 57,896 | | | | 4,530,941 | | |
Perry Ellis International, Inc.(a) | | | 49,682 | | | | 693,064 | | |
Quiksilver, Inc.(a) | | | 512,578 | | | | 3,998,108 | | |
Skechers U.S.A., Inc., Class A(a) | | | 158,748 | | | | 5,354,570 | | |
Steven Madden Ltd.(a) | | | 236,482 | | | | 8,619,769 | | |
Wolverine World Wide, Inc. | | | 403,382 | | | | 10,633,149 | | |
Total | | | | | 71,852,302 | | |
Total Consumer Discretionary | | | | | 438,017,123 | | |
Consumer Staples 3.3% | |
Beverages 0.3% | |
Boston Beer Co., Inc. (The), Class A(a) | | | 34,985 | | | | 8,282,699 | | |
Food & Staples Retailing 0.7% | |
Andersons, Inc. (The) | | | 105,740 | | | | 5,798,754 | | |
Casey's General Stores, Inc. | | | 154,320 | | | | 10,569,377 | | |
Spartan Stores, Inc. | | | 146,999 | | | | 3,320,707 | | |
Total | | | | | 19,688,838 | | |
Food Products 2.0% | |
Annie's, Inc.(a) | | | 67,825 | | | | 2,542,081 | | |
B&G Foods, Inc. | | | 214,346 | | | | 6,421,806 | | |
Cal-Maine Foods, Inc. | | | 59,943 | | | | 3,151,204 | | |
Calavo Growers, Inc. | | | 55,402 | | | | 1,725,218 | | |
Darling International, Inc.(a) | | | 634,443 | | | | 12,803,060 | | |
Diamond Foods, Inc.(a) | | | 82,924 | | | | 2,381,577 | | |
J&J Snack Foods Corp. | | | 58,427 | | | | 5,426,700 | | |
Sanderson Farms, Inc. | | | 81,217 | | | | 6,240,714 | | |
Seneca Foods Corp., Class A(a) | | | 28,443 | | | | 861,254 | | |
Snyders-Lance, Inc. | | | 196,161 | | | | 5,314,002 | | |
TreeHouse Foods, Inc.(a) | | | 146,040 | | | | 10,406,810 | | |
Total | | | | | 57,274,426 | | |
Household Products 0.2% | |
Central Garden and Pet Co., Class A(a) | | | 167,752 | | | | 1,234,655 | | |
WD-40 Co. | | | 57,529 | | | | 4,194,439 | | |
Total | | | | | 5,429,094 | | |
The accompanying Notes to Financial Statements are an integral part of this statement.
Annual Report 2014
8
Columbia Small Cap Index Fund
Portfolio of Investments (continued)
February 28, 2014
Common Stocks (continued)
Issuer | | Shares | | Value ($) | |
Personal Products 0.1% | |
Inter Parfums, Inc. | | | 67,949 | | | | 2,283,766 | | |
Medifast, Inc.(a) | | | 51,229 | | | | 1,349,372 | | |
Total | | | | | 3,633,138 | | |
Tobacco —% | |
Alliance One International, Inc.(a) | | | 328,764 | | | | 884,375 | | |
Total Consumer Staples | | | | | 95,192,570 | | |
Energy 4.3% | |
Energy Equipment & Services 2.3% | |
Basic Energy Services, Inc.(a) | | | 106,621 | | | | 2,542,911 | | |
Bristow Group, Inc. | | | 146,875 | | | | 11,397,500 | | |
C&J Energy Services, Inc.(a) | | | 181,635 | | | | 4,695,265 | | |
Era Group, Inc.(a) | | | 75,299 | | | | 2,127,197 | | |
Exterran Holdings, Inc.(a) | | | 235,150 | | | | 9,634,095 | | |
Geospace Technologies Corp.(a) | | | 51,930 | | | | 3,986,666 | | |
Gulf Island Fabrication, Inc. | | | 49,327 | | | | 1,034,387 | | |
Hornbeck Offshore Services, Inc.(a) | | | 130,129 | | | | 5,564,316 | | |
ION Geophysical Corp.(a) | | | 491,299 | | | | 1,999,587 | | |
Matrix Service Co.(a) | | | 105,046 | | | | 3,400,339 | | |
Newpark Resources, Inc.(a) | | | 350,400 | | | | 3,896,448 | | |
Pioneer Energy Services Corp.(a) | | | 250,488 | | | | 2,855,563 | | |
SEACOR Holdings, Inc.(a) | | | 75,834 | | | | 6,708,276 | | |
Tesco Corp.(a) | | | 125,475 | | | | 2,380,261 | | |
Tetra Technologies, Inc.(a) | | | 316,209 | | | | 3,794,508 | | |
Total | | | | | 66,017,319 | | |
Oil, Gas & Consumable Fuels 2.0% | |
Approach Resources, Inc.(a) | | | 140,844 | | | | 3,136,596 | | |
Arch Coal, Inc. | | | 851,350 | | | | 3,882,156 | | |
Carrizo Oil & Gas, Inc.(a) | | | 165,765 | | | | 8,245,151 | | |
Cloud Peak Energy, Inc.(a) | | | 244,234 | | | | 4,738,140 | | |
Comstock Resources, Inc. | | | 177,849 | | | | 3,514,296 | | |
Contango Oil & Gas Co.(a) | | | 61,158 | | | | 2,900,112 | | |
Forest Oil Corp.(a) | | | 479,915 | | | | 964,629 | | |
Green Plains Renewable Energy, Inc. | | | 95,340 | | | | 2,519,836 | | |
Northern Oil and Gas, Inc.(a) | | | 228,040 | | | | 3,174,317 | | |
PDC Energy, Inc.(a) | | | 142,987 | | | | 8,883,782 | | |
Penn Virginia Corp.(a) | | | 212,105 | | | | 3,213,391 | | |
Petroquest Energy, Inc.(a) | | | 227,575 | | | | 1,076,430 | | |
Common Stocks (continued)
Issuer | | Shares | | Value ($) | |
Stone Energy Corp.(a) | | | 200,505 | | | | 7,206,150 | | |
Swift Energy Co.(a) | | | 174,037 | | | | 1,740,370 | | |
Total | | | | | 55,195,356 | | |
Total Energy | | | | | 121,212,675 | | |
Financials 20.5% | |
Capital Markets 1.7% | |
Calamos Asset Management, Inc., Class A | | | 76,572 | | | | 913,504 | | |
Evercore Partners, Inc., Class A | | | 131,605 | | | | 7,322,502 | | |
Financial Engines, Inc. | | | 202,168 | | | | 11,424,514 | | |
FXCM, Inc., Class A | | | 144,820 | | | | 2,440,217 | | |
HFF, Inc., Class A | | | 132,947 | | | | 4,241,009 | | |
Investment Technology Group, Inc.(a) | | | 145,513 | | | | 2,514,465 | | |
Piper Jaffray Companies(a) | | | 63,788 | | | | 2,672,717 | | |
Prospect Capital Corp. | | | 2 | | | | 22 | | |
Stifel Financial Corp.(a) | | | 236,465 | | | | 11,371,602 | | |
SWS Group, Inc.(a) | | | 116,514 | | | | 949,589 | | |
Virtus Investment Partners, Inc.(a) | | | 28,107 | | | | 5,204,292 | | |
Total | | | | | 49,054,433 | | |
Commercial Banks 7.3% | |
Bank of the Ozarks, Inc. | | | 129,526 | | | | 8,214,539 | | |
Banner Corp. | | | 78,243 | | | | 3,105,465 | | |
BBCN Bancorp, Inc. | | | 317,902 | | | | 5,410,692 | | |
Boston Private Financial Holdings, Inc. | | | 320,135 | | | | 4,174,560 | | |
Cardinal Financial Corp. | | | 121,455 | | | | 2,093,884 | | |
City Holding Co. | | | 63,090 | | | | 2,793,625 | | |
Columbia Banking System, Inc. | | | 205,615 | | | | 5,391,225 | | |
Community Bank System, Inc. | | | 161,850 | | | | 5,896,195 | | |
CVB Financial Corp. | | | 375,634 | | | | 5,848,621 | | |
First BanCorp(a) | | | 398,609 | | | | 2,076,753 | | |
First Commonwealth Financial Corp. | | | 383,182 | | | | 3,264,711 | | |
First Financial Bancorp | | | 231,215 | | | | 3,939,904 | | |
First Financial Bankshares, Inc. | | | 121,830 | | | | 7,368,309 | | |
First Midwest Bancorp, Inc. | | | 301,072 | | | | 5,018,870 | | |
FNB Corp. | | | 662,733 | | | | 8,078,715 | | |
Glacier Bancorp, Inc. | | | 298,067 | | | | 8,271,359 | | |
Hanmi Financial Corp. | | | 127,350 | | | | 2,983,810 | | |
Home Bancshares, Inc. | | | 190,420 | | | | 6,390,495 | | |
Independent Bank Corp. | | | 92,126 | | | | 3,389,316 | | |
The accompanying Notes to Financial Statements are an integral part of this statement.
Annual Report 2014
9
Columbia Small Cap Index Fund
Portfolio of Investments (continued)
February 28, 2014
Common Stocks (continued)
Issuer | | Shares | | Value ($) | |
MB Financial, Inc. | | | 220,430 | | | | 6,729,728 | | |
National Penn Bancshares, Inc. | | | 467,586 | | | | 5,049,929 | | |
NBT Bancorp, Inc. | | | 173,720 | | | | 4,078,946 | | |
Old National Bancorp | | | 403,826 | | | | 5,665,679 | | |
PacWest Bancorp | | | 154,629 | | | | 6,710,899 | | |
Pinnacle Financial Partners, Inc. | | | 132,503 | | | | 4,780,708 | | |
PrivateBancorp, Inc. | | | 261,733 | | | | 7,553,614 | | |
S&T Bancorp, Inc. | | | 119,267 | | | | 2,751,490 | | |
Simmons First National Corp., Class A | | | 64,982 | | | | 2,315,309 | | |
Sterling Bancorp | | | 316,170 | | | | 4,059,623 | | |
Susquehanna Bancshares, Inc. | | | 750,923 | | | | 8,215,098 | | |
Taylor Capital Group, Inc.(a) | | | 61,175 | | | | 1,443,730 | | |
Texas Capital Bancshares, Inc.(a) | | | 164,359 | | | | 10,346,399 | | |
Tompkins Financial Corp. | | | 47,193 | | | | 2,284,613 | | |
UMB Financial Corp. | | | 150,307 | | | | 9,370,138 | | |
Umpqua Holdings Corp. | | | 448,888 | | | | 7,976,740 | | |
United Bankshares, Inc. | | | 250,488 | | | | 7,371,862 | | |
United Community Banks, Inc.(a) | | | 154,895 | | | | 2,585,198 | | |
ViewPoint Financial Group, Inc. | | | 144,203 | | | | 3,605,075 | | |
Wilshire Bancorp, Inc. | | | 272,130 | | | | 2,762,119 | | |
Wintrust Financial Corp. | | | 184,851 | | | | 8,554,904 | | |
Total | | | | | 207,922,849 | | |
Consumer Finance 1.2% | |
Cash America International, Inc. | | | 112,700 | | | | 4,510,254 | | |
Encore Capital Group, Inc.(a) | | | 93,795 | | | | 4,560,313 | | |
Ezcorp, Inc., Class A(a) | | | 217,834 | | | | 2,753,422 | | |
First Cash Financial Services, Inc.(a) | | | 115,923 | | | | 6,124,212 | | |
Green Dot Corp., Class A(a) | | | 86,895 | | | | 1,750,934 | | |
Portfolio Recovery Associates, Inc.(a) | | | 199,524 | | | | 10,820,187 | | |
World Acceptance Corp.(a) | | | 43,290 | | | | 4,149,346 | | |
Total | | | | | 34,668,668 | | |
Diversified Financial Services 0.5% | |
Interactive Brokers Group, Inc., Class A | | | 200,410 | | | | 4,457,119 | | |
MarkeTaxess Holdings, Inc. | | | 150,904 | | | | 8,909,372 | | |
Total | | | | | 13,366,491 | | |
Insurance 1.9% | |
AMERISAFE, Inc. | | | 74,210 | | | | 3,231,103 | | |
eHealth, Inc.(a) | | | 74,678 | | | | 3,584,544 | | |
Employers Holdings, Inc. | | | 125,176 | | | | 2,462,212 | | |
Common Stocks (continued)
Issuer | | Shares | | Value ($) | |
HCI Group, Inc. | | | 40,570 | | | | 1,964,399 | | |
Horace Mann Educators Corp. | | | 161,727 | | | | 4,627,010 | | |
Infinity Property & Casualty Corp. | | | 46,064 | | | | 3,397,220 | | |
Meadowbrook Insurance Group, Inc. | | | 186,070 | | | | 999,196 | | |
Navigators Group, Inc. (The)(a) | | | 42,556 | | | | 2,579,745 | | |
ProAssurance Corp. | | | 247,346 | | | | 11,244,349 | | |
RLI Corp. | | | 137,626 | | | | 5,935,809 | | |
Safety Insurance Group, Inc. | | | 51,227 | | | | 2,860,003 | | |
Selective Insurance Group, Inc. | | | 223,689 | | | | 5,153,795 | | |
Stewart Information Services Corp. | | | 83,910 | | | | 3,102,992 | | |
Tower Group International Ltd. | | | 156,621 | | | | 432,274 | | |
United Fire Group, Inc. | | | 86,605 | | | | 2,509,813 | | |
Universal Insurance Holdings, Inc. | | | 116,100 | | | | 1,551,096 | | |
Total | | | | | 55,635,560 | | |
Real Estate Investment Trusts (REITs) 6.9% | |
Acadia Realty Trust | | | 222,782 | | | | 5,892,584 | | |
Agree Realty Corp. | | | 59,725 | | | | 1,835,946 | | |
American Assets Trust, Inc. | | | 137,880 | | | | 4,559,692 | | |
Associated Estates Realty Corp. | | | 230,615 | | | | 3,943,516 | | |
Capstead Mortgage Corp. | | | 384,085 | | | | 4,950,856 | | |
Cedar Realty Trust, Inc. | | | 270,006 | | | | 1,660,537 | | |
Coresite Realty Corp. | | | 85,760 | | | | 2,670,566 | | |
Cousins Properties, Inc. | | | 707,401 | | | | 8,170,481 | | |
DiamondRock Hospitality Co. | | | 783,938 | | | | 9,893,298 | | |
EastGroup Properties, Inc. | | | 122,822 | | | | 7,619,877 | | |
EPR Properties | | | 207,155 | | | | 11,033,075 | | |
Franklin Street Properties Corp. | | | 349,565 | | | | 4,376,554 | | |
Geo Group, Inc. (The) | | | 288,977 | | | | 9,313,729 | | |
Getty Realty Corp. | | | 107,151 | | | | 2,061,585 | | |
Government Properties Income Trust | | | 219,465 | | | | 5,466,873 | | |
Healthcare Realty Trust, Inc. | | | 384,502 | | | | 9,216,513 | | |
Inland Real Estate Corp. | | | 335,834 | | | | 3,596,782 | | |
Kite Realty Group Trust | | | 523,993 | | | | 3,238,277 | | |
LaSalle Hotel Properties | | | 416,947 | | | | 13,067,119 | | |
Lexington Realty Trust | | | 815,069 | | | | 9,299,937 | | |
LTC Properties, Inc. | | | 139,371 | | | | 5,251,499 | | |
Medical Properties Trust, Inc. | | | 647,989 | | | | 8,546,975 | | |
Parkway Properties, Inc. | | | 272,381 | | | | 5,019,982 | | |
Pennsylvania Real Estate Investment Trust | | | 273,524 | | | | 5,131,310 | | |
The accompanying Notes to Financial Statements are an integral part of this statement.
Annual Report 2014
10
Columbia Small Cap Index Fund
Portfolio of Investments (continued)
February 28, 2014
Common Stocks (continued)
Issuer | | Shares | | Value ($) | |
Post Properties, Inc. | | | 217,354 | | | | 10,548,190 | | |
PS Business Parks, Inc. | | | 80,160 | | | | 6,735,043 | | |
Sabra Health Care REIT, Inc. | | | 151,921 | | | | 4,325,191 | | |
Saul Centers, Inc. | | | 50,972 | | | | 2,368,669 | | |
Sovran Self Storage, Inc. | | | 128,397 | | | | 9,500,094 | | |
Tanger Factory Outlet Centers, Inc. | | | 378,909 | | | | 13,000,368 | | |
Universal Health Realty Income Trust | | | 50,946 | | | | 2,169,281 | | |
Urstadt Biddle Properties, Inc., Class A | | | 101,866 | | | | 1,997,592 | | |
Total | | | | | 196,461,991 | | |
Real Estate Management & Development 0.1% | |
Forestar Group, Inc.(a) | | | 139,356 | | | | 2,628,254 | | |
Thrifts & Mortgage Finance 0.9% | |
Bank Mutual Corp. | | | 173,176 | | | | 1,146,425 | | |
BofI Holding, Inc.(a) | | | 48,340 | | | | 4,500,454 | | |
Brookline Bancorp, Inc. | | | 281,894 | | | | 2,573,692 | | |
Dime Community Bancshares, Inc. | | | 117,424 | | | | 1,972,723 | | |
Northwest Bancshares, Inc. | | | 377,766 | | | | 5,420,942 | | |
Oritani Financial Corp. | | | 157,548 | | | | 2,467,202 | | |
Provident Financial Services, Inc. | | | 213,791 | | | | 3,967,961 | | |
TrustCo Bank Corp. | | | 378,805 | | | | 2,560,722 | | |
Total | | | | | 24,610,121 | | |
Total Financials | | | | | 584,348,367 | | |
Health Care 10.1% | |
Biotechnology 0.7% | |
Acorda Therapeutics, Inc.(a) | | | 165,535 | | | | 6,065,202 | | |
Arqule, Inc.(a) | | | 218,775 | | | | 492,244 | | |
Emergent Biosolutions, Inc.(a) | | | 115,219 | | | | 2,850,518 | | |
Ligand Pharmaceuticals, Inc.(a) | | | 81,850 | | | | 5,709,037 | | |
Momenta Pharmaceuticals, Inc.(a) | | | 184,571 | | | | 2,731,651 | | |
Spectrum Pharmaceuticals, Inc.(a) | | | 215,205 | | | | 1,796,962 | | |
Total | | | | | 19,645,614 | | |
Health Care Equipment & Supplies 3.2% | |
Abaxis, Inc.(a) | | | 83,959 | | | | 3,186,244 | | |
ABIOMED, Inc.(a) | | | 140,824 | | | | 3,969,829 | | |
Analogic Corp. | | | 49,820 | | | | 4,696,033 | | |
Anika Therapeutics, Inc.(a) | | | 45,470 | | | | 1,790,154 | | |
Cantel Medical Corp. | | | 133,635 | | | | 4,323,092 | | |
CONMED Corp. | | | 110,748 | | | | 5,163,072 | | |
CryoLife, Inc. | | | 99,660 | | | | 992,614 | | |
Common Stocks (continued)
Issuer | | Shares | | Value ($) | |
Cyberonics, Inc.(a) | | | 98,683 | | | | 6,756,825 | | |
Cynosure Inc., Class A(a) | | | 78,136 | | | | 2,405,026 | | |
Greatbatch, Inc.(a) | | | 96,802 | | | | 4,194,431 | | |
Haemonetics Corp.(a) | | | 206,657 | | | | 7,538,847 | | |
ICU Medical, Inc.(a) | | | 52,599 | | | | 3,043,378 | | |
Integra LifeSciences Holdings Corp.(a) | | | 94,089 | | | | 4,425,946 | | |
Invacare Corp. | | | 115,532 | | | | 2,289,844 | | |
Meridian Bioscience, Inc. | | | 166,510 | | | | 3,473,399 | | |
Merit Medical Systems, Inc.(a) | | | 162,858 | | | | 2,457,527 | | |
Natus Medical, Inc.(a) | | | 111,760 | | | | 2,805,176 | | |
Neogen Corp.(a) | | | 146,179 | | | | 6,332,474 | | |
NuVasive, Inc.(a) | | | 178,941 | | | | 6,576,082 | | |
SurModics, Inc.(a) | | | 54,139 | | | | 1,348,061 | | |
Symmetry Medical, Inc.(a) | | | 149,405 | | | | 1,580,705 | | |
West Pharmaceutical Services, Inc. | | | 280,072 | | | | 12,765,682 | | |
Total | | | | | 92,114,441 | | |
Health Care Providers & Services 3.1% | |
Air Methods Corp.(a) | | | 140,910 | | | | 7,611,958 | | |
Almost Family, Inc.(a) | | | 33,584 | | | | 920,873 | | |
Amedisys, Inc.(a) | | | 130,184 | | | | 2,207,921 | | |
AMN Healthcare Services, Inc.(a) | | | 184,520 | | | | 2,570,364 | | |
Amsurg Corp.(a) | | | 129,249 | | | | 5,668,861 | | |
Bio-Reference Labs, Inc.(a) | | | 98,770 | | | | 2,494,930 | | |
Centene Corp.(a) | | | 219,654 | | | | 13,987,567 | | |
Chemed Corp. | | | 70,718 | | | | 5,982,743 | | |
Corvel Corp.(a) | | | 45,338 | | | | 2,086,001 | | |
Cross Country Healthcare, Inc.(a) | | | 108,461 | | | | 1,127,994 | | |
Ensign Group, Inc. (The) | | | 78,544 | | | | 3,110,342 | | |
Gentiva Health Services, Inc.(a) | | | 114,897 | | | | 1,230,547 | | |
Hanger, Inc.(a) | | | 139,434 | | | | 4,942,935 | | |
Healthways, Inc.(a) | | | 140,611 | | | | 2,103,540 | | |
IPC The Hospitalist Co., Inc.(a) | | | 67,881 | | | | 3,484,332 | | |
Kindred Healthcare, Inc. | | | 217,318 | | | | 4,707,108 | | |
Landauer, Inc. | | | 38,206 | | | | 1,851,463 | | |
LHC Group, Inc.(a) | | | 48,710 | | | | 1,147,608 | | |
Magellan Health Services, Inc.(a) | | | 108,556 | | | | 6,637,114 | | |
Molina Healthcare, Inc.(a) | | | 113,779 | | | | 4,287,193 | | |
MWI Veterinary Supply, Inc.(a) | | | 51,535 | | | | 8,396,082 | | |
PharMerica Corp.(a) | | | 118,029 | | | | 2,844,499 | | |
Total | | | | | 89,401,975 | | |
The accompanying Notes to Financial Statements are an integral part of this statement.
Annual Report 2014
11
Columbia Small Cap Index Fund
Portfolio of Investments (continued)
February 28, 2014
Common Stocks (continued)
Issuer | | Shares | | Value ($) | |
Health Care Technology 0.9% | |
Computer Programs & Systems, Inc. | | | 42,071 | | | | 2,878,919 | | |
HealthStream, Inc.(a) | | | 81,989 | | | | 2,362,923 | | |
Medidata Solutions, Inc.(a) | | | 201,742 | | | | 12,931,662 | | |
Omnicell, Inc.(a) | | | 142,835 | | | | 4,110,791 | | |
Quality Systems, Inc. | | | 176,023 | | | | 3,073,362 | | |
Total | | | | | 25,357,657 | | |
Life Sciences Tools & Services 0.7% | |
Affymetrix, Inc.(a) | | | 288,421 | | | | 2,226,610 | | |
Cambrex Corp.(a) | | | 121,303 | | | | 2,434,551 | | |
Luminex Corp.(a) | | | 149,444 | | | | 2,761,725 | | |
PAREXEL International Corp.(a) | | | 226,618 | | | | 12,139,927 | | |
Total | | | | | 19,562,813 | | |
Pharmaceuticals 1.5% | |
Akorn, Inc.(a) | | | 285,964 | | | | 7,383,590 | | |
Hi-Tech Pharmacal Co., Inc.(a) | | | 44,239 | | | | 1,918,203 | | |
Impax Laboratories, Inc.(a) | | | 259,430 | | | | 6,685,511 | | |
Medicines Co. (The)(a) | | | 256,357 | | | | 7,831,706 | | |
Prestige Brands Holdings, Inc.(a) | | | 207,398 | | | | 5,908,769 | | |
Questcor Pharmaceuticals, Inc. | | | 224,214 | | | | 13,621,001 | | |
Total | | | | | 43,348,780 | | |
Total Health Care | | | | | 289,431,280 | | |
Industrials 14.4% | |
Aerospace & Defense 2.5% | |
AAR Corp. | | | 158,743 | | | | 4,587,673 | | |
Aerovironment, Inc.(a) | | | 79,229 | | | | 2,475,114 | | |
American Science & Engineering, Inc. | | | 31,476 | | | | 2,069,547 | | |
Cubic Corp. | | | 83,787 | | | | 4,356,924 | | |
Curtiss-Wright Corp. | | | 189,967 | | | | 12,948,151 | | |
Engility Holdings, Inc.(a) | | | 69,106 | | | | 2,883,793 | | |
GenCorp, Inc.(a) | | | 245,037 | | | | 4,565,039 | | |
Moog, Inc., Class A(a) | | | 181,944 | | | | 11,267,792 | | |
National Presto Industries, Inc. | | | 19,647 | | | | 1,513,605 | | |
Orbital Sciences Corp.(a) | | | 242,462 | | | | 6,890,770 | | |
Taser International, Inc.(a) | | | 207,790 | | | | 3,995,802 | | |
Teledyne Technologies, Inc.(a) | | | 150,470 | | | | 14,743,050 | | |
Total | | | | | 72,297,260 | | |
Common Stocks (continued)
Issuer | | Shares | | Value ($) | |
Air Freight & Logistics 0.5% | |
Atlas Air Worldwide Holdings, Inc.(a) | | | 100,415 | | | | 3,025,504 | | |
Forward Air Corp. | | | 122,789 | | | | 5,311,852 | | |
HUB Group, Inc., Class A(a) | | | 140,397 | | | | 5,485,311 | | |
Total | | | | | 13,822,667 | | |
Airlines 0.3% | |
Allegiant Travel Co. | | | 58,862 | | | | 5,842,642 | | |
Skywest, Inc. | | | 205,449 | | | | 2,609,203 | | |
Total | | | | | 8,451,845 | | |
Building Products 0.9% | |
AAON, Inc. | | | 112,003 | | | | 3,346,650 | | |
American Woodmark Corp.(a) | | | 48,150 | | | | 1,546,096 | | |
Apogee Enterprises, Inc. | | | 115,450 | | | | 3,951,853 | | |
Gibraltar Industries, Inc.(a) | | | 115,727 | | | | 2,132,849 | | |
Griffon Corp. | | | 175,635 | | | | 2,177,874 | | |
Quanex Building Products Corp. | | | 148,654 | | | | 2,889,834 | | |
Simpson Manufacturing Co., Inc. | | | 163,026 | | | | 5,762,969 | | |
Universal Forest Products, Inc. | | | 79,810 | | | | 4,447,811 | | |
Total | | | | | 26,255,936 | | |
Commercial Services & Supplies 1.9% | |
ABM Industries, Inc. | | | 205,638 | | | | 5,805,161 | | |
G&K Services, Inc., Class A | | | 79,449 | | | | 4,975,891 | | |
Healthcare Services Group, Inc. | | | 279,956 | | | | 7,539,215 | | |
Interface, Inc. | | | 233,939 | | | | 4,505,665 | | |
Mobile Mini, Inc.(a) | | | 163,369 | | | | 7,353,239 | | |
Tetra Tech, Inc.(a) | | | 257,324 | | | | 7,431,517 | | |
Unifirst Corp. | | | 60,972 | | | | 6,688,019 | | |
United Stationers, Inc. | | | 160,104 | | | | 6,825,233 | | |
Viad Corp. | | | 81,532 | | | | 1,960,845 | | |
Total | | | | | 53,084,785 | | |
Construction & Engineering 0.8% | |
Aegion Corp.(a) | | | 153,898 | | | | 3,562,739 | | |
Comfort Systems U.S.A., Inc. | | | 149,813 | | | | 2,461,427 | | |
Dycom Industries, Inc.(a) | | | 135,374 | | | | 3,910,955 | | |
EMCOR Group, Inc. | | | 269,229 | | | | 12,594,532 | | |
Orion Marine Group, Inc.(a) | | | 109,678 | | | | 1,238,265 | | |
Total | | | | | 23,767,918 | | |
Electrical Equipment 1.4% | |
AZZ, Inc. | | | 102,265 | | | | 4,537,498 | | |
Brady Corp., Class A | | | 188,226 | | | | 5,035,046 | | |
The accompanying Notes to Financial Statements are an integral part of this statement.
Annual Report 2014
12
Columbia Small Cap Index Fund
Portfolio of Investments (continued)
February 28, 2014
Common Stocks (continued)
Issuer | | Shares | | Value ($) | |
Encore Wire Corp. | | | 74,684 | | | | 3,905,226 | | |
EnerSys, Inc. | | | 190,104 | | | | 13,504,988 | | |
Franklin Electric Co., Inc. | | | 156,686 | | | | 6,829,943 | | |
II-VI, Inc.(a) | | | 218,253 | | | | 3,577,167 | | |
Powell Industries, Inc. | | | 36,965 | | | | 2,518,425 | | |
Vicor Corp.(a) | | | 72,639 | | | | 782,322 | | |
Total | | | | | 40,690,615 | | |
Machinery 3.4% | |
Actuant Corp., Class A | | | 292,934 | | | | 10,270,266 | | |
Albany International Corp., Class A | | | 113,152 | | | | 4,082,524 | | |
Astec Industries, Inc. | | | 75,157 | | | | 3,022,815 | | |
Barnes Group, Inc. | | | 184,060 | | | | 7,077,107 | | |
Briggs & Stratton Corp. | | | 190,274 | | | | 4,334,442 | | |
CIRCOR International, Inc. | | | 70,552 | | | | 5,048,701 | | |
EnPro Industries, Inc.(a) | | | 84,023 | | | | 6,018,567 | | |
ESCO Technologies, Inc. | | | 106,242 | | | | 3,807,713 | | |
Federal Signal Corp.(a) | | | 251,356 | | | | 3,229,925 | | |
John Bean Technologies Corp. | | | 109,168 | | | | 3,292,507 | | |
Lindsay Corp. | | | 51,628 | | | | 4,381,152 | | |
Lydall, Inc.(a) | | | 67,338 | | | | 1,364,268 | | |
Mueller Industries, Inc. | | | 113,395 | | | | 7,084,920 | | |
Standex International Corp. | | | 51,208 | | | | 2,832,314 | | |
Tennant Co. | | | 74,080 | | | | 4,538,141 | | |
Titan International, Inc. | | | 214,760 | | | | 4,071,850 | | |
Toro Co. (The) | | | 229,229 | | | | 15,181,837 | | |
Watts Water Technologies, Inc., Class A | | | 114,675 | | | | 7,066,273 | | |
Total | | | | | 96,705,322 | | |
Professional Services 1.4% | |
CDI Corp. | | | 57,844 | | | | 1,056,810 | | |
Exponent, Inc. | | | 52,545 | | | | 3,743,306 | | |
Heidrick & Struggles International, Inc. | | | 64,652 | | | | 1,188,950 | | |
Insperity, Inc. | | | 91,272 | | | | 2,664,230 | | |
Kelly Services, Inc., Class A | | | 109,359 | | | | 2,751,472 | | |
Korn/Ferry International(a) | | | 198,407 | | | | 5,037,554 | | |
Navigant Consulting, Inc.(a) | | | 198,412 | | | | 3,458,321 | | |
On Assignment, Inc.(a) | | | 185,692 | | | | 6,387,805 | | |
Resources Connection, Inc. | | | 159,317 | | | | 2,182,643 | | |
TrueBlue, Inc.(a) | | | 164,641 | | | | 4,688,975 | | |
Wageworks, Inc.(a) | | | 119,320 | | | | 7,057,778 | | |
Total | | | | | 40,217,844 | | |
Common Stocks (continued)
Issuer | | Shares | | Value ($) | |
Road & Rail 0.7% | |
Arkansas Best Corp. | | | 96,995 | | | | 3,226,054 | | |
Heartland Express, Inc. | | | 193,936 | | | | 3,952,416 | | |
Knight Transportation, Inc. | | | 240,879 | | | | 5,174,081 | | |
Roadrunner Transportation Systems, Inc.(a) | | | 100,750 | | | | 2,368,632 | | |
Saia, Inc.(a) | | | 97,960 | | | | 3,383,538 | | |
Total | | | | | 18,104,721 | | |
Trading Companies & Distributors 0.6% | |
Applied Industrial Technologies, Inc. | | | 169,101 | | | | 8,629,224 | | |
DXP Enterprises, Inc.(a) | | | 41,640 | | | | 4,237,286 | | |
Kaman Corp. | | | 108,761 | | | | 4,319,987 | | |
Total | | | | | 17,186,497 | | |
Total Industrials | | | | | 410,585,410 | | |
Information Technology 18.5% | |
Communications Equipment 1.7% | |
Arris Group, Inc.(a) | | | 460,384 | | | | 13,213,021 | | |
Bel Fuse, Inc., Class B | | | 39,770 | | | | 755,630 | | |
Black Box Corp. | | | 63,753 | | | | 1,695,830 | | |
CalAmp Corp.(a) | | | 133,675 | | | | 4,282,947 | | |
Comtech Telecommunications Corp. | | | 64,437 | | | | 2,062,628 | | |
Digi International, Inc.(a) | | | 103,257 | | | | 986,104 | | |
Harmonic, Inc.(a) | | | 404,296 | | | | 2,623,881 | | |
Ixia(a) | | | 226,011 | | | | 2,793,496 | | |
NETGEAR, Inc.(a) | | | 155,445 | | | | 5,313,110 | | |
Oplink Communications, Inc.(a) | | | 72,089 | | | | 1,262,999 | | |
PC-Tel, Inc. | | | 69,855 | | | | 607,739 | | |
Procera Networks, Inc.(a) | | | 82,725 | | | | 912,457 | | |
Viasat, Inc.(a) | | | 168,185 | | | | 11,219,621 | | |
Total | | | | | 47,729,463 | | |
Computers & Peripherals 0.6% | |
Electronics for Imaging, Inc.(a) | | | 188,658 | | | | 8,414,147 | | |
Intevac, Inc.(a) | | | 96,281 | | | | 724,996 | | |
QLogic Corp.(a) | | | 347,890 | | | | 3,972,904 | | |
Super Micro Computer, Inc.(a) | | | 130,332 | | | | 2,631,403 | | |
Total | | | | | 15,743,450 | | |
Electronic Equipment, Instruments & Components 5.3% | |
Agilysys, Inc.(a) | | | 56,664 | | | | 822,761 | | |
Anixter International, Inc. | | | 107,011 | | | | 11,444,827 | | |
Badger Meter, Inc. | | | 57,658 | | | | 3,166,577 | | |
The accompanying Notes to Financial Statements are an integral part of this statement.
Annual Report 2014
13
Columbia Small Cap Index Fund
Portfolio of Investments (continued)
February 28, 2014
Common Stocks (continued)
Issuer | | Shares | | Value ($) | |
Belden, Inc. | | | 174,271 | | | | 12,570,167 | | |
Benchmark Electronics, Inc.(a) | | | 216,601 | | | | 5,163,768 | | |
Checkpoint Systems, Inc.(a) | | | 166,183 | | | | 2,434,581 | | |
Cognex Corp.(a) | | | 332,540 | | | | 12,523,456 | | |
Coherent, Inc.(a) | | | 99,529 | | | | 6,782,901 | | |
CTS Corp. | | | 135,117 | | | | 2,759,089 | | |
Daktronics, Inc. | | | 153,253 | | | | 2,171,595 | | |
DTS, Inc.(a) | | | 72,128 | | | | 1,464,920 | | |
Electro Scientific Industries, Inc. | | | 102,333 | | | | 965,000 | | |
FARO Technologies, Inc.(a) | | | 68,636 | | | | 3,949,315 | | |
FEI Co. | | | 167,464 | | | | 17,190,180 | | |
Insight Enterprises, Inc.(a) | | | 169,794 | | | | 3,901,866 | | |
Littelfuse, Inc. | | | 89,847 | | | | 8,478,861 | | |
Measurement Specialties, Inc.(a) | | | 60,453 | | | | 3,687,633 | | |
Mercury Systems, Inc.(a) | | | 133,509 | | | | 1,481,950 | | |
Methode Electronics, Inc. | | | 142,421 | | | | 4,828,072 | | |
MTS Systems Corp. | | | 61,591 | | | | 4,370,497 | | |
Newport Corp.(a) | | | 156,991 | | | | 3,249,714 | | |
OSI Systems, Inc.(a) | | | 75,597 | | | | 4,646,948 | | |
Park Electrochemical Corp. | | | 83,627 | | | | 2,382,533 | | |
Plexus Corp.(a) | | | 135,544 | | | | 5,577,636 | | |
Rofin-Sinar Technologies, Inc.(a) | | | 112,859 | | | | 2,648,801 | | |
Rogers Corp.(a) | | | 71,066 | | | | 4,597,970 | | |
Sanmina Corp.(a) | | | 337,770 | | | | 5,728,579 | | |
Scansource, Inc.(a) | | | 112,845 | | | | 4,430,295 | | |
SYNNEX Corp.(a) | | | 105,595 | | | | 6,280,791 | | |
TTM Technologies, Inc.(a) | | | 218,763 | | | | 1,837,609 | | |
Total | | | | | 151,538,892 | | |
Internet Software & Services 2.1% | |
Blucora, Inc.(a) | | | 165,219 | | | | 3,178,813 | | |
comScore, Inc.(a) | | | 133,123 | | | | 4,209,349 | | |
Dealertrack Technologies, Inc.(a) | | | 176,041 | | | | 9,518,537 | | |
Dice Holdings, Inc.(a) | | | 153,615 | | | | 1,130,606 | | |
Digital River, Inc.(a) | | | 113,967 | | | | 2,025,194 | | |
j2 Global, Inc. | | | 175,780 | | | | 9,035,092 | | |
Liquidity Services, Inc.(a) | | | 103,120 | | | | 2,641,934 | | |
LivePerson, Inc.(a) | | | 197,562 | | | | 2,584,111 | | |
LogMeIn, Inc.(a) | | | 91,314 | | | | 3,821,491 | | |
Monster Worldwide, Inc.(a) | | | 385,600 | | | | 3,073,232 | | |
Common Stocks (continued)
Issuer | | Shares | | Value ($) | |
NIC, Inc. | | | 239,795 | | | | 4,661,615 | | |
OpenTable, Inc.(a) | | | 93,332 | | | | 7,437,627 | | |
Perficient, Inc.(a) | | | 132,463 | | | | 2,703,570 | | |
QuinStreet, Inc.(a) | | | 114,859 | | | | 756,921 | | |
Stamps.com, Inc.(a) | | | 58,760 | | | | 2,067,177 | | |
XO Group, Inc.(a) | | | 99,587 | | | | 1,189,069 | | |
Total | | | | | 60,034,338 | | |
IT Services 2.0% | |
CACI International, Inc., Class A(a) | | | 93,949 | | | | 7,406,000 | | |
Cardtronics, Inc.(a) | | | 180,488 | | | | 7,313,374 | | |
Ciber, Inc.(a) | | | 269,299 | | | | 1,287,249 | | |
CSG Systems International, Inc. | | | 135,727 | | | | 3,800,356 | | |
ExlService Holdings, Inc.(a) | | | 124,160 | | | | 3,475,238 | | |
Forrester Research, Inc. | | | 50,700 | | | | 1,836,354 | | |
Heartland Payment Systems, Inc. | | | 147,890 | | | | 5,980,671 | | |
Higher One Holdings, Inc.(a) | | | 130,133 | | | | 1,041,064 | | |
iGATE Corp.(a) | | | 116,932 | | | | 3,958,148 | | |
MAXIMUS, Inc. | | | 274,873 | | | | 13,136,181 | | |
Sykes Enterprises, Inc.(a) | | | 156,973 | | | | 3,089,229 | | |
TeleTech Holdings, Inc.(a) | | | 76,845 | | | | 1,850,428 | | |
Virtusa Corp.(a) | | | 102,708 | | | | 3,735,490 | | |
Total | | | | | 57,909,782 | | |
Semiconductors & Semiconductor Equipment 4.1% | |
Advanced Energy Industries, Inc.(a) | | | 147,523 | | | | 4,048,031 | | |
ATMI, Inc.(a) | | | 127,700 | | | | 4,343,077 | | |
Brooks Automation, Inc. | | | 267,009 | | | | 2,768,883 | | |
Cabot Microelectronics Corp.(a) | | | 94,587 | | | | 4,177,908 | | |
Ceva, Inc.(a) | | | 88,165 | | | | 1,594,023 | | |
Cirrus Logic, Inc.(a) | | | 254,660 | | | | 4,902,205 | | |
Cohu, Inc. | | | 93,026 | | | | 938,632 | | |
Diodes, Inc.(a) | | | 145,957 | | | | 3,475,236 | | |
DSP Group, Inc.(a) | | | 90,483 | | | | 765,486 | | |
Entropic Communications, Inc.(a) | | | 365,997 | | | | 1,603,067 | | |
Exar Corp.(a) | | | 190,532 | | | | 2,181,591 | | |
GT Advanced Technologies, Inc.(a) | | | 531,307 | | | | 7,613,629 | | |
Hittite Microwave Corp. | | | 126,422 | | | | 7,456,370 | | |
Kopin Corp.(a) | | | 245,069 | | | | 977,825 | | |
Kulicke & Soffa Industries, Inc.(a) | | | 304,675 | | | | 3,515,950 | | |
Micrel, Inc. | | | 182,958 | | | | 1,910,082 | | |
The accompanying Notes to Financial Statements are an integral part of this statement.
Annual Report 2014
14
Columbia Small Cap Index Fund
Portfolio of Investments (continued)
February 28, 2014
Common Stocks (continued)
Issuer | | Shares | | Value ($) | |
Microsemi Corp.(a) | | | 376,858 | | | | 8,690,345 | | |
MKS Instruments, Inc. | | | 213,476 | | | | 6,417,089 | | |
Monolithic Power Systems, Inc.(a) | | | 139,438 | | | | 4,997,458 | | |
Nanometrics, Inc.(a) | | | 88,960 | | | | 1,633,306 | | |
Pericom Semiconductor Corp.(a) | | | 83,089 | | | | 672,190 | | |
Power Integrations, Inc. | | | 120,024 | | | | 7,097,019 | | |
Rubicon Technology, Inc.(a) | | | 79,171 | | | | 1,022,098 | | |
Rudolph Technologies, Inc.(a) | | | 132,115 | | | | 1,515,359 | | |
Sigma Designs, Inc.(a) | | | 124,775 | | | | 611,398 | | |
Supertex, Inc.(a) | | | 41,212 | | | | 1,357,111 | | |
Synaptics, Inc.(a) | | | 142,009 | | | | 9,236,265 | | |
Tessera Technologies, Inc. | | | 196,114 | | | | 4,259,596 | | |
TriQuint Semiconductor, Inc.(a) | | | 644,114 | | | | 7,883,955 | | |
Ultratech, Inc.(a) | | | 111,604 | | | | 2,926,257 | | |
Veeco Instruments, Inc.(a) | | | 157,395 | | | | 6,224,972 | | |
Total | | | | | 116,816,413 | | |
Software 2.7% | |
Blackbaud, Inc. | | | 183,620 | | | | 5,750,978 | | |
Bottomline Technologies de, Inc.(a) | | | 147,552 | | | | 5,266,131 | | |
Ebix, Inc. | | | 127,978 | | | | 2,079,643 | | |
EPIQ Systems, Inc. | | | 121,285 | | | | 1,719,821 | | |
Interactive Intelligence Group, Inc.(a) | | | 63,265 | | | | 5,037,792 | | |
Manhattan Associates, Inc.(a) | | | 308,118 | | | | 11,674,591 | | |
MicroStrategy, Inc., Class A(a) | | | 36,259 | | | | 4,682,125 | | |
Monotype Imaging Holdings, Inc. | | | 156,481 | | | | 4,450,320 | | |
Netscout Systems, Inc.(a) | | | 149,904 | | | | 5,693,354 | | |
Progress Software Corp.(a) | | | 208,213 | | | | 5,192,832 | | |
Synchronoss Technologies, Inc.(a) | | | 121,898 | | | | 4,190,853 | | |
Take-Two Interactive Software, Inc.(a) | | | 369,958 | | | | 7,314,070 | | |
Tangoe, Inc.(a) | | | 136,510 | | | | 2,596,420 | | |
Tyler Technologies, Inc.(a) | | | 113,797 | | | | 10,671,883 | | |
VASCO Data Security International, Inc.(a) | | | 117,133 | | | | 934,721 | | |
Total | | | | | 77,255,534 | | |
Total Information Technology | | | | | 527,027,872 | | |
Materials 6.4% | |
Chemicals 2.8% | |
A. Schulman, Inc. | | | 116,793 | | | | 4,058,557 | | |
American Vanguard Corp. | | | 100,001 | | | | 2,225,022 | | |
Common Stocks (continued)
Issuer | | Shares | | Value ($) | |
Balchem Corp. | | | 120,892 | | | | 6,106,255 | | |
Calgon Carbon Corp.(a) | | | 218,996 | | | | 4,408,389 | | |
Flotek Industries, Inc.(a) | | | 182,265 | | | | 4,638,644 | | |
FutureFuel Corp. | | | 90,390 | | | | 1,568,267 | | |
H.B. Fuller Co. | | | 201,583 | | | | 9,772,744 | | |
Hawkins, Inc. | | | 37,857 | | | | 1,348,845 | | |
Innophos Holdings, Inc. | | | 88,160 | | | | 4,841,747 | | |
Koppers Holdings, Inc. | | | 81,542 | | | | 3,224,171 | | |
Kraton Performance Polymers, Inc.(a) | | | 130,455 | | | | 3,618,822 | | |
LSB Industries, Inc.(a) | | | 76,765 | | | | 2,509,448 | | |
OM Group, Inc. | | | 128,263 | | | | 4,053,111 | | |
PolyOne Corp. | | | 385,977 | | | | 14,474,137 | | |
Quaker Chemical Corp. | | | 52,883 | | | | 4,086,798 | | |
Stepan Co. | | | 76,079 | | | | 4,625,603 | | |
Tredegar Corp. | | | 100,988 | | | | 2,515,611 | | |
Zep, Inc. | | | 91,510 | | | | 1,610,576 | | |
Total | | | | | 79,686,747 | | |
Construction Materials 0.4% | |
Headwaters, Inc.(a) | | | 293,273 | | | | 3,909,329 | | |
Texas Industries, Inc.(a) | | | 86,068 | | | | 7,307,173 | | |
Total | | | | | 11,216,502 | | |
Containers & Packaging 0.1% | |
Myers Industries, Inc. | | | 107,299 | | | | 2,306,929 | | |
Metals & Mining 1.7% | |
AK Steel Holding Corp.(a) | | | 546,795 | | | | 3,395,597 | | |
AM Castle & Co.(a) | | | 68,376 | | | | 999,657 | | |
AMCOL International Corp. | | | 100,185 | | | | 4,446,210 | | |
Century Aluminum Co.(a) | | | 206,284 | | | | 2,442,403 | | |
Globe Specialty Metals, Inc. | | | 259,753 | | | | 5,161,292 | | |
Haynes International, Inc. | | | 49,464 | | | | 2,449,952 | | |
Kaiser Aluminum Corp. | | | 75,249 | | | | 5,311,827 | | |
Materion Corp. | | | 82,699 | | | | 2,447,063 | | |
Olympic Steel, Inc. | | | 36,494 | | | | 1,003,950 | | |
RTI International Metals, Inc.(a) | | | 122,548 | | | | 3,329,629 | | |
Stillwater Mining Co.(a) | | | 478,533 | | | | 6,479,337 | | |
SunCoke Energy, Inc.(a) | | | 279,047 | | | | 6,217,167 | | |
US Silica Holdings, Inc. | | | 213,840 | | | | 7,013,952 | | |
Total | | | | | 50,698,036 | | |
The accompanying Notes to Financial Statements are an integral part of this statement.
Annual Report 2014
15
Columbia Small Cap Index Fund
Portfolio of Investments (continued)
February 28, 2014
Common Stocks (continued)
Issuer | | Shares | | Value ($) | |
Paper & Forest Products 1.4% | |
Boise Cascade Co.(a) | | | 126,300 | | | | 3,737,217 | | |
Clearwater Paper Corp.(a) | | | 84,461 | | | | 5,392,835 | | |
Deltic Timber Corp. | | | 44,750 | | | | 2,816,565 | | |
KapStone Paper and Packaging Corp.(a) | | | 321,678 | | | | 10,226,144 | | |
Neenah Paper, Inc. | | | 64,975 | | | | 3,262,395 | | |
PH Glatfelter Co. | | | 173,549 | | | | 5,267,212 | | |
Schweitzer-Mauduit International, Inc. | | | 125,927 | | | | 6,060,866 | | |
Wausau Paper Corp. | | | 198,300 | | | | 2,627,475 | | |
Total | | | | | 39,390,709 | | |
Total Materials | | | | | 183,298,923 | | |
Telecommunication Services 0.5% | |
Diversified Telecommunication Services 0.4% | |
8x8, Inc.(a) | | | 320,600 | | | | 3,391,948 | | |
Atlantic Tele-Network, Inc. | | | 39,814 | | | | 2,609,409 | | |
Cbeyond, Inc.(a) | | | 112,627 | | | | 771,495 | | |
Cincinnati Bell, Inc.(a) | | | 834,334 | | | | 2,795,019 | | |
General Communication, Inc., Class A(a) | | | 123,322 | | | | 1,283,782 | | |
Lumos Networks Corp. | | | 71,544 | | | | 1,038,819 | | |
Total | | | | | 11,890,472 | | |
Wireless Telecommunication Services 0.1% | |
NTELOS Holdings Corp. | | | 61,239 | | | | 856,121 | | |
U.S.A. Mobility, Inc. | | | 86,839 | | | | 1,254,824 | | |
Total | | | | | 2,110,945 | | |
Total Telecommunication Services | | | | | 14,001,417 | | |
Utilities 3.4% | |
Electric Utilities 1.1% | |
Allete, Inc. | | | 148,671 | | | | 7,509,372 | | |
El Paso Electric Co. | | | 161,935 | | | | 5,708,209 | | |
UIL Holdings Corp. | | | 226,447 | | | | 8,768,028 | | |
UNS Energy Corp. | | | 166,588 | | | | 10,080,240 | | |
Total | | | | | 32,065,849 | | |
Gas Utilities 1.6% | |
Laclede Group, Inc. (The) | | | 121,997 | | | | 5,593,562 | | |
New Jersey Resources Corp. | | | 168,543 | | | | 7,586,120 | | |
Common Stocks (continued)
Issuer | | Shares | | Value ($) | |
Northwest Natural Gas Co. | | | 108,295 | | | | 4,642,607 | | |
Piedmont Natural Gas Co., Inc. | | | 304,513 | | | | 10,298,630 | | |
South Jersey Industries, Inc. | | | 129,168 | | | | 7,385,826 | | |
Southwest Gas Corp. | | | 185,887 | | | | 10,041,616 | | |
Total | | | | | 45,548,361 | | |
Multi-Utilities 0.5% | |
Avista Corp. | | | 240,774 | | | | 7,126,911 | | |
NorthWestern Corp. | | | 154,252 | | | | 7,086,337 | | |
Total | | | | | 14,213,248 | | |
Water Utilities 0.2% | |
American States Water Co. | | | 155,274 | | | | 4,662,878 | | |
Total Utilities | | | | | 96,490,336 | | |
Total Common Stocks
(Cost: $1,669,369,569) | | | | | 2,759,605,973 | | |
Rights —%
Information Technology —% | |
Electronic Equipment, Instruments & Components —% | |
Gerber Scientific, Inc.(a)(b)(c)(d) | | | 112,391 | | | | — | | |
Total Information Technology | | | | | — | | |
Total Rights
(Cost: $—) | | | | | — | | |
Money Market Funds 2.4%
| | | Shares | | Value ($) | |
Columbia Short-Term Cash Fund,
0.098%(e)(f) | | | 69,671,430 | | | | 69,671,430 | | |
Total Money Market Funds
(Cost: $69,671,430) | | | | | 69,671,430 | | |
Total Investments
(Cost: $1,739,040,999) | | | | | 2,829,277,403 | | |
Other Assets & Liabilities, Net | | | | | 23,364,222 | | |
Net Assets | | | | | 2,852,641,625 | | |
The accompanying Notes to Financial Statements are an integral part of this statement.
Annual Report 2014
16
Columbia Small Cap Index Fund
Portfolio of Investments (continued)
February 28, 2014
Investments in Derivatives
Futures Contracts Outstanding at February 28, 2014
At February 28, 2014, cash totaling $2,999,200 was pledged as collateral to cover initial margin requirements on open futures contracts.
Contract Description | | Number of
Contracts
Long (Short) | | Trading
Currency | | Notional
Market
Value ($) | | Expiration
Date | | Unrealized
Appreciation ($) | | Unrealized
Depreciation ($) | |
Russell 2000 EMINI | | | 774 | | | USD | | | | | 91,479,060 | | | 03/2014 | | | 4,857,016 | | | | — | | |
Notes to Portfolio of Investments
(a) Non-income producing.
(b) Negligible market value.
(c) Identifies issues considered by the Investment Manager to be illiquid as to their marketability. The aggregate value of such securities at February 28, 2014 was $0, representing 0.00% of net assets. Information concerning such security holdings at February 28, 2014 is as follows:
Security Description | | Acquisition Dates | | Cost ($) | |
Gerber Scientific, Inc. | | 08/22/11 | | | — | | |
(d) Represents fair value as determined in good faith under procedures approved by the Board of Trustees. At February 28, 2014, the value of these securities amounted to $0, which represents 0.00% of net assets.
(e) The rate shown is the seven-day current annualized yield at February 28, 2014.
(f) As defined in the Investment Company Act of 1940, an affiliated company is one in which the Fund owns 5% or more of its outstanding voting securities, or a company which is under common ownership or control with the Fund. Holdings and transactions in these affiliated companies during the year ended February 28, 2014, are as follows:
Issuer | | Beginning
Cost ($) | | Purchase
Cost ($) | | Proceeds
From Sales ($) | | Ending
Cost ($) | | Dividends —
Affiliated
Issuers ($) | | Value ($) | |
Columbia Short-Term Cash Fund | | | 53,859,530 | | | | 514,268,094 | | | | (498,456,194 | ) | | | 69,671,430 | | | | 74,598 | | | | 69,671,430 | | |
Currency Legend
USD US Dollar
Fair Value Measurements
Generally accepted accounting principles (GAAP) require disclosure regarding the inputs and valuation techniques used to measure fair value and any changes in valuation inputs or techniques. In addition, investments shall be disclosed by major category.
The Fund categorizes its fair value measurements according to a three-level hierarchy that maximizes the use of observable inputs and minimizes the use of unobservable inputs by prioritizing that the most observable input be used when available. Observable inputs are those that market participants would use in pricing an investment based on market data obtained from sources independent of the reporting entity. Unobservable inputs are those that reflect the Fund's assumptions about the information market participants would use in pricing an investment. An investment's level within the fair value hierarchy is based on the lowest level of any input that is deemed significant to the asset or liability's fair value measurement. The input levels are not necessarily an indication of the risk or liquidity associated with investments at that level. For example, certain U.S. government securities are generally high quality and liquid, however, they are reflected as Level 2 because the inputs used to determine fair value may not always be quoted prices in an active market.
The accompanying Notes to Financial Statements are an integral part of this statement.
Annual Report 2014
17
Columbia Small Cap Index Fund
Portfolio of Investments (continued)
February 28, 2014
Fair Value Measurements (continued)
Fair value inputs are summarized in the three broad levels listed below:
> Level 1 — Valuations based on quoted prices for investments in active markets that the Fund has the ability to access at the measurement date (including NAV for open-end mutual funds). Valuation adjustments are not applied to Level 1 investments.
> Level 2 — Valuations based on other significant observable inputs (including quoted prices for similar securities, interest rates, prepayment speeds, credit risks, etc.).
> Level 3 — Valuations based on significant unobservable inputs (including the Fund's own assumptions and judgment in determining the fair value of investments).
Inputs that are used in determining fair value of an investment may include price information, credit data, volatility statistics, and other factors. These inputs can be either observable or unobservable. The availability of observable inputs can vary between investments, and is affected by various factors such as the type of investment, and the volume and level of activity for that investment or similar investments in the marketplace. The inputs will be considered by the Investment Manager, along with any other relevant factors in the calculation of an investment's fair value. The Fund uses prices and inputs that are current as of the measurement date, which may include periods of market dislocations. During these periods, the availability of prices and inputs may be reduced for many investments. This condition could cause an investment to be reclassified between the various levels within the hierarchy.
Investments falling into the Level 3 category are primarily supported by quoted prices from brokers and dealers participating in the market for those investments. However, these may be classified as Level 3 investments due to lack of market transparency and corroboration to support these quoted prices. Additionally, valuation models may be used as the pricing source for any remaining investments classified as Level 3. These models may rely on one or more significant unobservable inputs and/or significant assumptions by the Investment Manager. Inputs used in valuations may include, but are not limited to, financial statement analysis, capital account balances, discount rates and estimated cash flows, and comparable company data.
Under the direction of the Fund's Board of Trustees (the Board), the Investment Manager's Valuation Committee (the Committee) is responsible for overseeing the valuation procedures approved by the Board. The Committee consists of voting and non-voting members from various groups within the Investment Manager's organization, including operations and accounting, trading and investments, compliance, risk management and legal.
The Committee meets at least monthly to review and approve valuation matters, which may include a description of specific valuation determinations, data regarding pricing information received from approved pricing vendors and brokers and the results of Board-approved valuation control policies and procedures (the Policies). The Policies address, among other things, instances when market quotations are or are not readily available, including recommendations of third party pricing vendors and a determination of appropriate pricing methodologies; events that require specific valuation determinations and assessment of fair value techniques; securities with a potential for stale pricing, including those that are illiquid, restricted, or in default; and the effectiveness of third party pricing vendors, including periodic reviews of vendors. The Committee meets more frequently, as needed, to discuss additional valuation matters, which may include the need to review back-testing results, review time-sensitive information or approve related valuation actions. The Committee reports to the Board, with members of the Committee meeting with the Board at each of its regularly scheduled meetings to discuss valuation matters and actions during the period, similar to those described earlier.
For investments categorized as Level 3, the Committee monitors information similar to that described above, which may include: (i) data specific to the issuer or comparable issuers, (ii) general market or specific sector news and (iii) quoted prices and specific or similar security transactions. The Committee considers this data and any changes from prior periods in order to assess the reasonableness of observable and unobservable inputs, any assumptions or internal models used to value those securities and changes in fair value. This data is also used to corroborate, when available, information received from approved pricing vendors and brokers. Various factors impact the frequency of monitoring this information (which may occur as often as daily). However, the Committee may determine that changes to inputs, assumptions and models are not required as a result of the monitoring procedures performed.
The accompanying Notes to Financial Statements are an integral part of this statement.
Annual Report 2014
18
Columbia Small Cap Index Fund
Portfolio of Investments (continued)
February 28, 2014
Fair Value Measurements (continued)
The following table is a summary of the inputs used to value the Fund's investments at February 28, 2014:
Description | | Level 1
Quoted Prices in Active
Markets for Identical
Assets ($) | | Level 2
Other Significant
Observable Inputs ($) | | Level 3
Significant
Unobservable Inputs ($) | | Total ($) | |
Equity Securities | |
Common Stocks | |
Consumer Discretionary | | | 438,017,123 | | | | — | | | | — | | | | 438,017,123 | | |
Consumer Staples | | | 95,192,570 | | | | — | | | | — | | | | 95,192,570 | | |
Energy | | | 121,212,675 | | | | — | | | | — | | | | 121,212,675 | | |
Financials | | | 584,348,367 | | | | — | | | | — | | | | 584,348,367 | | |
Health Care | | | 289,431,280 | | | | — | | | | — | | | | 289,431,280 | | |
Industrials | | | 410,585,410 | | | | — | | | | — | | | | 410,585,410 | | |
Information Technology | | | 527,027,872 | | | | — | | | | — | | | | 527,027,872 | | |
Materials | | | 183,298,923 | | | | — | | | | — | | | | 183,298,923 | | |
Telecommunication Services | | | 14,001,417 | | | | — | | | | — | | | | 14,001,417 | | |
Utilities | | | 96,490,336 | | | | — | | | | — | | | | 96,490,336 | | |
Total Equity Securities | | | 2,759,605,973 | | | | — | | | | — | | | | 2,759,605,973 | | |
Mutual Funds | |
Money Market Funds | | | 69,671,430 | | | | — | | | | — | | | | 69,671,430 | | |
Total Mutual Funds | | | 69,671,430 | | | | — | | | | — | | | | 69,671,430 | | |
Investments in Securities | | | 2,829,277,403 | | | | — | | | | — | | | | 2,829,277,403 | | |
Derivatives | |
Assets | |
Futures Contracts | | | 4,857,016 | | | | — | | | | — | | | | 4,857,016 | | |
Total | | | 2,834,134,419 | | | | — | | | | — | | | | 2,834,134,419 | | |
See the Portfolio of Investments for all investment classifications not indicated in the table.
There were no transfers of financial assets between levels during the period.
Derivative instruments are valued at unrealized appreciation (depreciation).
The accompanying Notes to Financial Statements are an integral part of this statement.
Annual Report 2014
19
Columbia Small Cap Index Fund
Statement of Assets and Liabilities
February 28, 2014
Assets | |
Investments, at value | |
Unaffiliated issuers (identified cost $1,669,369,569) | | $ | 2,759,605,973 | | |
Affiliated issuers (identified cost $69,671,430) | | | 69,671,430 | | |
Total investments (identified cost $1,739,040,999) | | | 2,829,277,403 | | |
Margin deposits | | | 2,999,200 | | |
Receivable for: | |
Investments sold | | | 18,126,736 | | |
Capital shares sold | | | 8,077,468 | | |
Dividends | | | 1,972,871 | | |
Variation margin | | | 3,891 | | |
Expense reimbursement due from Investment Manager | | | 58 | | |
Total assets | | | 2,860,457,627 | | |
Liabilities | |
Payable for: | |
Investments purchased | | | 4,938,677 | | |
Capital shares purchased | | | 2,361,248 | | |
Variation margin | | | 350,869 | | |
Investment management fees | | | 7,799 | | |
Distribution and/or service fees | | | 7,850 | | |
Administration fees | | | 7,799 | | |
Plan administration fees | | | 2,436 | | |
Compensation of board members | | | 138,205 | | |
Other expenses | | | 1,119 | | |
Total liabilities | | | 7,816,002 | | |
Net assets applicable to outstanding capital stock | | $ | 2,852,641,625 | | |
Represented by | |
Paid-in capital | | $ | 1,726,896,600 | | |
Undistributed net investment income | | | 1,528,277 | | |
Accumulated net realized gain | | | 29,123,328 | | |
Unrealized appreciation (depreciation) on: | |
Investments | | | 1,090,236,404 | | |
Futures contracts | | | 4,857,016 | | |
Total — representing net assets applicable to outstanding capital stock | | $ | 2,852,641,625 | | |
The accompanying Notes to Financial Statements are an integral part of this statement.
Annual Report 2014
20
Columbia Small Cap Index Fund
Statement of Assets and Liabilities (continued)
February 28, 2014
Class A | |
Net assets | | $ | 1,113,746,403 | | |
Shares outstanding | | | 47,308,594 | | |
Net asset value per share | | $ | 23.54 | | |
Class B | |
Net assets | | $ | 9,469,476 | | |
Shares outstanding | | | 403,946 | | |
Net asset value per share | | $ | 23.44 | | |
Class I | |
Net assets | | $ | 3,577 | | |
Shares outstanding | | | 152 | | |
Net asset value per share(a) | | $ | 23.56 | | |
Class K | |
Net assets | | $ | 12,780,555 | | |
Shares outstanding | | | 541,221 | | |
Net asset value per share | | $ | 23.61 | | |
Class R5 | |
Net assets | | $ | 79,726,188 | | |
Shares outstanding | | | 3,322,858 | | |
Net asset value per share | | $ | 23.99 | | |
Class Z | |
Net assets | | $ | 1,636,915,426 | | |
Shares outstanding | | | 69,264,753 | | |
Net asset value per share | | $ | 23.63 | | |
(a) Net asset value per share rounds to this amount due to fractional shares outstanding.
The accompanying Notes to Financial Statements are an integral part of this statement.
Annual Report 2014
21
Columbia Small Cap Index Fund
Statement of Operations
Year Ended February 28, 2014
Net investment income | |
Income: | |
Dividends — unaffiliated issuers | | $ | 28,689,840 | | |
Dividends — affiliated issuers | | | 74,598 | | |
Interest | | | 18 | | |
Total income | | | 28,764,456 | | |
Expenses: | |
Investment management fees | | | 2,436,410 | | |
Distribution and/or service fees | |
Class A | | | 2,246,900 | | |
Class B | | | 108,151 | | |
Administration fees | | | 2,436,410 | | |
Plan administration fees | |
Class K | | | 28,681 | | |
Compensation of board members | | | 68,600 | | |
Other | | | 11,650 | | |
Total expenses | | | 7,336,802 | | |
Fees waived or expenses reimbursed by Investment Manager and its affiliates | | | (80,248 | ) | |
Expense reductions | | | (3,677 | ) | |
Total net expenses | | | 7,252,877 | | |
Net investment income | | | 21,511,579 | | |
Realized and unrealized gain (loss) — net | |
Net realized gain (loss) on: | |
Investments | | | 155,492,076 | | |
Futures contracts | | | 18,478,838 | | |
Net realized gain | | | 173,970,914 | | |
Net change in unrealized appreciation (depreciation) on: | |
Investments | | | 467,376,538 | | |
Futures contracts | | | 1,307,733 | | |
Net change in unrealized appreciation (depreciation) | | | 468,684,271 | | |
Net realized and unrealized gain | | | 642,655,185 | | |
Net increase in net assets resulting from operations | | $ | 664,166,764 | | |
The accompanying Notes to Financial Statements are an integral part of this statement.
Annual Report 2014
22
Columbia Small Cap Index Fund
Statement of Changes in Net Assets
| | | Year Ended
February 28,
2014 | | Year Ended
February 28,
2013(a) | |
Operations | |
Net investment income | | $ | 21,511,579 | | | $ | 29,025,982 | | |
Net realized gain | | | 173,970,914 | | | | 22,513,441 | | |
Net change in unrealized appreciation (depreciation) | | | 468,684,271 | | | | 159,325,516 | | |
Net increase in net assets resulting from operations | | | 664,166,764 | | | | 210,864,939 | | |
Distributions to shareholders | |
Net investment income | |
Class A | | | (6,654,997 | ) | | | (8,835,568 | ) | |
Class B | | | (3,954 | ) | | | (92,006 | ) | |
Class I | | | (31 | ) | | | (47 | ) | |
Class K | | | (79,225 | ) | | | (130,672 | ) | |
Class R5 | | | (419,714 | ) | | | (43 | ) | |
Class Z | | | (13,990,244 | ) | | | (19,265,834 | ) | |
Net realized gains | |
Class A | | | (50,037,594 | ) | | | (29,052,987 | ) | |
Class B | | | (577,915 | ) | | | (714,002 | ) | |
Class I | | | (180 | ) | | | (133 | ) | |
Class K | | | (615,780 | ) | | | (444,667 | ) | |
Class R5 | | | (1,943,999 | ) | | | (44 | ) | |
Class Z | | | (80,628,656 | ) | | | (54,131,198 | ) | |
Total distributions to shareholders | | | (154,952,289 | ) | | | (112,667,201 | ) | |
Increase (decrease) in net assets from capital stock activity | | | 358,468,551 | | | | (411,521,182 | ) | |
Total increase (decrease) in net assets | | | 867,683,026 | | | | (313,323,444 | ) | |
Net assets at beginning of year | | | 1,984,958,599 | | | | 2,298,282,043 | | |
Net assets at end of year | | $ | 2,852,641,625 | | | $ | 1,984,958,599 | | |
Undistributed net investment income | | $ | 1,528,277 | | | $ | 1,421,240 | | |
(a) Class R5 shares are for the period from November 8, 2012 (commencement of operations) to February 28, 2013.
The accompanying Notes to Financial Statements are an integral part of this statement.
Annual Report 2014
23
Columbia Small Cap Index Fund
Statement of Changes in Net Assets (continued)
| | | Year Ended February 28, 2014 | | Year Ended February 28, 2013(a) | |
| | | Shares | | Dollars ($) | | Shares | | Dollars ($) | |
Capital stock activity | |
Class A shares | |
Subscriptions(b) | | | 19,882,789 | | | | 432,044,976 | | | | 12,272,612 | | | | 217,416,726 | | |
Distributions reinvested | | | 2,444,682 | | | | 53,421,096 | | | | 2,152,007 | | | | 36,499,212 | | |
Redemptions | | | (11,235,169 | ) | | | (245,339,703 | ) | | | (10,363,166 | ) | | | (183,280,250 | ) | |
Net increase | | | 11,092,302 | | | | 240,126,369 | | | | 4,061,453 | | | | 70,635,688 | | |
Class B shares | |
Subscriptions | | | 23,579 | | | | 504,218 | | | | 27,883 | | | | 494,004 | | |
Distributions reinvested | | | 27,173 | | | | 581,060 | | | | 47,789 | | | | 805,040 | | |
Redemptions(b) | | | (258,854 | ) | | | (5,599,592 | ) | | | (445,467 | ) | | | (7,667,104 | ) | |
Net decrease | | | (208,102 | ) | | | (4,514,314 | ) | | | (369,795 | ) | | | (6,368,060 | ) | |
Class K shares | |
Subscriptions | | | 100,700 | | | | 2,181,086 | | | | 79,667 | | | | 1,426,562 | | |
Distributions reinvested | | | 31,816 | | | | 694,817 | | | | 33,822 | | | | 575,180 | | |
Redemptions | | | (104,881 | ) | | | (2,302,520 | ) | | | (153,729 | ) | | | (2,719,736 | ) | |
Net increase (decrease) | | | 27,635 | | | | 573,383 | | | | (40,240 | ) | | | (717,994 | ) | |
Class R5 shares | |
Subscriptions | | | 3,840,376 | | | | 85,575,154 | | | | 4,186 | | | | 81,292 | | |
Distributions reinvested | | | 97,658 | | | | 2,230,263 | | | | — | | | | — | | |
Redemptions | | | (619,362 | ) | | | (13,677,166 | ) | | | — | | | | — | | |
Net increase | | | 3,318,672 | | | | 74,128,251 | | | | 4,186 | | | | 81,292 | | |
Class Z shares | |
Subscriptions | | | 15,910,019 | | | | 343,579,759 | | | | 18,712,233 | | | | 335,164,984 | | |
Distributions reinvested | | | 2,645,949 | | | | 57,907,206 | | | | 2,446,478 | | | | 41,655,862 | | |
Redemptions | | | (16,215,593 | ) | | | (353,332,103 | ) | | | (49,712,101 | ) | | | (851,972,954 | ) | |
Net increase (decrease) | | | 2,340,375 | | | | 48,154,862 | | | | (28,553,390 | ) | | | (475,152,108 | ) | |
Total net increase (decrease) | | | 16,570,882 | | | | 358,468,551 | | | | (24,897,786 | ) | | | (411,521,182 | ) | |
(a) Class R5 shares are for the period from November 8, 2012 (commencement of operations) to February 28, 2013.
(b) Includes conversions of Class B shares to Class A shares, if any.
The accompanying Notes to Financial Statements are an integral part of this statement.
Annual Report 2014
24
Columbia Small Cap Index Fund
The following tables are intended to help you understand the Fund's financial performance. Certain information reflects financial results for a single share of a class held for the periods shown. Per share net investment income (loss) amounts are calculated based on average shares outstanding during the period. Total return assumes reinvestment of all dividends and distributions, if any. Total return does not reflect payment of sales charges, if any, and is not annualized for periods of less than one year.
| | | | | Year Ended | | | |
| | | Year Ended February 28, | | February 29, | | Year Ended February 28, | |
Class A | | 2014 | | 2013 | | 2012 | | 2011 | | 2010 | |
Per share data | |
Net asset value, beginning of period | | $ | 19.00 | | | $ | 17.75 | | | $ | 18.01 | | | $ | 13.97 | | | $ | 8.58 | | |
Income from investment operations: | |
Net investment income | | | 0.16 | | | | 0.24 | | | | 0.12 | | | | 0.12 | | | | 0.08 | | |
Net realized and unrealized gain | | | 5.72 | | | | 2.14 | | | | 0.66 | | | | 4.14 | | | | 5.40 | | |
Total from investment operations | | | 5.88 | | | | 2.38 | | | | 0.78 | | | | 4.26 | | | | 5.48 | | |
Less distributions to shareholders: | |
Net investment income | | | (0.15 | ) | | | (0.25 | ) | | | (0.12 | ) | | | (0.12 | ) | | | (0.09 | ) | |
Net realized gains | | | (1.19 | ) | | | (0.88 | ) | | | (0.92 | ) | | | (0.10 | ) | | | — | | |
Total distributions to shareholders | | | (1.34 | ) | | | (1.13 | ) | | | (1.04 | ) | | | (0.22 | ) | | | (0.09 | ) | |
Proceeds from regulatory settlements | | | — | | | | — | | | | 0.00 | (a) | | | — | | | | 0.00 | (a) | |
Net asset value, end of period | | $ | 23.54 | | | $ | 19.00 | | | $ | 17.75 | | | $ | 18.01 | | | $ | 13.97 | | |
Total return | | | 31.63 | % | | | 14.32 | % | | | 4.65 | % | | | 30.55 | % | | | 63.90 | % | |
Ratios to average net assets(b) | |
Total gross expenses | | | 0.45 | % | | | 0.45 | %(c) | | | 0.45 | % | | | 0.45 | % | | | 0.45 | % | |
Total net expenses(d) | | | 0.45 | %(e) | | | 0.45 | %(c)(e) | | | 0.45 | %(e) | | | 0.45 | % | | | 0.45 | % | |
Net investment income | | | 0.73 | % | | | 1.37 | % | | | 0.74 | % | | | 0.73 | % | | | 0.68 | % | |
Supplemental data | |
Net assets, end of period (in thousands) | | $ | 1,113,746 | | | $ | 687,934 | | | $ | 570,806 | | | $ | 183,578 | | | $ | 96,238 | | |
Portfolio turnover | | | 15 | % | | | 17 | % | | | 20 | % | | | 14 | % | | | 14 | % | |
Notes to Financial Highlights
(a) Rounds to zero.
(b) In addition to the fees and expenses which the Fund bears directly, the Fund indirectly bears a pro rata share of the fees and expenses of the acquired funds in which it invests. Such indirect expenses are not included in the reported expense ratios.
(c) Ratios include line of credit interest expense which rounds to less than 0.01%.
(d) Total net expenses include the impact of certain waivers/reimbursements made by the Investment Manager and certain of its affiliates, if applicable.
(e) The benefits derived from expense reductions had an impact of less than 0.01%.
The accompanying Notes to Financial Statements are an integral part of this statement.
Annual Report 2014
25
Columbia Small Cap Index Fund
Financial Highlights (continued)
| | | Year Ended February 28, | | Year Ended
February 29, | |
Class B | | 2014 | | 2013 | | 2012(a) | |
Per share data | |
Net asset value, beginning of period | | $ | 18.95 | | | $ | 17.73 | | | $ | 17.82 | | |
Income from investment operations: | |
Net investment income | | | (0.01 | ) | | | 0.11 | | | | 0.00 | (b) | |
Net realized and unrealized gain | | | 5.70 | | | | 2.13 | | | | 0.84 | | |
Total from investment operations | | | 5.69 | | | | 2.24 | | | | 0.84 | | |
Less distributions to shareholders: | |
Net investment income | | | (0.01 | ) | | | (0.14 | ) | | | (0.01 | ) | |
Net realized gains | | | (1.19 | ) | | | (0.88 | ) | | | (0.92 | ) | |
Total distributions to shareholders | | | (1.20 | ) | | | (1.02 | ) | | | (0.93 | ) | |
Proceeds from regulatory settlements | | | — | | | | — | | | | 0.00 | (b) | |
Net asset value, end of period | | $ | 23.44 | | | $ | 18.95 | | | $ | 17.73 | | |
Total return | | | 30.64 | % | | | 13.45 | % | | | 4.97 | % | |
Ratios to average net assets(c) | |
Total gross expenses | | | 1.20 | % | | | 1.20 | %(d) | | | 1.20 | %(e) | |
Total net expenses(f) | | | 1.20 | %(g) | | | 1.20 | %(d)(g) | | | 1.20 | %(e)(g) | |
Net investment income | | | (0.02 | %) | | | 0.61 | % | | | 0.01 | %(e) | |
Supplemental data | |
Net assets, end of period (in thousands) | | $ | 9,469 | | | $ | 11,596 | | | $ | 17,410 | | |
Portfolio turnover | | | 15 | % | | | 17 | % | | | 20 | % | |
Notes to Financial Highlights
(a) For the period from March 7, 2011 (commencement of operations) to February 29, 2012.
(b) Rounds to zero.
(c) In addition to the fees and expenses which the Fund bears directly, the Fund indirectly bears a pro rata share of the fees and expenses of the acquired funds in which it invests. Such indirect expenses are not included in the reported expense ratios.
(d) Ratios include line of credit interest expense which rounds to less than 0.01%.
(e) Annualized.
(f) Total net expenses include the impact of certain waivers/reimbursements made by the Investment Manager and certain of its affiliates, if applicable.
(g) The benefits derived from expense reductions had an impact of less than 0.01%.
The accompanying Notes to Financial Statements are an integral part of this statement.
Annual Report 2014
26
Columbia Small Cap Index Fund
Financial Highlights (continued)
| | | Year Ended February 28, | | Year Ended
February 29, | |
Class I | | 2014 | | 2013 | | 2012(a) | |
Per share data | |
Net asset value, beginning of period | | $ | 19.01 | | | $ | 17.76 | | | $ | 16.47 | | |
Income from investment operations: | |
Net investment income | | | 0.21 | | | | 0.29 | | | | 0.05 | | |
Net realized and unrealized gain | | | 5.73 | | | | 2.14 | | | | 1.87 | | |
Total from investment operations | | | 5.94 | | | | 2.43 | | | | 1.92 | | |
Less distributions to shareholders: | |
Net investment income | | | (0.20 | ) | | | (0.30 | ) | | | (0.17 | ) | |
Net realized gains | | | (1.19 | ) | | | (0.88 | ) | | | (0.46 | ) | |
Total distributions to shareholders | | | (1.39 | ) | | | (1.18 | ) | | | (0.63 | ) | |
Proceeds from regulatory settlements | | | — | | | | — | | | | 0.00 | (b) | |
Net asset value, end of period | | $ | 23.56 | | | $ | 19.01 | | | $ | 17.76 | | |
Total return | | | 31.97 | % | | | 14.63 | % | | | 12.03 | % | |
Ratios to average net assets(c) | |
Total gross expenses | | | 0.22 | % | | | 0.18 | %(d) | | | 0.17 | %(e) | |
Total net expenses(f) | | | 0.20 | % | | | 0.18 | %(d) | | | 0.17 | %(e) | |
Net investment income | | | 0.98 | % | | | 1.65 | % | | | 1.09 | %(e) | |
Supplemental data | |
Net assets, end of period (in thousands) | | $ | 4 | | | $ | 3 | | | $ | 3 | | |
Portfolio turnover | | | 15 | % | | | 17 | % | | | 20 | % | |
Notes to Financial Highlights
(a) For the period from November 16, 2011 (commencement of operations) to February 29, 2012.
(b) Rounds to zero.
(c) In addition to the fees and expenses which the Fund bears directly, the Fund indirectly bears a pro rata share of the fees and expenses of the acquired funds in which it invests. Such indirect expenses are not included in the reported expense ratios.
(d) Ratios include line of credit interest expense which rounds to less than 0.01%.
(e) Annualized.
(f) Total net expenses include the impact of certain waivers/reimbursements made by the Investment Manager and certain of its affiliates, if applicable.
The accompanying Notes to Financial Statements are an integral part of this statement.
Annual Report 2014
27
Columbia Small Cap Index Fund
Financial Highlights (continued)
| | | Year Ended February 28, | | Year Ended
February 29, | |
Class K | | 2014 | | 2013 | | 2012(a) | |
Per share data | |
Net asset value, beginning of period | | $ | 19.05 | | | $ | 17.80 | | | $ | 17.87 | | |
Income from investment operations: | |
Net investment income | | | 0.16 | | | | 0.24 | | | | 0.13 | | |
Net realized and unrealized gain | | | 5.74 | | | | 2.14 | | | | 0.84 | | |
Total from investment operations | | | 5.90 | | | | 2.38 | | | | 0.97 | | |
Less distributions to shareholders: | |
Net investment income | | | (0.15 | ) | | | (0.25 | ) | | | (0.12 | ) | |
Net realized gains | | | (1.19 | ) | | | (0.88 | ) | | | (0.92 | ) | |
Total distributions to shareholders | | | (1.34 | ) | | | (1.13 | ) | | | (1.04 | ) | |
Proceeds from regulatory settlements | | | — | | | | — | | | | 0.00 | (b) | |
Net asset value, end of period | | $ | 23.61 | | | $ | 19.05 | | | $ | 17.80 | | |
Total return | | | 31.65 | % | | | 14.27 | % | | | 5.76 | % | |
Ratios to average net assets(c) | |
Total gross expenses | | | 0.45 | % | | | 0.45 | %(d) | | | 0.45 | %(e) | |
Total net expenses(f) | | | 0.45 | % | | | 0.45 | %(d) | | | 0.45 | %(e) | |
Net investment income | | | 0.73 | % | | | 1.37 | % | | | 0.76 | %(e) | |
Supplemental data | |
Net assets, end of period (in thousands) | | $ | 12,781 | | | $ | 9,784 | | | $ | 9,858 | | |
Portfolio turnover | | | 15 | % | | | 17 | % | | | 20 | % | |
Notes to Financial Highlights
(a) For the period from March 7, 2011 (commencement of operations) to February 29, 2012.
(b) Rounds to zero.
(c) In addition to the fees and expenses which the Fund bears directly, the Fund indirectly bears a pro rata share of the fees and expenses of the acquired funds in which it invests. Such indirect expenses are not included in the reported expense ratios.
(d) Ratios include line of credit interest expense which rounds to less than 0.01%.
(e) Annualized.
(f) Total net expenses include the impact of certain waivers/reimbursements made by the Investment Manager and certain of its affiliates, if applicable.
The accompanying Notes to Financial Statements are an integral part of this statement.
Annual Report 2014
28
Columbia Small Cap Index Fund
Financial Highlights (continued)
| | | Year Ended February 28, | |
Class R5 | | 2014 | | 2013(a) | |
Per share data | |
Net asset value, beginning of period | | $ | 19.33 | | | $ | 17.47 | | |
Income from investment operations: | |
Net investment income | | | 0.23 | | | | 0.07 | | |
Net realized and unrealized gain | | | 5.82 | | | | 2.40 | | |
Total from investment operations | | | 6.05 | | | | 2.47 | | |
Less distributions to shareholders: | |
Net investment income | | | (0.20 | ) | | | (0.30 | ) | |
Net realized gains | | | (1.19 | ) | | | (0.31 | ) | |
Total distributions to shareholders | | | (1.39 | ) | | | (0.61 | ) | |
Net asset value, end of period | | $ | 23.99 | | | $ | 19.33 | | |
Total return | | | 32.01 | % | | | 14.51 | % | |
Ratios to average net assets(b) | |
Total gross expenses | | | 0.20 | % | | | 0.24 | %(c) | |
Total net expenses(d) | | | 0.20 | % | | | 0.20 | %(c) | |
Net investment income | | | 0.99 | % | | | 1.44 | %(c) | |
Supplemental data | |
Net assets, end of period (in thousands) | | $ | 79,726 | | | $ | 81 | | |
Portfolio turnover | | | 15 | % | | | 17 | % | |
Notes to Financial Highlights
(a) For the period from November 8, 2012 (commencement of operations) to February 28, 2013.
(b) In addition to the fees and expenses which the Fund bears directly, the Fund indirectly bears a pro rata share of the fees and expenses of the acquired funds in which it invests. Such indirect expenses are not included in the reported expense ratios.
(c) Annualized.
(d) Total net expenses include the impact of certain waivers/reimbursements made by the Investment Manager and certain of its affiliates, if applicable.
The accompanying Notes to Financial Statements are an integral part of this statement.
Annual Report 2014
29
Columbia Small Cap Index Fund
Financial Highlights (continued)
| | | | | Year Ended | | | |
| | | Year Ending February 28, | | February 29, | | Year Ended February 28, | |
Class Z | | 2014 | | 2013 | | 2012 | | 2011 | | 2010 | |
Per share data | |
Net asset value, beginning of period | | $ | 19.06 | | | $ | 17.81 | | | $ | 18.06 | | | $ | 14.01 | | | $ | 8.60 | | |
Income from investment operations: | |
Net investment income | | | 0.21 | | | | 0.29 | | | | 0.16 | | | | 0.15 | | | | 0.12 | | |
Net realized and unrealized gain | | | 5.75 | | | | 2.14 | | | | 0.66 | | | | 4.15 | | | | 5.40 | | |
Total from investment operations | | | 5.96 | | | | 2.43 | | | | 0.82 | | | | 4.30 | | | | 5.52 | | |
Less distributions to shareholders: | |
Net investment income | | | (0.20 | ) | | | (0.30 | ) | | | (0.15 | ) | | | (0.15 | ) | | | (0.11 | ) | |
Net realized gains | | | (1.19 | ) | | | (0.88 | ) | | | (0.92 | ) | | | (0.10 | ) | | | — | | |
Total distributions to shareholders | | | (1.39 | ) | | | (1.18 | ) | | | (1.07 | ) | | | (0.25 | ) | | | (0.11 | ) | |
Proceeds from regulatory settlements | | | — | | | | — | | | | 0.00 | (a) | | | — | | | | 0.00 | (a) | |
Net asset value, end of period | | $ | 23.63 | | | $ | 19.06 | | | $ | 17.81 | | | $ | 18.06 | | | $ | 14.01 | | |
Total return | | | 31.99 | % | | | 14.54 | % | | | 4.92 | % | | | 30.81 | % | | | 64.34 | % | |
Ratios to average net assets(b) | |
Total gross expenses | | | 0.20 | % | | | 0.20 | %(c) | | | 0.20 | % | | | 0.20 | % | | | 0.20 | % | |
Total net expenses(d) | | | 0.20 | %(e) | | | 0.20 | %(c)(e) | | | 0.20 | %(e) | | | 0.20 | % | | | 0.20 | % | |
Net investment income | | | 0.98 | % | | | 1.64 | % | | | 0.96 | % | | | 0.97 | % | | | 0.95 | % | |
Supplemental data | |
Net assets, end of period (in thousands) | | $ | 1,636,915 | | | $ | 1,275,562 | | | $ | 1,700,205 | | | $ | 1,681,152 | | | $ | 1,309,989 | | |
Portfolio turnover | | | 15 | % | | | 17 | % | | | 20 | % | | | 14 | % | | | 14 | % | |
Notes to Financial Highlights
(a) Rounds to zero.
(b) In addition to the fees and expenses which the Fund bears directly, the Fund indirectly bears a pro rata share of the fees and expenses of the acquired funds in which it invests. Such indirect expenses are not included in the reported expense ratios.
(c) Ratios include line of credit interest expense which rounds to less than 0.01%.
(d) Total net expenses include the impact of certain waivers/reimbursements made by the Investment Manager and certain of its affiliates, if applicable.
(e) The benefits derived from expense reductions had an impact of less than 0.01%.
The accompanying Notes to Financial Statements are an integral part of this statement.
Annual Report 2014
30
Columbia Small Cap Index Fund
Notes to Financial Statements
February 28, 2014
Note 1. Organization
Columbia Small Cap Index Fund (the Fund), a series of Columbia Funds Series Trust (the Trust), is a diversified fund. The Trust is registered under the Investment Company Act of 1940, as amended (the 1940 Act), as an open-end management investment company organized as a Delaware statutory trust.
Fund Shares
The Trust may issue an unlimited number of shares (without par value). The Fund offers Class A, Class B, Class I, Class K, Class R5 and Class Z shares. Although all share classes generally have identical voting, dividend and liquidation rights, each share class votes separately when required by law. Different share classes pay different distribution amounts to the extent the expenses of such share classes differ, and distributions in liquidation will be proportional to the net asset value of each share class. Each share class has its own expense structure and sales charges, as applicable.
Class A shares have no sales charge.
Class B shares may be subject to a maximum contingent deferred sales charge (CDSC) of 5.00% based upon the holding period after purchase. Class B shares will generally convert to Class A shares eight years after purchase. The Fund no longer accepts investments by new or existing investors in the Fund's Class B shares, except in connection with the reinvestment of any dividend and/or capital gain distributions in Class B shares of the Fund and exchanges by existing Class B shareholders of certain other funds within the Columbia Family of Funds.
Class I shares are not subject to sales charges and are available only to the Columbia Family of Funds.
Class K shares are not subject to sales charges, however this share class is closed to new investors.
Class R5 shares are not subject to sales charges and are generally available only to investors purchasing through authorized investment professionals and omnibus retirement plans.
Class Z shares are not subject to sales charges and are available only to certain eligible investors, which are subject to different investment minimums.
Note 2. Summary of Significant Accounting Policies
Use of Estimates
The preparation of financial statements in accordance with U.S. generally accepted accounting principles (GAAP) requires management to make certain estimates and
assumptions that affect the reported amounts of assets and liabilities, the disclosure of contingent assets and liabilities at the date of the financial statements and the reported amounts of revenue and expenses during the reporting period. Actual results could differ from those estimates.
The following is a summary of significant accounting policies consistently followed by the Fund in the preparation of its financial statements.
Security Valuation
All equity securities are valued at the close of business of the New York Stock Exchange (NYSE). Equity securities are valued at the last quoted sales price on the principal exchange or market on which they trade, except for securities traded on the NASDAQ Stock Market, which are valued at the NASDAQ official close price. Unlisted securities or listed securities for which there were no sales during the day are valued at the mean of the latest quoted bid and ask prices on such exchanges or markets.
Foreign equity securities are valued based on quotations from the principal market in which such securities are normally traded. If any foreign share prices are not readily available as a result of limited share activity the securities are valued at the mean of the latest quoted bid and ask prices on such exchanges or markets. Foreign currency exchange rates are generally determined at 4:00 p.m. Eastern (U.S.) time. However, many securities markets and exchanges outside the U.S. close prior to the close of the NYSE; therefore, the closing prices for securities in such markets or on such exchanges may not fully reflect events that occur after such close but before the close of the NYSE. In those situations, foreign securities will be fair valued pursuant to the policy adopted by the Board of Trustees (the Board), including utilizing a third party pricing service to determine these fair values. The third party pricing service takes into account multiple factors, including, but not limited to, movements in the U.S. securities markets, certain depositary receipts, futures contracts and foreign exchange rates that have occurred subsequent to the close of the foreign exchange or market, to determine a good faith estimate that reasonably reflects the current market conditions as of the close of the NYSE. The fair value of a security is likely to be different from the quoted or published price, if available.
Investments in open-end investment companies, including money market funds, are valued at net asset value.
Futures and options on futures contracts are valued based upon the settlement price established each day by the board of trade or exchange on which they are traded.
Annual Report 2014
31
Columbia Small Cap Index Fund
Notes to Financial Statements (continued)
February 28, 2014
Investments for which market quotations are not readily available, or that have quotations which management believes are not reliable, are valued at fair value as determined in good faith under consistently applied procedures established by and under the general supervision of the Board. If a security or class of securities (such as foreign securities) is valued at fair value, such value is likely to be different from the last quoted market price for the security.
The determination of fair value often requires significant judgment. To determine fair value, management may use assumptions including but not limited to future cash flows and estimated risk premiums. Multiple inputs from various sources may be used to determine fair value.
Derivative Instruments
The Fund invests in certain derivative instruments, as detailed below, to meet its investment objectives. Derivatives are instruments whose values depend on, or are derived from, in whole or in part, the value of one or more other assets, such as securities, currencies, commodities or indices. Derivative instruments may be used to maintain cash reserves while maintaining exposure to certain other assets, to offset anticipated declines in values of investments, to facilitate trading, to reduce transaction costs and to pursue higher investment returns. The Fund may also use derivative instruments to mitigate certain investment risks, such as foreign currency exchange rate risk, interest rate risk and credit risk. Derivatives may involve various risks, including the potential inability of the counterparty to fulfill its obligation under the terms of the contract, the potential for an illiquid secondary market (making it difficult for the Fund to sell, including at favorable prices) and the potential for market movements which may expose the Fund to gains or losses in excess of the amount shown in the Statement of Assets and Liabilities. The notional amounts of derivative instruments, if applicable, are not recorded in the financial statements.
A derivative instrument may suffer a mark to market loss if the value of the contract decreases due to an unfavorable change in the market rates or values of the underlying instrument. Losses can also occur if the counterparty does not perform under the contract. The Fund's risk of loss from counterparty credit risk on over-the-counter derivatives is generally limited to the aggregate unrealized gain netted against any collateral held by the Fund and the amount of any initial margin held by the counterparty. With exchange traded or centrally cleared derivatives, there is minimal counterparty credit risk to the Fund since the exchange's clearinghouse, as counterparty to such instruments, guarantees against a possible default. The clearinghouse stands between the buyer and the seller of the contract; therefore, the counterparty credit risk is limited to
failure of the clearinghouse. However, credit risk still exists in exchange traded or centrally cleared derivatives with respect to initial and variation margin that is held in a broker's customer accounts. While brokers are required to segregate customer margin from their own assets, in the event that a broker becomes insolvent or goes into bankruptcy and at that time there is a shortfall in the aggregate amount of margin held by the broker for all its clients, U.S. bankruptcy laws will typically allocate that shortfall on a pro-rata basis across all the broker's customers, potentially resulting in losses to the Fund.
In order to better define its contractual rights and to secure rights that will help the Fund mitigate its counterparty risk, the Fund may enter into an International Swaps and Derivatives Association, Inc. Master Agreement (ISDA Master Agreement) or similar agreement with its derivative contract counterparties. An ISDA Master Agreement is an agreement between the Fund and a counterparty that governs over-the-counter derivatives and forward foreign currency exchange contracts and typically contains, among other things, collateral posting terms and netting provisions in the event of a default and/or termination event. Under an ISDA Master Agreement, the Fund may, under certain circumstances, offset with the counterparty certain derivative instrument's payables and/or receivables with collateral held and/or posted and create one single net payment. The provisions of the ISDA Master Agreement typically permit a single net payment in the event of default (close-out netting) including the bankruptcy or insolvency of the counterparty. Note, however, that bankruptcy or insolvency laws of a particular jurisdiction may impose restrictions on or prohibitions against the right of offset in bankruptcy, insolvency or other events.
Collateral (margin) requirements differ by type of derivative. Margin requirements are established by the exchange or clearinghouse for exchange traded and centrally cleared derivatives. Brokers can ask for margin in excess of the minimum in certain circumstances. Collateral terms are contract specific for over-the-counter derivatives. For over-the-counter derivatives traded under an ISDA Master Agreement, the collateral requirements are typically calculated by netting the mark to market amount for each transaction under such agreement and comparing that amount to the value of any variation margin currently pledged by the Fund and/or the counterparty. Generally, the amount of collateral due from or to a party has to exceed a minimum transfer amount threshold (e.g., $500,000) before a transfer has to be made. To the extent amounts due to the Fund from its counterparties are not fully collateralized, contractually or otherwise, the Fund bears the risk of loss from counterparty nonperformance. The Fund attempts to mitigate counterparty risk by only entering into
Annual Report 2014
32
Columbia Small Cap Index Fund
Notes to Financial Statements (continued)
February 28, 2014
agreements with counterparties that it believes have the financial resources to honor their obligations and by monitoring the financial stability of those counterparties.
Certain ISDA Master Agreements allow counterparties to over-the-counter derivatives to terminate derivative contracts prior to maturity in the event the Fund's net assets decline by a stated percentage over a specified time period or the Fund fails to meet the terms of the ISDA Master Agreement, which would cause the Fund to accelerate payment of any net liability owed to the counterparty. The Fund also has termination rights if the counterparty fails to meet the terms of the ISDA Master Agreement. In addition to considering counterparty credit risk, the Fund would consider terminating the derivative contracts based on whether termination would result in a net liability owed from the counterparty.
For financial reporting purposes, the Fund does not offset derivative assets and derivative liabilities that are subject to netting arrangements in the Statement of Assets and Liabilities.
Futures Contracts
Futures contracts are exchange traded and represent commitments for the future purchase or sale of an asset at a specified price on a specified date. The Fund bought and sold futures contracts to maintain appropriate equity market exposure while keeping sufficient cash to accommodate daily redemptions. These instruments may be used for other purposes in future periods. Upon entering into futures contracts, the Fund bears risks that it may not achieve the anticipated benefits of the futures contracts and may realize a loss. Additional risks include counterparty credit risk, the possibility of an illiquid market, and that a change in the value of the contract or option may not correlate with changes in the value of the underlying asset.
Upon entering into a futures contract, the Fund pledges cash or securities with the broker in an amount sufficient to meet the initial margin requirement. The initial margin deposit must be maintained at an established level over the life of the contract. Cash deposited as initial margin is recorded in the Statement of Assets and Liabilities as margin deposits. Securities deposited as initial margin are designated in the Portfolio of Investments. Subsequent payments (variation margin) are made or received by the Fund each day. The variation margin payments are equal to the daily change in the contract value and are recorded as variation margin receivable or payable and are offset in unrealized gains or losses. The Fund recognizes a realized gain or loss when the contract is closed or expires. Futures contracts involve, to varying degrees, risk of loss in excess of the variation margin disclosed in the Statement of Assets and Liabilities.
Effects of Derivative Transactions in the Financial Statements
The following tables are intended to provide additional information about the effect of derivatives on the financial statements of the Fund, including: the fair value of derivatives by risk category and the location of those fair values in the Statement of Assets and Liabilities; the impact of derivative transactions over the period in the Statement of Operations including realized gains or losses and unrealized gains or losses. The derivative schedules following the Portfolio of Investments present additional information regarding derivative instruments outstanding at the end of the period, if any.
The following table is a summary of the fair value of derivative instruments at February 28, 2014:
Asset Derivatives | |
Risk Exposure
Category | | Statement of Assets and
Liabilities Location | |
Fair Value ($) | |
Equity risk
| | Net assets — unrealized
appreciation on
futures contracts | | | 4,857,016
| * | |
*Includes cumulative appreciation (depreciation) as reported in the tables following the Portfolio of Investments. Only the current day's variation margin is reported in receivables or payables in the Statement of Assets and Liabilities.
The following table indicates the effect of derivative instruments in the Statement of Operations for the year ended February 28, 2014:
Amount of Realized Gain (Loss) on Derivatives Recognized in Income | |
Risk Exposure Category | | Futures Contracts ($) | |
Equity risk | | | 18,478,838 | | |
Change in Unrealized Appreciation (Depreciation) on
Derivatives Recognized in Income | |
Risk Exposure Category | | Futures Contracts ($) | |
The following table is a summary of the volume of derivative instruments for the year ended February 28, 2014:
Derivative Instrument | | Contracts Opened | |
Futures contracts | | | 7,101 | | |
Security Transactions
Security transactions are accounted for on the trade date. Cost is determined and gains (losses) are based upon the specific identification method for both financial statement and federal income tax purposes.
Income Recognition
Corporate actions and dividend income are generally recorded net of any non-reclaimable tax withholdings, on the ex-dividend
Annual Report 2014
33
Columbia Small Cap Index Fund
Notes to Financial Statements (continued)
February 28, 2014
date or upon receipt of ex-dividend notification in the case of certain foreign securities.
The Fund may receive distributions from holdings in business development companies (BDCs), exchange traded funds (ETFs) and real estate investment trusts (REITs), which report information on the character of their distributions annually. These distributions are allocated to dividend income, capital gain and return of capital based on estimates made by the Fund's management if actual information has not yet been reported. Return of capital is recorded as a reduction of the cost basis of securities held. If the Fund no longer owns the applicable securities, return of capital is recorded as a realized gain. Management's estimates are subsequently adjusted when the actual character of the distributions is disclosed by the BDCs, ETFs and REITs, which could result in a proportionate change in return of capital to shareholders.
Awards from class action litigation are recorded as a reduction of cost basis if the Fund still owns the applicable securities on the payment date. If the Fund no longer owns the applicable securities, the proceeds are recorded as realized gains.
Expenses
General expenses of the Trust are allocated to the Fund and other funds of the Trust based upon relative net assets or other expense allocation methodologies determined by the nature of the expense. Expenses directly attributable to the Fund are charged to the Fund. Expenses directly attributable to a specific class of shares are charged to that share class.
Determination of Class Net Asset Value
All income, expenses (other than class-specific expenses, which are charged to that share class, as shown in the Statement of Operations) and realized and unrealized gains (losses) are allocated to each class of the Fund on a daily basis, based on the relative net assets of each class, for purposes of determining the net asset value of each class.
Federal Income Tax Status
The Fund intends to qualify each year as a regulated investment company under Subchapter M of the Internal Revenue Code, as amended, and will distribute substantially all of its taxable income (including net short-term capital gains), if any, for its tax year, and as such will not be subject to federal income taxes. In addition, the Fund intends to distribute in each calendar year substantially all of its net investment income, capital gains and certain other amounts, if any, such that the Fund should not be subject to federal excise tax. Therefore, no federal income or excise tax provision is recorded.
Distributions to Shareholders
Distributions from net investment income, if any, are declared and paid semi-annually. Net realized capital gains, if any, are distributed at least annually. Income distributions and capital gain distributions are determined in accordance with federal income tax regulations, which may differ from GAAP.
Guarantees and Indemnifications
Under the Trust's organizational documents and, in some cases, by contract, its officers and trustees are indemnified against certain liabilities arising out of the performance of their duties to the Trust or its funds. In addition, certain of the Fund's contracts with its service providers contain general indemnification clauses. The Fund's maximum exposure under these arrangements is unknown since the amount of any future claims that may be made against the Fund cannot be determined, and the Fund has no historical basis for predicting the likelihood of any such claims.
Note 3. Fees and Compensation Paid to Affiliates
Investment Management Fees
Under an Investment Management Services Agreement, Columbia Management Investment Advisers, LLC (the Investment Manager), a wholly-owned subsidiary of Ameriprise Financial, Inc. (Ameriprise Financial), determines which securities will be purchased, held or sold. The investment management fee is an annual fee that is equal to 0.10% of the Fund's average daily net assets.
Administration Fees
Under an Administrative Services Agreement, the Investment Manager also serves as the Fund Administrator. The Fund pays the Fund Administrator an annual fee for administration and accounting services equal to 0.10% of the Fund's average daily net assets.
The Investment Manager, from the administration fee it receives from the Fund, pays all operating expenses of the Fund, with the exception of brokerage fees and commissions, interest, fees and expenses of Trustees who are not officers, directors or employees of the Investment Manager or its affiliates, distribution and/or shareholder servicing and plan administration fees and any extraordinary non-recurring expenses that may arise, including litigation.
Other Expenses
Other expenses are for, among other things, miscellaneous expenses of the Fund or the Board, including payments to a company providing limited administrative services to the Fund and the Board. That company's expenses include boardroom
Annual Report 2014
34
Columbia Small Cap Index Fund
Notes to Financial Statements (continued)
February 28, 2014
and office expense, employee compensation, employee health and retirement benefits, and certain other expenses. For the year ended February 28, 2014, other expenses paid to this company were $6,693.
Compensation of Board Members
Board members are compensated for their services to the Fund as disclosed in the Statement of Operations. Under a Deferred Compensation Plan (the Plan), the Board members who are not "interested persons" of the Fund, as defined under the 1940 Act, may elect to defer payment of up to 100% of their compensation. Deferred amounts are treated as though equivalent dollar amounts had been invested in shares of certain funds managed by the Investment Manager. The Fund's liability for these amounts is adjusted for market value changes and remains in the Fund until distributed in accordance with the Plan.
Transfer Agent Fees
Under a Transfer and Dividend Disbursing Agent Agreement, Columbia Management Investment Services Corp. (the Transfer Agent), an affiliate of the Investment Manager and a wholly-owned subsidiary of Ameriprise Financial, is responsible for providing transfer agency services to the Fund. The Transfer Agent has contracted with Boston Financial Data Services (BFDS) to serve as sub-transfer agent.
The transfer agent fees are payable by the Investment Manager. The Transfer Agent pays the fees of BFDS for services as sub-transfer agent and is not entitled to reimbursement for such fees from the Fund. The Transfer Agent also receives compensation from fees for various shareholder services and reimbursements for certain out-of-pocket expenses.
An annual minimum account balance fee of $20 may apply to certain accounts with a value below the applicable share class's initial minimum investment requirements to reduce the impact of small accounts on transfer agent fees. These minimum account balance fees are recorded as part of expense reductions in the Statement of Operations. For the year ended February 28, 2014, these minimum account balance fees reduced total expenses by $3,677.
Plan Administration Fees
Under a Plan Administration Services Agreement with the Transfer Agent, the Fund pays an annual fee at a rate of 0.25% of the Fund's average daily net assets attributable to Class K shares for the provision of various administrative, recordkeeping, communication and educational services.
Distribution and Service Fees
The Fund has an agreement with Columbia Management Investment Distributors, Inc. (the Distributor), an affiliate of the Investment Manager and a wholly-owned subsidiary of
Ameriprise Financial, for distribution and shareholder services. The Board has approved, and the Fund has adopted, distribution and shareholder service plans (the Plans) applicable to certain share classes, which set the distribution and service fees for the Fund. These fees are calculated daily and are intended to compensate the Distributor and/or eligible selling and/or servicing agents for selling shares of the Fund and providing services to investors.
Under the Plans, the Fund pays a monthly combined distribution and service fee to the Distributor at the maximum annual rate of 0.25% of the average daily net assets attributable to Class A shares of the Fund. Also under the Plans, the Fund pays a monthly service fee at the maximum annual rate of 0.25% of the average daily net assets attributable to Class B shares of the Fund and the payment of a monthly distribution fee at the maximum annual rate of 0.75% of the average daily net assets attributable to Class B shares of the Fund.
Sales Charges
Sales charges, including front-end charges and CDSCs, received by the Distributor for distributing Fund shares were $1,721 for Class B shares for the year ended February 28, 2014.
Expenses Waived/Reimbursed by the Investment Manager and its Affiliates
The Investment Manager and certain of its affiliates have contractually agreed to waive fees and/or reimburse expenses (excluding certain fees and expenses described below) for the period disclosed below, unless sooner terminated at the sole discretion of the Board, so that the Fund's net operating expenses, after giving effect to fees waived/expenses reimbursed and any balance credits and/or overdraft charges from the Fund's custodian, do not exceed the following annual rates as a percentage of the class' average daily net assets:
| | | Fee Rates Contractual
through
June 30, 2014 | |
Class A | | | 0.45 | % | |
Class B | | | 1.20 | | |
Class I | | | 0.20 | | |
Class K | | | 0.45 | | |
Class R5 | | | 0.20 | | |
Class Z | | | 0.20 | | |
Under the agreement governing these fee waivers and/or expense reimbursement arrangements, the following fees and expenses are excluded from the waiver/reimbursement commitment, and therefore will be paid by the Fund, if applicable: taxes (including foreign transaction taxes), expenses associated with investments in affiliated and
Annual Report 2014
35
Columbia Small Cap Index Fund
Notes to Financial Statements (continued)
February 28, 2014
non-affiliated pooled investment vehicles (including mutual funds and exchange traded funds), transaction costs and brokerage commissions, costs related to any securities lending program, dividend expenses associated with securities sold short, inverse floater program fees and expenses, transaction charges and interest on borrowed money, interest, extraordinary expenses and any other expenses the exclusion of which is specifically approved by the Board. This agreement may be modified or amended only with approval from all parties.
Note 4. Federal Tax Information
The timing and character of income and capital gain distributions are determined in accordance with income tax regulations, which may differ from GAAP because of temporary or permanent book to tax differences.
At February 28, 2014, these differences are primarily due to differing treatment for deferral/reversal of wash sales losses, Trustees' deferred compensation, re-characterization of distributions for investments, and derivative investments. To the extent these differences are permanent, reclassifications are made among the components of the Fund's net assets in the Statement of Assets and Liabilities. Temporary differences do not require reclassifications. In the Statement of Assets and Liabilities the following reclassifications were made:
Undistributed net investment income | | $ | (256,377 | ) | |
Accumulated net realized gain | | | 305,331 | | |
Paid-in capital | | | (48,954 | ) | |
Net investment income and net realized gains (losses), as disclosed in the Statement of Operations, and net assets were not affected by this reclassification.
The tax character of distributions paid during the years indicated was as follows:
Year Ended February 28, | | 2014 | | 2013 | |
Ordinary income | | $ | 35,592,677 | | | $ | 28,324,170 | | |
Long-term capital gains | | | 119,359,612 | | | | 84,343,031 | | |
Total | | $ | 154,952,289 | | | $ | 112,667,201 | | |
Short-term capital gain distributions, if any, are considered ordinary income distributions for tax purposes.
At February 28, 2014, the components of distributable earnings on a tax basis were as follows:
Undistributed ordinary income | | $ | 10,049,616 | | |
Undistributed accumulated long-term gain | | | 74,558,795 | | |
Unrealized appreciation | | | 1,041,239,065 | | |
At February 28, 2014, the cost of investments for federal income tax purposes was $1,788,038,338 and the aggregate gross unrealized appreciation and depreciation based on that cost was:
Unrealized appreciation | | $ | 1,086,053,220 | | |
Unrealized depreciation | | | (44,814,155 | ) | |
Net unrealized appreciation | | $ | 1,041,239,065 | | |
Management of the Fund has concluded that there are no significant uncertain tax positions that would require recognition in the financial statements. However, management's conclusion may be subject to review and adjustment at a later date based on factors including, but not limited to, new tax laws, regulations, and administrative interpretations (including relevant court decisions). Generally, the Fund's federal tax returns for the prior three fiscal years remain subject to examination by the Internal Revenue Service.
Note 5. Portfolio Information
The cost of purchases and proceeds from sales of securities, excluding short-term obligations, aggregated to $555,050,700 and $355,981,829, respectively, for the year ended February 28, 2014.
Note 6. Affiliated Money Market Fund
The Fund invests its daily cash balances in Columbia Short-Term Cash Fund, an affiliated money market fund established for the exclusive use by the Fund and other affiliated funds. The income earned by the Fund from such investments is included as "Dividends — affiliated issuers" in the Statement of Operations. As an investing fund, the Fund indirectly bears its proportionate share of the expenses of Columbia Short-Term Cash Fund.
Note 7. Shareholder Concentration
At February 28, 2014, one unaffiliated shareholder account owned 23.7% of the outstanding shares of the Fund. The Fund has no knowledge about whether any portion of those shares was owned beneficially by such account. Subscription and redemption activity by concentrated accounts may have a significant effect on the operations of the Fund.
Note 8. Line of Credit
The Fund has entered into a revolving credit facility with a syndicate of banks led by JPMorgan Chase Bank N.A. whereby the Fund may borrow for the temporary funding of shareholder redemptions or for other temporary or emergency purposes. The credit facility agreement, as amended, which is a collective agreement between the Fund and certain other funds managed by the Investment Manager, severally and not jointly, permits collective borrowings up to $500 million. Interest is charged to
Annual Report 2014
36
Columbia Small Cap Index Fund
Notes to Financial Statements (continued)
February 28, 2014
each participating fund based on its borrowings at a rate equal to the higher of (i) the overnight federal funds rate plus 1.00% or (ii) the one-month LIBOR rate plus 1.00%. Each borrowing under the credit facility matures no later than 60 days after the date of borrowing. Effective December 10, 2013, the Fund also pays a commitment fee equal to its pro rata share of the amount of the credit facility at a rate of 0.075% per annum. Prior to December 10, 2013, the commitment fee was charged at the annual rate of 0.08% per annum. The commitment fee is included in other expenses in the Statement of Operations.
The Fund had no borrowings during the year ended February 28, 2014.
Note 9. Significant Risks
Financial Sector Risk
Sector risk occurs when a fund invests a significant portion of its assets in securities of companies conducting business in a related group of industries within an economic sector. Companies in the same economic sector may be similarly affected by economic, regulatory, political or market events or conditions, making a fund more vulnerable to unfavorable developments in that economic sector than funds that invest more broadly. The Fund may be more susceptible to the particular risks that may affect companies in the financial sector than if it were invested in a wider variety of companies in unrelated sectors.
Note 10. Subsequent Events
Management has evaluated the events and transactions that have occurred through the date the financial statements were issued and noted no items requiring adjustment of the financial statements or additional disclosure.
Note 11. Information Regarding Pending and Settled Legal Proceedings
In December 2005, without admitting or denying the allegations, American Express Financial Corporation (AEFC, which is now known as Ameriprise Financial, Inc. (Ameriprise Financial)) entered into settlement agreements with the Securities and Exchange Commission (SEC) and Minnesota Department of Commerce (MDOC) related to market timing activities. As a result, AEFC was censured and ordered to cease and desist from committing or causing any violations of certain provisions of the Investment Advisers Act of 1940, the Investment Company Act of 1940, and various Minnesota laws. AEFC agreed to pay disgorgement of $10 million and civil money penalties of $7 million. AEFC also agreed to retain an independent distribution consultant to assist in developing a plan for distribution of all disgorgement and civil penalties ordered by the SEC in accordance with various undertakings detailed at www.sec.gov/litigation/admin/ia-2451.pdf.
Ameriprise Financial and its affiliates have cooperated with the SEC and the MDOC in these legal proceedings, and have made regular reports to the Funds' Boards of Trustees.
Ameriprise Financial and certain of its affiliates have historically been involved in a number of legal, arbitration and regulatory proceedings, including routine litigation, class actions, and governmental actions, concerning matters arising in connection with the conduct of their business activities. Ameriprise Financial believes that the Funds are not currently the subject of, and that neither Ameriprise Financial nor any of its affiliates are the subject of, any pending legal, arbitration or regulatory proceedings that are likely to have a material adverse effect on the Funds or the ability of Ameriprise Financial or its affiliates to perform under their contracts with the Funds. Ameriprise Financial is required to make 10-Q, 10-K and, as necessary, 8-K filings with the Securities and Exchange Commission on legal and regulatory matters that relate to Ameriprise Financial and its affiliates. Copies of these filings may be obtained by accessing the SEC website at www.sec.gov.
There can be no assurance that these matters, or the adverse publicity associated with them, will not result in increased fund redemptions, reduced sale of fund shares or other adverse consequences to the Funds. Further, although we believe proceedings are not likely to have a material adverse effect on the Funds or the ability of Ameriprise Financial or its affiliates to perform under their contracts with the Funds, these proceedings are subject to uncertainties and, as such, we are unable to estimate the possible loss or range of loss that may result. An adverse outcome in one or more of these proceedings could result in adverse judgments, settlements, fines, penalties or other relief that could have a material adverse effect on the consolidated financial condition or results of operations of Ameriprise Financial.
Annual Report 2014
37
Columbia Small Cap Index Fund
Report of Independent Registered Public Accounting Firm
To the Trustees of Columbia Funds Series Trust and the Shareholders of
Columbia Small Cap Index Fund
In our opinion, the accompanying statement of assets and liabilities, including the portfolio of investments, and the related statements of operations and of changes in net assets and the financial highlights present fairly, in all material respects, the financial position of Columbia Small Cap Index Fund (the "Fund", a series of Columbia Funds Series Trust) at February 28, 2014, and the results of its operations, the changes in its net assets and the financial highlights for each of the periods indicated, in conformity with accounting principles generally accepted in the United States of America. These financial statements and financial highlights (hereafter referred to as "financial statements") are the responsibility of the Fund's management; our responsibility is to express an opinion on these financial statements based on our audits. We conducted our audits of these financial statements in accordance with the standards of the Public Company Accounting Oversight Board (United States). Those standards require that we plan and perform the audit to obtain reasonable assurance about whether the financial statements are free of material misstatement. An audit includes examining, on a test basis, evidence supporting the amounts and disclosures in the financial statements, assessing the accounting principles used and significant estimates made by management, and evaluating the overall financial statement presentation. We believe that our audits, which included confirmation of securities at February 28, 2014 by correspondence with the custodian, brokers and transfer agent, provide a reasonable basis for our opinion.
PricewaterhouseCoopers LLP
Minneapolis, Minnesota
April 21, 2014
Annual Report 2014
38
Columbia Small Cap Index Fund
Federal Income Tax Information
(Unaudited)
The Fund hereby designates the following tax attributes for the fiscal year ended February 28, 2014. Shareholders will be notified in early 2015 of the amounts for use in preparing 2014 income tax returns.
Tax Designations:
| Qualified Dividend Income | | | 57.93 | % | |
| Dividends Received Deduction | | | 57.95 | % | |
Capital Gain Dividend | | $ | 159,194,598 | | |
Qualified Dividend Income. For taxable, non-corporate shareholders, the percentage of ordinary income dividends paid during the fiscal year that represents qualified dividend income subject to reduced tax rates.
Dividends Received Deduction. The percentage of ordinary income dividends paid during the fiscal year that qualifies for the corporate dividends received deduction.
Capital Gain Dividend. The Fund designates as a capital gain dividend the amount reflected above, or if subsequently determined to be different, the net capital gain of such fiscal period. The Fund also designates as capital gain dividends, to the extent necessary to fully distribute such capital gains, earnings and profits distributed to shareholders on the redemption of shares.
Annual Report 2014
39
Columbia Small Cap Index Fund
Shareholders elect the Board that oversees the Funds' operations. The Board appoints officers who are responsible for day-to-day business decisions based on policies set by the Board. The following table provides basic biographical information about the Funds' Board members, including their principal occupations during the past five years, although specific titles for individuals may have varied over the period. Under current Board policy, members may serve through the end of the calendar year in which he or she reaches either the mandatory retirement age established by the Board or the fifteenth anniversary of the first Board meeting they attended as a member of the Board.
Independent Trustees
Name,
Address,
Year of Birth | | Position Held With
Funds and Length of
Service | | Principal Occupation(s)
During Past Five Years
and Other Relevant
Professional Experience | | Number of
Funds in the
Fund Family
Overseen by
Board Member | | Other Present or Past
Directorships/
Trusteeships
(Within Past 5 Years) | |
Kathleen Blatz
901 S. Marquette Ave.
Minneapolis, MN 55402
1954 | | Board member since 1/06 for RiverSource Funds and since 6/11 for Nations Funds | | Attorney; Chief Justice, Minnesota Supreme
Court, 1998-2006 | | | 131 | | | Trustee, BlueCross BlueShield of Minnesota since 2009 | |
Edward J. Boudreau, Jr.
901 S. Marquette Ave.
Minneapolis, MN 55402
1944 | | Board member since 6/11 for RiverSource Funds and since 1/05 for Nations Funds | | Managing Director, E.J. Boudreau & Associates (consulting) since 2000; Chairman and Chief Executive Officer, John Hancock Funds (mutual funds), 1989-2000 | | | 129 | | | Former Trustee, BofA Funds Series Trust (11 funds), 2005-2011 | |
Pamela G. Carlton
901 S. Marquette Ave.
Minneapolis, MN 55402
1954 | | Board member since 7/07 for RiverSource Funds and since 6/11 for Nations Funds | | President, Springboard — Partners in Cross Cultural Leadership (consulting company) since 2003; Director or Management Director of US Equity Research, Chase Asset Management, 1996-2003; Investment Banker, Morgan Stanley, 1982-1996 | | | 131 | | | None | |
William P. Carmichael
901 S. Marquette Ave.
Minneapolis, MN 55402
1943 | | Chair of the Board since 1/14, Board member since 6/11 for RiverSource Funds and since 2003 for Nations Funds | | Retired; Co-founder, The Succession Fund (provides exit strategies to owners of privately held companies); previously, Senior Vice President, Sara Lee Corporation; Senior Vice President and Chief Financial officer, Beatrice Foods Company; Vice President, Esmark, Inc.; Associate, Price Waterhouse | | | 131 | | | Director, Cobra Electronics Corporation (electronic equipment manufacturer); The Finish Line (athletic shoes and apparel) since July 2003; Director, International Textile Corp. since 2012; former Director, McMoRan Exploration Company (oil and gas exploration and development) 2010-2013; former Trustee, BofA Funds Series Trust (11 funds), 2009-2011; Director, Spectrum Brands, Inc. (consumer products), 2002-2009; Director, Simmons Company (bedding), 2004-2010 | |
Annual Report 2014
40
Columbia Small Cap Index Fund
Trustees and Officers (continued)
Independent Trustees (continued)
Name,
Address,
Year of Birth | | Position Held With
Funds and Length of
Service | | Principal Occupation(s)
During Past Five Years
and Other Relevant
Professional Experience | | Number of
Funds in the
Fund Family
Overseen by
Board Member | | Other Present or Past
Directorships/
Trusteeships
(Within Past 5 Years) | |
Patricia M. Flynn
901 S. Marquette Ave.
Minneapolis, MN 55402
1950 | | Board member since 11/04 for RiverSource Funds and since 6/11 for Nations Funds | | Trustee Professor of Economics and Management, Bentley University since 1976 (also teaches and conducts research on corporate governance); Dean, McCallum Graduate School of Business, Bentley University, 1992-2002 | | | 131 | | | None | |
William A. Hawkins
901 S. Marquette Ave.
Minneapolis, MN 55402
1942 | | Board member since 6/11 for RiverSource Funds and since 1/05 for Nations Funds | | Managing Director, Overton Partners (financial consulting), since August 2010; President and Chief Executive Officer, California General Bank, N.A., January 2008-August 2010 | | | 129 | | | Trustee, BofA Funds Series Trust (11 funds) | |
R. Glenn Hilliard
901 S. Marquette Ave.
Minneapolis, MN 55402
1943 | | Board member since 6/11 for RiverSource Funds and since 1/05 for Nations Funds | | Chairman and Chief Executive Officer, Hilliard Group LLC (investing and consulting) since April 2003; Non-Executive Director & Chairman, CNO Financial Group, Inc. (insurance), September 2003-May 2011 | | | 129 | | | Chairman, BofA Fund Series Trust (11 funds); former Director, CNO Financial Group, Inc. (insurance), 2003-2011 | |
Stephen R. Lewis, Jr.
901 S. Marquette Ave.
Minneapolis, MN 55402
1939 | | Board member for RiverSource Funds since 1/02 and since 6/11 for Nations Funds, Board Chair 1/07-12/13 | | President Emeritus and Professor of Economics Emeritus, Carleton College since 2002 | | | 131 | | | Director, Valmont Industries, Inc. (irrigation systems manufacturer), 2002-2013 | |
Catherine James Paglia
901 S. Marquette Ave.
Minneapolis, MN 55402
1952 | | Board member since 11/04 for RiverSource Funds and since 6/11 for Nations Funds | | Director, Enterprise Asset Management, Inc. (private real estate and asset management company) since September 1998 | | | 131 | | | Director, Valmont Industries, Inc. (irrigation systems manufacturer) since 2012 | |
Leroy C. Richie
901 S. Marquette Ave.
Minneapolis, MN 55402
1941 | | Board member since 2000 for Legacy Seligman Funds, since 11/08 for RiverSource Funds and since 6/11 for Nations Funds | | Counsel, Lewis & Munday, P.C. (law firm) since 2004; Vice President and General Counsel, Automotive Legal Affairs, Chrysler Corporation, 1993-1997 | | | 131 | | | Lead Outside Director, Digital Ally, Inc. (digital imaging) since September 2005; Director, Infinity, Inc. (oil and gas exploration and production) since 1994; Director, OGE Energy Corp. (energy and energy services) since November 2007 | |
Minor M. Shaw
901 S. Marquette Ave.
Minneapolis, MN 55402
1947 | | Board member since 6/11 for RiverSource Funds and since 2003 for Nations Funds | | President, Micco LLC (private investments) since 2011; President, Micco Corp. since 1998 | | | 129 | | | Director, Piedmont Natural Gas; Director, BlueCross BlueShield of South Carolina since April 2008; Director, National Association of Corporate Directors, Carolinas Chapter, since 2013; former Trustee, BofA Funds Series Trust (11 funds) | |
Annual Report 2014
41
Columbia Small Cap Index Fund
Trustees and Officers (continued)
Independent Trustees (continued)
Name,
Address,
Year of Birth | | Position Held With
Funds and Length of
Service | | Principal Occupation(s)
During Past Five Years
and Other Relevant
Professional Experience | | Number of
Funds in the
Fund Family
Overseen by
Board Member | | Other Present or Past
Directorships/
Trusteeships
(Within Past 5 Years) | |
Alison Taunton-Rigby
901 S. Marquette Ave.
Minneapolis, MN 55402
1944 | | Board member since 11/02 for RiverSource Funds and since 6/11 for Nations Funds | | Chief Executive Officer and Director, RiboNovix, Inc., (biotechnology) 2003-2010 | | | 131 | | | Director, Healthways, Inc. (health and wellbeing solutions) since 2005; Director, ICI Mutual Insurance Company, RRG since 2011; Director, Abt Associates (government contractor) since 2001; Director, Boston Children's Hospital since 2002 | |
Interested Trustee Not Affiliated with Investment Manager*
Name,
Address,
Year of Birth | | Position Held With
Funds and Length of
Service | | Principal Occupation(s)
During Past Five Years
and Other Relevant
Professional Experience | | Number of
Funds in the
Fund Family
Overseen by
Board Member | | Other Present or Past
Directorships/
Trusteeships
(Within Past 5 Years) | |
Anthony M. Santomero
901 S. Marquette Ave.
Minneapolis, MN 55402
1946 | | Board member since 6/11 for RiverSource Funds and since 1/08 for Nations Funds | | Richard K. Mellon Professor Emeritus of Finance, The Wharton School, University of Pennsylvania, since 2002; Senior Advisor, McKinsey & Company (consulting), 2006-2008 | | | 129 | | | Director, Renaissance Reinsurance Ltd. since May 2008; Trustee, Penn Mutual Life Insurance Company since March 2008; Director, Citigroup Inc. since 2009; Director, Citibank, N.A. since 2009; former Trustee, BofA Funds Series Trust (11 funds), 2008-2011 | |
* Dr. Santomero is not an affiliated person of the Investment Manager or Ameriprise Financial. However, he is currently deemed by the Funds to be an "interested person" (as defined in the 1940 Act) of the Funds because he serves as a Director of Citigroup Inc. and Citibank, N.A., companies that may directly or through subsidiaries and affiliates engage from time-to-time in brokerage execution, principal transactions and lending relationships with the Funds or accounts advised/managed by the Investment Manager.
Annual Report 2014
42
Columbia Small Cap Index Fund
Trustees and Officers (continued)
Interested Trustee Affiliated with Investment Manager*
Name,
Address,
Year of Birth | | Position Held With
Funds and Length of
Service | | Principal Occupation(s)
During Past Five Years
and Other Relevant
Professional Experience | | Number of
Funds in the
Fund Family
Overseen by
Board Member | | Other Present or Past
Directorships/
Trusteeships
(Within Past 5 Years) | |
William F. Truscott
53600 Ameriprise
Financial Center
Minneapolis, MN 55474
1960 | | Board member since 11/01 for RiverSource Funds and since 6/11 for Nations Funds; Senior Vice President since 2002 for RiverSource Funds and since 5/10 for Nations Funds | | Chairman of the Board and President, Columbia Management Investment Advisers, LLC since May 2010 and February 2012, respectively (previously President and Chief Investment Officer, 2001-April 2010); Chief Executive Officer, Global Asset Management, Ameriprise Financial, Inc. since September 2012 (previously Chief Executive Officer, U.S. Asset Management & President, Annuities, May 2010-September 2012 and President — U.S. Asset Management and Chief Investment Officer, 2005-April 2010); Director and Chief Executive Officer, Columbia Management Investment Distributors, Inc. since May 2010 and February 2012, respectively (previously Chairman of the Board and Chief Executive Officer, 2006-April 2010); Chairman of the Board and Chief Executive Officer, RiverSource Distributors, Inc. since 2006; Director, Threadneedle Asset Management Holdings, SARL since 2014; President and Chief Executive Officer, Ameriprise Certificate Company, 2006-August 2012 | | | 183 | | | Former Director, Ameriprise Certificate Company, 2006-January 2013 | |
* Interested person (as defined under the 1940 Act) by reason of being an officer, director, security holder and/or employee of the Investment Manager or Ameriprise Financial.
The SAI has additional information about the Fund's Board members and is available, without charge, upon request by calling 800.345.6611; contacting your financial intermediary or visiting columbiamanagement.com.
Annual Report 2014
43
Columbia Small Cap Index Fund
Trustees and Officers (continued)
The Board has appointed officers who are responsible for day-to-day business decisions based on policies it has established. The officers serve at the pleasure of the Board. In addition to Mr. Truscott, who is Senior Vice President, the Funds' other officers are:
Officers
Name,
Address and
Year of Birth | | Position and Year
First Appointed to
Position for any Fund
in the Columbia
Funds Complex or a
Predecessor Thereof | | Principal Occupation(s) During Past Five Years | |
J. Kevin Connaughton
225 Franklin Street
Boston, MA 02110
Born 1964 | | President and Principal Executive Officer (2009) | | Managing Director and General Manager — Mutual Fund Products, Columbia Management Investment Advisers, LLC since May 2010; and President, Columbia Funds since 2009; Managing Director, Columbia Management Advisors, LLC, December 2004 – April 2010; Senior Vice President and Chief Financial Officer, Columbia Funds, June 2008 – January 2009; and senior officer of Columbia Funds and affiliated funds since 2003 | |
Michael G. Clarke
225 Franklin Street
Boston, MA 02110
Born 1969 | | Treasurer (2011) and Chief Financial Officer (2009) | | Vice President — Mutual Fund Administration, Columbia Management Investment Advisers, LLC, since May 2010;Managing Director of Fund Administration, Columbia Management Advisors, LLC, September 2004 – April 2010; and senior officer of Columbia Funds and affiliated funds since 2002 | |
Scott R. Plummer
5228 Ameriprise Financial Center
Minneapolis, MN 55474
Born 1959 | | Senior Vice President (2006), Chief Legal Officer (2006) and Assistant Secretary (2011) | | Senior Vice President and Assistant General Counsel — Global Asset Management, Ameriprise Financial since February 2014 (previously, Senior Vice President and Lead Chief Counsel — Asset Management, 2012 – February 2014; Vice President and Lead Chief Counsel — Asset Management, 2010 – 2012; and Vice President and Chief Counsel — Asset Management, 2005 – 2010); Senior Vice President, Chief Legal Officer and Assistant Secretary, Columbia Management Investment Advisers, LLC since June 2005; Vice President, Chief Counsel and Assistant Secretary, Columbia Management Investment Distributors, Inc. since 2008; Vice President, General Counsel and Secretary, Ameriprise Certificate Company since 2005; Chief Counsel, RiverSource Distributors, Inc. since 2006; senior officer of Columbia Funds and affiliated funds since 2006 | |
Thomas P. McGuire
225 Franklin Street
Boston, MA 02110
Born 1972 | | Chief Compliance Officer (2012) | | Vice President — Asset Management Compliance, Ameriprise Financial, Inc. since May 2010; Chief Compliance Officer, Ameriprise Certificate Company, since September 2010; Compliance Executive, Bank of America, 2005 – April 2010 | |
Colin Moore
225 Franklin Street
Boston, MA 02110
Born 1958 | | Senior Vice President (2010) | | Executive Vice President and Global Chief Investment Officer, Ameriprise Financial, Inc. since July 2013; Director and Global Chief Investment Officer, Columbia Management Investment Advisers, LLC since May 2010; Manager, Managing Director and Chief Investment Officer, Columbia Management Advisors, LLC, 2007 – April 2010 | |
Michael E. DeFao
225 Franklin Street
Boston, MA 02110
Born 1968 | | Vice President (2011) and Assistant Secretary (2010) | | Vice President and Chief Counsel, Ameriprise Financial, Inc. since May 2010; Associate General Counsel, Bank of America 2005 – April 2010 | |
Joseph F. DiMaria
225 Franklin Street
Boston, MA 02110
Born 1968 | | Vice President (2011) and Chief Accounting Officer (2008) | | Vice President — Mutual Fund Treasurer, Columbia Management Investment Advisers, LLC since May 2010; Director of Fund Administration, Columbia Management Advisors, LLC, 2006 – April 2010 | |
Paul B. Goucher
100 Park Avenue
New York, NY 10017
Born 1968 | | Vice President (2011) and Assistant Secretary (2008) | | Vice President and Lead Chief Counsel, Ameriprise Financial, Inc. since November 2008 and January 2013, respectively (previously Chief Counsel, January 2010 – January 2013, and Group Counsel, November 2008 – January 2010); Director, Managing Director and General Counsel, J. & W. Seligman & Co. Incorporated, July 2008 – November 2008 | |
Amy Johnson
5228 Ameriprise Financial
Center
Minneapolis, MN 55474
Born 1965 | | Vice President (2006) | | Managing Director and Chief Operating Officer, Columbia Management Investment Advisers, LLC since May 2010 (previously Chief Administrative Officer, 2009 – April 2010, and Vice President — Asset Management and Trust Company Services, 2006 – 2009) | |
Annual Report 2014
44
Columbia Small Cap Index Fund
Trustees and Officers (continued)
Officers (continued)
Name,
Address and
Year of Birth | | Position and Year
First Appointed to
Position for any Fund
in the Columbia
Funds Complex or a
Predecessor Thereof | | Principal Occupation(s) During Past Five Years | |
Paul D. Pearson
5228 Ameriprise Financial
Center
Minneapolis, MN 55474
Born 1956 | | Vice President (2011) and Assistant Treasurer (1999) | | Vice President — Investment Accounting, Columbia Management Investment Advisers, LLC since May 2010; Vice President — Managed Assets, Investment Accounting, Ameriprise Financial, Inc., 1998 – April 2010 | |
Christopher O. Petersen
5228 Ameriprise Financial Center
Minneapolis, MN 55474
Born 1970 | | Vice President and Secretary (2010) | | Vice President and Chief Counsel, Ameriprise Financial, Inc., since January 2010 (previously Vice President and Group Counsel or Counsel, 2004 – January 2010); officer of Columbia Funds and affiliated funds since 2007 | |
Stephen T. Welsh
225 Franklin Street
Boston, MA 02110
Born 1957 | | Vice President (2006) | | President and Director, Columbia Management Investment Services Corp. since May 2010; President and Director, Columbia Management Services, Inc., 2004 – April 2010; Managing Director, Columbia Management Distributors, Inc., 2007 – April 2010 | |
Annual Report 2014
45
This page intentionally left blank.
Annual Report 2014
46
This page intentionally left blank.
Annual Report 2014
47
This page intentionally left blank.
Annual Report 2014
48
Columbia Small Cap Index Fund
Important Information About This Report
Each fund mails one shareholder report to each shareholder address. If you would like more than one report, please call shareholder services at 800.345.6611 and additional reports will be sent to you.
The policy of the Board is to vote the proxies of the companies in which each fund holds investments consistent with the procedures as stated in the Statement of Additional Information (SAI). You may obtain a copy of the SAI without charge by calling 800.345.6611; contacting your financial intermediary; visiting columbiamanagement.com; or searching the website of the Securities and Exchange Commission (SEC) at sec.gov. Information regarding how each fund voted proxies relating to portfolio securities is filed with the SEC by August 31 for the most recent 12-month period ending June 30 of that year, and is available without charge by visiting columbiamanagement.com; or searching the website of the SEC at sec.gov.
Each fund files a complete schedule of portfolio holdings with the SEC for the first and third quarters of each fiscal year on Form N-Q. Each fund's Form N-Q is available on the SEC's website at sec.gov and may be reviewed and copied at the SEC's Public Reference Room in Washington, D.C. Information on the operation of the Public Reference Room may be obtained by calling 800.SEC.0330. Each fund's complete schedule of portfolio holdings, as filed on Form N-Q, can also be obtained without charge, upon request, by calling 800.345.6611.
Annual Report 2014
49

Columbia Small Cap Index Fund
P.O. Box 8081
Boston, MA 02266-8081
columbiamanagement.com
This information is for use with concurrent or prior delivery of a fund prospectus. Please read and consider the investment objectives, risks, charges and expenses for any fund carefully before investing. For a prospectus and, if available, a summary prospectus, which contains this and other important information about the Fund go to columbiamanagement.com. The Fund is distributed by Columbia Management Investment Distributors, Inc., member FINRA, and managed by Columbia Management Investment Advisers, LLC.
© 2014 Columbia Management Investment Advisers, LLC. All rights reserved.
ANN228_02_D01_(04/14)
Annual Report
February 28, 2014

Columbia Large Cap Enhanced Core Fund
Not FDIC insured • No bank guarantee • May lose value
 Dear Shareholders,
Equities recovered
In the final months of 2013, the U.S. economy embraced a robust recovery. After five years of only modest progress, the pace of economic growth picked up, job gains continued, manufacturing activity accelerated and a rebound in the housing market showed staying power. Growth, as measured by gross domestic product, was 4.1% in the third quarter, with expectations for a solid fourth quarter. Job growth averaged close to 200,000 monthly. Industrial production rose at a rate of 3.3%, considerably higher than the 12-month average of 2.5%. Factories were busier than at any point since the 2008/2009 recession, with capacity utilization at 79%. Orders for durable goods were strong, bolstered by rising auto sales. Holiday spending was solid, especially online sales, which rose 10% year over year, despite a shorter season.
Against this backdrop, the Federal Reserve's (the Fed's) announcement that it would slowly retreat from its monthly bond buying program and a bipartisan budget deal in Washington were welcome news for investors. Stocks climbed to new highs in the fourth quarter, while bonds retreated as yields moved higher. Small-cap stocks outperformed large- and mid-cap stocks, led by significant gains from the industrials, technology and consumer discretionary sectors. All 10 sectors of the S&P 500 Index delivered positive returns, although telecommunications and utilities posted only modest gains.
Fixed-income retreated
Improved economic data drove interest rates higher over the fourth quarter, credit spreads narrowed and the dollar weakened against most developed market currencies. Against this backdrop, most non-Treasury, fixed-income sectors delivered positive returns. Outgoing Fed chairman Ben Bernanke expressed concern about the persistently low level of core inflation, but gains in the labor market and reduced unemployment led to the Fed's decision to taper its bond-buying program gradually beginning in January 2014.
As the stock market soared, the riskiest sectors of the fixed-income markets fared the best. U.S. and foreign high-yield bonds were the strongest performers, followed by emerging-market and U.S. investment-grade corporate bonds. U.S. mortgage-backed securities (MBS) and securitized bonds produced negative total returns, as did U.S. Treasuries and developed world government bonds. Treasury inflation-protected bonds were the period's biggest losers. Investment-grade municipals delivered fractional gains, as better economic conditions helped steady state finances.
Stay on track with Columbia Management
Backed by more than 100 years of experience, Columbia Management is one of the nation's largest asset managers. At the heart of our success and, most importantly, that of our investors, are highly talented industry professionals, brought together by a unique way of working. At Columbia Management, reaching our performance goals matters, and how we reach them matters just as much.
Visit columbiamanagement.com for:
> The Columbia Management Perspectives blog, offering insights on current market events and investment opportunities
> Detailed up-to-date fund performance and portfolio information
> Quarterly fund commentaries
> Columbia Management Investor, our award-winning quarterly newsletter for shareholders
Thank you for your continued support of the Columbia Funds. We look forward to serving your investment needs for many years to come.
Best Regards,

J. Kevin Connaughton
President, Columbia Funds
Investing involves risk including the risk of loss of principal.
The S&P 500 Index, an unmanaged index, measures the performance of 500 widely held, large-capitalization U.S. stocks and is frequently used as a general measure of market performance. The Dow Jones Industrial Average is a price weighted average of 30 actively traded shares of blue chip US industrial corporations listed on the New York Stock Exchange. Indices are not available for investment, are not professionally managed and do not reflect sales charges, fees, brokerage commissions, taxes or other expenses of investing.
Investors should consider the investment objectives, risks, charges and expenses of a mutual fund carefully before investing. For a free prospectus and, if available, a summary prospectus, which contains this and other important information about a fund, visit columbiamanagement.com. The prospectus should be read carefully before investing.
Columbia Funds are distributed by Columbia Management Investment Distributors, Inc., member FINRA, and managed by Columbia Management Investment Advisers, LLC.
© 2014 Columbia Management Investment Advisers, LLC. All rights reserved.
Columbia Large Cap Enhanced Core Fund
Performance Overview | | | 2 | | |
Manager Discussion of Fund Performance | | | 4 | | |
Understanding Your Fund's Expenses | | | 6 | | |
Portfolio of Investments | | | 7 | | |
Statement of Assets and Liabilities | | | 13 | | |
Statement of Operations | | | 15 | | |
Statement of Changes in Net Assets | | | 16 | | |
Financial Highlights | | | 18 | | |
Notes to Financial Statements | | | 23 | | |
Report of Independent Registered
Public Accounting Firm | | | 30 | | |
Federal Income Tax Information | | | 31 | | |
Trustees and Officers | | | 32 | | |
Important Information About This Report | | | 41 | | |
Fund Investment Manager
Columbia Management Investment
Advisers, LLC
225 Franklin Street
Boston, MA 02110
Fund Distributor
Columbia Management Investment
Distributors, Inc.
225 Franklin Street
Boston, MA 02110
Fund Transfer Agent
Columbia Management Investment
Services Corp.
P.O. Box 8081
Boston, MA 02266-8081
For more information about any of the funds, please visit columbiamanagement.com or call 800.345.6611. Customer Service Representatives are available to answer your questions Monday through Friday from 8 a.m. to 7 p.m. Eastern time.
The views expressed in this report reflect the current views of the respective parties. These views are not guarantees of future performance and involve certain risks, uncertainties and assumptions that are difficult to predict, so actual outcomes and results may differ significantly from the views expressed. These views are subject to change at any time based upon economic, market or other conditions and the respective parties disclaim any responsibility to update such views. These views may not be relied on as investment advice and, because investment decisions for a Columbia Fund are based on numerous factors, may not be relied on as an indication of trading intent on behalf of any particular Columbia Fund. References to specific securities should not be construed as a recommendation or investment advice.
Columbia Large Cap Enhanced Core Fund
Performance Summary
> Columbia Large Cap Enhanced Core Fund (the Fund) Class A shares returned 26.58% for the 12-month period that ended February 28, 2014.
> The Fund outperformed its benchmark, the S&P 500 Index, which returned 25.37% for the same 12-month period.
> Stock selection generally accounted for the Fund's performance advantage over the benchmark.
Average Annual Total Returns (%) (for period ended February 28, 2014)
| | Inception | | 1 Year | | 5 Years | | 10 Years | |
Class A | | 07/31/96 | | | 26.58 | | | | 22.76 | | | | 6.98 | | |
Class I* | | 09/27/10 | | | 27.06 | | | | 23.06 | | | | 7.11 | | |
Class R* | | 01/23/06 | | | 26.26 | | | | 22.45 | | | | 6.71 | | |
Class Y* | | 07/15/09 | | | 27.11 | | | | 23.19 | | | | 7.16 | | |
Class Z | | 07/31/96 | | | 27.03 | | | | 23.07 | | | | 7.25 | | |
S&P 500 Index | | | | | 25.37 | | | | 23.00 | | | | 7.16 | | |
All results shown assume reinvestment of distributions during the period. Returns do not reflect the deduction of taxes that a shareholder may pay on Fund distributions or on the redemption of Fund shares. Performance results reflect the effect of any fee waivers or reimbursements of Fund expenses by Columbia Management Investment Advisers, LLC and/or any of its affiliates. Absent these fee waivers or expense reimbursement arrangements, performance results would have been lower.
The performance information shown represents past performance and is not a guarantee of future results. The investment return and principal value of your investment will fluctuate so that your shares, when redeemed, may be worth more or less than their original cost. Current performance may be lower or higher than the performance information shown. You may obtain performance information current to the most recent month-end by contacting your financial intermediary, visiting columbiamanagement.com or calling 800.345.6611.
*The returns shown for periods prior to the share class inception date (including returns for the Life of the Fund, if shown, which are since Fund inception) include the returns of the Fund's oldest share class. Since the Fund launched than one share class at its inception, Class A shares were used. These returns are adjusted to reflect any higher class-related operating expenses of the newer share classes, as applicable. Please visit columbiamanagement.com/mutual-funds/appended-performance for more information.
The S&P 500 Index, an unmanaged index, measures the performance of 500 widely held, large-capitalization U.S. stocks and is frequently used as a general measure of market performance.
Indices are not available for investment, are not professionally managed and do not reflect sales charges, fees, brokerage commissions, taxes or other expenses of investing. Securities in the Fund may not match those in an index.
Annual Report 2014
2
Columbia Large Cap Enhanced Core Fund
Performance Overview (continued)
Performance of a Hypothetical $10,000 Investment (March 1, 2004 – February 28, 2014)
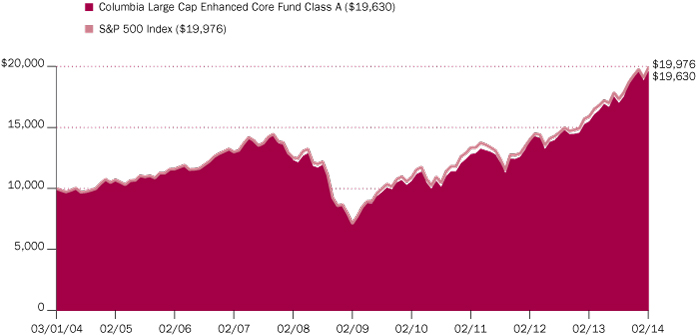
The chart above shows the change in value of a hypothetical $10,000 investment in Class A shares of Columbia Large Cap Enhanced Core Fund during the stated time period, and does not reflect the deduction of taxes that a shareholder may pay on Fund distributions or on the redemption of Fund shares.
Annual Report 2014
3
Columbia Large Cap Enhanced Core Fund
Manager Discussion of Fund Performance
For the 12-month period that ended February 28, 2014, the Fund's Class A shares returned 26.58%. The Fund outperformed its benchmark, the S&P 500 Index, which returned 25.37% for the same time period. Stock selection generally accounted for the Fund's performance advantage relative to the benchmark, most notably within industrials, consumer staples, information technology and health care. Sector allocation modestly detracted from relative results, as did security selection within the consumer discretionary and energy sectors. Overall, we seek positive returns relative to the benchmark through stock selection and not sector allocation.
Stocks Rose in a Favorable Market Environment
Steady job growth, a solid rebound in the housing market and increased manufacturing activity drove economic growth modestly higher over the 12-month period that ended February 28, 2014. Pent-up demand, low mortgage rates and an improving labor market helped home sales advance. Foreclosure activity trended downward. After a brief pullback, manufacturing activity picked up midway through the period and remained strong. Business surveys and recent demand measures suggest to us that business spending may be poised to pick up.
Even though a host of concerns weighed on investors — the impact of tax increases and enforced federal spending cuts, another showdown over the U.S. debt ceiling, the possibility of an attack on Syria and uncertainty regarding the timing of the Federal Reserve's (the Fed's) next move on monetary policy — prices on stocks moved higher as central banks continued to pour liquidity into key markets. Midway through the period, the Fed's talk about removing monetary support dampened investor enthusiasm. However, once the Fed chose not to act until 2014, the market rally rebooted. In fact, U.S. equities posted their most significant gains since the late 1990s.
Investors Continued to Favor Risk
A market rally that began in 2012 continued into 2013 and beginning of 2014 and, once again, the riskiest stocks generated the best performance during the period. Within the benchmark, the stocks with the highest beta, a measure of volatility, outperformed stocks with the lowest beta by more than 15 percentage points. The quintile of stocks with the greatest growth characteristics outperformed those that were more value-oriented by approximately 20 percentage points. Non-dividend paying stocks outperformed the highest quartile of dividend paying stocks by more than 25 percentage points. Within the benchmark, smaller-cap stocks outperformed larger-cap stocks, while small-and mid-cap stocks outperformed large-cap stocks across the entire U.S. equity market.
The components of the Fund's stock selection model were consistent with the risk-on trend. We divide the metrics for our stock selection model into three broad categories: valuation (fundamental measures such as earnings and cash flow relative to market values), catalyst (price momentum and business momentum), and quality (quality of earnings and financial strength). The stocks that we consider to have the strongest valuations and appeared inexpensive relative to their peers (top 20% of stocks in the benchmark, ranked using our aggregate quality score) outperformed stocks with weaker valuations. Stocks scored on our catalyst measures were more neutral, with the highest ranked only modestly outperforming the lower catalyst quintiles. Quality measures were mixed.
Portfolio Management
Brian Condon, CFA
Oliver Buckley
Morningstar Style BoxTM
The Morningstar Style BoxTM is based on a fund's portfolio holdings. For equity funds, the vertical axis shows the market capitalization of the stocks owned, and the horizontal axis shows investment style (value, blend, or growth). Information shown is based on the most recent data provided by Morningstar.
© 2014 Morningstar, Inc. All rights reserved. The Morningstar information contained herein: (1) is proprietary to Morningstar and/or its content providers; (2) may not be copied or distributed; and (3) is not warranted to be accurate, complete or timely. Neither Morningstar nor its content providers are responsible for any damages or losses arising from any use of this information.
Top Ten Holdings (%)
(at February 28, 2014) | |
Apple, Inc. | | | 3.7 | | |
Google, Inc., Class A | | | 2.6 | | |
Microsoft Corp. | | | 2.5 | | |
Pfizer, Inc. | | | 2.1 | | |
Merck & Co., Inc. | | | 1.9 | | |
Exxon Mobil Corp. | | | 1.8 | | |
Oracle Corp. | | | 1.6 | | |
Comcast Corp., Class A | | | 1.6 | | |
Verizon Communications, Inc. | | | 1.6 | | |
QUALCOMM, Inc. | | | 1.5 | | |
Percentages indicated are based upon total investments (excluding Money Market Funds).
For further detail about these holdings, please refer to the section entitled "Portfolio of Investments."
Fund holdings are as of the date given, are subject to change at any time, and are not recommendations to buy or sell any security.
Annual Report 2014
4
Columbia Large Cap Enhanced Core Fund
Manager Discussion of Fund Performance (continued)
Security Selection Drove Performance
Security selection was the primary contributor to performance relative to the benchmark, most notably within industrials, consumer staples and health care. In the industrials sector, airlines as an industry did well during the period. Business and leisure travel have picked up with a strengthening economy and fares have increased. As a result, the Fund's position in Southwest Airlines benefited from positive earnings and revenues, raising its share price during the period. Within the aerospace industry, Raytheon benefited from strong earnings despite the federal government's enforced spending cuts, known as the sequestration, and a federal government shutdown. Large contract wins and continued strong international opportunities helped offset the impact of both factors. In the consumer staples sector, Tyson Foods was a standout performer as the company benefited from its diversified business model and its ability to increase earnings in different environments. In the health care sector, the Fund benefited from overweight positions relative to the index in St. Jude Medical and Gilead Sciences, both strong performers for the period.
The Fund gave up ground due to stock selection in the consumer discretionary and energy sectors. In the consumer discretionary sector, Best Buy was up strongly over the entire period but traded down sharply after announcing its fourth quarter 2013 earnings and disappointing holiday sales. Because the Fund bought the stock in the third quarter, it sustained a loss on the position. In the energy sector, disappointments were small but widespread across both equipment and services and the oil and gas industries. The single biggest disappointment for the period was missing out of the strong gains generated by Bank of America, a stock that we did not own for the majority of the period. Banks, as a whole, did well as the economy improved, interest rates moved higher and the capital markets remained strong. In this environment, Bank of America shares rose more than 49%.
Portfolio Activity
During the 12-month period, we established new positions in several names, including Caterpillar, Phillips 66, Medtronic, Starbucks and BlackRock. We liquidated positions in Bristol-Myers Squibb, Danaher, TJX, EMC, Discovery Communications and DIRECTV, among others.
Looking Ahead
Our investment strategy is based on individual quantitative stock selection. Consequently, we do not rely on macroeconomic scenarios or market outlooks to make security selections. We do not try to predict when equities, or any other asset class, will perform well or poorly. Instead, we seek to keep the Fund substantially invested in equities at all times. We will continue to work to enhance our quantitative models and focus portfolio holdings on our three themes of valuation, catalyst and quality.
Portfolio Breakdown (%)
(at February 28, 2014) | |
Common Stocks | | | 97.9 | | |
Consumer Discretionary | | | 11.8 | | |
Consumer Staples | | | 9.2 | | |
Energy | | | 9.5 | | |
Financials | | | 15.6 | | |
Health Care | | | 13.7 | | |
Industrials | | | 10.8 | | |
Information Technology | | | 18.5 | | |
Materials | | | 3.8 | | |
Telecommunication Services | | | 1.9 | | |
Utilities | | | 3.1 | | |
Money Market Funds | | | 2.1 | | |
Total | | | 100.0 | | |
Percentages indicated are based upon total investments. The Fund's portfolio composition is subject to change.
Investment Risks — The Fund is subject to stock market fluctuations and changes in the values of specific fund holdings due to economic and business developments. See the Fund's prospectus for information on these and other risks.
Annual Report 2014
5
Columbia Large Cap Enhanced Core Fund
Understanding Your Fund's Expenses
(Unaudited)
As an investor, you incur two types of costs. There are transaction costs, which generally include sales charges on purchases and may include redemption fees. There are also ongoing costs, which generally include management fees, distribution and/or service fees, and other fund expenses. The following information is intended to help you understand your ongoing costs (in dollars) of investing in the Fund and to help you compare these costs with the ongoing costs of investing in other mutual funds.
Analyzing Your Fund's Expenses
To illustrate these ongoing costs, we have provided examples and calculated the expenses paid by investors in each share class of the Fund during the period. The actual and hypothetical information in the table is based on an initial investment of $1,000 at the beginning of the period indicated and held for the entire period. Expense information is calculated two ways and each method provides you with different information. The amount listed in the "Actual" column is calculated using the Fund's actual operating expenses and total return for the period. You may use the Actual information, together with the amount invested, to estimate the expenses that you paid over the period. Simply divide your account value by $1,000 (for example, an $8,600 account value divided by $1,000 = 8.6), then multiply the results by the expenses paid during the period under the "Actual" column. The amount listed in the "Hypothetical" column assumes a 5% annual rate of return before expenses (which is not the Fund's actual return) and then applies the Fund's actual expense ratio for the period to the hypothetical return. You should not use the hypothetical account values and expenses to estimate either your actual account balance at the end of the period or the expenses you paid during the period. See "Compare With Other Funds" below for details on how to use the hypothetical data.
Compare With Other Funds
Since all mutual funds are required to include the same hypothetical calculations about expenses in shareholder reports, you can use this information to compare the ongoing cost of investing in the Fund with other funds. To do so, compare the hypothetical example with the 5% hypothetical examples that appear in the shareholder reports of other funds. As you compare hypothetical examples of other funds, it is important to note that hypothetical examples are meant to highlight the ongoing costs of investing in a fund only and do not reflect any transaction costs, such as sales charges, or redemption or exchange fees. Therefore, the hypothetical calculations are useful in comparing ongoing costs only, and will not help you determine the relative total costs of owning different funds. If transaction costs were included in these calculations, your costs would be higher.
September 1, 2013 – February 28, 2014
| | Account Value at the Beginning
of the Period ($) | | Account Value at the End of the
Period ($) | | Expenses Paid During the
Period ($) | | Fund's Annualized
Expense Ratio (%) | |
| | Actual | | Hypothetical | | Actual | | Hypothetical | | Actual | | Hypothetical | | Actual | |
Class A | | | 1,000.00 | | | | 1,000.00 | | | | 1,154.30 | | | | 1,020.44 | | | | 4.83 | | | | 4.53 | | | | 0.90 | | |
Class I | | | 1,000.00 | | | | 1,000.00 | | | | 1,156.20 | | | | 1,022.49 | | | | 2.63 | | | | 2.47 | | | | 0.49 | | |
Class R | | | 1,000.00 | | | | 1,000.00 | | | | 1,153.00 | | | | 1,019.20 | | | | 6.17 | | | | 5.79 | | | | 1.15 | | |
Class Y | | | 1,000.00 | | | | 1,000.00 | | | | 1,156.80 | | | | 1,022.49 | | | | 2.63 | | | | 2.47 | | | | 0.49 | | |
Class Z | | | 1,000.00 | | | | 1,000.00 | | | | 1,155.40 | | | | 1,021.69 | | | | 3.49 | | | | 3.28 | | | | 0.65 | | |
Expenses paid during the period are equal to the annualized expense ratio for each class as indicated above, multiplied by the average account value over the period and then multiplied by the number of days in the Fund's most recent fiscal half year and divided by 365.
Expenses do not include fees and expenses incurred indirectly by the Fund from the underlying funds in which the Fund may invest (also referred to as "acquired funds"), including affiliated and non-affiliated pooled investment vehicles (including mutual funds and exchange-traded funds).
Had Columbia Management Investment Advisers, LLC and/or certain of its affiliates not waived/reimbursed certain fees and expenses, account value at the end of the period would have been reduced.
Annual Report 2014
6
Columbia Large Cap Enhanced Core Fund
Portfolio of Investments
February 28, 2014
(Percentages represent value of investments compared to net assets)
Common Stocks 98.0%
Issuer | | Shares | | Value ($) | |
Consumer Discretionary 11.8% | |
Auto Components 0.6% | |
Delphi Automotive PLC | | | 23,100 | | | | 1,537,767 | | |
Diversified Consumer Services 0.8% | |
Graham Holdings Co., Class B | | | 2,900 | | | | 2,084,230 | | |
Hotels, Restaurants & Leisure 0.5% | |
Starbucks Corp. | | | 3,500 | | | | 248,360 | | |
Wynn Resorts Ltd. | | | 4,700 | | | | 1,139,703 | | |
Total | | | | | 1,388,063 | | |
Household Durables 0.9% | |
Harman International Industries, Inc. | | | 3,800 | | | | 397,974 | | |
Whirlpool Corp. | | | 12,900 | | | | 1,865,727 | | |
Total | | | | | 2,263,701 | | |
Internet & Catalog Retail 1.3% | |
Amazon.com, Inc.(a) | | | 600 | | | | 217,260 | | |
priceline.com, Inc.(a) | | | 2,500 | | | | 3,372,100 | | |
Total | | | | | 3,589,360 | | |
Media 3.5% | |
Comcast Corp., Class A | | | 82,700 | | | | 4,274,763 | | |
DIRECTV(a) | | | 3,500 | | | | 271,600 | | |
Time Warner Cable, Inc. | | | 16,800 | | | | 2,357,880 | | |
Viacom, Inc., Class B | | | 29,600 | | | | 2,596,808 | | |
Total | | | | | 9,501,051 | | |
Specialty Retail 3.4% | |
AutoZone, Inc.(a) | | | 500 | | | | 269,220 | | |
Best Buy Co., Inc. | | | 46,000 | | | | 1,224,980 | | |
GameStop Corp., Class A | | | 39,400 | | | | 1,470,014 | | |
Home Depot, Inc. (The) | | | 48,800 | | | | 4,003,064 | | |
Lowe's Companies, Inc. | | | 32,100 | | | | 1,605,963 | | |
Staples, Inc. | | | 47,400 | | | | 644,166 | | |
Total | | | | | 9,217,407 | | |
Textiles, Apparel & Luxury Goods 0.8% | |
VF Corp. | | | 37,800 | | | | 2,214,702 | | |
Total Consumer Discretionary | | | | | 31,796,281 | | |
Consumer Staples 9.2% | |
Beverages 0.4% | |
Coca-Cola Co. (The) | | | 10,800 | | | | 412,560 | | |
PepsiCo, Inc. | | | 9,500 | | | | 760,665 | | |
Total | | | | | 1,173,225 | | |
Common Stocks (continued)
Issuer | | Shares | | Value ($) | |
Food & Staples Retailing 2.5% | |
CVS Caremark Corp. | | | 50,900 | | | | 3,722,826 | | |
Kroger Co. (The) | | | 57,900 | | | | 2,428,326 | | |
Wal-Mart Stores, Inc. | | | 7,300 | | | | 545,310 | | |
Total | | | | | 6,696,462 | | |
Food Products 1.9% | |
Archer-Daniels-Midland Co. | | | 56,400 | | | | 2,289,840 | | |
Hershey Co. (The) | | | 3,500 | | | | 370,370 | | |
Tyson Foods, Inc., Class A | | | 62,100 | | | | 2,449,845 | | |
Total | | | | | 5,110,055 | | |
Household Products 1.5% | |
Kimberly-Clark Corp. | | | 24,000 | | | | 2,648,400 | | |
Procter & Gamble Co. (The) | | | 18,300 | | | | 1,439,478 | | |
Total | | | | | 4,087,878 | | |
Tobacco 2.9% | |
Altria Group, Inc. | | | 85,500 | | | | 3,100,230 | | |
Lorillard, Inc. | | | 47,200 | | | | 2,315,632 | | |
Philip Morris International, Inc. | | | 28,100 | | | | 2,273,571 | | |
Total | | | | | 7,689,433 | | |
Total Consumer Staples | | | | | 24,757,053 | | |
Energy 9.5% | |
Energy Equipment & Services 0.9% | |
National Oilwell Varco, Inc. | | | 32,100 | | | | 2,472,984 | | |
Oil, Gas & Consumable Fuels 8.6% | |
Anadarko Petroleum Corp. | | | 31,100 | | | | 2,617,376 | | |
Chevron Corp. | | | 28,800 | | | | 3,321,504 | | |
ConocoPhillips | | | 49,900 | | | | 3,318,350 | | |
Exxon Mobil Corp. | | | 50,000 | | | | 4,813,500 | | |
Marathon Petroleum Corp. | | | 19,800 | | | | 1,663,200 | | |
Murphy Oil Corp. | | | 31,500 | | | | 1,870,155 | | |
Phillips 66 | | | 39,500 | | | | 2,956,970 | | |
Valero Energy Corp. | | | 53,200 | | | | 2,552,536 | | |
Total | | | | | 23,113,591 | | |
Total Energy | | | | | 25,586,575 | | |
Financials 15.6% | |
Capital Markets 2.9% | |
BlackRock, Inc. | | | 8,800 | | | | 2,682,592 | | |
Goldman Sachs Group, Inc. (The) | | | 18,600 | | | | 3,095,970 | | |
State Street Corp. | | | 33,000 | | | | 2,167,110 | | |
Total | | | | | 7,945,672 | | |
The accompanying Notes to Financial Statements are an integral part of this statement.
Annual Report 2014
7
Columbia Large Cap Enhanced Core Fund
Portfolio of Investments (continued)
February 28, 2014
Common Stocks (continued)
Issuer | | Shares | | Value ($) | |
Commercial Banks 3.3% | |
Comerica, Inc. | | | 46,900 | | | | 2,259,642 | | |
Fifth Third Bancorp | | | 98,200 | | | | 2,130,449 | | |
KeyCorp | | | 160,400 | | | | 2,112,468 | | |
Wells Fargo & Co. | | | 51,300 | | | | 2,381,346 | | |
Total | | | | | 8,883,905 | | |
Consumer Finance 1.8% | |
Capital One Financial Corp. | | | 26,500 | | | | 1,945,895 | | |
Discover Financial Services | | | 44,000 | | | | 2,524,720 | | |
SLM Corp. | | | 21,200 | | | | 507,528 | | |
Total | | | | | 4,978,143 | | |
Diversified Financial Services 2.5% | |
Bank of America Corp. | | | 53,000 | | | | 876,090 | | |
Berkshire Hathaway, Inc., Class B(a) | | | 11,700 | | | | 1,354,626 | | |
Citigroup, Inc. | | | 11,900 | | | | 578,697 | | |
JPMorgan Chase & Co. | | | 53,500 | | | | 3,039,870 | | |
McGraw Hill Financial, Inc. | | | 11,900 | | | | 947,954 | | |
Total | | | | | 6,797,237 | | |
Insurance 3.2% | |
ACE Ltd. | | | 14,600 | | | | 1,428,902 | | |
Aon PLC | | | 16,800 | | | | 1,438,080 | | |
Assurant, Inc. | | | 2,000 | | | | 131,260 | | |
Lincoln National Corp. | | | 42,400 | | | | 2,125,512 | | |
MetLife, Inc. | | | 12,600 | | | | 638,442 | | |
Prudential Financial, Inc. | | | 32,300 | | | | 2,731,934 | | |
Total | | | | | 8,494,130 | | |
Real Estate Investment Trusts (REITs) 1.9% | |
Public Storage | | | 15,000 | | | | 2,535,000 | | |
Simon Property Group, Inc. | | | 15,700 | | | | 2,532,253 | | |
Total | | | | | 5,067,253 | | |
Total Financials | | | | | 42,166,340 | | |
Health Care 13.7% | |
Biotechnology 2.5% | |
Amgen, Inc. | | | 6,500 | | | | 806,130 | | |
Biogen Idec, Inc.(a) | | | 3,400 | | | | 1,158,312 | | |
Celgene Corp.(a) | | | 9,150 | | | | 1,470,862 | | |
Gilead Sciences, Inc.(a) | | | 34,700 | | | | 2,872,813 | | |
Vertex Pharmaceuticals, Inc.(a) | | | 6,100 | | | | 493,246 | | |
Total | | | | | 6,801,363 | | |
Common Stocks (continued)
Issuer | | Shares | | Value ($) | |
Health Care Equipment & Supplies 2.8% | |
Boston Scientific Corp.(a) | | | 39,500 | | | | 517,450 | | |
Covidien PLC | | | 25,700 | | | | 1,849,115 | | |
CR Bard, Inc. | | | 15,100 | | | | 2,176,816 | | |
Medtronic, Inc. | | | 49,000 | | | | 2,903,740 | | |
Total | | | | | 7,447,121 | | |
Health Care Providers & Services 2.0% | |
Cardinal Health, Inc. | | | 6,500 | | | | 464,945 | | |
CIGNA Corp. | | | 19,000 | | | | 1,512,210 | | |
Express Scripts Holding Co.(a) | | | 12,800 | | | | 963,968 | | |
WellPoint, Inc. | | | 26,300 | | | | 2,382,517 | | |
Total | | | | | 5,323,640 | | |
Pharmaceuticals 6.4% | |
Eli Lilly & Co. | | | 53,800 | | | | 3,207,018 | | |
Johnson & Johnson | | | 39,400 | | | | 3,629,528 | | |
Merck & Co., Inc. | | | 86,600 | | | | 4,935,334 | | |
Pfizer, Inc. | | | 172,100 | | | | 5,526,131 | | |
Total | | | | | 17,298,011 | | |
Total Health Care | | | | | 36,870,135 | | |
Industrials 10.8% | |
Aerospace & Defense 3.8% | |
General Dynamics Corp. | | | 22,100 | | | | 2,420,834 | | |
Lockheed Martin Corp. | | | 16,900 | | | | 2,742,870 | | |
Northrop Grumman Corp. | | | 20,500 | | | | 2,481,115 | | |
Raytheon Co. | | | 25,400 | | | | 2,486,914 | | |
Total | | | | | 10,131,733 | | |
Air Freight & Logistics 1.1% | |
United Parcel Service, Inc., Class B | | | 31,800 | | | | 3,045,486 | | |
Airlines 1.0% | |
Southwest Airlines Co. | | | 117,400 | | | | 2,634,456 | | |
Electrical Equipment 1.0% | |
Emerson Electric Co. | | | 41,700 | | | | 2,721,342 | | |
Industrial Conglomerates 0.8% | |
General Electric Co. | | | 82,900 | | | | 2,111,463 | | |
Machinery 2.9% | |
Caterpillar, Inc. | | | 32,700 | | | | 3,170,919 | | |
Illinois Tool Works, Inc. | | | 29,400 | | | | 2,425,500 | | |
Pentair Ltd. | | | 28,800 | | | | 2,327,328 | | |
Total | | | | | 7,923,747 | | |
The accompanying Notes to Financial Statements are an integral part of this statement.
Annual Report 2014
8
Columbia Large Cap Enhanced Core Fund
Portfolio of Investments (continued)
February 28, 2014
Common Stocks (continued)
Issuer | | Shares | | Value ($) | |
Professional Services 0.1% | |
Dun & Bradstreet Corp. (The) | | | 4,300 | | | | 426,603 | | |
Road & Rail 0.1% | |
Union Pacific Corp. | | | 800 | | | | 144,304 | | |
Total Industrials | | | | | 29,139,134 | | |
Information Technology 18.5% | |
Communications Equipment 2.9% | |
Cisco Systems, Inc. | | | 178,000 | | | | 3,880,400 | | |
QUALCOMM, Inc. | | | 54,000 | | | | 4,065,660 | | |
Total | | | | | 7,946,060 | | |
Computers & Peripherals 3.8% | |
Apple, Inc. | | | 18,425 | | | | 9,695,972 | | |
Western Digital Corp. | | | 5,400 | | | | 469,746 | | |
Total | | | | | 10,165,718 | | |
Internet Software & Services 3.5% | |
Facebook, Inc., Class A(a) | | | 7,700 | | | | 527,142 | | |
Google, Inc., Class A(a) | | | 5,600 | | | | 6,807,640 | | |
VeriSign, Inc.(a) | | | 38,000 | | | | 2,094,180 | | |
Total | | | | | 9,428,962 | | |
IT Services 1.9% | |
Accenture PLC, Class A | | | 8,200 | | | | 683,470 | | |
International Business Machines Corp. | | | 5,600 | | | | 1,036,952 | | |
MasterCard, Inc., Class A | | | 44,400 | | | | 3,450,768 | | |
Total | | | | | 5,171,190 | | |
Semiconductors & Semiconductor Equipment 1.5% | |
Broadcom Corp., Class A | | | 49,300 | | | | 1,465,196 | | |
First Solar, Inc.(a) | | | 14,200 | | | | 810,394 | | |
Intel Corp. | | | 67,400 | | | | 1,668,824 | | |
Total | | | | | 3,944,414 | | |
Software 4.9% | |
CA, Inc. | | | 68,700 | | | | 2,301,450 | | |
Microsoft Corp.(b) | | | 175,000 | | | | 6,704,250 | | |
Oracle Corp. | | | 110,300 | | | | 4,313,833 | | |
Total | | | | | 13,319,533 | | |
Total Information Technology | | | | | 49,975,877 | | |
Common Stocks (continued)
Issuer | | Shares | | Value ($) | |
Materials 3.8% | |
Chemicals 2.9% | |
CF Industries Holdings, Inc. | | | 9,500 | | | | 2,383,550 | | |
LyondellBasell Industries NV, Class A | | | 33,000 | | | | 2,906,640 | | |
PPG Industries, Inc. | | | 13,300 | | | | 2,631,006 | | |
Total | | | | | 7,921,196 | | |
Paper & Forest Products 0.9% | |
International Paper Co. | | | 49,600 | | | | 2,424,944 | | |
Total Materials | | | | | 10,346,140 | | |
Telecommunication Services 2.0% | |
Diversified Telecommunication Services 2.0% | |
AT&T, Inc. | | | 34,000 | | | | 1,085,620 | | |
Verizon Communications, Inc. | | | 87,700 | | | | 4,172,766 | | |
Total | | | | | 5,258,386 | | |
Total Telecommunication Services | | | | | 5,258,386 | | |
Utilities 3.1% | |
Electric Utilities 0.8% | |
Exelon Corp. | | | 67,200 | | | | 2,043,552 | | |
Independent Power Producers & Energy Traders 0.8% | |
AES Corp. (The) | | | 152,200 | | | | 2,077,530 | | |
Multi-Utilities 1.5% | |
Ameren Corp. | | | 38,500 | | | | 1,555,785 | | |
Public Service Enterprise Group, Inc. | | | 69,900 | | | | 2,562,534 | | |
Total | | | | | 4,118,319 | | |
Total Utilities | | | | | 8,239,401 | | |
Total Common Stocks
(Cost: $184,146,328) | | | | | 264,135,322 | | |
Money Market Funds 2.1%
| | | Shares | | Value ($) | |
Columbia Short-Term Cash Fund,
0.098%(c)(d) | | | 5,596,363 | | | | 5,596,363 | | |
Total Money Market Funds
(Cost: $5,596,363) | | | | | 5,596,363 | | |
Total Investments
(Cost: $189,742,691) | | | | | 269,731,685 | | |
Other Assets & Liabilities, Net | | | | | (315,374 | ) | |
Net Assets | | | | | 269,416,311 | | |
The accompanying Notes to Financial Statements are an integral part of this statement.
Annual Report 2014
9
Columbia Large Cap Enhanced Core Fund
Portfolio of Investments (continued)
February 28, 2014
Investments in Derivatives
Futures Contracts Outstanding at February 28, 2014
At February 28, 2014, securities totaling $509,523 were pledged as collateral to cover initial margin requirements on open futures contracts.
Contract Description | | Number of
Contracts
Long (Short) | | Trading
Currency | | Notional
Market
Value ($) | | Expiration
Date | | Unrealized
Appreciation ($) | | Unrealized
Depreciation ($) | |
S&P 500 INDEX | | | 12 | | | USD | | | | | 5,572,800 | | | March 2014 | | | 206,209 | | | | — | | |
Notes to Portfolio of Investments
(a) Non-income producing.
(b) This security, or a portion of this security, has been pledged as collateral in connection with open futures contracts. These values are denoted within the Investments in Derivatives section of the Portfolio of Investments.
(c) The rate shown is the seven-day current annualized yield at February 28, 2014.
(d) As defined in the Investment Company Act of 1940, an affiliated company is one in which the Fund owns 5% or more of its outstanding voting securities, or a company which is under common ownership or control with the Fund. Holdings and transactions in these affiliated companies during the year ended February 28, 2014, are as follows:
Issuer | | Beginning
Cost ($) | | Purchase
Cost ($) | | Proceeds
From Sales ($) | | Ending
Cost ($) | | Dividends —
Affiliated
Issuers ($) | | Value ($) | |
Columbia Short-Term Cash Fund | | | 7,247,525 | | | | 117,594,718 | | | | (119,245,880 | ) | | | 5,596,363 | | | | 5,390 | | | | 5,596,363 | | |
Currency Legend
USD US Dollar
Fair Value Measurements
Generally accepted accounting principles (GAAP) require disclosure regarding the inputs and valuation techniques used to measure fair value and any changes in valuation inputs or techniques. In addition, investments shall be disclosed by major category.
The Fund categorizes its fair value measurements according to a three-level hierarchy that maximizes the use of observable inputs and minimizes the use of unobservable inputs by prioritizing that the most observable input be used when available. Observable inputs are those that market participants would use in pricing an investment based on market data obtained from sources independent of the reporting entity. Unobservable inputs are those that reflect the Fund's assumptions about the information market participants would use in pricing an investment. An investment's level within the fair value hierarchy is based on the lowest level of any input that is deemed significant to the asset or liability's fair value measurement. The input levels are not necessarily an indication of the risk or liquidity associated with investments at that level. For example, certain U.S. government securities are generally high quality and liquid, however, they are reflected as Level 2 because the inputs used to determine fair value may not always be quoted prices in an active market.
Fair value inputs are summarized in the three broad levels listed below:
> Level 1 — Valuations based on quoted prices for investments in active markets that the Fund has the ability to access at the measurement date (including NAV for open-end mutual funds). Valuation adjustments are not applied to Level 1 investments.
> Level 2 — Valuations based on other significant observable inputs (including quoted prices for similar securities, interest rates, prepayment speeds, credit risks, etc.).
> Level 3 — Valuations based on significant unobservable inputs (including the Fund's own assumptions and judgment in determining the fair value of investments).
The accompanying Notes to Financial Statements are an integral part of this statement.
Annual Report 2014
10
Columbia Large Cap Enhanced Core Fund
Portfolio of Investments (continued)
February 28, 2014
Fair Value Measurements (continued)
Inputs that are used in determining fair value of an investment may include price information, credit data, volatility statistics, and other factors. These inputs can be either observable or unobservable. The availability of observable inputs can vary between investments, and is affected by various factors such as the type of investment, and the volume and level of activity for that investment or similar investments in the marketplace. The inputs will be considered by the Investment Manager, along with any other relevant factors in the calculation of an investment's fair value. The Fund uses prices and inputs that are current as of the measurement date, which may include periods of market dislocations. During these periods, the availability of prices and inputs may be reduced for many investments. This condition could cause an investment to be reclassified between the various levels within the hierarchy.
Investments falling into the Level 3 category are primarily supported by quoted prices from brokers and dealers participating in the market for those investments. However, these may be classified as Level 3 investments due to lack of market transparency and corroboration to support these quoted prices. Additionally, valuation models may be used as the pricing source for any remaining investments classified as Level 3. These models may rely on one or more significant unobservable inputs and/or significant assumptions by the Investment Manager. Inputs used in valuations may include, but are not limited to, financial statement analysis, capital account balances, discount rates and estimated cash flows, and comparable company data.
Under the direction of the Fund's Board of Trustees (the Board), the Investment Manager's Valuation Committee (the Committee) is responsible for overseeing the valuation procedures approved by the Board. The Committee consists of voting and non-voting members from various groups within the Investment Manager's organization, including operations and accounting, trading and investments, compliance, risk management and legal.
The Committee meets at least monthly to review and approve valuation matters, which may include a description of specific valuation determinations, data regarding pricing information received from approved pricing vendors and brokers and the results of Board-approved valuation control policies and procedures (the Policies). The Policies address, among other things, instances when market quotations are or are not readily available, including recommendations of third party pricing vendors and a determination of appropriate pricing methodologies; events that require specific valuation determinations and assessment of fair value techniques; securities with a potential for stale pricing, including those that are illiquid, restricted, or in default; and the effectiveness of third party pricing vendors, including periodic reviews of vendors. The Committee meets more frequently, as needed, to discuss additional valuation matters, which may include the need to review back-testing results, review time-sensitive information or approve related valuation actions. The Committee reports to the Board, with members of the Committee meeting with the Board at each of its regularly scheduled meetings to discuss valuation matters and actions during the period, similar to those described earlier.
For investments categorized as Level 3, the Committee monitors information similar to that described above, which may include: (i) data specific to the issuer or comparable issuers, (ii) general market or specific sector news and (iii) quoted prices and specific or similar security transactions. The Committee considers this data and any changes from prior periods in order to assess the reasonableness of observable and unobservable inputs, any assumptions or internal models used to value those securities and changes in fair value. This data is also used to corroborate, when available, information received from approved pricing vendors and brokers. Various factors impact the frequency of monitoring this information (which may occur as often as daily). However, the Committee may determine that changes to inputs, assumptions and models are not required as a result of the monitoring procedures performed.
The accompanying Notes to Financial Statements are an integral part of this statement.
Annual Report 2014
11
Columbia Large Cap Enhanced Core Fund
Portfolio of Investments (continued)
February 28, 2014
Fair Value Measurements (continued)
The following table is a summary of the inputs used to value the Fund's investments at February 28, 2014:
Description | | Level 1
Quoted Prices in Active
Markets for Identical
Assets ($) | | Level 2
Other Significant
Observable Inputs ($) | | Level 3
Significant
Unobservable Inputs ($) | | Total ($) | |
Equity Securities | |
Common Stocks | |
Consumer Discretionary | | | 31,796,281 | | | | — | | | | — | | | | 31,796,281 | | |
Consumer Staples | | | 24,757,053 | | | | — | | | | — | | | | 24,757,053 | | |
Energy | | | 25,586,575 | | | | — | | | | — | | | | 25,586,575 | | |
Financials | | | 42,166,340 | | | | — | | | | — | | | | 42,166,340 | | |
Health Care | | | 36,870,135 | | | | — | | | | — | | | | 36,870,135 | | |
Industrials | | | 29,139,134 | | | | — | | | | — | | | | 29,139,134 | | |
Information Technology | | | 49,975,877 | | | | — | | | | — | | | | 49,975,877 | | |
Materials | | | 10,346,140 | | | | — | | | | — | | | | 10,346,140 | | |
Telecommunication Services | | | 5,258,386 | | | | — | | | | — | | | | 5,258,386 | | |
Utilities | | | 8,239,401 | | | | — | | | | — | | | | 8,239,401 | | |
Total Equity Securities | | | 264,135,322 | | | | — | | | | — | | | | 264,135,322 | | |
Mutual Funds | |
Money Market Funds | | | 5,596,363 | | | | — | | | | — | | | | 5,596,363 | | |
Total Mutual Funds | | | 5,596,363 | | | | — | | | | — | | | | 5,596,363 | | |
Investments in Securities | | | 269,731,685 | | | | — | | | | — | | | | 269,731,685 | | |
Derivatives | |
Assets | |
Futures Contracts | | | 206,209 | | | | — | | | | — | | | | 206,209 | | |
Total | | | 269,937,894 | | | | — | | | | — | | | | 269,937,894 | | |
See the Portfolio of Investments for all investment classifications not indicated in the table.
There were no transfers of financial assets between levels during the period.
Derivative instruments are valued at unrealized appreciation (depreciation).
The accompanying Notes to Financial Statements are an integral part of this statement.
Annual Report 2014
12
Columbia Large Cap Enhanced Core Fund
Statement of Assets and Liabilities
February 28, 2014
Assets | |
Investments, at value | |
Unaffiliated issuers (identified cost $184,146,328) | | $ | 264,135,322 | | |
Affiliated issuers (identified cost $5,596,363) | | | 5,596,363 | | |
Total investments (identified cost $189,742,691) | | | 269,731,685 | | |
Receivable for: | |
Capital shares sold | | | 17,660 | | |
Dividends | | | 643,646 | | |
Variation margin | | | 14,143 | | |
Expense reimbursement due from Investment Manager | | | 1,727 | | |
Prepaid expenses | | | 1,263 | | |
Total assets | | | 270,410,124 | | |
Liabilities | |
Payable for: | |
Capital shares purchased | | | 826,393 | | |
Investment management fees | | | 4,350 | | |
Distribution and/or service fees | | | 209 | | |
Transfer agent fees | | | 38,716 | | |
Administration fees | | | 442 | | |
Compensation of board members | | | 95,224 | | |
Other expenses | | | 28,479 | | |
Total liabilities | | | 993,813 | | |
Net assets applicable to outstanding capital stock | | $ | 269,416,311 | | |
Represented by | |
Paid-in capital | | $ | 233,208,807 | | |
Undistributed net investment income | | | 461,347 | | |
Accumulated net realized loss | | | (44,449,046 | ) | |
Unrealized appreciation (depreciation) on: | |
Investments | | | 79,988,994 | | |
Futures contracts | | | 206,209 | | |
Total — representing net assets applicable to outstanding capital stock | | $ | 269,416,311 | | |
The accompanying Notes to Financial Statements are an integral part of this statement.
Annual Report 2014
13
Columbia Large Cap Enhanced Core Fund
Statement of Assets and Liabilities (continued)
February 28, 2014
Class A | |
Net assets | | $ | 25,473,556 | | |
Shares outstanding | | | 1,356,830 | | |
Net asset value per share | | $ | 18.77 | | |
Class I | |
Net assets | | $ | 20,285,736 | | |
Shares outstanding | | | 1,083,558 | | |
Net asset value per share | | $ | 18.72 | | |
Class R | |
Net assets | | $ | 2,728,983 | | |
Shares outstanding | | | 145,542 | | |
Net asset value per share | | $ | 18.75 | | |
Class Y | |
Net assets | | $ | 3,450,893 | | |
Shares outstanding | | | 184,215 | | |
Net asset value per share | | $ | 18.73 | | |
Class Z | |
Net assets | | $ | 217,477,143 | | |
Shares outstanding | | | 11,609,466 | | |
Net asset value per share | | $ | 18.73 | | |
The accompanying Notes to Financial Statements are an integral part of this statement.
Annual Report 2014
14
Columbia Large Cap Enhanced Core Fund
Statement of Operations
Year Ended February 28, 2014
Net investment income | |
Income: | |
Dividends — unaffiliated issuers | | $ | 5,718,718 | | |
Dividends — affiliated issuers | | | 5,390 | | |
Interest | | | 13 | | |
Foreign taxes withheld | | | (2,685 | ) | |
Total income | | | 5,721,436 | | |
Expenses: | |
Investment management fees | | | 1,789,900 | | |
Distribution and/or service fees | |
Class A | | | 51,515 | | |
Class R | | | 11,231 | | |
Transfer agent fees | |
Class A | | | 41,627 | | |
Class R | | | 4,539 | | |
Class Z | | | 420,014 | | |
Administration fees | | | 155,643 | | |
Compensation of board members | | | 29,934 | | |
Custodian fees | | | 10,790 | | |
Registration fees | | | 36,009 | | |
Professional fees | | | 30,963 | | |
Other | | | 29,799 | | |
Total expenses | | | 2,611,964 | | |
Fees waived or expenses reimbursed by Investment Manager and its affiliates | | | (942,955 | ) | |
Expense reductions | | | (120 | ) | |
Total net expenses | | | 1,668,889 | | |
Net investment income | | | 4,052,547 | | |
Realized and unrealized gain (loss) — net | |
Net realized gain (loss) on: | |
Investments | | | 62,713,987 | | |
Futures contracts | | | 723,542 | | |
Net realized gain | | | 63,437,529 | | |
Net change in unrealized appreciation (depreciation) on: | |
Investments | | | (2,346,965 | ) | |
Futures contracts | | | (182,720 | ) | |
Net change in unrealized appreciation (depreciation) | | | (2,529,685 | ) | |
Net realized and unrealized gain | | | 60,907,844 | | |
Net increase in net assets resulting from operations | | $ | 64,960,391 | | |
The accompanying Notes to Financial Statements are an integral part of this statement.
Annual Report 2014
15
Columbia Large Cap Enhanced Core Fund
Statement of Changes in Net Assets
| | | Year Ended
February 28,
2014 | | Year Ended
February 28,
2013 | |
Operations | |
Net investment income | | $ | 4,052,547 | | | $ | 5,015,800 | | |
Net realized gain | | | 63,437,529 | | | | 34,799,465 | | |
Net change in unrealized appreciation (depreciation) | | | (2,529,685 | ) | | | (6,534,973 | ) | |
Net increase in net assets resulting from operations | | | 64,960,391 | | | | 33,280,292 | | |
Distributions to shareholders | |
Net investment income | |
Class A | | | (323,578 | ) | | | (188,669 | ) | |
Class I | | | (321,177 | ) | | | (650,071 | ) | |
Class R | | | (28,784 | ) | | | (9,708 | ) | |
Class Y | | | (60,362 | ) | | | (55,773 | ) | |
Class Z | | | (3,460,430 | ) | | | (4,155,698 | ) | |
Total distributions to shareholders | | | (4,194,331 | ) | | | (5,059,919 | ) | |
Increase (decrease) in net assets from capital stock activity | | | (59,818,974 | ) | | | (43,179,736 | ) | |
Total increase (decrease) in net assets | | | 947,086 | | | | (14,959,363 | ) | |
Net assets at beginning of year | | | 268,469,225 | | | | 283,428,588 | | |
Net assets at end of year | | $ | 269,416,311 | | | $ | 268,469,225 | | |
Undistributed net investment income | | $ | 461,347 | | | $ | 605,646 | | |
The accompanying Notes to Financial Statements are an integral part of this statement.
Annual Report 2014
16
Columbia Large Cap Enhanced Core Fund
Statement of Changes in Net Assets (continued)
| | | Year Ended February 28, 2014 | | Year Ended February 28, 2013 | |
| | | Shares | | Dollars ($) | | Shares | | Dollars ($) | |
Capital stock activity | |
Class A shares | |
Subscriptions | | | 685,849 | | | | 11,415,643 | | | | 145,052 | | | | 2,069,335 | | |
Distributions reinvested | | | 12,578 | | | | 226,220 | | | | 7,146 | | | | 100,390 | | |
Redemptions | | | (219,812 | ) | | | (3,850,464 | ) | | | (181,688 | ) | | | (2,565,249 | ) | |
Net increase (decrease) | | | 478,615 | | | | 7,791,399 | | | | (29,490 | ) | | | (395,524 | ) | |
Class I shares | |
Subscriptions | | | 2,615,545 | | | | 42,658,290 | | | | 3,406,324 | | | | 47,272,503 | | |
Distributions reinvested | | | 18,505 | | | | 321,105 | | | | 46,353 | | | | 650,012 | | |
Redemptions | | | (3,965,275 | ) | | | (67,244,199 | ) | | | (2,013,490 | ) | | | (28,588,536 | ) | |
Net increase (decrease) | | | (1,331,225 | ) | | | (24,264,804 | ) | | | 1,439,187 | | | | 19,333,979 | | |
Class R shares | |
Subscriptions | | | 82,559 | | | | 1,344,602 | | | | 79,167 | | | | 1,128,386 | | |
Distributions reinvested | | | 1,359 | | | | 24,333 | | | | 562 | | | | 7,914 | | |
Redemptions | | | (23,840 | ) | | | (404,324 | ) | | | (9,187 | ) | | | (133,056 | ) | |
Net increase | | | 60,078 | | | | 964,611 | | | | 70,542 | | | | 1,003,244 | | |
Class Y shares | |
Subscriptions | | | 11,788 | | | | 210,304 | | | | 18,945 | | | | 258,233 | | |
Redemptions | | | (39,384 | ) | | | (670,000 | ) | | | (29,073 | ) | | | (415,740 | ) | |
Net decrease | | | (27,596 | ) | | | (459,696 | ) | | | (10,128 | ) | | | (157,507 | ) | |
Class Z shares | |
Subscriptions | | | 1,925,147 | | | | 33,078,637 | | | | 2,714,857 | | | | 38,196,210 | | |
Distributions reinvested | | | 14,959 | | | | 266,740 | | | | 21,699 | | | | 304,171 | | |
Redemptions | | | (4,642,277 | ) | | | (77,195,861 | ) | | | (7,107,729 | ) | | | (101,464,309 | ) | |
Net decrease | | | (2,702,171 | ) | | | (43,850,484 | ) | | | (4,371,173 | ) | | | (62,963,928 | ) | |
Total net decrease | | | (3,522,299 | ) | | | (59,818,974 | ) | | | (2,901,062 | ) | | | (43,179,736 | ) | |
The accompanying Notes to Financial Statements are an integral part of this statement.
Annual Report 2014
17
Columbia Large Cap Enhanced Core Fund
The following tables are intended to help you understand the Fund's financial performance. Certain information reflects financial results for a single share of a class held for the periods shown. Per share net investment income (loss) amounts are calculated based on average shares outstanding during the period. Total return assumes reinvestment of all dividends and distributions, if any. Total return does not reflect payment of sales charges, if any, and is not annualized for periods of less than one year.
| | | Year Ended February 28, | | Year Ended
February 29, | | Year Ended February 28, | |
Class A | | 2014 | | 2013 | | 2012 | | 2011 | | 2010 | |
Per share data | |
Net asset value, beginning of period | | $ | 15.04 | | | $ | 13.67 | | | $ | 12.81 | | | $ | 10.73 | | | $ | 7.24 | | |
Income from investment operations: | |
Net investment income | | | 0.23 | | | | 0.22 | | | | 0.17 | | | | 0.14 | | | | 0.13 | | |
Net realized and unrealized gain | | | 3.76 | | | | 1.36 | | | | 0.89 | | | | 2.08 | | | | 3.52 | | |
Total from investment operations | | | 3.99 | | | | 1.58 | | | | 1.06 | | | | 2.22 | | | | 3.65 | | |
Less distributions to shareholders: | |
Net investment income | | | (0.26 | ) | | | (0.21 | ) | | | (0.20 | ) | | | (0.14 | ) | | | (0.16 | ) | |
Total distributions to shareholders | | | (0.26 | ) | | | (0.21 | ) | | | (0.20 | ) | | | (0.14 | ) | | | (0.16 | ) | |
Proceeds from regulatory settlements | | | — | | | | — | | | | — | | | | — | | | | 0.00 | (a) | |
Net asset value, end of period | | $ | 18.77 | | | $ | 15.04 | | | $ | 13.67 | | | $ | 12.81 | | | $ | 10.73 | | |
Total return | | | 26.58 | % | | | 11.71 | % | | | 8.41 | % | | | 20.84 | % | | | 50.49 | % | |
Ratios to average net assets(b) | |
Total gross expenses | | | 1.26 | % | | | 1.28 | % | | | 1.19 | %(c) | | | 0.96 | %(c) | | | 0.92 | %(c) | |
Total net expenses(d) | | | 0.89 | %(e) | | | 0.89 | %(e) | | | 0.94 | %(c)(e) | | | 0.95 | %(c)(e) | | | 0.89 | %(c)(e) | |
Net investment income | | | 1.34 | % | | | 1.53 | % | | | 1.33 | % | | | 1.22 | % | | | 1.39 | % | |
Supplemental data | |
Net assets, end of period (in thousands) | | $ | 25,474 | | | $ | 13,209 | | | $ | 12,404 | | | $ | 12,213 | | | $ | 12,348 | | |
Portfolio turnover | | | 101 | % | | | 92 | % | | | 67 | % | | | 63 | % | | | 122 | % | |
Notes to Financial Highlights
(a) Rounds to zero.
(b) In addition to the fees and expenses which the Fund bears directly, the Fund indirectly bears a pro rata share of the fees and expenses of the acquired funds in which it invests. Such indirect expenses are not included in the reported expense ratios.
(c) Ratios include line of credit interest expense which rounds to less than 0.01%.
(d) Total net expenses include the impact of certain waivers/reimbursements made by the Investment Manager and certain of its affiliates, if applicable.
(e) The benefits derived from expense reductions had an impact of less than 0.01%.
The accompanying Notes to Financial Statements are an integral part of this statement.
Annual Report 2014
18
Columbia Large Cap Enhanced Core Fund
Financial Highlights (continued)
| | | Year Ended February 28, | | Year Ended
February 29, | | Year Ended
February 28, | |
Class I | | 2014 | | 2013 | | 2012 | | 2011(a) | |
Per share data | |
Net asset value, beginning of period | | $ | 15.00 | | | $ | 13.63 | | | $ | 12.78 | | | $ | 11.11 | | |
Income from investment operations: | |
Net investment income | | | 0.29 | | | | 0.28 | | | | 0.21 | | | | 0.09 | | |
Net realized and unrealized gain | | | 3.75 | | | | 1.36 | | | | 0.88 | | | | 1.75 | | |
Total from investment operations | | | 4.04 | | | | 1.64 | | | | 1.09 | | | | 1.84 | | |
Less distributions to shareholders: | |
Net investment income | | | (0.32 | ) | | | (0.27 | ) | | | (0.24 | ) | | | (0.17 | ) | |
Total distributions to shareholders | | | (0.32 | ) | | | (0.27 | ) | | | (0.24 | ) | | | (0.17 | ) | |
Net asset value, end of period | | $ | 18.72 | | | $ | 15.00 | | | $ | 13.63 | | | $ | 12.78 | | |
Total return | | | 27.06 | % | | | 12.15 | % | | | 8.73 | % | | | 16.65 | % | |
Ratios to average net assets(b) | |
Total gross expenses | | | 0.80 | % | | | 0.84 | % | | | 0.74 | %(c) | | | 0.59 | %(c)(d) | |
Total net expenses(e) | | | 0.48 | % | | | 0.50 | % | | | 0.61 | %(c) | | | 0.57 | %(c)(d)(f) | |
Net investment income | | | 1.72 | % | | | 2.01 | % | | | 1.72 | % | | | 1.68 | %(d) | |
Supplemental data | |
Net assets, end of period (in thousands) | | $ | 20,286 | | | $ | 36,224 | | | $ | 13,297 | | | $ | 7,466 | | |
Portfolio turnover | | | 101 | % | | | 92 | % | | | 67 | % | | | 63 | % | |
Notes to Financial Highlights
(a) For the period from September 27, 2010 (commencement of operations) to February 28, 2011.
(b) In addition to the fees and expenses which the Fund bears directly, the Fund indirectly bears a pro rata share of the fees and expenses of the acquired funds in which it invests. Such indirect expenses are not included in the reported expense ratios.
(c) Ratios include line of credit interest expense which rounds to less than 0.01%.
(d) Annualized.
(e) Total net expenses include the impact of certain waivers/reimbursements made by the Investment Manager and certain of its affiliates, if applicable.
(f) The benefits derived from expense reductions had an impact of less than 0.01%.
The accompanying Notes to Financial Statements are an integral part of this statement.
Annual Report 2014
19
Columbia Large Cap Enhanced Core Fund
Financial Highlights (continued)
| | | Year Ended February 28, | | Year Ended
February 29, | | Year Ended February 28, | |
Class R | | 2014 | | 2013 | | 2012 | | 2011 | | 2010 | |
Per share data | |
Net asset value, beginning of period | | $ | 15.03 | | | $ | 13.65 | | | $ | 12.80 | | | $ | 10.72 | | | $ | 7.24 | | |
Income from investment operations: | |
Net investment income | | | 0.18 | | | | 0.20 | | | | 0.14 | | | | 0.12 | | | | 0.11 | | |
Net realized and unrealized gain | | | 3.76 | | | | 1.36 | | | | 0.88 | | | | 2.08 | | | | 3.51 | | |
Total from investment operations | | | 3.94 | | | | 1.56 | | | | 1.02 | | | | 2.20 | | | | 3.62 | | |
Less distributions to shareholders: | |
Net investment income | | | (0.22 | ) | | | (0.18 | ) | | | (0.17 | ) | | | (0.12 | ) | | | (0.14 | ) | |
Total distributions to shareholders | | | (0.22 | ) | | | (0.18 | ) | | | (0.17 | ) | | | (0.12 | ) | | | (0.14 | ) | |
Proceeds from regulatory settlements | | | — | | | | — | | | | — | | | | — | | | | 0.00 | (a) | |
Net asset value, end of period | | $ | 18.75 | | | $ | 15.03 | | | $ | 13.65 | | | $ | 12.80 | | | $ | 10.72 | | |
Total return | | | 26.26 | % | | | 11.54 | % | | | 8.08 | % | | | 20.58 | % | | | 50.02 | % | |
Ratios to average net assets(b) | |
Total gross expenses | | | 1.51 | % | | | 1.53 | % | | | 1.44 | %(c) | | | 1.21 | %(c) | | | 1.17 | %(c) | |
Total net expenses(d) | | | 1.14 | %(e) | | | 1.12 | %(e) | | | 1.19 | %(c)(e) | | | 1.20 | %(c)(e) | | | 1.14 | %(c)(e) | |
Net investment income | | | 1.08 | % | | | 1.45 | % | | | 1.11 | % | | | 1.02 | % | | | 1.08 | % | |
Supplemental data | |
Net assets, end of period (in thousands) | | $ | 2,729 | | | $ | 1,284 | | | $ | 204 | | | $ | 175 | | | $ | 112 | | |
Portfolio turnover | | | 101 | % | | | 92 | % | | | 67 | % | | | 63 | % | | | 122 | % | |
Notes to Financial Highlights
(a) Rounds to zero.
(b) In addition to the fees and expenses which the Fund bears directly, the Fund indirectly bears a pro rata share of the fees and expenses of the acquired funds in which it invests. Such indirect expenses are not included in the reported expense ratios.
(c) Ratios include line of credit interest expense which rounds to less than 0.01%.
(d) Total net expenses include the impact of certain waivers/reimbursements made by the Investment Manager and certain of its affiliates, if applicable.
(e) The benefits derived from expense reductions had an impact of less than 0.01%.
The accompanying Notes to Financial Statements are an integral part of this statement.
Annual Report 2014
20
Columbia Large Cap Enhanced Core Fund
Financial Highlights (continued)
| | | Year Ended February 28, | | Year Ended
February 29, | | Year Ended February 28, | |
Class Y | | 2014 | | 2013 | | 2012 | | 2011 | | 2010(a) | |
Per share data | |
Net asset value, beginning of period | | $ | 15.00 | | | $ | 13.63 | | | $ | 12.78 | | | $ | 10.70 | | | $ | 9.10 | | |
Income from investment operations: | |
Net investment income | | | 0.29 | | | | 0.27 | | | | 0.18 | | | | 0.17 | | | | 0.11 | | |
Net realized and unrealized gain | | | 3.76 | | | | 1.36 | | | | 0.91 | | | | 2.09 | | | | 1.64 | | |
Total from investment operations | | | 4.05 | | | | 1.63 | | | | 1.09 | | | | 2.26 | | | | 1.75 | | |
Less distributions to shareholders: | |
Net investment income | | | (0.32 | ) | | | (0.26 | ) | | | (0.24 | ) | | | (0.18 | ) | | | (0.15 | ) | |
Total distributions to shareholders | | | (0.32 | ) | | | (0.26 | ) | | | (0.24 | ) | | | (0.18 | ) | | | (0.15 | ) | |
Net asset value, end of period | | $ | 18.73 | | | $ | 15.00 | | | $ | 13.63 | | | $ | 12.78 | | | $ | 10.70 | | |
Total return | | | 27.11 | % | | | 12.13 | % | | | 8.74 | % | | | 21.30 | % | | | 19.23 | % | |
Ratios to average net assets(b) | |
Total gross expenses | | | 0.80 | % | | | 0.83 | % | | | 0.74 | %(c) | | | 0.59 | %(c) | | | 0.57 | %(c)(d) | |
Total net expenses(e) | | | 0.48 | % | | | 0.52 | % | | | 0.60 | %(c) | | | 0.58 | %(c)(f) | | | 0.57 | %(c)(d)(f) | |
Net investment income | | | 1.72 | % | | | 1.90 | % | | | 1.46 | % | | | 1.53 | % | | | 1.62 | %(d) | |
Supplemental data | |
Net assets, end of period (in thousands) | | $ | 3,451 | | | $ | 3,177 | | | $ | 3,024 | | | $ | 31,588 | | | $ | 60,329 | | |
Portfolio turnover | | | 101 | % | | | 92 | % | | | 67 | % | | | 63 | % | | | 122 | % | |
Notes to Financial Highlights
(a) For the period from July 15, 2009 (commencement of operations) to February 28, 2010.
(b) In addition to the fees and expenses which the Fund bears directly, the Fund indirectly bears a pro rata share of the fees and expenses of the acquired funds in which it invests. Such indirect expenses are not included in the reported expense ratios.
(c) Ratios include line of credit interest expense which rounds to less than 0.01%.
(d) Annualized.
(e) Total net expenses include the impact of certain waivers/reimbursements made by the Investment Manager and certain of its affiliates, if applicable.
(f) The benefits derived from expense reductions had an impact of less than 0.01%.
The accompanying Notes to Financial Statements are an integral part of this statement.
Annual Report 2014
21
Columbia Large Cap Enhanced Core Fund
Financial Highlights (continued)
| | | Year Ended February 28, | | Year Ended
February 29, | | Year Ended February 28, | |
Class Z | | 2014 | | 2013 | | 2012 | | 2011 | | 2010 | |
Per share data | |
Net asset value, beginning of period | | $ | 14.99 | | | $ | 13.62 | | | $ | 12.78 | | | $ | 10.70 | | | $ | 7.22 | | |
Income from investment operations: | |
Net investment income | | | 0.27 | | | | 0.25 | | | | 0.19 | | | | 0.16 | | | | 0.16 | | |
Net realized and unrealized gain | | | 3.77 | | | | 1.37 | | | | 0.88 | | | | 2.09 | | | | 3.50 | | |
Total from investment operations | | | 4.04 | | | | 1.62 | | | | 1.07 | | | | 2.25 | | | | 3.66 | | |
Less distributions to shareholders: | |
Net investment income | | | (0.30 | ) | | | (0.25 | ) | | | (0.23 | ) | | | (0.17 | ) | | | (0.18 | ) | |
Total distributions to shareholders | | | (0.30 | ) | | | (0.25 | ) | | | (0.23 | ) | | | (0.17 | ) | | | (0.18 | ) | |
Proceeds from regulatory settlements | | | — | | | | — | | | | — | | | | — | | | | 0.00 | (a) | |
Net asset value, end of period | | $ | 18.73 | | | $ | 14.99 | | | $ | 13.62 | | | $ | 12.78 | | | $ | 10.70 | | |
Total return | | | 27.03 | % | | | 12.02 | % | | | 8.54 | % | | | 21.18 | % | | | 50.82 | % | |
Ratios to average net assets(b) | |
Total gross expenses | | | 1.01 | % | | | 1.03 | % | | | 0.94 | %(c) | | | 0.71 | %(c) | | | 0.67 | %(c) | |
Total net expenses(d) | | | 0.64 | %(e) | | | 0.64 | %(e) | | | 0.70 | %(c)(e) | | | 0.70 | %(c)(e) | | | 0.64 | %(c)(e) | |
Net investment income | | | 1.57 | % | | | 1.77 | % | | | 1.54 | % | | | 1.46 | % | | | 1.65 | % | |
Supplemental data | |
Net assets, end of period (in thousands) | | $ | 217,477 | | | $ | 214,575 | | | $ | 254,500 | | | $ | 365,205 | | | $ | 451,824 | | |
Portfolio turnover | | | 101 | % | | | 92 | % | | | 67 | % | | | 63 | % | | | 122 | % | |
Notes to Financial Highlights
(a) Rounds to zero.
(b) In addition to the fees and expenses which the Fund bears directly, the Fund indirectly bears a pro rata share of the fees and expenses of the acquired funds in which it invests. Such indirect expenses are not included in the reported expense ratios.
(c) Ratios include line of credit interest expense which rounds to less than 0.01%.
(d) Total net expenses include the impact of certain waivers/reimbursements made by the Investment Manager and certain of its affiliates, if applicable.
(e) The benefits derived from expense reductions had an impact of less than 0.01%.
The accompanying Notes to Financial Statements are an integral part of this statement.
Annual Report 2014
22
Columbia Large Cap Enhanced Core Fund
Notes to Financial Statements
February 28, 2014
Note 1. Organization
Columbia Large Cap Enhanced Core Fund (the Fund), a series of Columbia Funds Series Trust (the Trust), is a diversified fund. The Trust is registered under the Investment Company Act of 1940, as amended (the 1940 Act), as an open-end management investment company organized as a Delaware statutory trust.
Fund Shares
The Trust may issue an unlimited number of shares (without par value). The Fund offers Class A, Class I, Class R, Class Y and Class Z shares. Although all share classes generally have identical voting, dividend and liquidation rights, each share class votes separately when required by law. Different share classes pay different distribution amounts to the extent the expenses of such share classes differ, and distributions in liquidation will be proportional to the net asset value of each share class. Each share class has its own expense structure and sales charges, as applicable.
Class A shares have no sales charge.
Class I shares are not subject to sales charges and are available only to the Columbia Family of Funds.
Class R shares are not subject to sales charges and are generally available only to certain retirement plans and other eligible investors.
Class Y shares are not subject to sales charges and are generally available only to certain retirement plans.
Class Z shares are not subject to sales charges and are available only to certain eligible investors, which are subject to different investment minimums.
Note 2. Summary of Significant Accounting Policies
Use of Estimates
The preparation of financial statements in accordance with U.S. generally accepted accounting principles (GAAP) requires management to make certain estimates and assumptions that affect the reported amounts of assets and liabilities, the disclosure of contingent assets and liabilities at the date of the financial statements and the reported amounts of revenue and expenses during the reporting period. Actual results could differ from those estimates.
The following is a summary of significant accounting policies consistently followed by the Fund in the preparation of its financial statements.
Security Valuation
All equity securities are valued at the close of business of the New York Stock Exchange (NYSE). Equity securities are
valued at the last quoted sales price on the principal exchange or market on which they trade, except for securities traded on the NASDAQ Stock Market, which are valued at the NASDAQ official close price. Unlisted securities or listed securities for which there were no sales during the day are valued at the mean of the latest quoted bid and ask prices on such exchanges or markets.
Foreign equity securities are valued based on quotations from the principal market in which such securities are normally traded. If any foreign share prices are not readily available as a result of limited share activity the securities are valued at the mean of the latest quoted bid and ask prices on such exchanges or markets. Foreign currency exchange rates are generally determined at 4:00 p.m. Eastern (U.S.) time. However, many securities markets and exchanges outside the U.S. close prior to the close of the NYSE; therefore, the closing prices for securities in such markets or on such exchanges may not fully reflect events that occur after such close but before the close of the NYSE. In those situations, foreign securities will be fair valued pursuant to the policy adopted by the Board of Trustees (the Board), including utilizing a third party pricing service to determine these fair values. The third party pricing service takes into account multiple factors, including, but not limited to, movements in the U.S. securities markets, certain depositary receipts, futures contracts and foreign exchange rates that have occurred subsequent to the close of the foreign exchange or market, to determine a good faith estimate that reasonably reflects the current market conditions as of the close of the NYSE. The fair value of a security is likely to be different from the quoted or published price, if available.
Investments in open-end investment companies, including money market funds, are valued at net asset value.
Futures and options on futures contracts are valued based upon the settlement price established each day by the board of trade or exchange on which they are traded.
Investments for which market quotations are not readily available, or that have quotations which management believes are not reliable, are valued at fair value as determined in good faith under consistently applied procedures established by and under the general supervision of the Board. If a security or class of securities (such as foreign securities) is valued at fair value, such value is likely to be different from the last quoted market price for the security.
The determination of fair value often requires significant judgment. To determine fair value, management may use assumptions including but not limited to future cash flows and estimated risk premiums. Multiple inputs from various sources may be used to determine fair value.
Annual Report 2014
23
Columbia Large Cap Enhanced Core Fund
Notes to Financial Statements (continued)
February 28, 2014
Derivative Instruments
The Fund invests in certain derivative instruments, as detailed below, to meet its investment objectives. Derivatives are instruments whose values depend on, or are derived from, in whole or in part, the value of one or more other assets, such as securities, currencies, commodities or indices. Derivative instruments may be used to maintain cash reserves while maintaining exposure to certain other assets, to offset anticipated declines in values of investments, to facilitate trading, to reduce transaction costs and to pursue higher investment returns. The Fund may also use derivative instruments to mitigate certain investment risks, such as foreign currency exchange rate risk, interest rate risk and credit risk. Derivatives may involve various risks, including the potential inability of the counterparty to fulfill its obligation under the terms of the contract, the potential for an illiquid secondary market (making it difficult for the Fund to sell, including at favorable prices) and the potential for market movements which may expose the Fund to gains or losses in excess of the amount shown in the Statement of Assets and Liabilities. The notional amounts of derivative instruments, if applicable, are not recorded in the financial statements.
A derivative instrument may suffer a mark to market loss if the value of the contract decreases due to an unfavorable change in the market rates or values of the underlying instrument. Losses can also occur if the counterparty does not perform under the contract. The Fund's risk of loss from counterparty credit risk on over-the-counter derivatives is generally limited to the aggregate unrealized gain netted against any collateral held by the Fund and the amount of any initial margin held by the counterparty. With exchange traded or centrally cleared derivatives, there is minimal counterparty credit risk to the Fund since the exchange's clearinghouse, as counterparty to such instruments, guarantees against a possible default. The clearinghouse stands between the buyer and the seller of the contract; therefore, the counterparty credit risk is limited to failure of the clearinghouse. However, credit risk still exists in exchange traded or centrally cleared derivatives with respect to initial and variation margin that is held in a broker's customer accounts. While brokers are required to segregate customer margin from their own assets, in the event that a broker becomes insolvent or goes into bankruptcy and at that time there is a shortfall in the aggregate amount of margin held by the broker for all its clients, U.S. bankruptcy laws will typically allocate that shortfall on a pro-rata basis across all the broker's customers, potentially resulting in losses to the Fund.
In order to better define its contractual rights and to secure rights that will help the Fund mitigate its counterparty risk, the Fund may enter into an International Swaps and Derivatives Association, Inc. Master Agreement (ISDA Master Agreement)
or similar agreement with its derivative contract counterparties. An ISDA Master Agreement is an agreement between the Fund and a counterparty that governs over-the-counter derivatives and forward foreign currency exchange contracts and typically contains, among other things, collateral posting terms and netting provisions in the event of a default and/or termination event. Under an ISDA Master Agreement, the Fund may, under certain circumstances, offset with the counterparty certain derivative instrument's payables and/or receivables with collateral held and/or posted and create one single net payment. The provisions of the ISDA Master Agreement typically permit a single net payment in the event of default (close-out netting) including the bankruptcy or insolvency of the counterparty. Note, however, that bankruptcy or insolvency laws of a particular jurisdiction may impose restrictions on or prohibitions against the right of offset in bankruptcy, insolvency or other events.
Collateral (margin) requirements differ by type of derivative. Margin requirements are established by the exchange or clearinghouse for exchange traded and centrally cleared derivatives. Brokers can ask for margin in excess of the minimum in certain circumstances. Collateral terms are contract specific for over-the-counter derivatives. For over-the-counter derivatives traded under an ISDA Master Agreement, the collateral requirements are typically calculated by netting the mark to market amount for each transaction under such agreement and comparing that amount to the value of any variation margin currently pledged by the Fund and/or the counterparty. Generally, the amount of collateral due from or to a party has to exceed a minimum transfer amount threshold (e.g., $500,000) before a transfer has to be made. To the extent amounts due to the Fund from its counterparties are not fully collateralized, contractually or otherwise, the Fund bears the risk of loss from counterparty nonperformance. The Fund attempts to mitigate counterparty risk by only entering into agreements with counterparties that it believes have the financial resources to honor their obligations and by monitoring the financial stability of those counterparties.
Certain ISDA Master Agreements allow counterparties to over-the-counter derivatives to terminate derivative contracts prior to maturity in the event the Fund's net assets decline by a stated percentage over a specified time period or the Fund fails to meet the terms of the ISDA Master Agreement, which would cause the Fund to accelerate payment of any net liability owed to the counterparty. The Fund also has termination rights if the counterparty fails to meet the terms of the ISDA Master Agreement. In addition to considering counterparty credit risk, the Fund would consider terminating the derivative contracts based on whether termination would result in a net liability owed from the counterparty.
Annual Report 2014
24
Columbia Large Cap Enhanced Core Fund
Notes to Financial Statements (continued)
February 28, 2014
For financial reporting purposes, the Fund does not offset derivative assets and derivative liabilities that are subject to netting arrangements in the Statement of Assets and Liabilities.
Futures Contracts
Futures contracts are exchange traded and represent commitments for the future purchase or sale of an asset at a specified price on a specified date. The Fund bought and sold futures contracts to maintain appropriate equity market exposure while keeping sufficient cash to accommodate daily redemptions. These instruments may be used for other purposes in future periods. Upon entering into futures contracts, the Fund bears risks that it may not achieve the anticipated benefits of the futures contracts and may realize a loss. Additional risks include counterparty credit risk, the possibility of an illiquid market, and that a change in the value of the contract or option may not correlate with changes in the value of the underlying asset.
Upon entering into a futures contract, the Fund pledges cash or securities with the broker in an amount sufficient to meet the initial margin requirement. The initial margin deposit must be maintained at an established level over the life of the contract. Cash deposited as initial margin is recorded in the Statement of Assets and Liabilities as margin deposits. Securities deposited as initial margin are designated in the Portfolio of Investments. Subsequent payments (variation margin) are made or received by the Fund each day. The variation margin payments are equal to the daily change in the contract value and are recorded as variation margin receivable or payable and are offset in unrealized gains or losses. The Fund recognizes a realized gain or loss when the contract is closed or expires. Futures contracts involve, to varying degrees, risk of loss in excess of the variation margin disclosed in the Statement of Assets and Liabilities.
Effects of Derivative Transactions in the Financial Statements
The following tables are intended to provide additional information about the effect of derivatives on the financial statements of the Fund, including: the fair value of derivatives by risk category and the location of those fair values in the Statement of Assets and Liabilities; the impact of derivative transactions over the period in the Statement of Operations including realized gains or losses and unrealized gains or losses. The derivative schedules following the Portfolio of Investments present additional information regarding derivative instruments outstanding at the end of the period, if any.
The following table is a summary of the fair value of derivative instruments at February 28, 2014:
Asset Derivatives | |
Risk Exposure
Category | | Statement of Assets and
Liabilities Location | | Fair Value ($) | |
Equity risk
| | Net assets — unrealized
appreciation on futures
contracts | | | 206,209
| * | |
*Includes cumulative appreciation (depreciation) as reported in the tables following the Portfolio of Investments. Only the current day's variation margin is reported in receivables or payables in the Statement of Assets and Liabilities.
The following table indicates the effect of derivative instruments in the Statement of Operations for the year ended February 28, 2014:
Amount of Realized Gain (Loss) on Derivatives Recognized in Income | |
Risk Exposure Category | | Futures Contracts ($) | |
Equity risk | | | 723,542 | | |
Change in Unrealized Appreciation (Depreciation) on
Derivatives Recognized in Income | |
Risk Exposure Category | | Futures Contracts ($) | |
Equity risk | | | (182,720 | ) | |
The following table is a summary of the volume of derivative instruments for the year ended February 28, 2014:
Derivative Instrument | | Contracts Opened | |
Futures contracts | | | 252 | | |
Security Transactions
Security transactions are accounted for on the trade date. Cost is determined and gains (losses) are based upon the specific identification method for both financial statement and federal income tax purposes.
Income Recognition
Corporate actions and dividend income are generally recorded net of any non-reclaimable tax withholdings, on the ex-dividend date or upon receipt of ex-dividend notification in the case of certain foreign securities.
The Fund may receive distributions from holdings in business development companies (BDCs), exchange traded funds (ETFs) and real estate investment trusts (REITs), which report information on the character of their distributions annually. These distributions are allocated to dividend income, capital gain and return of capital based on estimates made by the Fund's management if actual information has not yet been reported. Return of capital is recorded as a reduction of the cost basis of securities held. If the Fund no longer owns the applicable securities, return of capital is recorded as a realized gain. Management's estimates are subsequently adjusted when
Annual Report 2014
25
Columbia Large Cap Enhanced Core Fund
Notes to Financial Statements (continued)
February 28, 2014
the actual character of the distributions is disclosed by the BDCs, ETFs and REITs, which could result in a proportionate change in return of capital to shareholders.
Awards from class action litigation are recorded as a reduction of cost basis if the Fund still owns the applicable securities on the payment date. If the Fund no longer owns the applicable securities, the proceeds are recorded as realized gains.
Expenses
General expenses of the Trust are allocated to the Fund and other funds of the Trust based upon relative net assets or other expense allocation methodologies determined by the nature of the expense. Expenses directly attributable to the Fund are charged to the Fund. Expenses directly attributable to a specific class of shares are charged to that share class.
Determination of Class Net Asset Value
All income, expenses (other than class-specific expenses, which are charged to that share class, as shown in the Statement of Operations) and realized and unrealized gains (losses) are allocated to each class of the Fund on a daily basis, based on the relative net assets of each class, for purposes of determining the net asset value of each class.
Federal Income Tax Status
The Fund intends to qualify each year as a regulated investment company under Subchapter M of the Internal Revenue Code, as amended, and will distribute substantially all of its taxable income (including net short-term capital gains), if any, for its tax year, and as such will not be subject to federal income taxes. In addition, the Fund intends to distribute in each calendar year substantially all of its net investment income, capital gains and certain other amounts, if any, such that the Fund should not be subject to federal excise tax. Therefore, no federal income or excise tax provision is recorded.
Foreign Taxes
The Fund may be subject to foreign taxes on income, gains on investments or currency repatriation, a portion of which may be recoverable. The Fund will accrue such taxes and recoveries, as applicable, based upon its current interpretation of tax rules and regulations that exist in the markets in which it invests.
Realized gains in certain countries may be subject to foreign taxes at the Fund level, based on statutory rates. The Fund accrues for such foreign taxes on realized and unrealized gains at the appropriate rate for each jurisdiction, as applicable. The amount, if any, is disclosed as a liability on the Statement of Assets and Liabilities.
Distributions to Shareholders
Distributions from net investment income, if any, are declared and paid semi-annually. Net realized capital gains, if any, are distributed at least annually. Income distributions and capital
gain distributions are determined in accordance with federal income tax regulations, which may differ from GAAP.
Guarantees and Indemnifications
Under the Trust's organizational documents and, in some cases, by contract, its officers and trustees are indemnified against certain liabilities arising out of the performance of their duties to the Trust or its funds. In addition, certain of the Fund's contracts with its service providers contain general indemnification clauses. The Fund's maximum exposure under these arrangements is unknown since the amount of any future claims that may be made against the Fund cannot be determined, and the Fund has no historical basis for predicting the likelihood of any such claims.
Note 3. Fees and Compensation Paid to Affiliates
Investment Management Fees
Under an Investment Management Services Agreement, Columbia Management Investment Advisers, LLC (the Investment Manager), a wholly-owned subsidiary of Ameriprise Financial, Inc. (Ameriprise Financial), determines which securities will be purchased, held or sold. The investment management fee is an annual fee that is equal to a percentage of the Fund's average daily net assets that declines from 0.69% to 0.52% as the Fund's net assets increase. The effective investment management fee rate for the year ended February 28, 2014 was 0.69% of the Fund's average daily net assets.
Effective July 1, 2013, the Investment Manager has contractually agreed to waive 0.10% of the Fund's investment management fee through June 30, 2014. Prior to July 1, 2013, the Investment Manager contractually agreed to waive 0.15% of the Fund's investment management fee. The effective investment management fee waiver for the year ended February 28, 2014 was 0.12% of the Fund's average daily net assets.
The effective investment management fee rate, net of fee waivers, for the year ended February 28, 2014 was 0.57% of the Fund's average daily net assets.
Administration Fees
Under an Administrative Services Agreement, the Investment Manager also serves as the Fund Administrator. The Fund pays the Fund Administrator an annual fee for administration and accounting services equal to a percentage of the Fund's average daily net assets that declines from 0.06% to 0.03% as the Fund's net assets increase. The effective administration fee rate for the year ended February 28, 2014 was 0.06% of the Fund's average daily net assets.
Other Expenses
Other expenses are for, among other things, miscellaneous expenses of the Fund or the Board, including payments to a
Annual Report 2014
26
Columbia Large Cap Enhanced Core Fund
Notes to Financial Statements (continued)
February 28, 2014
company providing limited administrative services to the Fund and the Board. That company's expenses include boardroom and office expense, employee compensation, employee health and retirement benefits, and certain other expenses. For the year ended February 28, 2014, other expenses paid to this company were $2,035.
Compensation of Board Members
Board members are compensated for their services to the Fund as disclosed in the Statement of Operations. Under a Deferred Compensation Plan (the Plan), the Board members who are not "interested persons" of the Fund, as defined under the 1940 Act, may elect to defer payment of up to 100% of their compensation. Deferred amounts are treated as though equivalent dollar amounts had been invested in shares of certain funds managed by the Investment Manager. The Fund's liability for these amounts is adjusted for market value changes and remains in the Fund until distributed in accordance with the Plan.
Transfer Agent Fees
Under a Transfer and Dividend Disbursing Agent Agreement, Columbia Management Investment Services Corp. (the Transfer Agent), an affiliate of the Investment Manager and a wholly-owned subsidiary of Ameriprise Financial, is responsible for providing transfer agency services to the Fund. The Transfer Agent has contracted with Boston Financial Data Services (BFDS) to serve as sub-transfer agent.
The Transfer Agent receives monthly account-based service fees based on the number of open accounts and also receives sub-transfer agency fees based on a percentage of the average aggregate value of the Fund's shares maintained in omnibus accounts (other than omnibus accounts for which American Enterprise Investment Services Inc. is the broker of record or accounts where the beneficial shareholder is a customer of Ameriprise Financial Services, Inc., which are paid a per account fee). The Transfer Agent pays the fees of BFDS for services as sub-transfer agent and is not entitled to reimbursement for such fees from the Fund (with the exception of out-of-pocket fees).
The Transfer Agent also receives compensation from fees for various shareholder services and reimbursements for certain out-of-pocket fees. Class I shares do not pay transfer agent fees. Class Y shares are not subject to transfer agent fees.
For the year ended February 28, 2014, the Fund's effective transfer agent fee rates as a percentage of average daily net assets of each class were as follows:
Class A | | | 0.20 | % | |
Class R | | | 0.20 | | |
Class Z | | | 0.20 | | |
An annual minimum account balance fee of $20 may apply to certain accounts with a value below the applicable share class's initial minimum investment requirements to reduce the impact of small accounts on transfer agent fees. These minimum account balance fees are recorded as part of expense reductions in the Statement of Operations. For the year ended February 28, 2014, these minimum account balance fees reduced total expenses by $120.
Distribution and Service Fees
The Fund has an agreement with Columbia Management Investment Distributors, Inc. (the Distributor), an affiliate of the Investment Manager and a wholly-owned subsidiary of Ameriprise Financial, for distribution and shareholder services. The Board has approved, and the Fund has adopted, distribution and shareholder service plans (the Plans) applicable to certain share classes, which set the distribution and service fees for the Fund. These fees are calculated daily and are intended to compensate the Distributor and/or eligible selling and/or servicing agents for selling shares of the Fund and providing services to investors.
Under the Plans, the Fund pays a monthly combined distribution and service fee to the Distributor at the maximum annual rate of 0.25% of the average daily net assets attributable to Class A shares of the Fund. Also under the Plans, the Fund pays a monthly distribution fee at the maximum annual rate of 0.50% of the average daily net assets attributable to Class R shares of the Fund.
Expenses Waived/Reimbursed by the Investment Manager and its Affiliates
The Investment Manager and certain of its affiliates have contractually agreed to waive fees and/or reimburse expenses (excluding certain fees and expenses described below) for the periods disclosed below, unless sooner terminated at the sole discretion of the Board, so that the Fund's net operating expenses, after giving effect to fees waived/expenses reimbursed and any balance credits and/or overdraft charges from the Fund's custodian, do not exceed the following annual rates as a percentage of the class' average daily net assets:
| | | July 1, 2013
through
June 30, 2014 | | Prior to
July 1, 2013 | |
Class A | | | 0.90 | % | | | 0.86 | % | |
Class I | | | 0.49 | | | | 0.46 | | |
Class R | | | 1.15 | | | | 1.11 | | |
Class Y | | | 0.49 | | | | 0.46 | | |
Class Z | | | 0.65 | | | | 0.61 | | |
Under the agreement governing these fee waivers and/or expense reimbursement arrangements, the following fees and expenses are excluded from the waiver/reimbursement
Annual Report 2014
27
Columbia Large Cap Enhanced Core Fund
Notes to Financial Statements (continued)
February 28, 2014
commitment, and therefore will be paid by the Fund, if applicable: taxes (including foreign transaction taxes), expenses associated with investments in affiliated and non-affiliated pooled investment vehicles (including mutual funds and exchange traded funds), transaction costs and brokerage commissions, costs related to any securities lending program, dividend expenses associated with securities sold short, inverse floater program fees and expenses, transaction charges and interest on borrowed money, interest, extraordinary expenses and any other expenses the exclusion of which is specifically approved by the Board. This agreement may be modified or amended only with approval from all parties.
Note 4. Federal Tax Information
The timing and character of income and capital gain distributions are determined in accordance with income tax regulations, which may differ from GAAP because of temporary or permanent book to tax differences.
At February 28, 2014, these differences are primarily due to differing treatment for capital loss carryforwards, deferral/reversal of wash sales losses, Trustees' deferred compensation, re-characterization of distributions for investments, derivative investments, and tax straddles. To the extent these differences are permanent, reclassifications are made among the components of the Fund's net assets in the Statement of Assets and Liabilities. Temporary differences do not require reclassifications. In the Statement of Assets and Liabilities the following reclassifications were made:
Undistributed net investment income | | $ | (2,515 | ) | |
Accumulated net realized loss | | | 2,515 | | |
Net investment income and net realized gains (losses), as disclosed in the Statement of Operations, and net assets were not affected by this reclassification.
The tax character of distributions paid during the years indicated was as follows:
Year Ended February 28, | | 2014 | | 2013 | |
Ordinary income | | $ | 4,194,331 | | | $ | 5,059,919 | | |
Short-term capital gain distributions, if any, are considered ordinary income distributions for tax purposes.
At February 28, 2014, the components of distributable earnings on a tax basis were as follows:
Undistributed ordinary income | | $ | 556,641 | | |
Unrealized appreciation | | | 79,539,130 | | |
At February 28, 2014, the cost of investments for federal income tax purposes was $190,192,555 and the aggregate gross unrealized appreciation and depreciation based on that cost was:
Unrealized appreciation | | $ | 81,134,796 | | |
Unrealized depreciation | | | (1,595,666 | ) | |
Net unrealized appreciation | | $ | 79,539,130 | | |
The following capital loss carryforward, determined at February 28, 2014, may be available to reduce taxable income arising from future net realized gains on investments, if any, to the extent permitted by the Internal Revenue Code:
Year of Expiration | | Amount ($) | |
2018 | | | 43,738,973 | | |
For the year ended February 28, 2014, $63,087,838 of capital loss carryforward was utilized.
Management of the Fund has concluded that there are no significant uncertain tax positions that would require recognition in the financial statements. However, management's conclusion may be subject to review and adjustment at a later date based on factors including, but not limited to, new tax laws, regulations, and administrative interpretations (including relevant court decisions). Generally, the Fund's federal tax returns for the prior three fiscal years remain subject to examination by the Internal Revenue Service.
Note 5. Portfolio Information
The cost of purchases and proceeds from sales of securities, excluding short-term obligations, aggregated to $254,014,332 and $311,079,441, respectively, for the year ended February 28, 2014.
Note 6. Affiliated Money Market Fund
The Fund invests its daily cash balances in Columbia Short-Term Cash Fund, an affiliated money market fund established for the exclusive use by the Fund and other affiliated funds. The income earned by the Fund from such investments is included as "Dividends — affiliated issuers" in the Statement of Operations. As an investing fund, the Fund indirectly bears its proportionate share of the expenses of Columbia Short-Term Cash Fund.
Note 7. Shareholder Concentration
At February 28, 2014, one unaffiliated shareholder account owned 77.9% of the outstanding shares of the Fund. The Fund has no knowledge about whether any portion of those shares was owned beneficially by such account. Subscription and redemption activity by concentrated accounts may have a significant effect on the operations of the Fund.
Annual Report 2014
28
Columbia Large Cap Enhanced Core Fund
Notes to Financial Statements (continued)
February 28, 2014
Note 8. Line of Credit
The Fund has entered into a revolving credit facility with a syndicate of banks led by JPMorgan Chase Bank N.A. whereby the Fund may borrow for the temporary funding of shareholder redemptions or for other temporary or emergency purposes. The credit facility agreement, as amended, which is a collective agreement between the Fund and certain other funds managed by the Investment Manager, severally and not jointly, permits collective borrowings up to $500 million. Interest is charged to each participating fund based on its borrowings at a rate equal to the higher of (i) the overnight federal funds rate plus 1.00% or (ii) the one-month LIBOR rate plus 1.00%. Each borrowing under the credit facility matures no later than 60 days after the date of borrowing. Effective December 10, 2013, the Fund also pays a commitment fee equal to its pro rata share of the amount of the credit facility at a rate of 0.075% per annum. Prior to December 10, 2013, the commitment fee was charged at the annual rate of 0.08% per annum. The commitment fee is included in other expenses in the Statement of Operations.
The Fund had no borrowings during the year ended February 28, 2014.
Note 9. Subsequent Events
Management has evaluated the events and transactions that have occurred through the date the financial statements were issued and noted no items requiring adjustment of the financial statements or additional disclosure.
Note 10. Information Regarding Pending and Settled Legal Proceedings
In December 2005, without admitting or denying the allegations, American Express Financial Corporation (AEFC, which is now known as Ameriprise Financial, Inc. (Ameriprise Financial)) entered into settlement agreements with the Securities and Exchange Commission (SEC) and Minnesota Department of Commerce (MDOC) related to market timing activities. As a result, AEFC was censured and ordered to cease and desist from committing or causing any violations of certain provisions of the Investment Advisers Act of 1940, the Investment Company Act of 1940, and various Minnesota laws. AEFC agreed to pay disgorgement of $10 million and civil money penalties of $7 million. AEFC also agreed to retain an independent distribution consultant to assist in developing a plan for distribution of all disgorgement and civil penalties ordered by the SEC in accordance with various undertakings detailed at www.sec.gov/litigation/admin/ia-2451.pdf. Ameriprise Financial and its affiliates have cooperated with the SEC and the MDOC in these legal proceedings, and have made regular reports to the Funds' Boards of Trustees.
Ameriprise Financial and certain of its affiliates have historically been involved in a number of legal, arbitration and regulatory proceedings, including routine litigation, class actions, and governmental actions, concerning matters arising in connection with the conduct of their business activities. Ameriprise Financial believes that the Funds are not currently the subject of, and that neither Ameriprise Financial nor any of its affiliates are the subject of, any pending legal, arbitration or regulatory proceedings that are likely to have a material adverse effect on the Funds or the ability of Ameriprise Financial or its affiliates to perform under their contracts with the Funds. Ameriprise Financial is required to make 10-Q, 10-K and, as necessary, 8-K filings with the Securities and Exchange Commission on legal and regulatory matters that relate to Ameriprise Financial and its affiliates. Copies of these filings may be obtained by accessing the SEC website at www.sec.gov.
There can be no assurance that these matters, or the adverse publicity associated with them, will not result in increased fund redemptions, reduced sale of fund shares or other adverse consequences to the Funds. Further, although we believe proceedings are not likely to have a material adverse effect on the Funds or the ability of Ameriprise Financial or its affiliates to perform under their contracts with the Funds, these proceedings are subject to uncertainties and, as such, we are unable to estimate the possible loss or range of loss that may result. An adverse outcome in one or more of these proceedings could result in adverse judgments, settlements, fines, penalties or other relief that could have a material adverse effect on the consolidated financial condition or results of operations of Ameriprise Financial.
Annual Report 2014
29
Columbia Large Cap Enhanced Core Fund
Report of Independent Registered Public Accounting Firm
To the Trustees of Columbia Funds Series Trust and the Shareholders of
Columbia Large Cap Enhanced Core Fund
In our opinion, the accompanying statement of assets and liabilities, including the portfolio of investments, and the related statements of operations and of changes in net assets and the financial highlights present fairly, in all material respects, the financial position of Columbia Large Cap Enhanced Core Fund (the "Fund", a series of Columbia Funds Series Trust) at February 28, 2014, and the results of its operations, the changes in its net assets and the financial highlights for each of the periods indicated, in conformity with accounting principles generally accepted in the United States of America. These financial statements and financial highlights (hereafter referred to as "financial statements") are the responsibility of the Fund's management; our responsibility is to express an opinion on these financial statements based on our audits. We conducted our audits of these financial statements in accordance with the standards of the Public Company Accounting Oversight Board (United States). Those standards require that we plan and perform the audit to obtain reasonable assurance about whether the financial statements are free of material misstatement. An audit includes examining, on a test basis, evidence supporting the amounts and disclosures in the financial statements, assessing the accounting principles used and significant estimates made by management, and evaluating the overall financial statement presentation. We believe that our audits, which included confirmation of securities at February 28, 2014 by correspondence with the custodian, brokers and transfer agent, provide a reasonable basis for our opinion.
PricewaterhouseCoopers LLP
Minneapolis, Minnesota
April 21, 2014
Annual Report 2014
30
Columbia Large Cap Enhanced Core Fund
Federal Income Tax Information
(Unaudited)
The Fund hereby designates the following tax attributes for the fiscal year ended February 28, 2014. Shareholders will be notified in early 2015 of the amounts for use in preparing 2014 income tax returns.
Tax Designations:
| Qualified Dividend Income | | | 100.00 | % | |
| Dividends Received Deduction | | | 100.00 | % | |
Qualified Dividend Income. For taxable, non-corporate shareholders, the percentage of ordinary income dividends paid during the fiscal year that represents qualified dividend income subject to reduced tax rates.
Dividends Received Deduction. The percentage of ordinary income dividends paid during the fiscal year that qualifies for the corporate dividends received deduction.
Annual Report 2014
31
Columbia Large Cap Enhanced Core Fund
Shareholders elect the Board that oversees the Funds' operations. The Board appoints officers who are responsible for day-to-day business decisions based on policies set by the Board. The following table provides basic biographical information about the Funds' Board members, including their principal occupations during the past five years, although specific titles for individuals may have varied over the period. Under current Board policy, members may serve through the end of the calendar year in which he or she reaches either the mandatory retirement age established by the Board or the fifteenth anniversary of the first Board meeting they attended as a member of the Board.
Independent Trustees
Name,
Address,
Year of Birth | | Position Held With
Funds and Length of
Service | | Principal Occupation(s)
During Past Five Years
and Other Relevant
Professional Experience | | Number of
Funds in the
Fund Family
Overseen by
Board Member | | Other Present or Past
Directorships/
Trusteeships
(Within Past 5 Years) | |
Kathleen Blatz
901 S. Marquette Ave.
Minneapolis, MN 55402
1954 | | Board member since 1/06 for RiverSource Funds and since 6/11 for Nations Funds | | Attorney; Chief Justice, Minnesota Supreme
Court, 1998-2006 | | | 131 | | | Trustee, BlueCross BlueShield of Minnesota since 2009 | |
Edward J. Boudreau, Jr.
901 S. Marquette Ave.
Minneapolis, MN 55402
1944 | | Board member since 6/11 for RiverSource Funds and since 1/05 for Nations Funds | | Managing Director, E.J. Boudreau & Associates (consulting) since 2000; Chairman and Chief Executive Officer, John Hancock Funds (mutual funds), 1989-2000 | | | 129 | | | Former Trustee, BofA Funds Series Trust (11 funds), 2005-2011 | |
Pamela G. Carlton
901 S. Marquette Ave.
Minneapolis, MN 55402
1954 | | Board member since 7/07 for RiverSource Funds and since 6/11 for Nations Funds | | President, Springboard — Partners in Cross Cultural Leadership (consulting company) since 2003; Director or Management Director of US Equity Research, Chase Asset Management, 1996-2003; Investment Banker, Morgan Stanley, 1982-1996 | | | 131 | | | None | |
William P. Carmichael
901 S. Marquette Ave.
Minneapolis, MN 55402
1943 | | Chair of the Board since 1/14, Board member since 6/11 for RiverSource Funds and since 2003 for Nations Funds | | Retired; Co-founder, The Succession Fund (provides exit strategies to owners of privately held companies); previously, Senior Vice President, Sara Lee Corporation; Senior Vice President and Chief Financial officer, Beatrice Foods Company; Vice President, Esmark, Inc.; Associate, Price Waterhouse | | | 131 | | | Director, Cobra Electronics Corporation (electronic equipment manufacturer); The Finish Line (athletic shoes and apparel) since July 2003; Director, International Textile Corp. since 2012; former Director, McMoRan Exploration Company (oil and gas exploration and development) 2010-2013; former Trustee, BofA Funds Series Trust (11 funds), 2009-2011; Director, Spectrum Brands, Inc. (consumer products), 2002-2009; Director, Simmons Company (bedding), 2004-2010 | |
Annual Report 2014
32
Columbia Large Cap Enhanced Core Fund
Trustees and Officers (continued)
Independent Trustees (continued)
Name,
Address,
Year of Birth | | Position Held With
Funds and Length of
Service | | Principal Occupation(s)
During Past Five Years
and Other Relevant
Professional Experience | | Number of
Funds in the
Fund Family
Overseen by
Board Member | | Other Present or Past
Directorships/
Trusteeships
(Within Past 5 Years) | |
Patricia M. Flynn
901 S. Marquette Ave.
Minneapolis, MN 55402
1950 | | Board member since 11/04 for RiverSource Funds and since 6/11 for Nations Funds | | Trustee Professor of Economics and Management, Bentley University since 1976 (also teaches and conducts research on corporate governance); Dean, McCallum Graduate School of Business, Bentley University, 1992-2002 | | | 131 | | | None | |
William A. Hawkins
901 S. Marquette Ave.
Minneapolis, MN 55402
1942 | | Board member since 6/11 for RiverSource Funds and since 1/05 for Nations Funds | | Managing Director, Overton Partners (financial consulting), since August 2010; President and Chief Executive Officer, California General Bank, N.A., January 2008-August 2010 | | | 129 | | | Trustee, BofA Funds Series Trust (11 funds) | |
R. Glenn Hilliard
901 S. Marquette Ave.
Minneapolis, MN 55402
1943 | | Board member since 6/11 for RiverSource Funds and since 1/05 for Nations Funds | | Chairman and Chief Executive Officer, Hilliard Group LLC (investing and consulting) since April 2003; Non-Executive Director & Chairman, CNO Financial Group, Inc. (insurance), September 2003-May 2011 | | | 129 | | | Chairman, BofA Fund Series Trust (11 funds); former Director, CNO Financial Group, Inc. (insurance), 2003-2011 | |
Stephen R. Lewis, Jr.
901 S. Marquette Ave.
Minneapolis, MN 55402
1939 | | Board member for RiverSource Funds since 1/02 and since 6/11 for Nations Funds, Board Chair 1/07-12/13 | | President Emeritus and Professor of Economics Emeritus, Carleton College since 2002 | | | 131 | | | Director, Valmont Industries, Inc. (irrigation systems manufacturer), 2002-2013 | |
Catherine James Paglia
901 S. Marquette Ave.
Minneapolis, MN 55402
1952 | | Board member since 11/04 for RiverSource Funds and since 6/11 for Nations Funds | | Director, Enterprise Asset Management, Inc. (private real estate and asset management company) since September 1998 | | | 131 | | | Director, Valmont Industries, Inc. (irrigation systems manufacturer) since 2012 | |
Leroy C. Richie
901 S. Marquette Ave.
Minneapolis, MN 55402
1941 | | Board member since 2000 for Legacy Seligman Funds, since 11/08 for RiverSource Funds and since 6/11 for Nations Funds | | Counsel, Lewis & Munday, P.C. (law firm) since 2004; Vice President and General Counsel, Automotive Legal Affairs, Chrysler Corporation, 1993-1997 | | | 131 | | | Lead Outside Director, Digital Ally, Inc. (digital imaging) since September 2005; Director, Infinity, Inc. (oil and gas exploration and production) since 1994; Director, OGE Energy Corp. (energy and energy services) since November 2007 | |
Minor M. Shaw
901 S. Marquette Ave.
Minneapolis, MN 55402
1947 | | Board member since 6/11 for RiverSource Funds and since 2003 for Nations Funds | | President, Micco LLC (private investments) since 2011; President, Micco Corp. since 1998 | | | 129 | | | Director, Piedmont Natural Gas; Director, BlueCross BlueShield of South Carolina since April 2008; Director, National Association of Corporate Directors, Carolinas Chapter, since 2013; former Trustee, BofA Funds Series Trust (11 funds) | |
Annual Report 2014
33
Columbia Large Cap Enhanced Core Fund
Trustees and Officers (continued)
Independent Trustees (continued)
Name,
Address,
Year of Birth | | Position Held With
Funds and Length of
Service | | Principal Occupation(s)
During Past Five Years
and Other Relevant
Professional Experience | | Number of
Funds in the
Fund Family
Overseen by
Board Member | | Other Present or Past
Directorships/
Trusteeships
(Within Past 5 Years) | |
Alison Taunton-Rigby
901 S. Marquette Ave.
Minneapolis, MN 55402
1944 | | Board member since 11/02 for RiverSource Funds and since 6/11 for Nations Funds | | Chief Executive Officer and Director, RiboNovix, Inc., (biotechnology) 2003-2010 | | | 131 | | | Director, Healthways, Inc. (health and wellbeing solutions) since 2005; Director, ICI Mutual Insurance Company, RRG since 2011; Director, Abt Associates (government contractor) since 2001; Director, Boston Children's Hospital since 2002 | |
Interested Trustee Not Affiliated with Investment Manager*
Name,
Address,
Year of Birth | | Position Held With
Funds and Length of
Service | | Principal Occupation(s)
During Past Five Years
and Other Relevant
Professional Experience | | Number of
Funds in the
Fund Family
Overseen by
Board Member | | Other Present or Past
Directorships/
Trusteeships
(Within Past 5 Years) | |
Anthony M. Santomero
901 S. Marquette Ave.
Minneapolis, MN 55402
1946 | | Board member since 6/11 for RiverSource Funds and since 1/08 for Nations Funds | | Richard K. Mellon Professor Emeritus of Finance, The Wharton School, University of Pennsylvania, since 2002; Senior Advisor, McKinsey & Company (consulting), 2006-2008 | | | 129 | | | Director, Renaissance Reinsurance Ltd. since May 2008; Trustee, Penn Mutual Life Insurance Company since March 2008; Director, Citigroup Inc. since 2009; Director, Citibank, N.A. since 2009; former Trustee, BofA Funds Series Trust (11 funds), 2008-2011 | |
* Dr. Santomero is not an affiliated person of the Investment Manager or Ameriprise Financial. However, he is currently deemed by the Funds to be an "interested person" (as defined in the 1940 Act) of the Funds because he serves as a Director of Citigroup Inc. and Citibank, N.A., companies that may directly or through subsidiaries and affiliates engage from time-to-time in brokerage execution, principal transactions and lending relationships with the Funds or accounts advised/managed by the Investment Manager.
Annual Report 2014
34
Columbia Large Cap Enhanced Core Fund
Trustees and Officers (continued)
Interested Trustee Affiliated with Investment Manager*
Name,
Address,
Year of Birth | | Position Held With
Funds and Length of
Service | | Principal Occupation(s)
During Past Five Years
and Other Relevant
Professional Experience | | Number of
Funds in the
Fund Family
Overseen by
Board Member | | Other Present or Past
Directorships/
Trusteeships
(Within Past 5 Years) | |
William F. Truscott
53600 Ameriprise
Financial Center
Minneapolis, MN 55474
1960 | | Board member since 11/01 for RiverSource Funds and since 6/11 for Nations Funds; Senior Vice President since 2002 for RiverSource Funds and since 5/10 for Nations Funds | | Chairman of the Board and President, Columbia Management Investment Advisers, LLC since May 2010 and February 2012, respectively (previously President and Chief Investment Officer, 2001-April 2010); Chief Executive Officer, Global Asset Management, Ameriprise Financial, Inc. since September 2012 (previously Chief Executive Officer, U.S. Asset Management & President, Annuities, May 2010-September 2012 and President — U.S. Asset Management and Chief Investment Officer, 2005-April 2010); Director and Chief Executive Officer, Columbia Management Investment Distributors, Inc. since May 2010 and February 2012, respectively (previously Chairman of the Board and Chief Executive Officer, 2006-April 2010); Chairman of the Board and Chief Executive Officer, RiverSource Distributors, Inc. since 2006; Director, Threadneedle Asset Management Holdings, SARL since 2014; President and Chief Executive Officer, Ameriprise Certificate Company, 2006-August 2012 | | | 183 | | | Former Director, Ameriprise Certificate Company, 2006-January 2013 | |
* Interested person (as defined under the 1940 Act) by reason of being an officer, director, security holder and/or employee of the Investment Manager or Ameriprise Financial.
The SAI has additional information about the Fund's Board members and is available, without charge, upon request by calling 800.345.6611; contacting your financial intermediary or visiting columbiamanagement.com.
Annual Report 2014
35
Columbia Large Cap Enhanced Core Fund
Trustees and Officers (continued)
The Board has appointed officers who are responsible for day-to-day business decisions based on policies it has established. The officers serve at the pleasure of the Board. In addition to Mr. Truscott, who is Senior Vice President, the Funds' other officers are:
Officers
Name,
Address and
Year of Birth | | Position and Year
First Appointed to
Position for any Fund
in the Columbia
Funds Complex or a
Predecessor Thereof | | Principal Occupation(s) During Past Five Years | |
J. Kevin Connaughton
225 Franklin Street
Boston, MA 02110
Born 1964 | | President and Principal Executive Officer (2009) | | Managing Director and General Manager — Mutual Fund Products, Columbia Management Investment Advisers, LLC since May 2010; and President, Columbia Funds since 2009; Managing Director, Columbia Management Advisors, LLC, December 2004 – April 2010; Senior Vice President and Chief Financial Officer, Columbia Funds, June 2008 – January 2009; and senior officer of Columbia Funds and affiliated funds since 2003 | |
Michael G. Clarke
225 Franklin Street
Boston, MA 02110
Born 1969 | | Treasurer (2011) and Chief Financial Officer (2009) | | Vice President — Mutual Fund Administration, Columbia Management Investment Advisers, LLC, since May 2010;Managing Director of Fund Administration, Columbia Management Advisors, LLC, September 2004 – April 2010; and senior officer of Columbia Funds and affiliated funds since 2002 | |
Scott R. Plummer
5228 Ameriprise Financial Center
Minneapolis, MN 55474
Born 1959 | | Senior Vice President (2006), Chief Legal Officer (2006) and Assistant Secretary (2011) | | Senior Vice President and Assistant General Counsel — Global Asset Management, Ameriprise Financial since February 2014 (previously, Senior Vice President and Lead Chief Counsel — Asset Management, 2012 – February 2014; Vice President and Lead Chief Counsel — Asset Management, 2010 – 2012; and Vice President and Chief Counsel — Asset Management, 2005 – 2010); Senior Vice President, Chief Legal Officer and Assistant Secretary, Columbia Management Investment Advisers, LLC since June 2005; Vice President, Chief Counsel and Assistant Secretary, Columbia Management Investment Distributors, Inc. since 2008; Vice President, General Counsel and Secretary, Ameriprise Certificate Company since 2005; Chief Counsel, RiverSource Distributors, Inc. since 2006; senior officer of Columbia Funds and affiliated funds since 2006 | |
Thomas P. McGuire
225 Franklin Street
Boston, MA 02110
Born 1972 | | Chief Compliance Officer (2012) | | Vice President — Asset Management Compliance, Ameriprise Financial, Inc. since May 2010; Chief Compliance Officer, Ameriprise Certificate Company, since September 2010; Compliance Executive, Bank of America, 2005 – April 2010 | |
Colin Moore
225 Franklin Street
Boston, MA 02110
Born 1958 | | Senior Vice President (2010) | | Executive Vice President and Global Chief Investment Officer, Ameriprise Financial, Inc. since July 2013; Director and Global Chief Investment Officer, Columbia Management Investment Advisers, LLC since May 2010; Manager, Managing Director and Chief Investment Officer, Columbia Management Advisors, LLC, 2007 – April 2010 | |
Michael E. DeFao
225 Franklin Street
Boston, MA 02110
Born 1968 | | Vice President (2011) and Assistant Secretary (2010) | | Vice President and Chief Counsel, Ameriprise Financial, Inc. since May 2010; Associate General Counsel, Bank of America 2005 – April 2010 | |
Joseph F. DiMaria
225 Franklin Street
Boston, MA 02110
Born 1968 | | Vice President (2011) and Chief Accounting Officer (2008) | | Vice President — Mutual Fund Treasurer, Columbia Management Investment Advisers, LLC since May 2010; Director of Fund Administration, Columbia Management Advisors, LLC, 2006 – April 2010 | |
Paul B. Goucher
100 Park Avenue
New York, NY 10017
Born 1968 | | Vice President (2011) and Assistant Secretary (2008) | | Vice President and Lead Chief Counsel, Ameriprise Financial, Inc. since November 2008 and January 2013, respectively (previously Chief Counsel, January 2010 – January 2013, and Group Counsel, November 2008 – January 2010); Director, Managing Director and General Counsel, J. & W. Seligman & Co. Incorporated, July 2008 – November 2008 | |
Amy Johnson
5228 Ameriprise Financial
Center
Minneapolis, MN 55474
Born 1965 | | Vice President (2006) | | Managing Director and Chief Operating Officer, Columbia Management Investment Advisers, LLC since May 2010 (previously Chief Administrative Officer, 2009 – April 2010, and Vice President — Asset Management and Trust Company Services, 2006 – 2009) | |
Annual Report 2014
36
Columbia Large Cap Enhanced Core Fund
Trustees and Officers (continued)
Officers (continued)
Name,
Address and
Year of Birth | | Position and Year
First Appointed to
Position for any Fund
in the Columbia
Funds Complex or a
Predecessor Thereof | | Principal Occupation(s) During Past Five Years | |
Paul D. Pearson
5228 Ameriprise Financial
Center
Minneapolis, MN 55474
Born 1956 | | Vice President (2011) and Assistant Treasurer (1999) | | Vice President — Investment Accounting, Columbia Management Investment Advisers, LLC since May 2010; Vice President — Managed Assets, Investment Accounting, Ameriprise Financial, Inc., 1998 – April 2010 | |
Christopher O. Petersen
5228 Ameriprise Financial Center
Minneapolis, MN 55474
Born 1970 | | Vice President and Secretary (2010) | | Vice President and Chief Counsel, Ameriprise Financial, Inc., since January 2010 (previously Vice President and Group Counsel or Counsel, 2004 – January 2010); officer of Columbia Funds and affiliated funds since 2007 | |
Stephen T. Welsh
225 Franklin Street
Boston, MA 02110
Born 1957 | | Vice President (2006) | | President and Director, Columbia Management Investment Services Corp. since May 2010; President and Director, Columbia Management Services, Inc., 2004 – April 2010; Managing Director, Columbia Management Distributors, Inc., 2007 – April 2010 | |
Annual Report 2014
37
This page intentionally left blank.
Annual Report 2014
38
This page intentionally left blank.
Annual Report 2014
39
This page intentionally left blank.
Annual Report 2014
40
Columbia Large Cap Enhanced Core Fund
Important Information About This Report
Each fund mails one shareholder report to each shareholder address. If you would like more than one report, please call shareholder services at 800.345.6611 and additional reports will be sent to you.
The policy of the Board is to vote the proxies of the companies in which each fund holds investments consistent with the procedures as stated in the Statement of Additional Information (SAI). You may obtain a copy of the SAI without charge by calling 800.345.6611; contacting your financial intermediary; visiting columbiamanagement.com; or searching the website of the Securities and Exchange Commission (SEC) at sec.gov. Information regarding how each fund voted proxies relating to portfolio securities is filed with the SEC by August 31 for the most recent 12-month period ending June 30 of that year, and is available without charge by visiting columbiamanagement.com; or searching the website of the SEC at sec.gov.
Each fund files a complete schedule of portfolio holdings with the SEC for the first and third quarters of each fiscal year on Form N-Q. Each fund's Form N-Q is available on the SEC's website at sec.gov and may be reviewed and copied at the SEC's Public Reference Room in Washington, D.C. Information on the operation of the Public Reference Room may be obtained by calling 800.SEC.0330. Each fund's complete schedule of portfolio holdings, as filed on Form N-Q, can also be obtained without charge, upon request, by calling 800.345.6611.
Annual Report 2014
41

Columbia Large Cap Enhanced Core Fund
P.O. Box 8081
Boston, MA 02266-8081
columbiamanagement.com
This information is for use with concurrent or prior delivery of a fund prospectus. Please read and consider the investment objectives, risks, charges and expenses for any fund carefully before investing. For a prospectus and, if available, a summary prospectus, which contains this and other important information about the Fund go to columbiamanagement.com. The Fund is distributed by Columbia Management Investment Distributors, Inc., member FINRA, and managed by Columbia Management Investment Advisers, LLC.
© 2014 Columbia Management Investment Advisers, LLC. All rights reserved.
ANN173_02_D01_(04/14)
Annual Report
February 28, 2014

Columbia Marsico Growth Fund
Not FDIC insured • No bank guarantee • May lose value
 Dear Shareholders,
Equities recovered
In the final months of 2013, the U.S. economy embraced a robust recovery. After five years of only modest progress, the pace of economic growth picked up, job gains continued, manufacturing activity accelerated and a rebound in the housing market showed staying power. Growth, as measured by gross domestic product, was 4.1% in the third quarter, with expectations for a solid fourth quarter. Job growth averaged close to 200,000 monthly. Industrial production rose at a rate of 3.3%, considerably higher than the 12-month average of 2.5%. Factories were busier than at any point since the 2008/2009 recession, with capacity utilization at 79%. Orders for durable goods were strong, bolstered by rising auto sales. Holiday spending was solid, especially online sales, which rose 10% year over year, despite a shorter season.
Against this backdrop, the Federal Reserve's (the Fed's) announcement that it would slowly retreat from its monthly bond buying program and a bipartisan budget deal in Washington were welcome news for investors. Stocks climbed to new highs in the fourth quarter, while bonds retreated as yields moved higher. Small-cap stocks outperformed large- and mid-cap stocks, led by significant gains from the industrials, technology and consumer discretionary sectors. All 10 sectors of the S&P 500 Index delivered positive returns, although telecommunications and utilities posted only modest gains.
Fixed-income retreated
Improved economic data drove interest rates higher over the fourth quarter, credit spreads narrowed and the dollar weakened against most developed market currencies. Against this backdrop, most non-Treasury, fixed-income sectors delivered positive returns. Outgoing Fed chairman Ben Bernanke expressed concern about the persistently low level of core inflation, but gains in the labor market and reduced unemployment led to the Fed's decision to taper its bond-buying program gradually beginning in January 2014.
As the stock market soared, the riskiest sectors of the fixed-income markets fared the best. U.S. and foreign high-yield bonds were the strongest performers, followed by emerging-market and U.S. investment-grade corporate bonds. U.S. mortgage-backed securities (MBS) and securitized bonds produced negative total returns, as did U.S. Treasuries and developed world government bonds. Treasury inflation-protected bonds were the period's biggest losers. Investment-grade municipals delivered fractional gains, as better economic conditions helped steady state finances.
Stay on track with Columbia Management
Backed by more than 100 years of experience, Columbia Management is one of the nation's largest asset managers. At the heart of our success and, most importantly, that of our investors, are highly talented industry professionals, brought together by a unique way of working. At Columbia Management, reaching our performance goals matters, and how we reach them matters just as much.
Visit columbiamanagement.com for:
> The Columbia Management Perspectives blog, offering insights on current market events and investment opportunities
> Detailed up-to-date fund performance and portfolio information
> Quarterly fund commentaries
> Columbia Management Investor, our award-winning quarterly newsletter for shareholders
Thank you for your continued support of the Columbia Funds. We look forward to serving your investment needs for many years to come.
Best Regards,

J. Kevin Connaughton
President, Columbia Funds
Investing involves risk including the risk of loss of principal.
The S&P 500 Index, an unmanaged index, measures the performance of 500 widely held, large-capitalization U.S. stocks and is frequently used as a general measure of market performance. The Dow Jones Industrial Average is a price weighted average of 30 actively traded shares of blue chip US industrial corporations listed on the New York Stock Exchange. Indices are not available for investment, are not professionally managed and do not reflect sales charges, fees, brokerage commissions, taxes or other expenses of investing.
Investors should consider the investment objectives, risks, charges and expenses of a mutual fund carefully before investing. For a free prospectus and, if available, a summary prospectus, which contains this and other important information about a fund, visit columbiamanagement.com. The prospectus should be read carefully before investing.
Columbia Funds are distributed by Columbia Management Investment Distributors, Inc., member FINRA, and managed by Columbia Management Investment Advisers, LLC.
© 2014 Columbia Management Investment Advisers, LLC. All rights reserved.
Columbia Marsico Growth Fund
Performance Overview | | | 2 | | |
Manager Discussion of Fund Performance | | | 4 | | |
Understanding Your Fund's Expenses | | | 6 | | |
Portfolio of Investments | | | 7 | | |
Statement of Assets and Liabilities | | | 11 | | |
Statement of Operations | | | 13 | | |
Statement of Changes in Net Assets | | | 14 | | |
Financial Highlights | | | 16 | | |
Notes to Financial Statements | | | 25 | | |
Report of Independent Registered
Public Accounting Firm | | | 31 | | |
Federal Income Tax Information | | | 32 | | |
Trustees and Officers | | | 33 | | |
Important Information About This Report | | | 41 | | |
Fund Investment Manager
Columbia Management Investment
Advisers, LLC
225 Franklin Street
Boston, MA 02110
Fund Distributor
Columbia Management Investment
Distributors, Inc.
225 Franklin Street
Boston, MA 02110
Fund Transfer Agent
Columbia Management Investment
Services Corp.
P.O. Box 8081
Boston, MA 02266-8081
For more information about any of the funds, please visit columbiamanagement.com or call 800.345.6611. Customer Service Representatives are available to answer your questions Monday through Friday from 8 a.m. to 7 p.m. Eastern time.
The views expressed in this report reflect the current views of the respective parties. These views are not guarantees of future performance and involve certain risks, uncertainties and assumptions that are difficult to predict, so actual outcomes and results may differ significantly from the views expressed. These views are subject to change at any time based upon economic, market or other conditions and the respective parties disclaim any responsibility to update such views. These views may not be relied on as investment advice and, because investment decisions for a Columbia Fund are based on numerous factors, may not be relied on as an indication of trading intent on behalf of any particular Columbia Fund. References to specific securities should not be construed as a recommendation or investment advice.
Columbia Marsico Growth Fund
Performance Summary
> Columbia Marsico Growth Fund (the Fund) Class A shares returned 32.56% excluding sales charges for the 12-month period that ended February 28, 2014.
> The Fund outperformed its benchmark, the S&P 500 Index, which returned 25.37% for the same time period.
> Strong stock selection in the health care, consumer discretionary, information technology and consumer staples sectors drove the Fund's outperformance during the period. Sector allocation also aided relative results.
Average Annual Total Returns (%) (for period ended February 28, 2014)
| | | Inception | | 1 Year | | 5 Years | | 10 Years | |
Class A | | 12/31/97 | | | | | | | | | | | | | |
Excluding sales charges | | | | | | | 32.56 | | | | 22.89 | | | | 7.20 | | |
Including sales charges | | | | | | | 24.91 | | | | 21.45 | | | | 6.56 | | |
Class B | | 12/31/97 | | | | | | | | | | | | | |
Excluding sales charges | | | | | | | 31.58 | | | | 22.00 | | | | 6.40 | | |
Including sales charges | | | | | | | 26.58 | | | | 21.82 | | | | 6.40 | | |
Class C | | 12/31/97 | | | | | | | | | | | | | |
Excluding sales charges | | | | | | | 31.64 | | | | 21.99 | | | | 6.40 | | |
Including sales charges | | | | | | | 30.64 | | | | 21.99 | | | | 6.40 | | |
Class I* | | 09/27/10 | | | 33.18 | | | | 23.30 | | | | 7.38 | | |
Class R* | | 01/23/06 | | | 32.24 | | | | 22.60 | | | | 6.91 | | |
Class R4* | | 11/08/12 | | | 32.88 | | | | 22.97 | | | | 7.23 | | |
Class R5* | | 11/08/12 | | | 33.12 | | | | 23.02 | | | | 7.25 | | |
Class W* | | 09/27/10 | | | 32.63 | | | | 22.91 | | | | 7.21 | | |
Class Z | | 12/31/97 | | | 32.89 | | | | 23.21 | | | | 7.47 | | |
S&P 500 Index | | | | | | | 25.37 | | | | 23.00 | | | | 7.16 | | |
Returns for Class A are shown with and without the maximum initial sales charge of 5.75%. Returns for Class B are shown with and without the applicable contingent deferred sales charge (CDSC) of 5.00% in the first year, declining to 1.00% in the sixth year and eliminated thereafter. Returns for Class C are shown with and without the 1.00% CDSC for the first year only. The Fund's other classes are not subject to sales charges and have limited eligibility. Please see the Fund's prospectus for details. Performance for different share classes will vary based on differences in sales charges and fees associated with each class. All results shown assume reinvestment of distributions during the period. Returns do not reflect the deduction of taxes that a shareholder may pay on Fund distributions or on the redemption of Fund shares. Performance results reflect the effect of any fee waivers or reimbursements of Fund expenses by Columbia Management Investment Advisers, LLC and/or any of its affiliates. Absent these fee waivers or expense reimbursement arrangements, performance results would have been lower.
The performance information shown represents past performance and is not a guarantee of future results. The investment return and principal value of your investment will fluctuate so that your shares, when redeemed, may be worth more or less than their original cost. Current performance may be lower or higher than the performance information shown. You may obtain performance information current to the most recent month-end by contacting your financial intermediary, visiting columbiamanagement.com or calling 800.345.6611.
*The returns shown for periods prior to the share class inception date (including returns for the Life of the Fund, if shown, which are since Fund inception) include the returns of the Fund's oldest share class. Since the Fund launched more than one share class at its inception, Class A shares were used. These returns are adjusted to reflect any higher class-related operating expenses of the newer share classes, as applicable. Please visit columbiamanagement.com/mutual-funds/appended-performance for more information.
The S&P 500 Index, an unmanaged index, measures the performance of 500 widely held, large-capitalization U.S. stocks and is frequently used as a general measure of market performance.
Indices are not available for investment, are not professionally managed and do not reflect sales charges, fees, brokerage commissions, taxes or other expenses of investing. Securities in the Fund may not match those in an index.
Annual Report 2014
2
Columbia Marsico Growth Fund
Performance Overview (continued)
Performance of a Hypothetical $10,000 Investment (March 1, 2004 – February 28, 2014)

The chart above shows the change in value of a hypothetical $10,000 investment in Class A shares of Columbia Marsico Growth Fund during the stated time period, and does not reflect the deduction of taxes that a shareholder may pay on Fund distributions or on the redemption of Fund shares.
Annual Report 2014
3
Columbia Marsico Growth Fund
Manager Discussion of Fund Performance
For the 12-month period that ended February 28, 2014, the Fund's Class A shares returned 32.56% excluding sales charges. The Fund outperformed its benchmark, the S&P 500 Index, which returned 25.37% for the same time period. Strong stock selection in the health care, consumer discretionary, information technology and consumer staples sectors drove the Fund's outperformance during the period. We did well to emphasize the consumer discretionary and health care sectors and to underweight the consumer staples, energy, utilities and telecommunication services sectors relative to the benchmark. Stock selection in the materials, financials and industrials sectors, along with some individual disappointments detracted from performance.
Stocks Rose in a Favorable Market Environment
Despite a string of weak job gains at the end of 2013 — and a difficult winter, which affected job growth, construction activity and the housing market — the U.S. economy expanded at a respectable pace over the 12-month period that ended February 28, 2014. Pent-up demand, low mortgage rates and an improving labor market helped home sales advance, and foreclosure activity trended downward. After a brief pullback, manufacturing activity picked up midway through the period and remained solid. Businesses remained profitable and household finances were healthy, with lower debt loads and stronger credit conditions.
Even though a host of concerns weighed on investors, stock prices moved higher as central banks continued to pour liquidity into the financial markets. Investors shrugged off concerns regarding tax increases and enforced federal spending cuts, another showdown over the debt ceiling and the possibility of an attack on Syria. Midway through the period, the Federal Reserve's (the Fed's) talk about removing monetary support briefly dampened investor enthusiasm. However, once the Fed chose not to act until 2014, the market rally rebooted. In fact, U.S. equities posted their most significant gains since the late 1990s.
Stock Selection, Sector Allocation Aided Performance
Stock selection plus an overweight in health care relative to the benchmark aided results, as health care was the strongest performing sector within the benchmark. We favored pharmaceutical and biotechnology companies, attracted by the quality of the science they are using to treat diseases that were considered untreatable just a few years ago. We are seeing a variety of emerging therapeutic pathways and believe we are in the early stages of a paradigm shift in disease treatment, in which highly specialized compounds are developed to treat specific genetic targets. Gilead Sciences and Biogen Idec are two such companies. Gilead Sciences is a world leader in therapeutics for viral diseases. We believe the company may experience increased growth from the upcoming launch of a new drug franchise for Hepatitis C. Biogen Idec is a leader in developing treatments for multiple sclerosis (MS). During the period, the company received Food & Drug Administration approval for Tecfidera, the first oral medication that could allow thousands of MS patients to stop receiving drugs by needle or intravenously.
The Fund also had more exposure than the benchmark to the strong performing consumer discretionary sector. Within consumer discretionary holdings, Wynn Resorts, priceline.com and CBS were standout performers. Wynn Resorts generated strong revenues from its Macau casino resorts and its stock price rose. priceline.com benefited from solid bookings growth and expansion into new
Portfolio Management
Marsico Capital Management, LLC
Thomas Marsico
Coralie Witter, CFA
Morningstar Style BoxTM

The Morningstar Style BoxTM is based on a fund's portfolio holdings. For equity funds, the vertical axis shows the market capitalization of the stocks owned, and the horizontal axis shows investment style (value, blend, or growth). Information shown is based on the most recent data provided by Morningstar.
© 2014 Morningstar, Inc. All rights reserved. The Morningstar information contained herein: (1) is proprietary to Morningstar and/or its content providers; (2) may not be copied or distributed; and (3) is not warranted to be accurate, complete or timely. Neither Morningstar nor its content providers are responsible for any damages or losses arising from any use of this information.
Top Ten Holdings (%)
(at February 28, 2014) | |
Gilead Sciences, Inc. | | | 6.6 | | |
Google, Inc., Class A | | | 6.0 | | |
Biogen Idec, Inc. | | | 5.8 | | |
Visa, Inc., Class A | | | 4.4 | | |
Monsanto Co. | | | 4.3 | | |
Facebook, Inc., Class A | | | 4.0 | | |
priceline.com, Inc. | | | 4.0 | | |
Starwood Hotels & Resorts
Worldwide, Inc. | | | 3.8 | | |
Sherwin-Williams Co. (The) | | | 3.3 | | |
Celgene Corp. | | | 3.2 | | |
Percentages indicated are based upon total investments (excluding Money Market Funds and other cash equivalents).
For further detail about these holdings, please refer to the section entitled "Portfolio of Investments."
Fund holdings are as of the date given, are subject to change at any time, and are not recommendations to buy or sell any security.
Annual Report 2014
4
Columbia Marsico Growth Fund
Manager Discussion of Fund Performance (continued)
markets. CBS posted strong results as the network saw growth in its advertising segment and retransmission revenue gains.
Stock selection in the information technology and consumer staples sectors also aided performance. Facebook was another meaningful contributor to performance for the period. Strong advertising revenues in its mobile business benefited Facebook shares. Positions in Visa, Google and Green Mountain Coffee also benefited results. Green Mountain Coffee shares rose after the firm announced a partnership with Coca-Cola and revealed plans for a new cold beverage product.
The Fund had no exposure to utilities and telecommunication services, which were the weakest performing sectors of the benchmark, and had little exposure to consumer staples and energy, which lagged the overall return of the benchmark. These allocation decisions further aided results.
Materials, Industrials and Financials Detracted
Stock selection in the materials and industrials sectors detracted from performance. Aerospace company Boeing and power systems company Rolls-Royce Holdings each posted weak returns, and Boeing was sold from the portfolio. Agricultural materials firm Monsanto posted a positive return, but lagged the overall return of the benchmark. We continue to hold Monsanto as we believe the company's seeds, biotechnology traits and herbicides help improve agricultural productivity and reduce food costs. Stock selection in the financials sector also detracted from relative performance, and we reduced holdings in favor of investments in sectors in which we have higher conviction. Individual disappointments included athletic apparel company lululemon athletica and eBay. eBay reported softness in its international business, while lululemon athletica faced several challenges during the period, including quality control and the resignation of its CEO. Both stocks were sold.
In addition to cutting exposure to financial stocks, we reduced the Fund's allocations to the consumer discretionary and industrials sectors during the period, while increasing investments in the information technology, materials and consumer staples sectors.
Looking Ahead
We believe we are currently entering a period of low inflation and modest economic growth. Against this backdrop, we believe that companies with steadily expanding earnings, strong cash flow, increasing margins, rising market share, improving profitability, the development of innovative products and the effective allocation of capital to fuel further growth may be positioned to outperform their peers. These are the characteristics we seek in holdings we select for the Fund. As of period-end, the Fund's largest sector allocations included consumer discretionary, information technology, health care and industrials.
Portfolio Breakdown (%)
(at February 28, 2014) | |
Common Stocks | | | 98.2 | | |
Consumer Discretionary | | | 28.4 | | |
Consumer Staples | | | 3.7 | | |
Energy | | | 4.5 | | |
Financials | | | 2.9 | | |
Health Care | | | 15.3 | | |
Industrials | | | 10.1 | | |
Information Technology | | | 23.7 | | |
Materials | | | 9.6 | | |
Money Market Funds | | | 1.8 | | |
Total | | | 100.0 | | |
Percentages indicated are based upon total investments. The Fund's portfolio composition is subject to change.
Investment Risks
The Fund is subject to stock market fluctuations The Fund can invest up to 25% of its assets in foreign securities. International investing involves special risks, including foreign taxation, currency risks, risks associated with possible differences in financial standards, and other monetary and political risks. The Fund normally invests in a core portfolio of 35 – 50 stocks. By maintaining a relatively concentrated portfolio, the Fund may be subject to greater risks than a fund that is more fully diversified. See the Fund's prospectus for more information on these and other risks.
Annual Report 2014
5
Columbia Marsico Growth Fund
Understanding Your Fund's Expenses
(Unaudited)
As an investor, you incur two types of costs. There are transaction costs, which generally include sales charges on purchases and may include redemption fees. There are also ongoing costs, which generally include management fees, distribution and/or service fees, and other fund expenses. The following information is intended to help you understand your ongoing costs (in dollars) of investing in the Fund and to help you compare these costs with the ongoing costs of investing in other mutual funds.
Analyzing Your Fund's Expenses
To illustrate these ongoing costs, we have provided examples and calculated the expenses paid by investors in each share class of the Fund during the period. The actual and hypothetical information in the table is based on an initial investment of $1,000 at the beginning of the period indicated and held for the entire period. Expense information is calculated two ways and each method provides you with different information. The amount listed in the "Actual" column is calculated using the Fund's actual operating expenses and total return for the period. You may use the Actual information, together with the amount invested, to estimate the expenses that you paid over the period. Simply divide your account value by $1,000 (for example, an $8,600 account value divided by $1,000 = 8.6), then multiply the results by the expenses paid during the period under the "Actual" column. The amount listed in the "Hypothetical" column assumes a 5% annual rate of return before expenses (which is not the Fund's actual return) and then applies the Fund's actual expense ratio for the period to the hypothetical return. You should not use the hypothetical account values and expenses to estimate either your actual account balance at the end of the period or the expenses you paid during the period. See "Compare With Other Funds" below for details on how to use the hypothetical data.
Compare With Other Funds
Since all mutual funds are required to include the same hypothetical calculations about expenses in shareholder reports, you can use this information to compare the ongoing cost of investing in the Fund with other funds. To do so, compare the hypothetical example with the 5% hypothetical examples that appear in the shareholder reports of other funds. As you compare hypothetical examples of other funds, it is important to note that hypothetical examples are meant to highlight the ongoing costs of investing in a fund only and do not reflect any transaction costs, such as sales charges, or redemption or exchange fees. Therefore, the hypothetical calculations are useful in comparing ongoing costs only, and will not help you determine the relative total costs of owning different funds. If transaction costs were included in these calculations, your costs would be higher.
September 1, 2013 – February 28, 2014
| | | Account Value at the Beginning
of the Period ($) | | Account Value at the End of the
Period ($) | | Expenses Paid During the
Period ($) | | Fund's Annualized
Expense Ratio (%) | |
| | | Actual | | Hypothetical | | Actual | | Hypothetical | | Actual | | Hypothetical | | Actual | |
Class A | | | 1,000.00 | | | | 1,000.00 | | | | 1,202.60 | | | | 1,019.10 | | | | 6.42 | | | | 5.89 | | | | 1.17 | | |
Class B | | | 1,000.00 | | | | 1,000.00 | | | | 1,198.30 | | | | 1,015.36 | | | | 10.52 | | | | 9.65 | | | | 1.92 | | |
Class C | | | 1,000.00 | | | | 1,000.00 | | | | 1,198.50 | | | | 1,015.36 | | | | 10.52 | | | | 9.65 | | | | 1.92 | | |
Class I | | | 1,000.00 | | | | 1,000.00 | | | | 1,205.60 | | | | 1,021.49 | | | | 3.79 | | | | 3.48 | | | | 0.69 | | |
Class R | | | 1,000.00 | | | | 1,000.00 | | | | 1,201.40 | | | | 1,017.85 | | | | 7.79 | | | | 7.14 | | | | 1.42 | | |
Class R4 | | | 1,000.00 | | | | 1,000.00 | | | | 1,204.50 | | | | 1,020.34 | | | | 5.06 | | | | 4.63 | | | | 0.92 | | |
Class R5 | | | 1,000.00 | | | | 1,000.00 | | | | 1,205.40 | | | | 1,021.09 | | | | 4.23 | | | | 3.88 | | | | 0.77 | | |
Class W | | | 1,000.00 | | | | 1,000.00 | | | | 1,203.20 | | | | 1,019.25 | | | | 6.26 | | | | 5.74 | | | | 1.14 | | |
Class Z | | | 1,000.00 | | | | 1,000.00 | | | | 1,204.40 | | | | 1,020.34 | | | | 5.06 | | | | 4.63 | | | | 0.92 | | |
Expenses paid during the period are equal to the annualized expense ratio for each class as indicated above, multiplied by the average account value over the period and then multiplied by the number of days in the Fund's most recent fiscal half year and divided by 365.
Expenses do not include fees and expenses incurred indirectly by the Fund from the underlying funds in which the Fund may invest (also referred to as "acquired funds"), including affiliated and non-affiliated pooled investment vehicles (including mutual funds and exchange-traded funds).
Annual Report 2014
6
Columbia Marsico Growth Fund
Portfolio of Investments
February 28, 2014
(Percentages represent value of investments compared to net assets)
Common Stocks 98.8%
Issuer | | Shares | | Value ($) | |
Consumer Discretionary 28.5% | |
Hotels, Restaurants & Leisure 8.2% | |
Panera Bread Co., Class A(a) | | | 62,759 | | | | 11,379,462 | | |
Starbucks Corp. | | | 266,656 | | | | 18,921,910 | | |
Starwood Hotels & Resorts
Worldwide, Inc. | | | 968,759 | | | | 79,883,867 | | |
Wynn Resorts Ltd. | | | 265,481 | | | | 64,376,488 | | |
Total | | | | | 174,561,727 | | |
Internet & Catalog Retail 5.2% | |
Amazon.com, Inc.(a) | | | 74,778 | | | | 27,077,114 | | |
priceline.com, Inc.(a) | | | 62,166 | | | | 83,851,987 | | |
Total | | | | | 110,929,101 | | |
Media 10.8% | |
CBS Corp., Class B Non Voting | | | 994,490 | | | | 66,710,389 | | |
Comcast Corp., Class A | | | 874,143 | | | | 45,184,452 | | |
Liberty Global PLC, Class A(a) | | | 371,396 | | | | 32,144,324 | | |
Liberty Media Corp., Class A(a) | | | 151,814 | | | | 20,822,808 | | |
Walt Disney Co. (The) | | | 801,582 | | | | 64,775,841 | | |
Total | | | | | 229,637,814 | | |
Specialty Retail 4.3% | |
Gap, Inc. (The) | | | 549,053 | | | | 24,021,069 | | |
Home Depot, Inc. (The) | | | 272,037 | | | | 22,315,195 | | |
TJX Companies, Inc. (The) | | | 740,993 | | | | 45,541,430 | | |
Total | | | | | 91,877,694 | | |
Total Consumer Discretionary | | | | | 607,006,336 | | |
Consumer Staples 3.8% | |
Food & Staples Retailing 1.5% | |
CVS Caremark Corp. | | | 439,844 | | | | 32,170,190 | | |
Food Products 2.3% | |
Green Mountain Coffee Roasters, Inc. | | | 438,478 | | | | 48,136,115 | | |
Total Consumer Staples | | | | | 80,306,305 | | |
Energy 4.5% | |
Energy Equipment & Services 2.4% | |
Schlumberger Ltd. | | | 550,866 | | | | 51,230,538 | | |
Oil, Gas & Consumable Fuels 2.1% | |
Antero Resources Corp.(a) | | | 360,778 | | | | 21,769,344 | | |
Continental Resources, Inc.(a) | | | 192,253 | | | | 22,978,079 | | |
Total | | | | | 44,747,423 | | |
Total Energy | | | | | 95,977,961 | | |
Common Stocks (continued)
Issuer | | Shares | | Value ($) | |
Financials 2.9% | |
Diversified Financial Services 2.9% | |
Citigroup, Inc. | | | 851,877 | | | | 41,426,778 | | |
IntercontinentalExchange Group, Inc. | | | 98,382 | | | | 20,546,097 | | |
Total | | | | | 61,972,875 | | |
Total Financials | | | | | 61,972,875 | | |
Health Care 15.4% | |
Biotechnology 15.4% | |
Biogen Idec, Inc.(a) | | | 357,550 | | | | 121,810,134 | | |
Celgene Corp.(a) | | | 417,744 | | | | 67,152,348 | | |
Gilead Sciences, Inc.(a) | | | 1,667,499 | | | | 138,052,242 | | |
Total | | | | | 327,014,724 | | |
Total Health Care | | | | | 327,014,724 | | |
Industrials 10.2% | |
Aerospace & Defense 1.9% | |
General Dynamics Corp. | | | 292,706 | | | | 32,063,015 | | |
Rolls-Royce Holdings PLC | | | 462,086 | | | | 7,730,128 | | |
Total | | | | | 39,793,143 | | |
Airlines 0.9% | |
United Continental Holdings, Inc.(a) | | | 423,538 | | | | 19,042,269 | | |
Commercial Services & Supplies 1.5% | |
Tyco International Ltd. | | | 741,650 | | | | 31,282,797 | | |
Road & Rail 5.9% | |
Canadian Pacific Railway Ltd. | | | 415,432 | | | | 65,222,824 | | |
Union Pacific Corp. | | | 338,729 | | | | 61,099,937 | | |
Total | | | | | 126,322,761 | | |
Total Industrials | | | | | 216,440,970 | | |
Information Technology 23.9% | |
Internet Software & Services 12.1% | |
Facebook, Inc., Class A(a) | | | 1,242,644 | | | | 85,071,408 | | |
Google, Inc., Class A(a) | | | 104,019 | | | | 126,450,697 | | |
LinkedIn Corp., Class A(a) | | | 145,743 | | | | 29,737,402 | | |
Yahoo!, Inc.(a) | | | 433,239 | | | | 16,753,352 | | |
Total | | | | | 258,012,859 | | |
IT Services 5.0% | |
FleetCor Technologies, Inc.(a) | | | 92,654 | | | | 12,038,534 | | |
Visa, Inc., Class A | | | 413,723 | | | | 93,476,575 | | |
Total | | | | | 105,515,109 | | |
The accompanying Notes to Financial Statements are an integral part of this statement.
Annual Report 2014
7
Columbia Marsico Growth Fund
Portfolio of Investments (continued)
February 28, 2014
Common Stocks (continued)
Issuer | | Shares | | Value ($) | |
Semiconductors & Semiconductor Equipment 4.8% | |
| ASML Holding NV | | | 608,334 | | | | 52,401,891 | | |
Texas Instruments, Inc. | | | 1,086,990 | | | | 48,871,070 | | |
Total | | | | | 101,272,961 | | |
Software 2.0% | |
Salesforce.com, Inc.(a) | | | 694,381 | | | | 43,308,543 | | |
Total Information Technology | | | | | 508,109,472 | | |
Materials 9.6% | |
Chemicals 9.6% | |
Ecolab, Inc. | | | 410,825 | | | | 44,266,394 | | |
Monsanto Co. | | | 828,605 | | | | 91,163,122 | | |
Sherwin-Williams Co. (The) | | | 346,735 | | | | 69,513,433 | | |
Total | | | | | 204,942,949 | | |
Total Materials | | | | | 204,942,949 | | |
Total Common Stocks
(Cost: $1,408,952,512) | | | | | 2,101,771,592 | | |
Money Market Funds 1.8%
| | | Shares | | Value ($) | |
Columbia Short-Term Cash Fund,
0.098%(b)(c) | | | 38,194,829 | | | | 38,194,829 | | |
Total Money Market Funds
(Cost: $38,194,829) | | | | | 38,194,829 | | |
Total Investments
(Cost: $1,447,147,341) | | | | | 2,139,966,421 | | |
Other Assets & Liabilities, Net | | | | | (13,712,444 | ) | |
Net Assets | | | | | 2,126,253,977 | | |
Notes to Portfolio of Investments
(a) Non-income producing.
(b) The rate shown is the seven-day current annualized yield at February 28, 2014.
(c) As defined in the Investment Company Act of 1940, an affiliated company is one in which the Fund owns 5% or more of its outstanding voting securities, or a company which is under common ownership or control with the Fund. Holdings and transactions in these affiliated companies during the year ended February 28, 2014, are as follows:
Issuer | | Beginning
Cost ($) | | Purchase
Cost ($) | | Proceeds
From Sales ($) | | Ending
Cost ($) | | Dividends —
Affiliated
Issuers ($) | | Value ($) | |
Columbia Short-Term Cash Fund | | | 40,312,087 | | | | 1,112,181,698 | | | | (1,114,298,956 | ) | | | 38,194,829 | | | | 48,573 | | | | 38,194,829 | | |
Fair Value Measurements
Generally accepted accounting principles (GAAP) require disclosure regarding the inputs and valuation techniques used to measure fair value and any changes in valuation inputs or techniques. In addition, investments shall be disclosed by major category.
The Fund categorizes its fair value measurements according to a three-level hierarchy that maximizes the use of observable inputs and minimizes the use of unobservable inputs by prioritizing that the most observable input be used when available. Observable inputs are those that market participants would use in pricing an investment based on market data obtained from sources independent of the reporting entity. Unobservable inputs are those that reflect the Fund's assumptions about the information market participants would use in pricing an investment. An investment's level within the fair value hierarchy is based on the lowest level of any input that is deemed significant to the asset or liability's fair value measurement. The input levels are not necessarily an indication of the risk or liquidity associated with
The accompanying Notes to Financial Statements are an integral part of this statement.
Annual Report 2014
8
Columbia Marsico Growth Fund
Portfolio of Investments (continued)
February 28, 2014
Fair Value Measurements (continued)
investments at that level. For example, certain U.S. government securities are generally high quality and liquid, however, they are reflected as Level 2 because the inputs used to determine fair value may not always be quoted prices in an active market.
Fair value inputs are summarized in the three broad levels listed below:
> Level 1 — Valuations based on quoted prices for investments in active markets that the Fund has the ability to access at the measurement date (including NAV for open-end mutual funds). Valuation adjustments are not applied to Level 1 investments.
> Level 2 — Valuations based on other significant observable inputs (including quoted prices for similar securities, interest rates, prepayment speeds, credit risks, etc.).
> Level 3 — Valuations based on significant unobservable inputs (including the Fund's own assumptions and judgment in determining the fair value of investments).
Inputs that are used in determining fair value of an investment may include price information, credit data, volatility statistics, and other factors. These inputs can be either observable or unobservable. The availability of observable inputs can vary between investments, and is affected by various factors such as the type of investment, and the volume and level of activity for that investment or similar investments in the marketplace. The inputs will be considered by the Investment Manager, along with any other relevant factors in the calculation of an investment's fair value. The Fund uses prices and inputs that are current as of the measurement date, which may include periods of market dislocations. During these periods, the availability of prices and inputs may be reduced for many investments. This condition could cause an investment to be reclassified between the various levels within the hierarchy.
Foreign equity securities actively traded in markets where there is a significant delay in the local close relative to the New York Stock Exchange (NYSE) are classified as Level 2. The values of these securities may include an adjustment to reflect the impact of significant market movements following the close of local trading, as described in Note 2 to the financial statements — Security Valuation.
Investments falling into the Level 3 category are primarily supported by quoted prices from brokers and dealers participating in the market for those investments. However, these may be classified as Level 3 investments due to lack of market transparency and corroboration to support these quoted prices. Additionally, valuation models may be used as the pricing source for any remaining investments classified as Level 3. These models may rely on one or more significant unobservable inputs and/or significant assumptions by the Investment Manager. Inputs used in valuations may include, but are not limited to, financial statement analysis, capital account balances, discount rates and estimated cash flows, and comparable company data.
Under the direction of the Fund's Board of Trustees (the Board), the Investment Manager's Valuation Committee (the Committee) is responsible for overseeing the valuation procedures approved by the Board. The Committee consists of voting and non-voting members from various groups within the Investment Manager's organization, including operations and accounting, trading and investments, compliance, risk management and legal.
The Committee meets at least monthly to review and approve valuation matters, which may include a description of specific valuation determinations, data regarding pricing information received from approved pricing vendors and brokers and the results of Board-approved valuation control policies and procedures (the Policies). The Policies address, among other things, instances when market quotations are or are not readily available, including recommendations of third party pricing vendors and a determination of appropriate pricing methodologies; events that require specific valuation determinations and assessment of fair value techniques; securities with a potential for stale pricing, including those that are illiquid, restricted, or in default; and the effectiveness of third party pricing vendors, including periodic reviews of vendors. The Committee meets more frequently, as needed, to discuss additional valuation matters, which may include the need to review back-testing results, review time-sensitive information or approve related valuation actions. The Committee reports to the Board, with members of the Committee meeting with the Board at each of its regularly scheduled meetings to discuss valuation matters and actions during the period, similar to those described earlier.
For investments categorized as Level 3, the Committee monitors information similar to that described above, which may include: (i) data specific to the issuer or comparable issuers, (ii) general market or specific sector news and (iii) quoted prices and specific or similar security transactions. The Committee considers this data and any changes from prior periods in order to assess the reasonableness of observable and unobservable inputs, any assumptions or internal models used to value those securities and changes in fair value. This data is also used to corroborate, when available, information received from approved pricing vendors and brokers. Various factors impact the frequency of monitoring this information (which may occur as often as daily). However, the Committee may determine that changes to inputs, assumptions and models are not required as a result of the monitoring procedures performed.
The accompanying Notes to Financial Statements are an integral part of this statement.
Annual Report 2014
9
Columbia Marsico Growth Fund
Portfolio of Investments (continued)
February 28, 2014
Fair Value Measurements (continued)
The following table is a summary of the inputs used to value the Fund's investments at February 28, 2014:
Description | | Level 1
Quoted Prices in Active
Markets for Identical
Assets ($) | | Level 2
Other Significant
Observable Inputs ($) | | Level 3
Significant
Unobservable Inputs ($) | | Total ($) | |
Equity Securities | |
Common Stocks | |
Consumer Discretionary | | | 607,006,336 | | | | — | | | | — | | | | 607,006,336 | | |
Consumer Staples | | | 80,306,305 | | | | — | | | | — | | | | 80,306,305 | | |
Energy | | | 95,977,961 | | | | — | | | | — | | | | 95,977,961 | | |
Financials | | | 61,972,875 | | | | — | | | | — | | | | 61,972,875 | | |
Health Care | | | 327,014,724 | | | | — | | | | — | | | | 327,014,724 | | |
Industrials | | | 208,710,842 | | | | 7,730,128 | | | | — | | | | 216,440,970 | | |
Information Technology | | | 508,109,472 | | | | — | | | | — | | | | 508,109,472 | | |
Materials | | | 204,942,949 | | | | — | | | | — | | | | 204,942,949 | | |
Total Equity Securities | | | 2,094,041,464 | | | | 7,730,128 | | | | — | | | | 2,101,771,592 | | |
Mutual Funds | |
Money Market Funds | | | 38,194,829 | | | | — | | | | — | | | | 38,194,829 | | |
Total | | | 2,132,236,293 | | | | 7,730,128 | | | | — | | | | 2,139,966,421 | | |
See the Portfolio of Investments for all investment classifications not indicated in the table.
The Fund's assets assigned to the Level 2 input category are generally valued using the market approach, in which a security's value is determined through reference to prices and information from market transactions for similar or identical assets. These assets include certain foreign securities for which a third party statistical pricing service may be employed for purposes of fair market valuation. The models utilized by the third party statistical pricing service take into account a security's correlation to available market data including, but not limited to, intraday index, ADR, and ETF movements.
There were no transfers of financial assets between levels during the period.
The accompanying Notes to Financial Statements are an integral part of this statement.
Annual Report 2014
10
Columbia Marsico Growth Fund
Statement of Assets and Liabilities
February 28, 2014
Assets | |
Investments, at value | |
Unaffiliated issuers (identified cost $1,408,952,512) | | $ | 2,101,771,592 | | |
Affiliated issuers (identified cost $38,194,829) | | | 38,194,829 | | |
Total investments (identified cost $1,447,147,341) | | | 2,139,966,421 | | |
Receivable for: | |
Investments sold | | | 2,008,582 | | |
Capital shares sold | | | 1,207,155 | | |
Dividends | | | 996,837 | | |
Prepaid expenses | | | 2,636 | | |
Total assets | | | 2,144,181,631 | | |
Liabilities | |
Payable for: | |
Investments purchased | | | 13,991,698 | | |
Capital shares purchased | | | 3,100,470 | | |
Investment management fees | | | 37,188 | | |
Distribution and/or service fees | | | 13,769 | | |
Transfer agent fees | | | 470,237 | | |
Administration fees | | | 3,125 | | |
Compensation of board members | | | 206,935 | | |
Other expenses | | | 104,232 | | |
Total liabilities | | | 17,927,654 | | |
Net assets applicable to outstanding capital stock | | $ | 2,126,253,977 | | |
Represented by | |
Paid-in capital | | $ | 1,369,589,875 | | |
Excess of distributions over net investment income | | | (207,096 | ) | |
Accumulated net realized gain | | | 64,055,655 | | |
Unrealized appreciation (depreciation) on: | |
Investments | | | 692,819,080 | | |
Foreign currency translations | | | (3,537 | ) | |
Total — representing net assets applicable to outstanding capital stock | | $ | 2,126,253,977 | | |
The accompanying Notes to Financial Statements are an integral part of this statement.
Annual Report 2014
11
Columbia Marsico Growth Fund
Statement of Assets and Liabilities (continued)
February 28, 2014
Class A | |
Net assets | | $ | 653,959,294 | | |
Shares outstanding | | | 25,492,937 | | |
Net asset value per share | | $ | 25.65 | | |
Maximum offering price per share(a) | | $ | 27.21 | | |
Class B | |
Net assets | | $ | 10,639,072 | | |
Shares outstanding | | | 472,884 | | |
Net asset value per share | | $ | 22.50 | | |
Class C | |
Net assets | | $ | 315,733,823 | | |
Shares outstanding | | | 14,009,215 | | |
Net asset value per share | | $ | 22.54 | | |
Class I | |
Net assets | | $ | 3,597 | | |
Shares outstanding | | | 137 | | |
Net asset value per share(b) | | $ | 26.31 | | |
Class R | |
Net assets | | $ | 22,272,649 | | |
Shares outstanding | | | 883,817 | | |
Net asset value per share | | $ | 25.20 | | |
Class R4 | |
Net assets | | $ | 26,343,029 | | |
Shares outstanding | | | 988,027 | | |
Net asset value per share | | $ | 26.66 | | |
Class R5 | |
Net assets | | $ | 2,773,926 | | |
Shares outstanding | | | 104,053 | | |
Net asset value per share | | $ | 26.66 | | |
Class W | |
Net assets | | $ | 3,568 | | |
Shares outstanding | | | 139 | | |
Net asset value per share(b) | | $ | 25.66 | | |
Class Z | |
Net assets | | $ | 1,094,525,019 | | |
Shares outstanding | | | 41,691,030 | | |
Net asset value per share | | $ | 26.25 | | |
(a) The maximum offering price per share is calculated by dividing the net asset value per share by 1.0 minus the maximum sales charge of 5.75%.
(b) Net asset value per share rounds to this amount due to fractional shares outstanding.
The accompanying Notes to Financial Statements are an integral part of this statement.
Annual Report 2014
12
Columbia Marsico Growth Fund
Statement of Operations
Year Ended February 28, 2014
Net investment income | |
Income: | |
Dividends — unaffiliated issuers | | $ | 20,802,806 | | |
Dividends — affiliated issuers | | | 48,573 | | |
Interest | | | 39 | | |
Foreign taxes withheld | | | (452,959 | ) | |
Total income | | | 20,398,459 | | |
Expenses: | |
Investment management fees | | | 13,233,867 | | |
Distribution and/or service fees | |
Class A | | | 1,535,948 | | |
Class B | | | 143,375 | | |
Class C | | | 2,941,305 | | |
Class R | | | 103,894 | | |
Class W | | | 9 | | |
Transfer agent fees | |
Class A | | | 1,269,149 | | |
Class B | | | 29,549 | | |
Class C | | | 607,710 | | |
Class R | | | 42,942 | | |
Class R4 | | | 45,761 | | |
Class R5 | | | 654 | | |
Class W | | | 7 | | |
Class Z | | | 2,279,703 | | |
Administration fees | | | 1,110,866 | | |
Compensation of board members | | | 75,789 | | |
Custodian fees | | | 23,649 | | |
Printing and postage fees | | | 160,302 | | |
Registration fees | | | 76,924 | | |
Professional fees | | | 47,022 | | |
Line of credit interest expense | | | 2,648 | | |
Other | | | 153,776 | | |
Total expenses | | | 23,884,849 | | |
Expense reductions | | | (2,461 | ) | |
Total net expenses | | | 23,882,388 | | |
Net investment loss | | | (3,483,929 | ) | |
Realized and unrealized gain (loss) — net | |
Net realized gain (loss) on: | |
Investments | | | 364,787,413 | | |
Foreign currency translations | | | (64,477 | ) | |
Net realized gain | | | 364,722,936 | | |
Net change in unrealized appreciation (depreciation) on: | |
Investments | | | 226,197,065 | | |
Foreign currency translations | | | (3,537 | ) | |
Net change in unrealized appreciation (depreciation) | | | 226,193,528 | | |
Net realized and unrealized gain | | | 590,916,464 | | |
Net increase in net assets resulting from operations | | $ | 587,432,535 | | |
The accompanying Notes to Financial Statements are an integral part of this statement.
Annual Report 2014
13
Columbia Marsico Growth Fund
Statement of Changes in Net Assets
| | | Year Ended
February 28,
2014 | | Year Ended
February 28,
2013(a) | |
Operations | |
Net investment income (loss) | | $ | (3,483,929 | ) | | $ | 7,125,170 | | |
Net realized gain | | | 364,722,936 | | | | 611,483,128 | | |
Net change in unrealized appreciation (depreciation) | | | 226,193,528 | | | | (474,435,054 | ) | |
Net increase in net assets resulting from operations | | | 587,432,535 | | | | 144,173,244 | | |
Distributions to shareholders | |
Net investment income | |
Class A | | | — | | | | (1,780,654 | ) | |
Class I | | | (1 | ) | | | (30 | ) | |
Class R | | | — | | | | (4,564 | ) | |
Class R4 | | | (754 | ) | | | (12 | ) | |
Class R5 | | | (152 | ) | | | (13 | ) | |
Class W | | | — | | | | (10 | ) | |
Class Z | | | (6,430 | ) | | | (10,566,047 | ) | |
Net realized gains | |
Class A | | | (117,357,888 | ) | | | — | | |
Class B | | | (2,688,621 | ) | | | — | | |
Class C | | | (61,094,202 | ) | | | — | | |
Class I | | | (715 | ) | | | — | | |
Class R | | | (4,038,218 | ) | | | — | | |
Class R4 | | | (4,531,753 | ) | | | — | | |
Class R5 | | | (347,600 | ) | | | — | | |
Class W | | | (713 | ) | | | — | | |
Class Z | | | (198,141,956 | ) | | | — | | |
Total distributions to shareholders | | | (388,209,003 | ) | | | (12,351,330 | ) | |
Increase (decrease) in net assets from capital stock activity | | | (219,144,107 | ) | | | (1,201,164,689 | ) | |
Total decrease in net assets | | | (19,920,575 | ) | | | (1,069,342,775 | ) | |
Net assets at beginning of year | | | 2,146,174,552 | | | | 3,215,517,327 | | |
Net assets at end of year | | $ | 2,126,253,977 | | | $ | 2,146,174,552 | | |
Excess of distributions over net investment income | | $ | (207,096 | ) | | $ | (156,749 | ) | |
(a) Class R4 and Class R5 shares are for the period from November 8, 2012 (commencement of operations) to February 28, 2013.
The accompanying Notes to Financial Statements are an integral part of this statement.
Annual Report 2014
14
Columbia Marsico Growth Fund
Statement of Changes in Net Assets (continued)
| | | Year Ended February 28, 2014 | | Year Ended February 28, 2013(a) | |
| | | Shares | | Dollars ($) | | Shares | | Dollars ($) | |
Capital stock activity | |
Class A shares | |
Subscriptions(b) | | | 3,453,087 | | | | 86,957,138 | | | | 2,514,851 | | | | 56,427,371 | | |
Distributions reinvested | | | 4,104,050 | | | | 97,441,772 | | | | 67,517 | | | | 1,489,735 | | |
Redemptions | | | (7,133,863 | ) | | | (180,509,550 | ) | | | (10,263,560 | ) | | | (230,701,898 | ) | |
Net increase (decrease) | | | 423,274 | | | | 3,889,360 | | | | (7,681,192 | ) | | | (172,784,792 | ) | |
Class B shares | |
Subscriptions | | | 55,060 | | | | 1,164,752 | | | | 14,345 | | | | 292,426 | | |
Distributions reinvested | | | 69,420 | | | | 1,454,522 | | | | — | | | | — | | |
Redemptions(b) | | | (526,550 | ) | | | (11,897,152 | ) | | | (482,875 | ) | | | (9,839,116 | ) | |
Net decrease | | | (402,070 | ) | | | (9,277,878 | ) | | | (468,530 | ) | | | (9,546,690 | ) | |
Class C shares | |
Subscriptions | | | 1,880,870 | | | | 40,551,362 | | | | 529,146 | | | | 10,734,279 | | |
Distributions reinvested | | | 1,499,439 | | | | 31,447,842 | | | | — | | | | — | | |
Redemptions | | | (2,316,415 | ) | | | (52,440,802 | ) | | | (3,968,353 | ) | | | (80,319,452 | ) | |
Net increase (decrease) | | | 1,063,894 | | | | 19,558,402 | | | | (3,439,207 | ) | | | (69,585,173 | ) | |
Class R shares | |
Subscriptions | | | 186,467 | | | | 4,656,438 | | | | 225,764 | | | | 4,962,159 | | |
Distributions reinvested | | | 161,886 | | | | 3,778,784 | | | | 187 | | | | 4,065 | | |
Redemptions | | | (300,721 | ) | | | (7,516,597 | ) | | | (354,540 | ) | | | (7,840,576 | ) | |
Net increase (decrease) | | | 47,632 | | | | 918,625 | | | | (128,589 | ) | | | (2,874,352 | ) | |
Class R4 shares | |
Subscriptions | | | 1,036,213 | | | | 26,303,276 | | | | 2,686 | | | | 65,383 | | |
Distributions reinvested | | | 183,929 | | | | 4,531,923 | | | | — | | | | — | | |
Redemptions | | | (234,801 | ) | | | (6,170,621 | ) | | | — | | | | — | | |
Net increase | | | 985,341 | | | | 24,664,578 | | | | 2,686 | | | | 65,383 | | |
Class R5 shares | |
Subscriptions | | | 103,194 | | | | 2,714,441 | | | | 113 | | | | 2,500 | | |
Distributions reinvested | | | 14,086 | | | | 347,163 | | | | — | | | | — | | |
Redemptions | | | (13,340 | ) | | | (333,645 | ) | | | — | | | | — | | |
Net increase | | | 103,940 | | | | 2,727,959 | | | | 113 | | | | 2,500 | | |
Class Z shares | |
Subscriptions | | | 10,596,355 | | | | 275,531,162 | | | | 20,275,822 | | | | 465,764,921 | | |
Distributions reinvested | | | 6,750,386 | | | | 163,830,515 | | | | 346,104 | | | | 7,778,747 | | |
Redemptions | | | (26,955,709 | ) | | | (700,986,830 | ) | | | (62,160,960 | ) | | | (1,419,985,233 | ) | |
Net decrease | | | (9,608,968 | ) | | | (261,625,153 | ) | | | (41,539,034 | ) | | | (946,441,565 | ) | |
Total net decrease | | | (7,386,957 | ) | | | (219,144,107 | ) | | | (53,253,753 | ) | | | (1,201,164,689 | ) | |
(a) Class R4 and Class R5 shares are for the period from November 8, 2012 (commencement of operations) to February 28, 2013.
(b) Includes conversions of Class B shares to Class A shares, if any.
The accompanying Notes to Financial Statements are an integral part of this statement.
Annual Report 2014
15
Columbia Marsico Growth Fund
The following tables are intended to help you understand the Fund's financial performance. Certain information reflects financial results for a single share of a class held for the periods shown. Per share net investment income (loss) amounts are calculated based on average shares outstanding during the period. Total return assumes reinvestment of all dividends and distributions, if any. Total return does not reflect payment of sales charges, if any, and is not annualized for periods of less than one year.
| | | Year Ended February 28, | | Year Ended
February 29, | | Year Ended February 28, | |
Class A | | 2014 | | 2013 | | 2012 | | 2011 | | 2010 | |
Per share data | |
Net asset value, beginning of period | | $ | 23.69 | | | $ | 22.25 | | | $ | 21.19 | | | $ | 16.75 | | | $ | 11.30 | | |
Income from investment operations: | |
Net investment income (loss) | | | (0.05 | ) | | | 0.05 | | | | 0.02 | | | | (0.01 | ) | | | 0.03 | | |
Net realized and unrealized gain | | | 7.14 | | | | 1.45 | | | | 1.04 | | | | 4.45 | | | | 5.50 | | |
Total from investment operations | | | 7.09 | | | | 1.50 | | | | 1.06 | | | | 4.44 | | | | 5.53 | | |
Less distributions to shareholders: | |
Net investment income | | | — | | | | (0.06 | ) | | | — | | | | — | | | | (0.08 | ) | |
Net realized gains | | | (5.13 | ) | | | — | | | | — | | | | — | | | | — | | |
Total distributions to shareholders | | | (5.13 | ) | | | (0.06 | ) | | | — | | | | — | | | | (0.08 | ) | |
Proceeds from regulatory settlements | | | — | | | | — | | | | — | | | | 0.00 | (a) | | | 0.00 | (a) | |
Net asset value, end of period | | $ | 25.65 | | | $ | 23.69 | | | $ | 22.25 | | | $ | 21.19 | | | $ | 16.75 | | |
Total return | | | 32.56 | % | | | 6.78 | % | | | 5.00 | % | | | 26.51 | % | | | 49.09 | % | |
Ratios to average net assets(b) | |
Total gross expenses | | | 1.18 | %(c) | | | 1.36 | % | | | 1.33 | %(c) | | | 1.30 | %(c) | | | 1.28 | %(c) | |
Total net expenses(d) | | | 1.18 | %(c)(e) | | | 1.26 | %(e) | | | 1.28 | %(c)(e) | | | 1.30 | %(c)(e) | | | 1.28 | %(c)(e) | |
Net investment income (loss) | | | (0.20 | %) | | | 0.24 | % | | | 0.08 | % | | | (0.05 | %) | | | 0.23 | % | |
Supplemental data | |
Net assets, end of period (in thousands) | | $ | 653,959 | | | $ | 593,794 | | | $ | 728,788 | | | $ | 1,021,724 | | | $ | 1,569,860 | | |
Portfolio turnover | | | 97 | % | | | 90 | % | | | 65 | % | | | 67 | % | | | 69 | % | |
Notes to Financial Highlights
(a) Rounds to zero.
(b) In addition to the fees and expenses which the Fund bears directly, the Fund indirectly bears a pro rata share of the fees and expenses of the acquired funds in which it invests. Such indirect expenses are not included in the reported expense ratios.
(c) Ratios include line of credit interest expense which rounds to less than 0.01%.
(d) Total net expenses include the impact of certain waivers/reimbursements made by the Investment Manager and certain of its affiliates, if applicable.
(e) The benefits derived from expense reductions had an impact of less than 0.01%.
The accompanying Notes to Financial Statements are an integral part of this statement.
Annual Report 2014
16
Columbia Marsico Growth Fund
Financial Highlights (continued)
| | | Year Ended February 28, | | Year Ended
February 29, | | Year Ended February 28, | |
Class B | | 2014 | | 2013 | | 2012 | | 2011 | | 2010 | |
Per share data | |
Net asset value, beginning of period | | $ | 21.33 | | | $ | 20.13 | | | $ | 19.31 | | | $ | 15.38 | | | $ | 10.42 | | |
Income from investment operations: | |
Net investment loss | | | (0.21 | ) | | | (0.10 | ) | | | (0.13 | ) | | | (0.13 | ) | | | (0.07 | ) | |
Net realized and unrealized gain | | | 6.35 | | | | 1.30 | | | | 0.95 | | | | 4.06 | | | | 5.07 | | |
Total from investment operations | | | 6.14 | | | | 1.20 | | | | 0.82 | | | | 3.93 | | | | 5.00 | | |
Less distributions to shareholders: | |
Net investment income | | | — | | | | — | | | | — | | | | — | | | | (0.04 | ) | |
Net realized gains | | | (4.97 | ) | | | — | | | | — | | | | — | | | | — | | |
Total distributions to shareholders | | | (4.97 | ) | | | — | | | | — | | | | — | | | | (0.04 | ) | |
Proceeds from regulatory settlements | | | — | | | | — | | | | — | | | | 0.00 | (a) | | | 0.00 | (a) | |
Net asset value, end of period | | $ | 22.50 | | | $ | 21.33 | | | $ | 20.13 | | | $ | 19.31 | | | $ | 15.38 | | |
Total return | | | 31.58 | % | | | 5.96 | % | | | 4.25 | % | | | 25.55 | % | | | 48.10 | % | |
Ratios to average net assets(b) | |
Total gross expenses | | | 1.92 | %(c) | | | 2.10 | % | | | 2.09 | %(c) | | | 2.05 | %(c) | | | 2.03 | %(c) | |
Total net expenses(d) | | | 1.92 | %(c)(e) | | | 2.01 | %(e) | | | 2.03 | %(c)(e) | | | 2.05 | %(c)(e) | | | 2.03 | %(c)(e) | |
Net investment loss | | | (0.93 | %) | | | (0.52 | %) | | | (0.68 | %) | | | (0.78 | %) | | | (0.52 | %) | |
Supplemental data | |
Net assets, end of period (in thousands) | | $ | 10,639 | | | $ | 18,659 | | | $ | 27,041 | | | $ | 41,675 | | | $ | 47,847 | | |
Portfolio turnover | | | 97 | % | | | 90 | % | | | 65 | % | | | 67 | % | | | 69 | % | |
Notes to Financial Highlights
(a) Rounds to zero.
(b) In addition to the fees and expenses which the Fund bears directly, the Fund indirectly bears a pro rata share of the fees and expenses of the acquired funds in which it invests. Such indirect expenses are not included in the reported expense ratios.
(c) Ratios include line of credit interest expense which rounds to less than 0.01%.
(d) Total net expenses include the impact of certain waivers/reimbursements made by the Investment Manager and certain of its affiliates, if applicable.
(e) The benefits derived from expense reductions had an impact of less than 0.01%.
The accompanying Notes to Financial Statements are an integral part of this statement.
Annual Report 2014
17
Columbia Marsico Growth Fund
Financial Highlights (continued)
| | | Year Ended February 28, | | Year Ended
February 29, | | Year Ended February 28, | |
Class C | | 2014 | | 2013 | | 2012 | | 2011 | | 2010 | |
Per share data | |
Net asset value, beginning of period | | $ | 21.35 | | | $ | 20.15 | | | $ | 19.34 | | | $ | 15.40 | | | $ | 10.44 | | |
Income from investment operations: | |
Net investment loss | | | (0.22 | ) | | | (0.10 | ) | | | (0.13 | ) | | | (0.13 | ) | | | (0.07 | ) | |
Net realized and unrealized gain | | | 6.38 | | | | 1.30 | | | | 0.94 | | | | 4.07 | | | | 5.07 | | |
Total from investment operations | | | 6.16 | | | | 1.20 | | | | 0.81 | | | | 3.94 | | | | 5.00 | | |
Less distributions to shareholders: | |
Net investment income | | | — | | | | — | | | | — | | | | — | | | | (0.04 | ) | |
Net realized gains | | | (4.97 | ) | | | — | | | | — | | | | — | | | | — | | |
Total distributions to shareholders | | | (4.97 | ) | | | — | | | | — | | | | — | | | | (0.04 | ) | |
Proceeds from regulatory settlements | | | — | | | | — | | | | — | | | | 0.00 | (a) | | | 0.00 | (a) | |
Net asset value, end of period | | $ | 22.54 | | | $ | 21.35 | | | $ | 20.15 | | | $ | 19.34 | | | $ | 15.40 | | |
Total return | | | 31.64 | % | | | 5.96 | % | | | 4.19 | % | | | 25.58 | % | | | 48.00 | % | |
Ratios to average net assets(b) | |
Total gross expenses | | | 1.93 | %(c) | | | 2.10 | % | | | 2.09 | %(c) | | | 2.05 | %(c) | | | 2.03 | %(c) | |
Total net expenses(d) | | | 1.93 | %(c)(e) | | | 2.01 | %(e) | | | 2.03 | %(c)(e) | | | 2.05 | %(c)(e) | | | 2.03 | %(c)(e) | |
Net investment loss | | | (0.95 | %) | | | (0.51 | %) | | | (0.67 | %) | | | (0.78 | %) | | | (0.52 | %) | |
Supplemental data | |
Net assets, end of period (in thousands) | | $ | 315,734 | | | $ | 276,437 | | | $ | 330,213 | | | $ | 390,384 | | | $ | 399,082 | | |
Portfolio turnover | | | 97 | % | | | 90 | % | | | 65 | % | | | 67 | % | | | 69 | % | |
Notes to Financial Highlights
(a) Rounds to zero.
(b) In addition to the fees and expenses which the Fund bears directly, the Fund indirectly bears a pro rata share of the fees and expenses of the acquired funds in which it invests. Such indirect expenses are not included in the reported expense ratios.
(c) Ratios include line of credit interest expense which rounds to less than 0.01%.
(d) Total net expenses include the impact of certain waivers/reimbursements made by the Investment Manager and certain of its affiliates, if applicable.
(e) The benefits derived from expense reductions had an impact of less than 0.01%.
The accompanying Notes to Financial Statements are an integral part of this statement.
Annual Report 2014
18
Columbia Marsico Growth Fund
Financial Highlights (continued)
| | | Year Ended February 28, | | Year Ended
February 29, | | Year Ended
February 28, | |
Class I | | 2014 | | 2013 | | 2012 | | 2011(a) | |
Per share data | |
Net asset value, beginning of period | | $ | 24.17 | | | $ | 22.77 | | | $ | 21.55 | | | $ | 18.29 | | |
Income from investment operations: | |
Net investment income | | | 0.07 | | | | 0.15 | | | | 0.13 | | | | 0.01 | | |
Net realized and unrealized gain | | | 7.31 | | | | 1.47 | | | | 1.09 | | | | 3.29 | | |
Total from investment operations | | | 7.38 | | | | 1.62 | | | | 1.22 | | | | 3.30 | | |
Less distributions to shareholders: | |
Net investment income | | | (0.01 | ) | | | (0.22 | ) | | | — | | | | (0.04 | ) | |
Net realized gains | | | (5.23 | ) | | | — | | | | — | | | | — | | |
Total distributions to shareholders | | | (5.24 | ) | | | (0.22 | ) | | | — | | | | (0.04 | ) | |
Net asset value, end of period | | $ | 26.31 | | | $ | 24.17 | | | $ | 22.77 | | | $ | 21.55 | | |
Total return | | | 33.18 | % | | | 7.20 | % | | | 5.66 | % | | | 18.05 | % | |
Ratios to average net assets(b) | |
Total gross expenses | | | 0.70 | %(c) | | | 0.87 | % | | | 0.89 | %(c) | | | 0.88 | %(c)(d) | |
Total net expenses(e) | | | 0.70 | %(c) | | | 0.87 | % | | | 0.88 | %(c)(f) | | | 0.88 | %(c)(d)(f) | |
Net investment income | | | 0.28 | % | | | 0.65 | % | | | 0.64 | % | | | 0.06 | %(d) | |
Supplemental data | |
Net assets, end of period (in thousands) | | $ | 4 | | | $ | 3 | | | $ | 3 | | | $ | 11,201 | | |
Portfolio turnover | | | 97 | % | | | 90 | % | | | 65 | % | | | 67 | % | |
Notes to Financial Highlights
(a) For the period from September 27, 2010 (commencement of operations) to February 28, 2011.
(b) In addition to the fees and expenses which the Fund bears directly, the Fund indirectly bears a pro rata share of the fees and expenses of the acquired funds in which it invests. Such indirect expenses are not included in the reported expense ratios.
(c) Ratios include line of credit interest expense which rounds to less than 0.01%.
(d) Annualized.
(e) Total net expenses include the impact of certain waivers/reimbursements made by the Investment Manager and certain of its affiliates, if applicable.
(f) The benefits derived from expense reductions had an impact of less than 0.01%.
The accompanying Notes to Financial Statements are an integral part of this statement.
Annual Report 2014
19
Columbia Marsico Growth Fund
Financial Highlights (continued)
| | | Year Ended February 28, | | Year Ended
February 29, | | Year Ended February 28, | |
Class R | | 2014 | | 2013 | | 2012 | | 2011 | | 2010 | |
Per share data | |
Net asset value, beginning of period | | $ | 23.36 | | | $ | 21.94 | | | $ | 20.94 | | | $ | 16.60 | | | $ | 11.20 | | |
Income from investment operations: | |
Net investment income (loss) | | | (0.11 | ) | | | (0.00 | )(a) | | | (0.03 | ) | | | (0.05 | ) | | | (0.00 | )(a) | |
Net realized and unrealized gain | | | 7.02 | | | | 1.43 | | | | 1.03 | | | | 4.39 | | | | 5.45 | | |
Total from investment operations | | | 6.91 | | | | 1.43 | | | | 1.00 | | | | 4.34 | | | | 5.45 | | |
Less distributions to shareholders: | |
Net investment income | | | — | | | | (0.01 | ) | | | — | | | | — | | | | (0.05 | ) | |
Net realized gains | | | (5.07 | ) | | | — | | | | — | | | | — | | | | — | | |
Total distributions to shareholders | | | (5.07 | ) | | | (0.01 | ) | | | — | | | | — | | | | (0.05 | ) | |
Proceeds from regulatory settlements | | | — | | | | — | | | | — | | | | 0.00 | (a) | | | 0.00 | (a) | |
Net asset value, end of period | | $ | 25.20 | | | $ | 23.36 | | | $ | 21.94 | | | $ | 20.94 | | | $ | 16.60 | | |
Total return | | | 32.24 | % | | | 6.50 | % | | | 4.78 | % | | | 26.14 | % | | | 48.79 | % | |
Ratios to average net assets(b) | |
Total gross expenses | | | 1.43 | %(c) | | | 1.61 | % | | | 1.58 | %(c) | | | 1.55 | %(c) | | | 1.53 | %(c) | |
Total net expenses(d) | | | 1.43 | %(c)(e) | | | 1.51 | %(e) | | | 1.53 | %(c)(e) | | | 1.55 | %(c)(e) | | | 1.53 | %(c)(e) | |
Net investment income (loss) | | | (0.45 | %) | | | (0.00 | )(a) | | | (0.16 | %) | | | (0.27 | %) | | | (0.02 | %) | |
Supplemental data | |
Net assets, end of period (in thousands) | | $ | 22,273 | | | $ | 19,530 | | | $ | 21,166 | | | $ | 20,548 | | | $ | 14,848 | | |
Portfolio turnover | | | 97 | % | | | 90 | % | | | 65 | % | | | 67 | % | | | 69 | % | |
Notes to Financial Highlights
(a) Rounds to zero.
(b) In addition to the fees and expenses which the Fund bears directly, the Fund indirectly bears a pro rata share of the fees and expenses of the acquired funds in which it invests. Such indirect expenses are not included in the reported expense ratios.
(c) Ratios include line of credit interest expense which rounds to less than 0.01%.
(d) Total net expenses include the impact of certain waivers/reimbursements made by the Investment Manager and certain of its affiliates, if applicable.
(e) The benefits derived from expense reductions had an impact of less than 0.01%.
The accompanying Notes to Financial Statements are an integral part of this statement.
Annual Report 2014
20
Columbia Marsico Growth Fund
Financial Highlights (continued)
| | | Year Ended February 28, | |
Class R4 | | 2014 | | 2013(a) | |
Per share data | |
Net asset value, beginning of period | | $ | 24.44 | | | $ | 22.14 | | |
Income from investment operations: | |
Net investment income | | | 0.02 | | | | 0.08 | | |
Net realized and unrealized gain | | | 7.38 | | | | 2.32 | | |
Total from investment operations | | | 7.40 | | | | 2.40 | | |
Less distributions to shareholders: | |
Net investment income | | | (0.00 | )(b) | | | (0.10 | ) | |
Net realized gains | | | (5.18 | ) | | | — | | |
Total distributions to shareholders | | | (5.18 | ) | | | (0.10 | ) | |
Net asset value, end of period | | $ | 26.66 | | | $ | 24.44 | | |
Total return | | | 32.88 | % | | | 10.89 | % | |
Ratios to average net assets(c) | |
Total gross expenses | | | 0.93 | %(d) | | | 1.01 | %(e) | |
Total net expenses(f) | | | 0.93 | %(d)(g) | | | 1.00 | %(e) | |
Net investment income | | | 0.07 | % | | | 1.11 | %(e) | |
Supplemental data | |
Net assets, end of period (in thousands) | | $ | 26,343 | | | $ | 66 | | |
Portfolio turnover | | | 97 | % | | | 90 | % | |
Notes to Financial Highlights
(a) For the period from November 8, 2012 (commencement of operations) to February 28, 2013.
(b) Rounds to zero.
(c) In addition to the fees and expenses which the Fund bears directly, the Fund indirectly bears a pro rata share of the fees and expenses of the acquired funds in which it invests. Such indirect expenses are not included in the reported expense ratios.
(d) Ratios include line of credit interest expense which rounds to less than 0.01%.
(e) Annualized.
(f) Total net expenses include the impact of certain waivers/reimbursements made by the Investment Manager and certain of its affiliates, if applicable.
(g) The benefits derived from expense reductions had an impact of less than 0.01%.
The accompanying Notes to Financial Statements are an integral part of this statement.
Annual Report 2014
21
Columbia Marsico Growth Fund
Financial Highlights (continued)
| | | Year Ended February 28, | |
Class R5 | | 2014 | | 2013(a) | |
Per share data | |
Net asset value, beginning of period | | $ | 24.43 | | | $ | 22.14 | | |
Income from investment operations: | |
Net investment income | | | 0.05 | | | | 0.09 | | |
Net realized and unrealized gain | | | 7.40 | | | | 2.32 | | |
Total from investment operations | | | 7.45 | | | | 2.41 | | |
Less distributions to shareholders: | |
Net investment income | | | (0.01 | ) | | | (0.12 | ) | |
Net realized gains | | | (5.21 | ) | | | — | | |
Total distributions to shareholders | | | (5.22 | ) | | | (0.12 | ) | |
Net asset value, end of period | | $ | 26.66 | | | $ | 24.43 | | |
Total return | | | 33.12 | % | | | 10.92 | % | |
Ratios to average net assets(b) | |
Total gross expenses | | | 0.77 | %(c) | | | 0.89 | %(d) | |
Total net expenses(e) | | | 0.77 | %(c) | | | 0.89 | %(d) | |
Net investment income | | | 0.18 | % | | | 1.22 | %(d) | |
Supplemental data | |
Net assets, end of period (in thousands) | | $ | 2,774 | | | $ | 3 | | |
Portfolio turnover | | | 97 | % | | | 90 | % | |
Notes to Financial Highlights
(a) For the period from November 8, 2012 (commencement of operations) to February 28, 2013.
(b) In addition to the fees and expenses which the Fund bears directly, the Fund indirectly bears a pro rata share of the fees and expenses of the acquired funds in which it invests. Such indirect expenses are not included in the reported expense ratios.
(c) Ratios include line of credit interest expense which rounds to less than 0.01%.
(d) Annualized.
(e) Total net expenses include the impact of certain waivers/reimbursements made by the Investment Manager and certain of its affiliates, if applicable.
The accompanying Notes to Financial Statements are an integral part of this statement.
Annual Report 2014
22
Columbia Marsico Growth Fund
Financial Highlights (continued)
| | | Year Ended February 28, | | Year Ended
February 29, | | Year Ended
February 28, | |
Class W | | 2014 | | 2013 | | 2012 | | 2011(a) | |
Per share data | |
Net asset value, beginning of period | | $ | 23.69 | | | $ | 22.26 | | | $ | 21.20 | | | $ | 17.98 | | |
Income from investment operations: | |
Net investment income (loss) | | | (0.04 | ) | | | 0.06 | | | | 0.02 | | | | 0.01 | | |
Net realized and unrealized gain | | | 7.14 | | | | 1.44 | | | | 1.04 | | | | 3.21 | | |
Total from investment operations | | | 7.10 | | | | 1.50 | | | | 1.06 | | | | 3.22 | | |
Less distributions to shareholders: | |
Net investment income | | | — | | | | (0.07 | ) | | | — | | | | — | | |
Net realized gains | | | (5.13 | ) | | | — | | | | — | | | | — | | |
Total distributions to shareholders | | | (5.13 | ) | | | (0.07 | ) | | | — | | | | — | | |
Net asset value, end of period | | $ | 25.66 | | | $ | 23.69 | | | $ | 22.26 | | | $ | 21.20 | | |
Total return | | | 32.63 | % | | | 6.76 | % | | | 5.00 | % | | | 17.91 | % | |
Ratios to average net assets(b) | |
Total gross expenses | | | 1.15 | %(c) | | | 1.35 | % | | | 1.29 | %(c) | | | 1.28 | %(c)(d) | |
Total net expenses(e) | | | 1.15 | %(c)(f) | | | 1.26 | % | | | 1.26 | %(c)(f) | | | 1.28 | %(c)(d)(f) | |
Net investment income (loss) | | | (0.17 | %) | | | 0.25 | % | | | 0.11 | % | | | 0.17 | %(d) | |
Supplemental data | |
Net assets, end of period (in thousands) | | $ | 4 | | | $ | 3 | | | $ | 3 | | | $ | 3 | | |
Portfolio turnover | | | 97 | % | | | 90 | % | | | 65 | % | | | 67 | % | |
Notes to Financial Highlights
(a) For the period from September 27, 2010 (commencement of operations) to February 28, 2011.
(b) In addition to the fees and expenses which the Fund bears directly, the Fund indirectly bears a pro rata share of the fees and expenses of the acquired funds in which it invests. Such indirect expenses are not included in the reported expense ratios.
(c) Ratios include line of credit interest expense which rounds to less than 0.01%.
(d) Annualized.
(e) Total net expenses include the impact of certain waivers/reimbursements made by the Investment Manager and certain of its affiliates, if applicable.
(f) The benefits derived from expense reductions had an impact of less than 0.01%.
The accompanying Notes to Financial Statements are an integral part of this statement.
Annual Report 2014
23
Columbia Marsico Growth Fund
Financial Highlights (continued)
| | | Year Ended February 28, | | Year Ended
February 29, | | Year Ended February 28, | |
Class Z | | 2014 | | 2013 | | 2012 | | 2011 | | 2010 | |
Per share data | |
Net asset value, beginning of period | | $ | 24.13 | | | $ | 22.71 | | | $ | 21.57 | | | $ | 17.02 | | | $ | 11.47 | | |
Income from investment operations: | |
Net investment income | | | 0.02 | | | | 0.10 | | | | 0.07 | | | | 0.04 | | | | 0.07 | | |
Net realized and unrealized gain | | | 7.28 | | | | 1.48 | | | | 1.07 | | | | 4.52 | | | | 5.60 | | |
Total from investment operations | | | 7.30 | | | | 1.58 | | | | 1.14 | | | | 4.56 | | | | 5.67 | | |
Less distributions to shareholders: | |
Net investment income | | | (0.00 | )(a) | | | (0.16 | ) | | | — | | | | (0.01 | ) | | | (0.12 | ) | |
Net realized gains | | | (5.18 | ) | | | — | | | | — | | | | — | | | | — | | |
Total distributions to shareholders | | | (5.18 | ) | | | (0.16 | ) | | | — | | | | (0.01 | ) | | | (0.12 | ) | |
Proceeds from regulatory settlements | | | — | | | | — | | | | — | | | | 0.00 | (a) | | | 0.00 | (a) | |
Net asset value, end of period | | $ | 26.25 | | | $ | 24.13 | | | $ | 22.71 | | | $ | 21.57 | | | $ | 17.02 | | |
Total return | | | 32.89 | % | | | 7.02 | % | | | 5.29 | % | | | 26.81 | % | | | 49.55 | % | |
Ratios to average net assets(b) | |
Total gross expenses | | | 0.92 | %(c) | | | 1.10 | % | | | 1.08 | %(c) | | | 1.05 | %(c) | | | 1.03 | %(c) | |
Total net expenses(d) | | | 0.92 | %(c)(e) | | | 1.02 | %(e) | | | 1.03 | %(c)(e) | | | 1.05 | %(c)(e) | | | 1.03 | %(c)(e) | |
Net investment income | | | 0.07 | % | | | 0.43 | % | | | 0.34 | % | | | 0.24 | % | | | 0.48 | % | |
Supplemental data | |
Net assets, end of period (in thousands) | | $ | 1,094,525 | | | $ | 1,237,679 | | | $ | 2,108,304 | | | $ | 2,063,751 | | | $ | 1,676,013 | | |
Portfolio turnover | | | 97 | % | | | 90 | % | | | 65 | % | | | 67 | % | | | 69 | % | |
Notes to Financial Highlights
(a) Rounds to zero.
(b) In addition to the fees and expenses which the Fund bears directly, the Fund indirectly bears a pro rata share of the fees and expenses of the acquired funds in which it invests. Such indirect expenses are not included in the reported expense ratios.
(c) Ratios include line of credit interest expense which rounds to less than 0.01%.
(d) Total net expenses include the impact of certain waivers/reimbursements made by the Investment Manager and certain of its affiliates, if applicable.
(e) The benefits derived from expense reductions had an impact of less than 0.01%.
The accompanying Notes to Financial Statements are an integral part of this statement.
Annual Report 2014
24
Columbia Marsico Growth Fund
Notes to Financial Statements
February 28, 2014
Note 1. Organization
Columbia Marsico Growth Fund (the Fund), a series of Columbia Funds Series Trust (the Trust), is a diversified fund. The Trust is registered under the Investment Company Act of 1940, as amended (the 1940 Act), as an open-end management investment company organized as a Delaware statutory trust.
Fund Shares
The Trust may issue an unlimited number of shares (without par value). The Fund offers Class A, Class B, Class C, Class I, Class R, Class R4, Class R5, Class W and Class Z shares. Although all share classes generally have identical voting, dividend and liquidation rights, each share class votes separately when required by law. Different share classes pay different distribution amounts to the extent the expenses of such share classes differ, and distributions in liquidation will be proportional to the net asset value of each share class. Each share class has its own expense structure and sales charges, as applicable.
Class A shares are subject to a maximum front-end sales charge of 5.75% based on the initial investment amount. Class A shares purchased without an initial sales charge in accounts aggregating $1 million to $50 million at the time of purchase are subject to a contingent deferred sales charge (CDSC) if the shares are sold within 18 months of purchase, charged as follows: 1.00% CDSC if redeemed within 12 months of purchase, and 0.50% CDSC if redeemed more than 12, but less than 18, months after purchase.
Class B shares may be subject to a maximum CDSC of 5.00% based upon the holding period after purchase. Class B shares will generally convert to Class A shares eight years after purchase. The Fund no longer accepts investments by new or existing investors in the Fund's Class B shares, except in connection with the reinvestment of any dividend and/or capital gain distributions in Class B shares of the Fund and exchanges by existing Class B shareholders of certain other funds within the Columbia Family of Funds.
Class C shares are subject to a 1.00% CDSC on shares redeemed within one year of purchase.
Class I shares are not subject to sales charges and are available only to the Columbia Family of Funds.
Class R shares are not subject to sales charges and are generally available only to certain retirement plans and other eligible investors.
Class R4 shares are not subject to sales charges and are generally available only to omnibus retirement plans and certain other eligible investors.
Class R5 shares are not subject to sales charges and are generally available only to investors purchasing through authorized investment professionals and omnibus retirement plans.
Class W shares are not subject to sales charges and are available only to investors purchasing through authorized investment programs managed by investment professionals, including discretionary managed account programs.
Class Z shares are not subject to sales charges and are available only to certain eligible investors, which are subject to different investment minimums.
Note 2. Summary of Significant Accounting Policies
Use of Estimates
The preparation of financial statements in accordance with U.S. generally accepted accounting principles (GAAP) requires management to make certain estimates and assumptions that affect the reported amounts of assets and liabilities, the disclosure of contingent assets and liabilities at the date of the financial statements and the reported amounts of revenue and expenses during the reporting period. Actual results could differ from those estimates.
The following is a summary of significant accounting policies consistently followed by the Fund in the preparation of its financial statements.
Security Valuation
All equity securities are valued at the close of business of the New York Stock Exchange (NYSE). Equity securities are valued at the last quoted sales price on the principal exchange or market on which they trade, except for securities traded on the NASDAQ Stock Market, which are valued at the NASDAQ official close price. Unlisted securities or listed securities for which there were no sales during the day are valued at the mean of the latest quoted bid and ask prices on such exchanges or markets.
Foreign equity securities are valued based on quotations from the principal market in which such securities are normally traded. If any foreign share prices are not readily available as a result of limited share activity the securities are valued at the mean of the latest quoted bid and ask prices on such exchanges or markets. Foreign currency exchange rates are generally determined at 4:00 p.m. Eastern (U.S.) time. However, many securities markets and exchanges outside the U.S. close prior to the close of the NYSE; therefore, the closing prices for securities in such markets or on such exchanges may not fully reflect events that occur after such close but before the close of the NYSE. In those situations,
Annual Report 2014
25
Columbia Marsico Growth Fund
Notes to Financial Statements (continued)
February 28, 2014
foreign securities will be fair valued pursuant to the policy adopted by the Board of Trustees (the Board), including utilizing a third party pricing service to determine these fair values. The third party pricing service takes into account multiple factors, including, but not limited to, movements in the U.S. securities markets, certain depositary receipts, futures contracts and foreign exchange rates that have occurred subsequent to the close of the foreign exchange or market, to determine a good faith estimate that reasonably reflects the current market conditions as of the close of the NYSE. The fair value of a security is likely to be different from the quoted or published price, if available.
Investments in open-end investment companies, including money market funds, are valued at net asset value.
Investments for which market quotations are not readily available, or that have quotations which management believes are not reliable, are valued at fair value as determined in good faith under consistently applied procedures established by and under the general supervision of the Board. If a security or class of securities (such as foreign securities) is valued at fair value, such value is likely to be different from the last quoted market price for the security.
The determination of fair value often requires significant judgment. To determine fair value, management may use assumptions including but not limited to future cash flows and estimated risk premiums. Multiple inputs from various sources may be used to determine fair value.
Foreign Currency Transactions and Translations
The values of all assets and liabilities denominated in foreign currencies are translated into U.S. dollars at that day's exchange rates. Net realized and unrealized gains (losses) on foreign currency transactions and translations include gains (losses) arising from the fluctuation in exchange rates between trade and settlement dates on securities transactions, gains (losses) arising from the disposition of foreign currency and currency gains (losses) between the accrual and payment dates on dividends, interest income and foreign withholding taxes.
For financial statement purposes, the Fund does not distinguish that portion of gains (losses) on investments which is due to changes in foreign exchange rates from that which is due to changes in market prices of the investments. Such fluctuations are included with the net realized and unrealized gains (losses) on investments in the Statement of Operations.
Security Transactions
Security transactions are accounted for on the trade date. Cost is determined and gains (losses) are based upon the specific identification method for both financial statement and federal income tax purposes.
Income Recognition
Corporate actions and dividend income are generally recorded net of any non-reclaimable tax withholdings, on the ex-dividend date or upon receipt of ex-dividend notification in the case of certain foreign securities.
Awards from class action litigation are recorded as a reduction of cost basis if the Fund still owns the applicable securities on the payment date. If the Fund no longer owns the applicable securities, the proceeds are recorded as realized gains.
Expenses
General expenses of the Trust are allocated to the Fund and other funds of the Trust based upon relative net assets or other expense allocation methodologies determined by the nature of the expense. Expenses directly attributable to the Fund are charged to the Fund. Expenses directly attributable to a specific class of shares are charged to that share class.
Determination of Class Net Asset Value
All income, expenses (other than class-specific expenses, which are charged to that share class, as shown in the Statement of Operations) and realized and unrealized gains (losses) are allocated to each class of the Fund on a daily basis, based on the relative net assets of each class, for purposes of determining the net asset value of each class.
Federal Income Tax Status
The Fund intends to qualify each year as a regulated investment company under Subchapter M of the Internal Revenue Code, as amended, and will distribute substantially all of its taxable income (including net short-term capital gains), if any, for its tax year, and as such will not be subject to federal income taxes. In addition, the Fund intends to distribute in each calendar year substantially all of its net investment income, capital gains and certain other amounts, if any, such that the Fund should not be subject to federal excise tax. Therefore, no federal income or excise tax provision is recorded.
Foreign Taxes
The Fund may be subject to foreign taxes on income, gains on investments or currency repatriation, a portion of which may be recoverable. The Fund will accrue such taxes and recoveries, as applicable, based upon its current interpretation of tax rules and regulations that exist in the markets in which it invests.
Realized gains in certain countries may be subject to foreign taxes at the Fund level, based on statutory rates. The Fund accrues for such foreign taxes on realized and unrealized gains at the appropriate rate for each jurisdiction, as applicable. The
Annual Report 2014
26
Columbia Marsico Growth Fund
Notes to Financial Statements (continued)
February 28, 2014
amount, if any, is disclosed as a liability on the Statement of Assets and Liabilities.
Distributions to Shareholders
Distributions from net investment income, if any, are declared and paid semi-annually. Net realized capital gains, if any, are distributed at least annually. Income distributions and capital gain distributions are determined in accordance with federal income tax regulations, which may differ from GAAP.
Guarantees and Indemnifications
Under the Trust's organizational documents and, in some cases, by contract, its officers and trustees are indemnified against certain liabilities arising out of the performance of their duties to the Trust or its funds. In addition, certain of the Fund's contracts with its service providers contain general indemnification clauses. The Fund's maximum exposure under these arrangements is unknown since the amount of any future claims that may be made against the Fund cannot be determined, and the Fund has no historical basis for predicting the likelihood of any such claims.
Note 3. Fees and Compensation Paid to Affiliates
Investment Management Fees
Under an Investment Management Services Agreement, Columbia Management Investment Advisers, LLC (the Investment Manager), a wholly-owned subsidiary of Ameriprise Financial, Inc. (Ameriprise Financial), is responsible for the ultimate oversight of investments made by the Fund. The Fund's subadviser (see Subadvisory Agreement below) has the primary responsibility for the day-to-day portfolio management of the Fund. The investment management fee is an annual fee that is equal to a percentage of the Fund's average daily net assets that declines from 0.71% to 0.54% as the Fund's net assets increase. The effective investment management fee rate for the year ended February 28, 2014 was 0.64% of the Fund's average daily net assets.
Subadvisory Agreement
The Investment Manager has entered into a Subadvisory Agreement with Marsico Capital Management, LLC (Marsico) to subadvise the assets of the Fund. The Investment Manager compensates Marsico to manage the investment of the Fund's assets.
Administration Fees
Under an Administrative Services Agreement, the Investment Manager also serves as the Fund Administrator. The Fund pays the Fund Administrator an annual fee for administration and
accounting services equal to a percentage of the Fund's average daily net assets that declines from 0.06% to 0.03% as the Fund's net assets increase. The effective administration fee rate for the year ended February 28, 2014 was 0.05% of the Fund's average daily net assets.
Other Expenses
Other expenses are for, among other things, miscellaneous expenses of the Fund or the Board, including payments to a company providing limited administrative services to the Fund and the Board. That company's expenses include boardroom and office expense, employee compensation, employee health and retirement benefits, and certain other expenses. For the year ended February 28, 2014, other expenses paid to this company were $6,233.
Compensation of Board Members
Board members are compensated for their services to the Fund as disclosed in the Statement of Operations. Under a Deferred Compensation Plan (the Plan), the Board members who are not "interested persons" of the Fund, as defined under the 1940 Act, may elect to defer payment of up to 100% of their compensation. Deferred amounts are treated as though equivalent dollar amounts had been invested in shares of certain funds managed by the Investment Manager. The Fund's liability for these amounts is adjusted for market value changes and remains in the Fund until distributed in accordance with the Plan.
Transfer Agent Fees
Under a Transfer and Dividend Disbursing Agent Agreement, Columbia Management Investment Services Corp. (the Transfer Agent), an affiliate of the Investment Manager and a wholly-owned subsidiary of Ameriprise Financial, is responsible for providing transfer agency services to the Fund. The Transfer Agent has contracted with Boston Financial Data Services (BFDS) to serve as sub-transfer agent.
The Transfer Agent receives monthly account-based service fees based on the number of open accounts and also receives sub-transfer agency fees based on a percentage of the average aggregate value of the Fund's shares maintained in omnibus accounts (other than omnibus accounts for which American Enterprise Investment Services Inc. is the broker of record or accounts where the beneficial shareholder is a customer of Ameriprise Financial Services, Inc., which are paid a per account fee). The Transfer Agent pays the fees of BFDS for services as sub-transfer agent and is not entitled to reimbursement for such fees from the Fund (with the exception of out-of-pocket fees).
Annual Report 2014
27
Columbia Marsico Growth Fund
Notes to Financial Statements (continued)
February 28, 2014
The Transfer Agent also receives compensation from fees for various shareholder services and reimbursements for certain out-of-pocket fees. Class I shares do not pay transfer agent fees. Total transfer agent fees for Class R5 shares are subject to an annual limitation of not more than 0.05% of the average daily net assets attributable to Class R5 shares.
For the year ended February 28, 2014, the Fund's effective transfer agent fee rates as a percentage of average daily net assets of each class were as follows:
Class A | | | 0.21 | % | |
Class B | | | 0.21 | | |
Class C | | | 0.21 | | |
Class R | | | 0.21 | | |
Class R4 | | | 0.21 | | |
Class R5 | | | 0.05 | | |
Class W | | | 0.21 | | |
Class Z | | | 0.21 | | |
An annual minimum account balance fee of $20 may apply to certain accounts with a value below the applicable share class's initial minimum investment requirements to reduce the impact of small accounts on transfer agent fees. These minimum account balance fees are recorded as part of expense reductions in the Statement of Operations. For the year ended February 28, 2014, these minimum account balance fees reduced total expenses by $2,461.
Distribution and Service Fees
The Fund has an agreement with Columbia Management Investment Distributors, Inc. (the Distributor), an affiliate of the Investment Manager and a wholly-owned subsidiary of Ameriprise Financial, for distribution and shareholder services. The Board has approved, and the Fund has adopted, distribution and shareholder service plans (the Plans) applicable to certain share classes, which set the distribution and service fees for the Fund. These fees are calculated daily and are intended to compensate the Distributor and/or eligible selling and/or servicing agents for selling shares of the Fund and providing services to investors.
Under the Plans, the Fund pays a monthly combined distribution and service fee to the Distributor at the maximum annual rate of 0.25% of the average daily net assets attributable to Class A shares of the Fund. Also under the Plans, the Fund pays a monthly service fee at the maximum annual rate of 0.25% of the average daily net assets attributable to Class B, Class C and Class W shares of the Fund and the payment of a monthly distribution fee at the maximum annual rates of 0.75%, 0.75%, 0.50% and 0.25% of
the average daily net assets attributable to Class B, Class C, Class R and Class W shares, respectively.
Although the Fund may pay a distribution fee up to 0.25% of the Fund's average daily net assets attributable to Class W shares and a service fee of up to 0.25% of the Fund's average daily net assets attributable to Class W shares, the aggregate fee shall not exceed 0.25% of the Fund's average daily net assets attributable to Class W shares.
Sales Charges
Sales charges, including front-end charges and CDSCs, received by the Distributor for distributing Fund shares were $230,076 for Class A, $7,693 for Class B and $6,665 for Class C shares for the year ended February 28, 2014.
Expenses Waived/Reimbursed by the Investment Manager and its Affiliates
The Investment Manager and certain of its affiliates have contractually agreed to waive fees and/or reimburse expenses (excluding certain fees and expenses described below) for the periods disclosed below, unless sooner terminated at the sole discretion of the Board, so that the Fund's net operating expenses, after giving effect to fees waived/expenses reimbursed and any balance credits and/or overdraft charges from the Fund's custodian, do not exceed the following annual rates as a percentage of the class' average daily net assets:
| | | July 1, 2013
through
June 30, 2014 | | Prior to
July 1, 2013 | |
Class A | | | 1.24 | % | | | 1.25 | % | |
Class B | | | 1.99 | | | | 2.00 | | |
Class C | | | 1.99 | | | | 2.00 | | |
Class I | | | 0.84 | | | | 0.87 | | |
Class R | | | 1.49 | | | | 1.50 | | |
Class R4 | | | 0.99 | | | | 1.00 | | |
Class R5 | | | 0.89 | | | | 0.92 | | |
Class W | | | 1.24 | | | | 1.25 | | |
Class Z | | | 0.99 | | | | 1.00 | | |
Under the agreement governing these fee waivers and/or expense reimbursement arrangements, the following fees and expenses are excluded from the waiver/reimbursement commitment, and therefore will be paid by the Fund, if applicable: taxes (including foreign transaction taxes), expenses associated with investments in affiliated and non-affiliated pooled investment vehicles (including mutual funds and exchange traded funds), transaction costs and brokerage commissions, costs related to any securities lending program, dividend expenses associated with securities sold short, inverse floater program fees and expenses, transaction charges
Annual Report 2014
28
Columbia Marsico Growth Fund
Notes to Financial Statements (continued)
February 28, 2014
and interest on borrowed money, interest, extraordinary expenses and any other expenses the exclusion of which is specifically approved by the Board. This agreement may be modified or amended only with approval from all parties.
Note 4. Federal Tax Information
The timing and character of income and capital gain distributions are determined in accordance with income tax regulations, which may differ from GAAP because of temporary or permanent book to tax differences.
At February 28, 2014, these differences are primarily due to differing treatment for deferral/reversal of wash sales losses, Trustees' deferred compensation, distribution reclassifications, foreign currency transactions, and net operating loss reclassification. To the extent these differences are permanent, reclassifications are made among the components of the Fund's net assets in the Statement of Assets and Liabilities. Temporary differences do not require reclassifications. In the Statement of Assets and Liabilities the following reclassifications were made:
Excess of distributions over net investment income | | $ | 3,440,919 | | |
Accumulated net realized gain | | | (3,440,919 | ) | |
Net investment income and net realized gains (losses), as disclosed in the Statement of Operations, and net assets were not affected by this reclassification.
The tax character of distributions paid during the years indicated was as follows:
Year Ended February 28, | | 2014 | | 2013 | |
Ordinary income | | $ | 97,664,446 | | | $ | 12,351,330 | | |
Long-term capital gains | | | 290,544,557 | | | | — | | |
Total | | $ | 388,209,003 | | | $ | 12,351,330 | | |
Short-term capital gain distributions, if any, are considered ordinary income distributions for tax purposes.
At February 28, 2014, the components of distributable earnings on a tax basis were as follows:
Undistributed accumulated long-term gain | | $ | 64,123,037 | | |
Unrealized appreciation | | | 692,751,698 | | |
At February 28, 2014, the cost of investments for federal income tax purposes was $1,447,214,723 and the aggregate gross unrealized appreciation and depreciation based on that cost was:
Unrealized appreciation | | $ | 695,506,761 | | |
Unrealized depreciation | | | (2,755,063 | ) | |
Net unrealized appreciation | | $ | 692,751,698 | | |
Management of the Fund has concluded that there are no significant uncertain tax positions that would require recognition in the financial statements. However, management's conclusion may be subject to review and adjustment at a later date based on factors including, but not limited to, new tax laws, regulations, and administrative interpretations (including relevant court decisions). Generally, the Fund's federal tax returns for the prior three fiscal years remain subject to examination by the Internal Revenue Service.
Note 5. Portfolio Information
The cost of purchases and proceeds from sales of securities, excluding short-term obligations, aggregated to $1,962,882,599 and $2,579,344,831, respectively, for the year ended February 28, 2014.
Note 6. Affiliated Money Market Fund
The Fund invests its daily cash balances in Columbia Short-Term Cash Fund, an affiliated money market fund established for the exclusive use by the Fund and other affiliated funds. The income earned by the Fund from such investments is included as "Dividends — affiliated issuers" in the Statement of Operations. As an investing fund, the Fund indirectly bears its proportionate share of the expenses of Columbia Short-Term Cash Fund.
Note 7. Shareholder Concentration
At February 28, 2014, three unaffiliated shareholder accounts owned an aggregate of 62.8% of the outstanding shares of the Fund. The Fund has no knowledge about whether any portion of those shares was owned beneficially by such accounts. Subscription and redemption activity by concentrated accounts may have a significant effect on the operations of the Fund.
Note 8. Line of Credit
The Fund has entered into a revolving credit facility with a syndicate of banks led by JPMorgan Chase Bank N.A. whereby the Fund may borrow for the temporary funding of shareholder redemptions or for other temporary or emergency purposes. The credit facility agreement, as amended, which is a collective agreement between the Fund and certain other funds managed by the Investment Manager, severally and not jointly, permits collective borrowings up to $500 million. Interest is charged to each participating fund based on its borrowings at a rate equal to the higher of (i) the overnight federal funds rate plus 1.00% or (ii) the one-month LIBOR rate plus 1.00%. Each borrowing under the credit facility matures no later than 60 days after the date of borrowing. Effective December 10, 2013, the Fund also pays a
Annual Report 2014
29
Columbia Marsico Growth Fund
Notes to Financial Statements (continued)
February 28, 2014
commitment fee equal to its pro rata share of the amount of the credit facility at a rate of 0.075% per annum. Prior to December 10, 2013, the commitment fee was charged at the annual rate of 0.08% per annum. The commitment fee is included in other expenses in the Statement of Operations.
For the year ended February 28, 2014, the average daily loan balance outstanding on days when borrowing existed was $13,316,667 at a weighted average interest rate of 1.19%. Interest expense incurred by the Fund is recorded as line of credit interest expense in the Statement of Operations.
Note 9. Significant Risks
Consumer Discretionary Sector Risk
Sector risk occurs when a fund invests a significant portion of its assets in securities of companies conducting business in a related group of industries within an economic sector. Companies in the same economic sector may be similarly affected by economic, regulatory, political or market events or conditions, making a fund more vulnerable to unfavorable developments in that economic sector than funds that invest more broadly. The Fund may be more susceptible to the particular risks that may affect companies in the consumer discretionary sector than if it were invested in a wider variety of companies in unrelated sectors.
Information Technology Sector Risk
Sector risk occurs when a fund invests a significant portion of its assets in securities of companies conducting business in a related group of industries within an economic sector. Companies in the same economic sector may be similarly affected by economic, regulatory, political or market events or conditions, making a fund more vulnerable to unfavorable developments in that economic sector than funds that invest more broadly. The Fund may be more susceptible to the particular risks that may affect companies in the information technology sector than if it were invested in a wider variety of companies in unrelated sectors.
Note 10. Subsequent Events
Management has evaluated the events and transactions that have occurred through the date the financial statements were issued and noted no items requiring adjustment of the financial statements or additional disclosure.
Note 11. Information Regarding Pending and Settled Legal Proceedings
In December 2005, without admitting or denying the allegations, American Express Financial Corporation (AEFC, which is now known as Ameriprise Financial, Inc. (Ameriprise Financial)) entered into settlement agreements with the
Securities and Exchange Commission (SEC) and Minnesota Department of Commerce (MDOC) related to market timing activities. As a result, AEFC was censured and ordered to cease and desist from committing or causing any violations of certain provisions of the Investment Advisers Act of 1940, the Investment Company Act of 1940, and various Minnesota laws. AEFC agreed to pay disgorgement of $10 million and civil money penalties of $7 million. AEFC also agreed to retain an independent distribution consultant to assist in developing a plan for distribution of all disgorgement and civil penalties ordered by the SEC in accordance with various undertakings detailed at www.sec.gov/litigation/admin/ia-2451.pdf. Ameriprise Financial and its affiliates have cooperated with the SEC and the MDOC in these legal proceedings, and have made regular reports to the Funds' Boards of Trustees.
Ameriprise Financial and certain of its affiliates have historically been involved in a number of legal, arbitration and regulatory proceedings, including routine litigation, class actions, and governmental actions, concerning matters arising in connection with the conduct of their business activities. Ameriprise Financial believes that the Funds are not currently the subject of, and that neither Ameriprise Financial nor any of its affiliates are the subject of, any pending legal, arbitration or regulatory proceedings that are likely to have a material adverse effect on the Funds or the ability of Ameriprise Financial or its affiliates to perform under their contracts with the Funds. Ameriprise Financial is required to make 10-Q, 10-K and, as necessary, 8-K filings with the Securities and Exchange Commission on legal and regulatory matters that relate to Ameriprise Financial and its affiliates. Copies of these filings may be obtained by accessing the SEC website at www.sec.gov.
There can be no assurance that these matters, or the adverse publicity associated with them, will not result in increased fund redemptions, reduced sale of fund shares or other adverse consequences to the Funds. Further, although we believe proceedings are not likely to have a material adverse effect on the Funds or the ability of Ameriprise Financial or its affiliates to perform under their contracts with the Funds, these proceedings are subject to uncertainties and, as such, we are unable to estimate the possible loss or range of loss that may result. An adverse outcome in one or more of these proceedings could result in adverse judgments, settlements, fines, penalties or other relief that could have a material adverse effect on the consolidated financial condition or results of operations of Ameriprise Financial.
Annual Report 2014
30
Columbia Marsico Growth Fund
Report of Independent Registered Public Accounting Firm
To the Trustees of Columbia Funds Series Trust and the Shareholders of
Columbia Marsico Growth Fund
In our opinion, the accompanying statement of assets and liabilities, including the portfolio of investments, and the related statements of operations and of changes in net assets and the financial highlights present fairly, in all material respects, the financial position of Columbia Marsico Growth Fund (the "Fund", a series of Columbia Funds Series Trust) at February 28, 2014, and the results of its operations, the changes in its net assets and the financial highlights for each of the periods indicated, in conformity with accounting principles generally accepted in the United States of America. These financial statements and financial highlights (hereafter referred to as "financial statements") are the responsibility of the Fund's management; our responsibility is to express an opinion on these financial statements based on our audits. We conducted our audits of these financial statements in accordance with the standards of the Public Company Accounting Oversight Board (United States). Those standards require that we plan and perform the audit to obtain reasonable assurance about whether the financial statements are free of material misstatement. An audit includes examining, on a test basis, evidence supporting the amounts and disclosures in the financial statements, assessing the accounting principles used and significant estimates made by management, and evaluating the overall financial statement presentation. We believe that our audits, which included confirmation of securities at February 28, 2014 by correspondence with the custodian, brokers and transfer agent, provide a reasonable basis for our opinion.
PricewaterhouseCoopers LLP
Minneapolis, Minnesota
April 21, 2014
Annual Report 2014
31
Columbia Marsico Growth Fund
Federal Income Tax Information
(Unaudited)
The Fund hereby designates the following tax attributes for the fiscal year ended February 28, 2014. Shareholders will be notified in early 2015 of the amounts for use in preparing 2014 income tax returns.
Tax Designations:
| Qualified Dividend Income | | | 21.24 | % | |
| Dividends Received Deduction | | | 18.29 | % | |
Capital Gain Dividend | | $ | 274,523,496 | | |
Qualified Dividend Income. For taxable, non-corporate shareholders, the percentage of ordinary income dividends paid during the fiscal year that represents qualified dividend income subject to reduced tax rates.
Dividends Received Deduction. The percentage of ordinary income dividends paid during the fiscal year that qualifies for the corporate dividends received deduction.
Capital Gain Dividend. The Fund designates as a capital gain dividend the amount reflected above, or if subsequently determined to be different, the net capital gain of such fiscal period. The Fund also designates as capital gain dividends, to the extent necessary to fully distribute such capital gains, earnings and profits distributed to shareholders on the redemption of shares.
Annual Report 2014
32
Columbia Marsico Growth Fund
Shareholders elect the Board that oversees the Funds' operations. The Board appoints officers who are responsible for day-to-day business decisions based on policies set by the Board. The following table provides basic biographical information about the Funds' Board members, including their principal occupations during the past five years, although specific titles for individuals may have varied over the period. Under current Board policy, members may serve through the end of the calendar year in which he or she reaches either the mandatory retirement age established by the Board or the fifteenth anniversary of the first Board meeting they attended as a member of the Board.
Independent Trustees
Name,
Address,
Year of Birth | | Position Held With
Funds and Length of
Service | | Principal Occupation(s)
During Past Five Years
and Other Relevant
Professional Experience | | Number of
Funds in the
Fund Family
Overseen by
Board Member | | Other Present or Past
Directorships/
Trusteeships
(Within Past 5 Years) | |
Kathleen Blatz
901 S. Marquette Ave.
Minneapolis, MN 55402
1954 | | Board member since 1/06 for RiverSource Funds and since 6/11 for Nations Funds | | Attorney; Chief Justice, Minnesota Supreme
Court, 1998-2006 | | | 131 | | | Trustee, BlueCross BlueShield of Minnesota since 2009 | |
Edward J. Boudreau, Jr.
901 S. Marquette Ave.
Minneapolis, MN 55402
1944 | | Board member since 6/11 for RiverSource Funds and since 1/05 for Nations Funds | | Managing Director, E.J. Boudreau & Associates (consulting) since 2000; Chairman and Chief Executive Officer, John Hancock Funds (mutual funds), 1989-2000 | | | 129 | | | Former Trustee, BofA Funds Series Trust (11 funds), 2005-2011 | |
Pamela G. Carlton
901 S. Marquette Ave.
Minneapolis, MN 55402
1954 | | Board member since 7/07 for RiverSource Funds and since 6/11 for Nations Funds | | President, Springboard — Partners in Cross Cultural Leadership (consulting company) since 2003; Director or Management Director of US Equity Research, Chase Asset Management, 1996-2003; Investment Banker, Morgan Stanley, 1982-1996 | | | 131 | | | None | |
William P. Carmichael
901 S. Marquette Ave.
Minneapolis, MN 55402
1943 | | Chair of the Board since 1/14, Board member since 6/11 for RiverSource Funds and since 2003 for Nations Funds | | Retired; Co-founder, The Succession Fund (provides exit strategies to owners of privately held companies); previously, Senior Vice President, Sara Lee Corporation; Senior Vice President and Chief Financial officer, Beatrice Foods Company; Vice President, Esmark, Inc.; Associate, Price Waterhouse | | | 131 | | | Director, Cobra Electronics Corporation (electronic equipment manufacturer); The Finish Line (athletic shoes and apparel) since July 2003; Director, International Textile Corp. since 2012; former Director, McMoRan Exploration Company (oil and gas exploration and development) 2010-2013; former Trustee, BofA Funds Series Trust (11 funds), 2009-2011; Director, Spectrum Brands, Inc. (consumer products), 2002-2009; Director, Simmons Company (bedding), 2004-2010 | |
Annual Report 2014
33
Columbia Marsico Growth Fund
Trustees and Officers (continued)
Independent Trustees (continued)
Name,
Address,
Year of Birth | | Position Held With
Funds and Length of
Service | | Principal Occupation(s)
During Past Five Years
and Other Relevant
Professional Experience | | Number of
Funds in the
Fund Family
Overseen by
Board Member | | Other Present or Past
Directorships/
Trusteeships
(Within Past 5 Years) | |
Patricia M. Flynn
901 S. Marquette Ave.
Minneapolis, MN 55402
1950 | | Board member since 11/04 for RiverSource Funds and since 6/11 for Nations Funds | | Trustee Professor of Economics and Management, Bentley University since 1976 (also teaches and conducts research on corporate governance); Dean, McCallum Graduate School of Business, Bentley University, 1992-2002 | | | 131 | | | None | |
William A. Hawkins
901 S. Marquette Ave.
Minneapolis, MN 55402
1942 | | Board member since 6/11 for RiverSource Funds and since 1/05 for Nations Funds | | Managing Director, Overton Partners (financial consulting), since August 2010; President and Chief Executive Officer, California General Bank, N.A., January 2008-August 2010 | | | 129 | | | Trustee, BofA Funds Series Trust (11 funds) | |
R. Glenn Hilliard
901 S. Marquette Ave.
Minneapolis, MN 55402
1943 | | Board member since 6/11 for RiverSource Funds and since 1/05 for Nations Funds | | Chairman and Chief Executive Officer, Hilliard Group LLC (investing and consulting) since April 2003; Non-Executive Director & Chairman, CNO Financial Group, Inc. (insurance), September 2003-May 2011 | | | 129 | | | Chairman, BofA Fund Series Trust (11 funds); former Director, CNO Financial Group, Inc. (insurance), 2003-2011 | |
Stephen R. Lewis, Jr.
901 S. Marquette Ave.
Minneapolis, MN 55402
1939 | | Board member for RiverSource Funds since 1/02 and since 6/11 for Nations Funds, Board Chair 1/07-12/13 | | President Emeritus and Professor of Economics Emeritus, Carleton College since 2002 | | | 131 | | | Director, Valmont Industries, Inc. (irrigation systems manufacturer), 2002-2013 | |
Catherine James Paglia
901 S. Marquette Ave.
Minneapolis, MN 55402
1952 | | Board member since 11/04 for RiverSource Funds and since 6/11 for Nations Funds | | Director, Enterprise Asset Management, Inc. (private real estate and asset management company) since September 1998 | | | 131 | | | Director, Valmont Industries, Inc. (irrigation systems manufacturer) since 2012 | |
Leroy C. Richie
901 S. Marquette Ave.
Minneapolis, MN 55402
1941 | | Board member since 2000 for Legacy Seligman Funds, since 11/08 for RiverSource Funds and since 6/11 for Nations Funds | | Counsel, Lewis & Munday, P.C. (law firm) since 2004; Vice President and General Counsel, Automotive Legal Affairs, Chrysler Corporation, 1993-1997 | | | 131 | | | Lead Outside Director, Digital Ally, Inc. (digital imaging) since September 2005; Director, Infinity, Inc. (oil and gas exploration and production) since 1994; Director, OGE Energy Corp. (energy and energy services) since November 2007 | |
Minor M. Shaw
901 S. Marquette Ave.
Minneapolis, MN 55402
1947 | | Board member since 6/11 for RiverSource Funds and since 2003 for Nations Funds | | President, Micco LLC (private investments) since 2011; President, Micco Corp. since 1998 | | | 129 | | | Director, Piedmont Natural Gas; Director, BlueCross BlueShield of South Carolina since April 2008; Director, National Association of Corporate Directors, Carolinas Chapter, since 2013; former Trustee, BofA Funds Series Trust (11 funds) | |
Annual Report 2014
34
Columbia Marsico Growth Fund
Trustees and Officers (continued)
Independent Trustees (continued)
Name,
Address,
Year of Birth | | Position Held With
Funds and Length of
Service | | Principal Occupation(s)
During Past Five Years
and Other Relevant
Professional Experience | | Number of
Funds in the
Fund Family
Overseen by
Board Member | | Other Present or Past
Directorships/
Trusteeships
(Within Past 5 Years) | |
Alison Taunton-Rigby
901 S. Marquette Ave.
Minneapolis, MN 55402
1944 | | Board member since 11/02 for RiverSource Funds and since 6/11 for Nations Funds | | Chief Executive Officer and Director, RiboNovix, Inc., (biotechnology) 2003-2010 | | | 131 | | | Director, Healthways, Inc. (health and wellbeing solutions) since 2005; Director, ICI Mutual Insurance Company, RRG since 2011; Director, Abt Associates (government contractor) since 2001; Director, Boston Children's Hospital since 2002 | |
Interested Trustee Not Affiliated with Investment Manager*
Name,
Address,
Year of Birth | | Position Held With
Funds and Length of
Service | | Principal Occupation(s)
During Past Five Years
and Other Relevant
Professional Experience | | Number of
Funds in the
Fund Family
Overseen by
Board Member | | Other Present or Past
Directorships/
Trusteeships
(Within Past 5 Years) | |
Anthony M. Santomero
901 S. Marquette Ave.
Minneapolis, MN 55402
1946 | | Board member since 6/11 for RiverSource Funds and since 1/08 for Nations Funds | | Richard K. Mellon Professor Emeritus of Finance, The Wharton School, University of Pennsylvania, since 2002; Senior Advisor, McKinsey & Company (consulting), 2006-2008 | | | 129 | | | Director, Renaissance Reinsurance Ltd. since May 2008; Trustee, Penn Mutual Life Insurance Company since March 2008; Director, Citigroup Inc. since 2009; Director, Citibank, N.A. since 2009; former Trustee, BofA Funds Series Trust (11 funds), 2008-2011 | |
* Dr. Santomero is not an affiliated person of the Investment Manager or Ameriprise Financial. However, he is currently deemed by the Funds to be an "interested person" (as defined in the 1940 Act) of the Funds because he serves as a Director of Citigroup Inc. and Citibank, N.A., companies that may directly or through subsidiaries and affiliates engage from time-to-time in brokerage execution, principal transactions and lending relationships with the Funds or accounts advised/managed by the Investment Manager.
Annual Report 2014
35
Columbia Marsico Growth Fund
Trustees and Officers (continued)
Interested Trustee Affiliated with Investment Manager*
Name,
Address,
Year of Birth | | Position Held With
Funds and Length of
Service | | Principal Occupation(s)
During Past Five Years
and Other Relevant
Professional Experience | | Number of
Funds in the
Fund Family
Overseen by
Board Member | | Other Present or Past
Directorships/
Trusteeships
(Within Past 5 Years) | |
William F. Truscott
53600 Ameriprise
Financial Center
Minneapolis, MN 55474
1960 | | Board member since 11/01 for RiverSource Funds and since 6/11 for Nations Funds; Senior Vice President since 2002 for RiverSource Funds and since 5/10 for Nations Funds | | Chairman of the Board and President, Columbia Management Investment Advisers, LLC since May 2010 and February 2012, respectively (previously President and Chief Investment Officer, 2001-April 2010); Chief Executive Officer, Global Asset Management, Ameriprise Financial, Inc. since September 2012 (previously Chief Executive Officer, U.S. Asset Management & President, Annuities, May 2010-September 2012 and President — U.S. Asset Management and Chief Investment Officer, 2005-April 2010); Director and Chief Executive Officer, Columbia Management Investment Distributors, Inc. since May 2010 and February 2012, respectively (previously Chairman of the Board and Chief Executive Officer, 2006-April 2010); Chairman of the Board and Chief Executive Officer, RiverSource Distributors, Inc. since 2006; Director, Threadneedle Asset Management Holdings, SARL since 2014; President and Chief Executive Officer, Ameriprise Certificate Company, 2006-August 2012 | | | 183 | | | Former Director, Ameriprise Certificate Company, 2006-January 2013 | |
* Interested person (as defined under the 1940 Act) by reason of being an officer, director, security holder and/or employee of the Investment Manager or Ameriprise Financial.
The SAI has additional information about the Fund's Board members and is available, without charge, upon request by calling 800.345.6611; contacting your financial intermediary; or visiting columbiamanagement.com.
Annual Report 2014
36
Columbia Marsico Growth Fund
Trustees and Officers (continued)
The Board has appointed officers who are responsible for day-to-day business decisions based on policies it has established. The officers serve at the pleasure of the Board. In addition to Mr. Truscott, who is Senior Vice President, the Funds' other officers are:
Officers
Name,
Address and
Year of Birth | | Position and Year
First Appointed to
Position for any Fund
in the Columbia
Funds Complex or a
Predecessor Thereof | | Principal Occupation(s) During Past Five Years | |
J. Kevin Connaughton
225 Franklin Street
Boston, MA 02110
Born 1964 | | President and Principal Executive Officer (2009) | | Managing Director and General Manager — Mutual Fund Products, Columbia Management Investment Advisers, LLC since May 2010; and President, Columbia Funds since 2009; Managing Director, Columbia Management Advisors, LLC, December 2004 – April 2010; Senior Vice President and Chief Financial Officer, Columbia Funds, June 2008 – January 2009; and senior officer of Columbia Funds and affiliated funds since 2003 | |
Michael G. Clarke
225 Franklin Street
Boston, MA 02110
Born 1969 | | Treasurer (2011) and Chief Financial Officer (2009) | | Vice President — Mutual Fund Administration, Columbia Management Investment Advisers, LLC, since May 2010;Managing Director of Fund Administration, Columbia Management Advisors, LLC, September 2004 – April 2010; and senior officer of Columbia Funds and affiliated funds since 2002 | |
Scott R. Plummer
5228 Ameriprise Financial Center
Minneapolis, MN 55474
Born 1959 | | Senior Vice President (2006), Chief Legal Officer (2006) and Assistant Secretary (2011) | | Senior Vice President and Assistant General Counsel — Global Asset Management, Ameriprise Financial since February 2014 (previously, Senior Vice President and Lead Chief Counsel — Asset Management, 2012 – February 2014; Vice President and Lead Chief Counsel — Asset Management, 2010 – 2012; and Vice President and Chief Counsel — Asset Management, 2005 – 2010); Senior Vice President, Chief Legal Officer and Assistant Secretary, Columbia Management Investment Advisers, LLC since June 2005; Vice President, Chief Counsel and Assistant Secretary, Columbia Management Investment Distributors, Inc. since 2008; Vice President, General Counsel and Secretary, Ameriprise Certificate Company since 2005; Chief Counsel, RiverSource Distributors, Inc. since 2006; senior officer of Columbia Funds and affiliated funds since 2006 | |
Thomas P. McGuire
225 Franklin Street
Boston, MA 02110
Born 1972 | | Chief Compliance Officer (2012) | | Vice President — Asset Management Compliance, Ameriprise Financial, Inc. since May 2010; Chief Compliance Officer, Ameriprise Certificate Company, since September 2010; Compliance Executive, Bank of America, 2005 – April 2010 | |
Colin Moore
225 Franklin Street
Boston, MA 02110
Born 1958 | | Senior Vice President (2010) | | Executive Vice President and Global Chief Investment Officer, Ameriprise Financial, Inc. since July 2013; Director and Global Chief Investment Officer, Columbia Management Investment Advisers, LLC since May 2010; Manager, Managing Director and Chief Investment Officer, Columbia Management Advisors, LLC, 2007 – April 2010 | |
Michael E. DeFao
225 Franklin Street
Boston, MA 02110
Born 1968 | | Vice President (2011) and Assistant Secretary (2010) | | Vice President and Chief Counsel, Ameriprise Financial, Inc. since May 2010; Associate General Counsel, Bank of America 2005 – April 2010 | |
Joseph F. DiMaria
225 Franklin Street
Boston, MA 02110
Born 1968 | | Vice President (2011) and Chief Accounting Officer (2008) | | Vice President — Mutual Fund Treasurer, Columbia Management Investment Advisers, LLC since May 2010; Director of Fund Administration, Columbia Management Advisors, LLC, 2006 – April 2010 | |
Paul B. Goucher
100 Park Avenue
New York, NY 10017
Born 1968 | | Vice President (2011) and Assistant Secretary (2008) | | Vice President and Lead Chief Counsel, Ameriprise Financial, Inc. since November 2008 and January 2013, respectively (previously Chief Counsel, January 2010 – January 2013, and Group Counsel, November 2008 – January 2010); Director, Managing Director and General Counsel, J. & W. Seligman & Co. Incorporated, July 2008 – November 2008 | |
Amy Johnson
5228 Ameriprise Financial
Center
Minneapolis, MN 55474
Born 1965 | | Vice President (2006) | | Managing Director and Chief Operating Officer, Columbia Management Investment Advisers, LLC since May 2010 (previously Chief Administrative Officer, 2009 – April 2010, and Vice President — Asset Management and Trust Company Services, 2006 – 2009) | |
Annual Report 2014
37
Columbia Marsico Growth Fund
Trustees and Officers (continued)
Officers (continued)
Name,
Address and
Year of Birth | | Position and Year
First Appointed to
Position for any Fund
in the Columbia
Funds Complex or a
Predecessor Thereof | | Principal Occupation(s) During Past Five Years | |
Paul D. Pearson
5228 Ameriprise Financial
Center
Minneapolis, MN 55474
Born 1956 | | Vice President (2011) and Assistant Treasurer (1999) | | Vice President — Investment Accounting, Columbia Management Investment Advisers, LLC since May 2010; Vice President — Managed Assets, Investment Accounting, Ameriprise Financial, Inc., 1998 – April 2010 | |
Christopher O. Petersen
5228 Ameriprise Financial Center
Minneapolis, MN 55474
Born 1970 | | Vice President and Secretary (2010) | | Vice President and Chief Counsel, Ameriprise Financial, Inc., since January 2010 (previously Vice President and Group Counsel or Counsel, 2004 – January 2010); officer of Columbia Funds and affiliated funds since 2007 | |
Stephen T. Welsh
225 Franklin Street
Boston, MA 02110
Born 1957 | | Vice President (2006) | | President and Director, Columbia Management Investment Services Corp. since May 2010; President and Director, Columbia Management Services, Inc., 2004 – April 2010; Managing Director, Columbia Management Distributors, Inc., 2007 – April 2010 | |
Annual Report 2014
38
This page intentionally left blank.
Annual Report 2014
39
This page intentionally left blank.
Annual Report 2014
40
Columbia Marsico Growth Fund
Important Information About This Report
Each fund mails one shareholder report to each shareholder address. If you would like more than one report, please call shareholder services at 800.345.6611 and additional reports will be sent to you.
The policy of the Board is to vote the proxies of the companies in which each fund holds investments consistent with the procedures as stated in the Statement of Additional Information (SAI). You may obtain a copy of the SAI without charge by calling 800.345.6611; contacting your financial intermediary; visiting columbiamanagement.com; or searching the website of the Securities and Exchange Commission (SEC) at sec.gov. Information regarding how each fund voted proxies relating to portfolio securities is filed with the SEC by August 31 for the most recent 12-month period ending June 30 of that year, and is available without charge by visiting columbiamanagement.com; or searching the website of the SEC at sec.gov.
Each fund files a complete schedule of portfolio holdings with the SEC for the first and third quarters of each fiscal year on Form N-Q. Each fund's Form N-Q is available on the SEC's website at sec.gov and may be reviewed and copied at the SEC's Public Reference Room in Washington, D.C. Information on the operation of the Public Reference Room may be obtained by calling 800.SEC.0330. Each fund's complete schedule of portfolio holdings, as filed on Form N-Q, can also be obtained without charge, upon request, by calling 800.345.6611.
Annual Report 2014
41

Columbia Marsico Growth Fund
P.O. Box 8081
Boston, MA 02266-8081
columbiamanagement.com
This information is for use with concurrent or prior delivery of a fund prospectus. Please read and consider the investment objectives, risks, charges and expenses for any fund carefully before investing. For a prospectus and, if available, a summary prospectus, which contains this and other important information about the Fund go to columbiamanagement.com. The Fund is distributed by Columbia Management Investment Distributors, Inc., member FINRA, and managed by Columbia Management Investment Advisers, LLC.
© 2014 Columbia Management Investment Advisers, LLC. All rights reserved.
ANN188_02_D01_(04/14)
Annual Report
February 28, 2014

Columbia Multi-Advisor International Equity Fund
Not FDIC insured • No bank guarantee • May lose value
 Dear Shareholders,
Equities recovered
In the final months of 2013, the U.S. economy embraced a robust recovery. After five years of only modest progress, the pace of economic growth picked up, job gains continued, manufacturing activity accelerated and a rebound in the housing market showed staying power. Growth, as measured by gross domestic product, was 4.1% in the third quarter, with expectations for a solid fourth quarter. Job growth averaged close to 200,000 monthly. Industrial production rose at a rate of 3.3%, considerably higher than the 12-month average of 2.5%. Factories were busier than at any point since the 2008/2009 recession, with capacity utilization at 79%. Orders for durable goods were strong, bolstered by rising auto sales. Holiday spending was solid, especially online sales, which rose 10% year over year, despite a shorter season.
Against this backdrop, the Federal Reserve's (the Fed's) announcement that it would slowly retreat from its monthly bond buying program and a bipartisan budget deal in Washington were welcome news for investors. Stocks climbed to new highs in the fourth quarter, while bonds retreated as yields moved higher. Small-cap stocks outperformed large- and mid-cap stocks, led by significant gains from the industrials, technology and consumer discretionary sectors. All 10 sectors of the S&P 500 Index delivered positive returns, although telecommunications and utilities posted only modest gains.
Fixed-income retreated
Improved economic data drove interest rates higher over the fourth quarter, credit spreads narrowed and the dollar weakened against most developed market currencies. Against this backdrop, most non-Treasury, fixed-income sectors delivered positive returns. Outgoing Fed chairman Ben Bernanke expressed concern about the persistently low level of core inflation, but gains in the labor market and reduced unemployment led to the Fed's decision to taper its bond-buying program gradually beginning in January 2014.
As the stock market soared, the riskiest sectors of the fixed-income markets fared the best. U.S. and foreign high-yield bonds were the strongest performers, followed by emerging-market and U.S. investment-grade corporate bonds. U.S. mortgage-backed securities (MBS) and securitized bonds produced negative total returns, as did U.S. Treasuries and developed world government bonds. Treasury inflation-protected bonds were the period's biggest losers. Investment-grade municipals delivered fractional gains, as better economic conditions helped steady state finances.
Stay on track with Columbia Management
Backed by more than 100 years of experience, Columbia Management is one of the nation's largest asset managers. At the heart of our success and, most importantly, that of our investors, are highly talented industry professionals, brought together by a unique way of working. At Columbia Management, reaching our performance goals matters, and how we reach them matters just as much.
Visit columbiamanagement.com for:
> The Columbia Management Perspectives blog, offering insights on current market events and investment opportunities
> Detailed up-to-date fund performance and portfolio information
> Quarterly fund commentaries
> Columbia Management Investor, our award-winning quarterly newsletter for shareholders
Thank you for your continued support of the Columbia Funds. We look forward to serving your investment needs for many years to come.
Best Regards,

J. Kevin Connaughton
President, Columbia Funds
Investing involves risk including the risk of loss of principal.
The S&P 500 Index, an unmanaged index, measures the performance of 500 widely held, large-capitalization U.S. stocks and is frequently used as a general measure of market performance. The Dow Jones Industrial Average is a price weighted average of 30 actively traded shares of blue chip US industrial corporations listed on the New York Stock Exchange. Indices are not available for investment, are not professionally managed and do not reflect sales charges, fees, brokerage commissions, taxes or other expenses of investing.
Investors should consider the investment objectives, risks, charges and expenses of a mutual fund carefully before investing. For a free prospectus and, if available, a summary prospectus, which contains this and other important information about a fund, visit columbiamanagement.com. The prospectus should be read carefully before investing.
Columbia Funds are distributed by Columbia Management Investment Distributors, Inc., member FINRA, and managed by Columbia Management Investment Advisers, LLC.
© 2014 Columbia Management Investment Advisers, LLC. All rights reserved.
Columbia Multi-Advisor International Equity Fund
Performance Overview | | | 2 | | |
Manager Discussion of Fund Performance | | | 4 | | |
Understanding Your Fund's Expenses | | | 9 | | |
Portfolio of Investments | | | 10 | | |
Statement of Assets and Liabilities | | | 19 | | |
Statement of Operations | | | 22 | | |
Statement of Changes in Net Assets | | | 23 | | |
Financial Highlights | | | 26 | | |
Notes to Financial Statements | | | 37 | | |
Report of Independent Registered
Public Accounting Firm | | | 47 | | |
Federal Income Tax Information | | | 48 | | |
Trustees and Officers | | | 49 | | |
Important Information About This Report | | | 57 | | |
Fund Investment Manager
Columbia Management Investment
Advisers, LLC
225 Franklin Street
Boston, MA 02110
Fund Distributor
Columbia Management Investment
Distributors, Inc.
225 Franklin Street
Boston, MA 02110
Fund Transfer Agent
Columbia Management Investment
Services Corp.
P.O. Box 8081
Boston, MA 02266-8081
For more information about any of the funds, please visit columbiamanagement.com or call 800.345.6611. Customer Service Representatives are available to answer your questions Monday through Friday from 8 a.m. to 7 p.m. Eastern time.
The views expressed in this report reflect the current views of the respective parties. These views are not guarantees of future performance and involve certain risks, uncertainties and assumptions that are difficult to predict, so actual outcomes and results may differ significantly from the views expressed. These views are subject to change at any time based upon economic, market or other conditions and the respective parties disclaim any responsibility to update such views. These views may not be relied on as investment advice and, because investment decisions for a Columbia Fund are based on numerous factors, may not be relied on as an indication of trading intent on behalf of any particular Columbia Fund. References to specific securities should not be construed as a recommendation or investment advice.
Columbia Multi-Advisor International Equity Fund
Performance Summary
> Columbia Multi-Advisor International Equity Fund (the Fund) Class A shares returned 15.47% excluding sales charges for the 12-month period that ended February 28, 2014.
> The Fund underperformed its benchmark, the MSCI EAFE Index (Net), which returned 19.28% for the same time period.
> The Fund's underlying investment segments all delivered solid performance. However, exposure to emerging markets accounted for the Fund's shortfall relative to its benchmark.
Average Annual Total Returns (%) (for period ended February 28, 2014)
| | Inception | | 1 Year | | 5 Years | | 10 Years | |
Class A | | 06/03/92 | | | | | | | | | | | | | |
Excluding sales charges | | | | | | | 15.47 | | | | 15.41 | | | | 5.14 | | |
Including sales charges | | | | | | | 8.86 | | | | 14.06 | | | | 4.52 | | |
Class B | | 06/07/93 | | | | | | | | | | | | | |
Excluding sales charges | | | | | | | 14.68 | | | | 14.54 | | | | 4.37 | | |
Including sales charges | | | | | | | 9.68 | | | | 14.31 | | | | 4.37 | | |
Class C | | 06/17/92 | | | | | | | | | | | | | |
Excluding sales charges | | | | | | | 14.58 | | | | 14.57 | | | | 4.36 | | |
Including sales charges | | | | | | | 13.58 | | | | 14.57 | | | | 4.36 | | |
Class I* | | 09/27/10 | | | 15.98 | | | | 15.89 | | | | 5.50 | | |
Class K* | | 03/07/11 | | | 15.66 | | | | 15.61 | | | | 5.31 | | |
Class R* | | 01/23/06 | | | 15.24 | | | | 15.14 | | | | 4.89 | | |
Class R4* | | 11/08/12 | | | 15.73 | | | | 15.72 | | | | 5.41 | | |
Class R5* | | 11/08/12 | | | 15.91 | | | | 15.76 | | | | 5.43 | | |
Class W* | | 09/27/10 | | | 15.47 | | | | 15.44 | | | | 5.17 | | |
Class Y* | | 03/07/11 | | | 15.97 | | | | 15.86 | | | | 5.48 | | |
Class Z | | 12/02/91 | | | 15.75 | | | | 15.72 | | | | 5.41 | | |
MSCI EAFE Index (Net) | | | | | | | 19.28 | | | | 17.60 | | | | 6.66 | | |
Returns for Class A are shown with and without the maximum initial sales charge of 5.75%. Returns for Class B are shown with and without the applicable contingent deferred sales charge (CDSC) of 5.00% in the first year, declining to 1.00% in the sixth year and eliminated thereafter. Returns for Class C are shown with and without the 1.00% CDSC for the first year only. The Fund's other classes are not subject to sales charges and have limited eligibility. Please see the Fund's prospectus for details. Performance for different share classes will vary based on differences in sales charges and fees associated with each class. All results shown assume reinvestment of distributions during the period. Returns do not reflect the deduction of taxes that a shareholder may pay on Fund distributions or on the redemption of Fund shares. Performance results reflect the effect of any fee waivers or reimbursements of Fund expenses by Columbia Management Investment Advisers, LLC and/or any of its affiliates. Absent these fee waivers or expense reimbursement arrangements, performance results would have been lower.
The performance information shown represents past performance and is not a guarantee of future results. The investment return and principal value of your investment will fluctuate so that your shares, when redeemed, may be worth more or less than their original cost. Current performance may be lower or higher than the performance information shown. You may obtain performance information current to the most recent month-end by contacting your financial intermediary, visiting columbiamanagement.com or calling 800.345.6611.
*The returns shown for periods prior to the share class inception date (including returns for the Life of the Fund, if shown, which are since Fund inception) include the returns of the Fund's oldest share class. These returns are adjusted to reflect any higher class-related operating expenses of the newer share classes, as applicable. Please visit columbiamanagement.com/mutual-funds/appended-performance for more information.
The MSCI EAFE Index (Net) is a free float-adjusted market capitalization index that is designed to measure the equity market performance of developed markets, excluding the US & Canada. The index is compiled from a composite of securities markets of Europe, Australasia and the Far East and is widely recognized by investors in foreign markets as the measurement index for portfolios of non-North American securities.
Indices are not available for investment, are not professionally managed and do not reflect sales charges, fees, brokerage commissions, taxes (except the MSCI EAFE Index (Net), which reflects reinvested dividends net of withholding taxes) or other expenses of investing. Securities in the Fund may not match those in an index.
Annual Report 2014
2
Columbia Multi-Advisor International Equity Fund
Performance Overview (continued)
Performance of a Hypothetical $10,000 Investment (March 1, 2004 – February 28, 2014)
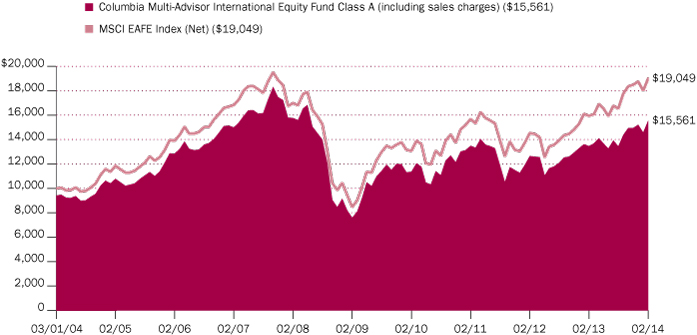
The chart above shows the change in value of a hypothetical $10,000 investment in Class A shares of Columbia Multi-Advisor International Equity Fund during the stated time period, and does not reflect the deduction of taxes that a shareholder may pay on Fund distributions or on the redemption of Fund shares.
Annual Report 2014
3
Columbia Multi-Advisor International Equity Fund
Manager Discussion of Fund Performance
For the 12-month period that ended February 28, 2014, the Fund's Class A shares returned 15.47% excluding sales charges. The Fund's benchmark, the MSCI EAFE Index (Net), returned 19.28% for the same time period. In a year of generally strong performance from markets in the developed world, the Fund's four underlying equity portfolios delivered solid results. Investments in emerging markets, however, which are not included in the benchmark, detracted from performance relative to the benchmark. The Fund's currency strategy also accounted for a modest loss over the period.
Improving Environment Aided Global Stock Markets
Stabilizing economic growth and accommodative central bank policy aided stocks in developed markets around the world over the 12-month period that ended February 28, 2014. In Europe, growth turned modestly positive, aided by rising new orders, higher manufacturing output and a pickup in exports, especially in Spain and Italy. Austerity programs showed signs of success, as some areas besieged in the recent debt crisis, such as Spain and Greece, delivered decent equity returns as the period ended. Although uncertainties and challenges linger, the risk of a eurozone breakup appeared to subside, while the threat of military conflict in Syria and the Ukraine remain ongoing worries. Emerging markets lagged developed markets, beset by political instability and fears over the impact of the Federal Reserve's (the Fed's) exit from its multi-year bond-buying program, which has provided liquidity and support to markets across the globe. However, the Fed took no action until early 2014 and many emerging market returns turned positive in the final month of the period.
Solid Performance from Fund Equity Segments
The Fund is managed to take advantage of opportunities across different regions, investment styles and market segments. Threadneedle International Limited, an affiliate of Columbia Management, focuses on European equities, while the investment team from Columbia Management manages four individual sub-portfolios. One focuses on emerging markets, a second on Japan and a third on the Pacific/Asia region, excluding Japan. A fourth portfolio seeks incremental return from a strategy that buys and sells the currencies of major developed economies.
During the period, all four of the Fund's equity segments — Europe, Japan, Pacific Asia ex Japan and emerging markets — delivered solid results. The Fund's exposure to Europe was especially favorable. Stock picking generally accounted for the Europe segment's strong performance. However, the Fund's position in emerging markets detracted from overall relative results. Emerging markets were weak to negative during the period, and the benchmark does not include an emerging markets component. The Fund's currency strategy contributed a modest loss during the period as world currency markets were volatile in reaction to potential Fed policy changes.
The Fund uses equity index futures to equitize cash in its portfolio and currency contracts for its incremental currency alpha overlay strategy. The impact of equity index futures on performance was minimal during the period. The currency hedging policy detracted as the currency exposures resulting from our active country positions would have outperformed the benchmark currency basket had we not hedged them. They performed as expected, however, which was to eliminate the active currency positions that resulted from our country/stock selection process, which to us simply represents uncompensated risk.
Portfolio Management
Colin Moore, AIIMR
Fred Copper, CFA
Daniel Ison
Morningstar Style BoxTM

The Morningstar Style BoxTM is based on a fund's portfolio holdings. For equity funds, the vertical axis shows the market capitalization of the stocks owned, and the horizontal axis shows investment style (value, blend, or growth). Information shown is based on the most recent data provided by Morningstar.
© 2014 Morningstar, Inc. All rights reserved. The Morningstar information contained herein: (1) is proprietary to Morningstar and/or its content providers; (2) may not be copied or distributed; and (3) is not warranted to be accurate, complete or timely. Neither Morningstar nor its content providers are responsible for any damages or losses arising from any use of this information.
Annual Report 2014
4
Columbia Multi-Advisor International Equity Fund
Manager Discussion of Fund Performance (continued)
Looking Ahead
At this time, our outlook for global stock markets remains fairly positive for 2014. Despite the logical assumption that some amount of give-back is in order after a period as strong as the last 12 months, history has shown that returns tend to be positive in the year that follows a strong up year. Despite the Fed's moves to reduce its bond purchases, monetary conditions continue to be supportive around the world. Further, even though valuations are no longer a tailwind, we currently believe they are not yet at levels that would pose an obstacle. The odds of a short-term pullback following such strong performance must be noted, but generally, we believe the environment for global equity markets remains favorable at this time.
Top Ten Holdings (%)
(at February 28, 2014) | |
Roche Holding AG, Genusschein
Shares (Switzerland) | | | 2.2 | | |
Bayer AG, Registered Shares
(Germany) | | | 1.8 | | |
UBS AG, Registered Shares
(Switzerland) | | | 1.6 | | |
Vodafone Group PLC
(United Kingdom) | | | 1.6 | | |
Airbus Group NV (France) | | | 1.5 | | |
BNP Paribas SA (France) | | | 1.5 | | |
BASF SE (Germany) | | | 1.5 | | |
ING Groep NV-CVA (Netherlands) | | | 1.5 | | |
Allianz SE, Registered Shares
(Germany) | | | 1.4 | | |
Legrand SA (France) | | | 1.3 | | |
Percentages indicated are based upon total investments (excluding Money Market Funds).
For further detail about these holdings, please refer to the section entitled "Portfolio of Investments."
Fund holdings are as of the date given, are subject to change at any time, and are not recommendations to buy or sell any security.
Investment Risks
International investing involves increased risk and volatility due to potential political and economic instability, currency fluctuations, and differences in financial reporting and accounting standards and oversight. Risks are particularly significant in emerging markets. Derivative instruments are financial instruments that have a value dependent on the value of something else, such as one or more underlying securities. Gains or losses may be substantial, because a relatively small price movement in an underlying security may result in a substantial gain or loss. See the Fund's prospectus for more information on these and other risks.
Annual Report 2014
5
Columbia Multi-Advisor International Equity Fund
Manager Discussion of Fund Performance (continued)
Country Breakdown (%)
(at February 28, 2014) | |
Australia | | | 3.0 | | |
Belgium | | | 1.8 | | |
Brazil | | | 0.3 | | |
Chile | | | 0.0 | (a) | |
China | | | 4.1 | | |
Denmark | | | 1.6 | | |
Finland | | | 0.3 | | |
France | | | 13.4 | | |
Germany | | | 10.7 | | |
Hong Kong | | | 1.8 | | |
India | | | 1.7 | | |
Indonesia | | | 0.6 | | |
Ireland | | | 0.9 | | |
Italy | | | 1.2 | | |
Japan | | | 14.0 | | |
Malaysia | | | 0.3 | | |
Malta | | | 0.0 | (a) | |
Mexico | | | 0.3 | | |
Netherlands | | | 5.3 | | |
Norway | | | 0.8 | | |
Panama | | | 0.0 | (a) | |
Peru | | | 0.1 | | |
Philippines | | | 1.0 | | |
Poland | | | 0.0 | (a) | |
Russian Federation | | | 0.4 | | |
Singapore | | | 0.5 | | |
South Africa | | | 0.2 | | |
South Korea | | | 2.6 | | |
Spain | | | 2.6 | | |
Sweden | | | 2.1 | | |
Switzerland | | | 5.6 | | |
Taiwan | | | 2.0 | | |
Thailand | | | 0.9 | | |
Turkey | | | 0.1 | | |
United Kingdom | | | 17.4 | | |
United States(b) | | | 2.4 | | |
Total | | | 100.0 | | |
Percentages indicated are based upon total investments. The Fund's portfolio composition is subject to change.
(a) Rounds to zero.
(b) Includes investments in Money Market Funds.
Annual Report 2014
6
Columbia Multi-Advisor International Equity Fund
Manager Discussion of Fund Performance (continued)
Summary of Investments in Securities
by Industry (%)
(at February 28, 2014) | |
Aerospace & Defense | | | 2.0 | | |
Air Freight & Logistics | | | 0.1 | | |
Airlines | | | 1.6 | | |
Auto Components | | | 2.5 | | |
Automobiles | | | 4.7 | | |
Beverages | | | 1.8 | | |
Biotechnology | | | 0.1 | | |
Capital Markets | | | 2.0 | | |
Chemicals | | | 2.6 | | |
Commercial Banks | | | 13.4 | | |
Commercial Services &
Supplies | | | 0.2 | | |
Computers & Peripherals | | | 0.2 | | |
Construction & Engineering | | | 0.5 | | |
Construction Materials | | | 0.2 | | |
Containers & Packaging | | | 0.3 | | |
Diversified Consumer Services | | | 0.1 | | |
Diversified Financial Services | | | 2.5 | | |
Diversified Telecommunication
Services | | | 4.4 | | |
Electric Utilities | | | 0.3 | | |
Electrical Equipment | | | 1.9 | | |
Electronic Equipment,
Instruments & Components | | | 1.4 | | |
Food & Staples Retailing | | | 1.0 | | |
Food Products | | | 0.2 | | |
Gas Utilities | | | 0.4 | | |
Health Care Equipment &
Supplies | | | 1.5 | | |
Health Care Providers &
Services | | | 0.6 | | |
Hotels, Restaurants &
Leisure | | | 2.0 | | |
Health Care Technology | | | 0.2 | | |
Household Durables | | | 1.2 | | |
Household Products | | | 0.1 | | |
Industrial Conglomerates | | | 0.5 | | |
Insurance | | | 6.2 | | |
Internet & Catalog Retail | | | 0.3 | | |
Internet Software & Services | | | 1.3 | | |
IT Services | | | 2.7 | | |
Leisure Equipment & Products | | | 0.2 | | |
Life Sciences Tools & Services | | | 0.3 | | |
Machinery | | | 3.2 | | |
Media | | | 4.1 | | |
Annual Report 2014
7
Columbia Multi-Advisor International Equity Fund
Manager Discussion of Fund Performance (continued)
Summary of Investments in Securities
by Industry (%)
(at February 28, 2014) (continued) | |
Metals & Mining | | | 0.9 | | |
Multiline Retail | | | 0.2 | | |
Oil, Gas & Consumable Fuels | | | 1.4 | | |
Personal Products | | | 0.8 | | |
Pharmaceuticals | | | 6.1 | | |
Professional Services | | | 1.1 | | |
Real Estate Investment Trusts
(REITs) | | | 0.1 | | |
Real Estate Management &
Development | | | 1.0 | | |
Road & Rail | | | 0.3 | | |
Semiconductors &
Semiconductor Equipment | | | 2.8 | | |
Software | | | 1.5 | | |
Specialty Retail | | | 1.0 | | |
Textiles, Apparel & Luxury
Goods | | | 1.4 | | �� |
Tobacco | | | 0.4 | | |
Trading Companies &
Distributors | | | 4.7 | | |
Transportation Infrastructure | | | 0.9 | | |
Water Utilities | | | 0.3 | | |
Wireless Telecommunication
Services | | | 3.1 | | |
Money Market Funds | | | 1.6 | | |
Total | | | 98.4 | | |
Percentages indicated are based upon net assets. The Fund's portfolio composition is subject to change.
Annual Report 2014
8
Columbia Multi-Advisor International Equity Fund
Understanding Your Fund's Expenses
(Unaudited)
As an investor, you incur two types of costs. There are transaction costs, which generally include sales charges on purchases and may include redemption fees. There are also ongoing costs, which generally include management fees, distribution and/or service fees, and other fund expenses. The following information is intended to help you understand your ongoing costs (in dollars) of investing in the Fund and to help you compare these costs with the ongoing costs of investing in other mutual funds.
Analyzing Your Fund's Expenses
To illustrate these ongoing costs, we have provided examples and calculated the expenses paid by investors in each share class of the Fund during the period. The actual and hypothetical information in the table is based on an initial investment of $1,000 at the beginning of the period indicated and held for the entire period. Expense information is calculated two ways and each method provides you with different information. The amount listed in the "Actual" column is calculated using the Fund's actual operating expenses and total return for the period. You may use the Actual information, together with the amount invested, to estimate the expenses that you paid over the period. Simply divide your account value by $1,000 (for example, an $8,600 account value divided by $1,000 = 8.6), then multiply the results by the expenses paid during the period under the "Actual" column. The amount listed in the "Hypothetical" column assumes a 5% annual rate of return before expenses (which is not the Fund's actual return) and then applies the Fund's actual expense ratio for the period to the hypothetical return. You should not use the hypothetical account values and expenses to estimate either your actual account balance at the end of the period or the expenses you paid during the period. See "Compare With Other Funds" below for details on how to use the hypothetical data.
Compare With Other Funds
Since all mutual funds are required to include the same hypothetical calculations about expenses in shareholder reports, you can use this information to compare the ongoing cost of investing in the Fund with other funds. To do so, compare the hypothetical example with the 5% hypothetical examples that appear in the shareholder reports of other funds. As you compare hypothetical examples of other funds, it is important to note that hypothetical examples are meant to highlight the ongoing costs of investing in a fund only and do not reflect any transaction costs, such as sales charges, or redemption or exchange fees. Therefore, the hypothetical calculations are useful in comparing ongoing costs only, and will not help you determine the relative total costs of owning different funds. If transaction costs were included in these calculations, your costs would be higher.
September 1, 2013 – February 28, 2014
| | Account Value at the Beginning
of the Period ($) | | Account Value at the End of the
Period ($) | | Expenses Paid During the
Period ($) | | Fund's Annualized
Expense Ratio (%) | |
| | Actual | | Hypothetical | | Actual | | Hypothetical | | Actual | | Hypothetical | | Actual | |
Class A | | | 1,000.00 | | | | 1,000.00 | | | | 1,155.70 | | | | 1,017.90 | | | | 7.58 | | | | 7.09 | | | | 1.41 | | |
Class B | | | 1,000.00 | | | | 1,000.00 | | | | 1,152.10 | | | | 1,014.16 | | | | 11.59 | | | | 10.85 | | | | 2.16 | | |
Class C | | | 1,000.00 | | | | 1,000.00 | | | | 1,151.10 | | | | 1,014.16 | | | | 11.58 | | | | 10.85 | | | | 2.16 | | |
Class I | | | 1,000.00 | | | | 1,000.00 | | | | 1,157.90 | | | | 1,020.14 | | | | 5.16 | | | | 4.84 | | | | 0.96 | | |
Class K | | | 1,000.00 | | | | 1,000.00 | | | | 1,157.50 | | | | 1,018.75 | | | | 6.67 | | | | 6.24 | | | | 1.24 | | |
Class R | | | 1,000.00 | | | | 1,000.00 | | | | 1,154.30 | | | | 1,016.65 | | | | 8.92 | | | | 8.35 | | | | 1.66 | | |
Class R4 | | | 1,000.00 | | | | 1,000.00 | | | | 1,157.30 | | | | 1,019.00 | | | | 6.40 | | | | 5.99 | | | | 1.19 | | |
Class R5 | | | 1,000.00 | | | | 1,000.00 | | | | 1,157.20 | | | | 1,019.80 | | | | 5.54 | | | | 5.19 | | | | 1.03 | | |
Class W | | | 1,000.00 | | | | 1,000.00 | | | | 1,155.70 | | | | 1,017.95 | | | | 7.52 | | | | 7.04 | | | | 1.40 | | |
Class Y | | | 1,000.00 | | | | 1,000.00 | | | | 1,157.80 | | | | 1,020.24 | | | | 5.06 | | | | 4.73 | | | | 0.94 | | |
Class Z | | | 1,000.00 | | | | 1,000.00 | | | | 1,156.60 | | | | 1,019.15 | | | | 6.24 | | | | 5.84 | | | | 1.16 | | |
Expenses paid during the period are equal to the annualized expense ratio for each class as indicated above, multiplied by the average account value over the period and then multiplied by the number of days in the Fund's most recent fiscal half year and divided by 365.
Expenses do not include fees and expenses incurred indirectly by the Fund from the underlying funds in which the Fund may invest (also referred to as "acquired funds"), including affiliated and non-affiliated pooled investment vehicles (including mutual funds and exchange-traded funds).
Annual Report 2014
9
Columbia Multi-Advisor International Equity Fund
Portfolio of Investments
February 28, 2014
(Percentages represent value of investments compared to net assets)
Common Stocks 96.8%
Issuer | | Shares | | Value ($) | |
Australia 2.9% | |
Amcor Ltd. | | | 216,950 | | | | 1,961,161 | | |
Australia and New Zealand Banking
Group Ltd. | | | 149,980 | | | | 4,311,988 | | |
BHP Billiton Ltd. | | | 63,206 | | | | 2,167,877 | | |
Commonwealth Bank of Australia | | | 44,397 | | | | 2,965,302 | | |
National Australia Bank Ltd. | | | 66,121 | | | | 2,056,294 | | |
Suncorp Group Ltd. | | | 75,052 | | | | 816,072 | | |
Telstra Corp., Ltd. | | | 687,972 | | | | 3,103,608 | | |
Wesfarmers Ltd. | | | 64,134 | | | | 2,462,699 | | |
Westpac Banking Corp. | | | 71,287 | | | | 2,139,464 | | |
Total | | | | | 21,984,465 | | |
Belgium 1.8% | |
Anheuser-Busch InBev NV | | | 84,639 | | | | 8,873,029 | | |
KBC Groep NV | | | 75,083 | | | | 4,765,234 | | |
Total | | | | | 13,638,263 | | |
Brazil 0.3% | |
AmBev SA, ADR | | | 86,945 | | | | 626,004 | | |
| BRF SA | | | 11,300 | | | | 206,843 | | |
Hypermarcas SA | | | 42,500 | | | | 263,365 | | |
M. Dias Branco SA | | | 3,300 | | | | 115,266 | | |
Mills Estruturas e Servicos de
Engenharia SA | | | 32,500 | | | | 356,221 | | |
Ultrapar Participacoes SA | | | 24,100 | | | | 536,013 | | |
Valid Solucoes SA | | | 7,800 | | | | 98,134 | | |
Total | | | | | 2,201,846 | | |
Chile —% | |
SACI Falabella | | | 29,809 | | | | 247,956 | | |
China 4.0% | |
58.Com, Inc., ADR(a) | | | 6,402 | | | | 302,751 | | |
Anhui Conch Cement Co., Ltd., Class H | | | 367,500 | | | | 1,345,694 | | |
Autohome, Inc., ADR(a) | | | 1,889 | | | | 77,827 | | |
Baidu, Inc., ADR(a) | | | 6,359 | | | | 1,086,944 | | |
China Merchants Bank Co., Ltd., Class H | | | 427,000 | | | | 751,950 | | |
China Milk Products Group Ltd.(a)(b)(c) | | | 7,426,000 | | | | 234,323 | | |
China Mobile Ltd., ADR | | | 15,746 | | | | 748,722 | | |
China Overseas Land & Investment Ltd. | | | 112,000 | | | | 301,850 | | |
China Pacific Insurance Group Co., Ltd.,
Class H | | | 65,800 | | | | 226,783 | | |
China Petroleum & Chemical Corp.,
Class H | | | 303,600 | | | | 268,749 | | |
Common Stocks (continued)
Issuer | | Shares | | Value ($) | |
China Vanke Co., Ltd., Class B | | | 747,470 | | | | 1,109,429 | | |
Chongqing Changan Automobile Co., Ltd.
Class B | | | 39,574 | | | | 79,032 | | |
CIMC Enric Holdings Ltd. | | | 650,000 | | | | 1,002,317 | | |
CNOOC Ltd. | | | 686,000 | | | | 1,123,060 | | |
CSPC Pharmaceutical Group Ltd. | | | 1,708,000 | | | | 1,543,728 | | |
ENN Energy Holdings Ltd. | | | 88,000 | | | | 623,845 | | |
GCL-Poly Energy Holdings Ltd.(a) | | | 1,387,000 | | | | 523,452 | | |
Guangdong Investment Ltd. | | | 2,424,000 | | | | 2,540,149 | | |
Industrial & Commercial Bank of
China Ltd., Class H | | | 2,875,000 | | | | 1,728,374 | | |
Li Ning Co., Ltd.(a) | | | 345,500 | | | | 266,359 | | |
Luthai Textile Co., Ltd., Class B | | | 853,630 | | | | 1,176,170 | | |
New Oriental Education & Technology
Group, Inc., ADR | | | 25,241 | | | | 702,709 | | |
Ping An Insurance Group Co. of
China Ltd., Class H | | | 52,000 | | | | 423,890 | | |
Semiconductor Manufacturing
International Corp.(a) | | | 1,881,000 | | | | 162,695 | | |
SINA Corp.(a) | | | 2,287 | | | | 156,271 | | |
Sino Biopharmaceutical Ltd. | | | 1,488,000 | | | | 1,388,195 | | |
Sinopec Engineering Group Co.
Ltd., Class H | | | 753,500 | | | | 942,513 | | |
Tencent Holdings Ltd. | | | 52,300 | | | | 4,199,482 | | |
Vipshop Holdings Ltd., ADS(a) | | | 6,969 | | | | 915,169 | | |
Wasion Group Holdings Ltd. | | | 1,432,000 | | | | 844,451 | | |
WuXi PharmaTech (Cayman), Inc. ADR(a) | | | 55,110 | | | | 2,119,531 | | |
Zhuzhou CSR Times Electric Co., Ltd.,
Class H | | | 481,500 | | | | 1,530,939 | | |
Total | | | | | 30,447,353 | | |
Denmark 1.6% | |
Novo Nordisk A/S, Class B | | | 200,561 | | | | 9,559,710 | | |
Pandora A/S | | | 37,508 | | | | 2,541,927 | | |
Total | | | | | 12,101,637 | | |
Finland 0.3% | |
KONE OYJ, Class B | | | 62,706 | | | | 2,554,182 | | |
France 13.2% | |
Airbus Group NV | | | 148,326 | | | | 10,930,771 | | |
AtoS | | | 70,720 | | | | 6,876,965 | | |
BNP Paribas SA | | | 132,126 | | | | 10,843,932 | | |
Essilor International SA | | | 35,827 | | | | 3,741,540 | | |
Groupe Eurotunnel SA | | | 424,922 | | | | 5,106,243 | | |
Iliad SA | | | 28,748 | | | | 7,011,610 | | |
The accompanying Notes to Financial Statements are an integral part of this statement.
Annual Report 2014
10
Columbia Multi-Advisor International Equity Fund
Portfolio of Investments (continued)
February 28, 2014
Common Stocks (continued)
Issuer | | Shares | | Value ($) | |
L'Oreal SA | | | 34,211 | | | | 5,796,434 | | |
Legrand SA | | | 157,900 | | | | 9,792,468 | | |
Numericable Group(a) | | | 64,922 | | | | 2,697,317 | | |
Publicis Groupe SA | | | 85,897 | | | | 8,157,180 | | |
Renault SA | | | 94,922 | | | | 9,461,017 | | |
Societe Generale SA | | | 78,481 | | | | 5,240,336 | | |
Thales SA | | | 67,033 | | | | 4,450,485 | | |
Vivendi SA | | | 330,717 | | | | 9,456,165 | | |
Total | | | | | 99,562,463 | | |
Germany 10.5% | |
Allianz SE, Registered Shares | | | 56,811 | | | | 10,170,587 | | |
BASF SE | | | 92,805 | | | | 10,686,000 | | |
Bayer AG, Registered Shares | | | 94,292 | | | | 13,392,567 | | |
Bayerische Motoren Werke AG | | | 83,595 | | | | 9,715,519 | | |
Brenntag AG | | | 48,644 | | | | 9,047,564 | | |
Continental AG | | | 32,864 | | | | 7,999,622 | | |
Fresenius Medical Care AG & Co. KGaA | | | 67,402 | | | | 4,661,984 | | |
ProSiebenSat.1 Media AG, Registered
Shares | | | 171,940 | | | | 8,199,711 | | |
SAP AG | | | 69,058 | | | | 5,578,172 | | |
Total | | | | | 79,451,726 | | |
Hong Kong 1.8% | |
AIA Group Ltd. | | | 351,000 | | | | 1,719,740 | | |
Cheung Kong Holdings Ltd. | | | 87,000 | | | | 1,366,111 | | |
Galaxy Entertainment Group Ltd.(a) | | | 299,000 | | | | 3,011,533 | | |
Hutchison Whampoa Ltd. | | | 226,000 | | | | 3,052,861 | | |
Kerry Logistics Network Ltd.(a) | | | 510,000 | | | | 835,920 | | |
Sands China Ltd. | | | 432,800 | | | | 3,634,308 | | |
Total | | | | | 13,620,473 | | |
India 1.7% | |
Eicher Motors Ltd. | | | 6,003 | | | | 497,858 | | |
HCL Technologies Ltd. | | | 104,026 | | | | 2,644,472 | | |
HDFC Bank Ltd., ADR | | | 34,229 | | | | 1,149,752 | | |
ICICI Bank Ltd., ADR | | | 10,934 | | | | 390,125 | | |
ITC Ltd. | | | 166,089 | | | | 879,487 | | |
Just Dial Ltd.(a) | | | 15,485 | | | | 359,314 | | |
Lupin Ltd. | | | 82,562 | | | | 1,326,137 | | |
Motherson Sumi Systems Ltd. | | | 644,460 | | | | 2,414,636 | | |
Tata Motors Ltd. | | | 353,188 | | | | 2,396,406 | | |
Tech Mahindra Ltd. | | | 12,600 | | | | 380,203 | | |
Total | | | | | 12,438,390 | | |
Common Stocks (continued)
Issuer | | Shares | | Value ($) | |
Indonesia 0.6% | |
PT Bank Negara Indonesia Persero Tbk | | | 641,100 | | | | 252,253 | | |
PT Bank Rakyat Indonesia Persero Tbk | | | 2,669,500 | | | | 2,140,977 | | |
PT Bank Tabungan Pensiunan
Nasional Tbk(a) | | | 551,400 | | | | 201,010 | | |
PT Matahari Department Store Tbk(a) | | | 934,000 | | | | 1,129,654 | | |
PT Nippon Indosari Corpindo Tbk | | | 2,087,500 | | | | 207,241 | | |
PT Sumber Alfaria Trijaya Tbk | | | 4,906,000 | | | | 188,481 | | |
Total | | | | | 4,119,616 | | |
Ireland 0.9% | |
Bank of Ireland(a) | | | 12,903,686 | | | | 6,928,464 | | |
Italy 1.2% | |
Intesa Sanpaolo SpA | | | 2,805,287 | | | | 8,696,823 | | |
Japan 13.8% | |
Alps Electric Co., Ltd.(a) | | | 100,000 | | | | 1,294,929 | | |
Aoyama Trading Co., Ltd. | | | 74,300 | | | | 1,832,598 | | |
Astellas Pharma, Inc. | | | 44,200 | | | | 2,873,035 | | |
Central Japan Railway Co. | | | 20,200 | | | | 2,357,585 | | |
Daiichikosho Co., Ltd. | | | 102,300 | | | | 3,079,791 | | |
Denso Corp. | | | 62,200 | | | | 3,337,109 | | |
Enplas Corp. | | | 23,600 | | | | 1,548,681 | | |
Fuji Heavy Industries Ltd. | | | 132,600 | | | | 3,599,372 | | |
Glory Ltd. | | | 76,800 | | | | 2,010,326 | | |
Hikari Tsushin, Inc. | | | 12,100 | | | | 1,049,191 | | |
Hino Motors Ltd. | | | 216,400 | | | | 3,211,463 | | |
Hoshizaki Electric Co., Ltd. | | | 60,500 | | | | 2,258,207 | | |
Hulic REIT, Inc.(a) | | | 766 | | | | 1,040,200 | | |
Iriso Electronics Co., Ltd. | | | 22,600 | | | | 1,138,807 | | |
IT Holdings Corp. | | | 125,100 | | | | 2,161,319 | | |
ITOCHU Corp. | | | 364,000 | | | | 4,536,135 | | |
Japan Tobacco, Inc. | | | 67,900 | | | | 2,162,597 | | |
Kakaku.com, Inc. | | | 50,600 | | | | 844,991 | | |
Kanamoto Co., Ltd. | | | 79,600 | | | | 2,265,696 | | |
KDDI Corp. | | | 58,900 | | | | 3,602,068 | | |
Lawson, Inc. | | | 14,700 | | | | 1,022,118 | | |
M3, Inc. | | | 532 | | | | 1,772,884 | | |
Mazda Motor Corp.(a) | | | 170,000 | | | | 821,102 | | |
Mitsubishi UFJ Financial Group, Inc. | | | 966,800 | | | | 5,602,272 | | |
Mitsui & Co., Ltd. | | | 195,800 | | | | 3,018,410 | | |
MS&AD Insurance Group Holdings, Inc. | | | 129,000 | | | | 3,065,205 | | |
The accompanying Notes to Financial Statements are an integral part of this statement.
Annual Report 2014
11
Columbia Multi-Advisor International Equity Fund
Portfolio of Investments (continued)
February 28, 2014
Common Stocks (continued)
Issuer | | Shares | | Value ($) | |
NAC Co., Ltd. | | | 83,400 | | | | 1,341,398 | | |
Nakanishi, Inc. | | | 4,800 | | | | 780,426 | | |
Namura Shipbuilding Co., Ltd. | | | 158,100 | | | | 1,626,420 | | |
Nidec Corp. | | | 24,400 | | | | 3,000,423 | | |
Nihon M&A Center, Inc. | | | 800 | | | | 64,541 | | |
Olympus Corp.(a) | | | 38,800 | | | | 1,348,101 | | |
Omron Corp. | | | 60,000 | | | | 2,530,612 | | |
ORIX Corp. | | | 72,580 | | | | 1,076,405 | | |
Otsuka Corp. | | | 8,700 | | | | 1,118,482 | | |
PeptiDream, Inc.(a) | | | 7,500 | | | | 742,030 | | |
Pigeon Corp. | | | 23,200 | | | | 1,046,818 | | |
Raito Kogyo Co., Ltd. | | | 304,900 | | | | 2,501,152 | | |
Rakuten, Inc. | | | 101,700 | | | | 1,462,011 | | |
Resorttrust, Inc. | | | 55,700 | | | | 928,544 | | |
San-A Co., Ltd. | | | 58,700 | | | | 1,658,752 | | |
Shinmaywa Industries Ltd. | | | 156,000 | | | | 1,355,890 | | |
SoftBank Corp. | | | 41,100 | | | | 3,114,695 | | |
Sumitomo Mitsui Financial Group, Inc. | | | 115,500 | | | | 5,185,725 | | |
Sun Frontier Fudousan Co., Ltd. | | | 82,400 | | | | 1,030,886 | | |
T&D Holdings, Inc. | | | 73,400 | | | | 902,584 | | |
Temp Holdings Co., Ltd. | | | 33,700 | | | | 996,475 | | |
Tokyo Gas Co., Ltd. | | | 423,000 | | | | 2,124,955 | | |
Tokyo Tatemono Co., Ltd. | | | 143,000 | | | | 1,167,993 | | |
Toyota Motor Corp. | | | 92,500 | | | | 5,323,664 | | |
Total | | | | | 103,935,073 | | |
Malaysia 0.3% | |
Tenaga Nasional Bhd | | | 612,500 | | | | 2,244,540 | | |
Malta —% | |
BGP Holdings PLC(a)(b)(c) | | | 2,232,232 | | | | 3 | | |
Mexico 0.3% | |
Alfa SAB de CV, Class A | | | 266,600 | | | | 642,739 | | |
Cemex SAB de CV, ADR(a) | | | 36,032 | | | | 471,299 | | |
Grupo Financiero Banorte SAB de CV,
Class O | | | 129,300 | | | | 837,087 | | |
Total | | | | | 1,951,125 | | |
Netherlands 5.2% | |
Aegon NV | | | 818,790 | | | | 7,378,920 | | |
| ASML Holding NV | | | 83,274 | | | | 7,247,164 | | |
Gemalto NV | | | 53,273 | | | | 5,992,918 | | |
Common Stocks (continued)
Issuer | | Shares | | Value ($) | |
ING Groep NV-CVA(a) | | | 730,268 | | | | 10,654,446 | | |
Reed Elsevier NV | | | 361,473 | | | | 7,923,188 | | |
Total | | | | | 39,196,636 | | |
Norway 0.8% | |
DNB ASA | | | 325,986 | | | | 5,914,674 | | |
Panama —% | |
Copa Holdings SA, Class A | | | 1,047 | | | | 141,827 | | |
Peru 0.1% | |
Credicorp Ltd. | | | 5,238 | | | | 680,416 | | |
Philippines 1.0% | |
GT Capital Holdings, Inc. | | | 154,500 | | | | 2,770,206 | | |
Metropolitan Bank & Trust Co. | | | 1,019,258 | | | | 1,876,284 | | |
Robinsons Retail Holdings, Inc.(a) | | | 843,620 | | | | 1,263,493 | | |
Universal Robina Corp. | | | 79,070 | | | | 248,574 | | |
Vista Land & Lifescapes, Inc. | | | 9,068,400 | | | | 1,098,654 | | |
Total | | | | | 7,257,211 | | |
Poland —% | |
Eurocash SA | | | 18,248 | | | | 240,659 | | |
Russian Federation 0.4% | |
Lukoil OAO, ADR | | | 10,813 | | | | 587,578 | | |
Magnit OJSC, GDR(d) | | | 8,425 | | | | 471,800 | | |
Mail.ru Group Ltd., GDR(d) | | | 16,208 | | | | 687,219 | | |
Mobile Telesystems OJSC, ADR | | | 14,502 | | | | 249,725 | | |
NovaTek OAO | | | 55,490 | | | | 633,544 | | |
Sberbank of Russia(c) | | | 122,557 | | | | 310,290 | | |
Yandex NV, Class A(a) | | | 4,932 | | | | 184,950 | | |
Total | | | | | 3,125,106 | | |
Singapore 0.5% | |
DBS Group Holdings Ltd. | | | 205,000 | | | | 2,674,254 | | |
Wing Tai Holdings Ltd. | | | 920,000 | | | | 1,344,045 | | |
Total | | | | | 4,018,299 | | |
South Africa 0.2% | |
AVI Ltd. | | | 66,485 | | | | 316,303 | | |
Clicks Group Ltd. | | | 37,718 | | | | 196,922 | | |
Naspers Ltd., Class N | | | 7,157 | | | | 863,220 | | |
Total | | | | | 1,376,445 | | |
The accompanying Notes to Financial Statements are an integral part of this statement.
Annual Report 2014
12
Columbia Multi-Advisor International Equity Fund
Portfolio of Investments (continued)
February 28, 2014
Common Stocks (continued)
Issuer | | Shares | | Value ($) | |
South Korea 2.5% | |
Hotel Shilla Co., Ltd. | | | 28,071 | | | | 2,195,354 | | |
Hyundai Motor Co. | | | 15,103 | | | | 3,469,934 | | |
Kia Motors Corp. | | | 6,780 | | | | 352,264 | | |
LG Uplus Corp. | | | 33,970 | | | | 332,937 | | |
NAVER Corp. | | | 2,663 | | | | 2,036,008 | | |
Posco ICT Co., Ltd. | | | 15,593 | | | | 109,375 | | |
Samchuly Bicycle Co., Ltd. | | | 7,823 | | | | 131,810 | | |
Samsung Electronics Co., Ltd. | | | 5,505 | | | | 6,973,752 | | |
Samsung SDI Co., Ltd. | | | 2,549 | | | | 358,034 | | |
SK Telecom Co., Ltd. | | | 13,943 | | | | 2,837,200 | | |
Suprema, Inc.(a) | | | 14,322 | | | | 355,481 | | |
Total | | | | | 19,152,149 | | |
Spain 2.6% | |
Amadeus IT Holding SA, Class A | | | 142,691 | | | | 6,276,017 | | |
Banco Popular Espanol SA | | | 499,589 | | | | 3,602,381 | | |
Bankinter SA | | | 587,521 | | | | 4,762,741 | | |
Inditex SA | | | 34,499 | | | | 4,966,660 | | |
Total | | | | | 19,607,799 | | |
Sweden 2.1% | |
Investment AB Kinnevik, Class B | | | 109,163 | | | | 4,237,703 | | |
Nordea Bank AB | | | 484,834 | | | | 6,945,483 | | |
| SKF AB B Shares | | | 164,174 | | | | 4,396,478 | | |
Total | | | | | 15,579,664 | | |
Switzerland 5.5% | |
Adecco SA, Registered Shares | | | 82,067 | | | | 7,086,968 | | |
Cie Financiere Richemont SA, Class A,
Registered Shares | | | 64,990 | | | | 6,473,137 | | |
Roche Holding AG, Genusschein Shares | | | 51,823 | | | | 15,991,771 | | |
UBS AG, Registered Shares | | | 559,624 | | | | 12,006,941 | | |
Total | | | | | 41,558,817 | | |
Taiwan 2.0% | |
Airtac International Group | | | 34,730 | | | | 356,015 | | |
Cathay Financial Holding Co., Ltd. | | | 284,000 | | | | 421,416 | | |
Delta Electronics, Inc. | | | 227,000 | | | | 1,269,615 | | |
Eclat Textile Co., Ltd. | | | 16,000 | | | | 204,590 | | |
Gigabyte Technology Co., Ltd. | | | 1,118,000 | | | | 1,664,031 | | |
Hermes Microvision, Inc. | | | 39,000 | | | | 1,457,973 | | |
Himax Technologies, Inc., ADR | | | 13,505 | | | | 186,504 | | |
MediaTek, Inc. | | | 142,000 | | | | 2,093,330 | | |
Common Stocks (continued)
Issuer | | Shares | | Value ($) | |
Merida Industry Co., Ltd. | | | 230,000 | | | | 1,547,647 | | |
Merry Electronics Co., Ltd. | | | 59,000 | | | | 328,351 | | |
St. Shine Optical Co., Ltd. | | | 60,000 | | | | 1,675,551 | | |
Taiwan Semiconductor Manufacturing
Co., Ltd. | | | 132,049 | | | | 476,341 | | |
Taiwan Semiconductor Manufacturing
Co., Ltd., ADR | | | 106,833 | | | | 1,930,472 | | |
Tong Hsing Electronic Industries Ltd. | | | 269,000 | | | | 1,417,925 | | |
Total | | | | | 15,029,761 | | |
Thailand 0.8% | |
Advanced Information Service PCL,
Foreign Registered Shares | | | 212,700 | | | | 1,379,095 | | |
Bangkok Expressway PCL,
Foreign Registered Shares | | | 1,441,400 | | | | 1,460,507 | | |
Kasikornbank PCL, Foreign Registered
Shares | | | 252,300 | | | | 1,341,234 | | |
PTT Global Chemical PCL, Foreign
Registered Shares | | | 831,852 | | | | 1,916,604 | | |
Robinson Department Store PCL,
Foreign Registered Shares | | | 186,800 | | | | 272,641 | | |
Total | | | | | 6,370,081 | | |
Turkey 0.1% | |
Arcelik AS | | | 73,477 | | | | 393,938 | | |
United Kingdom 17.1% | |
Ashtead Group PLC | | | 387,023 | | | | 5,677,266 | | |
BG Group PLC | | | 412,257 | | | | 7,514,410 | | |
BT Group PLC | | | 1,186,838 | | | | 8,144,450 | | |
Diageo PLC | | | 124,086 | | | | 3,903,304 | | |
easyJet PLC | | | 252,888 | | | | 7,287,985 | | |
GKN PLC | | | 712,367 | | | | 4,839,575 | | |
HSBC Holdings PLC, ADR | | | 14,426 | | | | 761,549 | | |
IMI PLC | | | 200,288 | | | | 5,114,735 | | |
Intercontinental Hotels Group PLC | | | 152,983 | | | | 4,974,974 | | |
International Consolidated Airlines
Group SA(a) | | | 609,046 | | | | 4,456,870 | | |
Johnson Matthey PLC | | | 122,973 | | | | 6,717,259 | | |
Legal & General Group PLC | | | 2,079,845 | | | | 8,372,667 | | |
Lloyds Banking Group PLC(a) | | | 4,109,093 | | | | 5,678,795 | | |
Lonmin PLC(a) | | | 25,890 | | | | 130,669 | | |
Persimmon PLC | | | 353,687 | | | | 8,564,180 | | |
Prudential PLC | | | 317,614 | | | | 7,206,715 | | |
Rio Tinto PLC | | | 83,623 | | | | 4,806,563 | | |
Schroders PLC | | | 66,290 | | | | 3,011,592 | | |
The accompanying Notes to Financial Statements are an integral part of this statement.
Annual Report 2014
13
Columbia Multi-Advisor International Equity Fund
Portfolio of Investments (continued)
February 28, 2014
Common Stocks (continued)
Issuer | | Shares | | Value ($) | |
Smith & Nephew PLC | | | 223,901 | | | | 3,567,494 | | |
St. James's Place PLC | | | 436,977 | | | | 6,402,727 | | |
Travis Perkins PLC | | | 163,978 | | | | 5,368,225 | | |
Vodafone Group PLC | | | 2,733,330 | | | | 11,396,978 | | |
Wolseley PLC | | | 92,570 | | | | 5,388,258 | | |
Total | | | | | 129,287,240 | | |
United States 0.7% | |
Cognizant Technology Solutions Corp.,
Class A(a) | | | 4,647 | | | | 483,567 | | |
Verizon Communications, Inc. | | | 104,180 | | | | 4,940,215 | | |
Total | | | | | 5,423,782 | | |
Total Common Stocks
(Cost: $550,005,474) | | | | | 730,478,902 | | |
Money Market Funds 1.6%
| | | Shares | | Value ($) | |
Columbia Short-Term Cash Fund,
0.098%(e)(f) | | | 12,324,034 | | | | 12,324,034 | | |
Total Money Market Funds
(Cost: $12,324,034) | | | | | 12,324,034 | | |
Total Investments
(Cost: $562,329,508) | | | | | 742,802,936 | | |
Other Assets & Liabilities, Net | | | | | 12,062,540 | | |
Net Assets | | | | | 754,865,476 | | |
Investments in Derivatives
Forward Foreign Currency Exchange Contracts Open at February 28, 2014
Counterparty | | Exchange Date | | Currency to
be Delivered | | Currency to
be Received | | Unrealized
Appreciation ($) | | Unrealized
Depreciation ($) | |
Barclays Capital | | 03/27/14
| | | 25,763,000
EUR | | | | 35,005,048
USD | | | | —
| | | | (555,029
| ) | |
Barclays Capital | | 03/27/14
| | | 18,695,553,000
KRW | | | | 17,253,187
USD | | | | —
| | | | (189,521
| ) | |
Barclays Capital | | 03/27/14
| | | 291,615,000
PHP | | | | 6,425,361
USD | | | | —
| | | | (101,241
| ) | |
Barclays Capital | | 03/27/14
| | | 213,353,000
THB | | | | 6,423,586
USD | | | | —
| | | | (107,531
| ) | |
Barclays Capital | | 03/27/14
| | | 573,762,000
TWD | | | | 18,943,402
USD | | | | 4,674
| | | | —
| | |
Barclays Capital | | 03/27/14
| | | 32,165,228
USD | | | | 36,759,000
AUD | | | | 584,251
| | | | —
| | |
Barclays Capital | | 03/27/14
| | | 1,437,814
USD | | | | 3,467,000
BRL | | | | 31,055
| | | | —
| | |
Barclays Capital | | 03/27/14
| | | 23,267,265
USD | | | | 20,958,000
CHF | | | | 566,546
| | | | —
| | |
Barclays Capital | | 03/27/14
| | | 25,462,280
USD | | | | 15,446,000
GBP | | | | 398,220
| | | | —
| | |
Barclays Capital | | 03/27/14
| | | 1,453,556
USD | | | | 17,482,639,000
IDR | | | | 51,805
| | | | — | | |
Barclays Capital | | 03/27/14
| | | 4,018,558
USD | | | | 14,049,000
ILS | | | | 7,891
| | | | — | | |
Barclays Capital | | 03/27/14
| | | 16,713,604
USD | | | | 1,715,384,000
JPY | | | | 143,926
| | | | — | | |
Barclays Capital | | 03/27/14
| | | 3,180,042
USD | | | | 3,910,000
NZD | | | | 92,407
| | | | — | | |
Barclays Capital | | 03/27/14
| | | 7,817,325
USD | | | | 50,909,000
SEK | | | | 119,602
| | | | — | | |
Barclays Capital | | 03/27/14
| | | 8,056,002
USD | | | | 10,271,000
SGD | | | | 46,441
| | | | — | | |
Total | | | | | | | | | 2,046,818 | | | | (953,322 | ) | |
The accompanying Notes to Financial Statements are an integral part of this statement.
Annual Report 2014
14
Columbia Multi-Advisor International Equity Fund
Portfolio of Investments (continued)
February 28, 2014
Futures Contracts Outstanding at February 28, 2014
At February 28, 2014, cash totaling $623,760 was pledged as collateral to cover initial margin requirements on open futures contracts.
Contract Description | | Number of
Contracts
Long (Short) | | Trading
Currency | | Notional
Market
Value ($) | | Expiration
Date | | Unrealized
Appreciation ($) | | Unrealized
Depreciation ($) | |
EMINI MSCI EAFE INDEX | | | 113 | | | USD | | | | | 10,900,545 | | | 03/2014 | | | 592,514 | | | | — | | |
Notes to Portfolio of Investments
(a) Non-income producing.
(b) Identifies issues considered by the Investment Manager to be illiquid as to their marketability. The aggregate value of such securities at February 28, 2014 was $234,326, representing 0.03% of net assets. Information concerning such security holdings at February 28, 2014 is as follows:
Security Description | | Acquisition Dates | | Cost ($) | |
BGP Holdings PLC | | 02/04/09 – 05/14/09 | | | — | | |
China Milk Products Group Ltd. | | 09/11/06 – 07/02/09 | | | 4,479,619 | | |
(c) Represents fair value as determined in good faith under procedures approved by the Board of Trustees. At February 28, 2014, the value of these securities amounted to $544,616, which represents 0.07% of net assets.
(d) Security exempt from registration pursuant to Rule 144A under the Securities Act of 1933. This security may be resold in transactions exempt from registration, normally to qualified institutional buyers. At February 28, 2014, the value of these securities amounted to $1,159,019 or 0.15% of net assets.
(e) The rate shown is the seven-day current annualized yield at February 28, 2014.
(f) As defined in the Investment Company Act of 1940, an affiliated company is one in which the Fund owns 5% or more of its outstanding voting securities, or a company which is under common ownership or control with the Fund. Holdings and transactions in these affiliated companies during the year ended February 28, 2014, are as follows:
Issuer | | Beginning
Cost ($) | | Purchase
Cost ($) | | Proceeds
From Sales ($) | | Ending
Cost ($) | | Dividends —
Affiliated
Issuers ($) | | Value ($) | |
Columbia Short-Term Cash Fund | | | 24,514,286 | | | | 639,692,778 | | | | (651,883,030 | ) | | | 12,324,034 | | | | 23,336 | | | | 12,324,034 | | |
Abbreviation Legend
ADR American Depositary Receipt
ADS American Depositary Share
GDR Global Depositary Receipt
Currency Legend
AUD Australian Dollar
BRL Brazilian Real
CHF Swiss Franc
EUR Euro
GBP British Pound
IDR Indonesian Rupiah
ILS Israeli Shekel
The accompanying Notes to Financial Statements are an integral part of this statement.
Annual Report 2014
15
Columbia Multi-Advisor International Equity Fund
Portfolio of Investments (continued)
February 28, 2014
Currency Legend (continued)
JPY Japanese Yen
KRW Korean Won
NZD New Zealand Dollar
PHP Philippine Peso
SEK Swedish Krona
SGD Singapore Dollar
THB Thailand Baht
TWD Taiwan Dollar
USD US Dollar
Fair Value Measurements
Generally accepted accounting principles (GAAP) require disclosure regarding the inputs and valuation techniques used to measure fair value and any changes in valuation inputs or techniques. In addition, investments shall be disclosed by major category.
The Fund categorizes its fair value measurements according to a three-level hierarchy that maximizes the use of observable inputs and minimizes the use of unobservable inputs by prioritizing that the most observable input be used when available. Observable inputs are those that market participants would use in pricing an investment based on market data obtained from sources independent of the reporting entity. Unobservable inputs are those that reflect the Fund's assumptions about the information market participants would use in pricing an investment. An investment's level within the fair value hierarchy is based on the lowest level of any input that is deemed significant to the asset or liability's fair value measurement. The input levels are not necessarily an indication of the risk or liquidity associated with investments at that level. For example, certain U.S. government securities are generally high quality and liquid, however, they are reflected as Level 2 because the inputs used to determine fair value may not always be quoted prices in an active market.
Fair value inputs are summarized in the three broad levels listed below:
> Level 1 — Valuations based on quoted prices for investments in active markets that the Fund has the ability to access at the measurement date (including NAV for open-end mutual funds). Valuation adjustments are not applied to Level 1 investments.
> Level 2 — Valuations based on other significant observable inputs (including quoted prices for similar securities, interest rates, prepayment speeds, credit risks, etc.).
> Level 3 — Valuations based on significant unobservable inputs (including the Fund's own assumptions and judgment in determining the fair value of investments).
Inputs that are used in determining fair value of an investment may include price information, credit data, volatility statistics, and other factors. These inputs can be either observable or unobservable. The availability of observable inputs can vary between investments, and is affected by various factors such as the type of investment, and the volume and level of activity for that investment or similar investments in the marketplace. The inputs will be considered by the Investment Manager, along with any other relevant factors in the calculation of an investment's fair value. The Fund uses prices and inputs that are current as of the measurement date, which may include periods of market dislocations. During these periods, the availability of prices and inputs may be reduced for many investments. This condition could cause an investment to be reclassified between the various levels within the hierarchy.
Foreign equity securities actively traded in markets where there is a significant delay in the local close relative to the New York Stock Exchange (NYSE) are classified as Level 2. The values of these securities may include an adjustment to reflect the impact of significant market movements following the close of local trading, as described in Note 2 to the financial statements — Security Valuation.
Investments falling into the Level 3 category are primarily supported by quoted prices from brokers and dealers participating in the market for those investments. However, these may be classified as Level 3 investments due to lack of market transparency and corroboration to support these quoted prices. Additionally, valuation models may be used as the pricing source for any remaining investments classified as Level 3. These models may rely on one or more significant unobservable inputs and/or significant assumptions by the Investment Manager. Inputs used in valuations may include, but are not limited to, financial statement analysis, capital account balances, discount rates and estimated cash flows, and comparable company data.
Under the direction of the Fund's Board of Trustees (the Board), the Investment Manager's Valuation Committee (the Committee) is responsible for overseeing the valuation procedures approved by the Board. The Committee consists of voting and non-voting members from various groups within the Investment Manager's organization, including operations and accounting, trading and investments, compliance, risk management and legal.
The accompanying Notes to Financial Statements are an integral part of this statement.
Annual Report 2014
16
Columbia Multi-Advisor International Equity Fund
Portfolio of Investments (continued)
February 28, 2014
Fair Value Measurements (continued)
The Committee meets at least monthly to review and approve valuation matters, which may include a description of specific valuation determinations, data regarding pricing information received from approved pricing vendors and brokers and the results of Board-approved valuation control policies and procedures (the Policies). The Policies address, among other things, instances when market quotations are or are not readily available, including recommendations of third party pricing vendors and a determination of appropriate pricing methodologies; events that require specific valuation determinations and assessment of fair value techniques; securities with a potential for stale pricing, including those that are illiquid, restricted, or in default; and the effectiveness of third party pricing vendors, including periodic reviews of vendors. The Committee meets more frequently, as needed, to discuss additional valuation matters, which may include the need to review back-testing results, review time-sensitive information or approve related valuation actions. The Committee reports to the Board, with members of the Committee meeting with the Board at each of its regularly scheduled meetings to discuss valuation matters and actions during the period, similar to those described earlier.
For investments categorized as Level 3, the Committee monitors information similar to that described above, which may include: (i) data specific to the issuer or comparable issuers, (ii) general market or specific sector news and (iii) quoted prices and specific or similar security transactions. The Committee considers this data and any changes from prior periods in order to assess the reasonableness of observable and unobservable inputs, any assumptions or internal models used to value those securities and changes in fair value. This data is also used to corroborate, when available, information received from approved pricing vendors and brokers. Various factors impact the frequency of monitoring this information (which may occur as often as daily). However, the Committee may determine that changes to inputs, assumptions and models are not required as a result of the monitoring procedures performed.
The following table is a summary of the inputs used to value the Fund's investments at February 28, 2014:
Description | | Level 1
Quoted Prices in Active
Markets for Identical
Assets ($) | | Level 2
Other Significant
Observable Inputs ($) | | Level 3
Significant
Unobservable Inputs ($) | | Total ($) | |
Equity Securities | |
Common Stocks | |
Consumer Discretionary | | | 1,865,835 | | | | 131,815,237 | | | | — | | | | 133,681,072 | | |
Consumer Staples | | | 1,211,479 | | | | 30,938,708 | | | | 234,323 | | | | 32,384,510 | | |
Energy | | | 1,123,591 | | | | 9,539,762 | | | | — | | | | 10,663,353 | | |
Financials | | | 3,818,929 | | | | 186,240,303 | | | | 3 | | | | 190,059,235 | | |
Health Care | | | 2,119,530 | | | | 64,365,151 | | | | — | | | | 66,484,681 | | |
Industrials | | | 1,238,921 | | | | 126,881,550 | | | | — | | | | 128,120,471 | | |
Information Technology | | | 4,409,285 | | | | 70,622,210 | | | | — | | | | 75,031,495 | | |
Materials | | | 471,299 | | | | 29,731,828 | | | | — | | | | 30,203,127 | | |
Telecommunication Services | | | 998,447 | | | | 55,319,022 | | | | — | | | | 56,317,469 | | |
Utilities | | | — | | | | 7,533,489 | | | | — | | | | 7,533,489 | | |
Total Equity Securities | | | 17,257,316 | | | | 712,987,260 | | | | 234,326 | | | | 730,478,902 | | |
Mutual Funds | |
Money Market Funds | | | 12,324,034 | | | | — | | | | — | | | | 12,324,034 | | |
Total Mutual Funds | | | 12,324,034 | | | | — | | | | — | | | | 12,324,034 | | |
Investments in Securities | | | 29,581,350 | | | | 712,987,260 | | | | 234,326 | | | | 742,802,936 | | |
Derivatives | |
Assets | |
Forward Foreign Currency
Exchange Contracts | | | — | | | | 2,046,818 | | | | — | | | | 2,046,818 | | |
Futures Contracts | | | 592,514 | | | | — | | | | — | | | | 592,514 | | |
Liabilities | |
Forward Foreign Currency
Exchange Contracts | | | — | | | | (953,322 | ) | | | — | | | | (953,322 | ) | |
Total | | | 30,173,864 | | | | 714,080,756 | | | | 234,326 | | | | 744,488,946 | | |
See the Portfolio of Investments for all investment classifications not indicated in the table.
The accompanying Notes to Financial Statements are an integral part of this statement.
Annual Report 2014
17
Columbia Multi-Advisor International Equity Fund
Portfolio of Investments (continued)
February 28, 2014
Fair Value Measurements (continued)
The Fund's assets assigned to the Level 2 input category are generally valued using the market approach, in which a security's value is determined through reference to prices and information from market transactions for similar or identical assets. These assets include certain foreign securities for which a third party statistical pricing service may be employed for purposes of fair market valuation. The models utilized by the third party statistical pricing service take into account a security's correlation to available market data including, but not limited to, intraday index, ADR, and ETF movements.
There were no transfers of financial assets between levels during the period.
Derivative instruments are valued at unrealized appreciation (depreciation).
The Fund's assets assigned to the Level 3 category are valued utilizing the valuation technique deemed the most appropriate in the circumstances. Certain common stocks classified as Level 3 securities are valued using the market approach. To determine fair value for these securities, management considered various factors which may have included, but were not limited to, the halt price of the security, the movement in observed market prices for other securities from the issuer, the movement in certain foreign or domestic market indices, and the position of the security within the respective company's capital structure. Significant increases (decreases) to any of these inputs would result in a significantly lower (higher) fair value measurement.
The Fund does not hold any significant investments with unobservable inputs which are categorized as Level 3.
Transfers in and/or out of Level 3 are determined based on the fair value at the beginning of the period for security positions held throughout the period.
The accompanying Notes to Financial Statements are an integral part of this statement.
Annual Report 2014
18
Columbia Multi-Advisor International Equity Fund
Statement of Assets and Liabilities
February 28, 2014
Assets | |
Investments, at value | |
Unaffiliated issuers (identified cost $550,005,474) | | $ | 730,478,902 | | |
Affiliated issuers (identified cost $12,324,034) | | | 12,324,034 | | |
Total investments (identified cost $562,329,508) | | | 742,802,936 | | |
Foreign currency (identified cost $2,354,810) | | | 2,354,720 | | |
Margin deposits | | | 623,760 | | |
Unrealized appreciation on forward foreign currency exchange contracts | | | 2,046,818 | | |
Receivable for: | |
Investments sold | | | 13,018,787 | | |
Capital shares sold | | | 415,720 | | |
Dividends | | | 3,883,337 | | |
Reclaims | | | 2,072,492 | | |
Variation margin | | | 20,340 | | |
Prepaid expenses | | | 1,552 | | |
Trustees' deferred compensation plan | | | 98,964 | | |
Total assets | | | 767,339,426 | | |
Liabilities | |
Disbursements in excess of cash | | | 578,608 | | |
Unrealized depreciation on forward foreign currency exchange contracts | | | 953,322 | | |
Payable for: | |
Investments purchased | | | 9,762,515 | | |
Capital shares purchased | | | 640,346 | | |
Investment management fees | | | 15,884 | | |
Distribution and/or service fees | | | 3,758 | | |
Transfer agent fees | | | 92,951 | | |
Administration fees | | | 1,606 | | |
Plan administration fees | | | 22 | | |
Compensation of board members | | | 159,502 | | |
Other expenses | | | 166,472 | | |
Trustees' deferred compensation plan | | | 98,964 | | |
Total liabilities | | | 12,473,950 | | |
Net assets applicable to outstanding capital stock | | $ | 754,865,476 | | |
The accompanying Notes to Financial Statements are an integral part of this statement.
Annual Report 2014
19
Columbia Multi-Advisor International Equity Fund
Statement of Assets and Liabilities (continued)
February 28, 2014
Represented by | |
Paid-in capital | | $ | 1,427,687,829 | | |
Excess of distributions over net investment income | | | (11,596,514 | ) | |
Accumulated net realized loss | | | (843,411,551 | ) | |
Unrealized appreciation (depreciation) on: | |
Investments | | | 180,473,428 | | |
Foreign currency translations | | | 26,274 | | |
Forward foreign currency exchange contracts | | | 1,093,496 | | |
Futures contracts | | | 592,514 | | |
Total — representing net assets applicable to outstanding capital stock | | $ | 754,865,476 | | |
Class A | |
Net assets | | $ | 316,823,394 | | |
Shares outstanding | | | 22,823,168 | | |
Net asset value per share | | $ | 13.88 | | |
Maximum offering price per share(a) | | $ | 14.73 | | |
Class B | |
Net assets | | $ | 4,260,323 | | |
Shares outstanding | | | 340,936 | | |
Net asset value per share | | $ | 12.50 | | |
Class C | |
Net assets | | $ | 12,561,892 | | |
Shares outstanding | | | 1,017,764 | | |
Net asset value per share | | $ | 12.34 | | |
Class I | |
Net assets | | $ | 18,815 | | |
Shares outstanding | | | 1,330 | | |
Net asset value per share | | $ | 14.15 | | |
Class K | |
Net assets | | $ | 111,149 | | |
Shares outstanding | | | 7,879 | | |
Net asset value per share | | $ | 14.11 | | |
Class R | |
Net assets | | $ | 1,632,259 | | |
Shares outstanding | | | 117,964 | | |
Net asset value per share | | $ | 13.84 | | |
Class R4 | |
Net assets | | $ | 6,600 | | |
Shares outstanding | | | 465 | | |
Net asset value per share(b) | | $ | 14.20 | | |
The accompanying Notes to Financial Statements are an integral part of this statement.
Annual Report 2014
20
Columbia Multi-Advisor International Equity Fund
Statement of Assets and Liabilities (continued)
February 28, 2014
Class R5 | |
Net assets | | $ | 14,318 | | |
Shares outstanding | | | 1,008 | | |
Net asset value per share(b) | | $ | 14.21 | | |
Class W | |
Net assets | | $ | 166,485,912 | | |
Shares outstanding | | | 11,991,876 | | |
Net asset value per share | | $ | 13.88 | | |
Class Y | |
Net assets | | $ | 15,701,384 | | |
Shares outstanding | | | 1,108,530 | | |
Net asset value per share | | $ | 14.16 | | |
Class Z | |
Net assets | | $ | 237,249,430 | | |
Shares outstanding | | | 16,808,910 | | |
Net asset value per share | | $ | 14.11 | | |
(a) The maximum offering price per share is calculated by dividing the net asset value per share by 1.0 minus the maximum sales charge of 5.75%.
(b) Net asset value per share rounds to this amount due to fractional shares outstanding.
The accompanying Notes to Financial Statements are an integral part of this statement.
Annual Report 2014
21
Columbia Multi-Advisor International Equity Fund
Statement of Operations
Year Ended February 28, 2014
Net investment income | |
Income: | |
Dividends — unaffiliated issuers | | $ | 25,945,908 | | |
Dividends — affiliated issuers | | | 23,336 | | |
Interest | | | 1,713 | | |
Foreign taxes withheld | | | (2,645,518 | ) | |
Total income | | | 23,325,439 | | |
Expenses: | |
Investment management fees | | | 6,937,792 | | |
Distribution and/or service fees | |
Class A | | | 772,378 | | |
Class B | | | 52,583 | | |
Class C | | | 124,358 | | |
Class R | | | 8,936 | | |
Class W | | | 707,844 | | |
Transfer agent fees | |
Class A | | | 695,497 | | |
Class B | | | 11,891 | | |
Class C | | | 27,994 | | |
Class K | | | 63 | | |
Class R | | | 4,015 | | |
Class R4 | | | 9 | | |
Class R5 | | | 2 | | |
Class W | | | 634,541 | | |
Class Z | | | 592,722 | | |
Administration fees | | | 700,784 | | |
Plan administration fees | |
Class K | | | 313 | | |
Compensation of board members | | | 50,202 | | |
Custodian fees | | | 279,124 | | |
Printing and postage fees | | | 189,656 | | |
Registration fees | | | 80,683 | | |
Professional fees | | | 117,881 | | |
Line of credit interest expense | | | 151 | | |
Other | | | 107,162 | | |
Total expenses | | | 12,096,581 | | |
Expense reductions | | | (28,863 | ) | |
Total net expenses | | | 12,067,718 | | |
Net investment income | | | 11,257,721 | | |
Realized and unrealized gain (loss) — net | |
Net realized gain (loss) on: | |
Investments | | | 150,851,895 | | |
Foreign currency translations | | | (1,740,444 | ) | |
Forward foreign currency exchange contracts | | | (24,938,890 | ) | |
Futures contracts | | | 932,385 | | |
Net realized gain | | | 125,104,946 | | |
Net change in unrealized appreciation (depreciation) on: | |
Investments | | | (19,252,184 | ) | |
Foreign currency translations | | | 124,956 | | |
Forward foreign currency exchange contracts | | | 5,373,299 | | |
Futures contracts | | | 616,902 | | |
Net change in unrealized appreciation (depreciation) | | | (13,137,027 | ) | |
Net realized and unrealized gain | | | 111,967,919 | | |
Net increase in net assets resulting from operations | | $ | 123,225,640 | | |
The accompanying Notes to Financial Statements are an integral part of this statement.
Annual Report 2014
22
Columbia Multi-Advisor International Equity Fund
Statement of Changes in Net Assets
| | | Year Ended
February 28,
2014 | | Year Ended
February 28,
2013(a) | |
Operations | |
Net investment income | | $ | 11,257,721 | | | $ | 19,732,163 | | |
Net realized gain | | | 125,104,946 | | | | 51,486,181 | | |
Net change in unrealized appreciation (depreciation) | | | (13,137,027 | ) | | | (26,672,600 | ) | |
Net increase in net assets resulting from operations | | | 123,225,640 | | | | 44,545,744 | | |
Distributions to shareholders | |
Net investment income | |
Class A | | | — | | | | (10,520,289 | ) | |
Class B | | | — | | | | (158,488 | ) | |
Class C | | | — | | | | (288,442 | ) | |
Class I | | | — | | | | (865,193 | ) | |
Class K | | | — | | | | (4,228 | ) | |
Class R | | | — | | | | (51,789 | ) | |
Class R4 | | | — | | | | (63 | ) | |
Class R5 | | | — | | | | (66 | ) | |
Class W | | | — | | | | (7,739,183 | ) | |
Class Y | | | — | | | | (582,398 | ) | |
Class Z | | | — | | | | (15,239,279 | ) | |
Total distributions to shareholders | | | — | | | | (35,449,418 | ) | |
Increase (decrease) in net assets from capital stock activity | | | (313,880,792 | ) | | | (867,104,937 | ) | |
Total decrease in net assets | | | (190,655,152 | ) | | | (858,008,611 | ) | |
Net assets at beginning of year | | | 945,520,628 | | | | 1,803,529,239 | | |
Net assets at end of year | | $ | 754,865,476 | | | $ | 945,520,628 | | |
Excess of distributions over net investment income | | $ | (11,596,514 | ) | | $ | (15,866,186 | ) | |
(a) Class R4 and Class R5 shares are for the period from November 8, 2012 (commencement of operations) to February 28, 2013.
The accompanying Notes to Financial Statements are an integral part of this statement.
Annual Report 2014
23
Columbia Multi-Advisor International Equity Fund
Statement of Changes in Net Assets (continued)
| | | Year Ended February 28, 2014 | | Year Ended February 28, 2013(a) | |
| | | Shares | | Dollars ($) | | Shares | | Dollars ($) | |
Capital stock activity | |
Class A shares | |
Subscriptions(b) | | | 646,077 | | | | 8,234,862 | | | | 933,505 | | | | 10,410,498 | | |
Distributions reinvested | | | — | | | | — | | | | 844,169 | | | | 9,680,587 | | |
Redemptions | | | (3,875,355 | ) | | | (49,195,352 | ) | | | (6,272,359 | ) | | | (71,262,677 | ) | |
Net decrease | | | (3,229,278 | ) | | | (40,960,490 | ) | | | (4,494,685 | ) | | | (51,171,592 | ) | |
Class B shares | |
Subscriptions | | | 6,253 | | | | 75,199 | | | | 9,795 | | | | 103,220 | | |
Distributions reinvested | | | — | | | | — | | | | 14,419 | | | | 153,043 | | |
Redemptions(b) | | | (267,444 | ) | | | (3,061,752 | ) | | | (544,662 | ) | | | (5,422,078 | ) | |
Net decrease | | | (261,191 | ) | | | (2,986,553 | ) | | | (520,448 | ) | | | (5,165,815 | ) | |
Class C shares | |
Subscriptions | | | 57,315 | | | | 653,865 | | | | 76,374 | | | | 777,986 | | |
Distributions reinvested | | | — | | | | — | | | | 23,574 | | | | 248,324 | | |
Redemptions | | | (211,168 | ) | | | (2,392,940 | ) | | | (373,898 | ) | | | (3,818,948 | ) | |
Net decrease | | | (153,853 | ) | | | (1,739,075 | ) | | | (273,950 | ) | | | (2,792,638 | ) | |
Class I shares | |
Subscriptions | | | 614,977 | | | | 7,738,494 | | | | 627,455 | | | | 7,357,646 | | |
Distributions reinvested | | | — | | | | — | | | | 74,414 | | | | 864,547 | | |
Redemptions | | | (2,598,019 | ) | | | (32,648,086 | ) | | | (5,317,888 | ) | | | (62,865,286 | ) | |
Net decrease | | | (1,983,042 | ) | | | (24,909,592 | ) | | | (4,616,019 | ) | | | (54,643,093 | ) | |
Class K shares | |
Distributions reinvested | | | — | | | | — | | | | 340 | | | | 3,942 | | |
Redemptions | | | (2,116 | ) | | | (27,822 | ) | | | (1,721 | ) | | | (20,487 | ) | |
Net decrease | | | (2,116 | ) | | | (27,822 | ) | | | (1,381 | ) | | | (16,545 | ) | |
Class R shares | |
Subscriptions | | | 24,953 | | | | 317,832 | | | | 31,951 | | | | 364,188 | | |
Distributions reinvested | | | — | | | | — | | | | 4,361 | | | | 50,297 | | |
Redemptions | | | (46,260 | ) | | | (610,494 | ) | | | (60,128 | ) | | | (675,540 | ) | |
Net decrease | | | (21,307 | ) | | | (292,662 | ) | | | (23,816 | ) | | | (261,055 | ) | |
Class R4 shares | |
Subscriptions | | | 250 | | | | 3,400 | | | | 215 | | | | 2,500 | | |
Net increase | | | 250 | | | | 3,400 | | | | 215 | | | | 2,500 | | |
Class R5 shares | |
Subscriptions | | | 793 | | | | 10,824 | | | | 215 | | | | 2,500 | | |
Net increase | | | 793 | | | | 10,824 | | | | 215 | | | | 2,500 | | |
The accompanying Notes to Financial Statements are an integral part of this statement.
Annual Report 2014
24
Columbia Multi-Advisor International Equity Fund
Statement of Changes in Net Assets (continued)
| | | Year Ended February 28, 2014 | | Year Ended February 28, 2013(a) | |
| | | Shares | | Dollars ($) | | Shares | | Dollars ($) | |
Capital stock activity (continued) | |
Class W shares | |
Subscriptions | | | 8,591,377 | | | | 109,329,950 | | | | 8,691,812 | | | | 99,042,100 | | |
Distributions reinvested | | | — | | | | — | | | | 674,478 | | | | 7,738,983 | | |
Redemptions | | | (19,068,106 | ) | | | (248,569,885 | ) | | | (6,833,955 | ) | | | (76,787,419 | ) | |
Net increase (decrease) | | | (10,476,729 | ) | | | (139,239,935 | ) | | | 2,532,335 | | | | 29,993,664 | | |
Class Y shares | |
Subscriptions | | | — | | | | — | | | | 196,703 | | | | 2,220,001 | | |
Redemptions | | | (119,142 | ) | | | (1,500,000 | ) | | | (43,554 | ) | | | (512,026 | ) | |
Net increase (decrease) | | | (119,142 | ) | | | (1,500,000 | ) | | | 153,149 | | | | 1,707,975 | | |
Class Z shares | |
Subscriptions | | | 375,335 | | | | 4,867,671 | | | | 2,335,364 | | | | 26,575,742 | | |
Distributions reinvested | | | — | | | | — | | | | 341,514 | | | | 3,855,315 | | |
Redemptions | | | (8,328,636 | ) | | | (107,106,558 | ) | | | (70,124,076 | ) | | | (815,191,895 | ) | |
Net decrease | | | (7,953,301 | ) | | | (102,238,887 | ) | | | (67,447,198 | ) | | | (784,760,838 | ) | |
Total net decrease | | | (24,198,916 | ) | | | (313,880,792 | ) | | | (74,691,583 | ) | | | (867,104,937 | ) | |
(a) Class R4 and Class R5 shares are for the period from November 8, 2012 (commencement of operations) to February 28, 2013.
(b) Includes conversions of Class B shares to Class A shares, if any.
The accompanying Notes to Financial Statements are an integral part of this statement.
Annual Report 2014
25
Columbia Multi-Advisor International Equity Fund
The following tables are intended to help you understand the Fund's financial performance. Certain information reflects financial results for a single share of a class held for the periods shown. Per share net investment income (loss) amounts are calculated based on average shares outstanding during the period. Total return assumes reinvestment of all dividends and distributions, if any. Total return does not reflect payment of sales charges, if any, and is not annualized for periods of less than one year.
| | | Year Ended February 28, | | Year Ended
February 29, | | Year Ended February 28, | |
Class A | | 2014 | | 2013 | | 2012 | | 2011 | | 2010 | |
Per share data | |
Net asset value, beginning of period | | $ | 12.02 | | | $ | 11.68 | | | $ | 12.46 | | | $ | 10.68 | | | $ | 7.44 | | |
Income from investment operations: | |
Net investment income | | | 0.15 | | | | 0.17 | | | | 0.14 | | | | 0.14 | | | | 0.13 | | |
Net realized and unrealized gain (loss) | | | 1.71 | | | | 0.56 | | | | (0.94 | ) | | | 1.85 | | | | 3.51 | | |
Total from investment operations | | | 1.86 | | | | 0.73 | | | | (0.80 | ) | | | 1.99 | | | | 3.64 | | |
Less distributions to shareholders: | |
Net investment income | | | — | | | | (0.39 | ) | | | — | | | | (0.21 | ) | | | (0.43 | ) | |
Total distributions to shareholders | | | — | | | | (0.39 | ) | | | — | | | | (0.21 | ) | | | (0.43 | ) | |
Proceeds from regulatory settlements | | | — | | | | — | | | | 0.02 | | | | 0.00 | (a) | | | 0.03 | | |
Redemption fees: | |
Redemption fees added to paid-in capital | | | — | | | | — | | | | — | | | | — | | | | 0.00 | (a) | |
Net asset value, end of period | | $ | 13.88 | | | $ | 12.02 | | | $ | 11.68 | | | $ | 12.46 | | | $ | 10.68 | | |
Total return | | | 15.47 | % | | | 6.41 | % | | | (6.26 | %)(b) | | | 18.80 | % | | | 49.61 | % | |
Ratios to average net assets(c) | |
Total gross expenses | | | 1.42 | %(d) | | | 1.39 | %(d) | | | 1.36 | % | | | 1.33 | %(d) | | | 1.26 | %(d) | |
Total net expenses(e) | | | 1.42 | %(d)(f) | | | 1.38 | %(d)(f) | | | 1.32 | %(f) | | | 1.33 | %(d)(f) | | | 1.26 | %(d)(f) | |
Net investment income | | | 1.20 | % | | | 1.46 | % | | | 1.20 | % | | | 1.27 | % | | | 1.26 | % | |
Supplemental data | |
Net assets, end of period (in thousands) | | $ | 316,823 | | | $ | 313,239 | | | $ | 356,708 | | | $ | 24,668 | | | $ | 24,243 | | |
Portfolio turnover | | | 125 | % | | | 100 | % | | | 112 | % | | | 92 | % | | | 127 | % | |
Notes to Financial Highlights
(a) Rounds to zero.
(b) The Fund received proceeds from regulatory settlements. Had the Fund not received these proceeds, the total return would have been lower by 0.19%.
(c) In addition to the fees and expenses which the Fund bears directly, the Fund indirectly bears a pro rata share of the fees and expenses of the acquired funds in which it invests. Such indirect expenses are not included in the reported expense ratios.
(d) Ratios include line of credit interest expense which rounds to less than 0.01%.
(e) Total net expenses include the impact of certain waivers/reimbursements made by the Investment Manager and certain of its affiliates, if applicable.
(f) The benefits derived from expense reductions had an impact of less than 0.01%.
The accompanying Notes to Financial Statements are an integral part of this statement.
Annual Report 2014
26
Columbia Multi-Advisor International Equity Fund
Financial Highlights (continued)
| | | Year Ended February 28, | | Year Ended
February 29, | | Year Ended February 28, | |
Class B | | 2014 | | 2013 | | 2012 | | 2011 | | 2010 | |
Per share data | |
Net asset value, beginning of period | | $ | 10.90 | | | $ | 10.55 | | | $ | 11.34 | | | $ | 9.75 | | | $ | 6.82 | | |
Income from investment operations: | |
Net investment income | | | 0.06 | | | | 0.09 | | | | 0.06 | | | | 0.07 | | | | 0.06 | | |
Net realized and unrealized gain (loss) | | | 1.54 | | | | 0.49 | | | | (0.87 | ) | | | 1.66 | | | | 3.20 | | |
Total from investment operations | | | 1.60 | | | | 0.58 | | | | (0.81 | ) | | | 1.73 | | | | 3.26 | | |
Less distributions to shareholders: | |
Net investment income | | | — | | | | (0.23 | ) | | | — | | | | (0.14 | ) | | | (0.36 | ) | |
Total distributions to shareholders | | | — | | | | (0.23 | ) | | | — | | | | (0.14 | ) | | | (0.36 | ) | |
Proceeds from regulatory settlements | | | — | | | | — | | | | 0.02 | | | | 0.00 | (a) | | | 0.03 | | |
Redemption fees: | |
Redemption fees added to paid-in capital | | | — | | | | — | | | | — | | | | — | | | | 0.00 | (a) | |
Net asset value, end of period | | $ | 12.50 | | | $ | 10.90 | | | $ | 10.55 | | | $ | 11.34 | | | $ | 9.75 | | |
Total return | | | 14.68 | % | | | 5.59 | % | | | (6.97 | %)(b) | | | 17.88 | % | | | 48.47 | % | |
Ratios to average net assets(c) | |
Total gross expenses | | | 2.17 | %(d) | | | 2.13 | %(d) | | | 2.11 | % | | | 2.08 | %(d) | | | 2.01 | %(d) | |
Total net expenses(e) | | | 2.17 | %(d)(f) | | | 2.12 | %(d)(f) | | | 2.06 | %(f) | | | 2.08 | %(d)(f) | | | 2.01 | %(d)(f) | |
Net investment income | | | 0.52 | % | | | 0.91 | % | | | 0.62 | % | | | 0.70 | % | | | 0.60 | % | |
Supplemental data | |
Net assets, end of period (in thousands) | | $ | 4,260 | | | $ | 6,566 | | | $ | 11,838 | | | $ | 784 | | | $ | 1,190 | | |
Portfolio turnover | | | 125 | % | | | 100 | % | | | 112 | % | | | 92 | % | | | 127 | % | |
Notes to Financial Highlights
(a) Rounds to zero.
(b) The Fund received proceeds from regulatory settlements. Had the Fund not received these proceeds, the total return would have been lower by 0.20%.
(c) In addition to the fees and expenses which the Fund bears directly, the Fund indirectly bears a pro rata share of the fees and expenses of the acquired funds in which it invests. Such indirect expenses are not included in the reported expense ratios.
(d) Ratios include line of credit interest expense which rounds to less than 0.01%.
(e) Total net expenses include the impact of certain waivers/reimbursements made by the Investment Manager and certain of its affiliates, if applicable.
(f) The benefits derived from expense reductions had an impact of less than 0.01%.
The accompanying Notes to Financial Statements are an integral part of this statement.
Annual Report 2014
27
Columbia Multi-Advisor International Equity Fund
Financial Highlights (continued)
| | | Year Ended February 28, | | Year Ended
February 29, | | Year Ended February 28, | |
Class C | | 2014 | | 2013 | | 2012 | | 2011 | | 2010 | |
Per share data | |
Net asset value, beginning of period | | $ | 10.77 | | | $ | 10.42 | | | $ | 11.20 | | | $ | 9.63 | | | $ | 6.73 | | |
Income from investment operations: | |
Net investment income | | | 0.05 | | | | 0.07 | | | | 0.05 | | | | 0.07 | | | | 0.05 | | |
Net realized and unrealized gain (loss) | | | 1.52 | | | | 0.51 | | | | (0.85 | ) | | | 1.64 | | | | 3.18 | | |
Total from investment operations | | | 1.57 | | | | 0.58 | | | | (0.80 | ) | | | 1.71 | | | | 3.23 | | |
Less distributions to shareholders: | |
Net investment income | | | — | | | | (0.23 | ) | | | — | | | | (0.14 | ) | | | (0.36 | ) | |
Total distributions to shareholders | | | — | | | | (0.23 | ) | | | — | | | | (0.14 | ) | | | (0.36 | ) | |
Proceeds from regulatory settlements | | | — | | | | — | | | | 0.02 | | | | 0.00 | (a) | | | 0.03 | | |
Redemption fees: | |
Redemption fees added to paid-in capital | | | — | | | | — | | | | — | | | | — | | | | 0.00 | (a) | |
Net asset value, end of period | | $ | 12.34 | | | $ | 10.77 | | | $ | 10.42 | | | $ | 11.20 | | | $ | 9.63 | | |
Total return | | | 14.58 | % | | | 5.64 | % | | | (6.96 | %)(b) | | | 17.89 | % | | | 48.67 | % | |
Ratios to average net assets(c) | |
Total gross expenses | | | 2.17 | %(d) | | | 2.14 | %(d) | | | 2.10 | % | | | 2.08 | %(d) | | | 2.01 | %(d) | |
Total net expenses(e) | | | 2.17 | %(d)(f) | | | 2.13 | %(d)(f) | | | 2.07 | %(f) | | | 2.08 | %(d)(f) | | | 2.01 | %(d)(f) | |
Net investment income | | | 0.45 | % | | | 0.72 | % | | | 0.48 | % | | | 0.72 | % | | | 0.55 | % | |
Supplemental data | |
Net assets, end of period (in thousands) | | $ | 12,562 | | | $ | 12,619 | | | $ | 15,058 | | | $ | 1,272 | | | $ | 1,728 | | |
Portfolio turnover | | | 125 | % | | | 100 | % | | | 112 | % | | | 92 | % | | | 127 | % | |
Notes to Financial Highlights
(a) Rounds to zero.
(b) The Fund received proceeds from regulatory settlements. Had the Fund not received these proceeds, the total return would have been lower by 0.19%.
(c) In addition to the fees and expenses which the Fund bears directly, the Fund indirectly bears a pro rata share of the fees and expenses of the acquired funds in which it invests. Such indirect expenses are not included in the reported expense ratios.
(d) Ratios include line of credit interest expense which rounds to less than 0.01%.
(e) Total net expenses include the impact of certain waivers/reimbursements made by the Investment Manager and certain of its affiliates, if applicable.
(f) The benefits derived from expense reductions had an impact of less than 0.01%.
The accompanying Notes to Financial Statements are an integral part of this statement.
Annual Report 2014
28
Columbia Multi-Advisor International Equity Fund
Financial Highlights (continued)
| | | Year Ended February 28, | | Year Ended
February 29, | | Year Ended
February 28, | |
Class I | | 2014 | | 2013 | | 2012 | | 2011(a) | |
Per share data | |
Net asset value, beginning of period | | $ | 12.20 | | | $ | 11.89 | | | $ | 12.62 | | | $ | 11.64 | | |
Income from investment operations: | |
Net investment income | | | 0.30 | | | | 0.22 | | | | 0.22 | | | | 0.02 | | |
Net realized and unrealized gain (loss) | | | 1.65 | | | | 0.58 | | | | (0.97 | ) | | | 1.21 | | |
Total from investment operations | | | 1.95 | | | | 0.80 | | | | (0.75 | ) | | | 1.23 | | |
Less distributions to shareholders: | |
Net investment income | | | — | | | | (0.49 | ) | | | — | | | | (0.25 | ) | |
Total distributions to shareholders | | | — | | | | (0.49 | ) | | | — | | | | (0.25 | ) | |
Proceeds from regulatory settlements | | | — | | | | — | | | | 0.02 | | | | 0.00 | (b) | |
Net asset value, end of period | | $ | 14.15 | | | $ | 12.20 | | | $ | 11.89 | | | $ | 12.62 | | |
Total return | | | 15.98 | % | | | 6.96 | % | | | (5.78 | %)(c) | | | 10.69 | % | |
Ratios to average net assets(d) | |
Total gross expenses | | | 0.93 | %(e) | | | 0.93 | %(e) | | | 0.84 | % | | | 0.95 | %(e)(f) | |
Total net expenses(g) | | | 0.93 | %(e) | | | 0.93 | %(e) | | | 0.84 | % | | | 0.95 | %(e)(f)(h) | |
Net investment income | | | 2.38 | % | | | 1.90 | % | | | 1.87 | % | | | 0.32 | %(f) | |
Supplemental data | |
Net assets, end of period (in thousands) | | $ | 19 | | | $ | 24,204 | | | $ | 78,467 | | | $ | 47,056 | | |
Portfolio turnover | | | 125 | % | | | 100 | % | | | 112 | % | | | 92 | % | |
Notes to Financial Highlights
(a) For the period from September 27, 2010 (commencement of operations) to February 28, 2011.
(b) Rounds to zero.
(c) The Fund received proceeds from regulatory settlements. Had the Fund not received these proceeds, the total return would have been lower by 0.19%.
(d) In addition to the fees and expenses which the Fund bears directly, the Fund indirectly bears a pro rata share of the fees and expenses of the acquired funds in which it invests. Such indirect expenses are not included in the reported expense ratios.
(e) Ratios include line of credit interest expense which rounds to less than 0.01%.
(f) Annualized.
(g) Total net expenses include the impact of certain waivers/reimbursements made by the Investment Manager and certain of its affiliates, if applicable.
(h) The benefits derived from expense reductions had an impact of less than 0.01%.
The accompanying Notes to Financial Statements are an integral part of this statement.
Annual Report 2014
29
Columbia Multi-Advisor International Equity Fund
Financial Highlights (continued)
| | | Year Ended February 28, | | Year Ended
February 29, | |
Class K | | 2014 | | 2013 | | 2012(a) | |
Per share data | |
Net asset value, beginning of period | | $ | 12.20 | | | $ | 11.85 | | | $ | 12.54 | | |
Income from investment operations: | |
Net investment income | | | 0.17 | | | | 0.18 | | | | 0.15 | | |
Net realized and unrealized gain (loss) | | | 1.74 | | | | 0.58 | | | | (0.86 | ) | |
Total from investment operations | | | 1.91 | | | | 0.76 | | | | (0.71 | ) | |
Less distributions to shareholders: | |
Net investment income | | | — | | | | (0.41 | ) | | | — | | |
Total distributions to shareholders | | | — | | | | (0.41 | ) | | | — | | |
Proceeds from regulatory settlements | | | — | | | | — | | | | 0.02 | | |
Net asset value, end of period | | $ | 14.11 | | | $ | 12.20 | | | $ | 11.85 | | |
Total return | | | 15.66 | % | | | 6.64 | % | | | (5.50 | %)(b) | |
Ratios to average net assets(c) | |
Total gross expenses | | | 1.24 | %(d) | | | 1.24 | %(d) | | | 1.21 | %(e) | |
Total net expenses(f) | | | 1.24 | %(d) | | | 1.24 | %(d) | | | 1.21 | %(e) | |
Net investment income | | | 1.32 | % | | | 1.61 | % | | | 1.33 | %(e) | |
Supplemental data | |
Net assets, end of period (in thousands) | | $ | 111 | | | $ | 122 | | | $ | 135 | | |
Portfolio turnover | | | 125 | % | | | 100 | % | | | 112 | % | |
Notes to Financial Highlights
(a) For the period from March 7, 2011 (commencement of operations) to February 29, 2012.
(b) The Fund received proceeds from regulatory settlements. Had the Fund not received these proceeds, the total return would have been lower by 0.19%.
(c) In addition to the fees and expenses which the Fund bears directly, the Fund indirectly bears a pro rata share of the fees and expenses of the acquired funds in which it invests. Such indirect expenses are not included in the reported expense ratios.
(d) Ratios include line of credit interest expense which rounds to less than 0.01%.
(e) Annualized.
(f) Total net expenses include the impact of certain waivers/reimbursements made by the Investment Manager and certain of its affiliates, if applicable.
The accompanying Notes to Financial Statements are an integral part of this statement.
Annual Report 2014
30
Columbia Multi-Advisor International Equity Fund
Financial Highlights (continued)
| | | Year Ended February 28, | | Year Ended
February 29, | | Year Ended February 28, | |
Class R | | 2014 | | 2013 | | 2012 | | 2011 | | 2010 | |
Per share data | |
Net asset value, beginning of period | | $ | 12.01 | | | $ | 11.64 | | | $ | 12.45 | | | $ | 10.68 | | | $ | 7.44 | | |
Income from investment operations: | |
Net investment income | | | 0.11 | | | | 0.14 | | | | 0.11 | | | | 0.13 | | | | 0.09 | | |
Net realized and unrealized gain (loss) | | | 1.72 | | | | 0.57 | | | | (0.94 | ) | | | 1.83 | | | | 3.53 | | |
Total from investment operations | | | 1.83 | | | | 0.71 | | | | (0.83 | ) | | | 1.96 | | | | 3.62 | | |
Less distributions to shareholders: | |
Net investment income | | | — | | | | (0.34 | ) | | | — | | | | (0.19 | ) | | | (0.41 | ) | |
Total distributions to shareholders | | | — | | | | (0.34 | ) | | | — | | | | (0.19 | ) | | | (0.41 | ) | |
Proceeds from regulatory settlements | | | — | | | | — | | | | 0.02 | | | | 0.00 | (a) | | | 0.03 | | |
Redemption fees: | |
Redemption fees added to paid-in capital | | | — | | | | — | | | | — | | | | — | | | | 0.00 | (a) | |
Net asset value, end of period | | $ | 13.84 | | | $ | 12.01 | | | $ | 11.64 | | | $ | 12.45 | | | $ | 10.68 | | |
Total return | | | 15.24 | % | | | 6.20 | % | | | (6.51 | %)(b) | | | 18.47 | % | | | 49.28 | % | |
Ratios to average net assets(c) | |
Total gross expenses | | | 1.67 | %(d) | | | 1.64 | %(d) | | | 1.62 | % | | | 1.58 | %(d) | | | 1.51 | %(d) | |
Total net expenses(e) | | | 1.67 | %(d)(f) | | | 1.63 | %(d)(f) | | | 1.57 | %(f) | | | 1.58 | %(d)(f) | | | 1.51 | %(d)(f) | |
Net investment income | | | 0.87 | % | | | 1.22 | % | | | 0.98 | % | | | 1.13 | % | | | 0.86 | % | |
Supplemental data | |
Net assets, end of period (in thousands) | | $ | 1,632 | | | $ | 1,673 | | | $ | 1,899 | | | $ | 287 | | | $ | 289 | | |
Portfolio turnover | | | 125 | % | | | 100 | % | | | 112 | % | | | 92 | % | | | 127 | % | |
Notes to Financial Highlights
(a) Rounds to zero.
(b) The Fund received proceeds from regulatory settlements. Had the Fund not received these proceeds, the total return would have been lower by 0.19%.
(c) In addition to the fees and expenses which the Fund bears directly, the Fund indirectly bears a pro rata share of the fees and expenses of the acquired funds in which it invests. Such indirect expenses are not included in the reported expense ratios.
(d) Ratios include line of credit interest expense which rounds to less than 0.01%.
(e) Total net expenses include the impact of certain waivers/reimbursements made by the Investment Manager and certain of its affiliates, if applicable.
(f) The benefits derived from expense reductions had an impact of less than 0.01%.
The accompanying Notes to Financial Statements are an integral part of this statement.
Annual Report 2014
31
Columbia Multi-Advisor International Equity Fund
Financial Highlights (continued)
| | | Year Ended February 28, | |
Class R4 | | 2014 | | 2013(a) | |
Per share data | |
Net asset value, beginning of period | | $ | 12.27 | | | $ | 11.62 | | |
Income from investment operations: | |
Net investment income | | | 0.18 | | | | 0.02 | | |
Net realized and unrealized gain | | | 1.75 | | | | 0.92 | | |
Total from investment operations | | | 1.93 | | | | 0.94 | | |
Less distributions to shareholders: | |
Net investment income | | | — | | | | (0.29 | ) | |
Total distributions to shareholders | | | — | | | | (0.29 | ) | |
Net asset value, end of period | | $ | 14.20 | | | $ | 12.27 | | |
Total return | | | 15.73 | % | | | 8.17 | % | |
Ratios to average net assets(b) | |
Total gross expenses | | | 1.19 | %(c) | | | 1.25 | %(d) | |
Total net expenses(e) | | | 1.19 | %(c)(f) | | | 1.25 | %(d) | |
Net investment income | | | 1.35 | % | | | 0.55 | %(d) | |
Supplemental data | |
Net assets, end of period (in thousands) | | $ | 7 | | | $ | 3 | | |
Portfolio turnover | | | 125 | % | | | 100 | % | |
Notes to Financial Highlights
(a) For the period from November 8, 2012 (commencement of operations) to February 28, 2013.
(b) In addition to the fees and expenses which the Fund bears directly, the Fund indirectly bears a pro rata share of the fees and expenses of the acquired funds in which it invests. Such indirect expenses are not included in the reported expense ratios.
(c) Ratios include line of credit interest expense which rounds to less than 0.01%.
(d) Annualized.
(e) Total net expenses include the impact of certain waivers/reimbursements made by the Investment Manager and certain of its affiliates, if applicable.
(f) The benefits derived from expense reductions had an impact of less than 0.01%.
The accompanying Notes to Financial Statements are an integral part of this statement.
Annual Report 2014
32
Columbia Multi-Advisor International Equity Fund
Financial Highlights (continued)
| | | Year Ended February 28, | |
Class R5 | | 2014 | | 2013(a) | |
Per share data | |
Net asset value, beginning of period | | $ | 12.26 | | | $ | 11.62 | | |
Income from investment operations: | |
Net investment income | | | 0.32 | | | | 0.03 | | |
Net realized and unrealized gain | | | 1.63 | | | | 0.92 | | |
Total from investment operations | | | 1.95 | | | | 0.95 | | |
Less distributions to shareholders: | |
Net investment income | | | — | | | | (0.31 | ) | |
Total distributions to shareholders | | | — | | | | (0.31 | ) | |
Net asset value, end of period | | $ | 14.21 | | | $ | 12.26 | | |
Total return | | | 15.91 | % | | | 8.20 | % | |
Ratios to average net assets(b) | |
Total gross expenses | | | 1.04 | %(c) | | | 1.05 | %(d) | |
Total net expenses(e) | | | 1.04 | %(c) | | | 1.05 | %(d) | |
Net investment income | | | 2.45 | % | | | 0.75 | %(d) | |
Supplemental data | |
Net assets, end of period (in thousands) | | $ | 14 | | | $ | 3 | | |
Portfolio turnover | | | 125 | % | | | 100 | % | |
Notes to Financial Highlights
(a) For the period from November 8, 2012 (commencement of operations) to February 28, 2013.
(b) In addition to the fees and expenses which the Fund bears directly, the Fund indirectly bears a pro rata share of the fees and expenses of the acquired funds in which it invests. Such indirect expenses are not included in the reported expense ratios.
(c) Ratios include line of credit interest expense which rounds to less than 0.01%.
(d) Annualized.
(e) Total net expenses include the impact of certain waivers/reimbursements made by the Investment Manager and certain of its affiliates, if applicable.
The accompanying Notes to Financial Statements are an integral part of this statement.
Annual Report 2014
33
Columbia Multi-Advisor International Equity Fund
Financial Highlights (continued)
| | | Year Ended February 28, | | Year Ended
February 29, | | Year Ended
February 28, | |
Class W | | 2014 | | 2013 | | 2012 | | 2011(a) | |
Per share data | |
Net asset value, beginning of period | | $ | 12.02 | | | $ | 11.68 | | | $ | 12.46 | | | $ | 11.48 | | |
Income from investment operations: | |
Net investment income | | | 0.13 | | | | 0.16 | | | | 0.12 | | | | 0.02 | | |
Net realized and unrealized gain (loss) | | | 1.73 | | | | 0.57 | | | | (0.92 | ) | | | 1.17 | | |
Total from investment operations | | | 1.86 | | | | 0.73 | | | | (0.80 | ) | | | 1.19 | | |
Less distributions to shareholders: | |
Net investment income | | | — | | | | (0.39 | ) | | | — | | | | (0.21 | ) | |
Total distributions to shareholders | | | — | | | | (0.39 | ) | | | — | | | | (0.21 | ) | |
Proceeds from regulatory settlements | | | — | | | | — | | | | 0.02 | | | | 0.00 | (b) | |
Net asset value, end of period | | $ | 13.88 | | | $ | 12.02 | | | $ | 11.68 | | | $ | 12.46 | | |
Total return | | | 15.47 | % | | | 6.40 | % | | | (6.26 | %)(c) | | | 10.52 | % | |
Ratios to average net assets(d) | |
Total gross expenses | | | 1.41 | %(e) | | | 1.40 | %(e) | | | 1.38 | % | | | 1.30 | %(e)(f) | |
Total net expenses(g) | | | 1.41 | %(e)(h) | | | 1.39 | %(e)(h) | | | 1.33 | %(h) | | | 1.30 | %(e)(f)(h) | |
Net investment income | | | 1.05 | % | | | 1.42 | % | | | 1.06 | % | | | 0.33 | %(f) | |
Supplemental data | |
Net assets, end of period (in thousands) | | $ | 166,486 | | | $ | 270,144 | | | $ | 232,777 | | | $ | 3 | | |
Portfolio turnover | | | 125 | % | | | 100 | % | | | 112 | % | | | 92 | % | |
Notes to Financial Highlights
(a) For the period from September 27, 2010 (commencement of operations) to February 28, 2011.
(b) Rounds to zero.
(c) The Fund received proceeds from regulatory settlements. Had the Fund not received these proceeds, the total return would have been lower by 0.19%.
(d) In addition to the fees and expenses which the Fund bears directly, the Fund indirectly bears a pro rata share of the fees and expenses of the acquired funds in which it invests. Such indirect expenses are not included in the reported expense ratios.
(e) Ratios include line of credit interest expense which rounds to less than 0.01%.
(f) Annualized.
(g) Total net expenses include the impact of certain waivers/reimbursements made by the Investment Manager and certain of its affiliates, if applicable.
(h) The benefits derived from expense reductions had an impact of less than 0.01%.
The accompanying Notes to Financial Statements are an integral part of this statement.
Annual Report 2014
34
Columbia Multi-Advisor International Equity Fund
Financial Highlights (continued)
| | | Year Ended February 28, | | Year Ended
February 29, | |
Class Y | | 2014 | | 2013 | | 2012(a) | |
Per share data | |
Net asset value, beginning of period | | $ | 12.21 | | | $ | 11.89 | | | $ | 12.55 | | |
Income from investment operations: | |
Net investment income | | | 0.22 | | | | 0.21 | | | | 0.18 | | |
Net realized and unrealized gain (loss) | | | 1.73 | | | | 0.59 | | | | (0.86 | ) | |
Total from investment operations | | | 1.95 | | | | 0.80 | | | | (0.68 | ) | |
Less distributions to shareholders: | |
Net investment income | | | — | | | | (0.48 | ) | | | — | | |
Total distributions to shareholders | | | — | | | | (0.48 | ) | | | — | | |
Proceeds from regulatory settlements | | | — | | | | — | | | | 0.02 | | |
Net asset value, end of period | | $ | 14.16 | | | $ | 12.21 | | | $ | 11.89 | | |
Total return | | | 15.97 | % | | | 6.98 | % | | | (5.26 | %)(b) | |
Ratios to average net assets(c) | |
Total gross expenses | | | 0.94 | %(d) | | | 0.95 | %(d) | | | 0.88 | %(e) | |
Total net expenses(f) | | | 0.94 | %(d) | | | 0.95 | %(d) | | | 0.88 | %(e) | |
Net investment income | | | 1.67 | % | | | 1.79 | % | | | 1.64 | %(e) | |
Supplemental data | |
Net assets, end of period (in thousands) | | $ | 15,701 | | | $ | 14,990 | | | $ | 12,780 | | |
Portfolio turnover | | | 125 | % | | | 100 | % | | | 112 | % | |
Notes to Financial Highlights
(a) For the period from March 7, 2011 (commencement of operations) to February 29, 2012.
(b) The Fund received proceeds from regulatory settlements. Had the Fund not received these proceeds, the total return would have been lower by 0.19%.
(c) In addition to the fees and expenses which the Fund bears directly, the Fund indirectly bears a pro rata share of the fees and expenses of the acquired funds in which it invests. Such indirect expenses are not included in the reported expense ratios.
(d) Ratios include line of credit interest expense which rounds to less than 0.01%.
(e) Annualized.
(f) Total net expenses include the impact of certain waivers/reimbursements made by the Investment Manager and certain of its affiliates, if applicable.
The accompanying Notes to Financial Statements are an integral part of this statement.
Annual Report 2014
35
Columbia Multi-Advisor International Equity Fund
Financial Highlights (continued)
| | | Year Ended February 28, | | Year Ended
February 29, | | Year Ended February 28, | |
Class Z | | 2014 | | 2013 | | 2012 | | 2011 | | 2010 | |
Per share data | |
Net asset value, beginning of period | | $ | 12.19 | | | $ | 11.86 | | | $ | 12.62 | | | $ | 10.81 | | | $ | 7.52 | | |
Income from investment operations: | |
Net investment income | | | 0.19 | | | | 0.23 | | | | 0.18 | | | | 0.18 | | | | 0.17 | | |
Net realized and unrealized gain (loss) | | | 1.73 | | | | 0.54 | | | | (0.96 | ) | | | 1.87 | | | | 3.55 | | |
Total from investment operations | | | 1.92 | | | | 0.77 | | | | (0.78 | ) | | | 2.05 | | | | 3.72 | | |
Less distributions to shareholders: | |
Net investment income | | | — | | | | (0.44 | ) | | | — | | | | (0.24 | ) | | | (0.46 | ) | |
Total distributions to shareholders | | | — | | | | (0.44 | ) | | | — | | | | (0.24 | ) | | | (0.46 | ) | |
Proceeds from regulatory settlements | | | — | | | | — | | | | 0.02 | | | | 0.00 | (a) | | | 0.03 | | |
Redemption fees: | |
Redemption fees added to paid-in capital | | | — | | | | — | | | | — | | | | — | | | | 0.00 | (a) | |
Net asset value, end of period | | $ | 14.11 | | | $ | 12.19 | | | $ | 11.86 | | | $ | 12.62 | | | $ | 10.81 | | |
Total return | | | 15.75 | % | | | 6.72 | % | | | (6.02 | %)(b) | | | 19.08 | % | | | 50.09 | % | |
Ratios to average net assets(c) | |
Total gross expenses | | | 1.17 | %(d) | | | 1.13 | %(d) | | | 1.11 | % | | | 1.08 | %(d) | | | 1.01 | %(d) | |
Total net expenses(e) | | | 1.17 | %(d)(f) | | | 1.12 | %(d)(f) | | | 1.08 | %(f) | | | 1.08 | %(d)(f) | | | 1.01 | %(d)(f) | |
Net investment income | | | 1.50 | % | | | 2.00 | % | | | 1.53 | % | | | 1.58 | % | | | 1.59 | % | |
Supplemental data | |
Net assets, end of period (in thousands) | | $ | 237,249 | | | $ | 301,958 | | | $ | 1,093,867 | | | $ | 1,177,541 | | | $ | 1,375,538 | | |
Portfolio turnover | | | 125 | % | | | 100 | % | | | 112 | % | | | 92 | % | | | 127 | % | |
Notes to Financial Highlights
(a) Rounds to zero.
(b) The Fund received proceeds from regulatory settlements. Had the Fund not received these proceeds, the total return would have been lower by 0.19%.
(c) In addition to the fees and expenses which the Fund bears directly, the Fund indirectly bears a pro rata share of the fees and expenses of the acquired funds in which it invests. Such indirect expenses are not included in the reported expense ratios.
(d) Ratios include line of credit interest expense which rounds to less than 0.01%.
(e) Total net expenses include the impact of certain waivers/reimbursements made by the Investment Manager and certain of its affiliates, if applicable.
(f) The benefits derived from expense reductions had an impact of less than 0.01%.
The accompanying Notes to Financial Statements are an integral part of this statement.
Annual Report 2014
36
Columbia Multi-Advisor International Equity Fund
Notes to Financial Statements
February 28, 2014
Note 1. Organization
Columbia Multi-Advisor International Equity Fund (the Fund), a series of Columbia Funds Series Trust (the Trust), is a diversified fund. The Trust is registered under the Investment Company Act of 1940, as amended (the 1940 Act), as an open-end management investment company organized as a Delaware statutory trust.
Fund Shares
The Trust may issue an unlimited number of shares (without par value). The Fund offers Class A, Class B, Class C, Class I, Class K, Class R, Class R4, Class R5, Class W, Class Y and Class Z shares. Although all share classes generally have identical voting, dividend and liquidation rights, each share class votes separately when required by law. Different share classes pay different distribution amounts to the extent the expenses of such share classes differ, and distributions in liquidation will be proportional to the net asset value of each share class. Each share class has its own expense structure and sales charges, as applicable.
Class A shares are subject to a maximum front-end sales charge of 5.75% based on the initial investment amount. Class A shares purchased without an initial sales charge in accounts aggregating $1 million to $50 million at the time of purchase are subject to a contingent deferred sales charge (CDSC) if the shares are sold within 18 months of purchase, charged as follows: 1.00% CDSC if redeemed within 12 months of purchase, and 0.50% CDSC if redeemed more than 12, but less than 18, months after purchase.
Class B shares may be subject to a maximum CDSC of 5.00% based upon the holding period after purchase. Class B shares will generally convert to Class A shares eight years after purchase. The Fund no longer accepts investments by new or existing investors in the Fund's Class B shares, except in connection with the reinvestment of any dividend and/or capital gain distributions in Class B shares of the Fund and exchanges by existing Class B shareholders of certain other funds within the Columbia Family of Funds.
Class C shares are subject to a 1.00% CDSC on shares redeemed within one year of purchase.
Class I shares are not subject to sales charges and are available only to the Columbia Family of Funds.
Class K shares are not subject to sales charges, however this share class is closed to new investors.
Class R shares are not subject to sales charges and are generally available only to certain retirement plans and other eligible investors.
Class R4 shares are not subject to sales charges and are generally available only to omnibus retirement plans and certain other eligible investors.
Class R5 shares are not subject to sales charges and are generally available only to investors purchasing through authorized investment professionals and omnibus retirement plans.
Class W shares are not subject to sales charges and are available only to investors purchasing through authorized investment programs managed by investment professionals, including discretionary managed account programs.
Class Y shares are not subject to sales charges and are generally available only to certain retirement plans.
Class Z shares are not subject to sales charges and are available only to certain eligible investors, which are subject to different investment minimums.
Note 2. Summary of Significant Accounting Policies
Use of Estimates
The preparation of financial statements in accordance with U.S. generally accepted accounting principles (GAAP) requires management to make certain estimates and assumptions that affect the reported amounts of assets and liabilities, the disclosure of contingent assets and liabilities at the date of the financial statements and the reported amounts of revenue and expenses during the reporting period. Actual results could differ from those estimates.
The following is a summary of significant accounting policies consistently followed by the Fund in the preparation of its financial statements.
Security Valuation
All equity securities are valued at the close of business of the New York Stock Exchange (NYSE). Equity securities are valued at the last quoted sales price on the principal exchange or market on which they trade, except for securities traded on the NASDAQ Stock Market, which are valued at the NASDAQ official close price. Unlisted securities or listed securities for which there were no sales during the day are valued at the mean of the latest quoted bid and ask prices on such exchanges or markets.
Foreign equity securities are valued based on quotations from the principal market in which such securities are normally traded. If any foreign share prices are not readily available as a result of limited share activity the securities are valued at the mean of the latest quoted bid and ask prices on such exchanges or markets. Foreign currency exchange rates are
Annual Report 2014
37
Columbia Multi-Advisor International Equity Fund
Notes to Financial Statements (continued)
February 28, 2014
generally determined at 4:00 p.m. Eastern (U.S.) time. However, many securities markets and exchanges outside the U.S. close prior to the close of the NYSE; therefore, the closing prices for securities in such markets or on such exchanges may not fully reflect events that occur after such close but before the close of the NYSE. In those situations, foreign securities will be fair valued pursuant to the policy adopted by the Board of Trustees (the Board), including utilizing a third party pricing service to determine these fair values. The third party pricing service takes into account multiple factors, including, but not limited to, movements in the U.S. securities markets, certain depositary receipts, futures contracts and foreign exchange rates that have occurred subsequent to the close of the foreign exchange or market, to determine a good faith estimate that reasonably reflects the current market conditions as of the close of the NYSE. The fair value of a security is likely to be different from the quoted or published price, if available.
Investments in open-end investment companies, including money market funds, are valued at net asset value.
Forward foreign currency exchange contracts are marked-to-market based upon foreign currency exchange rates provided by a pricing service.
Futures and options on futures contracts are valued based upon the settlement price established each day by the board of trade or exchange on which they are traded.
Investments for which market quotations are not readily available, or that have quotations which management believes are not reliable, are valued at fair value as determined in good faith under consistently applied procedures established by and under the general supervision of the Board. If a security or class of securities (such as foreign securities) is valued at fair value, such value is likely to be different from the last quoted market price for the security.
The determination of fair value often requires significant judgment. To determine fair value, management may use assumptions including but not limited to future cash flows and estimated risk premiums. Multiple inputs from various sources may be used to determine fair value.
Foreign Currency Transactions and Translations
The values of all assets and liabilities denominated in foreign currencies are translated into U.S. dollars at that day's exchange rates. Net realized and unrealized gains (losses) on foreign currency transactions and translations include gains (losses) arising from the fluctuation in exchange rates between trade and settlement dates on securities transactions, gains (losses) arising from the disposition of foreign currency and currency gains (losses) between the accrual and payment dates on dividends, interest income and foreign withholding taxes.
For financial statement purposes, the Fund does not distinguish that portion of gains (losses) on investments which is due to changes in foreign exchange rates from that which is due to changes in market prices of the investments. Such fluctuations are included with the net realized and unrealized gains (losses) on investments in the Statement of Operations.
Derivative Instruments
The Fund invests in certain derivative instruments, as detailed below, to meet its investment objectives. Derivatives are instruments whose values depend on, or are derived from, in whole or in part, the value of one or more other assets, such as securities, currencies, commodities or indices. Derivative instruments may be used to maintain cash reserves while maintaining exposure to certain other assets, to offset anticipated declines in values of investments, to facilitate trading, to reduce transaction costs and to pursue higher investment returns. The Fund may also use derivative instruments to mitigate certain investment risks, such as foreign currency exchange rate risk, interest rate risk and credit risk. Derivatives may involve various risks, including the potential inability of the counterparty to fulfill its obligation under the terms of the contract, the potential for an illiquid secondary market (making it difficult for the Fund to sell, including at favorable prices) and the potential for market movements which may expose the Fund to gains or losses in excess of the amount shown in the Statement of Assets and Liabilities. The notional amounts of derivative instruments, if applicable, are not recorded in the financial statements.
A derivative instrument may suffer a mark to market loss if the value of the contract decreases due to an unfavorable change in the market rates or values of the underlying instrument. Losses can also occur if the counterparty does not perform under the contract. The Fund's risk of loss from counterparty credit risk on over-the-counter derivatives is generally limited to the aggregate unrealized gain netted against any collateral held by the Fund and the amount of any variation margin held by the counterparty. With exchange traded or centrally cleared derivatives, there is minimal counterparty credit risk to the Fund since the exchange's clearinghouse, as counterparty to such instruments, guarantees against a possible default. The clearinghouse stands between the buyer and the seller of the contract; therefore, the counterparty credit risk is limited to failure of the clearinghouse. However, credit risk still exists in exchange traded or centrally cleared derivatives with respect to initial and variation margin that is held in a broker's customer accounts. While brokers are required to segregate customer margin from their own assets, in the event that a broker becomes insolvent or goes into bankruptcy and at that time there is a shortfall in the aggregate amount of margin held by the broker for all its clients, U.S. bankruptcy laws will typically
Annual Report 2014
38
Columbia Multi-Advisor International Equity Fund
Notes to Financial Statements (continued)
February 28, 2014
allocate that shortfall on a pro-rata basis across all the broker's customers, potentially resulting in losses to the Fund.
In order to better define its contractual rights and to secure rights that will help the Fund mitigate its counterparty risk, the Fund may enter into an International Swaps and Derivatives Association, Inc. Master Agreement (ISDA Master Agreement) or similar agreement with its derivative contract counterparties. An ISDA Master Agreement is an agreement between the Fund and a counterparty that governs over-the-counter derivatives and forward foreign currency exchange contracts and typically contains, among other things, collateral posting terms and netting provisions in the event of a default and/or termination event. Under an ISDA Master Agreement, the Fund may, under certain circumstances, offset with the counterparty certain derivative instrument's payables and/or receivables with collateral held and/or posted and create one single net payment. The provisions of the ISDA Master Agreement typically permit a single net payment in the event of default (close-out netting) including the bankruptcy or insolvency of the counterparty. Note, however, that bankruptcy or insolvency laws of a particular jurisdiction may impose restrictions on or prohibitions against the right of offset in bankruptcy, insolvency or other events.
Collateral (margin) requirements differ by type of derivative. Margin requirements are established by the exchange or clearinghouse for exchange traded and centrally cleared derivatives. Brokers can ask for margin in excess of the minimum in certain circumstances. Collateral terms are contract specific for over-the-counter derivatives. For over-the-counter derivatives traded under an ISDA Master Agreement, the collateral requirements are typically calculated by netting the mark to market amount for each transaction under such agreement and comparing that amount to the value of any variation margin currently pledged by the Fund and/or the counterparty. Generally, the amount of collateral due from or to a party has to exceed a minimum transfer amount threshold (e.g., $500,000) before a transfer has to be made. To the extent amounts due to the Fund from its counterparties are not fully collateralized, contractually or otherwise, the Fund bears the risk of loss from counterparty nonperformance. The Fund attempts to mitigate counterparty risk by only entering into agreements with counterparties that it believes have the financial resources to honor their obligations and by monitoring the financial stability of those counterparties.
Certain ISDA Master Agreements allow counterparties to over-the-counter derivatives to terminate derivative contracts prior to maturity in the event the Fund's net assets decline by a stated percentage over a specified time period or the Fund fails to meet the terms of the ISDA Master Agreement, which would cause the Fund to accelerate payment of any net liability owed to the counterparty. The Fund also has
termination rights if the counterparty fails to meet the terms of the ISDA Master Agreement. In addition to considering counterparty credit risk, the Fund would consider terminating the derivative contracts based on whether termination would result in a net liability owed from the counterparty.
For financial reporting purposes, the Fund does not offset derivative assets and derivative liabilities that are subject to netting arrangements in the Statement of Assets and Liabilities.
Forward Foreign Currency Exchange Contracts
Forward foreign currency exchange contracts are over-the-counter agreements between two parties to buy and sell a currency at a set price on a future date. These contracts are typically intended to be used to minimize the exposure to foreign exchange rate fluctuations during the period between the trade and settlement dates of the contract. The Fund utilized forward foreign currency exchange contracts to hedge the currency exposure associated with some or all of the Fund's securities, to shift investment exposure from one currency to another, and to shift U.S. dollar exposure to achieve a representative weighted mix of major currencies in its benchmark, and/or to recover an underweight country exposure in its portfolio. These instruments may be used for other purposes in future periods.
The values of forward foreign currency exchange contracts fluctuate with changes in foreign currency exchange rates. The Fund will record a realized gain or loss when the forward foreign currency exchange contract expires or is closed.
The use of forward foreign currency exchange contracts does not eliminate fluctuations in the prices of the Fund's portfolio securities. The risks of forward foreign currency exchange contracts include movement in the values of the foreign currencies relative to the U.S. dollar (or other foreign currencies) and the possibility that counterparties will not complete their contractual obligations, which may be in excess of the amount reflected, if any, in the Statement of Assets and Liabilities.
Futures Contracts
Futures contracts are exchange traded and represent commitments for the future purchase or sale of an asset at a specified price on a specified date. The Fund bought and sold futures contracts to manage exposure to the securities market and maintain appropriate equity market exposure while keeping sufficient cash to accommodate daily redemptions. These instruments may be used for other purposes in future periods. Upon entering into futures contracts, the Fund bears risks that it may not achieve the anticipated benefits of the futures contracts and may realize a loss. Additional risks include counterparty credit risk, the possibility of an illiquid
Annual Report 2014
39
Columbia Multi-Advisor International Equity Fund
Notes to Financial Statements (continued)
February 28, 2014
market, and that a change in the value of the contract or option may not correlate with changes in the value of the underlying asset.
Upon entering into a futures contract, the Fund pledges cash or securities with the broker in an amount sufficient to meet the initial margin requirement. The initial margin deposit must be maintained at an established level over the life of the contract. Cash deposited as initial margin is recorded in the Statement of Assets and Liabilities as margin deposits.
Securities deposited as initial margin are designated in the Portfolio of Investments. Subsequent payments (variation margin) are made or received by the Fund each day. The variation margin payments are equal to the daily change in the contract value and are recorded as variation margin receivable or payable and are offset in unrealized gains or losses. The Fund recognizes a realized gain or loss when the contract is closed or expires. Futures contracts involve, to varying degrees, risk of loss in excess of the variation margin disclosed in the Statement of Assets and Liabilities.
Offsetting of Derivative Assets and Derivative Liabilities
The following tables present the Fund's gross and net amount of assets and liabilities available for offset under netting arrangements as well as any related collateral received or pledged by the Fund as of February 28, 2014:
| | | | | | | Net Amounts of | | Gross Amounts Not Offset in
the Statement of Assets and Liabilities | | | |
| | Gross
Amounts of
Recognized
Assets ($) | | Gross Amounts
Offset in the
Statement of
Assets and
Liabilities ($) | | Assets
Presented in the
Statement of
Assets and
Liabilities ($) | | Financial
Instruments ($)(a) | | Cash
Collateral
Received ($) | | Securities
Collateral
Received ($) | | Net
Amount ($)(b) | |
Asset Derivatives: | |
Forward Foreign Currency
Exchange Contracts | | | 2,046,818 | | | | — | | | | 2,046,818 | | | | 953,322 | | | | — | | | | — | | | | 1,093,496 | | |
Total | | | 2,046,818 | | | | — | | | | 2,046,818 | | | | 953,322 | | | | — | | | | — | | | | 1,093,496 | | |
| | | | | | Net Amounts of | | Gross Amounts Not Offset in
the Statement of Assets and Liabilities | | | |
| | Gross
Amounts of
Recognized
Liabilities ($) | | Gross Amounts
Offset in the
Statement of
Assets and
Liabilities ($) | | Liabilities
Presented in the
Statement of
Assets and
Liabilities ($) | | Financial
Instruments ($)(c) | | Cash
Collateral
Pledged ($) | | Securities
Collateral
Pledged ($) | | Net
Amount($)(d) | |
Liability Derivatives: | |
Forward Foreign Currency
Exchange Contracts | | | 953,322 | | | | — | | | | 953,322 | | | | 953,322 | | | | — | | | | — | | | | — | | |
Total | | | 953,322 | | | | — | | | | 953,322 | | | | 953,322 | | | | — | | | | — | | | | — | | |
(a) Represents the amount of assets that could be offset by liabilities with the same counterparty under master netting or similar agreements that management elects not to offset on the Statement of Assets and Liabilities.
(b) Represents the net amount due from counterparties in the event of default.
(c) Represents the amount of liabilities that could be offset by assets with the same counterparty under master netting or similar agreements that management elects not to offset on the Statement of Assets and Liabilities.
(d) Represents the net amount due to counterparties in the event of default.
Effects of Derivative Transactions in the Financial Statements
The following tables are intended to provide additional information about the effect of derivatives on the financial statements of the Fund, including: the fair value of derivatives by risk category and the location of those fair values in the
Statement of Assets and Liabilities; the impact of derivative transactions over the period in the Statement of Operations including realized gains or losses and unrealized gains or losses. The derivative schedules following the Portfolio of Investments present additional information regarding derivative instruments outstanding at the end of the period, if any.
Annual Report 2014
40
Columbia Multi-Advisor International Equity Fund
Notes to Financial Statements (continued)
February 28, 2014
The following table is a summary of the fair value of derivative instruments at February 28, 2014.
Asset Derivatives | |
Risk Exposure
Category | | Statement of Assets and
Liabilities Location | |
Fair Value ($) | |
Equity risk
| | Net assets — unrealized
appreciation on futures
contracts | | | 592,514
| * | |
Foreign exchange
risk
| | Unrealized appreciation on
forward foreign currency
exchange contracts | | | 2,046,818
| | |
Total | | | | | 2,639,332 | | |
Liability Derivatives | |
Risk Exposure
Category | | Statement of Assets and
Liabilities Location | | Fair Value ($) | |
Foreign exchange
risk
| | Unrealized depreciation on
forward foreign currency
exchange contracts | | | 953,322
| | |
*Includes cumulative appreciation (depreciation) as reported in the tables following the Portfolio of Investments. Only the current day's variation margin is reported in receivables or payables in the Statement of Assets and Liabilities.
The following table indicates the effect of derivative instruments in the Statement of Operations for the year ended February 28, 2014:
Amount of Realized Gain (Loss) on Derivatives Recognized in Income | |
Risk Exposure
Category | | Forward Foreign
Currency Exchange
Contracts ($) | | Futures
Contracts ($)
| | Total ($)
| |
Equity risk | | | — | | | | 932,385 | | | | 932,385 | | |
Foreign exchange risk | | | (24,938,890 | ) | | | — | | | | (24,938,890 | ) | |
Total | | | (24,938,890 | ) | | | 932,385 | | | | (24,006,505 | ) | |
Change in Unrealized Appreciation (Depreciation) on
Derivatives Recognized in Income | |
Risk Exposure
Category | | Forward Foreign
Currency Exchange
Contracts ($) | | Futures
Contracts ($) | | Total ($) | |
Equity risk | | | — | | | | 616,902 | | | | 616,902 | | |
Foreign exchange risk | | | 5,373,299 | | | | — | | | | 5,373,299 | | |
Total | | | 5,373,299 | | | | 616,902 | | | | 5,990,201 | | |
The following table is a summary of the volume of derivative instruments for the year ended February 28, 2014:
Derivative Instrument | | Contracts Opened | |
Forward foreign currency exchange contracts | | | 654 | | |
Futures contracts | | | 1,500 | | |
Security Transactions
Security transactions are accounted for on the trade date. Cost is determined and gains (losses) are based upon the specific identification method for both financial statement and federal income tax purposes.
Income Recognition
Corporate actions and dividend income are generally recorded net of any non-reclaimable tax withholdings, on the ex-dividend date or upon receipt of ex-dividend notification in the case of certain foreign securities.
Awards from class action litigation are recorded as a reduction of cost basis if the Fund still owns the applicable securities on the payment date. If the Fund no longer owns the applicable securities, the proceeds are recorded as realized gains.
Expenses
General expenses of the Trust are allocated to the Fund and other funds of the Trust based upon relative net assets or other expense allocation methodologies determined by the nature of the expense. Expenses directly attributable to the Fund are charged to the Fund. Expenses directly attributable to a specific class of shares are charged to that share class.
Determination of Class Net Asset Value
All income, expenses (other than class-specific expenses, which are charged to that share class, as shown in the Statement of Operations) and realized and unrealized gains (losses) are allocated to each class of the Fund on a daily basis, based on the relative net assets of each class, for purposes of determining the net asset value of each class.
Federal Income Tax Status
The Fund intends to qualify each year as a regulated investment company under Subchapter M of the Internal Revenue Code, as amended, and will distribute substantially all of its taxable income (including net short-term capital gains), if any, for its tax year, and as such will not be subject to federal income taxes. In addition, the Fund intends to distribute in each calendar year substantially all of its net investment income, capital gains and certain other amounts, if any, such that the Fund should not be subject to federal excise tax. Therefore, no federal income or excise tax provision is recorded.
Foreign Taxes
The Fund may be subject to foreign taxes on income, gains on investments or currency repatriation, a portion of which may be recoverable. The Fund will accrue such taxes and recoveries, as applicable, based upon its current interpretation of tax rules and regulations that exist in the markets in which it invests.
Realized gains in certain countries may be subject to foreign taxes at the Fund level, based on statutory rates. The Fund accrues for such foreign taxes on realized and unrealized gains at the appropriate rate for each jurisdiction, as applicable. The amount, if any, is disclosed as a liability on the Statement of Assets and Liabilities.
Annual Report 2014
41
Columbia Multi-Advisor International Equity Fund
Notes to Financial Statements (continued)
February 28, 2014
Distributions to Shareholders
Distributions from net investment income, if any, are declared and paid semi-annually. Net realized capital gains, if any, are distributed at least annually. Income distributions and capital gain distributions are determined in accordance with federal income tax regulations, which may differ from GAAP.
Guarantees and Indemnifications
Under the Trust's organizational documents and, in some cases, by contract, its officers and trustees are indemnified against certain liabilities arising out of the performance of their duties to the Trust or its funds. In addition, certain of the Fund's contracts with its service providers contain general indemnification clauses. The Fund's maximum exposure under these arrangements is unknown since the amount of any future claims that may be made against the Fund cannot be determined, and the Fund has no historical basis for predicting the likelihood of any such claims.
Note 3. Fees and Compensation Paid to Affiliates
Investment Management Fees
Under an Investment Management Services Agreement, Columbia Management Investment Advisers, LLC (the Investment Manager), a wholly-owned subsidiary of Ameriprise Financial, Inc. (Ameriprise Financial), is responsible for the ultimate oversight of investments made by the Fund. The Fund's subadviser (see Subadvisory Agreement below) shares the responsibility for the day-to-day portfolio management of the Fund with the Investment Manager. The investment management fee is an annual fee that is equal to a percentage of the Fund's average daily net assets that declines from 0.79% to 0.62% as the Fund's net assets increase. The effective investment management fee rate for the year ended February 28, 2014 was 0.77% of the Fund's average daily net assets.
Subadvisory Agreements
The Investment Manager has entered into a Subadvisory Agreement with Threadneedle International Limited (Threadneedle), an affiliate of the Investment Manager and a wholly-owned subsidiary of Ameriprise Financial, to subadvise a portion of the Fund's assets. The Investment Manager compensates Threadneedle to manage the investment of a portion of the Fund's assets. Prior to May 20, 2013, Marsico Capital Management, LLC (Marsico) was also a subadviser to the Fund pursuant to a Subadvisory Agreement between the Investment Manager and Marsico. Threadneedle and Marsico each subadvised a portion of the Fund's assets. New investments in the Fund, net of any redemptions, were allocated in accordance with the Investment Manager's determination, subject to the oversight of the Board, of the allocation that was in the best interests of the shareholders.
Threadneedle's and Marsico's proportionate share of investments in the Fund varied due to market fluctuations. Prior to May 20, 2013, the Investment Manager also compensated Marsico for its services as subadviser. Marsico is not currently a subadviser to the Fund.
Administration Fees
Under an Administrative Services Agreement, the Investment Manager also serves as the Fund Administrator. The Fund pays the Fund Administrator an annual fee for administration and accounting services equal to a percentage of the Fund's average daily net assets that declines from 0.08% to 0.05% as the Fund's net assets increase. The effective administration fee rate for the year ended February 28, 2014 was 0.08% of the Fund's average daily net assets.
Other Expenses
Other expenses are for, among other things, miscellaneous expenses of the Fund or the Board, including payments to a company providing limited administrative services to the Fund and the Board. That company's expenses include boardroom and office expense, employee compensation, employee health and retirement benefits, and certain other expenses. For the year ended February 28, 2014, other expenses paid to this company were $3,536.
Compensation of Board Members
Board members are compensated for their services to the Fund as disclosed in the Statement of Operations. Under a Deferred Compensation Plan (the Plan), the Board members who are not "interested persons" of the Fund, as defined under the 1940 Act, may elect to defer payment of up to 100% of their compensation. Deferred amounts are treated as though equivalent dollar amounts had been invested in shares of certain funds managed by the Investment Manager. The Fund's liability for these amounts is adjusted for market value changes and remains in the Fund until distributed in accordance with the Plan.
Transfer Agent Fees
Under a Transfer and Dividend Disbursing Agent Agreement, Columbia Management Investment Services Corp. (the Transfer Agent), an affiliate of the Investment Manager and a wholly-owned subsidiary of Ameriprise Financial, is responsible for providing transfer agency services to the Fund. The Transfer Agent has contracted with Boston Financial Data Services (BFDS) to serve as sub-transfer agent.
The Transfer Agent receives monthly account-based service fees based on the number of open accounts and also receives sub-transfer agency fees based on a percentage of the average aggregate value of the Fund's shares maintained in omnibus accounts (other than omnibus accounts for which American Enterprise Investment Services Inc. is the broker of record or accounts where the beneficial shareholder is a customer of
Annual Report 2014
42
Columbia Multi-Advisor International Equity Fund
Notes to Financial Statements (continued)
February 28, 2014
Ameriprise Financial Services, Inc., which are paid a per account fee). The Transfer Agent pays the fees of BFDS for services as sub-transfer agent and is not entitled to reimbursement for such fees from the Fund (with the exception of out-of-pocket fees).
The Transfer Agent also receives compensation from fees for various shareholder services and reimbursements for certain out-of-pocket fees. Class I shares do not pay transfer agent fees. Total transfer agent fees for Class K and Class R5 shares are subject to an annual limitation of not more than 0.05% of the average daily net assets attributable to each share class. Class Y shares are not subject to transfer agent fees.
For the year ended February 28, 2014, the Fund's effective transfer agent fee rates as a percentage of average daily net assets of each class were as follows:
Class A | | | 0.23 | % | |
Class B | | | 0.23 | | |
Class C | | | 0.23 | | |
Class K | | | 0.05 | | |
Class R | | | 0.22 | | |
Class R4 | | | 0.23 | | |
Class R5 | | | 0.05 | | |
Class W | | | 0.22 | | |
Class Z | | | 0.23 | | |
An annual minimum account balance fee of $20 may apply to certain accounts with a value below the applicable share class's initial minimum investment requirements to reduce the impact of small accounts on transfer agent fees. These minimum account balance fees are recorded as part of expense reductions in the Statement of Operations. For the year ended February 28, 2014, these minimum account balance fees reduced total expenses by $28,863.
Plan Administration Fees
Under a Plan Administration Services Agreement with the Transfer Agent, the Fund pays an annual fee at a rate of 0.25% of the Fund's average daily net assets attributable to Class K shares for the provision of various administrative, recordkeeping, communication and educational services.
Distribution and Service Fees
The Fund has an agreement with Columbia Management Investment Distributors, Inc. (the Distributor), an affiliate of the Investment Manager and a wholly-owned subsidiary of Ameriprise Financial, for distribution and shareholder services. The Board has approved, and the Fund has adopted, distribution and shareholder service plans (the Plans) applicable to certain share classes, which set the distribution and service fees for the Fund. These fees are calculated daily and are intended to compensate the Distributor and/or eligible
selling and/or servicing agents for selling shares of the Fund and providing services to investors.
Under the Plans, the Fund pays a monthly combined distribution and service fee to the Distributor at the maximum annual rate of 0.25% of the average daily net assets attributable to Class A shares of the Fund. Also under the Plans, the Fund pays a monthly service fee at the maximum annual rate of 0.25% of the average daily net assets attributable to Class B and Class C shares of the Fund and the payment of a monthly distribution fee at the maximum annual rates of 0.75%, 0.75%, 0.50% and 0.25% of the average daily net assets attributable to Class B, Class C, Class R and Class W shares, respectively.
Although the Fund may pay a distribution fee up to 0.25% of the Fund's average daily net assets attributable to Class W shares and a service fee of up to 0.25% of the Fund's average daily net assets attributable to Class W shares, the aggregate fee shall not exceed 0.25% of the Fund's average daily net assets attributable to Class W shares.
Sales Charges
Sales charges, including front-end charges and CDSCs, received by the Distributor for distributing Fund shares were $83,756 for Class A, $1,914 for Class B and $234 for Class C shares for the year ended February 28, 2014.
Expenses Waived/Reimbursed by the Investment Manager and its Affiliates
The Investment Manager and certain of its affiliates have contractually agreed to waive fees and/or reimburse expenses (excluding certain fees and expenses described below) for the periods disclosed below, unless sooner terminated at the sole discretion of the Board, so that the Fund's net operating expenses, after giving effect to fees waived/expenses reimbursed and any balance credits and/or overdraft charges from the Fund's custodian, do not exceed the following annual rates as a percentage of the class' average daily net assets:
| | | July 1, 2013
through
June 30, 2014 | | Prior to
July 1, 2013 | |
Class A | | | 1.44 | % | | | 1.50 | % | |
Class B | | | 2.19 | | | | 2.25 | | |
Class C | | | 2.19 | | | | 2.25 | | |
Class I | | | 1.01 | | | | 1.05 | | |
Class K | | | 1.31 | | | | 1.35 | | |
Class R | | | 1.69 | | | | 1.75 | | |
Class R4 | | | 1.19 | | | | 1.25 | | |
Class R5 | | | 1.06 | | | | 1.10 | | |
Class W | | | 1.44 | | | | 1.50 | | |
Class Y | | | 1.01 | | | | 1.05 | | |
Class Z | | | 1.19 | | | | 1.25 | | |
Annual Report 2014
43
Columbia Multi-Advisor International Equity Fund
Notes to Financial Statements (continued)
February 28, 2014
Under the agreement governing these fee waivers and/or expense reimbursement arrangements, the following fees and expenses are excluded from the waiver/reimbursement commitment, and therefore will be paid by the Fund, if applicable: taxes (including foreign transaction taxes), expenses associated with investments in affiliated and non-affiliated pooled investment vehicles (including mutual funds and exchange traded funds), transaction costs and brokerage commissions, costs related to any securities lending program, dividend expenses associated with securities sold short, inverse floater program fees and expenses, transaction charges and interest on borrowed money, interest, extraordinary expenses and any other expenses the exclusion of which is specifically approved by the Board. This agreement may be modified or amended only with approval from all parties.
Note 4. Federal Tax Information
The timing and character of income and capital gain distributions are determined in accordance with income tax regulations, which may differ from GAAP because of temporary or permanent book to tax differences.
At February 28, 2014, these differences are primarily due to differing treatment for capital loss carryforwards, deferral/reversal of wash sales losses, Trustees' deferred compensation, foreign currency transactions, net operating loss reclassification, passive foreign investment company (PFIC) holdings, late-year ordinary losses, and derivative investments. To the extent these differences are permanent, reclassifications are made among the components of the Fund's net assets in the Statement of Assets and Liabilities. Temporary differences do not require reclassifications. In the Statement of Assets and Liabilities the following reclassifications were made:
Excess of distributions over net investment income | | $ | (6,988,049 | ) | |
Accumulated net realized loss | | | 28,780,913 | | |
Paid-in capital | | | (21,792,864 | ) | |
Net investment income and net realized gains (losses), as disclosed in the Statement of Operations, and net assets were not affected by this reclassification.
The tax character of distributions paid during the years indicated was as follows:
Year Ended February 28, | | 2014 | | 2013 | |
Ordinary income | | $ | — | | | $ | 35,449,418 | | |
Short-term capital gain distributions, if any, are considered ordinary income distributions for tax purposes.
At February 28, 2014, the components of distributable earnings on a tax basis were as follows:
Unrealized appreciation | | $ | 169,535,521 | | |
At February 28, 2014, the cost of investments for federal income tax purposes was $573,267,415 and the aggregate gross unrealized appreciation and depreciation based on that cost was:
Unrealized appreciation | | $ | 178,639,087 | | |
Unrealized depreciation | | | (9,103,566 | ) | |
Net unrealized appreciation | | $ | 169,535,521 | | |
The following capital loss carryforward, determined at February 28, 2014, may be available to reduce taxable income arising from future net realized gains on investments, if any, to the extent permitted by the Internal Revenue Code:
Year of Expiration | | Amount | |
2017 | | $ | 281,271,418 | | |
2018 | | | 552,155,697 | | |
Total | | $ | 833,427,115 | | |
For the year ended February 28, 2014, capital loss carryforwards of $6,897,207 were permanently lost and $136,400,604 of capital loss carryforward was utilized.
Under current tax rules, regulated investment companies can elect to treat certain late-year ordinary losses incurred and post-October capital losses (capital losses realized after October 31) as arising on the first day of the following taxable year. As of February 28, 2014, the Fund will elect to treat late-year ordinary losses of $8,600,677 as arising on March 1, 2014.
Management of the Fund has concluded that there are no significant uncertain tax positions that would require recognition in the financial statements. However, management's conclusion may be subject to review and adjustment at a later date based on factors including, but not limited to, new tax laws, regulations, and administrative interpretations (including relevant court decisions). Generally, the Fund's federal tax returns for the prior three fiscal years remain subject to examination by the Internal Revenue Service.
Note 5. Portfolio Information
The cost of purchases and proceeds from sales of securities, excluding short-term obligations, aggregated to $1,089,738,402 and $1,416,395,170, respectively, for the year ended February 28, 2014.
Note 6. Affiliated Money Market Fund
The Fund invests its daily cash balances in Columbia Short-Term Cash Fund, an affiliated money market fund established for the exclusive use by the Fund and other
Annual Report 2014
44
Columbia Multi-Advisor International Equity Fund
Notes to Financial Statements (continued)
February 28, 2014
affiliated funds. The income earned by the Fund from such investments is included as "Dividends — affiliated issuers" in the Statement of Operations. As an investing fund, the Fund indirectly bears its proportionate share of the expenses of Columbia Short-Term Cash Fund.
Note 7. Shareholder Concentration
At February 28, 2014, one unaffiliated shareholder account owned 23.9% of the outstanding shares of the Fund. The Fund has no knowledge about whether any portion of those shares was owned beneficially by such account. Affiliated shareholder accounts owned 26.4% of the outstanding shares of the Fund. Subscription and redemption activity by concentrated accounts may have a significant effect on the operations of the Fund.
Note 8. Line of Credit
The Fund has entered into a revolving credit facility with a syndicate of banks led by JPMorgan Chase Bank N.A. whereby the Fund may borrow for the temporary funding of shareholder redemptions or for other temporary or emergency purposes. The credit facility agreement, as amended, which is a collective agreement between the Fund and certain other funds managed by the Investment Manager, severally and not jointly, permits collective borrowings up to $500 million. Interest is charged to each participating fund based on its borrowings at a rate equal to the higher of (i) the overnight federal funds rate plus 1.00% or (ii) the one-month LIBOR rate plus 1.00%. Each borrowing under the credit facility matures no later than 60 days after the date of borrowing. Effective December 10, 2013, the Fund also pays a commitment fee equal to its pro rata share of the amount of the credit facility at a rate of 0.075% per annum. Prior to December 10, 2013, the commitment fee was charged at the annual rate of 0.08% per annum. The commitment fee is included in other expenses in the Statement of Operations.
For the year ended February 28, 2014, the average daily loan balance outstanding on days when borrowing existed was $4,700,000 at a weighted average interest rate of 1.16%. Interest expense incurred by the Fund is recorded as line of credit interest expense in the Statement of Operations.
Note 9. Significant Risks
Foreign Securities Risk
Investing in foreign securities may include certain risks and considerations not typically associated with investing in U.S. securities, such as fluctuating currency values and changing local and regional economic, political and social conditions, which may result in greater market volatility. In addition, certain foreign securities may not be as liquid as U.S. securities. Investing in emerging markets may accentuate these risks.
Investments in emerging market countries are subject to additional risk. The risk of foreign investments is typically increased in less developed countries. These countries are also more likely to experience high levels of inflation, deflation or currency devaluation which could hurt their economies and securities markets.
Financial Sector Risk
Sector risk occurs when a fund invests a significant portion of its assets in securities of companies conducting business in a related group of industries within an economic sector. Companies in the same economic sector may be similarly affected by economic, regulatory, political or market events or conditions, making a fund more vulnerable to unfavorable developments in that economic sector than funds that invest more broadly. The Fund may be more susceptible to the particular risks that may affect companies in the financial sector than if it were invested in a wider variety of companies in unrelated sectors.
Note 10. Subsequent Events
Management has evaluated the events and transactions that have occurred through the date the financial statements were issued and noted no items requiring adjustment of the financial statements or additional disclosure.
Note 11. Information Regarding Pending and Settled Legal Proceedings
In December 2005, without admitting or denying the allegations, American Express Financial Corporation (AEFC, which is now known as Ameriprise Financial, Inc. (Ameriprise Financial)) entered into settlement agreements with the Securities and Exchange Commission (SEC) and Minnesota Department of Commerce (MDOC) related to market timing activities. As a result, AEFC was censured and ordered to cease and desist from committing or causing any violations of certain provisions of the Investment Advisers Act of 1940, the Investment Company Act of 1940, and various Minnesota laws. AEFC agreed to pay disgorgement of $10 million and civil money penalties of $7 million. AEFC also agreed to retain an independent distribution consultant to assist in developing a plan for distribution of all disgorgement and civil penalties ordered by the SEC in accordance with various undertakings detailed at www.sec.gov/litigation/admin/ia-2451.pdf. Ameriprise Financial and its affiliates have cooperated with the SEC and the MDOC in these legal proceedings, and have made regular reports to the Funds' Boards of Trustees.
Ameriprise Financial and certain of its affiliates have historically been involved in a number of legal, arbitration and regulatory proceedings, including routine litigation, class actions, and governmental actions, concerning matters arising in connection with the conduct of their business activities.
Annual Report 2014
45
Columbia Multi-Advisor International Equity Fund
Notes to Financial Statements (continued)
February 28, 2014
Ameriprise Financial believes that the Funds are not currently the subject of, and that neither Ameriprise Financial nor any of its affiliates are the subject of, any pending legal, arbitration or regulatory proceedings that are likely to have a material adverse effect on the Funds or the ability of Ameriprise Financial or its affiliates to perform under their contracts with the Funds. Ameriprise Financial is required to make 10-Q, 10-K and, as necessary, 8-K filings with the Securities and Exchange Commission on legal and regulatory matters that relate to Ameriprise Financial and its affiliates. Copies of these filings may be obtained by accessing the SEC website at www.sec.gov.
There can be no assurance that these matters, or the adverse publicity associated with them, will not result in increased fund redemptions, reduced sale of fund shares or other adverse consequences to the Funds. Further, although we believe proceedings are not likely to have a material adverse effect on the Funds or the ability of Ameriprise Financial or its affiliates to perform under their contracts with the Funds, these proceedings are subject to uncertainties and, as such, we are unable to estimate the possible loss or range of loss that may result. An adverse outcome in one or more of these proceedings could result in adverse judgments, settlements, fines, penalties or other relief that could have a material adverse effect on the consolidated financial condition or results of operations of Ameriprise Financial.
Annual Report 2014
46
Columbia Multi-Advisor International Equity Fund
Report of Independent Registered Public Accounting Firm
To the Trustees of Columbia Funds Series Trust and the Shareholders of
Columbia Multi-Advisor International Equity Fund
In our opinion, the accompanying statement of assets and liabilities, including the portfolio of investments, and the related statements of operations and of changes in net assets and the financial highlights present fairly, in all material respects, the financial position of Columbia Multi-Advisor International Equity Fund (the "Fund", a series of Columbia Funds Series Trust) at February 28, 2014, and the results of its operations, the changes in its net assets and the financial highlights for each of the periods indicated, in conformity with accounting principles generally accepted in the United States of America. These financial statements and financial highlights (hereafter referred to as "financial statements") are the responsibility of the Fund's management; our responsibility is to express an opinion on these financial statements based on our audits. We conducted our audits of these financial statements in accordance with the standards of the Public Company Accounting Oversight Board (United States). Those standards require that we plan and perform the audit to obtain reasonable assurance about whether the financial statements are free of material misstatement. An audit includes examining, on a test basis, evidence supporting the amounts and disclosures in the financial statements, assessing the accounting principles used and significant estimates made by management, and evaluating the overall financial statement presentation. We believe that our audits, which included confirmation of securities at February 28, 2014 by correspondence with the custodian, brokers and transfer agent, and the application of alternative auditing procedures where such confirmations had not been received, provide a reasonable basis for our opinion.
PricewaterhouseCoopers LLP
Minneapolis, Minnesota
April 21, 2014
Annual Report 2014
47
Columbia Multi-Advisor International Equity Fund
Federal Income Tax Information
(Unaudited)
The Fund hereby designates the following tax attributes for the fiscal year ended February 28, 2014. Shareholders will be notified in early 2015 of the amounts for use in preparing 2014 income tax returns.
Tax Designations:
Foreign Taxes Paid | | $ | 1,888,275 | | |
Foreign Source Income | | $ | 25,863,917 | | |
Foreign Taxes. The Fund makes the election to pass through to shareholders the foreign taxes paid. These taxes, and the corresponding foreign source income, are provided.
Annual Report 2014
48
Columbia Multi-Advisor International Equity Fund
Shareholders elect the Board that oversees the Funds' operations. The Board appoints officers who are responsible for day-to-day business decisions based on policies set by the Board. The following table provides basic biographical information about the Funds' Board members, including their principal occupations during the past five years, although specific titles for individuals may have varied over the period. Under current Board policy, members may serve through the end of the calendar year in which he or she reaches either the mandatory retirement age established by the Board or the fifteenth anniversary of the first Board meeting they attended as a member of the Board.
Independent Trustees
Name,
Address,
Year of Birth | | Position Held With
Funds and Length of
Service | | Principal Occupation(s)
During Past Five Years
and Other Relevant
Professional Experience | | Number of
Funds in the
Fund Family
Overseen by
Board Member | | Other Present or Past
Directorships/
Trusteeships
(Within Past 5 Years) | |
Kathleen Blatz
901 S. Marquette Ave.
Minneapolis, MN 55402
1954 | | Board member since 1/06 for RiverSource Funds and since 6/11 for Nations Funds | | Attorney; Chief Justice, Minnesota Supreme
Court, 1998-2006 | | | 131 | | | Trustee, BlueCross BlueShield of Minnesota since 2009 | |
Edward J. Boudreau, Jr.
901 S. Marquette Ave.
Minneapolis, MN 55402
1944 | | Board member since 6/11 for RiverSource Funds and since 1/05 for Nations Funds | | Managing Director, E.J. Boudreau & Associates (consulting) since 2000; Chairman and Chief Executive Officer, John Hancock Funds (mutual funds), 1989-2000 | | | 129 | | | Former Trustee, BofA Funds Series Trust (11 funds), 2005-2011 | |
Pamela G. Carlton
901 S. Marquette Ave.
Minneapolis, MN 55402
1954 | | Board member since 7/07 for RiverSource Funds and since 6/11 for Nations Funds | | President, Springboard — Partners in Cross Cultural Leadership (consulting company) since 2003; Director or Management Director of US Equity Research, Chase Asset Management, 1996-2003; Investment Banker, Morgan Stanley, 1982-1996 | | | 131 | | | None | |
William P. Carmichael
901 S. Marquette Ave.
Minneapolis, MN 55402
1943 | | Chair of the Board since 1/14, Board member since 6/11 for RiverSource Funds and since 2003 for Nations Funds | | Retired; Co-founder, The Succession Fund (provides exit strategies to owners of privately held companies); previously, Senior Vice President, Sara Lee Corporation; Senior Vice President and Chief Financial officer, Beatrice Foods Company; Vice President, Esmark, Inc.; Associate, Price Waterhouse | | | 131 | | | Director, Cobra Electronics Corporation (electronic equipment manufacturer); The Finish Line (athletic shoes and apparel) since July 2003; Director, International Textile Corp. since 2012; former Director, McMoRan Exploration Company (oil and gas exploration and development) 2010-2013; former Trustee, BofA Funds Series Trust (11 funds), 2009-2011; Director, Spectrum Brands, Inc. (consumer products), 2002-2009; Director, Simmons Company (bedding), 2004-2010 | |
Annual Report 2014
49
Columbia Multi-Advisor International Equity Fund
Trustees and Officers (continued)
Independent Trustees (continued)
Name,
Address,
Year of Birth | | Position Held With
Funds and Length of
Service | | Principal Occupation(s)
During Past Five Years
and Other Relevant
Professional Experience | | Number of
Funds in the
Fund Family
Overseen by
Board Member | | Other Present or Past
Directorships/
Trusteeships
(Within Past 5 Years) | |
Patricia M. Flynn
901 S. Marquette Ave.
Minneapolis, MN 55402
1950 | | Board member since 11/04 for RiverSource Funds and since 6/11 for Nations Funds | | Trustee Professor of Economics and Management, Bentley University since 1976 (also teaches and conducts research on corporate governance); Dean, McCallum Graduate School of Business, Bentley University, 1992-2002 | | | 131 | | | None | |
William A. Hawkins
901 S. Marquette Ave.
Minneapolis, MN 55402
1942 | | Board member since 6/11 for RiverSource Funds and since 1/05 for Nations Funds | | Managing Director, Overton Partners (financial consulting), since August 2010; President and Chief Executive Officer, California General Bank, N.A., January 2008-August 2010 | | | 129 | | | Trustee, BofA Funds Series Trust (11 funds) | |
R. Glenn Hilliard
901 S. Marquette Ave.
Minneapolis, MN 55402
1943 | | Board member since 6/11 for RiverSource Funds and since 1/05 for Nations Funds | | Chairman and Chief Executive Officer, Hilliard Group LLC (investing and consulting) since April 2003; Non-Executive Director & Chairman, CNO Financial Group, Inc. (insurance), September 2003-May 2011 | | | 129 | | | Chairman, BofA Fund Series Trust (11 funds); former Director, CNO Financial Group, Inc. (insurance), 2003-2011 | |
Stephen R. Lewis, Jr.
901 S. Marquette Ave.
Minneapolis, MN 55402
1939 | | Board member for RiverSource Funds since 1/02 and since 6/11 for Nations Funds, Board Chair 1/07-12/13 | | President Emeritus and Professor of Economics Emeritus, Carleton College since 2002 | | | 131 | | | Director, Valmont Industries, Inc. (irrigation systems manufacturer), 2002-2013 | |
Catherine James Paglia
901 S. Marquette Ave.
Minneapolis, MN 55402
1952 | | Board member since 11/04 for RiverSource Funds and since 6/11 for Nations Funds | | Director, Enterprise Asset Management, Inc. (private real estate and asset management company) since September 1998 | | | 131 | | | Director, Valmont Industries, Inc. (irrigation systems manufacturer) since 2012 | |
Leroy C. Richie
901 S. Marquette Ave.
Minneapolis, MN 55402
1941 | | Board member since 2000 for Legacy Seligman Funds, since 11/08 for RiverSource Funds and since 6/11 for Nations Funds | | Counsel, Lewis & Munday, P.C. (law firm) since 2004; Vice President and General Counsel, Automotive Legal Affairs, Chrysler Corporation, 1993-1997 | | | 131 | | | Lead Outside Director, Digital Ally, Inc. (digital imaging) since September 2005; Director, Infinity, Inc. (oil and gas exploration and production) since 1994; Director, OGE Energy Corp. (energy and energy services) since November 2007 | |
Minor M. Shaw
901 S. Marquette Ave.
Minneapolis, MN 55402
1947 | | Board member since 6/11 for RiverSource Funds and since 2003 for Nations Funds | | President, Micco LLC (private investments) since 2011; President, Micco Corp. since 1998 | | | 129 | | | Director, Piedmont Natural Gas; Director, BlueCross BlueShield of South Carolina since April 2008; Director, National Association of Corporate Directors, Carolinas Chapter, since 2013; former Trustee, BofA Funds Series Trust (11 funds) | |
Annual Report 2014
50
Columbia Multi-Advisor International Equity Fund
Trustees and Officers (continued)
Independent Trustees (continued)
Name,
Address,
Year of Birth | | Position Held With
Funds and Length of
Service | | Principal Occupation(s)
During Past Five Years
and Other Relevant
Professional Experience | | Number of
Funds in the
Fund Family
Overseen by
Board Member | | Other Present or Past
Directorships/
Trusteeships
(Within Past 5 Years) | |
Alison Taunton-Rigby
901 S. Marquette Ave.
Minneapolis, MN 55402
1944 | | Board member since 11/02 for RiverSource Funds and since 6/11 for Nations Funds | | Chief Executive Officer and Director, RiboNovix, Inc., (biotechnology) 2003-2010 | | | 131 | | | Director, Healthways, Inc. (health and wellbeing solutions) since 2005; Director, ICI Mutual Insurance Company, RRG since 2011; Director, Abt Associates (government contractor) since 2001; Director, Boston Children's Hospital since 2002 | |
Interested Trustee Not Affiliated with Investment Manager*
Name,
Address,
Year of Birth | | Position Held With
Funds and Length of
Service | | Principal Occupation(s)
During Past Five Years
and Other Relevant
Professional Experience | | Number of
Funds in the
Fund Family
Overseen by
Board Member | | Other Present or Past
Directorships/
Trusteeships
(Within Past 5 Years) | |
Anthony M. Santomero
901 S. Marquette Ave.
Minneapolis, MN 55402
1946 | | Board member since 6/11 for RiverSource Funds and since 1/08 for Nations Funds | | Richard K. Mellon Professor Emeritus of Finance, The Wharton School, University of Pennsylvania, since 2002; Senior Advisor, McKinsey & Company (consulting), 2006-2008 | | | 129 | | | Director, Renaissance Reinsurance Ltd. since May 2008; Trustee, Penn Mutual Life Insurance Company since March 2008; Director, Citigroup Inc. since 2009; Director, Citibank, N.A. since 2009; former Trustee, BofA Funds Series Trust (11 funds), 2008-2011 | |
* Dr. Santomero is not an affiliated person of the Investment Manager or Ameriprise Financial. However, he is currently deemed by the Funds to be an "interested person" (as defined in the 1940 Act) of the Funds because he serves as a Director of Citigroup Inc. and Citibank, N.A., companies that may directly or through subsidiaries and affiliates engage from time-to-time in brokerage execution, principal transactions and lending relationships with the Funds or accounts advised/managed by the Investment Manager.
Annual Report 2014
51
Columbia Multi-Advisor International Equity Fund
Trustees and Officers (continued)
Interested Trustee Affiliated with Investment Manager*
Name,
Address,
Year of Birth | | Position Held With
Funds and Length of
Service | | Principal Occupation(s)
During Past Five Years
and Other Relevant
Professional Experience | | Number of
Funds in the
Fund Family
Overseen by
Board Member | | Other Present or Past
Directorships/
Trusteeships
(Within Past 5 Years) | |
William F. Truscott
53600 Ameriprise
Financial Center
Minneapolis, MN 55474
1960 | | Board member since 11/01 for RiverSource Funds and since 6/11 for Nations Funds; Senior Vice President since 2002 for RiverSource Funds and since 5/10 for Nations Funds | | Chairman of the Board and President, Columbia Management Investment Advisers, LLC since May 2010 and February 2012, respectively (previously President and Chief Investment Officer, 2001-April 2010); Chief Executive Officer, Global Asset Management, Ameriprise Financial, Inc. since September 2012 (previously Chief Executive Officer, U.S. Asset Management & President, Annuities, May 2010-September 2012 and President — U.S. Asset Management and Chief Investment Officer, 2005-April 2010); Director and Chief Executive Officer, Columbia Management Investment Distributors, Inc. since May 2010 and February 2012, respectively (previously Chairman of the Board and Chief Executive Officer, 2006-April 2010); Chairman of the Board and Chief Executive Officer, RiverSource Distributors, Inc. since 2006; Director, Threadneedle Asset Management Holdings, SARL since 2014; President and Chief Executive Officer, Ameriprise Certificate Company, 2006-August 2012 | | | 183 | | | Former Director, Ameriprise Certificate Company, 2006-January 2013 | |
* Interested person (as defined under the 1940 Act) by reason of being an officer, director, security holder and/or employee of the Investment Manager or Ameriprise Financial.
The SAI has additional information about the Fund's Board members and is available, without charge, upon request by calling 800.345.6611; contacting your financial intermediary; or visiting columbiamanagement.com.
Annual Report 2014
52
Columbia Multi-Advisor International Equity Fund
Trustees and Officers (continued)
The Board has appointed officers who are responsible for day-to-day business decisions based on policies it has established. The officers serve at the pleasure of the Board. In addition to Mr. Truscott, who is Senior Vice President, the Funds' other officers are:
Officers
Name,
Address and
Year of Birth | | Position and Year
First Appointed to
Position for any Fund
in the Columbia
Funds Complex or a
Predecessor Thereof | | Principal Occupation(s) During Past Five Years | |
J. Kevin Connaughton
225 Franklin Street
Boston, MA 02110
Born 1964 | | President and Principal Executive Officer (2009) | | Managing Director and General Manager — Mutual Fund Products, Columbia Management Investment Advisers, LLC since May 2010; and President, Columbia Funds since 2009; Managing Director, Columbia Management Advisors, LLC, December 2004 – April 2010; Senior Vice President and Chief Financial Officer, Columbia Funds, June 2008 – January 2009; and senior officer of Columbia Funds and affiliated funds since 2003 | |
Michael G. Clarke
225 Franklin Street
Boston, MA 02110
Born 1969 | | Treasurer (2011) and Chief Financial Officer (2009) | | Vice President — Mutual Fund Administration, Columbia Management Investment Advisers, LLC, since May 2010;Managing Director of Fund Administration, Columbia Management Advisors, LLC, September 2004 – April 2010; and senior officer of Columbia Funds and affiliated funds since 2002 | |
Scott R. Plummer
5228 Ameriprise Financial Center
Minneapolis, MN 55474
Born 1959 | | Senior Vice President (2006), Chief Legal Officer (2006) and Assistant Secretary (2011) | | Senior Vice President and Assistant General Counsel — Global Asset Management, Ameriprise Financial since February 2014 (previously, Senior Vice President and Lead Chief Counsel — Asset Management, 2012 – February 2014; Vice President and Lead Chief Counsel — Asset Management, 2010 – 2012; and Vice President and Chief Counsel — Asset Management, 2005 – 2010); Senior Vice President, Chief Legal Officer and Assistant Secretary, Columbia Management Investment Advisers, LLC since June 2005; Vice President, Chief Counsel and Assistant Secretary, Columbia Management Investment Distributors, Inc. since 2008; Vice President, General Counsel and Secretary, Ameriprise Certificate Company since 2005; Chief Counsel, RiverSource Distributors, Inc. since 2006; senior officer of Columbia Funds and affiliated funds since 2006 | |
Thomas P. McGuire
225 Franklin Street
Boston, MA 02110
Born 1972 | | Chief Compliance Officer (2012) | | Vice President — Asset Management Compliance, Ameriprise Financial, Inc. since May 2010; Chief Compliance Officer, Ameriprise Certificate Company, since September 2010; Compliance Executive, Bank of America, 2005 – April 2010 | |
Colin Moore
225 Franklin Street
Boston, MA 02110
Born 1958 | | Senior Vice President (2010) | | Executive Vice President and Global Chief Investment Officer, Ameriprise Financial, Inc. since July 2013; Director and Global Chief Investment Officer, Columbia Management Investment Advisers, LLC since May 2010; Manager, Managing Director and Chief Investment Officer, Columbia Management Advisors, LLC, 2007 – April 2010 | |
Michael E. DeFao
225 Franklin Street
Boston, MA 02110
Born 1968 | | Vice President (2011) and Assistant Secretary (2010) | | Vice President and Chief Counsel, Ameriprise Financial, Inc. since May 2010; Associate General Counsel, Bank of America 2005 – April 2010 | |
Joseph F. DiMaria
225 Franklin Street
Boston, MA 02110
Born 1968 | | Vice President (2011) and Chief Accounting Officer (2008) | | Vice President — Mutual Fund Treasurer, Columbia Management Investment Advisers, LLC since May 2010; Director of Fund Administration, Columbia Management Advisors, LLC, 2006 – April 2010 | |
Paul B. Goucher
100 Park Avenue
New York, NY 10017
Born 1968 | | Vice President (2011) and Assistant Secretary (2008) | | Vice President and Lead Chief Counsel, Ameriprise Financial, Inc. since November 2008 and January 2013, respectively (previously Chief Counsel, January 2010 – January 2013, and Group Counsel, November 2008 – January 2010); Director, Managing Director and General Counsel, J. & W. Seligman & Co. Incorporated, July 2008 – November 2008 | |
Amy Johnson
5228 Ameriprise Financial
Center
Minneapolis, MN 55474
Born 1965 | | Vice President (2006) | | Managing Director and Chief Operating Officer, Columbia Management Investment Advisers, LLC since May 2010 (previously Chief Administrative Officer, 2009 – April 2010, and Vice President — Asset Management and Trust Company Services, 2006 – 2009) | |
Annual Report 2014
53
Columbia Multi-Advisor International Equity Fund
Trustees and Officers (continued)
Officers (continued)
Name,
Address and
Year of Birth | | Position and Year
First Appointed to
Position for any Fund
in the Columbia
Funds Complex or a
Predecessor Thereof | | Principal Occupation(s) During Past Five Years | |
Paul D. Pearson
5228 Ameriprise Financial
Center
Minneapolis, MN 55474
Born 1956 | | Vice President (2011) and Assistant Treasurer (1999) | | Vice President — Investment Accounting, Columbia Management Investment Advisers, LLC since May 2010; Vice President — Managed Assets, Investment Accounting, Ameriprise Financial, Inc., 1998 – April 2010 | |
Christopher O. Petersen
5228 Ameriprise Financial Center
Minneapolis, MN 55474
Born 1970 | | Vice President and Secretary (2010) | | Vice President and Chief Counsel, Ameriprise Financial, Inc., since January 2010 (previously Vice President and Group Counsel or Counsel, 2004 – January 2010); officer of Columbia Funds and affiliated funds since 2007 | |
Stephen T. Welsh
225 Franklin Street
Boston, MA 02110
Born 1957 | | Vice President (2006) | | President and Director, Columbia Management Investment Services Corp. since May 2010; President and Director, Columbia Management Services, Inc., 2004 – April 2010; Managing Director, Columbia Management Distributors, Inc., 2007 – April 2010 | |
Annual Report 2014
54
This page intentionally left blank.
Annual Report 2014
55
This page intentionally left blank.
Annual Report 2014
56
Columbia Multi-Advisor International Equity Fund
Important Information About This Report
Each fund mails one shareholder report to each shareholder address. If you would like more than one report, please call shareholder services at 800.345.6611 and additional reports will be sent to you.
The policy of the Board is to vote the proxies of the companies in which each fund holds investments consistent with the procedures as stated in the Statement of Additional Information (SAI). You may obtain a copy of the SAI without charge by calling 800.345.6611; contacting your financial intermediary; visiting columbiamanagement.com; or searching the website of the Securities and Exchange Commission (SEC) at sec.gov. Information regarding how each fund voted proxies relating to portfolio securities is filed with the SEC by August 31 for the most recent 12-month period ending June 30 of that year, and is available without charge by visiting columbiamanagement.com; or searching the website of the SEC at sec.gov.
Each fund files a complete schedule of portfolio holdings with the SEC for the first and third quarters of each fiscal year on Form N-Q. Each fund's Form N-Q is available on the SEC's website at sec.gov and may be reviewed and copied at the SEC's Public Reference Room in Washington, D.C. Information on the operation of the Public Reference Room may be obtained by calling 800.SEC.0330. Each fund's complete schedule of portfolio holdings, as filed on Form N-Q, can also be obtained without charge, upon request, by calling 800.345.6611.
Annual Report 2014
57

Columbia Multi-Advisor International Equity Fund
P.O. Box 8081
Boston, MA 02266-8081
columbiamanagement.com
This information is for use with concurrent or prior delivery of a fund prospectus. Please read and consider the investment objectives, risks, charges and expenses for any fund carefully before investing. For a prospectus and, if available, a summary prospectus, which contains this and other important information about the Fund go to columbiamanagement.com. The Fund is distributed by Columbia Management Investment Distributors, Inc., member FINRA, and managed by Columbia Management Investment Advisers, LLC.
© 2014 Columbia Management Investment Advisers, LLC. All rights reserved.
ANN201_02_D01_(04/14)
Annual Report
February 28, 2014

Columbia Overseas Value Fund
Not FDIC insured • No bank guarantee • May lose value
 Dear Shareholders,
Equities recovered
In the final months of 2013, the U.S. economy embraced a robust recovery. After five years of only modest progress, the pace of economic growth picked up, job gains continued, manufacturing activity accelerated and a rebound in the housing market showed staying power. Growth, as measured by gross domestic product, was 4.1% in the third quarter, with expectations for a solid fourth quarter. Job growth averaged close to 200,000 monthly. Industrial production rose at a rate of 3.3%, considerably higher than the 12-month average of 2.5%. Factories were busier than at any point since the 2008/2009 recession, with capacity utilization at 79%. Orders for durable goods were strong, bolstered by rising auto sales. Holiday spending was solid, especially online sales, which rose 10% year over year, despite a shorter season.
Against this backdrop, the Federal Reserve's (the Fed's) announcement that it would slowly retreat from its monthly bond buying program and a bipartisan budget deal in Washington were welcome news for investors. Stocks climbed to new highs in the fourth quarter, while bonds retreated as yields moved higher. Small-cap stocks outperformed large- and mid-cap stocks, led by significant gains from the industrials, technology and consumer discretionary sectors. All 10 sectors of the S&P 500 Index delivered positive returns, although telecommunications and utilities posted only modest gains.
Fixed-income retreated
Improved economic data drove interest rates higher over the fourth quarter, credit spreads narrowed and the dollar weakened against most developed market currencies. Against this backdrop, most non-Treasury, fixed-income sectors delivered positive returns. Outgoing Fed chairman Ben Bernanke expressed concern about the persistently low level of core inflation, but gains in the labor market and reduced unemployment led to the Fed's decision to taper its bond-buying program gradually beginning in January 2014.
As the stock market soared, the riskiest sectors of the fixed-income markets fared the best. U.S. and foreign high-yield bonds were the strongest performers, followed by emerging-market and U.S. investment-grade corporate bonds. U.S. mortgage-backed securities (MBS) and securitized bonds produced negative total returns, as did U.S. Treasuries and developed world government bonds. Treasury inflation-protected bonds were the period's biggest losers. Investment-grade municipals delivered fractional gains, as better economic conditions helped steady state finances.
Stay on track with Columbia Management
Backed by more than 100 years of experience, Columbia Management is one of the nation's largest asset managers. At the heart of our success and, most importantly, that of our investors, are highly talented industry professionals, brought together by a unique way of working. At Columbia Management, reaching our performance goals matters, and how we reach them matters just as much.
Visit columbiamanagement.com for:
> The Columbia Management Perspectives blog, offering insights on current market events and investment opportunities
> Detailed up-to-date fund performance and portfolio information
> Quarterly fund commentaries
> Columbia Management Investor, our award-winning quarterly newsletter for shareholders
Thank you for your continued support of the Columbia Funds. We look forward to serving your investment needs for many years to come.
Best Regards,

J. Kevin Connaughton
President, Columbia Funds
Investing involves risk including the risk of loss of principal.
The S&P 500 Index, an unmanaged index, measures the performance of 500 widely held, large-capitalization U.S. stocks and is frequently used as a general measure of market performance. The Dow Jones Industrial Average is a price weighted average of 30 actively traded shares of blue chip US industrial corporations listed on the New York Stock Exchange. Indices are not available for investment, are not professionally managed and do not reflect sales charges, fees, brokerage commissions, taxes or other expenses of investing.
Investors should consider the investment objectives, risks, charges and expenses of a mutual fund carefully before investing. For a free prospectus and, if available, a summary prospectus, which contains this and other important information about a fund, visit columbiamanagement.com. The prospectus should be read carefully before investing.
Columbia Funds are distributed by Columbia Management Investment Distributors, Inc., member FINRA, and managed by Columbia Management Investment Advisers, LLC.
© 2014 Columbia Management Investment Advisers, LLC. All rights reserved.
Columbia Overseas Value Fund
Performance Overview | | | 2 | | |
Manager Discussion of Fund Performance | | | 4 | | |
Understanding Your Fund's Expenses | | | 8 | | |
Portfolio of Investments | | | 9 | | |
Statement of Assets and Liabilities | | | 15 | | |
Statement of Operations | | | 17 | | |
Statement of Changes in Net Assets | | | 18 | | |
Financial Highlights | | | 20 | | |
Notes to Financial Statements | | | 27 | | |
Report of Independent Registered
Public Accounting Firm | | | 38 | | |
Federal Income Tax Information | | | 39 | | |
Trustees and Officers | | | 40 | | |
Important Information About This Report | | | 49 | | |
Fund Investment Manager
Columbia Management Investment
Advisers, LLC
225 Franklin Street
Boston, MA 02110
Fund Distributor
Columbia Management Investment
Distributors, Inc.
225 Franklin Street
Boston, MA 02110
Fund Transfer Agent
Columbia Management Investment
Services Corp.
P.O. Box 8081
Boston, MA 02266-8081
For more information about any of the funds, please visit columbiamanagement.com or call 800.345.6611. Customer Service Representatives are available to answer your questions Monday through Friday from 8 a.m. to 7 p.m. Eastern time.
The views expressed in this report reflect the current views of the respective parties. These views are not guarantees of future performance and involve certain risks, uncertainties and assumptions that are difficult to predict, so actual outcomes and results may differ significantly from the views expressed. These views are subject to change at any time based upon economic, market or other conditions and the respective parties disclaim any responsibility to update such views. These views may not be relied on as investment advice and, because investment decisions for a Columbia Fund are based on numerous factors, may not be relied on as an indication of trading intent on behalf of any particular Columbia Fund. References to specific securities should not be construed as a recommendation or investment advice.
Columbia Overseas Value Fund
Performance Summary
> Columbia Overseas Value Fund (the Fund) Class A shares returned 22.10% excluding sales charges for the 12-month period that ended February 28, 2014.
> The Fund outperformed its benchmark, the MSCI EAFE Value Index (Net), which returned 21.15% for the same time period.
> Stock selection helped the Fund outperform its benchmark. A position in U.S. stocks, which are not included in the benchmark, and strong stock selection in the consumer discretionary and health care sectors also aided relative results.
Average Annual Total Returns (%) (for period ended February 28, 2014)
| | Inception | | 1 Year | | 5 Years | | Life | |
Class A* | | 02/28/13 | | | | | | | | | | | | | |
Excluding sales charges | | | | | | | 22.10 | | | | 18.24 | | | | 1.17 | | |
Including sales charges | | | | | | | 15.04 | | | | 16.86 | | | | 0.16 | | |
Class B* | | 02/28/13 | | | | | | | | | | | | | |
Excluding sales charges | | | | | | | 21.13 | | | | 17.35 | | | | 0.40 | | |
Including sales charges | | | | | | | 16.13 | | | | 17.14 | | | | 0.25 | | |
Class C* | | 02/28/13 | | | | | | | | | | | | | |
Excluding sales charges | | | | | | | 21.13 | | | | 17.35 | | | | 0.40 | | |
Including sales charges | | | | | | | 20.13 | | | | 17.35 | | | | 0.40 | | |
Class I* | | 03/31/11 | | | 22.55 | | | | 18.90 | | | | 1.74 | | |
Class K* | | 02/28/13 | | | 22.25 | | | | 18.22 | | | | 1.15 | | |
Class W* | | 03/31/11 | | | 21.97 | | | | 18.62 | | | | 1.52 | | |
Class Z | | 03/31/08 | | | 22.19 | | | | 18.80 | | | | 1.67 | | |
MSCI EAFE Value Index (Net) | | | | | | | 21.15 | | | | 17.86 | | | | 1.79 | | |
Returns for Class A are shown with and without the maximum initial sales charge of 5.75%. Returns for Class B are shown with and without the applicable contingent deferred sales charge (CDSC) of 5.00% in the first year, declining to 1.00% in the sixth year and eliminated thereafter. Returns for Class C are shown with and without the 1.00% CDSC for the first year only. The Fund's other classes are not subject to sales charges and have limited eligibility. Please see the Fund's prospectus for details. Performance for different share classes will vary based on differences in sales charges and fees associated with each class. All results shown assume reinvestment of distributions during the period. Returns do not reflect the deduction of taxes that a shareholder may pay on Fund distributions or on the redemption of Fund shares. Performance results reflect the effect of any fee waivers or reimbursements of Fund expenses by Columbia Management Investment Advisers, LLC and/or any of its affiliates. Absent these fee waivers or expense reimbursement arrangements, performance results would have been lower.
The performance information shown represents past performance and is not a guarantee of future results. The investment return and principal value of your investment will fluctuate so that your shares, when redeemed, may be worth more or less than their original cost. Current performance may be lower or higher than the performance information shown. You may obtain performance information current to the most recent month-end by contacting your financial intermediary, visiting columbiamanagement.com or calling 800.345.6611.
*The returns shown for periods prior to the share class inception date (including returns for the Life of the Fund, if shown, which are since Fund inception) include the returns of the Fund's oldest share class. These returns are adjusted to reflect any higher class-related operating expenses of the newer share classes, as applicable. Please visit columbiamanagement.com/mutual-funds/appended-performance for more information.
The MSCI EAFE Value Index (Net) is a subset of the MSCI EAFE Index (Net), and constituents of the index include securities from Europe, Australasia and the Far East. The index generally represents approximately 50% of the free float-adjusted market capitalization of the underlying MSCI EAFE Index (Net), and consists of those securities classified by MSCI Inc. as most representing the value style, such as higher book value-to-price ratios, higher forward earnings-to-price ratios, higher dividend yields and lower forecasted growth rates than securities representing the growth style.
Indices are not available for investment, are not professionally managed and do not reflect sales charges, fees, brokerage commissions, taxes (except the MSCI EAFE Value Index (Net), which reflects reinvested dividends net of withholding taxes) or other expenses of investing. Securities in the Fund may not match those in an index.
Annual Report 2014
2
Columbia Overseas Value Fund
Performance Overview (continued)
Performance of a Hypothetical $10,000 Investment (March 31, 2008 – February 28, 2014)
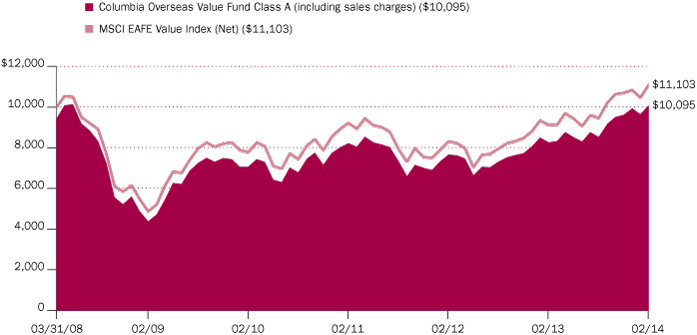
The chart above shows the change in value of a hypothetical $10,000 investment in Class A shares of Columbia Overseas Value Fund during the stated time period, and does not reflect the deduction of taxes that a shareholder may pay on Fund distributions or on the redemption of Fund shares.
Annual Report 2014
3
Columbia Overseas Value Fund
Manager Discussion of Fund Performance
For the 12-month period that ended February 28, 2014, the Fund's Class A shares returned 22.10% excluding sales charges. The Fund outperformed its benchmark, the MSCI EAFE Value Index (Net), which returned 21.15% for the same time period. A position in U.S. stocks, which are not included in the benchmark, aided relative results, as did stock selection in pharmaceuticals within health care and automotive stocks within the consumer discretionary sector.
Broad Rally in Global Stock Markets
Stocks celebrated a year of strong performance, as international equities posted solid returns for the 12-month period that ended February 28, 2014. Stabilizing economic growth, accommodating global bank policy and undemanding valuations triggered a boom in stock markets around the world. However, emerging markets did not participate in the rally. Fears of reduced capital flow, as the Federal Reserve winds down its stimulus, and developing unrest in Eastern Europe weighed on returns in emerging markets. Yet, most emerging markets turned positive in the final month of the period.
Top-performing international markets were clustered in Europe, with Ireland, Greece and Spain showing good results. Japan was a strong performer, helped by Prime Minister Abe's efforts to jumpstart a meaningful economic recovery after years of stagnation.
Contributors and Detractors
Stock selection helped the Fund edge out its benchmark for the period, and out-of-benchmark positions were the strongest performers. Within biotechnology in the health care sector, Jazz Pharmaceuticals, a maker of cancer drugs and pain medications domiciled in Ireland, was a top contributor to performance. Recordati SpA, a pharmaceutical company based in Milan, Italy, also generated a strong return for the Fund.
The Fund's concentration in auto stocks also proved beneficial to relative performance, as the world played catch-up in purchasing cars and trucks. Kongsberg Automotive, a Norwegian company that makes parts and small trucks, and Fuji Heavy Industries, a Japanese manufacturer of autos and trucks, rose strongly. Fuji was a big beneficiary of government policy.
Utilities stocks generally detracted from performance. Although utilities typically behave as a defensive group in an up market, utilities outperformed as stocks rallied and the Fund's lack of exposure to some of the sector's best performers detracted from results. An out-of-benchmark position in Energy Development, a geothermal power supplier in the Philippines, further weighed on returns as the company experienced a delay in bringing new power-generating utilities online.
The Fund uses currency contracts as part of its overall investment strategy, primarily to hedge benchmark relative currency risk. On occasion, some active currency positions may also be taken through the use of currency contracts. The currency hedging policy detracted from Fund results during the period as the currency exposures resulting from our active country positions would have outperformed the benchmark currency basket had we not hedged them. They performed as expected, however, which was to eliminate the active currency positions that resulted from our country/stock selection process, which to us simply represents uncompensated risk.
Portfolio Management
Fred Copper, CFA
Daisuke Nomoto, CMA (SAAJ)*
*Effective August 2013, Mr. Nomoto was named a Portfolio Manager of the Fund.
Morningstar Style BoxTM

The Morningstar Style BoxTM is based on a fund's portfolio holdings. For equity funds, the vertical axis shows the market capitalization of the stocks owned, and the horizontal axis shows investment style (value, blend, or growth). Information shown is based on the most recent data provided by Morningstar.
© 2014 Morningstar, Inc. All rights reserved. The Morningstar information contained herein: (1) is proprietary to Morningstar and/or its content providers; (2) may not be copied or distributed; and (3) is not warranted to be accurate, complete or timely. Neither Morningstar nor its content providers are responsible for any damages or losses arising from any use of this information.
Top Ten Holdings (%)
(at February 28, 2014) | |
Royal Dutch Shell PLC,
Class B (United Kingdom) | | | 3.8 | | |
HSBC Holdings PLC
(United Kingdom) | | | 3.3 | | |
iShares MSCI EAFE ETF
(United States) | | | 3.0 | | |
Allianz SE, Registered Shares
(Germany) | | | 2.2 | | |
BNP Paribas SA (France) | | | 2.2 | | |
GlaxoSmithKline PLC
(United Kingdom) | | | 2.1 | | |
Sumitomo Mitsui
Financial Group, Inc. (Japan) | | | 2.0 | | |
AXA SA (France) | | | 1.9 | | |
Total SA (France) | | | 1.7 | | |
Australia and New Zealand
Banking Group Ltd. (Australia) | | | 1.7 | | |
Percentages indicated are based upon total investments (excluding Money Market Funds).
For further detail about these holdings, please refer to the section entitled "Portfolio of Investments."
Fund holdings are as of the date given, are subject to change at any time, and are not recommendations to buy or sell any security.
Annual Report 2014
4
Columbia Overseas Value Fund
Manager Discussion of Fund Performance (continued)
Looking Ahead
At this time, we maintain a positive outlook for international stock markets in 2014. In our opinion, the global economy is stabilizing at present, even though growth remains modest. Against that backdrop, we believe we have currently positioned the Fund to respond to cyclical recovery in Europe and to ongoing monetary stimulus. Longer term, we remain concerned about the high level of debt in developed markets and the potential for slowing growth, which we believe is likely to result in greater volatility and pressure on equity returns around the world.
Country Breakdown (%)
(at February 28, 2014) | |
Australia | | | 4.6 | | |
Belgium | | | 1.2 | | |
Canada | | | 0.5 | | |
Denmark | | | 0.6 | | |
France | | | 9.1 | | |
Germany | | | 9.4 | | |
Hong Kong | | | 1.0 | | |
Ireland | | | 4.0 | | |
Italy | | | 2.1 | | |
Japan | | | 19.6 | | |
Netherlands | | | 4.2 | | |
Norway | | | 1.5 | | |
Singapore | | | 1.5 | | |
South Korea | | | 2.2 | | |
Spain | | | 2.4 | | |
Sweden | | | 2.7 | | |
Switzerland | | | 5.6 | | |
Taiwan | | | 0.5 | | |
United Kingdom | | | 19.4 | | |
United States(a) | | | 7.9 | | |
Total | | | 100.0 | | |
Percentages indicated are based upon total investments. The Fund's portfolio composition is subject to change.
(a) Includes investments in Money Market Funds.
Summary of Investments in Securities
by Industry (%)
(at February 28, 2014) | |
Aerospace & Defense | | | 1.2 | | |
Auto Components | | | 3.9 | | |
Automobiles | | | 1.9 | | |
Beverages | | | 0.4 | | |
Biotechnology | | | 3.0 | | |
Capital Markets | | | 1.7 | | |
Chemicals | | | 1.4 | | |
Commercial Banks | | | 18.4 | | |
Commercial Services &
Supplies | | | 0.4 | | |
Communications Equipment | | | 0.5 | | |
Construction & Engineering | | | 0.1 | | |
Containers & Packaging | | | 1.3 | | |
Diversified Financial Services | | | 5.5 | | |
Annual Report 2014
5
Columbia Overseas Value Fund
Manager Discussion of Fund Performance (continued)
Summary of Investments in Securities
by Industry (%)
(at February 28, 2014) (continued) | |
Diversified Telecommunication
Services | | | 0.9 | | |
Electric Utilities | | | 1.2 | | |
Electronic Equipment,
Instruments & Components | | | 0.7 | | |
Energy Equipment & Services | | | 0.3 | | |
Food & Staples Retailing | | | 2.0 | | |
Food Products | | | 0.4 | | |
Gas Utilities | | | 0.3 | | |
Health Care Equipment &
Supplies | | | 0.4 | | |
Household Durables | | | 1.8 | | |
Industrial Conglomerates | | | 2.6 | | |
Insurance | | | 9.9 | | |
Internet & Catalog Retail | | | 1.5 | | |
IT Services | | | 2.1 | | |
Machinery | | | 4.3 | | |
Media | | | 2.1 | | |
Metals & Mining | | | 2.8 | | |
Oil, Gas & Consumable Fuels | | | 9.2 | | |
Pharmaceuticals | | | 6.1 | | |
Professional Services | | | 1.1 | | |
Real Estate Management &
Development | | | 1.0 | | |
Road & Rail | | | 0.9 | | |
Semiconductors &
Semiconductor Equipment | | | 0.2 | | |
Specialty Retail | | | 0.2 | | |
Textiles, Apparel & Luxury
Goods | | | 1.3 | | |
Tobacco | | | 0.6 | | |
Trading Companies &
Distributors | | | 1.7 | | |
Wireless Telecommunication
Services | | | 3.8 | | |
Money Market Funds | | | 0.3 | | |
Total | | | 99.4 | | |
Percentages indicated are based upon net assets. The Fund's portfolio composition is subject to change.
Annual Report 2014
6
Columbia Overseas Value Fund
Manager Discussion of Fund Performance (continued)
Investment Risks
The market value of securities may fall, fail to rise, or fluctuate, sometimes rapidly and unpredictably. Market risk may affect a single issuer, sector of the economy, industry, or the market as a whole. Due to its active management, the Fund could underperform other mutual funds with similar investment objectives. Investments in foreign securities involve certain risks not associated with investments in U.S. companies. Foreign securities in the Fund's portfolio subject the Fund to the risks associated with investing in the particular country, including the political, regulatory, economic, social and other conditions or events occurring in the country, as well as fluctuations in its currency and the risks associated with less developed custody and settlement practices. Risks are particularly significant in emerging markets. Value securities involve the risk that they may never reach what the portfolio managers believe is their full market value either because the market fails to recognize the stock's intrinsic worth or the portfolio managers misgauged that worth. They also may decline in price, even though in theory they are already undervalued. The use of derivatives introduces risks possibly greater than the risks associated with investing directly in the investments underlying the derivatives. A relatively small price movement in an underlying security may result in a substantial gain or loss. See the Fund's prospectus for more information on these and other risks.
Annual Report 2014
7
Columbia Overseas Value Fund
Understanding Your Fund's Expenses
(Unaudited)
As an investor, you incur two types of costs. There are transaction costs, which generally include sales charges on purchases and may include redemption fees. There are also ongoing costs, which generally include management fees, distribution and/or service fees, and other fund expenses. The following information is intended to help you understand your ongoing costs (in dollars) of investing in the Fund and to help you compare these costs with the ongoing costs of investing in other mutual funds.
Analyzing Your Fund's Expenses
To illustrate these ongoing costs, we have provided examples and calculated the expenses paid by investors in each share class of the Fund during the period. The actual and hypothetical information in the table is based on an initial investment of $1,000 at the beginning of the period indicated and held for the entire period. Expense information is calculated two ways and each method provides you with different information. The amount listed in the "Actual" column is calculated using the Fund's actual operating expenses and total return for the period. You may use the Actual information, together with the amount invested, to estimate the expenses that you paid over the period. Simply divide your account value by $1,000 (for example, an $8,600 account value divided by $1,000 = 8.6), then multiply the results by the expenses paid during the period under the "Actual" column. The amount listed in the "Hypothetical" column assumes a 5% annual rate of return before expenses (which is not the Fund's actual return) and then applies the Fund's actual expense ratio for the period to the hypothetical return. You should not use the hypothetical account values and expenses to estimate either your actual account balance at the end of the period or the expenses you paid during the period. See "Compare With Other Funds" below for details on how to use the hypothetical data.
Compare With Other Funds
Since all mutual funds are required to include the same hypothetical calculations about expenses in shareholder reports, you can use this information to compare the ongoing cost of investing in the Fund with other funds. To do so, compare the hypothetical example with the 5% hypothetical examples that appear in the shareholder reports of other funds. As you compare hypothetical examples of other funds, it is important to note that hypothetical examples are meant to highlight the ongoing costs of investing in a fund only and do not reflect any transaction costs, such as sales charges, or redemption or exchange fees. Therefore, the hypothetical calculations are useful in comparing ongoing costs only, and will not help you determine the relative total costs of owning different funds. If transaction costs were included in these calculations, your costs would be higher.
September 1, 2013 – February 28, 2014
| | Account Value at the Beginning
of the Period ($) | | Account Value at the End of the
Period ($) | | Expenses Paid During the
Period ($) | | Fund's Annualized
Expense Ratio (%) | |
| | Actual | | Hypothetical | | Actual | | Hypothetical | | Actual | | Hypothetical | | Actual | |
Class A | | | 1,000.00 | | | | 1,000.00 | | | | 1,183.90 | | | | 1,017.90 | | | | 7.68 | | | | 7.09 | | | | 1.41 | | |
Class B | | | 1,000.00 | | | | 1,000.00 | | | | 1,178.90 | | | | 1,014.16 | | | | 11.73 | | | | 10.85 | | | | 2.16 | | |
Class C | | | 1,000.00 | | | | 1,000.00 | | | | 1,178.90 | | | | 1,014.16 | | | | 11.73 | | | | 10.85 | | | | 2.16 | | |
Class I | | | 1,000.00 | | | | 1,000.00 | | | | 1,186.30 | | | | 1,020.14 | | | | 5.23 | | | | 4.84 | | | | 0.96 | | |
Class K | | | 1,000.00 | | | | 1,000.00 | | | | 1,185.30 | | | | 1,018.65 | | | | 6.86 | | | | 6.34 | | | | 1.26 | | |
Class W | | | 1,000.00 | | | | 1,000.00 | | | | 1,184.10 | | | | 1,017.90 | | | | 7.68 | | | | 7.09 | | | | 1.41 | | |
Class Z | | | 1,000.00 | | | | 1,000.00 | | | | 1,184.30 | | | | 1,019.15 | | | | 6.32 | | | | 5.84 | | | | 1.16 | | |
Expenses paid during the period are equal to the annualized expense ratio for each class as indicated above, multiplied by the average account value over the period and then multiplied by the number of days in the Fund's most recent fiscal half year and divided by 365.
Expenses do not include fees and expenses incurred indirectly by the Fund from the underlying funds in which the Fund may invest (also referred to as "acquired funds"), including affiliated and non-affiliated pooled investment vehicles (including mutual funds and exchange-traded funds).
Had Columbia Management Investment Advisers, LLC and/or certain of its affiliates not waived/reimbursed certain fees and expenses, account value at the end of the period would have been reduced.
Annual Report 2014
8
Columbia Overseas Value Fund
Portfolio of Investments
February 28, 2014
(Percentages represent value of investments compared to net assets)
Common Stocks 96.1%
Issuer | | Shares | | Value ($) | |
Australia 4.6% | |
Australia and New Zealand Banking
Group Ltd. | | | 381,031 | | | | 10,954,802 | | |
Commonwealth Bank of Australia | | | 36,543 | | | | 2,440,729 | | |
Macmahon Holdings Ltd.(a) | | | 4,210,001 | | | | 452,956 | | |
National Australia Bank Ltd. | | | 348,852 | | | | 10,848,932 | | |
Westpac Banking Corp. | | | 151,168 | | | | 4,536,852 | | |
Total | | | | | 29,234,271 | | |
Belgium 1.2% | |
Barco NV | | | 59,369 | | | | 4,700,483 | | |
Delhaize Group SA | | | 40,255 | | | | 2,895,439 | | |
Total | | | | | 7,595,922 | | |
Canada 0.5% | |
Cott Corp. | | | 338,796 | | | | 2,757,799 | | |
Eastern Platinum Ltd.(a) | | | 5,642,611 | | | | 458,625 | | |
Total | | | | | 3,216,424 | | |
Denmark 0.6% | |
Pandora A/S | | | 56,206 | | | | 3,809,096 | | |
France 9.1% | |
AXA SA | | | 465,780 | | | | 12,176,835 | | |
BNP Paribas SA | | | 165,420 | | | | 13,576,459 | | |
CNP Assurances | | | 355,478 | | | | 7,664,209 | | |
Metropole Television SA | | | 105,401 | | | | 2,451,423 | | |
Sanofi | | | 103,007 | | | | 10,710,465 | | |
Total SA | | | 169,350 | | | | 10,993,444 | | |
Total | | | | | 57,572,835 | | |
Germany 9.3% | |
Allianz SE, Registered Shares | | | 76,051 | | | | 13,615,027 | | |
Aurelius AG | | | 71,666 | | | | 2,830,613 | | |
Aurubis AG | | | 94,278 | | | | 5,248,222 | | |
BASF SE | | | 45,645 | | | | 5,255,778 | | |
Continental AG | | | 29,236 | | | | 7,116,509 | | |
Daimler AG, Registered Shares | | | 46,142 | | | | 4,300,337 | | |
Deutz AG(a) | | | 213,817 | | | | 2,331,835 | | |
Duerr AG | | | 54,619 | | | | 4,571,687 | | |
Freenet AG | | | 248,060 | | | | 8,387,022 | | |
Siemens AG, Registered Shares | | | 43,017 | | | | 5,745,259 | | |
Total | | | �� | | 59,402,289 | | |
Common Stocks (continued)
Issuer | | Shares | | Value ($) | |
Hong Kong 1.0% | |
Hongkong Land Holdings Ltd. | | | 415,000 | | | | 2,606,118 | | |
K Wah International Holdings Ltd. | | | 4,574,000 | | | | 3,551,128 | | |
Total | | | | | 6,157,246 | | |
Ireland 4.0% | |
DCC PLC | | | 93,052 | | | | 4,928,597 | | |
Dragon Oil PLC | | | 746,861 | | | | 7,572,727 | | |
Jazz Pharmaceuticals PLC(a) | | | 32,610 | | | | 4,954,926 | | |
Smurfit Kappa Group PLC | | | 291,009 | | | | 8,109,916 | | |
Total | | | | | 25,566,166 | | |
Italy 2.1% | |
ENI SpA | | | 283,603 | | | | 6,842,674 | | |
Recordati SpA | | | 359,076 | | | | 6,606,784 | | |
Total | | | | | 13,449,458 | | |
Japan 19.5% | |
Aisin Seiki Co., Ltd. | | | 119,000 | | | | 4,143,863 | | |
Central Japan Railway Co. | | | 50,500 | | | | 5,893,963 | | |
CyberAgent, Inc. | | | 88,000 | | | | 3,876,818 | | |
Daiichikosho Co., Ltd. | | | 235,000 | | | | 7,074,788 | | |
Fuji Heavy Industries Ltd. | | | 275,800 | | | | 7,486,476 | | |
Fuji Machine Manufacturing Co., Ltd. | | | 162,200 | | | | 1,402,325 | | |
Fujitsu General Ltd. | | | 385,000 | | | | 3,943,473 | | |
Fuyo General Lease Co., Ltd. | | | 166,600 | | | | 5,625,582 | | |
Hino Motors Ltd. | | | 355,900 | | | | 5,281,699 | | |
Iida Group Holdings Co., Ltd.(a) | | | 250,008 | | | | 3,802,778 | | |
IT Holdings Corp. | | | 400,000 | | | | 6,910,692 | | |
ITOCHU Corp. | | | 539,200 | | | | 6,719,462 | | |
Japan Tobacco, Inc. | | | 128,600 | | | | 4,095,876 | | |
Kanamoto Co., Ltd. | | | 145,300 | | | | 4,135,748 | | |
KDDI Corp. | | | 97,700 | | | | 5,974,907 | | |
Mitsubishi UFJ Financial Group, Inc. | | | 1,638,800 | | | | 9,496,281 | | |
NAC Co., Ltd. | | | 148,600 | | | | 2,390,070 | | |
Nakanishi, Inc. | | | 17,200 | | | | 2,796,527 | | |
Namura Shipbuilding Co., Ltd. | | | 324,600 | | | | 3,339,254 | | |
Nihon M&A Center, Inc. | | | 52,100 | | | | 4,203,253 | | |
NuFlare Technology, Inc. | | | 18,392 | | | | 1,321,928 | | |
Sumitomo Mitsui Financial Group, Inc. | | | 278,600 | | | | 12,508,596 | | |
Temp Holdings Co., Ltd. | | | 101,200 | | | | 2,992,383 | | |
The accompanying Notes to Financial Statements are an integral part of this statement.
Annual Report 2014
9
Columbia Overseas Value Fund
Portfolio of Investments (continued)
February 28, 2014
Common Stocks (continued)
Issuer | | Shares | | Value ($) | |
Tokyo Gas Co., Ltd. | | | 400,000 | | | | 2,009,414 | | |
TS Tech Co., Ltd. | | | 152,100 | | | | 4,979,817 | | |
Yodogawa Steel Works Ltd. | | | 371,000 | | | | 1,547,957 | | |
Total | | | | | 123,953,930 | | |
Netherlands 4.1% | |
ING Groep NV-CVA(a) | | | 700,923 | | | | 10,226,309 | | |
Koninklijke Ahold NV | | | 535,379 | | | | 9,987,366 | | |
Koninklijke Philips NV | | | 174,432 | | | | 6,105,891 | | |
Total | | | | | 26,319,566 | | |
Norway 1.4% | |
Atea ASA | | | 188,168 | | | | 2,014,294 | | |
Electromagnetic GeoServices(a) | | | 1,436,856 | | | | 1,778,714 | | |
Kongsberg Automotive Holding ASA(a) | | | 5,653,924 | | | | 5,331,758 | | |
Total | | | | | 9,124,766 | | |
Singapore 1.5% | |
DBS Group Holdings Ltd. | | | 725,000 | | | | 9,457,727 | | |
South Korea 2.2% | |
GS Home Shopping, Inc. | | | 16,912 | | | | 4,109,679 | | |
Hyundai Home Shopping Network Corp. | | | 34,301 | | | | 5,402,026 | | |
LG Fashon Corp. | | | 122,077 | | | | 3,178,030 | | |
Youngone Holdings Co., Ltd. | | | 19,232 | | | | 1,332,331 | | |
Total | | | | | 14,022,066 | | |
Spain 2.4% | |
Banco Bilbao Vizcaya Argentaria SA | | | 611,384 | | | | 7,590,822 | | |
Iberdrola SA | | | 1,170,806 | | | | 7,784,580 | | |
Total | | | | | 15,375,402 | | |
Sweden 2.7% | |
MQ Holding AB | | | 267,738 | | | | 993,842 | | |
Nordea Bank AB | | | 574,158 | | | | 8,225,092 | | |
Saab AB, Class B | | | 284,402 | | | | 7,868,944 | | |
Total | | | | | 17,087,878 | | |
Switzerland 5.6% | |
Autoneum Holding AG | | | 16,107 | | | | 2,873,438 | | |
Baloise Holding AG, Registered Shares | | | 59,567 | | | | 7,680,384 | | |
Bucher Industries AG, Registered Shares | | | 12,338 | | | | 3,777,153 | | |
Georg Fischer AG, Registered Shares | | | 8,365 | | | | 6,705,316 | | |
Nestlé SA, Registered Shares | | | 33,589 | | | | 2,543,522 | | |
Common Stocks (continued)
Issuer | | Shares | | Value ($) | |
Novartis AG, Registered Shares | | | 37,234 | | | | 3,109,536 | | |
Zurich Insurance Group AG | | | 28,475 | | | | 8,725,426 | | |
Total | | | | | 35,414,775 | | |
Taiwan 0.5% | |
Wistron NeWeb Corp. | | | 1,131,000 | | | | 2,942,188 | | |
United Kingdom 19.2% | |
Amarin Corp. PLC, ADR(a) | | | 1,071,021 | | | | 1,863,577 | | |
Antofagasta PLC | | | 215,694 | | | | 3,252,521 | | |
Aviva PLC | | | 1,069,944 | | | | 8,485,377 | | |
Barclays PLC | | | 1,613,336 | | | | 6,810,767 | | |
| BP PLC | | | 1,134,926 | | | | 9,586,079 | | |
Crest Nicholson Holdings PLC(a) | | | 562,395 | | | | 3,596,578 | | |
GlaxoSmithKline PLC | | | 479,163 | | | | 13,411,830 | | |
HSBC Holdings PLC | | | 1,974,323 | | | | 20,818,541 | | |
Intermediate Capital Group PLC | | | 1,024,725 | | | | 7,723,510 | | |
Lancashire Holdings Ltd. | | | 395,582 | | | | 4,858,867 | | |
Rio Tinto PLC | | | 72,678 | | | | 4,177,456 | | |
Royal Dutch Shell PLC, Class B | | | 606,866 | | | | 23,647,627 | | |
Vodafone Group PLC | | | 2,102,621 | | | | 8,767,155 | | |
Vodafone Group PLC, ADR | | | 28,535 | | | | 1,186,219 | | |
Xchanging PLC | | | 1,404,226 | | | | 4,150,306 | | |
Total | | | | | 122,336,410 | | |
United States 4.6% | |
Ariad Pharmaceuticals, Inc.(a) | | | 129,036 | | | | 1,121,323 | | |
Auspex Pharmaceuticals, Inc.(a) | | | 73,639 | | | | 1,818,883 | | |
CF Industries Holdings, Inc. | | | 13,955 | | | | 3,501,310 | | |
Dynavax Technologies Corp.(a) | | | 835,846 | | | | 1,554,674 | | |
Gilead Sciences, Inc.(a) | | | 32,577 | | | | 2,697,050 | | |
Infinity Pharmaceuticals, Inc.(a) | | | 156,050 | | | | 2,446,864 | | |
Insmed, Inc.(a) | | | 93,419 | | | | 1,869,314 | | |
Keryx Biopharmaceuticals, Inc.(a) | | | 85,268 | | | | 1,368,551 | | |
Pharmacyclics, Inc.(a) | | | 10,279 | | | | 1,425,286 | | |
Stillwater Mining Co.(a) | | | 249,502 | | | | 3,378,257 | | |
Verizon Communications, Inc. | | | 101,381 | | | | 4,807,487 | | |
Verizon Communications, Inc. | | | 13,759 | | | | 654,648 | | |
Vertex Pharmaceuticals, Inc.(a) | | | 33,656 | | | | 2,721,424 | | |
Total | | | | | 29,365,071 | | |
Total Common Stocks
(Cost: $547,086,082) | | | | | 611,403,486 | | |
The accompanying Notes to Financial Statements are an integral part of this statement.
Annual Report 2014
10
Columbia Overseas Value Fund
Portfolio of Investments (continued)
February 28, 2014
Exchange-Traded Funds 3.0%
| | | Shares | | Value ($) | |
iShares MSCI EAFE ETF | | | 283,959 | | | | 19,153,035 | | |
Total Exchange-Traded Funds
(Cost: $18,167,473) | | | | | 19,153,035 | | |
Money Market Funds 0.3%
| | | Shares | | Value ($) | |
Columbia Short-Term Cash Fund,
0.098%(b)(c) | | | 1,600,211 | | | | 1,600,211 | | |
Total Money Market Funds
(Cost: $1,600,211) | | | | | 1,600,211 | | |
Total Investments
(Cost: $566,853,766) | | | | | 632,156,732 | | |
Other Assets & Liabilities, Net | | | | | 3,744,987 | | |
Net Assets | | | | | 635,901,719 | | |
Investments in Derivatives
Forward Foreign Currency Exchange Contracts Open at February 28, 2014
Counterparty | | Exchange Date | | Currency to
be Delivered | | Currency to
be Received | | Unrealized
Appreciation ($) | | Unrealized
Depreciation ($) | |
Morgan Stanley | | 03/27/14 | | | 2,467,000
CAD | | | | 2,207,048
USD | | | | —
| | | | (19,646
| ) | |
Morgan Stanley | | 03/27/14 | | | 5,315,000
CHF | | | | 5,929,523
USD | | | | —
| | | | (114,790
| ) | |
Morgan Stanley | | 03/27/14 | | | 4,823,000
DKK | | | | 878,080
USD | | | | —
| | | | (14,173
| ) | |
Morgan Stanley | | 03/27/14 | | | 668,905,000
JPY | | | | 6,512,212
USD | | | | —
| | | | (61,293
| ) | |
Morgan Stanley | | 03/27/14 | | | 117,368,000
JPY | | | | 1,156,353
USD | | | | 2,947
| | | | —
| | |
Morgan Stanley | | 03/27/14 | | | 14,825,112,000
KRW | | | | 13,650,917
USD | | | | —
| | | | (180,719
| ) | |
Morgan Stanley | | 03/27/14 | | | 5,711,000
SEK | | | | 877,178
USD | | | | —
| | | | (13,191
| ) | |
Morgan Stanley | | 03/27/14 | | | 126,689,000
TWD | | | | 4,183,785
USD | | | | 2,036
| | | | —
| | |
Morgan Stanley | | 03/27/14 | | | 52,621,000
TWD | | | | 1,736,781
USD | | | | —
| | | | (132
| ) | |
Morgan Stanley | | 03/27/14 | | | 11,533,064
USD | | | | 13,168,000
AUD | | | | 198,625
| | | | —
| | |
Morgan Stanley | | 03/27/14 | | | 4,659,908
USD | | | | 5,214,000
AUD | | | | —
| | | | (14,630
| ) | |
Morgan Stanley | | 03/27/14 | | | 1,214,271
USD | | | | 2,927,000
BRL | | | | 25,815
| | | | —
| | |
Morgan Stanley | | 03/27/14 | | | 3,009,160
USD | | | | 2,203,000
EUR | | | | 31,590
| | | | —
| | |
Morgan Stanley | | 03/27/14 | | | 35,001,741
USD | | | | 21,258,000
GBP | | | | 589,514
| | | | —
| | |
Morgan Stanley | | 03/27/14 | | | 1,229,377
USD | | | | 14,764,820,000
IDR | | | | 41,962
| | | | —
| | |
Morgan Stanley | | 03/27/14 | | | 1,765,731
USD | | | | 6,167,000
ILS | | | | 1,734
| | | | —
| | |
Morgan Stanley | | 03/27/14 | | | 1,310,564
USD | | | | 1,609,000
NZD | | | | 36,078
| | | | —
| | |
Morgan Stanley | | 03/27/14 | | | 1,326,586
USD | | | | 1,691,000
SGD | | | | 7,387
| | | | —
| | |
Total | | | | | | | | | 937,688 | | | | (418,574 | ) | |
The accompanying Notes to Financial Statements are an integral part of this statement.
Annual Report 2014
11
Columbia Overseas Value Fund
Portfolio of Investments (continued)
February 28, 2014
Notes to Portfolio of Investments
(a) Non-income producing.
(b) The rate shown is the seven-day current annualized yield at February 28, 2014.
(c) As defined in the Investment Company Act of 1940, an affiliated company is one in which the Fund owns 5% or more of its outstanding voting securities, or a company which is under common ownership or control with the Fund. Holdings and transactions in these affiliated companies during the year ended February 28, 2014, are as follows:
Issuer | | Beginning
Cost ($) | | Purchase
Cost ($) | | Proceeds
From Sales ($) | | Ending
Cost ($) | | Dividends —
Affiliated
Issuers ($) | | Value ($) | |
Columbia Short-Term Cash Fund | | | 149,527 | | | | 145,777,675 | | | | (144,326,991 | ) | | | 1,600,211 | | | | 1,338 | | | | 1,600,211 | | |
Abbreviation Legend
ADR American Depositary Receipt
Currency Legend
AUD Australian Dollar
BRL Brazilian Real
CAD Canadian Dollar
CHF Swiss Franc
DKK Danish Krone
EUR Euro
GBP British Pound
IDR Indonesian Rupiah
ILS Israeli Shekel
JPY Japanese Yen
KRW Korean Won
NZD New Zealand Dollar
SEK Swedish Krona
SGD Singapore Dollar
TWD Taiwan Dollar
USD US Dollar
The accompanying Notes to Financial Statements are an integral part of this statement.
Annual Report 2014
12
Columbia Overseas Value Fund
Portfolio of Investments (continued)
February 28, 2014
Fair Value Measurements
Generally accepted accounting principles (GAAP) require disclosure regarding the inputs and valuation techniques used to measure fair value and any changes in valuation inputs or techniques. In addition, investments shall be disclosed by major category.
The Fund categorizes its fair value measurements according to a three-level hierarchy that maximizes the use of observable inputs and minimizes the use of unobservable inputs by prioritizing that the most observable input be used when available. Observable inputs are those that market participants would use in pricing an investment based on market data obtained from sources independent of the reporting entity. Unobservable inputs are those that reflect the Fund's assumptions about the information market participants would use in pricing an investment. An investment's level within the fair value hierarchy is based on the lowest level of any input that is deemed significant to the asset or liability's fair value measurement. The input levels are not necessarily an indication of the risk or liquidity associated with investments at that level. For example, certain U.S. government securities are generally high quality and liquid, however, they are reflected as Level 2 because the inputs used to determine fair value may not always be quoted prices in an active market.
Fair value inputs are summarized in the three broad levels listed below:
> Level 1 — Valuations based on quoted prices for investments in active markets that the Fund has the ability to access at the measurement date (including NAV for open-end mutual funds). Valuation adjustments are not applied to Level 1 investments.
> Level 2 — Valuations based on other significant observable inputs (including quoted prices for similar securities, interest rates, prepayment speeds, credit risks, etc.).
> Level 3 — Valuations based on significant unobservable inputs (including the Fund's own assumptions and judgment in determining the fair value of investments).
Inputs that are used in determining fair value of an investment may include price information, credit data, volatility statistics, and other factors. These inputs can be either observable or unobservable. The availability of observable inputs can vary between investments, and is affected by various factors such as the type of investment, and the volume and level of activity for that investment or similar investments in the marketplace. The inputs will be considered by the Investment Manager, along with any other relevant factors in the calculation of an investment's fair value. The Fund uses prices and inputs that are current as of the measurement date, which may include periods of market dislocations. During these periods, the availability of prices and inputs may be reduced for many investments. This condition could cause an investment to be reclassified between the various levels within the hierarchy.
Foreign equity securities actively traded in markets where there is a significant delay in the local close relative to the New York Stock Exchange (NYSE) are classified as Level 2. The values of these securities may include an adjustment to reflect the impact of significant market movements following the close of local trading, as described in Note 2 to the financial statements — Security Valuation.
Investments falling into the Level 3 category are primarily supported by quoted prices from brokers and dealers participating in the market for those investments. However, these may be classified as Level 3 investments due to lack of market transparency and corroboration to support these quoted prices. Additionally, valuation models may be used as the pricing source for any remaining investments classified as Level 3. These models may rely on one or more significant unobservable inputs and/or significant assumptions by the Investment Manager. Inputs used in valuations may include, but are not limited to, financial statement analysis, capital account balances, discount rates and estimated cash flows, and comparable company data.
Under the direction of the Fund's Board of Trustees (the Board), the Investment Manager's Valuation Committee (the Committee) is responsible for overseeing the valuation procedures approved by the Board. The Committee consists of voting and non-voting members from various groups within the Investment Manager's organization, including operations and accounting, trading and investments, compliance, risk management and legal.
The Committee meets at least monthly to review and approve valuation matters, which may include a description of specific valuation determinations, data regarding pricing information received from approved pricing vendors and brokers and the results of Board-approved valuation control policies and procedures (the Policies). The Policies address, among other things, instances when market quotations are or are not readily available, including recommendations of third party pricing vendors and a determination of appropriate pricing methodologies; events that require specific valuation determinations and assessment of fair value techniques; securities with a potential for stale pricing, including those that are illiquid, restricted, or in default; and the effectiveness of third party pricing vendors, including periodic reviews of vendors. The Committee meets more frequently, as needed, to discuss additional valuation matters, which may include the need to review back-testing results, review time-sensitive information or approve related valuation actions. The Committee reports to the Board, with members of the Committee meeting with the Board at each of its regularly scheduled meetings to discuss valuation matters and actions during the period, similar to those described earlier.
For investments categorized as Level 3, the Committee monitors information similar to that described above, which may include: (i) data specific to the issuer or comparable issuers, (ii) general market or specific sector news and (iii) quoted prices and specific or similar security transactions. The Committee considers this data and any changes from prior periods in order to assess the reasonableness of observable and unobservable inputs, any assumptions or internal models used to value those securities and changes in fair value. This data is also used to corroborate, when available, information received from approved pricing vendors and brokers. Various factors impact the frequency of monitoring this information (which may occur as often as daily). However, the Committee may determine that changes to inputs, assumptions and models are not required as a result of the monitoring procedures performed.
The accompanying Notes to Financial Statements are an integral part of this statement.
Annual Report 2014
13
Columbia Overseas Value Fund
Portfolio of Investments (continued)
February 28, 2014
Fair Value Measurements (continued)
The following table is a summary of the inputs used to value the Fund's investments at February 28, 2014:
Description | | Level 1
Quoted Prices in Active
Markets for Identical
Assets ($) | | Level 2
Other Significant
Observable Inputs ($) | | Level 3
Significant
Unobservable Inputs ($) | | Total ($) | |
Equity Securities | |
Common Stocks | |
Consumer Discretionary | | | — | | | | 79,803,060 | | | | — | | | | 79,803,060 | | |
Consumer Staples | | | 2,757,799 | | | | 19,522,204 | | | | — | | | | 22,280,003 | | |
Energy | | | — | | | | 60,421,266 | | | | — | | | | 60,421,266 | | |
Financials | | | — | | | | 213,034,985 | | | | — | | | | 213,034,985 | | |
Health Care | | | 23,841,872 | | | | 36,635,142 | | | | — | | | | 60,477,014 | | |
Industrials | | | — | | | | 78,845,795 | | | | — | | | | 78,845,795 | | |
Information Technology | | | — | | | | 22,039,891 | | | | — | | | | 22,039,891 | | |
Materials | | | 7,338,191 | | | | 27,591,849 | | | | — | | | | 34,930,040 | | |
Telecommunication Services | | | 1,840,867 | | | | 27,936,571 | | | | — | | | | 29,777,438 | | |
Utilities | | | — | | | | 9,793,994 | | | | — | | | | 9,793,994 | | |
Exchange-Traded Funds | | | 19,153,035 | | | | — | | | | — | | | | 19,153,035 | | |
Total Equity Securities | | | 54,931,764 | | | | 575,624,757 | | | | — | | | | 630,556,521 | | |
Mutual Funds | |
Money Market Funds | | | 1,600,211 | | | | — | | | | — | | | | 1,600,211 | | |
Total Mutual Funds | | | 1,600,211 | | | | — | | | | — | | | | 1,600,211 | | |
Investments in Securities | | | 56,531,975 | | | | 575,624,757 | | | | — | | | | 632,156,732 | | |
Derivatives | |
Assets | |
Forward Foreign Currency
Exchange Contracts | | | — | | | | 937,688 | | | | — | | | | 937,688 | | |
Liabilities | |
Forward Foreign Currency
Exchange Contracts | | | — | | | | (418,574 | ) | | | — | | | | (418,574 | ) | |
Total | | | 56,531,975 | | | | 576,143,871 | | | | — | | | | 632,675,846 | | |
See the Portfolio of Investments for all investment classifications not indicated in the table.
The Fund's assets assigned to the Level 2 input category are generally valued using the market approach, in which a security's value is determined through reference to prices and information from market transactions for similar or identical assets. These assets include certain foreign securities for which a third party statistical pricing service may be employed for purposes of fair market valuation. The models utilized by the third party statistical pricing service take into account a security's correlation to available market data including, but not limited to, intraday index, ADR, and ETF movements.
There were no transfers of financial assets between levels during the period.
Derivative instruments are valued at unrealized appreciation (depreciation).
The accompanying Notes to Financial Statements are an integral part of this statement.
Annual Report 2014
14
Columbia Overseas Value Fund
Statement of Assets and Liabilities
February 28, 2014
Assets | |
Investments, at value | |
Unaffiliated issuers (identified cost $565,253,555) | | $ | 630,556,521 | | |
Affiliated issuers (identified cost $1,600,211) | | | 1,600,211 | | |
Total investments (identified cost $566,853,766) | | | 632,156,732 | | |
Unrealized appreciation on forward foreign currency exchange contracts | | | 937,688 | | |
Receivable for: | |
Investments sold | | | 275,107 | | |
Capital shares sold | | | 748,702 | | |
Dividends | | | 2,833,602 | | |
Reclaims | | | 477,667 | | |
Expense reimbursement due from Investment Manager | | | 2,275 | | |
Prepaid expenses | | | 1,521 | | |
Other assets | | | 646 | | |
Total assets | | | 637,433,940 | | |
Liabilities | |
Disbursements in excess of cash | | | 55,158 | | |
Unrealized depreciation on forward foreign currency exchange contracts | | | 418,574 | | |
Payable for: | |
Investments purchased | | | 20,241 | | |
Capital shares purchased | | | 767,114 | | |
Foreign capital gains taxes deferred | | | 22,804 | | |
Investment management fees | | | 13,545 | | |
Distribution and/or service fees | | | 3,959 | | |
Transfer agent fees | | | 97,610 | | |
Administration fees | | | 1,370 | | |
Plan administration fees | | | 38 | | |
Compensation of board members | | | 56,865 | | |
Other expenses | | | 74,943 | | |
Total liabilities | | | 1,532,221 | | |
Net assets applicable to outstanding capital stock | | $ | 635,901,719 | | |
Represented by | |
Paid-in capital | | $ | 903,306,922 | | |
Undistributed net investment income | | | 1,190,436 | | |
Accumulated net realized loss | | | (334,417,590 | ) | |
Unrealized appreciation (depreciation) on: | |
Investments | | | 65,302,966 | | |
Foreign currency translations | | | 22,675 | | |
Forward foreign currency exchange contracts | | | 519,114 | | |
Foreign capital gains tax | | | (22,804 | ) | |
Total — representing net assets applicable to outstanding capital stock | | $ | 635,901,719 | | |
The accompanying Notes to Financial Statements are an integral part of this statement.
Annual Report 2014
15
Columbia Overseas Value Fund
Statement of Assets and Liabilities (continued)
February 28, 2014
Class A | |
Net assets | | $ | 219,133,046 | | |
Shares outstanding | | | 23,830,748 | | |
Net asset value per share | | $ | 9.20 | | |
Maximum offering price per share(a) | | $ | 9.76 | | |
Class B | |
Net assets | | $ | 9,662,250 | | |
Shares outstanding | | | 1,052,585 | | |
Net asset value per share | | $ | 9.18 | | |
Class C | |
Net assets | | $ | 4,842,995 | | |
Shares outstanding | | | 527,608 | | |
Net asset value per share | | $ | 9.18 | | |
Class I | |
Net assets | | $ | 98,705,934 | | |
Shares outstanding | | | 10,732,026 | | |
Net asset value per share | | $ | 9.20 | | |
Class K | |
Net assets | | $ | 197,091 | | |
Shares outstanding | | | 21,435 | | |
Net asset value per share(b) | | $ | 9.20 | | |
Class W | |
Net assets | | $ | 303,272,564 | | |
Shares outstanding | | | 33,007,386 | | |
Net asset value per share | | $ | 9.19 | | |
Class Z | |
Net assets | | $ | 87,839 | | |
Shares outstanding | | | 9,544 | | |
Net asset value per share | | $ | 9.20 | | |
(a) The maximum offering price per share is calculated by dividing the net asset value per share by 1.0 minus the maximum sales charge of 5.75%.
(b) Net asset value per share rounds to this amount due to fractional shares outstanding.
The accompanying Notes to Financial Statements are an integral part of this statement.
Annual Report 2014
16
Columbia Overseas Value Fund
Statement of Operations
Year Ended February 28, 2014
Net Investment Income | |
Income: | |
Dividends — unaffiliated issuers | | $ | 12,015,213 | | |
Dividends — affiliated issuers | | | 1,338 | | |
Interest | | | 1,685 | | |
Foreign taxes withheld | | | (1,093,247 | ) | |
Total income | | | 10,924,989 | | |
Expenses: | |
Investment management fees | | | 2,394,086 | | |
Distribution and/or service fees | |
Class A | | | 497,620 | | |
Class B | | | 106,498 | | |
Class C | | | 43,496 | | |
Class W | | | 111,857 | | |
Transfer agent fees | |
Class A | | | 857,946 | | |
Class B | | | 46,438 | | |
Class C | | | 18,740 | | |
Class K | | | 98 | | |
Class W | | | 168,629 | | |
Class Z | | | 3,858 | | |
Administration fees | | | 242,402 | | |
Plan administration fees | |
Class K | | | 488 | | |
Compensation of board members | | | 21,628 | | |
Custodian fees | | | 84,929 | | |
Printing and postage fees | | | 175,515 | | |
Registration fees | | | 112,097 | | |
Professional fees | | | 70,630 | | |
Other | | | 26,981 | | |
Total expenses | | | 4,983,936 | | |
Fees waived or expenses reimbursed by Investment Manager and its affiliates | | | (783,102 | ) | |
Expense reductions | | | (20 | ) | |
Total net expenses | | | 4,200,814 | | |
Net investment income | | | 6,724,175 | | |
Realized and unrealized gain (loss) — net | |
Net realized gain (loss) on: | |
Investments | | | 3,854,330 | | |
Foreign currency translations | | | (125,541 | ) | |
Forward foreign currency exchange contracts | | | 462,874 | | |
Futures contracts | | | (369,970 | ) | |
Options contracts written | | | 98,548 | | |
Net realized gain | | | 3,920,241 | | |
Net change in unrealized appreciation (depreciation) on: | |
Investments | | | 50,101,379 | | |
Foreign currency translations | | | 32,178 | | |
Forward foreign currency exchange contracts | | | 594,852 | | |
Options contracts written | | | 126 | | |
Foreign capital gains tax | | | (22,804 | ) | |
Net change in unrealized appreciation (depreciation) | | | 50,705,731 | | |
Net realized and unrealized gain | | | 54,625,972 | | |
Net increase in net assets resulting from operations | | $ | 61,350,147 | | |
The accompanying Notes to Financial Statements are an integral part of this statement.
Annual Report 2014
17
Columbia Overseas Value Fund
Statement of Changes in Net Assets
| | | Year Ended
February 28,
2014 | | Year Ended
February 28,
2013(a) | |
Operations | |
Net investment income | | $ | 6,724,175 | | | $ | 809,968 | | |
Net realized gain (loss) | | | 3,920,241 | | | | (790,657 | ) | |
Net change in unrealized appreciation (depreciation) | | | 50,705,731 | | | | 2,365,397 | | |
Net increase in net assets resulting from operations | | | 61,350,147 | | | | 2,384,708 | | |
Distributions to shareholders | |
Net investment income | |
Class A | | | (3,174,030 | ) | | | — | | |
Class B | | | (92,360 | ) | | | — | | |
Class C | | | (42,930 | ) | | | — | | |
Class I | | | (1,329,214 | ) | | | (619,005 | ) | |
Class K | | | (3,424 | ) | | | — | | |
Class W | | | (1,894,152 | ) | | | (50 | ) | |
Class Z | | | (1,405 | ) | | | (60,434 | ) | |
Total distributions to shareholders | | | (6,537,515 | ) | | | (679,489 | ) | |
Increase (decrease) in net assets from capital stock activity | | | 551,882,746 | | | | (3,398,069 | ) | |
Total increase (decrease) in net assets | | | 606,695,378 | | | | (1,692,850 | ) | |
Net assets at beginning of year | | | 29,206,341 | | | | 30,899,191 | | |
Net assets at end of year | | $ | 635,901,719 | | | $ | 29,206,341 | | |
Undistributed (excess of distributions over) net investment income | | $ | 1,190,436 | | | $ | (97,583 | ) | |
(a) Class A, Class B, Class C and Class K shares commenced operations on February 28, 2013.
The accompanying Notes to Financial Statements are an integral part of this statement.
Annual Report 2014
18
Columbia Overseas Value Fund
Statement of Changes in Net Assets (continued)
| | | Year Ended February 28, 2014 | | Year Ended February 28, 2013(a) | |
| | | Shares | | Dollars ($) | | Shares | | Dollars ($) | |
Capital stock activity | |
Class A shares | |
Subscriptions(b) | | | 1,324,047 | | | | 11,145,381 | | | | 355 | | | | 2,714 | | |
Fund merger | | | 26,646,303 | | | | 209,545,325 | | | | — | | | | — | | |
Distributions reinvested | | | 361,031 | | | | 3,137,362 | | | | — | | | | — | | |
Redemptions | | | (4,500,988 | ) | | | (37,329,759 | ) | | | — | | | | — | | |
Net increase | | | 23,830,393 | | | | 186,498,309 | | | | 355 | | | | 2,714 | | |
Class B shares | |
Subscriptions | | | 18,581 | | | | 155,880 | | | | 327 | | | | 2,500 | | |
Fund merger | | | 1,692,156 | | | | 13,292,374 | | | | — | | | | — | | |
Distributions reinvested | | | 10,583 | | | | 91,970 | | | | — | | | | — | | |
Redemptions(b) | | | (669,062 | ) | | | (5,528,393 | ) | | | — | | | | — | | |
Net increase | | | 1,052,258 | | | | 8,011,831 | | | | 327 | | | | 2,500 | | |
Class C shares | |
Subscriptions | | | 49,227 | | | | 417,762 | | | | 327 | | | | 2,500 | | |
Fund merger | | | 578,148 | | | | 4,540,714 | | | | — | | | | — | | |
Distributions reinvested | | | 4,928 | | | | 42,828 | | | | — | | | | — | | |
Redemptions | | | (105,022 | ) | | | (872,101 | ) | | | — | | | | — | | |
Net increase | | | 527,281 | | | | 4,129,203 | | | | 327 | | | | 2,500 | | |
Class I shares | |
Subscriptions | | | 8,000,307 | | | | 70,799,661 | | | | 48,851 | | | | 348,518 | | |
Fund merger | | | 1,031 | | | | 8,099 | | | | — | | | | — | | |
Distributions reinvested | | | 153,097 | | | | 1,328,992 | | | | 84,884 | | | | 618,950 | | |
Redemptions | | | (888,462 | ) | | | (7,792,682 | ) | | | (599,923 | ) | | | (4,381,289 | ) | |
Net increase (decrease) | | | 7,265,973 | | | | 64,344,070 | | | | (466,188 | ) | | | (3,413,821 | ) | |
Class K shares | |
Subscriptions | | | — | | | | — | | | | 327 | | | | 2,500 | | |
Fund merger | | | 25,842 | | | | 203,141 | | | | — | | | | — | | |
Distributions reinvested | | | 377 | | | | 3,277 | | | | — | | | | — | | |
Redemptions | | | (5,111 | ) | | | (49,292 | ) | | | — | | | | — | | |
Net increase | | | 21,108 | | | | 157,126 | | | | 327 | | | | 2,500 | | |
Class W shares | |
Subscriptions | | | 33,965,383 | | | | 300,016,709 | | | | — | | | | — | | |
Distributions reinvested | | | 217,964 | | | | 1,894,110 | | | | — | | | | — | | |
Redemptions | | | (1,176,279 | ) | | | (10,496,461 | ) | | | — | | | | — | | |
Net increase | | | 33,007,068 | | | | 291,414,358 | | | | — | | | | — | | |
Class Z shares | |
Subscriptions | | | 1,646 | | | | 13,870 | | | | — | | | | — | | |
Fund merger | | | 8,336 | | | | 65,598 | | | | — | | | | — | | |
Distributions reinvested | | | 128 | | | | 1,109 | | | | 839 | | | | 5,538 | | |
Redemptions | | | (350,354 | ) | | | (2,752,728 | ) | | | — | | | | — | | |
Net increase (decrease) | | | (340,244 | ) | | | (2,672,151 | ) | | | 839 | | | | 5,538 | | |
Total net increase (decrease) | | | 65,363,837 | | | | 551,882,746 | | | | (464,013 | ) | | | (3,398,069 | ) | |
(a) Class A, Class B, Class C and Class K shares commenced operations on February 28, 2013.
(b) Includes conversions of Class B shares to Class A shares, if any.
The accompanying Notes to Financial Statements are an integral part of this statement.
Annual Report 2014
19
Columbia Overseas Value Fund
The following tables are intended to help you understand the Fund's financial performance. Certain information reflects financial results for a single share of a class held for the periods shown. Per share net investment income (loss) amounts are calculated based on average shares outstanding during the period. Total return assumes reinvestment of all dividends and distributions, if any. Total return does not reflect payment of sales charges, if any, and is not annualized for periods of less than one year.
Class A | | Year Ended
February 28,
2014(a) | |
Per share data | |
Net asset value, beginning of period | | $ | 7.65 | | |
Income from investment operations: | |
Net investment income | | | 0.19 | | |
Net realized and unrealized gain | | | 1.49 | | |
Total from investment operations | | | 1.68 | | |
Less distributions to shareholders: | |
Net investment income | | | (0.13 | ) | |
Total distributions to shareholders | | | (0.13 | ) | |
Net asset value, end of period | | $ | 9.20 | | |
Total return | | | 22.10 | % | |
Ratios to average net assets(b) | |
Total gross expenses | | | 1.71 | % | |
Total net expenses(c) | | | 1.41 | %(d) | |
Net investment income | | | 2.22 | % | |
Supplemental data | |
Net assets, end of period (in thousands) | | $ | 219,133 | | |
Portfolio turnover | | | 63 | % | |
Notes to Financial Highlights
(a) Shares commenced operations on February 28, 2013.
(b) In addition to the fees and expenses which the Fund bears directly, the Fund indirectly bears a pro rata share of the fees and expenses of the acquired funds in which it invests. Such indirect expenses are not included in the reported expense ratios.
(c) Total net expenses include the impact of certain waivers/reimbursements made by the Investment Manager and certain of its affiliates, if applicable.
(d) The benefits derived from expense reductions had an impact of less than 0.01%.
The accompanying Notes to Financial Statements are an integral part of this statement.
Annual Report 2014
20
Columbia Overseas Value Fund
Financial Highlights (continued)
Class B | | Year Ended
February 28,
2014(a) | |
Per share data | |
Net asset value, beginning of period | | $ | 7.65 | | |
Income from investment operations: | |
Net investment income | | | 0.14 | | |
Net realized and unrealized gain | | | 1.47 | | |
Total from investment operations | | | 1.61 | | |
Less distributions to shareholders: | |
Net investment income | | | (0.08 | ) | |
Total distributions to shareholders | | | (0.08 | ) | |
Net asset value, end of period | | $ | 9.18 | | |
Total return | | | 21.13 | % | |
Ratios to average net assets(b) | |
Total gross expenses | | | 2.47 | % | |
Total net expenses(c) | | | 2.16 | %(d) | |
Net investment income | | | 1.66 | % | |
Supplemental data | |
Net assets, end of period (in thousands) | | $ | 9,662 | | |
Portfolio turnover | | | 63 | % | |
Notes to Financial Highlights
(a) Shares commenced operations on February 28, 2013.
(b) In addition to the fees and expenses which the Fund bears directly, the Fund indirectly bears a pro rata share of the fees and expenses of the acquired funds in which it invests. Such indirect expenses are not included in the reported expense ratios.
(c) Total net expenses include the impact of certain waivers/reimbursements made by the Investment Manager and certain of its affiliates, if applicable.
(d) The benefits derived from expense reductions had an impact of less than 0.01%.
The accompanying Notes to Financial Statements are an integral part of this statement.
Annual Report 2014
21
Columbia Overseas Value Fund
Financial Highlights (continued)
Class C | | Year Ended
February 28,
2014(a) | |
Per share data | |
Net asset value, beginning of period | | $ | 7.65 | | |
Income from investment operations: | |
Net investment income | | | 0.12 | | |
Net realized and unrealized gain | | | 1.49 | | |
Total from investment operations | | | 1.61 | | |
Less distributions to shareholders: | |
Net investment income | | | (0.08 | ) | |
Total distributions to shareholders | | | (0.08 | ) | |
Net asset value, end of period | | $ | 9.18 | | |
Total return | | | 21.13 | % | |
Ratios to average net assets(b) | |
Total gross expenses | | | 2.46 | % | |
Total net expenses(c) | | | 2.16 | %(d) | |
Net investment income | | | 1.46 | % | |
Supplemental data | |
Net assets, end of period (in thousands) | | $ | 4,843 | | |
Portfolio turnover | | | 63 | % | |
Notes to Financial Highlights
(a) Shares commenced operations on February 28, 2013.
(b) In addition to the fees and expenses which the Fund bears directly, the Fund indirectly bears a pro rata share of the fees and expenses of the acquired funds in which it invests. Such indirect expenses are not included in the reported expense ratios.
(c) Total net expenses include the impact of certain waivers/reimbursements made by the Investment Manager and certain of its affiliates, if applicable.
(d) The benefits derived from expense reductions had an impact of less than 0.01%.
The accompanying Notes to Financial Statements are an integral part of this statement.
Annual Report 2014
22
Columbia Overseas Value Fund
Financial Highlights (continued)
| | | | | Year Ended | |
| | | Year Ended February 28, | | February 29, | |
Class I | | 2014 | | 2013 | | 2012(a) | |
Per share data | |
Net asset value, beginning of period | | $ | 7.65 | | | $ | 7.22 | | | $ | 7.87 | | |
Income from investment operations: | |
Net investment income | | | 0.20 | | | | 0.20 | | | | 0.22 | | |
Net realized and unrealized gain (loss) | | | 1.51 | | | | 0.40 | | | | (0.62 | ) | |
Total from investment operations | | | 1.71 | | | | 0.60 | | | | (0.40 | ) | |
Less distributions to shareholders: | |
Net investment income | | | (0.16 | ) | | | (0.17 | ) | | | (0.25 | ) | |
Total distributions to shareholders | | | (0.16 | ) | | | (0.17 | ) | | | (0.25 | ) | |
Net asset value, end of period | | $ | 9.20 | | | $ | 7.65 | | | $ | 7.22 | | |
Total return | | | 22.55 | % | | | 8.49 | % | | | (4.55 | %) | |
Ratios to average net assets(b) | |
Total gross expenses | | | 1.04 | % | | | 1.33 | % | | | 1.76 | %(c) | |
Total net expenses(d) | | | 0.98 | % | | | 1.07 | % | | | 0.84 | %(c) | |
Net investment income | | | 2.36 | % | | | 2.78 | % | | | 3.37 | %(c) | |
Supplemental data | |
Net assets, end of period (in thousands) | | $ | 98,706 | | | $ | 26,514 | | | $ | 28,376 | | |
Portfolio turnover | | | 63 | % | | | 46 | % | | | 96 | % | |
Notes to Financial Highlights
(a) For the period from March 31, 2011 (commencement of operations) to February 29, 2012.
(b) In addition to the fees and expenses which the Fund bears directly, the Fund indirectly bears a pro rata share of the fees and expenses of the acquired funds in which it invests. Such indirect expenses are not included in the reported expense ratios.
(c) Annualized.
(d) Total net expenses include the impact of certain waivers/reimbursements made by the Investment Manager and certain of its affiliates, if applicable.
The accompanying Notes to Financial Statements are an integral part of this statement.
Annual Report 2014
23
Columbia Overseas Value Fund
Financial Highlights (continued)
Class K | | Year Ended
February 28,
2014(a) | |
Per share data | |
Net asset value, beginning of period | | $ | 7.65 | | |
Income from investment operations: | |
Net investment income | | | 0.20 | | |
Net realized and unrealized gain | | | 1.49 | | |
Total from investment operations | | | 1.69 | | |
Less distributions to shareholders: | |
Net investment income | | | (0.14 | ) | |
Total distributions to shareholders | | | (0.14 | ) | |
Net asset value, end of period | | $ | 9.20 | | |
Total return | | | 22.25 | % | |
Ratios to average net assets(b) | |
Total gross expenses | | | 1.33 | % | |
Total net expenses(c) | | | 1.26 | % | |
Net investment income | | | 2.39 | % | |
Supplemental data | |
Net assets, end of period (in thousands) | | $ | 197 | | |
Portfolio turnover | | | 63 | % | |
Notes to Financial Highlights
(a) Shares commenced operations on February 28, 2013.
(b) In addition to the fees and expenses which the Fund bears directly, the Fund indirectly bears a pro rata share of the fees and expenses of the acquired funds in which it invests. Such indirect expenses are not included in the reported expense ratios.
(c) Total net expenses include the impact of certain waivers/reimbursements made by the Investment Manager and certain of its affiliates, if applicable.
The accompanying Notes to Financial Statements are an integral part of this statement.
Annual Report 2014
24
Columbia Overseas Value Fund
Financial Highlights (continued)
| | | | | Year Ended | |
| | | Year Ended February 28, | | February 29, | |
Class W | | 2014 | | 2013 | | 2012(a) | |
Per share data | |
Net asset value, beginning of period | | $ | 7.65 | | | $ | 7.22 | | | $ | 7.87 | | |
Income from investment operations: | |
Net investment income | | | 0.19 | | | | 0.17 | | | | 0.22 | | |
Net realized and unrealized gain (loss) | | | 1.48 | | | | 0.42 | | | | (0.64 | ) | |
Total from investment operations | | | 1.67 | | | | 0.59 | | | | (0.42 | ) | |
Less distributions to shareholders: | |
Net investment income | | | (0.13 | ) | | | (0.16 | ) | | | (0.23 | ) | |
Total distributions to shareholders | | | (0.13 | ) | | | (0.16 | ) | | | (0.23 | ) | |
Net asset value, end of period | | $ | 9.19 | | | $ | 7.65 | | | $ | 7.22 | | |
Total return | | | 21.97 | % | | | 8.24 | % | | | (4.81 | %) | |
Ratios to average net assets(b) | |
Total gross expenses | | | 1.63 | % | | | 1.58 | % | | | 2.09 | %(c) | |
Total net expenses(d) | | | 1.41 | %(e) | | | 1.33 | % | | | 1.12 | %(c) | |
Net investment income | | | 2.21 | % | | | 2.46 | % | | | 3.24 | %(c) | |
Supplemental data | |
Net assets, end of period (in thousands) | | $ | 303,273 | | | $ | 2 | | | $ | 2 | | |
Portfolio turnover | | | 63 | % | | | 46 | % | | | 96 | % | |
Notes to Financial Highlights
(a) For the period from March 31, 2011 (commencement of operations) to February 29, 2012.
(b) In addition to the fees and expenses which the Fund bears directly, the Fund indirectly bears a pro rata share of the fees and expenses of the acquired funds in which it invests. Such indirect expenses are not included in the reported expense ratios.
(c) Annualized.
(d) Total net expenses include the impact of certain waivers/reimbursements made by the Investment Manager and certain of its affiliates, if applicable.
(e) The benefits derived from expense reductions had an impact of less than 0.01%.
The accompanying Notes to Financial Statements are an integral part of this statement.
Annual Report 2014
25
Columbia Overseas Value Fund
Financial Highlights (continued)
| | | | | Year Ended | | | |
| | | Year Ended February 28, | | February 29, | | Year Ended February 28, | |
Class Z | | 2014 | | 2013 | | 2012 | | 2011 | | 2010 | |
Per share data | |
Net asset value, beginning of period | | $ | 7.66 | | | $ | 7.23 | | | $ | 8.00 | | | $ | 6.98 | | | $ | 4.46 | | |
Income from investment operations: | |
Net investment income | | | 0.40 | | | | 0.19 | | | | 0.32 | | | | 0.16 | | | | 0.17 | | |
Net realized and unrealized gain (loss) | | | 1.29 | | | | 0.41 | | | | (0.85 | ) | | | 1.01 | | | | 2.63 | | |
Total from investment operations | | | 1.69 | | | | 0.60 | | | | (0.53 | ) | | | 1.17 | | | | 2.80 | | |
Less distributions to shareholders: | |
Net investment income | | | (0.15 | ) | | | (0.17 | ) | | | (0.24 | ) | | | (0.15 | ) | | | (0.28 | ) | |
Total distributions to shareholders | | | (0.15 | ) | | | (0.17 | ) | | | (0.24 | ) | | | (0.15 | ) | | | (0.28 | ) | |
Net asset value, end of period | | $ | 9.20 | | | $ | 7.66 | | | $ | 7.23 | | | $ | 8.00 | | | $ | 6.98 | | |
Total return | | | 22.19 | % | | | 8.45 | % | | | (6.17 | %) | | | 17.06 | % | | | 62.60 | % | |
Ratios to average net assets(a) | |
Total gross expenses | | | 1.52 | % | | | 1.32 | % | | | 1.87 | % | | | 3.65 | % | | | 3.02 | % | |
Total net expenses(b) | | | 1.21 | %(c) | | | 1.07 | % | | | 0.98 | % | | | 1.15 | %(c) | | | 1.14 | %(c) | |
Net investment income | | | 4.97 | % | | | 2.72 | % | | | 3.80 | % | | | 2.18 | % | | | 2.46 | % | |
Supplemental data | |
Net assets, end of period (in thousands) | | $ | 88 | | | $ | 2,680 | | | $ | 2,521 | | | $ | 8,690 | | | $ | 7,572 | | |
Portfolio turnover | | | 63 | % | | | 46 | % | | | 96 | % | | | 48 | % | | | 62 | % | |
Notes to Financial Highlights
(a) In addition to the fees and expenses which the Fund bears directly, the Fund indirectly bears a pro rata share of the fees and expenses of the acquired funds in which it invests. Such indirect expenses are not included in the reported expense ratios.
(b) Total net expenses include the impact of certain waivers/reimbursements made by the Investment Manager and certain of its affiliates, if applicable.
(c) The benefits derived from expense reductions had an impact of less than 0.01%.
The accompanying Notes to Financial Statements are an integral part of this statement.
Annual Report 2014
26
Columbia Overseas Value Fund
Notes to Financial Statements
February 28, 2014
Note 1. Organization
Columbia Overseas Value Fund (the Fund), a series of Columbia Funds Series Trust (the Trust), is a diversified fund. The Trust is registered under the Investment Company Act of 1940, as amended (the 1940 Act), as an open-end management investment company organized as a Delaware statutory trust.
Fund Shares
The Trust may issue an unlimited number of shares (without par value). The Fund offers Class A, Class B, Class C, Class I, Class K, Class W and Class Z shares. Although all share classes generally have identical voting, dividend and liquidation rights, each share class votes separately when required by law. Different share classes pay different distribution amounts to the extent the expenses of such share classes differ, and distributions in liquidation will be proportional to the net asset value of each share class. Each share class has its own expense structure and sales charges, as applicable.
Class A shares are subject to a maximum front-end sales charge of 5.75% based on the initial investment amount. Class A shares purchased without an initial sales charge in accounts aggregating $1 million to $50 million at the time of purchase are subject to a contingent deferred sales charge (CDSC) if the shares are sold within 18 months of purchase, charged as follows: 1.00% CDSC if redeemed within 12 months of purchase, and 0.50% CDSC if redeemed more than 12, but less than 18, months after purchase.
Class B shares may be subject to a maximum CDSC of 5.00% based upon the holding period after purchase. Class B shares will generally convert to Class A shares eight years after purchase. The Fund no longer accepts investments by new or existing investors in the Fund's Class B shares, except in connection with the reinvestment of any dividend and/or capital gain distributions in Class B shares of the Fund and exchanges by existing Class B shareholders of certain other funds within the Columbia Family of Funds.
Class C shares are subject to a 1.00% CDSC on shares redeemed within one year of purchase.
Class I shares are not subject to sales charges and are available only to the Columbia Family of Funds.
Class K shares are not subject to sales charges, however this share class is closed to new investors.
Class W shares are not subject to sales charges and are available only to investors purchasing through authorized investment programs managed by investment professionals, including discretionary managed account programs.
Class Z shares are not subject to sales charges and are available only to certain eligible investors, which are subject to different investment minimums.
Note 2. Summary of Significant Accounting Policies
Use of Estimates
The preparation of financial statements in accordance with U.S. generally accepted accounting principles (GAAP) requires management to make certain estimates and assumptions that affect the reported amounts of assets and liabilities, the disclosure of contingent assets and liabilities at the date of the financial statements and the reported amounts of revenue and expenses during the reporting period. Actual results could differ from those estimates.
The following is a summary of significant accounting policies consistently followed by the Fund in the preparation of its financial statements.
Security Valuation
All equity securities and exchange-traded funds (ETFs) are valued at the close of business of the New York Stock Exchange (NYSE). Equity securities and ETFs are valued at the last quoted sales price on the principal exchange or market on which they trade, except for securities traded on the NASDAQ Stock Market, which are valued at the NASDAQ official close price. Unlisted securities or listed securities for which there were no sales during the day are valued at the mean of the latest quoted bid and ask prices on such exchanges or markets.
Foreign equity securities are valued based on quotations from the principal market in which such securities are normally traded. If any foreign share prices are not readily available as a result of limited share activity the securities are valued at the mean of the latest quoted bid and ask prices on such exchanges or markets. Foreign currency exchange rates are generally determined at 4:00 p.m. Eastern (U.S.) time. However, many securities markets and exchanges outside the U.S. close prior to the close of the NYSE; therefore, the closing prices for securities in such markets or on such exchanges may not fully reflect events that occur after such close but before the close of the NYSE. In those situations, foreign securities will be fair valued pursuant to the policy adopted by the Board of Trustees (the Board), including utilizing a third party pricing service to determine these fair values. The third party pricing service takes into account multiple factors, including, but not limited to, movements in the U.S. securities markets, certain depositary receipts, futures contracts and foreign exchange rates that have occurred
Annual Report 2014
27
Columbia Overseas Value Fund
Notes to Financial Statements (continued)
February 28, 2014
subsequent to the close of the foreign exchange or market, to determine a good faith estimate that reasonably reflects the current market conditions as of the close of the NYSE. The fair value of a security is likely to be different from the quoted or published price, if available.
Investments in open-end investment companies, including money market funds, are valued at net asset value.
Forward foreign currency exchange contracts are marked-to-market based upon foreign currency exchange rates provided by a pricing service.
Futures and options on futures contracts are valued based upon the settlement price established each day by the board of trade or exchange on which they are traded.
Option contracts are valued at the mean of the latest quoted bid and asked prices on their primary exchanges. Option contracts, including over-the-counter (OTC) option contracts, with no readily available market value are valued using quotations obtained from independent brokers as of the close of the NYSE.
Investments for which market quotations are not readily available, or that have quotations which management believes are not reliable, are valued at fair value as determined in good faith under consistently applied procedures established by and under the general supervision of the Board. If a security or class of securities (such as foreign securities) is valued at fair value, such value is likely to be different from the last quoted market price for the security.
The determination of fair value often requires significant judgment. To determine fair value, management may use assumptions including but not limited to future cash flows and estimated risk premiums. Multiple inputs from various sources may be used to determine fair value.
Foreign Currency Transactions and Translations
The values of all assets and liabilities denominated in foreign currencies are translated into U.S. dollars at that day's exchange rates. Net realized and unrealized gains (losses) on foreign currency transactions and translations include gains (losses) arising from the fluctuation in exchange rates between trade and settlement dates on securities transactions, gains (losses) arising from the disposition of foreign currency and currency gains (losses) between the accrual and payment dates on dividends, interest income and foreign withholding taxes.
For financial statement purposes, the Fund does not distinguish that portion of gains (losses) on investments which is due to changes in foreign exchange rates from that which is due to changes in market prices of the investments. Such
fluctuations are included with the net realized and unrealized gains (losses) on investments in the Statement of Operations.
Derivative Instruments
The Fund invests in certain derivative instruments, as detailed below, to meet its investment objectives. Derivatives are instruments whose values depend on, or are derived from, in whole or in part, the value of one or more other assets, such as securities, currencies, commodities or indices. Derivative instruments may be used to maintain cash reserves while maintaining exposure to certain other assets, to offset anticipated declines in values of investments, to facilitate trading, to reduce transaction costs and to pursue higher investment returns. The Fund may also use derivative instruments to mitigate certain investment risks, such as foreign currency exchange rate risk, interest rate risk and credit risk. Derivatives may involve various risks, including the potential inability of the counterparty to fulfill its obligation under the terms of the contract, the potential for an illiquid secondary market (making it difficult for the Fund to sell, including at favorable prices) and the potential for market movements which may expose the Fund to gains or losses in excess of the amount shown in the Statement of Assets and Liabilities. The notional amounts of derivative instruments, if applicable, are not recorded in the financial statements.
A derivative instrument may suffer a mark to market loss if the value of the contract decreases due to an unfavorable change in the market rates or values of the underlying instrument. Losses can also occur if the counterparty does not perform under the contract. The Fund's risk of loss from counterparty credit risk on OTC derivatives is generally limited to the aggregate unrealized gain netted against any collateral held by the Fund and the amount of any initial margin held by the counterparty. With exchange traded or centrally cleared derivatives, there is minimal counterparty credit risk to the Fund since the exchange's clearinghouse, as counterparty to such instruments, guarantees against a possible default. The clearinghouse stands between the buyer and the seller of the contract; therefore, the counterparty credit risk is limited to failure of the clearinghouse. However, credit risk still exists in exchange traded or centrally cleared derivatives with respect to initial and variation margin that is held in a broker's customer accounts. While brokers are required to segregate customer margin from their own assets, in the event that a broker becomes insolvent or goes into bankruptcy and at that time there is a shortfall in the aggregate amount of margin held by the broker for all its clients, U.S. bankruptcy laws will typically allocate that shortfall on a pro-rata basis across all the broker's customers, potentially resulting in losses to the Fund.
Annual Report 2014
28
Columbia Overseas Value Fund
Notes to Financial Statements (continued)
February 28, 2014
In order to better define its contractual rights and to secure rights that will help the Fund mitigate its counterparty risk, the Fund may enter into an International Swaps and Derivatives Association, Inc. Master Agreement (ISDA Master Agreement) or similar agreement with its derivative contract counterparties. An ISDA Master Agreement is an agreement between the Fund and a counterparty that governs OTC derivatives and forward foreign currency exchange contracts and typically contains, among other things, collateral posting terms and netting provisions in the event of a default and/or termination event. Under an ISDA Master Agreement, the Fund may, under certain circumstances, offset with the counterparty certain derivative instrument's payables and/or receivables with collateral held and/or posted and create one single net payment. The provisions of the ISDA Master Agreement typically permit a single net payment in the event of default (close-out netting) including the bankruptcy or insolvency of the counterparty. Note, however, that bankruptcy or insolvency laws of a particular jurisdiction may impose restrictions on or prohibitions against the right of offset in bankruptcy, insolvency or other events.
Collateral (margin) requirements differ by type of derivative. Margin requirements are established by the exchange or clearinghouse for exchange traded and centrally cleared derivatives. Brokers can ask for margin in excess of the minimum in certain circumstances. Collateral terms are contract specific for OTC derivatives. For OTC derivatives traded under an ISDA Master Agreement, the collateral requirements are typically calculated by netting the mark to market amount for each transaction under such agreement and comparing that amount to the value of any variation margin currently pledged by the Fund and/or the counterparty. Generally, the amount of collateral due from or to a party has to exceed a minimum transfer amount threshold (e.g., $500,000) before a transfer has to be made. To the extent amounts due to the Fund from its counterparties are not fully collateralized, contractually or otherwise, the Fund bears the risk of loss from counterparty nonperformance. The Fund attempts to mitigate counterparty risk by only entering into agreements with counterparties that it believes have the financial resources to honor their obligations and by monitoring the financial stability of those counterparties.
Certain ISDA Master Agreements allow counterparties to OTC derivatives to terminate derivative contracts prior to maturity in the event the Fund's net assets decline by a stated percentage over a specified time period or the Fund fails to meet the terms of the ISDA Master Agreement, which would cause the Fund to accelerate payment of any net liability owed to the counterparty. The Fund also has termination rights if the counterparty fails to meet the terms of the ISDA Master
Agreement. In addition to considering counterparty credit risk, the Fund would consider terminating the derivative contracts based on whether termination would result in a net liability owed from the counterparty.
For financial reporting purposes, the Fund does not offset derivative assets and derivative liabilities that are subject to netting arrangements in the Statement of Assets and Liabilities.
Forward Foreign Currency Exchange Contracts
Forward foreign currency exchange contracts are OTC agreements between two parties to buy and sell a currency at a set price on a future date. These contracts are typically intended to be used to minimize the exposure to foreign exchange rate fluctuations during the period between the trade and settlement dates of the contract. The Fund utilized forward foreign currency exchange contracts to hedge the currency exposure associated with some or all of the Fund's securities, to shift investment exposure from one currency to another, and to shift U.S. dollar exposure to achieve a representative weighted mix of major currencies in its benchmark, and/or to recover an underweight country exposure in its portfolio. These instruments may be used for other purposes in future periods.
The values of forward foreign currency exchange contracts fluctuate with changes in foreign currency exchange rates. The Fund will record a realized gain or loss when the forward foreign currency exchange contract expires or is closed.
The use of forward foreign currency exchange contracts does not eliminate fluctuations in the prices of the Fund's portfolio securities. The risks of forward foreign currency exchange contracts include movement in the values of the foreign currencies relative to the U.S. dollar (or other foreign currencies) and the possibility that counterparties will not complete their contractual obligations, which may be in excess of the amount reflected, if any, in the Statement of Assets and Liabilities.
Futures Contracts
Futures contracts are exchange traded and represent commitments for the future purchase or sale of an asset at a specified price on a specified date. The Fund bought and sold futures contracts to manage exposure to the securities market and maintain appropriate equity market exposure while keeping sufficient cash to accommodate daily redemptions. These instruments may be used for other purposes in future periods. Upon entering into futures contracts, the Fund bears risks that it may not achieve the anticipated benefits of the futures contracts and may realize a loss. Additional risks include counterparty credit risk, the possibility of an illiquid
Annual Report 2014
29
Columbia Overseas Value Fund
Notes to Financial Statements (continued)
February 28, 2014
market, and that a change in the value of the contract or option may not correlate with changes in the value of the underlying asset.
Upon entering into a futures contract, the Fund pledges cash or securities with the broker in an amount sufficient to meet the initial margin requirement. The initial margin deposit must be maintained at an established level over the life of the contract. Cash deposited as initial margin is recorded in the Statement of Assets and Liabilities as margin deposits. Securities deposited as initial margin are designated in the Portfolio of Investments. Subsequent payments (variation margin) are made or received by the Fund each day. The variation margin payments are equal to the daily change in the contract value and are recorded as variation margin receivable or payable and are offset in unrealized gains or losses. The Fund recognizes a realized gain or loss when the contract is closed or expires. Futures contracts involve, to varying degrees, risk of loss in excess of the variation margin disclosed in the Statement of Assets and Liabilities.
Options Contracts
Options are contracts which entitle the holder to purchase or sell securities or other identified assets at a specified price, or in the case of index option contracts, to receive or pay the difference between the index value and the strike price of the index option contract. Option contracts can be either exchange traded or OTC. The Fund purchased and wrote option contracts to decrease the Fund's exposure to equity risk and to increase return on investments, to facilitate buying and selling of securities for investments and to implement a particular view on individual stocks that were more efficiently accomplished via options than the underlying equities. These instruments may be used for other purposes in future periods. Completion of transactions for option contracts traded in the OTC market depends upon the performance of the other party. Cash collateral may be collected or posted by the Fund to secure certain OTC option contract trades. Cash collateral held or posted by the Fund for such option contract trades must be returned to the counterparty or the Fund upon closure, exercise or expiration of the contract.
Options contracts purchased are recorded as investments. When the Fund writes an options contract, the premium received is recorded as an asset and an amount equivalent to the premium is recorded as a liability in the Statement of Assets and Liabilities and is subsequently adjusted to reflect the current fair value of the option written. The Fund will realize a gain or loss when the option contract is closed or
expires. When option contracts are exercised, the proceeds on sales for a written call or purchased put option contract, or the purchase cost for a written put or purchased call option contract, is adjusted by the amount of premium received or paid.
For OTC options purchased, the Fund bears the risk of loss of the amount of the premiums paid plus the positive change in market values net of any collateral held by the Fund should the counterparty fail to perform under the contracts. Option contracts written by the Fund do not typically give rise to counterparty credit risk, as options written generally obligate the Fund and not the counterparty to perform. The risk in writing a call option contract is that the Fund gives up the opportunity for profit if the market price of the security increases above the strike price and the option contract is exercised. The risk in writing a put option contract is that the Fund may incur a loss if the market price of the security decreases below the strike price and the option contract is exercised. Exercise of a written option could result in the Fund purchasing or selling a security or foreign currency when it otherwise would not, or at a price different from the current market value. In purchasing and writing options, the Fund bears the risk of an unfavorable change in the value of the underlying instrument or the risk that the Fund may not be able to enter into a closing transaction due to an illiquid market.
Contracts and premiums associated with options contracts written for the year ended February 28, 2014 are as follows:
| | | Calls | | Puts | |
| | | Contracts | | Premiums | | Contracts | | Premiums | |
Balance at
February 28, 2013 | | | —
| | | $ | —
| | | | 12
| | | $ | 1,614
| | |
Opened | | | 2,618 | | | $ | 41,609 | | | | 3,941 | | | | 82,892 | | |
Closed | | | — | | | | — | | | | (12 | ) | | | (1,614 | ) | |
Expired | | | (860 | ) | | | (14,295 | ) | | | (3,941 | ) | | | (82,892 | ) | |
Exercised | | | (1,758 | ) | | | (27,314 | ) | | | | | |
Balance at
February 28, 2014 | | | —
| | | $ | —
| | | | —
| | | $ | —
| | |
Annual Report 2014
30
Columbia Overseas Value Fund
Notes to Financial Statements (continued)
February 28, 2014
Offsetting of Derivative Assets and Derivative Liabilities
The following tables present the Fund's gross and net amount of assets and liabilities available for offset under netting arrangements as well as any related collateral received or pledged by the Fund as of February 28, 2014:
| | | | | | | Net Amounts of | | Gross Amounts Not Offset in
the Statement of Assets and Liabilities | | | |
| | Gross
Amounts of
Recognized
Assets ($) | | Gross Amounts
Offset in the
Statement of
Assets and
Liabilities ($) | | Assets
Presented in the
Statement of
Assets and
Liabilities ($) | | Financial
Instruments ($)(a) | | Cash
Collateral
Received ($) | | Securities
Collateral
Received ($) | | Net
Amount ($)(b) | |
Asset Derivatives: | |
Forward Foreign Currency
Exchange Contracts | | | 937,688 | | | | — | | | | 937,688 | | | | 418,574 | | | | — | | | | — | | | | 519,114 | | |
| | | | | | Net Amounts of | | Gross Amounts Not Offset in
the Statement of Assets and Liabilities | | | |
| | Gross
Amounts of
Recognized
Liabilities ($) | | Gross Amounts
Offset in the
Statement of
Assets and
Liabilities ($) | | Liabilities
Presented in the
Statement of
Assets and
Liabilities ($) | | Financial
Instruments ($)(c) | | Cash
Collateral
Pledged ($) | | Securities
Collateral
Pledged ($) | | Net
Amount ($)(d) | |
Liability Derivatives: | |
Forward Foreign Currency
Exchange Contracts | | | 418,574 | | | | — | | | | 418,574 | | | | 418,574 | | | | — | | | | — | | | | — | | |
(a) Represents the amount of assets that could be offset by liabilities with the same counterparty under master netting or similar agreements that management elects not to offset on the Statement of Assets and Liabilities.
(b) Represents the net amount due from counterparties in the event of default.
(c) Represents the amount of liabilities that could be offset by assets with the same counterparty under master netting or similar agreements that management elects not to offset on the Statement of Assets and Liabilities.
(d) Represents the net amount due to counterparties in the event of default.
Effects of Derivative Transactions in the Financial Statements
The following tables are intended to provide additional information about the effect of derivatives on the financial statements of the Fund, including: the fair value of derivatives by risk category and the location of those fair values in the Statement of Assets and Liabilities; the impact of derivative transactions over the period in the Statement of Operations including realized gains or losses and unrealized gains or losses. The derivative schedules following the Portfolio of Investments present additional information regarding derivative instruments outstanding at the end of the period, if any.
The following table is a summary of the fair value of derivative instruments at February 28, 2014:
Asset Derivatives | |
Risk Exposure
Category | | Statement of Assets and
Liabilities Location | |
Fair Value ($) | |
Foreign exchange
risk
| | Unrealized appreciation on
forward foreign currency
exchange contracts | | | 937,688
| | |
Liability Derivatives | |
Risk Exposure
Category | | Statement of Assets and
Liabilities Location | |
Fair Value ($) | |
Foreign exchange
risk
| | Unrealized depreciation on
forward foreign currency
exchange contracts | | | 418,574
| | |
Annual Report 2014
31
Columbia Overseas Value Fund
Notes to Financial Statements (continued)
February 28, 2014
The following table indicates the effect of derivative instruments in the Statement of Operations for the year ended February 28, 2014:
Amount of Realized Gain (Loss) on Derivatives Recognized in Income | |
| Risk Exposure Category | | Forward Foreign
Currency Exchange
Contracts ($) | | Futures
Contracts ($) | | Options Contracts
Written and
Purchased ($) | | Total ($) | |
Equity risk | | | — | | | | (369,970 | ) | | | (53,099 | ) | | | (423,069 | ) | |
Foreign exchange risk | | | 462,874 | | | | — | | | | — | | | | 462,874 | | |
Total | | | 462,874 | | | | (369,970 | ) | | | (53,099 | ) | | | 39,805 | | |
Change in Unrealized Appreciation (Depreciation) on Derivatives Recognized in Income | |
| Risk Exposure Category | | Forward Foreign
Currency Exchange
Contracts ($) | |
| | Options Contracts
Written and
Purchased ($) | | Total ($) | |
Equity risk | | | — | | | | | | | | 126 | | | | 126 | | |
Foreign exchange risk | | | 594,852 | | | | | | | | — | | | | 594,852 | | |
Total | | | 594,852 | | | | | | | | 126 | | | | 594,978 | | |
The following table is a summary of the volume of derivative instruments for the year ended February 28, 2014:
Derivative Instrument | | Contracts Opened | |
Forward foreign currency exchange contracts | | | 328 | | |
Futures contracts | | | 3,205 | | |
Options contracts | | | 9,136 | | |
Security Transactions
Security transactions are accounted for on the trade date. Cost is determined and gains (losses) are based upon the specific identification method for both financial statement and federal income tax purposes.
Income Recognition
Corporate actions and dividend income are generally recorded net of any non-reclaimable tax withholdings, on the ex-dividend date or upon receipt of ex-dividend notification in the case of certain foreign securities.
Awards from class action litigation are recorded as a reduction of cost basis if the Fund still owns the applicable securities on the payment date. If the Fund no longer owns the applicable securities, the proceeds are recorded as realized gains.
Expenses
General expenses of the Trust are allocated to the Fund and other funds of the Trust based upon relative net assets or other expense allocation methodologies determined by the nature of the expense. Expenses directly attributable to the Fund are charged to the Fund. Expenses directly attributable to a specific class of shares are charged to that share class.
Determination of Class Net Asset Value
All income, expenses (other than class-specific expenses, which are charged to that share class, as shown in the
Statement of Operations) and realized and unrealized gains (losses) are allocated to each class of the Fund on a daily basis, based on the relative net assets of each class, for purposes of determining the net asset value of each class.
Federal Income Tax Status
The Fund intends to qualify each year as a regulated investment company under Subchapter M of the Internal Revenue Code, as amended, and will distribute substantially all of its taxable income (including net short-term capital gains), if any, for its tax year, and as such will not be subject to federal income taxes. In addition, the Fund intends to distribute in each calendar year substantially all of its net investment income, capital gains and certain other amounts, if any, such that the Fund should not be subject to federal excise tax. Therefore, no federal income or excise tax provision is recorded.
Foreign Taxes
The Fund may be subject to foreign taxes on income, gains on investments or currency repatriation, a portion of which may be recoverable. The Fund will accrue such taxes and recoveries, as applicable, based upon its current interpretation of tax rules and regulations that exist in the markets in which it invests.
Realized gains in certain countries may be subject to foreign taxes at the Fund level, based on statutory rates. The Fund accrues for such foreign taxes on realized and unrealized gains at the appropriate rate for each jurisdiction, as applicable. The amount, if any, is disclosed as a liability on the Statement of Assets and Liabilities.
Distributions to Shareholders
Distributions from net investment income, if any, are declared and paid annually. Net realized capital gains, if any, are
Annual Report 2014
32
Columbia Overseas Value Fund
Notes to Financial Statements (continued)
February 28, 2014
distributed along with the income distribution. Income distributions and capital gain distributions are determined in accordance with federal income tax regulations, which may differ from GAAP.
Guarantees and Indemnifications
Under the Trust's organizational documents and, in some cases, by contract, its officers and trustees are indemnified against certain liabilities arising out of the performance of their duties to the Trust or its funds. In addition, certain of the Fund's contracts with its service providers contain general indemnification clauses. The Fund's maximum exposure under these arrangements is unknown since the amount of any future claims that may be made against the Fund cannot be determined, and the Fund has no historical basis for predicting the likelihood of any such claims.
Note 3. Fees and Compensation Paid to Affiliates
Investment Management Fees
Under an Investment Management Services Agreement, Columbia Management Investment Advisers, LLC (the Investment Manager), a wholly-owned subsidiary of Ameriprise Financial, Inc. (Ameriprise Financial), determines which securities will be purchased, held or sold. The investment management fee is an annual fee that is equal to a percentage of the Fund's average daily net assets that declines from 0.79% to 0.62% as the Fund's net assets increase. The effective investment management fee rate for the year ended February 28, 2014 was 0.79% of the Fund's average daily net assets.
Administration Fees
Under an Administrative Services Agreement, the Investment Manager also serves as the Fund Administrator. The Fund pays the Fund Administrator an annual fee for administration and accounting services equal to a percentage of the Fund's average daily net assets that declines from 0.08% to 0.05% as the Fund's net assets increase. The effective administration fee rate for the year ended February 28, 2014 was 0.08% of the Fund's average daily net assets.
Other Expenses
Other expenses are for, among other things, miscellaneous expenses of the Fund or the Board, including payments to a company providing limited administrative services to the Fund and the Board. That company's expenses include boardroom and office expense, employee compensation, employee health and retirement benefits, and certain other expenses. For the year ended February 28, 2014, other expenses paid to this company were $2,009.
Compensation of Board Members
Board members are compensated for their services to the Fund as disclosed in the Statement of Operations. Under a Deferred Compensation Plan (the Plan), the Board members who are not "interested persons" of the Fund, as defined under the 1940 Act, may elect to defer payment of up to 100% of their compensation. Deferred amounts are treated as though equivalent dollar amounts had been invested in shares of certain funds managed by the Investment Manager. The Fund's liability for these amounts is adjusted for market value changes and remains in the Fund until distributed in accordance with the Plan.
Transfer Agent Fees
Under a Transfer and Dividend Disbursing Agent Agreement, Columbia Management Investment Services Corp. (the Transfer Agent), an affiliate of the Investment Manager and a wholly-owned subsidiary of Ameriprise Financial, is responsible for providing transfer agency services to the Fund. The Transfer Agent has contracted with Boston Financial Data Services (BFDS) to serve as sub-transfer agent.
The Transfer Agent receives monthly account-based service fees based on the number of open accounts and also receives sub-transfer agency fees based on a percentage of the average aggregate value of the Fund's shares maintained in omnibus accounts (other than omnibus accounts for which American Enterprise Investment Services Inc. is the broker of record or accounts where the beneficial shareholder is a customer of Ameriprise Financial Services, Inc., which are paid a per account fee). The Transfer Agent pays the fees of BFDS for services as sub-transfer agent and is not entitled to reimbursement for such fees from the Fund (with the exception of out-of-pocket fees).
The Transfer Agent also receives compensation from fees for various shareholder services and reimbursements for certain out-of-pocket fees. Class I shares do not pay transfer agent fees. Total transfer agent fees for Class K shares are subject to an annual limitation of not more than 0.05% of the average daily net assets attributable to Class K shares.
For the year ended February 28, 2014, the Fund's effective transfer agent fee rates as a percentage of average daily net assets of each class were as follows:
Class A | | | 0.43 | % | |
Class B | | | 0.44 | | |
Class C | | | 0.43 | | |
Class K | | | 0.05 | | |
Class W | | | 0.38 | | |
Class Z | | | 0.42 | | |
Annual Report 2014
33
Columbia Overseas Value Fund
Notes to Financial Statements (continued)
February 28, 2014
An annual minimum account balance fee of $20 may apply to certain accounts with a value below the applicable share class's initial minimum investment requirements to reduce the impact of small accounts on transfer agent fees. These minimum account balance fees are recorded as part of expense reductions in the Statement of Operations. For the year ended February 28, 2014, these minimum account balance fees reduced total expenses by $20.
Plan Administration Fees
Under a Plan Administration Services Agreement with the Transfer Agent, the Fund pays an annual fee at a rate of 0.25% of the Fund's average daily net assets attributable to Class K shares for the provision of various administrative, recordkeeping, communication and educational services.
Distribution and Service Fees
The Fund has an agreement with Columbia Management Investment Distributors, Inc. (the Distributor), an affiliate of the Investment Manager and a wholly-owned subsidiary of Ameriprise Financial, for distribution and shareholder services. The Board has approved, and the Fund has adopted, distribution and shareholder service plans (the Plans) applicable to certain share classes, which set the distribution and service fees for the Fund. These fees are calculated daily and are intended to compensate the Distributor and/or eligible selling and/or servicing agents for selling shares of the Fund and providing services to investors.
Under the Plans, the Fund pays a monthly combined distribution and service fee to the Distributor at the maximum annual rate of 0.25% of the average daily net assets attributable to Class A shares of the Fund. Also under the Plans, the Fund pays a monthly service fee at the maximum annual rate of 0.25% of the average daily net assets attributable to Class B, Class C and Class W shares of the Fund and the payment of a monthly distribution fee at the maximum annual rate of 0.75%, 0.75% and 0.25% of the average daily net assets attributable to Class B, Class C and Class W shares, respectively.
Although the Fund may pay a distribution fee up to 0.25% of the Fund's average daily net assets attributable to Class W shares and a service fee of up to 0.25% of the Fund's average daily net assets attributable to Class W shares, the aggregate fee shall not exceed 0.25% of the Fund's average daily net assets attributable to Class W shares.
Sales Charges
Sales charges, including front-end charges and CDSCs, received by the Distributor for distributing Fund shares were $105,636 for Class A, $2,534 for Class B and $261 for Class C shares for the year ended February 28, 2014.
Expenses Waived/Reimbursed by the Investment Manager and its Affiliates
The Investment Manager and certain of its affiliates have contractually agreed to waive fees and/or reimburse expenses (excluding certain fees and expenses described below as well as any reorganization costs allocated to the Fund) for the periods disclosed below, unless sooner terminated at the sole discretion of the Board, so that the Fund's net operating expenses, after giving effect to fees waived/expenses reimbursed and any balance credits and/or overdraft charges from the Fund's custodian, do not exceed the following annual rates as a percentage of the class' average daily net assets:
| | | March 16, 2013
through
June 30, 2014 | | Prior to
March 16, 2013 | |
Class A | | | 1.41 | % | | | 1.56 | % | |
Class B | | | 2.16 | | | | 2.31 | | |
Class C | | | 2.16 | | | | 2.31 | | |
Class I | | | 0.96 | | | | 1.31 | | |
Class K | | | 1.26 | | | | 1.61 | | |
Class W | | | 1.41 | | | | 1.56 | | |
Class Z | | | 1.16 | | | | 1.31 | | |
Under the agreement governing these fee waivers and/or expense reimbursement arrangements, the following fees and expenses are excluded from the waiver/reimbursement commitment, and therefore will be paid by the Fund, if applicable: taxes (including foreign transaction taxes), expenses associated with investments in affiliated and non-affiliated pooled investment vehicles (including mutual funds and exchange traded funds), transaction costs and brokerage commissions, costs related to any securities lending program, dividend expenses associated with securities sold short, inverse floater program fees and expenses, transaction charges and interest on borrowed money, interest, extraordinary expenses and any other expenses the exclusion of which is specifically approved by the Board. This agreement may be modified or amended only with approval from all parties. Reorganization (see Note 9) costs were allocated to the Fund only to the extent they are expected to be offset by the anticipated reduction in expenses borne by the Fund's shareholders during the first year following the reorganization.
Note 4. Federal Tax Information
The timing and character of income and capital gain distributions are determined in accordance with income tax regulations, which may differ from GAAP because of temporary or permanent book to tax differences.
At February 28, 2014, these differences are primarily due to differing treatment for capital loss carryforwards, deferral/reversal of wash sales losses, Trustees' deferred
Annual Report 2014
34
Columbia Overseas Value Fund
Notes to Financial Statements (continued)
February 28, 2014
compensation, foreign currency transactions, passive foreign investment company (PFIC) holdings and derivative investments. To the extent these differences are permanent, reclassifications are made among the components of the Fund's net assets in the Statement of Assets and Liabilities. Temporary differences do not require reclassifications. In the Statement of Assets and Liabilities the following reclassifications were made:
Undistributed net investment income | | $ | 2,502,039 | | |
Accumulated net realized loss | | | (1,263,853 | ) | |
Paid-in capital | | | (1,238,186 | ) | |
Net investment income and net realized gains (losses), as disclosed in the Statement of Operations, and net assets were not affected by this reclassification.
The tax character of distributions paid during the years indicated was as follows:
Year Ended February 28, | | 2014 ($) | | 2013 ($) | |
Ordinary income | | | 6,537,515 | | | | 679,489 | | |
Short-term capital gain distributions, if any, are considered ordinary income distributions for tax purposes.
At February 28, 2014, the components of distributable earnings on a tax basis were as follows:
Undistributed ordinary income | | $ | 3,011,116 | | |
Unrealized appreciation | | | 60,828,093 | | |
At February 28, 2014, the cost of investments for federal income tax purposes was $571,328,639 and the aggregate gross unrealized appreciation and depreciation based on that cost was:
Unrealized appreciation | | $ | 67,654,161 | | |
Unrealized depreciation | | | (6,826,068 | ) | |
Net unrealized appreciation | | $ | 60,828,093 | | |
The following capital loss carryforward, determined at February 28, 2014, may be available to reduce taxable income arising from future net realized gains on investments, if any, to the extent permitted by the Internal Revenue Code:
Year of Expiration | | Amount ($) | |
2017 | | | 321,278,593 | | |
2018 | | | 2,959,273 | | |
Unlimited short-term | | | 6,867,446 | | |
Unlimited long-term | | | 118,816 | | |
Total | | | 331,224,128 | | |
Unlimited capital loss carryforwards are required to be utilized prior to any capital losses which carry an expiration date. As a result of this ordering rule, capital loss
carryforwards which carry an expiration date may be more likely to expire unused.
For the year ended February 28, 2014, capital loss carryforwards of $1,238,180 were permanently lost and $2,288,634 were utilized to offset current year gains. Columbia Overseas Value Fund acquired capital loss carry forwards in connection with the merger with Columbia Multi-Advisor International Value Fund of $329,283,656. As a result of this merger, the utilization of both the acquiring fund and acquired fund capital loss carryforwards may be limited by the Internal Revenue Code.
Management of the Fund has concluded that there are no significant uncertain tax positions that would require recognition in the financial statements. However, management's conclusion may be subject to review and adjustment at a later date based on factors including, but not limited to, new tax laws, regulations, and administrative interpretations (including relevant court decisions). Generally, the Fund's federal tax returns for the prior three fiscal years remain subject to examination by the Internal Revenue Service.
Note 5. Portfolio Information
The cost of purchases and proceeds from sales of securities, excluding short-term obligations, aggregated to $513,520,763 and $191,606,079, respectively, for the year ended February 28, 2014.
Transactions to realign the Fund's portfolio following the merger as described in Note 9 are excluded for purposes of calculating the Fund's portfolio turnover rate. These realignment transactions amounted to cost of purchases and proceeds from sales of $8,899,041 and $9,001,280, respectively.
Note 6. Affiliated Money Market Fund
The Fund invests its daily cash balances in Columbia Short-Term Cash Fund, an affiliated money market fund established for the exclusive use by the Fund and other affiliated funds. The income earned by the Fund from such investments is included as "Dividends — affiliated issuers" in the Statement of Operations. As an investing fund, the Fund indirectly bears its proportionate share of the expenses of Columbia Short-Term Cash Fund.
Note 7. Shareholder Concentration
At February 28, 2014, affiliated shareholder accounts owned 71.0% of the outstanding shares of the Fund. Subscription and redemption activity by concentrated accounts may have a significant effect on the operations of the Fund.
Annual Report 2014
35
Columbia Overseas Value Fund
Notes to Financial Statements (continued)
February 28, 2014
Note 8. Line of Credit
The Fund has entered into a revolving credit facility with a syndicate of banks led by JPMorgan Chase Bank N.A. whereby the Fund may borrow for the temporary funding of shareholder redemptions or for other temporary or emergency purposes. The credit facility agreement, as amended, which is a collective agreement between the Fund and certain other funds managed by the Investment Manager, severally and not jointly, permits collective borrowings up to $500 million. Interest is charged to each participating fund based on its borrowings at a rate equal to the higher of (i) the overnight federal funds rate plus 1.00% or (ii) the one-month LIBOR rate plus 1.00%. Each borrowing under the credit facility matures no later than 60 days after the date of borrowing. Effective December 10, 2013, the Fund also pays a commitment fee equal to its pro rata share of the amount of the credit facility at a rate of 0.075% per annum. Prior to December 10, 2013, the commitment fee was charged at the annual rate of 0.08% per annum. The commitment fee is included in other expenses in the Statement of Operations.
The Fund had no borrowings during the year ended February 28, 2014.
Note 9. Fund Merger
At the close of business on March 15, 2013, the Fund acquired the assets and assumed the identified liabilities of Columbia Multi-Advisor International Value Fund, a series of Columbia Funds Series Trust II (the acquired fund). The reorganization was completed after shareholders of the acquired fund approved a plan of reorganization on February 27, 2013. The purpose of the transaction was to combine two funds managed by the Investment Manager with comparable investment objectives and strategies.
The aggregate net assets of the Fund immediately before the acquisition were $30,016,215 and the combined net assets immediately after the acquisition were $257,671,466.
The merger was accomplished by a tax-free exchange of 40,021,347 shares of the acquired fund valued at $227,655,251 (including $12,260,969 of unrealized appreciation).
In exchange for the acquired fund's shares, the Fund issued the following number of shares:
| | | Shares | |
Class A | | | 26,646,303 | | |
Class B | | | 1,692,156 | | |
Class C | | | 578,148 | | |
Class I | | | 1,031 | | |
Class K | | | 25,842 | | |
Class Z | | | 8,336 | | |
For financial reporting purposes, net assets received and shares issued by the Fund were recorded at fair value; however, the acquired fund's cost of investments was carried forward.
The financial statements reflect the operations of the Fund for the period prior to the merger and the combined fund for the period subsequent to the merger. Because the combined investment portfolios have been managed as a single integrated portfolio since the merger was completed, it is not practicable to separate the amounts of revenue and earnings of the acquired fund that have been included in the combined Fund's Statement of Operations since the merger was completed.
Assuming the merger had been completed on March 1, 2013, the Fund's pro-forma net investment income, net gain on investments, net change in unrealized appreciation and net increase in net assets from operations for the year ended February 28, 2014 would have been approximately $6.9 million, $17.2 million, $41.5 million and $65.6 million, respectively.
Note 10. Significant Risks
Financial Sector Risk
Sector risk occurs when a fund invests a significant portion of its assets in securities of companies conducting business in a related group of industries within an economic sector. Companies in the same economic sector may be similarly affected by economic, regulatory, political or market events or conditions, making a fund more vulnerable to unfavorable developments in that economic sector than funds that invest more broadly. The Fund may be more susceptible to the particular risks that may affect companies in the financial sector than if it were invested in a wider variety of companies in unrelated sectors.
Foreign Securities Risk
Investing in foreign securities may include certain risks and considerations not typically associated with investing in U.S. securities, such as fluctuating currency values and changing local and regional economic, political and social conditions, which may result in greater market volatility. In addition, certain foreign securities may not be as liquid as U.S. securities. Investing in emerging markets may accentuate these risks.
Investments in emerging market countries are subject to additional risk. The risk of foreign investments is typically increased in less developed countries. These countries are also more likely to experience high levels of inflation, deflation or currency devaluation which could hurt their economies and securities markets.
Annual Report 2014
36
Columbia Overseas Value Fund
Notes to Financial Statements (continued)
February 28, 2014
Note 11. Subsequent Events
Management has evaluated the events and transactions that have occurred through the date the financial statements were issued and noted no items requiring adjustment of the financial statements or additional disclosure.
Note 12. Information Regarding Pending and Settled Legal Proceedings
In December 2005, without admitting or denying the allegations, American Express Financial Corporation (AEFC, which is now known as Ameriprise Financial, Inc. (Ameriprise Financial)) entered into settlement agreements with the Securities and Exchange Commission (SEC) and Minnesota Department of Commerce (MDOC) related to market timing activities. As a result, AEFC was censured and ordered to cease and desist from committing or causing any violations of certain provisions of the Investment Advisers Act of 1940, the Investment Company Act of 1940, and various Minnesota laws. AEFC agreed to pay disgorgement of $10 million and civil money penalties of $7 million. AEFC also agreed to retain an independent distribution consultant to assist in developing a plan for distribution of all disgorgement and civil penalties ordered by the SEC in accordance with various undertakings detailed at www.sec.gov/litigation/admin/ia-2451.pdf. Ameriprise Financial and its affiliates have cooperated with the SEC and the MDOC in these legal proceedings, and have made regular reports to the Funds' Boards of Trustees.
Ameriprise Financial and certain of its affiliates have historically been involved in a number of legal, arbitration and regulatory proceedings, including routine litigation, class actions, and governmental actions, concerning matters arising in connection with the conduct of their business activities. Ameriprise Financial believes that the Funds are not currently the subject of, and that neither Ameriprise Financial nor any of its affiliates are the subject of, any pending legal, arbitration or regulatory proceedings that are likely to have a material adverse effect on the Funds or the ability of Ameriprise Financial or its affiliates to perform under their contracts with the Funds. Ameriprise Financial is required to make 10-Q, 10-K and, as necessary, 8-K filings with the Securities and Exchange Commission on legal and regulatory matters that relate to Ameriprise Financial and its affiliates. Copies of these filings may be obtained by accessing the SEC website at www.sec.gov.
There can be no assurance that these matters, or the adverse publicity associated with them, will not result in increased fund redemptions, reduced sale of fund shares or other adverse consequences to the Funds. Further, although we believe
proceedings are not likely to have a material adverse effect on the Funds or the ability of Ameriprise Financial or its affiliates to perform under their contracts with the Funds, these proceedings are subject to uncertainties and, as such, we are unable to estimate the possible loss or range of loss that may result. An adverse outcome in one or more of these proceedings could result in adverse judgments, settlements, fines, penalties or other relief that could have a material adverse effect on the consolidated financial condition or results of operations of Ameriprise Financial.
Annual Report 2014
37
Columbia Overseas Value Fund
Report of Independent Registered Public Accounting Firm
To the Trustees of Columbia Funds Series Trust and the Shareholders of
Columbia Overseas Value Fund
In our opinion, the accompanying statement of assets and liabilities, including the portfolio of investments, and the related statements of operations and of changes in net assets and the financial highlights present fairly, in all material respects, the financial position of Columbia Overseas Value Fund (the "Fund", a series of Columbia Funds Series Trust) at February 28, 2014, and the results of its operations, the changes in its net assets and the financial highlights for each of the periods indicated, in conformity with accounting principles generally accepted in the United States of America. These financial statements and financial highlights (hereafter referred to as "financial statements") are the responsibility of the Fund's management; our responsibility is to express an opinion on these financial statements based on our audits. We conducted our audits of these financial statements in accordance with the standards of the Public Company Accounting Oversight Board (United States). Those standards require that we plan and perform the audit to obtain reasonable assurance about whether the financial statements are free of material misstatement. An audit includes examining, on a test basis, evidence supporting the amounts and disclosures in the financial statements, assessing the accounting principles used and significant estimates made by management, and evaluating the overall financial statement presentation. We believe that our audits, which included confirmation of securities at February 28, 2014 by correspondence with the custodian, brokers and transfer agent, and the application of alternative auditing procedures where such confirmations had not been received, provide a reasonable basis for our opinion.
PricewaterhouseCoopers LLP
Minneapolis, Minnesota
April 21, 2014
Annual Report 2014
38
Columbia Overseas Value Fund
Federal Income Tax Information
(Unaudited)
The Fund hereby designates the following tax attributes for the fiscal year ended February 28, 2014. Shareholders will be notified in early 2015 of the amounts for use in preparing 2014 income tax returns.
Tax Designations:
| Qualified Dividend Income | | | 100 | % | |
| Dividends Received Deduction | | | 1.62 | % | |
Foreign Taxes Paid | | $ | 659,852 | | |
Foreign Source Income | | $ | 11,777,393 | | |
Qualified Dividend Income. For taxable, non-corporate shareholders, the percentage of ordinary income dividends paid during the fiscal year that represents qualified dividend income subject to reduced tax rates.
Dividends Received Deduction. The percentage of ordinary income dividends paid during the fiscal year that qualifies for the corporate dividends received deduction.
Foreign Taxes. The Fund makes the election to pass through to shareholders the foreign taxes paid. These taxes, and the corresponding foreign source income, are provided.
Annual Report 2014
39
Columbia Overseas Value Fund
Shareholders elect the Board that oversees the Funds' operations. The Board appoints officers who are responsible for day-to-day business decisions based on policies set by the Board. The following table provides basic biographical information about the Funds' Board members, including their principal occupations during the past five years, although specific titles for individuals may have varied over the period. Under current Board policy, members may serve through the end of the calendar year in which he or she reaches either the mandatory retirement age established by the Board or the fifteenth anniversary of the first Board meeting they attended as a member of the Board.
Independent Trustees
Name,
Address,
Year of Birth | | Position Held With
Funds and Length of
Service | | Principal Occupation(s)
During Past Five Years
and Other Relevant
Professional Experience | | Number of
Funds in the
Fund Family
Overseen by
Board Member | | Other Present or Past
Directorships/
Trusteeships
(Within Past 5 Years) | |
Kathleen Blatz
901 S. Marquette Ave.
Minneapolis, MN 55402
1954 | | Board member since 1/06 for RiverSource Funds and since 6/11 for Nations Funds | | Attorney; Chief Justice, Minnesota Supreme
Court, 1998-2006 | | | 131 | | | Trustee, BlueCross BlueShield of Minnesota since 2009 | |
Edward J. Boudreau, Jr.
901 S. Marquette Ave.
Minneapolis, MN 55402
1944 | | Board member since 6/11 for RiverSource Funds and since 1/05 for Nations Funds | | Managing Director, E.J. Boudreau & Associates (consulting) since 2000; Chairman and Chief Executive Officer, John Hancock Funds (mutual funds), 1989-2000 | | | 129 | | | Former Trustee, BofA Funds Series Trust (11 funds), 2005-2011 | |
Pamela G. Carlton
901 S. Marquette Ave.
Minneapolis, MN 55402
1954 | | Board member since 7/07 for RiverSource Funds and since 6/11 for Nations Funds | | President, Springboard — Partners in Cross Cultural Leadership (consulting company) since 2003; Director or Management Director of US Equity Research, Chase Asset Management, 1996-2003; Investment Banker, Morgan Stanley, 1982-1996 | | | 131 | | | None | |
William P. Carmichael
901 S. Marquette Ave.
Minneapolis, MN 55402
1943 | | Chair of the Board since 1/14, Board member since 6/11 for RiverSource Funds and since 2003 for Nations Funds | | Retired; Co-founder, The Succession Fund (provides exit strategies to owners of privately held companies); previously, Senior Vice President, Sara Lee Corporation; Senior Vice President and Chief Financial officer, Beatrice Foods Company; Vice President, Esmark, Inc.; Associate, Price Waterhouse | | | 131 | | | Director, Cobra Electronics Corporation (electronic equipment manufacturer); The Finish Line (athletic shoes and apparel) since July 2003; Director, International Textile Corp. since 2012; former Director, McMoRan Exploration Company (oil and gas exploration and development) 2010-2013; former Trustee, BofA Funds Series Trust (11 funds), 2009-2011; Director, Spectrum Brands, Inc. (consumer products), 2002-2009; Director, Simmons Company (bedding), 2004-2010 | |
Annual Report 2014
40
Columbia Overseas Value Fund
Trustees and Officers (continued)
Independent Trustees (continued)
Name,
Address,
Year of Birth | | Position Held With
Funds and Length of
Service | | Principal Occupation(s)
During Past Five Years
and Other Relevant
Professional Experience | | Number of
Funds in the
Fund Family
Overseen by
Board Member | | Other Present or Past
Directorships/
Trusteeships
(Within Past 5 Years) | |
Patricia M. Flynn
901 S. Marquette Ave.
Minneapolis, MN 55402
1950 | | Board member since 11/04 for RiverSource Funds and since 6/11 for Nations Funds | | Trustee Professor of Economics and Management, Bentley University since 1976 (also teaches and conducts research on corporate governance); Dean, McCallum Graduate School of Business, Bentley University, 1992-2002 | | | 131 | | | None | |
William A. Hawkins
901 S. Marquette Ave.
Minneapolis, MN 55402
1942 | | Board member since 6/11 for RiverSource Funds and since 1/05 for Nations Funds | | Managing Director, Overton Partners (financial consulting), since August 2010; President and Chief Executive Officer, California General Bank, N.A., January 2008-August 2010 | | | 129 | | | Trustee, BofA Funds Series Trust (11 funds) | |
R. Glenn Hilliard
901 S. Marquette Ave.
Minneapolis, MN 55402
1943 | | Board member since 6/11 for RiverSource Funds and since 1/05 for Nations Funds | | Chairman and Chief Executive Officer, Hilliard Group LLC (investing and consulting) since April 2003; Non-Executive Director & Chairman, CNO Financial Group, Inc. (insurance), September 2003-May 2011 | | | 129 | | | Chairman, BofA Fund Series Trust (11 funds); former Director, CNO Financial Group, Inc. (insurance), 2003-2011 | |
Stephen R. Lewis, Jr.
901 S. Marquette Ave.
Minneapolis, MN 55402
1939 | | Board member for RiverSource Funds since 1/02 and since 6/11 for Nations Funds, Board Chair 1/07-12/13 | | President Emeritus and Professor of Economics Emeritus, Carleton College since 2002 | | | 131 | | | Director, Valmont Industries, Inc. (irrigation systems manufacturer), 2002-2013 | |
Catherine James Paglia
901 S. Marquette Ave.
Minneapolis, MN 55402
1952 | | Board member since 11/04 for RiverSource Funds and since 6/11 for Nations Funds | | Director, Enterprise Asset Management, Inc. (private real estate and asset management company) since September 1998 | | | 131 | | | Director, Valmont Industries, Inc. (irrigation systems manufacturer) since 2012 | |
Leroy C. Richie
901 S. Marquette Ave.
Minneapolis, MN 55402
1941 | | Board member since 2000 for Legacy Seligman Funds, since 11/08 for RiverSource Funds and since 6/11 for Nations Funds | | Counsel, Lewis & Munday, P.C. (law firm) since 2004; Vice President and General Counsel, Automotive Legal Affairs, Chrysler Corporation, 1993-1997 | | | 131 | | | Lead Outside Director, Digital Ally, Inc. (digital imaging) since September 2005; Director, Infinity, Inc. (oil and gas exploration and production) since 1994; Director, OGE Energy Corp. (energy and energy services) since November 2007 | |
Minor M. Shaw
901 S. Marquette Ave.
Minneapolis, MN 55402
1947 | | Board member since 6/11 for RiverSource Funds and since 2003 for Nations Funds | | President, Micco LLC (private investments) since 2011; President, Micco Corp. since 1998 | | | 129 | | | Director, Piedmont Natural Gas; Director, BlueCross BlueShield of South Carolina since April 2008; Director, National Association of Corporate Directors, Carolinas Chapter, since 2013; former Trustee, BofA Funds Series Trust (11 funds) | |
Annual Report 2014
41
Columbia Overseas Value Fund
Trustees and Officers (continued)
Independent Trustees (continued)
Name,
Address,
Year of Birth | | Position Held With
Funds and Length of
Service | | Principal Occupation(s)
During Past Five Years
and Other Relevant
Professional Experience | | Number of
Funds in the
Fund Family
Overseen by
Board Member | | Other Present or Past
Directorships/
Trusteeships
(Within Past 5 Years) | |
Alison Taunton-Rigby
901 S. Marquette Ave.
Minneapolis, MN 55402
1944 | | Board member since 11/02 for RiverSource Funds and since 6/11 for Nations Funds | | Chief Executive Officer and Director, RiboNovix, Inc., (biotechnology) 2003-2010 | | | 131 | | | Director, Healthways, Inc. (health and wellbeing solutions) since 2005; Director, ICI Mutual Insurance Company, RRG since 2011; Director, Abt Associates (government contractor) since 2001; Director, Boston Children's Hospital since 2002 | |
Interested Trustee Not Affiliated with Investment Manager*
Name,
Address,
Year of Birth | | Position Held With
Funds and Length of
Service | | Principal Occupation(s)
During Past Five Years
and Other Relevant
Professional Experience | | Number of
Funds in the
Fund Family
Overseen by
Board Member | | Other Present or Past
Directorships/
Trusteeships
(Within Past 5 Years) | |
Anthony M. Santomero
901 S. Marquette Ave.
Minneapolis, MN 55402
1946 | | Board member since 6/11 for RiverSource Funds and since 1/08 for Nations Funds | | Richard K. Mellon Professor Emeritus of Finance, The Wharton School, University of Pennsylvania, since 2002; Senior Advisor, McKinsey & Company (consulting), 2006-2008 | | | 129 | | | Director, Renaissance Reinsurance Ltd. since May 2008; Trustee, Penn Mutual Life Insurance Company since March 2008; Director, Citigroup Inc. since 2009; Director, Citibank, N.A. since 2009; former Trustee, BofA Funds Series Trust (11 funds), 2008-2011 | |
* Dr. Santomero is not an affiliated person of the Investment Manager or Ameriprise Financial. However, he is currently deemed by the Funds to be an "interested person" (as defined in the 1940 Act) of the Funds because he serves as a Director of Citigroup Inc. and Citibank, N.A., companies that may directly or through subsidiaries and affiliates engage from time-to-time in brokerage execution, principal transactions and lending relationships with the Funds or accounts advised/managed by the Investment Manager.
Annual Report 2014
42
Columbia Overseas Value Fund
Trustees and Officers (continued)
Interested Trustee Affiliated with Investment Manager*
Name,
Address,
Year of Birth | | Position Held With
Funds and Length of
Service | | Principal Occupation(s)
During Past Five Years
and Other Relevant
Professional Experience | | Number of
Funds in the
Fund Family
Overseen by
Board Member | | Other Present or Past
Directorships/
Trusteeships
(Within Past 5 Years) | |
William F. Truscott
53600 Ameriprise
Financial Center
Minneapolis, MN 55474
1960 | | Board member since 11/01 for RiverSource Funds and since 6/11 for Nations Funds; Senior Vice President since 2002 for RiverSource Funds and since 5/10 for Nations Funds | | Chairman of the Board and President, Columbia Management Investment Advisers, LLC since May 2010 and February 2012, respectively (previously President and Chief Investment Officer, 2001-April 2010); Chief Executive Officer, Global Asset Management, Ameriprise Financial, Inc. since September 2012 (previously Chief Executive Officer, U.S. Asset Management & President, Annuities, May 2010-September 2012 and President — U.S. Asset Management and Chief Investment Officer, 2005-April 2010); Director and Chief Executive Officer, Columbia Management Investment Distributors, Inc. since May 2010 and February 2012, respectively (previously Chairman of the Board and Chief Executive Officer, 2006-April 2010); Chairman of the Board and Chief Executive Officer, RiverSource Distributors, Inc. since 2006; Director, Threadneedle Asset Management Holdings, SARL since 2014; President and Chief Executive Officer, Ameriprise Certificate Company, 2006-August 2012 | | | 183 | | | Former Director, Ameriprise Certificate Company, 2006-January 2013 | |
* Interested person (as defined under the 1940 Act) by reason of being an officer, director, security holder and/or employee of the Investment Manager or Ameriprise Financial.
The SAI has additional information about the Fund's Board members and is available, without charge, upon request by calling 800.345.6611; contacting your financial intermediary; or visiting columbiamanagement.com.
Annual Report 2014
43
Columbia Overseas Value Fund
Trustees and Officers (continued)
The Board has appointed officers who are responsible for day-to-day business decisions based on policies it has established. The officers serve at the pleasure of the Board. In addition to Mr. Truscott, who is Senior Vice President, the Funds' other officers are:
Officers
Name,
Address and
Year of Birth | | Position and Year
First Appointed to
Position for any Fund
in the Columbia
Funds Complex or a
Predecessor Thereof | | Principal Occupation(s) During Past Five Years | |
J. Kevin Connaughton
225 Franklin Street
Boston, MA 02110
Born 1964 | | President and Principal Executive Officer (2009) | | Managing Director and General Manager — Mutual Fund Products, Columbia Management Investment Advisers, LLC since May 2010; and President, Columbia Funds since 2009; Managing Director, Columbia Management Advisors, LLC, December 2004 – April 2010; Senior Vice President and Chief Financial Officer, Columbia Funds, June 2008 – January 2009; and senior officer of Columbia Funds and affiliated funds since 2003 | |
Michael G. Clarke
225 Franklin Street
Boston, MA 02110
Born 1969 | | Treasurer (2011) and Chief Financial Officer (2009) | | Vice President — Mutual Fund Administration, Columbia Management Investment Advisers, LLC, since May 2010;Managing Director of Fund Administration, Columbia Management Advisors, LLC, September 2004 – April 2010; and senior officer of Columbia Funds and affiliated funds since 2002 | |
Scott R. Plummer
5228 Ameriprise Financial Center
Minneapolis, MN 55474
Born 1959 | | Senior Vice President (2006), Chief Legal Officer (2006) and Assistant Secretary (2011) | | Senior Vice President and Assistant General Counsel — Global Asset Management, Ameriprise Financial since February 2014 (previously, Senior Vice President and Lead Chief Counsel — Asset Management, 2012 – February 2014; Vice President and Lead Chief Counsel — Asset Management, 2010 – 2012; and Vice President and Chief Counsel — Asset Management, 2005 – 2010); Senior Vice President, Chief Legal Officer and Assistant Secretary, Columbia Management Investment Advisers, LLC since June 2005; Vice President, Chief Counsel and Assistant Secretary, Columbia Management Investment Distributors, Inc. since 2008; Vice President, General Counsel and Secretary, Ameriprise Certificate Company since 2005; Chief Counsel, RiverSource Distributors, Inc. since 2006; senior officer of Columbia Funds and affiliated funds since 2006 | |
Thomas P. McGuire
225 Franklin Street
Boston, MA 02110
Born 1972 | | Chief Compliance Officer (2012) | | Vice President — Asset Management Compliance, Ameriprise Financial, Inc. since May 2010; Chief Compliance Officer, Ameriprise Certificate Company, since September 2010; Compliance Executive, Bank of America, 2005 – April 2010 | |
Colin Moore
225 Franklin Street
Boston, MA 02110
Born 1958 | | Senior Vice President (2010) | | Executive Vice President and Global Chief Investment Officer, Ameriprise Financial, Inc. since July 2013; Director and Global Chief Investment Officer, Columbia Management Investment Advisers, LLC since May 2010; Manager, Managing Director and Chief Investment Officer, Columbia Management Advisors, LLC, 2007 – April 2010 | |
Michael E. DeFao
225 Franklin Street
Boston, MA 02110
Born 1968 | | Vice President (2011) and Assistant Secretary (2010) | | Vice President and Chief Counsel, Ameriprise Financial, Inc. since May 2010; Associate General Counsel, Bank of America 2005 – April 2010 | |
Joseph F. DiMaria
225 Franklin Street
Boston, MA 02110
Born 1968 | | Vice President (2011) and Chief Accounting Officer (2008) | | Vice President — Mutual Fund Treasurer, Columbia Management Investment Advisers, LLC since May 2010; Director of Fund Administration, Columbia Management Advisors, LLC, 2006 – April 2010 | |
Paul B. Goucher
100 Park Avenue
New York, NY 10017
Born 1968 | | Vice President (2011) and Assistant Secretary (2008) | | Vice President and Lead Chief Counsel, Ameriprise Financial, Inc. since November 2008 and January 2013, respectively (previously Chief Counsel, January 2010 – January 2013, and Group Counsel, November 2008 – January 2010); Director, Managing Director and General Counsel, J. & W. Seligman & Co. Incorporated, July 2008 – November 2008 | |
Amy Johnson
5228 Ameriprise Financial
Center
Minneapolis, MN 55474
Born 1965 | | Vice President (2006) | | Managing Director and Chief Operating Officer, Columbia Management Investment Advisers, LLC since May 2010 (previously Chief Administrative Officer, 2009 – April 2010, and Vice President — Asset Management and Trust Company Services, 2006 – 2009) | |
Annual Report 2014
44
Columbia Overseas Value Fund
Trustees and Officers (continued)
Officers (continued)
Name,
Address and
Year of Birth | | Position and Year
First Appointed to
Position for any Fund
in the Columbia
Funds Complex or a
Predecessor Thereof | | Principal Occupation(s) During Past Five Years | |
Paul D. Pearson
5228 Ameriprise Financial
Center
Minneapolis, MN 55474
Born 1956 | | Vice President (2011) and Assistant Treasurer (1999) | | Vice President — Investment Accounting, Columbia Management Investment Advisers, LLC since May 2010; Vice President — Managed Assets, Investment Accounting, Ameriprise Financial, Inc., 1998 – April 2010 | |
Christopher O. Petersen
5228 Ameriprise Financial Center
Minneapolis, MN 55474
Born 1970 | | Vice President and Secretary (2010) | | Vice President and Chief Counsel, Ameriprise Financial, Inc., since January 2010 (previously Vice President and Group Counsel or Counsel, 2004 – January 2010); officer of Columbia Funds and affiliated funds since 2007 | |
Stephen T. Welsh
225 Franklin Street
Boston, MA 02110
Born 1957 | | Vice President (2006) | | President and Director, Columbia Management Investment Services Corp. since May 2010; President and Director, Columbia Management Services, Inc., 2004 – April 2010; Managing Director, Columbia Management Distributors, Inc., 2007 – April 2010 | |
Annual Report 2014
45
This page intentionally left blank.
Annual Report 2014
46
This page intentionally left blank.
Annual Report 2014
47
This page intentionally left blank.
Annual Report 2014
48
Columbia Overseas Value Fund
Important Information About This Report
Each fund mails one shareholder report to each shareholder address. If you would like more than one report, please call shareholder services at 800.345.6611 and additional reports will be sent to you.
The policy of the Board is to vote the proxies of the companies in which each fund holds investments consistent with the procedures as stated in the Statement of Additional Information (SAI). You may obtain a copy of the SAI without charge by calling 800.345.6611; contacting your financial intermediary; visiting columbiamanagement.com; or searching the website of the Securities and Exchange Commission (SEC) at sec.gov. Information regarding how each fund voted proxies relating to portfolio securities is filed with the SEC by August 31 for the most recent 12-month period ending June 30 of that year, and is available without charge by visiting columbiamanagement.com; or searching the website of the SEC at sec.gov.
Each fund files a complete schedule of portfolio holdings with the SEC for the first and third quarters of each fiscal year on Form N-Q. Each fund's Form N-Q is available on the SEC's website at sec.gov and may be reviewed and copied at the SEC's Public Reference Room in Washington, D.C. Information on the operation of the Public Reference Room may be obtained by calling 800.SEC.0330. Each fund's complete schedule of portfolio holdings, as filed on Form N-Q, can also be obtained without charge, upon request, by calling 800.345.6611.
Annual Report 2014
49

Columbia Overseas Value Fund
P.O. Box 8081
Boston, MA 02266-8081
columbiamanagement.com
This information is for use with concurrent or prior delivery of a fund prospectus. Please read and consider the investment objectives, risks, charges and expenses for any fund carefully before investing. For a prospectus and, if available, a summary prospectus, which contains this and other important information about the Fund go to columbiamanagement.com. The Fund is distributed by Columbia Management Investment Distributors, Inc., member FINRA, and managed by Columbia Management Investment Advisers, LLC.
© 2014 Columbia Management Investment Advisers, LLC. All rights reserved.
ANN208_02_D01_(04/14)
Item 2. Code of Ethics.
(a) The registrant has adopted a code of ethics that applies to the registrant’s principal executive officer, principal financial officer, principal accounting officer or controller, or persons performing similar functions, regardless of whether these individuals are employed by the registrant or a third party.
(b) During the period covered by this report, there were not any amendments to a provision of the code of ethics adopted in 2(a) above.
(c) During the period covered by this report, there were no waivers, including any implicit waivers, from a provision of the code of ethics described in 2(a) above that relates to one or more of the items set forth in paragraph (b) of this item’s instructions.
Item 3. Audit Committee Financial Expert.
The registrant’s Board of Trustees has determined that Edward J. Boudreau, Pamela G. Carlton, William A. Hawkins and Alison Taunton-Rigby, each of whom are members of the registrant’s Board of Trustees and Audit Committee, each qualify as an audit committee financial expert. Mr. Boudreau, Ms. Carlton, Mr. Hawkins and Ms. Taunton-Rigby are each independent trustees, as defined in paragraph (a)(2) of this item’s instructions.
Item 4. Principal Accountant Fees and Services.
Fee information below is disclosed for the sixteen series of the registrant whose report to stockholders are included in this annual filing. In addition, two series merged away on April 26, 2013 and March 15, 2013 and the fees incurred by these series through its merger date are included in the response to this Item.
(a) Audit Fees. Aggregate Audit Fees billed by the principal accountant for professional services rendered during the fiscal years ended February 28, 2014 and February 28, 2013 are approximately as follows:
2014 | | 2013 | |
$ | 336,400 | | $ | 361,800 | |
| | | | | |
Audit Fees include amounts related to the audit of the registrant’s annual financial statements or services that are normally provided by the accountant in connection with statutory and regulatory filings or engagements for those fiscal years.
(b) Audit-Related Fees. Aggregate Audit-Related Fees billed to the registrant by the principal accountant for professional services rendered during the fiscal years ended February 28, 2014 and February 28, 2013 are approximately as follows:
Audit-Related Fees include amounts for assurance and related services by the principal accountant that are reasonably related to the performance of the audit of the registrant’s financial statements and are not reported in Audit Fees above. In both fiscal years 2014 and 2013, Audit-Related Fees consist of agreed-upon procedures performed for semi-annual shareholder reports and agreed- upon procedures related to fund mergers.
The fees for the fiscal years ended February 28, 2014 and February 28, 2013 shown below for audit-related services rendered to the registrant’s investment adviser and any entity controlling, controlled by, or under common control with the investment adviser that provides ongoing services to the registrant that were required to be pre-approved by the registrant’s Audit Committee are approximately as follows:
Fiscal year 2013 includes fees billed for the review and provision of consent in connection with fund mergers.
(c) Tax Fees. Aggregate Tax Fees billed by the principal accountant to the registrant for professional services rendered during the fiscal years ended February 28, 2014 and February 28, 2013 are approximately as follows:
2014 | | 2013 | |
$ | 124,400 | | $ | 86,900 | |
| | | | | |
Tax Fees include amounts for the review of annual tax returns, the review of required shareholder distribution calculations and typically include amounts for professional services by the principal accountant for tax compliance, tax advice and tax planning. In both fiscal years 2014 and 2013, Tax Fees also include agreed-upon procedures related to foreign tax filings. In fiscal year 2014, Tax Fees also include agreed-upon procedures related to fund mergers and the review of final tax returns.
During the fiscal years ended February 28, 2014 and February 28, 2013, there were no Tax Fees billed by the registrant’s principal accountant to the registrant’s investment adviser (not including any sub-adviser whose role is primarily portfolio management and is subcontracted with or overseen by another investment adviser) and any entity controlling, controlled by, or under common control with the adviser that provides ongoing services to the registrant for an engagement that related directly to the operations and financial reporting of the registrant.
(d) All Other Fees. Aggregate All Other Fees billed by the principal accountant to the registrant for professional services rendered during the fiscal years ended February 28, 2014 and February 28, 2013 are approximately as follows:
All Other Fees include amounts for products and services provided by the principal accountant, other than the services reported in paragraphs (a) through (c) above.
Aggregate All Other Fees billed by the registrant’s principal accountant to the registrant’s investment adviser (not including any sub-adviser whose role is primarily portfolio management and is subcontracted with or overseen by another investment adviser) and any entity controlling, controlled by, or under common control with the adviser that provides ongoing services to the registrant for an engagement that related directly to the operations and financial reporting of the registrant during the fiscal years ended February 28, 2014 and February 28, 2013 are approximately as follows:
2014 | | 2013 | |
$ | 135,000 | | $ | 115,000 | |
| | | | | |
In both fiscal years 2014 and 2013, All Other Fees consist of fees billed for internal control examinations of the registrant’s transfer agent and investment advisor.
(e)(1) Audit Committee Pre-Approval Policies and Procedures
The registrant’s Audit Committee is required to pre-approve the engagement of the registrant’s independent auditors to provide audit and non-audit services to the registrant and non-audit services to its investment adviser (excluding any sub-adviser whose role is primarily portfolio management and is sub-contracted or overseen by another investment adviser (the “Adviser”) or any entity controlling, controlled by or under common control with the Adviser that provides ongoing services to the Fund (a “Control Affiliate”) if the engagement relates directly to the operations and financial reporting of the registrant.
The Audit Committee has adopted a Policy for Engagement of Independent Auditors for Audit and Non-Audit Services (the “Policy”). The Policy sets forth the understanding of the Audit Committee regarding the engagement of the registrant’s independent accountants to provide (i) audit and permissible audit-related, tax and other services to the registrant (“Fund Services”); (ii) non-audit services to the registrant’s Adviser and any Control Affiliates, that relates directly to the operations and financial reporting of a Fund (“Fund-related Adviser Services”); and (iii) certain other audit and non-audit services to the registrant’s Adviser and its Control Affiliates. A service will require specific pre-approval by the Audit Committee if it is to be provided by the Fund’s independent auditor; provided, however, that pre-approval of non-audit services to the
Fund, the Adviser or Control Affiliates may be waived if certain de minimis requirements set forth in the SEC’s rules are met.
Under the Policy, the Audit Committee may delegate pre-approval authority to any pre-designated member or members who are independent board members. The member(s) to whom such authority is delegated must report, for informational purposes only, any pre-approval decisions to the Audit Committee at its next regular meeting. The Audit Committee’s responsibilities with respect to the pre-approval of services performed by the independent auditor may not be delegated to management.
On an annual basis, at a regularly scheduled Audit Committee meeting, the Fund’s Treasurer or other Fund officer shall submit to the Audit Committee a schedule of the types of Fund Services and Fund-related Adviser Services that are subject to specific pre-approval. This schedule will provide a description of each type of service that is subject to specific pre-approval, along with total projected fees for each service. The pre-approval will generally cover a one-year period. The Audit Committee will review and approve the types of services and the projected fees for the next one-year period and may add to, or subtract from, the list of pre-approved services from time to time, based on subsequent determinations. This specific approval acknowledges that the Audit Committee is in agreement with the specific types of services that the independent auditor will be permitted to perform and the projected fees for each service.
The Fund’s Treasurer or other Fund officer shall report to the Audit Committee at each of its regular meetings regarding all Fund Services or Fund-related Adviser Services provided since the last such report was rendered, including a description of the services, by category, with forecasted fees for the annual reporting period, proposed changes requiring specific pre-approval and a description of services provided by the independent auditor, by category, with actual fees during the current reporting period.
*****
(e)(2) 100% of the services performed for items (b) through (d) above during 2014 and 2013 were pre-approved by the registrant’s Audit Committee.
(f) Not applicable.
(g) The aggregate non-audit fees billed by the registrant’s accountant for services rendered to the registrant, and rendered to the registrant’s investment adviser (not including any sub-adviser whose role is primarily portfolio management and is subcontracted with or overseen by another investment adviser), and any entity controlling, controlled by, or under common control with the adviser that provides ongoing services to the registrant for the fiscal years ended February 28, 2014 and February 28, 2013 are approximately as follows:
2014 | | 2013 | |
$ | 267,800 | | $ | 215,900 | |
| | | | | |
(h) The registrant’s Audit Committee of the Board of Directors has considered whether the provision of non-audit services that were rendered to the registrant’s adviser (not including any sub-adviser whose role is primarily portfolio management and is subcontracted with or overseen by another investment adviser), and any entity controlling, controlled by, or under common control with the investment adviser that provides ongoing services to the registrant that were not pre-approved pursuant to paragraph (c)(7)(ii) of Rule 2-01 of Regulation S-X, is compatible with maintaining the principal accountant’s independence.
Item 5. Audit Committee of Listed Registrants.
Not applicable.
Item 6. Investments
(a) The registrant’s “Schedule I — Investments in securities of unaffiliated issuers” (as set forth in 17 CFR 210.12-12) is included in Item 1 of this Form N-CSR.
(b) Not applicable.
Item 7. Disclosure of Proxy Voting Policies and Procedures for Closed-End Management Investment Companies.
Not applicable.
Item 8. Portfolio Managers of Closed-End Management Investment Companies.
Not applicable.
Item 9. Purchases of Equity Securities by Closed-End Management Investment Company and Affiliated Purchasers.
Not applicable.
Item 10. Submission of Matters to a Vote of Security Holders.
There were no material changes to the procedures by which shareholders may recommend nominees to the registrant’s board of directors.
Item 11. Controls and Procedures.
(a) The registrant’s principal executive officer and principal financial officers, based on their evaluation of the registrant’s disclosure controls and procedures as of a date within 90 days of the filing of this report, have concluded that such controls and procedures are adequately designed to ensure that material information required to be disclosed by the registrant in Form N-CSR is accumulated and
communicated to the registrant’s management, including the principal executive officer and principal financial officer, or persons performing similar functions, as appropriate to allow timely decisions regarding required disclosure.
(b) There was no change in the registrant’s internal control over financial reporting that occurred during the registrant’s second fiscal quarter of the period covered by this report that has materially affected, or is reasonably likely to materially affect, the registrant’s internal control over financial reporting.
Item 12. Exhibits.
(a)(1) Code of ethics required to be disclosed under Item 2 of Form N-CSR attached hereto as Exhibit 99.CODE ETH.
(a)(2) Certifications pursuant to Rule 30a-2(a) under the Investment Company Act of 1940 (17 CFR 270.30a-2(a)) attached hereto as Exhibit 99.CERT.
(a)(3) Not applicable.
(b) Certification pursuant to Rule 30a-2(b) under the Investment Company Act of 1940 (17 CFR 270.30a-2(b)) attached hereto as Exhibit 99.906CERT.
SIGNATURES
Pursuant to the requirements of the Securities Exchange Act of 1934 and the Investment Company Act of 1940, the registrant has duly caused this report to be signed on its behalf by the undersigned, thereunto duly authorized.
(registrant) | | | Columbia Funds Series Trust | |
| | |
| | |
By (Signature and Title) | | | /s/ J. Kevin Connaughton | |
| | J. Kevin Connaughton, President and Principal Executive Officer |
| | |
| | |
Date | | | April 21, 2014 | |
| | | | | | |
Pursuant to the requirements of the Securities Exchange Act of 1934 and the Investment Company Act of 1940, this report has been signed below by the following persons on behalf of the registrant and in the capacities and on the dates indicated.
By (Signature and Title) | | | /s/ J. Kevin Connaughton | |
| | | J. Kevin Connaughton, President and Principal Executive Officer | |
| | |
| | |
| | |
Date | | | April 21, 2014 | |
| | |
| | |
By (Signature and Title) | | | /s/ Michael G. Clarke | |
| | Michael G. Clarke, Treasurer and Chief Financial Officer |
| | |
| | |
Date | | | April 21, 2014 | |
| | | | | |