UNITED STATES
SECURITIES AND EXCHANGE COMMISSION
Washington, D.C. 20549
FORM N-CSR
CERTIFIED SHAREHOLDER REPORT OF REGISTERED
MANAGEMENT INVESTMENT COMPANIES
Investment Company Act file number | 811-09645 |
|
Columbia Funds Series Trust |
(Exact name of registrant as specified in charter) |
|
50606 Ameriprise Financial Center
Minneapolis, MN | | 55474 |
(Address of principal executive offices) | | (Zip code) |
|
Christopher O. Petersen, Esq.
c/o Columbia Management Investment Advisers, LLC
225 Franklin Street
Boston, MA 02110 |
(Name and address of agent for service) |
|
Registrant’s telephone number, including area code: | (800) 345-6611 | |
|
Date of fiscal year end: | April 30 | |
|
Date of reporting period: | April 30, 2014 | |
| | | | | | | | |
Form N-CSR is to be used by management investment companies to file reports with the Commission not later than 10 days after the transmission to stockholders of any report that is required to be transmitted to stockholders under Rule 30e-1 under the Investment Company Act of 1940 (17 CFR 270.30e-1). The Commission may use the information provided on Form N-CSR in its regulatory, disclosure review, inspection, and policymaking roles.
A registrant is required to disclose the information specified by Form N-CSR, and the Commission will make this information public. A registrant is not required to respond to the collection of information contained in Form N-CSR unless the Form displays a currently valid Office of Management and Budget (“OMB”) control number. Please direct comments concerning the accuracy of the information collection burden estimate and any suggestions for reducing the burden to Secretary, Securities and Exchange Commission, 450 Fifth Street, NW, Washington, DC 20549-0609. The OMB has reviewed this collection of information under the clearance requirements of 44 U.S.C. § 3507.
Item 1. Reports to Stockholders.
Annual Report
April 30, 2014

Columbia Short Term Municipal Bond Fund
Not FDIC insured • No bank guarantee • May lose value
 Dear Shareholders,
Continued Economic Recovery
The U.S. economy continued to recover at a slow but steady pace during the first quarter of 2014, supported by solid manufacturing activity, reasonable job growth and continued gains for the housing market. Industrial production was robust, buoyed by strong demand for autos and related parts. After a disappointing January, job growth picked up, which helped boost consumer confidence. Housing data was somewhat mixed, as harsh weather and higher mortgage rates put a damper on sales, while lower inventories helped prices trend higher. The Federal Reserve (the Fed) announced further reductions to its monthly asset purchases and reassured the markets that it would not make any significant changes to monetary policy until it was satisfied that the labor market was on solid ground. Despite mostly good news on the economic front, the broad financial markets recorded only modest gains, as bitter winter weather at home and mounting tensions between Russia and Western allies prompted investor caution.
Investors braced for higher interest rates, but long-term yields declined and the fixed-income markets were surprisingly resilient in the face of stable-to-improving economic data. Risk-on trading continued during the quarter as the higher yielding sectors of the fixed-income markets generally fared well. Emerging-market bonds, long-term U.S. Treasuries and sovereign debt were among the strongest performers, as were Treasury Inflation Protected Securities. Municipal bonds delivered solid gains, especially high-yield municipals, which benefited from continued improvement in state finances.
Against this backdrop, the broad bond market, as measured by the Barclays U.S. Aggregate Bond Index, edged out the broad stock market, as measured by the Standard & Poor's 500 Index, with gains of 1.84% vs. 1.81%, respectively. As indicated late last year, the Fed began tapering its monthly asset purchase program and announced further reductions. New Fed chair Janet Yellen reassured investors the Fed was committed to keeping short-term borrowing rates low into 2015.
Stay on Track with Columbia Management
Backed by more than 100 years of experience, Columbia Management is one of the nation's largest asset managers. At the heart of our success and, most importantly, that of our investors, are highly talented industry professionals, brought together by a unique way of working. At Columbia Management, reaching our performance goals matters, and how we reach them matters just as much.
Visit columbiamanagement.com for:
> The Columbia Management Perspectives blog, offering insights on current market events and investment opportunities
> Detailed up-to-date fund performance and portfolio information
> Quarterly fund commentaries
> Columbia Management investor, our award-winning quarterly newsletter for shareholders
Thank you for your continued support of the Columbia Funds. We look forward to serving your investment needs for many years to come.
Best Regards,

J. Kevin Connaughton
President, Columbia Funds
Investing involves risk including the risk of loss of principal.
The Barclays U.S. Aggregate Bond Index is a broad-based benchmark that measures the investment grade, U.S. dollar denominated, fixed-rate taxable bond market, including Treasuries, government-related and corporate securities, mortgage-backed securities (agency fixed-rate and hybrid adjustable-rate mortgage passthroughs), asset-backed securities, and commercial mortgage-backed securities. The S&P 500 Index, an unmanaged index, measures the performance of 500 widely held, large-capitalization U.S. stocks and is frequently used as a general measure of market performance. Indices are not available for investment, are not professionally managed and do not reflect sales charges, fees, brokerage commissions, taxes or other expenses of investing.
Investors should consider the investment objectives, risks, charges and expenses of a mutual fund carefully before investing. For a free prospectus and, if available, a summary prospectus, which contains this and other important information about a fund, visit columbiamanagement.com. The prospectus should be read carefully before investing.
Columbia Funds are distributed by Columbia Management Investment Distributors, Inc., member FINRA, and managed by Columbia Management Investment Advisers, LLC.
© 2014 Columbia Management Investment Advisers, LLC. All rights reserved.
Columbia Short Term Municipal Bond Fund
Performance Overview | | | 2 | | |
Manager Discussion of Fund Performance | | | 4 | | |
Understanding Your Fund's Expenses | | | 6 | | |
Portfolio of Investments | | | 7 | | |
Statement of Assets and Liabilities | | | 25 | | |
Statement of Operations | | | 27 | | |
Statement of Changes in Net Assets | | | 28 | | |
Financial Highlights | | | 30 | | |
Notes to Financial Statements | | | 36 | | |
Report of Independent Registered
Public Accounting Firm | | | 42 | | |
Federal Income Tax Information | | | 43 | | |
Trustees and Officers | | | 44 | | |
Approval of Investment Management Services Agreement | | | 50 | | |
Important Information About This Report | | | 53 | | |
Fund Investment Manager
Columbia Management Investment
Advisers, LLC
225 Franklin Street
Boston, MA 02110
Fund Distributor
Columbia Management Investment
Distributors, Inc.
225 Franklin Street
Boston, MA 02110
Fund Transfer Agent
Columbia Management Investment
Services Corp.
P.O. Box 8081
Boston, MA 02266-8081
For more information about any of the funds, please visit columbiamanagement.com or call 800.345.6611. Customer Service Representatives are available to answer your questions Monday through Friday from 8 a.m. to 7 p.m. Eastern time.
The views expressed in this report reflect the current views of the respective parties. These views are not guarantees of future performance and involve certain risks, uncertainties and assumptions that are difficult to predict, so actual outcomes and results may differ significantly from the views expressed. These views are subject to change at any time based upon economic, market or other conditions and the respective parties disclaim any responsibility to update such views. These views may not be relied on as investment advice and, because investment decisions for a Columbia Fund are based on numerous factors, may not be relied on as an indication of trading intent on behalf of any particular Columbia Fund. References to specific securities should not be construed as a recommendation or investment advice.
Columbia Short Term Municipal Bond Fund
Performance Summary
> Columbia Short Term Municipal Bond Fund (the Fund) Class A shares returned 0.37% excluding sales charges for the 12-month period that ended April 30, 2014. The Fund's Class Z shares returned 0.62% for the same time period.
> The Fund underperformed its benchmark, the Barclays 1-3 Year Municipal Bond Index, which returned 0.94% for the same time period.
> Positive contributions resulting from effective sector allocation and overall security selection was more than offset by the detracting effects of duration and yield curve positioning.
Average Annual Total Returns (%) (for period ended April 30, 2014)
| | Inception | | 1 Year | | 5 Years | | 10 Years | |
Class A | | 11/02/93 | | | | | | | | | | | | | |
Excluding sales charges | | | | | | | 0.37 | | | | 1.32 | | | | 2.17 | | |
Including sales charges | | | | | | | -0.66 | | | | 1.11 | | | | 2.07 | | |
Class B | | 10/12/93 | | | -0.47 | | | | 0.55 | | | | 1.40 | | |
Class C | | 05/19/94 | | | | | | | | | | | | | |
Excluding sales charges | | | | | | | -0.38 | | | | 0.57 | | | | 1.41 | | |
Including sales charges | | | | | | | -1.37 | | | | 0.57 | | | | 1.41 | | |
Class R4* | | 03/19/13 | | | 0.53 | | | | 1.56 | | | | 2.41 | | |
Class R5* | | 11/08/12 | | | 0.67 | | | | 1.59 | | | | 2.43 | | |
Class Z | | 10/07/93 | | | 0.62 | | | | 1.58 | | | | 2.43 | | |
Barclays 1-3 Year Municipal Bond Index | | | | | | | 0.94 | | | | 1.68 | | | | 2.54 | | |
Returns for Class A are shown with and without the maximum initial sales charge of 1.00%. Returns for Class C are shown with and without the applicable contingent deferred sales charge (CDSC) of 1.00% in the first year. The Fund's other classes are not subject to sales charges and have limited eligibility. Please see the Fund's prospectus for details. Performance for different share classes will vary based on differences in sales charges and fees associated with each class. All results shown assume reinvestment of distributions during the period. Returns do not reflect the deduction of taxes that a shareholder may pay on Fund distributions or on the redemption of Fund shares. Performance results reflect the effect of any fee waivers or reimbursements of Fund expenses by Columbia Management Investment Advisers, LLC and/or any of its affiliates. Absent these fee waivers or expense reimbursement arrangements, performance results would have been lower.
The performance information shown represents past performance and is not a guarantee of future results. The investment return and principal value of your investment will fluctuate so that your shares, when redeemed, may be worth more or less than their original cost. Current performance may be lower or higher than the performance information shown. You may obtain performance information current to the most recent month-end by contacting your financial intermediary, visiting columbiamanagement.com or calling 800.345.6611.
*The returns shown for periods prior to the share class inception date (including returns for the Life of the Fund, if shown, which are since Fund inception) include the returns of the Fund's oldest share class. These returns are adjusted to reflect any higher class-related operating expenses of the newer share classes, as applicable. Please visit columbiamanagement.com/mutual-funds/appended-performance for more information.
The Barclays 1-3 Year Municipal Bond Index, is an unmanaged index which consists of a broad selection of investment grade general obligation and revenue bonds of maturities ranging from one year to three years.
Indices are not available for investment, are not professionally managed and do not reflect sales charges, fees, brokerage commissions, taxes or other expenses of investing. Securities in the Fund may not match those in an index.
Annual Report 2014
2
Columbia Short Term Municipal Bond Fund
Performance Overview (continued)
Performance of a Hypothetical $10,000 Investment (May 1, 2004 – April 30, 2014)
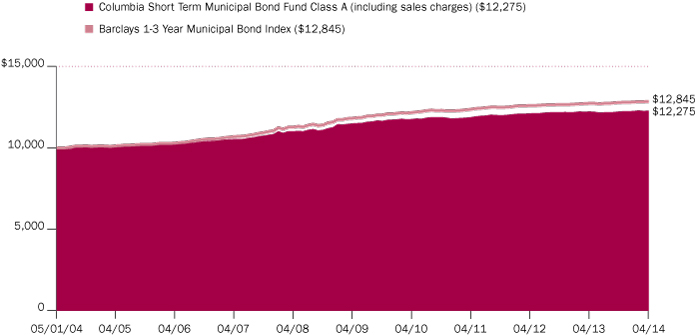
The chart above shows the change in value of a hypothetical $10,000 investment in Class A shares of Columbia Short Term Municipal Bond Fund during the stated time period, and does not reflect the deduction of taxes that a shareholder may pay on Fund distributions or on the redemption of Fund shares.
Annual Report 2014
3
Columbia Short Term Municipal Bond Fund
Manager Discussion of Fund Performance
For the 12-month period that ended April 30, 2014, the Fund's Class A shares returned 0.37% excluding sales charges. The Fund's Class Z shares returned 0.62% for the same time period. The Fund underperformed its benchmark, the Barclays 1-3 Year Municipal Bond Index, which returned 0.94% for the same time period. Positive contributions resulting from effective sector allocation and overall security selection was more than offset by the detracting effects of duration and yield curve positioning.
Tax-Exempt Bond Market Impacted by Shifting Fed Policy
During the annual period, yields on very short-term maturities (one year and under) declined, while yields on maturities within the two- to five-year portion of the yield curve rose. (There is usually an inverse relationship between bond prices and yield movements, so that bond prices fall when yields rise and vice versa.) In turn, the short-term municipal bond yield curve steepened.
In June 2013, following mid-May comments by then-Federal Reserve (Fed) Chair Bernanke, the markets began anticipating the tapering of monetary policy stimulus. Brightening economic growth prospects perpetuated municipal bond fund outflows, causing selling pressure and, in turn, higher yields. July and August 2013 saw negative returns in the benchmark due to sharply higher interest rates that resulted from confusion over Fed policy and heightened concerns about the fiscal health of Detroit, Puerto Rico and Illinois. Municipal bond mutual fund redemptions hit record levels, further pressuring bond prices, despite somewhat modest supply.
The municipal bond market reversed course in September 2013, posting gains as market fears faded with the Fed's unanticipated decision to delay tapering its quantitative easing program along with continued slow issuance. Through the remainder of the annual period, yields on municipal bonds with maturities of five years or less generally declined, while longer-term maturity yields increased. Municipal bond mutual fund redemptions slowed. Fund flows turned positive in February 2014, with improved demand for municipal bonds supported by reduced supply and high taxes. From February through April, the municipal yield curve flattened somewhat, meaning the differential between shorter- and longer-term yields narrowed.
From a fundamental perspective, states saw greater revenue on the back of increasing sales, income and property taxes along with lower expenses following recent austerity measures taken. While negative credit stories made headlines — including the state of Illinois' pension turmoil, Puerto Rico's multi-notch downgrade and Detroit's Chapter 9 bankruptcy filing, such issues were not representative of the broad municipal bond market. Overall default rates trended down and were at their lowest level since 2009.
Duration and Yield Curve Positioning Hampered Returns
Detracting from Fund results was the combined effect of duration and yield curve positioning. The Fund had a longer duration profile than the benchmark during the first half of the annual period, which hurt as tax-exempt bond rates rose. We shifted the Fund to a modestly shorter duration than that of the benchmark during the second half of the annual period, which subsequently offset some earlier losses. Also, the Fund's barbell maturity structure — with
Portfolio Management
Catherine Stienstra
Top Ten States (%)
(at April 30, 2014) | |
New York | | | 19.9 | | |
Illinois | | | 11.1 | | |
California | | | 10.3 | | |
New Jersey | | | 6.8 | | |
Florida | | | 6.6 | | |
Washington | | | 4.5 | | |
Michigan | | | 3.7 | | |
Texas | | | 3.7 | | |
Massachusetts | | | 3.2 | | |
Indiana | | | 2.7 | | |
Percentages indicated are based upon total investments (excluding Money Market Funds).
For further detail about these holdings, please refer to the section entitled "Portfolio of Investments."
Fund holdings are as of the date given, are subject to change at any time, and are not recommendations to buy or sell any security.
Quality Breakdown (%)
(at April 30, 2014) | |
AAA rating | | | 3.8 | | |
AA rating | | | 32.9 | | |
A rating | | | 49.0 | | |
BBB rating | | | 6.2 | | |
Not rated | | | 8.1 | | |
Total | | | 100.0 | | |
Percentages indicated are based upon total fixed income securities (excluding Money Market Funds).
Bond ratings apply to the underlying holdings of the Fund and not the Fund itself and are divided into categories ranging from AAA (highest) to D (lowest), and are subject to change. The ratings shown are determined by using the middle rating of Moody's, S&P, and Fitch after dropping the highest and lowest available ratings. When a rating from only two agencies is available, the lower rating is used. When a rating from only one agency is available, that rating is used. When a bond is not rated by one of these agencies, it is designated as Not rated. Credit ratings are subjective opinions and not statements of fact.
Annual Report 2014
4
Columbia Short Term Municipal Bond Fund
Manager Discussion of Fund Performance (continued)
overweights relative to the benchmark in bonds with maturities of one year and less and in issues with maturities of four to five years — hampered results. (Concentrations at both ends of the short-term municipal bond yield curve, with less exposure in beween, would mimic the shape of a barbell, hence the description.) The overweight in longer maturity bonds hurt relative performance, outweighing stronger performance from an overweight at the short end. Security selection among bonds rated A and bonds in the leasing sector detracted as well.
Effective Sector Allocation Aided Fund Performance
The Fund benefited from its underweighted allocation to bonds rated AAA and from its overweight to bonds rated A, as lower quality securities outpaced higher quality bonds for the annual period. From a sector perspective, the Fund's results were aided by its underweight to pre-refunded bonds, which lagged the benchmark, and by security selection within the transportation and state general obligation bond sectors. Geographically, the Fund benefited from having no exposure to Puerto Rico bonds and from having an overweight to Illinois-issued bonds. In early December 2013, the Illinois Senate and House passed pension reform, which the market viewed as positive news and was enough to cause Illinois credit spreads to start tightening.
Fundamental Analysis Drove Portfolio Changes
During the annual period, we gradually reduced the Fund's duration relative to that of the benchmark through December 2013 and then extended beginning in January 2014 to a neutral duration stance, as the yield curve steepened. Also, the Fund's barbell structure became less pronounced through December 2013 — becoming more overweight in bonds with maturities of one year and under and less overweight in longer maturities — as we allowed the barbell structure to drift in along with duration. In January 2014, we started to move back to a more evenly distributed barbell structure.
In anticipation of interest rate increases, we exchanged the Fund's longer maturity, lower coupon securities for more defensive, higher coupon bonds. Most new purchases were of bonds rated A or BBB. We decreased the Fund's allocation to securities rated AA. We increased the Fund's allocations to local general obligations bonds and to the transportation sector and decreased its exposure to the pre-refunded sector.
Looking Ahead
After the Fed unsettled the markets in March 2014 by hinting that it might increase interest rates sooner than previously anticipated, Chair Janet Yellen subsequently re-emphasized the Fed's commitment to keep short-term interest rates low. At the end of the annual period, it seemed to us the Fed had reverted back to a no-action bias regarding short-term interest rates until at least the second half of 2015. Given this view, combined with generally mixed-to-weaker economic data releases toward the end of the annual period, we currently intend to firm the Fund's barbell strategy and to take a duration stance just slightly longer than that of the benchmark. We also intend to continue to seek yield one security at a time, relying heavily on the strength of our in-house municipal credit research team to help us evaluate the risk and return potential of each issue. As always, the Fund's emphasis remains on seeking current income exempt from federal income tax, consistent with minimal fluctuation of principal.
Investment Risks
There are risks associated with an investment in this Fund, including market risk, credit risk, interest rate risk, prepayment and extension risk and state-specific municipal securities risk. In general, bond prices rise when interest rates fall and vice versa. Because the Fund concentrates its investments in municipal securities issued by a single state and its municipalities, specific events or factors affecting a particular state can cause more volatility in the Fund than a fund that is more geographically diversified. This effect is more pronounced for longer-term securities. Non-investment grade securities, commonly called 'high-yield' or 'junk' bonds, have more volatile prices and carry more risk to principal and income than investment grade securities. See the Fund's prospectus for information on these and other risks associated with Fund. Income from tax-exempt funds may be subject to state and local taxes. Federal and state income tax rules will apply to any capital gain distributions and any gains or losses on sales.
Annual Report 2014
5
Columbia Short Term Municipal Bond Fund
Understanding Your Fund's Expenses
(Unaudited)
As an investor, you incur two types of costs. There are transaction costs, which generally include sales charges on purchases and may include redemption fees. There are also ongoing costs, which generally include management fees, distribution and/or service fees, and other fund expenses. The following information is intended to help you understand your ongoing costs (in dollars) of investing in the Fund and to help you compare these costs with the ongoing costs of investing in other mutual funds.
Analyzing Your Fund's Expenses
To illustrate these ongoing costs, we have provided examples and calculated the expenses paid by investors in each share class of the Fund during the period. The actual and hypothetical information in the table is based on an initial investment of $1,000 at the beginning of the period indicated and held for the entire period. Expense information is calculated two ways and each method provides you with different information. The amount listed in the "Actual" column is calculated using the Fund's actual operating expenses and total return for the period. You may use the Actual information, together with the amount invested, to estimate the expenses that you paid over the period. Simply divide your account value by $1,000 (for example, an $8,600 account value divided by $1,000 = 8.6), then multiply the results by the expenses paid during the period under the "Actual" column. The amount listed in the "Hypothetical" column assumes a 5% annual rate of return before expenses (which is not the Fund's actual return) and then applies the Fund's actual expense ratio for the period to the hypothetical return. You should not use the hypothetical account values and expenses to estimate either your actual account balance at the end of the period or the expenses you paid during the period. See "Compare With Other Funds" below for details on how to use the hypothetical data.
Compare With Other Funds
Since all mutual funds are required to include the same hypothetical calculations about expenses in shareholder reports, you can use this information to compare the ongoing cost of investing in the Fund with other funds. To do so, compare the hypothetical example with the 5% hypothetical examples that appear in the shareholder reports of other funds. As you compare hypothetical examples of other funds, it is important to note that hypothetical examples are meant to highlight the ongoing costs of investing in a fund only and do not reflect any transaction costs, such as sales charges, or redemption or exchange fees. Therefore, the hypothetical calculations are useful in comparing ongoing costs only, and will not help you determine the relative total costs of owning different funds. If transaction costs were included in these calculations, your costs would be higher.
November 1, 2013 – April 30, 2014
| | | Account Value at the Beginning
of the Period ($) | | Account Value at the End
of the Period ($) | | Expenses Paid During
the Period ($) | | Fund's Annualized
Expense Ratio (%) | |
| | | Actual | | Hypothetical | | Actual | | Hypothetical | | Actual | | Hypothetical | | Actual | |
Class A | | | 1,000.00 | | | | 1,000.00 | | | | 1,003.70 | | | | 1,021.17 | | | | 3.63 | | | | 3.66 | | | | 0.73 | | |
Class B | | | 1,000.00 | | | | 1,000.00 | | | | 999.00 | | | | 1,017.46 | | | | 7.34 | | | | 7.40 | | | | 1.48 | | |
Class C | | | 1,000.00 | | | | 1,000.00 | | | | 999.90 | | | | 1,017.46 | | | | 7.34 | | | | 7.40 | | | | 1.48 | | |
Class R4 | | | 1,000.00 | | | | 1,000.00 | | | | 1,004.90 | | | | 1,022.41 | | | | 2.39 | | | | 2.41 | | | | 0.48 | | |
Class R5 | | | 1,000.00 | | | | 1,000.00 | | | | 1,004.40 | | | | 1,022.91 | | | | 1.89 | | | | 1.91 | | | | 0.38 | | |
Class Z | | | 1,000.00 | | | | 1,000.00 | | | | 1,004.90 | | | | 1,022.41 | | | | 2.39 | | | | 2.41 | | | | 0.48 | | |
Expenses paid during the period are equal to the annualized expense ratio for each class as indicated above, multiplied by the average account value over the period and then multiplied by the number of days in the Fund's most recent fiscal half year and divided by 365.
Expenses do not include fees and expenses incurred indirectly by the Fund from the underlying funds in which the Fund may invest (also referred to as "acquired funds"), including affiliated and non-affiliated pooled investment vehicles (including mutual funds and exchange-traded funds).
Had Columbia Management Investment Advisers, LLC and/or certain of its affiliates not waived/reimbursed certain fees and expenses, account value at the end of the period would have been reduced.
Annual Report 2014
6
Columbia Short Term Municipal Bond Fund
Portfolio of Investments
April 30, 2014
(Percentages represent value of investments compared to net assets)
Municipal Bonds 90.5%
Issue
Description | | Coupon
Rate | | Principal
Amount ($) | | Value ($) | |
Alabama 1.4% | |
Alabama 21st Century Authority
Revenue Bonds
Series 2012A
06/01/18 | | | 5.000 | % | | | 1,250,000 | | | | 1,426,487 | | |
Alabama Public School & College Authority
Refunding Revenue Bonds
Pool | |
Series 2012A
03/01/17 | | | 5.000 | % | | | 4,560,000 | | | | 5,117,506 | | |
03/01/18 | | | 5.000 | % | | | 7,510,000 | | | | 8,636,875 | | |
Series 2009A
05/01/14 | | | 5.000 | % | | | 9,000,000 | | | | 9,001,259 | | |
Auburn University
Revenue Bonds
Series 2012A
06/01/16 | | | 5.000 | % | | | 3,000,000 | | | | 3,286,380 | | |
Total | | | | | | | 27,468,507 | | |
Alaska 0.6% | |
Alaska Industrial Development & Export Authority
Refunding Revenue Bonds
Revolving Fund
Series 2010A
04/01/16 | | | 5.000 | % | | | 2,500,000 | | | | 2,710,100 | | |
City of Valdez
Refunding Revenue Bonds
BP Pipelines, Inc. Project
Series 2003
01/01/16 | | | 5.000 | % | | | 9,200,000 | | | | 9,904,996 | | |
Total | | | | | | | 12,615,096 | | |
Arizona 1.1% | |
Arizona School Facilities Board
Certificate of Participation
Series 2005A-1 (NPFGC)
09/01/14 | | | 5.000 | % | | | 10,000,000 | | | | 10,163,300 | | |
Refunding Certificate of Participation
Series 2013A-1
09/01/16 | | | 4.000 | % | | | 1,500,000 | | | | 1,618,470 | | |
County of Pima Sewer System
Revenue Bonds
Series 2012A
07/01/14 | | | 3.000 | % | | | 1,000,000 | | | | 1,004,880 | | |
Series 2012A
07/01/15 | | | 4.000 | % | | | 375,000 | | | | 391,725 | | |
Series 2012A
07/01/16 | | | 3.000 | % | | | 450,000 | | | | 475,349 | | |
Series 2012A
07/01/16 | | | 4.000 | % | | | 500,000 | | | | 538,955 | | |
Municipal Bonds (continued)
Issue
Description | | Coupon
Rate | | Principal
Amount ($) | | Value ($) | |
Maricopa County Industrial Development Authority
Revenue Bonds
Catholic Healthcare West
Series 2007A
07/01/18 | | | 5.000 | % | | | 1,845,000 | | | | 2,053,817 | | |
State of Arizona
Certificate of Participation
Department Administration
Series 2010A (AGM)
10/01/15 | | | 5.000 | % | | | 5,000,000 | | | | 5,315,200 | | |
Refunding Certificate of Participation
Department Administration
Series 2013B
10/01/14 | | | 3.000 | % | | | 350,000 | | | | 353,773 | | |
10/01/15 | | | 4.000 | % | | | 200,000 | | | | 209,536 | | |
10/01/16 | | | 5.000 | % | | | 175,000 | | | | 191,401 | | |
Total | | | | | | | 22,316,406 | | |
California 9.5% | |
Brea Redevelopment Agency
Refunding Tax Allocation Bonds
Redevelopment Project
Series 2013
08/01/17 | | | 5.000 | % | | | 950,000 | | | | 1,074,830 | | |
08/01/18 | | | 5.000 | % | | | 995,000 | | | | 1,145,464 | | |
California Health Facilities Financing Authority
Revenue Bonds
City of Hope Obligation Group
Series 2012A
11/15/14 | | | 5.000 | % | | | 500,000 | | | | 512,800 | | |
California Health Facilities Financing Authority(a)
Refunding Revenue Bonds
St. Joseph Health System
Series 2009C
07/01/34 | | | 5.000 | % | | | 12,000,000 | | | | 12,266,280 | | |
Revenue Bonds
St. Joseph Health Systems
Series 2013B
07/01/43 | | | 5.000 | % | | | 4,000,000 | | | | 4,570,320 | | |
California Pollution Control Financing Authority
Refunding Revenue Bonds
South Dakota Gas and Electric
Series 1996A (NPFGC)
06/01/14 | | | 5.900 | % | | | 500,000 | | | | 502,487 | | |
California Pollution Control Financing Authority(a)
Refunding Revenue Bonds
BP West Coast Products LLC
Series 2009
12/01/46 | | | 2.600 | % | | | 5,000,000 | | | | 5,036,700 | | |
California State Public Works Board
Refunding Revenue Bonds
Department of Corrections
Series 2012I
06/01/15 | | | 5.000 | % | | | 2,080,000 | | | | 2,187,120 | | |
The accompanying Notes to Financial Statements are an integral part of this statement.
Annual Report 2014
7
Columbia Short Term Municipal Bond Fund
Portfolio of Investments (continued)
April 30, 2014
Municipal Bonds (continued)
Issue
Description | | Coupon
Rate | | Principal
Amount ($) | | Value ($) | |
Richmond Laboratory Project
Series 2012J
11/01/14 | | | 3.000 | % | | | 1,445,000 | | | | 1,465,692 | | |
11/01/15 | | | 4.000 | % | | | 2,035,000 | | | | 2,148,858 | | |
Revenue Bonds
Various Capital Projects
Series 2011A
10/01/16 | | | 4.000 | % | | | 2,000,000 | | | | 2,167,100 | | |
Series 2013I
11/01/17 | | | 5.000 | % | | | 750,000 | | | | 856,710 | | |
Subordinated Series 2010A-1
03/01/15 | | | 5.000 | % | | | 3,000,000 | | | | 3,119,910 | | |
03/01/16 | | | 5.000 | % | | | 1,325,000 | | | | 1,435,107 | | |
City of Los Angeles Department of Airports
Refunding Revenue Bonds
Ontario International
Series 2006A (NPFGC) AMT(b)
05/15/14 | | | 4.750 | % | | | 3,410,000 | | | | 3,416,188 | | |
City of San Jose Airport
Revenue Bonds
Series 2007A (AMBAC) AMT(b)
03/01/17 | | | 5.000 | % | | | 5,415,000 | | | | 6,021,372 | | |
County of Sacramento
Revenue Bonds
GNMA Mortgage
Series 1998A Escrowed to Maturity AMT(b)
07/01/16 | | | 8.000 | % | | | 12,810,000 | | | | 14,792,476 | | |
Glendale Redevelopment Agency
Refunding Tax Allocation Bonds
Central Glendale Redevelopment
Subordinated Series 2013 (AGM)
12/01/15 | | | 3.000 | % | | | 1,000,000 | | | | 1,038,090 | | |
12/01/16 | | | 4.000 | % | | | 1,000,000 | | | | 1,079,810 | | |
12/01/17 | | | 4.000 | % | | | 1,235,000 | | | | 1,355,610 | | |
Los Angeles Department of Water & Power
Revenue Bonds
Power System
Series 2012C
01/01/16 | | | 5.000 | % | | | 10,000,000 | | | | 10,680,000 | | |
M-S-R Public Power Agency
Revenue Bonds
Subordinated Lien
Series 2011O
07/01/14 | | | 4.000 | % | | | 2,300,000 | | | | 2,314,950 | | |
Northern California Power Agency
Revenue Bonds
Series 2010A
07/01/15 | | | 4.000 | % | | | 1,355,000 | | | | 1,416,097 | | |
Oakland Redevelopment Successor Agency
Refunding Tax Allocation Bonds
Subordinated Series 2013
09/01/15 | | | 5.000 | % | | | 4,500,000 | | | | 4,764,060 | | |
09/01/16 | | | 5.000 | % | | | 3,300,000 | | | | 3,612,510 | | |
Municipal Bonds (continued)
Issue
Description | | Coupon
Rate | | Principal
Amount ($) | | Value ($) | |
Oakland Unified School District/Alameda County
Unlimited General Obligation Bonds
Series 2013
08/01/14 | | | 4.000 | % | | | 5,700,000 | | | | 5,747,139 | | |
08/01/15 | | | 4.000 | % | | | 1,470,000 | | | | 1,524,904 | | |
Port of Oakland
Refunding Revenue Bonds
Intermediate Lien
Series 2007B (NPFGC)
11/01/16 | | | 5.000 | % | | | 8,160,000 | | | | 9,076,368 | | |
Sacramento City Financing Authority
Refunding Revenue Bonds
EPA Building
Series 2013A
05/01/15 | | | 4.000 | % | | | 1,250,000 | | | | 1,296,662 | | |
05/01/16 | | | 4.000 | % | | | 750,000 | | | | 800,948 | | |
State of California
Prerefunded 06/01/14 Unlimited General Obligation Bonds
Series 2004
12/01/15 | | | 5.000 | % | | | 2,200,000 | | | | 2,209,196 | | |
Prerefunded 07/01/14 Unlimited General Obligation Bonds
Series 2004A
07/01/15 | | | 5.000 | % | | | 1,170,000 | | | | 1,179,629 | | |
Unlimited General Obligation Bonds
Series 2010
11/01/14 | | | 4.000 | % | | | 1,250,000 | | | | 1,274,450 | | |
Various Purpose
Series 2005
03/01/15 | | | 5.000 | % | | | 4,000,000 | | | | 4,162,040 | | |
Series 2011
10/01/16 | | | 5.000 | % | | | 20,000,000 | | | | 22,202,600 | | |
Series 2012
09/01/15 | | | 5.000 | % | | | 5,000,000 | | | | 5,319,350 | | |
Series 2013
02/01/18 | | | 5.000 | % | | | 10,000,000 | | | | 11,486,600 | | |
Unlimited General Obligation Refunding Bonds
Series 2012
02/01/15 | | | 5.000 | % | | | 15,885,000 | | | | 16,465,597 | | |
Unrefunded Unlimited General Obligation Bonds
Series 2004A
07/01/15 | | | 5.000 | % | | | 1,690,000 | | | | 1,703,740 | | |
State of California(a)
Unlimited General Obligation Refunding Bonds
Series 2009B
07/01/23 | | | 5.000 | % | | | 19,250,000 | | | | 19,407,465 | | |
Total | | | | | | | 192,837,229 | | |
Colorado 1.2% | |
City & County of Denver Airport System
Revenue Bonds
Series 2011A AMT(b)
11/15/15 | | | 5.000 | % | | | 1,500,000 | | | | 1,609,320 | | |
The accompanying Notes to Financial Statements are an integral part of this statement.
Annual Report 2014
8
Columbia Short Term Municipal Bond Fund
Portfolio of Investments (continued)
April 30, 2014
Municipal Bonds (continued)
Issue
Description | | Coupon
Rate | | Principal
Amount ($) | | Value ($) | |
City of Colorado Springs Utilities System
Refunding Revenue Bonds
Series 2011A
11/15/14 | | | 4.000 | % | | | 5,380,000 | | | | 5,492,496 | | |
Denver Urban Renewal Authority
Tax Allocation Bonds
Stapleton
Senior Series 2013A-1
12/01/14 | | | 5.000 | % | | | 2,500,000 | | | | 2,568,325 | | |
12/01/15 | | | 5.000 | % | | | 1,670,000 | | | | 1,788,837 | | |
Denver Wastewater Management Division Department of
Public Works
Revenue Bonds
Series 2012
11/01/14 | | | 5.000 | % | | | 2,440,000 | | | | 2,499,755 | | |
E-470 Public Highway Authority
Revenue Bonds
Senior Capital Appreciation
Series 1997B (NPFGC)(c)
09/01/16 | | | 0.000 | % | | | 4,460,000 | | | | 4,260,638 | | |
Regional Transportation District
Certificate of Participation
Series 2010A
06/01/15 | | | 5.000 | % | | | 1,420,000 | | | | 1,492,732 | | |
06/01/16 | | | 5.000 | % | | | 2,010,000 | | | | 2,196,066 | | |
Refunding Certificate of Participation
Series 2013A
06/01/16 | | | 5.000 | % | | | 3,045,000 | | | | 3,326,876 | | |
Total | | | | | | | 25,235,045 | | |
Connecticut 1.6% | |
City of Bridgeport
Unlimited General Obligation Refunding Bonds
Series 2012B
08/15/15 | | | 4.000 | % | | | 2,500,000 | | | | 2,602,925 | | |
08/15/17 | | | 5.000 | % | | | 5,000,000 | | | | 5,566,800 | | |
City of New Haven
Unlimited General Obligation Bonds
Series 2013A
08/01/15 | | | 5.000 | % | | | 3,135,000 | | | | 3,303,068 | | |
Unlimited General Obligation Refunding Bonds
Series 2006 (AMBAC)
11/01/15 | | | 5.000 | % | | | 2,325,000 | | | | 2,471,870 | | |
Connecticut Housing Finance Authority
Revenue Bonds
Subordinated Series 2012D-1
11/15/14 | | | 0.850 | % | | | 3,215,000 | | | | 3,224,291 | | |
11/15/15 | | | 1.200 | % | | | 3,710,000 | | | | 3,753,147 | | |
State of Connecticut
Unlimited General Obligation Bonds
Series 2011A(a)
05/15/15 | | | 0.600 | % | | | 11,265,000 | | | | 11,292,712 | | |
Total | | | | | | | 32,214,813 | | |
Municipal Bonds (continued)
Issue
Description | | Coupon
Rate | | Principal
Amount ($) | | Value ($) | |
District Of Columbia 0.3% | |
District of Columbia
Certificate of Participation
Series 2006 (NPFGC)
01/01/17 | | | 5.250 | % | | | 5,925,000 | | | | 6,316,287 | | |
Florida 6.5% | |
Citizens Property Insurance Corp.
Revenue Bonds
High Risk Senior Secured
Series 2010A-1
06/01/15 | | | 5.000 | % | | | 13,750,000 | | | | 14,454,275 | | |
Series 2010A-1 (AGM)
06/01/15 | | | 5.000 | % | | | 6,155,000 | | | | 6,470,259 | | |
Senior Secured
Series 2012A-1
06/01/17 | | | 5.000 | % | | | 15,000,000 | | | | 16,817,850 | | |
City of Jacksonville
Refunding Revenue Bonds
Series 2012C
10/01/14 | | | 5.000 | % | | | 1,250,000 | | | | 1,275,438 | | |
Series 2012C
10/01/15 | | | 5.000 | % | | | 1,000,000 | | | | 1,067,410 | | |
Sales Tax
Series 2012
10/01/17 | | | 5.000 | % | | | 2,000,000 | | | | 2,265,700 | | |
Revenue Bonds
Series 2010A-1
10/01/16 | | | 5.000 | % | | | 5,000,000 | | | | 5,538,450 | | |
City of Tampa
Revenue Bonds
Baycare Health Systems
Series 2010
11/15/16 | | | 5.000 | % | | | 2,000,000 | | | | 2,224,720 | | |
Florida Department of Environmental Protection
Refunding Revenue Bonds
Florida Forever
Series 2011B
07/01/15 | | | 5.000 | % | | | 15,335,000 | | | | 16,185,019 | | |
Series 2012A
07/01/16 | | | 4.000 | % | | | 13,915,000 | | | | 14,951,946 | | |
07/01/17 | | | 4.000 | % | | | 14,470,000 | | | | 15,897,031 | | |
Florida HomeLoan Corp.
Revenue Bonds
Homeowner Mortgage Special Program
Series 2010A (GNMA/FNMA/FHLMC)
07/01/28 | | | 5.000 | % | | | 2,295,000 | | | | 2,452,712 | | |
Florida Municipal Loan Council
Revenue Bonds
9B Design-Build Finance Project
Series 2012
08/15/16 | | | 1.750 | % | | | 9,250,000 | | | | 9,374,413 | | |
The accompanying Notes to Financial Statements are an integral part of this statement.
Annual Report 2014
9
Columbia Short Term Municipal Bond Fund
Portfolio of Investments (continued)
April 30, 2014
Municipal Bonds (continued)
Issue
Description | | Coupon
Rate | | Principal
Amount ($) | | Value ($) | |
Orange County Health Facilities Authority
Revenue Bonds
Hospital-Orlando Health, Inc.
Series 2009
10/01/14 | | | 5.000 | % | | | 2,000,000 | | | | 2,038,860 | | |
Pasco County School Board
Revenue Bonds
Series 2013
10/01/18 | | | 5.000 | % | | | 1,000,000 | | | | 1,153,960 | | |
St. Johns River Power Park
Refunding Revenue Bonds
Issue 2
Series 2011-23
10/01/17 | | | 5.000 | % | | | 3,000,000 | | | | 3,428,490 | | |
State Board of Administration Finance Corp.
Revenue Bonds
Series 2010A
07/01/15 | | | 5.000 | % | | | 10,000,000 | | | | 10,550,700 | | |
State of Florida
Unlimited General Obligation Refunding Bonds
Capital Outlay
Series 2009D
06/01/14 | | | 5.000 | % | | | 6,460,000 | | | | 6,487,619 | | |
Total | | | | | | | 132,634,852 | | |
Georgia 1.3% | |
Burke County Development Authority
Revenue Bonds
Georgia Power Co. Plant Vogtle Project
Series 2012(a)
11/01/48 | | | 1.550 | % | | | 5,000,000 | | | | 5,061,750 | | |
City of Atlanta Department of Aviation
Refunding Revenue Bonds
Series 2011A
01/01/19 | | | 5.000 | % | | | 4,000,000 | | | | 4,648,640 | | |
Floyd County Development Authority
Revenue Bonds
Georgia Power Company Plant Hammond Project
Series 2012(a)
07/01/22 | | | 0.850 | % | | | 4,750,000 | | | | 4,766,007 | | |
Municipal Electric Authority of Georgia
Revenue Bonds
Combined Cycle Project
Series 2012A
11/01/14 | | | 4.000 | % | | | 1,000,000 | | | | 1,019,270 | | |
11/01/15 | | | 4.000 | % | | | 3,045,000 | | | | 3,215,672 | | |
Unrefunded Revenue Bonds
Series 1998Y (AGM)
01/01/17 | | | 6.500 | % | | | 3,965,000 | | | | 4,296,831 | | |
Public Gas Partners, Inc.
Revenue Bonds
Series 2009A
10/01/14 | | | 5.000 | % | | | 3,630,000 | | | | 3,697,700 | | |
Total | | | | | | | 26,705,870 | | |
Municipal Bonds (continued)
Issue
Description | | Coupon
Rate | | Principal
Amount ($) | | Value ($) | |
Guam 0.1% | |
Antonio B. Won Pat International Airport Authority(b)(d)
Revenue Bonds
General
Series 2013C AMT
10/01/14 | | | 3.000 | % | | | 1,000,000 | | | | 1,007,770 | | |
10/01/15 | | | 4.000 | % | | | 1,000,000 | | | | 1,040,440 | | |
Total | | | | | | | 2,048,210 | | |
Hawaii 0.4% | |
State of Hawaii Airports System
Refunding Revenue Bonds
Series 2010B AMT(b)
07/01/15 | | | 5.000 | % | | | 7,000,000 | | | | 7,385,490 | | |
Illinois 11.0% | |
Chicago Board of Education
Unlimited General Obligation Refunding Bonds
Series 2004A (NPFGC)
12/01/15 | | | 5.000 | % | | | 1,700,000 | | | | 1,746,104 | | |
Series 2010F
12/01/15 | | | 5.000 | % | | | 2,000,000 | | | | 2,123,420 | | |
Chicago Board of Education(c)
Unlimited General Obligation Bonds
Capital Appreciation-Chicago School Reform
Series 1997A (AMBAC)
12/01/14 | | | 0.000 | % | | | 7,085,000 | | | | 7,059,494 | | |
Chicago Midway International Airport
Refunding Revenue Bonds
2nd Lien
Series 2004B (AMBAC)
01/01/18 | | | 5.000 | % | | | 5,120,000 | | | | 5,270,938 | | |
Chicago Midway International Airport(a)
Prerefunded 01/01/15 Revenue Bonds
2nd Lien
Series 2010B
01/01/34 | | | 5.000 | % | | | 10,250,000 | | | | 10,576,872 | | |
Chicago O'Hare International Airport
Revenue Bonds
General-Third Lien
Series 2011B
01/01/17 | | | 5.000 | % | | | 2,500,000 | | | | 2,778,850 | | |
Chicago O'Hare International Airport(b)
Refunding Revenue Bonds
General-Senior Lien
Series 2012A AMT
01/01/17 | | | 5.000 | % | | | 8,000,000 | | | | 8,851,920 | | |
01/01/18 | | | 5.000 | % | | | 11,340,000 | | | | 12,777,685 | | |
Series 2013A AMT
01/01/16 | | | 5.000 | % | | | 3,875,000 | | | | 4,159,774 | | |
Passenger Facility Charge
Series 2012B AMT
01/01/17 | | | 5.000 | % | | | 13,125,000 | | | | 14,522,681 | | |
The accompanying Notes to Financial Statements are an integral part of this statement.
Annual Report 2014
10
Columbia Short Term Municipal Bond Fund
Portfolio of Investments (continued)
April 30, 2014
Municipal Bonds (continued)
Issue
Description | | Coupon
Rate | | Principal
Amount ($) | | Value ($) | |
Chicago Public Building Commission
Refunding Revenue Bonds
Chicago School Reform
Series 1999B (NPFGC)
12/01/15 | | | 5.250 | % | | | 3,165,000 | | | | 3,378,258 | | |
Chicago Transit Authority
Revenue Bonds
Federal Transportation Administration Section 5307 Funds
Series 2006 (AMBAC)
06/01/15 | | | 5.000 | % | | | 2,615,000 | | | | 2,738,925 | | |
Unrefunded Revenue Bonds
Federal Transit Administration
Series 2006 (AMBAC)
06/01/17 | | | 5.000 | % | | | 2,875,000 | | | | 3,167,704 | | |
City of Chicago Wastewater Transmission
Refunding Revenue Bonds
2nd Lien
Series 2001 (NPFGC)
01/01/18 | | | 5.500 | % | | | 1,750,000 | | | | 1,989,558 | | |
City of Chicago
Refunding Unlimited General Obligation Bonds
Series 1996A-2 (AMBAC)
01/01/18 | | | 5.500 | % | | | 7,125,000 | | | | 7,854,315 | | |
Unlimited General Obligation Bonds
Series 2010A
12/01/16 | | | 5.000 | % | | | 2,500,000 | | | | 2,734,650 | | |
Unlimited General Obligation Refunding Bonds
Series 2005A (AGM)
01/01/16 | | | 5.000 | % | | | 4,000,000 | | | | 4,115,200 | | |
Cook County Community High School District No. 228
Limited General Obligation Bonds
Series 2014B
12/01/16 | | | 5.000 | % | | | 1,250,000 | | | | 1,382,275 | | |
12/01/17 | | | 5.000 | % | | | 2,000,000 | | | | 2,262,800 | | |
County of Cook
Unlimited General Obligation Bonds
Capital Equipment
Series 2009D
11/15/14 | | | 5.000 | % | | | 3,000,000 | | | | 3,078,030 | | |
Illinois Finance Authority
Refunding Revenue Bonds
DePaul University
Series 2004A
10/01/15 | | | 5.375 | % | | | 2,000,000 | | | | 2,139,340 | | |
Revenue Bonds
Art Institute of Chicago
Series 2010A
03/01/15 | | | 5.000 | % | | | 3,200,000 | | | | 3,323,744 | | |
Series 2012A
03/01/15 | | | 5.000 | % | | | 1,000,000 | | | | 1,038,840 | | |
Illinois Finance Authority(a)
Revenue Bonds
Ascension Health
Series 2012E
11/15/42 | | | 5.000 | % | | | 2,750,000 | | | | 2,877,325 | | |
Municipal Bonds (continued)
Issue
Description | | Coupon
Rate | | Principal
Amount ($) | | Value ($) | |
Ascension Health Credit Group
Series 2012E
11/15/42 | | | 5.000 | % | | | 2,000,000 | | | | 2,243,040 | | |
Railsplitter Tobacco Settlement Authority
Revenue Bonds
Series 2010
06/01/15 | | | 5.000 | % | | | 3,615,000 | | | | 3,780,639 | | |
06/01/16 | | | 5.000 | % | | | 8,280,000 | | | | 8,971,214 | | |
Regional Transportation Authority
Revenue Bonds
Series 2006A (NPFGC)
07/01/18 | | | 5.000 | % | | | 4,970,000 | | | | 5,402,688 | | |
State of Illinois Unemployment Compensation Trust Fund
Revenue Bonds
Series 2012B
06/15/17 | | | 5.000 | % | | | 9,000,000 | | | | 10,025,100 | | |
State of Illinois
Unlimited General Obligation Bonds
Series 2014
02/01/18 | | | 4.000 | % | | | 2,750,000 | | | | 2,988,508 | | |
04/01/18 | | | 5.000 | % | | | 10,000,000 | | | | 11,280,500 | | |
04/01/19 | | | 5.000 | % | | | 10,000,000 | | | | 11,376,200 | | |
Unlimited General Obligation Refunding Bonds
Series 2002 (XLCA)
08/01/15 | | | 5.500 | % | | | 7,825,000 | | | | 8,323,452 | | |
Series 2006
01/01/16 | | | 5.000 | % | | | 4,655,000 | | | | 4,990,626 | | |
Series 2010
01/01/16 | | | 5.000 | % | | | 14,600,000 | | | | 15,652,660 | | |
Series 2010 (AGM)
01/01/16 | | | 5.000 | % | | | 4,250,000 | | | | 4,561,610 | | |
Series 2012
08/01/16 | | | 5.000 | % | | | 20,000,000 | | | | 21,836,000 | | |
Total | | | | | | | 223,380,939 | | |
Indiana 2.0% | |
City of Whiting
Revenue Bonds
BP Products North America, Inc.
Series 2008(a)
06/01/44 | | | 2.800 | % | | | 13,250,000 | | | | 13,280,342 | | |
Indiana Finance Authority
Refunding Revenue Bonds
Series 2008A-1
11/01/16 | | | 5.000 | % | | | 2,665,000 | | | | 2,950,182 | | |
Indianapolis Power & Light Co.
Series 2009C
01/01/16 | | | 4.900 | % | | | 10,000,000 | | | | 10,625,000 | | |
Revenue Bonds
2nd Lien-CWA
Series 2011C
10/01/16 | | | 3.000 | % | | | 10,000,000 | | | | 10,506,300 | | |
Beacon Health System Obligation Group
Series 2013A
08/15/15 | | | 4.000 | % | | | 500,000 | | | | 524,035 | | |
08/15/16 | | | 5.000 | % | | | 1,000,000 | | | | 1,099,810 | | |
The accompanying Notes to Financial Statements are an integral part of this statement.
Annual Report 2014
11
Columbia Short Term Municipal Bond Fund
Portfolio of Investments (continued)
April 30, 2014
Municipal Bonds (continued)
Issue
Description | | Coupon
Rate | | Principal
Amount ($) | | Value ($) | |
Ivy Tech Community College
Revenue Bonds
Student Fee
Series 2013R-1
07/01/17 | | | 5.000 | % | | | 1,000,000 | | | | 1,130,840 | | |
Total | | | | | | | 40,116,509 | | |
Iowa 1.5% | |
Iowa Finance Authority
Revenue Bonds
Genesis Health System
Series 2010
07/01/15 | | | 5.000 | % | | | 1,075,000 | | | | 1,132,115 | | |
07/01/16 | | | 5.000 | % | | | 1,150,000 | | | | 1,249,762 | | |
Iowa Student Loan Liquidity Corp.
Revenue Bonds
Series 2009-1
12/01/14 | | | 3.750 | % | | | 5,050,000 | | | | 5,128,780 | | |
12/01/14 | | | 5.000 | % | | | 5,475,000 | | | | 5,601,910 | | |
Iowa Student Loan Liquidity Corp.(b)
Revenue Bonds
Senior Series 2011A-1 AMT
12/01/15 | | | 3.500 | % | | | 16,760,000 | | | | 16,994,808 | | |
Total | | | | | | | 30,107,375 | | |
Kentucky 0.5% | |
Kentucky Economic Development Finance Authority
Revenue Bonds
Catholic Health
Series 2009B(a)
05/01/39 | | | 5.000 | % | | | 2,000,000 | | | | 2,049,460 | | |
Kentucky Public Transportation Infrastructure Authority
Revenue Bonds
Downtown Crossing Project
BAN Subordinated Series 2013
07/01/17 | | | 5.000 | % | | | 5,550,000 | | | | 6,159,890 | | |
Kentucky State Property & Building Commission
Refunding Revenue Bonds
Project No. 100
Series 2011A
08/01/18 | | | 5.000 | % | | | 2,500,000 | | | | 2,880,100 | | |
Total | | | | | | | 11,089,450 | | |
Louisiana 1.5% | |
Louisiana Local Government Environmental Facilities & Community Development Authority
Revenue Bonds
LCTCS Facilities Corp. Project
Series 2009A
10/01/14 | | | 4.000 | % | | | 1,545,000 | | | | 1,567,990 | | |
Municipal Bonds (continued)
Issue
Description | | Coupon
Rate | | Principal
Amount ($) | | Value ($) | |
Louisiana Office Facilities Corp.
Refunding Revenue Bonds
State Capitol
Series 2010A
05/01/16 | | | 5.000 | % | | | 4,505,000 | | | | 4,887,700 | | |
Louisiana Public Facilities Authority
Revenue Bonds
Entergy Gulf States Louisiana
Series 2010B
11/01/15 | | | 2.875 | % | | | 2,750,000 | | | | 2,816,990 | | |
Louisiana State Citizens Property Insurance Corp.
Revenue Bonds
Series 2006B (AMBAC)
06/01/17 | | | 5.000 | % | | | 6,090,000 | | | | 6,563,741 | | |
Orleans Parish Parishwide School District
Unlimited General Obligation Refunding Bonds
Series 2010 (AGM)
09/01/15 | | | 4.000 | % | | | 8,240,000 | | | | 8,606,103 | | |
09/01/16 | | | 5.000 | % | | | 3,785,000 | | | | 4,137,611 | | |
Regional Transit Authority
Revenue Bonds
Sales Tax
Series 2010 (AGM)
12/01/15 | | | 4.000 | % | | | 1,150,000 | | | | 1,212,755 | | |
12/01/16 | | | 4.000 | % | | | 1,000,000 | | | | 1,080,840 | | |
Total | | | | | | | 30,873,730 | | |
Maine 0.4% | |
Maine Health & Higher Educational Facilities Authority
Revenue Bonds
Escrowed to Maturity
Series 2010B
07/01/16 | | | 4.000 | % | | | 50,000 | | | | 53,816 | | |
Escrowed to Maturity Series 2010B
07/01/15 | | | 5.000 | % | | | 50,000 | | | | 52,778 | | |
Unrefunded Revenue Bonds
Series 2010B
07/01/15 | | | 5.000 | % | | | 3,405,000 | | | | 3,584,648 | | |
Series 2010B
07/01/16 | | | 4.000 | % | | | 3,505,000 | | | | 3,738,678 | | |
Total | | | | | | | 7,429,920 | | |
Maryland 0.5% | |
County of Charles
Refunding Unlimited General Obligation Bonds
Consolidated Public Improvement
Series 2012
03/01/18 | | | 5.000 | % | | | 4,395,000 | | | | 5,058,074 | | |
University System of Maryland
Revenue Bonds
Series 2012C
04/01/18 | | | 5.000 | % | | | 3,605,000 | | | | 4,162,405 | | |
Total | | | | | | | 9,220,479 | | |
The accompanying Notes to Financial Statements are an integral part of this statement.
Annual Report 2014
12
Columbia Short Term Municipal Bond Fund
Portfolio of Investments (continued)
April 30, 2014
Municipal Bonds (continued)
Issue
Description | | Coupon
Rate | | Principal
Amount ($) | | Value ($) | |
Massachusetts 3.1% | |
Commonwealth of Massachusetts
Limited General Obligation Bonds
Consolidated Loan
Series 2013A
04/01/18 | | | 5.000 | % | | | 4,400,000 | | | | 5,075,752 | | |
Commonwealth of Massachusetts(a)
Unlimited General Obligation Refunding Bonds
Series 2011A
02/01/15 | | | 0.760 | % | | | 2,000,000 | | | | 2,000,000 | | |
Massachusetts Development Finance Agency
Revenue Bonds
Boston Medical Center
Series 2012C
07/01/15 | | | 5.000 | % | | | 2,000,000 | | | | 2,082,720 | | |
07/01/16 | | | 5.000 | % | | | 1,600,000 | | | | 1,713,024 | | |
Boston University
Series 2009V-2
10/01/14 | | | 2.875 | % | | | 4,975,000 | | | | 5,032,760 | | |
Massachusetts Development Finance Agency(a)
Revenue Bonds
Tufts University
Series 2011-P
02/15/36 | | | 3.000 | % | | | 3,700,000 | | | | 3,872,494 | | |
Williams College
Series 2011N
07/01/41 | | | 0.600 | % | | | 11,250,000 | | | | 11,252,812 | | |
Massachusetts Educational Financing Authority
Revenue Bonds
Series 2009I
01/01/16 | | | 5.250 | % | | | 12,500,000 | | | | 13,344,875 | | |
Massachusetts Housing Finance Agency
Revenue Notes
Construction Loan Notes
Series 2012F
12/01/14 | | | 0.650 | % | | | 2,760,000 | | | | 2,760,580 | | |
Massachusetts Municipal Wholesale Electric Co.
Revenue Bonds
Project 6
Series 2012A
07/01/15 | | | 5.000 | % | | | 1,500,000 | | | | 1,582,965 | | |
07/01/16 | | | 5.000 | % | | | 3,000,000 | | | | 3,288,180 | | |
Massachusetts Port Authority
Refunding Revenue Bonds
Series 2010E AMT(b)
07/01/15 | | | 5.000 | % | | | 4,000,000 | | | | 4,216,880 | | |
Massachusetts Water Pollution Abatement Trust (The)
Refunding Revenue Bonds
Series 2004A
02/01/18 | | | 5.250 | % | | | 3,670,000 | | | | 4,253,750 | | |
University of Massachusetts Building Authority
Refunding Revenue Bonds
Senior Series 2005-2 (AMBAC)
11/01/15 | | | 5.000 | % | | | 3,000,000 | | | | 3,207,480 | | |
Total | | | | | | | 63,684,272 | | |
Municipal Bonds (continued)
Issue
Description | | Coupon
Rate | | Principal
Amount ($) | | Value ($) | |
Michigan 3.5% | |
Detroit City School District
Unlimited General Obligation Refunding Bonds
Improvement School Building & Site
Series 2012A (Qualified School Board Loan Fund)
05/01/14 | | | 4.000 | % | | | 1,700,000 | | | | 1,700,166 | | |
Michigan Finance Authority
Refunding Revenue Bonds
State Revolving Fund Drinking Water
Series 2012
10/01/18 | | | 5.000 | % | | | 3,640,000 | | | | 4,247,225 | | |
Revenue Bonds
Unemployment Obligation Assessment
Series 2012
07/01/15 | | | 5.000 | % | | | 20,000,000 | | | | 21,135,400 | | |
Michigan State Building Authority
Refunding Revenue Bonds
FACS Program
Series 2013I-A
10/15/15 | | | 5.000 | % | | | 5,550,000 | | | | 5,918,520 | | |
Michigan State Hospital Finance Authority
Revenue Bonds
Ascension Health Senior Care Group
Series 2010
11/15/15 | | | 5.000 | % | | | 2,000,000 | | | | 2,140,700 | | |
Michigan State Hospital Finance Authority(a)
Revenue Bonds
Ascension Health Care Group
Series 1999
11/15/33 | | | 0.900 | % | | | 5,000,000 | | | | 5,016,400 | | |
Michigan Strategic Fund
Refunding Revenue Bonds
Dow Chemical
Series 2003B-1
06/01/14 | | | 6.250 | % | | | 12,000,000 | | | | 12,051,997 | | |
Royal Oak Hospital Finance Authority
Refunding Revenue Bonds
William Beaumont Hospital
Series 2014D(e)
09/01/17 | | | 5.000 | % | | | 1,400,000 | | | | 1,576,932 | | |
Wayne County Airport Authority
Refunding Revenue Bonds
Detroit Metro Airport
Series 2010C
12/01/14 | | | 5.000 | % | | | 12,805,000 | | | | 13,147,406 | | |
Detroit Metropolitan Airport
Series 2010C (AGM)
12/01/15 | | | 5.000 | % | | | 4,780,000 | | | | 5,118,328 | | |
Total | | | | | | | 72,053,074 | | |
The accompanying Notes to Financial Statements are an integral part of this statement.
Annual Report 2014
13
Columbia Short Term Municipal Bond Fund
Portfolio of Investments (continued)
April 30, 2014
Municipal Bonds (continued)
Issue
Description | | Coupon
Rate | | Principal
Amount ($) | | Value ($) | |
Minnesota 1.3% | |
Minneapolis-St. Paul Metropolitan Airports Commission
Refunding Revenue Bonds
Subordinated Series 2010D AMT(b)
01/01/16 | | | 5.000 | % | | | 5,160,000 | | | | 5,506,133 | | |
Moorhead Independent School District No. 152
Refunding Unlimited General Obligation Bonds
School Buildings
Series 2014A
04/01/18 | | | 5.000 | % | | | 3,285,000 | | | | 3,790,200 | | |
State of Minnesota
Refunding Revenue Bonds
Appropriation
Series 2012B
03/01/16 | | | 4.000 | % | | | 9,820,000 | | | | 10,475,485 | | |
Series 2012B
03/01/17 | | | 5.000 | % | | | 6,625,000 | | | | 7,434,972 | | |
Total | | | | | | | 27,206,790 | | |
Mississippi 0.1% | |
Mississippi Development Bank
Revenue Bonds
Marshall County Industrial Development Authority
Series 2012
01/01/15 | | | 4.000 | % | | | 375,000 | | | | 384,578 | | |
01/01/16 | | | 4.000 | % | | | 1,500,000 | | | | 1,589,235 | | |
Total | | | | | | | 1,973,813 | | |
Missouri 0.2% | |
City of St. Louis Airport
Refunding Revenue Bonds
Lambert-St. Louis International Airport
Series 2013
07/01/16 | | | 5.000 | % | | | 1,325,000 | | | | 1,445,946 | | |
07/01/17 | | | 5.000 | % | | | 715,000 | | | | 805,433 | | |
07/01/18 | | | 5.000 | % | | | 765,000 | | | | 876,147 | | |
Kansas City Airport Revenue
Refunding Revenue Bonds
General Improvement
Series 2013B
09/01/16 | | | 5.000 | % | | | 410,000 | | | | 452,283 | | |
Kansas City Airport Revenue(b)
Refunding Revenue Bonds
General Improvement
Series 2013A AMT
09/01/16 | | | 5.000 | % | | | 1,000,000 | | | | 1,102,310 | | |
Total | | | | | | | 4,682,119 | | |
Nevada 1.3% | |
Clark County School District
Refunding Limited General Obligation Bonds
Series 2014A
06/15/18 | | | 5.000 | % | | | 10,000,000 | | | | 11,511,900 | | |
Municipal Bonds (continued)
Issue
Description | | Coupon
Rate | | Principal
Amount ($) | | Value ($) | |
Las Vegas Convention & Visitors Authority
Refunding Revenue Bonds
Series 2005 (AMBAC)
07/01/17 | | | 5.000 | % | | | 13,380,000 | | | | 14,088,471 | | |
Total | | | | | | | 25,600,371 | | |
New Jersey 5.4% | |
City of Newark
Refunding Unlimited General Obligation Bonds
Qualified General Improvement
Series 2013A
07/15/15 | | | 5.000 | % | | | 2,000,000 | | | | 2,111,560 | | |
07/15/16 | | | 5.000 | % | | | 5,845,000 | | | | 6,401,853 | | |
City of Trenton
Unlimited General Obligation Refunding Bonds
Series 2013
07/15/15 | | | 3.000 | % | | | 1,000,000 | | | | 1,032,350 | | |
07/15/16 | | | 4.000 | % | | | 1,100,000 | | | | 1,179,266 | | |
County of Union
Unlimited General Obligation Bonds
Series 2012B
03/01/15 | | | 3.000 | % | | | 4,060,000 | | | | 4,156,060 | | |
03/01/16 | | | 3.000 | % | | | 4,080,000 | | | | 4,274,657 | | |
New Brunswick Parking Authority
Refunding Revenue Bonds
City Guaranteed Parking
Series 2012
09/01/15 | | | 3.000 | % | | | 1,500,000 | | | | 1,550,070 | | |
New Jersey Building Authority
Refunding Revenue Bonds
Series 2013A
06/15/17 | | | 5.000 | % | | | 5,500,000 | | | | 6,187,610 | | |
New Jersey Economic Development Authority
Refunding Revenue Bonds
School Facilities Construction
Series 2010DD-1
12/15/17 | | | 5.000 | % | | | 4,435,000 | | | | 5,044,502 | | |
Transportation Project Sublease
Series 2008A
05/01/17 | | | 5.000 | % | | | 11,345,000 | | | | 12,689,042 | | |
New Jersey Higher Education Student Assistance Authority(b)
Revenue Bonds
Senior Series 2013-1A AMT
12/01/15 | | | 4.000 | % | | | 1,750,000 | | | | 1,839,530 | | |
12/01/16 | | | 4.000 | % | | | 1,000,000 | | | | 1,069,130 | | |
12/01/17 | | | 5.000 | % | | | 2,780,000 | | | | 3,069,509 | | |
New Jersey State Turnpike Authority
Revenue Bonds
Series 2013D(a)
01/01/22 | | | 0.630 | % | | | 4,000,000 | | | | 4,014,360 | | |
The accompanying Notes to Financial Statements are an integral part of this statement.
Annual Report 2014
14
Columbia Short Term Municipal Bond Fund
Portfolio of Investments (continued)
April 30, 2014
Municipal Bonds (continued)
Issue
Description | | Coupon
Rate | | Principal
Amount ($) | | Value ($) | |
New Jersey Transit Corp.
Certificate of Participation
Federal Transit Administration Grants
Subordinated Series 2005A (NPFGC)
09/15/16 | | | 5.000 | % | | | 6,500,000 | | | | 6,875,115 | | |
09/15/17 | | | 5.000 | % | | | 8,770,000 | | | | 9,889,403 | | |
09/15/18 | | | 5.000 | % | | | 4,450,000 | | | | 4,701,024 | | |
New Jersey Transportation Trust Fund Authority
Revenue Bonds
Transportation Program
Series 2012AA
06/15/14 | | | 4.000 | % | | | 3,000,000 | | | | 3,014,615 | | |
Transportation System
Series 2004 (NPFGC)
12/15/16 | | | 5.500 | % | | | 9,600,000 | | | | 10,817,952 | | |
Unrefunded Revenue Bonds
Transportation System
Series 1999
06/15/16 | | | 5.750 | % | | | 4,860,000 | | | | 5,395,912 | | |
State of New Jersey
Certificate of Participation
Equipment Lease Purchase
Series 2004A
06/15/15 | | | 5.000 | % | | | 3,000,000 | | | | 3,017,760 | | |
Series 2008A
06/15/17 | | | 5.000 | % | | | 1,935,000 | | | | 2,165,575 | | |
06/15/18 | | | 5.000 | % | | | 9,100,000 | | | | 10,325,770 | | |
Total | | | | | | | 110,822,625 | | |
New Mexico 0.8% | |
Incorporated County of Los Alamos
Revenue Bonds
Series 2004A (AGM)
07/01/15 | | | 5.000 | % | | | 2,555,000 | | | | 2,565,016 | | |
New Mexico Educational Assistance Foundation
Revenue Bonds
Educational Loan
Senior Series 2009C AMT(b)
09/01/14 | | | 3.900 | % | | | 4,890,000 | | | | 4,940,171 | | |
State of New Mexico Severance Tax Permanent Fund
Revenue Bonds
Series 2009A
07/01/14 | | | 5.000 | % | | | 7,895,000 | | | | 7,960,213 | | |
Total | | | | | | | 15,465,400 | | |
New York 15.4% | |
Buffalo & Fort Erie Public Bridge Authority
Refunding Revenue Bonds
Series 2005(a)
01/01/25 | | | 2.625 | % | | | 8,625,000 | | | | 8,651,134 | | |
City of New York
Prerefunded 02/01/16 Unlimited General Obligation Bonds
Series 2005G
08/01/18 | | | 5.000 | % | | | 15,000 | | | | 16,231 | | |
Municipal Bonds (continued)
Issue
Description | | Coupon
Rate | | Principal
Amount ($) | | Value ($) | |
Unlimited General Obligation Bonds
Series 2004H
03/01/19 | | | 5.000 | % | | | 8,500,000 | | | | 9,911,765 | | |
Series 2005J (FGIC)
03/01/16 | | | 5.000 | % | | | 8,000,000 | | | | 8,315,040 | | |
Series 2005O
06/01/14 | | | 5.000 | % | | | 4,250,000 | | | | 4,268,103 | | |
Series 2009C
08/01/17 | | | 5.000 | % | | | 12,000,000 | | | | 13,612,680 | | |
Series 2009E
08/01/15 | | | 5.000 | % | | | 3,500,000 | | | | 3,711,085 | | |
Series 2010B
08/01/17 | | | 5.000 | % | | | 5,000,000 | | | | 5,671,950 | | |
Series 2013E
08/01/18 | | | 5.000 | % | | | 4,000,000 | | | | 4,624,680 | | |
08/01/18 | | | 5.000 | % | | | 5,960,000 | | | | 6,890,773 | | |
Subordinated Series 1996J-2
02/15/15 | | | 5.000 | % | | | 5,870,000 | | | | 6,095,643 | | |
Subordinated Series 2004H-A Escrowed to Maturity
03/01/15 | | | 5.000 | % | | | 2,705,000 | | | | 2,813,092 | | |
Subordinated Series 2005F-1
09/01/16 | | | 5.000 | % | | | 3,350,000 | | | | 3,559,140 | | |
Subordinated Series 2008I-1
02/01/17 | | | 5.000 | % | | | 8,635,000 | | | | 9,646,245 | | |
Unrefunded Unlimited General Obligation Bonds
Series 2005G
08/01/18 | | | 5.000 | % | | | 3,635,000 | | | | 3,922,783 | | |
Subordinated Series 2004H-A
03/01/15 | | | 5.000 | % | | | 3,795,000 | | | | 3,948,963 | | |
City of Rochester
Limited General Obligation Bonds
Series 2012I
08/15/14 | | | 2.000 | % | | | 2,400,000 | | | | 2,413,128 | | |
City of Yonkers
Refunding Limited General Obligation Bonds
Series 2012A
07/01/15 | | | 4.000 | % | | | 1,250,000 | | | | 1,296,600 | | |
County of Monroe
Limited General Obligation Refunding Bonds
Series 2012
03/01/15 | | | 5.000 | % | | | 1,000,000 | | | | 1,036,210 | | |
County of Rockland
Limited General Obligation Bonds
Series 2014A (AGM)
03/01/17 | | | 5.000 | % | | | 1,825,000 | | | | 2,011,716 | | |
03/01/18 | | | 5.000 | % | | | 1,825,000 | | | | 2,047,285 | | |
03/01/19 | | | 5.000 | % | | | 2,000,000 | | | | 2,271,960 | | |
County of Suffolk
Limited General Obligation Bonds
Public Improvement
Series 2013B
10/15/15 | | | 3.000 | % | | | 3,870,000 | | | | 4,014,738 | | |
10/15/16 | | | 3.000 | % | | | 3,905,000 | | | | 4,120,204 | | |
The accompanying Notes to Financial Statements are an integral part of this statement.
Annual Report 2014
15
Columbia Short Term Municipal Bond Fund
Portfolio of Investments (continued)
April 30, 2014
Municipal Bonds (continued)
Issue
Description | | Coupon
Rate | | Principal
Amount ($) | | Value ($) | |
Erie County Industrial Development Agency (The)
Revenue Bonds
Series 2012
05/01/15 | | | 5.000 | % | | | 2,000,000 | | | | 2,095,980 | | |
05/01/17 | | | 5.000 | % | | | 3,000,000 | | | | 3,377,280 | | |
Long Island Power Authority
Prerefunded 09/01/14 Revenue Bonds
Series 2006D Escrowed to Maturity (NPFGC)
09/01/14 | | | 5.000 | % | | | 1,585,000 | | | | 1,609,900 | | |
Revenue Bonds
Series 2010A Escrowed to Maturity
05/01/14 | | | 4.000 | % | | | 4,015,000 | | | | 4,015,442 | | |
Series 2012B
09/01/16 | | | 5.000 | % | | | 6,755,000 | | | | 7,376,055 | | |
Unrefunded Revenue Bonds
Series 2006D (NPFGC)
09/01/14 | | | 5.000 | % | | | 340,000 | | | | 345,243 | | |
Metropolitan Transportation Authority
Revenue Bonds
Series 2005A (AMBAC)
11/15/18 | | | 5.500 | % | | | 5,000,000 | | | | 5,926,900 | | |
Series 2008A
11/15/18 | | | 5.000 | % | | | 2,125,000 | | | | 2,472,204 | | |
Series 2010D
11/15/18 | | | 5.000 | % | | | 1,890,000 | | | | 2,198,807 | | |
Series 2012E
11/15/16 | | | 4.000 | % | | | 1,000,000 | | | | 1,087,160 | | |
11/15/17 | | | 5.000 | % | | | 1,000,000 | | | | 1,144,770 | | |
Series 2014B
11/15/18 | | | 5.000 | % | | | 1,000,000 | | | | 1,163,390 | | |
Subordinated Series 2012B-2
11/01/16 | | | 5.000 | % | | | 8,085,000 | | | | 9,004,426 | | |
New York City Health & Hospital Corp.
Revenue Bonds
Health System
Series 2010A
02/15/15 | | | 5.000 | % | | | 4,500,000 | | | | 4,669,560 | | |
New York City Industrial Development Agency
Refunding Revenue Bonds
Series 2012A AMT(b)
07/01/18 | | | 5.000 | % | | | 4,655,000 | | | | 5,158,671 | | |
New York State Dormitory Authority
Refunding Revenue Bonds
Department of Health
Series 2004 (NPFGC)
07/01/14 | | | 5.000 | % | | | 3,660,000 | | | | 3,688,841 | | |
Revenue Bonds
General Purpose
Series 2014A
02/15/18 | | | 5.000 | % | | | 14,250,000 | | | | 16,375,530 | | |
Mount Sinai School of Medicine
Series 2010A
07/01/15 | | | 5.000 | % | | | 1,000,000 | | | | 1,053,730 | | |
07/01/16 | | | 5.000 | % | | | 2,645,000 | | | | 2,885,827 | | |
Series 2012B
03/15/16 | | | 5.000 | % | | | 4,750,000 | | | | 5,162,727 | | |
Municipal Bonds (continued)
Issue
Description | | Coupon
Rate | | Principal
Amount ($) | | Value ($) | |
New York State Housing Finance Agency
Revenue Bonds
Affordable Housing
Series 2012E
11/01/16 | | | 1.100 | % | | | 2,100,000 | | | | 2,117,115 | | |
New York State Thruway Authority
Prerefunded 10/01/15 Revenue Bonds
2nd Series 2005B (NPFGC)
04/01/17 | | | 5.000 | % | | | 910,000 | | | | 971,880 | | |
Revenue Bonds
General
Second Series 2005B
04/01/16 | | | 5.000 | % | | | 4,500,000 | | | | 4,805,955 | | |
General Revenue
Series 2012I
01/01/17 | | | 5.000 | % | | | 1,000,000 | | | | 1,114,930 | | |
Local Highway & Bridge
Series 2012A
04/01/15 | | | 4.000 | % | | | 10,000,000 | | | | 10,352,700 | | |
Series 2007H (NPFGC)
01/01/19 | | | 5.000 | % | | | 6,240,000 | | | | 7,081,402 | | |
Series 2013A
05/01/19 | | | 5.000 | % | | | 17,890,000 | | | | 20,713,400 | | |
Series 2014J
01/01/19 | | | 5.000 | % | | | 1,200,000 | | | | 1,396,944 | | |
State Personal Transportation
Series 2008A
03/15/17 | | | 5.000 | % | | | 1,000,000 | | | | 1,125,640 | | |
Unrefunded Revenue Bonds
2nd Series 2005B (NPFGC)
04/01/17 | | | 5.000 | % | | | 5,960,000 | | | | 6,356,221 | | |
New York State Urban Development Corp.
Revenue Bonds
State Personal Income Tax
Series 2013E
03/15/17 | | | 5.000 | % | | | 15,000,000 | | | | 16,884,600 | | |
Port Authority of New York & New Jersey
Revenue Bonds
Consolidated 172nd
Series 2012 AMT(b)
10/01/17 | | | 5.000 | % | | | 5,000,000 | | | | 5,664,250 | | |
Tobacco Settlement Financing Corp.
Asset-Backed Revenue Bonds
Series 2011B
06/01/14 | | | 5.000 | % | | | 7,950,000 | | | | 7,983,989 | | |
06/01/16 | | | 5.000 | % | | | 20,000,000 | | | | 21,904,800 | | |
Triborough Bridge & Tunnel Authority
Refunding Revenue Bonds
Series 2012B
11/15/17 | | | 5.000 | % | | | 3,325,000 | | | | 3,814,207 | | |
United Nations Development Corp.
Refunding Revenue Bonds
Series 2009A
07/01/14 | | | 5.000 | % | | | 2,000,000 | | | | 2,016,140 | | |
The accompanying Notes to Financial Statements are an integral part of this statement.
Annual Report 2014
16
Columbia Short Term Municipal Bond Fund
Portfolio of Investments (continued)
April 30, 2014
Municipal Bonds (continued)
Issue
Description | | Coupon
Rate | | Principal
Amount ($) | | Value ($) | |
Utica School District
Unlimited General Obligation Refunding Bonds
Series 2013
07/01/14 | | | 2.000 | % | | | 1,000,000 | | | | 1,002,590 | | |
07/01/15 | | | 2.000 | % | | | 1,000,000 | | | | 1,013,700 | | |
07/01/16 | | | 3.000 | % | | | 1,000,000 | | | | 1,036,020 | | |
Total | | | | | | | 313,040,074 | | |
North Carolina 1.3% | |
North Carolina Eastern Municipal Power Agency
Refunding Revenue Bonds
Series 2012D
01/01/16 | | | 5.000 | % | | | 5,875,000 | | | | 6,314,979 | | |
State of North Carolina
Refunding Revenue Bonds
Series 2011B
11/01/16 | | | 5.000 | % | | | 17,555,000 | | | | 19,537,310 | | |
Total | | | | | | | 25,852,289 | | |
North Dakota 1.1% | |
County of McLean
Revenue Bonds
Great River Energy
Series 2010C AMT(a)(b)
07/01/38 | | | 3.500 | % | | | 22,000,000 | | | | 22,577,720 | | |
Ohio 0.6% | |
City of Cleveland
Refunding Limited General Obligation Bonds
Series 2012A
12/01/14 | | | 2.000 | % | | | 865,000 | | | | 873,364 | | |
Ohio Air Quality Development Authority(a)
Refunding Revenue Bonds
Ohio Power Co.
Series 2010A
06/01/41 | | | 3.250 | % | | | 6,150,000 | | | | 6,162,546 | | |
Ohio Air Quality Development Authority(a)(b)
Refunding Revenue Bonds
Ohio Power Co. Galvin
Series 2010A AMT
12/01/27 | | | 2.875 | % | | | 3,130,000 | | | | 3,143,522 | | |
Ohio Housing Finance Agency
Revenue Bonds
Series 2010-1
11/01/28 | | | 5.000 | % | | | 2,465,000 | | | | 2,645,463 | | |
Total | | | | | | | 12,824,895 | | |
Oklahoma 0.2% | |
Cleveland County Educational Facilities Authority
Revenue Bonds
Moore Public Schools Project
Series 2013
06/01/15 | | | 5.000 | % | | | 1,500,000 | | | | 1,574,955 | | |
Municipal Bonds (continued)
Issue
Description | | Coupon
Rate | | Principal
Amount ($) | | Value ($) | |
Oklahoma County Finance Authority
Revenue Bonds
Midwest City - Delaware City Public Schools
Series 2012
03/01/15 | | | 2.000 | % | | | 1,500,000 | | | | 1,520,475 | | |
Tulsa County Industrial Authority
Revenue Bonds
Jenks Public Schools
Series 2009
09/01/14 | | | 5.500 | % | | | 1,280,000 | | | | 1,302,733 | | |
Total | | | | | | | 4,398,163 | | |
Oregon 0.2% | |
Oregon Health & Science University
Revenue Bonds
Series 2012A
07/01/14 | | | 4.000 | % | | | 1,000,000 | | | | 1,006,230 | | |
State of Oregon Department of Administrative Services
Certificate of Participation
Series 2009A
05/01/14 | | | 5.000 | % | | | 3,125,000 | | | | 3,125,439 | | |
Total | | | | | | | 4,131,669 | | |
Pennsylvania 1.2% | |
City of Philadelphia Water & Wastewater
Revenue Bonds
Series 2010C (AGM)
08/01/16 | | | 5.000 | % | | | 3,440,000 | | | | 3,789,848 | | |
Monroeville Finance Authority
Revenue Bonds
Series 2012
02/15/18 | | | 4.000 | % | | | 1,250,000 | | | | 1,369,963 | | |
Pennsylvania Higher Educational Facilities Authority
Revenue Bonds
University of Pittsburgh Medical Center
Series 2010E
05/15/15 | | | 5.000 | % | | | 4,250,000 | | | | 4,459,100 | | |
Pennsylvania Housing Finance Agency
Revenue Bonds
Series 2012-114A AMT(b)
04/01/15 | | | 1.050 | % | | | 320,000 | | | | 320,739 | | |
Pennsylvania Industrial Development Authority
Refunding Revenue Bonds
Economic Development
Series 2012
07/01/15 | | | 5.000 | % | | | 2,000,000 | | | | 2,108,920 | | |
Pennsylvania Turnpike Commission
Revenue Bonds
Series 2011B(a)
06/01/14 | | | 0.750 | % | | | 3,000,000 | | | | 3,000,551 | | |
The accompanying Notes to Financial Statements are an integral part of this statement.
Annual Report 2014
17
Columbia Short Term Municipal Bond Fund
Portfolio of Investments (continued)
April 30, 2014
Municipal Bonds (continued)
Issue
Description | | Coupon
Rate | | Principal
Amount ($) | | Value ($) | |
Philadelphia Municipal Authority
Refunding Revenue Bonds
City Agreement
Series 2013A
11/15/15 | | | 5.000 | % | | | 2,000,000 | | | | 2,134,680 | | |
11/15/16 | | | 5.000 | % | | | 1,750,000 | | | | 1,926,872 | | |
Southeastern Pennsylvania Transportation Authority
Revenue Bonds
Capital Grant Receipts
Series 2011
06/01/14 | | | 3.000 | % | | | 1,000,000 | | | | 1,002,439 | | |
06/01/14 | | | 5.000 | % | | | 430,000 | | | | 431,800 | | |
State Public School Building Authority
Revenue Bonds
School District of Philadelphia
Series 2012
04/01/15 | | | 5.000 | % | | | 1,500,000 | | | | 1,564,320 | | |
04/01/16 | | | 5.000 | % | | | 2,000,000 | | | | 2,166,280 | | |
Total | | | | | | | 24,275,512 | | |
Rhode Island 0.9% | |
Rhode Island Economic Development Corp.
Revenue Bonds
Department of Transportation
Series 2006A (NPFGC)
06/15/17 | | | 5.000 | % | | | 16,410,000 | | | | 17,793,363 | | |
South Carolina 2.0% | |
Berkeley County School District
Revenue Bonds
Series 2013
12/01/16 | | | 4.000 | % | | | 400,000 | | | | 433,552 | | |
12/01/17 | | | 5.000 | % | | | 500,000 | | | | 567,965 | | |
Piedmont Municipal Power Agency
Refunding Revenue Bonds
Series 2009A-3
01/01/18 | | | 5.000 | % | | | 5,080,000 | | | | 5,745,429 | | |
Series 2009A-4
01/01/19 | | | 5.000 | % | | | 6,645,000 | | | | 7,621,948 | | |
South Carolina Jobs-Economic Development Authority
Refunding Revenue Bonds
Palmetto Health
Series 2013A
08/01/14 | | | 2.500 | % | | | 1,000,000 | | | | 1,003,890 | | |
08/01/15 | | | 3.000 | % | | | 1,000,000 | | | | 1,020,620 | | |
South Carolina State Public Service Authority
Refunding Revenue Bonds
Santee Cooper
Series 2012C
12/01/16 | | | 5.000 | % | | | 5,065,000 | | | | 5,645,956 | | |
Revenue Bonds
Santee Cooper
Series 2006A (NPFGC)
01/01/16 | | | 5.000 | % | | | 4,295,000 | | | | 4,621,892 | | |
Municipal Bonds (continued)
Issue
Description | | Coupon
Rate | | Principal
Amount ($) | | Value ($) | |
Series 2009E
01/01/15 | | | 5.000 | % | | | 8,225,000 | | | | 8,491,243 | | |
South Carolina Transportation Infrastructure Bank
Refunding Revenue Bonds
Series 2012A
10/01/15 | | | 4.000 | % | | | 6,000,000 | | | | 6,318,600 | | |
Total | | | | | | | 41,471,095 | | |
South Dakota 0.1% | |
South Dakota Health & Educational Facilities Authority
Revenue Bonds
Regional Health
Series 2011
09/01/14 | | | 5.000 | % | | | 1,470,000 | | | | 1,493,770 | | |
Tennessee 0.5% | |
Knox County Health Educational & Housing Facilities Board
Refunding Revenue Bonds
Fort Sanders Alliance
Series 1993 (NPFGC)
01/01/15 | | | 5.250 | % | | | 4,550,000 | | | | 4,698,284 | | |
Memphis-Shelby County Airport Authority(b)
Refunding Revenue Bonds
Series 2010B AMT
07/01/15 | | | 4.000 | % | | | 2,060,000 | | | | 2,136,797 | | |
07/01/16 | | | 5.000 | % | | | 1,000,000 | | | | 1,081,790 | | |
Metropolitan Government of Nashville & Davidson County
Water & Sewer
Refunding Revenue Bonds
Subordinated Lien
Series 2012
07/01/16 | | | 5.000 | % | | | 1,250,000 | | | | 1,371,213 | | |
Total | | | | | | | 9,288,084 | | |
Texas 3.6% | |
Central Texas Regional Mobility Authority
Refunding Revenue Bonds
Senior Lien
Series 2013A
01/01/15 | | | 4.000 | % | | | 750,000 | | | | 764,918 | | |
01/01/17 | | | 5.000 | % | | | 925,000 | | | | 1,011,682 | | |
City Public Service Board of San Antonio
Refunding Revenue Bonds
Systems
Series 2011
02/01/16 | | | 5.000 | % | | | 4,000,000 | | | | 4,326,160 | | |
City of Houston Utility System(a)
Refunding Revenue Bonds
Combined 1st Lien-SIFMA
Series 2012
05/15/34 | | | 0.700 | % | | | 6,000,000 | | | | 6,021,840 | | |
SIFMA Index
Series 2012
05/15/34 | | | 0.650 | % | | | 3,500,000 | | | | 3,505,425 | | |
The accompanying Notes to Financial Statements are an integral part of this statement.
Annual Report 2014
18
Columbia Short Term Municipal Bond Fund
Portfolio of Investments (continued)
April 30, 2014
Municipal Bonds (continued)
Issue
Description | | Coupon
Rate | | Principal
Amount ($) | | Value ($) | |
City of Houston
Limited General Obligation Refunding Bonds
Series 2011A
03/01/16 | | | 5.000 | % | | | 11,470,000 | | | | 12,445,294 | | |
City of Lubbock
Limited General Obligation Bonds
Waterworks
Series 2011
02/15/15 | | | 5.000 | % | | | 1,250,000 | | | | 1,297,787 | | |
Clear Creek Independent School District
Unlimited General Obligation Refunding Bonds
Series 2012A (Permanent School Fund Guarantee)
02/15/16 | | | 5.000 | % | | | 5,130,000 | | | | 5,558,098 | | |
Dallas/Fort Worth International Airport
Refunding Revenue Bonds
Series 2013D
11/01/16 | | | 5.000 | % | | | 1,000,000 | | | | 1,108,860 | | |
Houston Independent School District
Limited General Obligation Refunding Bonds
Limited Tax
Series 2012 (Permanent School Fund Guarantee)(a)
06/01/30 | | | 2.500 | % | | | 7,500,000 | | | | 7,682,100 | | |
Lower Colorado River Authority
Refunding Revenue Bonds
Series 2010
05/15/14 | | | 5.000 | % | | | 2,190,000 | | | | 2,194,416 | | |
Series 2010 Escrowed to Maturity
05/15/14 | | | 5.000 | % | | | 5,000 | | | | 5,010 | | |
05/15/14 | | | 5.000 | % | | | 5,000 | | | | 5,010 | | |
05/15/15 | | | 5.000 | % | | | 5,000 | | | | 5,249 | | |
05/15/15 | | | 5.000 | % | | | 10,000 | | | | 10,499 | | |
Revenue Bonds
Series 2010 Escrowed to Maturity
05/15/14 | | | 5.000 | % | | | 30,000 | | | | 30,061 | | |
Unrefunded Revenue Bonds
Series 2010
05/15/16 | | | 5.000 | % | | | 6,320,000 | | | | 6,894,994 | | |
Series 2010
05/15/15 | | | 5.000 | % | | | 7,125,000 | | | | 7,476,904 | | |
Sam Rayburn Municipal Power Agency
Refunding Revenue Bonds
Series 2012
10/01/15 | | | 5.000 | % | | | 2,110,000 | | | | 2,235,735 | | |
10/01/16 | | | 5.000 | % | | | 1,925,000 | | | | 2,106,393 | | |
10/01/17 | | | 5.000 | % | | | 2,865,000 | | | | 3,206,594 | | |
State of Texas
Unlimited General Obligation Refunding Bonds
College Student Loan
Series 2010 AMT(b)
08/01/15 | | | 5.000 | % | | | 5,775,000 | | | | 6,123,752 | | |
Total | | | | | | | 74,016,781 | | |
Municipal Bonds (continued)
Issue
Description | | Coupon
Rate | | Principal
Amount ($) | | Value ($) | |
Utah 0.5% | |
Utah Associated Municipal Power Systems
Refunding Revenue Bonds
Payson Power Project
Series 2012
04/01/16 | | | 4.000 | % | | | 4,690,000 | | | | 4,982,234 | | |
Utah State Building Ownership Authority
Refunding Revenue Bonds
State Facilities Master Lease Program
Series 1998C Escrowed to Maturity (AGM)
05/15/14 | | | 5.500 | % | | | 4,750,000 | | | | 4,760,547 | | |
Total | | | | | | | 9,742,781 | | |
Virginia 0.3% | |
Peninsula Ports Authority
Refunding Revenue Bonds
Dominion Term Association Project
Series 2003(a)
10/01/33 | | | 2.375 | % | | | 3,335,000 | | | | 3,404,435 | | |
York County Economic Development Authority
Refunding Revenue Bonds
Virginia Electric & Power
Series 2009A(a)
05/01/33 | | | 4.050 | % | | | 3,500,000 | | | | 3,508,750 | | |
Total | | | | | | | 6,913,185 | | |
Washington 4.4% | |
City of Seattle Municipal Light & Power
Prerefunded 08/01/14 Revenue Bonds
Series 2004 (AGM)
08/01/15 | | | 5.000 | % | | | 835,000 | | | | 845,229 | | |
Unrefunded Revenue Bonds
Series 2004 (AGM)
08/01/15 | | | 5.000 | % | | | 5,165,000 | | | | 5,228,323 | | |
Clark County Public Utility District No. 1
Refunding Revenue Bonds
Series 2010
01/01/15 | | | 5.000 | % | | | 2,900,000 | | | | 2,991,872 | | |
Energy Northwest
Refunding Revenue Bonds
Project 1
Series 2012B
07/01/17 | | | 5.000 | % | | | 30,220,000 | | | | 34,285,799 | | |
Wind Project
Series 2014
07/01/16 | | | 5.000 | % | | | 1,000,000 | | | | 1,084,270 | | |
07/01/17 | | | 5.000 | % | | | 1,000,000 | | | | 1,110,220 | | |
07/01/18 | | | 5.000 | % | | | 1,425,000 | | | | 1,607,343 | | |
Port of Seattle
Refunding Revenue Bonds
Series 2010B AMT(b)
12/01/15 | | | 5.000 | % | | | 5,500,000 | | | | 5,897,430 | | |
The accompanying Notes to Financial Statements are an integral part of this statement.
Annual Report 2014
19
Columbia Short Term Municipal Bond Fund
Portfolio of Investments (continued)
April 30, 2014
Municipal Bonds (continued)
Issue
Description | | Coupon
Rate | | Principal
Amount ($) | | Value ($) | |
Snohomish County School District No. 15 Edmonds
Unlimited General Obligation Refunding Bonds
Series 2012
12/01/17 | | | 4.000 | % | | | 2,000,000 | | | | 2,225,020 | | |
State of Washington
Certificate of Participation
State and Local Agencies
Series 2012
07/01/16 | | | 4.000 | % | | | 3,500,000 | | | | 3,772,685 | | |
Refunding Unlimited General Obligation Bonds
Series 2010A
01/01/19 | | | 5.000 | % | | | 5,780,000 | | | | 6,731,503 | | |
Various Purpose
Series 2009R
01/01/18 | | | 5.000 | % | | | 4,940,000 | | | | 5,648,198 | | |
Revenue Bonds
Federal Highway Grant
Series 2013
09/01/16 | | | 5.000 | % | | | 2,000,000 | | | | 2,206,740 | | |
Unlimited General Obligation Bonds
Motor Vehicle Fuel Tax
Series 2014E
02/01/18 | | | 5.000 | % | | | 4,410,000 | | | | 5,053,287 | | |
Series 2013E
02/01/19 | | | 5.000 | % | | | 6,080,000 | | | | 7,092,928 | | |
Various Purpose
Series 2013D
02/01/18 | | | 5.000 | % | | | 2,810,000 | | | | 3,219,895 | | |
Washington State Housing Finance Commission
Revenue Bonds
Series 2010A (GNMA/FNMA/FHLMC)
10/01/28 | | | 4.700 | % | | | 860,000 | | | | 890,306 | | |
Total | | | | | | | 89,891,048 | | |
West Virginia 0.8% | |
County of Mason
Revenue Bonds
Appalachian Power Co.
Series 2003L(a)
10/01/22 | | | 2.000 | % | | | 8,750,000 | | | | 8,790,688 | | |
West Virginia Economic Development Authority
Revenue Bonds
Appalachian Power Co.-Amos Project
Series 2011A AMT(a)(b)
01/01/41 | | | 2.250 | % | | | 3,750,000 | | | | 3,805,125 | | |
West Virginia University
Revenue Bonds
West Virginia University Projects
Series 2011C(a)
10/01/41 | | | 0.750 | % | | | 4,000,000 | | | | 4,001,120 | | |
Total | | | | | | | 16,596,933 | | |
Municipal Bonds (continued)
Issue
Description | | Coupon
Rate | | Principal
Amount ($) | | Value ($) | |
Wisconsin —% | |
University of Wisconsin Hospitals & Clinics Authority
Revenue Bonds
Series 2013A
04/01/15 | | | 4.000 | % | | | 160,000 | | | | 165,507 | | |
04/01/16 | | | 4.000 | % | | | 185,000 | | | | 197,040 | | |
Total | | | | | | | 362,547 | | |
Wyoming 0.3% | |
County of Sweetwater
Revenue Bonds
Series 2013
06/15/15 | | | 4.000 | % | | | 1,485,000 | | | | 1,538,326 | | |
12/15/15 | | | 5.000 | % | | | 2,000,000 | | | | 2,131,980 | | |
12/15/16 | | | 5.000 | % | | | 2,500,000 | | | | 2,745,575 | | |
Total | | | | | | | 6,415,881 | | |
Total Municipal Bonds
(Cost: $1,824,393,310) | | | | | | | 1,842,570,461 | | |
Floating Rate Notes 0.1%
Issue
Description | | Effective
Yield | | Principal
Amount ($) | | Value ($) | |
Minnesota 0.1% | |
Minneapolis & St. Paul Housing & Redevelopment Authority
Revenue Bonds
Children's Hospital Clinics
VRDN Series 2007A (AGM)(f)
08/15/37 | | | 0.130 | % | | | 2,750,000 | | | | 2,750,000 | | |
Total Floating Rate Notes
(Cost: $2,750,000) | | | | | | | 2,750,000 | | |
Municipal Short Term 8.3%
California 0.7% | |
California Municipal Finance Authority
Refunding Revenue Bonds
Republic Services
Series 2010(f)
09/01/21 | | | 0.350 | % | | | 4,000,000 | | | | 4,000,000 | | |
Charter Oak Unified School District
Unlimited General Obligation Bonds
BAN Series 2012
10/01/15 | | | 0.790 | % | | | 4,600,000 | | | | 4,872,780 | | |
Monterey Peninsula Unified School District
Unlimited General Obligation Bonds
BAN Series 2012
11/01/15 | | | 0.300 | % | | | 1,700,000 | | | | 1,756,032 | | |
The accompanying Notes to Financial Statements are an integral part of this statement.
Annual Report 2014
20
Columbia Short Term Municipal Bond Fund
Portfolio of Investments (continued)
April 30, 2014
Municipal Short Term (continued)
Issue
Description | | Effective
Yield | | Principal
Amount ($) | | Value ($) | |
Sulphur Springs Union School District
Unlimited General Obligation Notes
BAN Series 2013
01/01/15 | | | 0.380 | % | | | 2,750,000 | | | | 2,798,125 | | |
Total | | | | | | | 13,426,937 | | |
Indiana 0.7% | |
Indiana Finance Authority
Revenue Bonds
Republic Services, Inc. Project
Series 2010B(f)
05/01/28 | | | 0.320 | % | | | 5,000,000 | | | | 5,000,100 | | |
Posey County Industry Economic Development
Refunding Revenue Bonds
Midwest Fertilizer Corp.
Series 2013A(f)
07/01/46 | | | 0.300 | % | | | 8,700,000 | | | | 8,699,391 | | |
Total | | | | | | | 13,699,491 | | |
Louisiana 0.8% | |
Louisiana Public Facilities Authority
Revenue Bonds
Louisiana Pellets, Inc. Project
Series 2013A AMT(b)
08/01/14 | | | 7.820 | % | | | 15,850,000 | | | | 15,907,095 | | |
Michigan 0.1% | |
Michigan Finance Authority
Revenue Notes
State Aid Notes
Series 2013C
08/20/14 | | | 1.210 | % | | | 2,800,000 | | | | 2,826,712 | | |
New Jersey 1.2% | |
City of Newark
Unlimited General Obligation Notes
General Improvement
BAN Series 2013B
06/26/14 | | | 0.770 | % | | | 5,000,000 | | | | 5,005,607 | | |
Hudson County Improvement Authority
Revenue Bonds
County Guaranteed Pooled Notes
Series 2013Q-1
07/25/14 | | | 0.500 | % | | | 20,000,000 | | | | 20,070,200 | | |
Total | | | | | | | 25,075,807 | | |
New York 4.3% | |
Board of Cooperative Educational Services for the Sole
Supervisory District
Revenue Notes
RAN Series 2013
07/25/14 | | | 0.640 | % | | | 4,125,000 | | | | 4,128,465 | | |
Municipal Short Term (continued)
Issue
Description | | Effective
Yield | | Principal
Amount ($) | | Value ($) | |
City of Long Beach
Limited General Obligation Notes
BAN Series 2014
02/18/15 | | | 1.390 | % | | | 1,000,000 | | | | 1,006,730 | | |
County of Rockland
General Obligation Limited Notes
RAN Series 2013B
06/27/14 | | | 0.720 | % | | | 3,000,000 | | | | 3,004,849 | | |
Limited General Obligation Notes
BAN Series 2013B
06/05/14 | | | 0.710 | % | | | 2,350,000 | | | | 2,352,926 | | |
TAN Series 2014
03/17/15 | | | 0.950 | % | | | 8,000,000 | | | | 8,073,120 | | |
County of Suffolk
General Obligation Limited Notes
TAN Series 2013I
08/14/14 | | | 0.290 | % | | | 9,500,000 | | | | 9,533,060 | | |
Limited General Obligation Notes
RAN Series 2014
03/26/15 | | | 0.590 | % | | | 5,425,000 | | | | 5,469,268 | | |
Franklin County Solid Waste Management Authority
Revenue Notes
BAN Series 2014 AMT(b)
03/31/15 | | | 0.980 | % | | | 3,865,000 | | | | 3,865,773 | | |
Suffolk County Water Authority
Revenue Bonds
BAN Series 2013B
01/15/15 | | | 0.080 | % | | | 5,000,000 | | | | 5,103,200 | | |
Town of Oyster Bay
General Obligation Limited Notes
BAN Series 2013B
08/08/14 | | | 0.700 | % | | | 15,000,000 | | | | 15,174,000 | | |
Town of Ramapo
Refunding General Obligation Limited Notes
BAN Series 2013
05/28/14 | | | 3.000 | % | | | 5,200,000 | | | | 5,206,349 | | |
Utica School District
General Obligation Unlimited Notes
BAN Series 2013
07/31/14 | | | 0.960 | % | | | 15,000,000 | | | | 15,019,800 | | |
Village of East Rochester
General Obligation Limited Notes
BAN Series 2013
10/10/14 | | | 0.670 | % | | | 5,200,000 | | | | 5,213,260 | | |
Village of Johnson City
General Obligation Limited Notes
BAN Series 2013C
10/10/14 | | | 0.720 | % | | | 4,520,075 | | | | 4,530,607 | | |
Total | | | | | | | 87,681,407 | | |
The accompanying Notes to Financial Statements are an integral part of this statement.
Annual Report 2014
21
Columbia Short Term Municipal Bond Fund
Portfolio of Investments (continued)
April 30, 2014
Municipal Short Term (continued)
Issue
Description | | Effective
Yield | | Principal
Amount ($) | | Value ($) | |
Ohio 0.3% | |
State of Ohio
Refunding Revenue Bonds
Republic Services, Inc. Project
Series 2010(f)
11/01/35 | | | 0.320 | % | | | 5,000,000 | | | | 5,000,200 | | |
Pennsylvania 0.2% | |
Clarion County Industrial Development Authority
Revenue Bonds
Student Housing
BAN Series 2014(e)
05/01/16 | | | 1.050 | % | | | 5,000,000 | | | | 5,000,000 | | |
Total Municipal Short Term
(Cost: $168,440,379) | | | | | | | 168,617,649 | | |
Money Market Funds 0.2%
| | | Shares | | Value ($) | |
JPMorgan Tax-Free Money Market Fund,
0.010%(g) | | | 3,201,029 | | | | 3,201,029 | | |
Total Money Market Funds
(Cost: $3,201,029) | | | | | 3,201,029 | | |
Total Investments
(Cost: $1,998,784,718) | | | | | 2,017,139,139 | | |
Other Assets & Liabilities, Net | | | | | 19,423,584 | | |
Net Assets | | | | | 2,036,562,723 | | |
Notes to Portfolio of Investments
(a) Variable rate security.
(b) Income from this security may be subject to alternative minimum tax.
(c) Zero coupon bond.
(d) Municipal obligations include debt obligations issued by or on behalf of territories, possessions, or sovereign nations within the territorial boundaries of the United States. At April 30, 2014, the value of these securities amounted to $2,048,210 or 0.10% of net assets.
(e) Represents a security purchased on a when-issued or delayed delivery basis.
(f) Interest rate varies to reflect current market conditions; rate shown is the effective rate on April 30, 2014.
(g) The rate shown is the seven-day current annualized yield at April 30, 2014.
Abbreviation Legend
AGM Assured Guaranty Municipal Corporation
AMBAC Ambac Assurance Corporation
AMT Alternative Minimum Tax
BAN Bond Anticipation Note
FGIC Financial Guaranty Insurance Company
FHLMC Federal Home Loan Mortgage Corporation
FNMA Federal National Mortgage Association
GNMA Government National Mortgage Association
NPFGC National Public Finance Guarantee Corporation
RAN Revenue Anticipation Note
TAN Tax Anticipation Note
VRDN Variable Rate Demand Note
XLCA XL Capital Assurance
The accompanying Notes to Financial Statements are an integral part of this statement.
Annual Report 2014
22
Columbia Short Term Municipal Bond Fund
Portfolio of Investments (continued)
April 30, 2014
Generally accepted accounting principles (GAAP) require disclosure regarding the inputs and valuation techniques used to measure fair value and any changes in valuation inputs or techniques. In addition, investments shall be disclosed by major category.
The Fund categorizes its fair value measurements according to a three-level hierarchy that maximizes the use of observable inputs and minimizes the use of unobservable inputs by prioritizing that the most observable input be used when available. Observable inputs are those that market participants would use in pricing an investment based on market data obtained from sources independent of the reporting entity. Unobservable inputs are those that reflect the Fund's assumptions about the information market participants would use in pricing an investment. An investment's level within the fair value hierarchy is based on the lowest level of any input that is deemed significant to the asset or liability's fair value measurement. The input levels are not necessarily an indication of the risk or liquidity associated with investments at that level. For example, certain U.S. government securities are generally high quality and liquid, however, they are reflected as Level 2 because the inputs used to determine fair value may not always be quoted prices in an active market.
Fair value inputs are summarized in the three broad levels listed below:
> Level 1 — Valuations based on quoted prices for investments in active markets that the Fund has the ability to access at the measurement date (including NAV for open-end mutual funds). Valuation adjustments are not applied to Level 1 investments.
> Level 2 — Valuations based on other significant observable inputs (including quoted prices for similar securities, interest rates, prepayment speeds, credit risks, etc.).
> Level 3 — Valuations based on significant unobservable inputs (including the Fund's own assumptions and judgment in determining the fair value of investments).
Inputs that are used in determining fair value of an investment may include price information, credit data, volatility statistics, and other factors. These inputs can be either observable or unobservable. The availability of observable inputs can vary between investments, and is affected by various factors such as the type of investment, and the volume and level of activity for that investment or similar investments in the marketplace. The inputs will be considered by the Investment Manager, along with any other relevant factors in the calculation of an investment's fair value. The Fund uses prices and inputs that are current as of the measurement date, which may include periods of market dislocations. During these periods, the availability of prices and inputs may be reduced for many investments. This condition could cause an investment to be reclassified between the various levels within the hierarchy.
Investments falling into the Level 3 category are primarily supported by quoted prices from brokers and dealers participating in the market for those investments. However, these may be classified as Level 3 investments due to lack of market transparency and corroboration to support these quoted prices. Additionally, valuation models may be used as the pricing source for any remaining investments classified as Level 3. These models may rely on one or more significant unobservable inputs and/or significant assumptions by the Investment Manager. Inputs used in valuations may include, but are not limited to, financial statement analysis, capital account balances, discount rates and estimated cash flows, and comparable company data.
Under the direction of the Fund's Board of Trustees (the Board), the Investment Manager's Valuation Committee (the Committee) is responsible for overseeing the valuation procedures approved by the Board. The Committee consists of voting and non-voting members from various groups within the Investment Manager's organization, including operations and accounting, trading and investments, compliance, risk management and legal.
The Committee meets at least monthly to review and approve valuation matters, which may include a description of specific valuation determinations, data regarding pricing information received from approved pricing vendors and brokers and the results of Board-approved valuation control policies and procedures (the Policies). The Policies address, among other things, instances when market quotations are or are not readily available, including recommendations of third party pricing vendors and a determination of appropriate pricing methodologies; events that require specific valuation determinations and assessment of fair value techniques; securities with a potential for stale pricing, including those that are illiquid, restricted, or in default; and the effectiveness of third party pricing vendors, including periodic reviews of vendors. The Committee meets more frequently, as needed, to discuss additional valuation matters, which may include the need to review back-testing results, review time-sensitive information or approve related valuation actions. The Committee reports to the Board, with members of the Committee meeting with the Board at each of its regularly scheduled meetings to discuss valuation matters and actions during the period, similar to those described earlier.
For investments categorized as Level 3, the Committee monitors information similar to that described above, which may include: (i) data specific to the issuer or comparable issuers, (ii) general market or specific sector news and (iii) quoted prices and specific or similar security transactions. The Committee considers this data and any changes from prior periods in order to assess the reasonableness of observable and unobservable inputs, any assumptions or internal models used to value those securities and changes in fair value. This data is also used to corroborate, when available, information received from approved pricing vendors and brokers. Various factors impact the frequency of monitoring this information (which may occur as often as daily). However, the Committee may determine that changes to inputs, assumptions and models are not required as a result of the monitoring procedures performed.
The accompanying Notes to Financial Statements are an integral part of this statement.
Annual Report 2014
23
Columbia Short Term Municipal Bond Fund
Portfolio of Investments (continued)
April 30, 2014
Fair Value Measurements (continued)
The following table is a summary of the inputs used to value the Fund's investments at April 30, 2014:
Description | | Level 1
Quoted Prices in Active
Markets for Identical
Assets ($) | | Level 2
Other Significant
Observable Inputs ($) | | Level 3
Significant
Unobservable Inputs ($) | | Total ($) | |
Bonds | |
Municipal Bonds | | | — | | | | 1,842,570,461 | | | | — | | | | 1,842,570,461 | | |
Total Bonds | | | — | | | | 1,842,570,461 | | | | — | | | | 1,842,570,461 | | |
Short-Term Securities | |
Floating Rate Notes | | | — | | | | 2,750,000 | | | | — | | | | 2,750,000 | | |
Municipal Short Term | | | — | | | | 168,617,649 | | | | — | | | | 168,617,649 | | |
Total Short-Term Securities | | | — | | | | 171,367,649 | | | | — | | | | 171,367,649 | | |
Mutual Funds | |
Money Market Funds | | | 3,201,029 | | | | — | | | | — | | | | 3,201,029 | | |
Total Mutual Funds | | | 3,201,029 | | | | — | | | | — | | | | 3,201,029 | | |
Total | | | 3,201,029 | | | | 2,013,938,110 | | | | — | | | | 2,017,139,139 | | |
See the Portfolio of Investments for all investment classifications not indicated in the table.
The Fund's assets assigned to the Level 2 input category are generally valued using the market approach, in which a security's value is determined through reference to prices and information from market transactions for similar or identical assets.
There were no transfers of financial assets between levels during the period.
The accompanying Notes to Financial Statements are an integral part of this statement.
Annual Report 2014
24
Columbia Short Term Municipal Bond Fund
Statement of Assets and Liabilities
April 30, 2014
Assets | |
Investments, at value | |
(identified cost $1,998,784,718) | | $ | 2,017,139,139 | | |
Receivable for: | |
Investments sold | | | 297,250 | | |
Capital shares sold | | | 3,683,166 | | |
Interest | | | 25,958,681 | | |
Expense reimbursement due from Investment Manager | | | 9,785 | | |
Prepaid expenses | | | 1,721 | | |
Total assets | | | 2,047,089,742 | | |
Liabilities | |
Payable for: | |
Investments purchased on a delayed delivery basis | | | 6,576,932 | | |
Capital shares purchased | | | 1,502,560 | | |
Dividend distributions to shareholders | | | 1,902,606 | | |
Investment management fees | | | 19,960 | | |
Distribution and/or service fees | | | 1,806 | | |
Transfer agent fees | | | 346,302 | | |
Administration fees | | | 3,557 | | |
Compensation of board members | | | 129,723 | | |
Other expenses | | | 43,573 | | |
Total liabilities | | | 10,527,019 | | |
Net assets applicable to outstanding capital stock | | $ | 2,036,562,723 | | |
Represented by | |
Paid-in capital | | $ | 2,018,571,909 | | |
Undistributed net investment income | | | 2,260,574 | | |
Accumulated net realized loss | | | (2,624,181 | ) | |
Unrealized appreciation (depreciation) on: | |
Investments | | | 18,354,421 | | |
Total — representing net assets applicable to outstanding capital stock | | $ | 2,036,562,723 | | |
The accompanying Notes to Financial Statements are an integral part of this statement.
Annual Report 2014
25
Columbia Short Term Municipal Bond Fund
Statement of Assets and Liabilities (continued)
April 30, 2014
Class A | |
Net assets | | $ | 165,776,761 | | |
Shares outstanding | | | 15,825,694 | | |
Net asset value per share | | $ | 10.48 | | |
Maximum offering price per share(a) | | $ | 10.59 | | |
Class B | |
Net assets | | $ | 128,066 | | |
Shares outstanding | | | 12,227 | | |
Net asset value per share | | $ | 10.47 | | |
Class C | |
Net assets | | $ | 24,423,771 | | |
Shares outstanding | | | 2,331,207 | | |
Net asset value per share | | $ | 10.48 | | |
Class R4 | |
Net assets | | $ | 84,522 | | |
Shares outstanding | | | 8,071 | | |
Net asset value per share | | $ | 10.47 | | |
Class R5 | |
Net assets | | $ | 23,173,380 | | |
Shares outstanding | | | 2,212,513 | | |
Net asset value per share | | $ | 10.47 | | |
Class Z | |
Net assets | | $ | 1,822,976,223 | | |
Shares outstanding | | | 174,011,729 | | |
Net asset value per share | | $ | 10.48 | | |
(a) The maximum offering price per share is calculated by dividing the net asset value per share by 1.0 minus the maximum sales charge of 1.00%.
The accompanying Notes to Financial Statements are an integral part of this statement.
Annual Report 2014
26
Columbia Short Term Municipal Bond Fund
Statement of Operations
Year Ended April 30, 2014
Net investment income | |
Income: | |
Dividends | | $ | 3,267 | | |
Interest | | | 33,163,406 | | |
Total income | | | 33,166,673 | | |
Expenses: | |
Investment management fees | | | 7,085,231 | | |
Distribution and/or service fees | |
Class A | | | 438,472 | | |
Class B | | | 1,378 | | |
Class C | | | 261,673 | | |
Transfer agent fees | |
Class A | | | 344,051 | | |
Class B | | | 270 | | |
Class C | | | 51,329 | | |
Class R4 | | | 1,330 | | |
Class R5 | | | 5,416 | | |
Class Z | | | 3,460,524 | | |
Administration fees | | | 1,264,155 | | |
Compensation of board members | | | 55,917 | | |
Custodian fees | | | 12,923 | | |
Printing and postage fees | | | 40,965 | | |
Registration fees | | | 193,258 | | |
Professional fees | | | 47,610 | | |
Other | | | 88,293 | | |
Total expenses | | | 13,352,795 | | |
Fees waived or expenses reimbursed by Investment Manager and its affiliates | | | (3,155,193 | ) | |
Expense reductions | | | (20 | ) | |
Total net expenses | | | 10,197,582 | | |
Net investment income | | | 22,969,091 | | |
Realized and unrealized gain (loss) — net | |
Net realized gain (loss) on: | |
Investments | | | 1,106,359 | | |
Net realized gain | | | 1,106,359 | | |
Net change in unrealized appreciation (depreciation) on: | |
Investments | | | (13,485,395 | ) | |
Net change in unrealized appreciation (depreciation) | | | (13,485,395 | ) | |
Net realized and unrealized loss | | | (12,379,036 | ) | |
Net increase in net assets resulting from operations | | $ | 10,590,055 | | |
The accompanying Notes to Financial Statements are an integral part of this statement.
Annual Report 2014
27
Columbia Short Term Municipal Bond Fund
Statement of Changes in Net Assets
| | | Year ended
April 30,
2014 | | Year ended
April 30,
2013(a)(b) | |
Operations | |
Net investment income | | $ | 22,969,091 | | | $ | 27,255,536 | | |
Net realized gain | | | 1,106,359 | | | | 146,954 | | |
Net change in unrealized appreciation (depreciation) | | | (13,485,395 | ) | | | (2,229,981 | ) | |
Net increase in net assets resulting from operations | | | 10,590,055 | | | | 25,172,509 | | |
Distributions to shareholders | |
Net investment income | |
Class A | | | (1,655,269 | ) | | | (2,100,109 | ) | |
Class B | | | (267 | ) | | | (515 | ) | |
Class C | | | (50,886 | ) | | | (94,141 | ) | |
Class R4 | | | (8,004 | ) | | | (1,404 | ) | |
Class R5 | | | (199,259 | ) | | | (413 | ) | |
Class Z | | | (21,055,406 | ) | | | (25,058,954 | ) | |
Total distributions to shareholders | | | (22,969,091 | ) | | | (27,255,536 | ) | |
Increase (decrease) in net assets from capital stock activity | | | 4,176,179 | | | | (182,740,710 | ) | |
Total decrease in net assets | | | (8,202,857 | ) | | | (184,823,737 | ) | |
Net assets at beginning of year | | | 2,044,765,580 | | | | 2,229,589,317 | | |
Net assets at end of year | | $ | 2,036,562,723 | | | $ | 2,044,765,580 | | |
Undistributed net investment income | | $ | 2,260,574 | | | $ | 2,260,574 | | |
(a) Class R4 shares are for the period from March 19, 2013 (commencement of operations) to April 30, 2013.
(b) Class R5 shares are for the period from November 8, 2012 (commencement of operations) to April 30, 2013.
The accompanying Notes to Financial Statements are an integral part of this statement.
Annual Report 2014
28
Columbia Short Term Municipal Bond Fund
Statement of Changes in Net Assets (continued)
| | | Year ended April 30, 2014 | | Year ended April 30, 2013(a)(b) | |
| | | Shares | | Dollars ($) | | Shares | | Dollars ($) | |
Capital stock activity | |
Class A shares | |
Subscriptions(c) | | | 5,785,792 | | | | 60,627,189 | | | | 7,185,088 | | | | 75,770,635 | | |
Distributions reinvested | | | 102,700 | | | | 1,076,572 | | | | 121,189 | | | | 1,278,372 | | |
Redemptions | | | (7,635,941 | ) | | | (80,074,932 | ) | | | (9,596,930 | ) | | | (101,206,875 | ) | |
Net decrease | | | (1,747,449 | ) | | | (18,371,171 | ) | | | (2,290,653 | ) | | | (24,157,868 | ) | |
Class B shares | |
Subscriptions | | | 21 | | | | 227 | | | | 34 | | | | 357 | | |
Distributions reinvested | | | 3 | | | | 27 | | | | 12 | | | | 128 | | |
Redemptions(c) | | | (3,844 | ) | | | (40,316 | ) | | | (7,049 | ) | | | (74,443 | ) | |
Net decrease | | | (3,820 | ) | | | (40,062 | ) | | | (7,003 | ) | | | (73,958 | ) | |
Class C shares | |
Subscriptions | | | 647,212 | | | | 6,789,165 | | | | 618,807 | | | | 6,528,590 | | |
Distributions reinvested | | | 2,574 | | | | 26,988 | | | | 4,619 | | | | 48,730 | | |
Redemptions | | | (949,374 | ) | | | (9,954,093 | ) | | | (1,115,754 | ) | | | (11,767,697 | ) | |
Net decrease | | | (299,588 | ) | | | (3,137,940 | ) | | | (492,328 | ) | | | (5,190,377 | ) | |
Class R4 shares | |
Subscriptions | | | 12,627 | | | | 132,429 | | | | 203,406 | | | | 2,143,894 | | |
Distributions reinvested | | | 761 | | | | 7,974 | | | | 133 | | | | 1,403 | | |
Redemptions | | | (199,368 | ) | | | (2,086,668 | ) | | | (9,488 | ) | | | (100,000 | ) | |
Net increase (decrease) | | | (185,980 | ) | | | (1,946,265 | ) | | | 194,051 | | | | 2,045,297 | | |
Class R5 shares | |
Subscriptions | | | 2,411,637 | | | | 25,292,684 | | | | 49,535 | | | | 522,106 | | |
Distributions reinvested | | | 18,981 | | | | 198,924 | | | | 38 | | | | 400 | | |
Redemptions | | | (267,678 | ) | | | (2,805,823 | ) | | | — | | | | — | | |
Net increase | | | 2,162,940 | | | | 22,685,785 | | | | 49,573 | | | | 522,506 | | |
Class Z shares | |
Subscriptions | | | 75,675,898 | | | | 793,602,619 | | | | 85,292,001 | | | | 899,518,380 | | |
Distributions reinvested | | | 160,250 | | | | 1,679,903 | | | | 262,420 | | | | 2,768,141 | | |
Redemptions | | | (75,359,133 | ) | | | (790,296,690 | ) | | | (100,330,775 | ) | | | (1,058,172,831 | ) | |
Net increase (decrease) | | | 477,015 | | | | 4,985,832 | | | | (14,776,354 | ) | | | (155,886,310 | ) | |
Total net increase (decrease) | | | 403,118 | | | | 4,176,179 | | | | (17,322,714 | ) | | | (182,740,710 | ) | |
(a) Class R4 shares are for the period from March 19, 2013 (commencement of operations) to April 30, 2013.
(b) Class R5 shares are for the period from November 8, 2012 (commencement of operations) to April 30, 2013.
(c) Includes conversions of Class B shares to Class A shares, if any.
The accompanying Notes to Financial Statements are an integral part of this statement.
Annual Report 2014
29
Columbia Short Term Municipal Bond Fund
The following tables are intended to help you understand the Fund's financial performance. Certain information reflects financial results for a single share of a class held for the periods shown. Per share net investment income (loss) amounts are calculated based on average shares outstanding during the period. Total return assumes reinvestment of all dividends and distributions, if any. Total return does not reflect payment of sales charges, if any, and is not annualized for periods of less than one year.
| | | Year ended April 30, | | Year ended March 31, | |
Class A | | 2014 | | 2013 | | 2012(a) | | 2012 | | 2011 | | 2010 | |
Per share data | |
Net asset value, beginning of period | | $ | 10.54 | | | $ | 10.55 | | | $ | 10.54 | | | $ | 10.47 | | | $ | 10.55 | | | $ | 10.46 | | |
Income from investment operations: | |
Net investment income | | | 0.10 | | | | 0.11 | | | | 0.01 | | | | 0.16 | | | | 0.16 | | | | 0.17 | | |
Net realized and unrealized gain (loss) | | | (0.06 | ) | | | (0.01 | ) | | | 0.01 | | | | 0.06 | | | | (0.08 | ) | | | 0.09 | | |
Total from investment operations | | | 0.04 | | | | 0.10 | | | | 0.02 | | | | 0.22 | | | | 0.08 | | | | 0.26 | | |
Less distributions to shareholders: | |
Net investment income | | | (0.10 | ) | | | (0.11 | ) | | | (0.01 | ) | | | (0.15 | ) | | | (0.16 | ) | | | (0.17 | ) | |
Total distributions to shareholders | | | (0.10 | ) | | | (0.11 | ) | | | (0.01 | ) | | | (0.15 | ) | | | (0.16 | ) | | | (0.17 | ) | |
Proceeds from regulatory settlements | | | — | | | | — | | | | — | | | | — | | | | — | | | | 0.00 | (b) | |
Net asset value, end of period | | $ | 10.48 | | | $ | 10.54 | | | $ | 10.55 | | | $ | 10.54 | | | $ | 10.47 | | | $ | 10.55 | | |
Total return | | | 0.37 | % | | | 0.96 | % | | | 0.19 | % | | | 2.12 | % | | | 0.75 | % | | | 2.53 | % | |
Ratios to average net assets(c) | |
Total gross expenses | | | 0.89 | % | | | 0.89 | % | | | 0.88 | %(d) | | | 0.90 | % | | | 0.78 | %(e) | | | 0.73 | %(e) | |
Total net expenses(f) | | | 0.73 | %(g) | | | 0.73 | %(g) | | | 0.72 | %(d) | | | 0.73 | %(g) | | | 0.75 | %(e)(g) | | | 0.72 | %(e)(g) | |
Net investment income | | | 0.94 | % | | | 1.05 | % | | | 1.17 | %(d) | | | 1.54 | % | | | 1.50 | % | | | 1.57 | % | |
Supplemental data | |
Net assets, end of period (in thousands) | | $ | 165,777 | | | $ | 185,205 | | | $ | 209,557 | | | $ | 216,298 | | | $ | 281,009 | | | $ | 485,404 | | |
Portfolio turnover | | | 31 | % | | | 37 | % | | | 2 | % | | | 39 | % | | | 38 | % | | | 62 | % | |
Notes to Financial Highlights
(a) For the period from April 1, 2012 to April 30, 2012. During the period, the Fund's fiscal year end was changed from March 31 to April 30.
(b) Rounds to zero.
(c) In addition to the fees and expenses which the Fund bears directly, the Fund indirectly bears a pro rata share of the fees and expenses of the acquired funds in which it invests. Such indirect expenses are not included in the reported expense ratios.
(d) Annualized.
(e) Ratios include line of credit interest expense which rounds to less than 0.01%.
(f) Total net expenses include the impact of certain waivers/reimbursements made by the Investment Manager and certain of its affiliates, if applicable.
(g) The benefits derived from expense reductions had an impact of less than 0.01%.
The accompanying Notes to Financial Statements are an integral part of this statement.
Annual Report 2014
30
Columbia Short Term Municipal Bond Fund
Financial Highlights (continued)
| | | Year ended April 30, | | Year ended March 31, | |
Class B | | 2014 | | 2013 | | 2012(a) | | 2012 | | 2011 | | 2010 | |
Per share data | |
Net asset value, beginning of period | | $ | 10.54 | | | $ | 10.55 | | | $ | 10.54 | | | $ | 10.47 | | | $ | 10.55 | | | $ | 10.46 | | |
Income from investment operations: | |
Net investment income | | | 0.02 | | | | 0.03 | | | | 0.00 | (b) | | | 0.08 | | | | 0.08 | | | | 0.10 | | |
Net realized and unrealized gain (loss) | | | (0.07 | ) | | | (0.01 | ) | | | 0.01 | | | | 0.06 | | | | (0.08 | ) | | | 0.08 | | |
Total from investment operations | | | (0.05 | ) | | | 0.02 | | | | 0.01 | | | | 0.14 | | | | — | | | | 0.18 | | |
Less distributions to shareholders: | |
Net investment income | | | (0.02 | ) | | | (0.03 | ) | | | (0.00 | )(b) | | | (0.07 | ) | | | (0.08 | ) | | | (0.09 | ) | |
Total distributions to shareholders | | | (0.02 | ) | | | (0.03 | ) | | | (0.00 | )(b) | | | (0.07 | ) | | | (0.08 | ) | | | (0.09 | ) | |
Proceeds from regulatory settlements | | | — | | | | — | | | | — | | | | — | | | | — | | | | 0.00 | (b) | |
Net asset value, end of period | | $ | 10.47 | | | $ | 10.54 | | | $ | 10.55 | | | $ | 10.54 | | | $ | 10.47 | | | $ | 10.55 | | |
Total return | | | (0.47 | %) | | | 0.20 | % | | | 0.12 | % | | | 1.35 | % | | | 0.00 | %(b) | | | 1.77 | % | |
Ratios to average net assets(c) | |
Total gross expenses | | | 1.64 | % | | | 1.64 | % | | | 1.63 | %(d) | | | 1.63 | % | | | 1.53 | %(e) | | | 1.48 | %(e) | |
Total net expenses(f) | | | 1.48 | %(g) | | | 1.48 | % | | | 1.47 | %(d) | | | 1.48 | %(g) | | | 1.50 | %(e)(g) | | | 1.47 | %(e)(g) | |
Net investment income | | | 0.19 | % | | | 0.30 | % | | | 0.41 | %(d) | | | 0.79 | % | | | 0.76 | % | | | 0.91 | % | |
Supplemental data | |
Net assets, end of period (in thousands) | | $ | 128 | | | $ | 169 | | | $ | 243 | | | $ | 243 | | | $ | 325 | | | $ | 331 | | |
Portfolio turnover | | | 31 | % | | | 37 | % | | | 2 | % | | | 39 | % | | | 38 | % | | | 62 | % | |
Notes to Financial Highlights
(a) For the period from April 1, 2012 to April 30, 2012. During the period, the Fund's fiscal year end was changed from March 31 to April 30.
(b) Rounds to zero.
(c) In addition to the fees and expenses which the Fund bears directly, the Fund indirectly bears a pro rata share of the fees and expenses of the acquired funds in which it invests. Such indirect expenses are not included in the reported expense ratios.
(d) Annualized.
(e) Ratios include line of credit interest expense which rounds to less than 0.01%.
(f) Total net expenses include the impact of certain waivers/reimbursements made by the Investment Manager and certain of its affiliates, if applicable.
(g) The benefits derived from expense reductions had an impact of less than 0.01%.
The accompanying Notes to Financial Statements are an integral part of this statement.
Annual Report 2014
31
Columbia Short Term Municipal Bond Fund
Financial Highlights (continued)
| | | Year ended April 30, | | Year ended March 31, | |
Class C | | 2014 | | 2013 | | 2012(a) | | 2012 | | 2011 | | 2010 | |
Per share data | |
Net asset value, beginning of period | | $ | 10.54 | | | $ | 10.55 | | | $ | 10.54 | | | $ | 10.47 | | | $ | 10.55 | | | $ | 10.46 | | |
Income from investment operations: | |
Net investment income | | | 0.02 | | | | 0.03 | | | | 0.00 | (b) | | | 0.08 | | | | 0.08 | | | | 0.09 | | |
Net realized and unrealized gain (loss) | | | (0.06 | ) | | | (0.01 | ) | | | 0.01 | | | | 0.06 | | | | (0.08 | ) | | | 0.09 | | |
Total from investment operations | | | (0.04 | ) | | | 0.02 | | | | 0.01 | | | | 0.14 | | | | — | | | | 0.18 | | |
Less distributions to shareholders: | |
Net investment income | | | (0.02 | ) | | | (0.03 | ) | | | (0.00 | )(b) | | | (0.07 | ) | | | (0.08 | ) | | | (0.09 | ) | |
Total distributions to shareholders | | | (0.02 | ) | | | (0.03 | ) | | | (0.00 | )(b) | | | (0.07 | ) | | | (0.08 | ) | | | (0.09 | ) | |
Proceeds from regulatory settlements | | | — | | | | — | | | | — | | | | — | | | | — | | | | 0.00 | (b) | |
Net asset value, end of period | | $ | 10.48 | | | $ | 10.54 | | | $ | 10.55 | | | $ | 10.54 | | | $ | 10.47 | | | $ | 10.55 | | |
Total return | | | (0.38 | %) | | | 0.20 | % | | | 0.12 | % | | | 1.35 | % | | | 0.00 | %(b) | | | 1.76 | % | |
Ratios to average net assets(c) | |
Total gross expenses | | | 1.64 | % | | | 1.64 | % | | | 1.63 | %(d) | | | 1.64 | % | | | 1.53 | %(e) | | | 1.48 | %(e) | |
Total net expenses(f) | | | 1.48 | %(g) | | | 1.48 | %(g) | | | 1.47 | %(d) | | | 1.48 | %(g) | | | 1.50 | %(e)(g) | | | 1.47 | %(e)(g) | |
Net investment income | | | 0.19 | % | | | 0.30 | % | | | 0.42 | %(d) | | | 0.79 | % | | | 0.75 | % | | | 0.84 | % | |
Supplemental data | |
Net assets, end of period (in thousands) | | $ | 24,424 | | | $ | 27,730 | | | $ | 32,953 | | | $ | 33,176 | | | $ | 40,603 | | | $ | 58,529 | | |
Portfolio turnover | | | 31 | % | | | 37 | % | | | 2 | % | | | 39 | % | | | 38 | % | | | 62 | % | |
Notes to Financial Highlights
(a) For the period from April 1, 2012 to April 30, 2012. During the period, the Fund's fiscal year end was changed from March 31 to April 30.
(b) Rounds to zero.
(c) In addition to the fees and expenses which the Fund bears directly, the Fund indirectly bears a pro rata share of the fees and expenses of the acquired funds in which it invests. Such indirect expenses are not included in the reported expense ratios.
(d) Annualized.
(e) Ratios include line of credit interest expense which rounds to less than 0.01%.
(f) Total net expenses include the impact of certain waivers/reimbursements made by the Investment Manager and certain of its affiliates, if applicable.
(g) The benefits derived from expense reductions had an impact of less than 0.01%.
The accompanying Notes to Financial Statements are an integral part of this statement.
Annual Report 2014
32
Columbia Short Term Municipal Bond Fund
Financial Highlights (continued)
| | | Year ended April 30, | |
Class R4 | | 2014 | | 2013(a) | |
Per share data | |
Net asset value, beginning of period | | $ | 10.54 | | | $ | 10.54 | | |
Income from investment operations: | |
Net investment income | | | 0.13 | | | | 0.02 | | |
Net realized and unrealized loss | | | (0.08 | ) | | | (0.01 | ) | |
Total from investment operations | | | 0.05 | | | | 0.01 | | |
Less distributions to shareholders: | |
Net investment income | | | (0.12 | ) | | | (0.01 | ) | |
Total distributions to shareholders | | | (0.12 | ) | | | (0.01 | ) | |
Net asset value, end of period | | $ | 10.47 | | | $ | 10.54 | | |
Total return | | | 0.53 | % | | | 0.14 | % | |
Ratios to average net assets(b) | |
Total gross expenses | | | 0.64 | % | | | 0.66 | %(c) | |
Total net expenses(d) | | | 0.48 | %(e) | | | 0.48 | %(c) | |
Net investment income | | | 1.19 | % | | | 1.32 | %(c) | |
Supplemental data | |
Net assets, end of period (in thousands) | | $ | 85 | | | $ | 2,044 | | |
Portfolio turnover | | | 31 | % | | | 37 | % | |
Notes to Financial Highlights
(a) For the period from March 19, 2013 (commencement of operations) to April 30, 2013.
(b) In addition to the fees and expenses which the Fund bears directly, the Fund indirectly bears a pro rata share of the fees and expenses of the acquired funds in which it invests. Such indirect expenses are not included in the reported expense ratios.
(c) Annualized.
(d) Total net expenses include the impact of certain waivers/reimbursements made by the Investment Manager and certain of its affiliates, if applicable.
(e) The benefits derived from expense reductions had an impact of less than 0.01%.
The accompanying Notes to Financial Statements are an integral part of this statement.
Annual Report 2014
33
Columbia Short Term Municipal Bond Fund
Financial Highlights (continued)
| | | Year ended April 30, | |
Class R5 | | 2014 | | 2013(a) | |
Per share data | |
Net asset value, beginning of period | | $ | 10.54 | | | $ | 10.55 | | |
Income from investment operations: | |
Net investment income | | | 0.14 | | | | 0.07 | | |
Net realized and unrealized loss | | | (0.07 | ) | | | (0.01 | ) | |
Total from investment operations | | | 0.07 | | | | 0.06 | | |
Less distributions to shareholders: | |
Net investment income | | | (0.14 | ) | | | (0.07 | ) | |
Total distributions to shareholders | | | (0.14 | ) | | | (0.07 | ) | |
Net asset value, end of period | | $ | 10.47 | | | $ | 10.54 | | |
Total return | | | 0.67 | % | | | 0.54 | % | |
Ratios to average net assets(b) | |
Total gross expenses | | | 0.48 | % | | | 0.48 | %(c) | |
Total net expenses(d) | | | 0.37 | % | | | 0.39 | %(c) | |
Net investment income | | | 1.31 | % | | | 1.40 | %(c) | |
Supplemental data | |
Net assets, end of period (in thousands) | | $ | 23,173 | | | $ | 522 | | |
Portfolio turnover | | | 31 | % | | | 37 | % | |
Notes to Financial Highlights
(a) For the period from November 8, 2012 (commencement of operations) to April 30, 2013.
(b) In addition to the fees and expenses which the Fund bears directly, the Fund indirectly bears a pro rata share of the fees and expenses of the acquired funds in which it invests. Such indirect expenses are not included in the reported expense ratios.
(c) Annualized.
(d) Total net expenses include the impact of certain waivers/reimbursements made by the Investment Manager and certain of its affiliates, if applicable.
The accompanying Notes to Financial Statements are an integral part of this statement.
Annual Report 2014
34
Columbia Short Term Municipal Bond Fund
Financial Highlights (continued)
| | | Year ended April 30, | | Year ended March 31, | |
Class Z | | 2014 | | 2013 | | 2012(a) | | 2012 | | 2011 | | 2010 | |
Per share data | |
Net asset value, beginning of period | | $ | 10.54 | | | $ | 10.55 | | | $ | 10.54 | | | $ | 10.47 | | | $ | 10.55 | | | $ | 10.46 | | |
Income from investment operations: | |
Net investment income | | | 0.13 | | | | 0.14 | | | | 0.01 | | | | 0.19 | | | | 0.18 | | | | 0.19 | | |
Net realized and unrealized gain (loss) | | | (0.06 | ) | | | (0.01 | ) | | | 0.01 | | | | 0.06 | | | | (0.07 | ) | | | 0.10 | | |
Total from investment operations | | | 0.07 | | | | 0.13 | | | | 0.02 | | | | 0.25 | | | | 0.11 | | | | 0.29 | | |
Less distributions to shareholders: | |
Net investment income | | | (0.13 | ) | | | (0.14 | ) | | | (0.01 | ) | | | (0.18 | ) | | | (0.19 | ) | | | (0.20 | ) | |
Total distributions to shareholders | | | (0.13 | ) | | | (0.14 | ) | | | (0.01 | ) | | | (0.18 | ) | | | (0.19 | ) | | | (0.20 | ) | |
Proceeds from regulatory settlements | | | — | | | | — | | | | — | | | | — | | | | — | | | | 0.00 | (b) | |
Net asset value, end of period | | $ | 10.48 | | | $ | 10.54 | | | $ | 10.55 | | | $ | 10.54 | | | $ | 10.47 | | | $ | 10.55 | | |
Total return | | | 0.62 | % | | | 1.21 | % | | | 0.21 | % | | | 2.37 | % | | | 1.00 | % | | | 2.79 | % | |
Ratios to average net assets(c) | |
Total gross expenses | | | 0.64 | % | | | 0.64 | % | | | 0.63 | %(d) | | | 0.63 | % | | | 0.53 | %(e) | | | 0.48 | %(e) | |
Total net expenses(f) | | | 0.48 | %(g) | | | 0.48 | %(g) | | | 0.47 | %(d) | | | 0.48 | %(g) | | | 0.50 | %(e)(g) | | | 0.47 | %(e)(g) | |
Net investment income | | | 1.19 | % | | | 1.30 | % | | | 1.41 | %(d) | | | 1.77 | % | | | 1.75 | % | | | 1.83 | % | |
Supplemental data | |
Net assets, end of period (in thousands) | | $ | 1,822,976 | | | $ | 1,829,096 | | | $ | 1,986,836 | | | $ | 2,040,417 | | | $ | 1,703,560 | | | $ | 2,020,837 | | |
Portfolio turnover | | | 31 | % | | | 37 | % | | | 2 | % | | | 39 | % | | | 38 | % | | | 62 | % | |
Notes to Financial Highlights
(a) For the period from April 1, 2012 to April 30, 2012. During the period, the Fund's fiscal year end was changed from March 31 to April 30.
(b) Rounds to zero.
(c) In addition to the fees and expenses which the Fund bears directly, the Fund indirectly bears a pro rata share of the fees and expenses of the acquired funds in which it invests. Such indirect expenses are not included in the reported expense ratios.
(d) Annualized.
(e) Ratios include line of credit interest expense which rounds to less than 0.01%.
(f) Total net expenses include the impact of certain waivers/reimbursements made by the Investment Manager and certain of its affiliates, if applicable.
(g) The benefits derived from expense reductions had an impact of less than 0.01%.
The accompanying Notes to Financial Statements are an integral part of this statement.
Annual Report 2014
35
Columbia Short Term Municipal Bond Fund
Notes to Financial Statements
April 30, 2014
Note 1. Organization
Columbia Short Term Municipal Bond Fund (the Fund), a series of Columbia Funds Series Trust (the Trust), is a diversified fund. The Trust is registered under the Investment Company Act of 1940, as amended (the 1940 Act), as an open-end management investment company organized as a Delaware statutory trust.
Fund Shares
The Trust may issue an unlimited number of shares (without par value). The Fund offers Class A, Class B, Class C, Class R4, Class R5 and Class Z shares. Although all share classes generally have identical voting, dividend and liquidation rights, each share class votes separately when required by law. Different share classes pay different distribution amounts to the extent the expenses of such share classes differ, and distributions in liquidation will be proportional to the net asset value of each share class. Each share class has its own expense structure and sales charges, as applicable.
Class A shares are subject to a maximum front-end sales charge of 1.00% based on the initial investment amount. Class A shares purchased without an initial sales charge in accounts aggregating $1 million to $50 million at the time of purchase are subject to a contingent deferred sales charge (CDSC) if the shares are sold within 18 months of purchase, charged as follows: 1.00% CDSC if redeemed within 12 months of purchase, and 0.50% CDSC if redeemed more than 12, but less than 18, months after purchase.
Class B shares are not subject to sales charges and will generally convert to Class A shares eight years after purchase. The Fund no longer accepts investments by new or existing investors in the Fund's Class B shares, except in connection with the reinvestment of any dividend and/or capital gain distributions in Class B shares of the Fund and exchanges by existing Class B shareholders of certain other funds within the Columbia Family of Funds.
Class C shares are subject to a 1.00% CDSC on shares redeemed within one year of purchase.
Class R4 shares are not subject to sales charges and are generally available only to omnibus retirement plans and certain other eligible investors.
Class R5 shares are not subject to sales charges and are generally available only to investors purchasing through authorized investment professionals and omnibus retirement plans.
Class Z shares are not subject to sales charges and are available only to certain eligible investors, which are subject to different investment minimums.
Note 2. Summary of Significant Accounting Policies
Use of Estimates
The preparation of financial statements in accordance with U.S. generally accepted accounting principles (GAAP) requires management to make certain estimates and assumptions that affect the reported amounts of assets and liabilities, the disclosure of contingent assets and liabilities at the date of the financial statements and the reported amounts of revenue and expenses during the reporting period. Actual results could differ from those estimates.
The following is a summary of significant accounting policies consistently followed by the Fund in the preparation of its financial statements.
Security Valuation
Debt securities generally are valued by pricing services approved by the Board of Trustees (the Board) based upon market transactions for normal, institutional-size trading units of similar securities. The services may use various pricing techniques which take into account appropriate factors such as yield, quality, coupon rate, maturity, type of issue, trading characteristics and other data, as well as broker quotes. Debt securities for which quotations are readily available may also be valued based upon an over-the-counter or exchange bid quotation.
Investments in open-end investment companies, including money market funds, are valued at net asset value.
Short-term securities purchased within 60 days to maturity are valued at amortized cost, which approximates market value. The value of short-term securities originally purchased with maturities greater than 60 days is determined based on an amortized value to par upon reaching 60 days to maturity. Short-term securities maturing in more than 60 days from the valuation date are valued at the market price or approximate market value based on current interest rates.
Investments for which market quotations are not readily available, or that have quotations which management believes are not reliable, are valued at fair value as determined in good faith under consistently applied procedures established by and under the general supervision of the Board. If a security or class of securities (such as foreign securities) is valued at fair value, such value is likely to be different from the last quoted market price for the security.
Annual Report 2014
36
Columbia Short Term Municipal Bond Fund
Notes to Financial Statements (continued)
April 30, 2014
The determination of fair value often requires significant judgment. To determine fair value, management may use assumptions including but not limited to future cash flows and estimated risk premiums. Multiple inputs from various sources may be used to determine fair value.
Delayed Delivery Securities
The Fund may trade securities on other than normal settlement terms, including securities purchased or sold on a "when-issued" basis. This may increase risk since the other party to the transaction may fail to deliver which could cause the Fund to subsequently invest at less advantageous prices. The Fund designates cash or liquid securities in an amount equal to the delayed delivery commitment.
Security Transactions
Security transactions are accounted for on the trade date. Cost is determined and gains (losses) are based upon the specific identification method for both financial statement and federal income tax purposes.
Income Recognition
Interest income is recorded on an accrual basis. Market premiums and discounts, including original issue discounts, are amortized and accreted, respectively, over the expected life of the security on all debt securities, unless otherwise noted.
Dividend income is recorded on the ex-dividend date.
Expenses
General expenses of the Trust are allocated to the Fund and other funds of the Trust based upon relative net assets or other expense allocation methodologies determined by the nature of the expense. Expenses directly attributable to the Fund are charged to the Fund. Expenses directly attributable to a specific class of shares are charged to that share class.
Determination of Class Net Asset Value
All income, expenses (other than class-specific expenses, which are charged to that share class, as shown in the Statement of Operations) and realized and unrealized gains (losses) are allocated to each class of the Fund on a daily basis, based on the relative net assets of each class, for purposes of determining the net asset value of each class.
Federal Income Tax Status
The Fund intends to qualify each year as a regulated investment company under Subchapter M of the Internal Revenue Code, as amended, and will distribute substantially all of its tax exempt and taxable income (including net short-term capital gains), if any, for its tax year, and as such will not be subject to federal income taxes. In addition, the
Fund intends to distribute in each calendar year substantially all of its net investment income, capital gains and certain other amounts, if any, such that the Fund should not be subject to federal excise tax. Therefore, no federal income or excise tax provision is recorded.
Distributions to Shareholders
Distributions from net investment income, if any, are declared daily and paid monthly. Net realized capital gains, if any, are distributed at least annually. Income distributions and capital gain distributions are determined in accordance with federal income tax regulations, which may differ from GAAP.
Guarantees and Indemnifications
Under the Trust's organizational documents and, in some cases, by contract, its officers and trustees are indemnified against certain liabilities arising out of the performance of their duties to the Trust or its funds. In addition, certain of the Fund's contracts with its service providers contain general indemnification clauses. The Fund's maximum exposure under these arrangements is unknown since the amount of any future claims that may be made against the Fund cannot be determined, and the Fund has no historical basis for predicting the likelihood of any such claims.
Note 3. Fees and Compensation Paid to Affiliates
Investment Management Fees
Under an Investment Management Services Agreement, Columbia Management Investment Advisers, LLC (the Investment Manager), a wholly-owned subsidiary of Ameriprise Financial, Inc. (Ameriprise Financial), determines which securities will be purchased, held or sold. The investment management fee is an annual fee that is equal to a percentage of the Fund's average daily net assets that declines from 0.36% to 0.24% as the Fund's net assets increase. The effective investment management fee rate for the year ended April 30, 2014 was 0.36% of the Fund's average daily net assets.
Administration Fees
Under an Administrative Services Agreement, the Investment Manager also serves as the Fund Administrator. The Fund pays the Fund Administrator an annual fee for administration and accounting services equal to a percentage of the Fund's average daily net assets that declines from 0.07% to 0.04% as the Fund's net assets increase. The effective administration fee rate for the year ended April 30, 2014 was 0.06% of the Fund's average daily net assets.
Annual Report 2014
37
Columbia Short Term Municipal Bond Fund
Notes to Financial Statements (continued)
April 30, 2014
Other Expenses
Other expenses are for, among other things, miscellaneous expenses of the Fund or the Board, including payments to a company providing limited administrative services to the Fund and the Board. That company's expenses include boardroom and office expense, employee compensation, employee health and retirement benefits, and certain other expenses. For the year ended April 30, 2014, other expenses paid to this company were $5,779.
Compensation of Board Members
Board members are compensated for their services to the Fund as disclosed in the Statement of Operations. Under a Deferred Compensation Plan (the Plan), the Board members who are not "interested persons" of the Fund, as defined under the 1940 Act, may elect to defer payment of up to 100% of their compensation. Deferred amounts are treated as though equivalent dollar amounts had been invested in shares of certain funds managed by the Investment Manager. The Fund's liability for these amounts is adjusted for market value changes and remains in the Fund until distributed in accordance with the Plan.
Transfer Agent Fees
Under a Transfer and Dividend Disbursing Agent Agreement, Columbia Management Investment Services Corp. (the Transfer Agent), an affiliate of the Investment Manager and a wholly-owned subsidiary of Ameriprise Financial, is responsible for providing transfer agency services to the Fund. The Transfer Agent has contracted with Boston Financial Data Services (BFDS) to serve as sub-transfer agent.
The Transfer Agent receives monthly account-based service fees based on the number of open accounts and also receives sub-transfer agency fees based on a percentage of the average aggregate value of the Fund's shares maintained in omnibus accounts (other than omnibus accounts for which American Enterprise Investment Services Inc. is the broker of record or accounts where the beneficial shareholder is a customer of Ameriprise Financial Services, Inc., which are paid a per account fee). The Transfer Agent pays the fees of BFDS for services as sub-transfer agent and is not entitled to reimbursement for such fees from the Fund (with the exception of out-of-pocket fees).
The Transfer Agent also receives compensation from fees for various shareholder services and reimbursements for certain out-of-pocket fees. Total transfer agent fees for Class R5 shares are subject to an annual limitation of not more than 0.05% of the average daily net assets attributable to Class R5 shares.
For the year ended April 30, 2014, the Fund's effective transfer agent fee rates as a percentage of average daily net assets of each class were as follows:
Class A | | | 0.20 | % | |
Class B | | | 0.20 | | |
Class C | | | 0.20 | | |
Class R4 | | | 0.20 | | |
Class R5 | | | 0.04 | | |
Class Z | | | 0.20 | | |
An annual minimum account balance fee of $20 may apply to certain accounts with a value below the applicable share class's initial minimum investment requirements to reduce the impact of small accounts on transfer agent fees. These minimum account balance fees are recorded as part of expense reductions in the Statement of Operations. For the year ended April 30, 2014, these minimum account balance fees reduced total expenses by $20.
Distribution and Service Fees
The Fund has an agreement with Columbia Management Investment Distributors, Inc. (the Distributor), an affiliate of the Investment Manager and a wholly-owned subsidiary of Ameriprise Financial, for distribution and shareholder services. The Board has approved, and the Fund has adopted, distribution and shareholder service plans (the Plans) applicable to certain share classes, which set the distribution and service fees for the Fund. These fees are calculated daily and are intended to compensate the Distributor and/or eligible selling and/or servicing agents for selling shares of the Fund and providing services to investors.
Under the Plans, the Fund pays a monthly combined distribution and service fee to the Distributor at the maximum annual rate of 0.25% of the average daily net assets attributable to Class A shares of the Fund. Also under the Plans, the Fund pays a monthly service fee at the maximum annual rate of 0.25% of the average daily net assets attributable to Class B and Class C shares of the Fund and the payment of a monthly distribution fee at the maximum annual rate of 0.75% of the average daily net assets attributable to Class B and Class C shares of the Fund.
Sales Charges
Sales charges, including front-end charges and CDSCs, received by the Distributor for distributing Fund shares were $41,239 for Class A and $3,211 for Class C shares for the year ended April 30, 2014.
Annual Report 2014
38
Columbia Short Term Municipal Bond Fund
Notes to Financial Statements (continued)
April 30, 2014
Expenses Waived/Reimbursed by the Investment Manager and its Affiliates
The Investment Manager and certain of its affiliates have contractually agreed to waive fees and/or reimburse expenses (excluding certain fees and expenses described below) for the periods disclosed below, unless sooner terminated at the sole discretion of the Board, so that the Fund's net operating expenses, after giving effect to fees waived/expenses reimbursed and any balance credits and/or overdraft charges from the Fund's custodian, do not exceed the following annual rates as a percentage of the class' average daily net assets:
| | | September 1, 2013
through
August 31, 2014 | | Prior to
September 1, 2013 | |
Class A | | | 0.73 | % | | | 0.73 | % | |
Class B | | | 1.48 | | | | 1.48 | | |
Class C | | | 1.48 | | | | 1.48 | | |
Class R4 | | | 0.48 | | | | 0.48 | | |
Class R5 | | | 0.38 | | | | 0.39 | | |
Class Z | | | 0.48 | | | | 0.48 | | |
Under the agreement governing these fee waivers and/or expense reimbursement arrangements, the following fees and expenses are excluded from the waiver/reimbursement commitment, and therefore will be paid by the Fund, if applicable: taxes (including foreign transaction taxes), expenses associated with investments in affiliated and non-affiliated pooled investment vehicles (including mutual funds and exchange-traded funds), transaction costs and brokerage commissions, costs related to any securities lending program, dividend expenses associated with securities sold short, inverse floater program fees and expenses, transaction charges and interest on borrowed money, interest, extraordinary expenses and any other expenses the exclusion of which is specifically approved by the Board. This agreement may be modified or amended only with approval from all parties.
Note 4. Federal Tax Information
The timing and character of income and capital gain distributions are determined in accordance with income tax regulations, which may differ from GAAP because of temporary or permanent book to tax differences.
At April 30, 2014, these differences are primarily due to differing treatment for capital loss carryforwards, Trustees' deferred compensation and distributions. To the extent these differences are permanent, reclassifications are made among the components of the Fund's net assets in the Statement of Assets and Liabilities. Temporary differences do not require
reclassifications. In the Statement of Assets and Liabilities the following reclassifications were made:
Accumulated net realized loss | | $ | 3,090,745 | | |
Paid-in capital | | | (3,090,745 | ) | |
Net investment income and net realized gains (losses), as disclosed in the Statement of Operations, and net assets were not affected by this reclassification.
The tax character of distributions paid during the years indicated was as follows:
Year Ended April 30, | | 2014 | | 2013 | |
Ordinary income | | $ | 674 | | | $ | — | | |
Tax-exempt income | | | 22,968,417 | | | | 27,255,536 | | |
Total | | $ | 22,969,091 | | | $ | 27,255,536 | | |
Short-term capital gain distributions, if any, are considered ordinary income distributions for tax purposes.
At April 30, 2014, the components of distributable earnings on a tax basis were as follows:
Undistributed tax-exempt income | | $ | 4,292,341 | | |
Capital loss carryforwards | | | (2,624,181 | ) | |
Net unrealized appreciation | | | 18,354,421 | | |
At April 30, 2014, the cost of investments for federal income tax purposes was $1,998,784,718 and the aggregate gross unrealized appreciation and depreciation based on that cost was:
Unrealized appreciation | | $ | 20,731,306 | | |
Unrealized depreciation | | | (2,376,885 | ) | |
Net unrealized appreciation | | $ | 18,354,421 | | |
The following capital loss carryforwards, determined at April 30, 2014, may be available to reduce taxable income arising from future net realized gains on investments, if any, to the extent permitted by the Internal Revenue Code:
Year of Expiration | | Amount ($) | |
2015 | | | 1,181,270 | | |
2018 | | | 602,849 | | |
Unlimited long-term | | | 840,062 | | |
Total | | | 2,624,181 | | |
Unlimited capital loss carryforwards are required to be utilized prior to any capital losses which carry an expiration date. As a result of this ordering rule, capital loss carryforwards which carry an expiration date may be more likely to expire unused.
For the year ended April 30, 2014, $792,723 of capital loss carryforward was utilized and $3,090,745 expired unused.
Annual Report 2014
39
Columbia Short Term Municipal Bond Fund
Notes to Financial Statements (continued)
April 30, 2014
Management of the Fund has concluded that there are no significant uncertain tax positions that would require recognition in the financial statements. However, management's conclusion may be subject to review and adjustment at a later date based on factors including, but not limited to, new tax laws, regulations, and administrative interpretations (including relevant court decisions). Generally, the Fund's federal tax returns for the prior three fiscal years remain subject to examination by the Internal Revenue Service.
Note 5. Portfolio Information
The cost of purchases and proceeds from sales of securities, excluding short-term obligations, aggregated to $635,114,070 and $556,183,218, respectively, for the year ended April 30, 2014.
Note 6. Shareholder Concentration
At April 30, 2014, one unaffiliated shareholder of record owned 85.7% of the outstanding shares of the Fund in one or more accounts. The Fund has no knowledge about whether any portion of those shares was owned beneficially. Subscription and redemption activity by concentrated accounts may have a significant effect on the operations of the Fund.
Note 7. Line of Credit
The Fund has entered into a revolving credit facility with a syndicate of banks led by JPMorgan Chase Bank N.A. whereby the Fund may borrow for the temporary funding of shareholder redemptions or for other temporary or emergency purposes. The credit facility agreement, as amended, which is a collective agreement between the Fund and certain other funds managed by the Investment Manager, severally and not jointly, permits collective borrowings up to $500 million. Interest is charged to each participating fund based on its borrowings at a rate equal to the higher of (i) the overnight federal funds rate plus 1.00% or (ii) the one-month LIBOR rate plus 1.00%. Each borrowing under the credit facility matures no later than 60 days after the date of borrowing. Effective December 10, 2013, the Fund also pays a commitment fee equal to its pro rata share of the amount of the credit facility at a rate of 0.075% per annum. Prior to December 10, 2013, the commitment fee was charged at the annual rate of 0.08% per annum. The commitment fee is included in other expenses in the Statement of Operations.
The Fund had no borrowings during the year ended April 30, 2014.
Note 8. Subsequent Events
Management has evaluated the events and transactions that have occurred through the date the financial statements were issued and noted no items requiring adjustment of the financial statements or additional disclosure.
Note 9. Information Regarding Pending and Settled Legal Proceedings
In December 2005, without admitting or denying the allegations, American Express Financial Corporation (AEFC, which is now known as Ameriprise Financial, Inc. (Ameriprise Financial)) entered into settlement agreements with the Securities and Exchange Commission (SEC) and Minnesota Department of Commerce (MDOC) related to market timing activities. As a result, AEFC was censured and ordered to cease and desist from committing or causing any violations of certain provisions of the Investment Advisers Act of 1940, the Investment Company Act of 1940, and various Minnesota laws. AEFC agreed to pay disgorgement of $10 million and civil money penalties of $7 million. AEFC also agreed to retain an independent distribution consultant to assist in developing a plan for distribution of all disgorgement and civil penalties ordered by the SEC in accordance with various undertakings detailed at www.sec.gov/litigation/admin/ia-2451.pdf. Ameriprise Financial and its affiliates have cooperated with the SEC and the MDOC in these legal proceedings, and have made regular reports to the Funds' Boards of Trustees.
Ameriprise Financial and certain of its affiliates have historically been involved in a number of legal, arbitration and regulatory proceedings, including routine litigation, class actions, and governmental actions, concerning matters arising in connection with the conduct of their business activities. Ameriprise Financial believes that the Funds are not currently the subject of, and that neither Ameriprise Financial nor any of its affiliates are the subject of, any pending legal, arbitration or regulatory proceedings that are likely to have a material adverse effect on the Funds or the ability of Ameriprise Financial or its affiliates to perform under their contracts with the Funds. Ameriprise Financial is required to make 10-Q, 10-K and, as necessary, 8-K filings with the Securities and Exchange Commission on legal and regulatory matters that relate to Ameriprise Financial and its affiliates. Copies of these filings may be obtained by accessing the SEC website at www.sec.gov.
There can be no assurance that these matters, or the adverse publicity associated with them, will not result in increased fund redemptions, reduced sale of fund shares or other adverse consequences to the Funds. Further, although we believe proceedings are not likely to have a material adverse effect on the Funds or the ability of Ameriprise Financial or its affiliates to perform under their contracts with the Funds, these
Annual Report 2014
40
Columbia Short Term Municipal Bond Fund
Notes to Financial Statements (continued)
April 30, 2014
proceedings are subject to uncertainties and, as such, we are unable to estimate the possible loss or range of loss that may result. An adverse outcome in one or more of these proceedings could result in adverse judgments, settlements, fines, penalties or other relief that could have a material adverse effect on the consolidated financial condition or results of operations of Ameriprise Financial.
Annual Report 2014
41
Columbia Short Term Municipal Bond Fund
Report of Independent Registered Public Accounting Firm
To the Trustees of Columbia Funds Series Trust and the Shareholders of
Columbia Short Term Municipal Bond Fund
In our opinion, the accompanying statement of assets and liabilities, including the portfolio of investments, and the related statements of operations and of changes in net assets and the financial highlights present fairly, in all material respects, the financial position of Columbia Short Term Municipal Bond Fund (the "Fund", a series of Columbia Funds Series Trust) at April 30, 2014, and the results of its operations, the changes in its net assets and the financial highlights for each of the periods indicated, in conformity with accounting principles generally accepted in the United States of America. These financial statements and financial highlights (hereafter referred to as "financial statements") are the responsibility of the Fund's management; our responsibility is to express an opinion on these financial statements based on our audits. We conducted our audits of these financial statements in accordance with the standards of the Public Company Accounting Oversight Board (United States). Those standards require that we plan and perform the audit to obtain reasonable assurance about whether the financial statements are free of material misstatement. An audit includes examining, on a test basis, evidence supporting the amounts and disclosures in the financial statements, assessing the accounting principles used and significant estimates made by management, and evaluating the overall financial statement presentation. We believe that our audits, which included confirmation of securities at April 30, 2014 by correspondence with the custodian and brokers, and the application of alternative auditing procedures where such confirmations had not been received, provide a reasonable basis for our opinion.
PricewaterhouseCoopers LLP
Minneapolis, Minnesota
June 20, 2014
Annual Report 2014
42
Columbia Short Term Municipal Bond Fund
Federal Income Tax Information
(Unaudited)
The Fund hereby designates the following tax attributes for the fiscal year ended April 30, 2014. Shareholders will be notified in early 2015 of the amounts for use in preparing 2014 income tax returns.
Tax Designations
| Exempt-Interest Dividends | | | 100.00 | % | |
Exempt-Interest Dividends. The percentage of net investment income dividends paid during the fiscal year that qualifies as exempt-interest dividends for federal income tax purposes.
Annual Report 2014
43
Columbia Short Term Municipal Bond Fund
Shareholders elect the Board that oversees the Funds' operations. The Board appoints officers who are responsible for day-to-day business decisions based on policies set by the Board. The following table provides basic biographical information about the Funds' Board members, including their principal occupations during the past five years, although specific titles for individuals may have varied over the period. Under current Board policy, members may serve through the end of the calendar year in which he or she reaches either the mandatory retirement age established by the Board or the fifteenth anniversary of the first Board meeting they attended as a member of the Board.
Independent Trustees
Name,
Address,
Year of Birth | | Position Held With
Funds and Length of
Service | | Principal Occupation(s)
During Past Five Years
and Other Relevant
Professional Experience | | Number of
Funds in the
Fund Family
Overseen by
Board Member | | Other Present or Past
Directorships/
Trusteeships
(Within Past 5 Years) | |
Kathleen Blatz
901 S. Marquette Ave.
Minneapolis, MN 55402
1954 | | Board member since 1/06 for RiverSource Funds and since 6/11 for Nations Funds | | Attorney; Chief Justice, Minnesota Supreme Court, 1998-2006 | | | 132 | | | Trustee, BlueCross BlueShield of Minnesota since 2009 | |
Edward J. Boudreau, Jr.
901 S. Marquette Ave.
Minneapolis, MN 55402
1944 | | Board member since 6/11 for RiverSource Funds and since 1/05 for Nations Funds | | Managing Director, E.J. Boudreau & Associates (consulting) since 2000; Chairman and Chief Executive Officer, John Hancock Funds (mutual funds), 1989-2000 | | | 130 | | | Former Trustee, BofA Funds Series Trust (11 funds), 2005-2011 | |
Pamela G. Carlton
901 S. Marquette Ave.
Minneapolis, MN 55402
1954 | | Board member since 7/07 for RiverSource Funds and since 6/11 for Nations Funds | | President, Springboard — Partners in Cross Cultural Leadership (consulting company) since 2003; Director or Management Director of US Equity Research, Chase Asset Management, 1996-2003; Investment Banker, Morgan Stanley, 1982-1996 | | | 132 | | | None | |
William P. Carmichael
901 S. Marquette Ave.
Minneapolis, MN 55402
1943 | | Chair of the Board since 1/14, Board member since 6/11 for RiverSource Funds and since 2003 for Nations Funds | | Retired; Co-founder, The Succession Fund (provides exit strategies to owners of privately held companies); previously, Senior Vice President, Sara Lee Corporation; Senior Vice President and Chief Financial Officer, Beatrice Foods Company; Vice President, Esmark, Inc.; Associate, Price Waterhouse | | | 132 | | | Director, Cobra Electronics Corporation (electronic equipment manufacturer); The Finish Line (athletic shoes and apparel) since July 2003; Director, International Textile Corp. since 2012; former Director, McMoRan Exploration Company (oil and gas exploration and development) 2010-2013; former Trustee, BofA Funds Series Trust (11 funds), 2009-2011; Director, Spectrum Brands, Inc. (consumer products), 2002-2009; Director, Simmons Company (bedding), 2004-2010 | |
Annual Report 2014
44
Columbia Short Term Municipal Bond Fund
Trustees and Officers (continued)
Independent Trustees (continued)
Name,
Address,
Year of Birth | | Position Held With
Funds and Length of
Service | | Principal Occupation(s)
During Past Five Years
and Other Relevant
Professional Experience | | Number of
Funds in the
Fund Family
Overseen by
Board Member | | Other Present or Past
Directorships/
Trusteeships
(Within Past 5 Years) | |
Patricia M. Flynn
901 S. Marquette Ave.
Minneapolis, MN 55402
1950 | | Board member since 11/04 for RiverSource Funds and since 6/11 for Nations Funds | | Trustee Professor of Economics and Management, Bentley University since 1976 (also teaches and conducts research on corporate governance); Dean, McCallum Graduate School of Business, Bentley University, 1992-2002 | | | 132 | | | None | |
William A. Hawkins
901 S. Marquette Ave.
Minneapolis, MN 55402
1942 | | Board member since 6/11 for RiverSource Funds and since 1/05 for Nations Funds | | Managing Director, Overton Partners (financial consulting), since August 2010; President and Chief Executive Officer, California General Bank, N.A., January 2008-August 2010 | | | 130 | | | Trustee, BofA Funds Series Trust (11 funds) | |
R. Glenn Hilliard
901 S. Marquette Ave.
Minneapolis, MN 55402
1943 | | Board member since 6/11 for RiverSource Funds and since 1/05 for Nations Funds | | Chairman and Chief Executive Officer, Hilliard Group LLC (investing and consulting) since April 2003; Non-Executive Director & Chairman, CNO Financial Group, Inc. (insurance), September 2003-May 2011 | | | 130 | | | Chairman, BofA Fund Series Trust (11 funds); former Director, CNO Financial Group, Inc. (insurance), 2003-2011 | |
Stephen R. Lewis, Jr.
901 S. Marquette Ave.
Minneapolis, MN 55402
1939 | | Board member for RiverSource Funds since 1/02 and since 6/11 for Nations Funds, Board Chair 1/07-12/13 | | President Emeritus and Professor of Economics Emeritus, Carleton College since 2002 | | | 132 | | | Director, Valmont Industries, Inc. (irrigation systems manufacturer), 2002-2013 | |
Catherine James Paglia
901 S. Marquette Ave.
Minneapolis, MN 55402
1952 | | Board member since 11/04 for RiverSource Funds and since 6/11 for Nations Funds | | Director, Enterprise Asset Management, Inc. (private real estate and asset management company) since September 1998 | | | 132 | | | Director, Valmont Industries, Inc. (irrigation systems manufacturer) since 2012 | |
Leroy C. Richie
901 S. Marquette Ave.
Minneapolis, MN 55402
1941 | | Board member since 2000 for Legacy Seligman Funds, since 11/08 for RiverSource Funds and since 6/11 for Nations Funds | | Counsel, Lewis & Munday, P.C. (law firm) since 2004; Vice President and General Counsel, Automotive Legal Affairs, Chrysler Corporation, 1993-1997 | | | 132 | | | Lead Outside Director, Digital Ally, Inc. (digital imaging) since September 2005; Director, Infinity, Inc. (oil and gas exploration and production) since 1994; Director, OGE Energy Corp. (energy and energy services) since November 2007 | |
Minor M. Shaw
901 S. Marquette Ave.
Minneapolis, MN 55402
1947 | | Board member since 6/11 for RiverSource Funds and since 2003 for Nations Funds | | President, Micco LLC (private investments) since 2011; President, Micco Corp. since 1998 | | | 130 | | | Director, Piedmont Natural Gas; Director, BlueCross BlueShield of South Carolina since April 2008; Director, National Association of Corporate Directors, Carolinas Chapter, since 2013; former Trustee, BofA Funds Series Trust (11 funds) | |
Annual Report 2014
45
Columbia Short Term Municipal Bond Fund
Trustees and Officers (continued)
Independent Trustees (continued)
Name,
Address,
Year of Birth | | Position Held With
Funds and Length of
Service | | Principal Occupation(s)
During Past Five Years
and Other Relevant
Professional Experience | | Number of
Funds in the
Fund Family
Overseen by
Board Member | | Other Present or Past
Directorships/
Trusteeships
(Within Past 5 Years) | |
Alison Taunton-Rigby
901 S. Marquette Ave.
Minneapolis, MN 55402
1944 | | Board member since 11/02 for RiverSource Funds and since 6/11 for Nations Funds | | Chief Executive Officer and Director, RiboNovix, Inc., (biotechnology) 2003-2010 | | | 132 | | | Director, Healthways, Inc. (health and wellbeing solutions) since 2005; Director, ICI Mutual Insurance Company, RRG since 2011; Director, Abt Associates (government contractor) since 2001; Director, Boston Children's Hospital since 2002 | |
Interested Trustee Not Affiliated with Investment Manager*
Name,
Address,
Year of Birth | | Position Held With
Funds and Length of
Service | | Principal Occupation(s)
During Past Five Years
and Other Relevant
Professional Experience | | Number of
Funds in the
Fund Family
Overseen by
Board Member | | Other Present or Past
Directorships/
Trusteeships
(Within Past 5 Years) | |
Anthony M. Santomero
901 S. Marquette Ave.
Minneapolis, MN 55402
1946 | | Board member since 6/11 for RiverSource Funds and since 1/08 for Nations Funds | | Richard K. Mellon Professor Emeritus of Finance, The Wharton School, University of Pennsylvania, since 2002; Senior Advisor, McKinsey & Company (consulting), 2006-2008 | | | 130 | | | Director, Renaissance Reinsurance Ltd. since May 2008; Trustee, Penn Mutual Life Insurance Company since March 2008; Director, Citigroup Inc. since 2009; Director, Citibank, N.A. since 2009; former Trustee, BofA Funds Series Trust (11 funds), 2008-2011 | |
* Dr. Santomero is not an affiliated person of the Investment Manager or Ameriprise Financial. However, he is currently deemed by the Funds to be an "interested person" (as defined in the 1940 Act) of the Funds because he serves as a Director of Citigroup Inc. and Citibank, N.A., companies that may directly or through subsidiaries and affiliates engage from time-to-time in brokerage execution, principal transactions and lending relationships with the Funds or accounts advised/managed by the Investment Manager.
Annual Report 2014
46
Columbia Short Term Municipal Bond Fund
Trustees and Officers (continued)
Interested Trustee Affiliated with Investment Manager*
Name,
Address,
Year of Birth | | Position Held With
Funds and Length of
Service | | Principal Occupation(s)
During Past Five Years
and Other Relevant
Professional Experience | | Number of
Funds in the
Fund Family
Overseen by
Board Member | | Other Present or Past
Directorships/
Trusteeships
(Within Past 5 Years) | |
William F. Truscott
53600 Ameriprise
Financial Center
Minneapolis, MN 55474
1960 | | Board member since 11/01 for RiverSource Funds and since 6/11 for Nations Funds; Senior Vice President since 2002 for RiverSource Funds and since 5/10 for Nations Funds | | Chairman of the Board and President, Columbia Management Investment Advisers, LLC since May 2010 and February 2012, respectively (previously President and Chief Investment Officer, 2001-April 2010); Chief Executive Officer, Global Asset Management, Ameriprise Financial, Inc. since September 2012 (previously Chief Executive Officer, U.S. Asset Management & President, Annuities, May 2010-September 2012 and President — U.S. Asset Management and Chief Investment Officer, 2005-April 2010); Director and Chief Executive Officer, Columbia Management Investment Distributors, Inc. since May 2010 and February 2012, respectively (previously Chairman of the Board and Chief Executive Officer, 2006-April 2010); Chairman of the Board and Chief Executive Officer, RiverSource Distributors, Inc. since 2006; Director, Threadneedle Asset Management Holdings, SARL since 2014; President and Chief Executive Officer, Ameriprise Certificate Company, 2006-August 2012 | | | 186 | | | Former Director, Ameriprise Certificate Company, 2006-January 2013 | |
* Interested person (as defined under the 1940 Act) by reason of being an officer, director, security holder and/or employee of the Investment Manager or Ameriprise Financial.
The Statement of Additional Information has additional information about the Fund's Board members and is available, without charge, upon request by calling 800.345.6611; contacting your financial intermediary or visiting columbiamanagement.com.
Annual Report 2014
47
Columbia Short Term Municipal Bond Fund
Trustees and Officers (continued)
The Board has appointed officers who are responsible for day-to-day business decisions based on policies it has established. The officers serve at the pleasure of the Board. In addition to Mr. Truscott, who is Senior Vice President, the Funds' other officers are:
Officers
Name,
Address and
Year of Birth | | Position and Year
First Appointed to
Position for any Fund
in the Columbia
Funds Complex or a
Predecessor Thereof | | Principal Occupation(s) During Past Five Years | |
J. Kevin Connaughton
225 Franklin Street
Boston, MA 02110
Born 1964 | | President and Principal Executive Officer (2009) | | Managing Director and General Manager — Mutual Fund Products, Columbia Management Investment Advisers, LLC since May 2010; and President, Columbia Funds since 2009; Managing Director, Columbia Management Advisors, LLC, December 2004-April 2010; Senior Vice President and Chief Financial Officer, Columbia Funds, June 2008-January 2009; and senior officer of Columbia Funds and affiliated funds since 2003 | |
Michael G. Clarke
225 Franklin Street
Boston, MA 02110
Born 1969 | | Treasurer (2011) and Chief Financial Officer (2009) | | Vice President — Mutual Fund Administration, Columbia Management Investment Advisers, LLC, since May 2010; Managing Director of Fund Administration, Columbia Management Advisors, LLC, September 2004-April 2010; and senior officer of Columbia Funds and affiliated funds since 2002 | |
Scott R. Plummer
5228 Ameriprise Financial Center
Minneapolis, MN 55474
Born 1959 | | Senior Vice President (2006), Chief Legal Officer (2006) and Assistant Secretary (2011) | | Senior Vice President and Assistant General Counsel — Global Asset Management, Ameriprise Financial since February 2014 (previously, Senior Vice President and Lead Chief Counsel — Asset Management, 2012-February 2014; Vice President and Lead Chief Counsel — Asset Management, 2010-2012; and Vice President and Chief Counsel — Asset Management, 2005-2010); Senior Vice President, Chief Legal Officer and Assistant Secretary, Columbia Management Investment Advisers, LLC since June 2005; Vice President, Chief Counsel and Assistant Secretary, Columbia Management Investment Distributors, Inc. since 2008; Vice President, General Counsel and Secretary, Ameriprise Certificate Company since 2005; Chief Counsel, RiverSource Distributors, Inc. since 2006; senior officer of Columbia Funds and affiliated funds since 2006 | |
Thomas P. McGuire
225 Franklin Street
Boston, MA 02110
Born 1972 | | Chief Compliance Officer (2012) | | Vice President — Asset Management Compliance, Ameriprise Financial, Inc. since May 2010; Chief Compliance Officer, Ameriprise Certificate Company, since September 2010; Compliance Executive, Bank of America, 2005-April 2010 | |
Colin Moore
225 Franklin Street
Boston, MA 02110
Born 1958 | | Senior Vice President (2010) | | Executive Vice President and Global Chief Investment Officer, Ameriprise Financial, Inc. since July 2013; Director and Global Chief Investment Officer, Columbia Management Investment Advisers, LLC since May 2010; Manager, Managing Director and Chief Investment Officer, Columbia Management Advisors, LLC, 2007-April 2010 | |
Michael E. DeFao
225 Franklin Street
Boston, MA 02110
Born 1968 | | Vice President (2011) and Assistant Secretary (2010) | | Vice President and Chief Counsel, Ameriprise Financial, Inc. since May 2010; Associate General Counsel, Bank of America 2005-April 2010 | |
Joseph F. DiMaria
225 Franklin Street
Boston, MA 02110
Born 1968 | | Vice President (2011) and Chief Accounting Officer (2008) | | Vice President — Mutual Fund Treasurer, Columbia Management Investment Advisers, LLC since May 2010; Director of Fund Administration, Columbia Management Advisors, LLC, 2006-April 2010 | |
Paul B. Goucher
100 Park Avenue
New York, NY 10017
Born 1968 | | Vice President (2011) and Assistant Secretary (2008) | | Vice President and Lead Chief Counsel, Ameriprise Financial, Inc. since November 2008 and January 2013, respectively (previously Chief Counsel, January 2010-January 2013, and Group Counsel, November 2008-January 2010); Director, Managing Director and General Counsel, J. & W. Seligman & Co. Incorporated, July 2008-November 2008 | |
Amy Johnson
5228 Ameriprise Financial
Center
Minneapolis, MN 55474
Born 1965 | | Vice President (2006) | | Managing Director and Chief Operating Officer, Columbia Management Investment Advisers, LLC since May 2010 (previously Chief Administrative Officer, 2009-April 2010, and Vice President — Asset Management and Trust Company Services, 2006-2009) | |
Annual Report 2014
48
Columbia Short Term Municipal Bond Fund
Trustees and Officers (continued)
Officers (continued)
Name,
Address and
Year of Birth | | Position and Year
First Appointed to
Position for any Fund
in the Columbia
Funds Complex or a
Predecessor Thereof | | Principal Occupation(s) During Past Five Years | |
Paul D. Pearson
5228 Ameriprise Financial
Center
Minneapolis, MN 55474
Born 1956 | | Vice President (2011) and Assistant Treasurer (1999) | | Vice President — Investment Accounting, Columbia Management Investment Advisers, LLC since May 2010; Vice President — Managed Assets, Investment Accounting, Ameriprise Financial, Inc., 1998-April 2010 | |
Christopher O. Petersen
5228 Ameriprise Financial
Center
Minneapolis, MN 55474
Born 1970 | | Vice President and Secretary (2010) | | Vice President and Chief Counsel, Ameriprise Financial, Inc., since January 2010 (previously Vice President and Group Counsel or Counsel, 2004-January 2010); officer of Columbia Funds and affiliated funds since 2007 | |
Stephen T. Welsh
225 Franklin Street
Boston, MA 02110
Born 1957 | | Vice President (2006) | | President and Director, Columbia Management Investment Services Corp. since May 2010; President and Director, Columbia Management Services, Inc., 2004-April 2010; Managing Director, Columbia Management Distributors, Inc., 2007-April 2010 | |
Annual Report 2014
49
Columbia Short Term Municipal Bond Fund
Approval of Investment Management Services
Agreement
Columbia Management Investment Advisers, LLC (Columbia Management or the Investment Manager), a wholly-owned subsidiary of Ameriprise Financial, Inc. (Ameriprise Financial), serves as the investment manager to Columbia Short Term Municipal Bond Fund (the Fund). Under an investment management services agreement (the IMS Agreement), Columbia Management provides investment advice and other services to the Fund and other funds distributed by Columbia Management Investment Distributors, Inc. (collectively, the Funds).
On an annual basis, the Fund's Board of Trustees (the Board), including the independent Board members (the Independent Trustees), considers renewal of the IMS Agreement. Columbia Management prepared detailed reports for the Board and its Contracts Committee in January, March and April 2014, including reports based on analyses of data provided by an independent organization (Lipper) and a comprehensive response to each item of information requested by independent legal counsel to the Independent Trustees (Independent Legal Counsel) in a letter to the Investment Manager, to assist the Board in making this determination. All of the materials presented in January, March and April were first supplied in draft form to designated representatives of the Independent Trustees, i.e., Independent Legal Counsel, Fund Counsel, the Chair of the Board and the Chair of the Contracts Committee, and the final materials (including proposed expense caps for certain Funds) were revised to reflect discussion and subsequent requests made by the Contracts Committee. In addition, throughout the year, the Board (or its committees) regularly meets with portfolio management teams and senior management personnel, and reviews information prepared by Columbia Management addressing the services Columbia Management provides and Fund performance. The Board also accords appropriate weight to the work, deliberations and conclusions of the Contracts Committee, the Investment Review Committee and the Compliance Committee in determining whether to continue the IMS Agreement.
The Board, at its April 9-11, 2014 in-person Board meeting (the April Meeting), considered the renewal of the IMS Agreement for an additional one-year term. At the April Meeting, Independent Legal Counsel reviewed with the Independent Trustees various factors relevant to the Board's consideration of advisory agreements and the Board's legal responsibilities related to such consideration. Following an analysis and discussion of the factors identified below, the Board, including all of the Independent Trustees, approved the renewal of the IMS Agreement.
Nature, Extent and Quality of Services Provided by Columbia Management
The Independent Trustees analyzed various reports and presentations they had received detailing the services performed by Columbia Management, as well as its expertise, resources and capabilities. The Independent Trustees specifically considered many developments during the past year concerning the services provided by Columbia Management, including, in particular, the successful implementation of a globalization initiative, which, among other things, increased worldwide analyst support for global products, the reorganization of the Informational Technology research team, the hiring of additional personnel to assist the Asset Allocation team and the global restructuring of the Senior Operational team. The Independent Trustees noted the information they received concerning Columbia Management's ability to retain its key portfolio management personnel. The Independent Trustees also recalled Columbia Management's representation that additional staff has been added to support the vigorous application of the "5P" review process, to which all internally-managed Funds are subject.
In connection with the Board's evaluation of the overall package of services provided by Columbia Management, the Board also considered the quality of administrative services provided to the Fund by Columbia Management, recalling the information it received highlighting significant achievements in 2013 in the performance of administrative services. In evaluating the quality of services provided under the IMS Agreement and the Fund's Administrative Services Agreement, the Independent Trustees also took into account the organization and strength of the Fund's and its service providers' compliance programs. In addition, the Board also reviewed the financial condition of Columbia Management (and its affiliates) and each entity's ability to carry out its responsibilities under the IMS Agreement and the Fund's other services agreements with affiliates of Ameriprise Financial, observing the financial strength of Ameriprise Financial, with its solid balance sheet. The Board also discussed the acceptability of the terms of the IMS Agreement (including the relatively broad scope of services required to be performed by Columbia Management). The Board concluded that the services being performed under the IMS Agreement were of a reasonably high quality.
Based on the foregoing, and based on other information received (both oral and written, including the information on investment performance referenced below) and other considerations, the Board concluded that Columbia Management and its affiliates were in a position to continue to provide a high quality and level of services to the Fund.
Annual Report 2014
50
Columbia Short Term Municipal Bond Fund
Approval of Investment Management Services
Agreement (continued)
Investment Performance
For purposes of evaluating the nature, extent and quality of services provided under the IMS Agreement, the Board carefully reviewed the investment performance of the Fund. In this regard, the Board considered detailed reports providing the results of analyses performed by an independent organization showing, for various periods, the performance of the Fund, the performance of a benchmark index, the percentage ranking of the Fund among its comparison group and the net assets of the Fund. The Board observed that the Fund's investment performance met expectations.
Comparative Fees, Costs of Services Provided and the Profits Realized By Columbia Management and its Affiliates from their Relationships with the Fund
The Board reviewed comparative fees and the costs of services provided under the IMS Agreement. The Board members considered detailed comparative information set forth in an annual report on fees and expenses, including, among other things, data (based on analyses conducted by an independent organization) showing a comparison of the Fund's expenses with median expenses paid by funds in its comparative peer universe, as well as data showing the Fund's contribution to Columbia Management's profitability. The Board reviewed the fees charged to comparable institutional or other accounts/vehicles managed by Columbia Management and discussed differences in how the products are managed and operated, noting no unreasonable differences in the levels of contractual fees.
The Board accorded particular weight to the notion that the level of fees should reflect a rational pricing model applied consistently across the various product lines in the Fund family, while assuring that the overall fees for each Fund (with few defined exceptions) are generally in line with the "pricing philosophy" currently in effect (i.e., that the total expense ratio of the Fund is no higher than the median expense ratio of funds in the same comparison universe of the Fund). In this connection, the Board also considered the 2013 report provided by an independent consulting firm, Bobroff Consulting (the Independent Consultant), that concluded that the Funds' standardized investment management fee rates were within a reasonable range. The Board took into account that the Fund's total expense ratio (after considering proposed voluntary expense caps/waivers) approximated the peer universe's median expense ratio. It was observed that various proposals concerning the Funds' transfer agency and sub-transfer agency fee structures, and other changes impacting the Funds' pricing structure and fees, are expected to be considered at a later Board meeting which, if adopted, would alter the current pricing philosophy. Based on its review, the Board concluded that the Fund's management fee was fair and reasonable in light of the extent and quality of services that the Fund receives.
The Board also considered the expected profitability of Columbia Management and its affiliates in connection with Columbia Management providing investment management services to the Fund. In this regard, the Board referred to a detailed profitability report, discussing the profitability to Columbia Management and Ameriprise Financial from managing, operating and distributing the Funds. In this regard, the Board observed that: (i) the Independent Consultant concluded that 2012 profitability was reasonable; (ii) 2013 profitability only moderately exceeded 2012 levels; and (iii) 2013 profitability is in line with profitability levels of industry competitors. It also took into account the indirect economic benefits flowing to Columbia Management or its affiliates in connection with managing or distributing the Funds, such as the enhanced ability to offer various other financial products to Ameriprise Financial customers, soft dollar benefits and overall reputational advantages. The Board noted that the fees paid by the Funds should permit the Investment Manager to offer competitive compensation to its personnel, make necessary investments in its business and earn an appropriate profit. The Board concluded that profitability levels were reasonable.
Economies of Scale to be Realized
The Board also considered the economies of scale that might be realized by Columbia Management as the Fund grows and took note of the extent to which Fund shareholders might also benefit from such growth. In this regard, the Independent Trustees took into account that IMS fees decline as Fund assets exceed various breakpoints, all of which have not been surpassed.
Based on the foregoing, the Board, including all of the Independent Trustees, concluded that the investment management service fees were fair and reasonable in light of the extent and quality of services provided. In reaching this conclusion, no single factor was determinative. On April 11, 2014, the Board, including all of the Independent Trustees, approved the renewal of the IMS Agreement.
Annual Report 2014
51
This page intentionally left blank.
Annual Report 2014
52
Columbia Short Term Municipal Bond Fund
Important Information About This Report
Each fund mails one shareholder report to each shareholder address. If you would like more than one report, please call shareholder services at 800.345.6611 and additional reports will be sent to you.
The policy of the Board is to vote the proxies of the companies in which each fund holds investments consistent with the procedures as stated in the Statement of Additional Information (SAI). You may obtain a copy of the SAI without charge by calling 800.345.6611; contacting your financial intermediary; visiting columbiamanagement.com; or searching the website of the Securities and Exchange Commission (SEC) at sec.gov. Information regarding how each fund voted proxies relating to portfolio securities is filed with the SEC by August 31 for the most recent 12-month period ending June 30 of that year, and is available without charge by visiting columbiamanagement.com; or searching the website of the SEC at sec.gov.
Each fund files a complete schedule of portfolio holdings with the SEC for the first and third quarters of each fiscal year on Form N-Q. Each fund's Form N-Q is available on the SEC's website at sec.gov and may be reviewed and copied at the SEC's Public Reference Room in Washington, D.C. Information on the operation of the Public Reference Room may be obtained by calling 800.SEC.0330. Each fund's complete schedule of portfolio holdings, as filed on Form N-Q, can also be obtained without charge, upon request, by calling 800.345.6611.
Annual Report 2014
53

Columbia Short Term Municipal Bond Fund
P.O. Box 8081
Boston, MA 02266-8081
columbiamanagement.com
This information is for use with concurrent or prior delivery of a fund prospectus. Please read and consider the investment objectives, risks, charges and expenses for any fund carefully before investing. For a prospectus and, if available, a summary prospectus, which contains this and other important information about the Fund go to columbiamanagement.com. The Fund is distributed by Columbia Management Investment Distributors, Inc., member FINRA, and managed by Columbia Management Investment Advisers, LLC.
© 2014 Columbia Management Investment Advisers, LLC. All rights reserved.
ANN223_04_D01_(06/14)
Annual Report
April 30, 2014

Columbia Virginia Intermediate Municipal Bond Fund
(renamed Columbia AMT-Free Virginia Intermediate Muni Bond Fund, effective July 7, 2014)
Not FDIC insured • No bank guarantee • May lose value
 Dear Shareholders,
Continued Economic Recovery
The U.S. economy continued to recover at a slow but steady pace during the first quarter of 2014, supported by solid manufacturing activity, reasonable job growth and continued gains for the housing market. Industrial production was robust, buoyed by strong demand for autos and related parts. After a disappointing January, job growth picked up, which helped boost consumer confidence. Housing data was somewhat mixed, as harsh weather and higher mortgage rates put a damper on sales, while lower inventories helped prices trend higher. The Federal Reserve (the Fed) announced further reductions to its monthly asset purchases and reassured the markets that it would not make any significant changes to monetary policy until it was satisfied that the labor market was on solid ground. Despite mostly good news on the economic front, the broad financial markets recorded only modest gains, as bitter winter weather at home and mounting tensions between Russia and Western allies prompted investor caution.
Investors braced for higher interest rates, but long-term yields declined and the fixed-income markets were surprisingly resilient in the face of stable-to-improving economic data. Risk-on trading continued during the quarter as the higher yielding sectors of the fixed-income markets generally fared well. Emerging-market bonds, long-term U.S. Treasuries and sovereign debt were among the strongest performers, as were Treasury Inflation Protected Securities. Municipal bonds delivered solid gains, especially high-yield municipals, which benefited from continued improvement in state finances.
Against this backdrop, the broad bond market, as measured by the Barclays U.S. Aggregate Bond Index, edged out the broad stock market, as measured by the Standard & Poor's 500 Index, with gains of 1.84% vs. 1.81%, respectively. As indicated late last year, the Fed began tapering its monthly asset purchase program and announced further reductions. New Fed chair Janet Yellen reassured investors the Fed was committed to keeping short-term borrowing rates low into 2015.
Stay on Track with Columbia Management
Backed by more than 100 years of experience, Columbia Management is one of the nation's largest asset managers. At the heart of our success and, most importantly, that of our investors, are highly talented industry professionals, brought together by a unique way of working. At Columbia Management, reaching our performance goals matters, and how we reach them matters just as much.
Visit columbiamanagement.com for:
> The Columbia Management Perspectives blog, offering insights on current market events and investment opportunities
> Detailed up-to-date fund performance and portfolio information
> Quarterly fund commentaries
> Columbia Management investor, our award-winning quarterly newsletter for shareholders
Thank you for your continued support of the Columbia Funds. We look forward to serving your investment needs for many years to come.
Best Regards,

J. Kevin Connaughton
President, Columbia Funds
Investing involves risk including the risk of loss of principal.
The Barclays U.S. Aggregate Bond Index is a broad-based benchmark that measures the investment grade, U.S. dollar denominated, fixed-rate taxable bond market, including Treasuries, government-related and corporate securities, mortgage-backed securities (agency fixed-rate and hybrid adjustable-rate mortgage passthroughs), asset-backed securities, and commercial mortgage-backed securities. The S&P 500 Index, an unmanaged index, measures the performance of 500 widely held, large-capitalization U.S. stocks and is frequently used as a general measure of market performance. Indices are not available for investment, are not professionally managed and do not reflect sales charges, fees, brokerage commissions, taxes or other expenses of investing.
Investors should consider the investment objectives, risks, charges and expenses of a mutual fund carefully before investing. For a free prospectus and, if available, a summary prospectus, which contains this and other important information about a fund, visit columbiamanagement.com. The prospectus should be read carefully before investing.
Columbia Funds are distributed by Columbia Management Investment Distributors, Inc., member FINRA, and managed by Columbia Management Investment Advisers, LLC.
© 2014 Columbia Management Investment Advisers, LLC. All rights reserved.
Columbia Virginia Intermediate Municipal Bond Fund
Performance Overview | | | 2 | | |
Manager Discussion of Fund Performance | | | 4 | | |
Understanding Your Fund's Expenses | | | 6 | | |
Portfolio of Investments | | | 7 | | |
Statement of Assets and Liabilities | | | 14 | | |
Statement of Operations | | | 16 | | |
Statement of Changes in Net Assets | | | 17 | | |
Financial Highlights | | | 19 | | |
Notes to Financial Statements | | | 24 | | |
Report of Independent Registered
Public Accounting Firm | | | 29 | | |
Federal Income Tax Information | | | 30 | | |
Trustees and Officers | | | 31 | | |
Approval of Investment Management Services Agreement | | | 37 | | |
Important Information About This Report | | | 41 | | |
Fund Investment Manager
Columbia Management Investment
Advisers, LLC
225 Franklin Street
Boston, MA 02110
Fund Distributor
Columbia Management Investment
Distributors, Inc.
225 Franklin Street
Boston, MA 02110
Fund Transfer Agent
Columbia Management Investment
Services Corp.
P.O. Box 8081
Boston, MA 02266-8081
For more information about any of the funds, please visit columbiamanagement.com or call 800.345.6611. Customer Service Representatives are available to answer your questions Monday through Friday from 8 a.m. to 7 p.m. Eastern time.
The views expressed in this report reflect the current views of the respective parties. These views are not guarantees of future performance and involve certain risks, uncertainties and assumptions that are difficult to predict, so actual outcomes and results may differ significantly from the views expressed. These views are subject to change at any time based upon economic, market or other conditions and the respective parties disclaim any responsibility to update such views. These views may not be relied on as investment advice and, because investment decisions for a Columbia Fund are based on numerous factors, may not be relied on as an indication of trading intent on behalf of any particular Columbia Fund. References to specific securities should not be construed as a recommendation or investment advice.
Columbia Virginia Intermediate Municipal Bond Fund
Performance Summary
> Columbia Virginia Intermediate Municipal Bond Fund (the Fund) Class A shares returned -0.51% excluding sales charges for the 12-month period that ended April 30, 2014. Class Z shares of the Fund returned -0.26% for the same time period.
> The Fund's benchmark, the Barclays 3-15 Year Blend Municipal Bond Index, returned 0.97% for the 12-month period.
> The Fund's maturity and higher quality positioning generally accounted for its shortfall relative to the benchmark.
Average Annual Total Returns (%) (for period ended April 30, 2014)
| | | Inception | | 1 Year | | 5 Years | | 10 Years | |
Class A | | 12/05/89 | | | | | | | | | | | | | |
Excluding sales charges | | | | | | | -0.51 | | | | 3.82 | | | | 3.59 | | |
Including sales charges | | | | | | | -3.76 | | | | 3.13 | | | | 3.24 | | |
Class B | | 06/07/93 | | | | | | | | | | | | | |
Excluding sales charges | | | | | | | -1.16 | | | | 3.06 | | | | 2.82 | | |
Including sales charges | | | | | | | -4.05 | | | | 3.06 | | | | 2.82 | | |
Class C | | 06/17/92 | | | | | | | | | | | | | |
Excluding sales charges | | | | | | | -1.16 | | | | 3.08 | | | | 2.82 | | |
Including sales charges | | | | | | | -2.12 | | | | 3.08 | | | | 2.82 | | |
Class R4* | | 03/19/13 | | | -0.19 | | | | 4.09 | | | | 3.84 | | |
Class Z | | 09/20/89 | | | -0.26 | | | | 4.10 | | | | 3.84 | | |
Barclays 3-15 Year Blend Municipal Bond Index | | | | | | | 0.97 | | | | 4.91 | | | | 4.71 | | |
Returns for Class A are shown with and without the maximum initial sales charge of 3.25%. Returns for Class B are shown with and without the applicable contingent deferred sales charge (CDSC) of 3.00% in the first year, declining to 1.00% in the fourth year and eliminated thereafter. Returns for Class C are shown with and without the 1.00% CDSC for the first year only. The Fund's other classes are not subject to sales charges and have limited eligibility. Please see the Fund's prospectus for details. Performance for different share classes will vary based on differences in sales charges and fees associated with each class. All results shown assume reinvestment of distributions during the period. Returns do not reflect the deduction of taxes that a shareholder may pay on Fund distributions or on the redemption of Fund shares. Performance results reflect the effect of any fee waivers or reimbursements of Fund expenses by Columbia Management Investment Advisers, LLC and/or any of its affiliates. Absent these fee waivers or expense reimbursement arrangements, performance results would have been lower.
The performance information shown represents past performance and is not a guarantee of future results. The investment return and principal value of your investment will fluctuate so that your shares, when redeemed, may be worth more or less than their original cost. Current performance may be lower or higher than the performance information shown. You may obtain performance information current to the most recent month-end by contacting your financial intermediary, visiting columbiamanagement.com or calling 800.345.6611.
*The returns shown for periods prior to the share class inception date (including returns for the Life of the Fund, if shown, which are since Fund inception) include the returns of the Fund's oldest share class. These returns are adjusted to reflect any higher class-related operating expenses of the newer share classes, as applicable. Please visit columbiamanagement.com/mutual-funds/appended-performance for more information.
The Barclays 3-15 Year Blend Municipal Bond Index is an unmanaged index that tracks the performance of municipal bonds issued after December 31, 1990, with remaining maturities between 2 and 17 years and at least $7 million in principal amount outstanding.
Indices are not available for investment, are not professionally managed and do not reflect sales charges, fees, brokerage commissions, taxes or other expenses of investing. Securities in the Fund may not match those in an index.
Annual Report 2014
2
Columbia Virginia Intermediate Municipal Bond Fund
Performance Overview (continued)
Performance of a Hypothetical $10,000 Investment (May 1, 2004 – April 30, 2014)

The chart above shows the change in value of a hypothetical $10,000 investment in Class A shares of Columbia Virginia Intermediate Municipal Bond Fund during the stated time period, and does not reflect the deduction of taxes that a shareholder may pay on Fund distributions or on the redemption of Fund shares.
Annual Report 2014
3
Columbia Virginia Intermediate Municipal Bond Fund
Manager Discussion of Fund Performance
Effective July 7, 2014, the Fund will be renamed Columbia AMT-Free Virginia Intermediate Muni Bond Fund.
For the 12-month period that ended April 30, 2014, the Fund's Class A shares returned -0.51% excluding sales charges. Class Z shares of the Fund returned -0.26% for the same time period. The Fund's benchmark, the Barclays 3-15 Year Blend Municipal Bond Index, returned 0.97% for the 12-month period. The Fund's maturity and quality positioning generally accounted for its shortfall relative to the benchmark. It had more exposure to bonds in the weakest performing maturity segment — 8 to 12 years. The Fund also had less exposure than the benchmark to bonds rated A, which was the best performing quality tier for the period. Virginia is generally considered a high quality state and there are more issues with higher ratings within the state as compared with other states.
Stable Economic Growth
Even though a difficult winter weighed on the U.S. economy early in 2014, it was not enough to derail the steady growth that marked the 12-month period. Solid new job growth drove the unemployment rate down to 6.3%. Robust manufacturing activity boosted the nation's capacity utilization rate to a recovery high of 79.2%. Personal income edged higher, borrowing increased and the savings rate declined. Consumer confidence generally rose during the 12-month period, reflecting consumer expectations that the economy was on solid ground. The housing market lost some momentum, the victim of bad winter weather, tighter borrowing standards, rising prices and higher mortgage rates. However, higher pending home sales near the end of the period was a positive data point.
Investors welcomed reduced tensions in Washington, where an extended budget deal and the president's nomination of Janet Yellen as the new Federal Reserve (Fed) chair received bipartisan support. In December 2013, the Fed announced that it would take a measured approach to tapering its monthly bond-buying program, beginning in January 2014. Further tapering commenced in February, March and April. Against this backdrop of generally positive economic news, bonds lost some ground as interest rates moved higher. Nevertheless, the municipal market managed a modestly positive return for the period.
A Challenging Environment for the Municipal Market
Municipal yields followed Treasury yields higher from the beginning of the period through early September. A rapid selloff in the wake of climbing yields sent municipal bond fund shares downward, causing heavy selling pressure, which persisted through the end of the calendar year. The environment improved in the first four months of 2014. Fund outflows slowed, state and local revenues improved, demand for shorter-maturity municipal bonds remained strong and new issuance declined sharply. Through April, new bond issuance was down by 30% compared to the same period in 2013, and refunding volume has dropped by more than 50%. For the 12 months covered by this report, the best returns came from bonds with two- to four-year maturities. Ten-year maturities were the worst performers. Generally speaking, lower quality bonds generated slightly higher returns than higher quality bonds.
Portfolio Management
Brian McGreevy
Quality Breakdown (%)
(at April 30, 2014) | |
AAA rating | | | 15.7 | | |
AA rating | | | 50.4 | | |
A rating | | | 19.9 | | |
BBB rating | | | 9.2 | | |
Not rated | | | 4.8 | | |
Total | | | 100.0 | | |
Percentages indicated are based upon total fixed income securities (excluding Money Market Funds).
Bond ratings apply to the underlying holdings of the Fund and not the Fund itself and are divided into categories ranging from AAA (highest) to D (lowest), and are subject to change. The ratings shown are determined by using the middle rating of Moody's, S&P, and Fitch after dropping the highest and lowest available ratings. When a rating from only two agencies is available, the lower rating is used. When a rating from only one agency is available, that rating is used. When a bond is not rated by one of these agencies, it is designated as Not rated. Credit ratings are subjective opinions and not statements of fact.
Annual Report 2014
4
Columbia Virginia Intermediate Municipal Bond Fund
Manager Discussion of Fund Performance (continued)
Contributors and Detractors
Pre-refunded bonds and transportation issues did well for the Fund, generating returns in excess of the benchmark. Pre-refunded bonds are high quality and generally shorter in maturity. They are issued to pre-fund older callable bonds at lower rates for the issuer. The proceeds from the new issues are invested in Treasury securities and used to repay the original bond at its original call date. Hospital issues generated mixed results. Those with shorter maturities or shorter call dates lagged late in the year. However, they were good defensive holdings early in the period.
The Fund's small position in Puerto Rico issues was a drag on performance as it significantly underperformed the overall market. We eliminated the position during the period.
Portfolio Activity
We responded to a relatively high rate of redemptions by selling lower coupon, lower book-yielding securities to raise cash and maintain a healthy dividend stream for shareholders. We also shortened the Fund's duration in response to rising interest rates. However, as rates stabilized and then declined in the final months of the period, the Fund's lighter exposure to the 12- to 17-year portion of the yield curve detracted from results.
Positive Long-Term Prospects for Virginia
Federal defense cuts, along with overall federal fiscal restraint, have been a recent drag on Virginia's economy. Weak expansion overseas and state fiscal problems also hobbled Virginia's growth. However, port activity has been strong, population growth remains positive and unemployment has been well below the national average. Over the longer term, we believe Virginia remains a desirable place for business, workers and investment. We also believe next year's budget will likely treat Virginia more favorably. The state also has the potential to benefit from demand outside of government.
Looking Ahead
So far, we believe 2014 is lining up to be a better year for the municipal market than 2013. Overall returns have been better than they were in 2013, especially for longer-term municipal bonds. Even though we expect interest rates to continue to rise gradually through the end of the year, we believe that the taxable equivalent yield on municipals is still attractive to investors who are subject to higher federal tax rates. In this environment, we have positioned the Fund with neutral duration relative to the benchmark and greater emphasis on securities rated A and BBB, which we believe have the potential to offer more value in an environment of slow but improving economic growth.
Investment Risks
There are risks associated with an investment in this Fund, including market risk, credit risk, interest rate risk prepayment and extension risk and state-specific municipal securities risk. In general, bond prices rise when interest rates fall and vice versa. Because the Fund concentrates its investments in municipal securities issued by a single state and its municipalities, specific events or factors affecting a particular state can cause more volatility in the Fund than a fund that is more geographically diversified. This effect is more pronounced for longer-term securities. Non-investment grade securities, commonly called "high-yield" or "junk" bonds, have more volatile prices and carry more risk to principal and income than investment grade securities. Income from tax-exempt funds may be subject to state and local taxes. Federal and state income tax rules will apply to any capital gain distributions and any gains or losses on sales. See the Fund's prospectus for more information on these and other risks.
Annual Report 2014
5
Columbia Virginia Intermediate Municipal Bond Fund
Understanding Your Fund's Expenses
(Unaudited)
As an investor, you incur two types of costs. There are transaction costs, which generally include sales charges on purchases and may include redemption fees. There are also ongoing costs, which generally include management fees, distribution and/or service fees, and other fund expenses. The following information is intended to help you understand your ongoing costs (in dollars) of investing in the Fund and to help you compare these costs with the ongoing costs of investing in other mutual funds.
Analyzing Your Fund's Expenses
To illustrate these ongoing costs, we have provided examples and calculated the expenses paid by investors in each share class of the Fund during the period. The actual and hypothetical information in the table is based on an initial investment of $1,000 at the beginning of the period indicated and held for the entire period. Expense information is calculated two ways and each method provides you with different information. The amount listed in the "Actual" column is calculated using the Fund's actual operating expenses and total return for the period. You may use the Actual information, together with the amount invested, to estimate the expenses that you paid over the period. Simply divide your account value by $1,000 (for example, an $8,600 account value divided by $1,000 = 8.6), then multiply the results by the expenses paid during the period under the "Actual" column. The amount listed in the "Hypothetical" column assumes a 5% annual rate of return before expenses (which is not the Fund's actual return) and then applies the Fund's actual expense ratio for the period to the hypothetical return. You should not use the hypothetical account values and expenses to estimate either your actual account balance at the end of the period or the expenses you paid during the period. See "Compare With Other Funds" below for details on how to use the hypothetical data.
Compare With Other Funds
Since all mutual funds are required to include the same hypothetical calculations about expenses in shareholder reports, you can use this information to compare the ongoing cost of investing in the Fund with other funds. To do so, compare the hypothetical example with the 5% hypothetical examples that appear in the shareholder reports of other funds. As you compare hypothetical examples of other funds, it is important to note that hypothetical examples are meant to highlight the ongoing costs of investing in a fund only and do not reflect any transaction costs, such as sales charges, or redemption or exchange fees. Therefore, the hypothetical calculations are useful in comparing ongoing costs only, and will not help you determine the relative total costs of owning different funds. If transaction costs were included in these calculations, your costs would be higher.
November 1, 2013 – April 30, 2014
| | | Account Value at the Beginning
of the Period ($) | | Account Value at the End
of the Period ($) | | Expenses Paid During
the Period ($) | | Fund's Annualized
Expense Ratio (%) | |
| | | Actual | | Hypothetical | | Actual | | Hypothetical | | Actual | | Hypothetical | | Actual | |
Class A | | | 1,000.00 | | | | 1,000.00 | | | | 1,024.40 | | | | 1,020.78 | | | | 4.07 | | | | 4.06 | | | | 0.81 | | |
Class B | | | 1,000.00 | | | | 1,000.00 | | | | 1,021.50 | | | | 1,017.06 | | | | 7.82 | | | | 7.80 | | | | 1.56 | | |
Class C | | | 1,000.00 | | | | 1,000.00 | | | | 1,021.50 | | | | 1,017.06 | | | | 7.82 | | | | 7.80 | | | | 1.56 | | |
Class R4 | | | 1,000.00 | | | | 1,000.00 | | | | 1,025.50 | | | | 1,022.02 | | | | 2.81 | | | | 2.81 | | | | 0.56 | | |
Class Z | | | 1,000.00 | | | | 1,000.00 | | | | 1,025.70 | | | | 1,022.02 | | | | 2.81 | | | | 2.81 | | | | 0.56 | | |
Expenses paid during the period are equal to the annualized expense ratio for each class as indicated above, multiplied by the average account value over the period and then multiplied by the number of days in the Fund's most recent fiscal half year and divided by 365.
Expenses do not include fees and expenses incurred indirectly by the Fund from the underlying funds in which the Fund may invest (also referred to as "acquired funds"), including affiliated and non-affiliated pooled investment vehicles (including mutual funds and exchange-traded funds).
Had Columbia Management Investment Advisers, LLC and/or certain of its affiliates not waived/reimbursed certain fees and expenses, account value at the end of the period would have been reduced.
Annual Report 2014
6
Columbia Virginia Intermediate Municipal Bond Fund
Portfolio of Investments
April 30, 2014
(Percentages represent value of investments compared to net assets)
Municipal Bonds 98.5%
Issue
Description | | Coupon
Rate | | Principal
Amount ($) | | Value ($) | |
Airport 6.0% | |
Metropolitan Washington Airports Authority
Refunding Revenue Bonds
Series 2010F-1
10/01/21 | | | 5.000 | % | | | 1,000,000 | | | | 1,184,120 | | |
Revenue Bonds
Series 2009B
10/01/21 | | | 5.000 | % | | | 3,000,000 | | | | 3,486,360 | | |
Series 2009C
10/01/23 | | | 5.000 | % | | | 3,000,000 | | | | 3,434,010 | | |
Series 2010A
10/01/23 | | | 5.000 | % | | | 2,475,000 | | | | 2,886,493 | | |
10/01/27 | | | 5.000 | % | | | 1,515,000 | | | | 1,739,993 | | |
Norfolk Airport Authority
Refunding Revenue Bonds
Series 2011 (AGM)
07/01/24 | | | 5.000 | % | | | 1,000,000 | | | | 1,113,110 | | |
Total | | | | | | | 13,844,086 | | |
Higher Education 7.4% | |
Amherst Industrial Development Agency
Refunding Revenue Bonds
Educational Facilities Sweet Briar Institute
Series 2006
09/01/26 | | | 5.000 | % | | | 1,000,000 | | | | 1,025,630 | | |
Lexington Industrial Development Authority
Revenue Bonds
VMI Development Board, Inc. Project
Series 2006A(a)
12/01/20 | | | 5.000 | % | | | 1,400,000 | | | | 1,678,222 | | |
Virginia College Building Authority
Refunding Revenue Bonds
University of Richmond Project
Series 2011A
03/01/22 | | | 5.000 | % | | | 1,245,000 | | | | 1,486,493 | | |
Series 2011B
03/01/21 | | | 5.000 | % | | | 2,250,000 | | | | 2,689,942 | | |
Revenue Bonds
Liberty University Projects
Series 2010
03/01/19 | | | 5.000 | % | | | 1,000,000 | | | | 1,166,600 | | |
03/01/22 | | | 5.000 | % | | | 1,455,000 | | | | 1,664,302 | | |
03/01/23 | | | 5.000 | % | | | 2,000,000 | | | | 2,266,460 | | |
Roanoke College
Series 2007
04/01/23 | | | 5.000 | % | | | 1,000,000 | | | | 1,107,800 | | |
Washington & Lee University Project
Series 1998 (NPFGC)
01/01/26 | | | 5.250 | % | | | 3,115,000 | | | | 3,750,024 | | |
Total | | | | | | | 16,835,473 | | |
Municipal Bonds (continued)
Issue
Description | | Coupon
Rate | | Principal
Amount ($) | | Value ($) | |
Hospital 9.8% | |
Augusta County Economic Development Authority
Refunding Revenue Bonds
Augusta Health Care, Inc.
Series 2003
09/01/19 | | | 5.250 | % | | | 905,000 | | | | 1,042,397 | | |
Fairfax County Industrial Development Authority
Refunding Revenue Bonds
Inova Health System Project
Series 1993
08/15/19 | | | 5.250 | % | | | 1,000,000 | | | | 1,137,420 | | |
Series 1993I (NPFGC)
08/15/19 | | | 5.250 | % | | | 1,000,000 | | | | 1,113,580 | | |
Revenue Bonds
Inova Health System
Series 2009C
05/15/25 | | | 5.000 | % | | | 1,000,000 | | | | 1,106,550 | | |
Fredericksburg Economic Development Authority
Refunding Revenue Bonds
MediCorp Health Systems Obligation
Series 2007
06/15/18 | | | 5.250 | % | | | 1,000,000 | | | | 1,110,460 | | |
06/15/20 | | | 5.250 | % | | | 4,000,000 | | | | 4,493,960 | | |
Norfolk Economic Development Authority
Refunding Revenue Bonds
Sentara Healthcare
Series 2012B
11/01/27 | | | 5.000 | % | | | 1,735,000 | | | | 1,953,731 | | |
Roanoke Economic Development Authority
Refunding Revenue Bonds
Carilion Clinic Obligation Group
Series 2010
07/01/25 | | | 5.000 | % | | | 3,500,000 | | | | 3,833,620 | | |
Revenue Bonds
Carilion Clinic Obligation Group
Series 2012
07/01/22 | | | 5.000 | % | | | 2,000,000 | | | | 2,308,220 | | |
07/01/23 | | | 5.000 | % | | | 1,000,000 | | | | 1,141,590 | | |
Virginia Small Business Financing Authority
Refunding Revenue Bonds
Sentara Healthcare
Series 2010
11/01/16 | | | 4.000 | % | | | 1,000,000 | | | | 1,082,510 | | |
Revenue Bonds
Wellmont Health System Project
Series 2007A
09/01/22 | | | 5.125 | % | | | 710,000 | | | | 750,278 | | |
Winchester Economic Development Authority
Revenue Bonds
Valley Health System
Series 2007
01/01/26 | | | 5.000 | % | | | 1,250,000 | | | | 1,348,663 | | |
Total | | | | | | | 22,422,979 | | |
The accompanying Notes to Financial Statements are an integral part of this statement.
Annual Report 2014
7
Columbia Virginia Intermediate Municipal Bond Fund
Portfolio of Investments (continued)
April 30, 2014
Municipal Bonds (continued)
Issue
Description | | Coupon
Rate | | Principal
Amount ($) | | Value ($) | |
Investor Owned 1.5% | |
Chesterfield County Economic Development Authority
Refunding Revenue Bonds
Virginia Electric & Power
Series 2009A
05/01/23 | | | 5.000 | % | | | 2,000,000 | | | | 2,218,580 | | |
York County Economic Development Authority
Refunding Revenue Bonds
Virginia Electric & Power
Series 2009A(a)
05/01/33 | | | 4.050 | % | | | 1,300,000 | | | | 1,303,250 | | |
Total | | | | | | | 3,521,830 | | |
Local Appropriation 6.4% | |
Appomattox County Economic Development Authority
Refunding Revenue Bonds
Series 2010
05/01/22 | | | 5.000 | % | | | 1,490,000 | | | | 1,690,271 | | |
Bedford County Economic Development Authority
Revenue Bonds
Public Facilities Project
Series 2006 (NPFGC)
05/01/15 | | | 5.000 | % | | | 1,230,000 | | | | 1,285,977 | | |
Fairfax County Economic Development Authority
Revenue Bonds
School Board Center Administration Building Project I
Series 2005A
04/01/19 | | | 5.000 | % | | | 1,380,000 | | | | 1,437,905 | | |
Six Public Facilities Projects
Series 2010
04/01/24 | | | 4.000 | % | | | 1,340,000 | | | | 1,424,969 | | |
Henrico County Economic Development Authority
Refunding Revenue Bonds
Series 2009B
08/01/21 | | | 4.500 | % | | | 1,770,000 | | | | 1,999,428 | | |
James City County Economic Development Authority
Revenue Bonds
Public Facilities Projects
Series 2006 (AGM)
06/15/23 | | | 5.000 | % | | | 2,000,000 | | | | 2,187,920 | | |
Montgomery County Industrial Development Authority
Revenue Bonds
Public Projects
Series 2008
02/01/29 | | | 5.000 | % | | | 1,000,000 | | | | 1,098,830 | | |
New Kent County Economic Development Authority
Revenue Bonds
School & Governmental Projects
Series 2006 (AGM)
02/01/21 | | | 5.000 | % | | | 2,075,000 | | | | 2,260,069 | | |
Municipal Bonds (continued)
Issue
Description | | Coupon
Rate | | Principal
Amount ($) | | Value ($) | |
Prince William County Industrial Development Authority
Refunding Revenue Bonds
ATCC Project
Series 2005
02/01/17 | | | 5.250 | % | | | 1,115,000 | | | | 1,254,141 | | |
Total | | | | | | | 14,639,510 | | |
Local General Obligation 13.7% | |
City of Hampton
Limited General Obligation Refunding & Public
Improvement Bonds
Series 2010A
01/15/19 | | | 4.000 | % | | | 2,000,000 | | | | 2,249,940 | | |
City of Lynchburg
Unlimited General Obligation Public Improvement Bonds
Series 2009A
08/01/20 | | | 5.000 | % | | | 525,000 | | | | 614,644 | | |
08/01/21 | | | 5.000 | % | | | 530,000 | | | | 613,576 | | |
City of Manassas Park
Unlimited General Obligation Refunding Bonds
Series 2008 (AGM)
01/01/22 | | | 5.000 | % | | | 1,205,000 | | | | 1,353,625 | | |
City of Newport News
Unlimited General Obligation Improvement Bonds
Series 2011A
07/01/23 | | | 5.000 | % | | | 1,380,000 | | | | 1,598,744 | | |
Unlimited General Obligation Refunding Bonds
Improvement-Water
Series 2007B
07/01/20 | | | 5.250 | % | | | 2,000,000 | | | | 2,417,440 | | |
Series 2006B
02/01/18 | | | 5.250 | % | | | 3,030,000 | | | | 3,504,649 | | |
City of Portsmouth
Unlimited General Obligation Refunding Bonds
Public Utilities
Series 2012A
07/15/21 | | | 5.000 | % | | | 3,000,000 | | | | 3,599,670 | | |
Series 2006A (NPFGC)
07/01/16 | | | 5.000 | % | | | 660,000 | | | | 725,663 | | |
City of Richmond
Unlimited General Obligation Public
Improvement Bonds
Series 2010D
07/15/22 | | | 5.000 | % | | | 575,000 | | | | 681,421 | | |
07/15/24 | | | 5.000 | % | | | 1,000,000 | | | | 1,174,810 | | |
City of Virginia Beach
Unlimited General Obligation Refunding & Public
Improvement Bonds
Series 2004B
05/01/17 | | | 5.000 | % | | | 1,000,000 | | | | 1,109,540 | | |
The accompanying Notes to Financial Statements are an integral part of this statement.
Annual Report 2014
8
Columbia Virginia Intermediate Municipal Bond Fund
Portfolio of Investments (continued)
April 30, 2014
Municipal Bonds (continued)
Issue
Description | | Coupon
Rate | | Principal
Amount ($) | | Value ($) | |
County of Arlington
Unlimited General Obligation Refunding Bonds
Public Improvement
Series 2006
08/01/17 | | | 5.000 | % | | | 2,400,000 | | | | 2,633,616 | | |
County of Fairfax
Unlimited General Obligation Refunding Bonds
Public Improvement
Series 2011A
04/01/24 | | | 4.000 | % | | | 2,000,000 | | | | 2,207,580 | | |
County of Pittsylvania
Unlimited General Obligation Bonds
Series 2008B
02/01/23 | | | 5.500 | % | | | 1,030,000 | | | | 1,197,519 | | |
County of Smyth
Unlimited General Obligation Bonds
Public Improvement
Series 2011A
11/01/31 | | | 5.000 | % | | | 4,000,000 | | | | 4,415,120 | | |
Town of Leesburg
Unlimited General Obligation Refunding Bonds
Series 2006B
09/15/17 | | | 5.000 | % | | | 1,145,000 | | | | 1,304,808 | | |
Total | | | | | | | 31,402,365 | | |
Other Bond Issue 0.7% | |
Virginia Beach Development Authority
Revenue Bonds
Series 2010C
08/01/23 | | | 5.000 | % | | | 1,380,000 | | | | 1,594,935 | | |
Other Industrial Development Bond 0.9% | |
Peninsula Ports Authority
Refunding Revenue Bonds
Dominion Term Association Project
Series 2003(a)
10/01/33 | | | 2.375 | % | | | 2,000,000 | | | | 2,041,640 | | |
Pool/Bond Bank 17.9% | |
Virginia Public School Authority
Refunding Revenue Bonds
School Financing
Series 2004C
08/01/16 | | | 5.000 | % | | | 6,000,000 | | | | 6,618,060 | | |
Series 2009C
08/01/25 | | | 4.000 | % | | | 2,560,000 | | | | 2,730,086 | | |
Virginia Resources Authority
Refunding Revenue Bonds
Revolving Fund
Series 2011A
08/01/24 | | | 5.000 | % | | | 1,395,000 | | | | 1,623,543 | | |
Municipal Bonds (continued)
Issue
Description | | Coupon
Rate | | Principal
Amount ($) | | Value ($) | |
Subordinated State Revolving Fund
Series 2005
10/01/19 | | | 5.500 | % | | | 4,000,000 | | | | 4,861,040 | | |
10/01/20 | | | 5.500 | % | | | 3,500,000 | | | | 4,316,900 | | |
10/01/21 | | | 5.500 | % | | | 6,475,000 | | | | 8,091,031 | | |
Revenue Bonds
State Revolving Fund
Series 2009
10/01/17 | | | 5.000 | % | | | 1,380,000 | | | | 1,579,120 | | |
Subordinated State Revolving Fund
Series 2008
10/01/29 | | | 5.000 | % | | | 5,000,000 | | | | 5,620,300 | | |
Unrefunded Revenue Bonds
Series 2009B
11/01/18 | | | 4.000 | % | | | 3,870,000 | | | | 4,365,824 | | |
St. Moral
Series 2009B
11/01/18 | | | 4.000 | % | | | 965,000 | | | | 1,082,904 | | |
Total | | | | | | | 40,888,808 | | |
Refunded/Escrowed 4.3% | |
City of Portsmouth
Unlimited General Obligation Bonds
Series 2006 Escrowed to Maturity (NPFGC)
07/01/16 | | | 5.000 | % | | | 340,000 | | | | 374,061 | | |
County of Arlington
Prerefunded 08/01/16 Unlimited General Obligation
Public Improvement Bonds
Series 2006
08/01/17 | | | 5.000 | % | | | 1,600,000 | | | | 1,765,952 | | |
County of Henrico
Prerefunded 12/01/18 Unlimited General Obligation
Public Improvement Bonds
Series 2008A
12/01/21 | | | 5.000 | % | | | 1,000,000 | | | | 1,176,130 | | |
County of Prince William
Prerefunded 09/01/16 Certificate of Participation
Prince William County Facilities
Series 2006A (AMBAC)
09/01/17 | | | 5.000 | % | | | 800,000 | | | | 885,800 | | |
09/01/21 | | | 5.000 | % | | | 1,625,000 | | | | 1,799,281 | | |
Newport News Economic Development Authority
Prerefunded 01/15/16 Revenue Bonds
Series 2005A
01/15/23 | | | 5.250 | % | | | 1,510,000 | | | | 1,635,511 | | |
Richmond Metropolitan Authority
Refunding Revenue Bonds
Series 1998 Escrowed to Maturity (NPFGC)
07/15/17 | | | 5.250 | % | | | 480,000 | | | | 522,005 | | |
Tobacco Settlement Financing Corp.
Prerefunded 06/01/15 Asset-Backed Revenue Bonds
Series 2005
06/01/26 | | | 5.500 | % | | | 1,555,000 | | | | 1,612,395 | | |
The accompanying Notes to Financial Statements are an integral part of this statement.
Annual Report 2014
9
Columbia Virginia Intermediate Municipal Bond Fund
Portfolio of Investments (continued)
April 30, 2014
Municipal Bonds (continued)
Issue
Description | | Coupon
Rate | | Principal
Amount ($) | | Value ($) | |
Virginia Resources Authority
Prerefunded Revenue Bonds
Series 2009B Escrowed to Maturity
11/01/18 | | | 4.000 | % | | | 130,000 | | | | 146,513 | | |
St. Moral
Series 2009B Escrowed to Maturity
11/01/18 | | | 4.000 | % | | | 35,000 | | | | 39,446 | | |
Total | | | | | | | 9,957,094 | | |
Retirement Communities 3.9% | |
Albermarle County Economic Development Authority
Revenue Bonds
Westminster-Canterbury of the Blue Ridge
Series 2012
01/01/32 | | | 4.625 | % | | | 2,000,000 | | | | 1,887,880 | | |
Fairfax County Economic Development Authority
Refunding Revenue Bonds
Retirement-Greenspring
Series 2006A
10/01/26 | | | 4.750 | % | | | 2,000,000 | | | | 2,050,340 | | |
Revenue Bonds
Goodwin House, Inc.
Series 2007
10/01/22 | | | 5.000 | % | | | 2,500,000 | | | | 2,649,600 | | |
Hanover County Economic Development Authority
Revenue Bonds
Covenant Woods
Series 2012-A
07/01/22 | | | 4.000 | % | | | 1,320,000 | | | | 1,269,985 | | |
Henrico County Economic Development Authority
Refunding Revenue Bonds
Westminster Canterbury Corp.
Series 2006
10/01/21 | | | 5.000 | % | | | 1,000,000 | | | | 1,021,380 | | |
Total | | | | | | | 8,879,185 | | |
Special Non Property Tax 6.5% | |
Greater Richmond Convention Center Authority
Refunding Revenue Bonds
Series 2005 (NPFGC)
06/15/18 | | | 5.000 | % | | | 3,800,000 | | | | 3,949,530 | | |
06/15/25 | | | 5.000 | % | | | 3,000,000 | | | | 3,144,600 | | |
Reynolds Crossing Community Development Authority
Special Assessment Bonds
Reynolds Crossing Project
Series 2007
03/01/21 | | | 5.100 | % | | | 518,000 | | | | 525,096 | | |
Shops at White Oak Village Community Development
Authority (The)
Special Assessment Bonds
Series 2007
03/01/17 | | | 5.300 | % | | | 1,292,000 | | | | 1,380,502 | | |
Municipal Bonds (continued)
Issue
Description | | Coupon
Rate | | Principal
Amount ($) | | Value ($) | |
Territory of Guam
Revenue Bonds
Series 2011A(b)
01/01/31 | | | 5.000 | % | | | 850,000 | | | | 883,966 | | |
Virgin Islands Public Finance Authority(b)
Revenue Bonds
Matching Fund Loan Notes
Series 2012-A
10/01/32 | | | 5.000 | % | | | 2,210,000 | | | | 2,246,200 | | |
Senior Lien-Matching Fund Loan Note
Series 2010A
10/01/25 | | | 5.000 | % | | | 2,450,000 | | | | 2,633,701 | | |
Total | | | | | | | 14,763,595 | | |
Special Property Tax 5.3% | |
Dullles Town Center Community Development Authority
Refunding Special Assessment Bonds
Dulles Town Center Project
Series 2012
03/01/23 | | | 4.000 | % | | | 1,000,000 | | | | 944,260 | | |
Fairfax County Economic Development Authority
Special Tax Bonds
Silver Line Phase I Project
Series 2011
04/01/19 | | | 5.000 | % | | | 3,000,000 | | | | 3,503,910 | | |
04/01/26 | | | 5.000 | % | | | 4,185,000 | | | | 4,664,057 | | |
Marquis Community Development Authority of York County(c)(d)
Tax Allocation Bonds
Series 2007C
09/01/41 | | | 0.000 | % | | | 3,164,000 | | | | 394,551 | | |
Marquis Community Development Authority of York County(d)
Tax Allocation Bonds
Series 2007B
09/01/41 | | | 5.625 | % | | | 2,084,000 | | | | 1,849,654 | | |
Virginia Gateway Community Development Authority
Refunding Special Assessment Bonds
Series 2012
03/01/25 | | | 5.000 | % | | | 690,000 | | | | 702,489 | | |
Total | | | | | | | 12,058,921 | | |
State Appropriated 0.9% | |
Virginia Public Building Authority
Revenue Bonds
Public Facility
Series 2006B
08/01/26 | | | 4.500 | % | | | 2,000,000 | | | | 2,071,320 | | |
Transportation 1.5% | |
Virginia Commonwealth Transportation Board
Revenue Bonds
Capital Projects
Series 2012
05/15/29 | | | 5.000 | % | | | 3,000,000 | | | | 3,416,670 | | |
The accompanying Notes to Financial Statements are an integral part of this statement.
Annual Report 2014
10
Columbia Virginia Intermediate Municipal Bond Fund
Portfolio of Investments (continued)
April 30, 2014
Municipal Bonds (continued)
Issue
Description | | Coupon
Rate | | Principal
Amount ($) | | Value ($) | |
Turnpike/Bridge/Toll Road 4.6% | |
Chesapeake Bay Bridge & Tunnel District
Refunding Revenue Bonds
General Resolution
Series 1998 (NPFGC)
07/01/25 | | | 5.500 | % | | | 4,000,000 | | | | 4,596,400 | | |
City of Chesapeake Expressway Toll Road
Revenue Bonds
Transportation System
Senior Series 2012A
07/15/23 | | | 5.000 | % | | | 1,025,000 | | | | 1,126,578 | | |
07/15/27 | | | 5.000 | % | | | 1,000,000 | | | | 1,054,850 | | |
Metropolitan Washington Airports Authority
Revenue Bonds
Capital Appreciation-2nd Senior Lien
Series 2009B (AGM)(c)
10/01/23 | | | 0.000 | % | | | 5,000,000 | | | | 3,467,050 | | |
Richmond Metropolitan Authority
Refunding Revenue Bonds
Series 1998 (NPFGC)
07/15/17 | | | 5.250 | % | | | 360,000 | | | | 379,609 | | |
Total | | | | | | | 10,624,487 | | |
Water & Sewer 7.2% | |
City of Newport News
Revenue Bonds
Series 2007 (AGM)
06/01/19 | | | 5.000 | % | | | 1,035,000 | | | | 1,158,651 | | |
City of Norfolk Water
Refunding Revenue Bonds
Series 2012
11/01/19 | | | 5.000 | % | | | 1,000,000 | | | | 1,184,340 | | |
City of Richmond
Revenue Bonds
Series 2007 (AGM)
01/15/21 | | | 4.500 | % | | | 1,000,000 | | | | 1,089,670 | | |
County of Spotsylvania
Revenue Bonds
Series 2007 (AGM)
06/01/19 | | | 5.000 | % | | | 1,030,000 | | | | 1,153,868 | | |
Municipal Bonds (continued)
Issue
Description | | Coupon
Rate | | Principal
Amount ($) | | Value ($) | |
Fairfax County Water Authority
Refunding Revenue Bonds
Subordinated Series 2005B
04/01/19 | | | 5.250 | % | | | 1,835,000 | | | | 2,187,063 | | |
Hampton Roads Sanitation District
Revenue Bonds
Series 2008
04/01/22 | | | 5.000 | % | | | 1,000,000 | | | | 1,139,900 | | |
04/01/24 | | | 5.000 | % | | | 3,000,000 | | | | 3,404,940 | | |
Series 2011
11/01/24 | | | 5.000 | % | | | 1,750,000 | | | | 1,994,510 | | |
11/01/25 | | | 5.000 | % | | | 1,380,000 | | | | 1,568,867 | | |
Upper Occoquan Sewage Authority
Revenue Bonds
Series 1995A (NPFGC)
07/01/20 | | | 5.150 | % | | | 1,295,000 | | | | 1,490,895 | | |
Total | | | | | | | 16,372,704 | | |
Total Municipal Bonds
(Cost: $211,022,259) | | | | | | | 225,335,602 | | |
Money Market Funds 0.5%
| | | Shares | | Value ($) | |
JPMorgan Tax-Free Money Market Fund,
0.010%(e) | | | 1,140,293 | | | | 1,140,293 | | |
Total Money Market Funds
(Cost: $1,140,293) | | | | | 1,140,293 | | |
Total Investments
(Cost: $212,162,552) | | | | | 226,475,895 | | |
Other Assets & Liabilities, Net | | | | | 2,277,694 | | |
Net Assets | | | | | 228,753,589 | | |
Notes to Portfolio of Investments
(a) Variable rate security.
(b) Municipal obligations include debt obligations issued by or on behalf of territories, possessions, or sovereign nations within the territorial boundaries of the United States. At April 30, 2014, the value of these securities amounted to $5,763,867 or 2.52% of net assets.
(c) Zero coupon bond.
The accompanying Notes to Financial Statements are an integral part of this statement.
Annual Report 2014
11
Columbia Virginia Intermediate Municipal Bond Fund
Portfolio of Investments (continued)
April 30, 2014
Notes to Portfolio of Investments (continued)
(d) Identifies issues considered by the Investment Manager to be illiquid as to their marketability. The aggregate value of such securities at April 30, 2014 was $2,244,205, representing 0.98% of net assets. Information concerning such security holdings at April 30, 2014 is as follows:
Security Description | | Acquisition Dates | | Cost ($) | |
Marquis Community Development Authority of York County
Tax Allocation Bonds
Series 2007B
09/01/41 5.625% | | 11/30/07 | | | 2,084,000 | | |
Marquis Community Development Authority of York County
Tax Allocation Bonds
Series 2007C
09/01/41 0.000% | | 11/30/07 | | | 840,892 | | |
(e) The rate shown is the seven-day current annualized yield at April 30, 2014.
Abbreviation Legend
AGM Assured Guaranty Municipal Corporation
AMBAC Ambac Assurance Corporation
NPFGC National Public Finance Guarantee Corporation
Fair Value Measurements
Generally accepted accounting principles (GAAP) require disclosure regarding the inputs and valuation techniques used to measure fair value and any changes in valuation inputs or techniques. In addition, investments shall be disclosed by major category.
The Fund categorizes its fair value measurements according to a three-level hierarchy that maximizes the use of observable inputs and minimizes the use of unobservable inputs by prioritizing that the most observable input be used when available. Observable inputs are those that market participants would use in pricing an investment based on market data obtained from sources independent of the reporting entity. Unobservable inputs are those that reflect the Fund's assumptions about the information market participants would use in pricing an investment. An investment's level within the fair value hierarchy is based on the lowest level of any input that is deemed significant to the asset or liability's fair value measurement. The input levels are not necessarily an indication of the risk or liquidity associated with investments at that level. For example, certain U.S. government securities are generally high quality and liquid, however, they are reflected as Level 2 because the inputs used to determine fair value may not always be quoted prices in an active market.
Fair value inputs are summarized in the three broad levels listed below:
> Level 1 — Valuations based on quoted prices for investments in active markets that the Fund has the ability to access at the measurement date (including NAV for open-end mutual funds). Valuation adjustments are not applied to Level 1 investments.
> Level 2 — Valuations based on other significant observable inputs (including quoted prices for similar securities, interest rates, prepayment speeds, credit risks, etc.).
> Level 3 — Valuations based on significant unobservable inputs (including the Fund's own assumptions and judgment in determining the fair value of investments).
Inputs that are used in determining fair value of an investment may include price information, credit data, volatility statistics, and other factors. These inputs can be either observable or unobservable. The availability of observable inputs can vary between investments, and is affected by various factors such as the type of investment, and the volume and level of activity for that investment or similar investments in the marketplace. The inputs will be considered by the Investment Manager, along with any other relevant factors in the calculation of an investment's fair value. The Fund uses prices and inputs that are current as of the measurement date, which may include periods of market dislocations. During these periods, the availability of prices and inputs may be reduced for many investments. This condition could cause an investment to be reclassified between the various levels within the hierarchy.
Investments falling into the Level 3 category are primarily supported by quoted prices from brokers and dealers participating in the market for those investments. However, these may be classified as Level 3 investments due to lack of market transparency and corroboration to support these quoted prices. Additionally, valuation models may be used as the pricing source for any remaining investments classified as Level 3. These models may rely on one or more significant unobservable inputs and/or significant assumptions by the Investment Manager. Inputs used in valuations may include, but are not limited to, financial statement analysis, capital account balances, discount rates and estimated cash flows, and comparable company data.
The accompanying Notes to Financial Statements are an integral part of this statement.
Annual Report 2014
12
Columbia Virginia Intermediate Municipal Bond Fund
Portfolio of Investments (continued)
April 30, 2014
Fair Value Measurements (continued)
Under the direction of the Fund's Board of Trustees (the Board), the Investment Manager's Valuation Committee (the Committee) is responsible for overseeing the valuation procedures approved by the Board. The Committee consists of voting and non-voting members from various groups within the Investment Manager's organization, including operations and accounting, trading and investments, compliance, risk management and legal.
The Committee meets at least monthly to review and approve valuation matters, which may include a description of specific valuation determinations, data regarding pricing information received from approved pricing vendors and brokers and the results of Board-approved valuation control policies and procedures (the Policies). The Policies address, among other things, instances when market quotations are or are not readily available, including recommendations of third party pricing vendors and a determination of appropriate pricing methodologies; events that require specific valuation determinations and assessment of fair value techniques; securities with a potential for stale pricing, including those that are illiquid, restricted, or in default; and the effectiveness of third party pricing vendors, including periodic reviews of vendors. The Committee meets more frequently, as needed, to discuss additional valuation matters, which may include the need to review back-testing results, review time-sensitive information or approve related valuation actions. The Committee reports to the Board, with members of the Committee meeting with the Board at each of its regularly scheduled meetings to discuss valuation matters and actions during the period, similar to those described earlier.
For investments categorized as Level 3, the Committee monitors information similar to that described above, which may include: (i) data specific to the issuer or comparable issuers, (ii) general market or specific sector news and (iii) quoted prices and specific or similar security transactions. The Committee considers this data and any changes from prior periods in order to assess the reasonableness of observable and unobservable inputs, any assumptions or internal models used to value those securities and changes in fair value. This data is also used to corroborate, when available, information received from approved pricing vendors and brokers. Various factors impact the frequency of monitoring this information (which may occur as often as daily). However, the Committee may determine that changes to inputs, assumptions and models are not required as a result of the monitoring procedures performed.
The following table is a summary of the inputs used to value the Fund's investments at April 30, 2014:
Description | | Level 1
Quoted Prices in Active
Markets for Identical
Assets ($) | | Level 2
Other Significant
Observable Inputs ($) | | Level 3
Significant
Unobservable Inputs ($) | | Total ($) | |
Bonds | |
Municipal Bonds | | | — | | | | 225,335,602 | | | | — | | | | 225,335,602 | | |
Total Bonds | | | — | | | | 225,335,602 | | | | — | | | | 225,335,602 | | |
Mutual Funds | |
Money Market Funds | | | 1,140,293 | | | | — | | | | — | | | | 1,140,293 | | |
Total Mutual Funds | | | 1,140,293 | | | | — | | | | — | | | | 1,140,293 | | |
Total | | | 1,140,293 | | | | 225,335,602 | | | | — | | | | 226,475,895 | | |
See the Portfolio of Investments for all investment classifications not indicated in the table.
The Fund's assets assigned to the Level 2 input category are generally valued using the market approach, in which a security's value is determined through reference to prices and information from market transactions for similar or identical assets.
There were no transfers of financial assets between levels during the period.
The accompanying Notes to Financial Statements are an integral part of this statement.
Annual Report 2014
13
Columbia Virginia Intermediate Municipal Bond Fund
Statement of Assets and Liabilities
April 30, 2014
Assets | |
Investments, at value | |
(identified cost $212,162,552) | | $ | 226,475,895 | | |
Receivable for: | |
Investments sold | | | 577,686 | | |
Capital shares sold | | | 357,701 | | |
Interest | | | 2,421,682 | | |
Expense reimbursement due from Investment Manager | | | 968 | | |
Prepaid expenses | | | 752 | | |
Total assets | | | 229,834,684 | | |
Liabilities | |
Payable for: | |
Capital shares purchased | | | 316,477 | | |
Dividend distributions to shareholders | | | 575,527 | | |
Investment management fees | | | 2,505 | | |
Distribution and/or service fees | | | 433 | | |
Transfer agent fees | | | 38,107 | | |
Administration fees | | | 438 | | |
Compensation of board members | | | 115,014 | | |
Other expenses | | | 32,594 | | |
Total liabilities | | | 1,081,095 | | |
Net assets applicable to outstanding capital stock | | $ | 228,753,589 | | |
Represented by | |
Paid-in capital | | $ | 213,882,191 | | |
Undistributed net investment income | | | 822,052 | | |
Accumulated net realized loss | | | (263,997 | ) | |
Unrealized appreciation (depreciation) on: | |
Investments | | | 14,313,343 | | |
Total — representing net assets applicable to outstanding capital stock | | $ | 228,753,589 | | |
The accompanying Notes to Financial Statements are an integral part of this statement.
Annual Report 2014
14
Columbia Virginia Intermediate Municipal Bond Fund
Statement of Assets and Liabilities (continued)
April 30, 2014
Class A | |
Net assets | | $ | 47,112,870 | | |
Shares outstanding | | | 4,246,542 | | |
Net asset value per share | | $ | 11.09 | | |
Maximum offering price per share(a) | | $ | 11.46 | | |
Class B | |
Net assets | | $ | 17,831 | | |
Shares outstanding | | | 1,607 | | |
Net asset value per share | | $ | 11.10 | | |
Class C | |
Net assets | | $ | 4,043,805 | | |
Shares outstanding | | | 364,357 | | |
Net asset value per share | | $ | 11.10 | | |
Class R4 | |
Net assets | | $ | 76,963 | | |
Shares outstanding | | | 6,945 | | |
Net asset value per share | | $ | 11.08 | | |
Class Z | |
Net assets | | $ | 177,502,120 | | |
Shares outstanding | | | 16,001,978 | | |
Net asset value per share | | $ | 11.09 | | |
(a) The maximum offering price per share is calculated by dividing the net asset value per share by 1.0 minus the maximum sales charge of 3.25%.
The accompanying Notes to Financial Statements are an integral part of this statement.
Annual Report 2014
15
Columbia Virginia Intermediate Municipal Bond Fund
Statement of Operations
Year ended April 30, 2014
Net investment income | |
Income: | |
Dividends | | $ | 341 | | |
Interest | | | 10,099,375 | | |
Total income | | | 10,099,716 | | |
Expenses: | |
Investment management fees | | | 1,104,819 | | |
Distribution and/or service fees | |
Class A | | | 123,529 | | |
Class B | | | 234 | | |
Class C | | | 44,975 | | |
Transfer agent fees | |
Class A | | | 94,218 | | |
Class B | | | 45 | | |
Class C | | | 8,589 | | |
Class R4 | | | 27 | | |
Class Z | | | 425,414 | | |
Administration fees | | | 191,743 | | |
Compensation of board members | | | 29,510 | | |
Custodian fees | | | 2,968 | | |
Printing and postage fees | | | 23,153 | | |
Registration fees | | | 30,395 | | |
Professional fees | | | 36,296 | | |
Other | | | 31,523 | | |
Total expenses | | | 2,147,438 | | |
Fees waived or expenses reimbursed by Investment Manager and its affiliates | | | (431,935 | ) | |
Expense reductions | | | (20 | ) | |
Total net expenses | | | 1,715,483 | | |
Net investment income | | | 8,384,233 | | |
Realized and unrealized gain (loss) — net | |
Net realized gain (loss) on: | |
Investments | | | (263,997 | ) | |
Net realized loss | | | (263,997 | ) | |
Net change in unrealized appreciation (depreciation) on: | |
Investments | | | (12,235,891 | ) | |
Net change in unrealized appreciation (depreciation) | | | (12,235,891 | ) | |
Net realized and unrealized loss | | | (12,499,888 | ) | |
Net decrease in net assets from operations | | $ | (4,115,655 | ) | |
The accompanying Notes to Financial Statements are an integral part of this statement.
Annual Report 2014
16
Columbia Virginia Intermediate Municipal Bond Fund
Statement of Changes in Net Assets
| | | Year ended
April 30,
2014 | | Year ended
April 30,
2013(a) | |
Operations | |
Net investment income | | $ | 8,384,233 | | | $ | 10,277,615 | | |
Net realized gain (loss) | | | (263,997 | ) | | | 2,271,676 | | |
Net change in unrealized appreciation (depreciation) | | | (12,235,891 | ) | | | 231,117 | | |
Net increase (decrease) in net assets resulting from operations | | | (4,115,655 | ) | | | 12,780,408 | | |
Distributions to shareholders | |
Net investment income | |
Class A | | | (1,412,916 | ) | | | (1,458,897 | ) | |
Class B | | | (487 | ) | | | (2,282 | ) | |
Class C | | | (94,734 | ) | | | (100,032 | ) | |
Class R4 | | | (499 | ) | | | (8 | ) | |
Class Z | | | (6,879,789 | ) | | | (8,716,396 | ) | |
Net realized gains | |
Class A | | | (296,837 | ) | | | (81,116 | ) | |
Class B | | | (117 | ) | | | (174 | ) | |
Class C | | | (26,739 | ) | | | (7,808 | ) | |
Class R4 | | | (15 | ) | | | — | | |
Class Z | | | (1,201,281 | ) | | | (446,678 | ) | |
Total distributions to shareholders | | | (9,913,414 | ) | | | (10,813,391 | ) | |
Increase (decrease) in net assets from capital stock activity | | | (98,997,385 | ) | | | (27,903,080 | ) | |
Total decrease in net assets | | | (113,026,454 | ) | | | (25,936,063 | ) | |
Net assets at beginning of year | | | 341,780,043 | | | | 367,716,106 | | |
Net assets at end of year | | $ | 228,753,589 | | | $ | 341,780,043 | | |
Undistributed net investment income | | $ | 822,052 | | | $ | 851,335 | | |
(a) Class R4 shares are for the period from March 19, 2013 (commencement of operations) to April 30, 2013.
The accompanying Notes to Financial Statements are an integral part of this statement.
Annual Report 2014
17
Columbia Virginia Intermediate Municipal Bond Fund
Statement of Changes in Net Assets (continued)
| | | Year ended April 30,
2014 | | Year ended April 30,
2013(a) | |
| | | Shares | | Dollars($) | | Shares | | Dollars($) | |
Capital stock activity | |
Class A shares | |
Subscriptions(b) | | | 631,769 | | | | 6,980,196 | | | | 536,097 | | | | 6,175,085 | | |
Distributions reinvested | | | 74,024 | | | | 814,424 | | | | 54,993 | | | | 634,599 | | |
Redemptions | | | (1,226,704 | ) | | | (13,521,020 | ) | | | (531,974 | ) | | | (6,125,809 | ) | |
Net increase (decrease) | | | (520,911 | ) | | | (5,726,400 | ) | | | 59,116 | | | | 683,875 | | |
Class B shares | |
Subscriptions | | | 4 | | | | 43 | | | | 119 | | | | 1,376 | | |
Distributions reinvested | | | 49 | | | | 544 | | | | 89 | | | | 1,027 | | |
Redemptions(b) | | | (2,550 | ) | | | (28,434 | ) | | | (10,159 | ) | | | (116,758 | ) | |
Net decrease | | | (2,497 | ) | | | (27,847 | ) | | | (9,951 | ) | | | (114,355 | ) | |
Class C shares | |
Subscriptions | | | 43,250 | | | | 479,174 | | | | 117,832 | | | | 1,361,039 | | |
Distributions reinvested | | | 7,690 | | | | 84,594 | | | | 6,125 | | | | 70,724 | | |
Redemptions | | | (171,876 | ) | | | (1,897,990 | ) | | | (47,576 | ) | | | (549,358 | ) | |
Net increase (decrease) | | | (120,936 | ) | | | (1,334,222 | ) | | | 76,381 | | | | 882,405 | | |
Class R4 shares | |
Subscriptions | | | 6,690 | | | | 73,716 | | | | 218 | | | | 2,500 | | |
Distributions reinvested | | | 36 | | | | 401 | | | | 1 | | | | 6 | | |
Net increase | | | 6,726 | | | | 74,117 | | | | 219 | | | | 2,506 | | |
Class Z shares | |
Subscriptions | | | 1,434,444 | | | | 15,949,872 | | | | 2,244,008 | | | | 25,865,539 | | |
Distributions reinvested | | | 53,225 | | | | 585,778 | | | | 46,836 | | | | 540,498 | | |
Redemptions | | | (9,855,070 | ) | | | (108,518,683 | ) | | | (4,839,666 | ) | | | (55,763,548 | ) | |
Net decrease | | | (8,367,401 | ) | | | (91,983,033 | ) | | | (2,548,822 | ) | | | (29,357,511 | ) | |
Total net decrease | | | (9,005,019 | ) | | | (98,997,385 | ) | | | (2,423,057 | ) | | | (27,903,080 | ) | |
(a) Class R4 shares are for the period from March 19, 2013 (commencement of operations) to April 30, 2013.
(b) Includes conversions of Class B shares to Class A shares, if any.
The accompanying Notes to Financial Statements are an integral part of this statement.
Annual Report 2014
18
Columbia Virginia Intermediate Municipal Bond Fund
The following tables are intended to help you understand the Fund's financial performance. Certain information reflects financial results for a single share of a class held for the periods shown. Per share net investment income (loss) amounts are calculated based on average shares outstanding during the period. Total return assumes reinvestment of all dividends and distributions, if any. Total return does not reflect payment of sales charges, if any, and is not annualized for periods of less than one year.
| | | Year ended April 30, | | Year ended March 31, | |
Class A | | 2014 | | 2013 | | 2012(a) | | 2012 | | 2011 | | 2010 | |
Per share data | |
Net asset value, beginning of period | | $ | 11.54 | | | $ | 11.47 | | | $ | 11.38 | | | $ | 10.86 | | | $ | 10.94 | | | $ | 10.57 | | |
Income from investment operations: | |
Net investment income | | | 0.32 | | | | 0.31 | | | | 0.03 | | | | 0.33 | | | | 0.34 | | | | 0.35 | | |
Net realized and unrealized gain (loss) | | | (0.39 | ) | | | 0.09 | | | | 0.09 | | | | 0.52 | | | | (0.08 | ) | | | 0.37 | | |
Total from investment operations | | | (0.07 | ) | | | 0.40 | | | | 0.12 | | | | 0.85 | | | | 0.26 | | | | 0.72 | | |
Less distributions to shareholders: | |
Net investment income | | | (0.31 | ) | | | (0.31 | ) | | | (0.03 | ) | | | (0.33 | ) | | | (0.34 | ) | | | (0.35 | ) | |
Net realized gains | | | (0.07 | ) | | | (0.02 | ) | | | — | | | | — | | | | — | | | | — | | |
Total distributions to shareholders | | | (0.38 | ) | | | (0.33 | ) | | | (0.03 | ) | | | (0.33 | ) | | | (0.34 | ) | | | (0.35 | ) | |
Net asset value, end of period | | $ | 11.09 | | | $ | 11.54 | | | $ | 11.47 | | | $ | 11.38 | | | $ | 10.86 | | | $ | 10.94 | | |
Total return | | | (0.51 | %) | | | 3.49 | % | | | 1.06 | % | | | 7.87 | % | | | 2.40 | % | | | 6.83 | % | |
Ratios to average net assets(b) | |
Total gross expenses | | | 0.97 | % | | | 0.95 | % | | | 0.94 | %(c) | | | 0.98 | % | | | 0.92 | % | | | 0.87 | % | |
Total net expenses(d) | | | 0.81 | %(e) | | | 0.80 | %(e) | | | 0.79 | %(c) | | | 0.79 | %(e) | | | 0.80 | %(e) | | | 0.78 | %(e) | |
Net investment income | | | 2.86 | % | | | 2.68 | % | | | 3.04 | %(c) | | | 2.92 | % | | | 3.11 | % | | | 3.17 | % | |
Supplemental data | |
Net assets, end of period (in thousands) | | $ | 47,113 | | | $ | 55,003 | | | $ | 54,025 | | | $ | 53,775 | | | $ | 51,196 | | | $ | 51,857 | | |
Portfolio turnover | | | 2 | % | | | 11 | % | | | 0 | % | | | 8 | % | | | 14 | % | | | 12 | % | |
Notes to Financial Highlights
(a) For the period from April 1, 2012 to April 30, 2012. During the period, the Fund's fiscal year end was changed from March 31 to April 30.
(b) In addition to the fees and expenses which the Fund bears directly, the Fund indirectly bears a pro rata share of the fees and expenses of the acquired funds in which it invests. Such indirect expenses are not included in the reported expense ratios.
(c) Annualized.
(d) Total net expenses include the impact of certain waivers/reimbursements made by the Investment Manager and certain of its affiliates, if applicable.
(e) The benefits derived from expense reductions had an impact of less than 0.01%.
The accompanying Notes to Financial Statements are an integral part of this statement.
Annual Report 2014
19
Columbia Virginia Intermediate Municipal Bond Fund
Financial Highlights (continued)
| | | Year ended April 30, | | Year ended March 31, | |
Class B | | 2014 | | 2013 | | 2012(a) | | 2012 | | 2011 | | 2010 | |
Per share data | |
Net asset value, beginning of period | | $ | 11.54 | | | $ | 11.48 | | | $ | 11.38 | | | $ | 10.86 | | | $ | 10.95 | | | $ | 10.57 | | |
Income from investment operations: | |
Net investment income | | | 0.23 | | | | 0.22 | | | | 0.02 | | | | 0.25 | | | | 0.26 | | | | 0.27 | | |
Net realized and unrealized gain (loss) | | | (0.37 | ) | | | 0.08 | | | | 0.10 | | | | 0.51 | | | | (0.09 | ) | | | 0.37 | | |
Total from investment operations | | | (0.14 | ) | | | 0.30 | | | | 0.12 | | | | 0.76 | | | | 0.17 | | | | 0.64 | | |
Less distributions to shareholders: | |
Net investment income | | | (0.23 | ) | | | (0.22 | ) | | | (0.02 | ) | | | (0.24 | ) | | | (0.26 | ) | | | (0.26 | ) | |
Net realized gains | | | (0.07 | ) | | | (0.02 | ) | | | — | | | | — | | | | — | | | | — | | |
Total distributions to shareholders | | | (0.30 | ) | | | (0.24 | ) | | | (0.02 | ) | | | (0.24 | ) | | | (0.26 | ) | | | (0.26 | ) | |
Net asset value, end of period | | $ | 11.10 | | | $ | 11.54 | | | $ | 11.48 | | | $ | 11.38 | | | $ | 10.86 | | | $ | 10.95 | | |
Total return | | | (1.16 | %) | | | 2.62 | % | | | 1.08 | % | | | 7.06 | % | | | 1.55 | % | | | 6.14 | % | |
Ratios to average net assets(b) | |
Total gross expenses | | | 1.71 | % | | | 1.70 | % | | | 1.69 | %(c) | | | 1.81 | % | | | 1.67 | % | | | 1.62 | % | |
Total net expenses(d) | | | 1.56 | %(e) | | | 1.55 | %(e) | | | 1.54 | %(c) | | | 1.54 | %(e) | | | 1.55 | %(e) | | | 1.53 | %(e) | |
Net investment income | | | 2.08 | % | | | 1.92 | % | | | 2.29 | %(c) | | | 2.19 | % | | | 2.34 | % | | | 2.44 | % | |
Supplemental data | |
Net assets, end of period (in thousands) | | $ | 18 | | | $ | 47 | | | $ | 161 | | | $ | 182 | | | $ | 392 | | | $ | 1,575 | | |
Portfolio turnover | | | 2 | % | | | 11 | % | | | 0 | % | | | 8 | % | | | 14 | % | | | 12 | % | |
Notes to Financial Highlights
(a) For the period from April 1, 2012 to April 30, 2012. During the period, the Fund's fiscal year end was changed from March 31 to April 30.
(b) In addition to the fees and expenses which the Fund bears directly, the Fund indirectly bears a pro rata share of the fees and expenses of the acquired funds in which it invests. Such indirect expenses are not included in the reported expense ratios.
(c) Annualized.
(d) Total net expenses include the impact of certain waivers/reimbursements made by the Investment Manager and certain of its affiliates, if applicable.
(e) The benefits derived from expense reductions had an impact of less than 0.01%.
The accompanying Notes to Financial Statements are an integral part of this statement.
Annual Report 2014
20
Columbia Virginia Intermediate Municipal Bond Fund
Financial Highlights (continued)
| | | Year ended April 30, | | Year ended March 31, | |
Class C | | 2014 | | 2013 | | 2012(a) | | 2012 | | 2011 | | 2010 | |
Per share data | |
Net asset value, beginning of period | | $ | 11.54 | | | $ | 11.48 | | | $ | 11.38 | | | $ | 10.86 | | | $ | 10.95 | | | $ | 10.57 | | |
Income from investment operations: | |
Net investment income | | | 0.23 | | | | 0.22 | | | | 0.02 | | | | 0.24 | | | | 0.26 | | | | 0.26 | | |
Net realized and unrealized gain (loss) | | | (0.37 | ) | | | 0.08 | | | | 0.10 | | | | 0.52 | | | | (0.09 | ) | | | 0.38 | | |
Total from investment operations | | | (0.14 | ) | | | 0.30 | | | | 0.12 | | | | 0.76 | | | | 0.17 | | | | 0.64 | | |
Less distributions to shareholders: | |
Net investment income | | | (0.23 | ) | | | (0.22 | ) | | | (0.02 | ) | | | (0.24 | ) | | | (0.26 | ) | | | (0.26 | ) | |
Net realized gains | | | (0.07 | ) | | | (0.02 | ) | | | — | | | | — | | | | — | | | | — | | |
Total distributions to shareholders | | | (0.30 | ) | | | (0.24 | ) | | | (0.02 | ) | | | (0.24 | ) | | | (0.26 | ) | | | (0.26 | ) | |
Net asset value, end of period | | $ | 11.10 | | | $ | 11.54 | | | $ | 11.48 | | | $ | 11.38 | | | $ | 10.86 | | | $ | 10.95 | | |
Total return | | | (1.16 | %) | | | 2.63 | % | | | 1.08 | % | | | 7.06 | % | | | 1.54 | % | | | 6.13 | % | |
Ratios to average net assets(b) | |
Total gross expenses | | | 1.72 | % | | | 1.70 | % | | | 1.70 | %(c) | | | 1.73 | % | | | 1.67 | % | | | 1.62 | % | |
Total net expenses(d) | | | 1.56 | %(e) | | | 1.55 | %(e) | | | 1.54 | %(c) | | | 1.54 | %(e) | | | 1.55 | %(e) | | | 1.53 | %(e) | |
Net investment income | | | 2.11 | % | | | 1.93 | % | | | 2.29 | %(c) | | | 2.15 | % | | | 2.35 | % | | | 2.41 | % | |
Supplemental data | |
Net assets, end of period (in thousands) | | $ | 4,044 | | | $ | 5,601 | | | $ | 4,694 | | | $ | 4,739 | | | $ | 3,544 | | | $ | 2,499 | | |
Portfolio turnover | | | 2 | % | | | 11 | % | | | 0 | % | | | 8 | % | | | 14 | % | | | 12 | % | |
Notes to Financial Highlights
(a) For the period from April 1, 2012 to April 30, 2012. During the period, the Fund's fiscal year end was changed from March 31 to April 30.
(b) In addition to the fees and expenses which the Fund bears directly, the Fund indirectly bears a pro rata share of the fees and expenses of the acquired funds in which it invests. Such indirect expenses are not included in the reported expense ratios.
(c) Annualized.
(d) Total net expenses include the impact of certain waivers/reimbursements made by the Investment Manager and certain of its affiliates, if applicable.
(e) The benefits derived from expense reductions had an impact of less than 0.01%.
The accompanying Notes to Financial Statements are an integral part of this statement.
Annual Report 2014
21
Columbia Virginia Intermediate Municipal Bond Fund
Financial Highlights (continued)
| | | Year ended April 30, | |
Class R4 | | 2014 | | 2013(a) | |
Per share data | |
Net asset value, beginning of period | | $ | 11.52 | | | $ | 11.43 | | |
Income from investment operations: | |
Net investment income | | | 0.35 | | | | 0.04 | | |
Net realized and unrealized gain (loss) | | | (0.38 | ) | | | 0.09 | | |
Total from investment operations | | | (0.03 | ) | | | 0.13 | | |
Less distributions to shareholders: | |
Net investment income | | | (0.34 | ) | | | (0.04 | ) | |
Net realized gains | | | (0.07 | ) | | | — | | |
Total distributions to shareholders | | | (0.41 | ) | | | (0.04 | ) | |
Net asset value, end of period | | $ | 11.08 | | | $ | 11.52 | | |
Total return | | | (0.19 | %) | | | 1.12 | % | |
Ratios to average net assets(b) | |
Total gross expenses | | | 0.72 | % | | | 0.56 | %(c) | |
Total net expenses(d) | | | 0.56 | %(e) | | | 0.52 | %(c) | |
Net investment income | | | 3.18 | % | | | 2.98 | %(c) | |
Supplemental data | |
Net assets, end of period (in thousands) | | $ | 77 | | | $ | 3 | | |
Portfolio turnover | | | 2 | % | | | 11 | % | |
Notes to Financial Highlights
(a) For the period from March 19, 2013 (commencement of operations) to April 30, 2013.
(b) In addition to the fees and expenses which the Fund bears directly, the Fund indirectly bears a pro rata share of the fees and expenses of the acquired funds in which it invests. Such indirect expenses are not included in the reported expense ratios.
(c) Annualized.
(d) Total net expenses include the impact of certain waivers/reimbursements made by the Investment Manager and certain of its affiliates, if applicable.
(e) The benefits derived from expense reductions had an impact of less than 0.01%.
The accompanying Notes to Financial Statements are an integral part of this statement.
Annual Report 2014
22
Columbia Virginia Intermediate Municipal Bond Fund
Financial Highlights (continued)
| | | Year ended April 30, | | Year ended March 31, | |
Class Z | | 2014 | | 2013 | | 2012(a) | | 2012 | | 2011 | | 2010 | |
Per share data | |
Net asset value, beginning of period | | $ | 11.54 | | | $ | 11.47 | | | $ | 11.38 | | | $ | 10.85 | | | $ | 10.94 | | | $ | 10.57 | | |
Income from investment operations: | |
Net investment income | | | 0.34 | | | | 0.34 | | | | 0.03 | | | | 0.35 | | | | 0.37 | | | | 0.37 | | |
Net realized and unrealized gain (loss) | | | (0.38 | ) | | | 0.08 | | | | 0.09 | | | | 0.53 | | | | (0.09 | ) | | | 0.37 | | |
Total from investment operations | | | (0.04 | ) | | | 0.42 | | | | 0.12 | | | | 0.88 | | | | 0.28 | | | | 0.74 | | |
Less distributions to shareholders: | |
Net investment income | | | (0.34 | ) | | | (0.33 | ) | | | (0.03 | ) | | | (0.35 | ) | | | (0.37 | ) | | | (0.37 | ) | |
Net realized gains | | | (0.07 | ) | | | (0.02 | ) | | | — | | | | — | | | | — | | | | — | | |
Total distributions to shareholders | | | (0.41 | ) | | | (0.35 | ) | | | (0.03 | ) | | | (0.35 | ) | | | (0.37 | ) | | | (0.37 | ) | |
Net asset value, end of period | | $ | 11.09 | | | $ | 11.54 | | | $ | 11.47 | | | $ | 11.38 | | | $ | 10.85 | | | $ | 10.94 | | |
Total return | | | (0.26 | %) | | | 3.75 | % | | | 1.08 | % | | | 8.23 | % | | | 2.56 | % | | | 7.10 | % | |
Ratios to average net assets(b) | |
Total gross expenses | | | 0.72 | % | | | 0.70 | % | | | 0.69 | %(c) | | | 0.73 | % | | | 0.67 | % | | | 0.62 | % | |
Total net expenses(d) | | | 0.56 | %(e) | | | 0.55 | %(e) | | | 0.54 | %(c) | | | 0.54 | %(e) | | | 0.55 | %(e) | | | 0.53 | %(e) | |
Net investment income | | | 3.09 | % | | | 2.93 | % | | | 3.29 | %(c) | | | 3.16 | % | | | 3.36 | % | | | 3.42 | % | |
Supplemental data | |
Net assets, end of period (in thousands) | | $ | 177,502 | | | $ | 281,126 | | | $ | 308,836 | | | $ | 306,166 | | | $ | 264,505 | | | $ | 278,479 | | |
Portfolio turnover | | | 2 | % | | | 11 | % | | | 0 | % | | | 8 | % | | | 14 | % | | | 12 | % | |
Notes to Financial Highlights
(a) For the period from April 1, 2012 to April 30, 2012. During the period, the Fund's fiscal year end was changed from March 31 to April 30.
(b) In addition to the fees and expenses which the Fund bears directly, the Fund indirectly bears a pro rata share of the fees and expenses of the acquired funds in which it invests. Such indirect expenses are not included in the reported expense ratios.
(c) Annualized.
(d) Total net expenses include the impact of certain waivers/reimbursements made by the Investment Manager and certain of its affiliates, if applicable.
(e) The benefits derived from expense reductions had an impact of less than 0.01%.
The accompanying Notes to Financial Statements are an integral part of this statement.
Annual Report 2014
23
Columbia Virginia Intermediate Municipal Bond Fund
Notes to Financial Statements
April 30, 2014
Note 1. Organization
Columbia Virginia Intermediate Municipal Bond Fund (the Fund), a series of Columbia Funds Series Trust (the Trust), is a diversified fund. The Trust is registered under the Investment Company Act of 1940, as amended (the 1940 Act), as an open-end management investment company organized as a Delaware statutory trust.
Fund Shares
The Trust may issue an unlimited number of shares (without par value). The Fund offers Class A, Class B, Class C, Class R4 and Class Z shares. Although all share classes generally have identical voting, dividend and liquidation rights, each share class votes separately when required by law. Different share classes pay different distribution amounts to the extent the expenses of such share classes differ, and distributions in liquidation will be proportional to the net asset value of each share class. Each share class has its own expense structure and sales charges, as applicable.
Class A shares are subject to a maximum front-end sales charge of 3.25% based on the initial investment amount. Class A shares purchased without an initial sales charge in accounts aggregating $1 million to $50 million at the time of purchase are subject to a contingent deferred sales charge (CDSC) if the shares are sold within 18 months of purchase, charged as follows: 1.00% CDSC if redeemed within 12 months of purchase, and 0.50% CDSC if redeemed more than 12, but less than 18, months after purchase.
Class B shares may be subject to a maximum CDSC of 3.00% based upon the holding period after purchase. Class B shares will generally convert to Class A shares eight years after purchase. The Fund no longer accepts investments by new or existing investors in the Fund's Class B shares, except in connection with the reinvestment of any dividend and/or capital gain distributions in Class B shares of the Fund and exchanges by existing Class B shareholders of certain other funds within the Columbia Family of Funds.
Class C shares are subject to a 1.00% CDSC on shares redeemed within one year of purchase.
Class R4 shares are not subject to sales charges and are generally available only to omnibus retirement plans and certain other eligible investors.
Class Z shares are not subject to sales charges and are available only to certain eligible investors, which are subject to different investment minimums.
Note 2. Summary of Significant Accounting Policies
Use of Estimates
The preparation of financial statements in accordance with U.S. generally accepted accounting principles (GAAP) requires management to make certain estimates and assumptions that affect the reported amounts of assets and liabilities, the disclosure of contingent assets and liabilities at the date of the financial statements and the reported amounts of revenue and expenses during the reporting period. Actual results could differ from those estimates.
The following is a summary of significant accounting policies consistently followed by the Fund in the preparation of its financial statements.
Security Valuation
Debt securities generally are valued by pricing services approved by the Board of Trustees (the Board) based upon market transactions for normal, institutional-size trading units of similar securities. The services may use various pricing techniques which take into account appropriate factors such as yield, quality, coupon rate, maturity, type of issue, trading characteristics and other data, as well as broker quotes. Debt securities for which quotations are readily available may also be valued based upon an over-the-counter or exchange bid quotation.
Investments in open-end investment companies, including money market funds, are valued at net asset value.
Investments for which market quotations are not readily available, or that have quotations which management believes are not reliable, are valued at fair value as determined in good faith under consistently applied procedures established by and under the general supervision of the Board. If a security or class of securities (such as foreign securities) is valued at fair value, such value is likely to be different from the last quoted market price for the security.
The determination of fair value often requires significant judgment. To determine fair value, management may use assumptions including but not limited to future cash flows and estimated risk premiums. Multiple inputs from various sources may be used to determine fair value.
Security Transactions
Security transactions are accounted for on the trade date. Cost is determined and gains (losses) are based upon the specific identification method for both financial statement and federal income tax purposes.
Annual Report 2014
24
Columbia Virginia Intermediate Municipal Bond Fund
Notes to Financial Statements (continued)
April 30, 2014
Income Recognition
Interest income is recorded on an accrual basis. Market premiums and discounts, including original issue discounts, are amortized and accreted, respectively, over the expected life of the security on all debt securities, unless otherwise noted.
Dividend income is recorded on the ex-dividend date.
Expenses
General expenses of the Trust are allocated to the Fund and other funds of the Trust based upon relative net assets or other expense allocation methodologies determined by the nature of the expense. Expenses directly attributable to the Fund are charged to the Fund. Expenses directly attributable to a specific class of shares are charged to that share class.
Determination of Class Net Asset Value
All income, expenses (other than class-specific expenses, which are charged to that share class, as shown in the Statement of Operations) and realized and unrealized gains (losses) are allocated to each class of the Fund on a daily basis, based on the relative net assets of each class, for purposes of determining the net asset value of each class.
Federal Income Tax Status
The Fund intends to qualify each year as a regulated investment company under Subchapter M of the Internal Revenue Code, as amended, and will distribute substantially all of its tax exempt and taxable income (including net short-term capital gains), if any, for its tax year, and as such will not be subject to federal income taxes. In addition, the Fund intends to distribute in each calendar year substantially all of its net investment income, capital gains and certain other amounts, if any, such that the Fund should not be subject to federal excise tax. Therefore, no federal income or excise tax provision is recorded.
Distributions to Shareholders
Distributions from net investment income, if any, are declared daily and paid monthly. Net realized capital gains, if any, are distributed at least annually. Income distributions and capital gain distributions are determined in accordance with federal income tax regulations, which may differ from GAAP.
Guarantees and Indemnifications
Under the Trust's organizational documents and, in some cases, by contract, its officers and trustees are indemnified against certain liabilities arising out of the performance of their duties to the Trust or its funds. In addition, certain of the Fund's contracts with its service providers contain general indemnification clauses. The Fund's maximum exposure under these arrangements is unknown since the amount of any
future claims that may be made against the Fund cannot be determined, and the Fund has no historical basis for predicting the likelihood of any such claims.
Note 3. Fees and Compensation Paid to Affiliates
Investment Management Fees
Under an Investment Management Services Agreement, Columbia Management Investment Advisers, LLC (the Investment Manager), a wholly-owned subsidiary of Ameriprise Financial, Inc. (Ameriprise Financial), determines which securities will be purchased, held or sold. The investment management fee is an annual fee that is equal to a percentage of the Fund's average daily net assets that declines from 0.40% to 0.27% as the Fund's net assets increase. The effective investment management fee rate for the year ended April 30, 2014 was 0.40% of the Fund's average daily net assets.
Administration Fees
Under an Administrative Services Agreement, the Investment Manager also serves as the Fund Administrator. The Fund pays the Fund Administrator an annual fee for administration and accounting services equal to a percentage of the Fund's average daily net assets that declines from 0.07% to 0.04% as the Fund's net assets increase. The effective administration fee rate for the year ended April 30, 2014 was 0.07% of the Fund's average daily net assets.
Other Expenses
Other expenses are for, among other things, miscellaneous expenses of the Fund or the Board, including payments to a company providing limited administrative services to the Fund and the Board. That company's expenses include boardroom and office expense, employee compensation, employee health and retirement benefits, and certain other expenses. For the year ended April 30, 2014, other expenses paid to this company were $2,085.
Compensation of Board Members
Board members are compensated for their services to the Fund as disclosed in the Statement of Operations. Under a Deferred Compensation Plan (the Plan), the Board members who are not "interested persons" of the Fund, as defined under the 1940 Act, may elect to defer payment of up to 100% of their compensation. Deferred amounts are treated as though equivalent dollar amounts had been invested in shares of certain funds managed by the Investment Manager. The Fund's liability for these amounts is adjusted for market value changes and remains in the Fund until distributed in accordance with the Plan.
Annual Report 2014
25
Columbia Virginia Intermediate Municipal Bond Fund
Notes to Financial Statements (continued)
April 30, 2014
Transfer Agent Fees
Under a Transfer and Dividend Disbursing Agent Agreement, Columbia Management Investment Services Corp. (the Transfer Agent), an affiliate of the Investment Manager and a wholly-owned subsidiary of Ameriprise Financial, is responsible for providing transfer agency services to the Fund. The Transfer Agent has contracted with Boston Financial Data Services (BFDS) to serve as sub-transfer agent.
The Transfer Agent receives monthly account-based service fees based on the number of open accounts and also receives sub-transfer agency fees based on a percentage of the average aggregate value of the Fund's shares maintained in omnibus accounts (other than omnibus accounts for which American Enterprise Investment Services Inc. is the broker of record or accounts where the beneficial shareholder is a customer of Ameriprise Financial Services, Inc., which are paid a per account fee). The Transfer Agent pays the fees of BFDS for services as sub-transfer agent and is not entitled to reimbursement for such fees from the Fund (with the exception of out-of-pocket fees).
The Transfer Agent also receives compensation from fees for various shareholder services and reimbursements for certain out-of-pocket fees.
For the year ended April 30, 2014, the Fund's effective transfer agent fee rates as a percentage of average daily net assets of each class were as follows:
Class A | | | 0.19 | % | |
Class B | | | 0.19 | | |
Class C | | | 0.19 | | |
Class R4 | | | 0.17 | | |
Class Z | | | 0.19 | | |
An annual minimum account balance fee of $20 may apply to certain accounts with a value below the applicable share class's initial minimum investment requirements to reduce the impact of small accounts on transfer agent fees. These minimum account balance fees are recorded as part of expense reductions in the Statement of Operations. For the year ended April 30, 2014, these minimum account balance fees reduced total expenses by $20.
Distribution and Service Fees
The Fund has an agreement with Columbia Management Investment Distributors, Inc. (the Distributor), an affiliate of the Investment Manager and a wholly-owned subsidiary of Ameriprise Financial, for distribution and shareholder services. The Board has approved, and the Fund has adopted, distribution and shareholder service plans (the Plans) applicable to certain share classes, which set the distribution
and service fees for the Fund. These fees are calculated daily and are intended to compensate the Distributor and/or eligible selling and/or servicing agents for selling shares of the Fund and providing services to investors.
Under the Plans, the Fund pays a monthly combined distribution and service fee to the Distributor at the maximum annual rate of 0.25% of the average daily net assets attributable to Class A shares of the Fund. Also under the Plans, the Fund pays a monthly service fee at the maximum annual rate of 0.25% of the average daily net assets attributable to Class B and Class C shares of the Fund and the payment of a monthly distribution fee at the maximum annual rate of 0.75% of the average daily net assets attributable to Class B and Class C shares of the Fund.
Sales Charges
Sales charges, including front-end charges and CDSCs, received by the Distributor for distributing Fund shares were $12,826 for Class A and $531 for Class C shares for the year ended April 30, 2014.
Expenses Waived/Reimbursed by the Investment Manager and its Affiliates
The Investment Manager and certain of its affiliates have contractually agreed to waive fees and/or reimburse expenses (excluding certain fees and expenses described below) for the period disclosed below, unless sooner terminated at the sole discretion of the Board, so that the Fund's net operating expenses, after giving effect to fees waived/expenses reimbursed and any balance credits and/or overdraft charges from the Fund's custodian, do not exceed the following annual rates as a percentage of the class' average daily net assets:
| | | Fee Rates Contractual
through
August 31, 2014 | |
Class A | | | 0.81 | % | |
Class B | | | 1.56 | | |
Class C | | | 1.56 | | |
Class R4 | | | 0.56 | | |
Class Z | | | 0.56 | | |
Under the agreement governing these fee waivers and/or expense reimbursement arrangements, the following fees and expenses are excluded from the waiver/reimbursement commitment, and therefore will be paid by the Fund, if applicable: taxes (including foreign transaction taxes), expenses associated with investments in affiliated and non-affiliated pooled investment vehicles (including mutual funds and exchange-traded funds), transaction costs and brokerage commissions, costs related to any securities lending program, dividend expenses associated with securities sold short,
Annual Report 2014
26
Columbia Virginia Intermediate Municipal Bond Fund
Notes to Financial Statements (continued)
April 30, 2014
inverse floater program fees and expenses, transaction charges and interest on borrowed money, interest, extraordinary expenses and any other expenses the exclusion of which is specifically approved by the Board. This agreement may be modified or amended only with approval from all parties.
Note 4. Federal Tax Information
The timing and character of income and capital gain distributions are determined in accordance with income tax regulations, which may differ from GAAP because of temporary or permanent book to tax differences.
At April 30, 2014, these differences are primarily due to differing treatment for capital loss carryforwards, Trustees' deferred compensation and distribution reclassifications. To the extent these differences are permanent, reclassifications are made among the components of the Fund's net assets in the Statement of Assets and Liabilities. Temporary differences do not require reclassifications. In the Statement of Assets and Liabilities the following reclassifications were made:
Undistributed net investment income | | $ | (25,091 | ) | |
Accumulated net realized loss | | | 25,091 | | |
Net investment income and net realized gains (losses), as disclosed in the Statement of Operations, and net assets were not affected by this reclassification.
The tax character of distributions paid during the years indicated was as follows:
Year Ended April 30, | | 2014 | | 2013 | |
Ordinary income | | $ | 42,435 | | | $ | 43,799 | | |
Tax-exempt income | | | 8,371,081 | | | | 10,233,816 | | |
Long-term capital gains | | | 1,499,898 | | | | 535,776 | | |
Total | | $ | 9,913,414 | | | $ | 10,813,391 | | |
Short-term capital gain distributions, if any, are considered ordinary income distributions for tax purposes.
At April 30, 2014, the components of distributable earnings on a tax basis were as follows:
Undistributed tax-exempt income | | $ | 1,512,395 | | |
Capital loss carryforwards | | | (263,997 | ) | |
Net unrealized appreciation | | | 14,313,343 | | |
At April 30, 2014, the cost of investments for federal income tax purposes was $212,162,552 and the aggregate gross unrealized appreciation and depreciation based on that cost was:
Unrealized appreciation | | $ | 15,295,929 | | |
Unrealized depreciation | | | (982,586) | | |
Net unrealized appreciation | | $ | 14,313,343 | | |
The following capital loss carryforwards, determined at April 30, 2014, may be available to reduce taxable income arising from future net realized gains on investments, if any, to the extent permitted by the Internal Revenue Code:
Year of Expiration | | Amount ($) | |
Unlimited short-term | | | 263,997 | | |
Management of the Fund has concluded that there are no significant uncertain tax positions that would require recognition in the financial statements. However, management's conclusion may be subject to review and adjustment at a later date based on factors including, but not limited to, new tax laws, regulations, and administrative interpretations (including relevant court decisions). Generally, the Fund's federal tax returns for the prior three fiscal years remain subject to examination by the Internal Revenue Service.
Note 5. Portfolio Information
The cost of purchases and proceeds from sales of securities, excluding short-term obligations, aggregated to $5,187,465 and $100,094,398, respectively, for the year ended April 30, 2014.
Note 6. Shareholder Concentration
At April 30, 2014, one unaffiliated shareholder of record owned 79.9% of the outstanding shares of the Fund in one or more accounts. The Fund has no knowledge about whether any portion of those shares was owned beneficially. Subscription and redemption activity by concentrated accounts may have a significant effect on the operations of the Fund.
Note 7. Line of Credit
The Fund has entered into a revolving credit facility with a syndicate of banks led by JPMorgan Chase Bank N.A. whereby the Fund may borrow for the temporary funding of shareholder redemptions or for other temporary or emergency purposes. The credit facility agreement, as amended, which is a collective agreement between the Fund and certain other funds managed by the Investment Manager, severally and not jointly, permits collective borrowings up to $500 million. Interest is charged to each participating fund based on its borrowings at a rate equal to the higher of (i) the overnight federal funds rate plus 1.00% or (ii) the one-month LIBOR rate plus 1.00%. Each borrowing under the credit facility matures no later than 60 days after the date of borrowing. Effective December 10, 2013, the Fund also pays a commitment fee equal to its pro rata share of the amount of the credit facility at a rate of 0.075% per annum. Prior to December 10, 2013, the commitment fee was charged at the
Annual Report 2014
27
Columbia Virginia Intermediate Municipal Bond Fund
Notes to Financial Statements (continued)
April 30, 2014
annual rate of 0.08% per annum. The commitment fee is included in other expenses in the Statement of Operations.
The Fund had no borrowings during the year ended April 30, 2014.
Note 8. Significant Risks
Geographic Concentration Risk
Because state-specific tax-exempt funds invest primarily in the municipal securities issued by the state and political sub-divisions of the state, the Fund will be particularly affected by political and economic conditions and developments in the state in which it invests. The Fund may, therefore, have a greater risk than that of a municipal bond fund which is more geographically diversified. The value of the municipal securities owned by the Fund also may be adversely affected by future changes in federal or state income tax laws.
Note 9. Subsequent Events
Management has evaluated the events and transactions that have occurred through the date the financial statements were issued and noted no items requiring adjustment of the financial statements or additional disclosure.
Note 10. Information Regarding Pending and Settled Legal Proceedings
In December 2005, without admitting or denying the allegations, American Express Financial Corporation (AEFC, which is now known as Ameriprise Financial, Inc. (Ameriprise Financial)) entered into settlement agreements with the Securities and Exchange Commission (SEC) and Minnesota Department of Commerce (MDOC) related to market timing activities. As a result, AEFC was censured and ordered to cease and desist from committing or causing any violations of certain provisions of the Investment Advisers Act of 1940, the Investment Company Act of 1940, and various Minnesota laws. AEFC agreed to pay disgorgement of $10 million and civil money penalties of $7 million. AEFC also agreed to retain an independent distribution consultant to assist in developing a plan for distribution of all disgorgement and civil penalties ordered by the SEC in accordance with various undertakings detailed at www.sec.gov/litigation/admin/ia-2451.pdf. Ameriprise Financial and its affiliates have cooperated with the SEC and the MDOC in these legal proceedings, and have made regular reports to the Funds' Boards of Trustees.
Ameriprise Financial and certain of its affiliates have historically been involved in a number of legal, arbitration and regulatory proceedings, including routine litigation, class actions, and governmental actions, concerning matters arising in connection with the conduct of their business activities.
Ameriprise Financial believes that the Funds are not currently the subject of, and that neither Ameriprise Financial nor any of its affiliates are the subject of, any pending legal, arbitration or regulatory proceedings that are likely to have a material adverse effect on the Funds or the ability of Ameriprise Financial or its affiliates to perform under their contracts with the Funds. Ameriprise Financial is required to make 10-Q, 10-K and, as necessary, 8-K filings with the Securities and Exchange Commission on legal and regulatory matters that relate to Ameriprise Financial and its affiliates. Copies of these filings may be obtained by accessing the SEC website at www.sec.gov.
There can be no assurance that these matters, or the adverse publicity associated with them, will not result in increased fund redemptions, reduced sale of fund shares or other adverse consequences to the Funds. Further, although we believe proceedings are not likely to have a material adverse effect on the Funds or the ability of Ameriprise Financial or its affiliates to perform under their contracts with the Funds, these proceedings are subject to uncertainties and, as such, we are unable to estimate the possible loss or range of loss that may result. An adverse outcome in one or more of these proceedings could result in adverse judgments, settlements, fines, penalties or other relief that could have a material adverse effect on the consolidated financial condition or results of operations of Ameriprise Financial.
Annual Report 2014
28
Columbia Virginia Intermediate Municipal Bond Fund
Report of Independent Registered Public Accounting Firm
To the Trustees of Columbia Funds Series Trust and the
Shareholders of Columbia Virginia Intermediate Municipal Bond Fund
In our opinion, the accompanying statement of assets and liabilities, including the portfolio of investments, and the related statements of operations and of changes in net assets and the financial highlights present fairly, in all material respects, the financial position of Columbia Virginia Intermediate Municipal Bond Fund (the "Fund", a series of Columbia Funds Series Trust) at April 30, 2014, and the results of its operations, the changes in its net assets and the financial highlights for each of the periods indicated, in conformity with accounting principles generally accepted in the United States of America. These financial statements and financial highlights (hereafter referred to as "financial statements") are the responsibility of the Fund's management; our responsibility is to express an opinion on these financial statements based on our audits. We conducted our audits of these financial statements in accordance with the standards of the Public Company Accounting Oversight Board (United States). Those standards require that we plan and perform the audit to obtain reasonable assurance about whether the financial statements are free of material misstatement. An audit includes examining, on a test basis, evidence supporting the amounts and disclosures in the financial statements, assessing the accounting principles used and significant estimates made by management, and evaluating the overall financial statement presentation. We believe that our audits, which included confirmation of securities at April 30, 2014 by correspondence with the custodian, provide a reasonable basis for our opinion.
PricewaterhouseCoopers LLP
Minneapolis, Minnesota
June 20, 2014
Annual Report 2014
29
Columbia Virginia Intermediate Municipal Bond Fund
Federal Income Tax Information
(Unaudited)
The Fund hereby designates the following tax attributes for the fiscal year ended April 30, 2014. Shareholders will be notified in early 2015 of the amounts for use in preparing 2014 income tax returns.
Tax Designations
Capital Gain Dividend | | $ | 1,499,898 | | |
| Exempt-Interest Dividends | | | 99.50 | % | |
Capital Gain Dividend. The Fund designates as a capital gain dividend the amount reflected above, or if subsequently determined to be different, the net capital gain of such fiscal period. The Fund also designates as capital gain dividends, to the extent necessary to fully distribute such capital gains, earnings and profits distributed to shareholders on the redemption of shares.
Exempt-Interest Dividends. The percentage of net investment income dividends paid during the fiscal year that qualifies as exempt-interest dividends for federal income tax purposes.
Annual Report 2014
30
Columbia Virginia Intermediate Municipal Bond Fund
Shareholders elect the Board that oversees the Funds' operations. The Board appoints officers who are responsible for day-to-day business decisions based on policies set by the Board. The following table provides basic biographical information about the Funds' Board members, including their principal occupations during the past five years, although specific titles for individuals may have varied over the period. Under current Board policy, members may serve through the end of the calendar year in which he or she reaches either the mandatory retirement age established by the Board or the fifteenth anniversary of the first Board meeting they attended as a member of the Board.
Independent Trustees
Name,
Address,
Year of Birth | | Position Held With
Funds and Length of
Service | | Principal Occupation(s)
During Past Five Years
and Other Relevant
Professional Experience | | Number of
Funds in the
Fund Family
Overseen by
Board Member | | Other Present or Past
Directorships/
Trusteeships
(Within Past 5 Years) | |
Kathleen Blatz
901 S. Marquette Ave.
Minneapolis, MN 55402
1954 | | Board member since 1/06 for RiverSource Funds and since 6/11 for Nations Funds | | Attorney; Chief Justice, Minnesota Supreme Court, 1998-2006 | | | 132 | | | Trustee, BlueCross BlueShield of Minnesota since 2009 | |
Edward J. Boudreau, Jr.
901 S. Marquette Ave.
Minneapolis, MN 55402
1944 | | Board member since 6/11 for RiverSource Funds and since 1/05 for Nations Funds | | Managing Director, E.J. Boudreau & Associates (consulting) since 2000; Chairman and Chief Executive Officer, John Hancock Funds (mutual funds), 1989-2000 | | | 130 | | | Former Trustee, BofA Funds Series Trust (11 funds), 2005-2011 | |
Pamela G. Carlton
901 S. Marquette Ave.
Minneapolis, MN 55402
1954 | | Board member since 7/07 for RiverSource Funds and since 6/11 for Nations Funds | | President, Springboard — Partners in Cross Cultural Leadership (consulting company) since 2003; Director or Management Director of US Equity Research, Chase Asset Management, 1996-2003; Investment Banker, Morgan Stanley, 1982-1996 | | | 132 | | | None | |
William P. Carmichael
901 S. Marquette Ave.
Minneapolis, MN 55402
1943 | | Chair of the Board since 1/14, Board member since 6/11 for RiverSource Funds and since 2003 for Nations Funds | | Retired; Co-founder, The Succession Fund (provides exit strategies to owners of privately held companies); previously, Senior Vice President, Sara Lee Corporation; Senior Vice President and Chief Financial Officer, Beatrice Foods Company; Vice President, Esmark, Inc.; Associate, Price Waterhouse | | | 132 | | | Director, Cobra Electronics Corporation (electronic equipment manufacturer); The Finish Line (athletic shoes and apparel) since July 2003; Director, International Textile Corp. since 2012; former Director, McMoRan Exploration Company (oil and gas exploration and development) 2010-2013; former Trustee, BofA Funds Series Trust (11 funds), 2009-2011; Director, Spectrum Brands, Inc. (consumer products), 2002-2009; Director, Simmons Company (bedding), 2004-2010 | |
Annual Report 2014
31
Columbia Virginia Intermediate Municipal Bond Fund
Trustees and Officers (continued)
Independent Trustees (continued)
Name,
Address,
Year of Birth | | Position Held With
Funds and Length of
Service | | Principal Occupation(s)
During Past Five Years
and Other Relevant
Professional Experience | | Number of
Funds in the
Fund Family
Overseen by
Board Member | | Other Present or Past
Directorships/
Trusteeships
(Within Past 5 Years) | |
Patricia M. Flynn
901 S. Marquette Ave.
Minneapolis, MN 55402
1950 | | Board member since 11/04 for RiverSource Funds and since 6/11 for Nations Funds | | Trustee Professor of Economics and Management, Bentley University since 1976 (also teaches and conducts research on corporate governance); Dean, McCallum Graduate School of Business, Bentley University, 1992-2002 | | | 132 | | | None | |
William A. Hawkins
901 S. Marquette Ave.
Minneapolis, MN 55402
1942 | | Board member since 6/11 for RiverSource Funds and since 1/05 for Nations Funds | | Managing Director, Overton Partners (financial consulting), since August 2010; President and Chief Executive Officer, California General Bank, N.A., January 2008-August 2010 | | | 130 | | | Trustee, BofA Funds Series Trust (11 funds) | |
R. Glenn Hilliard
901 S. Marquette Ave.
Minneapolis, MN 55402
1943 | | Board member since 6/11 for RiverSource Funds and since 1/05 for Nations Funds | | Chairman and Chief Executive Officer, Hilliard Group LLC (investing and consulting) since April 2003; Non-Executive Director & Chairman, CNO Financial Group, Inc. (insurance), September 2003-May 2011 | | | 130 | | | Chairman, BofA Fund Series Trust (11 funds); former Director, CNO Financial Group, Inc. (insurance), 2003-2011 | |
Stephen R. Lewis, Jr.
901 S. Marquette Ave.
Minneapolis, MN 55402
1939 | | Board member for RiverSource Funds since 1/02 and since 6/11 for Nations Funds, Board Chair 1/07-12/13 | | President Emeritus and Professor of Economics Emeritus, Carleton College since 2002 | | | 132 | | | Director, Valmont Industries, Inc. (irrigation systems manufacturer), 2002-2013 | |
Catherine James Paglia
901 S. Marquette Ave.
Minneapolis, MN 55402
1952 | | Board member since 11/04 for RiverSource Funds and since 6/11 for Nations Funds | | Director, Enterprise Asset Management, Inc. (private real estate and asset management company) since September 1998 | | | 132 | | | Director, Valmont Industries, Inc. (irrigation systems manufacturer) since 2012 | |
Leroy C. Richie
901 S. Marquette Ave.
Minneapolis, MN 55402
1941 | | Board member since 2000 for Legacy Seligman Funds, since 11/08 for RiverSource Funds and since 6/11 for Nations Funds | | Counsel, Lewis & Munday, P.C. (law firm) since 2004; Vice President and General Counsel, Automotive Legal Affairs, Chrysler Corporation, 1993-1997 | | | 132 | | | Lead Outside Director, Digital Ally, Inc. (digital imaging) since September 2005; Director, Infinity, Inc. (oil and gas exploration and production) since 1994; Director, OGE Energy Corp. (energy and energy services) since November 2007 | |
Minor M. Shaw
901 S. Marquette Ave.
Minneapolis, MN 55402
1947 | | Board member since 6/11 for RiverSource Funds and since 2003 for Nations Funds | | President, Micco LLC (private investments) since 2011; President, Micco Corp. since 1998 | | | 130 | | | Director, Piedmont Natural Gas; Director, BlueCross BlueShield of South Carolina since April 2008; Director, National Association of Corporate Directors, Carolinas Chapter, since 2013; former Trustee, BofA Funds Series Trust (11 funds) | |
Annual Report 2014
32
Columbia Virginia Intermediate Municipal Bond Fund
Trustees and Officers (continued)
Independent Trustees (continued)
Name,
Address,
Year of Birth | | Position Held With
Funds and Length of
Service | | Principal Occupation(s)
During Past Five Years
and Other Relevant
Professional Experience | | Number of
Funds in the
Fund Family
Overseen by
Board Member | | Other Present or Past
Directorships/
Trusteeships
(Within Past 5 Years) | |
Alison Taunton-Rigby
901 S. Marquette Ave.
Minneapolis, MN 55402
1944 | | Board member since 11/02 for RiverSource Funds and since 6/11 for Nations Funds | | Chief Executive Officer and Director, RiboNovix, Inc., (biotechnology) 2003-2010 | | | 132 | | | Director, Healthways, Inc. (health and wellbeing solutions) since 2005; Director, ICI Mutual Insurance Company, RRG since 2011; Director, Abt Associates (government contractor) since 2001; Director, Boston Children's Hospital since 2002 | |
Interested Trustee Not Affiliated with Investment Manager*
Name,
Address,
Year of Birth | | Position Held With
Funds and Length of
Service | | Principal Occupation(s)
During Past Five Years
and Other Relevant
Professional Experience | | Number of
Funds in the
Fund Family
Overseen by
Board Member | | Other Present or Past
Directorships/
Trusteeships
(Within Past 5 Years) | |
Anthony M. Santomero
901 S. Marquette Ave.
Minneapolis, MN 55402
1946 | | Board member since 6/11 for RiverSource Funds and since 1/08 for Nations Funds | | Richard K. Mellon Professor Emeritus of Finance, The Wharton School, University of Pennsylvania, since 2002; Senior Advisor, McKinsey & Company (consulting), 2006-2008 | | | 130 | | | Director, Renaissance Reinsurance Ltd. since May 2008; Trustee, Penn Mutual Life Insurance Company since March 2008; Director, Citigroup Inc. since 2009; Director, Citibank, N.A. since 2009; former Trustee, BofA Funds Series Trust (11 funds), 2008-2011 | |
* Dr. Santomero is not an affiliated person of the Investment Manager or Ameriprise Financial. However, he is currently deemed by the Funds to be an "interested person" (as defined in the 1940 Act) of the Funds because he serves as a Director of Citigroup Inc. and Citibank, N.A., companies that may directly or through subsidiaries and affiliates engage from time-to-time in brokerage execution, principal transactions and lending relationships with the Funds or accounts advised/managed by the Investment Manager.
Annual Report 2014
33
Columbia Virginia Intermediate Municipal Bond Fund
Trustees and Officers (continued)
Interested Trustee Affiliated with Investment Manager*
Name,
Address,
Year of Birth | | Position Held With
Funds and Length of
Service | | Principal Occupation(s)
During Past Five Years
and Other Relevant
Professional Experience | | Number of
Funds in the
Fund Family
Overseen by
Board Member | | Other Present or Past
Directorships/
Trusteeships
(Within Past 5 Years) | |
William F. Truscott
53600 Ameriprise
Financial Center
Minneapolis, MN 55474
1960 | | Board member since 11/01 for RiverSource Funds and since 6/11 for Nations Funds; Senior Vice President since 2002 for RiverSource Funds and since 5/10 for Nations Funds | | Chairman of the Board and President, Columbia Management Investment Advisers, LLC since May 2010 and February 2012, respectively (previously President and Chief Investment Officer, 2001-April 2010); Chief Executive Officer, Global Asset Management, Ameriprise Financial, Inc. since September 2012 (previously Chief Executive Officer, U.S. Asset Management & President, Annuities, May 2010-September 2012 and President — U.S. Asset Management and Chief Investment Officer, 2005-April 2010); Director and Chief Executive Officer, Columbia Management Investment Distributors, Inc. since May 2010 and February 2012, respectively (previously Chairman of the Board and Chief Executive Officer, 2006-April 2010); Chairman of the Board and Chief Executive Officer, RiverSource Distributors, Inc. since 2006; Director, Threadneedle Asset Management Holdings, SARL since 2014; President and Chief Executive Officer, Ameriprise Certificate Company, 2006-August 2012 | | | 186 | | | Former Director, Ameriprise Certificate Company, 2006-January 2013 | |
* Interested person (as defined under the 1940 Act) by reason of being an officer, director, security holder and/or employee of the Investment Manager or Ameriprise Financial.
The Statement of Additional Information has additional information about the Fund's Board members and is available, without charge, upon request by calling 800.345.6611; contacting your financial intermediary or visiting columbiamanagement.com.
Annual Report 2014
34
Columbia Virginia Intermediate Municipal Bond Fund
Trustees and Officers (continued)
The Board has appointed officers who are responsible for day-to-day business decisions based on policies it has established. The officers serve at the pleasure of the Board. In addition to Mr. Truscott, who is Senior Vice President, the Funds' other officers are:
Officers
Name,
Address and
Year of Birth | | Position and Year
First Appointed to
Position for any Fund
in the Columbia
Funds Complex or a
Predecessor Thereof | | Principal Occupation(s) During Past Five Years | |
J. Kevin Connaughton
225 Franklin Street
Boston, MA 02110
Born 1964 | | President and Principal Executive Officer (2009) | | Managing Director and General Manager — Mutual Fund Products, Columbia Management Investment Advisers, LLC since May 2010; and President, Columbia Funds since 2009; Managing Director, Columbia Management Advisors, LLC, December 2004-April 2010; Senior Vice President and Chief Financial Officer, Columbia Funds, June 2008-January 2009; and senior officer of Columbia Funds and affiliated funds since 2003 | |
Michael G. Clarke
225 Franklin Street
Boston, MA 02110
Born 1969 | | Treasurer (2011) and Chief Financial Officer (2009) | | Vice President — Mutual Fund Administration, Columbia Management Investment Advisers, LLC, since May 2010; Managing Director of Fund Administration, Columbia Management Advisors, LLC, September 2004-April 2010; and senior officer of Columbia Funds and affiliated funds since 2002 | |
Scott R. Plummer
5228 Ameriprise Financial Center
Minneapolis, MN 55474
Born 1959 | | Senior Vice President (2006), Chief Legal Officer (2006) and Assistant Secretary (2011) | | Senior Vice President and Assistant General Counsel — Global Asset Management, Ameriprise Financial since February 2014 (previously, Senior Vice President and Lead Chief Counsel — Asset Management, 2012-February 2014; Vice President and Lead Chief Counsel — Asset Management, 2010-2012; and Vice President and Chief Counsel — Asset Management, 2005-2010); Senior Vice President, Chief Legal Officer and Assistant Secretary, Columbia Management Investment Advisers, LLC since June 2005; Vice President, Chief Counsel and Assistant Secretary, Columbia Management Investment Distributors, Inc. since 2008; Vice President, General Counsel and Secretary, Ameriprise Certificate Company since 2005; Chief Counsel, RiverSource Distributors, Inc. since 2006; senior officer of Columbia Funds and affiliated funds since 2006 | |
Thomas P. McGuire
225 Franklin Street
Boston, MA 02110
Born 1972 | | Chief Compliance Officer (2012) | | Vice President — Asset Management Compliance, Ameriprise Financial, Inc. since May 2010; Chief Compliance Officer, Ameriprise Certificate Company, since September 2010; Compliance Executive, Bank of America, 2005-April 2010 | |
Colin Moore
225 Franklin Street
Boston, MA 02110
Born 1958 | | Senior Vice President (2010) | | Executive Vice President and Global Chief Investment Officer, Ameriprise Financial, Inc. since July 2013; Director and Global Chief Investment Officer, Columbia Management Investment Advisers, LLC since May 2010; Manager, Managing Director and Chief Investment Officer, Columbia Management Advisors, LLC, 2007-April 2010 | |
Michael E. DeFao
225 Franklin Street
Boston, MA 02110
Born 1968 | | Vice President (2011) and Assistant Secretary (2010) | | Vice President and Chief Counsel, Ameriprise Financial, Inc. since May 2010; Associate General Counsel, Bank of America 2005-April 2010 | |
Joseph F. DiMaria
225 Franklin Street
Boston, MA 02110
Born 1968 | | Vice President (2011) and Chief Accounting Officer (2008) | | Vice President — Mutual Fund Treasurer, Columbia Management Investment Advisers, LLC since May 2010; Director of Fund Administration, Columbia Management Advisors, LLC, 2006-April 2010 | |
Paul B. Goucher
100 Park Avenue
New York, NY 10017
Born 1968 | | Vice President (2011) and Assistant Secretary (2008) | | Vice President and Lead Chief Counsel, Ameriprise Financial, Inc. since November 2008 and January 2013, respectively (previously Chief Counsel, January 2010-January 2013, and Group Counsel, November 2008-January 2010); Director, Managing Director and General Counsel, J. & W. Seligman & Co. Incorporated, July 2008-November 2008 | |
Amy Johnson
5228 Ameriprise Financial
Center
Minneapolis, MN 55474
Born 1965 | | Vice President (2006) | | Managing Director and Chief Operating Officer, Columbia Management Investment Advisers, LLC since May 2010 (previously Chief Administrative Officer, 2009-April 2010, and Vice President — Asset Management and Trust Company Services, 2006-2009) | |
Annual Report 2014
35
Columbia Virginia Intermediate Municipal Bond Fund
Trustees and Officers (continued)
Officers (continued)
Name,
Address and
Year of Birth | | Position and Year
First Appointed to
Position for any Fund
in the Columbia
Funds Complex or a
Predecessor Thereof | | Principal Occupation(s) During Past Five Years | |
Paul D. Pearson
5228 Ameriprise Financial
Center
Minneapolis, MN 55474
Born 1956 | | Vice President (2011) and Assistant Treasurer (1999) | | Vice President — Investment Accounting, Columbia Management Investment Advisers, LLC since May 2010; Vice President — Managed Assets, Investment Accounting, Ameriprise Financial, Inc., 1998-April 2010 | |
Christopher O. Petersen
5228 Ameriprise Financial
Center
Minneapolis, MN 55474
Born 1970 | | Vice President and Secretary (2010) | | Vice President and Chief Counsel, Ameriprise Financial, Inc., since January 2010 (previously Vice President and Group Counsel or Counsel, 2004-January 2010); officer of Columbia Funds and affiliated funds since 2007 | |
Stephen T. Welsh
225 Franklin Street
Boston, MA 02110
Born 1957 | | Vice President (2006) | | President and Director, Columbia Management Investment Services Corp. since May 2010; President and Director, Columbia Management Services, Inc., 2004-April 2010; Managing Director, Columbia Management Distributors, Inc., 2007-April 2010 | |
Annual Report 2014
36
Columbia Virginia Intermediate Municipal Bond Fund
Approval of Investment Management
Services Agreement
Columbia Management Investment Advisers, LLC (Columbia Management or the Investment Manager), a wholly-owned subsidiary of Ameriprise Financial, Inc. (Ameriprise Financial), serves as the investment manager to Columbia Virginia Intermediate Municipal Bond Fund (the Fund). Under an investment management services agreement (the IMS Agreement), Columbia Management provides investment advice and other services to the Fund and other funds distributed by Columbia Management Investment Distributors, Inc. (collectively, the Funds).
On an annual basis, the Fund's Board of Trustees (the Board), including the independent Board members (the Independent Trustees), considers renewal of the IMS Agreement. Columbia Management prepared detailed reports for the Board and its Contracts Committee in January, March and April 2014, including reports based on analyses of data provided by an independent organization (Lipper) and a comprehensive response to each item of information requested by independent legal counsel to the Independent Trustees (Independent Legal Counsel) in a letter to the Investment Manager, to assist the Board in making this determination. All of the materials presented in January, March and April were first supplied in draft form to designated representatives of the Independent Trustees, i.e., Independent Legal Counsel, Fund Counsel, the Chair of the Board and the Chair of the Contracts Committee, and the final materials (including proposed expense caps for certain Funds) were revised to reflect discussion and subsequent requests made by the Contracts Committee. In addition, throughout the year, the Board (or its committees) regularly meets with portfolio management teams and senior management personnel, and reviews information prepared by Columbia Management addressing the services Columbia Management provides and Fund performance. The Board also accords appropriate weight to the work, deliberations and conclusions of the Contracts Committee, the Investment Review Committee and the Compliance Committee in determining whether to continue the IMS Agreement.
The Board, at its April 9-11, 2014 in-person Board meeting (the April Meeting), considered the renewal of the IMS Agreement for an additional one-year term. At the April Meeting, Independent Legal Counsel reviewed with the Independent Trustees various factors relevant to the Board's consideration of advisory agreements and the Board's legal responsibilities related to such consideration. Following an analysis and discussion of the factors identified below, the Board, including all of the Independent Trustees, approved the renewal of the IMS Agreement.
Nature, Extent and Quality of Services Provided by Columbia Management
The Independent Trustees analyzed various reports and presentations they had received detailing the services performed by Columbia Management, as well as its expertise, resources and capabilities. The Independent Trustees specifically considered many developments during the past year concerning the services provided by Columbia Management, including, in particular, the successful implementation of a globalization initiative, which, among other things, increased worldwide analyst support for global products, the reorganization of the Informational Technology research team, the hiring of additional personnel to assist the Asset Allocation team and the global restructuring of the Senior Operational team. The Independent Trustees noted the information they received concerning Columbia Management's ability to retain its key portfolio management personnel. The Independent Trustees also recalled Columbia Management's representation that additional staff has been added to support the vigorous application of the "5P" review process, to which all internally-managed Funds are subject.
In connection with the Board's evaluation of the overall package of services provided by Columbia Management, the Board also considered the quality of administrative services provided to the Fund by Columbia Management, recalling the information it received highlighting significant achievements in 2013 in the performance of administrative services. In evaluating the quality of services provided under the IMS Agreement and the Fund's Administrative Services Agreement, the Independent Trustees also took into account the organization and strength of the Fund's and its service providers' compliance programs. In addition, the Board also reviewed the financial condition of Columbia Management (and its affiliates) and each entity's ability to carry out its responsibilities under the IMS Agreement and the Fund's other services agreements with affiliates of Ameriprise Financial, observing the financial strength of Ameriprise Financial, with its solid balance sheet. The Board also discussed the acceptability of the terms of the IMS Agreement (including the relatively broad scope of services required to be performed by Columbia Management). The Board concluded that the services being performed under the IMS Agreement were of a reasonably high quality.
Based on the foregoing, and based on other information received (both oral and written, including the information on investment performance referenced below) and other considerations, the Board concluded that Columbia Management and its affiliates were in a position to continue to provide a high quality and level of services to the Fund.
Annual Report 2014
37
Columbia Virginia Intermediate Municipal Bond Fund
Approval of Investment Management
Services Agreement (continued)
Investment Performance
For purposes of evaluating the nature, extent and quality of services provided under the IMS Agreement, the Board carefully reviewed the investment performance of the Fund. In this regard, the Board considered detailed reports providing the results of analyses performed by an independent organization showing, for various periods, the performance of the Fund, the performance of a benchmark index, the percentage ranking of the Fund among its comparison group and the net assets of the Fund. The Board observed that the Fund's investment performance was appropriate in light of the particular market environment.
Comparative Fees, Costs of Services Provided and the Profits Realized by Columbia Management and its Affiliates from their Relationships with the Fund
The Board reviewed comparative fees and the costs of services provided under the IMS Agreement. The Board members considered detailed comparative information set forth in an annual report on fees and expenses, including, among other things, data (based on analyses conducted by an independent organization) showing a comparison of the Fund's expenses with median expenses paid by funds in its comparative peer universe, as well as data showing the Fund's contribution to Columbia Management's profitability.
The Board accorded particular weight to the notion that the level of fees should reflect a rational pricing model applied consistently across the various product lines in the Fund family, while assuring that the overall fees for each Fund (with few defined exceptions) are generally in line with the "pricing philosophy" currently in effect (i.e., that the total expense ratio of the Fund is no higher than the median expense ratio of funds in the same comparison universe of the Fund). In this connection, the Board also considered the 2013 report provided by an independent consulting firm, Bobroff Consulting (the Independent Consultant), that concluded that the Funds' standardized investment management fee rates were within a reasonable range. The Board took into account that the Fund's total expense ratio (after considering proposed voluntary expense caps/waivers) approximated the peer universe's median expense ratio. It was observed that various proposals concerning the Funds' transfer agency and sub-transfer agency fee structures, and other changes impacting the Funds' pricing structure and fees, are expected to be considered at a later Board meeting which, if adopted, would alter the current pricing philosophy. Based on its review, the Board concluded that the Fund's management fee was fair and reasonable in light of the extent and quality of services that the Fund receives.
The Board also considered the expected profitability of Columbia Management and its affiliates in connection with Columbia Management providing investment management services to the Fund. In this regard, the Board referred to a detailed profitability report, discussing the profitability to Columbia Management and Ameriprise Financial from managing, operating and distributing the Funds. In this regard, the Board observed that: (i) the Independent Consultant concluded that 2012 profitability was reasonable; (ii) 2013 profitability only moderately exceeded 2012 levels; and (iii) 2013 profitability is in line with profitability levels of industry competitors. It also took into account the indirect economic benefits flowing to Columbia Management or its affiliates in connection with managing or distributing the Funds, such as the enhanced ability to offer various other financial products to Ameriprise Financial customers, soft dollar benefits and overall reputational advantages. The Board noted that the fees paid by the Funds should permit the Investment Manager to offer competitive compensation to its personnel, make necessary investments in its business and earn an appropriate profit. The Board concluded that profitability levels were reasonable.
Economies of Scale to be Realized
The Board also considered the economies of scale that might be realized by Columbia Management as the Fund grows and took note of the extent to which Fund shareholders might also benefit from such growth. In this regard, the Independent Trustees took into account that IMS fees decline as Fund assets exceed various breakpoints, all of which have not been surpassed.
Based on the foregoing, the Board, including all of the Independent Trustees, concluded that the investment management service fees were fair and reasonable in light of the extent and quality of services provided. In reaching this conclusion, no single factor was determinative. On April 11, 2014, the Board, including all of the Independent Trustees, approved the renewal of the IMS Agreement.
Annual Report 2014
38
This page intentionally left blank.
Annual Report 2014
39
This page intentionally left blank.
Annual Report 2014
40
Columbia Virginia Intermediate Municipal Bond Fund
Important Information About This Report
Each fund mails one shareholder report to each shareholder address. If you would like more than one report, please call shareholder services at 800.345.6611 and additional reports will be sent to you.
The policy of the Board is to vote the proxies of the companies in which each fund holds investments consistent with the procedures as stated in the Statement of Additional Information (SAI). You may obtain a copy of the SAI without charge by calling 800.345.6611; contacting your financial intermediary; visiting columbiamanagement.com; or searching the website of the Securities and Exchange Commission (SEC) at sec.gov. Information regarding how each fund voted proxies relating to portfolio securities is filed with the SEC by August 31 for the most recent 12-month period ending June 30 of that year, and is available without charge by visiting columbiamanagement.com; or searching the website of the SEC at sec.gov.
Each fund files a complete schedule of portfolio holdings with the SEC for the first and third quarters of each fiscal year on Form N-Q. Each fund's Form N-Q is available on the SEC's website at sec.gov and may be reviewed and copied at the SEC's Public Reference Room in Washington, D.C. Information on the operation of the Public Reference Room may be obtained by calling 800.SEC.0330. Each fund's complete schedule of portfolio holdings, as filed on Form N-Q, can also be obtained without charge, upon request, by calling 800.345.6611.
Annual Report 2014
41

Columbia Virginia Intermediate Municipal Bond Fund
P.O. Box 8081
Boston, MA 02266-8081
columbiamanagement.com
This information is for use with concurrent or prior delivery of a fund prospectus. Please read and consider the investment objectives, risks, charges and expenses for any fund carefully before investing. For a prospectus and, if available, a summary prospectus, which contains this and other important information about the Fund go to columbiamanagement.com. The Fund is distributed by Columbia Management Investment Distributors, Inc., member FINRA, and managed by Columbia Management Investment Advisers, LLC.
© 2014 Columbia Management Investment Advisers, LLC. All rights reserved.
ANN239_04_D01_(06/14)
Annual Report
April 30, 2014

Columbia California Intermediate Municipal Bond Fund
(renamed Columbia AMT-Free California Intermediate Muni Bond Fund, effective July 7, 2014)
Not FDIC insured • No bank guarantee • May lose value
 Dear Shareholders,
Continued Economic Recovery
The U.S. economy continued to recover at a slow but steady pace during the first quarter of 2014, supported by solid manufacturing activity, reasonable job growth and continued gains for the housing market. Industrial production was robust, buoyed by strong demand for autos and related parts. After a disappointing January, job growth picked up, which helped boost consumer confidence. Housing data was somewhat mixed, as harsh weather and higher mortgage rates put a damper on sales, while lower inventories helped prices trend higher. The Federal Reserve (the Fed) announced further reductions to its monthly asset purchases and reassured the markets that it would not make any significant changes to monetary policy until it was satisfied that the labor market was on solid ground. Despite mostly good news on the economic front, the broad financial markets recorded only modest gains, as bitter winter weather at home and mounting tensions between Russia and Western allies prompted investor caution.
Investors braced for higher interest rates, but long-term yields declined and the fixed-income markets were surprisingly resilient in the face of stable-to-improving economic data. Risk-on trading continued during the quarter as the higher yielding sectors of the fixed-income markets generally fared well. Emerging-market bonds, long-term U.S. Treasuries and sovereign debt were among the strongest performers, as were Treasury Inflation Protected Securities. Municipal bonds delivered solid gains, especially high-yield municipals, which benefited from continued improvement in state finances.
Against this backdrop, the broad bond market, as measured by the Barclays U.S. Aggregate Bond Index, edged out the broad stock market, as measured by the Standard & Poor's 500 Index, with gains of 1.84% vs. 1.81%, respectively. As indicated late last year, the Fed began tapering its monthly asset purchase program and announced further reductions. New Fed chair Janet Yellen reassured investors the Fed was committed to keeping short-term borrowing rates low into 2015.
Stay on Track with Columbia Management
Backed by more than 100 years of experience, Columbia Management is one of the nation's largest asset managers. At the heart of our success and, most importantly, that of our investors, are highly talented industry professionals, brought together by a unique way of working. At Columbia Management, reaching our performance goals matters, and how we reach them matters just as much.
Visit columbiamanagement.com for:
> The Columbia Management Perspectives blog, offering insights on current market events and investment opportunities
> Detailed up-to-date fund performance and portfolio information
> Quarterly fund commentaries
> Columbia Management investor, our award-winning quarterly newsletter for shareholders
Thank you for your continued support of the Columbia Funds. We look forward to serving your investment needs for many years to come.
Best Regards,

J. Kevin Connaughton
President, Columbia Funds
Investing involves risk including the risk of loss of principal.
The Barclays U.S. Aggregate Bond Index is a broad-based benchmark that measures the investment grade, U.S. dollar denominated, fixed-rate taxable bond market, including Treasuries, government-related and corporate securities, mortgage-backed securities (agency fixed-rate and hybrid adjustable-rate mortgage passthroughs), asset-backed securities, and commercial mortgage-backed securities. The S&P 500 Index, an unmanaged index, measures the performance of 500 widely held, large-capitalization U.S. stocks and is frequently used as a general measure of market performance. Indices are not available for investment, are not professionally managed and do not reflect sales charges, fees, brokerage commissions, taxes or other expenses of investing.
Investors should consider the investment objectives, risks, charges and expenses of a mutual fund carefully before investing. For a free prospectus and, if available, a summary prospectus, which contains this and other important information about a fund, visit columbiamanagement.com. The prospectus should be read carefully before investing.
Columbia Funds are distributed by Columbia Management Investment Distributors, Inc., member FINRA, and managed by Columbia Management Investment Advisers, LLC.
© 2014 Columbia Management Investment Advisers, LLC. All rights reserved.
Columbia California Intermediate Municipal Bond Fund
Performance Overview | | | 2 | | |
Manager Discussion of Fund Performance | | | 4 | | |
Understanding Your Fund's Expenses | | | 6 | | |
Portfolio of Investments | | | 7 | | |
Statement of Assets and Liabilities | | | 16 | | |
Statement of Operations | | | 18 | | |
Statement of Changes in Net Assets | | | 19 | | |
Financial Highlights | | | 21 | | |
Notes to Financial Statements | | | 27 | | |
Report of Independent Registered
Public Accounting Firm | | | 33 | | |
Federal Income Tax Information | | | 34 | | |
Trustees and Officers | | | 35 | | |
Approval of Investment Management Services Agreement | | | 41 | | |
Important Information About This Report | | | 45 | | |
Fund Investment Manager
Columbia Management Investment
Advisers, LLC
225 Franklin Street
Boston, MA 02110
Fund Distributor
Columbia Management Investment
Distributors, Inc.
225 Franklin Street
Boston, MA 02110
Fund Transfer Agent
Columbia Management Investment
Services Corp.
P.O. Box 8081
Boston, MA 02266-8081
For more information about any of the funds, please visit columbiamanagement.com or call 800.345.6611. Customer Service Representatives are available to answer your questions Monday through Friday from 8 a.m. to 7 p.m. Eastern time.
The views expressed in this report reflect the current views of the respective parties. These views are not guarantees of future performance and involve certain risks, uncertainties and assumptions that are difficult to predict, so actual outcomes and results may differ significantly from the views expressed. These views are subject to change at any time based upon economic, market or other conditions and the respective parties disclaim any responsibility to update such views. These views may not be relied on as investment advice and, because investment decisions for a Columbia Fund are based on numerous factors, may not be relied on as an indication of trading intent on behalf of any particular Columbia Fund. References to specific securities should not be construed as a recommendation or investment advice.
Columbia California Intermediate Municipal Bond Fund
Performance Summary
> Columbia California Intermediate Municipal Bond Fund (the Fund) Class A shares returned 0.64% excluding sales charges for the 12-month period that ended April 30, 2014. Class Z shares of the Fund returned 0.98% for the same time period.
> During the same time period, the Barclays California 3-15 Year Blend Municipal Bond Index returned 2.02% and the Barclays 3-15 Year Blend Municipal Bond Index returned 0.97%.
> A slightly longer duration relative to the Barclays California 3-15 Year Blend Municipal Bond Index at the beginning of the period detracted from results. Duration is a measure of interest rate sensitivity.
Average Annual Total Returns (%) (for period ended April 30, 2014)
| | Inception | | 1 Year | | 5 Years | | 10 Years | |
Class A | | 09/09/02 | | | | | | | | | | | | | |
Excluding sales charges | | | | | | | 0.64 | | | | 5.13 | | | | 4.16 | | |
Including sales charges | | | | | | | -2.64 | | | | 4.44 | | | | 3.81 | | |
Class B | | 08/29/02 | | | | | | | | | | | | | |
Excluding sales charges | | | | | | | -0.11 | | | | 4.35 | | | | 3.38 | | |
Including sales charges | | | | | | | -3.04 | | | | 4.35 | | | | 3.38 | | |
Class C | | 09/11/02 | | | | | | | | | | | | | |
Excluding sales charges | | | | | | | -0.02 | | | | 4.35 | | | | 3.38 | | |
Including sales charges | | | | | | | -1.00 | | | | 4.35 | | | | 3.38 | | |
Class R4* | | 03/19/13 | | | 0.98 | | | | 5.40 | | | | 4.42 | | |
Class R5* | | 11/08/12 | | | 0.98 | | | | 5.42 | | | | 4.43 | | |
Class Z | | 08/19/02 | | | 0.98 | | | | 5.40 | | | | 4.42 | | |
Barclays California 3-15 Year Blend Municipal Bond Index | | | | | | | 2.02 | | | | 5.55 | | | | 4.99 | | |
Barclays 3-15 Year Blend Municipal Bond Index | | | | | | | 0.97 | | | | 4.91 | | | | 4.71 | | |
Returns for Class A are shown with and without the maximum initial sales charge of 3.25%. Returns for Class B are shown with and without the applicable contingent deferred sales charge (CDSC) of 3.00% in the first year, declining to 1.00% in the fourth year and eliminated thereafter. Returns for Class C are shown with and without the 1.00% CDSC for the first year only. The Fund's other classes are not subject to sales charges and have limited eligibility. Please see the Fund's prospectus for details. Performance for different share classes will vary based on differences in sales charges and fees associated with each class. All results shown assume reinvestment of distributions during the period. Returns do not reflect the deduction of taxes that a shareholder may pay on Fund distributions or on the redemption of Fund shares. Performance results reflect the effect of any fee waivers or reimbursements of Fund expenses by Columbia Management Investment Advisers, LLC and/or any of its affiliates. Absent these fee waivers or expense reimbursement arrangements, performance results would have been lower.
The performance information shown represents past performance and is not a guarantee of future results. The investment return and principal value of your investment will fluctuate so that your shares, when redeemed, may be worth more or less than their original cost. Current performance may be lower or higher than the performance information shown. You may obtain performance information current to the most recent month-end by contacting your financial intermediary, visiting columbiamanagement.com or calling 800.345.6611.
*The returns shown for periods prior to the share class inception date (including returns for the Life of the Fund, if shown, which are since Fund inception) include the returns of the Fund's oldest share class. These returns are adjusted to reflect any higher class-related operating expenses of the newer share classes, as applicable. Please visit columbiamanagement.com/mutual-funds/appended-performance for more information.
The Barclays California 3-15 Year Blend Municipal Bond Index tracks investment grade bonds issued from the state of California and its municipalities.
The Barclays 3-15 Year Blend Municipal Bond Index is an unmanaged index that tracks the performance of municipal bonds issued after December 31, 1990, with remaining maturities between 2 and 17 years and at least $7 million in principal amount outstanding.
Indices are not available for investment, are not professionally managed and do not reflect sales charges, fees, brokerage commissions, taxes or other expenses of investing. Securities in the Fund may not match those in an index.
Annual Report 2014
2
Columbia California Intermediate Municipal Bond Fund
Performance Overview (continued)
Performance of a Hypothetical $10,000 Investment (May 1, 2004 – April 30, 2014)
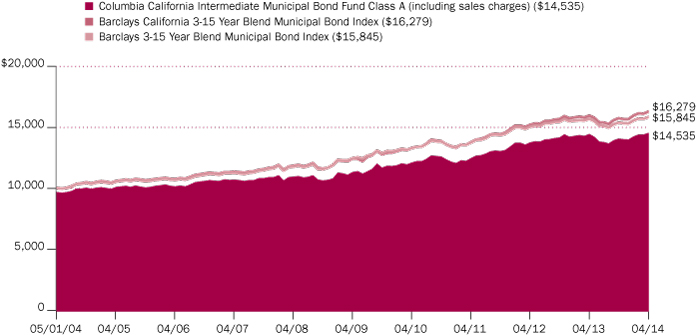
The chart above shows the change in value of a hypothetical $10,000 investment in Class A shares of Columbia California Intermediate Municipal Bond Fund during the stated time period, and does not reflect the deduction of taxes that a shareholder may pay on Fund distributions or on the redemption of Fund shares.
Annual Report 2014
3
Columbia California Intermediate Municipal Bond Fund
Manager Discussion of Fund Performance
Effective July 7, 2014, the Fund will be renamed Columbia AMT-Free California Intermediate Muni Bond Fund.
For the 12-month period that ended April 30, 2014, the Fund's Class A shares returned 0.64% excluding sales charges. Class Z shares of the Fund returned 0.98% for the same 12-month period. During the same time period, the Barclays California 3-15 Year Blend Municipal Bond Index returned 2.02% and the Barclays 3-15 Year Blend Municipal Bond Index returned 0.97%. In an environment of rising interest rates, a slightly longer duration relative to the Barclays California 3-15 Year Blend Municipal Bond Index at the beginning of the period detracted from results.
Stable Economic Growth
Even though a difficult winter weighed on the U.S. economy early in 2014, it was not enough to derail the steady growth that marked the 12-month period. Solid new job growth drove the unemployment rate down to 6.3%. Robust manufacturing activity boosted the nation's capacity utilization rate to a recovery high of 79.2%. Personal income edged higher, borrowing increased and the savings rate declined. Consumer confidence generally rose during the 12-month period, reflecting consumer expectations that the economy was on solid ground. The housing market lost some momentum, the victim of bad winter weather, tighter borrowing standards, rising prices and higher mortgage rates. However, higher pending home sales near the end of the period was a positive data point.
Investors welcomed reduced tensions in Washington, where an extended budget deal and the president's nomination of Janet Yellen as the new Federal Reserve (Fed) chair received bipartisan support. In December 2013, the Fed announced that it would take a measured approach to tapering its monthly bond-buying program, beginning in January 2014. Further tapering commenced in February, March and April. Against this backdrop of generally positive economic news, bonds lost some ground as interest rates moved higher. Nevertheless, the municipal market managed a modestly positive return for the period.
Contributors and Detractors
The special property tax sector was the best performer for the Fund during the period. Positions in tax allocation and special tax bonds benefited from rising assessed property tax values in California. The biggest detractor from performance was the Fund's slightly longer duration positioning relative to the Barclays California 3-15 Year Blend Municipal Bond Index at the beginning of the period, before the Fed's tapering announcement drove interest rates dramatically higher across all maturities. In response to changing market conditions and Fund redemptions, we sold bonds purchased at much lower yields and bonds with coupons below 5%, which we expected to continue to be out of favor. One benefit to this action was that it allowed us to lower the Fund's duration, which offered some protection against higher rates down the road. It also allowed us to realize losses that offset gains from previous activity, creating a gain/loss neutral position for the Fund, which helped it avoid taxable capital gains.
California Continued to Improve
Credit fundamentals, both for the state and for California municipalities, continued to improve over the 12-month period. In fact, the state will have a
Portfolio Management
Brian McGreevy
Paul Fuchs, CFA
Quality Breakdown (%)
(at April 30, 2014) | |
AAA rating | | | 0.7 | | |
AA rating | | | 29.1 | | |
A rating | | | 51.8 | | |
BBB rating | | | 14.6 | | |
Non-investment grade | | | 1.1 | | |
Not rated | | | 2.7 | | |
Total | | | 100.0 | | |
Percentages indicated are based upon total fixed income securities (excluding Money Market Funds).
Bond ratings apply to the underlying holdings of the Fund and not the Fund itself and are divided into categories ranging from AAA (highest) to D (lowest), and are subject to change. The ratings shown are determined by using the middle rating of Moody's, S&P, and Fitch after dropping the highest and lowest available ratings. When a rating from only two agencies is available, the lower rating is used. When a rating from only one agency is available, that rating is used. When a bond is not rated by one of these agencies, it is designated as Not rated. Credit ratings are subjective opinions and not statements of fact.
Investment Risks
There are risks associated with an investment in this Fund, including market risk, credit risk, interest rate risk prepayment and extension risk and state-specific municipal securities risk. In general, bond prices rise when interest rates fall and vice versa. Because the Fund concentrates its investments in municipal securities issued by a single state and its municipalities, specific events or factors affecting a particular state can cause more volatility in the Fund than a fund that is more geographically diversified. This effect is more pronounced for longer-term securities. Non-investment grade securities, commonly called 'high-yield' or 'junk' bonds, have more volatile prices and carry more risk to principal and income than investment grade securities. See the Fund's prospectus for information on these and other risks associated with Fund. Income from tax-exempt funds may be subject to state and local taxes. Federal and state income tax rules will apply to any capital gain distributions and any gains or losses on sales.
Annual Report 2014
4
Columbia California Intermediate Municipal Bond Fund
Manager Discussion of Fund Performance (continued)
budget surplus for 2014 and must decide what to do with it. The governor has proposed a constitutional amendment to establish a more disciplined approach to fund the state's rainy day reserve. Both are welcomed developments. Presently, demand for California municipal bonds remains strong as tax-sensitive investors seek shelter from increasing taxes. The immense wealth creation in Silicon Valley keeps adding to demand for investments that are exempt from federal and state taxes.
Looking Ahead
Municipal fund inflows improved early in 2014, and new issue supply was down 30% over the same period in 2013. That combination has produced a supportive technical environment for the municipal market. Concern about Russia's intentions in the Ukraine also rekindled interest in U.S. Treasury bonds, helping to lower yields. In this environment, we currently intend to maintain the Fund's neutral duration relative to the Barclays California 3-15 Year Blend Municipal Bond Index and favor purchases in the A and BBB quality range. We continue to find good opportunities to invest in California issuers that offer sound credit fundamentals and incremental yield. In addition, we presently believe there is value in bonds maturing in seven to 10 years and in and around 20 years. We think these maturity ranges may do well if rates resume their gradual rise and the yield curve, which depicts the range of yields from short to long-term, assumes a flatter profile.
Annual Report 2014
5
Columbia California Intermediate Municipal Bond Fund
Understanding Your Fund's Expenses
(Unaudited)
As an investor, you incur two types of costs. There are transaction costs, which generally include sales charges on purchases and may include redemption fees. There are also ongoing costs, which generally include management fees, distribution and/or service fees, and other fund expenses. The following information is intended to help you understand your ongoing costs (in dollars) of investing in the Fund and to help you compare these costs with the ongoing costs of investing in other mutual funds.
Analyzing Your Fund's Expenses
To illustrate these ongoing costs, we have provided examples and calculated the expenses paid by investors in each share class of the Fund during the period. The actual and hypothetical information in the table is based on an initial investment of $1,000 at the beginning of the period indicated and held for the entire period. Expense information is calculated two ways and each method provides you with different information. The amount listed in the "Actual" column is calculated using the Fund's actual operating expenses and total return for the period. You may use the Actual information, together with the amount invested, to estimate the expenses that you paid over the period. Simply divide your account value by $1,000 (for example, an $8,600 account value divided by $1,000 = 8.6), then multiply the results by the expenses paid during the period under the "Actual" column. The amount listed in the "Hypothetical" column assumes a 5% annual rate of return before expenses (which is not the Fund's actual return) and then applies the Fund's actual expense ratio for the period to the hypothetical return. You should not use the hypothetical account values and expenses to estimate either your actual account balance at the end of the period or the expenses you paid during the period. See "Compare With Other Funds" below for details on how to use the hypothetical data.
Compare With Other Funds
Since all mutual funds are required to include the same hypothetical calculations about expenses in shareholder reports, you can use this information to compare the ongoing cost of investing in the Fund with other funds. To do so, compare the hypothetical example with the 5% hypothetical examples that appear in the shareholder reports of other funds. As you compare hypothetical examples of other funds, it is important to note that hypothetical examples are meant to highlight the ongoing costs of investing in a fund only and do not reflect any transaction costs, such as sales charges, or redemption or exchange fees. Therefore, the hypothetical calculations are useful in comparing ongoing costs only, and will not help you determine the relative total costs of owning different funds. If transaction costs were included in these calculations, your costs would be higher.
November 1, 2013 – April 30, 2014
| | Account Value at the Beginning
of the Period ($) | | Account Value at the End
of the Period ($) | | Expenses Paid During
the Period ($) | | Fund's Annualized
Expense Ratio (%) | |
| | Actual | | Hypothetical | | Actual | | Hypothetical | | Actual | | Hypothetical | | Actual | |
Class A | | | 1,000.00 | | | | 1,000.00 | | | | 1,033.40 | | | | 1,021.12 | | | | 3.73 | | | | 3.71 | | | | 0.74 | | |
Class B | | | 1,000.00 | | | | 1,000.00 | | | | 1,029.60 | | | | 1,017.41 | | | | 7.50 | | | | 7.45 | | | | 1.49 | | |
Class C | | | 1,000.00 | | | | 1,000.00 | | | | 1,030.60 | | | | 1,017.41 | | | | 7.50 | | | | 7.45 | | | | 1.49 | | |
Class R4 | | | 1,000.00 | | | | 1,000.00 | | | | 1,035.80 | | | | 1,022.36 | | | | 2.47 | | | | 2.46 | | | | 0.49 | | |
Class R5 | | | 1,000.00 | | | | 1,000.00 | | | | 1,035.30 | | | | 1,022.81 | | | | 2.02 | | | | 2.01 | | | | 0.40 | | |
Class Z | | | 1,000.00 | | | | 1,000.00 | | | | 1,034.80 | | | | 1,022.36 | | | | 2.47 | | | | 2.46 | | | | 0.49 | | |
Expenses paid during the period are equal to the annualized expense ratio for each class as indicated above, multiplied by the average account value over the period and then multiplied by the number of days in the Fund's most recent fiscal half year and divided by 365.
Expenses do not include fees and expenses incurred indirectly by the Fund from the underlying funds in which the Fund may invest (also referred to as "acquired funds"), including affiliated and non-affiliated pooled investment vehicles (including mutual funds and exchange-traded funds).
Had Columbia Management Investment Advisers, LLC and/or certain of its affiliates not waived/reimbursed certain fees and expenses, account value at the end of the period would have been reduced.
Annual Report 2014
6
Columbia California Intermediate Municipal Bond Fund
Portfolio of Investments
April 30, 2014
(Percentages represent value of investments compared to net assets)
Municipal Bonds 93.2%
Issue
Description | | Coupon
Rate | | Principal
Amount ($) | |
Value ($) | |
Airport 3.1% | |
City of San Jose
Revenue Bonds
Series 2007B (AMBAC)
03/01/22 | | | 5.000 | % | | | 1,000,000 | | | | 1,061,100 | | |
County of Orange
Revenue Bonds
Series 2009A
07/01/25 | | | 5.250 | % | | | 1,500,000 | | | | 1,712,010 | | |
County of Sacramento
Revenue Bonds
Senior Series 2008 (AGM)
07/01/23 | | | 5.000 | % | | | 1,000,000 | | | | 1,132,240 | | |
San Diego County Regional Airport Authority
Revenue Bonds
Subordinated Series 2010A
07/01/24 | | | 5.000 | % | | | 1,000,000 | | | | 1,140,860 | | |
San Francisco City & County Airports Commission
Refunding Revenue Bonds
2nd Series 2009C (AGM)
05/01/18 | | | 5.000 | % | | | 1,825,000 | | | | 2,113,879 | | |
Revenue Bonds
Series 2011G
05/01/26 | | | 5.250 | % | | | 2,000,000 | | | | 2,325,820 | | |
Total | | | | | | | 9,485,909 | | |
Higher Education 5.6% | |
California Educational Facilities Authority
Revenue Bonds
California Lutheran University
Series 2008
10/01/21 | | | 5.250 | % | | | 1,500,000 | | | | 1,629,945 | | |
Pitzer College
Series 2005A
04/01/25 | | | 5.000 | % | | | 1,225,000 | | | | 1,271,195 | | |
Series 2009
04/01/19 | | | 5.000 | % | | | 1,610,000 | | | | 1,864,670 | | |
University Southern California
Series 2009C
10/01/24 | | | 5.250 | % | | | 3,000,000 | | | | 3,772,950 | | |
California Municipal Finance Authority
Revenue Bonds
Biola University
Series 2013
10/01/24 | | | 5.000 | % | | | 505,000 | | | | 565,857 | | |
10/01/28 | | | 5.000 | % | | | 840,000 | | | | 912,231 | | |
California State Public Works Board
Refunding Revenue Bonds
California State University
Series 2006A (NPFGC)
10/01/16 | | | 5.000 | % | | | 1,000,000 | | | | 1,107,050 | | |
Municipal Bonds (continued)
Issue
Description | | Coupon
Rate | | Principal
Amount ($) | |
Value ($) | |
California State University
Revenue Bonds
Systemwide
Series 2009A
11/01/22 | | | 5.250 | % | | | 2,500,000 | | | | 2,932,575 | | |
California Statewide Communities Development Authority
Revenue Bonds
California Baptist University
Series 2014A
11/01/23 | | | 5.125 | % | | | 715,000 | | | | 738,631 | | |
Lancer Plaza Project
Series 2013
11/01/23 | | | 5.125 | % | | | 1,000,000 | | | | 1,025,330 | | |
University of California
Revenue Bonds
Series 2009O
05/15/20 | | | 5.000 | % | | | 1,000,000 | | | | 1,179,440 | | |
Total | | | | | | | 16,999,874 | | |
Hospital 7.0% | |
ABAG Finance Authority for Nonprofit Corps.
Revenue Bonds
Sharp Healthcare
Series 2011A
08/01/24 | | | 5.250 | % | | | 2,750,000 | | | | 3,143,745 | | |
California Health Facilities Financing Authority
Refunding Revenue Bonds
Sutter Health
Series 2011D
08/15/26 | | | 5.000 | % | | | 2,250,000 | | | | 2,573,955 | | |
Revenue Bonds
Catholic Healthcare West
Series 2009A
07/01/29 | | | 6.000 | % | | | 1,250,000 | | | | 1,434,725 | | |
Series 2009E
07/01/25 | | | 5.625 | % | | | 1,500,000 | | | | 1,677,285 | | |
Children's Hospital of Orange County
Series 2009A
11/01/21 | | | 6.000 | % | | | 2,000,000 | | | | 2,376,820 | | |
City of Hope Obligation Group
Series 2012-A
11/15/21 | | | 5.000 | % | | | 600,000 | | | | 709,926 | | |
California Health Facilities Financing Authority(a)
Revenue Bonds
Lucile Salter Packard Children's Hospital
Series 2014
08/15/28 | | | 5.000 | % | | | 300,000 | | | | 345,513 | | |
California Statewide Communities Development Authority
Revenue Bonds
Health Facility Adventist Health System West
Series 2005A
03/01/17 | | | 5.000 | % | | | 1,000,000 | | | | 1,035,740 | | |
The accompanying Notes to Financial Statements are an integral part of this statement.
Annual Report 2014
7
Columbia California Intermediate Municipal Bond Fund
Portfolio of Investments (continued)
April 30, 2014
Municipal Bonds (continued)
Issue
Description | | Coupon
Rate | | Principal
Amount ($) | |
Value ($) | |
Henry Mayo Newhall Memorial
Series 2014A (AGM)
10/01/27 | | | 5.000 | % | | | 1,000,000 | | | | 1,100,840 | | |
John Muir Health
Series 2006A
08/15/17 | | | 5.000 | % | | | 3,000,000 | | | | 3,282,330 | | |
Kaiser Permanente
Series 2009A
04/01/19 | | | 5.000 | % | | | 2,000,000 | | | | 2,347,340 | | |
Sutter Health
Series 2011A
08/15/26 | | | 5.500 | % | | | 1,000,000 | | | | 1,156,440 | | |
Total | | | | | | | 21,184,659 | | |
Independent Power 2.6% | |
Kings River Conservation District
Certificate of Participation
Peaking Project
Series 2004
05/01/14 | | | 5.000 | % | | | 1,500,000 | | | | 1,500,206 | | |
Sacramento Municipal Utility District
Revenue Bonds
Cosumnes Project
Series 2006 (NPFGC)
07/01/15 | | | 5.000 | % | | | 1,000,000 | | | | 1,048,420 | | |
07/01/29 | | | 5.125 | % | | | 2,000,000 | | | | 2,149,700 | | |
Sacramento Power Authority
Refunding Revenue Bonds
Series 2005 (AMBAC)
07/01/15 | | | 5.250 | % | | | 3,000,000 | | | | 3,161,940 | | |
Total | | | | | | | 7,860,266 | | |
Joint Power Authority 3.9% | |
M-S-R Public Power Agency
Revenue Bonds
Subordinated Lien
Series 2008L (AGM)
07/01/21 | | | 5.000 | % | | | 2,500,000 | | | | 2,815,125 | | |
Northern California Power Agency
Refunding Revenue Bonds
Hydroelectric Project No. 1
Series 2008C (AGM)
07/01/22 | | | 5.000 | % | | | 3,000,000 | | | | 3,437,130 | | |
Southern California Public Power Authority
Refunding Revenue Bonds
Sanitary Power Project
Series 2005A (AGM)
01/01/18 | | | 5.000 | % | | | 2,000,000 | | | | 2,061,700 | | |
Series 2008A
07/01/22 | | | 5.000 | % | | | 2,000,000 | | | | 2,318,720 | | |
Revenue Bonds
Southern Transmission Project
Series 2008
07/01/27 | | | 6.000 | % | | | 1,000,000 | | | | 1,192,620 | | |
Total | | | | | | | 11,825,295 | | |
Municipal Bonds (continued)
Issue
Description | | Coupon
Rate | | Principal
Amount ($) | |
Value ($) | |
Local Appropriation 6.0% | |
City & County of San Francisco
Certificate of Participation
Multiple Capital Improvement Projects
Series 2009B
04/01/24 | | | 5.000 | % | | | 1,495,000 | | | | 1,682,413 | | |
City of Vista
Certificate of Participation
Community Projects
Series 2007 (NPFGC)
05/01/21 | | | 4.750 | % | | | 750,000 | | | | 796,230 | | |
County of Monterey
Certificate of Participation
Refinancing Project
Series 2009 (AGM)
08/01/17 | | | 5.000 | % | | | 1,000,000 | | | | 1,115,070 | | |
Los Angeles Community Redevelopment Agency
Revenue Bonds
VT Manchester Social Services Project
Series 2005 (AMBAC)
09/01/15 | | | 5.000 | % | | | 1,095,000 | | | | 1,164,992 | | |
Oakland Joint Powers Financing Authority
Refunding Revenue Bonds
Oakland Administration Buildings
Series 2008B (AGM)
08/01/22 | | | 5.000 | % | | | 2,000,000 | | | | 2,200,260 | | |
Pasadena Public Financing Authority
Revenue Bonds
Rose Bowl Renovation
Series 2010A
03/01/26 | | | 5.000 | % | | | 2,500,000 | | | | 2,776,725 | | |
Pico Rivera Public Financing Authority
Revenue Bonds
Series 2009
09/01/26 | | | 5.250 | % | | | 1,085,000 | | | | 1,187,685 | | |
Richmond Joint Powers Financing Authority
Refunding Revenue Bonds
Lease-Civic Center Project
Series 2009 (AGM)
08/01/17 | | | 5.000 | % | | | 1,570,000 | | | | 1,768,385 | | |
Riverside Public Financing Authority
Refunding Revenue Bonds
Series 2012-A
11/01/28 | | | 5.000 | % | | | 1,155,000 | | | | 1,246,199 | | |
San Mateo Joint Powers Financing Authority
Refunding Revenue Bonds
Youth Services Campus
Series 2008A
07/15/20 | | | 5.000 | % | | | 435,000 | | | | 487,239 | | |
07/15/28 | | | 5.250 | % | | | 2,275,000 | | | | 2,610,403 | | |
The accompanying Notes to Financial Statements are an integral part of this statement.
Annual Report 2014
8
Columbia California Intermediate Municipal Bond Fund
Portfolio of Investments (continued)
April 30, 2014
Municipal Bonds (continued)
Issue
Description | | Coupon
Rate | | Principal
Amount ($) | |
Value ($) | |
Santa Clara County Financing Authority
Refunding Revenue Bonds
Multiple Facilities Projects
Series 2010N
05/15/17 | | | 5.000 | % | | | 1,000,000 | | | | 1,128,410 | | |
Total | | | | | | | 18,164,011 | | |
Local General Obligation 12.9% | |
City & County of San Francisco
Unlimited General Obligation Bonds
Earthquake Safety
Series 2010E
06/15/27 | | | 5.000 | % | | | 3,380,000 | | | | 3,933,002 | | |
City of Los Angeles
Unlimited General Obligation Bonds
Series 2011A
09/01/25 | | | 5.000 | % | | | 3,000,000 | | | | 3,525,390 | | |
Compton Community College District
Unlimited General Obligation Refunding Bonds
Series 2012
07/01/22 | | | 5.000 | % | | | 2,095,000 | | | | 2,413,754 | | |
Compton Unified School District(b)
Unlimited General Obligation Bonds
Election of 2002 - Capital Appreciation
Series 2006C (AMBAC)
06/01/23 | | | 0.000 | % | | | 2,025,000 | | | | 1,369,690 | | |
06/01/24 | | | 0.000 | % | | | 1,925,000 | | | | 1,228,650 | | |
Culver City School Facilities Financing Authority
Revenue Bonds
Unified School District
Series 2005 (AGM)
08/01/23 | | | 5.500 | % | | | 1,490,000 | | | | 1,854,603 | | |
East Side Union High School District
Unlimited General Obligation Refunding Bonds
2012 Crossover
Series 2006 (AGM)
09/01/20 | | | 5.250 | % | | | 1,280,000 | | | | 1,517,965 | | |
Long Beach Community College District
Unlimited General Obligation Bonds
2008 Election
Series 2012-B
08/01/23 | | | 5.000 | % | | | 700,000 | | | | 836,759 | | |
Los Angeles Unified School District
Unlimited General Obligation Bonds
Election of 2004
Series 2006G (AMBAC)
07/01/20 | | | 5.000 | % | | | 1,000,000 | | | | 1,096,270 | | |
Palomar Community College District
Unlimited General Obligation Bonds
Capital Appreciation-Election of 2006
Series 2010B(b)
08/01/22 | | | 0.000 | % | | | 2,140,000 | | | | 1,681,719 | | |
Municipal Bonds (continued)
Issue
Description | | Coupon
Rate | | Principal
Amount ($) | |
Value ($) | |
Rancho Santiago Community College District
Unlimited General Obligation Refunding Bonds
Series 2005 (AGM)
09/01/19 | | | 5.250 | % | | | 1,000,000 | | | | 1,200,640 | | |
Rancho Santiago Community College District(b)
Unlimited General Obligation Bonds
Capital Appreciation-Election of 2002
Series 2006C (AGM)
09/01/31 | | | 0.000 | % | | | 3,785,000 | | | | 1,681,675 | | |
Rescue Union School District
Unlimited General Obligation Bonds
Capital Appreciation-Election of 1998
Series 2005 (NPFGC)(b)
09/01/26 | | | 0.000 | % | | | 1,100,000 | | | | 658,196 | | |
Riverside Public Financing Authority
Refunding Revenue Bonds
Series 2012-A
11/01/27 | | | 5.000 | % | | | 2,145,000 | | | | 2,324,022 | | |
San Mateo County Community College District
Unlimited General Obligation Bonds
Capital Appreciation-Election of 2005
Series 2006A (NPFGC)(b)
09/01/15 | | | 0.000 | % | | | 1,000,000 | | | | 994,850 | | |
San Mateo Foster City School District
Revenue Bonds
Series 2005 (AGM)
08/15/19 | | | 5.500 | % | | | 2,000,000 | | | | 2,419,400 | | |
Saugus Union School District
Unlimited General Obligation Refunding Bonds
Series 2006 (NPFGC)
08/01/21 | | | 5.250 | % | | | 2,375,000 | | | | 2,879,521 | | |
Simi Valley School Financing Authority
Refunding Revenue Bonds
Simi Valley Unified School District
Series 2007
08/01/18 | | | 5.000 | % | | | 1,045,000 | | | | 1,204,018 | | |
West Contra Costa Unified School District
Unlimited General Obligation Refunding Bonds
Series 2011 (AGM)
08/01/23 | | | 5.250 | % | | | 3,000,000 | | | | 3,481,980 | | |
Series 2012
08/01/27 | | | 5.000 | % | | | 2,365,000 | | | | 2,636,100 | | |
Total | | | | | | | 38,938,204 | | |
Multi-Family 1.2% | |
California Statewide Communities Development Authority
Refunding Revenue Bonds
University of California Irvine East Campus Apartments
Series 2012
05/15/19 | | | 5.000 | % | | | 1,000,000 | | | | 1,130,920 | | |
05/15/20 | | | 5.000 | % | | | 750,000 | | | | 850,605 | | |
The accompanying Notes to Financial Statements are an integral part of this statement.
Annual Report 2014
9
Columbia California Intermediate Municipal Bond Fund
Portfolio of Investments (continued)
April 30, 2014
Municipal Bonds (continued)
Issue
Description | | Coupon
Rate | | Principal
Amount ($) | |
Value ($) | |
Revenue Bonds
CHF-Irvine LLC-UCI East Campus
Series 2008
05/15/17 | | | 5.000 | % | | | 1,500,000 | | | | 1,666,695 | | |
Total | | | | | | | 3,648,220 | | |
Municipal Power 8.2% | |
City of Riverside Electric
Revenue Bonds
Series 2008D (AGM)
10/01/23 | | | 5.000 | % | | | 1,000,000 | | | | 1,109,940 | | |
City of Santa Clara
Refunding Revenue Bonds
Series 2011A
07/01/29 | | | 5.375 | % | | | 1,000,000 | | | | 1,119,950 | | |
City of Vernon Electric System
Revenue Bonds
Series 2009A
08/01/21 | | | 5.125 | % | | | 3,900,000 | | | | 4,322,175 | | |
Imperial Irrigation District
Refunding Revenue Bonds
Systems
Series 2008
11/01/21 | | | 5.250 | % | | | 2,500,000 | | | | 2,870,475 | | |
Series 2011D
11/01/22 | | | 5.000 | % | | | 2,860,000 | | | | 3,328,268 | | |
11/01/23 | | | 5.000 | % | | | 1,040,000 | | | | 1,191,954 | | |
Los Angeles Department of Water & Power
Revenue Bonds
Power System
Series 2009B
07/01/23 | | | 5.250 | % | | | 2,000,000 | | | | 2,370,440 | | |
Subordinated Series 2007A-1 (AMBAC)
07/01/19 | | | 5.000 | % | | | 1,000,000 | | | | 1,132,210 | | |
Sacramento Municipal Utility District
Revenue Bonds
Series 2008U (AGM)
08/15/21 | | | 5.000 | % | | | 1,500,000 | | | | 1,723,590 | | |
State of California Department of Water Resources
Revenue Bonds
Series 2005G-11
05/01/18 | | | 5.000 | % | | | 2,000,000 | | | | 2,315,440 | | |
Tuolumne Wind Project Authority
Revenue Bonds
Tuolumne Co. Project
Series 2009
01/01/22 | | | 5.000 | % | | | 1,000,000 | | | | 1,125,000 | | |
Walnut Energy Center Authority
Revenue Bonds
Series 2004A (AMBAC)
01/01/16 | | | 5.000 | % | | | 2,055,000 | | | | 2,063,035 | | |
Total | | | | | | | 24,672,477 | | |
Municipal Bonds (continued)
Issue
Description | | Coupon
Rate | | Principal
Amount ($) | |
Value ($) | |
Other Bond Issue 0.8% | |
Long Beach Bond Finance Authority
Refunding Revenue Bonds
Aquarium of the Pacific
Series 2012
11/01/27 | | | 5.000 | % | | | 2,210,000 | | | | 2,436,260 | | |
Ports 2.0% | |
Los Angeles Harbor Department
Revenue Bonds
Series 2009A
08/01/23 | | | 5.250 | % | | | 2,000,000 | | | | 2,358,020 | | |
Port of Oakland
Refunding Revenue Bonds
Intermediate Lien
Series 2007B (NPFGC)
11/01/29 | | | 5.000 | % | | | 1,165,000 | | | | 1,280,195 | | |
San Diego Unified Port District
Refunding Revenue Bonds
Series 2013A
09/01/27 | | | 5.000 | % | | | 1,000,000 | | | | 1,122,770 | | |
09/01/28 | | | 5.000 | % | | | 1,100,000 | | | | 1,230,394 | | |
Total | | | | | | | 5,991,379 | | |
Prepaid Gas 0.8% | |
M-S-R Energy Authority
Revenue Bonds
Series 2009B
11/01/29 | | | 6.125 | % | | | 2,000,000 | | | | 2,453,480 | | |
Refunded/Escrowed 3.7% | |
Bay Area Infrastructure Financing Authority
Prerefunded 08/01/14 Revenue Bonds
State Payment Acceleration Notes
Series 2006 (NPFGC)
08/01/17 | | | 5.000 | % | | | 2,000,000 | | | | 2,024,380 | | |
Bay Area Toll Authority
Prerefunded 04/01/16 Revenue Bonds
San Francisco Bay Area
Series 2006F (FHLMC/FNMA)
04/01/22 | | | 5.000 | % | | | 1,100,000 | | | | 1,197,647 | | |
California Health Facilities Financing Authority
Revenue Bonds
Insured Episcopal Home
Series 2010B Escrowed to Maturity
02/01/19 | | | 5.100 | % | | | 615,000 | | | | 684,858 | | |
California Infrastructure & Economic Development Bank
Prerefunded 02/01/15 Revenue Bonds
California Independent System Operator
Series 2009A
02/01/22 | | | 5.250 | % | | | 1,900,000 | | | | 1,972,580 | | |
The accompanying Notes to Financial Statements are an integral part of this statement.
Annual Report 2014
10
Columbia California Intermediate Municipal Bond Fund
Portfolio of Investments (continued)
April 30, 2014
Municipal Bonds (continued)
Issue
Description | | Coupon
Rate | | Principal
Amount ($) | |
Value ($) | |
California State Public Works Board
Prerefunded 04/01/15 Revenue Bonds
University California Institute Project
Series 2005C
04/01/16 | | | 5.000 | % | | | 1,000,000 | | | | 1,044,160 | | |
Revenue Bonds
Various University of California Projects
Series 2005D Escrowed to Maturity
05/01/15 | | | 5.000 | % | | | 1,000,000 | | | | 1,048,160 | | |
City of Newport Beach
Prerefunded 12/01/21 Revenue Bonds
Hoag Memorial Hospital Presbyterian
Series 2011
12/01/30 | | | 5.875 | % | | | 1,000,000 | | | | 1,280,170 | | |
Los Alamitos Unified School District
Unlimited General Obligation Bonds
School Facilities Improvement
BAN Series 2011 Escrowed to Maturity(b)
09/01/16 | | | 0.000 | % | | | 2,000,000 | | | | 1,982,000 | | |
Total | | | | | | | 11,233,955 | | |
Retirement Communities 3.0% | |
ABAG Finance Authority for Nonprofit Corps.
Refunding Revenue Bonds
Episcopal Senior Communities
Series 2011
07/01/24 | | | 5.375 | % | | | 2,795,000 | | | | 3,050,547 | | |
Revenue Bonds
Casa de Las Campanas, Inc.
Series 2010
09/01/15 | | | 4.000 | % | | | 1,020,000 | | | | 1,059,433 | | |
Episcopal Senior Communities
Series 2012B
07/01/21 | | | 5.000 | % | | | 1,000,000 | | | | 1,088,070 | | |
California Health Facilities Financing Authority
Revenue Bonds
Insured California Nevada-Methodist
Series 2006
07/01/26 | | | 5.000 | % | | | 1,000,000 | | | | 1,071,170 | | |
California Statewide Communities Development Authority
Refunding Revenue Bonds
Episcopal Communities and Services
Series 2012
05/15/27 | | | 5.000 | % | | | 1,520,000 | | | | 1,621,749 | | |
Revenue Bonds
Insured Redwoods Project
Series 2013I
11/15/28 | | | 5.000 | % | | | 1,000,000 | | | | 1,082,060 | | |
Total | | | | | | | 8,973,029 | | |
Municipal Bonds (continued)
Issue
Description | | Coupon
Rate | | Principal
Amount ($) | |
Value ($) | |
Special Non Property Tax 2.4% | |
State of California
Unlimited General Obligation Refunding Bonds
Series 2009A
07/01/18 | | | 5.000 | % | | | 3,000,000 | | | | 3,491,490 | | |
Virgin Islands Public Finance Authority(c)
Refunding Revenue Bonds
Series 2013B
10/01/24 | | | 5.000 | % | | | 1,740,000 | | | | 1,972,360 | | |
Revenue Bonds
Matching Fund Loan-Senior Lien
Series 2010A
10/01/20 | | | 5.000 | % | | | 1,490,000 | | | | 1,686,471 | | |
Total | | | | | | | 7,150,321 | | |
Special Property Tax 7.3% | |
Chino Public Financing Authority
Refunding Special Tax Bonds
Series 2012
09/01/23 | | | 5.000 | % | | | 1,070,000 | | | | 1,171,875 | | |
County of El Dorado
Refunding Special Tax Bonds
Community Facilities District No. 92-1
Series 2012
09/01/26 | | | 5.000 | % | | | 630,000 | | | | 690,461 | | |
09/01/27 | | | 5.000 | % | | | 805,000 | | | | 878,432 | | |
Culver City Redevelopment Finance Authority
Refunding Tax Allocation Bonds
Series 1993 (AMBAC)
11/01/14 | | | 5.500 | % | | | 385,000 | | | | 389,620 | | |
Fontana Public Finance Authority
Tax Allocation Bonds
Subordinated Lien-North Fontana Redevelopment
Series 2005A (AMBAC)
10/01/20 | | | 5.000 | % | | | 1,515,000 | | | | 1,588,568 | | |
Glendale Redevelopment Agency
Refunding Tax Allocation Bonds
Central Glendale Redevelopment
Subordinated Series 2013 (AGM)
12/01/21 | | | 5.000 | % | | | 755,000 | | | | 881,546 | | |
Inglewood Redevelopment Agency
Refunding Tax Allocation Bonds
Merged Redevelopment Project
Series 1998A (AMBAC)
05/01/17 | | | 5.250 | % | | | 1,425,000 | | | | 1,540,881 | | |
La Quinta Redevelopment Agency
Refunding Tax Allocation Bonds
Redevelopment Project
Subordinated Series 2013A
09/01/30 | | | 5.000 | % | | | 1,500,000 | | | | 1,615,830 | | |
The accompanying Notes to Financial Statements are an integral part of this statement.
Annual Report 2014
11
Columbia California Intermediate Municipal Bond Fund
Portfolio of Investments (continued)
April 30, 2014
Municipal Bonds (continued)
Issue
Description | | Coupon
Rate | | Principal
Amount ($) | |
Value ($) | |
Long Beach Bond Finance Authority
Tax Allocation Bonds
Industrial Redevelopment Project Areas
Series 2002B (AMBAC)
11/01/19 | | | 5.500 | % | | | 1,070,000 | | | | 1,249,589 | | |
Oakland Redevelopment Successor Agency
Refunding Tax Allocation Bonds
Subordinated Series 2013
09/01/22 | | | 5.000 | % | | | 2,000,000 | | | | 2,288,240 | | |
Poway Unified School District
Special Tax Bonds
Community Facilities District No. 6-4S Ranch
Series 2012
09/01/28 | | | 5.000 | % | | | 1,785,000 | | | | 1,955,432 | | |
09/01/29 | | | 5.000 | % | | | 1,205,000 | | | | 1,311,016 | | |
San Francisco City & County Redevelopment Agency
Tax Allocation Bonds
Mission Bay South Redevelopment Project
Series 2014A
08/01/29 | | | 5.000 | % | | | 225,000 | | | | 243,365 | | |
08/01/30 | | | 5.000 | % | | | 175,000 | | | | 187,913 | | |
San Francisco Redevelopment Projects
Series 2009B
08/01/18 | | | 5.000 | % | | | 1,255,000 | | | | 1,380,776 | | |
Santa Clara Redevelopment Agency
Tax Allocation Bonds
Capital Appreciation-Bayshore North Project
Series 2011(b)
06/01/14 | | | 0.000 | % | | | 1,005,000 | | | | 1,004,309 | | |
Sulphur Springs Union School District
Refunding Special Tax Bonds
Community Facilities District No. 2002-1-SE
Series 2012
09/01/28 | | | 5.000 | % | | | 1,050,000 | | | | 1,153,414 | | |
09/01/29 | | | 5.000 | % | | | 1,180,000 | | | | 1,288,230 | | |
Tustin Community Redevelopment Agency
Tax Allocation Bonds
MCAS-Tustin Redevelopment Project Area
Series 2010
09/01/25 | | | 5.000 | % | | | 1,250,000 | | | | 1,332,687 | | |
Total | | | | | | | 22,152,184 | | |
State Appropriated 6.6% | |
California State Public Works Board
Refunding Revenue Bonds
Various Capital Projects
Series 2012G
11/01/28 | | | 5.000 | % | | | 1,500,000 | | | | 1,672,410 | | |
Revenue Bonds
Department General Services
Series 2006A
04/01/28 | | | 5.000 | % | | | 1,000,000 | | | | 1,042,530 | | |
Municipal Bonds (continued)
Issue
Description | | Coupon
Rate | | Principal
Amount ($) | |
Value ($) | |
Department of Corrections and Rehabilitation
Series 2014C
10/01/22 | | | 5.000 | % | | | 1,925,000 | | | | 2,281,087 | | |
Department of General Services-Butterfeld State
Series 2005A
06/01/15 | | | 5.000 | % | | | 1,200,000 | | | | 1,261,800 | | |
Series 2014A
09/01/31 | | | 5.000 | % | | | 3,000,000 | | | | 3,329,580 | | |
Various Capital Projects
Series 2011A
10/01/20 | | | 5.000 | % | | | 2,000,000 | | | | 2,356,420 | | |
Series 2013I
11/01/28 | | | 5.250 | % | | | 3,000,000 | | | | 3,455,370 | | |
Subordinated Series 2009I-1
11/01/17 | | | 5.000 | % | | | 2,000,000 | | | | 2,284,560 | | |
Subordinated Series 2010A-1
03/01/22 | | | 5.250 | % | | | 2,000,000 | | | | 2,318,540 | | |
Total | | | | | | | 20,002,297 | | |
State General Obligation 6.9% | |
State of California
Unlimited General Obligation Bonds
Series 2010
11/01/24 | | | 5.000 | % | | | 5,000,000 | | | | 5,801,250 | | |
Various Purpose
Series 2007
12/01/26 | | | 5.000 | % | | | 2,000,000 | | | | 2,205,340 | | |
Series 2009
04/01/26 | | | 5.625 | % | | | 2,000,000 | | | | 2,349,300 | | |
10/01/29 | | | 5.250 | % | | | 1,500,000 | | | | 1,698,885 | | |
Series 2011
10/01/19 | | | 5.000 | % | | | 4,000,000 | | | | 4,735,120 | | |
Unlimited General Obligation Refunding Bonds
Series 2007
08/01/18 | | | 5.000 | % | | | 3,750,000 | | | | 4,208,513 | | |
Total | | | | | | | 20,998,408 | | |
Tobacco 0.4% | |
Golden State Tobacco Securitization Corp.
Asset-Backed Revenue Bonds
Series 2005A (AMBAC)
06/01/14 | | | 5.000 | % | | | 1,250,000 | | | | 1,254,918 | | |
Turnpike/Bridge/Toll Road 1.1% | |
Foothill-Eastern Transportation Corridor Agency
Refunding Revenue Bonds
Subordinated Series 2014B-3(d)
01/15/53 | | | 5.500 | % | | | 3,000,000 | | | | 3,397,230 | | |
Water & Sewer 7.7% | |
City of Fresno Sewer System
Revenue Bonds
Series 2008A
09/01/23 | | | 5.000 | % | | | 1,000,000 | | | | 1,148,440 | | |
The accompanying Notes to Financial Statements are an integral part of this statement.
Annual Report 2014
12
Columbia California Intermediate Municipal Bond Fund
Portfolio of Investments (continued)
April 30, 2014
Municipal Bonds (continued)
Issue
Description | | Coupon
Rate | | Principal
Amount ($) | |
Value ($) | |
City of Los Angeles Wastewater System
Refunding Revenue Bonds
Series 2009A
06/01/25 | | | 5.750 | % | | | 2,000,000 | | | | 2,348,480 | | |
Clovis Public Financing Authority
Revenue Bonds
Series 2007 (AMBAC)
08/01/21 | | | 5.000 | % | | | 1,000,000 | | | | 1,062,490 | | |
Kern County Water Agency Improvement District No. 4
Certificate of Participation
Series 2008A
05/01/22 | | | 5.000 | % | | | 2,020,000 | | | | 2,223,414 | | |
Oxnard Financing Authority
Revenue Bonds
Project
Series 2006
06/01/31 | | | 5.000 | % | | | 4,315,000 | | | | 4,448,377 | | |
Redwood Trunk Sewer & Headworks
Series 2004A (NPFGC)
06/01/29 | | | 5.000 | % | | | 2,000,000 | | | | 2,001,540 | | |
Sacramento County Sanitation Districts Financing Authority
Revenue Bonds
County Sanitation District 1
Series 2005 (NPFGC)
08/01/22 | | | 5.000 | % | | | 1,500,000 | | | | 1,582,380 | | |
Sacramento Regional County Sanitation
Series 2006 (NPFGC)
12/01/17 | | | 5.000 | % | | | 1,000,000 | | | | 1,090,850 | | |
San Diego Public Facilities Financing Authority
Refunding Revenue Bonds
Senior Series 2009B
05/15/25 | | | 5.250 | % | | | 1,500,000 | | | | 1,745,970 | | |
Series 2010A
08/01/24 | | | 5.000 | % | | | 2,000,000 | | | | 2,328,040 | | |
Municipal Bonds (continued)
Issue
Description | | Coupon
Rate | | Principal
Amount ($) | |
Value ($) | |
Semitropic Improvement District
Refunding Revenue Bonds
Series 2012-A
12/01/23 | | | 5.000 | % | | | 2,850,000 | | | | 3,309,163 | | |
Total | | | | | | | 23,289,144 | | |
Total Municipal Bonds
(Cost: $261,060,009) | | | | | | | 282,111,520 | | |
Municipal Short Term 0.4%
Issue
Description | | Effective
Yield | | Principal
Amount ($) | |
Value ($) | |
Disposal 0.4% | |
California Pollution Control Financing Authority
Revenue Bonds
Republic Services
VRDN Series 2010B(a)(d)(e)
08/01/24 | | | 0.350 | % | | | 1,250,000 | | | | 1,250,000 | | |
Total Municipal Short Term
(Cost: $1,250,000) | | | | | | | 1,250,000 | | |
Money Market Funds 5.8%
| | | Shares | | Value ($) | |
JPMorgan Tax-Free Money Market Fund,
0.010%(f) | | | 17,692,734 | | | | 17,692,734 | | |
Total Money Market Funds
(Cost: $17,692,734) | | | | | 17,692,734 | | |
Total Investments
(Cost: $280,002,743) | | | | | 301,054,254 | | |
Other Assets & Liabilities, Net | | | | | 1,858,128 | | |
Net Assets | | | | | 302,912,382 | | |
Notes to Portfolio of Investments
(a) Represents a security purchased on a when-issued or delayed delivery basis.
(b) Zero coupon bond.
(c) Municipal obligations include debt obligations issued by or on behalf of territories, possessions, or sovereign nations within the territorial boundaries of the United States. At April 30, 2014, the value of these securities amounted to $3,658,831 or 1.21% of net assets.
(d) Variable rate security.
(e) Security exempt from registration pursuant to Rule 144A under the Securities Act of 1933. This security may be resold in transactions exempt from registration, normally to qualified institutional buyers. At April 30, 2014, the value of these securities amounted to $1,250,000 or 0.41% of net assets.
(f) The rate shown is the seven-day current annualized yield at April 30, 2014.
The accompanying Notes to Financial Statements are an integral part of this statement.
Annual Report 2014
13
Columbia California Intermediate Municipal Bond Fund
Portfolio of Investments (continued)
April 30, 2014
Notes to Portfolio of Investments (continued)
Abbreviation Legend
AGM Assured Guaranty Municipal Corporation
AMBAC Ambac Assurance Corporation
BAN Bond Anticipation Note
FHLMC Federal Home Loan Mortgage Corporation
FNMA Federal National Mortgage Association
NPFGC National Public Finance Guarantee Corporation
VRDN Variable Rate Demand Note
Fair Value Measurements
Generally accepted accounting principles (GAAP) require disclosure regarding the inputs and valuation techniques used to measure fair value and any changes in valuation inputs or techniques. In addition, investments shall be disclosed by major category.
The Fund categorizes its fair value measurements according to a three-level hierarchy that maximizes the use of observable inputs and minimizes the use of unobservable inputs by prioritizing that the most observable input be used when available. Observable inputs are those that market participants would use in pricing an investment based on market data obtained from sources independent of the reporting entity. Unobservable inputs are those that reflect the Fund's assumptions about the information market participants would use in pricing an investment. An investment's level within the fair value hierarchy is based on the lowest level of any input that is deemed significant to the asset or liability's fair value measurement. The input levels are not necessarily an indication of the risk or liquidity associated with investments at that level. For example, certain U.S. government securities are generally high quality and liquid, however, they are reflected as Level 2 because the inputs used to determine fair value may not always be quoted prices in an active market.
Fair value inputs are summarized in the three broad levels listed below:
> Level 1 — Valuations based on quoted prices for investments in active markets that the Fund has the ability to access at the measurement date (including NAV for open-end mutual funds). Valuation adjustments are not applied to Level 1 investments.
> Level 2 — Valuations based on other significant observable inputs (including quoted prices for similar securities, interest rates, prepayment speeds, credit risks, etc.).
> Level 3 — Valuations based on significant unobservable inputs (including the Fund's own assumptions and judgment in determining the fair value of investments).
Inputs that are used in determining fair value of an investment may include price information, credit data, volatility statistics, and other factors. These inputs can be either observable or unobservable. The availability of observable inputs can vary between investments, and is affected by various factors such as the type of investment, and the volume and level of activity for that investment or similar investments in the marketplace. The inputs will be considered by the Investment Manager, along with any other relevant factors in the calculation of an investment's fair value. The Fund uses prices and inputs that are current as of the measurement date, which may include periods of market dislocations. During these periods, the availability of prices and inputs may be reduced for many investments. This condition could cause an investment to be reclassified between the various levels within the hierarchy.
Short-term securities are valued using amortized cost, as permitted under Rule 2a-7 of the Investment Company Act of 1940, as amended. Generally, amortized cost approximates the current fair value of these securities, but because the value is not obtained from a quoted price in an active market, such securities are reflected as Level 2.
Investments falling into the Level 3 category are primarily supported by quoted prices from brokers and dealers participating in the market for those investments. However, these may be classified as Level 3 investments due to lack of market transparency and corroboration to support these quoted prices. Additionally, valuation models may be used as the pricing source for any remaining investments classified as Level 3. These models may rely on one or more significant unobservable inputs and/or significant assumptions by the Investment Manager. Inputs used in valuations may include, but are not limited to, financial statement analysis, capital account balances, discount rates and estimated cash flows, and comparable company data.
Under the direction of the Fund's Board of Trustees (the Board), the Investment Manager's Valuation Committee (the Committee) is responsible for overseeing the valuation procedures approved by the Board. The Committee consists of voting and non-voting members from various groups within the Investment Manager's organization, including operations and accounting, trading and investments, compliance, risk management and legal.
The accompanying Notes to Financial Statements are an integral part of this statement.
Annual Report 2014
14
Columbia California Intermediate Municipal Bond Fund
Portfolio of Investments (continued)
April 30, 2014
Fair Value Measurements (continued)
The Committee meets at least monthly to review and approve valuation matters, which may include a description of specific valuation determinations, data regarding pricing information received from approved pricing vendors and brokers and the results of Board-approved valuation control policies and procedures (the Policies). The Policies address, among other things, instances when market quotations are or are not readily available, including recommendations of third party pricing vendors and a determination of appropriate pricing methodologies; events that require specific valuation determinations and assessment of fair value techniques; securities with a potential for stale pricing, including those that are illiquid, restricted, or in default; and the effectiveness of third party pricing vendors, including periodic reviews of vendors. The Committee meets more frequently, as needed, to discuss additional valuation matters, which may include the need to review back-testing results, review time-sensitive information or approve related valuation actions. The Committee reports to the Board, with members of the Committee meeting with the Board at each of its regularly scheduled meetings to discuss valuation matters and actions during the period, similar to those described earlier.
For investments categorized as Level 3, the Committee monitors information similar to that described above, which may include: (i) data specific to the issuer or comparable issuers, (ii) general market or specific sector news and (iii) quoted prices and specific or similar security transactions. The Committee considers this data and any changes from prior periods in order to assess the reasonableness of observable and unobservable inputs, any assumptions or internal models used to value those securities and changes in fair value. This data is also used to corroborate, when available, information received from approved pricing vendors and brokers. Various factors impact the frequency of monitoring this information (which may occur as often as daily). However, the Committee may determine that changes to inputs, assumptions and models are not required as a result of the monitoring procedures performed.
The following table is a summary of the inputs used to value the Fund's investments at April 30, 2014:
Description | | Level 1
Quoted Prices in Active
Markets for Identical
Assets ($) | | Level 2
Other Significant
Observable Inputs ($) | | Level 3
Significant
Unobservable Inputs ($) | | Total ($) | |
Bonds | |
Municipal Bonds | | | — | | | | 282,111,520 | | | | — | | | | 282,111,520 | | |
Total Bonds | | | — | | | | 282,111,520 | | | | — | | | | 282,111,520 | | |
Short-Term Securities | |
Municipal Short Term | | | — | | | | 1,250,000 | | | | — | | | | 1,250,000 | | |
Total Short-Term Securities | | | — | | | | 1,250,000 | | | | — | | | | 1,250,000 | | |
Mutual Funds | |
Money Market Funds | | | 17,692,734 | | | | — | | | | — | | | | 17,692,734 | | |
Total Mutual Funds | | | 17,692,734 | | | | — | | | | — | | | | 17,692,734 | | |
Total | | | 17,692,734 | | | | 283,361,520 | | | | — | | | | 301,054,254 | | |
See the Portfolio of Investments for all investment classifications not indicated in the table.
The Fund's assets assigned to the Level 2 input category are generally valued using the market approach, in which a security's value is determined through reference to prices and information from market transactions for similar or identical assets.
There were no transfers of financial assets between levels during the period.
The accompanying Notes to Financial Statements are an integral part of this statement.
Annual Report 2014
15
Columbia California Intermediate Municipal Bond Fund
Statement of Assets and Liabilities
April 30, 2014
Assets | |
Investments, at value | |
(identified cost $280,002,743) | | $ | 301,054,254 | | |
Receivable for: | |
Capital shares sold | | | 916,688 | | |
Interest | | | 3,665,253 | | |
Expense reimbursement due from Investment Manager | | | 1,812 | | |
Prepaid expenses | | | 752 | | |
Total assets | | | 305,638,759 | | |
Liabilities | |
Payable for: | |
Investments purchased on a delayed delivery basis | | | 1,595,513 | | |
Capital shares purchased | | | 194,638 | | |
Dividend distributions to shareholders | | | 781,413 | | |
Investment management fees | | | 3,302 | | |
Distribution and/or service fees | | | 480 | | |
Transfer agent fees | | | 47,526 | | |
Administration fees | | | 571 | | |
Compensation of board members | | | 69,929 | | |
Other expenses | | | 33,005 | | |
Total liabilities | | | 2,726,377 | | |
Net assets applicable to outstanding capital stock | | $ | 302,912,382 | | |
Represented by | |
Paid-in capital | | $ | 284,291,453 | | |
Excess of distributions over net investment income | | | (51,814 | ) | |
Accumulated net realized loss | | | (2,378,768 | ) | |
Unrealized appreciation (depreciation) on: | |
Investments | | | 21,051,511 | | |
Total — representing net assets applicable to outstanding capital stock | | $ | 302,912,382 | | |
The accompanying Notes to Financial Statements are an integral part of this statement.
Annual Report 2014
16
Columbia California Intermediate Municipal Bond Fund
Statement of Assets and Liabilities (continued)
April 30, 2014
Class A | |
Net assets | | $ | 33,140,098 | | |
Shares outstanding | | | 3,179,442 | | |
Net asset value per share | | $ | 10.42 | | |
Maximum offering price per share(a) | | $ | 10.77 | | |
Class B | |
Net assets | | $ | 26,624 | | |
Shares outstanding | | | 2,554 | | |
Net asset value per share | | $ | 10.42 | | |
Class C | |
Net assets | | $ | 9,252,669 | | |
Shares outstanding | | | 888,256 | | |
Net asset value per share | | $ | 10.42 | | |
Class R4 | |
Net assets | | $ | 51,697 | | |
Shares outstanding | | | 4,976 | | |
Net asset value per share | | $ | 10.39 | | |
Class R5 | |
Net assets | | $ | 340,685 | | |
Shares outstanding | | | 32,858 | | |
Net asset value per share | | $ | 10.37 | | |
Class Z | |
Net assets | | $ | 260,100,609 | | |
Shares outstanding | | | 25,013,556 | | |
Net asset value per share | | $ | 10.40 | | |
(a) The maximum offering price per share is calculated by dividing the net asset value per share by 1.0 minus the maximum sales charge of 3.25%.
The accompanying Notes to Financial Statements are an integral part of this statement.
Annual Report 2014
17
Columbia California Intermediate Municipal Bond Fund
Statement of Operations
Year Ended April 30, 2014
Net investment income | |
Income: | |
Dividends | | $ | 733 | | |
Interest | | | 11,160,399 | | |
Total income | | | 11,161,132 | | |
Expenses: | |
Investment management fees | | | 1,163,315 | | |
Distribution and/or service fees | |
Class A | | | 74,210 | | |
Class B | | | 202 | | |
Class C | | | 90,675 | | |
Transfer agent fees | |
Class A | | | 56,825 | | |
Class B | | | 39 | | |
Class C | | | 17,381 | | |
Class R4 | | | 7 | | |
Class R5 | | | 42 | | |
Class Z | | | 483,021 | | |
Administration fees | | | 201,539 | | |
Compensation of board members | | | 23,540 | | |
Custodian fees | | | 2,862 | | |
Printing and postage fees | | | 29,380 | | |
Registration fees | | | 25,183 | | |
Professional fees | | | 33,622 | | |
Other | | | 29,966 | | |
Total expenses | | | 2,231,809 | | |
Fees waived or expenses reimbursed by Investment Manager and its affiliates | | | (651,807 | ) | |
Expense reductions | | | (40 | ) | |
Total net expenses | | | 1,579,962 | | |
Net investment income | | | 9,581,170 | | |
Realized and unrealized gain (loss) — net | |
Net realized gain (loss) on: | |
Investments | | | (2,226,103 | ) | |
Net realized loss | | | (2,226,103 | ) | |
Net change in unrealized appreciation (depreciation) on: | |
Investments | | | (6,035,349 | ) | |
Net change in unrealized appreciation (depreciation) | | | (6,035,349 | ) | |
Net realized and unrealized loss | | | (8,261,452 | ) | |
Net increase in net assets resulting from operations | | $ | 1,319,718 | | |
The accompanying Notes to Financial Statements are an integral part of this statement.
Annual Report 2014
18
Columbia California Intermediate Municipal Bond Fund
Statement of Changes in Net Assets
| | | Year Ended
April 30,
2014 | | Year Ended
April 30,
2013(a)(b) | |
Operations | |
Net investment income | | $ | 9,581,170 | | | $ | 9,576,446 | | |
Net realized gain (loss) | | | (2,226,103 | ) | | | 130,925 | | |
Net change in unrealized appreciation (depreciation) | | | (6,035,349 | ) | | | 5,447,610 | | |
Net increase in net assets resulting from operations | | | 1,319,718 | | | | 15,154,981 | | |
Distributions to shareholders | |
Net investment income | |
Class A | | | (921,325 | ) | | | (739,053 | ) | |
Class B | | | (477 | ) | | | (311 | ) | |
Class C | | | (213,531 | ) | | | (136,370 | ) | |
Class R4 | | | (122 | ) | | | (9 | ) | |
Class R5 | | | (2,943 | ) | | | (39 | ) | |
Class Z | | | (8,442,772 | ) | | | (8,700,664 | ) | |
Total distributions to shareholders | | | (9,581,170 | ) | | | (9,576,446 | ) | |
Increase (decrease) in net assets from capital stock activity | | | (7,554,167 | ) | | | 33,602,163 | | |
Total increase (decrease) in net assets | | | (15,815,619 | ) | | | 39,180,698 | | |
Net assets at beginning of year | | | 318,728,001 | | | | 279,547,303 | | |
Net assets at end of year | | $ | 302,912,382 | | | $ | 318,728,001 | | |
Excess of distributions over net investment income | | $ | (51,814 | ) | | $ | (65,425 | ) | |
(a) Class R4 shares are for the period from March 19, 2013 (commencement of operations) to April 30, 2013.
(b) Class R5 shares are for the period from November 8, 2012 (commencement of operations) to April 30, 2013.
The accompanying Notes to Financial Statements are an integral part of this statement.
Annual Report 2014
19
Columbia California Intermediate Municipal Bond Fund
Statement of Changes in Net Assets (continued)
| | | Year Ended April 30, 2014 | | Year Ended April 30, 2013(a)(b) | |
| | | Shares | | Dollars ($) | | Shares | | Dollars ($) | |
Capital stock activity | |
Class A shares | |
Subscriptions(c) | | | 1,717,006 | | | | 17,569,379 | | | | 2,152,204 | | | | 22,901,982 | | |
Distributions reinvested | | | 71,345 | | | | 731,002 | | | | 49,555 | | | | 525,977 | | |
Redemptions | | | (1,361,863 | ) | | | (13,919,575 | ) | | | (1,375,792 | ) | | | (14,598,606 | ) | |
Net increase | | | 426,488 | | | | 4,380,806 | | | | 825,967 | | | | 8,829,353 | | |
Class B shares | |
Subscriptions | | | 1,425 | | | | 14,559 | | | | 1,581 | | | | 16,726 | | |
Distributions reinvested | | | 1 | | | | 11 | | | | 1 | | | | 5 | | |
Redemptions(c) | | | (700 | ) | | | (7,026 | ) | | | — | | | | — | | |
Net increase | | | 726 | | | | 7,544 | | | | 1,582 | | | | 16,731 | | |
Class C shares | |
Subscriptions | | | 455,004 | | | | 4,626,484 | | | | 371,838 | | | | 3,939,604 | | |
Distributions reinvested | | | 10,883 | | | | 111,377 | | | | 4,547 | | | | 48,259 | | |
Redemptions | | | (327,675 | ) | | | (3,348,280 | ) | | | (45,191 | ) | | | (481,299 | ) | |
Net increase | | | 138,212 | | | | 1,389,581 | | | | 331,194 | | | | 3,506,564 | | |
Class R4 shares | |
Subscriptions | | | 4,736 | | | | 49,099 | | | | 237 | | | | 2,500 | | |
Distributions reinvested | | | 2 | | | | 16 | | | | 1 | | | | 7 | | |
Net increase | | | 4,738 | | | | 49,115 | | | | 238 | | | | 2,507 | | |
Class R5 shares | |
Subscriptions | | | 32,623 | | | | 333,474 | | | | 235 | | | | 2,500 | | |
Distributions reinvested | | | 275 | | | | 2,834 | | | | 1 | | | | 7 | | |
Redemptions | | | (276 | ) | | | (2,841 | ) | | | — | | | | — | | |
Net increase | | | 32,622 | | | | 333,467 | | | | 236 | | | | 2,507 | | |
Class Z shares | |
Subscriptions | | | 6,985,515 | | | | 71,643,063 | | | | 7,435,604 | | | | 78,699,497 | | |
Distributions reinvested | | | 121,320 | | | | 1,239,928 | | | | 117,521 | | | | 1,244,577 | | |
Redemptions | | | (8,497,884 | ) | | | (86,597,671 | ) | | | (5,551,453 | ) | | | (58,699,573 | ) | |
Net increase (decrease) | | | (1,391,049 | ) | | | (13,714,680 | ) | | | 2,001,672 | | | | 21,244,501 | | |
Total net increase (decrease) | | | (788,263 | ) | | | (7,554,167 | ) | | | 3,160,889 | | | | 33,602,163 | | |
(a) Class R4 shares are for the period from March 19, 2013 (commencement of operations) to April 30, 2013.
(b) Class R5 shares are for the period from November 8, 2012 (commencement of operations) to April 30, 2013.
(c) Includes conversions of Class B shares to Class A shares, if any.
The accompanying Notes to Financial Statements are an integral part of this statement.
Annual Report 2014
20
Columbia California Intermediate Municipal Bond Fund
The following tables are intended to help you understand the Fund's financial performance. Certain information reflects financial results for a single share of a class held for the periods shown. Per share net investment income (loss) amounts are calculated based on average shares outstanding during the period. Total return assumes reinvestment of all dividends and distributions, if any. Total return does not reflect payment of sales charges, if any, and is not annualized for periods of less than one year.
| | | Year Ended April 30, | | Year Ended March 31, | |
Class A | | 2014 | | 2013 | | 2012(a) | | 2012 | | 2011 | | 2010 | |
Per share data | |
Net asset value, beginning of period | | $ | 10.68 | | | $ | 10.47 | | | $ | 10.37 | | | $ | 9.65 | | | $ | 9.72 | | | $ | 9.34 | | |
Income from investment operations: | |
Net investment income | | | 0.32 | | | | 0.32 | | | | 0.03 | | | | 0.32 | | | | 0.31 | | | | 0.32 | | |
Net realized and unrealized gain (loss) | | | (0.26 | ) | | | 0.21 | | | | 0.10 | | | | 0.72 | | | | (0.07 | ) | | | 0.39 | | |
Total from investment operations | | | 0.06 | | | | 0.53 | | | | 0.13 | | | | 1.04 | | | | 0.24 | | | | 0.71 | | |
Less distributions to shareholders: | |
Net investment income | | | (0.32 | ) | | | (0.32 | ) | | | (0.03 | ) | | | (0.32 | ) | | | (0.31 | ) | | | (0.32 | ) | |
Net realized gains | | | — | | | | — | | | | — | | | | — | | | | — | | | | (0.01 | ) | |
Total distributions to shareholders | | | (0.32 | ) | | | (0.32 | ) | | | (0.03 | ) | | | (0.32 | ) | | | (0.31 | ) | | | (0.33 | ) | |
Net asset value, end of period | | $ | 10.42 | | | $ | 10.68 | | | $ | 10.47 | | | $ | 10.37 | | | $ | 9.65 | | | $ | 9.72 | | |
Total return | | | 0.64 | % | | | 5.12 | % | | | 1.22 | % | | | 10.87 | % | | | 2.48 | % | | | 7.65 | % | |
Ratios to average net assets(b) | |
Total gross expenses | | | 0.96 | % | | | 0.96 | % | | | 1.00 | %(c) | | | 1.00 | % | | | 0.94 | % | | | 0.90 | % | |
Total net expenses(d) | | | 0.74 | %(e) | | | 0.73 | %(e) | | | 0.73 | %(c) | | | 0.74 | %(e) | | | 0.80 | %(e) | | | 0.79 | %(e) | |
Net investment income | | | 3.10 | % | | | 3.01 | % | | | 3.11 | %(c) | | | 3.13 | % | | | 3.14 | % | | | 3.34 | % | |
Supplemental data | |
Net assets, end of period (in thousands) | | $ | 33,140 | | | $ | 29,398 | | | $ | 20,180 | | | $ | 18,858 | | | $ | 11,613 | | | $ | 14,059 | | |
Portfolio turnover | | | 12 | % | | | 8 | % | | | 0 | % | | | 9 | % | | | 26 | % | | | 25 | % | |
Notes to Financial Highlights
(a) For the period from April 1, 2012 to April 30, 2012. During the period, the Fund's fiscal year end was changed from March 31 to April 30.
(b) In addition to the fees and expenses which the Fund bears directly, the Fund indirectly bears a pro rata share of the fees and expenses of the acquired funds in which it invests. Such indirect expenses are not included in the reported expense ratios.
(c) Annualized.
(d) Total net expenses include the impact of certain waivers/reimbursements made by the Investment Manager and certain of its affiliates, if applicable.
(e) The benefits derived from expense reductions had an impact of less than 0.01%.
The accompanying Notes to Financial Statements are an integral part of this statement.
Annual Report 2014
21
Columbia California Intermediate Municipal Bond Fund
Financial Highlights (continued)
| | | Year Ended April 30, | | Year Ended March 31, | |
Class B | | 2014 | | 2013 | | 2012(a) | | 2012 | | 2011 | | 2010 | |
Per share data | |
Net asset value, beginning of period | | $ | 10.68 | | | $ | 10.47 | | | $ | 10.37 | | | $ | 9.64 | | | $ | 9.71 | | | $ | 9.34 | | |
Income from investment operations: | |
Net investment income | | | 0.24 | | | | 0.24 | | | | 0.02 | | | | 0.25 | | | | 0.24 | | | | 0.25 | | |
Net realized and unrealized gain (loss) | | | (0.26 | ) | | | 0.21 | | | | 0.10 | | | | 0.71 | | | | (0.07 | ) | | | 0.37 | | |
Total from investment operations | | | (0.02 | ) | | | 0.45 | | | | 0.12 | | | | 0.96 | | | | 0.17 | | | | 0.62 | | |
Less distributions to shareholders: | |
Net investment income | | | (0.24 | ) | | | (0.24 | ) | | | (0.02 | ) | | | (0.23 | ) | | | (0.24 | ) | | | (0.24 | ) | |
Net realized gains | | | — | | | | — | | | | — | | | | — | | | | — | | | | (0.01 | ) | |
Total distributions to shareholders | | | (0.24 | ) | | | (0.24 | ) | | | (0.02 | ) | | | (0.23 | ) | | | (0.24 | ) | | | (0.25 | ) | |
Net asset value, end of period | | $ | 10.42 | | | $ | 10.68 | | | $ | 10.47 | | | $ | 10.37 | | | $ | 9.64 | | | $ | 9.71 | | |
Total return | | | (0.11 | %) | | | 4.34 | % | | | 1.16 | % | | | 10.04 | % | | | 1.72 | % | | | 6.74 | % | |
Ratios to average net assets(b) | |
Total gross expenses | | | 1.71 | % | | | 1.70 | % | | | 1.78 | %(c) | | | 1.96 | % | | | 1.69 | % | | | 1.65 | % | |
Total net expenses(d) | | | 1.49 | %(e) | | | 1.48 | % | | | 1.48 | %(c) | | | 1.56 | %(e) | | | 1.55 | %(e) | | | 1.54 | %(e) | |
Net investment income | | | 2.36 | % | | | 2.26 | % | | | 2.38 | %(c) | | | 2.53 | % | | | 2.41 | % | | | 2.58 | % | |
Supplemental data | |
Net assets, end of period (in thousands) | | $ | 27 | | | $ | 20 | | | $ | 3 | | | $ | 3 | | | $ | 144 | | | $ | 218 | | |
Portfolio turnover | | | 12 | % | | | 8 | % | | | 0 | % | | | 9 | % | | | 26 | % | | | 25 | % | |
Notes to Financial Highlights
(a) For the period from April 1, 2012 to April 30, 2012. During the period, the Fund's fiscal year end was changed from March 31 to April 30.
(b) In addition to the fees and expenses which the Fund bears directly, the Fund indirectly bears a pro rata share of the fees and expenses of the acquired funds in which it invests. Such indirect expenses are not included in the reported expense ratios.
(c) Annualized.
(d) Total net expenses include the impact of certain waivers/reimbursements made by the Investment Manager and certain of its affiliates, if applicable.
(e) The benefits derived from expense reductions had an impact of less than 0.01%.
The accompanying Notes to Financial Statements are an integral part of this statement.
Annual Report 2014
22
Columbia California Intermediate Municipal Bond Fund
Financial Highlights (continued)
| | | Year Ended April 30, | | Year Ended March 31, | |
Class C | | 2014 | | 2013 | | 2012(a) | | 2012 | | 2011 | | 2010 | |
Per share data | |
Net asset value, beginning of period | | $ | 10.67 | | | $ | 10.47 | | | $ | 10.37 | | | $ | 9.64 | | | $ | 9.72 | | | $ | 9.35 | | |
Income from investment operations: | |
Net investment income | | | 0.24 | | | | 0.24 | | | | 0.02 | | | | 0.24 | | | | 0.24 | | | | 0.25 | | |
Net realized and unrealized gain (loss) | | | (0.25 | ) | | | 0.20 | | | | 0.10 | | | | 0.73 | | | | (0.08 | ) | | | 0.37 | | |
Total from investment operations | | | (0.01 | ) | | | 0.44 | | | | 0.12 | | | | 0.97 | | | | 0.16 | | | | 0.62 | | |
Less distributions to shareholders: | |
Net investment income | | | (0.24 | ) | | | (0.24 | ) | | | (0.02 | ) | | | (0.24 | ) | | | (0.24 | ) | | | (0.24 | ) | |
Net realized gains | | | — | | | | — | | | | — | | | | — | | | | — | | | | (0.01 | ) | |
Total distributions to shareholders | | | (0.24 | ) | | | (0.24 | ) | | | (0.02 | ) | | | (0.24 | ) | | | (0.24 | ) | | | (0.25 | ) | |
Net asset value, end of period | | $ | 10.42 | | | $ | 10.67 | | | $ | 10.47 | | | $ | 10.37 | | | $ | 9.64 | | | $ | 9.72 | | |
Total return | | | (0.02 | %) | | | 4.24 | % | | | 1.16 | % | | | 10.15 | % | | | 1.61 | % | | | 6.74 | % | |
Ratios to average net assets(b) | |
Total gross expenses | | | 1.71 | % | | | 1.71 | % | | | 1.75 | %(c) | | | 1.73 | % | | | 1.69 | % | | | 1.65 | % | |
Total net expenses(d) | | | 1.49 | %(e) | | | 1.48 | %(e) | | | 1.48 | %(c) | | | 1.49 | %(e) | | | 1.55 | %(e) | | | 1.54 | %(e) | |
Net investment income | | | 2.35 | % | | | 2.25 | % | | | 2.36 | %(c) | | | 2.38 | % | | | 2.42 | % | | | 2.55 | % | |
Supplemental data | |
Net assets, end of period (in thousands) | | $ | 9,253 | | | $ | 8,004 | | | $ | 4,384 | | | $ | 4,223 | | | $ | 1,599 | | | $ | 1,875 | | |
Portfolio turnover | | | 12 | % | | | 8 | % | | | 0 | % | | | 9 | % | | | 26 | % | | | 25 | % | |
Notes to Financial Highlights
(a) For the period from April 1, 2012 to April 30, 2012. During the period, the Fund's fiscal year end was changed from March 31 to April 30.
(b) In addition to the fees and expenses which the Fund bears directly, the Fund indirectly bears a pro rata share of the fees and expenses of the acquired funds in which it invests. Such indirect expenses are not included in the reported expense ratios.
(c) Annualized.
(d) Total net expenses include the impact of certain waivers/reimbursements made by the Investment Manager and certain of its affiliates, if applicable.
(e) The benefits derived from expense reductions had an impact of less than 0.01%.
The accompanying Notes to Financial Statements are an integral part of this statement.
Annual Report 2014
23
Columbia California Intermediate Municipal Bond Fund
Financial Highlights (continued)
| | | Year Ended April 30, | |
Class R4 | | 2014 | | 2013(a) | |
Per share data | |
Net asset value, beginning of period | | $ | 10.64 | | | $ | 10.54 | | |
Income from investment operations: | |
Net investment income | | | 0.34 | | | | 0.04 | | |
Net realized and unrealized gain (loss) | | | (0.25 | ) | | | 0.10 | | |
Total from investment operations | | | 0.09 | | | | 0.14 | | |
Less distributions to shareholders: | |
Net investment income | | | (0.34 | ) | | | (0.04 | ) | |
Total distributions to shareholders | | | (0.34 | ) | | | (0.04 | ) | |
Net asset value, end of period | | $ | 10.39 | | | $ | 10.64 | | |
Total return | | | 0.98 | % | | | 1.32 | % | |
Ratios to average net assets(b) | |
Total gross expenses | | | 0.70 | % | | | 0.56 | %(c) | |
Total net expenses(d) | | | 0.49 | %(e) | | | 0.44 | %(c) | |
Net investment income | | | 3.46 | % | | | 3.27 | %(c) | |
Supplemental data | |
Net assets, end of period (in thousands) | | $ | 52 | | | $ | 3 | | |
Portfolio turnover | | | 12 | % | | | 8 | % | |
Notes to Financial Highlights
(a) For the period from March 19, 2013 (commencement of operations) to April 30, 2013.
(b) In addition to the fees and expenses which the Fund bears directly, the Fund indirectly bears a pro rata share of the fees and expenses of the acquired funds in which it invests. Such indirect expenses are not included in the reported expense ratios.
(c) Annualized.
(d) Total net expenses include the impact of certain waivers/reimbursements made by the Investment Manager and certain of its affiliates, if applicable.
(e) The benefits derived from expense reductions had an impact of less than 0.01%.
The accompanying Notes to Financial Statements are an integral part of this statement.
Annual Report 2014
24
Columbia California Intermediate Municipal Bond Fund
Financial Highlights (continued)
| | | Year Ended April 30, | |
Class R5 | | 2014 | | 2013(a) | |
Per share data | |
Net asset value, beginning of period | | $ | 10.63 | | | $ | 10.63 | | |
Income from investment operations: | |
Net investment income | | | 0.35 | | | | 0.16 | | |
Net realized and unrealized gain (loss) | | | (0.26 | ) | | | 0.01 | | |
Total from investment operations | | | 0.09 | | | | 0.17 | | |
Less distributions to shareholders: | |
Net investment income | | | (0.35 | ) | | | (0.17 | ) | |
Total distributions to shareholders | | | (0.35 | ) | | | (0.17 | ) | |
Net asset value, end of period | | $ | 10.37 | | | $ | 10.63 | | |
Total return | | | 0.98 | % | | | 1.57 | % | |
Ratios to average net assets(b) | |
Total gross expenses | | | 0.58 | % | | | 0.50 | %(c) | |
Total net expenses(d) | | | 0.40 | % | | | 0.39 | %(c) | |
Net investment income | | | 3.47 | % | | | 3.28 | %(c) | |
Supplemental data | |
Net assets, end of period (in thousands) | | $ | 341 | | | $ | 3 | | |
Portfolio turnover | | | 12 | % | | | 8 | % | |
Notes to Financial Highlights
(a) For the period from November 8, 2012 (commencement of operations) to April 30, 2013.
(b) In addition to the fees and expenses which the Fund bears directly, the Fund indirectly bears a pro rata share of the fees and expenses of the acquired funds in which it invests. Such indirect expenses are not included in the reported expense ratios.
(c) Annualized.
(d) Total net expenses include the impact of certain waivers/reimbursements made by the Investment Manager and certain of its affiliates, if applicable.
The accompanying Notes to Financial Statements are an integral part of this statement.
Annual Report 2014
25
Columbia California Intermediate Municipal Bond Fund
Financial Highlights (continued)
| | | Year Ended April 30, | | Year Ended March 31, | |
Class Z | | 2014 | | 2013 | | 2012(a) | | 2012 | | 2011 | | 2010 | |
Per share data | |
Net asset value, beginning of period | | $ | 10.65 | | | $ | 10.45 | | | $ | 10.35 | | | $ | 9.63 | | | $ | 9.70 | | | $ | 9.33 | | |
Income from investment operations: | |
Net investment income | | | 0.34 | | | | 0.35 | | | | 0.03 | | | | 0.34 | | | | 0.34 | | | | 0.34 | | |
Net realized and unrealized gain (loss) | | | (0.25 | ) | | | 0.20 | | | | 0.10 | | | | 0.72 | | | | (0.07 | ) | | | 0.38 | | |
Total from investment operations | | | 0.09 | | | | 0.55 | | | | 0.13 | | | | 1.06 | | | | 0.27 | | | | 0.72 | | |
Less distributions to shareholders: | |
Net investment income | | | (0.34 | ) | | | (0.35 | ) | | | (0.03 | ) | | | (0.34 | ) | | | (0.34 | ) | | | (0.34 | ) | |
Net realized gains | | | — | | | | — | | | | — | | | | — | | | | — | | | | (0.01 | ) | |
Total distributions to shareholders | | | (0.34 | ) | | | (0.35 | ) | | | (0.03 | ) | | | (0.34 | ) | | | (0.34 | ) | | | (0.35 | ) | |
Net asset value, end of period | | $ | 10.40 | | | $ | 10.65 | | | $ | 10.45 | | | $ | 10.35 | | | $ | 9.63 | | | $ | 9.70 | | |
Total return | | | 0.98 | % | | | 5.29 | % | | | 1.24 | % | | | 11.16 | % | | | 2.74 | % | | | 7.82 | % | |
Ratios to average net assets(b) | |
Total gross expenses | | | 0.71 | % | | | 0.71 | % | | | 0.75 | %(c) | | | 0.74 | % | | | 0.69 | % | | | 0.65 | % | |
Total net expenses(d) | | | 0.49 | %(e) | | | 0.48 | %(e) | | | 0.48 | %(c) | | | 0.50 | %(e) | | | 0.55 | %(e) | | | 0.54 | %(e) | |
Net investment income | | | 3.35 | % | | | 3.27 | % | | | 3.35 | %(c) | | | 3.39 | % | | | 3.43 | % | | | 3.56 | % | |
Supplemental data | |
Net assets, end of period (in thousands) | | $ | 260,101 | | | $ | 281,301 | | | $ | 254,981 | | | $ | 252,647 | | | $ | 217,024 | | | $ | 211,046 | | |
Portfolio turnover | | | 12 | % | | | 8 | % | | | 0 | % | | | 9 | % | | | 26 | % | | | 25 | % | |
Notes to Financial Highlights
(a) For the period from April 1, 2012 to April 30, 2012. During the period, the Fund's fiscal year end was changed from March 31 to April 30.
(b) In addition to the fees and expenses which the Fund bears directly, the Fund indirectly bears a pro rata share of the fees and expenses of the acquired funds in which it invests. Such indirect expenses are not included in the reported expense ratios.
(c) Annualized.
(d) Total net expenses include the impact of certain waivers/reimbursements made by the Investment Manager and certain of its affiliates, if applicable.
(e) The benefits derived from expense reductions had an impact of less than 0.01%.
The accompanying Notes to Financial Statements are an integral part of this statement.
Annual Report 2014
26
Columbia California Intermediate Municipal Bond Fund
Notes to Financial Statements
April 30, 2014
Note 1. Organization
Columbia California Intermediate Municipal Bond Fund (the Fund), a series of Columbia Funds Series Trust (the Trust), is a diversified fund. The Trust is registered under the Investment Company Act of 1940, as amended (the 1940 Act), as an open-end management investment company organized as a Delaware statutory trust.
Fund Shares
The Trust may issue an unlimited number of shares (without par value). The Fund offers Class A, Class B, Class C, Class R4, Class R5 and Class Z shares. Although all share classes generally have identical voting, dividend and liquidation rights, each share class votes separately when required by law. Different share classes pay different distribution amounts to the extent the expenses of such share classes differ, and distributions in liquidation will be proportional to the net asset value of each share class. Each share class has its own expense structure and sales charges, as applicable.
Class A shares are subject to a maximum front-end sales charge of 3.25% based on the initial investment amount. Class A shares purchased without an initial sales charge in accounts aggregating $1 million to $50 million at the time of purchase are subject to a contingent deferred sales charge (CDSC) if the shares are sold within 18 months of purchase, charged as follows: 1.00% CDSC if redeemed within 12 months of purchase, and 0.50% CDSC if redeemed more than 12, but less than 18, months after purchase.
Class B shares may be subject to a maximum CDSC of 3.00% based upon the holding period after purchase. Class B shares will generally convert to Class A shares eight years after purchase. The Fund no longer accepts investments by new or existing investors in the Fund's Class B shares, except in connection with the reinvestment of any dividend and/or capital gain distributions in Class B shares of the Fund and exchanges by existing Class B shareholders of certain other funds within the Columbia Family of Funds.
Class C shares are subject to a 1.00% CDSC on shares redeemed within one year of purchase.
Class R4 shares are not subject to sales charges and are generally available only to omnibus retirement plans and certain other eligible investors.
Class R5 shares are not subject to sales charges and are generally available only to investors purchasing through authorized investment professionals and omnibus retirement plans.
Class Z shares are not subject to sales charges and are available only to certain eligible investors, which are subject to different investment minimums.
Note 2. Summary of Significant Accounting Policies
Use of Estimates
The preparation of financial statements in accordance with U.S. generally accepted accounting principles (GAAP) requires management to make certain estimates and assumptions that affect the reported amounts of assets and liabilities, the disclosure of contingent assets and liabilities at the date of the financial statements and the reported amounts of revenue and expenses during the reporting period. Actual results could differ from those estimates.
The following is a summary of significant accounting policies consistently followed by the Fund in the preparation of its financial statements.
Security Valuation
Debt securities generally are valued by pricing services approved by the Board of Trustees (the Board) based upon market transactions for normal, institutional-size trading units of similar securities. The services may use various pricing techniques which take into account appropriate factors such as yield, quality, coupon rate, maturity, type of issue, trading characteristics and other data, as well as broker quotes. Debt securities for which quotations are readily available may also be valued based upon an over-the-counter or exchange bid quotation.
Investments in open-end investment companies, including money market funds, are valued at net asset value.
Short-term securities purchased within 60 days to maturity are valued at amortized cost, which approximates market value. The value of short-term securities originally purchased with maturities greater than 60 days is determined based on an amortized value to par upon reaching 60 days to maturity. Short-term securities maturing in more than 60 days from the valuation date are valued at the market price or approximate market value based on current interest rates.
Investments for which market quotations are not readily available, or that have quotations which management believes are not reliable, are valued at fair value as determined in good faith under consistently applied procedures established by and under the general supervision of the Board. If a security or class of securities (such as foreign securities) is valued at fair value, such value is likely to be different from the last quoted market price for the security.
Annual Report 2014
27
Columbia California Intermediate Municipal Bond Fund
Notes to Financial Statements (continued)
April 30, 2014
The determination of fair value often requires significant judgment. To determine fair value, management may use assumptions including but not limited to future cash flows and estimated risk premiums. Multiple inputs from various sources may be used to determine fair value.
Delayed Delivery Securities
The Fund may trade securities on other than normal settlement terms, including securities purchased or sold on a "when-issued" basis. This may increase risk since the other party to the transaction may fail to deliver which could cause the Fund to subsequently invest at less advantageous prices. The Fund designates cash or liquid securities in an amount equal to the delayed delivery commitment.
Security Transactions
Security transactions are accounted for on the trade date. Cost is determined and gains (losses) are based upon the specific identification method for both financial statement and federal income tax purposes.
Income Recognition
Interest income is recorded on an accrual basis. Market premiums and discounts, including original issue discounts, are amortized and accreted, respectively, over the expected life of the security on all debt securities, unless otherwise noted.
Dividend income is recorded on the ex-dividend date.
Expenses
General expenses of the Trust are allocated to the Fund and other funds of the Trust based upon relative net assets or other expense allocation methodologies determined by the nature of the expense. Expenses directly attributable to the Fund are charged to the Fund. Expenses directly attributable to a specific class of shares are charged to that share class.
Determination of Class Net Asset Value
All income, expenses (other than class-specific expenses, which are charged to that share class, as shown in the Statement of Operations) and realized and unrealized gains (losses) are allocated to each class of the Fund on a daily basis, based on the relative net assets of each class, for purposes of determining the net asset value of each class.
Federal Income Tax Status
The Fund intends to qualify each year as a regulated investment company under Subchapter M of the Internal Revenue Code, as amended, and will distribute substantially all of its tax exempt and taxable income (including net short-term capital gains), if any, for its tax year, and as such will not be subject to federal income taxes. In addition, the Fund
intends to distribute in each calendar year substantially all of its net investment income, capital gains and certain other amounts, if any, such that the Fund should not be subject to federal excise tax. Therefore, no federal income or excise tax provision is recorded.
Distributions to Shareholders
Distributions from net investment income, if any, are declared daily and paid monthly. Net realized capital gains, if any, are distributed at least annually. Income distributions and capital gain distributions are determined in accordance with federal income tax regulations, which may differ from GAAP.
Guarantees and Indemnifications
Under the Trust's organizational documents and, in some cases, by contract, its officers and trustees are indemnified against certain liabilities arising out of the performance of their duties to the Trust or its funds. In addition, certain of the Fund's contracts with its service providers contain general indemnification clauses. The Fund's maximum exposure under these arrangements is unknown since the amount of any future claims that may be made against the Fund cannot be determined, and the Fund has no historical basis for predicting the likelihood of any such claims.
Note 3. Fees and Compensation Paid to Affiliates
Investment Management Fees
Under an Investment Management Services Agreement, Columbia Management Investment Advisers, LLC (the Investment Manager), a wholly-owned subsidiary of Ameriprise Financial, Inc. (Ameriprise Financial), determines which securities will be purchased, held or sold. The investment management fee is an annual fee that is equal to a percentage of the Fund's average daily net assets that declines from 0.40% to 0.27% as the Fund's net assets increase. The effective investment management fee rate for the year ended April 30, 2014 was 0.40% of the Fund's average daily net assets.
Administration Fees
Under an Administrative Services Agreement, the Investment Manager also serves as the Fund Administrator. The Fund pays the Fund Administrator an annual fee for administration and accounting services equal to a percentage of the Fund's average daily net assets that declines from 0.07% to 0.04% as the Fund's net assets increase. The effective administration fee rate for the year ended April 30, 2014 was 0.07% of the Fund's average daily net assets.
Annual Report 2014
28
Columbia California Intermediate Municipal Bond Fund
Notes to Financial Statements (continued)
April 30, 2014
Other Expenses
Other expenses are for, among other things, miscellaneous expenses of the Fund or the Board, including payments to a company providing limited administrative services to the Fund and the Board. That company's expenses include boardroom and office expense, employee compensation, employee health and retirement benefits, and certain other expenses. For the year ended April 30, 2014, other expenses paid to this company were $2,085.
Compensation of Board Members
Board members are compensated for their services to the Fund as disclosed in the Statement of Operations. Under a Deferred Compensation Plan (the Plan), the Board members who are not "interested persons" of the Fund, as defined under the 1940 Act, may elect to defer payment of up to 100% of their compensation. Deferred amounts are treated as though equivalent dollar amounts had been invested in shares of certain funds managed by the Investment Manager. The Fund's liability for these amounts is adjusted for market value changes and remains in the Fund until distributed in accordance with the Plan.
Transfer Agent Fees
Under a Transfer and Dividend Disbursing Agent Agreement, Columbia Management Investment Services Corp. (the Transfer Agent), an affiliate of the Investment Manager and a wholly-owned subsidiary of Ameriprise Financial, is responsible for providing transfer agency services to the Fund. The Transfer Agent has contracted with Boston Financial Data Services (BFDS) to serve as sub-transfer agent.
The Transfer Agent receives monthly account-based service fees based on the number of open accounts and also receives sub-transfer agency fees based on a percentage of the average aggregate value of the Fund's shares maintained in omnibus accounts (other than omnibus accounts for which American Enterprise Investment Services Inc. is the broker of record or accounts where the beneficial shareholder is a customer of Ameriprise Financial Services, Inc., which are paid a per account fee). The Transfer Agent pays the fees of BFDS for services as sub-transfer agent and is not entitled to reimbursement for such fees from the Fund (with the exception of out-of-pocket fees).
The Transfer Agent also receives compensation from fees for various shareholder services and reimbursements for certain out-of-pocket fees. Total transfer agent fees for Class R5 shares are subject to an annual limitation of not more than 0.05% of the average daily net assets attributable to Class R5 shares.
For the year ended April 30, 2014, the Fund's effective transfer agent fee rates as a percentage of average daily net assets of each class were as follows:
Class A | | | 0.19 | % | |
Class B | | | 0.19 | | |
Class C | | | 0.19 | | |
Class R4 | | | 0.19 | | |
Class R5 | | | 0.05 | | |
Class Z | | | 0.19 | | |
An annual minimum account balance fee of $20 may apply to certain accounts with a value below the applicable share class's initial minimum investment requirements to reduce the impact of small accounts on transfer agent fees. These minimum account balance fees are recorded as part of expense reductions in the Statement of Operations. For the year ended April 30, 2014, these minimum account balance fees reduced total expenses by $40.
Distribution and Service Fees
The Fund has an agreement with Columbia Management Investment Distributors, Inc. (the Distributor), an affiliate of the Investment Manager and a wholly-owned subsidiary of Ameriprise Financial, for distribution and shareholder services. The Board has approved, and the Fund has adopted, distribution and shareholder service plans (the Plans) applicable to certain share classes, which set the distribution and service fees for the Fund. These fees are calculated daily and are intended to compensate the Distributor and/or eligible selling and/or servicing agents for selling shares of the Fund and providing services to investors.
Under the Plans, the Fund pays a monthly combined distribution and service fee to the Distributor at the maximum annual rate of 0.25% of the average daily net assets attributable to Class A shares of the Fund. Also under the Plans, the Fund pays a monthly service fee at the maximum annual rate of 0.25% of the average daily net assets attributable to Class B and Class C shares of the Fund and the payment of a monthly distribution fee at the maximum annual rate of 0.75% of the average daily net assets attributable to Class B and Class C shares of the Fund.
Sales Charges
Sales charges, including front-end charges and CDSCs, received by the Distributor for distributing Fund shares were $61,239 for Class A and $932 for Class C shares for the year ended April 30, 2014.
Annual Report 2014
29
Columbia California Intermediate Municipal Bond Fund
Notes to Financial Statements (continued)
April 30, 2014
Expenses Waived/Reimbursed by the Investment Manager and its Affiliates
The Investment Manager and certain of its affiliates have contractually agreed to waive fees and/or reimburse expenses (excluding certain fees and expenses described below) for the periods disclosed below, unless sooner terminated at the sole discretion of the Board, so that the Fund's net operating expenses, after giving effect to fees waived/expenses reimbursed and any balance credits and/or overdraft charges from the Fund's custodian, do not exceed the following annual rates as a percentage of the class' average daily net assets:
| | | September 1, 2013
through
August 31, 2014 | | Prior to
September 1, 2013 | |
Class A | | | 0.74 | % | | | 0.73 | % | |
Class B | | | 1.49 | | | | 1.48 | | |
Class C | | | 1.49 | | | | 1.48 | | |
Class R4 | | | 0.49 | | | | 0.48 | | |
Class R5 | | | 0.40 | | | | 0.39 | | |
Class Z | | | 0.49 | | | | 0.48 | | |
Under the agreement governing these fee waivers and/or expense reimbursement arrangements, the following fees and expenses are excluded from the waiver/reimbursement commitment, and therefore will be paid by the Fund, if applicable: taxes (including foreign transaction taxes), expenses associated with investments in affiliated and non-affiliated pooled investment vehicles (including mutual funds and exchange-traded funds), transaction costs and brokerage commissions, costs related to any securities lending program, dividend expenses associated with securities sold short, inverse floater program fees and expenses, transaction charges and interest on borrowed money, interest, extraordinary expenses and any other expenses the exclusion of which is specifically approved by the Board. This agreement may be modified or amended only with approval from all parties.
Note 4. Federal Tax Information
The timing and character of income and capital gain distributions are determined in accordance with income tax regulations, which may differ from GAAP because of temporary or permanent book to tax differences.
At April 30, 2014, these differences are primarily due to differing treatment for capital loss carryforwards, Trustees' deferred compensation and distributions. To the extent these differences are permanent, reclassifications are made among the components of the Fund's net assets in the Statement of Assets and Liabilities. Temporary differences do not require
reclassifications. In the Statement of Assets and Liabilities the following reclassifications were made:
Excess of distributions over net investment income | | $ | 13,611 | | |
Accumulated net realized loss | | | 11,158 | | |
Paid-in capital | | | (24,769 | ) | |
Net investment income and net realized gains (losses), as disclosed in the Statement of Operations, and net assets were not affected by this reclassification.
The tax character of distributions paid during the years indicated was as follows:
Year Ended April 30, | | 2014 | | 2013 | |
Ordinary income | | $ | 18,539 | | | $ | 18,179 | | |
Tax-exempt income | | | 9,562,631 | | | | 9,558,267 | | |
Total | | $ | 9,581,170 | | | $ | 9,576,446 | | |
Short-term capital gain distributions, if any, are considered ordinary income distributions for tax purposes.
At April 30, 2014, the components of distributable earnings on a tax basis were as follows:
Undistributed tax-exempt income | | $ | 799,440 | | |
Capital loss carryforwards | | | (2,378,768 | ) | |
Net unrealized appreciation | | | 21,051,511 | | |
At April 30, 2014, the cost of investments for federal income tax purposes was $280,002,743 and the aggregate gross unrealized appreciation and depreciation based on that cost was:
Unrealized appreciation | | $ | 21,258,257 | | |
Unrealized depreciation | | | (206,746 | ) | |
Net unrealized appreciation | | $ | 21,051,511 | | |
The following capital loss carryforwards, determined at April 30, 2014, may be available to reduce taxable income arising from future net realized gains on investments, if any, to the extent permitted by the Internal Revenue Code:
Year of Expiration | | Amount ($) | |
2017 | | | 10,109 | | |
Unlimited short-term | | | 2,323,351 | | |
Unlimited long-term | | | 45,308 | | |
Total | | | 2,378,768 | | |
Unlimited capital loss carryforwards are required to be utilized prior to any capital losses which carry an expiration date. As a result of this ordering rule, capital loss carryforwards which carry an expiration date may be more likely to expire unused.
Annual Report 2014
30
Columbia California Intermediate Municipal Bond Fund
Notes to Financial Statements (continued)
April 30, 2014
Management of the Fund has concluded that there are no significant uncertain tax positions that would require recognition in the financial statements. However, management's conclusion may be subject to review and adjustment at a later date based on factors including, but not limited to, new tax laws, regulations, and administrative interpretations (including relevant court decisions). Generally, the Fund's federal tax returns for the prior three fiscal years remain subject to examination by the Internal Revenue Service.
Note 5. Portfolio Information
The cost of purchases and proceeds from sales of securities, excluding short-term obligations, aggregated to $34,896,581 and $55,372,071, respectively, for the year ended April 30, 2014.
Note 6. Shareholder Concentration
At April 30, 2014, one unaffiliated shareholder of record owned 75.2 % of the outstanding shares of the Fund in one or more accounts. The Fund has no knowledge about whether any portion of those shares was owned beneficially. Subscription and redemption activity by concentrated accounts may have a significant effect on the operations of the Fund.
Note 7. Line of Credit
The Fund has entered into a revolving credit facility with a syndicate of banks led by JPMorgan Chase Bank N.A. whereby the Fund may borrow for the temporary funding of shareholder redemptions or for other temporary or emergency purposes. The credit facility agreement, as amended, which is a collective agreement between the Fund and certain other funds managed by the Investment Manager, severally and not jointly, permits collective borrowings up to $500 million. Interest is charged to each participating fund based on its borrowings at a rate equal to the higher of (i) the overnight federal funds rate plus 1.00% or (ii) the one-month LIBOR rate plus 1.00%. Each borrowing under the credit facility matures no later than 60 days after the date of borrowing. Effective December 10, 2013, the Fund also pays a commitment fee equal to its pro rata share of the amount of the credit facility at a rate of 0.075% per annum. Prior to December 10, 2013, the commitment fee was charged at the annual rate of 0.08% per annum. The commitment fee is included in other expenses in the Statement of Operations.
The Fund had no borrowings during the year ended April 30, 2014.
Note 8. Significant Risks
Geographic Concentration Risk
Because state-specific tax-exempt funds invest primarily in the municipal securities issued by the state and political sub-divisions of the state, the Fund will be particularly affected by political and economic conditions and developments in the state in which it invests. The Fund may, therefore, have a greater risk than that of a municipal bond fund which is more geographically diversified. The value of the municipal securities owned by the Fund also may be adversely affected by future changes in federal or state income tax laws.
Note 9. Subsequent Events
Management has evaluated the events and transactions that have occurred through the date the financial statements were issued and noted no items requiring adjustment of the financial statements or additional disclosure.
Note 10. Information Regarding Pending and Settled Legal Proceedings
In December 2005, without admitting or denying the allegations, American Express Financial Corporation (AEFC, which is now known as Ameriprise Financial, Inc. (Ameriprise Financial)) entered into settlement agreements with the Securities and Exchange Commission (SEC) and Minnesota Department of Commerce (MDOC) related to market timing activities. As a result, AEFC was censured and ordered to cease and desist from committing or causing any violations of certain provisions of the Investment Advisers Act of 1940, the Investment Company Act of 1940, and various Minnesota laws. AEFC agreed to pay disgorgement of $10 million and civil money penalties of $7 million. AEFC also agreed to retain an independent distribution consultant to assist in developing a plan for distribution of all disgorgement and civil penalties ordered by the SEC in accordance with various undertakings detailed at www.sec.gov/litigation/admin/ia-2451.pdf. Ameriprise Financial and its affiliates have cooperated with the SEC and the MDOC in these legal proceedings, and have made regular reports to the Funds' Boards of Trustees.
Ameriprise Financial and certain of its affiliates have historically been involved in a number of legal, arbitration and regulatory proceedings, including routine litigation, class actions, and governmental actions, concerning matters arising in connection with the conduct of their business activities. Ameriprise Financial believes that the Funds are not currently the subject of, and that neither Ameriprise Financial nor any of its affiliates are the subject of, any pending legal, arbitration or
Annual Report 2014
31
Columbia California Intermediate Municipal Bond Fund
Notes to Financial Statements (continued)
April 30, 2014
regulatory proceedings that are likely to have a material adverse effect on the Funds or the ability of Ameriprise Financial or its affiliates to perform under their contracts with the Funds. Ameriprise Financial is required to make 10-Q, 10-K and, as necessary, 8-K filings with the Securities and Exchange Commission on legal and regulatory matters that relate to Ameriprise Financial and its affiliates. Copies of these filings may be obtained by accessing the SEC website at www.sec.gov.
There can be no assurance that these matters, or the adverse publicity associated with them, will not result in increased fund redemptions, reduced sale of fund shares or other adverse consequences to the Funds. Further, although we believe proceedings are not likely to have a material adverse effect on the Funds or the ability of Ameriprise Financial or its affiliates to perform under their contracts with the Funds, these proceedings are subject to uncertainties and, as such, we are unable to estimate the possible loss or range of loss that may result. An adverse outcome in one or more of these proceedings could result in adverse judgments, settlements, fines, penalties or other relief that could have a material adverse effect on the consolidated financial condition or results of operations of Ameriprise Financial.
Annual Report 2014
32
Columbia California Intermediate Municipal Bond Fund
Report of Independent Registered Public Accounting Firm
To the Trustees of Columbia Funds Series Trust and the Shareholders of
Columbia California Intermediate Municipal Bond Fund
In our opinion, the accompanying statement of assets and liabilities, including the portfolio of investments, and the related statements of operations and of changes in net assets and the financial highlights present fairly, in all material respects, the financial position of Columbia California Intermediate Municipal Bond Fund (the "Fund", a series of Columbia Funds Series Trust) at April 30, 2014, and the results of its operations, the changes in its net assets and the financial highlights for each of the periods indicated, in conformity with accounting principles generally accepted in the United States of America. These financial statements and financial highlights (hereafter referred to as "financial statements") are the responsibility of the Fund's management; our responsibility is to express an opinion on these financial statements based on our audits. We conducted our audits of these financial statements in accordance with the standards of the Public Company Accounting Oversight Board (United States). Those standards require that we plan and perform the audit to obtain reasonable assurance about whether the financial statements are free of material misstatement. An audit includes examining, on a test basis, evidence supporting the amounts and disclosures in the financial statements, assessing the accounting principles used and significant estimates made by management, and evaluating the overall financial statement presentation. We believe that our audits, which included confirmation of securities at April 30, 2014 by correspondence with the custodian and brokers, provide a reasonable basis for our opinion.
PricewaterhouseCoopers LLP
Minneapolis, Minnesota
June 20, 2014
Annual Report 2014
33
Columbia California Intermediate Municipal Bond Fund
Federal Income Tax Information
(Unaudited)
The Fund hereby designates the following tax attributes for the fiscal year ended April 30, 2014. Shareholders will be notified in early 2015 of the amounts for use in preparing 2014 income tax returns.
Tax Designations:
| Exempt-Interest Dividends | | | 99.81 | % | |
Exempt-Interest Dividends. The percentage of net investment income dividends paid during the fiscal year that qualifies as exempt-interest dividends for federal income tax purposes.
Annual Report 2014
34
Columbia California Intermediate Municipal Bond Fund
Shareholders elect the Board that oversees the Funds' operations. The Board appoints officers who are responsible for day-to-day business decisions based on policies set by the Board. The following table provides basic biographical information about the Funds' Board members, including their principal occupations during the past five years, although specific titles for individuals may have varied over the period. Under current Board policy, members may serve through the end of the calendar year in which he or she reaches either the mandatory retirement age established by the Board or the fifteenth anniversary of the first Board meeting they attended as a member of the Board.
Independent Trustees
Name,
Address,
Year of Birth | | Position Held With
Funds and Length of
Service | | Principal Occupation(s)
During Past Five Years
and Other Relevant
Professional Experience | | Number of
Funds in the
Fund Family
Overseen by
Board Member | | Other Present or Past
Directorships/
Trusteeships
(Within Past 5 Years) | |
Kathleen Blatz
901 S. Marquette Ave.
Minneapolis, MN 55402
1954 | | Board member since 1/06 for RiverSource Funds and since 6/11 for Nations Funds | | Attorney; Chief Justice, Minnesota Supreme Court, 1998-2006 | | | 132 | | | Trustee, BlueCross BlueShield of Minnesota since 2009 | |
Edward J. Boudreau, Jr.
901 S. Marquette Ave.
Minneapolis, MN 55402
1944 | | Board member since 6/11 for RiverSource Funds and since 1/05 for Nations Funds | | Managing Director, E.J. Boudreau & Associates (consulting) since 2000; Chairman and Chief Executive Officer, John Hancock Funds (mutual funds), 1989-2000 | | | 130 | | | Former Trustee, BofA Funds Series Trust (11 funds), 2005-2011 | |
Pamela G. Carlton
901 S. Marquette Ave.
Minneapolis, MN 55402
1954 | | Board member since 7/07 for RiverSource Funds and since 6/11 for Nations Funds | | President, Springboard — Partners in Cross Cultural Leadership (consulting company) since 2003; Director or Management Director of US Equity Research, Chase Asset Management, 1996-2003; Investment Banker, Morgan Stanley, 1982-1996 | | | 132 | | | None | |
William P. Carmichael
901 S. Marquette Ave.
Minneapolis, MN 55402
1943 | | Chair of the Board since 1/14, Board member since 6/11 for RiverSource Funds and since 2003 for Nations Funds | | Retired; Co-founder, The Succession Fund (provides exit strategies to owners of privately held companies); previously, Senior Vice President, Sara Lee Corporation; Senior Vice President and Chief Financial Officer, Beatrice Foods Company; Vice President, Esmark, Inc.; Associate, Price Waterhouse | | | 132 | | | Director, Cobra Electronics Corporation (electronic equipment manufacturer); The Finish Line (athletic shoes and apparel) since July 2003; Director, International Textile Corp. since 2012; former Director, McMoRan Exploration Company (oil and gas exploration and development) 2010-2013; former Trustee, BofA Funds Series Trust (11 funds), 2009-2011; Director, Spectrum Brands, Inc. (consumer products), 2002-2009; Director, Simmons Company (bedding), 2004-2010 | |
Annual Report 2014
35
Columbia California Intermediate Municipal Bond Fund
Trustees and Officers (continued)
Independent Trustees (continued)
Name,
Address,
Year of Birth | | Position Held With
Funds and Length of
Service | | Principal Occupation(s)
During Past Five Years
and Other Relevant
Professional Experience | | Number of
Funds in the
Fund Family
Overseen by
Board Member | | Other Present or Past
Directorships/
Trusteeships
(Within Past 5 Years) | |
Patricia M. Flynn
901 S. Marquette Ave.
Minneapolis, MN 55402
1950 | | Board member since 11/04 for RiverSource Funds and since 6/11 for Nations Funds | | Trustee Professor of Economics and Management, Bentley University since 1976 (also teaches and conducts research on corporate governance); Dean, McCallum Graduate School of Business, Bentley University, 1992-2002 | | | 132 | | | None | |
William A. Hawkins
901 S. Marquette Ave.
Minneapolis, MN 55402
1942 | | Board member since 6/11 for RiverSource Funds and since 1/05 for Nations Funds | | Managing Director, Overton Partners (financial consulting), since August 2010; President and Chief Executive Officer, California General Bank, N.A., January 2008-August 2010 | | | 130 | | | Trustee, BofA Funds Series Trust (11 funds) | |
R. Glenn Hilliard
901 S. Marquette Ave.
Minneapolis, MN 55402
1943 | | Board member since 6/11 for RiverSource Funds and since 1/05 for Nations Funds | | Chairman and Chief Executive Officer, Hilliard Group LLC (investing and consulting) since April 2003; Non-Executive Director & Chairman, CNO Financial Group, Inc. (insurance), September 2003-May 2011 | | | 130 | | | Chairman, BofA Fund Series Trust (11 funds); former Director, CNO Financial Group, Inc. (insurance), 2003-2011 | |
Stephen R. Lewis, Jr.
901 S. Marquette Ave.
Minneapolis, MN 55402
1939 | | Board member for RiverSource Funds since 1/02 and since 6/11 for Nations Funds, Board Chair 1/07-12/13 | | President Emeritus and Professor of Economics Emeritus, Carleton College since 2002 | | | 132 | | | Director, Valmont Industries, Inc. (irrigation systems manufacturer), 2002-2013 | |
Catherine James Paglia
901 S. Marquette Ave.
Minneapolis, MN 55402
1952 | | Board member since 11/04 for RiverSource Funds and since 6/11 for Nations Funds | | Director, Enterprise Asset Management, Inc. (private real estate and asset management company) since September 1998 | | | 132 | | | Director, Valmont Industries, Inc. (irrigation systems manufacturer) since 2012 | |
Leroy C. Richie
901 S. Marquette Ave.
Minneapolis, MN 55402
1941 | | Board member since 2000 for Legacy Seligman Funds, since 11/08 for RiverSource Funds and since 6/11 for Nations Funds | | Counsel, Lewis & Munday, P.C. (law firm) since 2004; Vice President and General Counsel, Automotive Legal Affairs, Chrysler Corporation, 1993-1997 | | | 132 | | | Lead Outside Director, Digital Ally, Inc. (digital imaging) since September 2005; Director, Infinity, Inc. (oil and gas exploration and production) since 1994; Director, OGE Energy Corp. (energy and energy services) since November 2007 | |
Minor M. Shaw
901 S. Marquette Ave.
Minneapolis, MN 55402
1947 | | Board member since 6/11 for RiverSource Funds and since 2003 for Nations Funds | | President, Micco LLC (private investments) since 2011; President, Micco Corp. since 1998 | | | 130 | | | Director, Piedmont Natural Gas; Director, BlueCross BlueShield of South Carolina since April 2008; Director, National Association of Corporate Directors, Carolinas Chapter, since 2013; former Trustee, BofA Funds Series Trust (11 funds) | |
Annual Report 2014
36
Columbia California Intermediate Municipal Bond Fund
Trustees and Officers (continued)
Independent Trustees (continued)
Name,
Address,
Year of Birth | | Position Held With
Funds and Length of
Service | | Principal Occupation(s)
During Past Five Years
and Other Relevant
Professional Experience | | Number of
Funds in the
Fund Family
Overseen by
Board Member | | Other Present or Past
Directorships/
Trusteeships
(Within Past 5 Years) | |
Alison Taunton-Rigby
901 S. Marquette Ave.
Minneapolis, MN 55402
1944 | | Board member since 11/02 for RiverSource Funds and since 6/11 for Nations Funds | | Chief Executive Officer and Director, RiboNovix, Inc., (biotechnology) 2003-2010 | | | 132 | | | Director, Healthways, Inc. (health and wellbeing solutions) since 2005; Director, ICI Mutual Insurance Company, RRG since 2011; Director, Abt Associates (government contractor) since 2001; Director, Boston Children's Hospital since 2002 | |
Interested Trustee Not Affiliated with Investment Manager*
Name,
Address,
Year of Birth | | Position Held With
Funds and Length of
Service | | Principal Occupation(s)
During Past Five Years
and Other Relevant
Professional Experience | | Number of
Funds in the
Fund Family
Overseen by
Board Member | | Other Present or Past
Directorships/
Trusteeships
(Within Past 5 Years) | |
Anthony M. Santomero
901 S. Marquette Ave.
Minneapolis, MN 55402
1946 | | Board member since 6/11 for RiverSource Funds and since 1/08 for Nations Funds | | Richard K. Mellon Professor Emeritus of Finance, The Wharton School, University of Pennsylvania, since 2002; Senior Advisor, McKinsey & Company (consulting), 2006-2008 | | | 130 | | | Director, Renaissance Reinsurance Ltd. since May 2008; Trustee, Penn Mutual Life Insurance Company since March 2008; Director, Citigroup Inc. since 2009; Director, Citibank, N.A. since 2009; former Trustee, BofA Funds Series Trust (11 funds), 2008-2011 | |
*Dr. Santomero is not an affiliated person of the Investment Manager or Ameriprise Financial. However, he is currently deemed by the Funds to be an "interested person" (as defined in the 1940 Act) of the Funds because he serves as a Director of Citigroup Inc. and Citibank, N.A., companies that may directly or through subsidiaries and affiliates engage from time-to-time in brokerage execution, principal transactions and lending relationships with the Funds or accounts advised/managed by the Investment Manager.
Annual Report 2014
37
Columbia California Intermediate Municipal Bond Fund
Trustees and Officers (continued)
Interested Trustee Affiliated with Investment Manager*
Name,
Address,
Year of Birth | | Position Held With
Funds and Length of
Service | | Principal Occupation(s)
During Past Five Years
and Other Relevant
Professional Experience | | Number of
Funds in the
Fund Family
Overseen by
Board Member | | Other Present or Past
Directorships/
Trusteeships
(Within Past 5 Years) | |
William F. Truscott
53600 Ameriprise
Financial Center
Minneapolis, MN 55474
1960 | | Board member since 11/01 for RiverSource Funds and since 6/11 for Nations Funds; Senior Vice President since 2002 for RiverSource Funds and since 5/10 for Nations Funds | | Chairman of the Board and President, Columbia Management Investment Advisers, LLC since May 2010 and February 2012, respectively (previously President and Chief Investment Officer, 2001-April 2010); Chief Executive Officer, Global Asset Management, Ameriprise Financial, Inc. since September 2012 (previously Chief Executive Officer, U.S. Asset Management & President, Annuities, May 2010-September 2012 and President — U.S. Asset Management and Chief Investment Officer, 2005-April 2010); Director and Chief Executive Officer, Columbia Management Investment Distributors, Inc. since May 2010 and February 2012, respectively (previously Chairman of the Board and Chief Executive Officer, 2006-April 2010); Chairman of the Board and Chief Executive Officer, RiverSource Distributors, Inc. since 2006; Director, Threadneedle Asset Management Holdings, SARL since 2014; President and Chief Executive Officer, Ameriprise Certificate Company, 2006-August 2012 | | | 186 | | | Former Director, Ameriprise Certificate Company, 2006-January 2013 | |
*Interested person (as defined under the 1940 Act) by reason of being an officer, director, security holder and/or employee of the Investment Manager or Ameriprise Financial.
The Statement of Additional Information has additional information about the Fund's Board members and is available, without charge, upon request by calling 800.345.6611; contacting your financial intermediary or visiting columbiamanagement.com.
Annual Report 2014
38
Columbia California Intermediate Municipal Bond Fund
Trustees and Officers (continued)
The Board has appointed officers who are responsible for day-to-day business decisions based on policies it has established. The officers serve at the pleasure of the Board. In addition to Mr. Truscott, who is Senior Vice President, the Funds' other officers are:
Officers
Name,
Address and
Year of Birth | | Position and Year
First Appointed to
Position for any Fund
in the Columbia
Funds Complex or a
Predecessor Thereof | | Principal Occupation(s) During Past Five Years | |
J. Kevin Connaughton
225 Franklin Street
Boston, MA 02110
Born 1964 | | President and Principal Executive Officer (2009) | | Managing Director and General Manager — Mutual Fund Products, Columbia Management Investment Advisers, LLC since May 2010; and President, Columbia Funds since 2009; Managing Director, Columbia Management Advisors, LLC, December 2004-April 2010; Senior Vice President and Chief Financial Officer, Columbia Funds, June 2008-January 2009; and senior officer of Columbia Funds and affiliated funds since 2003 | |
Michael G. Clarke
225 Franklin Street
Boston, MA 02110
Born 1969 | | Treasurer (2011) and Chief Financial Officer (2009) | | Vice President — Mutual Fund Administration, Columbia Management Investment Advisers, LLC, since May 2010; Managing Director of Fund Administration, Columbia Management Advisors, LLC, September 2004-April 2010; and senior officer of Columbia Funds and affiliated funds since 2002 | |
Scott R. Plummer
5228 Ameriprise Financial Center
Minneapolis, MN 55474
Born 1959 | | Senior Vice President (2006), Chief Legal Officer (2006) and Assistant Secretary (2011) | | Senior Vice President and Assistant General Counsel — Global Asset Management, Ameriprise Financial since February 2014 (previously, Senior Vice President and Lead Chief Counsel — Asset Management, 2012-February 2014; Vice President and Lead Chief Counsel — Asset Management, 2010-2012; and Vice President and Chief Counsel — Asset Management, 2005-2010); Senior Vice President, Chief Legal Officer and Assistant Secretary, Columbia Management Investment Advisers, LLC since June 2005; Vice President, Chief Counsel and Assistant Secretary, Columbia Management Investment Distributors, Inc. since 2008; Vice President, General Counsel and Secretary, Ameriprise Certificate Company since 2005; Chief Counsel, RiverSource Distributors, Inc. since 2006; senior officer of Columbia Funds and affiliated funds since 2006 | |
Thomas P. McGuire
225 Franklin Street
Boston, MA 02110
Born 1972 | | Chief Compliance Officer (2012) | | Vice President — Asset Management Compliance, Ameriprise Financial, Inc. since May 2010; Chief Compliance Officer, Ameriprise Certificate Company, since September 2010; Compliance Executive, Bank of America, 2005-April 2010 | |
Colin Moore
225 Franklin Street
Boston, MA 02110
Born 1958 | | Senior Vice President (2010) | | Executive Vice President and Global Chief Investment Officer, Ameriprise Financial, Inc. since July 2013; Director and Global Chief Investment Officer, Columbia Management Investment Advisers, LLC since May 2010; Manager, Managing Director and Chief Investment Officer, Columbia Management Advisors, LLC, 2007-April 2010 | |
Michael E. DeFao
225 Franklin Street
Boston, MA 02110
Born 1968 | | Vice President (2011) and Assistant Secretary (2010) | | Vice President and Chief Counsel, Ameriprise Financial, Inc. since May 2010; Associate General Counsel, Bank of America 2005-April 2010 | |
Joseph F. DiMaria
225 Franklin Street
Boston, MA 02110
Born 1968 | | Vice President (2011) and Chief Accounting Officer (2008) | | Vice President — Mutual Fund Treasurer, Columbia Management Investment Advisers, LLC since May 2010; Director of Fund Administration, Columbia Management Advisors, LLC, 2006-April 2010 | |
Paul B. Goucher
100 Park Avenue
New York, NY 10017
Born 1968 | | Vice President (2011) and Assistant Secretary (2008) | | Vice President and Lead Chief Counsel, Ameriprise Financial, Inc. since November 2008 and January 2013, respectively (previously Chief Counsel, January 2010-January 2013, and Group Counsel, November 2008-January 2010); Director, Managing Director and General Counsel, J. & W. Seligman & Co. Incorporated, July 2008-November 2008 | |
Amy Johnson
5228 Ameriprise Financial
Center
Minneapolis, MN 55474
Born 1965 | | Vice President (2006) | | Managing Director and Chief Operating Officer, Columbia Management Investment Advisers, LLC since May 2010 (previously Chief Administrative Officer, 2009-April 2010, and Vice President — Asset Management and Trust Company Services, 2006-2009) | |
Annual Report 2014
39
Columbia California Intermediate Municipal Bond Fund
Trustees and Officers (continued)
Officers (continued)
Name,
Address and
Year of Birth | | Position and Year
First Appointed to
Position for any Fund
in the Columbia
Funds Complex or a
Predecessor Thereof | | Principal Occupation(s) During Past Five Years | |
Paul D. Pearson
5228 Ameriprise Financial
Center
Minneapolis, MN 55474
Born 1956 | | Vice President (2011) and Assistant Treasurer (1999) | | Vice President — Investment Accounting, Columbia Management Investment Advisers, LLC since May 2010; Vice President — Managed Assets, Investment Accounting, Ameriprise Financial, Inc., 1998-April 2010 | |
Christopher O. Petersen
5228 Ameriprise Financial
Center
Minneapolis, MN 55474
Born 1970 | | Vice President and Secretary (2010) | | Vice President and Chief Counsel, Ameriprise Financial, Inc., since January 2010 (previously Vice President and Group Counsel or Counsel, 2004-January 2010); officer of Columbia Funds and affiliated funds since 2007 | |
Stephen T. Welsh
225 Franklin Street
Boston, MA 02110
Born 1957 | | Vice President (2006) | | President and Director, Columbia Management Investment Services Corp. since May 2010; President and Director, Columbia Management Services, Inc., 2004-April 2010; Managing Director, Columbia Management Distributors, Inc., 2007-April 2010 | |
Annual Report 2014
40
Columbia California Intermediate Municipal Bond Fund
Approval of Investment Management Services
Agreement
Columbia Management Investment Advisers, LLC (Columbia Management or the Investment Manager), a wholly-owned subsidiary of Ameriprise Financial, Inc. (Ameriprise Financial), serves as the investment manager to Columbia California Intermediate Municipal Bond Fund (the Fund). Under an investment management services agreement (the IMS Agreement), Columbia Management provides investment advice and other services to the Fund and other funds distributed by Columbia Management Investment Distributors, Inc. (collectively, the Funds).
On an annual basis, the Fund's Board of Trustees (the Board), including the independent Board members (the Independent Trustees), considers renewal of the IMS Agreement. Columbia Management prepared detailed reports for the Board and its Contracts Committee in January, March and April 2014, including reports based on analyses of data provided by an independent organization (Lipper) and a comprehensive response to each item of information requested by independent legal counsel to the Independent Trustees (Independent Legal Counsel) in a letter to the Investment Manager, to assist the Board in making this determination. All of the materials presented in January, March and April were first supplied in draft form to designated representatives of the Independent Trustees, i.e., Independent Legal Counsel, Fund Counsel, the Chair of the Board and the Chair of the Contracts Committee, and the final materials (including proposed expense caps for certain Funds) were revised to reflect discussion and subsequent requests made by the Contracts Committee. In addition, throughout the year, the Board (or its committees) regularly meets with portfolio management teams and senior management personnel, and reviews information prepared by Columbia Management addressing the services Columbia Management provides and Fund performance. The Board also accords appropriate weight to the work, deliberations and conclusions of the Contracts Committee, the Investment Review Committee and the Compliance Committee in determining whether to continue the IMS Agreement.
The Board, at its April 9-11, 2014 in-person Board meeting (the April Meeting), considered the renewal of the IMS Agreement for an additional one-year term. At the April Meeting, Independent Legal Counsel reviewed with the Independent Trustees various factors relevant to the Board's consideration of advisory agreements and the Board's legal responsibilities related to such consideration. Following an analysis and discussion of the factors identified below, the Board, including all of the Independent Trustees, approved the renewal of the IMS Agreement.
Nature, Extent and Quality of Services Provided by Columbia Management
The Independent Trustees analyzed various reports and presentations they had received detailing the services performed by Columbia Management, as well as its expertise, resources and capabilities. The Independent Trustees specifically considered many developments during the past year concerning the services provided by Columbia Management, including, in particular, the successful implementation of a globalization initiative, which, among other things, increased worldwide analyst support for global products, the reorganization of the Informational Technology research team, the hiring of additional personnel to assist the Asset Allocation team and the global restructuring of the Senior Operational team. The Independent Trustees noted the information they received concerning Columbia Management's ability to retain its key portfolio management personnel. The Independent Trustees also recalled Columbia Management's representation that additional staff has been added to support the vigorous application of the "5P" review process, to which all internally-managed Funds are subject.
In connection with the Board's evaluation of the overall package of services provided by Columbia Management, the Board also considered the quality of administrative services provided to the Fund by Columbia Management, recalling the information it received highlighting significant achievements in 2013 in the performance of administrative services. In evaluating the quality of services provided under the IMS Agreement and the Fund's Administrative Services Agreement, the Independent Trustees also took into account the organization and strength of the Fund's and its service providers' compliance programs. In addition, the Board also reviewed the financial condition of Columbia Management (and its affiliates) and each entity's ability to carry out its responsibilities under the IMS Agreement and the Fund's other services agreements with affiliates of Ameriprise Financial, observing the financial strength of Ameriprise Financial, with its solid balance sheet. The Board also discussed the acceptability of the terms of the IMS Agreement (including the relatively broad scope of services required to be performed by Columbia Management). The Board concluded that the services being performed under the IMS Agreement were of a reasonably high quality.
Based on the foregoing, and based on other information received (both oral and written, including the information on investment performance referenced below) and other considerations, the Board concluded that Columbia Management and its affiliates were in a position to continue to provide a high quality and level of services to the Fund.
Annual Report 2014
41
Columbia California Intermediate Municipal Bond Fund
Approval of Investment Management Services
Agreement (continued)
Investment Performance
For purposes of evaluating the nature, extent and quality of services provided under the IMS Agreement, the Board carefully reviewed the investment performance of the Fund. In this regard, the Board considered detailed reports providing the results of analyses performed by an independent organization showing, for various periods, the performance of the Fund, the performance of a benchmark index, the percentage ranking of the Fund among its comparison group and the net assets of the Fund. The Board observed that the Fund's investment performance was appropriate in light of the particular management style involved and the particular market environment.
Comparative Fees, Costs of Services Provided and the Profits Realized By Columbia Management and its Affiliates from their Relationships with the Fund
The Board reviewed comparative fees and the costs of services provided under the IMS Agreement. The Board members considered detailed comparative information set forth in an annual report on fees and expenses, including, among other things, data (based on analyses conducted by an independent organization) showing a comparison of the Fund's expenses with median expenses paid by funds in its comparative peer universe, as well as data showing the Fund's contribution to Columbia Management's profitability.
The Board accorded particular weight to the notion that the level of fees should reflect a rational pricing model applied consistently across the various product lines in the Fund family, while assuring that the overall fees for each Fund (with few defined exceptions) are generally in line with the "pricing philosophy" currently in effect (i.e., that the total expense ratio of the Fund is no higher than the median expense ratio of funds in the same comparison universe of the Fund). In this connection, the Board also considered the 2013 report provided by an independent consulting firm, Bobroff Consulting (the Independent Consultant), that concluded that the Funds' standardized investment management fee rates were within a reasonable range. The Board took into account that the Fund's total expense ratio (after considering proposed voluntaryexpense caps/waivers) approximated the peer universe's median expense ratio. It was observed that various proposals concerning the Funds' transfer agency and sub-transfer agency fee structures, and other changes impacting the Funds' pricing structure and fees, are expected to be considered at a later Board meeting which, if adopted, would alter the current pricing philosophy. Based on its review, the Board concluded that the Fund's management fee was fair and reasonable in light of the extent and quality of services that the Fund receives.
The Board also considered the expected profitability of Columbia Management and its affiliates in connection with Columbia Management providing investment management services to the Fund. In this regard, the Board referred to a detailed profitability report, discussing the profitability to Columbia Management and Ameriprise Financial from managing, operating and distributing the Funds. In this regard, the Board observed that: (i) the Independent Consultant concluded that 2012 profitability was reasonable; (ii) 2013 profitability only moderately exceeded 2012 levels; and (iii) 2013 profitability is in line with profitability levels of industry competitors. It also took into account the indirect economic benefits flowing to Columbia Management or its affiliates in connection with managing or distributing the Funds, such as the enhanced ability to offer various other financial products to Ameriprise Financial customers, soft dollar benefits and overall reputational advantages. The Board noted that the fees paid by the Funds should permit the Investment Manager to offer competitive compensation to its personnel, make necessary investments in its business and earn an appropriate profit. The Board concluded that profitability levels were reasonable.
Economies of Scale to be Realized
The Board also considered the economies of scale that might be realized by Columbia Management as the Fund grows and took note of the extent to which Fund shareholders might also benefit from such growth. In this regard, the Independent Trustees took into account that IMS fees decline as Fund assets exceed various breakpoints, all of which have not been surpassed.
Based on the foregoing, the Board, including all of the Independent Trustees, concluded that the investment management service fees were fair and reasonable in light of the extent and quality of services provided. In reaching this conclusion, no single factor was determinative. On April 11, 2014, the Board, including all of the Independent Trustees, approved the renewal of the IMS Agreement.
Annual Report 2014
42
This page intentionally left blank.
Annual Report 2014
43
This page intentionally left blank.
Annual Report 2014
44
Columbia California Intermediate Municipal Bond Fund
Important Information About This Report
Each fund mails one shareholder report to each shareholder address. If you would like more than one report, please call shareholder services at 800.345.6611 and additional reports will be sent to you.
The policy of the Board is to vote the proxies of the companies in which each fund holds investments consistent with the procedures as stated in the Statement of Additional Information (SAI). You may obtain a copy of the SAI without charge by calling 800.345.6611; contacting your financial intermediary; visiting columbiamanagement.com; or searching the website of the Securities and Exchange Commission (SEC) at sec.gov. Information regarding how each fund voted proxies relating to portfolio securities is filed with the SEC by August 31 for the most recent 12-month period ending June 30 of that year, and is available without charge by visiting columbiamanagement.com; or searching the website of the SEC at sec.gov.
Each fund files a complete schedule of portfolio holdings with the SEC for the first and third quarters of each fiscal year on Form N-Q. Each fund's Form N-Q is available on the SEC's website at sec.gov and may be reviewed and copied at the SEC's Public Reference Room in Washington, D.C. Information on the operation of the Public Reference Room may be obtained by calling 800.SEC.0330. Each fund's complete schedule of portfolio holdings, as filed on Form N-Q, can also be obtained without charge, upon request, by calling 800.345.6611.
Annual Report 2014
45

Columbia California Intermediate Municipal Bond Fund
P.O. Box 8081
Boston, MA 02266-8081
columbiamanagement.com
This information is for use with concurrent or prior delivery of a fund prospectus. Please read and consider the investment objectives, risks, charges and expenses for any fund carefully before investing. For a prospectus and, if available, a summary prospectus, which contains this and other important information about the Fund go to columbiamanagement.com. The Fund is distributed by Columbia Management Investment Distributors, Inc., member FINRA, and managed by Columbia Management Investment Advisers, LLC.
© 2014 Columbia Management Investment Advisers, LLC. All rights reserved.
ANN122_04_D01_(06/14)
Annual Report
April 30, 2014

Columbia Maryland Intermediate Municipal Bond Fund
(renamed Columbia AMT-Free Maryland Intermediate Muni Bond Fund, effective July 7, 2014)
Not FDIC insured • No bank guarantee • May lose value
 Dear Shareholders,
Continued Economic Recovery
The U.S. economy continued to recover at a slow but steady pace during the first quarter of 2014, supported by solid manufacturing activity, reasonable job growth and continued gains for the housing market. Industrial production was robust, buoyed by strong demand for autos and related parts. After a disappointing January, job growth picked up, which helped boost consumer confidence. Housing data was somewhat mixed, as harsh weather and higher mortgage rates put a damper on sales, while lower inventories helped prices trend higher. The Federal Reserve (the Fed) announced further reductions to its monthly asset purchases and reassured the markets that it would not make any significant changes to monetary policy until it was satisfied that the labor market was on solid ground. Despite mostly good news on the economic front, the broad financial markets recorded only modest gains, as bitter winter weather at home and mounting tensions between Russia and Western allies prompted investor caution.
Investors braced for higher interest rates, but long-term yields declined and the fixed-income markets were surprisingly resilient in the face of stable-to-improving economic data. Risk-on trading continued during the quarter as the higher yielding sectors of the fixed-income markets generally fared well. Emerging-market bonds, long-term U.S. Treasuries and sovereign debt were among the strongest performers, as were Treasury Inflation Protected Securities. Municipal bonds delivered solid gains, especially high-yield municipals, which benefited from continued improvement in state finances.
Against this backdrop, the broad bond market, as measured by the Barclays U.S. Aggregate Bond Index, edged out the broad stock market, as measured by the Standard & Poor's 500 Index, with gains of 1.84% vs. 1.81%, respectively. As indicated late last year, the Fed began tapering its monthly asset purchase program and announced further reductions. New Fed chair Janet Yellen reassured investors the Fed was committed to keeping short-term borrowing rates low into 2015.
Stay on Track with Columbia Management
Backed by more than 100 years of experience, Columbia Management is one of the nation's largest asset managers. At the heart of our success and, most importantly, that of our investors, are highly talented industry professionals, brought together by a unique way of working. At Columbia Management, reaching our performance goals matters, and how we reach them matters just as much.
Visit columbiamanagement.com for:
> The Columbia Management Perspectives blog, offering insights on current market events and investment opportunities
> Detailed up-to-date fund performance and portfolio information
> Quarterly fund commentaries
> Columbia Management investor, our award-winning quarterly newsletter for shareholders
Thank you for your continued support of the Columbia Funds. We look forward to serving your investment needs for many years to come.
Best Regards,

J. Kevin Connaughton
President, Columbia Funds
Investing involves risk including the risk of loss of principal.
The Barclays U.S. Aggregate Bond Index is a broad-based benchmark that measures the investment grade, U.S. dollar denominated, fixed-rate taxable bond market, including Treasuries, government-related and corporate securities, mortgage-backed securities (agency fixed-rate and hybrid adjustable-rate mortgage passthroughs), asset-backed securities, and commercial mortgage-backed securities. The S&P 500 Index, an unmanaged index, measures the performance of 500 widely held, large-capitalization U.S. stocks and is frequently used as a general measure of market performance. Indices are not available for investment, are not professionally managed and do not reflect sales charges, fees, brokerage commissions, taxes or other expenses of investing.
Investors should consider the investment objectives, risks, charges and expenses of a mutual fund carefully before investing. For a free prospectus and, if available, a summary prospectus, which contains this and other important information about a fund, visit columbiamanagement.com. The prospectus should be read carefully before investing.
Columbia Funds are distributed by Columbia Management Investment Distributors, Inc., member FINRA, and managed by Columbia Management Investment Advisers, LLC.
© 2014 Columbia Management Investment Advisers, LLC. All rights reserved.
Columbia Maryland Intermediate Municipal Bond Fund
Performance Overview | | | 2 | | |
Manager Discussion of Fund Performance | | | 4 | | |
Understanding Your Fund's Expenses | | | 6 | | |
Portfolio of Investments | | | 7 | | |
Statement of Assets and Liabilities | | | 12 | | |
Statement of Operations | | | 14 | | |
Statement of Changes in Net Assets | | | 15 | | |
Financial Highlights | | | 17 | | |
Notes to Financial Statements | | | 22 | | |
Report of Independent Registered
Public Accounting Firm | | | 27 | | |
Federal Income Tax Information | | | 28 | | |
Trustees and Officers | | | 29 | | |
Approval of Investment Management Services Agreement | | | 35 | | |
Important Information About This Report | | | 37 | | |
Fund Investment Manager
Columbia Management Investment
Advisers, LLC
225 Franklin Street
Boston, MA 02110
Fund Distributor
Columbia Management Investment
Distributors, Inc.
225 Franklin Street
Boston, MA 02110
Fund Transfer Agent
Columbia Management Investment
Services Corp.
P.O. Box 8081
Boston, MA 02266-8081
For more information about any of the funds, please visit columbiamanagement.com or call 800.345.6611. Customer Service Representatives are available to answer your questions Monday through Friday from 8 a.m. to 7 p.m. Eastern time.
The views expressed in this report reflect the current views of the respective parties. These views are not guarantees of future performance and involve certain risks, uncertainties and assumptions that are difficult to predict, so actual outcomes and results may differ significantly from the views expressed. These views are subject to change at any time based upon economic, market or other conditions and the respective parties disclaim any responsibility to update such views. These views may not be relied on as investment advice and, because investment decisions for a Columbia Fund are based on numerous factors, may not be relied on as an indication of trading intent on behalf of any particular Columbia Fund. References to specific securities should not be construed as a recommendation or investment advice.
Columbia Maryland Intermediate Municipal Bond Fund
Performance Summary
> Columbia Maryland Intermediate Municipal Bond Fund (the Fund) Class A shares returned -0.16% excluding sales charges for the 12-month period that ended April 30, 2014. Class Z shares of the Fund returned 0.09% for the same time period.
> The Fund's benchmark, the Barclays 3-15 Year Blend Municipal Bond Index, returned 0.97% for the 12-month period.
> The Fund's state general obligation bonds, modest exposure to Puerto Rico and maturity positioning detracted from results.
Average Annual Total Returns (%) (for period ended April 30, 2014)
| | Inception | | 1 Year | | 5 Years | | 10 Years | |
Class A | | 09/01/90 | | | | | | | | | | | | | |
Excluding sales charges | | | | | | | -0.16 | | | | 4.12 | | | | 3.27 | | |
Including sales charges | | | | | | | -3.37 | | | | 3.45 | | | | 2.93 | | |
Class B | | 06/08/93 | | | | | | | | | | | | | |
Excluding sales charges | | | | | | | -0.90 | | | | 3.35 | | | | 2.51 | | |
Including sales charges | | | | | | | -3.81 | | | | 3.35 | | | | 2.51 | | |
Class C | | 06/17/92 | | | | | | | | | | | | | |
Excluding sales charges | | | | | | | -0.90 | | | | 3.35 | | | | 2.49 | | |
Including sales charges | | | | | | | -1.87 | | | | 3.35 | | | | 2.49 | | |
Class R4* | | 03/19/13 | | | 0.08 | | | | 4.18 | | | | 3.30 | | |
Class Z | | 09/01/90 | | | 0.09 | | | | 4.38 | | | | 3.52 | | |
Barclays 3-15 Year Blend Municipal Bond Index | | | | | | | 0.97 | | | | 4.91 | | | | 4.71 | | |
Returns for Class A are shown with and without the maximum initial sales charge of 3.25%. Returns for Class B are shown with and without the applicable contingent deferred sales charge (CDSC) of 3.00% in the first year, declining to 1.00% in the fourth year and eliminated thereafter. Returns for Class C are shown with and without the 1.00% CDSC for the first year only. The Fund's other classes are not subject to sales charges and have limited eligibility. Please see the Fund's prospectus for details. Performance for different share classes will vary based on differences in sales charges and fees associated with each class. All results shown assume reinvestment of distributions during the period. Returns do not reflect the deduction of taxes that a shareholder may pay on Fund distributions or on the redemption of Fund shares. Performance results reflect the effect of any fee waivers or reimbursements of Fund expenses by Columbia Management Investment Advisers, LLC and/or any of its affiliates. Absent these fee waivers or expense reimbursement arrangements, performance results would have been lower.
The performance information shown represents past performance and is not a guarantee of future results. The investment return and principal value of your investment will fluctuate so that your shares, when redeemed, may be worth more or less than their original cost. Current performance may be lower or higher than the performance information shown. You may obtain performance information current to the most recent month-end by contacting your financial intermediary, visiting columbiamanagement.com or calling 800.345.6611.
*The returns shown for periods prior to the share class inception date (including returns for the Life of the Fund, if shown, which are since Fund inception) include the returns of the Fund's oldest share class. Since the Fund launched more than one share class at its inception, Class A shares were used. These returns are adjusted to reflect any higher class-related operating expenses of the newer share classes, as applicable. Please visit columbiamanagement.com/mutual-funds/appended-performance for more information.
The Barclays 3-15 Year Blend Municipal Bond Index is an unmanaged index that tracks the performance of municipal bonds issued after December 31, 1990, with remaining maturities between 2 and 17 years and at least $7 million in principal amount outstanding.
Indices are not available for investment, are not professionally managed and do not reflect sales charges, fees, brokerage commissions, taxes or other expenses of investing. Securities in the Fund may not match those in an index.
Annual Report 2014
2
Columbia Maryland Intermediate Municipal Bond Fund
Performance Overview (continued)
Performance of a Hypothetical $10,000 Investment (May 1, 2004 – April 30, 2014)
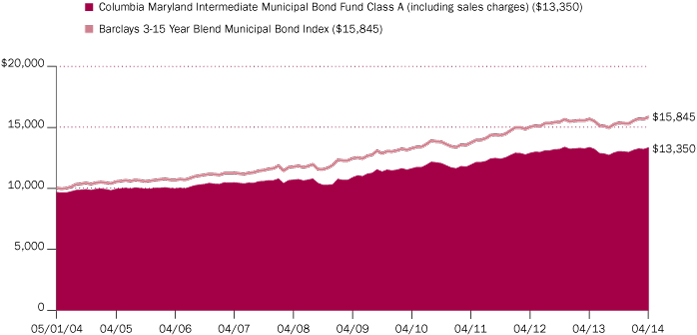
The chart above shows the change in value of a hypothetical $10,000 investment in Class A shares of Columbia Maryland Intermediate Municipal Bond Fund during the stated time period, and does not reflect the deduction of taxes that a shareholder may pay on Fund distributions or on the redemption of Fund shares.
Annual Report 2014
3
Columbia Maryland Intermediate Municipal Bond Fund
Manager Discussion of Fund Performance
Effective July 7, 2014, the Fund will be renamed Columbia AMT-Free Maryland Intermediate Muni Bond Fund.
For the 12-month period that ended April 30, 2014, the Fund's Class A shares returned -0.16% excluding sales charges. Class Z shares of the Fund returned 0.09% for the same time period. The Barclays 3-15 Year Blend Municipal Bond Index, which is national in scope, gained 0.97%. The Fund's state general obligation bonds, modest exposure to Puerto Rico and maturity positioning detracted from results.
Stable Economic Growth
Even though a difficult winter weighed on the U.S. economy early in 2014, it was not enough to derail the steady growth that marked the 12-month period. Solid new job growth drove the unemployment rate down to 6.3%. Robust manufacturing activity boosted the nation's capacity utilization rate to a recovery high of 79.2%. Personal income edged higher, borrowing increased and the savings rate declined. Consumer confidence generally rose during the 12-month period, reflecting consumer expectations that the economy was on solid ground. The housing market lost some momentum, the victim of bad winter weather, tighter borrowing standards, rising prices and higher mortgage rates. However, higher pending home sales near the end of the period was a positive data point.
Investors welcomed reduced tensions in Washington, where an extended budget deal and the president's nomination of Janet Yellen as the new Federal Reserve (Fed) chair received bipartisan support. In December 2013, the Fed announced that it would take a measured approach to tapering its monthly bond-buying program, beginning in January 2014. Further tapering commenced in February, March and April. Against this backdrop of generally positive economic news, bonds lost some ground as interest rates moved higher. Nevertheless, the municipal market managed a modestly positive return for the period.
A Challenging Environment for the Municipal Market
Municipal yields followed Treasury yields higher from the beginning of the period, in April 2013, through early September. A rapid selloff in the wake of climbing yields sent municipal bond fund shares downward, causing heavy selling pressure, which persisted through the end of the calendar year. The environment improved in the first four months of 2014. Fund outflows slowed, state and local revenues improved, demand for shorter-maturity municipal bonds remained strong and new issuance declined sharply. Through April, new bond issuance was down by 30% compared to the same period in 2013, and refunding volume has dropped by more than 50%. For the 12 months covered by this report, the best returns came from bonds with two- to four-year maturities. Ten-year maturities were the worst performers. Generally speaking, lower quality bonds generated slightly higher returns than higher quality bonds.
Portfolio Management
Brian McGreevy
Quality Breakdown (%)
(at April 30, 2014) | |
AAA rating | | | 10.7 | | |
AA rating | | | 47.8 | | |
A rating | | | 19.7 | | |
BBB rating | | | 18.1 | | |
Non-investment grade | | | 1.8 | | |
Not rated | | | 1.9 | | |
Total | | | 100.0 | | |
Percentages indicated are based upon total fixed income securities (excluding Money Market Funds).
Bond ratings apply to the underlying holdings of the Fund and not the Fund itself and are divided into categories ranging from AAA (highest) to D (lowest), and are subject to change. The ratings shown are determined by using the middle rating of Moody's, S&P, and Fitch after dropping the highest and lowest available ratings. When a rating from only two agencies is available, the lower rating is used. When a rating from only one agency is available, that rating is used. When a bond is not rated by one of these agencies, it is designated as Not rated. Credit ratings are subjective opinions and not statements of fact.
Investment Risks
There are risks associated with an investment in this Fund, including market risk, credit risk, interest rate risk prepayment and extension risk and state-specific municipal securities risk. In general, bond prices rise when interest rates fall and vice versa. Because the Fund concentrates its investments in municipal securities issued by a single state and its municipalities, specific events or factors affecting a particular state can cause more volatility in the Fund than a fund that is more geographically diversified. This effect is more pronounced for longer-term securities. Non-investment grade securities, commonly called 'high-yield' or 'junk' bonds, have more volatile prices and carry more risk to principal and income than investment grade securities. See the Fund's prospectus for information on these and other risks associated with Fund. Income from tax-exempt funds may be subject to state and local taxes. Federal and state income tax rules will apply to any capital gain distributions and any gains or losses on sales.
Annual Report 2014
4
Columbia Maryland Intermediate Municipal Bond Fund
Manager Discussion of Fund Performance (continued)
Contributors and Detractors
The Fund's holdings in the three- to eight-year maturity range outperformed the benchmark. Pre-refunded bonds also added to returns relative to the benchmark. Pre-refunded bonds are high quality and generally shorter in maturity. They are issued to pre-fund older callable bonds at lower rates for the issuer. The proceeds from the new issues are invested in Treasury securities and used to repay the original bond at its original call date. Housing and hospital bonds, which represented 25% of the portfolio, returned more than 2.0% for the Fund. Non-rated bonds, particularly continuing care retirement community issues, generated strong results.
The Fund had more exposure to the eight- to 12- year maturity range, which detracted from results, and was under weight in 12- to 17-year maturities, which outperformed late in the period. State general obligation bonds were also a small drag on results. A single position in Puerto Rico electric bonds generated negative results for the Fund and was sold before the end of the period.
Maryland's Long-Term Outlook Brightens
Last year's federal government shutdown and sequestation were a significant drag on Maryland's economy. Moody's Analytics estimates that the federal government shutdown cost the state $15 million per day. However, the new budget eases the drag of sequestation and alleviates some uncertainty going forward. Private sector employment also shows signs of life. The state's well established cybersecurity industry stands to benefit from increased global demand. In the long term, we expect Maryland to track the U.S. economy once federal government payrolls establish some stability.
Looking Ahead
So far, we believe 2014 is lining up to be a better year for the municipal market than 2013. More recent overall returns have been better than they were in 2013, especially for longer-term municipal bonds. Even though we currently expect interest rates to continue to rise gradually through the end of 2014, we believe that the taxable equivalent yield on municipals is still attractive to investors who are subject to higher federal tax rates. In this environment, we have currently positioned the Fund with neutral duration relative to the benchmark and with greater emphasis on securities rated A and BBB, which we believe have the potential to offer more value in an environment of slow but improving economic growth.
Annual Report 2014
5
Columbia Maryland Intermediate Municipal Bond Fund
Understanding Your Fund's Expenses
(Unaudited)
As an investor, you incur two types of costs. There are transaction costs, which generally include sales charges on purchases and may include redemption fees. There are also ongoing costs, which generally include management fees, distribution and/or service fees, and other fund expenses. The following information is intended to help you understand your ongoing costs (in dollars) of investing in the Fund and to help you compare these costs with the ongoing costs of investing in other mutual funds.
Analyzing Your Fund's Expenses
To illustrate these ongoing costs, we have provided examples and calculated the expenses paid by investors in each share class of the Fund during the period. The actual and hypothetical information in the table is based on an initial investment of $1,000 at the beginning of the period indicated and held for the entire period. Expense information is calculated two ways and each method provides you with different information. The amount listed in the "Actual" column is calculated using the Fund's actual operating expenses and total return for the period. You may use the Actual information, together with the amount invested, to estimate the expenses that you paid over the period. Simply divide your account value by $1,000 (for example, an $8,600 account value divided by $1,000 = 8.6), then multiply the results by the expenses paid during the period under the "Actual" column. The amount listed in the "Hypothetical" column assumes a 5% annual rate of return before expenses (which is not the Fund's actual return) and then applies the Fund's actual expense ratio for the period to the hypothetical return. You should not use the hypothetical account values and expenses to estimate either your actual account balance at the end of the period or the expenses you paid during the period. See "Compare With Other Funds" below for details on how to use the hypothetical data.
Compare With Other Funds
Since all mutual funds are required to include the same hypothetical calculations about expenses in shareholder reports, you can use this information to compare the ongoing cost of investing in the Fund with other funds. To do so, compare the hypothetical example with the 5% hypothetical examples that appear in the shareholder reports of other funds. As you compare hypothetical examples of other funds, it is important to note that hypothetical examples are meant to highlight the ongoing costs of investing in a fund only and do not reflect any transaction costs, such as sales charges, or redemption or exchange fees. Therefore, the hypothetical calculations are useful in comparing ongoing costs only, and will not help you determine the relative total costs of owning different funds. If transaction costs were included in these calculations, your costs would be higher.
November 1, 2013 – April 30, 2014
| | | Account Value at the Beginning
of the Period ($) | | Account Value at the End
of the Period ($) | | Expenses Paid During
the Period ($) | | Fund's Annualized
Expense Ratio (%) | �� |
| | | Actual | | Hypothetical | | Actual | | Hypothetical | | Actual | | Hypothetical | | Actual | |
Class A | | | 1,000.00 | | | | 1,000.00 | | | | 1,023.50 | | | | 1,020.78 | | | | 4.06 | | | | 4.06 | | | | 0.81 | | |
Class B | | | 1,000.00 | | | | 1,000.00 | | | | 1,019.70 | | | | 1,017.06 | | | | 7.81 | | | | 7.80 | | | | 1.56 | | |
Class C | | | 1,000.00 | | | | 1,000.00 | | | | 1,019.70 | | | | 1,017.06 | | | | 7.81 | | | | 7.80 | | | | 1.56 | | |
Class R4 | | | 1,000.00 | | | | 1,000.00 | | | | 1,024.70 | | | | 1,022.02 | | | | 2.81 | | | | 2.81 | | | | 0.56 | | |
Class Z | | | 1,000.00 | | | | 1,000.00 | | | | 1,024.70 | | | | 1,022.02 | | | | 2.81 | | | | 2.81 | | | | 0.56 | | |
Expenses paid during the period are equal to the annualized expense ratio for each class as indicated above, multiplied by the average account value over the period and then multiplied by the number of days in the Fund's most recent fiscal half year and divided by 365.
Expenses do not include fees and expenses incurred indirectly by the Fund from the underlying funds in which the Fund may invest (also referred to as "acquired funds"), including affiliated and non-affiliated pooled investment vehicles (including mutual funds and exchange-traded funds).
Had Columbia Management Investment Advisers, LLC and/or certain of its affiliates not waived/reimbursed certain fees and expenses, account value at the end of the period would have been reduced.
Annual Report 2014
6
Columbia Maryland Intermediate Municipal Bond Fund
Portfolio of Investments
April 30, 2014
(Percentages represent value of investments compared to net assets)
Municipal Bonds 97.5%
Issue
Description | | Coupon
Rate | | Principal
Amount ($) | | Value ($) | |
Disposal 1.3% | |
Maryland Environmental Service
Revenue Bonds
Mid Shore II Regional Landfill
Series 2011
11/01/24 | | | 5.000 | % | | | 1,030,000 | | | | 1,158,966 | | |
Higher Education 2.6% | |
Maryland Health & Higher Educational Facilities Authority
Revenue Bonds
Maryland Institute College of Art
Series 2012
06/01/29 | | | 5.000 | % | | | 1,000,000 | | | | 1,068,470 | | |
Notre Dame of Maryland University
Series 2012
10/01/32 | | | 5.000 | % | | | 1,000,000 | | | | 1,042,510 | | |
Morgan State University
Refunding Revenue Bonds
Series 2012
07/01/30 | | | 5.000 | % | | | 150,000 | | | | 165,300 | | |
Total | | | | | | | 2,276,280 | | |
Hospital 11.7% | |
Maryland Health & Higher Educational Facilities Authority
Revenue Bonds
Carroll Hospital
Series 2012A
07/01/26 | | | 5.000 | % | | | 1,210,000 | | | | 1,331,629 | | |
07/01/27 | | | 5.000 | % | | | 1,000,000 | | | | 1,092,730 | | |
FHA Insured Mortgage-Western Health
Series 2006
01/01/20 | | | 5.000 | % | | | 1,450,000 | | | | 1,555,125 | | |
Johns Hopkins Health System
Series 2012
07/01/28 | | | 5.000 | % | | | 1,000,000 | | | | 1,126,930 | | |
Johns Hopkins Health System
Series 2013C
05/15/33 | | | 5.000 | % | | | 1,500,000 | | | | 1,669,395 | | |
MedStar Health
Series 2011
08/15/22 | | | 5.000 | % | | | 1,620,000 | | | | 1,838,700 | | |
Peninsula Regional Medical Center
Series 2006
07/01/26 | | | 5.000 | % | | | 1,500,000 | | | | 1,605,750 | | |
Total | | | | | | | 10,220,259 | | |
Municipal Bonds (continued)
Issue
Description | | Coupon
Rate | | Principal
Amount ($) | | Value ($) | |
Investor Owned 3.4% | |
Maryland Economic Development Corp.
Refunding Revenue Bonds
Potomac
Series 2009
09/01/22 | | | 6.200 | % | | | 2,500,000 | | | | 2,950,450 | | |
Local Appropriation 2.7% | |
City of Baltimore
Refunding Certificate of Participation
Series 2010A
10/01/17 | | | 5.000 | % | | | 1,500,000 | | | | 1,699,275 | | |
Howard County Housing Commission
Revenue Bonds
Roger Carter Recreation Center Project
Series 2011
06/01/26 | | | 5.000 | % | | | 585,000 | | | | 648,250 | | |
Total | | | | | | | 2,347,525 | | |
Local General Obligation 12.7% | |
City of Baltimore
Unlimited General Obligation Bonds
Consolidated Public Improvement
Series 2008A (AGM)
10/15/22 | | | 5.000 | % | | | 2,000,000 | | | | 2,303,420 | | |
County of Anne Arundel
General Obligation Limited Notes
Consolidated General Improvement
Series 2006
03/01/18 | | | 5.000 | % | | | 1,500,000 | | | | 1,624,335 | | |
County of Baltimore
Unlimited General Obligation Bonds
Consolidated Public Improvement
Series 2008
02/01/18 | | | 5.000 | % | | | 1,000,000 | | | | 1,149,860 | | |
County of Frederick
Unlimited General Obligation Refunding Bonds
Public Facilities
Series 2006
11/01/18 | | | 5.250 | % | | | 2,005,000 | | | | 2,362,071 | | |
11/01/21 | | | 5.250 | % | | | 2,500,000 | | | | 3,060,125 | | |
County of Prince George's
Limited General Obligation Refunding & Public Improvement Bonds
Series 2011B
09/15/20 | | | 5.000 | % | | | 500,000 | | | | 601,260 | | |
Total | | | | | | | 11,101,071 | | |
The accompanying Notes to Financial Statements are an integral part of this statement.
Annual Report 2014
7
Columbia Maryland Intermediate Municipal Bond Fund
Portfolio of Investments (continued)
April 30, 2014
Municipal Bonds (continued)
Issue
Description | | Coupon
Rate | | Principal
Amount ($) | | Value ($) | |
Multi-Family 6.2% | |
Maryland Economic Development Corp.
Refunding Revenue Bonds
Morgan State University Project
Senior Series 2012
07/01/20 | | | 4.000 | % | | | 550,000 | | | | 579,970 | | |
University of Maryland-Baltimore County Project
Series 2006 (XLCA)
07/01/20 | | | 5.000 | % | | | 600,000 | | | | 623,460 | | |
University of Maryland-College Park Projects
Series 2006 (AGCP)
06/01/19 | | | 5.000 | % | | | 1,000,000 | | | | 1,074,100 | | |
Revenue Bonds
Salisbury University Project
Series 2012
06/01/27 | | | 5.000 | % | | | 1,100,000 | | | | 1,147,498 | | |
Senior Revenue Bonds
Towson University Project
Series 2007A
07/01/24 | | | 5.250 | % | | | 1,185,000 | | | | 1,243,930 | | |
Towson University Project
Series 2012
07/01/27 | | | 5.000 | % | | | 700,000 | | | | 748,342 | | |
Total | | | | | | | 5,417,300 | | |
Municipal Power 0.3% | |
Guam Power Authority
Refunding Revenue Bonds
Series 2012A (AGM)(a)
10/01/24 | | | 5.000 | % | | | 220,000 | | | | 252,208 | | |
Other Bond Issue 3.8% | |
County of Montgomery
Revenue Bonds
Department of Liquor Control
Series 2009A
04/01/22 | | | 5.000 | % | | | 2,055,000 | | | | 2,319,355 | | |
Maryland Community Development Administration
Revenue Bonds
Capital Fund Securitization
Series 2003 (AGM)
07/01/21 | | | 4.400 | % | | | 1,000,000 | | | | 1,001,620 | | |
Total | | | | | | | 3,320,975 | | |
Other Industrial Development Bond 1.7% | |
Maryland Economic Development Corp.
Refunding Revenue Bonds
CNX Marine Terminals, Inc.
Series 2010
09/01/25 | | | 5.750 | % | | | 1,425,000 | | | | 1,524,593 | | |
Municipal Bonds (continued)
Issue
Description | | Coupon
Rate | | Principal
Amount ($) | | Value ($) | |
Pool/Bond Bank 1.3% | |
Maryland Water Quality Financing Administration
Revolving Loan Fund
Revenue Bonds
Series 2008A
03/01/23 | | | 5.000 | % | | | 1,000,000 | | | | 1,136,270 | | |
Refunded/Escrowed 5.5% | |
City of Baltimore
Prerefunded 07/01/16 Revenue Bonds
Wastewater Projects
Series 2006C (AMBAC)
07/01/18 | | | 5.000 | % | | | 1,125,000 | | | | 1,238,726 | | |
Revenue Bonds
Water Project
Series 1994A Escrowed to Maturity (FGIC)
07/01/24 | | | 5.000 | % | | | 1,400,000 | | | | 1,695,736 | | |
County of Baltimore
Prerefunded 09/01/16 Revenue Bonds
Catholic Health Initiatives
Series 2006A
09/01/26 | | | 5.000 | % | | | 1,500,000 | | | | 1,658,280 | | |
Maryland State Transportation Authority
Revenue Bonds
Series 1978 Escrowed to Maturity
07/01/16 | | | 6.800 | % | | | 235,000 | | | | 252,606 | | |
Total | | | | | | | 4,845,348 | | |
Retirement Communities 6.3% | |
City of Gaithersburg
Refunding Revenue Bonds
Asbury Obligation
Series 2009B
01/01/23 | | | 6.000 | % | | | 1,250,000 | | | | 1,370,300 | | |
County of Baltimore
Revenue Bonds
Oak Crest Village Incorporate Facility
Series 2007A
01/01/22 | | | 5.000 | % | | | 1,045,000 | | | | 1,091,628 | | |
01/01/27 | | | 5.000 | % | | | 2,000,000 | | | | 2,056,700 | | |
Maryland Health & Higher Educational Facilities Authority
Revenue Bonds
King Farm Presbyterian Community
Series 2007A
01/01/27 | | | 5.250 | % | | | 1,000,000 | | | | 1,008,340 | | |
Total | | | | | | | 5,526,968 | | |
Single Family 1.8% | |
Maryland Community Development Administration
Revenue Bonds
Residential
Series 2010B
09/01/30 | | | 5.125 | % | | | 1,500,000 | | | | 1,587,780 | | |
The accompanying Notes to Financial Statements are an integral part of this statement.
Annual Report 2014
8
Columbia Maryland Intermediate Municipal Bond Fund
Portfolio of Investments (continued)
April 30, 2014
Municipal Bonds (continued)
Issue
Description | | Coupon
Rate | | Principal
Amount ($) | | Value ($) | |
Special Non Property Tax 7.6% | |
State of Maryland Department of Transportation
Revenue Bonds
Series 2008
02/15/22 | | | 5.000 | % | | | 3,125,000 | | | | 3,551,688 | | |
Series 2009
06/15/21 | | | 4.000 | % | | | 1,495,000 | | | | 1,660,960 | | |
Territory of Guam
Revenue Bonds
Series 2011A(a)
01/01/31 | | | 5.000 | % | | | 350,000 | | | | 363,986 | | |
Virgin Islands Public Finance Authority
Revenue Bonds
Matching Fund Loan-Senior Lien
Series 2010A(a)
10/01/17 | | | 5.000 | % | | | 1,000,000 | | | | 1,102,140 | | |
Total | | | | | | | 6,678,774 | | |
Special Property Tax 4.1% | |
Anne Arundel County Consolidated District
Special Tax Refunding Bonds
Villages of Dorchester & Farmington
Series 2013
07/01/23 | | | 5.000 | % | | | 225,000 | | | | 260,937 | | |
07/01/24 | | | 5.000 | % | | | 500,000 | | | | 574,660 | | |
County of Frederick
Special Tax Bonds
Urbana Community Development Authority
Series 2010A
07/01/25 | | | 5.000 | % | | | 2,500,000 | | | | 2,740,525 | | |
Total | | | | | | | 3,576,122 | | |
State Appropriated 4.2% | |
Maryland Economic Development Corp.
Refunding Revenue Bonds
Department of Transportation Headquarters
Series 2010
06/01/22 | | | 4.500 | % | | | 2,675,000 | | | | 3,111,105 | | |
New Jersey Transportation Trust Fund Authority
Revenue Bonds
Transportation System
Series 2006A
12/15/19 | | | 5.250 | % | | | 500,000 | | | | 588,290 | | |
Total | | | | | | | 3,699,395 | | |
State General Obligation 5.9% | |
State of Maryland
Unlimited General Obligation Bonds
State & Local Facilities
1st Series 2009C
03/01/21 | | | 5.000 | % | | | 1,500,000 | | | | 1,754,190 | | |
Municipal Bonds (continued)
Issue
Description | | Coupon
Rate | | Principal
Amount ($) | | Value ($) | |
State & Local Facilities-Capital Improvement
1st Series 2003A
03/01/17 | | | 5.250 | % | | | 3,000,000 | | | | 3,392,340 | | |
Total | | | | | | | 5,146,530 | | |
Transportation 4.0% | |
Washington Metropolitan Area Transit Authority
Revenue Bonds
Transit
Series 2009
07/01/23 | | | 5.250 | % | | | 3,000,000 | | | | 3,469,890 | | |
Turnpike/Bridge/Toll Road 2.7% | |
Maryland State Transportation Authority
Revenue Bonds
Series 2009A
07/01/22 | | | 5.000 | % | | | 2,000,000 | | | | 2,321,880 | | |
Water & Sewer 7.7% | |
City of Baltimore
Revenue Bonds
Wastewater Projects
Series 2007D (AMBAC)
07/01/19 | | | 5.000 | % | | | 1,250,000 | | | | 1,408,125 | | |
Series 2008A (AGM)
07/01/21 | | | 5.000 | % | | | 1,250,000 | | | | 1,429,950 | | |
Maryland Water Quality Financing Administration
Revolving Loan Fund
Revenue Bonds
Series 2008
03/01/21 | | | 5.000 | % | | | 2,500,000 | | | | 2,836,675 | | |
Washington Suburban Sanitary Commission
Unlimited General Obligation Refunding & Public
Improvement Bonds
Series 2009
06/01/21 | | | 4.000 | % | | | 1,000,000 | | | | 1,108,870 | | |
Total | | | | | | | 6,783,620 | | |
Total Municipal Bonds
(Cost: $79,299,490) | | | | | | | 85,342,204 | | |
The accompanying Notes to Financial Statements are an integral part of this statement.
Annual Report 2014
9
Columbia Maryland Intermediate Municipal Bond Fund
Portfolio of Investments (continued)
April 30, 2014
Money Market Funds 1.6%
| | | Shares | | Value ($) | |
JPMorgan Tax-Free Money Market Fund,
0.010%(b) | | | 1,368,449 | | | | 1,368,449 | | |
Total Money Market Funds
(Cost: $1,368,449) | | | | | 1,368,449 | | |
Total Investments
(Cost: $80,667,939) | | | | | 86,710,653 | | |
Other Assets & Liabilities, Net | | | | | 796,090 | | |
Net Assets | | | | | 87,506,743 | | |
Notes to Portfolio of Investments
(a) Municipal obligations include debt obligations issued by or on behalf of territories, possessions, or sovereign nations within the territorial boundaries of the United States. At April 30, 2014, the value of these securities amounted to $1,718,334 or 1.96% of net assets.
(b) The rate shown is the seven-day current annualized yield at April 30, 2014.
Abbreviation Legend
AGCP Assured Guaranty Corporation
AGM Assured Guaranty Municipal Corporation
AMBAC Ambac Assurance Corporation
FGIC Financial Guaranty Insurance Company
FHA Federal Housing Authority
XLCA XL Capital Assurance
Fair Value Measurements
Generally accepted accounting principles (GAAP) require disclosure regarding the inputs and valuation techniques used to measure fair value and any changes in valuation inputs or techniques. In addition, investments shall be disclosed by major category.
The Fund categorizes its fair value measurements according to a three-level hierarchy that maximizes the use of observable inputs and minimizes the use of unobservable inputs by prioritizing that the most observable input be used when available. Observable inputs are those that market participants would use in pricing an investment based on market data obtained from sources independent of the reporting entity. Unobservable inputs are those that reflect the Fund's assumptions about the information market participants would use in pricing an investment. An investment's level within the fair value hierarchy is based on the lowest level of any input that is deemed significant to the asset or liability's fair value measurement. The input levels are not necessarily an indication of the risk or liquidity associated with investments at that level. For example, certain U.S. government securities are generally high quality and liquid, however, they are reflected as Level 2 because the inputs used to determine fair value may not always be quoted prices in an active market.
Fair value inputs are summarized in the three broad levels listed below:
> Level 1 — Valuations based on quoted prices for investments in active markets that the Fund has the ability to access at the measurement date (including NAV for open-end mutual funds). Valuation adjustments are not applied to Level 1 investments.
> Level 2 — Valuations based on other significant observable inputs (including quoted prices for similar securities, interest rates, prepayment speeds, credit risks, etc.).
> Level 3 — Valuations based on significant unobservable inputs (including the Fund's own assumptions and judgment in determining the fair value of investments).
The accompanying Notes to Financial Statements are an integral part of this statement.
Annual Report 2014
10
Columbia Maryland Intermediate Municipal Bond Fund
Portfolio of Investments (continued)
April 30, 2014
Fair Value Measurements (continued)
Inputs that are used in determining fair value of an investment may include price information, credit data, volatility statistics, and other factors. These inputs can be either observable or unobservable. The availability of observable inputs can vary between investments, and is affected by various factors such as the type of investment, and the volume and level of activity for that investment or similar investments in the marketplace. The inputs will be considered by the Investment Manager, along with any other relevant factors in the calculation of an investment's fair value. The Fund uses prices and inputs that are current as of the measurement date, which may include periods of market dislocations. During these periods, the availability of prices and inputs may be reduced for many investments. This condition could cause an investment to be reclassified between the various levels within the hierarchy.
Investments falling into the Level 3 category are primarily supported by quoted prices from brokers and dealers participating in the market for those investments. However, these may be classified as Level 3 investments due to lack of market transparency and corroboration to support these quoted prices. Additionally, valuation models may be used as the pricing source for any remaining investments classified as Level 3. These models may rely on one or more significant unobservable inputs and/or significant assumptions by the Investment Manager. Inputs used in valuations may include, but are not limited to, financial statement analysis, capital account balances, discount rates and estimated cash flows, and comparable company data.
Under the direction of the Fund's Board of Trustees (the Board), the Investment Manager's Valuation Committee (the Committee) is responsible for overseeing the valuation procedures approved by the Board. The Committee consists of voting and non-voting members from various groups within the Investment Manager's organization, including operations and accounting, trading and investments, compliance, risk management and legal.
The Committee meets at least monthly to review and approve valuation matters, which may include a description of specific valuation determinations, data regarding pricing information received from approved pricing vendors and brokers and the results of Board-approved valuation control policies and procedures (the Policies). The Policies address, among other things, instances when market quotations are or are not readily available, including recommendations of third party pricing vendors and a determination of appropriate pricing methodologies; events that require specific valuation determinations and assessment of fair value techniques; securities with a potential for stale pricing, including those that are illiquid, restricted, or in default; and the effectiveness of third party pricing vendors, including periodic reviews of vendors. The Committee meets more frequently, as needed, to discuss additional valuation matters, which may include the need to review back-testing results, review time-sensitive information or approve related valuation actions. The Committee reports to the Board, with members of the Committee meeting with the Board at each of its regularly scheduled meetings to discuss valuation matters and actions during the period, similar to those described earlier.
For investments categorized as Level 3, the Committee monitors information similar to that described above, which may include: (i) data specific to the issuer or comparable issuers, (ii) general market or specific sector news and (iii) quoted prices and specific or similar security transactions. The Committee considers this data and any changes from prior periods in order to assess the reasonableness of observable and unobservable inputs, any assumptions or internal models used to value those securities and changes in fair value. This data is also used to corroborate, when available, information received from approved pricing vendors and brokers. Various factors impact the frequency of monitoring this information (which may occur as often as daily). However, the Committee may determine that changes to inputs, assumptions and models are not required as a result of the monitoring procedures performed.
The following table is a summary of the inputs used to value the Fund's investments at April 30, 2014:
Description | | Level 1
Quoted Prices in Active
Markets for Identical
Assets ($) | |
Level 2
Other Significant
Observable Inputs ($) | |
Level 3
Significant
Unobservable Inputs ($) | |
Total ($) | |
Bonds | |
Municipal Bonds | | | — | | | | 85,342,204 | | | | — | | | | 85,342,204 | | |
Total Bonds | | | — | | | | 85,342,204 | | | | — | | | | 85,342,204 | | |
Mutual Funds | |
Money Market Funds | | | 1,368,449 | | | | — | | | | — | | | | 1,368,449 | | |
Total Mutual Funds | | | 1,368,449 | | | | — | | | | — | | | | 1,368,449 | | |
Total | | | 1,368,449 | | | | 85,342,204 | | | | — | | | | 86,710,653 | | |
See the Portfolio of Investments for all investment classifications not indicated in the table.
The Fund's assets assigned to the Level 2 input category are generally valued using the market approach, in which a security's value is determined through reference to prices and information from market transactions for similar or identical assets.
There were no transfers of financial assets between levels during the period.
The accompanying Notes to Financial Statements are an integral part of this statement.
Annual Report 2014
11
Columbia Maryland Intermediate Municipal Bond Fund
Statement of Assets and Liabilities
April 30, 2014
Assets | |
Investments, at value | |
(identified cost $80,667,939) | | $ | 86,710,653 | | |
Receivable for: | |
Capital shares sold | | | 84,564 | | |
Interest | | | 1,101,740 | | |
Expense reimbursement due from Investment Manager | | | 618 | | |
Prepaid expenses | | | 637 | | |
Total assets | | | 87,898,212 | | |
Liabilities | |
Payable for: | |
Capital shares purchased | | | 10,533 | | |
Dividend distributions to shareholders | | | 226,310 | | |
Investment management fees | | | 957 | | |
Distribution and/or service fees | | | 219 | | |
Transfer agent fees | | | 14,931 | | |
Administration fees | | | 167 | | |
Compensation of board members | | | 107,626 | | |
Other expenses | | | 30,726 | | |
Total liabilities | | | 391,469 | | |
Net assets applicable to outstanding capital stock | | $ | 87,506,743 | | |
Represented by | |
Paid-in capital | | $ | 83,549,554 | | |
Undistributed net investment income | | | 238,451 | | |
Accumulated net realized loss | | | (2,323,976 | ) | |
Unrealized appreciation (depreciation) on: | |
Investments | | | 6,042,714 | | |
Total — representing net assets applicable to outstanding capital stock | | $ | 87,506,743 | | |
The accompanying Notes to Financial Statements are an integral part of this statement.
Annual Report 2014
12
Columbia Maryland Intermediate Municipal Bond Fund
Statement of Assets and Liabilities (continued)
April 30, 2014
Class A | |
Net assets | | $ | 20,972,746 | | |
Shares outstanding | | | 1,941,758 | | |
Net asset value per share | | $ | 10.80 | | |
Maximum offering price per share(a) | | $ | 11.16 | | |
Class B | |
Net assets | | $ | 92,504 | | |
Shares outstanding | | | 8,558 | | |
Net asset value per share | | $ | 10.81 | | |
Class C | |
Net assets | | $ | 2,666,465 | | |
Shares outstanding | | | 246,838 | | |
Net asset value per share | | $ | 10.80 | | |
Class R4 | |
Net assets | | $ | 10,104 | | |
Shares outstanding | | | 936 | | |
Net asset value per share(b) | | $ | 10.80 | | |
Class Z | |
Net assets | | $ | 63,764,924 | | |
Shares outstanding | | | 5,902,682 | | |
Net asset value per share | | $ | 10.80 | | |
(a) The maximum offering price per share is calculated by dividing the net asset value per share by 1.0 minus the maximum sales charge of 3.25%.
(b) Net asset value per share rounds to this amount due to fractional shares outstanding.
The accompanying Notes to Financial Statements are an integral part of this statement.
Annual Report 2014
13
Columbia Maryland Intermediate Municipal Bond Fund
Statement of Operations
Year Ended April 30, 2014
Net investment income | |
Income: | |
Dividends | | $ | 300 | | |
Interest | | | 3,961,513 | | |
Total income | | | 3,961,813 | | |
Expenses: | |
Investment management fees | | | 423,881 | | |
Distribution and/or service fees | |
Class A | | | 54,662 | | |
Class B | | | 995 | | |
Class C | | | 25,789 | | |
Transfer agent fees | |
Class A | | | 42,882 | | |
Class B | | | 195 | | |
Class C | | | 5,051 | | |
Class R4 | | | 6 | | |
Class Z | | | 160,303 | | |
Administration fees | | | 74,179 | | |
Compensation of board members | | | 25,859 | | |
Custodian fees | | | 1,833 | | |
Printing and postage fees | | | 21,300 | | |
Registration fees | | | 25,241 | | |
Professional fees | | | 31,976 | | |
Other | | | 25,170 | | |
Total expenses | | | 919,322 | | |
Fees waived or expenses reimbursed by Investment Manager and its affiliates | | | (244,382 | ) | |
Expense reductions | | | (60 | ) | |
Total net expenses | | | 674,880 | | |
Net investment income | | | 3,286,933 | | |
Realized and unrealized gain (loss) — net | |
Net realized gain (loss) on: | |
Investments | | | 34,332 | | |
Net realized gain | | | 34,332 | | |
Net change in unrealized appreciation (depreciation) on: | |
Investments | | | (4,767,002 | ) | |
Net change in unrealized appreciation (depreciation) | | | (4,767,002 | ) | |
Net realized and unrealized loss | | | (4,732,670 | ) | |
Net decrease in net assets from operations | | $ | (1,445,737 | ) | |
The accompanying Notes to Financial Statements are an integral part of this statement.
Annual Report 2014
14
Columbia Maryland Intermediate Municipal Bond Fund
Statement of Changes in Net Assets
| | | Year Ended
April 30,
2014 | | Year Ended
April 30,
2013(a) | |
Operations | |
Net investment income | | $ | 3,286,933 | | | $ | 4,120,471 | | |
Net realized gain | | | 34,332 | | | | 807,967 | | |
Net change in unrealized appreciation (depreciation) | | | (4,767,002 | ) | | | 290,144 | | |
Net increase (decrease) in net assets resulting from operations | | | (1,445,737 | ) | | | 5,218,582 | | |
Distributions to shareholders | |
Net investment income | |
Class A | | | (643,382 | ) | | | (649,382 | ) | |
Class B | | | (2,171 | ) | | | (2,810 | ) | |
Class C | | | (56,542 | ) | | | (55,899 | ) | |
Class R4 | | | (95 | ) | | | (8 | ) | |
Class Z | | | (2,584,743 | ) | | | (3,412,373 | ) | |
Total distributions to shareholders | | | (3,286,933 | ) | | | (4,120,472 | ) | |
Increase (decrease) in net assets from capital stock activity | | | (44,693,945 | ) | | | (2,058,975 | ) | |
Total decrease in net assets | | | (49,426,615 | ) | | | (960,865 | ) | |
Net assets at beginning of year | | | 136,933,358 | | | | 137,894,223 | | |
Net assets at end of year | | $ | 87,506,743 | | | $ | 136,933,358 | | |
Undistributed net investment income | | $ | 238,451 | | | $ | 238,451 | | |
(a) Class R4 shares are for the period from March 19, 2013 (commencement of operations) to April 30, 2013.
The accompanying Notes to Financial Statements are an integral part of this statement.
Annual Report 2014
15
Columbia Maryland Intermediate Municipal Bond Fund
Statement of Changes in Net Assets (continued)
| | | Year Ended April 30, 2014 | | Year Ended April 30, 2013(a) | |
| | | Shares | | Dollars ($) | | Shares | | Dollars ($) | |
Capital stock activity | |
Class A shares | |
Subscriptions(b) | | | 141,386 | | | | 1,520,318 | | | | 152,890 | | | | 1,699,702 | | |
Distributions reinvested | | | 19,255 | | | | 206,011 | | | | 15,799 | | | | 175,887 | | |
Redemptions | | | (352,147 | ) | | | (3,751,151 | ) | | | (278,163 | ) | | | (3,087,446 | ) | |
Net decrease | | | (191,506 | ) | | | (2,024,822 | ) | | | (109,474 | ) | | | (1,211,857 | ) | |
Class B shares | |
Subscriptions | | | 51 | | | | 547 | | | | 91 | | | | 1,011 | | |
Distributions reinvested | | | 152 | | | | 1,624 | | | | 158 | | | | 1,761 | | |
Redemptions(b) | | | (2,341 | ) | | | (24,948 | ) | | | (4,547 | ) | | | (50,615 | ) | |
Net decrease | | | (2,138 | ) | | | (22,777 | ) | | | (4,298 | ) | | | (47,843 | ) | |
Class C shares | |
Subscriptions | | | 72,895 | | | | 778,361 | | | | 65,891 | | | | 734,385 | | |
Distributions reinvested | | | 4,373 | | | | 46,796 | | | | 4,386 | | | | 48,835 | | |
Redemptions | | | (94,158 | ) | | | (1,005,515 | ) | | | (61,867 | ) | | | (687,787 | ) | |
Net increase (decrease) | | | (16,890 | ) | | | (180,358 | ) | | | 8,410 | | | | 95,433 | | |
Class R4 shares | |
Subscriptions | | | 710 | | | | 7,600 | | | | 226 | | | | 2,500 | | |
Distributions reinvested | | | (1 | ) | | | (6 | ) | | | 1 | | | | 6 | | |
Net increase | | | 709 | | | | 7,594 | | | | 227 | | | | 2,506 | | |
Class Z shares | |
Subscriptions | | | 393,787 | | | | 4,210,648 | | | | 1,552,156 | | | | 17,291,699 | | |
Distributions reinvested | | | 15,083 | | | | 161,405 | | | | 14,787 | | | | 164,665 | | |
Redemptions | | | (4,386,820 | ) | | | (46,845,635 | ) | | | (1,650,796 | ) | | | (18,353,578 | ) | |
Net decrease | | | (3,977,950 | ) | | | (42,473,582 | ) | | | (83,853 | ) | | | (897,214 | ) | |
Total net decrease | | | (4,187,775 | ) | | | (44,693,945 | ) | | | (188,988 | ) | | | (2,058,975 | ) | |
(a) Class R4 shares are for the period from March 19, 2013 (commencement of operations) to April 30, 2013.
(b) Includes conversions of Class B shares to Class A shares, if any.
The accompanying Notes to Financial Statements are an integral part of this statement.
Annual Report 2014
16
Columbia Maryland Intermediate Municipal Bond Fund
The following tables are intended to help you understand the Fund's financial performance. Certain information reflects financial results for a single share of a class held for the periods shown. Per share net investment income (loss) amounts are calculated based on average shares outstanding during the period. Total return assumes reinvestment of all dividends and distributions, if any. Total return does not reflect payment of sales charges, if any, and is not annualized for periods of less than one year.
| | | Year Ended April 30, | | Year Ended March 31, | |
Class A | | 2014 | | 2013 | | 2012(a) | | 2012 | | 2011 | | 2010 | |
Per share data | |
Net asset value, beginning of period | | $ | 11.14 | | | $ | 11.05 | | | $ | 10.96 | | | $ | 10.41 | | | $ | 10.53 | | | $ | 10.08 | | |
Income from investment operations: | |
Net investment income | | | 0.32 | | | | 0.30 | | | | 0.03 | | | | 0.33 | | | | 0.34 | | | | 0.34 | | |
Net realized and unrealized gain (loss) | | | (0.34 | ) | | | 0.09 | | | | 0.09 | | | | 0.55 | | | | (0.12 | ) | | | 0.45 | | |
Total from investment operations | | | (0.02 | ) | | | 0.39 | | | | 0.12 | | | | 0.88 | | | | 0.22 | | | | 0.79 | | |
Less distributions to shareholders: | |
Net investment income | | | (0.32 | ) | | | (0.30 | ) | | | (0.03 | ) | | | (0.33 | ) | | | (0.34 | ) | | | (0.34 | ) | |
Total distributions to shareholders | | | (0.32 | ) | | | (0.30 | ) | | | (0.03 | ) | | | (0.33 | ) | | | (0.34 | ) | | | (0.34 | ) | |
Net asset value, end of period | | $ | 10.80 | | | $ | 11.14 | | | $ | 11.05 | | | $ | 10.96 | | | $ | 10.41 | | | $ | 10.53 | | |
Total return | | | (0.16 | %) | | | 3.58 | % | | | 1.05 | % | | | 8.55 | % | | | 2.05 | % | | | 7.93 | % | |
Ratios to average net assets(b) | |
Total gross expenses | | | 1.05 | % | | | 1.01 | % | | | 1.05 | %(c) | | | 1.03 | % | | | 0.97 | % | | | 0.94 | % | |
Total net expenses(d) | | | 0.81 | %(e) | | | 0.81 | %(e) | | | 0.80 | %(c) | | | 0.80 | %(e) | | | 0.80 | %(e) | | | 0.79 | %(e) | |
Net investment income | | | 2.94 | % | | | 2.72 | % | | | 2.83 | %(c) | | | 3.07 | % | | | 3.18 | % | | | 3.26 | % | |
Supplemental data | |
Net assets, end of period (in thousands) | | $ | 20,973 | | | $ | 23,767 | | | $ | 24,781 | | | $ | 24,708 | | | $ | 23,454 | | | $ | 27,423 | | |
Portfolio turnover | | | 2 | % | | | 15 | % | | | 1 | % | | | 7 | % | | | 11 | % | | | 23 | % | |
Notes to Financial Highlights
(a) For the period from April 1, 2012 to April 30, 2012. During the period, the Fund's fiscal year end was changed from March 31 to April 30.
(b) In addition to the fees and expenses which the Fund bears directly, the Fund indirectly bears a pro rata share of the fees and expenses of the acquired funds in which it invests. Such indirect expenses are not included in the reported expense ratios.
(c) Annualized.
(d) Total net expenses include the impact of certain waivers/reimbursements made by the Investment Manager and certain of its affiliates, if applicable.
(e) The benefits derived from expense reductions had an impact of less than 0.01%.
The accompanying Notes to Financial Statements are an integral part of this statement.
Annual Report 2014
17
Columbia Maryland Intermediate Municipal Bond Fund
Financial Highlights (continued)
| | | Year Ended April 30, | | Year Ended March 31, | |
Class B | | 2014 | | 2013 | | 2012(a) | | 2012 | | 2011 | | 2010 | |
Per share data | |
Net asset value, beginning of period | | $ | 11.15 | | | $ | 11.06 | | | $ | 10.97 | | | $ | 10.42 | | | $ | 10.54 | | | $ | 10.09 | | |
Income from investment operations: | |
Net investment income | | | 0.23 | | | | 0.22 | | | | 0.02 | | | | 0.25 | | | | 0.26 | | | | 0.27 | | |
Net realized and unrealized gain (loss) | | | (0.34 | ) | | | 0.09 | | | | 0.09 | | | | 0.55 | | | | (0.12 | ) | | | 0.45 | | |
Total from investment operations | | | (0.11 | ) | | | 0.31 | | | | 0.11 | | | | 0.80 | | | | 0.14 | | | | 0.72 | | |
Less distributions to shareholders: | |
Net investment income | | | (0.23 | ) | | | (0.22 | ) | | | (0.02 | ) | | | (0.25 | ) | | | (0.26 | ) | | | (0.27 | ) | |
Total distributions to shareholders | | | (0.23 | ) | | | (0.22 | ) | | | (0.02 | ) | | | (0.25 | ) | | | (0.26 | ) | | | (0.27 | ) | |
Net asset value, end of period | | $ | 10.81 | | | $ | 11.15 | | | $ | 11.06 | | | $ | 10.97 | | | $ | 10.42 | | | $ | 10.54 | | |
Total return | | | (0.90 | %) | | | 2.81 | % | | | 0.99 | % | | | 7.73 | % | | | 1.30 | % | | | 7.13 | % | |
Ratios to average net assets(b) | |
Total gross expenses | | | 1.79 | % | | | 1.75 | % | | | 1.80 | %(c) | | | 1.81 | % | | | 1.72 | % | | | 1.69 | % | |
Total net expenses(d) | | | 1.56 | %(e) | | | 1.56 | %(e) | | | 1.55 | %(c) | | | 1.55 | %(e) | | | 1.55 | %(e) | | | 1.54 | %(e) | |
Net investment income | | | 2.18 | % | | | 1.96 | % | | | 2.08 | %(c) | | | 2.34 | % | | | 2.43 | % | | | 2.56 | % | |
Supplemental data | |
Net assets, end of period (in thousands) | | $ | 93 | | | $ | 119 | | | $ | 166 | | | $ | 164 | | | $ | 371 | | | $ | 929 | | |
Portfolio turnover | | | 2 | % | | | 15 | % | | | 1 | % | | | 7 | % | | | 11 | % | | | 23 | % | |
Notes to Financial Highlights
(a) For the period from April 1, 2012 to April 30, 2012. During the period, the Fund's fiscal year end was changed from March 31 to April 30.
(b) In addition to the fees and expenses which the Fund bears directly, the Fund indirectly bears a pro rata share of the fees and expenses of the acquired funds in which it invests. Such indirect expenses are not included in the reported expense ratios.
(c) Annualized.
(d) Total net expenses include the impact of certain waivers/reimbursements made by the Investment Manager and certain of its affiliates, if applicable.
(e) The benefits derived from expense reductions had an impact of less than 0.01%.
The accompanying Notes to Financial Statements are an integral part of this statement.
Annual Report 2014
18
Columbia Maryland Intermediate Municipal Bond Fund
Financial Highlights (continued)
| | | Year Ended April 30, | | Year Ended March 31, | |
Class C | | 2014 | | 2013 | | 2012(a) | | 2012 | | 2011 | | 2010 | |
Per share data | |
Net asset value, beginning of period | | $ | 11.14 | | | $ | 11.05 | | | $ | 10.96 | | | $ | 10.41 | | | $ | 10.53 | | | $ | 10.08 | | |
Income from investment operations: | |
Net investment income | | | 0.24 | | | | 0.22 | | | | 0.02 | | | | 0.25 | | | | 0.26 | | | | 0.26 | | |
Net realized and unrealized gain (loss) | | | (0.34 | ) | | | 0.09 | | | | 0.09 | | | | 0.55 | | | | (0.12 | ) | | | 0.45 | | |
Total from investment operations | | | (0.10 | ) | | | 0.31 | | | | 0.11 | | | | 0.80 | | | | 0.14 | | | | 0.71 | | |
Less distributions to shareholders: | |
Net investment income | | | (0.24 | ) | | | (0.22 | ) | | | (0.02 | ) | | | (0.25 | ) | | | (0.26 | ) | | | (0.26 | ) | |
Total distributions to shareholders | | | (0.24 | ) | | | (0.22 | ) | | | (0.02 | ) | | | (0.25 | ) | | | (0.26 | ) | | | (0.26 | ) | |
Net asset value, end of period | | $ | 10.80 | | | $ | 11.14 | | | $ | 11.05 | | | $ | 10.96 | | | $ | 10.41 | | | $ | 10.53 | | |
Total return | | | (0.90 | %) | | | 2.81 | % | | | 0.99 | % | | | 7.74 | % | | | 1.29 | % | | | 7.12 | % | |
Ratios to average net assets(b) | |
Total gross expenses | | | 1.80 | % | | | 1.76 | % | | | 1.80 | %(c) | | | 1.78 | % | | | 1.72 | % | | | 1.69 | % | |
Total net expenses(d) | | | 1.56 | %(e) | | | 1.56 | %(e) | | | 1.55 | %(c) | | | 1.55 | %(e) | | | 1.55 | %(e) | | | 1.54 | %(e) | |
Net investment income | | | 2.19 | % | | | 1.96 | % | | | 2.09 | %(c) | | | 2.33 | % | | | 2.42 | % | | | 2.49 | % | |
Supplemental data | |
Net assets, end of period (in thousands) | | $ | 2,666 | | | $ | 2,939 | | | $ | 2,822 | | | $ | 2,838 | | | $ | 3,705 | | | $ | 3,269 | | |
Portfolio turnover | | | 2 | % | | | 15 | % | | | 1 | % | | | 7 | % | | | 11 | % | | | 23 | % | |
Notes to Financial Highlights
(a) For the period from April 1, 2012 to April 30, 2012. During the period, the Fund's fiscal year end was changed from March 31 to April 30.
(b) In addition to the fees and expenses which the Fund bears directly, the Fund indirectly bears a pro rata share of the fees and expenses of the acquired funds in which it invests. Such indirect expenses are not included in the reported expense ratios.
(c) Annualized.
(d) Total net expenses include the impact of certain waivers/reimbursements made by the Investment Manager and certain of its affiliates, if applicable.
(e) The benefits derived from expense reductions had an impact of less than 0.01%.
The accompanying Notes to Financial Statements are an integral part of this statement.
Annual Report 2014
19
Columbia Maryland Intermediate Municipal Bond Fund
Financial Highlights (continued)
| | | Year Ended April 30, | |
Class R4 | | 2014 | | 2013(a) | |
Per share data | |
Net asset value, beginning of period | | $ | 11.14 | | | $ | 11.06 | | |
Income from investment operations: | |
Net investment income | | | 0.34 | | | | 0.04 | | |
Net realized and unrealized gain (loss) | | | (0.34 | ) | | | 0.08 | | |
Total from investment operations | | | — | | | | 0.12 | | |
Less distributions to shareholders: | |
Net investment income | | | (0.34 | ) | | | (0.04 | ) | |
Total distributions to shareholders | | | (0.34 | ) | | | (0.04 | ) | |
Net asset value, end of period | | $ | 10.80 | | | $ | 11.14 | | |
Total return | | | 0.08 | % | | | 1.06 | % | |
Ratios to average net assets(b) | |
Total gross expenses | | | 0.81 | % | | | 0.71 | %(c) | |
Total net expenses(d) | | | 0.56 | %(e) | | | 0.55 | %(c) | |
Net investment income | | | 3.24 | % | | | 2.97 | %(c) | |
Supplemental data | |
Net assets, end of period (in thousands) | | $ | 10 | | | $ | 3 | | |
Portfolio turnover | | | 2 | % | | | 15 | % | |
Notes to Financial Highlights
(a) For the period from March 19, 2013 (commencement of operations) to April 30, 2013.
(b) In addition to the fees and expenses which the Fund bears directly, the Fund indirectly bears a pro rata share of the fees and expenses of the acquired funds in which it invests. Such indirect expenses are not included in the reported expense ratios.
(c) Annualized.
(d) Total net expenses include the impact of certain waivers/reimbursements made by the Investment Manager and certain of its affiliates, if applicable.
(e) The benefits derived from expense reductions had an impact of less than 0.01%.
The accompanying Notes to Financial Statements are an integral part of this statement.
Annual Report 2014
20
Columbia Maryland Intermediate Municipal Bond Fund
Financial Highlights (continued)
| | | Year Ended April 30, | | Year Ended March 31, | |
Class Z | | 2014 | | 2013 | | 2012(a) | | 2012 | | 2011 | | 2010 | |
Per share data | |
Net asset value, beginning of period | | $ | 11.14 | | | $ | 11.05 | | | $ | 10.96 | | | $ | 10.41 | | | $ | 10.53 | | | $ | 10.09 | | |
Income from investment operations: | |
Net investment income | | | 0.34 | | | | 0.33 | | | | 0.03 | | | | 0.36 | | | | 0.36 | | | | 0.37 | | |
Net realized and unrealized gain (loss) | | | (0.34 | ) | | | 0.09 | | | | 0.09 | | | | 0.55 | | | | (0.11 | ) | | | 0.44 | | |
Total from investment operations | | | — | | | | 0.42 | | | | 0.12 | | | | 0.91 | | | | 0.25 | | | | 0.81 | | |
Less distributions to shareholders: | |
Net investment income | | | (0.34 | ) | | | (0.33 | ) | | | (0.03 | ) | | | (0.36 | ) | | | (0.37 | ) | | | (0.37 | ) | |
Total distributions to shareholders | | | (0.34 | ) | | | (0.33 | ) | | | (0.03 | ) | | | (0.36 | ) | | | (0.37 | ) | | | (0.37 | ) | |
Net asset value, end of period | | $ | 10.80 | | | $ | 11.14 | | | $ | 11.05 | | | $ | 10.96 | | | $ | 10.41 | | | $ | 10.53 | | |
Total return | | | 0.09 | % | | | 3.84 | % | | | 1.07 | % | | | 8.82 | % | | | 2.31 | % | | | 8.09 | % | |
Ratios to average net assets(b) | |
Total gross expenses | | | 0.79 | % | | | 0.76 | % | | | 0.80 | %(c) | | | 0.77 | % | | | 0.72 | % | | | 0.69 | % | |
Total net expenses(d) | | | 0.56 | %(e) | | | 0.56 | %(e) | | | 0.55 | %(c) | | | 0.55 | %(e) | | | 0.55 | %(e) | | | 0.54 | %(e) | |
Net investment income | | | 3.17 | % | | | 2.96 | % | | | 3.07 | %(c) | | | 3.31 | % | | | 3.43 | % | | | 3.52 | % | |
Supplemental data | |
Net assets, end of period (in thousands) | | $ | 63,765 | | | $ | 110,105 | | | $ | 110,126 | | | $ | 109,482 | | | $ | 103,031 | | | $ | 131,234 | | |
Portfolio turnover | | | 2 | % | | | 15 | % | | | 1 | % | | | 7 | % | | | 11 | % | | | 23 | % | |
Notes to Financial Highlights
(a) For the period from April 1, 2012 to April 30, 2012. During the period, the Fund's fiscal year end was changed from March 31 to April 30.
(b) In addition to the fees and expenses which the Fund bears directly, the Fund indirectly bears a pro rata share of the fees and expenses of the acquired funds in which it invests. Such indirect expenses are not included in the reported expense ratios.
(c) Annualized.
(d) Total net expenses include the impact of certain waivers/reimbursements made by the Investment Manager and certain of its affiliates, if applicable.
(e) The benefits derived from expense reductions had an impact of less than 0.01%.
The accompanying Notes to Financial Statements are an integral part of this statement.
Annual Report 2014
21
Columbia Maryland Intermediate Municipal Bond Fund
Notes to Financial Statements
April 30, 2014
Note 1. Organization
Columbia Maryland Intermediate Municipal Bond Fund (the Fund), a series of Columbia Funds Series Trust (the Trust), is a non-diversified fund. The Trust is registered under the Investment Company Act of 1940, as amended (the 1940 Act), as an open-end management investment company organized as a Delaware statutory trust.
Fund Shares
The Trust may issue an unlimited number of shares (without par value). The Fund offers Class A, Class B, Class C, Class R4 and Class Z shares. Although all share classes generally have identical voting, dividend and liquidation rights, each share class votes separately when required by law. Different share classes pay different distribution amounts to the extent the expenses of such share classes differ, and distributions in liquidation will be proportional to the net asset value of each share class. Each share class has its own expense structure and sales charges, as applicable.
Class A shares are subject to a maximum front-end sales charge of 3.25% based on the initial investment amount. Class A shares purchased without an initial sales charge in accounts aggregating $1 million to $50 million at the time of purchase are subject to a contingent deferred sales charge (CDSC) if the shares are sold within 18 months of purchase, charged as follows: 1.00% CDSC if redeemed within 12 months of purchase, and 0.50% CDSC if redeemed more than 12, but less than 18, months after purchase.
Class B shares may be subject to a maximum CDSC of 3.00% based upon the holding period after purchase. Class B shares will generally convert to Class A shares eight years after purchase. The Fund no longer accepts investments by new or existing investors in the Fund's Class B shares, except in connection with the reinvestment of any dividend and/or capital gain distributions in Class B shares of the Fund and exchanges by existing Class B shareholders of certain other funds within the Columbia Family of Funds.
Class C shares are subject to a 1.00% CDSC on shares redeemed within one year of purchase.
Class R4 shares are not subject to sales charges and are generally available only to omnibus retirement plans and certain other eligible investors.
Class Z shares are not subject to sales charges and are available only to certain eligible investors, which are subject to different investment minimums.
Note 2. Summary of Significant Accounting Policies
Use of Estimates
The preparation of financial statements in accordance with U.S. generally accepted accounting principles (GAAP) requires management to make certain estimates and assumptions that affect the reported amounts of assets and liabilities, the disclosure of contingent assets and liabilities at the date of the financial statements and the reported amounts of revenue and expenses during the reporting period. Actual results could differ from those estimates.
The following is a summary of significant accounting policies consistently followed by the Fund in the preparation of its financial statements.
Security Valuation
Debt securities generally are valued by pricing services approved by the Board of Trustees (the Board) based upon market transactions for normal, institutional-size trading units of similar securities. The services may use various pricing techniques which take into account appropriate factors such as yield, quality, coupon rate, maturity, type of issue, trading characteristics and other data, as well as broker quotes. Debt securities for which quotations are readily available may also be valued based upon an over-the-counter or exchange bid quotation.
Investments in open-end investment companies, including money market funds, are valued at net asset value.
Investments for which market quotations are not readily available, or that have quotations which management believes are not reliable, are valued at fair value as determined in good faith under consistently applied procedures established by and under the general supervision of the Board. If a security or class of securities (such as foreign securities) is valued at fair value, such value is likely to be different from the last quoted market price for the security.
The determination of fair value often requires significant judgment. To determine fair value, management may use assumptions including but not limited to future cash flows and estimated risk premiums. Multiple inputs from various sources may be used to determine fair value.
Security Transactions
Security transactions are accounted for on the trade date. Cost is determined and gains (losses) are based upon the specific identification method for both financial statement and federal income tax purposes.
Annual Report 2014
22
Columbia Maryland Intermediate Municipal Bond Fund
Notes to Financial Statements (continued)
April 30, 2014
Income Recognition
Interest income is recorded on an accrual basis. Market premiums and discounts, including original issue discounts, are amortized and accreted, respectively, over the expected life of the security on all debt securities, unless otherwise noted.
Dividend income is recorded on the ex-dividend date.
Expenses
General expenses of the Trust are allocated to the Fund and other funds of the Trust based upon relative net assets or other expense allocation methodologies determined by the nature of the expense. Expenses directly attributable to the Fund are charged to the Fund. Expenses directly attributable to a specific class of shares are charged to that share class.
Determination of Class Net Asset Value
All income, expenses (other than class-specific expenses, which are charged to that share class, as shown in the Statement of Operations) and realized and unrealized gains (losses) are allocated to each class of the Fund on a daily basis, based on the relative net assets of each class, for purposes of determining the net asset value of each class.
Federal Income Tax Status
The Fund intends to qualify each year as a regulated investment company under Subchapter M of the Internal Revenue Code, as amended, and will distribute substantially all of its tax exempt and taxable income (including net short-term capital gains), if any, for its tax year, and as such will not be subject to federal income taxes. In addition, the Fund intends to distribute in each calendar year substantially all of its net investment income, capital gains and certain other amounts, if any, such that the Fund should not be subject to federal excise tax. Therefore, no federal income or excise tax provision is recorded.
Distributions to Shareholders
Distributions from net investment income, if any, are declared daily and paid monthly. Net realized capital gains, if any, are distributed at least annually. Income distributions and capital gain distributions are determined in accordance with federal income tax regulations, which may differ from GAAP.
Guarantees and Indemnifications
Under the Trust's organizational documents and, in some cases, by contract, its officers and trustees are indemnified against certain liabilities arising out of the performance of their duties to the Trust or its funds. In addition, certain of the Fund's contracts with its service providers contain general indemnification clauses. The Fund's maximum exposure under these arrangements is unknown since the amount of any
future claims that may be made against the Fund cannot be determined, and the Fund has no historical basis for predicting the likelihood of any such claims.
Note 3. Fees and Compensation Paid to Affiliates
Investment Management Fees
Under an Investment Management Services Agreement, Columbia Management Investment Advisers, LLC (the Investment Manager), a wholly-owned subsidiary of Ameriprise Financial, Inc. (Ameriprise Financial), determines which securities will be purchased, held or sold. The investment management fee is an annual fee that is equal to a percentage of the Fund's average daily net assets that declines from 0.40% to 0.27% as the Fund's net assets increase. The effective investment management fee rate for the year ended April 30, 2014 was 0.40% of the Fund's average daily net assets.
Administration Fees
Under an Administrative Services Agreement, the Investment Manager also serves as the Fund Administrator. The Fund pays the Fund Administrator an annual fee for administration and accounting services equal to a percentage of the Fund's average daily net assets that declines from 0.07% to 0.04% as the Fund's net assets increase. The effective administration fee rate for the year ended April 30, 2014 was 0.07% of the Fund's average daily net assets.
Other Expenses
Other expenses are for, among other things, miscellaneous expenses of the Fund or the Board, including payments to a company providing limited administrative services to the Fund and the Board. That company's expenses include boardroom and office expense, employee compensation, employee health and retirement benefits, and certain other expenses. For the year ended April 30, 2014, other expenses paid to this company were $1,692.
Compensation of Board Members
Board members are compensated for their services to the Fund as disclosed in the Statement of Operations. Under a Deferred Compensation Plan (the Plan), the Board members who are not "interested persons" of the Fund, as defined under the 1940 Act, may elect to defer payment of up to 100% of their compensation. Deferred amounts are treated as though equivalent dollar amounts had been invested in shares of certain funds managed by the Investment Manager. The Fund's liability for these amounts is adjusted for market value changes and remains in the Fund until distributed in accordance with the Plan.
Annual Report 2014
23
Columbia Maryland Intermediate Municipal Bond Fund
Notes to Financial Statements (continued)
April 30, 2014
Transfer Agent Fees
Under a Transfer and Dividend Disbursing Agent Agreement, Columbia Management Investment Services Corp. (the Transfer Agent), an affiliate of the Investment Manager and a wholly-owned subsidiary of Ameriprise Financial, is responsible for providing transfer agency services to the Fund. The Transfer Agent has contracted with Boston Financial Data Services (BFDS) to serve as sub-transfer agent.
The Transfer Agent receives monthly account-based service fees based on the number of open accounts and also receives sub-transfer agency fees based on a percentage of the average aggregate value of the Fund's shares maintained in omnibus accounts (other than omnibus accounts for which American Enterprise Investment Services Inc. is the broker of record or accounts where the beneficial shareholder is a customer of Ameriprise Financial Services, Inc., which are paid a per account fee). The Transfer Agent pays the fees of BFDS for services as sub-transfer agent and is not entitled to reimbursement for such fees from the Fund (with the exception of out-of-pocket fees).
The Transfer Agent also receives compensation from fees for various shareholder services and reimbursements for certain out-of-pocket fees.
For the year ended April 30, 2014, the Fund's effective transfer agent fee rates as a percentage of average daily net assets of each class were as follows:
Class A | | | 0.20 | % | |
Class B | | | 0.20 | | |
Class C | | | 0.20 | | |
Class R4 | | | 0.20 | | |
Class Z | | | 0.20 | | |
An annual minimum account balance fee of $20 may apply to certain accounts with a value below the applicable share class's initial minimum investment requirements to reduce the impact of small accounts on transfer agent fees. These minimum account balance fees are recorded as part of expense reductions in the Statement of Operations. For the year ended April 30, 2014, these minimum account balance fees reduced total expenses by $60.
Distribution and Service Fees
The Fund has an agreement with Columbia Management Investment Distributors, Inc. (the Distributor), an affiliate of the Investment Manager and a wholly-owned subsidiary of Ameriprise Financial, for distribution and shareholder services. The Board has approved, and the Fund has adopted, distribution and shareholder service plans (the Plans) applicable to certain share classes, which set the distribution and service fees for the Fund. These fees are calculated daily
and are intended to compensate the Distributor and/or eligible selling and/or servicing agents for selling shares of the Fund and providing services to investors.
Under the Plans, the Fund pays a monthly combined distribution and service fee to the Distributor at the maximum annual rate of 0.25% of the average daily net assets attributable to Class A shares of the Fund. Also under the Plans, the Fund pays a monthly service fee at the maximum annual rate of 0.25% of the average daily net assets attributable to Class B and Class C shares of the Fund and the payment of a monthly distribution fee at the maximum annual rate of 0.75% of the average daily net assets attributable to Class B and Class C shares of the Fund.
Sales Charges
Sales charges, including front-end charges and CDSCs, received by the Distributor for distributing Fund shares were $4,881 for Class A and $807 for Class C shares for the year ended April 30, 2014.
Expenses Waived/Reimbursed by the Investment Manager and its Affiliates
The Investment Manager and certain of its affiliates have contractually agreed to waive fees and/or reimburse expenses (excluding certain fees and expenses described below) for the period disclosed below, unless sooner terminated at the sole discretion of the Board, so that the Fund's net operating expenses, after giving effect to fees waived/expenses reimbursed and any balance credits and/or overdraft charges from the Fund's custodian, do not exceed the following annual rates as a percentage of the class' average daily net assets:
| | | Fee Rates Contractual
through
August 31, 2014 | |
Class A | | | 0.81 | % | |
Class B | | | 1.56 | | |
Class C | | | 1.56 | | |
Class R4 | | | 0.56 | | |
Class Z | | | 0.56 | | |
Under the agreement governing these fee waivers and/or expense reimbursement arrangements, the following fees and expenses are excluded from the waiver/reimbursement commitment, and therefore will be paid by the Fund, if applicable: taxes (including foreign transaction taxes), expenses associated with investments in affiliated and non-affiliated pooled investment vehicles (including mutual funds and exchange-traded funds), transaction costs and brokerage commissions, costs related to any securities lending program, dividend expenses associated with securities sold short, inverse floater program fees and expenses, transaction
Annual Report 2014
24
Columbia Maryland Intermediate Municipal Bond Fund
Notes to Financial Statements (continued)
April 30, 2014
charges and interest on borrowed money, interest, extraordinary expenses and any other expenses the exclusion of which is specifically approved by the Board. This agreement may be modified or amended only with approval from all parties.
Note 4. Federal Tax Information
The timing and character of income and capital gain distributions are determined in accordance with income tax regulations, which may differ from GAAP because of temporary or permanent book to tax differences.
At April 30, 2014, these differences are primarily due to differing treatment for capital loss carryforwards, Trustees' deferred compensation and distributions. To the extent these differences are permanent, reclassifications are made among the components of the Fund's net assets in the Statement of Assets and Liabilities. Temporary differences do not require reclassifications. In the Statement of Assets and Liabilities the following reclassifications were made:
Accumulated net realized loss | | $ | 237,225 | | |
Paid-in capital | | | (237,225 | ) | |
Net investment income and net realized gains (losses), as disclosed in the Statement of Operations, and net assets were not affected by this reclassification.
The tax character of distributions paid during the years indicated was as follows:
Year Ended April 30, | | 2014 | | 2013 | |
Tax-exempt income | | $ | 3,228,969 | | | $ | 3,961,933 | | |
Ordinary income | | | 57,964 | | | | 158,539 | | |
Total | | | 3,286,933 | | | | 4,120,472 | | |
Short-term capital gain distributions, if any, are considered ordinary income distributions for tax purposes.
At April 30, 2014, the components of distributable earnings on a tax basis were as follows:
Undistributed tax-exempt income | | $ | 572,324 | | |
Capital loss carryforwards | | | (2,323,976 | ) | |
Net unrealized appreciation | | | 6,042,714 | | |
At April 30, 2014, the cost of investments for federal income tax purposes was $80,667,939 and the aggregate gross unrealized appreciation and depreciation based on that cost was:
Unrealized appreciation | | $ | 6,130,508 | | |
Unrealized depreciation | | | (87,794 | ) | |
Net unrealized appreciation | | | 6,042,714 | | |
The following capital loss carryforwards, determined at April 30, 2014, may be available to reduce taxable income arising from future net realized gains on investments, if any, to the extent permitted by the Internal Revenue Code:
Year of Expiration | | Amount ($) | |
2016 | | | 511 | | |
2017 | | | 2,323,465 | | |
Total | | | 2,323,976 | | |
For the year ended April 30, 2014, $34,332 of capital loss carryforward was utilized and $237,225 expired unused.
Management of the Fund has concluded that there are no significant uncertain tax positions that would require recognition in the financial statements. However, management's conclusion may be subject to review and adjustment at a later date based on factors including, but not limited to, new tax laws, regulations, and administrative interpretations (including relevant court decisions). Generally, the Fund's federal tax returns for the prior three fiscal years remain subject to examination by the Internal Revenue Service.
Note 5. Portfolio Information
The cost of purchases and proceeds from sales of securities, excluding short-term obligations, aggregated to $1,630,365 and $44,099,961, respectively, for the year ended April 30, 2014.
Note 6. Shareholder Concentration
At April 30, 2014, one unaffiliated shareholder of record owned 83.0% of the outstanding shares of the Fund in one or more accounts. The Fund has no knowledge about whether any portion of those shares was owned beneficially. Subscription and redemption activity by concentrated accounts may have a significant effect on the operations of the Fund.
Note 7. Line of Credit
The Fund has entered into a revolving credit facility with a syndicate of banks led by JPMorgan Chase Bank N.A. whereby the Fund may borrow for the temporary funding of shareholder redemptions or for other temporary or emergency purposes. The credit facility agreement, as amended, which is a collective agreement between the Fund and certain other funds managed by the Investment Manager, severally and not jointly, permits collective borrowings up to $500 million. Interest is charged to each participating fund based on its borrowings at a rate equal to the higher of (i) the overnight federal funds rate plus 1.00% or (ii) the one-month LIBOR rate plus 1.00%. Each borrowing under the credit facility matures no later than 60 days after the date of borrowing.
Annual Report 2014
25
Columbia Maryland Intermediate Municipal Bond Fund
Notes to Financial Statements (continued)
April 30, 2014
Effective December 10, 2013, the Fund also pays a commitment fee equal to its pro rata share of the amount of the credit facility at a rate of 0.075% per annum. Prior to December 10, 2013, the commitment fee was charged at the annual rate of 0.08% per annum. The commitment fee is included in other expenses in the Statement of Operations.
The Fund had no borrowings during the year ended April 30, 2014.
Note 8. Significant Risks
Geographic Concentration Risk
Because state-specific tax-exempt funds invest primarily in the municipal securities issued by the state and political sub-divisions of the state, the Fund will be particularly affected by political and economic conditions and developments in the state in which it invests. The Fund may, therefore, have a greater risk than that of a municipal bond fund which is more geographically diversified. The value of the municipal securities owned by the Fund also may be adversely affected by future changes in federal or state income tax laws.
Non-Diversification Risk
A non-diversified fund is permitted to invest a greater percentage of its total assets in fewer issuers than a diversified fund. The Fund may, therefore, have a greater risk of loss from a few issuers than a similar fund that invests more broadly.
Note 9. Subsequent Events
Management has evaluated the events and transactions that have occurred through the date the financial statements were issued and noted no items requiring adjustment of the financial statements or additional disclosure.
Note 10. Information Regarding Pending and Settled Legal Proceedings
In December 2005, without admitting or denying the allegations, American Express Financial Corporation (AEFC, which is now known as Ameriprise Financial, Inc. (Ameriprise Financial)) entered into settlement agreements with the Securities and Exchange Commission (SEC) and Minnesota Department of Commerce (MDOC) related to market timing activities. As a result, AEFC was censured and ordered to cease and desist from committing or causing any violations of certain provisions of the Investment Advisers Act of 1940, the Investment Company Act of 1940, and various Minnesota laws. AEFC agreed to pay disgorgement of $10 million and civil money penalties of $7 million. AEFC also agreed to retain an independent distribution consultant to assist in developing a plan for distribution of all disgorgement and civil penalties
ordered by the SEC in accordance with various undertakings detailed at www.sec.gov/litigation/admin/ia-2451.pdf. Ameriprise Financial and its affiliates have cooperated with the SEC and the MDOC in these legal proceedings, and have made regular reports to the Funds' Boards of Trustees.
Ameriprise Financial and certain of its affiliates have historically been involved in a number of legal, arbitration and regulatory proceedings, including routine litigation, class actions, and governmental actions, concerning matters arising in connection with the conduct of their business activities. Ameriprise Financial believes that the Funds are not currently the subject of, and that neither Ameriprise Financial nor any of its affiliates are the subject of, any pending legal, arbitration or regulatory proceedings that are likely to have a material adverse effect on the Funds or the ability of Ameriprise Financial or its affiliates to perform under their contracts with the Funds. Ameriprise Financial is required to make 10-Q, 10-K and, as necessary, 8-K filings with the Securities and Exchange Commission on legal and regulatory matters that relate to Ameriprise Financial and its affiliates. Copies of these filings may be obtained by accessing the SEC website at www.sec.gov.
There can be no assurance that these matters, or the adverse publicity associated with them, will not result in increased fund redemptions, reduced sale of fund shares or other adverse consequences to the Funds. Further, although we believe proceedings are not likely to have a material adverse effect on the Funds or the ability of Ameriprise Financial or its affiliates to perform under their contracts with the Funds, these proceedings are subject to uncertainties and, as such, we are unable to estimate the possible loss or range of loss that may result. An adverse outcome in one or more of these proceedings could result in adverse judgments, settlements, fines, penalties or other relief that could have a material adverse effect on the consolidated financial condition or results of operations of Ameriprise Financial.
Annual Report 2014
26
Columbia Maryland Intermediate Municipal Bond Fund
Report of Independent Registered Public Accounting Firm
To the Trustees of Columbia Funds Series Trust and the Shareholders of
Columbia Maryland Intermediate Municipal Bond Fund
In our opinion, the accompanying statement of assets and liabilities, including the portfolio of investments, and the related statements of operations and of changes in net assets and the financial highlights present fairly, in all material respects, the financial position of Columbia Maryland Intermediate Municipal Bond Fund (the "Fund", a series of Columbia Funds Series Trust) at April 30, 2014, and the results of its operations, the changes in its net assets and the financial highlights for each of the periods indicated, in conformity with accounting principles generally accepted in the United States of America. These financial statements and financial highlights (hereafter referred to as "financial statements") are the responsibility of the Fund's management; our responsibility is to express an opinion on these financial statements based on our audits. We conducted our audits of these financial statements in accordance with the standards of the Public Company Accounting Oversight Board (United States). Those standards require that we plan and perform the audit to obtain reasonable assurance about whether the financial statements are free of material misstatement. An audit includes examining, on a test basis, evidence supporting the amounts and disclosures in the financial statements, assessing the accounting principles used and significant estimates made by management, and evaluating the overall financial statement presentation. We believe that our audits, which included confirmation of securities at April 30, 2014 by correspondence with the custodian, provide a reasonable basis for our opinion.
PricewaterhouseCoopers LLP
Minneapolis, Minnesota
June 20, 2014
Annual Report 2014
27
Columbia Maryland Intermediate Municipal Bond Fund
Federal Income Tax Information
(Unaudited)
The Fund hereby designates the following tax attributes for the fiscal year ended April 30, 2014. Shareholders will be notified in early 2015 of the amounts for use in preparing 2014 income tax returns.
Tax Designations
| Exempt-Interest Dividends | | | 98.24 | % | |
Exempt-Interest Dividends. The percentage of net investment income dividends paid during the fiscal year that qualifies as exempt-interest dividends for federal income tax purposes.
Annual Report 2014
28
Columbia Maryland Intermediate Municipal Bond Fund
Shareholders elect the Board that oversees the Funds' operations. The Board appoints officers who are responsible for day-to-day business decisions based on policies set by the Board. The following table provides basic biographical information about the Funds' Board members, including their principal occupations during the past five years, although specific titles for individuals may have varied over the period. Under current Board policy, members may serve through the end of the calendar year in which he or she reaches either the mandatory retirement age established by the Board or the fifteenth anniversary of the first Board meeting they attended as a member of the Board.
Independent Trustees
Name,
Address,
Year of Birth | | Position Held With
Funds and Length of
Service | | Principal Occupation(s)
During Past Five Years
and Other Relevant
Professional Experience | | Number of
Funds in the
Fund Family
Overseen by
Board Member | | Other Present or Past
Directorships/
Trusteeships
(Within Past 5 Years) | |
Kathleen Blatz
901 S. Marquette Ave.
Minneapolis, MN 55402
1954 | | Board member since 1/06 for RiverSource Funds and since 6/11 for Nations Funds | | Attorney; Chief Justice, Minnesota Supreme Court, 1998-2006 | | | 132 | | | Trustee, BlueCross BlueShield of Minnesota since 2009 | |
Edward J. Boudreau, Jr.
901 S. Marquette Ave.
Minneapolis, MN 55402
1944 | | Board member since 6/11 for RiverSource Funds and since 1/05 for Nations Funds | | Managing Director, E.J. Boudreau & Associates (consulting) since 2000; Chairman and Chief Executive Officer, John Hancock Funds (mutual funds), 1989-2000 | | | 130 | | | Former Trustee, BofA Funds Series Trust (11 funds), 2005-2011 | |
Pamela G. Carlton
901 S. Marquette Ave.
Minneapolis, MN 55402
1954 | | Board member since 7/07 for RiverSource Funds and since 6/11 for Nations Funds | | President, Springboard — Partners in Cross Cultural Leadership (consulting company) since 2003; Director or Management Director of US Equity Research, Chase Asset Management, 1996-2003; Investment Banker, Morgan Stanley, 1982-1996 | | | 132 | | | None | |
William P. Carmichael
901 S. Marquette Ave.
Minneapolis, MN 55402
1943 | | Chair of the Board since 1/14, Board member since 6/11 for RiverSource Funds and since 2003 for Nations Funds | | Retired; Co-founder, The Succession Fund (provides exit strategies to owners of privately held companies); previously, Senior Vice President, Sara Lee Corporation; Senior Vice President and Chief Financial Officer, Beatrice Foods Company; Vice President, Esmark, Inc.; Associate, Price Waterhouse | | | 132 | | | Director, Cobra Electronics Corporation (electronic equipment manufacturer); The Finish Line (athletic shoes and apparel) since July 2003; Director, International Textile Corp. since 2012; former Director, McMoRan Exploration Company (oil and gas exploration and development) 2010-2013; former Trustee, BofA Funds Series Trust (11 funds), 2009-2011; Director, Spectrum Brands, Inc. (consumer products), 2002-2009; Director, Simmons Company (bedding), 2004-2010 | |
Annual Report 2014
29
Columbia Maryland Intermediate Municipal Bond Fund
Trustees and Officers (continued)
Independent Trustees (continued)
Name,
Address,
Year of Birth | | Position Held With
Funds and Length of
Service | | Principal Occupation(s)
During Past Five Years
and Other Relevant
Professional Experience | | Number of
Funds in the
Fund Family
Overseen by
Board Member | | Other Present or Past
Directorships/
Trusteeships
(Within Past 5 Years) | |
Patricia M. Flynn
901 S. Marquette Ave.
Minneapolis, MN 55402
1950 | | Board member since 11/04 for RiverSource Funds and since 6/11 for Nations Funds | | Trustee Professor of Economics and Management, Bentley University since 1976 (also teaches and conducts research on corporate governance); Dean, McCallum Graduate School of Business, Bentley University, 1992-2002 | | | 132 | | | None | |
William A. Hawkins
901 S. Marquette Ave.
Minneapolis, MN 55402
1942 | | Board member since 6/11 for RiverSource Funds and since 1/05 for Nations Funds | | Managing Director, Overton Partners (financial consulting), since August 2010; President and Chief Executive Officer, California General Bank, N.A., January 2008-August 2010 | | | 130 | | | Trustee, BofA Funds Series Trust (11 funds) | |
R. Glenn Hilliard
901 S. Marquette Ave.
Minneapolis, MN 55402
1943 | | Board member since 6/11 for RiverSource Funds and since 1/05 for Nations Funds | | Chairman and Chief Executive Officer, Hilliard Group LLC (investing and consulting) since April 2003; Non-Executive Director & Chairman, CNO Financial Group, Inc. (insurance), September 2003-May 2011 | | | 130 | | | Chairman, BofA Fund Series Trust (11 funds); former Director, CNO Financial Group, Inc. (insurance), 2003-2011 | |
Stephen R. Lewis, Jr.
901 S. Marquette Ave.
Minneapolis, MN 55402
1939 | | Board member for RiverSource Funds since 1/02 and since 6/11 for Nations Funds, Board Chair 1/07-12/13 | | President Emeritus and Professor of Economics Emeritus, Carleton College since 2002 | | | 132 | | | Director, Valmont Industries, Inc. (irrigation systems manufacturer), 2002-2013 | |
Catherine James Paglia
901 S. Marquette Ave.
Minneapolis, MN 55402
1952 | | Board member since 11/04 for RiverSource Funds and since 6/11 for Nations Funds | | Director, Enterprise Asset Management, Inc. (private real estate and asset management company) since September 1998 | | | 132 | | | Director, Valmont Industries, Inc. (irrigation systems manufacturer) since 2012 | |
Leroy C. Richie
901 S. Marquette Ave.
Minneapolis, MN 55402
1941 | | Board member since 2000 for Legacy Seligman Funds, since 11/08 for RiverSource Funds and since 6/11 for Nations Funds | | Counsel, Lewis & Munday, P.C. (law firm) since 2004; Vice President and General Counsel, Automotive Legal Affairs, Chrysler Corporation, 1993-1997 | | | 132 | | | Lead Outside Director, Digital Ally, Inc. (digital imaging) since September 2005; Director, Infinity, Inc. (oil and gas exploration and production) since 1994; Director, OGE Energy Corp. (energy and energy services) since November 2007 | |
Minor M. Shaw
901 S. Marquette Ave.
Minneapolis, MN 55402
1947 | | Board member since 6/11 for RiverSource Funds and since 2003 for Nations Funds | | President, Micco LLC (private investments) since 2011; President, Micco Corp. since 1998 | | | 130 | | | Director, Piedmont Natural Gas; Director, BlueCross BlueShield of South Carolina since April 2008; Director, National Association of Corporate Directors, Carolinas Chapter, since 2013; former Trustee, BofA Funds Series Trust (11 funds) | |
Annual Report 2014
30
Columbia Maryland Intermediate Municipal Bond Fund
Trustees and Officers (continued)
Independent Trustees (continued)
Name,
Address,
Year of Birth | | Position Held With
Funds and Length of
Service | | Principal Occupation(s)
During Past Five Years
and Other Relevant
Professional Experience | | Number of
Funds in the
Fund Family
Overseen by
Board Member | | Other Present or Past
Directorships/
Trusteeships
(Within Past 5 Years) | |
Alison Taunton-Rigby
901 S. Marquette Ave.
Minneapolis, MN 55402
1944 | | Board member since 11/02 for RiverSource Funds and since 6/11 for Nations Funds | | Chief Executive Officer and Director, RiboNovix, Inc., (biotechnology) 2003-2010 | | | 132 | | | Director, Healthways, Inc. (health and wellbeing solutions) since 2005; Director, ICI Mutual Insurance Company, RRG since 2011; Director, Abt Associates (government contractor) since 2001; Director, Boston Children's Hospital since 2002 | |
Interested Trustee Not Affiliated with Investment Manager*
Name,
Address,
Year of Birth | | Position Held With
Funds and Length of
Service | | Principal Occupation(s)
During Past Five Years
and Other Relevant
Professional Experience | | Number of
Funds in the
Fund Family
Overseen by
Board Member | | Other Present or Past
Directorships/
Trusteeships
(Within Past 5 Years) | |
Anthony M. Santomero
901 S. Marquette Ave.
Minneapolis, MN 55402
1946 | | Board member since 6/11 for RiverSource Funds and since 1/08 for Nations Funds | | Richard K. Mellon Professor Emeritus of Finance, The Wharton School, University of Pennsylvania, since 2002; Senior Advisor, McKinsey & Company (consulting), 2006-2008 | | | 130 | | | Director, Renaissance Reinsurance Ltd. since May 2008; Trustee, Penn Mutual Life Insurance Company since March 2008; Director, Citigroup Inc. since 2009; Director, Citibank, N.A. since 2009; former Trustee, BofA Funds Series Trust (11 funds), 2008-2011 | |
* Dr. Santomero is not an affiliated person of the Investment Manager or Ameriprise Financial. However, he is currently deemed by the Funds to be an "interested person" (as defined in the 1940 Act) of the Funds because he serves as a Director of Citigroup Inc. and Citibank, N.A., companies that may directly or through subsidiaries and affiliates engage from time-to-time in brokerage execution, principal transactions and lending relationships with the Funds or accounts advised/managed by the Investment Manager.
Annual Report 2014
31
Columbia Maryland Intermediate Municipal Bond Fund
Trustees and Officers (continued)
Interested Trustee Affiliated with Investment Manager*
Name,
Address,
Year of Birth | | Position Held With
Funds and Length of
Service | | Principal Occupation(s)
During Past Five Years
and Other Relevant
Professional Experience | | Number of
Funds in the
Fund Family
Overseen by
Board Member | | Other Present or Past
Directorships/
Trusteeships
(Within Past 5 Years) | |
William F. Truscott
53600 Ameriprise
Financial Center
Minneapolis, MN 55474
1960 | | Board member since 11/01 for RiverSource Funds and since 6/11 for Nations Funds; Senior Vice President since 2002 for RiverSource Funds and since 5/10 for Nations Funds | | Chairman of the Board and President, Columbia Management Investment Advisers, LLC since May 2010 and February 2012, respectively (previously President and Chief Investment Officer, 2001-April 2010); Chief Executive Officer, Global Asset Management, Ameriprise Financial, Inc. since September 2012 (previously Chief Executive Officer, U.S. Asset Management & President, Annuities, May 2010-September 2012 and President — U.S. Asset Management and Chief Investment Officer, 2005-April 2010); Director and Chief Executive Officer, Columbia Management Investment Distributors, Inc. since May 2010 and February 2012, respectively (previously Chairman of the Board and Chief Executive Officer, 2006-April 2010); Chairman of the Board and Chief Executive Officer, RiverSource Distributors, Inc. since 2006; Director, Threadneedle Asset Management Holdings, SARL since 2014; President and Chief Executive Officer, Ameriprise Certificate Company, 2006-August 2012 | | | 186 | | | Former Director, Ameriprise Certificate Company, 2006-January 2013 | |
* Interested person (as defined under the 1940 Act) by reason of being an officer, director, security holder and/or employee of the Investment Manager or Ameriprise Financial.
The Statement of Additional Information has additional information about the Fund's Board members and is available, without charge, upon request by calling 800.345.6611; contacting your financial intermediary or visiting columbiamanagement.com.
Annual Report 2014
32
Columbia Maryland Intermediate Municipal Bond Fund
Trustees and Officers (continued)
The Board has appointed officers who are responsible for day-to-day business decisions based on policies it has established. The officers serve at the pleasure of the Board. In addition to Mr. Truscott, who is Senior Vice President, the Funds' other officers are:
Officers
Name,
Address and
Year of Birth | | Position and Year
First Appointed to
Position for any Fund
in the Columbia
Funds Complex or a
Predecessor Thereof | | Principal Occupation(s) During Past Five Years | |
J. Kevin Connaughton
225 Franklin Street
Boston, MA 02110
Born 1964 | | President and Principal Executive Officer (2009) | | Managing Director and General Manager — Mutual Fund Products, Columbia Management Investment Advisers, LLC since May 2010; and President, Columbia Funds since 2009; Managing Director, Columbia Management Advisors, LLC, December 2004-April 2010; Senior Vice President and Chief Financial Officer, Columbia Funds, June 2008-January 2009; and senior officer of Columbia Funds and affiliated funds since 2003 | |
Michael G. Clarke
225 Franklin Street
Boston, MA 02110
Born 1969 | | Treasurer (2011) and Chief Financial Officer (2009) | | Vice President — Mutual Fund Administration, Columbia Management Investment Advisers, LLC, since May 2010; Managing Director of Fund Administration, Columbia Management Advisors, LLC, September 2004-April 2010; and senior officer of Columbia Funds and affiliated funds since 2002 | |
Scott R. Plummer
5228 Ameriprise Financial Center
Minneapolis, MN 55474
Born 1959 | | Senior Vice President (2006), Chief Legal Officer (2006) and Assistant Secretary (2011) | | Senior Vice President and Assistant General Counsel — Global Asset Management, Ameriprise Financial since February 2014 (previously, Senior Vice President and Lead Chief Counsel — Asset Management, 2012-February 2014; Vice President and Lead Chief Counsel — Asset Management, 2010-2012; and Vice President and Chief Counsel — Asset Management, 2005-2010); Senior Vice President, Chief Legal Officer and Assistant Secretary, Columbia Management Investment Advisers, LLC since June 2005; Vice President, Chief Counsel and Assistant Secretary, Columbia Management Investment Distributors, Inc. since 2008; Vice President, General Counsel and Secretary, Ameriprise Certificate Company since 2005; Chief Counsel, RiverSource Distributors, Inc. since 2006; senior officer of Columbia Funds and affiliated funds since 2006 | |
Thomas P. McGuire
225 Franklin Street
Boston, MA 02110
Born 1972 | | Chief Compliance Officer (2012) | | Vice President — Asset Management Compliance, Ameriprise Financial, Inc. since May 2010; Chief Compliance Officer, Ameriprise Certificate Company, since September 2010; Compliance Executive, Bank of America, 2005-April 2010 | |
Colin Moore
225 Franklin Street
Boston, MA 02110
Born 1958 | | Senior Vice President (2010) | | Executive Vice President and Global Chief Investment Officer, Ameriprise Financial, Inc. since July 2013; Director and Global Chief Investment Officer, Columbia Management Investment Advisers, LLC since May 2010; Manager, Managing Director and Chief Investment Officer, Columbia Management Advisors, LLC, 2007-April 2010 | |
Michael E. DeFao
225 Franklin Street
Boston, MA 02110
Born 1968 | | Vice President (2011) and Assistant Secretary (2010) | | Vice President and Chief Counsel, Ameriprise Financial, Inc. since May 2010; Associate General Counsel, Bank of America 2005-April 2010 | |
Joseph F. DiMaria
225 Franklin Street
Boston, MA 02110
Born 1968 | | Vice President (2011) and Chief Accounting Officer (2008) | | Vice President — Mutual Fund Treasurer, Columbia Management Investment Advisers, LLC since May 2010; Director of Fund Administration, Columbia Management Advisors, LLC, 2006-April 2010 | |
Paul B. Goucher
100 Park Avenue
New York, NY 10017
Born 1968 | | Vice President (2011) and Assistant Secretary (2008) | | Vice President and Lead Chief Counsel, Ameriprise Financial, Inc. since November 2008 and January 2013, respectively (previously Chief Counsel, January 2010-January 2013, and Group Counsel, November 2008-January 2010); Director, Managing Director and General Counsel, J. & W. Seligman & Co. Incorporated, July 2008-November 2008 | |
Amy Johnson
5228 Ameriprise Financial
Center
Minneapolis, MN 55474
Born 1965 | | Vice President (2006) | | Managing Director and Chief Operating Officer, Columbia Management Investment Advisers, LLC since May 2010 (previously Chief Administrative Officer, 2009-April 2010, and Vice President — Asset Management and Trust Company Services, 2006-2009) | |
Annual Report 2014
33
Columbia Maryland Intermediate Municipal Bond Fund
Trustees and Officers (continued)
Officers (continued)
Name,
Address and
Year of Birth | | Position and Year
First Appointed to
Position for any Fund
in the Columbia
Funds Complex or a
Predecessor Thereof | | Principal Occupation(s) During Past Five Years | |
Paul D. Pearson
5228 Ameriprise Financial
Center
Minneapolis, MN 55474
Born 1956 | | Vice President (2011) and Assistant Treasurer (1999) | | Vice President — Investment Accounting, Columbia Management Investment Advisers, LLC since May 2010; Vice President — Managed Assets, Investment Accounting, Ameriprise Financial, Inc., 1998-April 2010 | |
Christopher O. Petersen
5228 Ameriprise Financial
Center
Minneapolis, MN 55474
Born 1970 | | Vice President and Secretary (2010) | | Vice President and Chief Counsel, Ameriprise Financial, Inc., since January 2010 (previously Vice President and Group Counsel or Counsel, 2004-January 2010); officer of Columbia Funds and affiliated funds since 2007 | |
Stephen T. Welsh
225 Franklin Street
Boston, MA 02110
Born 1957 | | Vice President (2006) | | President and Director, Columbia Management Investment Services Corp. since May 2010; President and Director, Columbia Management Services, Inc., 2004-April 2010; Managing Director, Columbia Management Distributors, Inc., 2007-April 2010 | |
Annual Report 2014
34
Columbia Maryland Intermediate Municipal Bond Fund
Approval of Investment Management
Services Agreement
Columbia Management Investment Advisers, LLC (Columbia Management or the Investment Manager), a wholly-owned subsidiary of Ameriprise Financial, Inc. (Ameriprise Financial), serves as the investment manager to Columbia Maryland Intermediate Municipal Bond Fund (the Fund). Under an investment management services agreement (the IMS Agreement), Columbia Management provides investment advice and other services to the Fund and other funds distributed by Columbia Management Investment Distributors, Inc. (collectively, the Funds).
On an annual basis, the Fund's Board of Trustees (the Board), including the independent Board members (the Independent Trustees), considers renewal of the IMS Agreement. Columbia Management prepared detailed reports for the Board and its Contracts Committee in January, March and April 2014, including reports based on analyses of data provided by an independent organization (Lipper) and a comprehensive response to each item of information requested by independent legal counsel to the Independent Trustees (Independent Legal Counsel) in a letter to the Investment Manager, to assist the Board in making this determination. All of the materials presented in January, March and April were first supplied in draft form to designated representatives of the Independent Trustees, i.e., Independent Legal Counsel, Fund Counsel, the Chair of the Board and the Chair of the Contracts Committee, and the final materials (including proposed expense caps for certain Funds) were revised to reflect discussion and subsequent requests made by the Contracts Committee. In addition, throughout the year, the Board (or its committees) regularly meets with portfolio management teams and senior management personnel, and reviews information prepared by Columbia Management addressing the services Columbia Management provides and Fund performance. The Board also accords appropriate weight to the work, deliberations and conclusions of the Contracts Committee, the Investment Review Committee and the Compliance Committee in determining whether to continue the IMS Agreement.
The Board, at its April 9-11, 2014 in-person Board meeting (the April Meeting), considered the renewal of the IMS Agreement for an additional one-year term. At the April Meeting, Independent Legal Counsel reviewed with the Independent Trustees various factors relevant to the Board's consideration of advisory agreements and the Board's legal responsibilities related to such consideration. Following an analysis and discussion of the factors identified below, the Board, including all of the Independent Trustees, approved the renewal of the IMS Agreement.
Nature, Extent and Quality of Services Provided by Columbia Management
The Independent Trustees analyzed various reports and presentations they had received detailing the services performed by Columbia Management, as well as its expertise, resources and capabilities. The Independent Trustees specifically considered many developments during the past year concerning the services provided by Columbia Management, including, in particular, the successful implementation of a globalization initiative, which, among other things, increased worldwide analyst support for global products, the reorganization of the Informational Technology research team, the hiring of additional personnel to assist the Asset Allocation team and the global restructuring of the Senior Operational team. The Independent Trustees noted the information they received concerning Columbia Management's ability to retain its key portfolio management personnel. The Independent Trustees also recalled Columbia Management's representation that additional staff has been added to support the vigorous application of the "5P" review process, to which all internally-managed Funds are subject.
In connection with the Board's evaluation of the overall package of services provided by Columbia Management, the Board also considered the quality of administrative services provided to the Fund by Columbia Management, recalling the information it received highlighting significant achievements in 2013 in the performance of administrative services. In evaluating the quality of services provided under the IMS Agreement and the Fund's Administrative Services Agreement, the Independent Trustees also took into account the organization and strength of the Fund's and its service providers' compliance programs. In addition, the Board also reviewed the financial condition of Columbia Management (and its affiliates) and each entity's ability to carry out its responsibilities under the IMS Agreement and the Fund's other services agreements with affiliates of Ameriprise Financial, observing the financial strength of Ameriprise Financial, with its solid balance sheet. The Board also discussed the acceptability of the terms of the IMS Agreement (including the relatively broad scope of services required to be performed by Columbia Management). The Board concluded that the services being performed under the IMS Agreement were of a reasonably high quality.
Based on the foregoing, and based on other information received (both oral and written, including the information on investment performance referenced below) and other considerations, the Board concluded that Columbia Management and its affiliates were in a position to continue to provide a high quality and level of services to the Fund.
Annual Report 2014
35
Columbia Maryland Intermediate Municipal Bond Fund
Approval of Investment Management
Services Agreement (continued)
Investment Performance
For purposes of evaluating the nature, extent and quality of services provided under the IMS Agreement, the Board carefully reviewed the investment performance of the Fund. In this regard, the Board considered detailed reports providing the results of analyses performed by an independent organization showing, for various periods, the performance of the Fund, the performance of a benchmark index, the percentage ranking of the Fund among its comparison group and the net assets of the Fund. The Board observed that the Fund's investment performance met expectations.
Comparative Fees, Costs of Services Provided and the Profits Realized By Columbia Management and its Affiliates from their Relationships with the Fund
The Board reviewed comparative fees and the costs of services provided under the IMS Agreement. The Board members considered detailed comparative information set forth in an annual report on fees and expenses, including, among other things, data (based on analyses conducted by an independent organization) showing a comparison of the Fund's expenses with median expenses paid by funds in its comparative peer universe, as well as data showing the Fund's contribution to Columbia Management's profitability.
The Board accorded particular weight to the notion that the level of fees should reflect a rational pricing model applied consistently across the various product lines in the Fund family, while assuring that the overall fees for each Fund (with few defined exceptions) are generally in line with the "pricing philosophy" currently in effect (i.e., that the total expense ratio of the Fund is no higher than the median expense ratio of funds in the same comparison universe of the Fund). In this connection, the Board also considered the 2013 report provided by an independent consulting firm, Bobroff Consulting (the Independent Consultant), that concluded that the Funds' standardized investment management fee rates were within a reasonable range. The Board took into account that the Fund's total expense ratio (after considering proposed voluntary expense caps/waivers) approximated the peer universe's median expense ratio. It was observed that various proposals concerning the Funds' transfer agency and sub-transfer agency fee structures, and other changes impacting the Funds' pricing structure and fees, are expected to be considered at a later Board meeting which, if adopted, would alter the current pricing philosophy. Based on its review, the Board concluded that the Fund's management fee was fair and reasonable in light of the extent and quality of services that the Fund receives.
The Board also considered the expected profitability of Columbia Management and its affiliates in connection with Columbia Management providing investment management services to the Fund. In this regard, the Board referred to a detailed profitability report, discussing the profitability to Columbia Management and Ameriprise Financial from managing, operating and distributing the Funds. In this regard, the Board observed that: (i) the Independent Consultant concluded that 2012 profitability was reasonable; (ii) 2013 profitability only moderately exceeded 2012 levels; and (iii) 2013 profitability is in line with profitability levels of industry competitors. It also took into account the indirect economic benefits flowing to Columbia Management or its affiliates in connection with managing or distributing the Funds, such as the enhanced ability to offer various other financial products to Ameriprise Financial customers, soft dollar benefits and overall reputational advantages. The Board noted that the fees paid by the Funds should permit the Investment Manager to offer competitive compensation to its personnel, make necessary investments in its business and earn an appropriate profit. The Board concluded that profitability levels were reasonable.
Economies of Scale to be Realized
The Board also considered the economies of scale that might be realized by Columbia Management as the Fund grows and took note of the extent to which Fund shareholders might also benefit from such growth. In this regard, the Independent Trustees took into account that IMS fees decline as Fund assets exceed various breakpoints, all of which have not been surpassed.
Based on the foregoing, the Board, including all of the Independent Trustees, concluded that the investment management service fees were fair and reasonable in light of the extent and quality of services provided. In reaching this conclusion, no single factor was determinative. On April 11, 2014, the Board, including all of the Independent Trustees, approved the renewal of the IMS Agreement.
Annual Report 2014
36
Columbia Maryland Intermediate Municipal Bond Fund
Important Information About This Report
Each fund mails one shareholder report to each shareholder address. If you would like more than one report, please call shareholder services at 800.345.6611 and additional reports will be sent to you.
The policy of the Board is to vote the proxies of the companies in which each fund holds investments consistent with the procedures as stated in the Statement of Additional Information (SAI). You may obtain a copy of the SAI without charge by calling 800.345.6611; contacting your financial intermediary; visiting columbiamanagement.com; or searching the website of the Securities and Exchange Commission (SEC) at sec.gov. Information regarding how each fund voted proxies relating to portfolio securities is filed with the SEC by August 31 for the most recent 12-month period ending June 30 of that year, and is available without charge by visiting columbiamanagement.com; or searching the website of the SEC at sec.gov.
Each fund files a complete schedule of portfolio holdings with the SEC for the first and third quarters of each fiscal year on Form N-Q. Each fund's Form N-Q is available on the SEC's website at sec.gov and may be reviewed and copied at the SEC's Public Reference Room in Washington, D.C. Information on the operation of the Public Reference Room may be obtained by calling 800.SEC.0330. Each fund's complete schedule of portfolio holdings, as filed on Form N-Q, can also be obtained without charge, upon request, by calling 800.345.6611.
Annual Report 2014
37

Columbia Maryland Intermediate Municipal Bond Fund
P.O. Box 8081
Boston, MA 02266-8081
columbiamanagement.com
This information is for use with concurrent or prior delivery of a fund prospectus. Please read and consider the investment objectives, risks, charges and expenses for any fund carefully before investing. For a prospectus and, if available, a summary prospectus, which contains this and other important information about the Fund go to columbiamanagement.com. The Fund is distributed by Columbia Management Investment Distributors, Inc., member FINRA, and managed by Columbia Management Investment Advisers, LLC.
© 2014 Columbia Management Investment Advisers, LLC. All rights reserved.
ANN190_04_D01_(06/14)
Annual Report
April 30, 2014

Columbia North Carolina Intermediate Municipal Bond Fund
(renamed Columbia AMT-Free North Carolina Intermediate Muni Bond Fund, effective July 7, 2014)
Not FDIC insured • No bank guarantee • May lose value
 Dear Shareholders,
Continued Economic Recovery
The U.S. economy continued to recover at a slow but steady pace during the first quarter of 2014, supported by solid manufacturing activity, reasonable job growth and continued gains for the housing market. Industrial production was robust, buoyed by strong demand for autos and related parts. After a disappointing January, job growth picked up, which helped boost consumer confidence. Housing data was somewhat mixed, as harsh weather and higher mortgage rates put a damper on sales, while lower inventories helped prices trend higher. The Federal Reserve (the Fed) announced further reductions to its monthly asset purchases and reassured the markets that it would not make any significant changes to monetary policy until it was satisfied that the labor market was on solid ground. Despite mostly good news on the economic front, the broad financial markets recorded only modest gains, as bitter winter weather at home and mounting tensions between Russia and Western allies prompted investor caution.
Investors braced for higher interest rates, but long-term yields declined and the fixed-income markets were surprisingly resilient in the face of stable-to-improving economic data. Risk-on trading continued during the quarter as the higher yielding sectors of the fixed-income markets generally fared well. Emerging-market bonds, long-term U.S. Treasuries and sovereign debt were among the strongest performers, as were Treasury Inflation Protected Securities. Municipal bonds delivered solid gains, especially high-yield municipals, which benefited from continued improvement in state finances.
Against this backdrop, the broad bond market, as measured by the Barclays U.S. Aggregate Bond Index, edged out the broad stock market, as measured by the Standard & Poor's 500 Index, with gains of 1.84% vs. 1.81%, respectively. As indicated late last year, the Fed began tapering its monthly asset purchase program and announced further reductions. New Fed chair Janet Yellen reassured investors the Fed was committed to keeping short-term borrowing rates low into 2015.
Stay on Track with Columbia Management
Backed by more than 100 years of experience, Columbia Management is one of the nation's largest asset managers. At the heart of our success and, most importantly, that of our investors, are highly talented industry professionals, brought together by a unique way of working. At Columbia Management, reaching our performance goals matters, and how we reach them matters just as much.
Visit columbiamanagement.com for:
> The Columbia Management Perspectives blog, offering insights on current market events and investment opportunities
> Detailed up-to-date fund performance and portfolio information
> Quarterly fund commentaries
> Columbia Management investor, our award-winning quarterly newsletter for shareholders
Thank you for your continued support of the Columbia Funds. We look forward to serving your investment needs for many years to come.
Best Regards,

J. Kevin Connaughton
President, Columbia Funds
Investing involves risk including the risk of loss of principal.
The Barclays U.S. Aggregate Bond Index is a broad-based benchmark that measures the investment grade, U.S. dollar denominated, fixed-rate taxable bond market, including Treasuries, government-related and corporate securities, mortgage-backed securities (agency fixed-rate and hybrid adjustable-rate mortgage passthroughs), asset-backed securities, and commercial mortgage-backed securities. The S&P 500 Index, an unmanaged index, measures the performance of 500 widely held, large-capitalization U.S. stocks and is frequently used as a general measure of market performance. Indices are not available for investment, are not professionally managed and do not reflect sales charges, fees, brokerage commissions, taxes or other expenses of investing.
Investors should consider the investment objectives, risks, charges and expenses of a mutual fund carefully before investing. For a free prospectus and, if available, a summary prospectus, which contains this and other important information about a fund, visit columbiamanagement.com. The prospectus should be read carefully before investing.
Columbia Funds are distributed by Columbia Management Investment Distributors, Inc., member FINRA, and managed by Columbia Management Investment Advisers, LLC.
© 2014 Columbia Management Investment Advisers, LLC. All rights reserved.
Columbia North Carolina Intermediate Municipal Bond Fund
Performance Overview | | | 2 | | |
Manager Discussion of Fund Performance | | | 4 | | |
Understanding Your Fund's Expenses | | | 6 | | |
Portfolio of Investments | | | 7 | | |
Statement of Assets and Liabilities | | | 13 | | |
Statement of Operations | | | 15 | | |
Statement of Changes in Net Assets | | | 16 | | |
Financial Highlights | | | 18 | | |
Notes to Financial Statements | | | 23 | | |
Report of Independent Registered
Public Accounting Firm | | | 28 | | |
Federal Income Tax Information | | | 29 | | |
Trustees and Officers | | | 30 | | |
Approval of Investment Management Services Agreement | | | 36 | | |
Important Information About This Report | | | 41 | | |
Fund Investment Manager
Columbia Management Investment
Advisers, LLC
225 Franklin Street
Boston, MA 02110
Fund Distributor
Columbia Management Investment
Distributors, Inc.
225 Franklin Street
Boston, MA 02110
Fund Transfer Agent
Columbia Management Investment
Services Corp.
P.O. Box 8081
Boston, MA 02266-8081
For more information about any of the funds, please visit columbiamanagement.com or call 800.345.6611. Customer Service Representatives are available to answer your questions Monday through Friday from 8 a.m. to 7 p.m. Eastern time.
The views expressed in this report reflect the current views of the respective parties. These views are not guarantees of future performance and involve certain risks, uncertainties and assumptions that are difficult to predict, so actual outcomes and results may differ significantly from the views expressed. These views are subject to change at any time based upon economic, market or other conditions and the respective parties disclaim any responsibility to update such views. These views may not be relied on as investment advice and, because investment decisions for a Columbia Fund are based on numerous factors, may not be relied on as an indication of trading intent on behalf of any particular Columbia Fund. References to specific securities should not be construed as a recommendation or investment advice.
Columbia North Carolina Intermediate Municipal Bond Fund
Performance Summary
> Columbia North Carolina Intermediate Municipal Bond Fund (the Fund) Class A shares returned -0.22% excluding sales charges for the 12-month period that ended April 30, 2014. Class Z shares of the Fund returned 0.03% for the same time period.
> The Fund's benchmark, the Barclays 3-15 Year Blend Municipal Bond Index, returned 0.97% for the 12-month period.
> The Fund's modest position in Puerto Rican bonds and its education and local general obligation bonds detracted from results, as all three generated negative returns for the period.
Average Annual Total Returns (%) (for period ended April 30, 2014)
| | Inception | | 1 Year | | 5 Years | | 10 Years | |
Class A | | 12/14/92 | | | | | | | | | | | | | |
Excluding sales charges | | | | | | | -0.22 | | | | 4.25 | | | | 3.45 | | |
Including sales charges | | | | | | | -3.48 | | | | 3.57 | | | | 3.11 | | |
Class B | | 06/07/93 | | | | | | | | | | | | | |
Excluding sales charges | | | | | | | -0.96 | | | | 3.45 | | | | 2.67 | | |
Including sales charges | | | | | | | -3.87 | | | | 3.45 | | | | 2.67 | | |
Class C | | 12/16/92 | | | | | | | | | | | | | |
Excluding sales charges | | | | | | | -0.96 | | | | 3.48 | | | | 2.68 | | |
Including sales charges | | | | | | | -1.93 | | | | 3.48 | | | | 2.68 | | |
Class R4 * | | 03/19/13 | | | 0.03 | | | | 4.49 | | | | 3.70 | | |
Class Z | | 12/11/92 | | | 0.03 | | | | 4.49 | | | | 3.70 | | |
Barclays 3-15 Year Blend Municipal Bond Index | | | | | | | 0.97 | | | | 4.91 | | | | 4.71 | | |
Returns for Class A are shown with and without the maximum initial sales charge of 3.25%. Returns for Class B are shown with and without the applicable contingent deferred sales charge (CDSC) of 3.00% in the first year, declining to 1.00% in the fourth year and eliminated thereafter. Returns for Class C are shown with and without the 1.00% CDSC for the first year only. The Fund's other classes are not subject to sales charges and have limited eligibility. Please see the Fund's prospectus for details. Performance for different share classes will vary based on differences in sales charges and fees associated with each class. All results shown assume reinvestment of distributions during the period. Returns do not reflect the deduction of taxes that a shareholder may pay on Fund distributions or on the redemption of Fund shares. Performance results reflect the effect of any fee waivers or reimbursements of Fund expenses by Columbia Management Investment Advisers, LLC and/or any of its affiliates. Absent these fee waivers or expense reimbursement arrangements, performance results would have been lower.
The performance information shown represents past performance and is not a guarantee of future results. The investment return and principal value of your investment will fluctuate so that your shares, when redeemed, may be worth more or less than their original cost. Current performance may be lower or higher than the performance information shown. You may obtain performance information current to the most recent month-end by contacting your financial intermediary, visiting columbiamanagement.com or calling 800.345.6611.
*The returns shown for periods prior to the share class inception date (including returns for the Life of the Fund, if shown, which are since Fund inception) include the returns of the Fund's oldest share class. These returns are adjusted to reflect any higher class-related operating expenses of the newer share classes, as applicable. Please visit columbiamanagement.com/mutual-funds/appended-performance for more information.
The Barclays 3-15 Year Blend Municipal Bond Index is an unmanaged index that tracks the performance of municipal bonds issued after December 31, 1990, with remaining maturities between 2 and 17 years and at least $7 million in principal amount outstanding.
Indices are not available for investment, are not professionally managed and do not reflect sales charges, fees, brokerage commissions, taxes or other expenses of investing. Securities in the Fund may not match those in an index.
Annual Report 2014
2
Columbia North Carolina Intermediate Municipal Bond Fund
Performance Overview (continued)
Performance of a Hypothetical $10,000 Investment (May 1, 2004 – April 30, 2014)

The chart above shows the change in value of a hypothetical $10,000 investment in Class A shares of Columbia North Carolina Intermediate Municipal Bond Fund during the stated time period, and does not reflect the deduction of taxes that a shareholder may pay on Fund distributions or on the redemption of Fund shares.
Annual Report 2014
3
Columbia North Carolina Intermediate Municipal Bond Fund
Manager Discussion of Fund Performance
Effective July 7, 2014, the Fund will be renamed Columbia AMT-Free North Carolina Intermediate Muni Bond Fund.
For the 12-month period that ended April 30, 2014, the Fund's Class A shares returned -0.22% excluding sales charges. Class Z shares of the Fund returned 0.03% for the same time period. The Fund's benchmark, the Barclays 3-15 Year Blend Municipal Bond Index, returned 0.97% for the 12-month period. The Fund's modest position in Puerto Rican bonds and its education and local general obligation bonds detracted from results, as all three generated negative returns for the period.
Stable Economic Growth
Even though a difficult winter weighed on the U.S. economy early in 2014, it was not enough to derail the steady growth that marked the 12-month period. Solid new job growth drove the unemployment rate down to 6.3%. Robust manufacturing activity boosted the nation's capacity utilization rate to a recovery high of 79.2%. Personal income edged higher, borrowing increased and the savings rate declined. Consumer confidence generally rose during the 12-month period, reflecting consumer expectations that the economy was on solid ground. The housing market lost some momentum, the victim of bad winter weather, tighter borrowing standards, rising prices and higher mortgage rates. However, higher pending home sales near the end of the period was a positive data point.
Investors welcomed reduced tensions in Washington, where an extended budget deal and the president's nomination of Janet Yellen as the new Federal Reserve (Fed) chair received bipartisan support. In December 2013, the Fed announced that it would take a measured approach to tapering its monthly bond-buying program, beginning in January 2014. Further tapering commenced in February, March and April. Against this backdrop of generally positive economic news, bonds lost some ground as interest rates moved higher. Nevertheless, the municipal market managed a modestly positive return for the period.
A Challenging Environment for the Municipal Market
Municipal yields followed Treasury yields higher from the beginning of the period through early September 2013. A rapid selloff in the wake of climbing yields sent municipal bond fund shares downward, causing heavy selling pressure, which persisted through the end of the calendar year. The environment improved in the first four months of 2014. Fund outflows slowed, state and local revenues improved, demand for shorter-maturity municipal bonds remained strong and new issuance declined sharply. Through April, new bond issuance was down by 30% compared to the same period in 2013, and refunding volume has dropped by more than 50%. For the 12 months covered by this report, the best returns came from bonds with two- to four-year maturities. Ten-year maturities were the worst performers. Generally speaking, lower quality bonds generated slightly higher returns than higher quality bonds.
Contributors and Detractors
The Fund had a heavy weight in pre-refunded bonds, which performed well during the period. Pre-refunded bonds are high quality and generally shorter in maturity. They are issued to pre-fund older callable bonds at lower rates for the issuer. The proceeds from the new issues are invested in Treasury securities and used to repay the original bond at its original call date. Two Fund issuers
Portfolio Management
Brian McGreevy
Quality Breakdown (%)
(at April 30, 2014) | |
AAA rating | | | 14.9 | | |
AA rating | | | 48.0 | | |
A rating | | | 21.9 | | |
BBB rating | | | 9.5 | | |
Not rated | | | 5.7 | | |
Total | | | 100.0 | | |
Percentages indicated are based upon total fixed income securities (excluding Money Market Funds).
Bond ratings apply to the underlying holdings of the Fund and not the Fund itself and are divided into categories ranging from AAA (highest) to D (lowest), and are subject to change. The ratings shown are determined by using the middle rating of Moody's, S&P, and Fitch after dropping the highest and lowest available ratings. When a rating from only two agencies is available, the lower rating is used. When a rating from only one agency is available, that rating is used. When a bond is not rated by one of these agencies, it is designated as Not rated. Credit ratings are subjective opinions and not statements of fact.
Investment Risks
There are risks associated with an investment in this Fund, including market risk, credit risk, interest rate risk prepayment and extension risk and state-specific municipal securities risk. In general, bond prices rise when interest rates fall and vice versa. Because the Fund concentrates its investments in municipal securities issued by a single state and its municipalities, specific events or factors affecting a particular state can cause more volatility in the Fund than a fund that is more geographically diversified. This effect is more pronounced for longer-term securities. Non-investment grade securities, commonly called 'high-yield' or 'junk' bonds, have more volatile prices and carry more risk to principal and income than investment grade securities. See the Fund's prospectus for information on these and other risks associated with Fund. Income from tax-exempt funds may be subject to state and local taxes. Federal and state income tax rules will apply to any capital gain distributions and any gains or losses on sales.
Annual Report 2014
4
Columbia North Carolina Intermediate Municipal Bond Fund
Manager Discussion of Fund Performance (continued)
refunded their debt to its first call price, which generated a substantial improvement in price. Albemarle Hospital, a non-rated issue, generated a return of more than 8.0%. Electric revenue bonds, where the Fund's exposure is more than 10%, also generated returns higher than the index. An underweight in bonds rated AAA was positive for the Fund, as higher quality bonds underperformed.
During the period, we did well to decrease the Fund's exposure to lower coupon bonds. As interest rates rose in 2013, these bonds were weak performers as the market feared they would trade below par and that they had the potential to be subject to additional tax consequences.
The Fund's maturity positioning generated mixed results. Exposure to the two- to six-year range aided results because the Fund's holdings did better than the benchmark's holdings of similar maturities. In addition, the Fund's holdings in the eight- to 12-year range, which were weak for the benchmark, were solid for the Fund. However, the Fund's holdings in the six- to eight-year range were weak, dragged down by a small position in Puerto Rican bonds, which were sold near the end of the period.
North Carolina Recovery Advances at Moderate Pace
Unusually cold weather early in 2014 weighed on job growth in North Carolina. And it could take the state longer to recover from the last recession, as the downturn it endured was more severe than the nation overall. Yet, we currently believe North Carolina's long-term prospects are bright. The housing market recovery has been steady. A new federally subsidized manufacturing innovation institute aims to boost technology-driven manufacturing. The introduction of the Park Center in the Research Triangle of Raleigh, Durham and Chapel Hill, also figures to attract more companies to the region. However, the state has cut budgets for university, community college and public schools, which could weaken the state's ability to attract companies whose employees seek quality educational resources for their families.
Looking Ahead
So far, we believe 2014 is lining up to be a better year for the municipal market than 2013. Overall returns have been better than they were in 2013, especially for longer-term municipal bonds. Even though we expect interest rates to continue to rise gradually through the end of 2014, we presently believe at this time that the taxable equivalent yield on municipal bonds is still attractive to investors who are subject to higher federal tax rates. In this environment, we have currently positioned the Fund with neutral duration relative to the benchmark and greater emphasis on securities rated A and BBB, which we believe have the potential to offer more value in an environment of slow but improving economic growth.
Annual Report 2014
5
Columbia North Carolina Intermediate Municipal Bond Fund
Understanding Your Fund's Expenses
(Unaudited)
As an investor, you incur two types of costs. There are transaction costs, which generally include sales charges on purchases and may include redemption fees. There are also ongoing costs, which generally include management fees, distribution and/or service fees, and other fund expenses. The following information is intended to help you understand your ongoing costs (in dollars) of investing in the Fund and to help you compare these costs with the ongoing costs of investing in other mutual funds.
Analyzing Your Fund's Expenses
To illustrate these ongoing costs, we have provided examples and calculated the expenses paid by investors in each share class of the Fund during the period. The actual and hypothetical information in the table is based on an initial investment of $1,000 at the beginning of the period indicated and held for the entire period. Expense information is calculated two ways and each method provides you with different information. The amount listed in the "Actual" column is calculated using the Fund's actual operating expenses and total return for the period. You may use the Actual information, together with the amount invested, to estimate the expenses that you paid over the period. Simply divide your account value by $1,000 (for example, an $8,600 account value divided by $1,000 = 8.6), then multiply the results by the expenses paid during the period under the "Actual" column. The amount listed in the "Hypothetical" column assumes a 5% annual rate of return before expenses (which is not the Fund's actual return) and then applies the Fund's actual expense ratio for the period to the hypothetical return. You should not use the hypothetical account values and expenses to estimate either your actual account balance at the end of the period or the expenses you paid during the period. See "Compare With Other Funds" below for details on how to use the hypothetical data.
Compare With Other Funds
Since all mutual funds are required to include the same hypothetical calculations about expenses in shareholder reports, you can use this information to compare the ongoing cost of investing in the Fund with other funds. To do so, compare the hypothetical example with the 5% hypothetical examples that appear in the shareholder reports of other funds. As you compare hypothetical examples of other funds, it is important to note that hypothetical examples are meant to highlight the ongoing costs of investing in a fund only and do not reflect any transaction costs, such as sales charges, or redemption or exchange fees. Therefore, the hypothetical calculations are useful in comparing ongoing costs only, and will not help you determine the relative total costs of owning different funds. If transaction costs were included in these calculations, your costs would be higher.
November 1, 2013 – April 30, 2014
| | Account Value at the Beginning
of the Period ($) | | Account Value at the End
of the Period ($) | | Expenses Paid During
the Period ($) | | Fund's Annualized
Expense Ratio (%) | |
| | Actual | | Hypothetical | | Actual | | Hypothetical | | Actual | | Hypothetical | | Actual | |
Class A | | | 1,000.00 | | | | 1,000.00 | | | | 1,023.10 | | | | 1,020.78 | | | | 4.06 | | | | 4.06 | | | | 0.81 | | |
Class B | | | 1,000.00 | | | | 1,000.00 | | | | 1,019.30 | | | | 1,017.06 | | | | 7.81 | | | | 7.80 | | | | 1.56 | | |
Class C | | | 1,000.00 | | | | 1,000.00 | | | | 1,019.30 | | | | 1,017.06 | | | | 7.81 | | | | 7.80 | | | | 1.56 | | |
Class R4 | | | 1,000.00 | | | | 1,000.00 | | | | 1,024.40 | | | | 1,022.02 | | | | 2.81 | | | | 2.81 | | | | 0.56 | | |
Class Z | | | 1,000.00 | | | | 1,000.00 | | | | 1,024.40 | | | | 1,022.02 | | | | 2.81 | | | | 2.81 | | | | 0.56 | | |
Expenses paid during the period are equal to the annualized expense ratio for each class as indicated above, multiplied by the average account value over the period and then multiplied by the number of days in the Fund's most recent fiscal half year and divided by 365.
Expenses do not include fees and expenses incurred indirectly by the Fund from the underlying funds in which the Fund may invest (also referred to as "acquired funds"), including affiliated and non-affiliated pooled investment vehicles (including mutual funds and exchange-traded funds).
Had Columbia Management Investment Advisers, LLC and/or certain of its affiliates not waived/reimbursed certain fees and expenses, account value at the end of the period would have been reduced.
Annual Report 2014
6
Columbia North Carolina Intermediate Municipal Bond Fund
Portfolio of Investments
April 30, 2014
(Percentages represent value of investments compared to net assets)
Municipal Bonds 96.1%
Issue
Description | | Coupon
Rate | | Principal
Amount ($) | | Value ($) | |
Airport 2.1% | |
Raleigh Durham Airport Authority
Refunding Revenue Bonds
Series 2010A
05/01/23 | | | 5.000 | % | | | 3,000,000 | | | | 3,483,420 | | |
Higher Education 4.7% | |
Appalachian State University
Refunding Revenue Bonds
Series 2005 (NPFGC)
07/15/21 | | | 5.000 | % | | | 790,000 | | | | 830,124 | | |
North Carolina Capital Facilities Finance Agency
Revenue Bonds
Meredith College
Series 2008
06/01/31 | | | 6.000 | % | | | 1,000,000 | | | | 1,069,610 | | |
Wake Forest University
Series 2009
01/01/26 | | | 5.000 | % | | | 1,000,000 | | | | 1,143,640 | | |
University of North Carolina System
Revenue Bonds
General Trust Indenture
Series 2009B
10/01/17 | | | 4.250 | % | | | 1,000,000 | | | | 1,108,430 | | |
Series 2008A
10/01/22 | | | 5.000 | % | | | 2,000,000 | | | | 2,271,940 | | |
University of North Carolina at Charlotte
Revenue Bonds
Series 2014
04/01/30 | | | 5.000 | % | | | 1,000,000 | | | | 1,145,520 | | |
Total | | | | | | | 7,569,264 | | |
Hospital 8.8% | |
Charlotte-Mecklenburg Hospital Authority (The)
Refunding Revenue Bonds
Carolinas Health Care System Group
Series 2007A (AGM)
01/15/20 | | | 5.000 | % | | | 1,550,000 | | | | 1,707,371 | | |
Series 2008A
01/15/24 | | | 5.250 | % | | | 2,000,000 | | | | 2,220,140 | | |
Series 2009A
01/15/21 | | | 5.000 | % | | | 1,000,000 | | | | 1,126,870 | | |
North Carolina Medical Care Commission
Refunding Revenue Bonds
Novant Health Obligation Group
Series 2013
11/01/24 | | | 5.000 | % | | | 530,000 | | | | 602,637 | | |
Southeastern Regional Medical Center
Series 2012
06/01/26 | | | 5.000 | % | | | 1,000,000 | | | | 1,094,010 | | |
Vidant Health
Series 2012A
06/01/25 | | | 5.000 | % | | | 1,500,000 | | | | 1,670,820 | | |
Municipal Bonds (continued)
Issue
Description | | Coupon
Rate | | Principal
Amount ($) | | Value ($) | |
Revenue Bonds
Duke University Health System
Series 2012A
06/01/32 | | | 5.000 | % | | | 1,000,000 | | | | 1,105,990 | | |
Moses Cone Health System
Series 2011
10/01/20 | | | 5.000 | % | | | 3,215,000 | | | | 3,735,444 | | |
Northern Hospital District of Surry County
Revenue Bonds
Series 2008
10/01/24 | | | 5.750 | % | | | 1,000,000 | | | | 1,060,440 | | |
Total | | | | | | | 14,323,722 | | |
Joint Power Authority 10.2% | |
North Carolina Eastern Municipal Power Agency
Refunding Revenue Bonds
Series 1993B (NPFGC)
01/01/22 | | | 6.000 | % | | | 1,000,000 | | | | 1,238,120 | | |
Series 1993B (NPFGC/IBC)
01/01/22 | | | 6.000 | % | | | 3,000,000 | | | | 3,712,020 | | |
Series 2005A (AMBAC)
01/01/20 | | | 5.250 | % | | | 2,000,000 | | | | 2,151,800 | | |
Series 2008A (AGM)
01/01/19 | | | 5.250 | % | | | 1,500,000 | | | | 1,711,605 | | |
Revenue Bonds
Series 2009B
01/01/26 | | | 5.000 | % | | | 2,250,000 | | | | 2,460,015 | | |
North Carolina Municipal Power Agency No. 1
Refunding Revenue Bonds
Series 2008A
01/01/17 | | | 5.250 | % | | | 1,185,000 | | | | 1,325,991 | | |
01/01/20 | | | 5.250 | % | | | 2,000,000 | | | | 2,244,660 | | |
Revenue Bonds
Series 2009A
01/01/25 | | | 5.000 | % | | | 1,500,000 | | | | 1,715,460 | | |
Total | | | | | | | 16,559,671 | | |
Local Appropriation 17.9% | |
City of Greenville
Certificate of Participation
Public Facilities & Equipment Project
Series 2004 (AMBAC)
06/01/22 | | | 5.250 | % | | | 2,180,000 | | | | 2,189,156 | | |
City of Wilmington
Refunding Certificate of Participation
Series 2006A
06/01/17 | | | 5.000 | % | | | 1,005,000 | | | | 1,093,169 | | |
County of Buncombe
Revenue Bonds
Series 2012
06/01/28 | | | 5.000 | % | | | 500,000 | | | | 573,860 | | |
06/01/29 | | | 5.000 | % | | | 1,000,000 | | | | 1,139,550 | | |
The accompanying Notes to Financial Statements are an integral part of this statement.
Annual Report 2014
7
Columbia North Carolina Intermediate Municipal Bond Fund
Portfolio of Investments (continued)
April 30, 2014
Municipal Bonds (continued)
Issue
Description | | Coupon
Rate | | Principal
Amount ($) | | Value ($) | |
County of Cabarrus
Certificate of Participation
Installment Financing Contract
Series 2008C
06/01/22 | | | 5.000 | % | | | 1,545,000 | | | | 1,756,634 | | |
County of Catawba
Revenue Bonds
Series 2011
10/01/22 | | | 5.000 | % | | | 400,000 | | | | 469,620 | | |
County of Chatham
Certificate of Participation
Series 2006 (AMBAC)
06/01/20 | | | 5.000 | % | | | 1,065,000 | | | | 1,157,730 | | |
County of Cumberland
Refunding Certificate of Participation
Improvement Projects
Series 2009-B1
12/01/21 | | | 5.000 | % | | | 2,775,000 | | | | 3,201,101 | | |
County of Gaston
Refunding Certificate of Participation
Series 2005 (NPFGC)
12/01/15 | | | 5.000 | % | | | 1,350,000 | | | | 1,445,175 | | |
County of Harnett
Certificate of Participation
Series 2009
06/01/22 | | | 5.000 | % | | | 1,880,000 | | | | 2,096,971 | | |
County of Henderson
Certificate of Participation
Series 2006A (AMBAC)
06/01/16 | | | 5.000 | % | | | 1,060,000 | | | | 1,154,181 | | |
County of Mecklenburg
Certificate of Participation
Series 2009A
02/01/23 | | | 5.000 | % | | | 1,000,000 | | | | 1,114,140 | | |
County of Moore
Revenue Bonds
Series 2010
06/01/24 | | | 5.000 | % | | | 1,635,000 | | | | 1,832,295 | | |
County of New Hanover
Refunding Certificate of Participation
Series 2005B (AMBAC)
09/01/18 | | | 5.000 | % | | | 1,755,000 | | | | 2,039,363 | | |
County of Randolph
Refunding Revenue Bonds
Series 2013C
10/01/26 | | | 5.000 | % | | | 1,500,000 | | | | 1,766,865 | | |
County of Sampson
Certificate of Participation
Series 2006 (AGM)
06/01/16 | | | 5.000 | % | | | 1,000,000 | | | | 1,092,460 | | |
Municipal Bonds (continued)
Issue
Description | | Coupon
Rate | | Principal
Amount ($) | | Value ($) | |
County of Union
Refunding Revenue Bonds
Series 2012
12/01/24 | | | 5.000 | % | | | 1,715,000 | | | | 2,080,878 | | |
Jacksonville Public Facilities Corp.
Limited Obligation Revenue Bonds
Series 2012
04/01/26 | | | 5.000 | % | | | 1,075,000 | | | | 1,206,817 | | |
Orange County Public Facilities Co.
Revenue Bonds
Series 2012
10/01/24 | | | 5.000 | % | | | 1,325,000 | | | | 1,539,835 | | |
Total | | | | | | | 28,949,800 | | |
Local General Obligation 5.9% | |
County of Cabarrus
Unlimited General Obligation Bonds
Public Improvement
Series 2006
03/01/15 | | | 5.000 | % | | | 1,000,000 | | | | 1,039,760 | | |
03/01/16 | | | 5.000 | % | | | 1,000,000 | | | | 1,083,620 | | |
County of Iredell
Unlimited General Obligation Bonds
School
Series 2006
02/01/19 | | | 5.000 | % | | | 2,420,000 | | | | 2,604,331 | | |
County of New Hanover
Unlimited General Obligation Refunding Bonds
Series 2009
12/01/17 | | | 5.000 | % | | | 1,170,000 | | | | 1,345,149 | | |
County of Stanly
Unlimited General Obligation Refunding Bonds
Series 2010
02/01/18 | | | 4.000 | % | | | 1,500,000 | | | | 1,669,605 | | |
County of Wake
Unrefunded Unlimited General Obligation Public Improvement Bonds
Series 2009
03/01/20 | | | 5.000 | % | | | 1,565,000 | | | | 1,828,781 | | |
Total | | | | | | | 9,571,246 | | |
Municipal Power 1.1% | |
Greenville Utilities Commission
Revenue Bonds
Series 2008A (AGM)
11/01/18 | | | 5.000 | % | | | 1,040,000 | | | | 1,206,078 | | |
Guam Power Authority
Refunding Revenue Bonds
Series 2012A (AGM)(a)
10/01/24 | | | 5.000 | % | | | 520,000 | | | | 596,128 | | |
Total | | | | | | | 1,802,206 | | |
The accompanying Notes to Financial Statements are an integral part of this statement.
Annual Report 2014
8
Columbia North Carolina Intermediate Municipal Bond Fund
Portfolio of Investments (continued)
April 30, 2014
Municipal Bonds (continued)
Issue
Description | | Coupon
Rate | | Principal
Amount ($) | | Value ($) | |
Other Bond Issue 0.7% | |
Durham County Industrial Facilities & Pollution Control
Financing Authority
Revenue Bonds
Research Triangle Institute
Series 2010
02/01/18 | | | 4.000 | % | | | 1,000,000 | | | | 1,098,680 | | |
Ports 1.4% | |
North Carolina State Ports Authority
Revenue Bonds
Senior Lien
Series 2010B
02/01/25 | | | 5.000 | % | | | 2,000,000 | | | | 2,192,440 | | |
Refunded/Escrowed 16.7% | |
Albemarle Hospital Authority
Prerefunded 10/01/17 Revenue Bonds
Series 2007
10/01/21 | | | 5.250 | % | | | 2,000,000 | | | | 2,295,200 | | |
10/01/27 | | | 5.250 | % | | | 1,000,000 | | | | 1,147,600 | | |
Appalachian State University
Prerefunded 07/15/15 Revenue Bonds
Series 2005 (NPFGC)
07/15/21 | | | 5.000 | % | | | 695,000 | | | | 735,449 | | |
County of Burke
Prerefunded 04/01/16 Certificate of Participation
Series 2006B (AMBAC)
04/01/18 | | | 5.000 | % | | | 1,425,000 | | | | 1,550,357 | | |
County of Craven
Prerefunded 06/01/17 Certificate of Participation
Series 2007 (NPFGC)
06/01/18 | | | 5.000 | % | | | 2,825,000 | | | | 3,196,911 | | |
06/01/19 | | | 5.000 | % | | | 1,825,000 | | | | 2,065,261 | | |
County of Wake
Prerefunded 03/01/19 Unlimited General Obligation Bonds
Public Improvement
Series 2009
03/01/20 | | | 5.000 | % | | | 935,000 | | | | 1,105,497 | | |
Revenue Bonds
Series 1993 Escrowed to Maturity (NPFGC)
10/01/26 | | | 5.125 | % | | | 3,065,000 | | | | 3,584,579 | | |
North Carolina Eastern Municipal Power Agency
Prerefunded 01/01/22 Revenue Bonds
Series 1988A
01/01/26 | | | 6.000 | % | | | 1,000,000 | | | | 1,285,530 | | |
Revenue Bonds
Series 1986A Escrowed to Maturity
01/01/17 | | | 5.000 | % | | | 2,165,000 | | | | 2,325,535 | | |
Municipal Bonds (continued)
Issue
Description | | Coupon
Rate | | Principal
Amount ($) | | Value ($) | |
North Carolina Medical Care Commission
Prerefunded 11/01/17 Revenue Bonds
Wilson Medical Center
Series 2007
11/01/19 | | | 5.000 | % | | | 3,385,000 | | | | 3,875,453 | | |
Puerto Rico Highways & Transportation Authority
Refunding Revenue Bonds
Series 2003AA Escrowed to Maturity (NPFGC)(a)
07/01/18 | | | 5.500 | % | | | 3,360,000 | | | | 3,980,424 | | |
Total | | | | | | | 27,147,796 | | |
Retirement Communities 1.6% | |
North Carolina Medical Care Commission
Refunding Revenue Bonds
1st Mortgage United Methodist
Series 2013A
10/01/33 | | | 5.000 | % | | | 1,595,000 | | | | 1,552,796 | | |
1st Mortgage-Givens Estates
Series 2007
07/01/16 | | | 5.000 | % | | | 1,000,000 | | | | 1,061,600 | | |
Total | | | | | | | 2,614,396 | | |
Special Non Property Tax 1.4% | |
Territory of Guam
Revenue Bonds
Series 2011A(a)
01/01/31 | | | 5.000 | % | | | 500,000 | | | | 519,980 | | |
Virgin Islands Public Finance Authority
Revenue Bonds
Matching Fund Loan-Senior Lien
Series 2010A(a)
10/01/20 | | | 5.000 | % | | | 1,560,000 | | | | 1,765,702 | | |
Total | | | | | | | 2,285,682 | | |
State Appropriated 1.8% | |
North Carolina Infrastructure Finance Corp.
Certificate of Participation
Capital Improvement
Series 2007A (AGM)
05/01/24 | | | 5.000 | % | | | 2,570,000 | | | | 2,857,249 | | |
Water & Sewer 21.8% | |
Cape Fear Public Utility Authority
Revenue Bonds
Series 2008
08/01/20 | | | 5.000 | % | | | 1,000,000 | | | | 1,149,330 | | |
City of Charlotte
Revenue Bonds
Series 2009B
07/01/25 | | | 5.000 | % | | | 5,835,000 | | | | 6,789,139 | | |
The accompanying Notes to Financial Statements are an integral part of this statement.
Annual Report 2014
9
Columbia North Carolina Intermediate Municipal Bond Fund
Portfolio of Investments (continued)
April 30, 2014
Municipal Bonds (continued)
Issue
Description | | Coupon
Rate | | Principal
Amount ($) | | Value ($) | |
Water & Sewer System
Series 2008
07/01/23 | | | 5.000 | % | | | 3,000,000 | | | | 3,441,060 | | |
City of Concord
Refunding Revenue Bonds
Series 2008B
12/01/19 | | | 5.000 | % | | | 1,500,000 | | | | 1,755,090 | | |
City of Gastonia
Refunding Revenue Bonds
Combined Utilities System
Series 2009
05/01/17 | | | 4.000 | % | | | 1,205,000 | | | | 1,320,824 | | |
City of Greensboro
Refunding Revenue Bonds
Series 2006
06/01/17 | | | 5.250 | % | | | 2,000,000 | | | | 2,278,420 | | |
06/01/22 | | | 5.250 | % | | | 1,200,000 | | | | 1,468,692 | | |
06/01/23 | | | 5.250 | % | | | 2,000,000 | | | | 2,470,200 | | |
City of High Point
Revenue Bonds
Series 2008 (AGM)
11/01/24 | | | 5.000 | % | | | 1,000,000 | | | | 1,156,170 | | |
11/01/25 | | | 5.000 | % | | | 1,000,000 | | | | 1,154,280 | | |
City of Raleigh
Revenue Bonds
Series 2006A
03/01/16 | | | 5.000 | % | | | 1,500,000 | | | | 1,627,260 | | |
Series 2011
03/01/27 | | | 5.000 | % | | | 800,000 | | | | 919,616 | | |
City of Thomasville
Refunding Revenue Bonds
Series 2012
05/01/24 | | | 4.000 | % | | | 500,000 | | | | 539,405 | | |
05/01/26 | | | 4.000 | % | | | 860,000 | | | | 911,996 | | |
Municipal Bonds (continued)
Issue
Description | | Coupon
Rate | | Principal
Amount ($) | | Value ($) | |
City of Winston-Salem
Refunding Revenue Bonds
Series 2007A
06/01/19 | | | 5.000 | % | | | 3,000,000 | | | | 3,373,560 | | |
Revenue Bonds
Series 2009
06/01/23 | | | 5.000 | % | | | 1,000,000 | | | | 1,165,550 | | |
County of Brunswick
Revenue Bonds
Series 2008A
04/01/20 | | | 5.000 | % | | | 1,915,000 | | | | 2,179,768 | | |
04/01/22 | | | 5.000 | % | | | 1,390,000 | | | | 1,577,622 | | |
Total | | | | | | | 35,277,982 | | |
Total Municipal Bonds
(Cost: $143,618,807) | | | | | | | 155,733,554 | | |
Money Market Funds 2.8%
| | | Shares | | Value ($) | |
JPMorgan Tax-Free Money Market Fund,
0.010%(b) | | | 4,585,560 | | | | 4,585,560 | | |
Total Money Market Funds
(Cost: $4,585,560) | | | | | 4,585,560 | | |
Total Investments
(Cost: $148,204,367) | | | | | 160,319,114 | | |
Other Assets & Liabilities, Net | | | | | 1,751,848 | | |
Net Assets | | | | | 162,070,962 | | |
Notes to Portfolio of Investments
(a) Municipal obligations include debt obligations issued by or on behalf of territories, possessions, or sovereign nations within the territorial boundaries of the United States. At April 30, 2014, the value of these securities amounted to $6,862,234 or 4.23% of net assets.
(b) The rate shown is the seven-day current annualized yield at April 30, 2014.
Abbreviation Legend
AGM Assured Guaranty Municipal Corporation
AMBAC Ambac Assurance Corporation
IBC Insurance Bond Certificate
NPFGC National Public Finance Guarantee Corporation
The accompanying Notes to Financial Statements are an integral part of this statement.
Annual Report 2014
10
Columbia North Carolina Intermediate Municipal Bond Fund
Portfolio of Investments (continued)
April 30, 2014
Fair Value Measurements
Generally accepted accounting principles (GAAP) require disclosure regarding the inputs and valuation techniques used to measure fair value and any changes in valuation inputs or techniques. In addition, investments shall be disclosed by major category.
The Fund categorizes its fair value measurements according to a three-level hierarchy that maximizes the use of observable inputs and minimizes the use of unobservable inputs by prioritizing that the most observable input be used when available. Observable inputs are those that market participants would use in pricing an investment based on market data obtained from sources independent of the reporting entity. Unobservable inputs are those that reflect the Fund's assumptions about the information market participants would use in pricing an investment. An investment's level within the fair value hierarchy is based on the lowest level of any input that is deemed significant to the asset or liability's fair value measurement. The input levels are not necessarily an indication of the risk or liquidity associated with investments at that level. For example, certain U.S. government securities are generally high quality and liquid, however, they are reflected as Level 2 because the inputs used to determine fair value may not always be quoted prices in an active market.
Fair value inputs are summarized in the three broad levels listed below:
> Level 1 — Valuations based on quoted prices for investments in active markets that the Fund has the ability to access at the measurement date (including NAV for open-end mutual funds). Valuation adjustments are not applied to Level 1 investments.
> Level 2 — Valuations based on other significant observable inputs (including quoted prices for similar securities, interest rates, prepayment speeds, credit risks, etc.).
> Level 3 — Valuations based on significant unobservable inputs (including the Fund's own assumptions and judgment in determining the fair value of investments).
Inputs that are used in determining fair value of an investment may include price information, credit data, volatility statistics, and other factors. These inputs can be either observable or unobservable. The availability of observable inputs can vary between investments, and is affected by various factors such as the type of investment, and the volume and level of activity for that investment or similar investments in the marketplace. The inputs will be considered by the Investment Manager, along with any other relevant factors in the calculation of an investment's fair value. The Fund uses prices and inputs that are current as of the measurement date, which may include periods of market dislocations. During these periods, the availability of prices and inputs may be reduced for many investments. This condition could cause an investment to be reclassified between the various levels within the hierarchy.
Investments falling into the Level 3 category are primarily supported by quoted prices from brokers and dealers participating in the market for those investments. However, these may be classified as Level 3 investments due to lack of market transparency and corroboration to support these quoted prices. Additionally, valuation models may be used as the pricing source for any remaining investments classified as Level 3. These models may rely on one or more significant unobservable inputs and/or significant assumptions by the Investment Manager. Inputs used in valuations may include, but are not limited to, financial statement analysis, capital account balances, discount rates and estimated cash flows, and comparable company data.
Under the direction of the Fund's Board of Trustees (the Board), the Investment Manager's Valuation Committee (the Committee) is responsible for overseeing the valuation procedures approved by the Board. The Committee consists of voting and non-voting members from various groups within the Investment Manager's organization, including operations and accounting, trading and investments, compliance, risk management and legal.
The Committee meets at least monthly to review and approve valuation matters, which may include a description of specific valuation determinations, data regarding pricing information received from approved pricing vendors and brokers and the results of Board-approved valuation control policies and procedures (the Policies). The Policies address, among other things, instances when market quotations are or are not readily available, including recommendations of third party pricing vendors and a determination of appropriate pricing methodologies; events that require specific valuation determinations and assessment of fair value techniques; securities with a potential for stale pricing, including those that are illiquid, restricted, or in default; and the effectiveness of third party pricing vendors, including periodic reviews of vendors. The Committee meets more frequently, as needed, to discuss additional valuation matters, which may include the need to review back-testing results, review time-sensitive information or approve related valuation actions. The Committee reports to the Board, with members of the Committee meeting with the Board at each of its regularly scheduled meetings to discuss valuation matters and actions during the period, similar to those described earlier.
For investments categorized as Level 3, the Committee monitors information similar to that described above, which may include: (i) data specific to the issuer or comparable issuers, (ii) general market or specific sector news and (iii) quoted prices and specific or similar security transactions. The Committee considers this data and any changes from prior periods in order to assess the reasonableness of observable and unobservable inputs, any assumptions or internal models used to value those securities and changes in fair value. This data is also used to corroborate, when available, information received from approved pricing vendors and brokers. Various factors impact the frequency of monitoring this information (which may occur as often as daily). However, the Committee may determine that changes to inputs, assumptions and models are not required as a result of the monitoring procedures performed.
The accompanying Notes to Financial Statements are an integral part of this statement.
Annual Report 2014
11
Columbia North Carolina Intermediate Municipal Bond Fund
Portfolio of Investments (continued)
April 30, 2014
Fair Value Measurements (continued)
The following table is a summary of the inputs used to value the Fund's investments at April 30, 2014:
Description | | Level 1
Quoted Prices in Active
Markets for Identical
Assets ($) | | Level 2
Other Significant
Observable Inputs ($) | | Level 3
Significant
Unobservable Inputs ($) | | Total ($) | |
Bonds | |
Municipal Bonds | | | — | | | | 155,733,554 | | | | — | | | | 155,733,554 | | |
Total Bonds | | | — | | | | 155,733,554 | | | | — | | | | 155,733,554 | | |
Mutual Funds | |
Money Market Funds | | | 4,585,560 | | | | — | | | | — | | | | 4,585,560 | | |
Total Mutual Funds | | | 4,585,560 | | | | — | | | | — | | | | 4,585,560 | | |
Total | | | 4,585,560 | | | | 155,733,554 | | | | — | | | | 160,319,114 | | |
See the Portfolio of Investments for all investment classifications not indicated in the table.
The Fund's assets assigned to the Level 2 input category are generally valued using the market approach, in which a security's value is determined through reference to prices and information from market transactions for similar or identical assets.
There were no transfers of financial assets between levels during the period.
The accompanying Notes to Financial Statements are an integral part of this statement.
Annual Report 2014
12
Columbia North Carolina Intermediate Municipal Bond Fund
Statement of Assets and Liabilities
April 30, 2014
Assets | |
Investments, at value | |
(identified cost $148,204,367) | | $ | 160,319,114 | | |
Receivable for: | |
Capital shares sold | | | 263,156 | | |
Interest | | | 2,139,068 | | |
Expense reimbursement due from Investment Manager | | | 864 | | |
Prepaid expenses | | | 680 | | |
Total assets | | | 162,722,882 | | |
Liabilities | |
Payable for: | |
Capital shares purchased | | | 86,602 | | |
Dividend distributions to shareholders | | | 397,470 | | |
Investment management fees | | | 1,773 | | |
Distribution and/or service fees | | | 384 | | |
Transfer agent fees | | | 26,250 | | |
Administration fees | | | 310 | | |
Compensation of board members | | | 107,541 | | |
Other expenses | | | 31,590 | | |
Total liabilities | | | 651,920 | | |
Net assets applicable to outstanding capital stock | | $ | 162,070,962 | | |
Represented by | |
Paid-in capital | | $ | 152,328,130 | | |
Undistributed net investment income | | | 737,030 | | |
Accumulated net realized loss | | | (3,108,945 | ) | |
Unrealized appreciation (depreciation) on: | |
Investments | | | 12,114,747 | | |
Total — representing net assets applicable to outstanding capital stock | | $ | 162,070,962 | | |
The accompanying Notes to Financial Statements are an integral part of this statement.
Annual Report 2014
13
Columbia North Carolina Intermediate Municipal Bond Fund
Statement of Assets and Liabilities (continued)
April 30, 2014
Class A | |
Net assets | | $ | 27,796,541 | | |
Shares outstanding | | | 2,619,561 | | |
Net asset value per share | | $ | 10.61 | | |
Maximum offering price per share(a) | | $ | 10.97 | | |
Class B | |
Net assets | | $ | 102,007 | | |
Shares outstanding | | | 9,611 | | |
Net asset value per share | | $ | 10.61 | | |
Class C | |
Net assets | | $ | 7,015,237 | | |
Shares outstanding | | | 661,313 | | |
Net asset value per share | | $ | 10.61 | | |
Class R4 | |
Net assets | | $ | 1,736,885 | | |
Shares outstanding | | | 163,865 | | |
Net asset value per share | | $ | 10.60 | | |
Class Z | |
Net assets | | $ | 125,420,292 | | |
Shares outstanding | | | 11,830,486 | | |
Net asset value per share | | $ | 10.60 | | |
(a) The maximum offering price per share is calculated by dividing the net asset value per share by 1.0 minus the maximum sales charge of 3.25%.
The accompanying Notes to Financial Statements are an integral part of this statement.
Annual Report 2014
14
Columbia North Carolina Intermediate Municipal Bond Fund
Statement of Operations
Year Ended April 30, 2014
Net investment income | |
Income: | |
Dividends | | $ | 545 | | |
Interest | | | 6,430,743 | | |
Total income | | | 6,431,288 | | |
Expenses: | |
Investment management fees | | | 705,293 | | |
Distribution and/or service fees | |
Class A | | | 75,372 | | |
Class B | | | 1,142 | | |
Class C | | | 72,913 | | |
Transfer agent fees | |
Class A | | | 58,640 | | |
Class B | | | 221 | | |
Class C | | | 14,173 | | |
Class R4 | | | 1,308 | | |
Class Z | | | 268,729 | | |
Administration fees | | | 123,426 | | |
Compensation of board members | | | 26,863 | | |
Custodian fees | | | 2,292 | | |
Printing and postage fees | | | 22,977 | | |
Registration fees | | | 24,710 | | |
Professional fees | | | 32,563 | | |
Other | | | 27,565 | | |
Total expenses | | | 1,458,187 | | |
Fees waived or expenses reimbursed by Investment Manager and its affiliates | | | (321,351 | ) | |
Total net expenses | | | 1,136,836 | | |
Net investment income | | | 5,294,452 | | |
Realized and unrealized gain (loss) — net | |
Net realized gain (loss) on: | |
Investments | | | (432,106 | ) | |
Net realized loss | | | (432,106 | ) | |
Net change in unrealized appreciation (depreciation) on: | |
Investments | | | (6,609,611 | ) | |
Net change in unrealized appreciation (depreciation) | | | (6,609,611 | ) | |
Net realized and unrealized loss | | | (7,041,717 | ) | |
Net decrease in net assets from operations | | $ | (1,747,265 | ) | |
The accompanying Notes to Financial Statements are an integral part of this statement.
Annual Report 2014
15
Columbia North Carolina Intermediate Municipal Bond Fund
Statement of Changes in Net Assets
| | | Year Ended
April 30,
2014 | | Year Ended
April 30,
2013(a) | |
Operations | |
Net investment income | | $ | 5,294,452 | | | $ | 6,075,124 | | |
Net realized gain (loss) | | | (432,106 | ) | | | 684,349 | | |
Net change in unrealized appreciation (depreciation) | | | (6,609,611 | ) | | | 1,382,384 | | |
Net increase (decrease) in net assets resulting from operations | | | (1,747,265 | ) | | | 8,141,857 | | |
Distributions to shareholders | |
Net investment income | |
Class A | | | (856,844 | ) | | | (896,426 | ) | |
Class B | | | (2,381 | ) | | | (2,812 | ) | |
Class C | | | (152,273 | ) | | | (156,689 | ) | |
Class R4 | | | (21,441 | ) | | | (8 | ) | |
Class Z | | | (4,261,513 | ) | | | (5,019,201 | ) | |
Total distributions to shareholders | | | (5,294,452 | ) | | | (6,075,136 | ) | |
Increase (decrease) in net assets from capital stock activity | | | (40,397,421 | ) | | | (12,989,822 | ) | |
Total decrease in net assets | | | (47,439,138 | ) | | | (10,923,101 | ) | |
Net assets at beginning of year | | | 209,510,100 | | | | 220,433,201 | | |
Net assets at end of year | | $ | 162,070,962 | | | $ | 209,510,100 | | |
Undistributed net investment income | | $ | 737,030 | | | $ | 737,031 | | |
(a) Class R4 shares are for the period from March 19, 2013 (commencement of operations) to April 30, 2013.
The accompanying Notes to Financial Statements are an integral part of this statement.
Annual Report 2014
16
Columbia North Carolina Intermediate Municipal Bond Fund
Statement of Changes in Net Assets (continued)
| | | Year Ended April 30, 2014 | | Year Ended April 30, 2013(a) | |
| | | Shares | | Dollars ($) | | Shares | | Dollars ($) | |
Capital stock activity | |
Class A shares | |
Subscriptions(b) | | | 487,517 | | | | 5,110,376 | | | | 415,472 | | | | 4,535,493 | | |
Distributions reinvested | | | 62,988 | | | | 661,759 | | | | 60,476 | | | | 660,647 | | |
Redemptions | | | (1,116,020 | ) | | | (11,686,687 | ) | | | (391,487 | ) | | | (4,267,494 | ) | |
Net increase (decrease) | | | (565,515 | ) | | | (5,914,552 | ) | | | 84,461 | | | | 928,646 | | |
Class B shares | |
Subscriptions | | | 37 | | | | 394 | | | | 30 | | | | 327 | | |
Distributions reinvested | | | 189 | | | | 1,985 | | | | 203 | | | | 2,217 | | |
Redemptions(b) | | | (3,351 | ) | | | (35,161 | ) | | | (4,533 | ) | | | (49,446 | ) | |
Net decrease | | | (3,125 | ) | | | (32,782 | ) | | | (4,300 | ) | | | (46,902 | ) | |
Class C shares | |
Subscriptions | | | 124,421 | | | | 1,309,987 | | | | 162,353 | | | | 1,776,448 | | |
Distributions reinvested | | | 12,008 | | | | 126,099 | | | | 10,917 | | | | 119,250 | | |
Redemptions | | | (268,833 | ) | | | (2,806,963 | ) | | | (138,462 | ) | | | (1,513,574 | ) | |
Net increase (decrease) | | | (132,404 | ) | | | (1,370,877 | ) | | | 34,808 | | | | 382,124 | | |
Class R4 shares | |
Subscriptions | | | 182,189 | | | | 1,914,667 | | | | 230 | | | | 2,500 | | |
Distributions reinvested | | | 2,033 | | | | 21,343 | | | | 1 | | | | 6 | | |
Redemptions | | | (20,588 | ) | | | (214,599 | ) | | | — | | | | — | | |
Net increase | | | 163,634 | | | | 1,721,411 | | | | 231 | | | | 2,506 | | |
Class Z shares | |
Subscriptions | | | 2,519,806 | | | | 26,520,764 | | | | 2,478,489 | | | | 27,074,501 | | |
Distributions reinvested | | | 53,774 | | | | 564,454 | | | | 50,366 | | | | 549,746 | | |
Redemptions | | | (5,911,569 | ) | | | (61,885,839 | ) | | | (3,838,774 | ) | | | (41,880,443 | ) | |
Net decrease | | | (3,337,989 | ) | | | (34,800,621 | ) | | | (1,309,919 | ) | | | (14,256,196 | ) | |
Total net decrease | | | (3,875,399 | ) | | | (40,397,421 | ) | | | (1,194,719 | ) | | | (12,989,822 | ) | |
(a) Class R4 shares are for the period from March 19, 2013 (commencement of operations) to April 30, 2013.
(b) Includes conversions of Class B shares to Class A shares, if any.
The accompanying Notes to Financial Statements are an integral part of this statement.
Annual Report 2014
17
Columbia North Carolina Intermediate Municipal Bond Fund
The following tables are intended to help you understand the Fund's financial performance. Certain information reflects financial results for a single share of a class held for the periods shown. Per share net investment income (loss) amounts are calculated based on average shares outstanding during the period. Total return assumes reinvestment of all dividends and distributions, if any. Total return does not reflect payment of sales charges, if any, and is not annualized for periods of less than one year.
| | | Year Ended April 30, | | Year Ended March 31, | |
Class A | | 2014 | | 2013 | | 2012(a) | | 2012 | | 2011 | | 2010 | |
Per share data | |
Net asset value, beginning of period | | $ | 10.94 | | | $ | 10.84 | | | $ | 10.74 | | | $ | 10.13 | | | $ | 10.17 | | | $ | 9.79 | | |
Income from investment operations: | |
Net investment income | | | 0.30 | | | | 0.28 | | | | 0.02 | | | | 0.30 | | | | 0.31 | | | | 0.33 | | |
Net realized and unrealized gain (loss) | | | (0.33 | ) | | | 0.10 | | | | 0.10 | | | | 0.61 | | | | (0.04 | ) | | | 0.38 | | |
Total from investment operations | | | (0.03 | ) | | | 0.38 | | | | 0.12 | | | | 0.91 | | | | 0.27 | | | | 0.71 | | |
Less distributions to shareholders: | |
Net investment income | | | (0.30 | ) | | | (0.28 | ) | | | (0.02 | ) | | | (0.30 | ) | | | (0.31 | ) | | | (0.33 | ) | |
Total distributions to shareholders | | | (0.30 | ) | | | (0.28 | ) | | | (0.02 | ) | | | (0.30 | ) | | | (0.31 | ) | | | (0.33 | ) | |
Net asset value, end of period | | $ | 10.61 | | | $ | 10.94 | | | $ | 10.84 | | | $ | 10.74 | | | $ | 10.13 | | | $ | 10.17 | | |
Total return | | | (0.22 | %) | | | 3.57 | % | | | 1.15 | % | | | 9.02 | % | | | 2.61 | % | | | 7.34 | % | |
Ratios to average net assets(b) | |
Total gross expenses | | | 0.99 | % | | | 0.97 | % | | | 0.96 | %(c) | | | 1.00 | % | | | 0.94 | % | | | 0.91 | % | |
Total net expenses(d) | | | 0.81 | % | | | 0.80 | % | | | 0.79 | %(c) | | | 0.79 | % | | | 0.80 | %(e) | | | 0.78 | %(e) | |
Net investment income | | | 2.84 | % | | | 2.59 | % | | | 2.65 | %(c) | | | 2.80 | % | | | 2.97 | % | | | 3.27 | % | |
Supplemental data | |
Net assets, end of period (in thousands) | | $ | 27,797 | | | $ | 34,852 | | | $ | 33,601 | | | $ | 33,061 | | | $ | 31,731 | | | $ | 33,307 | | |
Portfolio turnover | | | 3 | % | | | 10 | % | | | 1 | % | | | 4 | % | | | 16 | % | | | 15 | % | |
Notes to Financial Highlights
(a) For the period from April 1, 2012 to April 30, 2012. During the period, the Fund's fiscal year end was changed from March 31 to April 30.
(b) In addition to the fees and expenses which the Fund bears directly, the Fund indirectly bears a pro rata share of the fees and expenses of the acquired funds in which it invests. Such indirect expenses are not included in the reported expense ratios.
(c) Annualized.
(d) Total net expenses include the impact of certain waivers/reimbursements made by the Investment Manager and certain of its affiliates, if applicable.
(e) The benefits derived from expense reductions had an impact of less than 0.01%.
The accompanying Notes to Financial Statements are an integral part of this statement.
Annual Report 2014
18
Columbia North Carolina Intermediate Municipal Bond Fund
Financial Highlights (continued)
| | | Year Ended April 30, | | Year Ended March 31, | |
Class B | | 2014 | | 2013 | | 2012(a) | | 2012 | | 2011 | | 2010 | |
Per share data | |
Net asset value, beginning of period | | $ | 10.94 | | | $ | 10.84 | | | $ | 10.74 | | | $ | 10.13 | | | $ | 10.17 | | | $ | 9.79 | | |
Income from investment operations: | |
Net investment income | | | 0.22 | | | | 0.20 | | | | 0.02 | | | | 0.22 | | | | 0.23 | | | | 0.26 | | |
Net realized and unrealized gain (loss) | | | (0.33 | ) | | | 0.10 | | | | 0.10 | | | | 0.59 | | | | (0.04 | ) | | | 0.38 | | |
Total from investment operations | | | (0.11 | ) | | | 0.30 | | | | 0.12 | | | | 0.81 | | | | 0.19 | | | | 0.64 | | |
Less distributions to shareholders: | |
Net investment income | | | (0.22 | ) | | | (0.20 | ) | | | (0.02 | ) | | | (0.20 | ) | | | (0.23 | ) | | | (0.26 | ) | |
Total distributions to shareholders | | | (0.22 | ) | | | (0.20 | ) | | | (0.02 | ) | | | (0.20 | ) | | | (0.23 | ) | | | (0.26 | ) | |
Net asset value, end of period | | $ | 10.61 | | | $ | 10.94 | | | $ | 10.84 | | | $ | 10.74 | | | $ | 10.13 | | | $ | 10.17 | | |
Total return | | | (0.96 | %) | | | 2.80 | % | | | 1.09 | % | | | 8.07 | % | | | 1.85 | % | | | 6.55 | % | |
Ratios to average net assets(b) | |
Total gross expenses | | | 1.74 | % | | | 1.72 | % | | | 1.71 | %(c) | | | 1.82 | % | | | 1.69 | % | | | 1.66 | % | |
Total net expenses(d) | | | 1.56 | % | | | 1.55 | % | | | 1.54 | %(c) | | | 1.55 | % | | | 1.55 | %(e) | | | 1.53 | %(e) | |
Net investment income | | | 2.09 | % | | | 1.85 | % | | | 1.90 | %(c) | | | 2.08 | % | | | 2.22 | % | | | 2.56 | % | |
Supplemental data | |
Net assets, end of period (in thousands) | | $ | 102 | | | $ | 139 | | | $ | 185 | | | $ | 183 | | | $ | 554 | | | $ | 1,260 | | |
Portfolio turnover | | | 3 | % | | | 10 | % | | | 1 | % | | | 4 | % | | | 16 | % | | | 15 | % | |
Notes to Financial Highlights
(a) For the period from April 1, 2012 to April 30, 2012. During the period, the Fund's fiscal year end was changed from March 31 to April 30.
(b) In addition to the fees and expenses which the Fund bears directly, the Fund indirectly bears a pro rata share of the fees and expenses of the acquired funds in which it invests. Such indirect expenses are not included in the reported expense ratios.
(c) Annualized.
(d) Total net expenses include the impact of certain waivers/reimbursements made by the Investment Manager and certain of its affiliates, if applicable.
(e) The benefits derived from expense reductions had an impact of less than 0.01%.
The accompanying Notes to Financial Statements are an integral part of this statement.
Annual Report 2014
19
Columbia North Carolina Intermediate Municipal Bond Fund
Financial Highlights (continued)
| | | Year Ended April 30, | | Year Ended March 31, | |
Class C | | 2014 | | 2013 | | 2012(a) | | 2012 | | 2011 | | 2010 | |
Per share data | |
Net asset value, beginning of period | | $ | 10.94 | | | $ | 10.83 | | | $ | 10.74 | | | $ | 10.13 | | | $ | 10.17 | | | $ | 9.79 | | |
Income from investment operations: | |
Net investment income | | | 0.22 | | | | 0.20 | | | | 0.02 | | | | 0.21 | | | | 0.23 | | | | 0.26 | | |
Net realized and unrealized gain (loss) | | | (0.33 | ) | | | 0.11 | | | | 0.09 | | | | 0.62 | | | | (0.04 | ) | | | 0.38 | | |
Total from investment operations | | | (0.11 | ) | | | 0.31 | | | | 0.11 | | | | 0.83 | | | | 0.19 | | | | 0.64 | | |
Less distributions to shareholders: | |
Net investment income | | | (0.22 | ) | | | (0.20 | ) | | | (0.02 | ) | | | (0.22 | ) | | | (0.23 | ) | | | (0.26 | ) | |
Total distributions to shareholders | | | (0.22 | ) | | | (0.20 | ) | | | (0.02 | ) | | | (0.22 | ) | | | (0.23 | ) | | | (0.26 | ) | |
Net asset value, end of period | | $ | 10.61 | | | $ | 10.94 | | | $ | 10.83 | | | $ | 10.74 | | | $ | 10.13 | | | $ | 10.17 | | |
Total return | | | (0.96 | %) | | | 2.89 | % | | | 0.99 | % | | | 8.23 | % | | | 1.84 | % | | | 6.55 | % | |
Ratios to average net assets(b) | |
Total gross expenses | | | 1.74 | % | | | 1.72 | % | | | 1.71 | %(c) | | | 1.74 | % | | | 1.69 | % | | | 1.66 | % | |
Total net expenses(d) | | | 1.56 | % | | | 1.55 | % | | | 1.54 | %(c) | | | 1.54 | % | | | 1.55 | %(e) | | | 1.53 | %(e) | |
Net investment income | | | 2.09 | % | | | 1.84 | % | | | 1.90 | %(c) | | | 2.03 | % | | | 2.22 | % | | | 2.54 | % | |
Supplemental data | |
Net assets, end of period (in thousands) | | $ | 7,015 | | | $ | 8,683 | | | $ | 8,222 | | | $ | 8,112 | | | $ | 5,270 | | | $ | 3,797 | | |
Portfolio turnover | | | 3 | % | | | 10 | % | | | 1 | % | | | 4 | % | | | 16 | % | | | 15 | % | |
Notes to Financial Highlights
(a) For the period from April 1, 2012 to April 30, 2012. During the period, the Fund's fiscal year end was changed from March 31 to April 30.
(b) In addition to the fees and expenses which the Fund bears directly, the Fund indirectly bears a pro rata share of the fees and expenses of the acquired funds in which it invests. Such indirect expenses are not included in the reported expense ratios.
(c) Annualized.
(d) Total net expenses include the impact of certain waivers/reimbursements made by the Investment Manager and certain of its affiliates, if applicable.
(e) The benefits derived from expense reductions had an impact of less than 0.01%.
The accompanying Notes to Financial Statements are an integral part of this statement.
Annual Report 2014
20
Columbia North Carolina Intermediate Municipal Bond Fund
Financial Highlights (continued)
| | | Year Ended April 30, | |
Class R4 | | 2014 | | 2013(a) | |
Per share data | |
Net asset value, beginning of period | | $ | 10.93 | | | $ | 10.85 | | |
Income from investment operations: | |
Net investment income | | | 0.33 | | | | 0.04 | | |
Net realized and unrealized gain (loss) | | | (0.33 | ) | | | 0.08 | | |
Total from investment operations | | | — | | | | 0.12 | | |
Less distributions to shareholders: | |
Net investment income | | | (0.33 | ) | | | (0.04 | ) | |
Total distributions to shareholders | | | (0.33 | ) | | | (0.04 | ) | |
Net asset value, end of period | | $ | 10.60 | | | $ | 10.93 | | |
Total return | | | 0.03 | % | | | 1.07 | % | |
Ratios to average net assets(b) | |
Total gross expenses | | | 0.76 | % | | | 0.60 | %(c) | |
Total net expenses(d) | | | 0.56 | % | | | 0.52 | %(c) | |
Net investment income | | | 3.17 | % | | | 2.98 | %(c) | |
Supplemental data | |
Net assets, end of period (in thousands) | | $ | 1,737 | | | $ | 3 | | |
Portfolio turnover | | | 3 | % | | | 10 | % | |
Notes to Financial Highlights
(a) For the period from March 19, 2013 (commencement of operations) to April 30, 2013.
(b) In addition to the fees and expenses which the Fund bears directly, the Fund indirectly bears a pro rata share of the fees and expenses of the acquired funds in which it invests. Such indirect expenses are not included in the reported expense ratios.
(c) Annualized.
(d) Total net expenses include the impact of certain waivers/reimbursements made by the Investment Manager and certain of its affiliates, if applicable.
The accompanying Notes to Financial Statements are an integral part of this statement.
Annual Report 2014
21
Columbia North Carolina Intermediate Municipal Bond Fund
Financial Highlights (continued)
| | | Year Ended April 30, | | Year Ended March 31, | |
Class Z | | 2014 | | 2013 | | 2012(a) | | 2012 | | 2011 | | 2010 | |
Per share data | |
Net asset value, beginning of period | | $ | 10.93 | | | $ | 10.83 | | | $ | 10.73 | | | $ | 10.12 | | | $ | 10.17 | | | $ | 9.79 | | |
Income from investment operations: | |
Net investment income | | | 0.32 | | | | 0.31 | | | | 0.03 | | | | 0.32 | | | | 0.33 | | | | 0.36 | | |
Net realized and unrealized gain (loss) | | | (0.32 | ) | | | 0.10 | | | | 0.10 | | | | 0.61 | | | | (0.05 | ) | | | 0.38 | | |
Total from investment operations | | | — | | | | 0.41 | | | | 0.13 | | | | 0.93 | | | | 0.28 | | | | 0.74 | | |
Less distributions to shareholders: | |
Net investment income | | | (0.33 | ) | | | (0.31 | ) | | | (0.03 | ) | | | (0.32 | ) | | | (0.33 | ) | | | (0.36 | ) | |
Total distributions to shareholders | | | (0.33 | ) | | | (0.31 | ) | | | (0.03 | ) | | | (0.32 | ) | | | (0.33 | ) | | | (0.36 | ) | |
Net asset value, end of period | | $ | 10.60 | | | $ | 10.93 | | | $ | 10.83 | | | $ | 10.73 | | | $ | 10.12 | | | $ | 10.17 | | |
Total return | | | 0.03 | % | | | 3.83 | % | | | 1.17 | % | | | 9.30 | % | | | 2.76 | % | | | 7.61 | % | |
Ratios to average net assets(b) | |
Total gross expenses | | | 0.74 | % | | | 0.72 | % | | | 0.71 | %(c) | | | 0.74 | % | | | 0.69 | % | | | 0.66 | % | |
Total net expenses(d) | | | 0.56 | % | | | 0.55 | % | | | 0.54 | %(c) | | | 0.54 | % | | | 0.55 | %(e) | | | 0.53 | %(e) | |
Net investment income | | | 3.09 | % | | | 2.84 | % | | | 2.90 | %(c) | | | 3.05 | % | | | 3.22 | % | | | 3.54 | % | |
Supplemental data | |
Net assets, end of period (in thousands) | | $ | 125,420 | | | $ | 165,833 | | | $ | 178,425 | | | $ | 178,204 | | | $ | 160,427 | | | $ | 172,795 | | |
Portfolio turnover | | | 3 | % | | | 10 | % | | | 1 | % | | | 4 | % | | | 16 | % | | | 15 | % | |
Notes to Financial Highlights
(a) For the period from April 1, 2012 to April 30, 2012. During the period, the Fund's fiscal year end was changed from March 31 to April 30.
(b) In addition to the fees and expenses which the Fund bears directly, the Fund indirectly bears a pro rata share of the fees and expenses of the acquired funds in which it invests. Such indirect expenses are not included in the reported expense ratios.
(c) Annualized.
(d) Total net expenses include the impact of certain waivers/reimbursements made by the Investment Manager and certain of its affiliates, if applicable.
(e) The benefits derived from expense reductions had an impact of less than 0.01%.
The accompanying Notes to Financial Statements are an integral part of this statement.
Annual Report 2014
22
Columbia North Carolina Intermediate Municipal Bond Fund
Notes to Financial Statements
April 30, 2014
Note 1. Organization
Columbia North Carolina Intermediate Municipal Bond Fund (the Fund), a series of Columbia Funds Series Trust (the Trust), is a diversified fund. The Trust is registered under the Investment Company Act of 1940, as amended (the 1940 Act), as an open-end management investment company organized as a Delaware statutory trust.
Fund Shares
The Trust may issue an unlimited number of shares (without par value). The Fund offers Class A, Class B, Class C, Class R4 and Class Z shares. Although all share classes generally have identical voting, dividend and liquidation rights, each share class votes separately when required by law. Different share classes pay different distribution amounts to the extent the expenses of such share classes differ, and distributions in liquidation will be proportional to the net asset value of each share class. Each share class has its own expense structure and sales charges, as applicable.
Class A shares are subject to a maximum front-end sales charge of 3.25% based on the initial investment amount. Class A shares purchased without an initial sales charge in accounts aggregating $1 million to $50 million at the time of purchase are subject to a contingent deferred sales charge (CDSC) if the shares are sold within 18 months of purchase, charged as follows: 1.00% CDSC if redeemed within 12 months of purchase, and 0.50% CDSC if redeemed more than 12, but less than 18, months after purchase.
Class B shares may be subject to a maximum CDSC of 3.00% based upon the holding period after purchase. Class B shares will generally convert to Class A shares eight years after purchase. The Fund no longer accepts investments by new or existing investors in the Fund's Class B shares, except in connection with the reinvestment of any dividend and/or capital gain distributions in Class B shares of the Fund and exchanges by existing Class B shareholders of certain other funds within the Columbia Family of Funds.
Class C shares are subject to a 1.00% CDSC on shares redeemed within one year of purchase.
Class R4 shares are not subject to sales charges and are generally available only to omnibus retirement plans and certain other eligible investors.
Class Z shares are not subject to sales charges and are available only to certain eligible investors, which are subject to different investment minimums.
Note 2. Summary of Significant Accounting Policies
Use of Estimates
The preparation of financial statements in accordance with U.S. generally accepted accounting principles (GAAP) requires management to make certain estimates and assumptions that affect the reported amounts of assets and liabilities, the disclosure of contingent assets and liabilities at the date of the financial statements and the reported amounts of revenue and expenses during the reporting period. Actual results could differ from those estimates.
The following is a summary of significant accounting policies consistently followed by the Fund in the preparation of its financial statements.
Security Valuation
Debt securities generally are valued by pricing services approved by the Board of Trustees (the Board) based upon market transactions for normal, institutional-size trading units of similar securities. The services may use various pricing techniques which take into account appropriate factors such as yield, quality, coupon rate, maturity, type of issue, trading characteristics and other data, as well as broker quotes. Debt securities for which quotations are readily available may also be valued based upon an over-the-counter or exchange bid quotation.
Investments in open-end investment companies, including money market funds, are valued at net asset value.
Investments for which market quotations are not readily available, or that have quotations which management believes are not reliable, are valued at fair value as determined in good faith under consistently applied procedures established by and under the general supervision of the Board. If a security or class of securities (such as foreign securities) is valued at fair value, such value is likely to be different from the last quoted market price for the security.
The determination of fair value often requires significant judgment. To determine fair value, management may use assumptions including but not limited to future cash flows and estimated risk premiums. Multiple inputs from various sources may be used to determine fair value.
Security Transactions
Security transactions are accounted for on the trade date. Cost is determined and gains (losses) are based upon the specific identification method for both financial statement and federal income tax purposes.
Annual Report 2014
23
Columbia North Carolina Intermediate Municipal Bond Fund
Notes to Financial Statements (continued)
April 30, 2014
Income Recognition
Interest income is recorded on an accrual basis. Market premiums and discounts, including original issue discounts, are amortized and accreted, respectively, over the expected life of the security on all debt securities, unless otherwise noted.
Dividend income is recorded on the ex-dividend date.
Expenses
General expenses of the Trust are allocated to the Fund and other funds of the Trust based upon relative net assets or other expense allocation methodologies determined by the nature of the expense. Expenses directly attributable to the Fund are charged to the Fund. Expenses directly attributable to a specific class of shares are charged to that share class.
Determination of Class Net Asset Value
All income, expenses (other than class-specific expenses, which are charged to that share class, as shown in the Statement of Operations) and realized and unrealized gains (losses) are allocated to each class of the Fund on a daily basis, based on the relative net assets of each class, for purposes of determining the net asset value of each class.
Federal Income Tax Status
The Fund intends to qualify each year as a regulated investment company under Subchapter M of the Internal Revenue Code, as amended, and will distribute substantially all of its tax exempt and taxable income (including net short-term capital gains), if any, for its tax year, and as such will not be subject to federal income taxes. In addition, the Fund intends to distribute in each calendar year substantially all of its net investment income, capital gains and certain other amounts, if any, such that the Fund should not be subject to federal excise tax. Therefore, no federal income or excise tax provision is recorded.
Distributions to Shareholders
Distributions from net investment income, if any, are declared daily and paid monthly. Net realized capital gains, if any, are distributed at least annually. Income distributions and capital gain distributions are determined in accordance with federal income tax regulations, which may differ from GAAP.
Guarantees and Indemnifications
Under the Trust's organizational documents and, in some cases, by contract, its officers and trustees are indemnified against certain liabilities arising out of the performance of their duties to the Trust or its funds. In addition, certain of the Fund's contracts with its service providers contain general indemnification clauses. The Fund's maximum exposure under these arrangements is unknown since the amount of any
future claims that may be made against the Fund cannot be determined, and the Fund has no historical basis for predicting the likelihood of any such claims.
Note 3. Fees and Compensation Paid to Affiliates
Investment Management Fees
Under an Investment Management Services Agreement, Columbia Management Investment Advisers, LLC (the Investment Manager), a wholly-owned subsidiary of Ameriprise Financial, Inc. (Ameriprise Financial), determines which securities will be purchased, held or sold. The investment management fee is an annual fee that is equal to a percentage of the Fund's average daily net assets that declines from 0.40% to 0.27% as the Fund's net assets increase. The effective investment management fee rate for the year ended April 30, 2014 was 0.40% of the Fund's average daily net assets.
Administration Fees
Under an Administrative Services Agreement, the Investment Manager also serves as the Fund Administrator. The Fund pays the Fund Administrator an annual fee for administration and accounting services equal to a percentage of the Fund's average daily net assets that declines from 0.07% to 0.04% as the Fund's net assets increase. The effective administration fee rate for the year ended April 30, 2014 was 0.07% of the Fund's average daily net assets.
Other Expenses
Other expenses are for, among other things, miscellaneous expenses of the Fund or the Board, including payments to a company providing limited administrative services to the Fund and the Board. That company's expenses include boardroom and office expense, employee compensation, employee health and retirement benefits, and certain other expenses. For the year ended April 30, 2014, other expenses paid to this company were $1,845.
Compensation of Board Members
Board members are compensated for their services to the Fund as disclosed in the Statement of Operations. Under a Deferred Compensation Plan (the Plan), the Board members who are not "interested persons" of the Fund, as defined under the 1940 Act, may elect to defer payment of up to 100% of their compensation. Deferred amounts are treated as though equivalent dollar amounts had been invested in shares of certain funds managed by the Investment Manager. The Fund's liability for these amounts is adjusted for market value changes and remains in the Fund until distributed in accordance with the Plan.
Annual Report 2014
24
Columbia North Carolina Intermediate Municipal Bond Fund
Notes to Financial Statements (continued)
April 30, 2014
Transfer Agent Fees
Under a Transfer and Dividend Disbursing Agent Agreement, Columbia Management Investment Services Corp. (the Transfer Agent), an affiliate of the Investment Manager and a wholly-owned subsidiary of Ameriprise Financial, is responsible for providing transfer agency services to the Fund. The Transfer Agent has contracted with Boston Financial Data Services (BFDS) to serve as sub-transfer agent.
The Transfer Agent receives monthly account-based service fees based on the number of open accounts and also receives sub-transfer agency fees based on a percentage of the average aggregate value of the Fund's shares maintained in omnibus accounts (other than omnibus accounts for which American Enterprise Investment Services Inc. is the broker of record or accounts where the beneficial shareholder is a customer of Ameriprise Financial Services, Inc., which are paid a per account fee). The Transfer Agent pays the fees of BFDS for services as sub-transfer agent and is not entitled to reimbursement for such fees from the Fund (with the exception of out-of-pocket fees).
The Transfer Agent also receives compensation from fees for various shareholder services and reimbursements for certain out-of-pocket fees.
For the year ended April 30, 2014, the Fund's effective transfer agent fee rates as a percentage of average daily net assets of each class were as follows:
Class A | | | 0.19 | % | |
Class B | | | 0.19 | | |
Class C | | | 0.19 | | |
Class R4 | | | 0.19 | | |
Class Z | | | 0.19 | | |
An annual minimum account balance fee of $20 may apply to certain accounts with a value below the applicable share class's initial minimum investment requirements to reduce the impact of small accounts on transfer agent fees. These minimum account balance fees are recorded as part of expense reductions in the Statement of Operations. For the year ended April 30, 2014, no minimum account balance fees were charged by the Fund.
Distribution and Service Fees
The Fund has an agreement with Columbia Management Investment Distributors, Inc. (the Distributor), an affiliate of the Investment Manager and a wholly-owned subsidiary of Ameriprise Financial, for distribution and shareholder services. The Board has approved, and the Fund has adopted, distribution and shareholder service plans (the Plans) applicable to certain share classes, which set the distribution
and service fees for the Fund. These fees are calculated daily and are intended to compensate the Distributor and/or eligible selling and/or servicing agents for selling shares of the Fund and providing services to investors.
Under the Plans, the Fund pays a monthly combined distribution and service fee to the Distributor at the maximum annual rate of 0.25% of the average daily net assets attributable to Class A shares of the Fund. Also under the Plans, the Fund pays a monthly service fee at the maximum annual rate of 0.25% of the average daily net assets attributable to Class B and Class C shares of the Fund and the payment of a monthly distribution fee at the maximum annual rate of 0.75% of the average daily net assets attributable to Class B and Class C shares of the Fund.
Sales Charges
Sales charges, including front-end charges and CDSCs, received by the Distributor for distributing Fund shares were $17,943 for Class A and $5,528 for Class C shares for the year ended April 30, 2014.
Expenses Waived/Reimbursed by the Investment Manager and its Affiliates
The Investment Manager and certain of its affiliates have contractually agreed to waive fees and/or reimburse expenses (excluding certain fees and expenses described below) for the period disclosed below, unless sooner terminated at the sole discretion of the Board, so that the Fund's net operating expenses, after giving effect to fees waived/expenses reimbursed and any balance credits and/or overdraft charges from the Fund's custodian, do not exceed the following annual rates as a percentage of the class' average daily net assets:
| | | Fee Rates Contractual
through
August 31, 2014 | |
Class A | | | 0.81 | % | |
Class B | | | 1.56 | | |
Class C | | | 1.56 | | |
Class R4 | | | 0.56 | | |
Class Z | | | 0.56 | | |
Under the agreement governing these fee waivers and/or expense reimbursement arrangements, the following fees and expenses are excluded from the waiver/reimbursement commitment, and therefore will be paid by the Fund, if applicable: taxes (including foreign transaction taxes), expenses associated with investments in affiliated and non-affiliated pooled investment vehicles (including mutual funds and exchange-traded funds), transaction costs and brokerage commissions, costs related to any securities lending program, dividend expenses associated with securities sold short,
Annual Report 2014
25
Columbia North Carolina Intermediate Municipal Bond Fund
Notes to Financial Statements (continued)
April 30, 2014
inverse floater program fees and expenses, transaction charges and interest on borrowed money, interest, extraordinary expenses and any other expenses the exclusion of which is specifically approved by the Board. This agreement may be modified or amended only with approval from all parties.
Note 4. Federal Tax Information
The timing and character of income and capital gain distributions are determined in accordance with income tax regulations, which may differ from GAAP because of temporary or permanent book to tax differences.
At April 30, 2014, these differences are primarily due to differing treatment for capital loss carryforwards, Trustees' deferred compensation, distributions, and tax straddles. To the extent these differences are permanent, reclassifications are made among the components of the Fund's net assets in the Statement of Assets and Liabilities. Temporary differences do not require reclassifications. In the Statement of Assets and Liabilities the following reclassifications were made:
Undistributed net investment income | | $ | (1 | ) | |
Accumulated net realized loss | | | (1 | ) | |
Paid-in capital | | | 2 | | |
Net investment income and net realized gains (losses), as disclosed in the Statement of Operations, and net assets were not affected by this reclassification.
The tax character of distributions paid during the years indicated was as follows:
Year Ended April 30, | | 2014 | | 2013 | |
Ordinary income | | $ | 15,531 | | | $ | 15,423 | | |
Tax-exempt income | | | 5,278,921 | | | | 6,059,713 | | |
Total | | $ | 5,294,452 | | | $ | 6,075,136 | | |
Short-term capital gain distributions, if any, are considered ordinary income distributions for tax purposes.
At April 30, 2014, the components of distributable earnings on a tax basis were as follows:
Undistributed tax-exempt income | | $ | 1,216,204 | | |
Capital loss carryforwards | | | (3,081,754 | ) | |
Unrealized appreciation | | | 12,140,499 | | |
At April 30, 2014, the cost of investments for federal income tax purposes was $148,178,615 and the aggregate gross unrealized appreciation and depreciation based on that cost was:
Unrealized appreciation | | $ | 12,330,016 | | |
Unrealized depreciation | | | (189,517 | ) | |
Net unrealized appreciation/depreciation | | $ | 12,140,499 | | |
The following capital loss carryforward, determined at April 30, 2014, may be available to reduce taxable income arising from future net realized gains on investments, if any, to the extent permitted by the Internal Revenue Code:
Year of Expiration | | Amount | |
2017 | | $ | 2,649,648 | | |
Unlimited short-term | | | 432,106 | | |
Total | | $ | 3,081,754 | | |
Unlimited capital loss carryforwards are required to be utilized prior to any capital losses which carry an expiration date. As a result of this ordering rule, capital loss carryforwards which carry an expiration date may be more likely to expire unused.
Management of the Fund has concluded that there are no significant uncertain tax positions that would require recognition in the financial statements. However, management's conclusion may be subject to review and adjustment at a later date based on factors including, but not limited to, new tax laws, regulations, and administrative interpretations (including relevant court decisions). Generally, the Fund's federal tax returns for the prior three fiscal years remain subject to examination by the Internal Revenue Service.
Note 5. Portfolio Information
The cost of purchases and proceeds from sales of securities, excluding short-term obligations, aggregated to $4,910,218 and $43,563,782, respectively, for the year ended April 30, 2014.
Note 6. Shareholder Concentration
At April 30, 2014, two unaffiliated shareholders of record owned 81.0% of the outstanding shares of the Fund in one or more accounts. The Fund has no knowledge about whether any portion of those shares was owned beneficially. Subscription and redemption activity by concentrated accounts may have a significant effect on the operations of the Fund.
Note 7. Line of Credit
The Fund has entered into a revolving credit facility with a syndicate of banks led by JPMorgan Chase Bank N.A. whereby the Fund may borrow for the temporary funding of shareholder redemptions or for other temporary or emergency purposes. The credit facility agreement, as amended, which is a collective agreement between the Fund and certain other funds managed by the Investment Manager, severally and not jointly, permits collective borrowings up to $500 million. Interest is charged to each participating fund based on its borrowings at a rate equal to the higher of (i) the overnight federal funds rate plus 1.00% or (ii) the one-month LIBOR
Annual Report 2014
26
Columbia North Carolina Intermediate Municipal Bond Fund
Notes to Financial Statements (continued)
April 30, 2014
rate plus 1.00%. Each borrowing under the credit facility matures no later than 60 days after the date of borrowing. Effective December 10, 2013, the Fund also pays a commitment fee equal to its pro rata share of the amount of the credit facility at a rate of 0.075% per annum. Prior to December 10, 2013, the commitment fee was charged at the annual rate of 0.08% per annum. The commitment fee is included in other expenses in the Statement of Operations.
The Fund had no borrowings during the year ended April 30, 2014.
Note 8. Significant Risks
Geographic Concentration Risk
Because state-specific tax-exempt funds invest primarily in the municipal securities issued by the state and political sub-divisions of the state, the Fund will be particularly affected by political and economic conditions and developments in the state in which it invests. The Fund may, therefore, have a greater risk than that of a municipal bond fund which is more geographically diversified. The value of the municipal securities owned by the Fund also may be adversely affected by future changes in federal or state income tax laws.
Note 9. Subsequent Events
Management has evaluated the events and transactions that have occurred through the date the financial statements were issued and noted no items requiring adjustment of the financial statements or additional disclosure.
Note 10. Information Regarding Pending and Settled Legal Proceedings
In December 2005, without admitting or denying the allegations, American Express Financial Corporation (AEFC, which is now known as Ameriprise Financial, Inc. (Ameriprise Financial)) entered into settlement agreements with the Securities and Exchange Commission (SEC) and Minnesota Department of Commerce (MDOC) related to market timing activities. As a result, AEFC was censured and ordered to cease and desist from committing or causing any violations of certain provisions of the Investment Advisers Act of 1940, the Investment Company Act of 1940, and various Minnesota laws. AEFC agreed to pay disgorgement of $10 million and civil money penalties of $7 million. AEFC also agreed to retain an independent distribution consultant to assist in developing a plan for distribution of all disgorgement and civil penalties ordered by the SEC in accordance with various undertakings detailed at www.sec.gov/litigation/admin/ia-2451.pdf. Ameriprise Financial and its affiliates have cooperated with the SEC and the MDOC in these legal proceedings, and have made regular reports to the Funds' Boards of Trustees.
Ameriprise Financial and certain of its affiliates have historically been involved in a number of legal, arbitration and regulatory proceedings, including routine litigation, class actions, and governmental actions, concerning matters arising in connection with the conduct of their business activities. Ameriprise Financial believes that the Funds are not currently the subject of, and that neither Ameriprise Financial nor any of its affiliates are the subject of, any pending legal, arbitration or regulatory proceedings that are likely to have a material adverse effect on the Funds or the ability of Ameriprise Financial or its affiliates to perform under their contracts with the Funds. Ameriprise Financial is required to make 10-Q, 10-K and, as necessary, 8-K filings with the Securities and Exchange Commission on legal and regulatory matters that relate to Ameriprise Financial and its affiliates. Copies of these filings may be obtained by accessing the SEC website at www.sec.gov.
There can be no assurance that these matters, or the adverse publicity associated with them, will not result in increased fund redemptions, reduced sale of fund shares or other adverse consequences to the Funds. Further, although we believe proceedings are not likely to have a material adverse effect on the Funds or the ability of Ameriprise Financial or its affiliates to perform under their contracts with the Funds, these proceedings are subject to uncertainties and, as such, we are unable to estimate the possible loss or range of loss that may result. An adverse outcome in one or more of these proceedings could result in adverse judgments, settlements, fines, penalties or other relief that could have a material adverse effect on the consolidated financial condition or results of operations of Ameriprise Financial.
Annual Report 2014
27
Columbia North Carolina Intermediate Municipal Bond Fund
Report of Independent Registered Public Accounting Firm
To the Trustees of Columbia Funds Series Trust and the Shareholders of
Columbia North Carolina Intermediate Municipal Bond Fund
In our opinion, the accompanying statement of assets and liabilities, including the portfolio of investments, and the related statements of operations and of changes in net assets and the financial highlights present fairly, in all material respects, the financial position of Columbia North Carolina Intermediate Municipal Bond Fund (the "Fund", a series of Columbia Funds Series Trust) at April 30, 2014, and the results of its operations, the changes in its net assets and the financial highlights for each of the periods indicated, in conformity with accounting principles generally accepted in the United States of America. These financial statements and financial highlights (hereafter referred to as "financial statements") are the responsibility of the Fund's management; our responsibility is to express an opinion on these financial statements based on our audits. We conducted our audits of these financial statements in accordance with the standards of the Public Company Accounting Oversight Board (United States). Those standards require that we plan and perform the audit to obtain reasonable assurance about whether the financial statements are free of material misstatement. An audit includes examining, on a test basis, evidence supporting the amounts and disclosures in the financial statements, assessing the accounting principles used and significant estimates made by management, and evaluating the overall financial statement presentation. We believe that our audits, which included confirmation of securities at April 30, 2014 by correspondence with the custodian, provide a reasonable basis for our opinion.
PricewaterhouseCoopers LLP
Minneapolis, Minnesota
June 20, 2014
Annual Report 2014
28
Columbia North Carolina Intermediate Municipal Bond Fund
Federal Income Tax Information
(Unaudited)
The Fund hereby designates the following tax attributes for the fiscal year ended April 30, 2014. Shareholders will be notified in early 2015 of the amounts for use in preparing 2014 income tax returns.
Tax Designations:
| Exempt-Interest Dividends | | | 99.71 | % | |
Exempt-Interest Dividends. The percentage of net investment income dividends paid during the fiscal year that qualifies as exempt-interest dividends for federal income tax purposes.
Annual Report 2014
29
Columbia North Carolina Intermediate Municipal Bond Fund
Shareholders elect the Board that oversees the Funds' operations. The Board appoints officers who are responsible for day-to-day business decisions based on policies set by the Board. The following table provides basic biographical information about the Funds' Board members, including their principal occupations during the past five years, although specific titles for individuals may have varied over the period. Under current Board policy, members may serve through the end of the calendar year in which he or she reaches either the mandatory retirement age established by the Board or the fifteenth anniversary of the first Board meeting they attended as a member of the Board.
Independent Trustees
Name,
Address,
Year of Birth | | Position Held With
Funds and Length of
Service | | Principal Occupation(s)
During Past Five Years
and Other Relevant
Professional Experience | | Number of
Funds in the
Fund Family
Overseen by
Board Member | | Other Present or Past
Directorships/
Trusteeships
(Within Past 5 Years) | |
Kathleen Blatz
901 S. Marquette Ave.
Minneapolis, MN 55402
1954 | | Board member since 1/06 for RiverSource Funds and since 6/11 for Nations Funds | | Attorney; Chief Justice, Minnesota Supreme Court, 1998-2006 | | | 132 | | | Trustee, BlueCross BlueShield of Minnesota since 2009 | |
Edward J. Boudreau, Jr.
901 S. Marquette Ave.
Minneapolis, MN 55402
1944 | | Board member since 6/11 for RiverSource Funds and since 1/05 for Nations Funds | | Managing Director, E.J. Boudreau & Associates (consulting) since 2000; Chairman and Chief Executive Officer, John Hancock Funds (mutual funds), 1989-2000 | | | 130 | | | Former Trustee, BofA Funds Series Trust (11 funds), 2005-2011 | |
Pamela G. Carlton
901 S. Marquette Ave.
Minneapolis, MN 55402
1954 | | Board member since 7/07 for RiverSource Funds and since 6/11 for Nations Funds | | President, Springboard — Partners in Cross Cultural Leadership (consulting company) since 2003; Director or Management Director of US Equity Research, Chase Asset Management, 1996-2003; Investment Banker, Morgan Stanley, 1982-1996 | | | 132 | | | None | |
William P. Carmichael
901 S. Marquette Ave.
Minneapolis, MN 55402
1943 | | Chair of the Board since 1/14, Board member since 6/11 for RiverSource Funds and since 2003 for Nations Funds | | Retired; Co-founder, The Succession Fund (provides exit strategies to owners of privately held companies); previously, Senior Vice President, Sara Lee Corporation; Senior Vice President and Chief Financial Officer, Beatrice Foods Company; Vice President, Esmark, Inc.; Associate, Price Waterhouse | | | 132 | | | Director, Cobra Electronics Corporation (electronic equipment manufacturer); The Finish Line (athletic shoes and apparel) since July 2003; Director, International Textile Corp. since 2012; former Director, McMoRan Exploration Company (oil and gas exploration and development) 2010-2013; former Trustee, BofA Funds Series Trust (11 funds), 2009-2011; Director, Spectrum Brands, Inc. (consumer products), 2002-2009; Director, Simmons Company (bedding), 2004-2010 | |
Annual Report 2014
30
Columbia North Carolina Intermediate Municipal Bond Fund
Trustees and Officers (continued)
Independent Trustees (continued)
Name,
Address,
Year of Birth | | Position Held With
Funds and Length of
Service | | Principal Occupation(s)
During Past Five Years
and Other Relevant
Professional Experience | | Number of
Funds in the
Fund Family
Overseen by
Board Member | | Other Present or Past
Directorships/
Trusteeships
(Within Past 5 Years) | |
Patricia M. Flynn
901 S. Marquette Ave.
Minneapolis, MN 55402
1950 | | Board member since 11/04 for RiverSource Funds and since 6/11 for Nations Funds | | Trustee Professor of Economics and Management, Bentley University since 1976 (also teaches and conducts research on corporate governance); Dean, McCallum Graduate School of Business, Bentley University, 1992-2002 | | | 132 | | | None | |
William A. Hawkins
901 S. Marquette Ave.
Minneapolis, MN 55402
1942 | | Board member since 6/11 for RiverSource Funds and since 1/05 for Nations Funds | | Managing Director, Overton Partners (financial consulting), since August 2010; President and Chief Executive Officer, California General Bank, N.A., January 2008-August 2010 | | | 130 | | | Trustee, BofA Funds Series Trust (11 funds) | |
R. Glenn Hilliard
901 S. Marquette Ave.
Minneapolis, MN 55402
1943 | | Board member since 6/11 for RiverSource Funds and since 1/05 for Nations Funds | | Chairman and Chief Executive Officer, Hilliard Group LLC (investing and consulting) since April 2003; Non-Executive Director & Chairman, CNO Financial Group, Inc. (insurance), September 2003-May 2011 | | | 130 | | | Chairman, BofA Fund Series Trust (11 funds); former Director, CNO Financial Group, Inc. (insurance), 2003-2011 | |
Stephen R. Lewis, Jr.
901 S. Marquette Ave.
Minneapolis, MN 55402
1939 | | Board member for RiverSource Funds since 1/02 and since 6/11 for Nations Funds, Board Chair 1/07-12/13 | | President Emeritus and Professor of Economics Emeritus, Carleton College since 2002 | | | 132 | | | Director, Valmont Industries, Inc. (irrigation systems manufacturer), 2002-2013 | |
Catherine James Paglia
901 S. Marquette Ave.
Minneapolis, MN 55402
1952 | | Board member since 11/04 for RiverSource Funds and since 6/11 for Nations Funds | | Director, Enterprise Asset Management, Inc. (private real estate and asset management company) since September 1998 | | | 132 | | | Director, Valmont Industries, Inc. (irrigation systems manufacturer) since 2012 | |
Leroy C. Richie
901 S. Marquette Ave.
Minneapolis, MN 55402
1941 | | Board member since 2000 for Legacy Seligman Funds, since 11/08 for RiverSource Funds and since 6/11 for Nations Funds | | Counsel, Lewis & Munday, P.C. (law firm) since 2004; Vice President and General Counsel, Automotive Legal Affairs, Chrysler Corporation, 1993-1997 | | | 132 | | | Lead Outside Director, Digital Ally, Inc. (digital imaging) since September 2005; Director, Infinity, Inc. (oil and gas exploration and production) since 1994; Director, OGE Energy Corp. (energy and energy services) since November 2007 | |
Minor M. Shaw
901 S. Marquette Ave.
Minneapolis, MN 55402
1947 | | Board member since 6/11 for RiverSource Funds and since 2003 for Nations Funds | | President, Micco LLC (private investments) since 2011; President, Micco Corp. since 1998 | | | 130 | | | Director, Piedmont Natural Gas; Director, BlueCross BlueShield of South Carolina since April 2008; Director, National Association of Corporate Directors, Carolinas Chapter, since 2013; former Trustee, BofA Funds Series Trust (11 funds) | |
Annual Report 2014
31
Columbia North Carolina Intermediate Municipal Bond Fund
Trustees and Officers (continued)
Independent Trustees (continued)
Name,
Address,
Year of Birth | | Position Held With
Funds and Length of
Service | | Principal Occupation(s)
During Past Five Years
and Other Relevant
Professional Experience | | Number of
Funds in the
Fund Family
Overseen by
Board Member | | Other Present or Past
Directorships/
Trusteeships
(Within Past 5 Years) | |
Alison Taunton-Rigby
901 S. Marquette Ave.
Minneapolis, MN 55402
1944 | | Board member since 11/02 for RiverSource Funds and since 6/11 for Nations Funds | | Chief Executive Officer and Director, RiboNovix, Inc., (biotechnology) 2003-2010 | | | 132 | | | Director, Healthways, Inc. (health and wellbeing solutions) since 2005; Director, ICI Mutual Insurance Company, RRG since 2011; Director, Abt Associates (government contractor) since 2001; Director, Boston Children's Hospital since 2002 | |
Interested Trustee Not Affiliated with Investment Manager*
Name,
Address,
Year of Birth | | Position Held With
Funds and Length of
Service | | Principal Occupation(s)
During Past Five Years
and Other Relevant
Professional Experience | | Number of
Funds in the
Fund Family
Overseen by
Board Member | | Other Present or Past
Directorships/
Trusteeships
(Within Past 5 Years) | |
Anthony M. Santomero
901 S. Marquette Ave.
Minneapolis, MN 55402
1946 | | Board member since 6/11 for RiverSource Funds and since 1/08 for Nations Funds | | Richard K. Mellon Professor Emeritus of Finance, The Wharton School, University of Pennsylvania, since 2002; Senior Advisor, McKinsey & Company (consulting), 2006-2008 | | | 130 | | | Director, Renaissance Reinsurance Ltd. since May 2008; Trustee, Penn Mutual Life Insurance Company since March 2008; Director, Citigroup Inc. since 2009; Director, Citibank, N.A. since 2009; former Trustee, BofA Funds Series Trust (11 funds), 2008-2011 | |
*Dr. Santomero is not an affiliated person of the Investment Manager or Ameriprise Financial. However, he is currently deemed by the Funds to be an "interested person" (as defined in the 1940 Act) of the Funds because he serves as a Director of Citigroup Inc. and Citibank, N.A., companies that may directly or through subsidiaries and affiliates engage from time-to-time in brokerage execution, principal transactions and lending relationships with the Funds or accounts advised/managed by the Investment Manager.
Annual Report 2014
32
Columbia North Carolina Intermediate Municipal Bond Fund
Trustees and Officers (continued)
Interested Trustee Affiliated with Investment Manager*
Name,
Address,
Year of Birth | | Position Held With
Funds and Length of
Service | | Principal Occupation(s)
During Past Five Years
and Other Relevant
Professional Experience | | Number of
Funds in the
Fund Family
Overseen by
Board Member | | Other Present or Past
Directorships/
Trusteeships
(Within Past 5 Years) | |
William F. Truscott
53600 Ameriprise
Financial Center
Minneapolis, MN 55474
1960 | | Board member since 11/01 for RiverSource Funds and since 6/11 for Nations Funds; Senior Vice President since 2002 for RiverSource Funds and since 5/10 for Nations Funds | | Chairman of the Board and President, Columbia Management Investment Advisers, LLC since May 2010 and February 2012, respectively (previously President and Chief Investment Officer, 2001-April 2010); Chief Executive Officer, Global Asset Management, Ameriprise Financial, Inc. since September 2012 (previously Chief Executive Officer, U.S. Asset Management & President, Annuities, May 2010-September 2012 and President — U.S. Asset Management and Chief Investment Officer, 2005-April 2010); Director and Chief Executive Officer, Columbia Management Investment Distributors, Inc. since May 2010 and February 2012, respectively (previously Chairman of the Board and Chief Executive Officer, 2006-April 2010); Chairman of the Board and Chief Executive Officer, RiverSource Distributors, Inc. since 2006; Director, Threadneedle Asset Management Holdings, SARL since 2014; President and Chief Executive Officer, Ameriprise Certificate Company, 2006-August 2012 | | | 186 | | | Former Director, Ameriprise Certificate Company, 2006-January 2013 | |
*Interested person (as defined under the 1940 Act) by reason of being an officer, director, security holder and/or employee of the Investment Manager or Ameriprise Financial.
The Statement of Additional Information has additional information about the Fund's Board members and is available, without charge, upon request by calling 800.345.6611; contacting your financial intermediary or visiting columbiamanagement.com.
Annual Report 2014
33
Columbia North Carolina Intermediate Municipal Bond Fund
Trustees and Officers (continued)
The Board has appointed officers who are responsible for day-to-day business decisions based on policies it has established. The officers serve at the pleasure of the Board. In addition to Mr. Truscott, who is Senior Vice President, the Funds' other officers are:
Officers
Name,
Address and
Year of Birth | | Position and Year
First Appointed to
Position for any Fund
in the Columbia
Funds Complex or a
Predecessor Thereof | | Principal Occupation(s) During Past Five Years | |
J. Kevin Connaughton
225 Franklin Street
Boston, MA 02110
Born 1964 | | President and Principal Executive Officer (2009) | | Managing Director and General Manager — Mutual Fund Products, Columbia Management Investment Advisers, LLC since May 2010; and President, Columbia Funds since 2009; Managing Director, Columbia Management Advisors, LLC, December 2004-April 2010; Senior Vice President and Chief Financial Officer, Columbia Funds, June 2008-January 2009; and senior officer of Columbia Funds and affiliated funds since 2003 | |
Michael G. Clarke
225 Franklin Street
Boston, MA 02110
Born 1969 | | Treasurer (2011) and Chief Financial Officer (2009) | | Vice President — Mutual Fund Administration, Columbia Management Investment Advisers, LLC, since May 2010; Managing Director of Fund Administration, Columbia Management Advisors, LLC, September 2004-April 2010; and senior officer of Columbia Funds and affiliated funds since 2002 | |
Scott R. Plummer
5228 Ameriprise Financial Center
Minneapolis, MN 55474
Born 1959 | | Senior Vice President (2006), Chief Legal Officer (2006) and Assistant Secretary (2011) | | Senior Vice President and Assistant General Counsel — Global Asset Management, Ameriprise Financial since February 2014 (previously, Senior Vice President and Lead Chief Counsel — Asset Management, 2012-February 2014; Vice President and Lead Chief Counsel — Asset Management, 2010-2012; and Vice President and Chief Counsel — Asset Management, 2005-2010); Senior Vice President, Chief Legal Officer and Assistant Secretary, Columbia Management Investment Advisers, LLC since June 2005; Vice President, Chief Counsel and Assistant Secretary, Columbia Management Investment Distributors, Inc. since 2008; Vice President, General Counsel and Secretary, Ameriprise Certificate Company since 2005; Chief Counsel, RiverSource Distributors, Inc. since 2006; senior officer of Columbia Funds and affiliated funds since 2006 | |
Thomas P. McGuire
225 Franklin Street
Boston, MA 02110
Born 1972 | | Chief Compliance Officer (2012) | | Vice President — Asset Management Compliance, Ameriprise Financial, Inc. since May 2010; Chief Compliance Officer, Ameriprise Certificate Company, since September 2010; Compliance Executive, Bank of America, 2005-April 2010 | |
Colin Moore
225 Franklin Street
Boston, MA 02110
Born 1958 | | Senior Vice President (2010) | | Executive Vice President and Global Chief Investment Officer, Ameriprise Financial, Inc. since July 2013; Director and Global Chief Investment Officer, Columbia Management Investment Advisers, LLC since May 2010; Manager, Managing Director and Chief Investment Officer, Columbia Management Advisors, LLC, 2007-April 2010 | |
Michael E. DeFao
225 Franklin Street
Boston, MA 02110
Born 1968 | | Vice President (2011) and Assistant Secretary (2010) | | Vice President and Chief Counsel, Ameriprise Financial, Inc. since May 2010; Associate General Counsel, Bank of America 2005-April 2010 | |
Joseph F. DiMaria
225 Franklin Street
Boston, MA 02110
Born 1968 | | Vice President (2011) and Chief Accounting Officer (2008) | | Vice President — Mutual Fund Treasurer, Columbia Management Investment Advisers, LLC since May 2010; Director of Fund Administration, Columbia Management Advisors, LLC, 2006-April 2010 | |
Paul B. Goucher
100 Park Avenue
New York, NY 10017
Born 1968 | | Vice President (2011) and Assistant Secretary (2008) | | Vice President and Lead Chief Counsel, Ameriprise Financial, Inc. since November 2008 and January 2013, respectively (previously Chief Counsel, January 2010-January 2013, and Group Counsel, November 2008-January 2010); Director, Managing Director and General Counsel, J. & W. Seligman & Co. Incorporated, July 2008-November 2008 | |
Amy Johnson
5228 Ameriprise Financial
Center
Minneapolis, MN 55474
Born 1965 | | Vice President (2006) | | Managing Director and Chief Operating Officer, Columbia Management Investment Advisers, LLC since May 2010 (previously Chief Administrative Officer, 2009-April 2010, and Vice President — Asset Management and Trust Company Services, 2006-2009) | |
Annual Report 2014
34
Columbia North Carolina Intermediate Municipal Bond Fund
Trustees and Officers (continued)
Officers (continued)
Name,
Address and
Year of Birth | | Position and Year
First Appointed to
Position for any Fund
in the Columbia
Funds Complex or a
Predecessor Thereof | | Principal Occupation(s) During Past Five Years | |
Paul D. Pearson
5228 Ameriprise Financial
Center
Minneapolis, MN 55474
Born 1956 | | Vice President (2011) and Assistant Treasurer (1999) | | Vice President — Investment Accounting, Columbia Management Investment Advisers, LLC since May 2010; Vice President — Managed Assets, Investment Accounting, Ameriprise Financial, Inc., 1998-April 2010 | |
Christopher O. Petersen
5228 Ameriprise Financial
Center
Minneapolis, MN 55474
Born 1970 | | Vice President and Secretary (2010) | | Vice President and Chief Counsel, Ameriprise Financial, Inc., since January 2010 (previously Vice President and Group Counsel or Counsel, 2004-January 2010); officer of Columbia Funds and affiliated funds since 2007 | |
Stephen T. Welsh
225 Franklin Street
Boston, MA 02110
Born 1957 | | Vice President (2006) | | President and Director, Columbia Management Investment Services Corp. since May 2010; President and Director, Columbia Management Services, Inc., 2004-April 2010; Managing Director, Columbia Management Distributors, Inc., 2007-April 2010 | |
Annual Report 2014
35
Columbia North Carolina Intermediate Municipal Bond Fund
Approval of Investment Management Services
Agreement
Columbia Management Investment Advisers, LLC (Columbia Management or the Investment Manager), a wholly-owned subsidiary of Ameriprise Financial, Inc. (Ameriprise Financial), serves as the investment manager to Columbia North Carolina Intermediate Municipal Bond Fund (the Fund). Under an investment management services agreement (the IMS Agreement), Columbia Management provides investment advice and other services to the Fund and other funds distributed by Columbia Management Investment Distributors, Inc. (collectively, the Funds).
On an annual basis, the Fund's Board of Trustees (the Board), including the independent Board members (the Independent Trustees), considers renewal of the IMS Agreement. Columbia Management prepared detailed reports for the Board and its Contracts Committee in January, March and April 2014, including reports based on analyses of data provided by an independent organization (Lipper) and a comprehensive response to each item of information requested by independent legal counsel to the Independent Trustees (Independent Legal Counsel) in a letter to the Investment Manager, to assist the Board in making this determination. All of the materials presented in January, March and April were first supplied in draft form to designated representatives of the Independent Trustees, i.e., Independent Legal Counsel, Fund Counsel, the Chair of the Board and the Chair of the Contracts Committee, and the final materials (including proposed expense caps for certain Funds) were revised to reflect discussion and subsequent requests made by the Contracts Committee. In addition, throughout the year, the Board (or its committees) regularly meets with portfolio management teams and senior management personnel, and reviews information prepared by Columbia Management addressing the services Columbia Management provides and Fund performance. The Board also accords appropriate weight to the work, deliberations and conclusions of the Contracts Committee, the Investment Review Committee and the Compliance Committee in determining whether to continue the IMS Agreement.
The Board, at its April 9-11, 2014 in-person Board meeting (the April Meeting), considered the renewal of the IMS Agreement for an additional one-year term. At the April Meeting, Independent Legal Counsel reviewed with the Independent Trustees various factors relevant to the Board's consideration of advisory agreements and the Board's legal responsibilities related to such consideration. Following an analysis and discussion of the factors identified below, the Board, including all of the Independent Trustees, approved the renewal of the IMS Agreement.
Nature, Extent and Quality of Services Provided by Columbia Management
The Independent Trustees analyzed various reports and presentations they had received detailing the services performed by Columbia Management, as well as its expertise, resources and capabilities. The Independent Trustees specifically considered many developments during the past year concerning the services provided by Columbia Management, including, in particular, the successful implementation of a globalization initiative, which, among other things, increased worldwide analyst support for global products, the reorganization of the Informational Technology research team, the hiring of additional personnel to assist the Asset Allocation team and the global restructuring of the Senior Operational team. The Independent Trustees noted the information they received concerning Columbia Management's ability to retain its key portfolio management personnel. The Independent Trustees also recalled Columbia Management's representation that additional staff has been added to support the vigorous application of the "5P" review process, to which all internally-managed Funds are subject.
In connection with the Board's evaluation of the overall package of services provided by Columbia Management, the Board also considered the quality of administrative services provided to the Fund by Columbia Management, recalling the information it received highlighting significant achievements in 2013 in the performance of administrative services. In evaluating the quality of services provided under the IMS Agreement and the Fund's Administrative Services Agreement, the Independent Trustees also took into account the organization and strength of the Fund's and its service providers' compliance programs. In addition, the Board also reviewed the financial condition of Columbia Management (and its affiliates) and each entity's ability to carry out its responsibilities under the IMS Agreement and the Fund's other services agreements with affiliates of Ameriprise Financial, observing the financial strength of Ameriprise Financial, with its solid balance sheet. The Board also discussed the acceptability of the terms of the IMS Agreement (including the relatively broad scope of services required to be performed by Columbia Management). The Board concluded that the services being performed under the IMS Agreement were of a reasonably high quality.
Based on the foregoing, and based on other information received (both oral and written, including the information on investment performance referenced below) and other considerations, the Board concluded that Columbia Management and its affiliates were in a position to continue to provide a high quality and level of services to the Fund.
Annual Report 2014
36
Columbia North Carolina Intermediate Municipal Bond Fund
Approval of Investment Management Services Agreement (continued)
Investment Performance
For purposes of evaluating the nature, extent and quality of services provided under the IMS Agreement, the Board carefully reviewed the investment performance of the Fund. In this regard, the Board considered detailed reports providing the results of analyses performed by an independent organization showing, for various periods, the performance of the Fund, the performance of a benchmark index, the percentage ranking of the Fund among its comparison group and the net assets of the Fund. The Board observed that the Fund's investment performance met expectations.
Comparative Fees, Costs of Services Provided and the Profits Realized By Columbia Management and its Affiliates from their Relationships with the Fund
The Board reviewed comparative fees and the costs of services provided under the IMS Agreement. The Board members considered detailed comparative information set forth in an annual report on fees and expenses, including, among other things, data (based on analyses conducted by an independent organization) showing a comparison of the Fund's expenses with median expenses paid by funds in its comparative peer universe, as well as data showing the Fund's contribution to Columbia Management's profitability.
The Board accorded particular weight to the notion that the level of fees should reflect a rational pricing model applied consistently across the various product lines in the Fund family, while assuring that the overall fees for each Fund (with few defined exceptions) are generally in line with the "pricing philosophy" currently in effect (i.e., that the total expense ratio of the Fund is no higher than the median expense ratio of funds in the same comparison universe of the Fund). In this connection, the Board also considered the 2013 report provided by an independent consulting firm, Bobroff Consulting (the Independent Consultant), that concluded that the Funds' standardized investment management fee rates were within a reasonable range. The Board took into account that the Fund's total expense ratio (after considering proposed voluntary expense caps/waivers) approximated the peer universe's median expense ratio. It was observed that various proposals concerning the Funds' transfer agency and sub-transfer agency fee structures, and other changes impacting the Funds' pricing structure and fees, are expected to be considered at a later Board meeting which, if adopted, would alter the current pricing philosophy. Based on its review, the Board concluded that the Fund's management fee was fair and reasonable in light of the extent and quality of services that the Fund receives.
The Board also considered the expected profitability of Columbia Management and its affiliates in connection with Columbia Management providing investment management services to the Fund. In this regard, the Board referred to a detailed profitability report, discussing the profitability to Columbia Management and Ameriprise Financial from managing, operating and distributing the Funds. In this regard, the Board observed that: (i) the Independent Consultant concluded that 2012 profitability was reasonable; (ii) 2013 profitability only moderately exceeded 2012 levels; and (iii) 2013 profitability is in line with profitability levels of industry competitors. It also took into account the indirect economic benefits flowing to Columbia Management or its affiliates in connection with managing or distributing the Funds, such as the enhanced ability to offer various other financial products to Ameriprise Financial customers, soft dollar benefits and overall reputational advantages. The Board noted that the fees paid by the Funds should permit the Investment Manager to offer competitive compensation to its personnel, make necessary investments in its business and earn an appropriate profit. The Board concluded that profitability levels were reasonable.
Economies of Scale to be Realized
The Board also considered the economies of scale that might be realized by Columbia Management as the Fund grows and took note of the extent to which Fund shareholders might also benefit from such growth. In this regard, the Independent Trustees took into account that IMS fees decline as Fund assets exceed various breakpoints, all of which have not been surpassed.
Based on the foregoing, the Board, including all of the Independent Trustees, concluded that the investment management service fees were fair and reasonable in light of the extent and quality of services provided. In reaching this conclusion, no single factor was determinative. On April 11, 2014, the Board, including all of the Independent Trustees, approved the renewal of the IMS Agreement.
Annual Report 2014
37
This page intentionally left blank.
Annual Report 2014
38
This page intentionally left blank.
Annual Report 2014
39
This page intentionally left blank.
Annual Report 2014
40
Columbia North Carolina Intermediate Municipal Bond Fund
Important Information About This Report
Each fund mails one shareholder report to each shareholder address. If you would like more than one report, please call shareholder services at 800.345.6611 and additional reports will be sent to you.
The policy of the Board is to vote the proxies of the companies in which each fund holds investments consistent with the procedures as stated in the Statement of Additional Information (SAI). You may obtain a copy of the SAI without charge by calling 800.345.6611; contacting your financial intermediary; visiting columbiamanagement.com; or searching the website of the Securities and Exchange Commission (SEC) at sec.gov. Information regarding how each fund voted proxies relating to portfolio securities is filed with the SEC by August 31 for the most recent 12-month period ending June 30 of that year, and is available without charge by visiting columbiamanagement.com; or searching the website of the SEC at sec.gov.
Each fund files a complete schedule of portfolio holdings with the SEC for the first and third quarters of each fiscal year on Form N-Q. Each fund's Form N-Q is available on the SEC's website at sec.gov and may be reviewed and copied at the SEC's Public Reference Room in Washington, D.C. Information on the operation of the Public Reference Room may be obtained by calling 800.SEC.0330. Each fund's complete schedule of portfolio holdings, as filed on Form N-Q, can also be obtained without charge, upon request, by calling 800.345.6611.
Annual Report 2014
41

Columbia North Carolina Intermediate Municipal Bond Fund
P.O. Box 8081
Boston, MA 02266-8081
columbiamanagement.com
This information is for use with concurrent or prior delivery of a fund prospectus. Please read and consider the investment objectives, risks, charges and expenses for any fund carefully before investing. For a prospectus and, if available, a summary prospectus, which contains this and other important information about the Fund go to columbiamanagement.com. The Fund is distributed by Columbia Management Investment Distributors, Inc., member FINRA, and managed by Columbia Management Investment Advisers, LLC.
© 2014 Columbia Management Investment Advisers, LLC. All rights reserved.
ANN206_04_D01_(06/14)
Annual Report
April 30, 2014

Columbia South Carolina Intermediate Municipal Bond Fund
(renamed Columbia AMT-Free South Carolina Intermediate Muni Bond Fund, effective July 7, 2014)
Not FDIC insured • No bank guarantee • May lose value
 Dear Shareholders,
Continued Economic Recovery
The U.S. economy continued to recover at a slow but steady pace during the first quarter of 2014, supported by solid manufacturing activity, reasonable job growth and continued gains for the housing market. Industrial production was robust, buoyed by strong demand for autos and related parts. After a disappointing January, job growth picked up, which helped boost consumer confidence. Housing data was somewhat mixed, as harsh weather and higher mortgage rates put a damper on sales, while lower inventories helped prices trend higher. The Federal Reserve (the Fed) announced further reductions to its monthly asset purchases and reassured the markets that it would not make any significant changes to monetary policy until it was satisfied that the labor market was on solid ground. Despite mostly good news on the economic front, the broad financial markets recorded only modest gains, as bitter winter weather at home and mounting tensions between Russia and Western allies prompted investor caution.
Investors braced for higher interest rates, but long-term yields declined and the fixed-income markets were surprisingly resilient in the face of stable-to-improving economic data. Risk-on trading continued during the quarter as the higher yielding sectors of the fixed-income markets generally fared well. Emerging-market bonds, long-term U.S. Treasuries and sovereign debt were among the strongest performers, as were Treasury Inflation Protected Securities. Municipal bonds delivered solid gains, especially high-yield municipals, which benefited from continued improvement in state finances.
Against this backdrop, the broad bond market, as measured by the Barclays U.S. Aggregate Bond Index, edged out the broad stock market, as measured by the Standard & Poor's 500 Index, with gains of 1.84% vs. 1.81%, respectively. As indicated late last year, the Fed began tapering its monthly asset purchase program and announced further reductions. New Fed chair Janet Yellen reassured investors the Fed was committed to keeping short-term borrowing rates low into 2015.
Stay on Track with Columbia Management
Backed by more than 100 years of experience, Columbia Management is one of the nation's largest asset managers. At the heart of our success and, most importantly, that of our investors, are highly talented industry professionals, brought together by a unique way of working. At Columbia Management, reaching our performance goals matters, and how we reach them matters just as much.
Visit columbiamanagement.com for:
> The Columbia Management Perspectives blog, offering insights on current market events and investment opportunities
> Detailed up-to-date fund performance and portfolio information
> Quarterly fund commentaries
> Columbia Management investor, our award-winning quarterly newsletter for shareholders
Thank you for your continued support of the Columbia Funds. We look forward to serving your investment needs for many years to come.
Best Regards,

J. Kevin Connaughton
President, Columbia Funds
Investing involves risk including the risk of loss of principal.
The Barclays U.S. Aggregate Bond Index is a broad-based benchmark that measures the investment grade, U.S. dollar denominated, fixed-rate taxable bond market, including Treasuries, government-related and corporate securities, mortgage-backed securities (agency fixed-rate and hybrid adjustable-rate mortgage passthroughs), asset-backed securities, and commercial mortgage-backed securities. The S&P 500 Index, an unmanaged index, measures the performance of 500 widely held, large-capitalization U.S. stocks and is frequently used as a general measure of market performance. Indices are not available for investment, are not professionally managed and do not reflect sales charges, fees, brokerage commissions, taxes or other expenses of investing.
Investors should consider the investment objectives, risks, charges and expenses of a mutual fund carefully before investing. For a free prospectus and, if available, a summary prospectus, which contains this and other important information about a fund, visit columbiamanagement.com. The prospectus should be read carefully before investing.
Columbia Funds are distributed by Columbia Management Investment Distributors, Inc., member FINRA, and managed by Columbia Management Investment Advisers, LLC.
© 2014 Columbia Management Investment Advisers, LLC. All rights reserved.
Columbia South Carolina Intermediate Municipal Bond Fund
Performance Overview | | | 2 | | |
Manager Discussion of Fund Performance | | | 4 | | |
Understanding Your Fund's Expenses | | | 6 | | |
Portfolio of Investments | | | 7 | | |
Statement of Assets and Liabilities | | | 12 | | |
Statement of Operations | | | 14 | | |
Statement of Changes in Net Assets | | | 15 | | |
Financial Highlights | | | 17 | | |
Notes to Financial Statements | | | 22 | | |
Report of Independent Registered
Public Accounting Firm | | | 27 | | |
Federal Income Tax Information | | | 28 | | |
Trustees and Officers | | | 29 | | |
Approval of Investment Management Services Agreement | | | 35 | | |
Important Information About This Report | | | 37 | | |
Fund Investment Manager
Columbia Management Investment
Advisers, LLC
225 Franklin Street
Boston, MA 02110
Fund Distributor
Columbia Management Investment
Distributors, Inc.
225 Franklin Street
Boston, MA 02110
Fund Transfer Agent
Columbia Management Investment
Services Corp.
P.O. Box 8081
Boston, MA 02266-8081
For more information about any of the funds, please visit columbiamanagement.com or call 800.345.6611. Customer Service Representatives are available to answer your questions Monday through Friday from 8 a.m. to 7 p.m. Eastern time.
The views expressed in this report reflect the current views of the respective parties. These views are not guarantees of future performance and involve certain risks, uncertainties and assumptions that are difficult to predict, so actual outcomes and results may differ significantly from the views expressed. These views are subject to change at any time based upon economic, market or other conditions and the respective parties disclaim any responsibility to update such views. These views may not be relied on as investment advice and, because investment decisions for a Columbia Fund are based on numerous factors, may not be relied on as an indication of trading intent on behalf of any particular Columbia Fund. References to specific securities should not be construed as a recommendation or investment advice.
Columbia South Carolina Intermediate Municipal Bond Fund
Performance Summary
> Columbia South Carolina Intermediate Municipal Bond Fund (the Fund) Class A shares returned -0.66% excluding sales charges for the 12-month period that ended April 30, 2014. Class Z shares of the Fund returned -0.32% for the same time period.
> The Fund's benchmark, the Barclays 3-15 Year Blend Municipal Bond Index, returned 0.97% for the 12-month period.
> The Fund's maturity positioning generally accounted for its shortfall relative to its benchmark.
Average Annual Total Returns (%) (for period ended April 30, 2014)
| | Inception | | 1 Year | | 5 Years | | 10 Years | |
Class A | | 05/05/92 | | | | | | | | | | | | | |
Excluding sales charges | | | | | | | -0.66 | | | | 4.29 | | | | 3.68 | | |
Including sales charges | | | | | | | -3.93 | | | | 3.61 | | | | 3.34 | | |
Class B | | 06/08/93 | | | | | | | | | | | | | |
Excluding sales charges | | | | | | | -1.31 | | | | 3.53 | | | | 2.92 | | |
Including sales charges | | | | | | | -4.20 | | | | 3.53 | | | | 2.92 | | |
Class C | | 06/17/92 | | | | | | | | | | | | | |
Excluding sales charges | | | | | | | -1.31 | | | | 3.53 | | | | 2.91 | | |
Including sales charges | | | | | | | -2.27 | | | | 3.53 | | | | 2.91 | | |
Class R4* | | 03/19/13 | | | -0.32 | | | | 4.56 | | | | 3.94 | | |
Class Z | | 01/06/92 | | | -0.32 | | | | 4.56 | | | | 3.94 | | |
Barclays 3-15 Year Blend Municipal Bond Index | | | | | 0.97 | | | | 4.91 | | | | 4.71 | | |
Returns for Class A are shown with and without the maximum initial sales charge of 3.25%. Returns for Class B are shown with and without the applicable contingent deferred sales charge (CDSC) of 3.00% in the first year, declining to 1.00% in the fourth year and eliminated thereafter. Returns for Class C are shown with and without the 1.00% CDSC for the first year only. The Fund's other classes are not subject to sales charges and have limited eligibility. Please see the Fund's prospectus for details. Performance for different share classes will vary based on differences in sales charges and fees associated with each class. All results shown assume reinvestment of distributions during the period. Returns do not reflect the deduction of taxes that a shareholder may pay on Fund distributions or on the redemption of Fund shares. Performance results reflect the effect of any fee waivers or reimbursements of Fund expenses by Columbia Management Investment Advisers, LLC and/or any of its affiliates. Absent these fee waivers or expense reimbursement arrangements, performance results would have been lower.
The performance information shown represents past performance and is not a guarantee of future results. The investment return and principal value of your investment will fluctuate so that your shares, when redeemed, may be worth more or less than their original cost. Current performance may be lower or higher than the performance information shown. You may obtain performance information current to the most recent month-end by contacting your financial intermediary, visiting columbiamanagement.com or calling 800.345.6611.
*The returns shown for periods prior to the share class inception date (including returns for the Life of the Fund, if shown, which are since Fund inception) include the returns of the Fund's oldest share class. These returns are adjusted to reflect any higher class-related operating expenses of the newer share classes, as applicable. Please visit columbiamanagement.com/mutual-funds/appended-performance for more information.
The Barclays 3-15 Year Blend Municipal Bond Index is an unmanaged index that tracks the performance of municipal bonds issued after December 31, 1990, with remaining maturities between 2 and 17 years and at least $7 million in principal amount outstanding.
Indices are not available for investment, are not professionally managed and do not reflect sales charges, fees, brokerage commissions, taxes or other expenses of investing. Securities in the Fund may not match those in an index.
Annual Report 2014
2
Columbia South Carolina Intermediate Municipal Bond Fund
Performance Overview (continued)
Performance of a Hypothetical $10,000 Investment (May 1, 2004 – April 30, 2014)
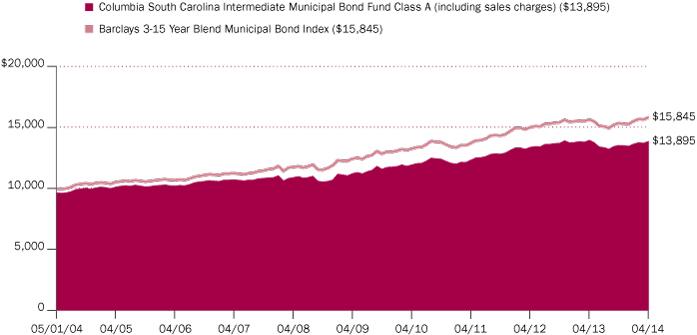
The chart above shows the change in value of a hypothetical $10,000 investment in Class A shares of Columbia South Carolina Intermediate Municipal Bond Fund during the stated time period, and does not reflect the deduction of taxes that a shareholder may pay on Fund distributions or on the redemption of Fund shares.
Annual Report 2014
3
Columbia South Carolina Intermediate Municipal Bond Fund
Manager Discussion of Fund Performance
Effective July 7, 2014, the Fund will be renamed Columbia AMT-Free South Carolina Intermediate Muni Bond Fund.
For the 12-month period that ended April 30, 2014, the Fund's Class A shares returned -0.66% excluding sales charges. Class Z shares of the Fund returned -0.32% for the same time period. The Fund's benchmark, the Barclays 3-15 Year Blend Municipal Bond Index, returned 0.97% for the 12-month period. The Fund's maturity positioning generally accounted for its shortfall relative to its benchmark. We shortened the Fund's duration, a measure of interest rate sensitivity, in response to rising interest rates and to meet redemptions. As a result, we missed some of the rally as rates stabilized then declined over the last four months of the period.
Stable Economic Growth
Even though a difficult winter weighed on the U.S. economy early in 2014, it was not enough to derail the steady growth that marked the 12-month period. Solid new job growth drove the unemployment rate down to 6.3%. Robust manufacturing activity boosted the nation's capacity utilization rate to a recovery high of 79.2%. Personal income edged higher, borrowing increased and the savings rate declined. Consumer confidence generally rose during the 12-month period, reflecting consumer expectations that the economy was on solid ground. The housing market lost some momentum, the victim of bad winter weather, tighter borrowing standards, rising prices and higher mortgage rates. However, higher pending home sales near the end of the period was a positive data point.
Investors welcomed reduced tensions in Washington, where an extended budget deal and the president's nomination of Janet Yellen as the new Federal Reserve (Fed) chair received bipartisan support. In December 2013, the Fed announced that it would take a measured approach to tapering its monthly bond-buying program, beginning in January 2014. Further tapering commenced in February, March and April. Against this backdrop of generally positive economic news, bonds lost some ground as interest rates moved higher. Nevertheless, the municipal market managed a modestly positive return for the period.
A Challenging Environment for the Municipal Market
Municipal yields followed Treasury yields higher from the beginning of the reporting period through early September 2013. A rapid selloff in the wake of climbing yields sent municipal bond fund shares downward, causing heavy selling pressure, which persisted through the end of the calendar year. The environment improved in the first four months of 2014. Fund outflows slowed, state and local revenues improved, demand for shorter-maturity municipal bonds remained strong and new issuance declined sharply. Through April, new bond issuance was down by 30% compared to the same period in 2013, and refunding volume dropped by more than 50%. For the 12 months covered by this report, the best returns came from bonds with two- to four-year maturities. Ten-year maturities were the worst performers. Generally speaking, lower quality bonds generated slightly higher returns than higher quality bonds.
Contributors and Detractors
The Fund's holdings in the two- to six-year maturity range did better than their benchmark counterparts, which aided results even though the Fund was significantly underweight in the maturity segment. The Fund's electric revenue
Portfolio Management
Brian McGreevy
Quality Breakdown (%)
(at April 30, 2014) | |
AAA rating | | | 2.5 | | |
AA rating | | | 40.0 | | |
A rating | | | 49.8 | | |
BBB rating | | | 4.7 | | |
Not rated | | | 3.0 | | |
Total | | | 100.0 | | |
Percentages indicated are based upon total fixed income securities (excluding Money Market Funds).
Bond ratings apply to the underlying holdings of the Fund and not the Fund itself and are divided into categories ranging from AAA (highest) to D (lowest), and are subject to change. The ratings shown are determined by using the middle rating of Moody's, S&P, and Fitch after dropping the highest and lowest available ratings. When a rating from only two agencies is available, the lower rating is used. When a rating from only one agency is available, that rating is used. When a bond is not rated by one of these agencies, it is designated as Not rated. Credit ratings are subjective opinions and not statements of fact.
Investment Risks
There are risks associated with an investment in this Fund, including market risk, credit risk, interest rate risk prepayment and extension risk and state-specific municipal securities risk. In general, bond prices rise when interest rates fall and vice versa. Because the Fund concentrates its investments in municipal securities issued by a single state and its municipalities, specific events or factors affecting a particular state can cause more volatility in the Fund than a fund that is more geographically diversified. This effect is more pronounced for longer-term securities. Non-investment grade securities, commonly called 'high-yield' or 'junk' bonds, have more volatile prices and carry more risk to principal and income than investment grade securities. See the Fund's prospectus for information on these and other risks associated with Fund. Income from tax-exempt funds may be subject to state and local taxes. Federal and state income tax rules will apply to any capital gain distributions and any gains or losses on sales.
Annual Report 2014
4
Columbia South Carolina Intermediate Municipal Bond Fund
Manager Discussion of Fund Performance (continued)
bonds also generated returns that were better than the benchmark. An underweight in issues rated AAA was also positive for the Fund, as higher quality names underperformed. These gains were more than offset by the impact of the Fund's maturity positioning. A heavier weight in eight- to 12-year maturities was a drag on performance as this was the worst performing area of the benchmark. An underweight in 12- to 17-year maturities was a source of underperformance as the market improved. The Fund had only one position in Puerto Rican bonds, but it was a drag on performance. It was sold near the end of the period. Education and local general obligation bonds were a source of underperformance as both experienced negative returns. Hospital credits, where the Fund was overweight, performed in line with the benchmark.
South Carolina's Economy Set to Outperform
South Carolina has kept pace with the nation's economic recovery. Job growth has been strong, and wage and salary growth has picked up. The performance of the leisure/hospitality sector has been stronger than expected. Overall, the state's unemployment rate is at a six-year low of 5.7%. In addition, the manufacturing sector is expected to remain an important part of the South Carolina economy, because of low labor costs, low unionization rates and the state's willingness to offer aggressive tax incentives to attract manufacturing business. The scaling back of federal sequestration also stands to benefit South Carolina more than other states. As a result, we currently expect South Carolina to outperform over the next several years. Health care and retail should be particularly robust. Long term, we believe a favorable business climate and strong population growth stand to make South Carolina an above-average outperformer.
Looking Ahead
So far, we believe 2014 is lining up to be a better year for the municipal market than 2013. More recent returns have been better than they were in 2013, especially for longer-term municipal bonds. Even though we presently expect interest rates to continue to rise gradually through the end of 2014, we believe that the taxable equivalent yield on municipals is still attractive to investors who are subject to higher federal tax rates. In this environment, we have currently positioned the Fund with neutral duration relative to the benchmark and with greater emphasis on issues rated A and BBB, which we believe have the potential to offer more value in an environment of slow but improving economic growth.
Annual Report 2014
5
Columbia South Carolina Intermediate Municipal Bond Fund
Understanding Your Fund's Expenses
(Unaudited)
As an investor, you incur two types of costs. There are transaction costs, which generally include sales charges on purchases and may include redemption fees. There are also ongoing costs, which generally include management fees, distribution and/or service fees, and other fund expenses. The following information is intended to help you understand your ongoing costs (in dollars) of investing in the Fund and to help you compare these costs with the ongoing costs of investing in other mutual funds.
Analyzing Your Fund's Expenses
To illustrate these ongoing costs, we have provided examples and calculated the expenses paid by investors in each share class of the Fund during the period. The actual and hypothetical information in the table is based on an initial investment of $1,000 at the beginning of the period indicated and held for the entire period. Expense information is calculated two ways and each method provides you with different information. The amount listed in the "Actual" column is calculated using the Fund's actual operating expenses and total return for the period. You may use the Actual information, together with the amount invested, to estimate the expenses that you paid over the period. Simply divide your account value by $1,000 (for example, an $8,600 account value divided by $1,000 = 8.6), then multiply the results by the expenses paid during the period under the "Actual" column. The amount listed in the "Hypothetical" column assumes a 5% annual rate of return before expenses (which is not the Fund's actual return) and then applies the Fund's actual expense ratio for the period to the hypothetical return. You should not use the hypothetical account values and expenses to estimate either your actual account balance at the end of the period or the expenses you paid during the period. See "Compare With Other Funds" below for details on how to use the hypothetical data.
Compare With Other Funds
Since all mutual funds are required to include the same hypothetical calculations about expenses in shareholder reports, you can use this information to compare the ongoing cost of investing in the Fund with other funds. To do so, compare the hypothetical example with the 5% hypothetical examples that appear in the shareholder reports of other funds. As you compare hypothetical examples of other funds, it is important to note that hypothetical examples are meant to highlight the ongoing costs of investing in a fund only and do not reflect any transaction costs, such as sales charges, or redemption or exchange fees. Therefore, the hypothetical calculations are useful in comparing ongoing costs only, and will not help you determine the relative total costs of owning different funds. If transaction costs were included in these calculations, your costs would be higher.
November 1, 2013 – April 30, 2014
| | Account Value at the Beginning
of the Period ($) | | Account Value at the End
of the Period ($) | | Expenses Paid During
the Period ($) | | Fund's Annualized
Expense Ratio (%) | |
| | Actual | | Hypothetical | | Actual | | Hypothetical | | Actual | | Hypothetical | | Actual | |
Class A | | | 1,000.00 | | | | 1,000.00 | | | | 1,023.50 | | | | 1,020.78 | | | | 4.06 | | | | 4.06 | | | | 0.81 | | |
Class B | | | 1,000.00 | | | | 1,000.00 | | | | 1,019.70 | | | | 1,017.06 | | | | 7.81 | | | | 7.80 | | | | 1.56 | | |
Class C | | | 1,000.00 | | | | 1,000.00 | | | | 1,019.70 | | | | 1,017.06 | | | | 7.81 | | | | 7.80 | | | | 1.56 | | |
Class R4 | | | 1,000.00 | | | | 1,000.00 | | | | 1,024.80 | | | | 1,022.02 | | | | 2.81 | | | | 2.81 | | | | 0.56 | | |
Class Z | | | 1,000.00 | | | | 1,000.00 | | | | 1,024.80 | | | | 1,022.02 | | | | 2.81 | | | | 2.81 | | | | 0.56 | | |
Expenses paid during the period are equal to the annualized expense ratio for each class as indicated above, multiplied by the average account value over the period and then multiplied by the number of days in the Fund's most recent fiscal half year and divided by 365.
Expenses do not include fees and expenses incurred indirectly by the Fund from the underlying funds in which the Fund may invest (also referred to as "acquired funds"), including affiliated and non-affiliated pooled investment vehicles (including mutual funds and exchange-traded funds).
Had Columbia Management Investment Advisers, LLC and/or certain of its affiliates not waived/reimbursed certain fees and expenses, account value at the end of the period would have been reduced.
Annual Report 2014
6
Columbia South Carolina Intermediate Municipal Bond Fund
Portfolio of Investments
April 30, 2014
(Percentages represent value of investments compared to net assets)
Municipal Bonds 95.6%
Issue
Description | | Coupon
Rate | | Principal
Amount ($) | |
Value ($) | |
Airport 2.3% | |
County of Horry
Revenue Bonds
Series 2010A
07/01/18 | | | 5.000 | % | | | 1,315,000 | | | | 1,484,964 | | |
07/01/20 | | | 5.000 | % | | | 1,150,000 | | | | 1,318,371 | | |
Total | | | | | | | 2,803,335 | | |
Higher Education 4.0% | |
Florence-Darlington Commission for Technical Education
Revenue Bonds
Series 2005A (NPFGC)
03/01/20 | | | 5.000 | % | | | 1,905,000 | | | | 1,971,275 | | |
University of South Carolina
Revenue Bonds
Moore School of Business Project
Series 2012
05/01/26 | | | 5.000 | % | | | 1,500,000 | | | | 1,731,675 | | |
Series 2008A (AGM)
06/01/21 | | | 5.000 | % | | | 1,060,000 | | | | 1,207,912 | | |
Total | | | | | | | 4,910,862 | | |
Hospital 17.6% | |
County of Charleston
Revenue Bonds
Care Alliance Health Services
Series 1999A (AGM)
08/15/15 | | | 5.125 | % | | | 2,000,000 | | | | 2,110,120 | | |
County of Greenwood
Refunding Revenue Bonds
Self Regional Healthcare
Series 2012B
10/01/27 | | | 5.000 | % | | | 1,750,000 | | | | 1,910,230 | | |
10/01/31 | | | 5.000 | % | | | 2,000,000 | | | | 2,167,020 | | |
Greenville Hospital System Board
Refunding Revenue Bonds
Series 2008A
05/01/21 | | | 5.250 | % | | | 2,750,000 | | | | 3,132,332 | | |
Lexington County Health Services District, Inc.
Refunding Revenue Bonds
Series 2007
11/01/17 | | | 5.000 | % | | | 1,230,000 | | | | 1,395,115 | | |
11/01/18 | | | 5.000 | % | | | 1,000,000 | | | | 1,121,760 | | |
South Carolina Jobs-Economic Development Authority
Refunding Revenue Bonds
Anmed Health Project
Series 2010
02/01/17 | | | 5.000 | % | | | 1,000,000 | | | | 1,102,280 | | |
Palmetto Health
Series 2005A (AGM)
08/01/21 | | | 5.250 | % | | | 3,000,000 | | | | 3,286,980 | | |
Municipal Bonds (continued)
Issue
Description | | Coupon
Rate | | Principal
Amount ($) | |
Value ($) | |
Revenue Bonds
Bon Secours Health System, Inc.
Series 2013
11/01/20 | | | 5.000 | % | | | 2,000,000 | | | | 2,273,480 | | |
Kershaw County Medical Center Project
Series 2008
09/15/25 | | | 5.500 | % | | | 1,925,000 | | | | 2,040,211 | | |
Spartanburg Regional Health Services District
Revenue Bonds
Series 2008A
04/15/19 | | | 5.000 | % | | | 1,225,000 | | | | 1,375,455 | | |
Total | | | | | | | 21,914,983 | | |
Investor Owned 0.9% | |
County of Oconee
Refunding Revenue Bonds
Duke Power Co. Project
Series 2009
02/01/17 | | | 3.600 | % | | | 1,000,000 | | | | 1,073,600 | | |
Joint Power Authority 8.4% | |
City of Easley
Refunding Revenue Bonds
Series 2011 (AGM)
12/01/28 | | | 5.000 | % | | | 1,000,000 | | | | 1,113,180 | | |
Piedmont Municipal Power Agency
Refunding Revenue Bonds
Series 2008A-3 (AGM)
01/01/17 | | | 5.000 | % | | | 2,000,000 | | | | 2,216,900 | | |
01/01/18 | | | 5.000 | % | | | 3,050,000 | | | | 3,458,913 | | |
South Carolina State Public Service Authority
Refunding Revenue Bonds
Series 2009A
01/01/28 | | | 5.000 | % | | | 2,000,000 | | | | 2,215,600 | | |
Revenue Bonds
Series 2009B
01/01/24 | | | 5.000 | % | | | 1,250,000 | | | | 1,419,938 | | |
Total | | | | | | | 10,424,531 | | |
Local Appropriation 23.4% | |
Berkeley County School District
Revenue Bonds
Securing Assets for Education
Series 2006
12/01/20 | | | 5.000 | % | | | 1,000,000 | | | | 1,098,350 | | |
12/01/21 | | | 5.000 | % | | | 2,000,000 | | | | 2,191,320 | | |
12/01/22 | | | 5.000 | % | | | 3,545,000 | | | | 3,869,864 | | |
Charleston Educational Excellence Finance Corp.
Revenue Bonds
Charleston County School District Project
Series 2006
12/01/19 | | | 5.000 | % | | | 2,000,000 | | | | 2,217,280 | | |
The accompanying Notes to Financial Statements are an integral part of this statement.
Annual Report 2014
7
Columbia South Carolina Intermediate Municipal Bond Fund
Portfolio of Investments (continued)
April 30, 2014
Municipal Bonds (continued)
Issue
Description | | Coupon
Rate | | Principal
Amount ($) | |
Value ($) | |
City of North Charleston
Revenue Bonds
Series 2012
06/01/29 | | | 5.000 | % | | | 2,280,000 | | | | 2,515,592 | | |
Dorchester County School District No. 2
Refunding Revenue Bonds
Growth Installment Purchase
Series 2013
12/01/27 | | | 5.000 | % | | | 1,000,000 | | | | 1,136,500 | | |
Fort Mill School Facilities Corp.
Revenue Bonds
Series 2006
12/01/17 | | | 5.000 | % | | | 2,900,000 | | | | 3,164,190 | | |
Greenville County School District
Refunding Revenue Bonds
Building Equity Sooner Tomorrow
Series 2006
12/01/27 | | | 5.000 | % | | | 1,300,000 | | | | 1,412,203 | | |
Newberry Investing in Children's Education
Revenue Bonds
Newberry County School District Project
Series 2005
12/01/15 | | | 5.250 | % | | | 1,265,000 | | | | 1,349,553 | | |
Scago Educational Facilities Corp. for Pickens School District
Revenue Bonds
Pickens County Project
Series 2006 (AGM)
12/01/23 | | | 5.000 | % | | | 5,000,000 | | | | 5,458,200 | | |
12/01/24 | | | 5.000 | % | | | 2,000,000 | | | | 2,177,960 | | |
Sumter Two School Facilities, Inc.
Refunding Revenue Bonds
Sumter County School District No. 2
Series 2007
12/01/17 | | | 5.000 | % | | | 1,000,000 | | | | 1,131,520 | | |
Town of Hilton Head Island
Revenue Bonds
Series 2011A
06/01/23 | | | 5.000 | % | | | 555,000 | | | | 638,366 | | |
06/01/24 | | | 5.000 | % | | | 580,000 | | | | 662,053 | | |
Total | | | | | | | 29,022,951 | | |
Local General Obligation 5.8% | |
Anderson County School District No. 4
Unlimited General Obligation Bonds
Series 2006 (AGM)
03/01/19 | | | 5.250 | % | | | 1,115,000 | | | | 1,208,772 | | |
Beaufort County School District
Unlimited General Obligation Bonds
Series 2014B
03/01/23 | | | 5.000 | % | | | 1,190,000 | | | | 1,449,860 | | |
Municipal Bonds (continued)
Issue
Description | | Coupon
Rate | | Principal
Amount ($) | |
Value ($) | |
County of Charleston
Unlimited General Obligation Bonds
Improvement
Series 2009A
08/01/23 | | | 5.000 | % | | | 2,000,000 | | | | 2,338,460 | | |
Spartanburg County School District No. 7
Unlimited General Obligation Bonds
Series 2001
03/01/18 | | | 5.000 | % | | | 2,000,000 | | | | 2,221,180 | | |
Total | | | | | | | 7,218,272 | | |
Municipal Power 1.7% | |
City of Rock Hill
Refunding Revenue Bonds
Combined Utility System
Series 2012A (AGM)
01/01/23 | | | 5.000 | % | | | 1,560,000 | | | | 1,810,520 | | |
Guam Power Authority
Refunding Revenue Bonds
Series 2012A (AGM)(a)
10/01/24 | | | 5.000 | % | | | 315,000 | | | | 361,116 | | |
Total | | | | | | | 2,171,636 | | |
Ports 0.9% | |
South Carolina State Ports Authority
Revenue Bonds
Series 2010
07/01/23 | | | 5.250 | % | | | 1,000,000 | | | | 1,137,010 | | |
Prep School 0.4% | |
South Carolina Jobs-Economic Development Authority
Revenue Bonds
York Preparatory Academy Project
Series 2014A
11/01/33 | | | 7.000 | % | | | 500,000 | | | | 513,835 | | |
Refunded/Escrowed 1.0% | |
Puerto Rico Highways & Transportation Authority
Refunding Revenue Bonds
Series 2003AA Escrowed to Maturity (NPFGC)(a)
07/01/18 | | | 5.500 | % | | | 1,050,000 | | | | 1,243,883 | | |
Resource Recovery 2.0% | |
Three Rivers Solid Waste Authority(b)
Revenue Bonds
Capital Appreciation-Landfill Gas Project
Series 2007
10/01/24 | | | 0.000 | % | | | 1,835,000 | | | | 1,265,251 | | |
10/01/25 | | | 0.000 | % | | | 1,835,000 | | | | 1,200,879 | | |
Total | | | | | | | 2,466,130 | | |
The accompanying Notes to Financial Statements are an integral part of this statement.
Annual Report 2014
8
Columbia South Carolina Intermediate Municipal Bond Fund
Portfolio of Investments (continued)
April 30, 2014
Municipal Bonds (continued)
Issue
Description | | Coupon
Rate | | Principal
Amount ($) | |
Value ($) | |
Retirement Communities 3.4% | |
South Carolina Jobs-Economic Development Authority
Refunding Revenue Bonds
1st Mortgage-Episcopal Church
Series 2007
04/01/15 | | | 5.000 | % | | | 525,000 | | | | 539,417 | | |
04/01/16 | | | 5.000 | % | | | 600,000 | | | | 631,974 | | |
1st Mortgage-Lutheran Homes
Series 2007
05/01/16 | | | 5.000 | % | | | 1,245,000 | | | | 1,294,041 | | |
05/01/21 | | | 5.375 | % | | | 1,650,000 | | | | 1,707,931 | | |
Total | | | | | | | 4,173,363 | | |
Single Family 0.5% | |
South Carolina State Housing Finance & Development Authority
Revenue Bonds
Series 2010-1 (GNMA/FNMA/FHLMC)
01/01/28 | | | 5.000 | % | | | 610,000 | | | | 659,148 | | |
Special Non Property Tax 3.6% | |
City of Greenville
Improvement Refunding Bonds
Series 2011 (AGM)
04/01/21 | | | 5.000 | % | | | 1,290,000 | | | | 1,502,231 | | |
City of Myrtle Beach
Revenue Bonds
Hospitality Fee
Series 2014B
06/01/30 | | | 5.000 | % | | | 560,000 | | | | 623,795 | | |
City of Rock Hill
Revenue Bonds
Hospitality Fee Pledge
Series 2013
04/01/23 | | | 5.000 | % | | | 695,000 | | | | 814,797 | | |
Territory of Guam
Revenue Bonds
Series 2011A(a)
01/01/31 | | | 5.000 | % | | | 400,000 | | | | 415,984 | | |
Virgin Islands Public Finance Authority
Revenue Bonds
Senior Lien-Matching Fund Loan Note
Series 2010A(a)
10/01/25 | | | 5.000 | % | | | 1,060,000 | | | | 1,139,479 | | |
Total | | | | | | | 4,496,286 | | |
Student Loan 1.7% | |
South Carolina State Education Assistance Authority
Revenue Bonds
Student Loan
Series 2009I
10/01/24 | | | 5.000 | % | | | 2,015,000 | | | | 2,139,708 | | |
Municipal Bonds (continued)
Issue
Description | | Coupon
Rate | | Principal
Amount ($) | |
Value ($) | |
Transportation 4.7% | |
South Carolina Transportation Infrastructure Bank
Refunding Revenue Bonds
Series 2005A (AMBAC)
10/01/20 | | | 5.250 | % | | | 4,880,000 | | | | 5,817,936 | | |
Water & Sewer 13.3% | |
Anderson Regional Joint Water System
Refunding Revenue Bonds
Series 2012
07/15/28 | | | 5.000 | % | | | 2,000,000 | | | | 2,251,820 | | |
Beaufort-Jasper Water & Sewer Authority
Improvement Refunding Revenue Bonds
Series 2006 (AGM)
03/01/23 | | | 5.000 | % | | | 1,500,000 | | | | 1,682,055 | | |
03/01/25 | | | 4.750 | % | | | 3,000,000 | | | | 3,319,800 | | |
City of Charleston
Refunding Revenue Bonds
Waterworks & Sewer System
Series 2009A
01/01/21 | | | 5.000 | % | | | 2,500,000 | | | | 2,859,100 | | |
City of Columbia
Refunding Revenue Bonds
Waterworks & Sewer System
Series 2011A
02/01/27 | | | 5.000 | % | | | 1,000,000 | | | | 1,136,220 | | |
County of Berkeley Water & Sewer
Refunding Revenue Bonds
Series 2008A (AGM)
06/01/21 | | | 5.000 | % | | | 1,000,000 | | | | 1,141,240 | | |
Renewable Water Resources
Refunding Revenue Bonds
Series 2005B (AGM)
03/01/19 | | | 5.250 | % | | | 1,000,000 | | | | 1,177,220 | | |
Series 2010A
01/01/20 | | | 5.000 | % | | | 1,500,000 | | | | 1,761,105 | | |
Series 2012
01/01/24 | | | 5.000 | % | | | 1,000,000 | | | | 1,172,700 | | |
Total | | | | | | | 16,501,260 | | |
Total Municipal Bonds
(Cost: $110,717,667) | | | | | | | 118,688,729 | | |
The accompanying Notes to Financial Statements are an integral part of this statement.
Annual Report 2014
9
Columbia South Carolina Intermediate Municipal Bond Fund
Portfolio of Investments (continued)
April 30, 2014
Money Market Funds 3.4%
| | | Shares | | Value ($) | |
JPMorgan Tax-Free Money Market
Fund, 0.010%(c) | | | 4,282,828 | | | | 4,282,828 | | |
Total Money Market Funds
(Cost: $4,282,828) | | | | | 4,282,828 | | |
Total Investments
(Cost: $115,000,495) | | | | | 122,971,557 | | |
Other Assets & Liabilities, Net | | | | | 1,214,032 | | |
Net Assets | | | | | 124,185,589 | | |
Notes to Portfolio of Investments
(a) Municipal obligations include debt obligations issued by or on behalf of territories, possessions, or sovereign nations within the territorial boundaries of the United States. At April 30, 2014, the value of these securities amounted to $3,160,462 or 2.54% of net assets.
(b) Zero coupon bond.
(c) The rate shown is the seven-day current annualized yield at April 30, 2014.
Abbreviation Legend
AGM Assured Guaranty Municipal Corporation
AMBAC Ambac Assurance Corporation
FHLMC Federal Home Loan Mortgage Corporation
FNMA Federal National Mortgage Association
GNMA Government National Mortgage Association
NPFGC National Public Finance Guarantee Corporation
Fair Value Measurements
Generally accepted accounting principles (GAAP) require disclosure regarding the inputs and valuation techniques used to measure fair value and any changes in valuation inputs or techniques. In addition, investments shall be disclosed by major category.
The Fund categorizes its fair value measurements according to a three-level hierarchy that maximizes the use of observable inputs and minimizes the use of unobservable inputs by prioritizing that the most observable input be used when available. Observable inputs are those that market participants would use in pricing an investment based on market data obtained from sources independent of the reporting entity. Unobservable inputs are those that reflect the Fund's assumptions about the information market participants would use in pricing an investment. An investment's level within the fair value hierarchy is based on the lowest level of any input that is deemed significant to the asset or liability's fair value measurement. The input levels are not necessarily an indication of the risk or liquidity associated with investments at that level. For example, certain U.S. government securities are generally high quality and liquid, however, they are reflected as Level 2 because the inputs used to determine fair value may not always be quoted prices in an active market.
Fair value inputs are summarized in the three broad levels listed below:
> Level 1 — Valuations based on quoted prices for investments in active markets that the Fund has the ability to access at the measurement date (including NAV for open-end mutual funds). Valuation adjustments are not applied to Level 1 investments.
> Level 2 — Valuations based on other significant observable inputs (including quoted prices for similar securities, interest rates, prepayment speeds, credit risks, etc.).
> Level 3 — Valuations based on significant unobservable inputs (including the Fund's own assumptions and judgment in determining the fair value of investments).
The accompanying Notes to Financial Statements are an integral part of this statement.
Annual Report 2014
10
Columbia South Carolina Intermediate Municipal Bond Fund
Portfolio of Investments (continued)
April 30, 2014
Fair Value Measurements (continued)
Inputs that are used in determining fair value of an investment may include price information, credit data, volatility statistics, and other factors. These inputs can be either observable or unobservable. The availability of observable inputs can vary between investments, and is affected by various factors such as the type of investment, and the volume and level of activity for that investment or similar investments in the marketplace. The inputs will be considered by the Investment Manager, along with any other relevant factors in the calculation of an investment's fair value. The Fund uses prices and inputs that are current as of the measurement date, which may include periods of market dislocations. During these periods, the availability of prices and inputs may be reduced for many investments. This condition could cause an investment to be reclassified between the various levels within the hierarchy.
Investments falling into the Level 3 category are primarily supported by quoted prices from brokers and dealers participating in the market for those investments. However, these may be classified as Level 3 investments due to lack of market transparency and corroboration to support these quoted prices. Additionally, valuation models may be used as the pricing source for any remaining investments classified as Level 3. These models may rely on one or more significant unobservable inputs and/or significant assumptions by the Investment Manager. Inputs used in valuations may include, but are not limited to, financial statement analysis, capital account balances, discount rates and estimated cash flows, and comparable company data.
Under the direction of the Fund's Board of Trustees (the Board), the Investment Manager's Valuation Committee (the Committee) is responsible for overseeing the valuation procedures approved by the Board. The Committee consists of voting and non-voting members from various groups within the Investment Manager's organization, including operations and accounting, trading and investments, compliance, risk management and legal.
The Committee meets at least monthly to review and approve valuation matters, which may include a description of specific valuation determinations, data regarding pricing information received from approved pricing vendors and brokers and the results of Board-approved valuation control policies and procedures (the Policies). The Policies address, among other things, instances when market quotations are or are not readily available, including recommendations of third party pricing vendors and a determination of appropriate pricing methodologies; events that require specific valuation determinations and assessment of fair value techniques; securities with a potential for stale pricing, including those that are illiquid, restricted, or in default; and the effectiveness of third party pricing vendors, including periodic reviews of vendors. The Committee meets more frequently, as needed, to discuss additional valuation matters, which may include the need to review back-testing results, review time-sensitive information or approve related valuation actions. The Committee reports to the Board, with members of the Committee meeting with the Board at each of its regularly scheduled meetings to discuss valuation matters and actions during the period, similar to those described earlier.
For investments categorized as Level 3, the Committee monitors information similar to that described above, which may include: (i) data specific to the issuer or comparable issuers, (ii) general market or specific sector news and (iii) quoted prices and specific or similar security transactions. The Committee considers this data and any changes from prior periods in order to assess the reasonableness of observable and unobservable inputs, any assumptions or internal models used to value those securities and changes in fair value. This data is also used to corroborate, when available, information received from approved pricing vendors and brokers. Various factors impact the frequency of monitoring this information (which may occur as often as daily). However, the Committee may determine that changes to inputs, assumptions and models are not required as a result of the monitoring procedures performed.
The following table is a summary of the inputs used to value the Fund's investments at April 30, 2014:
Description | | Level 1
Quoted Prices in Active
Markets for Identical
Assets ($) | | Level 2
Other Significant
Observable Inputs ($) | | Level 3
Significant
Unobservable Inputs ($) | | Total ($) | |
Bonds | |
Municipal Bonds | | | — | | | | 118,688,729 | | | | — | | | | 118,688,729 | | |
Total Bonds | | | — | | | | 118,688,729 | | | | — | | | | 118,688,729 | | |
Mutual Funds | |
Money Market Funds | | | 4,282,828 | | | | — | | | | — | | | | 4,282,828 | | |
Total Mutual Funds | | | 4,282,828 | | | | — | | | | — | | | | 4,282,828 | | |
Total | | | 4,282,828 | | | | 118,688,729 | | | | — | | | | 122,971,557 | | |
See the Portfolio of Investments for all investment classifications not indicated in the table.
The Fund's assets assigned to the Level 2 input category are generally valued using the market approach, in which a security's value is determined through reference to prices and information from market transactions for similar or identical assets.
There were no transfers of financial assets between levels during the period.
The accompanying Notes to Financial Statements are an integral part of this statement.
Annual Report 2014
11
Columbia South Carolina Intermediate Municipal Bond Fund
Statement of Assets and Liabilities
April 30, 2014
Assets | |
Investments, at value | |
(identified cost $115,000,495) | | $ | 122,971,557 | | |
Receivable for: | |
Capital shares sold | | | 143,177 | | |
Interest | | | 1,570,345 | | |
Expense reimbursement due from Investment Manager | | | 662 | | |
Prepaid expenses | | | 648 | | |
Total assets | | | 124,686,389 | | |
Liabilities | |
Payable for: | |
Capital shares purchased | | | 30,373 | | |
Dividend distributions to shareholders | | | 307,190 | | |
Investment management fees | | | 1,359 | | |
Distribution and/or service fees | | | 528 | | |
Transfer agent fees | | | 22,622 | | |
Administration fees | | | 238 | | |
Compensation of board members | | | 107,093 | | |
Other expenses | | | 31,397 | | |
Total liabilities | | | 500,800 | | |
Net assets applicable to outstanding capital stock | | $ | 124,185,589 | | |
Represented by | |
Paid-in capital | | $ | 115,215,286 | | |
Undistributed net investment income | | | 1,096,315 | | |
Accumulated net realized loss | | | (97,074 | ) | |
Unrealized appreciation (depreciation) on: | |
Investments | | | 7,971,062 | | |
Total — representing net assets applicable to outstanding capital stock | | $ | 124,185,589 | | |
The accompanying Notes to Financial Statements are an integral part of this statement.
Annual Report 2014
12
Columbia South Carolina Intermediate Municipal Bond Fund
Statement of Assets and Liabilities (continued)
April 30, 2014
Class A | |
Net assets | | $ | 21,694,047 | | |
Shares outstanding | | | 2,067,363 | | |
Net asset value per share | | $ | 10.49 | | |
Maximum offering price per share(a) | | $ | 10.84 | | |
Class B | |
Net assets | | $ | 24,499 | | |
Shares outstanding | | | 2,333 | | |
Net asset value per share | | $ | 10.50 | | |
Class C | |
Net assets | | $ | 13,871,113 | | |
Shares outstanding | | | 1,321,046 | | |
Net asset value per share | | $ | 10.50 | | |
Class R4 | |
Net assets | | $ | 604,343 | | |
Shares outstanding | | | 57,615 | | |
Net asset value per share | | $ | 10.49 | | |
Class Z | |
Net assets | | $ | 87,991,587 | | |
Shares outstanding | | | 8,381,198 | | |
Net asset value per share | | $ | 10.50 | | |
(a) The maximum offering price per share is calculated by dividing the net asset value per share by 1.0 minus the maximum sales charge of 3.25%.
The accompanying Notes to Financial Statements are an integral part of this statement.
Annual Report 2014
13
Columbia South Carolina Intermediate Municipal Bond Fund
Statement of Operations
Year Ended April 30, 2014
Net investment income | |
Income: | |
Dividends | | $ | 193 | | |
Interest | | | 5,053,946 | | |
Total income | | | 5,054,139 | | |
Expenses: | |
Investment management fees | | | 527,856 | | |
Distribution and/or service fees | |
Class A | | | 56,893 | | |
Class B | | | 719 | | |
Class C | | | 139,820 | | |
Transfer agent fees | |
Class A | | | 43,712 | | |
Class B | | | 139 | | |
Class C | | | 26,847 | | |
Class R4 | | | 499 | | |
Class Z | | | 182,378 | | |
Administration fees | | | 92,375 | | |
Compensation of board members | | | 26,147 | | |
Custodian fees | | | 2,069 | | |
Printing and postage fees | | | 22,138 | | |
Registration fees | | | 19,049 | | |
Professional fees | | | 34,967 | | |
Other | | | 25,855 | | |
Total expenses | | | 1,201,463 | | |
Fees waived or expenses reimbursed by Investment Manager and its affiliates | | | (265,033 | ) | |
Total net expenses | | | 936,430 | | |
Net investment income | | | 4,117,709 | | |
Realized and unrealized gain (loss) — net | |
Net realized gain (loss) on: | |
Investments | | | (97,074 | ) | |
Net realized loss | | | (97,074 | ) | |
Net change in unrealized appreciation (depreciation) on: | |
Investments | | | (5,891,627 | ) | |
Net change in unrealized appreciation (depreciation) | | | (5,891,627 | ) | |
Net realized and unrealized loss | | | (5,988,701 | ) | |
Net decrease in net assets from operations | | $ | (1,870,992 | ) | |
The accompanying Notes to Financial Statements are an integral part of this statement.
Annual Report 2014
14
Columbia South Carolina Intermediate Municipal Bond Fund
Statement of Changes in Net Assets
| | | Year Ended
April 30,
2014 | | Year Ended
April 30,
2013(a) | |
Operations | |
Net investment income | | $ | 4,117,709 | | | $ | 4,942,480 | | |
Net realized gain (loss) | | | (97,074 | ) | | | 812,308 | | |
Net change in unrealized appreciation (depreciation) | | | (5,891,627 | ) | | | 1,393,274 | | |
Net increase (decrease) in net assets resulting from operations | | | (1,870,992 | ) | | | 7,148,062 | | |
Distributions to shareholders | |
Net investment income | |
Class A | | | (687,610 | ) | | | (737,871 | ) | |
Class B | | | (1,645 | ) | | | (2,718 | ) | |
Class C | | | (318,131 | ) | | | (305,366 | ) | |
Class R4 | | | (8,876 | ) | | | (9 | ) | |
Class Z | | | (3,101,447 | ) | | | (3,896,516 | ) | |
Net realized gains | |
Class A | | | (10,759 | ) | | | — | | |
Class B | | | (37 | ) | | | — | | |
Class C | | | (6,762 | ) | | | — | | |
Class R4 | | | (192 | ) | | | — | | |
Class Z | | | (43,423 | ) | | | — | | |
Total distributions to shareholders | | | (4,178,882 | ) | | | (4,942,480 | ) | |
Increase (decrease) in net assets from capital stock activity | | | (35,895,298 | ) | | | (10,205,179 | ) | |
Total decrease in net assets | | | (41,945,172 | ) | | | (7,999,597 | ) | |
Net assets at beginning of year | | | 166,130,761 | | | | 174,130,358 | | |
Net assets at end of year | | $ | 124,185,589 | | | $ | 166,130,761 | | |
Undistributed net investment income | | $ | 1,096,315 | | | $ | 1,101,330 | | |
(a) Class R4 shares are for the period from March 19, 2013 (commencement of operations) to April 30, 2013.
The accompanying Notes to Financial Statements are an integral part of this statement.
Annual Report 2014
15
Columbia South Carolina Intermediate Municipal Bond Fund
Statement of Changes in Net Assets (continued)
| | | Year Ended April 30, 2014 | | Year Ended April 30, 2013(a) | |
| | | Shares | | Dollars ($) | | Shares | | Dollars ($) | |
Capital stock activity | |
Class A shares | |
Subscriptions(b) | | | 400,356 | | | | 4,172,250 | | | | 786,533 | | | | 8,520,729 | | |
Distributions reinvested | | | 49,193 | | | | 512,200 | | | | 46,687 | | | | 506,413 | | |
Redemptions | | | (930,682 | ) | | | (9,756,565 | ) | | | (585,105 | ) | | | (6,335,753 | ) | |
Net increase (decrease) | | | (481,133 | ) | | | (5,072,115 | ) | | | 248,115 | | | | 2,691,389 | | |
Class B shares | |
Subscriptions | | | — | | | | — | | | | 1 | | | | 6 | | |
Distributions reinvested | | | 138 | | | | 1,442 | | | | 227 | | | | 2,458 | | |
Redemptions(b) | | | (8,167 | ) | | | (85,336 | ) | | | (4,307 | ) | | | (46,718 | ) | |
Net decrease | | | (8,029 | ) | | | (83,894 | ) | | | (4,079 | ) | | | (44,254 | ) | |
Class C shares | |
Subscriptions | | | 289,043 | | | | 3,023,842 | | | | 358,502 | | | | 3,890,750 | | |
Distributions reinvested | | | 19,889 | | | | 207,157 | | | | 16,204 | | | | 175,855 | | |
Redemptions | | | (428,686 | ) | | | (4,467,197 | ) | | | (240,470 | ) | | | (2,610,818 | ) | |
Net increase (decrease) | | | (119,754 | ) | | | (1,236,198 | ) | | | 134,236 | | | | 1,455,787 | | |
Class R4 shares | |
Subscriptions | | | 57,136 | | | | 591,829 | | | | 231 | | | | 2,500 | | |
Distributions reinvested | | | 861 | | | | 8,962 | | | | 1 | | | | 6 | | |
Redemptions | | | (614 | ) | | | (6,369 | ) | | | — | | | | — | | |
Net increase | | | 57,383 | | | | 594,422 | | | | 232 | | | | 2,506 | | |
Class Z shares | |
Subscriptions | | | 1,282,166 | | | | 13,381,814 | | | | 3,873,321 | | | | 41,933,570 | | |
Distributions reinvested | | | 39,092 | | | | 407,323 | | | | 40,129 | | | | 435,394 | | |
Redemptions | | | (4,194,741 | ) | | | (43,886,650 | ) | | | (5,243,476 | ) | | | (56,679,571 | ) | |
Net decrease | | | (2,873,483 | ) | | | (30,097,513 | ) | | | (1,330,026 | ) | | | (14,310,607 | ) | |
Total net decrease | | | (3,425,016 | ) | | | (35,895,298 | ) | | | (951,522 | ) | | | (10,205,179 | ) | |
(a) Class R4 shares are for the period from March 19, 2013 (commencement of operations) to April 30, 2013.
(b) Includes conversions of Class B shares to Class A shares, if any.
The accompanying Notes to Financial Statements are an integral part of this statement.
Annual Report 2014
16
Columbia South Carolina Intermediate Municipal Bond Fund
The following tables are intended to help you understand the Fund's financial performance. Certain information reflects financial results for a single share of a class held for the periods shown. Per share net investment income (loss) amounts are calculated based on average shares outstanding during the period. Total return assumes reinvestment of all dividends and distributions, if any. Total return does not reflect payment of sales charges, if any, and is not annualized for periods of less than one year.
| | | Year Ended April 30, | | Year Ended March 31, | |
Class A | | 2014 | | 2013 | | 2012(a) | | 2012 | | 2011 | | 2010 | |
Per share data | |
Net asset value, beginning of period | | $ | 10.89 | | | $ | 10.74 | | | $ | 10.64 | | | $ | 10.08 | | | $ | 10.17 | | | $ | 9.84 | | |
Income from investment operations: | |
Net investment income | | | 0.32 | | | | 0.30 | | | | 0.03 | | | | 0.33 | | | | 0.35 | | | | 0.34 | | |
Net realized and unrealized gain (loss) | | | (0.40 | ) | | | 0.15 | | | | 0.10 | | | | 0.56 | | | | (0.09 | ) | | | 0.33 | | |
Total from investment operations | | | (0.08 | ) | | | 0.45 | | | | 0.13 | | | | 0.89 | | | | 0.26 | | | | 0.67 | | |
Less distributions to shareholders: | |
Net investment income | | | (0.31 | ) | | | (0.30 | ) | | | (0.03 | ) | | | (0.33 | ) | | | (0.35 | ) | | | (0.34 | ) | |
Net realized gains | | | (0.01 | ) | | | — | | | | — | | | | — | | | | — | | | | — | | |
Total distributions to shareholders | | | (0.32 | ) | | | (0.30 | ) | | | (0.03 | ) | | | (0.33 | ) | | | (0.35 | ) | | | (0.34 | ) | |
Net asset value, end of period | | $ | 10.49 | | | $ | 10.89 | | | $ | 10.74 | | | $ | 10.64 | | | $ | 10.08 | | | $ | 10.17 | | |
Total return | | | (0.66 | %) | | | 4.28 | % | | | 1.18 | % | | | 8.97 | % | | | 2.54 | % | | | 6.91 | % | |
Ratios to average net assets(b) | |
Total gross expenses | | | 1.01 | % | | | 0.97 | % | | | 0.99 | %(c) | | | 1.04 | % | | | 0.95 | % | | | 0.91 | % | |
Total net expenses(d) | | | 0.81 | % | | | 0.81 | %(e) | | | 0.79 | %(c) | | | 0.79 | %(e) | | | 0.80 | %(e) | | | 0.78 | %(e) | |
Net investment income | | | 3.02 | % | | | 2.81 | % | | | 2.95 | %(c) | | | 3.16 | % | | | 3.41 | % | | | 3.39 | % | |
Supplemental data | |
Net assets, end of period (in thousands) | | $ | 21,694 | | | $ | 27,743 | | | $ | 24,707 | | | $ | 24,748 | | | $ | 18,513 | | | $ | 24,126 | | |
Portfolio turnover | | | 6 | % | | | 14 | % | | | 0 | % | | | 9 | % | | | 15 | % | | | 16 | % | |
Notes to Financial Highlights
(a) For the period from April 1, 2012 to April 30, 2012. During the period, the Fund's fiscal year end was changed from March 31 to April 30.
(b) In addition to the fees and expenses which the Fund bears directly, the Fund indirectly bears a pro rata share of the fees and expenses of the acquired funds in which it invests. Such indirect expenses are not included in the reported expense ratios.
(c) Annualized.
(d) Total net expenses include the impact of certain waivers/reimbursements made by the Investment Manager and certain of its affiliates, if applicable.
(e) The benefits derived from expense reductions had an impact of less than 0.01%.
The accompanying Notes to Financial Statements are an integral part of this statement.
Annual Report 2014
17
Columbia South Carolina Intermediate Municipal Bond Fund
Financial Highlights (continued)
| | | Year Ended April 30, | | Year Ended March 31, | |
Class B | | 2014 | | 2013 | | 2012(a) | | 2012 | | 2011 | | 2010 | |
Per share data | |
Net asset value, beginning of period | | $ | 10.89 | | | $ | 10.75 | | | $ | 10.65 | | | $ | 10.08 | | | $ | 10.18 | | | $ | 9.85 | | |
Income from investment operations: | |
Net investment income | | | 0.24 | | | | 0.22 | | | | 0.02 | | | | 0.25 | | | | 0.27 | | | | 0.27 | | |
Net realized and unrealized gain (loss) | | | (0.39 | ) | | | 0.14 | | | | 0.10 | | | | 0.58 | | | | (0.09 | ) | | | 0.33 | | |
Total from investment operations | | | (0.15 | ) | | | 0.36 | | | | 0.12 | | | | 0.83 | | | | 0.18 | | | | 0.60 | | |
Less distributions to shareholders: | |
Net investment income | | | (0.23 | ) | | | (0.22 | ) | | | (0.02 | ) | | | (0.26 | ) | | | (0.28 | ) | | | (0.27 | ) | |
Net realized gains | | | (0.01 | ) | | | — | | | | — | | | | — | | | | — | | | | — | | |
Total distributions to shareholders | | | (0.24 | ) | | | (0.22 | ) | | | (0.02 | ) | | | (0.26 | ) | | | (0.28 | ) | | | (0.27 | ) | |
Net asset value, end of period | | $ | 10.50 | | | $ | 10.89 | | | $ | 10.75 | | | $ | 10.65 | | | $ | 10.08 | | | $ | 10.18 | | |
Total return | | | (1.31 | %) | | | 3.41 | % | | | 1.12 | % | | | 8.25 | % | | | 1.70 | % | | | 6.12 | % | |
Ratios to average net assets(b) | |
Total gross expenses | | | 1.76 | % | | | 1.72 | % | | | 1.74 | %(c) | | | 1.84 | % | | | 1.70 | % | | | 1.66 | % | |
Total net expenses(d) | | | 1.56 | % | | | 1.55 | %(e) | | | 1.54 | %(c) | | | 1.54 | %(e) | | | 1.55 | %(e) | | | 1.53 | %(e) | |
Net investment income | | | 2.29 | % | | | 2.07 | % | | | 2.20 | %(c) | | | 2.43 | % | | | 2.65 | % | | | 2.64 | % | |
Supplemental data | |
Net assets, end of period (in thousands) | | $ | 24 | | | $ | 113 | | | $ | 155 | | | $ | 154 | | | $ | 246 | | | $ | 1,175 | | |
Portfolio turnover | | | 6 | % | | | 14 | % | | | 0 | % | | | 9 | % | | | 15 | % | | | 16 | % | |
Notes to Financial Highlights
(a) For the period from April 1, 2012 to April 30, 2012. During the period, the Fund's fiscal year end was changed from March 31 to April 30.
(b) In addition to the fees and expenses which the Fund bears directly, the Fund indirectly bears a pro rata share of the fees and expenses of the acquired funds in which it invests. Such indirect expenses are not included in the reported expense ratios.
(c) Annualized.
(d) Total net expenses include the impact of certain waivers/reimbursements made by the Investment Manager and certain of its affiliates, if applicable.
(e) The benefits derived from expense reductions had an impact of less than 0.01%.
The accompanying Notes to Financial Statements are an integral part of this statement.
Annual Report 2014
18
Columbia South Carolina Intermediate Municipal Bond Fund
Financial Highlights (continued)
| | | Year Ended April 30, | | Year Ended March 31, | |
Class C | | 2014 | | 2013 | | 2012(a) | | 2012 | | 2011 | | 2010 | |
Per share data | |
Net asset value, beginning of period | | $ | 10.89 | | | $ | 10.75 | | | $ | 10.65 | | | $ | 10.08 | | | $ | 10.18 | | | $ | 9.85 | | |
Income from investment operations: | |
Net investment income | | | 0.24 | | | | 0.22 | | | | 0.02 | | | | 0.25 | | | | 0.27 | | | | 0.27 | | |
Net realized and unrealized gain (loss) | | | (0.39 | ) | | | 0.14 | | | | 0.10 | | | | 0.58 | | | | (0.10 | ) | | | 0.33 | | |
Total from investment operations | | | (0.15 | ) | | | 0.36 | | | | 0.12 | | | | 0.83 | | | | 0.17 | | | | 0.60 | | |
Less distributions to shareholders: | |
Net investment income | | | (0.23 | ) | | | (0.22 | ) | | | (0.02 | ) | | | (0.26 | ) | | | (0.27 | ) | | | (0.27 | ) | |
Net realized gains | | | (0.01 | ) | | | — | | | | — | | | | — | | | | — | | | | — | | |
Total distributions to shareholders | | | (0.24 | ) | | | (0.22 | ) | | | (0.02 | ) | | | (0.26 | ) | | | (0.27 | ) | | | (0.27 | ) | |
Net asset value, end of period | | $ | 10.50 | | | $ | 10.89 | | | $ | 10.75 | | | $ | 10.65 | | | $ | 10.08 | | | $ | 10.18 | | |
Total return | | | (1.31 | %) | | | 3.41 | % | | | 1.12 | % | | | 8.27 | % | | | 1.68 | % | | | 6.11 | % | |
Ratios to average net assets(b) | |
Total gross expenses | | | 1.76 | % | | | 1.72 | % | | | 1.73 | %(c) | | | 1.78 | % | | | 1.70 | % | | | 1.66 | % | |
Total net expenses(d) | | | 1.56 | % | | | 1.55 | %(e) | | | 1.54 | %(c) | | | 1.54 | %(e) | | | 1.55 | %(e) | | | 1.53 | %(e) | |
Net investment income | | | 2.28 | % | | | 2.06 | % | | | 2.19 | %(c) | | | 2.41 | % | | | 2.65 | % | | | 2.63 | % | |
Supplemental data | |
Net assets, end of period (in thousands) | | $ | 13,871 | | | $ | 15,694 | | | $ | 14,041 | | | $ | 13,093 | | | $ | 10,031 | | | $ | 9,300 | | |
Portfolio turnover | | | 6 | % | | | 14 | % | | | 0 | % | | | 9 | % | | | 15 | % | | | 16 | % | |
Notes to Financial Highlights
(a) For the period from April 1, 2012 to April 30, 2012. During the period, the Fund's fiscal year end was changed from March 31 to April 30.
(b) In addition to the fees and expenses which the Fund bears directly, the Fund indirectly bears a pro rata share of the fees and expenses of the acquired funds in which it invests. Such indirect expenses are not included in the reported expense ratios.
(c) Annualized.
(d) Total net expenses include the impact of certain waivers/reimbursements made by the Investment Manager and certain of its affiliates, if applicable.
(e) The benefits derived from expense reductions had an impact of less than 0.01%.
The accompanying Notes to Financial Statements are an integral part of this statement.
Annual Report 2014
19
Columbia South Carolina Intermediate Municipal Bond Fund
Financial Highlights (continued)
| | | Year Ended April 30, | |
Class R4 | | 2014 | | 2013(a) | |
Per share data | |
Net asset value, beginning of period | | $ | 10.88 | | | $ | 10.80 | | |
Income from investment operations: | |
Net investment income | | | 0.34 | | | | 0.04 | | |
Net realized and unrealized gain (loss) | | | (0.38 | ) | | | 0.08 | | |
Total from investment operations | | | (0.04 | ) | | | 0.12 | | |
Less distributions to shareholders: | |
Net investment income | | | (0.34 | ) | | | (0.04 | ) | |
Net realized gains | | | (0.01 | ) | | | — | | |
Total distributions to shareholders | | | (0.35 | ) | | | (0.04 | ) | |
Net asset value, end of period | | $ | 10.49 | | | $ | 10.88 | | |
Total return | | | (0.32 | %) | | | 1.09 | % | |
Ratios to average net assets(b) | |
Total gross expenses | | | 0.79 | % | | | 0.58 | %(c) | |
Total net expenses(d) | | | 0.56 | % | | | 0.53 | %(c) | |
Net investment income | | | 3.34 | % | | | 3.12 | %(c) | |
Supplemental data | |
Net assets, end of period (in thousands) | | $ | 604 | | | $ | 3 | | |
Portfolio turnover | | | 6 | % | | | 14 | % | |
Notes to Financial Highlights
(a) For the period from March 19, 2013 (commencement of operations) to April 30, 2013.
(b) In addition to the fees and expenses which the Fund bears directly, the Fund indirectly bears a pro rata share of the fees and expenses of the acquired funds in which it invests. Such indirect expenses are not included in the reported expense ratios.
(c) Annualized.
(d) Total net expenses include the impact of certain waivers/reimbursements made by the Investment Manager and certain of its affiliates, if applicable.
The accompanying Notes to Financial Statements are an integral part of this statement.
Annual Report 2014
20
Columbia South Carolina Intermediate Municipal Bond Fund
Financial Highlights (continued)
| | | Year Ended April 30, | | Year Ended March 31, | |
Class Z | | 2014 | | 2013 | | 2012(a) | | 2012 | | 2011 | | 2010 | |
Per share data | |
Net asset value, beginning of period | | $ | 10.89 | | | $ | 10.75 | | | $ | 10.65 | | | $ | 10.08 | | | $ | 10.18 | | | $ | 9.84 | | |
Income from investment operations: | |
Net investment income | | | 0.34 | | | | 0.33 | | | | 0.03 | | | | 0.36 | | | | 0.38 | | | | 0.37 | | |
Net realized and unrealized gain (loss) | | | (0.38 | ) | | | 0.14 | | | | 0.10 | | | | 0.57 | | | | (0.10 | ) | | | 0.34 | | |
Total from investment operations | | | (0.04 | ) | | | 0.47 | | | | 0.13 | | | | 0.93 | | | | 0.28 | | | | 0.71 | | |
Less distributions to shareholders: | |
Net investment income | | | (0.34 | ) | | | (0.33 | ) | | | (0.03 | ) | | | (0.36 | ) | | | (0.38 | ) | | | (0.37 | ) | |
Net realized gains | | | (0.01 | ) | | | — | | | | — | | | | — | | | | — | | | | — | | |
Total distributions to shareholders | | | (0.35 | ) | | | (0.33 | ) | | | (0.03 | ) | | | (0.36 | ) | | | (0.38 | ) | | | (0.37 | ) | |
Net asset value, end of period | | $ | 10.50 | | | $ | 10.89 | | | $ | 10.75 | | | $ | 10.65 | | | $ | 10.08 | | | $ | 10.18 | | |
Total return | | | (0.32 | %) | | | 4.45 | % | | | 1.20 | % | | | 9.33 | % | | | 2.70 | % | | | 7.28 | % | |
Ratios to average net assets(b) | |
Total gross expenses | | | 0.76 | % | | | 0.72 | % | | | 0.73 | %(c) | | | 0.78 | % | | | 0.70 | % | | | 0.66 | % | |
Total net expenses(d) | | | 0.56 | % | | | 0.55 | %(e) | | | 0.54 | %(c) | | | 0.54 | %(e) | | | 0.55 | %(e) | | | 0.53 | %(e) | |
Net investment income | | | 3.27 | % | | | 3.06 | % | | | 3.20 | %(c) | | | 3.42 | % | | | 3.65 | % | | | 3.64 | % | |
Supplemental data | |
Net assets, end of period (in thousands) | | $ | 87,992 | | | $ | 122,578 | | | $ | 135,227 | | | $ | 131,663 | | | $ | 127,101 | | | $ | 150,971 | | |
Portfolio turnover | | | 6 | % | | | 14 | % | | | 0 | % | | | 9 | % | | | 15 | % | | | 16 | % | |
Notes to Financial Highlights
(a) For the period from April 1, 2012 to April 30, 2012. During the period, the Fund's fiscal year end was changed from March 31 to April 30.
(b) In addition to the fees and expenses which the Fund bears directly, the Fund indirectly bears a pro rata share of the fees and expenses of the acquired funds in which it invests. Such indirect expenses are not included in the reported expense ratios.
(c) Annualized.
(d) Total net expenses include the impact of certain waivers/reimbursements made by the Investment Manager and certain of its affiliates, if applicable.
(e) The benefits derived from expense reductions had an impact of less than 0.01%.
The accompanying Notes to Financial Statements are an integral part of this statement.
Annual Report 2014
21
Columbia South Carolina Intermediate Municipal Bond Fund
Notes to Financial Statements
April 30, 2014
Note 1. Organization
Columbia South Carolina Intermediate Municipal Bond Fund (the Fund), a series of Columbia Funds Series Trust (the Trust), is a diversified fund. The Trust is registered under the Investment Company Act of 1940, as amended (the 1940 Act), as an open-end management investment company organized as a Delaware statutory trust.
Fund Shares
The Trust may issue an unlimited number of shares (without par value). The Fund offers Class A, Class B, Class C, Class R4 and Class Z shares. Although all share classes generally have identical voting, dividend and liquidation rights, each share class votes separately when required by law. Different share classes pay different distribution amounts to the extent the expenses of such share classes differ, and distributions in liquidation will be proportional to the net asset value of each share class. Each share class has its own expense structure and sales charges, as applicable.
Class A shares are subject to a maximum front-end sales charge of 3.25% based on the initial investment amount. Class A shares purchased without an initial sales charge in accounts aggregating $1 million to $50 million at the time of purchase are subject to a contingent deferred sales charge (CDSC) if the shares are sold within 18 months of purchase, charged as follows: 1.00% CDSC if redeemed within 12 months of purchase, and 0.50% CDSC if redeemed more than 12, but less than 18, months after purchase.
Class B shares may be subject to a maximum CDSC of 3.00% based upon the holding period after purchase. Class B shares will generally convert to Class A shares eight years after purchase. The Fund no longer accepts investments by new or existing investors in the Fund's Class B shares, except in connection with the reinvestment of any dividend and/or capital gain distributions in Class B shares of the Fund and exchanges by existing Class B shareholders of certain other funds within the Columbia Family of Funds.
Class C shares are subject to a 1.00% CDSC on shares redeemed within one year of purchase.
Class R4 shares are not subject to sales charges and are generally available only to omnibus retirement plans and certain other eligible investors.
Class Z shares are not subject to sales charges and are available only to certain eligible investors, which are subject to different investment minimums.
Note 2. Summary of Significant Accounting Policies
Use of Estimates
The preparation of financial statements in accordance with U.S. generally accepted accounting principles (GAAP) requires management to make certain estimates and assumptions that affect the reported amounts of assets and liabilities, the disclosure of contingent assets and liabilities at the date of the financial statements and the reported amounts of revenue and expenses during the reporting period. Actual results could differ from those estimates.
The following is a summary of significant accounting policies consistently followed by the Fund in the preparation of its financial statements.
Security Valuation
Debt securities generally are valued by pricing services approved by the Board of Trustees (the Board) based upon market transactions for normal, institutional-size trading units of similar securities. The services may use various pricing techniques which take into account appropriate factors such as yield, quality, coupon rate, maturity, type of issue, trading characteristics and other data, as well as broker quotes. Debt securities for which quotations are readily available may also be valued based upon an over-the-counter or exchange bid quotation.
Investments in open-end investment companies, including money market funds, are valued at net asset value.
Investments for which market quotations are not readily available, or that have quotations which management believes are not reliable, are valued at fair value as determined in good faith under consistently applied procedures established by and under the general supervision of the Board. If a security or class of securities (such as foreign securities) is valued at fair value, such value is likely to be different from the last quoted market price for the security.
The determination of fair value often requires significant judgment. To determine fair value, management may use assumptions including but not limited to future cash flows and estimated risk premiums. Multiple inputs from various sources may be used to determine fair value.
Security Transactions
Security transactions are accounted for on the trade date. Cost is determined and gains (losses) are based upon the specific identification method for both financial statement and federal income tax purposes.
Annual Report 2014
22
Columbia South Carolina Intermediate Municipal Bond Fund
Notes to Financial Statements (continued)
April 30, 2014
Income Recognition
Interest income is recorded on an accrual basis. Market premiums and discounts, including original issue discounts, are amortized and accreted, respectively, over the expected life of the security on all debt securities, unless otherwise noted.
Dividend income is recorded on the ex-dividend date.
Expenses
General expenses of the Trust are allocated to the Fund and other funds of the Trust based upon relative net assets or other expense allocation methodologies determined by the nature of the expense. Expenses directly attributable to the Fund are charged to the Fund. Expenses directly attributable to a specific class of shares are charged to that share class.
Determination of Class Net Asset Value
All income, expenses (other than class-specific expenses, which are charged to that share class, as shown in the Statement of Operations) and realized and unrealized gains (losses) are allocated to each class of the Fund on a daily basis, based on the relative net assets of each class, for purposes of determining the net asset value of each class.
Federal Income Tax Status
The Fund intends to qualify each year as a regulated investment company under Subchapter M of the Internal Revenue Code, as amended, and will distribute substantially all of its tax exempt and taxable income (including net short-term capital gains), if any, for its tax year, and as such will not be subject to federal income taxes. In addition, the Fund intends to distribute in each calendar year substantially all of its net investment income, capital gains and certain other amounts, if any, such that the Fund should not be subject to federal excise tax. Therefore, no federal income or excise tax provision is recorded.
Distributions to Shareholders
Distributions from net investment income, if any, are declared daily and paid monthly. Net realized capital gains, if any, are distributed at least annually. Income distributions and capital gain distributions are determined in accordance with federal income tax regulations, which may differ from GAAP.
Guarantees and Indemnifications
Under the Trust's organizational documents and, in some cases, by contract, its officers and trustees are indemnified against certain liabilities arising out of the performance of their duties to the Trust or its funds. In addition, certain of the Fund's contracts with its service providers contain general indemnification clauses. The Fund's maximum exposure under these arrangements is unknown since the amount of any
future claims that may be made against the Fund cannot be determined, and the Fund has no historical basis for predicting the likelihood of any such claims.
Note 3. Fees and Compensation Paid to Affiliates
Investment Management Fees
Under an Investment Management Services Agreement, Columbia Management Investment Advisers, LLC (the Investment Manager), a wholly-owned subsidiary of Ameriprise Financial, Inc. (Ameriprise Financial), determines which securities will be purchased, held or sold. The investment management fee is an annual fee that is equal to a percentage of the Fund's average daily net assets that declines from 0.40% to 0.27% as the Fund's net assets increase. The effective investment management fee rate for the year ended April 30, 2014 was 0.40% of the Fund's average daily net assets.
Administration Fees
Under an Administrative Services Agreement, the Investment Manager also serves as the Fund Administrator. The Fund pays the Fund Administrator an annual fee for administration and accounting services equal to a percentage of the Fund's average daily net assets that declines from 0.07% to 0.04% as the Fund's net assets increase. The effective administration fee rate for the year ended April 30, 2014 was 0.07% of the Fund's average daily net assets.
Other Expenses
Other expenses are for, among other things, miscellaneous expenses of the Fund or the Board, including payments to a company providing limited administrative services to the Fund and the Board. That company's expenses include boardroom and office expense, employee compensation, employee health and retirement benefits, and certain other expenses. For the year ended April 30, 2014, other expenses paid to this company were $1,748.
Compensation of Board Members
Board members are compensated for their services to the Fund as disclosed in the Statement of Operations. Under a Deferred Compensation Plan (the Plan), the Board members who are not "interested persons" of the Fund, as defined under the 1940 Act, may elect to defer payment of up to 100% of their compensation. Deferred amounts are treated as though equivalent dollar amounts had been invested in shares of certain funds managed by the Investment Manager. The Fund's liability for these amounts is adjusted for market value changes and remains in the Fund until distributed in accordance with the Plan.
Annual Report 2014
23
Columbia South Carolina Intermediate Municipal Bond Fund
Notes to Financial Statements (continued)
April 30, 2014
Transfer Agent Fees
Under a Transfer and Dividend Disbursing Agent Agreement, Columbia Management Investment Services Corp. (the Transfer Agent), an affiliate of the Investment Manager and a wholly-owned subsidiary of Ameriprise Financial, is responsible for providing transfer agency services to the Fund. The Transfer Agent has contracted with Boston Financial Data Services (BFDS) to serve as sub-transfer agent.
The Transfer Agent receives monthly account-based service fees based on the number of open accounts and also receives sub-transfer agency fees based on a percentage of the average aggregate value of the Fund's shares maintained in omnibus accounts (other than omnibus accounts for which American Enterprise Investment Services Inc. is the broker of record or accounts where the beneficial shareholder is a customer of Ameriprise Financial Services, Inc., which are paid a per account fee). The Transfer Agent pays the fees of BFDS for services as sub-transfer agent and is not entitled to reimbursement for such fees from the Fund (with the exception of out-of-pocket fees).
The Transfer Agent also receives compensation from fees for various shareholder services and reimbursements for certain out-of-pocket fees.
For the year ended April 30, 2014, the Fund's effective transfer agent fee rates as a percentage of average daily net assets of each class were as follows:
Class A | | | 0.19 | % | |
Class B | | | 0.19 | | |
Class C | | | 0.19 | | |
Class R4 | | | 0.19 | | |
Class Z | | | 0.19 | | |
An annual minimum account balance fee of $20 may apply to certain accounts with a value below the applicable share class's initial minimum investment requirements to reduce the impact of small accounts on transfer agent fees. These minimum account balance fees are recorded as part of expense reductions in the Statement of Operations. For the year ended April 30, 2014, no minimum account balance fees were charged by the Fund.
Distribution and Service Fees
The Fund has an agreement with Columbia Management Investment Distributors, Inc. (the Distributor), an affiliate of the Investment Manager and a wholly-owned subsidiary of Ameriprise Financial, for distribution and shareholder services. The Board has approved, and the Fund has adopted,
distribution and shareholder service plans (the Plans) applicable to certain share classes, which set the distribution and service fees for the Fund. These fees are calculated daily and are intended to compensate the Distributor and/or eligible selling and/or servicing agents for selling shares of the Fund and providing services to investors.
Under the Plans, the Fund pays a monthly combined distribution and service fee to the Distributor at the maximum annual rate of 0.25% of the average daily net assets attributable to Class A shares of the Fund. Also under the Plans, the Fund pays a monthly service fee at the maximum annual rate of 0.25% of the average daily net assets attributable to Class B and Class C shares of the Fund and the payment of a monthly distribution fee at the maximum annual rate of 0.75% of the average daily net assets attributable to Class B and Class C shares of the Fund.
Sales Charges
Sales charges, including front-end charges and CDSCs, received by the Distributor for distributing Fund shares were $33,426 for Class A and $2,129 for Class C shares for the year ended April 30, 2014.
Expenses Waived/Reimbursed by the Investment Manager and its Affiliates
The Investment Manager and certain of its affiliates have contractually agreed to waive fees and/or reimburse expenses (excluding certain fees and expenses described below) for the period disclosed below, unless sooner terminated at the sole discretion of the Board, so that the Fund's net operating expenses, after giving effect to fees waived/expenses reimbursed and any balance credits and/or overdraft charges from the Fund's custodian, do not exceed the following annual rates as a percentage of the class' average daily net assets:
| | | Fee Rates Contractual
through
August 31, 2014 | |
Class A | | | 0.81 | % | |
Class B | | | 1.56 | | |
Class C | | | 1.56 | | |
Class R4 | | | 0.56 | | |
Class Z | | | 0.56 | | |
Under the agreement governing these fee waivers and/or expense reimbursement arrangements, the following fees and expenses are excluded from the waiver/reimbursement commitment, and therefore will be paid by the Fund, if applicable: taxes (including foreign transaction taxes), expenses associated with investments in affiliated and
Annual Report 2014
24
Columbia South Carolina Intermediate Municipal Bond Fund
Notes to Financial Statements (continued)
April 30, 2014
non-affiliated pooled investment vehicles (including mutual funds and exchange-traded funds), transaction costs and brokerage commissions, costs related to any securities lending program, dividend expenses associated with securities sold short, inverse floater program fees and expenses, transaction charges and interest on borrowed money, interest, extraordinary expenses and any other expenses the exclusion of which is specifically approved by the Board. This agreement may be modified or amended only with approval from all parties.
Note 4. Federal Tax Information
The timing and character of income and capital gain distributions are determined in accordance with income tax regulations, which may differ from GAAP because of temporary or permanent book to tax differences.
At April 30, 2014, these differences are primarily due to differing treatment for capital loss carryforwards, principal and/or interest of fixed income securities, deferral/reversal of wash sale losses, Trustees' deferred compensation and distribution reclassifications. To the extent these differences are permanent, reclassifications are made among the components of the Fund's net assets in the Statement of Assets and Liabilities. Temporary differences do not require reclassifications. In the Statement of Assets and Liabilities the following reclassifications were made:
Undistributed net investment income | | $ | (5,015 | ) | |
Accumulated net realized loss | | | 5,013 | | |
Paid-in capital | | | 2 | | |
Net investment income and net realized gains (losses), as disclosed in the Statement of Operations, and net assets were not affected by this reclassification.
The tax character of distributions paid during the years indicated was as follows:
Year Ended April 30, | | 2014 | | 2013 | |
Ordinary income | | $ | 14,472 | | | $ | 14,440 | | |
Long-term capital gains | | | 56,114 | | | | — | | |
Tax-exempt income | | | 4,108,296 | | | | 4,928,040 | | |
Total | | $ | 4,178,882 | | | $ | 4,942,480 | | |
Short-term capital gain distributions, if any, are considered ordinary income distributions for tax purposes.
At April 30, 2014, the components of distributable earnings on a tax basis were as follows:
Undistributed tax-exempt income | | $ | 1,510,538 | | |
Capital loss carryforwards | | | (30,659 | ) | |
Net unrealized appreciation | | | 7,904,647 | | |
At April 30, 2014, the cost of investments for federal income tax purposes was $115,066,910 and the aggregate gross unrealized appreciation and depreciation based on that cost was:
Unrealized appreciation | | $ | 8,076,534 | | |
Unrealized depreciation | | | (171,887 | ) | |
Net unrealized appreciation | | $ | 7,904,647 | | |
The following capital loss carryforwards, determined at April 30, 2014, may be available to reduce taxable income arising from future net realized gains on investments, if any, to the extent permitted by the Internal Revenue Code:
Year of Expiration | | Amount ($) | |
Unlimited short-term | | | 30,659 | | |
Management of the Fund has concluded that there are no significant uncertain tax positions that would require recognition in the financial statements. However, management's conclusion may be subject to review and adjustment at a later date based on factors including, but not limited to, new tax laws, regulations, and administrative interpretations (including relevant court decisions). Generally, the Fund's federal tax returns for the prior three fiscal years remain subject to examination by the Internal Revenue Service.
Note 5. Portfolio Information
The cost of purchases and proceeds from sales of securities, excluding short-term obligations, aggregated to $8,196,451 and $45,913,981, respectively, for the year ended April 30, 2014.
Note 6. Shareholder Concentration
At April 30, 2014, one unaffiliated shareholder of record owned 65.3% of the outstanding shares of the Fund in one or more accounts. The Fund has no knowledge about whether any portion of those shares was owned beneficially. Subscription and redemption activity by concentrated accounts may have a significant effect on the operations of the Fund.
Note 7. Line of Credit
The Fund has entered into a revolving credit facility with a syndicate of banks led by JPMorgan Chase Bank N.A. whereby the Fund may borrow for the temporary funding of shareholder redemptions or for other temporary or emergency purposes. The credit facility agreement, as amended, which is a collective agreement between the Fund and certain other funds managed by the Investment Manager, severally and not jointly, permits collective borrowings up to $500 million. Interest is charged to each participating fund based on its borrowings at a rate equal to the higher of (i) the overnight federal funds rate plus 1.00% or (ii) the one-month LIBOR
Annual Report 2014
25
Columbia South Carolina Intermediate Municipal Bond Fund
Notes to Financial Statements (continued)
April 30, 2014
rate plus 1.00%. Each borrowing under the credit facility matures no later than 60 days after the date of borrowing. Effective December 10, 2013, the Fund also pays a commitment fee equal to its pro rata share of the amount of the credit facility at a rate of 0.075% per annum. Prior to December 10, 2013, the commitment fee was charged at the annual rate of 0.08% per annum. The commitment fee is included in other expenses in the Statement of Operations.
The Fund had no borrowings during the year ended April 30, 2014.
Note 8. Significant Risks
Geographic Concentration Risk
Because state-specific tax-exempt funds invest primarily in the municipal securities issued by the state and political sub-divisions of the state, the Fund will be particularly affected by political and economic conditions and developments in the state in which it invests. The Fund may, therefore, have a greater risk than that of a municipal bond fund which is more geographically diversified. The value of the municipal securities owned by the Fund also may be adversely affected by future changes in federal or state income tax laws.
Note 9. Subsequent Events
Management has evaluated the events and transactions that have occurred through the date the financial statements were issued and noted no items requiring adjustment of the financial statements or additional disclosure.
Note 10. Information Regarding Pending and Settled Legal Proceedings
In December 2005, without admitting or denying the allegations, American Express Financial Corporation (AEFC, which is now known as Ameriprise Financial, Inc. (Ameriprise Financial)) entered into settlement agreements with the Securities and Exchange Commission (SEC) and Minnesota Department of Commerce (MDOC) related to market timing activities. As a result, AEFC was censured and ordered to cease and desist from committing or causing any violations of certain provisions of the Investment Advisers Act of 1940, the Investment Company Act of 1940, and various Minnesota laws. AEFC agreed to pay disgorgement of $10 million and civil money penalties of $7 million. AEFC also agreed to retain an independent distribution consultant to assist in developing a plan for distribution of all disgorgement and civil penalties ordered by the SEC in accordance with various undertakings detailed at www.sec.gov/litigation/admin/ia-2451.pdf. Ameriprise Financial and its affiliates have cooperated with the SEC and the MDOC in these legal proceedings, and have made regular reports to the Funds' Boards of Trustees.
Ameriprise Financial and certain of its affiliates have historically been involved in a number of legal, arbitration and regulatory proceedings, including routine litigation, class actions, and governmental actions, concerning matters arising in connection with the conduct of their business activities. Ameriprise Financial believes that the Funds are not currently the subject of, and that neither Ameriprise Financial nor any of its affiliates are the subject of, any pending legal, arbitration or regulatory proceedings that are likely to have a material adverse effect on the Funds or the ability of Ameriprise Financial or its affiliates to perform under their contracts with the Funds. Ameriprise Financial is required to make 10-Q, 10-K and, as necessary, 8-K filings with the Securities and Exchange Commission on legal and regulatory matters that relate to Ameriprise Financial and its affiliates. Copies of these filings may be obtained by accessing the SEC website at www.sec.gov.
There can be no assurance that these matters, or the adverse publicity associated with them, will not result in increased fund redemptions, reduced sale of fund shares or other adverse consequences to the Funds. Further, although we believe proceedings are not likely to have a material adverse effect on the Funds or the ability of Ameriprise Financial or its affiliates to perform under their contracts with the Funds, these proceedings are subject to uncertainties and, as such, we are unable to estimate the possible loss or range of loss that may result. An adverse outcome in one or more of these proceedings could result in adverse judgments, settlements, fines, penalties or other relief that could have a material adverse effect on the consolidated financial condition or results of operations of Ameriprise Financial.
Annual Report 2014
26
Columbia South Carolina Intermediate Municipal Bond Fund
Report of Independent Registered Public Accounting Firm
To the Trustees of Columbia Funds Series Trust and the Shareholders of
Columbia South Carolina Intermediate Municipal Bond Fund
In our opinion, the accompanying statement of assets and liabilities, including the portfolio of investments, and the related statements of operations and of changes in net assets and the financial highlights present fairly, in all material respects, the financial position of Columbia South Carolina Intermediate Municipal Bond Fund (the "Fund", a series of Columbia Funds Series Trust) at April 30, 2014, and the results of its operations, the changes in its net assets and the financial highlights for each of the periods indicated, in conformity with accounting principles generally accepted in the United States of America. These financial statements and financial highlights (hereafter referred to as "financial statements") are the responsibility of the Fund's management; our responsibility is to express an opinion on these financial statements based on our audits. We conducted our audits of these financial statements in accordance with the standards of the Public Company Accounting Oversight Board (United States). Those standards require that we plan and perform the audit to obtain reasonable assurance about whether the financial statements are free of material misstatement. An audit includes examining, on a test basis, evidence supporting the amounts and disclosures in the financial statements, assessing the accounting principles used and significant estimates made by management, and evaluating the overall financial statement presentation. We believe that our audits, which included confirmation of securities at April 30, 2014 by correspondence with the custodian, provide a reasonable basis for our opinion.
PricewaterhouseCoopers LLP
Minneapolis, Minnesota
June 20, 2014
Annual Report 2014
27
Columbia South Carolina Intermediate Municipal Bond Fund
Federal Income Tax Information
(Unaudited)
The Fund hereby designates the following tax attributes for the fiscal year ended April 30, 2014. Shareholders will be notified in early 2015 of the amounts for use in preparing 2014 income tax returns.
Tax Designations:
Capital Gain Dividend | | $ | 56,114 | | |
| Exempt-Interest Dividends | | | 99.65 | % | |
Capital Gain Dividend. The Fund designates as a capital gain dividend the amount reflected above, or if subsequently determined to be different, the net capital gain of such fiscal period. The Fund also designates as capital gain dividends, to the extent necessary to fully distribute such capital gains, earnings and profits distributed to shareholders on the redemption of shares.
Exempt-Interest Dividends. The percentage of net investment income dividends paid during the fiscal year that qualifies as exempt-interest dividends for federal income tax purposes.
Annual Report 2014
28
Columbia South Carolina Intermediate Municipal Bond Fund
Shareholders elect the Board that oversees the Funds' operations. The Board appoints officers who are responsible for day-to-day business decisions based on policies set by the Board. The following table provides basic biographical information about the Funds' Board members, including their principal occupations during the past five years, although specific titles for individuals may have varied over the period. Under current Board policy, members may serve through the end of the calendar year in which he or she reaches either the mandatory retirement age established by the Board or the fifteenth anniversary of the first Board meeting they attended as a member of the Board.
Independent Trustees
Name,
Address,
Year of Birth | | Position Held With
Funds and Length of
Service | | Principal Occupation(s)
During Past Five Years
and Other Relevant
Professional Experience | | Number of
Funds in the
Fund Family
Overseen by
Board Member | | Other Present or Past
Directorships/
Trusteeships
(Within Past 5 Years) | |
Kathleen Blatz
901 S. Marquette Ave.
Minneapolis, MN 55402
1954 | | Board member since 1/06 for RiverSource Funds and since 6/11 for Nations Funds | | Attorney; Chief Justice, Minnesota Supreme Court, 1998-2006 | | | 132 | | | Trustee, BlueCross BlueShield of Minnesota since 2009 | |
Edward J. Boudreau, Jr.
901 S. Marquette Ave.
Minneapolis, MN 55402
1944 | | Board member since 6/11 for RiverSource Funds and since 1/05 for Nations Funds | | Managing Director, E.J. Boudreau & Associates (consulting) since 2000; Chairman and Chief Executive Officer, John Hancock Funds (mutual funds), 1989-2000 | | | 130 | | | Former Trustee, BofA Funds Series Trust (11 funds), 2005-2011 | |
Pamela G. Carlton
901 S. Marquette Ave.
Minneapolis, MN 55402
1954 | | Board member since 7/07 for RiverSource Funds and since 6/11 for Nations Funds | | President, Springboard — Partners in Cross Cultural Leadership (consulting company) since 2003; Director or Management Director of US Equity Research, Chase Asset Management, 1996-2003; Investment Banker, Morgan Stanley, 1982-1996 | | | 132 | | | None | |
William P. Carmichael
901 S. Marquette Ave.
Minneapolis, MN 55402
1943 | | Chair of the Board since 1/14, Board member since 6/11 for RiverSource Funds and since 2003 for Nations Funds | | Retired; Co-founder, The Succession Fund (provides exit strategies to owners of privately held companies); previously, Senior Vice President, Sara Lee Corporation; Senior Vice President and Chief Financial Officer, Beatrice Foods Company; Vice President, Esmark, Inc.; Associate, Price Waterhouse | | | 132 | | | Director, Cobra Electronics Corporation (electronic equipment manufacturer); The Finish Line (athletic shoes and apparel) since July 2003; Director, International Textile Corp. since 2012; former Director, McMoRan Exploration Company (oil and gas exploration and development) 2010-2013; former Trustee, BofA Funds Series Trust (11 funds), 2009-2011; Director, Spectrum Brands, Inc. (consumer products), 2002-2009; Director, Simmons Company (bedding), 2004-2010 | |
Annual Report 2014
29
Columbia South Carolina Intermediate Municipal Bond Fund
Trustees and Officers (continued)
Independent Trustees (continued)
Name,
Address,
Year of Birth | | Position Held With
Funds and Length of
Service | | Principal Occupation(s)
During Past Five Years
and Other Relevant
Professional Experience | | Number of
Funds in the
Fund Family
Overseen by
Board Member | | Other Present or Past
Directorships/
Trusteeships
(Within Past 5 Years) | |
Patricia M. Flynn
901 S. Marquette Ave.
Minneapolis, MN 55402
1950 | | Board member since 11/04 for RiverSource Funds and since 6/11 for Nations Funds | | Trustee Professor of Economics and Management, Bentley University since 1976 (also teaches and conducts research on corporate governance); Dean, McCallum Graduate School of Business, Bentley University, 1992-2002 | | | 132 | | | None | |
William A. Hawkins
901 S. Marquette Ave.
Minneapolis, MN 55402
1942 | | Board member since 6/11 for RiverSource Funds and since 1/05 for Nations Funds | | Managing Director, Overton Partners (financial consulting), since August 2010; President and Chief Executive Officer, California General Bank, N.A., January 2008-August 2010 | | | 130 | | | Trustee, BofA Funds Series Trust (11 funds) | |
R. Glenn Hilliard
901 S. Marquette Ave.
Minneapolis, MN 55402
1943 | | Board member since 6/11 for RiverSource Funds and since 1/05 for Nations Funds | | Chairman and Chief Executive Officer, Hilliard Group LLC (investing and consulting) since April 2003; Non-Executive Director & Chairman, CNO Financial Group, Inc. (insurance), September 2003-May 2011 | | | 130 | | | Chairman, BofA Fund Series Trust (11 funds); former Director, CNO Financial Group, Inc. (insurance), 2003-2011 | |
Stephen R. Lewis, Jr.
901 S. Marquette Ave.
Minneapolis, MN 55402
1939 | | Board member for RiverSource Funds since 1/02 and since 6/11 for Nations Funds, Board Chair 1/07-12/13 | | President Emeritus and Professor of Economics Emeritus, Carleton College since 2002 | | | 132 | | | Director, Valmont Industries, Inc. (irrigation systems manufacturer), 2002-2013 | |
Catherine James Paglia
901 S. Marquette Ave.
Minneapolis, MN 55402
1952 | | Board member since 11/04 for RiverSource Funds and since 6/11 for Nations Funds | | Director, Enterprise Asset Management, Inc. (private real estate and asset management company) since September 1998 | | | 132 | | | Director, Valmont Industries, Inc. (irrigation systems manufacturer) since 2012 | |
Leroy C. Richie
901 S. Marquette Ave.
Minneapolis, MN 55402
1941 | | Board member since 2000 for Legacy Seligman Funds, since 11/08 for RiverSource Funds and since 6/11 for Nations Funds | | Counsel, Lewis & Munday, P.C. (law firm) since 2004; Vice President and General Counsel, Automotive Legal Affairs, Chrysler Corporation, 1993-1997 | | | 132 | | | Lead Outside Director, Digital Ally, Inc. (digital imaging) since September 2005; Director, Infinity, Inc. (oil and gas exploration and production) since 1994; Director, OGE Energy Corp. (energy and energy services) since November 2007 | |
Minor M. Shaw
901 S. Marquette Ave.
Minneapolis, MN 55402
1947 | | Board member since 6/11 for RiverSource Funds and since 2003 for Nations Funds | | President, Micco LLC (private investments) since 2011; President, Micco Corp. since 1998 | | | 130 | | | Director, Piedmont Natural Gas; Director, BlueCross BlueShield of South Carolina since April 2008; Director, National Association of Corporate Directors, Carolinas Chapter, since 2013; former Trustee, BofA Funds Series Trust (11 funds) | |
Annual Report 2014
30
Columbia South Carolina Intermediate Municipal Bond Fund
Trustees and Officers (continued)
Independent Trustees (continued)
Name,
Address,
Year of Birth | | Position Held With
Funds and Length of
Service | | Principal Occupation(s)
During Past Five Years
and Other Relevant
Professional Experience | | Number of
Funds in the
Fund Family
Overseen by
Board Member | | Other Present or Past
Directorships/
Trusteeships
(Within Past 5 Years) | |
Alison Taunton-Rigby
901 S. Marquette Ave.
Minneapolis, MN 55402
1944 | | Board member since 11/02 for RiverSource Funds and since 6/11 for Nations Funds | | Chief Executive Officer and Director, RiboNovix, Inc., (biotechnology) 2003-2010 | | | 132 | | | Director, Healthways, Inc. (health and wellbeing solutions) since 2005; Director, ICI Mutual Insurance Company, RRG since 2011; Director, Abt Associates (government contractor) since 2001; Director, Boston Children's Hospital since 2002 | |
Interested Trustee Not Affiliated with Investment Manager*
Name,
Address,
Year of Birth | | Position Held With
Funds and Length of
Service | | Principal Occupation(s)
During Past Five Years
and Other Relevant
Professional Experience | | Number of
Funds in the
Fund Family
Overseen by
Board Member | | Other Present or Past
Directorships/
Trusteeships
(Within Past 5 Years) | |
Anthony M. Santomero
901 S. Marquette Ave.
Minneapolis, MN 55402
1946 | | Board member since 6/11 for RiverSource Funds and since 1/08 for Nations Funds | | Richard K. Mellon Professor Emeritus of Finance, The Wharton School, University of Pennsylvania, since 2002; Senior Advisor, McKinsey & Company (consulting), 2006-2008 | | | 130 | | | Director, Renaissance Reinsurance Ltd. since May 2008; Trustee, Penn Mutual Life Insurance Company since March 2008; Director, Citigroup Inc. since 2009; Director, Citibank, N.A. since 2009; former Trustee, BofA Funds Series Trust (11 funds), 2008-2011 | |
*Dr. Santomero is not an affiliated person of the Investment Manager or Ameriprise Financial. However, he is currently deemed by the Funds to be an "interested person" (as defined in the 1940 Act) of the Funds because he serves as a Director of Citigroup Inc. and Citibank, N.A., companies that may directly or through subsidiaries and affiliates engage from time-to-time in brokerage execution, principal transactions and lending relationships with the Funds or accounts advised/managed by the Investment Manager.
Annual Report 2014
31
Columbia South Carolina Intermediate Municipal Bond Fund
Trustees and Officers (continued)
Interested Trustee Affiliated with Investment Manager*
Name,
Address,
Year of Birth | | Position Held With
Funds and Length of
Service | | Principal Occupation(s)
During Past Five Years
and Other Relevant
Professional Experience | | Number of
Funds in the
Fund Family
Overseen by
Board Member | | Other Present or Past
Directorships/
Trusteeships
(Within Past 5 Years) | |
William F. Truscott
53600 Ameriprise
Financial Center
Minneapolis, MN 55474
1960 | | Board member since 11/01 for RiverSource Funds and since 6/11 for Nations Funds; Senior Vice President since 2002 for RiverSource Funds and since 5/10 for Nations Funds | | Chairman of the Board and President, Columbia Management Investment Advisers, LLC since May 2010 and February 2012, respectively (previously President and Chief Investment Officer, 2001-April 2010); Chief Executive Officer, Global Asset Management, Ameriprise Financial, Inc. since September 2012 (previously Chief Executive Officer, U.S. Asset Management & President, Annuities, May 2010-September 2012 and President — U.S. Asset Management and Chief Investment Officer, 2005-April 2010); Director and Chief Executive Officer, Columbia Management Investment Distributors, Inc. since May 2010 and February 2012, respectively (previously Chairman of the Board and Chief Executive Officer, 2006-April 2010); Chairman of the Board and Chief Executive Officer, RiverSource Distributors, Inc. since 2006; Director, Threadneedle Asset Management Holdings, SARL since 2014; President and Chief Executive Officer, Ameriprise Certificate Company, 2006-August 2012 | | | 186 | | | Former Director, Ameriprise Certificate Company, 2006-January 2013 | |
*Interested person (as defined under the 1940 Act) by reason of being an officer, director, security holder and/or employee of the Investment Manager or Ameriprise Financial.
The Statement of Additional Information has additional information about the Fund's Board members and is available, without charge, upon request by calling 800.345.6611; contacting your financial intermediary or visiting columbiamanagement.com.
Annual Report 2014
32
Columbia South Carolina Intermediate Municipal Bond Fund
Trustees and Officers (continued)
The Board has appointed officers who are responsible for day-to-day business decisions based on policies it has established. The officers serve at the pleasure of the Board. In addition to Mr. Truscott, who is Senior Vice President, the Funds' other officers are:
Officers
Name,
Address and
Year of Birth | | Position and Year
First Appointed to
Position for any Fund
in the Columbia
Funds Complex or a
Predecessor Thereof | | Principal Occupation(s) During Past Five Years | |
J. Kevin Connaughton
225 Franklin Street
Boston, MA 02110
Born 1964 | | President and Principal Executive Officer (2009) | | Managing Director and General Manager — Mutual Fund Products, Columbia Management Investment Advisers, LLC since May 2010; and President, Columbia Funds since 2009; Managing Director, Columbia Management Advisors, LLC, December 2004-April 2010; Senior Vice President and Chief Financial Officer, Columbia Funds, June 2008-January 2009; and senior officer of Columbia Funds and affiliated funds since 2003 | |
Michael G. Clarke
225 Franklin Street
Boston, MA 02110
Born 1969 | | Treasurer (2011) and Chief Financial Officer (2009) | | Vice President — Mutual Fund Administration, Columbia Management Investment Advisers, LLC, since May 2010; Managing Director of Fund Administration, Columbia Management Advisors, LLC, September 2004-April 2010; and senior officer of Columbia Funds and affiliated funds since 2002 | |
Scott R. Plummer
5228 Ameriprise Financial Center
Minneapolis, MN 55474
Born 1959 | | Senior Vice President (2006), Chief Legal Officer (2006) and Assistant Secretary (2011) | | Senior Vice President and Assistant General Counsel — Global Asset Management, Ameriprise Financial since February 2014 (previously, Senior Vice President and Lead Chief Counsel — Asset Management, 2012-February 2014; Vice President and Lead Chief Counsel — Asset Management, 2010-2012; and Vice President and Chief Counsel — Asset Management, 2005-2010); Senior Vice President, Chief Legal Officer and Assistant Secretary, Columbia Management Investment Advisers, LLC since June 2005; Vice President, Chief Counsel and Assistant Secretary, Columbia Management Investment Distributors, Inc. since 2008; Vice President, General Counsel and Secretary, Ameriprise Certificate Company since 2005; Chief Counsel, RiverSource Distributors, Inc. since 2006; senior officer of Columbia Funds and affiliated funds since 2006 | |
Thomas P. McGuire
225 Franklin Street
Boston, MA 02110
Born 1972 | | Chief Compliance Officer (2012) | | Vice President — Asset Management Compliance, Ameriprise Financial, Inc. since May 2010; Chief Compliance Officer, Ameriprise Certificate Company, since September 2010; Compliance Executive, Bank of America, 2005-April 2010 | |
Colin Moore
225 Franklin Street
Boston, MA 02110
Born 1958 | | Senior Vice President (2010) | | Executive Vice President and Global Chief Investment Officer, Ameriprise Financial, Inc. since July 2013; Director and Global Chief Investment Officer, Columbia Management Investment Advisers, LLC since May 2010; Manager, Managing Director and Chief Investment Officer, Columbia Management Advisors, LLC, 2007-April 2010 | |
Michael E. DeFao
225 Franklin Street
Boston, MA 02110
Born 1968 | | Vice President (2011) and Assistant Secretary (2010) | | Vice President and Chief Counsel, Ameriprise Financial, Inc. since May 2010; Associate General Counsel, Bank of America 2005-April 2010 | |
Joseph F. DiMaria
225 Franklin Street
Boston, MA 02110
Born 1968 | | Vice President (2011) and Chief Accounting Officer (2008) | | Vice President — Mutual Fund Treasurer, Columbia Management Investment Advisers, LLC since May 2010; Director of Fund Administration, Columbia Management Advisors, LLC, 2006-April 2010 | |
Paul B. Goucher
100 Park Avenue
New York, NY 10017
Born 1968 | | Vice President (2011) and Assistant Secretary (2008) | | Vice President and Lead Chief Counsel, Ameriprise Financial, Inc. since November 2008 and January 2013, respectively (previously Chief Counsel, January 2010-January 2013, and Group Counsel, November 2008-January 2010); Director, Managing Director and General Counsel, J. & W. Seligman & Co. Incorporated, July 2008-November 2008 | |
Amy Johnson
5228 Ameriprise Financial
Center
Minneapolis, MN 55474
Born 1965 | | Vice President (2006) | | Managing Director and Chief Operating Officer, Columbia Management Investment Advisers, LLC since May 2010 (previously Chief Administrative Officer, 2009-April 2010, and Vice President — Asset Management and Trust Company Services, 2006-2009) | |
Annual Report 2014
33
Columbia South Carolina Intermediate Municipal Bond Fund
Trustees and Officers (continued)
Officers (continued)
Name,
Address and
Year of Birth | | Position and Year
First Appointed to
Position for any Fund
in the Columbia
Funds Complex or a
Predecessor Thereof | | Principal Occupation(s) During Past Five Years | |
Paul D. Pearson
5228 Ameriprise Financial
Center
Minneapolis, MN 55474
Born 1956 | | Vice President (2011) and Assistant Treasurer (1999) | | Vice President — Investment Accounting, Columbia Management Investment Advisers, LLC since May 2010; Vice President — Managed Assets, Investment Accounting, Ameriprise Financial, Inc., 1998-April 2010 | |
Christopher O. Petersen
5228 Ameriprise Financial
Center
Minneapolis, MN 55474
Born 1970 | | Vice President and Secretary (2010) | | Vice President and Chief Counsel, Ameriprise Financial, Inc., since January 2010 (previously Vice President and Group Counsel or Counsel, 2004-January 2010); officer of Columbia Funds and affiliated funds since 2007 | |
Stephen T. Welsh
225 Franklin Street
Boston, MA 02110
Born 1957 | | Vice President (2006) | | President and Director, Columbia Management Investment Services Corp. since May 2010; President and Director, Columbia Management Services, Inc., 2004-April 2010; Managing Director, Columbia Management Distributors, Inc., 2007-April 2010 | |
Annual Report 2014
34
Columbia South Carolina Intermediate Municipal Bond Fund
Approval of Investment Management Services
Agreement
Columbia Management Investment Advisers, LLC (Columbia Management or the Investment Manager), a wholly-owned subsidiary of Ameriprise Financial, Inc. (Ameriprise Financial), serves as the investment manager to Columbia South Carolina Intermediate Municipal Bond Fund (the Fund). Under an investment management services agreement (the IMS Agreement), Columbia Management provides investment advice and other services to the Fund and other funds distributed by Columbia Management Investment Distributors, Inc. (collectively, the Funds).
On an annual basis, the Fund's Board of Trustees (the Board), including the independent Board members (the Independent Trustees), considers renewal of the IMS Agreement. Columbia Management prepared detailed reports for the Board and its Contracts Committee in January, March and April 2014, including reports based on analyses of data provided by an independent organization (Lipper) and a comprehensive response to each item of information requested by independent legal counsel to the Independent Trustees (Independent Legal Counsel) in a letter to the Investment Manager, to assist the Board in making this determination. All of the materials presented in January, March and April were first supplied in draft form to designated representatives of the Independent Trustees, i.e., Independent Legal Counsel, Fund Counsel, the Chair of the Board and the Chair of the Contracts Committee, and the final materials (including proposed expense caps for certain Funds) were revised to reflect discussion and subsequent requests made by the Contracts Committee. In addition, throughout the year, the Board (or its committees) regularly meets with portfolio management teams and senior management personnel, and reviews information prepared by Columbia Management addressing the services Columbia Management provides and Fund performance. The Board also accords appropriate weight to the work, deliberations and conclusions of the Contracts Committee, the Investment Review Committee and the Compliance Committee in determining whether to continue the IMS Agreement.
The Board, at its April 9-11, 2014 in-person Board meeting (the April Meeting), considered the renewal of the IMS Agreement for an additional one-year term. At the April Meeting, Independent Legal Counsel reviewed with the Independent Trustees various factors relevant to the Board's consideration of advisory agreements and the Board's legal responsibilities related to such consideration. Following an analysis and discussion of the factors identified below, the Board, including all of the Independent Trustees, approved the renewal of the IMS Agreement.
Nature, Extent and Quality of Services Provided by Columbia Management
The Independent Trustees analyzed various reports and presentations they had received detailing the services performed by Columbia Management, as well as its expertise, resources and capabilities. The Independent Trustees specifically considered many developments during the past year concerning the services provided by Columbia Management, including, in particular, the successful implementation of a globalization initiative, which, among other things, increased worldwide analyst support for global products, the reorganization of the Informational Technology research team, the hiring of additional personnel to assist the Asset Allocation team and the global restructuring of the Senior Operational team. The Independent Trustees noted the information they received concerning Columbia Management's ability to retain its key portfolio management personnel. The Independent Trustees also recalled Columbia Management's representation that additional staff has been added to support the vigorous application of the "5P" review process, to which all internally-managed Funds are subject.
In connection with the Board's evaluation of the overall package of services provided by Columbia Management, the Board also considered the quality of administrative services provided to the Fund by Columbia Management, recalling the information it received highlighting significant achievements in 2013 in the performance of administrative services. In evaluating the quality of services provided under the IMS Agreement and the Fund's Administrative Services Agreement, the Independent Trustees also took into account the organization and strength of the Fund's and its service providers' compliance programs. In addition, the Board also reviewed the financial condition of Columbia Management (and its affiliates) and each entity's ability to carry out its responsibilities under the IMS Agreement and the Fund's other services agreements with affiliates of Ameriprise Financial, observing the financial strength of Ameriprise Financial, with its solid balance sheet. The Board also discussed the acceptability of the terms of the IMS Agreement (including the relatively broad scope of services required to be performed by Columbia Management). The Board concluded that the services being performed under the IMS Agreement were of a reasonably high quality.
Based on the foregoing, and based on other information received (both oral and written, including the information on investment performance referenced below) and other considerations, the Board concluded that Columbia Management and its affiliates were in a position to continue to provide a high quality and level of services to the Fund.
Annual Report 2014
35
Columbia South Carolina Intermediate Municipal Bond Fund
Approval of Investment Management Services
Agreement (continued)
Investment Performance
For purposes of evaluating the nature, extent and quality of services provided under the IMS Agreement, the Board carefully reviewed the investment performance of the Fund. In this regard, the Board considered detailed reports providing the results of analyses performed by an independent organization showing, for various periods, the performance of the Fund, the performance of a benchmark index, the percentage ranking of the Fund among its comparison group and the net assets of the Fund. The Board observed that the Fund's investment performance met expectations.
Comparative Fees, Costs of Services Provided and the Profits Realized By Columbia Management and its Affiliates from their Relationships with the Fund
The Board reviewed comparative fees and the costs of services provided under the IMS Agreement. The Board members considered detailed comparative information set forth in an annual report on fees and expenses, including, among other things, data (based on analyses conducted by an independent organization) showing a comparison of the Fund's expenses with median expenses paid by funds in its comparative peer universe, as well as data showing the Fund's contribution to Columbia Management's profitability.
The Board accorded particular weight to the notion that the level of fees should reflect a rational pricing model applied consistently across the various product lines in the Fund family, while assuring that the overall fees for each Fund (with few defined exceptions) are generally in line with the "pricing philosophy" currently in effect (i.e., that the total expense ratio of the Fund is no higher than the median expense ratio of funds in the same comparison universe of the Fund). In this connection, the Board also considered the 2013 report provided by an independent consulting firm, Bobroff Consulting (the Independent Consultant), that concluded that the Funds' standardized investment management fee rates were within a reasonable range. The Board took into account that the Fund's total expense ratio (after considering proposed voluntary expense caps/waivers) approximated the peer universe's median expense ratio. It was observed that various proposals concerning the Funds' transfer agency and sub-transfer agency fee structures, and other changes impacting the Funds' pricing structure and fees, are expected to be considered at a later Board meeting which, if adopted, would alter the current pricing philosophy. Based on its review, the Board concluded that the Fund's management fee was fair and reasonable in light of the extent and quality of services that the Fund receives.
The Board also considered the expected profitability of Columbia Management and its affiliates in connection with Columbia Management providing investment management services to the Fund. In this regard, the Board referred to a detailed profitability report, discussing the profitability to Columbia Management and Ameriprise Financial from managing, operating and distributing the Funds. In this regard, the Board observed that: (i) the Independent Consultant concluded that 2012 profitability was reasonable; (ii) 2013 profitability only moderately exceeded 2012 levels; and (iii) 2013 profitability is in line with profitability levels of industry competitors. It also took into account the indirect economic benefits flowing to Columbia Management or its affiliates in connection with managing or distributing the Funds, such as the enhanced ability to offer various other financial products to Ameriprise Financial customers, soft dollar benefits and overall reputational advantages. The Board noted that the fees paid by the Funds should permit the Investment Manager to offer competitive compensation to its personnel, make necessary investments in its business and earn an appropriate profit. The Board concluded that profitability levels were reasonable.
Economies of Scale to be Realized
The Board also considered the economies of scale that might be realized by Columbia Management as the Fund grows and took note of the extent to which Fund shareholders might also benefit from such growth. In this regard, the Independent Trustees took into account that IMS fees decline as Fund assets exceed various breakpoints, all of which have not been surpassed.
Based on the foregoing, the Board, including all of the Independent Trustees, concluded that the investment management service fees were fair and reasonable in light of the extent and quality of services provided. In reaching this conclusion, no single factor was determinative. On April 11, 2014, the Board, including all of the Independent Trustees, approved the renewal of the IMS Agreement.
Annual Report 2014
36
Columbia South Carolina Intermediate Municipal Bond Fund
Important Information About This Report
Each fund mails one shareholder report to each shareholder address. If you would like more than one report, please call shareholder services at 800.345.6611 and additional reports will be sent to you.
The policy of the Board is to vote the proxies of the companies in which each fund holds investments consistent with the procedures as stated in the Statement of Additional Information (SAI). You may obtain a copy of the SAI without charge by calling 800.345.6611; contacting your financial intermediary; visiting columbiamanagement.com; or searching the website of the Securities and Exchange Commission (SEC) at sec.gov. Information regarding how each fund voted proxies relating to portfolio securities is filed with the SEC by August 31 for the most recent 12-month period ending June 30 of that year, and is available without charge by visiting columbiamanagement.com; or searching the website of the SEC at sec.gov.
Each fund files a complete schedule of portfolio holdings with the SEC for the first and third quarters of each fiscal year on Form N-Q. Each fund's Form N-Q is available on the SEC's website at sec.gov and may be reviewed and copied at the SEC's Public Reference Room in Washington, D.C. Information on the operation of the Public Reference Room may be obtained by calling 800.SEC.0330. Each fund's complete schedule of portfolio holdings, as filed on Form N-Q, can also be obtained without charge, upon request, by calling 800.345.6611.
Annual Report 2014
37

Columbia South Carolina Intermediate Municipal Bond Fund
P.O. Box 8081
Boston, MA 02266-8081
columbiamanagement.com
This information is for use with concurrent or prior delivery of a fund prospectus. Please read and consider the investment objectives, risks, charges and expenses for any fund carefully before investing. For a prospectus and, if available, a summary prospectus, which contains this and other important information about the Fund go to columbiamanagement.com. The Fund is distributed by Columbia Management Investment Distributors, Inc., member FINRA, and managed by Columbia Management Investment Advisers, LLC.
© 2014 Columbia Management Investment Advisers, LLC. All rights reserved.
ANN231_04_D01_(06/14)
Annual Report
April 30, 2014

Columbia Georgia Intermediate Municipal Bond Fund
(renamed Columbia AMT-Free Georgia Intermediate Muni Bond Fund, effective July 7, 2014)
Not FDIC insured • No bank guarantee • May lose value
 Dear Shareholders,
Continued Economic Recovery
The U.S. economy continued to recover at a slow but steady pace during the first quarter of 2014, supported by solid manufacturing activity, reasonable job growth and continued gains for the housing market. Industrial production was robust, buoyed by strong demand for autos and related parts. After a disappointing January, job growth picked up, which helped boost consumer confidence. Housing data was somewhat mixed, as harsh weather and higher mortgage rates put a damper on sales, while lower inventories helped prices trend higher. The Federal Reserve (the Fed) announced further reductions to its monthly asset purchases and reassured the markets that it would not make any significant changes to monetary policy until it was satisfied that the labor market was on solid ground. Despite mostly good news on the economic front, the broad financial markets recorded only modest gains, as bitter winter weather at home and mounting tensions between Russia and Western allies prompted investor caution.
Investors braced for higher interest rates, but long-term yields declined and the fixed-income markets were surprisingly resilient in the face of stable-to-improving economic data. Risk-on trading continued during the quarter as the higher yielding sectors of the fixed-income markets generally fared well. Emerging-market bonds, long-term U.S. Treasuries and sovereign debt were among the strongest performers, as were Treasury Inflation Protected Securities. Municipal bonds delivered solid gains, especially high-yield municipals, which benefited from continued improvement in state finances.
Against this backdrop, the broad bond market, as measured by the Barclays U.S. Aggregate Bond Index, edged out the broad stock market, as measured by the Standard & Poor's 500 Index, with gains of 1.84% vs. 1.81%, respectively. As indicated late last year, the Fed began tapering its monthly asset purchase program and announced further reductions. New Fed chair Janet Yellen reassured investors the Fed was committed to keeping short-term borrowing rates low into 2015.
Stay on Track with Columbia Management
Backed by more than 100 years of experience, Columbia Management is one of the nation's largest asset managers. At the heart of our success and, most importantly, that of our investors, are highly talented industry professionals, brought together by a unique way of working. At Columbia Management, reaching our performance goals matters, and how we reach them matters just as much.
Visit columbiamanagement.com for:
> The Columbia Management Perspectives blog, offering insights on current market events and investment opportunities
> Detailed up-to-date fund performance and portfolio information
> Quarterly fund commentaries
> Columbia Management investor, our award-winning quarterly newsletter for shareholders
Thank you for your continued support of the Columbia Funds. We look forward to serving your investment needs for many years to come.
Best Regards,

J. Kevin Connaughton
President, Columbia Funds
Investing involves risk including the risk of loss of principal.
The Barclays U.S. Aggregate Bond Index is a broad-based benchmark that measures the investment grade, U.S. dollar denominated, fixed-rate taxable bond market, including Treasuries, government-related and corporate securities, mortgage-backed securities (agency fixed-rate and hybrid adjustable-rate mortgage passthroughs), asset-backed securities, and commercial mortgage-backed securities. The S&P 500 Index, an unmanaged index, measures the performance of 500 widely held, large-capitalization U.S. stocks and is frequently used as a general measure of market performance. Indices are not available for investment, are not professionally managed and do not reflect sales charges, fees, brokerage commissions, taxes or other expenses of investing.
Investors should consider the investment objectives, risks, charges and expenses of a mutual fund carefully before investing. For a free prospectus and, if available, a summary prospectus, which contains this and other important information about a fund, visit columbiamanagement.com. The prospectus should be read carefully before investing.
Columbia Funds are distributed by Columbia Management Investment Distributors, Inc., member FINRA, and managed by Columbia Management Investment Advisers, LLC.
© 2014 Columbia Management Investment Advisers, LLC. All rights reserved.
Columbia Georgia Intermediate Municipal Bond Fund
Performance Overview | | | 2 | | |
Manager Discussion of Fund Performance | | | 4 | | |
Understanding Your Fund's Expenses | | | 6 | | |
Portfolio of Investments | | | 7 | | |
Statement of Assets and Liabilities | | | 12 | | |
Statement of Operations | | | 14 | | |
Statement of Changes in Net Assets | | | 15 | | |
Financial Highlights | | | 17 | | |
Notes to Financial Statements | | | 22 | | |
Report of Independent Registered
Public Accounting Firm | | | 27 | | |
Federal Income Tax Information | | | 28 | | |
Trustees and Officers | | | 29 | | |
Approval of Investment Management Services Agreement | | | 35 | | |
Important Information About This Report | | | 37 | | |
Fund Investment Manager
Columbia Management Investment
Advisers, LLC
225 Franklin Street
Boston, MA 02110
Fund Distributor
Columbia Management Investment
Distributors, Inc.
225 Franklin Street
Boston, MA 02110
Fund Transfer Agent
Columbia Management Investment
Services Corp.
P.O. Box 8081
Boston, MA 02266-8081
For more information about any of the funds, please visit columbiamanagement.com or call 800.345.6611. Customer Service Representatives are available to answer your questions Monday through Friday from 8 a.m. to 7 p.m. Eastern time.
The views expressed in this report reflect the current views of the respective parties. These views are not guarantees of future performance and involve certain risks, uncertainties and assumptions that are difficult to predict, so actual outcomes and results may differ significantly from the views expressed. These views are subject to change at any time based upon economic, market or other conditions and the respective parties disclaim any responsibility to update such views. These views may not be relied on as investment advice and, because investment decisions for a Columbia Fund are based on numerous factors, may not be relied on as an indication of trading intent on behalf of any particular Columbia Fund. References to specific securities should not be construed as a recommendation or investment advice.
Columbia Georgia Intermediate Municipal Bond Fund
Performance Summary
> Columbia Georgia Intermediate Municipal Bond Fund (the Fund) Class A shares returned 0.02% excluding sales charges for the 12-month period that ended April 30, 2014. Class Z shares of the Fund returned 0.18% for the same time period.
> The Fund's benchmark, the Barclays 3-15 Year Blend Municipal Bond Index, returned 0.97% for the 12-month period.
> The Fund's maturity positioning generally accounted for its shortfall relative to its benchmark.
Average Annual Total Returns (%) (for period ended April 30, 2014)
| | Inception | | 1 Year | | 5 Years | | 10 Years | |
Class A | | 05/04/92 | | | | | | | | | | | | | |
Excluding sales charges | | | | | | | 0.02 | | | | 4.12 | | | | 3.60 | | |
Including sales charges | | | | | | | -3.26 | | | | 3.43 | | | | 3.26 | | |
Class B | | 06/07/93 | | | | | | | | | | | | | |
Excluding sales charges | | | | | | | -0.82 | | | | 3.32 | | | | 2.83 | | |
Including sales charges | | | | | | | -3.71 | | | | 3.32 | | | | 2.83 | | |
Class C | | 06/17/92 | | | | | | | | | | | | | |
Excluding sales charges | | | | | | | -0.82 | | | | 3.32 | | | | 2.83 | | |
Including sales charges | | | | | | | -1.78 | | | | 3.32 | | | | 2.83 | | |
Class R4* | | 03/19/13 | | | 0.18 | | | | 4.35 | | | | 3.85 | | |
Class Z | | 03/01/92 | | | 0.18 | | | | 4.37 | | | | 3.86 | | |
Barclays 3-15 Year Blend Municipal Bond Index | | | | | | | 0.97 | | | | 4.91 | | | | 4.71 | | |
Returns for Class A are shown with and without the maximum initial sales charge of 3.25%. Returns for Class B are shown with and without the applicable contingent deferred sales charge (CDSC) of 3.00% in the first year, declining to 1.00% in the fourth year and eliminated thereafter. Returns for Class C are shown with and without the 1.00% CDSC for the first year only. The Fund's other classes are not subject to sales charges and have limited eligibility. Please see the Fund's prospectus for details. Performance for different share classes will vary based on differences in sales charges and fees associated with each class. All results shown assume reinvestment of distributions during the period. Returns do not reflect the deduction of taxes that a shareholder may pay on Fund distributions or on the redemption of Fund shares. Performance results reflect the effect of any fee waivers or reimbursements of Fund expenses by Columbia Management Investment Advisers, LLC and/or any of its affiliates. Absent these fee waivers or expense reimbursement arrangements, performance results would have been lower.
The performance information shown represents past performance and is not a guarantee of future results. The investment return and principal value of your investment will fluctuate so that your shares, when redeemed, may be worth more or less than their original cost. Current performance may be lower or higher than the performance information shown. You may obtain performance information current to the most recent month-end by contacting your financial intermediary, visiting columbiamanagement.com or calling 800.345.6611.
*The returns shown for periods prior to the share class inception date (including returns for the Life of the Fund, if shown, which are since Fund inception) include the returns of the Fund's oldest share class. These returns are adjusted to reflect any higher class-related operating expenses of the newer share classes, as applicable. Please visit columbiamanagement.com/mutual-funds/appended-performance for more information.
The Barclays 3-15 Year Blend Municipal Bond Index is an unmanaged index that tracks the performance of municipal bonds issued after December 31, 1990, with remaining maturities between 2 and 17 years and at least $7 million in principal amount outstanding.
Indices are not available for investment, are not professionally managed and do not reflect sales charges, fees, brokerage commissions, taxes or other expenses of investing. Securities in the Fund may not match those in an index.
Annual Report 2014
2
Columbia Georgia Intermediate Municipal Bond Fund
Performance Overview (continued)
Performance of a Hypothetical $10,000 Investment (May 1, 2004 – April 30, 2014)

The chart above shows the change in value of a hypothetical $10,000 investment in Class A shares of Columbia Georgia Intermediate Municipal Bond Fund during the stated time period, and does not reflect the deduction of taxes that a shareholder may pay on Fund distributions or on the redemption of Fund shares.
Annual Report 2014
3
Columbia Georgia Intermediate Municipal Bond Fund
Manager Discussion of Fund Performance
Effective July 7, 2014, the Fund will be renamed Columbia AMT-Free Georgia Intermediate Muni Bond Fund.
For the 12-month period that ended April 30, 2014, the Fund's Class A shares returned 0.02% excluding sales charges. Class Z shares of the Fund returned 0.18% for the same time period. The Fund's benchmark, the Barclays 3-15 Year Blend Municipal Bond Index, returned 0.97% for the 12-month period. The Fund's maturity positioning generally accounted for its shortfall relative to the benchmark, as the Fund generally had more exposure than the benchmark to the 8-12 year maturity range, which was the worst performing area of the maturity spectrum during the period. We shortened the Fund's duration as interest rates rose in 2013, which was a good strategic decision, but it was a little too short to capture the upside opportunity when rates stabilized and then declined in 2014.
Stable Economic Growth
Even though a difficult winter weighed on the U.S. economy early in 2014, it was not enough to derail the steady growth that marked the 12-month period. Solid new job growth drove the unemployment rate down to 6.3%. Robust manufacturing activity boosted the nation's capacity utilization rate to a recovery high of 79.2%. Personal income edged higher, borrowing increased and the savings rate declined. Consumer confidence generally rose during the 12-month period, reflecting consumer expectations that the economy was on solid ground. The housing market lost some momentum, the victim of bad winter weather, tighter borrowing standards, rising prices and higher mortgage rates. However, higher pending home sales near the end of the period was a positive data point.
Investors welcomed reduced tensions in Washington, where an extended budget deal and the president's nomination of Janet Yellen as the new Federal Reserve (Fed) chair received bipartisan support. In December 2013, the Fed announced that it would take a measured approach to tapering its monthly bond-buying program, beginning in January 2014. Further tapering commenced in February, March and April. Against this backdrop of generally positive economic news, bonds lost some ground as interest rates moved higher. Nevertheless, the municipal market managed a modestly positive return for the period.
A Challenging Environment for the Municipal Market
Municipal yields followed Treasury yields higher from the beginning of the reporting period through early September 2013. A rapid selloff in the wake of climbing yields sent municipal bond fund shares downward, causing heavy selling pressure which persisted through the end of the calendar year. The environment improved in the first four months of 2014. Fund outflows slowed, state and local revenues improved, demand for shorter-maturity municipal bonds remained strong and new issuance declined sharply. Through April, new bond issuance was down by 30% compared to the same period in 2013, and refunding volume dropped by more than 50%. For the 12-month period, the best returns came from bonds with two- to four-year maturities. Bonds with 10-year maturities were the worst performers. Generally speaking, lower quality bonds generated slightly higher returns than higher quality bonds.
We took advantage of market volatility to shorten the Fund's duration, manage tax gains and losses and decrease exposure to lower coupon bonds, which underperformed as rates rose and added volatility to the portfolio. The Fund's cash position was larger than we typically maintain to provide liquidity and meet
Portfolio Management
Brian McGreevy
Quality Breakdown (%)
(at April 30, 2014) | |
AAA rating | | | 8.5 | | |
AA rating | | | 44.6 | | |
A rating | | | 37.5 | | |
BBB rating | | | 8.0 | | |
Not rated | | | 1.4 | | |
Total | | | 100.0 | | |
Percentages indicated are based upon total fixed income securities (excluding Money Market Funds).
Bond ratings apply to the underlying holdings of the Fund and not the Fund itself and are divided into categories ranging from AAA (highest) to D (lowest), and are subject to change. The ratings shown are determined by using the middle rating of Moody's, S&P, and Fitch after dropping the highest and lowest available ratings. When a rating from only two agencies is available, the lower rating is used. When a rating from only one agency is available, that rating is used. When a bond is not rated by one of these agencies, it is designated as Not rated. Credit ratings are subjective opinions and not statements of fact.
Investment Risks
There are risks associated with an investment in this Fund, including market risk, credit risk, interest rate risk prepayment and extension risk and state-specific municipal securities risk. In general, bond prices rise when interest rates fall and vice versa. Because the Fund concentrates its investments in municipal securities issued by a single state and its municipalities, specific events or factors affecting a particular state can cause more volatility in the Fund than a fund that is more geographically diversified. This effect is more pronounced for longer-term securities. Non-investment grade securities, commonly called 'high-yield' or 'junk' bonds, have more volatile prices and carry more risk to principal and income than investment grade securities. See the Fund's prospectus for information on these and other risks associated with Fund. Income from tax-exempt funds may be subject to state and local taxes. Federal and state income tax rules will apply to any capital gain distributions and any gains or losses on sales.
Annual Report 2014
4
Columbia Georgia Intermediate Municipal Bond Fund
Manager Discussion of Fund Performance (continued)
customer redemptions. We also eliminated the Fund's modest exposure to Puerto Rico, which, with recent downgrades, currently accounts for very little of the benchmark as well.
Contributors and Detractors
The Fund's overweight relative to the benchmark in issues rated A and underweight in higher quality issues rated AAA added results. Because we sold the Fund's only Puerto Rico holding early in the period, we avoided the large losses that ensued as all Puerto Rico credits came under pressure. Housing bonds and transportation issues aided results. In addition, the Fund's overweight in water and sewer issues, which generated better results than the benchmark components, supported the Fund's returns. These gains were somewhat offset by the Fund's overweight in the weakest performing segment of the yield curve, eight- to 12-year maturity range. Hospital and local general obligation bonds also detracted from results.
Georgia's Momentum Intact
Even though job growth slowed half way through the period, we believe the employment picture for Georgia is better than its neighboring Southern states and the U.S. average. Consumer and business services have been resilient, construction hiring has resumed and manufacturing employment bounced back from a weak stretch in 2013. At this time, housing prices are also up strongly. The current forecast for Georgia state and local government calls for an increase in public hiring in 2014, as state tax revenues have shown healthy gains. Disappointing population growth in 2013 weighs on Georgia's short-term outlook. However, we believe the state's multiple drivers of growth have the potential to lift Georgia to above-average growth over the longer term.
Looking Ahead
So far, we believe 2014 is lining up to be a better year for the municipal market than 2013. Overall returns have been better than they were in 2013, especially for longer-term municipal bonds. Even though we expect interest rates to continue to rise gradually through the end of 2014, we presently believe that the taxable equivalent yield on municipal bonds is still attractive to investors who are subject to higher federal tax rates. In this environment, we have currently positioned the Fund with neutral duration relative to the benchmark and with greater emphasis on issues rated A and BBB, which we believe have the potential to offer more value in an environment of slow but improving economic growth.
Annual Report 2014
5
Columbia Georgia Intermediate Municipal Bond Fund
Understanding Your Fund's Expenses
(Unaudited)
As an investor, you incur two types of costs. There are transaction costs, which generally include sales charges on purchases and may include redemption fees. There are also ongoing costs, which generally include management fees, distribution and/or service fees, and other fund expenses. The following information is intended to help you understand your ongoing costs (in dollars) of investing in the Fund and to help you compare these costs with the ongoing costs of investing in other mutual funds.
Analyzing Your Fund's Expenses
To illustrate these ongoing costs, we have provided examples and calculated the expenses paid by investors in each share class of the Fund during the period. The actual and hypothetical information in the table is based on an initial investment of $1,000 at the beginning of the period indicated and held for the entire period. Expense information is calculated two ways and each method provides you with different information. The amount listed in the "Actual" column is calculated using the Fund's actual operating expenses and total return for the period. You may use the Actual information, together with the amount invested, to estimate the expenses that you paid over the period. Simply divide your account value by $1,000 (for example, an $8,600 account value divided by $1,000 = 8.6), then multiply the results by the expenses paid during the period under the "Actual" column. The amount listed in the "Hypothetical" column assumes a 5% annual rate of return before expenses (which is not the Fund's actual return) and then applies the Fund's actual expense ratio for the period to the hypothetical return. You should not use the hypothetical account values and expenses to estimate either your actual account balance at the end of the period or the expenses you paid during the period. See "Compare With Other Funds" below for details on how to use the hypothetical data.
Compare With Other Funds
Since all mutual funds are required to include the same hypothetical calculations about expenses in shareholder reports, you can use this information to compare the ongoing cost of investing in the Fund with other funds. To do so, compare the hypothetical example with the 5% hypothetical examples that appear in the shareholder reports of other funds. As you compare hypothetical examples of other funds, it is important to note that hypothetical examples are meant to highlight the ongoing costs of investing in a fund only and do not reflect any transaction costs, such as sales charges, or redemption or exchange fees. Therefore, the hypothetical calculations are useful in comparing ongoing costs only, and will not help you determine the relative total costs of owning different funds. If transaction costs were included in these calculations, your costs would be higher.
November 1, 2013 – April 30, 2014
| | Account Value at the Beginning
of the Period ($) | | Account Value at the End
of the Period ($) | | Expenses Paid During
the Period ($) | | Fund's Annualized
Expense Ratio (%) | |
| | Actual | | Hypothetical | | Actual | | Hypothetical | | Actual | | Hypothetical | | Actual | |
Class A | | | 1,000.00 | | | | 1,000.00 | | | | 1,021.30 | | | | 1,020.78 | | | | 4.06 | | | | 4.06 | | | | 0.81 | | |
Class B | | | 1,000.00 | | | | 1,000.00 | | | | 1,016.60 | | | | 1,017.06 | | | | 7.80 | | | | 7.80 | | | | 1.56 | | |
Class C | | | 1,000.00 | | | | 1,000.00 | | | | 1,016.60 | | | | 1,017.06 | | | | 7.80 | | | | 7.80 | | | | 1.56 | | |
Class R4 | | | 1,000.00 | | | | 1,000.00 | | | | 1,021.70 | | | | 1,022.02 | | | | 2.81 | | | | 2.81 | | | | 0.56 | | |
Class Z | | | 1,000.00 | | | | 1,000.00 | | | | 1,022.50 | | | | 1,022.02 | | | | 2.81 | | | | 2.81 | | | | 0.56 | | |
Expenses paid during the period are equal to the annualized expense ratio for each class as indicated above, multiplied by the average account value over the period and then multiplied by the number of days in the Fund's most recent fiscal half year and divided by 365.
Expenses do not include fees and expenses incurred indirectly by the Fund from the underlying funds in which the Fund may invest (also referred to as "acquired funds"), including affiliated and non-affiliated pooled investment vehicles (including mutual funds and exchange-traded funds).
Had Columbia Management Investment Advisers, LLC and/or certain of its affiliates not waived/reimbursed certain fees and expenses, account value at the end of the period would have been reduced.
Annual Report 2014
6
Columbia Georgia Intermediate Municipal Bond Fund
Portfolio of Investments
April 30, 2014
(Percentages represent value of investments compared to net assets)
Municipal Bonds 96.6%
Issue
Description | | Coupon
Rate | | Principal
Amount ($) | |
Value ($) | |
Airport 3.6% | |
City of Atlanta Department of Aviation
Refunding Revenue Bonds
Series 2010C
01/01/25 | | | 5.000 | % | | | 1,500,000 | | | | 1,692,630 | | |
Revenue Bonds
Series 2012B
01/01/27 | | | 5.000 | % | | | 1,000,000 | | | | 1,132,410 | | |
Total | | | | | | | 2,825,040 | | |
Forest Products 1.3% | |
Richmond County Development Authority
Revenue Bonds
International Paper Co. Project
Series 2001A
03/01/15 | | | 5.150 | % | | | 1,000,000 | | | | 1,031,980 | | |
Higher Education 14.1% | |
Athens Housing Authority
Refunding Revenue Bonds
UGAREF East
Series 2010
12/01/16 | | | 4.000 | % | | | 250,000 | | | | 270,410 | | |
UGAREF East Campus Housing
Series 2011
12/01/25 | | | 5.000 | % | | | 1,000,000 | | | | 1,120,890 | | |
Bleckley County & Dodge County Joint Development Authority
Revenue Bonds
Middle Georgia College
Series 2008
07/01/21 | | | 5.000 | % | | | 1,260,000 | | | | 1,354,210 | | |
Bulloch County Development Authority
Refunding Revenue Bonds
Georgia Southern University Housing Foundation
Series 2012 (AGM)
08/01/27 | | | 5.000 | % | | | 1,000,000 | | | | 1,107,800 | | |
Revenue Bonds
Georgia Southern University Housing Foundation Four
Series 2008 (AGM)
07/01/20 | | | 5.250 | % | | | 1,000,000 | | | | 1,149,660 | | |
Carrollton Payroll Development Authority
Refunding Revenue Bonds
Anticipation Certificates - UWG Campus Center
Series 2012 (AGM)
08/01/25 | | | 5.000 | % | | | 1,225,000 | | | | 1,367,529 | | |
DeKalb Newton & Gwinnett Counties Joint Development Authority
Revenue Bonds
GGC Foundation LLC Project
Series 2009
07/01/24 | | | 5.500 | % | | | 2,500,000 | | | | 2,780,050 | | |
Municipal Bonds (continued)
Issue
Description | | Coupon
Rate | | Principal
Amount ($) | |
Value ($) | |
Richmond County Development Authority
Refunding Revenue Bonds
ASU Jaguar Student Housing
Series 2012 (AGM)
02/01/27 | | | 5.000 | % | | | 750,000 | | | | 827,295 | | |
South Regional Joint Development Authority
Revenue Bonds
VSU Auxiliary Services-Student
Series 2008A
08/01/23 | | | 5.000 | % | | | 1,125,000 | | | | 1,222,796 | | |
Total | | | | | | | 11,200,640 | | |
Hospital 7.6% | |
Cobb County Kennestone Hospital Authority
Revenue Bonds
Certificates
Series 2005B (AMBAC)
04/01/16 | | | 4.000 | % | | | 1,110,000 | | | | 1,178,620 | | |
DeKalb Private Hospital Authority
Revenue Bonds
Children's Healthcare
Series 2009
11/15/17 | | | 5.000 | % | | | 320,000 | | | | 362,339 | | |
Fayette County Hospital Authority
Revenue Bonds
Fayette Community Hospital
Series 2009A
06/15/23 | | | 5.250 | % | | | 2,000,000 | | | | 2,281,140 | | |
Gwinnett County Hospital Authority
Revenue Bonds
Gwinnet Hospital System
Series 2007A (AGM)
07/01/23 | | | 5.000 | % | | | 2,000,000 | | | | 2,186,140 | | |
Total | | | | | | | 6,008,239 | | |
Joint Power Authority 4.9% | |
Municipal Electric Authority of Georgia
Revenue Bonds
Linked Certificates
Series 1992B (NPFGC)
01/01/16 | | | 6.375 | % | | | 1,000,000 | | | | 1,061,380 | | |
Project One
Subordinated Series 2008A
01/01/21 | | | 5.250 | % | | | 1,395,000 | | | | 1,655,642 | | |
Subordinated Series 2008D
01/01/23 | | | 6.000 | % | | | 1,000,000 | | | | 1,184,740 | | |
Total | | | | | | | 3,901,762 | | |
Local Appropriation 7.8% | |
Atlanta Public Safety & Judicial Facilities Authority
Revenue Bonds
Public Safety Facility Project
Series 2006 (AGM)
12/01/17 | | | 5.000 | % | | | 1,310,000 | | | | 1,442,480 | | |
The accompanying Notes to Financial Statements are an integral part of this statement.
Annual Report 2014
7
Columbia Georgia Intermediate Municipal Bond Fund
Portfolio of Investments (continued)
April 30, 2014
Municipal Bonds (continued)
Issue
Description | | Coupon
Rate | | Principal
Amount ($) | |
Value ($) | |
Clayton County Development Authority
Refunding Revenue Bonds
Tuff Archives LLC
Series 2012
07/01/24 | | | 5.000 | % | | | 1,295,000 | | | | 1,485,935 | | |
Fulton County Facilities Corp.
Certificate of Participation
Fulton County Public Purpose Project
Series 2009
11/01/17 | | | 5.000 | % | | | 1,000,000 | | | | 1,130,920 | | |
Winder-Barrow Industrial Building Authority
Refunding Revenue Bonds
City of Winder Project
Series 2012 (AGM)
12/01/24 | | | 5.000 | % | | | 1,900,000 | | | | 2,161,231 | | |
Total | | | | | | | 6,220,566 | | |
Local General Obligation 12.3% | |
Atlanta Solid Waste Management Authority
Refunding Revenue Bonds
Series 2008 (AGM)
12/01/17 | | | 5.000 | % | | | 795,000 | | | | 908,939 | | |
Cherokee County Board of Education
Unlimited General Obligation Bonds
Series 2009A
08/01/22 | | | 5.000 | % | | | 2,000,000 | | | | 2,332,980 | | |
Series 2014A
08/01/30 | | | 5.000 | % | | | 1,000,000 | | | | 1,162,880 | | |
College Park Business & Industrial Development Authority
Refunding Revenue Bonds
Civic Center Project
Series 2005 (AMBAC)
09/01/19 | | | 5.250 | % | | | 1,000,000 | | | | 1,098,560 | | |
Gwinnett County School District
Unlimited General Obligation Refunding Bonds
Series 2010
02/01/24 | | | 5.000 | % | | | 1,500,000 | | | | 1,855,140 | | |
Savannah-Chatham County School District
Unlimited General Obligation Refunding Bonds
Series 2004 (AGM)
08/01/19 | | | 5.250 | % | | | 2,000,000 | | | | 2,385,560 | | |
Total | | | | | | | 9,744,059 | | |
Multi-Family 2.9% | |
Cobb County Development Authority
Revenue Bonds
KSU Village Real Estate
Series 2007A (AMBAC)
07/15/27 | | | 5.250 | % | | | 2,250,000 | | | | 2,296,215 | | |
Municipal Bonds (continued)
Issue
Description | | Coupon
Rate | | Principal
Amount ($) | |
Value ($) | |
Municipal Power 1.4% | |
City of Griffin
Refunding Revenue Bonds
Series 2012 (AGM)
01/01/22 | | | 4.000 | % | | | 750,000 | | | | 817,110 | | |
Guam Power Authority
Refunding Revenue Bonds
Series 2012A (AGM)(a)
10/01/24 | | | 5.000 | % | | | 220,000 | | | | 252,208 | | |
Total | | | | | | | 1,069,318 | | |
Prepaid Gas 0.4% | |
Main Street Natural Gas, Inc.
Revenue Bonds
Series 2007A
09/15/19 | | | 5.250 | % | | | 295,000 | | | | 334,524 | | |
Refunded/Escrowed 7.7% | |
Douglas County School District
Prerefunded 04/01/17 Unlimited General Obligation Bonds
Series 2007
04/01/21 | | | 5.000 | % | | | 1,110,000 | | | | 1,251,658 | | |
Unlimited General Obligation Prefunded 04/01/17 Bonds
Series 2007
04/01/21 | | | 5.000 | % | | | 890,000 | | | | 1,004,134 | | |
Gwinnett County School District
Prerefunded 02/01/18 Unlimited General Obligation Bonds
Series 2008
02/01/22 | | | 5.000 | % | | | 1,000,000 | | | | 1,150,190 | | |
State of Georgia
Prerefunded 12/01/17 Unlimited General Obligation Bonds
Series 2007G
12/01/20 | | | 5.000 | % | | | 1,000,000 | | | | 1,150,470 | | |
Walton County School District
Prerefunded 08/01/15 Unlimited General Obligation Bonds
Series 2005A (NPFGC)
08/01/22 | | | 5.000 | % | | | 1,500,000 | | | | 1,589,640 | | |
Total | | | | | | | 6,146,092 | | |
Special Non Property Tax 8.2% | |
Cobb-Marietta Coliseum & Exhibit Hall Authority
Refunding Revenue Bonds
Series 2005 (NPFGC)
10/01/19 | | | 5.250 | % | | | 2,430,000 | | | | 2,854,060 | | |
Metropolitan Atlanta Rapid Transit Authority
Refunding Revenue Bonds
Series 1992N (NPFGC/BNY)
07/01/18 | | | 6.250 | % | | | 1,535,000 | | | | 1,701,839 | | |
Third Indenture
Series 2012A
07/01/30 | | | 5.000 | % | | | 1,500,000 | | | | 1,675,545 | | |
The accompanying Notes to Financial Statements are an integral part of this statement.
Annual Report 2014
8
Columbia Georgia Intermediate Municipal Bond Fund
Portfolio of Investments (continued)
April 30, 2014
Municipal Bonds (continued)
Issue
Description | | Coupon
Rate | | Principal
Amount ($) | |
Value ($) | |
Territory of Guam
Revenue Bonds
Series 2011A(a)
01/01/31 | | | 5.000 | % | | | 300,000 | | | | 311,988 | | |
Total | | | | | | | 6,543,432 | | |
Special Property Tax 2.1% | |
City of Atlanta
Refunding Tax Allocation Bonds
Atlanta Station Project
Series 2007 (AGM)
12/01/20 | | | 5.250 | % | | | 1,545,000 | | | | 1,671,860 | | |
State General Obligation 2.9% | |
State of Georgia
Unlimited General Obligation Bonds
Series 2009D
05/01/23 | | | 5.000 | % | | | 2,000,000 | | | | 2,337,860 | | |
Transportation 4.2% | |
Georgia State Road & Tollway Authority
Revenue Bonds
Federal Highway Grant
BAN Series 2009A
06/01/21 | | | 5.000 | % | | | 1,000,000 | | | | 1,166,080 | | |
Federal Highway Grant - GARVEE
BAN Series 2006 (NPFGC)
06/01/16 | | | 5.000 | % | | | 2,000,000 | | | | 2,189,160 | | |
Total | | | | | | | 3,355,240 | | |
Water & Sewer 15.2% | |
Augusta Water & Sewerage
Refunding Revenue Bonds
Series 2007 (AGM)
10/01/21 | | | 5.000 | % | | | 1,000,000 | | | | 1,147,450 | | |
10/01/22 | | | 5.000 | % | | | 2,000,000 | | | | 2,292,720 | | |
City of Atlanta Water & Wastewater
Revenue Bonds
Series 2009B (AGM)
11/01/17 | | | 5.000 | % | | | 1,000,000 | | | | 1,140,170 | | |
Municipal Bonds (continued)
Issue
Description | | Coupon
Rate | | Principal
Amount ($) | |
Value ($) | |
County of DeKalb
Refunding Revenue Bond
Water & Sewerage
Series 2006B
10/01/21 | | | 5.250 | % | | | 2,000,000 | | | | 2,405,200 | | |
Jackson County Water & Sewer Authority
Revenue Bonds
Series 2006A (XLCA)
09/01/16 | | | 5.000 | % | | | 1,030,000 | | | | 1,106,344 | | |
Upper Oconee Basin Water Authority
Refunding Revenue Bonds
Series 2005 (NPFGC)
07/01/17 | | | 5.000 | % | | | 1,140,000 | | | | 1,284,563 | | |
07/01/22 | | | 5.000 | % | | | 1,000,000 | | | | 1,052,950 | | |
Walton County Water & Sewer Authority
Revenue Bonds
Hard Labor Creek Project
Series 2008 (AGM)
02/01/25 | | | 5.000 | % | | | 1,495,000 | | | | 1,674,624 | | |
Total | | | | | | | 12,104,021 | | |
Total Municipal Bonds
(Cost: $71,435,109) | | | | | | | 76,790,848 | | |
Money Market Funds 2.5%
| | | Shares | | Value ($) | |
JPMorgan Tax-Free Money Market Fund,
0.010%(b) | | | 1,958,147 | | | | 1,958,147 | | |
Total Money Market Funds
(Cost: $1,958,147) | | | | | 1,958,147 | | |
Total Investments
(Cost: $73,393,256) | | | | | 78,748,995 | | |
Other Assets & Liabilities, Net | | | | | 702,334 | | |
Net Assets | | | | | 79,451,329 | | |
Notes to Portfolio of Investments
(a) Municipal obligations include debt obligations issued by or on behalf of territories, possessions, or sovereign nations within the territorial boundaries of the United States. At April 30, 2014, the value of these securities amounted to $564,196 or 0.71% of net assets.
(b) The rate shown is the seven-day current annualized yield at April 30, 2014.
The accompanying Notes to Financial Statements are an integral part of this statement.
Annual Report 2014
9
Columbia Georgia Intermediate Municipal Bond Fund
Portfolio of Investments (continued)
April 30, 2014
Abbreviation Legend
AGM Assured Guaranty Municipal Corporation
AMBAC Ambac Assurance Corporation
BAN Bond Anticipation Note
BNY Bank of New York
NPFGC National Public Finance Guarantee Corporation
XLCA XL Capital Assurance
Fair Value Measurements
Generally accepted accounting principles (GAAP) require disclosure regarding the inputs and valuation techniques used to measure fair value and any changes in valuation inputs or techniques. In addition, investments shall be disclosed by major category.
The Fund categorizes its fair value measurements according to a three-level hierarchy that maximizes the use of observable inputs and minimizes the use of unobservable inputs by prioritizing that the most observable input be used when available. Observable inputs are those that market participants would use in pricing an investment based on market data obtained from sources independent of the reporting entity. Unobservable inputs are those that reflect the Fund's assumptions about the information market participants would use in pricing an investment. An investment's level within the fair value hierarchy is based on the lowest level of any input that is deemed significant to the asset or liability's fair value measurement. The input levels are not necessarily an indication of the risk or liquidity associated with investments at that level. For example, certain U.S. government securities are generally high quality and liquid, however, they are reflected as Level 2 because the inputs used to determine fair value may not always be quoted prices in an active market.
Fair value inputs are summarized in the three broad levels listed below:
> Level 1 — Valuations based on quoted prices for investments in active markets that the Fund has the ability to access at the measurement date (including NAV for open-end mutual funds). Valuation adjustments are not applied to Level 1 investments.
> Level 2 — Valuations based on other significant observable inputs (including quoted prices for similar securities, interest rates, prepayment speeds, credit risks, etc.).
> Level 3 — Valuations based on significant unobservable inputs (including the Fund's own assumptions and judgment in determining the fair value of investments).
Inputs that are used in determining fair value of an investment may include price information, credit data, volatility statistics, and other factors. These inputs can be either observable or unobservable. The availability of observable inputs can vary between investments, and is affected by various factors such as the type of investment, and the volume and level of activity for that investment or similar investments in the marketplace. The inputs will be considered by the Investment Manager, along with any other relevant factors in the calculation of an investment's fair value. The Fund uses prices and inputs that are current as of the measurement date, which may include periods of market dislocations. During these periods, the availability of prices and inputs may be reduced for many investments. This condition could cause an investment to be reclassified between the various levels within the hierarchy.
Investments falling into the Level 3 category are primarily supported by quoted prices from brokers and dealers participating in the market for those investments. However, these may be classified as Level 3 investments due to lack of market transparency and corroboration to support these quoted prices. Additionally, valuation models may be used as the pricing source for any remaining investments classified as Level 3. These models may rely on one or more significant unobservable inputs and/or significant assumptions by the Investment Manager. Inputs used in valuations may include, but are not limited to, financial statement analysis, capital account balances, discount rates and estimated cash flows, and comparable company data.
Under the direction of the Fund's Board of Trustees (the Board), the Investment Manager's Valuation Committee (the Committee) is responsible for overseeing the valuation procedures approved by the Board. The Committee consists of voting and non-voting members from various groups within the Investment Manager's organization, including operations and accounting, trading and investments, compliance, risk management and legal.
The Committee meets at least monthly to review and approve valuation matters, which may include a description of specific valuation determinations, data regarding pricing information received from approved pricing vendors and brokers and the results of Board-approved valuation control policies and procedures (the Policies). The Policies address, among other things, instances when market quotations are or are not readily available, including recommendations of third party pricing vendors and a determination of appropriate pricing methodologies; events that require specific valuation determinations and assessment of fair value techniques; securities with a potential for stale pricing, including those that are illiquid, restricted, or in default; and the effectiveness of third party pricing vendors, including periodic reviews of vendors. The Committee meets more frequently, as needed, to discuss additional valuation matters, which may include the need to review back-testing results, review time-sensitive information or approve related valuation actions. The Committee reports to the Board, with members of the Committee meeting with the Board at each of its regularly scheduled meetings to discuss valuation matters and actions during the period, similar to those described earlier.
The accompanying Notes to Financial Statements are an integral part of this statement.
Annual Report 2014
10
Columbia Georgia Intermediate Municipal Bond Fund
Portfolio of Investments (continued)
April 30, 2014
Fair Value Measurements (continued)
For investments categorized as Level 3, the Committee monitors information similar to that described above, which may include: (i) data specific to the issuer or comparable issuers, (ii) general market or specific sector news and (iii) quoted prices and specific or similar security transactions. The Committee considers this data and any changes from prior periods in order to assess the reasonableness of observable and unobservable inputs, any assumptions or internal models used to value those securities and changes in fair value. This data is also used to corroborate, when available, information received from approved pricing vendors and brokers. Various factors impact the frequency of monitoring this information (which may occur as often as daily). However, the Committee may determine that changes to inputs, assumptions and models are not required as a result of the monitoring procedures performed.
The following table is a summary of the inputs used to value the Fund's investments at April 30, 2014:
Description | | Level 1
Quoted Prices in Active
Markets for Identical
Assets ($) | | Level 2
Other Significant
Observable Inputs ($) | | Level 3
Significant
Unobservable Inputs ($) | | Total ($) | |
Bonds | |
Municipal Bonds | | | — | | | | 76,790,848 | | | | — | | | | 76,790,848 | | |
Total Bonds | | | — | | | | 76,790,848 | | | | — | | | | 76,790,848 | | |
Mutual Funds | |
Money Market Funds | | | 1,958,147 | | | | — | | | | — | | | | 1,958,147 | | |
Total Mutual Funds | | | 1,958,147 | | | | — | | | | — | | | | 1,958,147 | | |
Total | | | 1,958,147 | | | | 76,790,848 | | | | — | | | | 78,748,995 | | |
See the Portfolio of Investments for all investment classifications not indicated in the table.
The Fund's assets assigned to the Level 2 input category are generally valued using the market approach, in which a security's value is determined through reference to prices and information from market transactions for similar or identical assets.
There were no transfers of financial assets between levels during the period.
The accompanying Notes to Financial Statements are an integral part of this statement.
Annual Report 2014
11
Columbia Georgia Intermediate Municipal Bond Fund
Statement of Assets and Liabilities
April 30, 2014
Assets | |
Investments, at value | |
(identified cost $73,393,256) | | $ | 78,748,995 | | |
Receivable for: | |
Capital shares sold | | | 76,694 | | |
Interest | | | 1,007,223 | | |
Expense reimbursement due from Investment Manager | | | 655 | | |
Prepaid expenses | | | 614 | | |
Total assets | | | 79,834,181 | | |
Liabilities | |
Payable for: | |
Capital shares purchased | | | 34,247 | | |
Dividend distributions to shareholders | | | 196,936 | | |
Investment management fees | | | 871 | | |
Distribution and/or service fees | | | 216 | | |
Transfer agent fees | | | 14,521 | | |
Administration fees | | | 152 | | |
Compensation of board members | | | 105,547 | | |
Other expenses | | | 30,362 | | |
Total liabilities | | | 382,852 | | |
Net assets applicable to outstanding capital stock | | $ | 79,451,329 | | |
Represented by | |
Paid-in capital | | $ | 74,158,052 | | |
Undistributed net investment income | | | 140,766 | | |
Accumulated net realized loss | | | (203,228 | ) | |
Unrealized appreciation (depreciation) on: | |
Investments | | | 5,355,739 | | |
Total — representing net assets applicable to outstanding capital stock | | $ | 79,451,329 | | |
The accompanying Notes to Financial Statements are an integral part of this statement.
Annual Report 2014
12
Columbia Georgia Intermediate Municipal Bond Fund
Statement of Assets and Liabilities (continued)
April 30, 2014
Class A | |
Net assets | | $ | 16,728,035 | | |
Shares outstanding | | | 1,546,374 | | |
Net asset value per share | | $ | 10.82 | | |
Maximum offering price per share(a) | | $ | 11.18 | | |
Class B | |
Net assets | | $ | 212,389 | | |
Shares outstanding | | | 19,623 | | |
Net asset value per share | | $ | 10.82 | | |
Class C | |
Net assets | | $ | 3,500,932 | | |
Shares outstanding | | | 323,530 | | |
Net asset value per share | | $ | 10.82 | | |
Class R4 | |
Net assets | | $ | 36,933 | | |
Shares outstanding | | | 3,418 | | |
Net asset value per share(b) | | $ | 10.80 | | |
Class Z | |
Net assets | | $ | 58,973,040 | | |
Shares outstanding | | | 5,451,273 | | |
Net asset value per share | | $ | 10.82 | | |
(a) The maximum offering price per share is calculated by dividing the net asset value per share by 1.0 minus the maximum sales charge of 3.25%.
(b) Net asset value per share rounds to this amount due to fractional shares outstanding.
The accompanying Notes to Financial Statements are an integral part of this statement.
Annual Report 2014
13
Columbia Georgia Intermediate Municipal Bond Fund
Statement of Operations
Year Ended April 30, 2014
Net investment income | |
Income: | |
Dividends | | $ | 334 | | |
Interest | | | 3,127,201 | | |
Total income | | | 3,127,535 | | |
Expenses: | |
Investment management fees | | | 337,994 | | |
Distribution and/or service fees | |
Class A | | | 42,773 | | |
Class B | | | 2,094 | | |
Class C | | | 38,881 | | |
Transfer agent fees | |
Class A | | | 33,857 | | |
Class B | | | 415 | | |
Class C | | | 7,689 | | |
Class R4 | | | 9 | | |
Class Z | | | 125,163 | | |
Administration fees | | | 59,149 | | |
Compensation of board members | | | 25,164 | | |
Custodian fees | | | 1,691 | | |
Printing and postage fees | | | 21,228 | | |
Registration fees | | | 23,509 | | |
Professional fees | | | 34,565 | | |
Other | | | 24,241 | | |
Total expenses | | | 778,422 | | |
Fees waived or expenses reimbursed by Investment Manager and its affiliates | | | (221,483 | ) | |
Total net expenses | | | 556,939 | | |
Net investment income | | | 2,570,596 | | |
Realized and unrealized gain (loss) — net | |
Net realized gain (loss) on: | |
Investments | | | (203,228 | ) | |
Net realized loss | | | (203,228 | ) | |
Net change in unrealized appreciation (depreciation) on: | |
Investments | | | (2,737,552 | ) | |
Net change in unrealized appreciation (depreciation) | | | (2,737,552 | ) | |
Net realized and unrealized loss | | | (2,940,780 | ) | |
Net decrease in net assets from operations | | $ | (370,184 | ) | |
The accompanying Notes to Financial Statements are an integral part of this statement.
Annual Report 2014
14
Columbia Georgia Intermediate Municipal Bond Fund
Statement of Changes in Net Assets
| | | Year Ended
April 30,
2014 | | Year Ended
April 30,
2013(a) | |
Operations | |
Net investment income | | $ | 2,570,596 | | | $ | 3,038,674 | | |
Net realized gain (loss) | | | (203,228 | ) | | | 617,336 | | |
Net change in unrealized appreciation (depreciation) | | | (2,737,552 | ) | | | (210,967 | ) | |
Net increase (decrease) in net assets resulting from operations | | | (370,184 | ) | | | 3,445,043 | | |
Distributions to shareholders | |
Net investment income | |
Class A | | | (494,521 | ) | | | (576,263 | ) | |
Class B | | | (4,493 | ) | | | (5,354 | ) | |
Class C | | | (83,246 | ) | | | (86,232 | ) | |
Class R4 | | | (142 | ) | | | (9 | ) | |
Class Z | | | (1,988,246 | ) | | | (2,370,817 | ) | |
Net realized gains | |
Class A | | | (113,251 | ) | | | (16,344 | ) | |
Class B | | | (1,381 | ) | | | (190 | ) | |
Class C | | | (25,243 | ) | | | (3,430 | ) | |
Class R4 | | | (16 | ) | | | — | | |
Class Z | | | (404,861 | ) | | | (62,446 | ) | |
Total distributions to shareholders | | | (3,115,400 | ) | | | (3,121,085 | ) | |
Increase (decrease) in net assets from capital stock activity | | | (16,253,048 | ) | | | (5,196,092 | ) | |
Total decrease in net assets | | | (19,738,632 | ) | | | (4,872,134 | ) | |
Net assets at beginning of year | | | 99,189,961 | | | | 104,062,095 | | |
Net assets at end of year | | $ | 79,451,329 | | | $ | 99,189,961 | | |
Undistributed net investment income | | $ | 140,766 | | | $ | 165,802 | | |
(a) Class R4 shares are for the period from March 19, 2013 (commencement of operations) to April 30, 2013.
The accompanying Notes to Financial Statements are an integral part of this statement.
Annual Report 2014
15
Columbia Georgia Intermediate Municipal Bond Fund
Statement of Changes in Net Assets (continued)
| | | Year Ended April 30, 2014 | | Year Ended April 30, 2013(a) | |
| | | Shares | | Dollars ($) | | Shares | | Dollars ($) | |
Capital stock activity | |
Class A shares | |
Subscriptions(b) | | | 348,795 | | | | 3,717,506 | | | | 309,194 | | | | 3,462,505 | | |
Distributions reinvested | | | 37,421 | | | | 402,659 | | | | 39,862 | | | | 447,356 | | |
Redemptions | | | (758,732 | ) | | | (8,247,044 | ) | | | (207,091 | ) | | | (2,324,482 | ) | |
Net increase (decrease) | | | (372,516 | ) | | | (4,126,879 | ) | | | 141,965 | | | | 1,585,379 | | |
Class B shares | |
Subscriptions | | | 206 | | | | 2,213 | | | | 164 | | | | 1,846 | | |
Distributions reinvested | | | 297 | | | | 3,195 | | | | 284 | | | | 3,188 | | |
Redemptions(b) | | | (140 | ) | | | (1,507 | ) | | | (14,501 | ) | | | (162,758 | ) | |
Net increase (decrease) | | | 363 | | | | 3,901 | | | | (14,053 | ) | | | (157,724 | ) | |
Class C shares | |
Subscriptions | | | 61,401 | | | | 674,191 | | | | 127,657 | | | | 1,430,778 | | |
Distributions reinvested | | | 7,901 | | | | 84,936 | | | | 6,054 | | | | 67,973 | | |
Redemptions | | | (129,136 | ) | | | (1,384,926 | ) | | | (100,765 | ) | | | (1,127,857 | ) | |
Net increase (decrease) | | | (59,834 | ) | | | (625,799 | ) | | | 32,946 | | | | 370,894 | | |
Class R4 shares | |
Subscriptions | | | 3,189 | | | | 34,292 | | | | 224 | | | | 2,500 | | |
Distributions reinvested | | | 4 | | | | 42 | | | | 1 | | | | 6 | | |
Net increase | | | 3,193 | | | | 34,334 | | | | 225 | | | | 2,506 | | |
Class Z shares | |
Subscriptions | | | 447,121 | | | | 4,828,087 | | | | 778,048 | | | | 8,731,054 | | |
Distributions reinvested | | | 14,755 | | | | 158,690 | | | | 12,415 | | | | 139,348 | | |
Redemptions | | | (1,533,223 | ) | | | (16,525,382 | ) | | | (1,415,307 | ) | | | (15,867,549 | ) | |
Net decrease | | | (1,071,347 | ) | | | (11,538,605 | ) | | | (624,844 | ) | | | (6,997,147 | ) | |
Total net decrease | | | (1,500,141 | ) | | | (16,253,048 | ) | | | (463,761 | ) | | | (5,196,092 | ) | |
(a) Class R4 shares are for the period from March 19, 2013 (commencement of operations) to April 30, 2013.
(b) Includes conversions of Class B shares to Class A shares, if any.
The accompanying Notes to Financial Statements are an integral part of this statement.
Annual Report 2014
16
Columbia Georgia Intermediate Municipal Bond Fund
The following tables are intended to help you understand the Fund's financial performance. Certain information reflects financial results for a single share of a class held for the periods shown. Per share net investment income (loss) amounts are calculated based on average shares outstanding during the period. Total return assumes reinvestment of all dividends and distributions, if any. Total return does not reflect payment of sales charges, if any, and is not annualized for periods of less than one year.
| | | Year Ended April 30, | | Year Ended March 31, | |
Class A | | 2014 | | 2013 | | 2012(a) | | 2012 | | 2011 | | 2010 | |
Per share data | |
Net asset value, beginning of period | | $ | 11.21 | | | $ | 11.18 | | | $ | 11.09 | | | $ | 10.50 | | | $ | 10.58 | | | $ | 10.18 | | |
Income from investment operations: | |
Net investment income | | | 0.31 | | | | 0.31 | | | | 0.03 | | | | 0.33 | | | | 0.33 | | | | 0.34 | | |
Net realized and unrealized gain (loss) | | | (0.32 | ) | | | 0.04 | | | | 0.09 | | | | 0.59 | | | | (0.08 | ) | | | 0.40 | | |
Total from investment operations | | | (0.01 | ) | | | 0.35 | | | | 0.12 | | | | 0.92 | | | | 0.25 | | | | 0.74 | | |
Less distributions to shareholders: | |
Net investment income | | | (0.31 | ) | | | (0.31 | ) | | | (0.03 | ) | | | (0.33 | ) | | | (0.33 | ) | | | (0.34 | ) | |
Net realized gains | | | (0.07 | ) | | | (0.01 | ) | | | — | | | | — | | | | — | | | | — | | |
Total distributions to shareholders | | | (0.38 | ) | | | (0.32 | ) | | | (0.03 | ) | | | (0.33 | ) | | | (0.33 | ) | | | (0.34 | ) | |
Net asset value, end of period | | $ | 10.82 | | | $ | 11.21 | | | $ | 11.18 | | | $ | 11.09 | | | $ | 10.50 | | | $ | 10.58 | | |
Total return | | | 0.02 | % | | | 3.16 | % | | | 1.05 | % | | | 8.85 | % | | | 2.35 | % | | | 7.31 | % | |
Ratios to average net assets(b) | |
Total gross expenses | | | 1.07 | % | | | 1.03 | % | | | 1.02 | %(c) | | | 1.04 | % | | | 0.99 | % | | | 0.95 | % | |
Total net expenses(d) | | | 0.81 | % | | | 0.81 | % | | | 0.80 | %(c) | | | 0.80 | %(e) | | | 0.80 | %(e) | | | 0.78 | %(e) | |
Net investment income | | | 2.89 | % | | | 2.77 | % | | | 2.92 | %(c) | | | 2.99 | % | | | 3.09 | % | | | 3.20 | % | |
Supplemental data | |
Net assets, end of period (in thousands) | | $ | 16,728 | | | $ | 21,517 | | | $ | 19,861 | | | $ | 19,563 | | | $ | 19,641 | | | $ | 19,433 | | |
Portfolio turnover | | | 5 | % | | | 16 | % | | | 0 | % | | | 11 | % | | | 11 | % | | | 22 | % | |
Notes to Financial Highlights
(a) For the period from April 1, 2012 to April 30, 2012. During the period, the Fund's fiscal year end was changed from March 31 to April 30.
(b) In addition to the fees and expenses which the Fund bears directly, the Fund indirectly bears a pro rata share of the fees and expenses of the acquired funds in which it invests. Such indirect expenses are not included in the reported expense ratios.
(c) Annualized.
(d) Total net expenses include the impact of certain waivers/reimbursements made by the Investment Manager and certain of its affiliates, if applicable.
(e) The benefits derived from expense reductions had an impact of less than 0.01%.
The accompanying Notes to Financial Statements are an integral part of this statement.
Annual Report 2014
17
Columbia Georgia Intermediate Municipal Bond Fund
Financial Highlights (continued)
| | | Year Ended April 30, | | Year Ended March 31, | |
Class B | | 2014 | | 2013 | | 2012(a) | | 2012 | | 2011 | | 2010 | |
Per share data | |
Net asset value, beginning of period | | $ | 11.22 | | | $ | 11.18 | | | $ | 11.10 | | | $ | 10.50 | | | $ | 10.58 | | | $ | 10.19 | | |
Income from investment operations: | |
Net investment income | | | 0.23 | | | | 0.23 | | | | 0.02 | | | | 0.24 | | | | 0.25 | | | | 0.26 | | |
Net realized and unrealized gain (loss) | | | (0.33 | ) | | | 0.05 | | | | 0.08 | | | | 0.60 | | | | (0.08 | ) | | | 0.39 | | |
Total from investment operations | | | (0.10 | ) | | | 0.28 | | | | 0.10 | | | | 0.84 | | | | 0.17 | | | | 0.65 | | |
Less distributions to shareholders: | |
Net investment income | | | (0.23 | ) | | | (0.23 | ) | | | (0.02 | ) | | | (0.24 | ) | | | (0.25 | ) | | | (0.26 | ) | |
Net realized gains | | | (0.07 | ) | | | (0.01 | ) | | | — | | | | — | | | | — | | | | — | | |
Total distributions to shareholders | | | (0.30 | ) | | | (0.24 | ) | | | (0.02 | ) | | | (0.24 | ) | | | (0.25 | ) | | | (0.26 | ) | |
Net asset value, end of period | | $ | 10.82 | | | $ | 11.22 | | | $ | 11.18 | | | $ | 11.10 | | | $ | 10.50 | | | $ | 10.58 | | |
Total return | | | (0.82 | %) | | | 2.48 | % | | | 0.90 | % | | | 8.10 | % | | | 1.59 | % | | | 6.41 | % | |
Ratios to average net assets(b) | |
Total gross expenses | | | 1.83 | % | | | 1.78 | % | | | 1.77 | %(c) | | | 1.81 | % | | | 1.74 | % | | | 1.70 | % | |
Total net expenses(d) | | | 1.56 | % | | | 1.56 | % | | | 1.55 | %(c) | | | 1.55 | %(e) | | | 1.55 | %(e) | | | 1.53 | %(e) | |
Net investment income | | | 2.15 | % | | | 2.04 | % | | | 2.17 | %(c) | | | 2.25 | % | | | 2.33 | % | | | 2.47 | % | |
Supplemental data | |
Net assets, end of period (in thousands) | | $ | 212 | | | $ | 216 | | | $ | 373 | | | $ | 369 | | | $ | 528 | | | $ | 886 | | |
Portfolio turnover | | | 5 | % | | | 16 | % | | | 0 | % | | | 11 | % | | | 11 | % | | | 22 | % | |
Notes to Financial Highlights
(a) For the period from April 1, 2012 to April 30, 2012. During the period, the Fund's fiscal year end was changed from March 31 to April 30.
(b) In addition to the fees and expenses which the Fund bears directly, the Fund indirectly bears a pro rata share of the fees and expenses of the acquired funds in which it invests. Such indirect expenses are not included in the reported expense ratios.
(c) Annualized.
(d) Total net expenses include the impact of certain waivers/reimbursements made by the Investment Manager and certain of its affiliates, if applicable.
(e) The benefits derived from expense reductions had an impact of less than 0.01%.
The accompanying Notes to Financial Statements are an integral part of this statement.
Annual Report 2014
18
Columbia Georgia Intermediate Municipal Bond Fund
Financial Highlights (continued)
| | | Year Ended April 30, | | Year Ended March 31, | |
Class C | | 2014 | | 2013 | | 2012(a) | | 2012 | | 2011 | | 2010 | |
Per share data | |
Net asset value, beginning of period | | $ | 11.22 | | | $ | 11.18 | | | $ | 11.09 | | | $ | 10.50 | | | $ | 10.58 | | | $ | 10.18 | | |
Income from investment operations: | |
Net investment income | | | 0.23 | | | | 0.23 | | | | 0.02 | | | | 0.24 | | | | 0.25 | | | | 0.26 | | |
Net realized and unrealized gain (loss) | | | (0.33 | ) | | | 0.04 | | | | 0.09 | | | | 0.59 | | | | (0.08 | ) | | | 0.40 | | |
Total from investment operations | | | (0.10 | ) | | | 0.27 | | | | 0.11 | | | | 0.83 | | | | 0.17 | | | | 0.66 | | |
Less distributions to shareholders: | |
Net investment income | | | (0.23 | ) | | | (0.22 | ) | | | (0.02 | ) | | | (0.24 | ) | | | (0.25 | ) | | | (0.26 | ) | |
Net realized gains | | | (0.07 | ) | | | (0.01 | ) | | | — | | | | — | | | | — | | | | — | | |
Total distributions to shareholders | | | (0.30 | ) | | | (0.23 | ) | | | (0.02 | ) | | | (0.24 | ) | | | (0.25 | ) | | | (0.26 | ) | |
Net asset value, end of period | | $ | 10.82 | | | $ | 11.22 | | | $ | 11.18 | | | $ | 11.09 | | | $ | 10.50 | | | $ | 10.58 | | |
Total return | | | (0.82 | %) | | | 2.48 | % | | | 0.99 | % | | | 8.00 | % | | | 1.59 | % | | | 6.51 | % | |
Ratios to average net assets(b) | |
Total gross expenses | | | 1.82 | % | | | 1.78 | % | | | 1.77 | %(c) | | | 1.78 | % | | | 1.74 | % | | | 1.70 | % | |
Total net expenses(d) | | | 1.56 | % | | | 1.56 | % | | | 1.55 | %(c) | | | 1.55 | %(e) | | | 1.55 | %(e) | | | 1.53 | %(e) | |
Net investment income | | | 2.14 | % | | | 2.02 | % | | | 2.17 | %(c) | | | 2.23 | % | | | 2.34 | % | | | 2.42 | % | |
Supplemental data | |
Net assets, end of period (in thousands) | | $ | 3,501 | | | $ | 4,301 | | | $ | 3,919 | | | $ | 4,066 | | | $ | 3,347 | | | $ | 3,567 | | |
Portfolio turnover | | | 5 | % | | | 16 | % | | | 0 | % | | | 11 | % | | | 11 | % | | | 22 | % | |
Notes to Financial Highlights
(a) For the period from April 1, 2012 to April 30, 2012. During the period, the Fund's fiscal year end was changed from March 31 to April 30.
(b) In addition to the fees and expenses which the Fund bears directly, the Fund indirectly bears a pro rata share of the fees and expenses of the acquired funds in which it invests. Such indirect expenses are not included in the reported expense ratios.
(c) Annualized.
(d) Total net expenses include the impact of certain waivers/reimbursements made by the Investment Manager and certain of its affiliates, if applicable.
(e) The benefits derived from expense reductions had an impact of less than 0.01%.
The accompanying Notes to Financial Statements are an integral part of this statement.
Annual Report 2014
19
Columbia Georgia Intermediate Municipal Bond Fund
Financial Highlights (continued)
| | | Year Ended April 30, | |
Class R4 | | 2014 | | 2013(a) | |
Per share data | |
Net asset value, beginning of period | | $ | 11.20 | | | $ | 11.12 | | |
Income from investment operations: | |
Net investment income | | | 0.34 | | | | 0.04 | | |
Net realized and unrealized gain (loss) | | | (0.33 | ) | | | 0.08 | | |
Total from investment operations | | | 0.01 | | | | 0.12 | | |
Less distributions to shareholders: | |
Net investment income | | | (0.34 | ) | | | (0.04 | ) | |
Net realized gains | | | (0.07 | ) | | | — | | |
Total distributions to shareholders | | | (0.41 | ) | | | (0.04 | ) | |
Net asset value, end of period | | $ | 10.80 | | | $ | 11.20 | | |
Total return | | | 0.18 | % | | | 1.07 | % | |
Ratios to average net assets(b) | |
Total gross expenses | | | 0.88 | % | | | 0.72 | %(c) | |
Total net expenses(d) | | | 0.56 | % | | | 0.53 | %(c) | |
Net investment income | | | 3.21 | % | | | 3.12 | %(c) | |
Supplemental data | |
Net assets, end of period (in thousands) | | $ | 37 | | | $ | 3 | | |
Portfolio turnover | | | 5 | % | | | 16 | % | |
Notes to Financial Highlights
(a) For the period from March 19, 2013 (commencement of operations) to April 30, 2013.
(b) In addition to the fees and expenses which the Fund bears directly, the Fund indirectly bears a pro rata share of the fees and expenses of the acquired funds in which it invests. Such indirect expenses are not included in the reported expense ratios.
(c) Annualized.
(d) Total net expenses include the impact of certain waivers/reimbursements made by the Investment Manager and certain of its affiliates, if applicable.
The accompanying Notes to Financial Statements are an integral part of this statement.
Annual Report 2014
20
Columbia Georgia Intermediate Municipal Bond Fund
Financial Highlights (continued)
| | | Year Ended April 30, | | Year Ended March 31, | |
Class Z | | 2014 | | 2013 | | 2012(a) | | 2012 | | 2011 | | 2010 | |
Per share data | |
Net asset value, beginning of period | | $ | 11.22 | | | $ | 11.18 | | | $ | 11.09 | | | $ | 10.50 | | | $ | 10.58 | | | $ | 10.18 | | |
Income from investment operations: | |
Net investment income | | | 0.34 | | | | 0.34 | | | | 0.03 | | | | 0.35 | | | | 0.36 | | | | 0.36 | | |
Net realized and unrealized gain (loss) | | | (0.33 | ) | | | 0.05 | | | | 0.09 | | | | 0.59 | | | | (0.08 | ) | | | 0.40 | | |
Total from investment operations | | | 0.01 | | | | 0.39 | | | | 0.12 | | | | 0.94 | | | | 0.28 | | | | 0.76 | | |
Less distributions to shareholders: | |
Net investment income | | | (0.34 | ) | | | (0.34 | ) | | | (0.03 | ) | | | (0.35 | ) | | | (0.36 | ) | | | (0.36 | ) | |
Net realized gains | | | (0.07 | ) | | | (0.01 | ) | | | — | | | | — | | | | — | | | | — | | |
Total distributions to shareholders | | | (0.41 | ) | | | (0.35 | ) | | | (0.03 | ) | | | (0.35 | ) | | | (0.36 | ) | | | (0.36 | ) | |
Net asset value, end of period | | $ | 10.82 | | | $ | 11.22 | | | $ | 11.18 | | | $ | 11.09 | | | $ | 10.50 | | | $ | 10.58 | | |
Total return | | | 0.18 | % | | | 3.51 | % | | | 1.07 | % | | | 9.08 | % | | | 2.61 | % | | | 7.58 | % | |
Ratios to average net assets(b) | |
Total gross expenses | | | 0.82 | % | | | 0.78 | % | | | 0.77 | %(c) | | | 0.79 | % | | | 0.74 | % | | | 0.70 | % | |
Total net expenses(d) | | | 0.56 | % | | | 0.56 | % | | | 0.55 | %(c) | | | 0.55 | %(e) | | | 0.55 | %(e) | | | 0.53 | %(e) | |
Net investment income | | | 3.14 | % | | | 3.02 | % | | | 3.17 | %(c) | | | 3.24 | % | | | 3.34 | % | | | 3.46 | % | |
Supplemental data | |
Net assets, end of period (in thousands) | | $ | 58,973 | | | $ | 73,154 | | | $ | 79,910 | | | $ | 79,371 | | | $ | 85,305 | | | $ | 110,040 | | |
Portfolio turnover | | | 5 | % | | | 16 | % | | | 0 | % | | | 11 | % | | | 11 | % | | | 22 | % | |
Notes to Financial Highlights
(a) For the period from April 1, 2012 to April 30, 2012. During the period, the Fund's fiscal year end was changed from March 31 to April 30.
(b) In addition to the fees and expenses which the Fund bears directly, the Fund indirectly bears a pro rata share of the fees and expenses of the acquired funds in which it invests. Such indirect expenses are not included in the reported expense ratios.
(c) Annualized.
(d) Total net expenses include the impact of certain waivers/reimbursements made by the Investment Manager and certain of its affiliates, if applicable.
(e) The benefits derived from expense reductions had an impact of less than 0.01%.
The accompanying Notes to Financial Statements are an integral part of this statement.
Annual Report 2014
21
Columbia Georgia Intermediate Municipal Bond Fund
Notes to Financial Statements
April 30, 2014
Note 1. Organization
Columbia Georgia Intermediate Municipal Bond Fund (the Fund), a series of Columbia Funds Series Trust (the Trust), is a diversified fund. The Trust is registered under the Investment Company Act of 1940, as amended (the 1940 Act), as an open-end management investment company organized as a Delaware statutory trust.
Fund Shares
The Trust may issue an unlimited number of shares (without par value). The Fund offers Class A, Class B, Class C, Class R4 and Class Z shares. Although all share classes generally have identical voting, dividend and liquidation rights, each share class votes separately when required by law. Different share classes pay different distribution amounts to the extent the expenses of such share classes differ, and distributions in liquidation will be proportional to the net asset value of each share class. Each share class has its own expense structure and sales charges, as applicable.
Class A shares are subject to a maximum front-end sales charge of 3.25% based on the initial investment amount. Class A shares purchased without an initial sales charge in accounts aggregating $1 million to $50 million at the time of purchase are subject to a contingent deferred sales charge (CDSC) if the shares are sold within 18 months of purchase, charged as follows: 1.00% CDSC if redeemed within 12 months of purchase, and 0.50% CDSC if redeemed more than 12, but less than 18, months after purchase.
Class B shares may be subject to a maximum CDSC of 3.00% based upon the holding period after purchase. Class B shares will generally convert to Class A shares eight years after purchase. The Fund no longer accepts investments by new or existing investors in the Fund's Class B shares, except in connection with the reinvestment of any dividend and/or capital gain distributions in Class B shares of the Fund and exchanges by existing Class B shareholders of certain other funds within the Columbia Family of Funds.
Class C shares are subject to a 1.00% CDSC on shares redeemed within one year of purchase.
Class R4 shares are not subject to sales charges and are generally available only to omnibus retirement plans and certain other eligible investors.
Class Z shares are not subject to sales charges and are available only to certain eligible investors, which are subject to different investment minimums.
Note 2. Summary of Significant Accounting Policies
Use of Estimates
The preparation of financial statements in accordance with U.S. generally accepted accounting principles (GAAP) requires management to make certain estimates and assumptions that affect the reported amounts of assets and liabilities, the disclosure of contingent assets and liabilities at the date of the financial statements and the reported amounts of revenue and expenses during the reporting period. Actual results could differ from those estimates.
The following is a summary of significant accounting policies consistently followed by the Fund in the preparation of its financial statements.
Security Valuation
Debt securities generally are valued by pricing services approved by the Board of Trustees (the Board) based upon market transactions for normal, institutional-size trading units of similar securities. The services may use various pricing techniques which take into account appropriate factors such as yield, quality, coupon rate, maturity, type of issue, trading characteristics and other data, as well as broker quotes. Debt securities for which quotations are readily available may also be valued based upon an over-the-counter or exchange bid quotation.
Investments in open-end investment companies, including money market funds, are valued at net asset value.
Investments for which market quotations are not readily available, or that have quotations which management believes are not reliable, are valued at fair value as determined in good faith under consistently applied procedures established by and under the general supervision of the Board. If a security or class of securities (such as foreign securities) is valued at fair value, such value is likely to be different from the last quoted market price for the security.
The determination of fair value often requires significant judgment. To determine fair value, management may use assumptions including but not limited to future cash flows and estimated risk premiums. Multiple inputs from various sources may be used to determine fair value.
Security Transactions
Security transactions are accounted for on the trade date. Cost is determined and gains (losses) are based upon the specific identification method for both financial statement and federal income tax purposes.
Annual Report 2014
22
Columbia Georgia Intermediate Municipal Bond Fund
Notes to Financial Statements (continued)
April 30, 2014
Income Recognition
Interest income is recorded on an accrual basis. Market premiums and discounts, including original issue discounts, are amortized and accreted, respectively, over the expected life of the security on all debt securities, unless otherwise noted.
Dividend income is recorded on the ex-dividend date.
Expenses
General expenses of the Trust are allocated to the Fund and other funds of the Trust based upon relative net assets or other expense allocation methodologies determined by the nature of the expense. Expenses directly attributable to the Fund are charged to the Fund. Expenses directly attributable to a specific class of shares are charged to that share class.
Determination of Class Net Asset Value
All income, expenses (other than class-specific expenses, which are charged to that share class, as shown in the Statement of Operations) and realized and unrealized gains (losses) are allocated to each class of the Fund on a daily basis, based on the relative net assets of each class, for purposes of determining the net asset value of each class.
Federal Income Tax Status
The Fund intends to qualify each year as a regulated investment company under Subchapter M of the Internal Revenue Code, as amended, and will distribute substantially all of its tax exempt and taxable income (including net short-term capital gains), if any, for its tax year, and as such will not be subject to federal income taxes. In addition, the Fund intends to distribute in each calendar year substantially all of its net investment income, capital gains and certain other amounts, if any, such that the Fund should not be subject to federal excise tax. Therefore, no federal income or excise tax provision is recorded.
Distributions to Shareholders
Distributions from net investment income, if any, are declared daily and paid monthly. Net realized capital gains, if any, are distributed at least annually. Income distributions and capital gain distributions are determined in accordance with federal income tax regulations, which may differ from GAAP.
Guarantees and Indemnifications
Under the Trust's organizational documents and, in some cases, by contract, its officers and trustees are indemnified against certain liabilities arising out of the performance of their duties to the Trust or its funds. In addition, certain of the Fund's contracts with its service providers contain general indemnification clauses. The Fund's maximum exposure under these arrangements is unknown since the amount of any
future claims that may be made against the Fund cannot be determined, and the Fund has no historical basis for predicting the likelihood of any such claims.
Note 3. Fees and Compensation Paid to Affiliates
Investment Management Fees
Under an Investment Management Services Agreement, Columbia Management Investment Advisers, LLC (the Investment Manager), a wholly-owned subsidiary of Ameriprise Financial, Inc. (Ameriprise Financial), determines which securities will be purchased, held or sold. The investment management fee is an annual fee that is equal to a percentage of the Fund's average daily net assets that declines from 0.40% to 0.27% as the Fund's net assets increase. The effective investment management fee rate for the year ended April 30, 2014 was 0.40% of the Fund's average daily net assets.
Administration Fees
Under an Administrative Services Agreement, the Investment Manager also serves as the Fund Administrator. The Fund pays the Fund Administrator an annual fee for administration and accounting services equal to a percentage of the Fund's average daily net assets that declines from 0.07% to 0.04% as the Fund's net assets increase. The effective administration fee rate for the year ended April 30, 2014 was 0.07% of the Fund's average daily net assets.
Other Expenses
Other expenses are for, among other things, miscellaneous expenses of the Fund or the Board, including payments to a company providing limited administrative services to the Fund and the Board. That company's expenses include boardroom and office expense, employee compensation, employee health and retirement benefits, and certain other expenses. For the year ended April 30, 2014, other expenses paid to this company were $1,633.
Compensation of Board Members
Board members are compensated for their services to the Fund as disclosed in the Statement of Operations. Under a Deferred Compensation Plan (the Plan), the Board members who are not "interested persons" of the Fund, as defined under the 1940 Act, may elect to defer payment of up to 100% of their compensation. Deferred amounts are treated as though equivalent dollar amounts had been invested in shares of certain funds managed by the Investment Manager. The Fund's liability for these amounts is adjusted for market value changes and remains in the Fund until distributed in accordance with the Plan.
Annual Report 2014
23
Columbia Georgia Intermediate Municipal Bond Fund
Notes to Financial Statements (continued)
April 30, 2014
Transfer Agent Fees
Under a Transfer and Dividend Disbursing Agent Agreement, Columbia Management Investment Services Corp. (the Transfer Agent), an affiliate of the Investment Manager and a wholly-owned subsidiary of Ameriprise Financial, is responsible for providing transfer agency services to the Fund. The Transfer Agent has contracted with Boston Financial Data Services (BFDS) to serve as sub-transfer agent.
The Transfer Agent receives monthly account-based service fees based on the number of open accounts and also receives sub-transfer agency fees based on a percentage of the average aggregate value of the Fund's shares maintained in omnibus accounts (other than omnibus accounts for which American Enterprise Investment Services Inc. is the broker of record or accounts where the beneficial shareholder is a customer of Ameriprise Financial Services, Inc., which are paid a per account fee). The Transfer Agent pays the fees of BFDS for services as sub-transfer agent and is not entitled to reimbursement for such fees from the Fund (with the exception of out-of-pocket fees).
The Transfer Agent also receives compensation from fees for various shareholder services and reimbursements for certain out-of-pocket fees.
For the year ended April 30, 2014, the Fund's effective transfer agent fee rates as a percentage of average daily net assets of each class were as follows:
Class A | | | 0.20 | % | |
Class B | | | 0.20 | | |
Class C | | | 0.20 | | |
Class R4 | | | 0.20 | | |
Class Z | | | 0.20 | | |
An annual minimum account balance fee of $20 may apply to certain accounts with a value below the applicable share class's initial minimum investment requirements to reduce the impact of small accounts on transfer agent fees. These minimum account balance fees are recorded as part of expense reductions in the Statement of Operations. For the year ended April 30, 2014, no minimum account balance fees were charged by the Fund.
Distribution and Service Fees
The Fund has an agreement with Columbia Management Investment Distributors, Inc. (the Distributor), an affiliate of the Investment Manager and a wholly-owned subsidiary of Ameriprise Financial, for distribution and shareholder services. The Board has approved, and the Fund has adopted, distribution and shareholder service plans (the Plans) applicable to certain share classes, which set the distribution
and service fees for the Fund. These fees are calculated daily and are intended to compensate the Distributor and/or eligible selling and/or servicing agents for selling shares of the Fund and providing services to investors.
Under the Plans, the Fund pays a monthly combined distribution and service fee to the Distributor at the maximum annual rate of 0.25% of the average daily net assets attributable to Class A shares of the Fund. Also under the Plans, the Fund pays a monthly service fee at the maximum annual rate of 0.25% of the average daily net assets attributable to Class B and Class C shares of the Fund and the payment of a monthly distribution fee at the maximum annual rate of 0.75% of the average daily net assets attributable to Class B and Class C shares of the Fund.
Sales Charges
Sales charges, including front-end charges and CDSCs, received by the Distributor for distributing Fund shares were $6,518 for Class A and $1,256 for Class C shares for the year ended April 30, 2014.
Expenses Waived/Reimbursed by the Investment Manager and its Affiliates
The Investment Manager and certain of its affiliates have contractually agreed to waive fees and/or reimburse expenses (excluding certain fees and expenses described below) for the period disclosed below, unless sooner terminated at the sole discretion of the Board, so that the Fund's net operating expenses, after giving effect to fees waived/expenses reimbursed and any balance credits and/or overdraft charges from the Fund's custodian, do not exceed the following annual rates as a percentage of the class' average daily net assets:
| | | Fee Rates Contractual
through
August 31, 2014 | |
Class A | | | 0.81 | % | |
Class B | | | 1.56 | | |
Class C | | | 1.56 | | |
Class R4 | | | 0.56 | | |
Class Z | | | 0.56 | | |
Under the agreement governing these fee waivers and/or expense reimbursement arrangements, the following fees and expenses are excluded from the waiver/reimbursement commitment, and therefore will be paid by the Fund, if applicable: taxes (including foreign transaction taxes), expenses associated with investments in affiliated and non-affiliated pooled investment vehicles (including mutual funds and exchange-traded funds), transaction costs and brokerage commissions, costs related to any securities lending program, dividend expenses associated with securities sold short,
Annual Report 2014
24
Columbia Georgia Intermediate Municipal Bond Fund
Notes to Financial Statements (continued)
April 30, 2014
inverse floater program fees and expenses, transaction charges and interest on borrowed money, interest, extraordinary expenses and any other expenses the exclusion of which is specifically approved by the Board. This agreement may be modified or amended only with approval from all parties.
Note 4. Federal Tax Information
The timing and character of income and capital gain distributions are determined in accordance with income tax regulations, which may differ from GAAP because of temporary or permanent book to tax differences.
At April 30, 2014, these differences are primarily due to differing treatment for capital loss carryforwards, Trustees' deferred compensation and distributions. To the extent these differences are permanent, reclassifications are made among the components of the Fund's net assets in the Statement of Assets and Liabilities. Temporary differences do not require reclassifications. In the Statement of Assets and Liabilities the following reclassifications were made:
Undistributed net investment income | | $ | (24,984 | ) | |
Accumulated net realized loss | | | 24,984 | | |
Net investment income and net realized gains (losses), as disclosed in the Statement of Operations, and net assets were not affected by this reclassification.
The tax character of distributions paid during the years indicated was as follows:
Year Ended April 30, | | 2014 | | 2013 | |
Ordinary income | | $ | 8,960 | | | $ | — | | |
Long-term capital gains | | | 510,808 | | | | 82,410 | | |
Tax-exempt income | | | 2,595,632 | | | | 3,038,675 | | |
Total | | $ | 3,115,400 | | | $ | 3,121,085 | | |
Short-term capital gain distributions, if any, are considered ordinary income distributions for tax purposes.
At April 30, 2014, the components of distributable earnings on a tax basis were as follows:
Undistributed tax-exempt income | | $ | 443,231 | | |
Capital loss carryforwards | | | (203,228 | ) | |
Net unrealized appreciation | | | 5,355,739 | | |
At April 30, 2014, the cost of investments for federal income tax purposes was $73,393,256 and the aggregate gross unrealized appreciation and depreciation based on that cost was:
Unrealized appreciation | | $ | 5,510,818 | | |
Unrealized depreciation | | | (155,079 | ) | |
Net unrealized appreciation | | $ | 5,355,739 | | |
The following capital loss carryforward, determined at April 30, 2014, may be available to reduce taxable income arising from future net realized gains on investments, if any, to the extent permitted by the Internal Revenue Code:
Year of Expiration | | Amount | |
Unlimited short-term | | $ | 203,228 | | |
Management of the Fund has concluded that there are no significant uncertain tax positions that would require recognition in the financial statements. However, management's conclusion may be subject to review and adjustment at a later date based on factors including, but not limited to, new tax laws, regulations, and administrative interpretations (including relevant court decisions). Generally, the Fund's federal tax returns for the prior three fiscal years remain subject to examination by the Internal Revenue Service.
Note 5. Portfolio Information
The cost of purchases and proceeds from sales of securities, excluding short-term obligations, aggregated to $3,817,235 and $20,880,997, respectively, for the year ended April 30, 2014.
Note 6. Shareholder Concentration
At April 30, 2014, one unaffiliated shareholder of record owned 77.4% of the outstanding shares of the Fund in one or more accounts. The Fund has no knowledge about whether any portion of those shares was owned beneficially. Subscription and redemption activity by concentrated accounts may have a significant effect on the operations of the Fund.
Note 7. Line of Credit
The Fund has entered into a revolving credit facility with a syndicate of banks led by JPMorgan Chase Bank N.A. whereby the Fund may borrow for the temporary funding of shareholder redemptions or for other temporary or emergency purposes. The credit facility agreement, as amended, which is a collective agreement between the Fund and certain other funds managed by the Investment Manager, severally and not jointly, permits collective borrowings up to $500 million. Interest is charged to each participating fund based on its borrowings at a rate equal to the higher of (i) the overnight federal funds rate plus 1.00% or (ii) the one-month LIBOR rate plus 1.00%. Each borrowing under the credit facility matures no later than 60 days after the date of borrowing. Effective December 10, 2013, the Fund also pays a commitment fee equal to its pro rata share of the amount of the credit facility at a rate of 0.075% per annum. Prior to December 10, 2013, the commitment fee was charged at the annual rate of 0.08% per annum. The commitment fee is included in other expenses in the Statement of Operations.
Annual Report 2014
25
Columbia Georgia Intermediate Municipal Bond Fund
Notes to Financial Statements (continued)
April 30, 2014
The Fund had no borrowings during the year ended April 30, 2014.
Note 8. Significant Risks
Geographic Concentration Risk
Because state-specific tax-exempt funds invest primarily in the municipal securities issued by the state and political sub-divisions of the state, the Fund will be particularly affected by political and economic conditions and developments in the state in which it invests. The Fund may, therefore, have a greater risk than that of a municipal bond fund which is more geographically diversified. The value of the municipal securities owned by the Fund also may be adversely affected by future changes in federal or state income tax laws.
Note 9. Subsequent Events
Management has evaluated the events and transactions that have occurred through the date the financial statements were issued and noted no items requiring adjustment of the financial statements or additional disclosure.
Note 10. Information Regarding Pending and Settled Legal Proceedings
In December 2005, without admitting or denying the allegations, American Express Financial Corporation (AEFC, which is now known as Ameriprise Financial, Inc. (Ameriprise Financial)) entered into settlement agreements with the Securities and Exchange Commission (SEC) and Minnesota Department of Commerce (MDOC) related to market timing activities. As a result, AEFC was censured and ordered to cease and desist from committing or causing any violations of certain provisions of the Investment Advisers Act of 1940, the Investment Company Act of 1940, and various Minnesota laws. AEFC agreed to pay disgorgement of $10 million and civil money penalties of $7 million. AEFC also agreed to retain an independent distribution consultant to assist in developing a plan for distribution of all disgorgement and civil penalties ordered by the SEC in accordance with various undertakings detailed at www.sec.gov/litigation/admin/ia-2451.pdf. Ameriprise Financial and its affiliates have cooperated with the SEC and the MDOC in these legal proceedings, and have made regular reports to the Funds' Boards of Trustees.
Ameriprise Financial and certain of its affiliates have historically been involved in a number of legal, arbitration and regulatory proceedings, including routine litigation, class actions, and governmental actions, concerning matters arising in connection with the conduct of their business activities. Ameriprise Financial believes that the Funds are not currently the subject of, and that neither Ameriprise Financial nor any of its affiliates are the subject of, any pending legal, arbitration or regulatory proceedings that are likely to have a material
adverse effect on the Funds or the ability of Ameriprise Financial or its affiliates to perform under their contracts with the Funds. Ameriprise Financial is required to make 10-Q, 10-K and, as necessary, 8-K filings with the Securities and Exchange Commission on legal and regulatory matters that relate to Ameriprise Financial and its affiliates. Copies of these filings may be obtained by accessing the SEC website at www.sec.gov.
There can be no assurance that these matters, or the adverse publicity associated with them, will not result in increased fund redemptions, reduced sale of fund shares or other adverse consequences to the Funds. Further, although we believe proceedings are not likely to have a material adverse effect on the Funds or the ability of Ameriprise Financial or its affiliates to perform under their contracts with the Funds, these proceedings are subject to uncertainties and, as such, we are unable to estimate the possible loss or range of loss that may result. An adverse outcome in one or more of these proceedings could result in adverse judgments, settlements, fines, penalties or other relief that could have a material adverse effect on the consolidated financial condition or results of operations of Ameriprise Financial.
Annual Report 2014
26
Columbia Georgia Intermediate Municipal Bond Fund
Report of Independent Registered Public Accounting Firm
To the Trustees of Columbia Funds Series Trust and the Shareholders of
Columbia Georgia Intermediate Municipal Bond Fund
In our opinion, the accompanying statement of assets and liabilities, including the portfolio of investments, and the related statements of operations and of changes in net assets and the financial highlights present fairly, in all material respects, the financial position of Columbia Georgia Intermediate Municipal Bond Fund (the "Fund", a series of Columbia Funds Series Trust) at April 30, 2014, and the results of its operations, the changes in its net assets and the financial highlights for each of the periods indicated, in conformity with accounting principles generally accepted in the United States of America. These financial statements and financial highlights (hereafter referred to as "financial statements") are the responsibility of the Fund's management; our responsibility is to express an opinion on these financial statements based on our audits. We conducted our audits of these financial statements in accordance with the standards of the Public Company Accounting Oversight Board (United States). Those standards require that we plan and perform the audit to obtain reasonable assurance about whether the financial statements are free of material misstatement. An audit includes examining, on a test basis, evidence supporting the amounts and disclosures in the financial statements, assessing the accounting principles used and significant estimates made by management, and evaluating the overall financial statement presentation. We believe that our audits, which included confirmation of securities at April 30, 2014 by correspondence with the custodian, provide a reasonable basis for our opinion.
PricewaterhouseCoopers LLP
Minneapolis, Minnesota
June 20, 2014
Annual Report 2014
27
Columbia Georgia Intermediate Municipal Bond Fund
Federal Income Tax Information
(Unaudited)
The Fund hereby designates the following tax attributes for the fiscal year ended April 30, 2014. Shareholders will be notified in early 2015 of the amounts for use in preparing 2014 income tax returns.
Tax Designations:
Capital Gain Dividend | | $ | 2,595,632 | | |
| Exempt-Interest Dividends | | | 100.00 | % | |
Capital Gain Dividend. The Fund designates as a capital gain dividend the amount reflected above, or if subsequently determined to be different, the net capital gain of such fiscal period. The Fund also designates as capital gain dividends, to the extent necessary to fully distribute such capital gains, earnings and profits distributed to shareholders on the redemption of shares.
Exempt-Interest Dividends. The percentage of net investment income dividends paid during the fiscal year that qualifies as exempt-interest dividends for federal income tax purposes.
Annual Report 2014
28
Columbia Georgia Intermediate Municipal Bond Fund
Shareholders elect the Board that oversees the Funds' operations. The Board appoints officers who are responsible for day-to-day business decisions based on policies set by the Board. The following table provides basic biographical information about the Funds' Board members, including their principal occupations during the past five years, although specific titles for individuals may have varied over the period. Under current Board policy, members may serve through the end of the calendar year in which he or she reaches either the mandatory retirement age established by the Board or the fifteenth anniversary of the first Board meeting they attended as a member of the Board.
Independent Trustees
Name,
Address,
Year of Birth | | Position Held With
Funds and Length of
Service | | Principal Occupation(s)
During Past Five Years
and Other Relevant
Professional Experience | | Number of
Funds in the
Fund Family
Overseen by
Board Member | | Other Present or Past
Directorships/
Trusteeships
(Within Past 5 Years) | |
Kathleen Blatz
901 S. Marquette Ave.
Minneapolis, MN 55402
1954 | | Board member since 1/06 for RiverSource Funds and since 6/11 for Nations Funds | | Attorney; Chief Justice, Minnesota Supreme Court, 1998-2006 | | | 132 | | | Trustee, BlueCross BlueShield of Minnesota since 2009 | |
Edward J. Boudreau, Jr.
901 S. Marquette Ave.
Minneapolis, MN 55402
1944 | | Board member since 6/11 for RiverSource Funds and since 1/05 for Nations Funds | | Managing Director, E.J. Boudreau & Associates (consulting) since 2000; Chairman and Chief Executive Officer, John Hancock Funds (mutual funds), 1989-2000 | | | 130 | | | Former Trustee, BofA Funds Series Trust (11 funds), 2005-2011 | |
Pamela G. Carlton
901 S. Marquette Ave.
Minneapolis, MN 55402
1954 | | Board member since 7/07 for RiverSource Funds and since 6/11 for Nations Funds | | President, Springboard — Partners in Cross Cultural Leadership (consulting company) since 2003; Director or Management Director of US Equity Research, Chase Asset Management, 1996-2003; Investment Banker, Morgan Stanley, 1982-1996 | | | 132 | | | None | |
William P. Carmichael
901 S. Marquette Ave.
Minneapolis, MN 55402
1943 | | Chair of the Board since 1/14, Board member since 6/11 for RiverSource Funds and since 2003 for Nations Funds | | Retired; Co-founder, The Succession Fund (provides exit strategies to owners of privately held companies); previously, Senior Vice President, Sara Lee Corporation; Senior Vice President and Chief Financial Officer, Beatrice Foods Company; Vice President, Esmark, Inc.; Associate, Price Waterhouse | | | 132 | | | Director, Cobra Electronics Corporation (electronic equipment manufacturer); The Finish Line (athletic shoes and apparel) since July 2003; Director, International Textile Corp. since 2012; former Director, McMoRan Exploration Company (oil and gas exploration and development) 2010-2013; former Trustee, BofA Funds Series Trust (11 funds), 2009-2011; Director, Spectrum Brands, Inc. (consumer products), 2002-2009; Director, Simmons Company (bedding), 2004-2010 | |
Annual Report 2014
29
Columbia Georgia Intermediate Municipal Bond Fund
Trustees and Officers (continued)
Independent Trustees (continued)
Name,
Address,
Year of Birth | | Position Held With
Funds and Length of
Service | | Principal Occupation(s)
During Past Five Years
and Other Relevant
Professional Experience | | Number of
Funds in the
Fund Family
Overseen by
Board Member | | Other Present or Past
Directorships/
Trusteeships
(Within Past 5 Years) | |
Patricia M. Flynn
901 S. Marquette Ave.
Minneapolis, MN 55402
1950 | | Board member since 11/04 for RiverSource Funds and since 6/11 for Nations Funds | | Trustee Professor of Economics and Management, Bentley University since 1976 (also teaches and conducts research on corporate governance); Dean, McCallum Graduate School of Business, Bentley University, 1992-2002 | | | 132 | | | None | |
William A. Hawkins
901 S. Marquette Ave.
Minneapolis, MN 55402
1942 | | Board member since 6/11 for RiverSource Funds and since 1/05 for Nations Funds | | Managing Director, Overton Partners (financial consulting), since August 2010; President and Chief Executive Officer, California General Bank, N.A., January 2008-August 2010 | | | 130 | | | Trustee, BofA Funds Series Trust (11 funds) | |
R. Glenn Hilliard
901 S. Marquette Ave.
Minneapolis, MN 55402
1943 | | Board member since 6/11 for RiverSource Funds and since 1/05 for Nations Funds | | Chairman and Chief Executive Officer, Hilliard Group LLC (investing and consulting) since April 2003; Non-Executive Director & Chairman, CNO Financial Group, Inc. (insurance), September 2003-May 2011 | | | 130 | | | Chairman, BofA Fund Series Trust (11 funds); former Director, CNO Financial Group, Inc. (insurance), 2003-2011 | |
Stephen R. Lewis, Jr.
901 S. Marquette Ave.
Minneapolis, MN 55402
1939 | | Board member for RiverSource Funds since 1/02 and since 6/11 for Nations Funds, Board Chair 1/07-12/13 | | President Emeritus and Professor of Economics Emeritus, Carleton College since 2002 | | | 132 | | | Director, Valmont Industries, Inc. (irrigation systems manufacturer), 2002-2013 | |
Catherine James Paglia
901 S. Marquette Ave.
Minneapolis, MN 55402
1952 | | Board member since 11/04 for RiverSource Funds and since 6/11 for Nations Funds | | Director, Enterprise Asset Management, Inc. (private real estate and asset management company) since September 1998 | | | 132 | | | Director, Valmont Industries, Inc. (irrigation systems manufacturer) since 2012 | |
Leroy C. Richie
901 S. Marquette Ave.
Minneapolis, MN 55402
1941 | | Board member since 2000 for Legacy Seligman Funds, since 11/08 for RiverSource Funds and since 6/11 for Nations Funds | | Counsel, Lewis & Munday, P.C. (law firm) since 2004; Vice President and General Counsel, Automotive Legal Affairs, Chrysler Corporation, 1993-1997 | | | 132 | | | Lead Outside Director, Digital Ally, Inc. (digital imaging) since September 2005; Director, Infinity, Inc. (oil and gas exploration and production) since 1994; Director, OGE Energy Corp. (energy and energy services) since November 2007 | |
Minor M. Shaw
901 S. Marquette Ave.
Minneapolis, MN 55402
1947 | | Board member since 6/11 for RiverSource Funds and since 2003 for Nations Funds | | President, Micco LLC (private investments) since 2011; President, Micco Corp. since 1998 | | | 130 | | | Director, Piedmont Natural Gas; Director, BlueCross BlueShield of South Carolina since April 2008; Director, National Association of Corporate Directors, Carolinas Chapter, since 2013; former Trustee, BofA Funds Series Trust (11 funds) | |
Annual Report 2014
30
Columbia Georgia Intermediate Municipal Bond Fund
Trustees and Officers (continued)
Independent Trustees (continued)
Name,
Address,
Year of Birth | | Position Held With
Funds and Length of
Service | | Principal Occupation(s)
During Past Five Years
and Other Relevant
Professional Experience | | Number of
Funds in the
Fund Family
Overseen by
Board Member | | Other Present or Past
Directorships/
Trusteeships
(Within Past 5 Years) | |
Alison Taunton-Rigby
901 S. Marquette Ave.
Minneapolis, MN 55402
1944 | | Board member since 11/02 for RiverSource Funds and since 6/11 for Nations Funds | | Chief Executive Officer and Director, RiboNovix, Inc., (biotechnology) 2003-2010 | | | 132 | | | Director, Healthways, Inc. (health and wellbeing solutions) since 2005; Director, ICI Mutual Insurance Company, RRG since 2011; Director, Abt Associates (government contractor) since 2001; Director, Boston Children's Hospital since 2002 | |
Interested Trustee Not Affiliated with Investment Manager*
Name,
Address,
Year of Birth | | Position Held With
Funds and Length of
Service | | Principal Occupation(s)
During Past Five Years
and Other Relevant
Professional Experience | | Number of
Funds in the
Fund Family
Overseen by
Board Member | | Other Present or Past
Directorships/
Trusteeships
(Within Past 5 Years) | |
Anthony M. Santomero
901 S. Marquette Ave.
Minneapolis, MN 55402
1946 | | Board member since 6/11 for RiverSource Funds and since 1/08 for Nations Funds | | Richard K. Mellon Professor Emeritus of Finance, The Wharton School, University of Pennsylvania, since 2002; Senior Advisor, McKinsey & Company (consulting), 2006-2008 | | | 130 | | | Director, Renaissance Reinsurance Ltd. since May 2008; Trustee, Penn Mutual Life Insurance Company since March 2008; Director, Citigroup Inc. since 2009; Director, Citibank, N.A. since 2009; former Trustee, BofA Funds Series Trust (11 funds), 2008-2011 | |
*Dr. Santomero is not an affiliated person of the Investment Manager or Ameriprise Financial. However, he is currently deemed by the Funds to be an "interested person" (as defined in the 1940 Act) of the Funds because he serves as a Director of Citigroup Inc. and Citibank, N.A., companies that may directly or through subsidiaries and affiliates engage from time-to-time in brokerage execution, principal transactions and lending relationships with the Funds or accounts advised/managed by the Investment Manager.
Annual Report 2014
31
Columbia Georgia Intermediate Municipal Bond Fund
Trustees and Officers (continued)
Interested Trustee Affiliated with Investment Manager*
Name,
Address,
Year of Birth | | Position Held With
Funds and Length of
Service | | Principal Occupation(s)
During Past Five Years
and Other Relevant
Professional Experience | | Number of
Funds in the
Fund Family
Overseen by
Board Member | | Other Present or Past
Directorships/
Trusteeships
(Within Past 5 Years) | |
William F. Truscott
53600 Ameriprise
Financial Center
Minneapolis, MN 55474
1960 | | Board member since 11/01 for RiverSource Funds and since 6/11 for Nations Funds; Senior Vice President since 2002 for RiverSource Funds and since 5/10 for Nations Funds | | Chairman of the Board and President, Columbia Management Investment Advisers, LLC since May 2010 and February 2012, respectively (previously President and Chief Investment Officer, 2001-April 2010); Chief Executive Officer, Global Asset Management, Ameriprise Financial, Inc. since September 2012 (previously Chief Executive Officer, U.S. Asset Management & President, Annuities, May 2010-September 2012 and President — U.S. Asset Management and Chief Investment Officer, 2005-April 2010); Director and Chief Executive Officer, Columbia Management Investment Distributors, Inc. since May 2010 and February 2012, respectively (previously Chairman of the Board and Chief Executive Officer, 2006-April 2010); Chairman of the Board and Chief Executive Officer, RiverSource Distributors, Inc. since 2006; Director, Threadneedle Asset Management Holdings, SARL since 2014; President and Chief Executive Officer, Ameriprise Certificate Company, 2006-August 2012 | | | 186 | | | Former Director, Ameriprise Certificate Company, 2006-January 2013 | |
*Interested person (as defined under the 1940 Act) by reason of being an officer, director, security holder and/or employee of the Investment Manager or Ameriprise Financial.
The Statement of Additional Information has additional information about the Fund's Board members and is available, without charge, upon request by calling 800.345.6611; contacting your financial intermediary or visiting columbiamanagement.com.
Annual Report 2014
32
Columbia Georgia Intermediate Municipal Bond Fund
Trustees and Officers (continued)
The Board has appointed officers who are responsible for day-to-day business decisions based on policies it has established. The officers serve at the pleasure of the Board. In addition to Mr. Truscott, who is Senior Vice President, the Funds' other officers are:
Officers
Name,
Address and
Year of Birth | | Position and Year
First Appointed to
Position for any Fund
in the Columbia
Funds Complex or a
Predecessor Thereof | | Principal Occupation(s) During Past Five Years | |
J. Kevin Connaughton
225 Franklin Street
Boston, MA 02110
Born 1964 | | President and Principal Executive Officer (2009) | | Managing Director and General Manager — Mutual Fund Products, Columbia Management Investment Advisers, LLC since May 2010; and President, Columbia Funds since 2009; Managing Director, Columbia Management Advisors, LLC, December 2004-April 2010; Senior Vice President and Chief Financial Officer, Columbia Funds, June 2008-January 2009; and senior officer of Columbia Funds and affiliated funds since 2003 | |
Michael G. Clarke
225 Franklin Street
Boston, MA 02110
Born 1969 | | Treasurer (2011) and Chief Financial Officer (2009) | | Vice President — Mutual Fund Administration, Columbia Management Investment Advisers, LLC, since May 2010; Managing Director of Fund Administration, Columbia Management Advisors, LLC, September 2004-April 2010; and senior officer of Columbia Funds and affiliated funds since 2002 | |
Scott R. Plummer
5228 Ameriprise Financial Center
Minneapolis, MN 55474
Born 1959 | | Senior Vice President (2006), Chief Legal Officer (2006) and Assistant Secretary (2011) | | Senior Vice President and Assistant General Counsel — Global Asset Management, Ameriprise Financial since February 2014 (previously, Senior Vice President and Lead Chief Counsel — Asset Management, 2012-February 2014; Vice President and Lead Chief Counsel — Asset Management, 2010-2012; and Vice President and Chief Counsel — Asset Management, 2005-2010); Senior Vice President, Chief Legal Officer and Assistant Secretary, Columbia Management Investment Advisers, LLC since June 2005; Vice President, Chief Counsel and Assistant Secretary, Columbia Management Investment Distributors, Inc. since 2008; Vice President, General Counsel and Secretary, Ameriprise Certificate Company since 2005; Chief Counsel, RiverSource Distributors, Inc. since 2006; senior officer of Columbia Funds and affiliated funds since 2006 | |
Thomas P. McGuire
225 Franklin Street
Boston, MA 02110
Born 1972 | | Chief Compliance Officer (2012) | | Vice President — Asset Management Compliance, Ameriprise Financial, Inc. since May 2010; Chief Compliance Officer, Ameriprise Certificate Company, since September 2010; Compliance Executive, Bank of America, 2005-April 2010 | |
Colin Moore
225 Franklin Street
Boston, MA 02110
Born 1958 | | Senior Vice President (2010) | | Executive Vice President and Global Chief Investment Officer, Ameriprise Financial, Inc. since July 2013; Director and Global Chief Investment Officer, Columbia Management Investment Advisers, LLC since May 2010; Manager, Managing Director and Chief Investment Officer, Columbia Management Advisors, LLC, 2007-April 2010 | |
Michael E. DeFao
225 Franklin Street
Boston, MA 02110
Born 1968 | | Vice President (2011) and Assistant Secretary (2010) | | Vice President and Chief Counsel, Ameriprise Financial, Inc. since May 2010; Associate General Counsel, Bank of America 2005-April 2010 | |
Joseph F. DiMaria
225 Franklin Street
Boston, MA 02110
Born 1968 | | Vice President (2011) and Chief Accounting Officer (2008) | | Vice President — Mutual Fund Treasurer, Columbia Management Investment Advisers, LLC since May 2010; Director of Fund Administration, Columbia Management Advisors, LLC, 2006-April 2010 | |
Paul B. Goucher
100 Park Avenue
New York, NY 10017
Born 1968 | | Vice President (2011) and Assistant Secretary (2008) | | Vice President and Lead Chief Counsel, Ameriprise Financial, Inc. since November 2008 and January 2013, respectively (previously Chief Counsel, January 2010-January 2013, and Group Counsel, November 2008-January 2010); Director, Managing Director and General Counsel, J. & W. Seligman & Co. Incorporated, July 2008-November 2008 | |
Amy Johnson
5228 Ameriprise Financial
Center
Minneapolis, MN 55474
Born 1965 | | Vice President (2006) | | Managing Director and Chief Operating Officer, Columbia Management Investment Advisers, LLC since May 2010 (previously Chief Administrative Officer, 2009-April 2010, and Vice President — Asset Management and Trust Company Services, 2006-2009) | |
Annual Report 2014
33
Columbia Georgia Intermediate Municipal Bond Fund
Trustees and Officers (continued)
Officers (continued)
Name,
Address and
Year of Birth | | Position and Year
First Appointed to
Position for any Fund
in the Columbia
Funds Complex or a
Predecessor Thereof | | Principal Occupation(s) During Past Five Years | |
Paul D. Pearson
5228 Ameriprise Financial
Center
Minneapolis, MN 55474
Born 1956 | | Vice President (2011) and Assistant Treasurer (1999) | | Vice President — Investment Accounting, Columbia Management Investment Advisers, LLC since May 2010; Vice President — Managed Assets, Investment Accounting, Ameriprise Financial, Inc., 1998-April 2010 | |
Christopher O. Petersen
5228 Ameriprise Financial
Center
Minneapolis, MN 55474
Born 1970 | | Vice President and Secretary (2010) | | Vice President and Chief Counsel, Ameriprise Financial, Inc., since January 2010 (previously Vice President and Group Counsel or Counsel, 2004-January 2010); officer of Columbia Funds and affiliated funds since 2007 | |
Stephen T. Welsh
225 Franklin Street
Boston, MA 02110
Born 1957 | | Vice President (2006) | | President and Director, Columbia Management Investment Services Corp. since May 2010; President and Director, Columbia Management Services, Inc., 2004-April 2010; Managing Director, Columbia Management Distributors, Inc., 2007-April 2010 | |
Annual Report 2014
34
Columbia Georgia Intermediate Municipal Bond Fund
Approval of Investment Management Services
Agreement
Columbia Management Investment Advisers, LLC (Columbia Management or the Investment Manager), a wholly-owned subsidiary of Ameriprise Financial, Inc. (Ameriprise Financial), serves as the investment manager to Columbia Georgia Intermediate Municipal Bond Fund (the Fund). Under an investment management services agreement (the IMS Agreement), Columbia Management provides investment advice and other services to the Fund and other funds distributed by Columbia Management Investment Distributors, Inc. (collectively, the Funds).
On an annual basis, the Fund's Board of Trustees (the Board), including the independent Board members (the Independent Trustees), considers renewal of the IMS Agreement. Columbia Management prepared detailed reports for the Board and its Contracts Committee in January, March and April 2014, including reports based on analyses of data provided by an independent organization (Lipper) and a comprehensive response to each item of information requested by independent legal counsel to the Independent Trustees (Independent Legal Counsel) in a letter to the Investment Manager, to assist the Board in making this determination. All of the materials presented in January, March and April were first supplied in draft form to designated representatives of the Independent Trustees, i.e., Independent Legal Counsel, Fund Counsel, the Chair of the Board and the Chair of the Contracts Committee, and the final materials (including proposed expense caps for certain Funds) were revised to reflect discussion and subsequent requests made by the Contracts Committee. In addition, throughout the year, the Board (or its committees) regularly meets with portfolio management teams and senior management personnel, and reviews information prepared by Columbia Management addressing the services Columbia Management provides and Fund performance. The Board also accords appropriate weight to the work, deliberations and conclusions of the Contracts Committee, the Investment Review Committee and the Compliance Committee in determining whether to continue the IMS Agreement.
The Board, at its April 9-11, 2014 in-person Board meeting (the April Meeting), considered the renewal of the IMS Agreement for an additional one-year term. At the April Meeting, Independent Legal Counsel reviewed with the Independent Trustees various factors relevant to the Board's consideration of advisory agreements and the Board's legal responsibilities related to such consideration. Following an analysis and discussion of the factors identified below, the Board, including all of the Independent Trustees, approved the renewal of the IMS Agreement.
Nature, Extent and Quality of Services Provided by Columbia Management
The Independent Trustees analyzed various reports and presentations they had received detailing the services performed by Columbia Management, as well as its expertise, resources and capabilities. The Independent Trustees specifically considered many developments during the past year concerning the services provided by Columbia Management, including, in particular, the successful implementation of a globalization initiative, which, among other things, increased worldwide analyst support for global products, the reorganization of the Informational Technology research team, the hiring of additional personnel to assist the Asset Allocation team and the global restructuring of the Senior Operational team. The Independent Trustees noted the information they received concerning Columbia Management's ability to retain its key portfolio management personnel. The Independent Trustees also recalled Columbia Management's representation that additional staff has been added to support the vigorous application of the "5P" review process, to which all internally-managed Funds are subject.
In connection with the Board's evaluation of the overall package of services provided by Columbia Management, the Board also considered the quality of administrative services provided to the Fund by Columbia Management, recalling the information it received highlighting significant achievements in 2013 in the performance of administrative services. In evaluating the quality of services provided under the IMS Agreement and the Fund's Administrative Services Agreement, the Independent Trustees also took into account the organization and strength of the Fund's and its service providers' compliance programs. In addition, the Board also reviewed the financial condition of Columbia Management (and its affiliates) and each entity's ability to carry out its responsibilities under the IMS Agreement and the Fund's other services agreements with affiliates of Ameriprise Financial, observing the financial strength of Ameriprise Financial, with its solid balance sheet. The Board also discussed the acceptability of the terms of the IMS Agreement (including the relatively broad scope of services required to be performed by Columbia Management). The Board concluded that the services being performed under the IMS Agreement were of a reasonably high quality.
Based on the foregoing, and based on other information received (both oral and written, including the information on investment performance referenced below) and other considerations, the Board concluded that Columbia Management and its affiliates were in a position to continue to provide a high quality and level of services to the Fund.
Annual Report 2014
35
Columbia Georgia Intermediate Municipal Bond Fund
Approval of Investment Management Services
Agreement (continued)
Investment Performance
For purposes of evaluating the nature, extent and quality of services provided under the IMS Agreement, the Board carefully reviewed the investment performance of the Fund. In this regard, the Board considered detailed reports providing the results of analyses performed by an independent organization showing, for various periods, the performance of the Fund, the performance of a benchmark index, the percentage ranking of the Fund among its comparison group and the net assets of the Fund. The Board observed that the Fund's investment performance met expectations.
Comparative Fees, Costs of Services Provided and the Profits Realized By Columbia Management and its Affiliates from their Relationships with the Fund
The Board reviewed comparative fees and the costs of services provided under the IMS Agreement. The Board members considered detailed comparative information set forth in an annual report on fees and expenses, including, among other things, data (based on analyses conducted by an independent organization) showing a comparison of the Fund's expenses with median expenses paid by funds in its comparative peer universe, as well as data showing the Fund's contribution to Columbia Management's profitability.
The Board accorded particular weight to the notion that the level of fees should reflect a rational pricing model applied consistently across the various product lines in the Fund family, while assuring that the overall fees for each Fund (with few defined exceptions) are generally in line with the "pricing philosophy" currently in effect (i.e., that the total expense ratio of the Fund is no higher than the median expense ratio of funds in the same comparison universe of the Fund). In this connection, the Board also considered the 2013 report provided by an independent consulting firm, Bobroff Consulting (the Independent Consultant), that concluded that the Funds' standardized investment management fee rates were within a reasonable range. The Board took into account that the Fund's total expense ratio (after considering proposed voluntary expense caps/waivers) approximated the peer universe's median expense ratio. It was observed that various proposals concerning the Funds' transfer agency and sub-transfer agency fee structures, and other changes impacting the Funds' pricing structure and fees, are expected to be considered at a later Board meeting which, if adopted, would alter the current pricing philosophy. Based on its review, the Board concluded that the Fund's management fee was fair and reasonable in light of the extent and quality of services that the Fund receives.
The Board also considered the expected profitability of Columbia Management and its affiliates in connection with Columbia Management providing investment management services to the Fund. In this regard, the Board referred to a detailed profitability report, discussing the profitability to Columbia Management and Ameriprise Financial from managing, operating and distributing the Funds. In this regard, the Board observed that: (i) the Independent Consultant concluded that 2012 profitability was reasonable; (ii) 2013 profitability only moderately exceeded 2012 levels; and (iii) 2013 profitability is in line with profitability levels of industry competitors. It also took into account the indirect economic benefits flowing to Columbia Management or its affiliates in connection with managing or distributing the Funds, such as the enhanced ability to offer various other financial products to Ameriprise Financial customers, soft dollar benefits and overall reputational advantages. The Board noted that the fees paid by the Funds should permit the Investment Manager to offer competitive compensation to its personnel, make necessary investments in its business and earn an appropriate profit. The Board concluded that profitability levels were reasonable.
Economies of Scale to be Realized
The Board also considered the economies of scale that might be realized by Columbia Management as the Fund grows and took note of the extent to which Fund shareholders might also benefit from such growth. In this regard, the Independent Trustees took into account that IMS fees decline as Fund assets exceed various breakpoints, all of which have not been surpassed.
Based on the foregoing, the Board, including all of the Independent Trustees, concluded that the investment management service fees were fair and reasonable in light of the extent and quality of services provided. In reaching this conclusion, no single factor was determinative. On April 11, 2014, the Board, including all of the Independent Trustees, approved the renewal of the IMS Agreement.
Annual Report 2014
36
Columbia Georgia Intermediate Municipal Bond Fund
Important Information About This Report
Each fund mails one shareholder report to each shareholder address. If you would like more than one report, please call shareholder services at 800.345.6611 and additional reports will be sent to you.
The policy of the Board is to vote the proxies of the companies in which each fund holds investments consistent with the procedures as stated in the Statement of Additional Information (SAI). You may obtain a copy of the SAI without charge by calling 800.345.6611; contacting your financial intermediary; visiting columbiamanagement.com; or searching the website of the Securities and Exchange Commission (SEC) at sec.gov. Information regarding how each fund voted proxies relating to portfolio securities is filed with the SEC by August 31 for the most recent 12-month period ending June 30 of that year, and is available without charge by visiting columbiamanagement.com; or searching the website of the SEC at sec.gov.
Each fund files a complete schedule of portfolio holdings with the SEC for the first and third quarters of each fiscal year on Form N-Q. Each fund's Form N-Q is available on the SEC's website at sec.gov and may be reviewed and copied at the SEC's Public Reference Room in Washington, D.C. Information on the operation of the Public Reference Room may be obtained by calling 800.SEC.0330. Each fund's complete schedule of portfolio holdings, as filed on Form N-Q, can also be obtained without charge, upon request, by calling 800.345.6611.
Annual Report 2014
37

Columbia Georgia Intermediate Municipal Bond Fund
P.O. Box 8081
Boston, MA 02266-8081
columbiamanagement.com
This information is for use with concurrent or prior delivery of a fund prospectus. Please read and consider the investment objectives, risks, charges and expenses for any fund carefully before investing. For a prospectus and, if available, a summary prospectus, which contains this and other important information about the Fund go to columbiamanagement.com. The Fund is distributed by Columbia Management Investment Distributors, Inc., member FINRA, and managed by Columbia Management Investment Advisers, LLC.
© 2014 Columbia Management Investment Advisers, LLC. All rights reserved.
ANN152_04_D01_(06/14)
Item 2. Code of Ethics.
(a) The registrant has adopted a code of ethics that applies to the registrant’s principal executive officer, principal financial officer, principal accounting officer or controller, or persons performing similar functions, regardless of whether these individuals are employed by the registrant or a third party.
(b) During the period covered by this report, there were not any amendments to a provision of the code of ethics adopted in 2(a) above.
(c) During the period covered by this report, there were no waivers, including any implicit waivers, from a provision of the code of ethics described in 2(a) above that relates to one or more of the items set forth in paragraph (b) of this item’s instructions.
Item 3. Audit Committee Financial Expert.
The registrant’s Board of Trustees has determined that Edward J. Boudreau, Pamela G. Carlton, William A. Hawkins and Alison Taunton-Rigby, each of whom are members of the registrant’s Board of Trustees and Audit Committee, each qualify as an audit committee financial expert. Mr. Boudreau, Ms. Carlton, Mr. Hawkins and Ms. Taunton-Rigby are each independent trustees, as defined in paragraph (a)(2) of this item’s instructions.
Item 4. Principal Accountant Fees and Services.
Fee information below is disclosed for the seven series of the registrant whose reports to stockholders are included in this annual filing. The fees presented for 2013 also include two series that liquidated during the period.
(a) Audit Fees. Aggregate Audit Fees billed by the principal accountant for professional services rendered during the fiscal years ended April 30, 2014 and April 30, 2013 are approximately as follows:
2014 | | 2013 | |
$ | 154,000 | | $ | 154,000 | |
| | | | | |
Audit Fees include amounts related to the audit of the registrant’s annual financial statements or services that are normally provided by the accountant in connection with statutory and regulatory filings or engagements for those fiscal years.
(b) Audit-Related Fees. Aggregate Audit-Related Fees billed to the registrant by the principal accountant for professional services rendered during the fiscal years ended April 30, 2014 and April 30, 2013 are approximately as follows:
Audit-Related Fees include amounts for assurance and related services by the principal accountant that are reasonably related to the performance of the audit of the registrant’s financial statements and are not reported in Audit Fees above. In both fiscal years 2014 and 2013, Audit-Related Fees consist of agreed-upon procedures performed for semi-annual shareholder reports.
During the fiscal years ended April 30, 2014 and April 30, 2013, there were no Audit-Related Fees billed by the registrant’s principal accountant to the registrant’s investment adviser (not including any sub-adviser whose role is primarily portfolio management and is subcontracted with or overseen by another investment adviser) and any entity controlling, controlled by, or under common control with the adviser that provides ongoing services to the registrant for an engagement that related directly to the operations and financial reporting of the registrant.
(c) Tax Fees. Aggregate Tax Fees billed by the principal accountant to the registrant for professional services rendered during the fiscal years ended April 30, 2014 and April 30, 2013 are approximately as follows:
2014 | | 2013 | |
$ | 25,800 | | $ | 72,400 | |
| | | | | |
Tax Fees include amounts for the review of annual tax returns, the review of required shareholder distribution calculations and typically include amounts for professional services by the principal accountant for tax compliance, tax advice and tax planning. In fiscal year 2013, Tax Fees also include agreed-upon procedures related to fund liquidations and the review of final tax returns.
During the fiscal years ended April 30, 2014 and April 30, 2013, there were no Tax Fees billed by the registrant’s principal accountant to the registrant’s investment adviser (not including any sub-adviser whose role is primarily portfolio management and is subcontracted with or overseen by another investment adviser) and any entity controlling, controlled by, or under common control with the adviser that provides ongoing services to the registrant for an engagement that related directly to the operations and financial reporting of the registrant.
(d) All Other Fees. Aggregate All Other Fees billed by the principal accountant to the registrant for professional services rendered during the fiscal years ended April 30, 2014 and April 30, 2013 are approximately as follows:
All Other Fees include amounts for products and services provided by the principal accountant, other than the services reported in paragraphs (a) through (c) above.
Aggregate All Other Fees billed by the registrant’s principal accountant to the registrant’s investment adviser (not including any sub-adviser whose role is primarily portfolio management and is subcontracted with or overseen by another investment adviser) and any entity controlling, controlled by, or under common control with the adviser that provides ongoing services to the registrant for an engagement that related directly to the operations and financial reporting of the registrant during the fiscal years ended April 30, 2014 and April 30, 2013 are approximately as follows:
2014 | | 2013 | |
$ | 325,000 | | $ | 115,000 | |
| | | | | |
In fiscal year 2014, All Other Fees primarily consist of fees billed for internal control examinations of the registrant’s transfer agent and investment advisor. In fiscal year 2013, All Other Fees consist of fees billed for an internal control examination of the registrant’s transfer agent.
(e)(1) Audit Committee Pre-Approval Policies and Procedures
The registrant’s Audit Committee is required to pre-approve the engagement of the registrant’s independent auditors to provide audit and non-audit services to the registrant and non-audit services to its investment adviser (excluding any sub-adviser whose role is primarily portfolio management and is sub-contracted or overseen by another investment adviser (the “Adviser”) or any entity controlling, controlled by or under common control with the Adviser that provides ongoing services to the Fund (a “Control Affiliate”) if the engagement relates directly to the operations and financial reporting of the registrant.
The Audit Committee has adopted a Policy for Engagement of Independent Auditors for Audit and Non-Audit Services (the “Policy”). The Policy sets forth the understanding of the Audit Committee regarding the engagement of the registrant’s independent accountants to provide (i) audit and permissible audit-related, tax and other services to the registrant (“Fund Services”); (ii) non-audit services to the registrant’s Adviser and any Control Affiliates, that relates directly to the operations and financial reporting of a Fund (“Fund-related Adviser Services”); and (iii) certain other audit and non-audit services to the registrant’s Adviser and its Control Affiliates. A service will require specific pre-approval by the Audit Committee if it is to be provided by the Fund’s independent auditor; provided, however, that pre-approval of non-audit services to the Fund, the Adviser or Control Affiliates may be waived if certain de minimis requirements set forth in the SEC’s rules are met.
Under the Policy, the Audit Committee may delegate pre-approval authority to any pre-designated member or members who are independent board members. The member(s) to whom such authority is delegated must report, for informational purposes only, any pre-approval decisions to the Audit Committee at its next regular meeting. The Audit Committee’s responsibilities with respect to the pre-approval of services performed by the independent auditor may not be delegated to management.
On an annual basis, at a regularly scheduled Audit Committee meeting, the Fund’s Treasurer or other Fund officer shall submit to the Audit Committee a schedule of the types of Fund Services and Fund-related Adviser Services that are subject to specific pre-approval. This schedule will provide a description of each type of service that is subject to specific pre-approval, along with total projected fees for each service. The pre-approval will generally cover a one-year period. The Audit Committee will review and approve the types of services and the projected fees for the next one-year period and may add to, or subtract from, the list of pre-approved services from time to time, based on subsequent determinations. This specific approval acknowledges that the Audit Committee is in agreement with the specific types of services that the independent auditor will be permitted to perform and the projected fees for each service.
The Fund’s Treasurer or other Fund officer shall report to the Audit Committee at each of its regular meetings regarding all Fund Services or Fund-related Adviser Services provided since the last such report was rendered, including a description of the services, by category, with forecasted fees for the annual reporting period, proposed changes requiring specific pre-approval and a description of services provided by the independent auditor, by category, with actual fees during the current reporting period.
*****
(e)(2) 100% of the services performed for items (b) through (d) above during 2014 and 2013 were pre-approved by the registrant’s Audit Committee.
(f) Not applicable.
(g) The aggregate non-audit fees billed by the registrant’s accountant for services rendered to the registrant, and rendered to the registrant’s investment adviser (not including any sub-adviser whose role is primarily portfolio management and is subcontracted with or overseen by another investment adviser), and any entity controlling, controlled by, or under common control with the adviser that provides ongoing services to the registrant for the fiscal years ended April 30, 2014 and April 30, 2013 are approximately as follows:
2014 | | 2013 | |
$ | 353,600 | | $ | 190,200 | |
| | | | | |
(h) The registrant’s Audit Committee of the Board of Directors has considered whether the provision of non-audit services that were rendered to the registrant’s adviser (not including any sub-adviser whose role is primarily portfolio management and is
subcontracted with or overseen by another investment adviser), and any entity controlling, controlled by, or under common control with the investment adviser that provides ongoing services to the registrant that were not pre-approved pursuant to paragraph (c)(7)(ii) of Rule 2-01 of Regulation S-X, is compatible with maintaining the principal accountant’s independence.
Item 5. Audit Committee of Listed Registrants.
Not applicable.
Item 6. Investments
(a) The registrant’s “Schedule I — Investments in securities of unaffiliated issuers” (as set forth in 17 CFR 210.12-12) is included in Item 1 of this Form N-CSR.
(b) Not applicable.
Item 7. Disclosure of Proxy Voting Policies and Procedures for Closed-End Management Investment Companies.
Not applicable.
Item 8. Portfolio Managers of Closed-End Management Investment Companies.
Not applicable.
Item 9. Purchases of Equity Securities by Closed-End Management Investment Company and Affiliated Purchasers.
Not applicable.
Item 10. Submission of Matters to a Vote of Security Holders.
There were no material changes to the procedures by which shareholders may recommend nominees to the registrant’s board of directors.
Item 11. Controls and Procedures.
(a) The registrant’s principal executive officer and principal financial officers, based on their evaluation of the registrant’s disclosure controls and procedures as of a date within 90 days of the filing of this report, have concluded that such controls and procedures are adequately designed to ensure that material information required to be disclosed by the registrant in Form N-CSR is accumulated and communicated to the registrant’s management, including the principal executive officer and principal financial officer, or persons performing similar functions, as appropriate to allow timely decisions regarding required disclosure.
(b) There was no change in the registrant’s internal control over financial reporting that occurred during the registrant’s second fiscal quarter of the period covered by this report that has materially affected, or is reasonably likely to materially affect, the registrant’s internal control over financial reporting.
Item 12. Exhibits.
(a)(1) Code of ethics required to be disclosed under Item 2 of Form N-CSR attached hereto as Exhibit 99.CODE ETH.
(a)(2) Certifications pursuant to Rule 30a-2(a) under the Investment Company Act of 1940 (17 CFR 270.30a-2(a)) attached hereto as Exhibit 99.CERT.
(a)(3) Not applicable.
(b) Certification pursuant to Rule 30a-2(b) under the Investment Company Act of 1940 (17 CFR 270.30a-2(b)) attached hereto as Exhibit 99.906CERT.
SIGNATURES
Pursuant to the requirements of the Securities Exchange Act of 1934 and the Investment Company Act of 1940, the registrant has duly caused this report to be signed on its behalf by the undersigned, thereunto duly authorized.
(registrant) | | | Columbia Funds Series Trust | |
| | |
| | |
By (Signature and Title) | | | /s/ J. Kevin Connaughton | |
| | J. Kevin Connaughton, President and Principal Executive Officer |
| | |
| | |
Date | | | June 20, 2014 | |
| | | | | | |
Pursuant to the requirements of the Securities Exchange Act of 1934 and the Investment Company Act of 1940, this report has been signed below by the following persons on behalf of the registrant and in the capacities and on the dates indicated.
By (Signature and Title) | | | /s/ J. Kevin Connaughton | |
| | | J. Kevin Connaughton, President and Principal Executive Officer | |
| | |
| | |
Date | | | June 20, 2014 | |
| | |
| | |
By (Signature and Title) | | | /s/ Michael G. Clarke | |
| | Michael G. Clarke, Treasurer and Chief Financial Officer |
| | |
| | |
Date | | | June 20, 2014 | |
| | | | | |