UNITED STATES
SECURITIES AND EXCHANGE COMMISSION
Washington, D.C. 20549
FORM N-CSR
CERTIFIED SHAREHOLDER REPORT OF REGISTERED
MANAGEMENT INVESTMENT COMPANIES
Investment Company Act file number | 811-09645 |
|
Columbia Funds Series Trust |
(Exact name of registrant as specified in charter) |
|
50606 Ameriprise Financial Center Minneapolis, MN | | 55474 |
(Address of principal executive offices) | | (Zip code) |
|
Ryan Larrenaga c/o Columbia Management Investment Advisers, LLC 225 Franklin Street Boston, MA 02110 |
(Name and address of agent for service) |
|
Registrant’s telephone number, including area code: | (800) 345-6611 | |
|
Date of fiscal year end: | February 28 | |
|
Date of reporting period: | February 28, 2015 | |
| | | | | | | | |
Form N-CSR is to be used by management investment companies to file reports with the Commission not later than 10 days after the transmission to stockholders of any report that is required to be transmitted to stockholders under Rule 30e-1 under the Investment Company Act of 1940 (17 CFR 270.30e-1). The Commission may use the information provided on Form N-CSR in its regulatory, disclosure review, inspection, and policymaking roles.
A registrant is required to disclose the information specified by Form N-CSR, and the Commission will make this information public. A registrant is not required to respond to the collection of information contained in Form N-CSR unless the Form displays a currently valid Office of Management and Budget (“OMB”) control number. Please direct comments concerning the accuracy of the information collection burden estimate and any suggestions for reducing the burden to Secretary, Securities and Exchange Commission, 450 Fifth Street, NW, Washington, DC 20549-0609. The OMB has reviewed this collection of information under the clearance requirements of 44 U.S.C. § 3507.
Item 1. Reports to Stockholders.

ANNUAL REPORT
February 28, 2015

COLUMBIA CONVERTIBLE SECURITIES FUND


ABOUT COLUMBIA THREADNEEDLE INVESTMENTS
Columbia Threadneedle Investments is a leading global asset management group that provides a broad range of actively managed investment strategies and solutions for individual, institutional and corporate clients around the world.
With more than 2,000 people, including over 450 investment professionals based in North America, Europe and Asia, we manage $506 billion* of assets across developed and emerging market equities, fixed income, asset allocation solutions and alternatives. We are the 11th largest manager of long-term mutual fund assets in the U.S.** and the 5th largest manager of retail funds in the U.K.***
Our priority is the investment success of our clients. We aim to deliver the investment outcomes they expect through an investment approach that is team-based, performance-driven and risk-aware. Our culture is dynamic and interactive. By sharing our insights across asset classes and geographies, we generate richer perspectives on global, regional and local investment landscapes. The ability to exchange and debate investment ideas in a collaborative environment enriches our teams' investment processes. More importantly, it results in better informed investment decisions for our clients.
Columbia funds are distributed by Columbia Management Investment Distributors, Inc., member FINRA, and managed by Columbia Management Investment Advisers, LLC.
Columbia Threadneedle Investments (Columbia Threadneedle) is the global brand name of the Columbia and Threadneedle group of companies.
* In U.S. dollars as of December 31, 2014. Source: Ameriprise Q4 Earnings Release. Includes all assets managed by entities in the Columbia and Threadneedle groups of companies. Contact us for more current data.
** Source: ICI as of December 31, 2014 for Columbia Management Investment Advisers, LLC.
*** Source: Investment Association as of December 2014 for Threadneedle Asset Management Limited.
© 2015 Columbia Management Investment Advisers, LLC. All rights reserved.
Not part of the shareholder report
Get the market insight you need from our investment experts
Connect with Columbia Threadneedle Investments
Investor insight
Find economic and market commentary, investment videos, white papers, mutual fund commentary and more at columbiathreadneedle.com/us.
 Columbia Threadneedle Investor Newsletter (e-newsletter)
Read our award-winning* shareholder newsletter. Our quarterly newsletter is available online and provides timely and relevant content about economic trends, fund news, service enhancements and changes. Sign up to receive the newsletter electronically at columbiathreadneedle.com/
us/newsletter.

 Investment videos
Get analysis of current events and trends that may affect your investments. Visit our online video library to watch and discover what our thought leaders are saying about the financial markets and economy.
 Social media
We offer you multiple ways to access our market commentary and investment insights.
n Perspectives blog at columbiathreadneedle.com/us
Read timely posts by our investment team, including our chief investment officer, chief economist and portfolio managers.
n twitter.com/CTinvest_US
Follow us on Twitter for quick, up-to-the-minute comments on market news and more.
n youtube.com/CTinvestUS
View our commentaries on the economy, markets and current investment opportunities.
n linkedin.com/company/columbia-threadneedle-investments-us
Connect with us on LinkedIn for updates from our thought leaders.
*Columbia Threadneedle Investor Newsletter was awarded top honors in the Mutual Fund Education Alliance STAR Awards competition for excellence in mutual fund marketing and communications in 2011, 2012 and 2013. Materials in the competition were evaluated on educational value, message comprehension, effective design and objectives.
Not part of the shareholder report
Stay informed
Become a subscriber to receive the latest investment publications and mutual fund commentaries
Subscribe to Columbia Threadneedle Investments
Email subscription center
Subscribe to the latest information from Columbia Threadneedle. Visit our email subscription center at columbiathreadneedle.com/us/subscribe to register for economic and market commentary, product and service updates, white papers and more.
n Columbia Threadneedle Investor Newsletter
Quarterly newsletter featuring the latest macro- and micro-economic trends, investment themes, products, service changes and other items of interest to our investors
n Investment Strategy Outlook
Quarterly publication featuring the Columbia Threadneedle Asset Allocation Team's perspective on global economic investment conditions and markets
n MarketTrack
Quarterly publication featuring more than 40 charts and graphs that highlight the current state of the economy and the markets; includes straightforward insight on current investment opportunities
n White papers
Frequent articles that delve deep into a variety of investment topics
n Mutual fund updates
Quarterly portfolio manager commentary and fund fact sheets available for Columbia funds. (Not all funds have a commentary.)
Register your information online at columbiathreadneedle.com/us/subscribe and select the publications you would like to receive. Update your subscriptions at any time by accessing the email subscription center.
CT-MK (03/15) 5383/1125800
 Dear Shareholder,
In a world that is changing faster than ever before, investors want asset managers who offer a global perspective while generating strong and sustainable returns. To that end, Columbia Management, in conjunction with its U.K.-based affiliate, Threadneedle Investments, has rebranded to Columbia Threadneedle Investments. The new global brand represents the combined capabilities, resources and reach of the global group, offering investors access to the best of both firms.
With a presence in 18 countries and more than 450 investment professionals*, our collective perspective and world view as Columbia Threadneedle Investments gives us deeper insight into what might affect the real-life financial outcomes clients are seeking. Putting our views into a global context enables us to build richer perspectives and create the right solutions, and provides us with enhanced capabilities to deliver consistent investment performance, which may ultimately lead to better investor outcomes.
As a result of the rebrand, you will begin to see our new logo and colors reflected in printed materials, such as this shareholder report, as well as on our new website — columbiathreadneedle.com/us. We encourage you to visit us online and view a new video on the "About Us" tab that speaks to the strength of the firm.
While we are introducing a new brand, in many ways, the investment company you know well has not changed. The following remain in effect:
n Fund and strategy names
n Established investment teams, philosophies and processes
n Account services, features, servicing phone numbers and mailing addresses
n Columbia Management Investment Distributors as distributor and Columbia Management Investment Advisers as investment adviser
We recognize that the money we manage represents the hard work and savings of people like you, and that everyone has different ambitions and different definitions of success. Investors have varying goals — funding their children's education, enjoying their retirement, putting money aside for unexpected events, and more. Whatever your ambitions, we believe our wide range of investment products and solutions can help give you confidence that you will reach your goals.
The world is constantly changing, but our priority remains the same: to help you secure your finances, meet your goals and achieve success. Thank you for your continued investment with us. Our service representatives are available at 800.345.6611 to help with any questions.
Sincerely,

Christopher O. Petersen
President, Columbia Funds
Investors should consider the investment objectives, risks, charges and expenses of a mutual fund carefully before investing. For a free prospectus and summary prospectus, which contains this and other important information about a fund, visit columbiathreadneedle.com/us. The prospectus should be read carefully before investing.
* Source: Ameriprise as of December 1, 2014
Columbia Funds are distributed by Columbia Management Investment Distributors, Inc., member FINRA, and managed by Columbia Management Investment Advisers, LLC.
© 2015 Columbia Management Investment Advisers, LLC. All rights reserved.
COLUMBIA CONVERTIBLE SECURITIES FUND
Fund Investment Manager
Columbia Management Investment
Advisers, LLC
225 Franklin Street
Boston, MA 02110
Fund Distributor
Columbia Management Investment
Distributors, Inc.
225 Franklin Street
Boston, MA 02110
Fund Transfer Agent
Columbia Management Investment
Services Corp.
P.O. Box 8081
Boston, MA 02266-8081
For more information about any of the funds, please visit columbiathreadneedle.com/us or call 800.345.6611. Customer Service Representatives are available to answer your questions Monday through Friday from 8 a.m. to 7 p.m. Eastern time.
The views expressed in this report reflect the current views of the respective parties. These views are not guarantees of future performance and involve certain risks, uncertainties and assumptions that are difficult to predict, so actual outcomes and results may differ significantly from the views expressed. These views are subject to change at any time based upon economic, market or other conditions and the respective parties disclaim any responsibility to update such views. These views may not be relied on as investment advice and, because investment decisions for a Columbia fund are based on numerous factors, may not be relied on as an indication of trading intent on behalf of any particular Columbia fund. References to specific securities should not be construed as a recommendation or investment advice.
Performance Overview | | | 3 | | |
Manager Discussion of Fund Performance | | | 5 | | |
Understanding Your Fund's Expenses | | | 7 | | |
Portfolio of Investments | | | 8 | | |
Statement of Assets and Liabilities | | | 15 | | |
Statement of Operations | | | 17 | | |
Statement of Changes in Net Assets | | | 18 | | |
Financial Highlights | | | 21 | | |
Notes to Financial Statements | | | 31 | | |
Report of Independent Registered
Public Accounting Firm | | | 39 | | |
Federal Income Tax Information | | | 40 | | |
Trustees and Officers | | | 41 | | |
Important Information About This Report | | | 47 | | |
COLUMBIA CONVERTIBLE SECURITIES FUND
Performance Summary
n Columbia Convertible Securities Fund (the Fund) Class A shares returned 6.44% excluding sales charges for the 12-month period that ended February 28, 2015.
n The Fund underperformed its benchmark, the Bank of America Merrill Lynch (BofAML) All Convertibles All Qualities Index, which returned 6.71% during the same time period.
n Healthcare and technology holdings were the strongest contributors to returns. A modest overweight in energy detracted from results relative to the benchmark.
Average Annual Total Returns (%) (for period ended February 28, 2015)
| | | Inception | | 1 Year | | 5 Years | | 10 Years | |
Class A | | 09/25/87 | | | | | | | | | | | | | |
Excluding sales charges | | | | | | | 6.44 | | | | 12.24 | | | | 6.81 | | |
Including sales charges | | | | | | | 0.34 | | | | 10.92 | | | | 6.18 | | |
Class B | | 07/15/98 | | | | | | | | | | | | | |
Excluding sales charges | | | | | | | 5.65 | | | | 11.40 | | | | 6.01 | | |
Including sales charges | | | | | | | 0.65 | | | | 11.14 | | | | 6.01 | | |
Class C | | 10/21/96 | | | | | | | | | | | | | |
Excluding sales charges | | | | | | | 5.62 | | | | 11.41 | | | | 6.01 | | |
Including sales charges | | | | | | | 4.62 | | | | 11.41 | | | | 6.01 | | |
Class I* | | 09/27/10 | | | 6.88 | | | | 12.64 | | | | 7.00 | | |
Class R* | | 11/16/11 | | | 6.13 | | | | 11.90 | | | | 6.43 | | |
Class R4* | | 11/08/12 | | | 6.71 | | | | 12.38 | | | | 6.88 | | |
Class R5* | | 11/08/12 | | | 6.80 | | | | 12.44 | | | | 6.91 | | |
Class W* | | 11/16/11 | | | 6.33 | | | | 12.16 | | | | 6.68 | | |
Class Y* | | 10/01/14 | | | 6.64 | | | | 12.29 | | | | 6.83 | | |
Class Z | | 05/21/99 | | | 6.70 | | | | 12.53 | | | | 7.09 | | |
BofAML All Convertibles All Qualities Index | | | | | | | 6.71 | | | | 12.23 | | | | 7.73 | | |
Returns for Class A are shown with and without the maximum initial sales charge of 5.75%. Returns for Class B are shown with and without the applicable contingent deferred sales charge (CDSC) of 5.00% in the first year, declining to 1.00% in the sixth year and eliminated thereafter. Returns for Class C are shown with and without the 1.00% CDSC for the first year only. The Fund's other classes are not subject to sales charges and have limited eligibility. Please see the Fund's prospectus for details. Performance for different share classes will vary based on differences in sales charges and fees associated with each class. All results shown assume reinvestment of distributions during the period. Returns do not reflect the deduction of taxes that a shareholder may pay on Fund distributions or on the redemption of Fund shares. Performance results reflect the effect of any fee waivers or reimbursements of Fund expenses by Columbia Management Investment Advisers, LLC and/or any of its affiliates. Absent these fee waivers or expense reimbursement arrangements, performance results would have been lower.
The performance information shown represents past performance and is not a guarantee of future results. The investment return and principal value of your investment will fluctuate so that your shares, when redeemed, may be worth more or less than their original cost. Current performance may be lower or higher than the performance information shown. You may obtain performance information current to the most recent month-end by contacting your financial intermediary, visiting columbiathreadneedle.com/us or calling 800.345.6611.
*The returns shown for periods prior to the share class inception date (including returns for the Life of the Fund, if shown, which are since Fund inception) include the returns of the Fund's oldest share class. These returns are adjusted to reflect any higher class-related operating expenses of the newer share classes, as applicable. Please visit columbiathreadneedle.com/us/investment-products/mutual-funds/appended-performance for more information.
The BofAML All Convertibles All Qualities Index measures the performance of U.S. dollar-denominated convertible securities not currently in bankruptcy with a total market value greater than $50 million at issuance.
Indices are not available for investment, are not professionally managed and do not reflect sales charges, fees, brokerage commissions, taxes or other expenses of investing. Securities in the Fund may not match those in an index.
Annual Report 2015
3
COLUMBIA CONVERTIBLE SECURITIES FUND
PERFORMANCE OVERVIEW (continued)
Performance of a Hypothetical $10,000 Investment (March 1, 2005 – February 28, 2015)
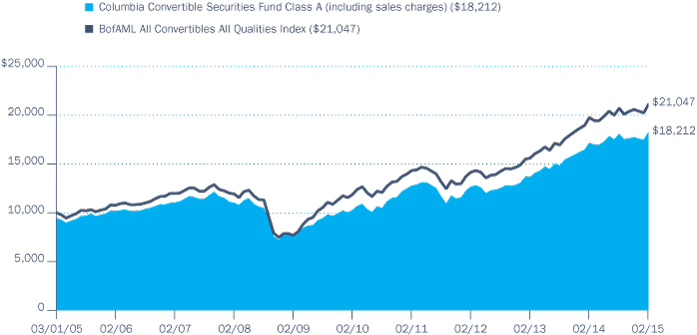
The chart above shows the change in value of a hypothetical $10,000 investment in Class A shares of Columbia Convertible Securities Fund during the stated time period, and does not reflect the deduction of taxes that a shareholder may pay on Fund distributions or on the redemption of Fund shares.
Annual Report 2015
4
COLUMBIA CONVERTIBLE SECURITIES FUND
MANAGER DISCUSSION OF FUND PERFORMANCE
For the 12-month period ended February 28, 2015, the Fund's Class A shares returned 6.44% excluding sales charges. The Fund underperformed its benchmark, the BofAML All Convertibles All Qualities Index, which returned 6.71% during the same time period. Healthcare and technology holdings were the strongest contributors to returns. A modest overweight in energy, particularly exploration and production (E&P) names, detracted from results relative to the benchmark.
U.S. Economy Set Positive Tone for Financial Markets
After a cold and difficult winter brought many parts of the United States to a standstill early in 2014, the pace of U.S. economic growth picked up and good news appeared in most sectors. The labor market added 267,000 new jobs monthly, on average, during the 12-month period ended February 28, 2015. Solid new job growth drove the unemployment rate down to 5.5%, and prospects for higher wages generally buoyed consumer confidence during the period. Manufacturing activity remained solid, as capacity utilization rose to a post-recovery high. However, another stormy winter in the Northeast and Midwest nipped growth early in 2015. Manufacturing activity and consumer confidence slipped as harsh weather weighed on short-term expectations. The housing market's recovery was restrained by both periods of bad weather, tighter borrowing standards, rising prices and higher mortgage rates.
Investors responded favorably to the generally good economic news. However, concerns about increased global tensions, uncertainty about the Federal Reserve's (the Fed's) next move and sinking oil prices resulted in bouts of volatility that became more pronounced as the period wore on. The Fed spent 2014 winding down its monthly bond purchases, ending its program of quantitative easing in October, and suggested that it would raise short-term interest rates sometime in 2015. However, the timing of that move remained unclear, especially as some weaker data appeared in January and February. Against this backdrop, interest rates dropped sharply. The yield on the 10-year U.S. Treasury bond, which started the period at 2.6%, dropped to 2.0%, having traded even lower in the final months of the period. U.S. stocks outperformed bonds and returns from convertible securities fell in between.
Standout Returns from Healthcare and Technology
The healthcare sector was the largest contributor to the Fund's returns, most notably certain long-held positions in the biotechnology and pharmaceutical industries, including Gilead Sciences and Cubist Pharmaceutical. Biotechnology leader Gilead Sciences continued to generate strong results as its convertibles traded well above par for the year. Gilead Sciences has been a solid performer for the Fund for three consecutive years, and we reduced the Fund's position somewhat, taking profits along the way. Nevertheless, at the close of the reporting period, it remained a large holding for the Fund. Cubist Pharmaceutical generated solid gains on news that it would be taken over by Merck. We took profits and sold Cubist Pharmaceutical. In the technology sector, semiconductor giant Micron Technology was the single largest contributor to Fund returns for the period. Semiconductor equipment maker Novellus Systems rose
Portfolio Management
David King, CFA
Yan Jin
Top Ten Holdings (%)
(at February 28, 2015) | |
Actavis PLC, 5.500% | | | 2.6 | | |
Micron Technology, Inc.,
2.125% 02/15/33 | | | 2.5 | | |
Intel Corp.,
3.250% 08/01/39 | | | 2.0 | | |
Fiat Chrysler Automobiles NV,
7.875% | | | 1.8 | | |
Bank of America Corp.,
7.250% | | | 1.7 | | |
Incyte Corp.,
1.250% 11/15/20 | | | 1.7 | | |
Microchip Technology, Inc.,
1.625% 02/15/25 | | | 1.5 | | |
Priceline Group, Inc. (The),
1.000% 03/15/18 | | | 1.5 | | |
Jarden Corp.,
1.875% 09/15/18 | | | 1.5 | | |
Novellus Systems, Inc.,
2.625% 05/15/41 | | | 1.3 | | |
Percentages indicated are based upon total investments (excluding Money Market Funds).
For further detail about these holdings, please refer to the section entitled "Portfolio of Investments."
Fund holdings are as of the date given, are subject to change at any time, and are not recommendations to buy or sell any security.
Annual Report 2015
5
COLUMBIA CONVERTIBLE SECURITIES FUND
MANAGER DISCUSSION OF FUND PERFORMANCE (continued)
Portfolio Breakdown (%)
(at February 28, 2015) | |
Common Stocks | | | 1.0 | | |
Health Care | | | 0.5 | | |
Industrials | | | 0.5 | | |
Materials | | | 0.0 | (a) | |
Convertible Bonds | | | 68.6 | | |
Convertible Preferred Stocks | | | 25.3 | | |
Consumer Discretionary | | | 1.7 | | |
Consumer Staples | | | 2.7 | | |
Energy | | | 2.9 | | |
Financials | | | 7.8 | | |
Health Care | | | 3.9 | | |
Industrials | | | 1.2 | | |
Materials | | | 0.6 | | |
Telecommunication Services | | | 0.7 | | |
Utilities | | | 3.8 | | |
Money Market Funds | | | 5.1 | | |
Total | | | 100.0 | | |
Percentages indicated are based upon total investments. The Fund's portfolio composition is subject to change.
(a) Rounds to zero.
Investment Risks
Market risk may affect a single issuer, sector of the economy, industry or the market as a whole. Convertible securities are subject to issuer default risk. A rise in interest rates may result in a price decline of fixed-income instruments held by the Fund, negatively impacting its performance and NAV. Falling rates may result in the fund investing in lower yielding debt instruments, lowering the Fund's income and yield. These risks may be heightened for longer maturity and duration securities. The Fund may also be forced to convert a convertible security at an inopportune time, which may decrease the Fund's return. Non-investment-grade (high-yield or junk) securities present greater price volatility and more risk to principal and income than higher rated securities. Foreign investments subject the Fund to risks, including political, economic, market, social and others within a particular country, as well as to currency instabilities and less stringent financial and accounting standards generally applicable to U.S. issuers. Short positions (where the underlying asset is not owned) can create unlimited risk. Market or other (e.g., interest rate) environments may adversely affect the liquidity of fund investments, negatively impacting their price. Generally, the less liquid the market at the time the fund sells a holding, the greater risk of loss or decline of value to the fund. See the Fund's prospectus for more information on these and other risks.
on strong demand for silicon wafer fabricating equipment from global semiconductor companies. Gains from these and other technology positions more than offset the biggest single disappointment of the year, a significant loss from GT Technologies. The company took a hit in September after it learned that the Apple iPhone 6 would not feature GT's sapphire display and filed for bankruptcy late in 2014.
Energy Detracted from Results
The Fund lost ground against its benchmark because of a modest overweight in energy, which was hit hard by declining prices in the second half of 2014. Energy XXI, Cobalt Energy and Endeavor International, all global E&P names, were major disappointments. Endeavour International suffered a sharp decline after a weak showing early in 2014 and was sold from the Fund. Alpha Natural, one of the largest coal companies, was another energy disappointment. As energy issues came down with commodity prices, we saw opportunity and added to some higher quality names on the heels of the downturn.
Looking Ahead
At this time, our outlook on the convertibles market remains constructive over the long term. We believe the market is well diversified, valuations are reasonably attractive and new issuance got off to a solid start in 2015. However, we are mindful that the level of equity sensitivity for convertibles continues to be higher than its historical norm — and convertibles have enjoyed solid returns for five consecutive years, which interjects a note of caution to our current view.
Annual Report 2015
6
COLUMBIA CONVERTIBLE SECURITIES FUND
UNDERSTANDING YOUR FUND'S EXPENSES
(Unaudited)
As an investor, you incur two types of costs. There are transaction costs, which generally include sales charges on purchases and may include redemption fees. There are also ongoing costs, which generally include management fees, distribution and/or service fees, and other fund expenses. The following information is intended to help you understand your ongoing costs (in dollars) of investing in the Fund and to help you compare these costs with the ongoing costs of investing in other mutual funds.
Analyzing Your Fund's Expenses
To illustrate these ongoing costs, we have provided examples and calculated the expenses paid by investors in each share class of the Fund during the period. The actual and hypothetical information in the table is based on an initial investment of $1,000 at the beginning of the period indicated and held for the entire period. Expense information is calculated two ways and each method provides you with different information. The amount listed in the "Actual" column is calculated using the Fund's actual operating expenses and total return for the period. You may use the Actual information, together with the amount invested, to estimate the expenses that you paid over the period. Simply divide your account value by $1,000 (for example, an $8,600 account value divided by $1,000 = 8.6), then multiply the results by the expenses paid during the period under the "Actual" column. The amount listed in the "Hypothetical" column assumes a 5% annual rate of return before expenses (which is not the Fund's actual return) and then applies the Fund's actual expense ratio for the period to the hypothetical return. You should not use the hypothetical account values and expenses to estimate either your actual account balance at the end of the period or the expenses you paid during the period. See "Compare With Other Funds" below for details on how to use the hypothetical data.
Compare With Other Funds
Since all mutual funds are required to include the same hypothetical calculations about expenses in shareholder reports, you can use this information to compare the ongoing cost of investing in the Fund with other funds. To do so, compare the hypothetical example with the 5% hypothetical examples that appear in the shareholder reports of other funds. As you compare hypothetical examples of other funds, it is important to note that hypothetical examples are meant to highlight the ongoing costs of investing in a fund only and do not reflect any transaction costs, such as sales charges, or redemption or exchange fees. Therefore, the hypothetical calculations are useful in comparing ongoing costs only, and will not help you determine the relative total costs of owning different funds. If transaction costs were included in these calculations, your costs would be higher.
September 1, 2014 – February 28, 2015
| | | Account Value at the Beginning
of the Period ($) | | Account Value at the End of the
Period ($) | | Expenses Paid During the
Period ($) | | Fund's Annualized
Expense Ratio (%) | |
| | | Actual | | Hypothetical | | Actual | | Hypothetical | | Actual | | Hypothetical | | Actual | |
Class A | | | 1,000.00 | | | | 1,000.00 | | | | 1,008.70 | | | | 1,019.45 | | | | 5.51 | | | | 5.54 | | | | 1.10 | | |
Class B | | | 1,000.00 | | | | 1,000.00 | | | | 1,005.00 | | | | 1,015.71 | | | | 9.25 | | | | 9.30 | | | | 1.85 | | |
Class C | | | 1,000.00 | | | | 1,000.00 | | | | 1,004.90 | | | | 1,015.71 | | | | 9.25 | | | | 9.30 | | | | 1.85 | | |
Class I | | | 1,000.00 | | | | 1,000.00 | | | | 1,010.90 | | | | 1,021.49 | | | | 3.46 | | | | 3.48 | | | | 0.69 | | |
Class R | | | 1,000.00 | | | | 1,000.00 | | | | 1,007.40 | | | | 1,018.20 | | | | 6.76 | | | | 6.79 | | | | 1.35 | | |
Class R4 | | | 1,000.00 | | | | 1,000.00 | | | | 1,009.90 | | | | 1,020.69 | | | | 4.26 | | | | 4.28 | | | | 0.85 | | |
Class R5 | | | 1,000.00 | | | | 1,000.00 | | | | 1,010.60 | | | | 1,021.24 | | | | 3.71 | | | | 3.73 | | | | 0.74 | | |
Class W | | | 1,000.00 | | | | 1,000.00 | | | | 1,009.00 | | | | 1,019.45 | | | | 5.51 | | | | 5.54 | | | | 1.10 | | |
Class Y | | | 1,000.00 | | | | 1,000.00 | | | | 1,054.80 | * | | | 1,021.49 | | | | 2.87 | * | | | 3.48 | | | | 0.69 | * | |
Class Z | | | 1,000.00 | | | | 1,000.00 | | | | 1,010.50 | | | | 1,020.69 | | | | 4.26 | | | | 4.28 | | | | 0.85 | | |
*Based on operations from October 1, 2014 (commencement of operations) through the stated period end.
Expenses paid during the period are equal to the annualized expense ratio for each class as indicated above, multiplied by the average account value over the period and then multiplied by the number of days in the Fund's most recent fiscal half year and divided by 365.
Expenses do not include fees and expenses incurred indirectly by the Fund from its investment in underlying funds, including affiliated and non-affiliated pooled investment vehicles, such as mutual funds and exchange-traded funds.
Had Columbia Management Investment Advisers, LLC and/or certain of its affiliates not waived/reimbursed certain fees and expenses, account value at the end of the period would have been reduced.
Annual Report 2015
7
COLUMBIA CONVERTIBLE SECURITIES FUND
PORTFOLIO OF INVESTMENTS
February 28, 2015
(Percentages represent value of investments compared to net assets)
Common Stocks 1.1%
Issuer | | Shares | | Value ($) | |
HEALTH CARE 0.5% | |
Pharmaceuticals 0.5% | |
Teva Pharmaceutical Industries
Ltd., ADR | | | 119,000 | | | | 6,785,380 | | |
Total Health Care | | | | | 6,785,380 | | |
INDUSTRIALS 0.5% | |
Transportation Infrastructure 0.5% | |
Macquarie Infrastructure Co. LLC | | | 91,300 | | | | 7,177,093 | | |
Total Industrials | | | | | 7,177,093 | | |
MATERIALS 0.1% | |
Metals & Mining 0.1% | |
Jaguar Mining, Inc.(a) | | | 1,247,898 | | | | 511,597 | | |
Total Materials | | | | | 511,597 | | |
Total Common Stocks
(Cost: $13,912,074) | | | | | 14,474,070 | | |
Convertible Preferred Stocks 25.9%
CONSUMER DISCRETIONARY 1.7% | |
Automobiles 1.7% | |
Fiat Chrysler Automobiles NV 7.875% | | | 182,000 | | | | 24,115,000 | | |
Total Consumer Discretionary | | | | | 24,115,000 | | |
CONSUMER STAPLES 2.7% | |
Food Products 2.7% | |
Bunge Ltd., 4.875% | | | 130,000 | | | | 13,662,870 | | |
Post Holdings, Inc., 3.750%(b) | | | 92,500 | | | | 10,286,463 | | |
Tyson Foods, Inc., 4.750% | | | 275,000 | | | | 13,983,750 | | |
Total | | | | | 37,933,083 | | |
Total Consumer Staples | | | | | 37,933,083 | | |
ENERGY 3.0% | |
Oil, Gas & Consumable Fuels 3.0% | |
Chesapeake Energy Corp., 5.000% | | | 68,900 | | | | 6,407,700 | | |
Chesapeake Energy Corp., 5.750%(b) | | | 18,000 | | | | 18,101,250 | | |
Penn Virginia Corp., 6.000%(b) | | | 71,900 | | | | 4,718,574 | | |
Southwestern Energy Co., 6.250% | | | 230,000 | | | | 12,383,200 | | |
Total | | | | | 41,610,724 | | |
Total Energy | | | | | 41,610,724 | | |
Convertible Preferred Stocks (continued)
Issuer | | Shares | | Value ($) | |
FINANCIALS 8.0% | |
Banks 1.7% | |
Bank of America Corp., 7.250% | | | 20,000 | | | | 23,400,000 | | |
Capital Markets 0.5% | |
AMG Capital Trust II, 5.150% | | | 125,000 | | | | 7,726,562 | | |
Real Estate Investment Trusts (REITs) 5.8% | |
Alexandria Real Estate Equities, Inc.,
7.000% | | | 450,000 | | | | 13,035,960 | | |
American Tower Corp., 5.250% | | | 103,825 | | | | 10,958,729 | | |
American Tower Corp., 5.500% | | | 103,300 | | | | 10,436,399 | | |
Crown Castle International Corp.
4.500% | | | 128,000 | | | | 13,632,000 | | |
Health Care REIT, Inc., 6.500% | | | 190,000 | | | | 12,984,600 | | |
Weyerhaeuser Co., 6.375% | | | 225,000 | | | | 13,126,500 | | |
iStar Financial, Inc., 4.500% | | | 110,000 | | | | 6,358,275 | | |
Total | | | | | 80,532,463 | | |
Total Financials | | | | | 111,659,025 | | |
HEALTH CARE 4.0% | |
Health Care Equipment & Supplies 0.4% | |
Alere, Inc., 3.000% | | | 17,600 | | | | 5,770,688 | | |
Health Care Providers & Services 1.1% | |
Kindred Healthcare, Inc., 7.500% | | | 6,760 | | | | 7,109,019 | | |
Omnicare Capital Trust II, 4.000% | | | 81,400 | | | | 7,672,764 | | |
Total | | | | | 14,781,783 | | |
Pharmaceuticals 2.5% | |
Actavis PLC, 5.500% | | | 34,800 | | | | 35,413,524 | | |
Total Health Care | | | | | 55,965,995 | | |
INDUSTRIALS 1.3% | |
Aerospace & Defense 0.7% | |
United Technologies Corp., 7.500% | | | 158,100 | | | | 10,070,970 | | |
Road & Rail 0.6% | |
Genesee & Wyoming, Inc., 5.000% | | | 59,000 | | | | 7,698,320 | | |
Total Industrials | | | | | 17,769,290 | | |
MATERIALS 0.6% | |
Metals & Mining 0.6% | |
Alcoa, Inc., 5.375% | | | 182,600 | | | | 8,837,840 | | |
Total Materials | | | | | 8,837,840 | | |
The accompanying Notes to Financial Statements are an integral part of this statement.
Annual Report 2015
8
COLUMBIA CONVERTIBLE SECURITIES FUND
PORTFOLIO OF INVESTMENTS (continued)
February 28, 2015
Convertible Preferred Stocks (continued)
Issuer | | Shares | | Value ($) | |
TELECOMMUNICATION SERVICES 0.8% | |
Wireless Telecommunication Services 0.8% | |
T-Mobile USA, Inc. 5.500% | | | 176,000 | | | | 10,630,400 | | |
Total Telecommunication Services | | | | | 10,630,400 | | |
UTILITIES 3.8% | |
Electric Utilities 1.2% | |
NextEra Energy, Inc., 5.799% | | | 297,000 | | | | 16,940,880 | | |
Multi-Utilities 2.6% | |
CenterPoint Energy, Inc., 3.943%(c) | | | 250,000 | | | | 16,125,000 | | |
Dominion Resources, Inc., 6.000% | | | 176,600 | | | | 10,196,884 | | |
Dominion Resources, Inc., 6.125% | | | 177,300 | | | | 10,214,253 | | |
Total | | | | | 36,536,137 | | |
Total Utilities | | | | | 53,477,017 | | |
Total Convertible Preferred Stocks
(Cost: $335,442,276) | | | | | 361,998,374 | | |
Convertible Bonds 69.7%
Issuer | | Coupon
Rate | | Principal
Amount ($) | | Value ($) | |
AUTOMOTIVE 1.6% | |
Navistar International Corp.(b)
04/15/19 | | | 4.750 | % | | | | | 18,330,000 | | | | 16,130,400 | | |
Wabash National Corp.
05/01/18 | | | 3.375 | % | | | | | | | 4,760,000 | | | | 6,737,732 | | |
Total | | | | | | | | | 22,868,132 | | |
BANKING 0.6% | |
Cowen Group, Inc.(b)
03/15/19 | | | 3.000 | % | | | | | 7,570,000 | | | | 8,577,756 | | |
BROKERAGE/ASSET MANAGERS/EXCHANGES 0.5% | |
Walter Investment Management Corp.
11/01/19 | | | 4.500 | % | | | | | 9,400,000 | | | | 7,490,625 | | |
BUILDING MATERIALS 0.5% | |
Cemex SAB de CV
03/15/18 | | | 3.750 | % | | | | | 5,400,000 | | | | 6,669,000 | | |
CONSUMER PRODUCTS 1.4% | |
Jarden Corp.
09/15/18 | | | 1.875 | % | | | | | 11,600,000 | | | | 19,930,250 | | |
Convertible Bonds (continued)
| Issuer | | Coupon
Rate | | Principal
Amount ($) | | Value ($) | |
ELECTRIC 0.7% | |
NRG Yield, Inc.(b)
02/01/19 | | | 3.500 | % | | | 8,820,000 | | | | 10,341,891 | | |
FINANCE COMPANIES 1.6% | |
Air Lease Corp.
12/01/18 | | | 3.875 | % | | | 6,660,000 | | | | 9,686,138 | | |
Ares Capital Corp.
01/15/19 | | | 4.375 | % | | | 12,760,000 | | | | 13,230,525 | | |
Total | | | | | | | 22,916,663 | | |
HEALTH CARE 3.8% | |
Brookdale Senior Living, Inc.
06/15/18 | | | 2.750 | % | | | 5,950,000 | | | | 8,229,594 | | |
Hologic, Inc.(c)
12/15/37 | | | 2.000 | % | | | 5,000,000 | | | | 7,265,625 | | |
Immunomedics, Inc.(b)
02/15/20 | | | 4.750 | % | | | 5,306,000 | | | | 5,411,802 | | |
Molina Healthcare, Inc.
08/15/44 | | | 1.625 | % | | | 9,825,000 | | | | 12,311,953 | | |
Omnicare, Inc.
12/15/35 | | | 3.250 | % | | | 8,600,000 | | | | 10,078,125 | | |
Teleflex, Inc.
08/01/17 | | | 3.875 | % | | | 5,100,000 | | | | 10,133,062 | | |
Total | | | | | | | 53,430,161 | | |
HEALTHCARE INSURANCE 0.8% | |
Anthem, Inc.
10/15/42 | | | 2.750 | % | | | 5,500,000 | | | | 10,810,938 | | |
INDEPENDENT ENERGY 1.2% | |
American Energy-Permian Basin LLC
PIK(b)
05/01/22 | | | 8.000 | % | | | 5,000,000 | | | | 4,250,000 | | |
Newpark Resources, Inc.
10/01/17 | | | 4.000 | % | | | 4,673,000 | | | | 5,315,538 | | |
Stone Energy Corp.
03/01/17 | | | 1.750 | % | | | 7,650,000 | | | | 7,042,781 | | |
Total | | | | | | | 16,608,319 | | |
INTEGRATED ENERGY 0.2% | |
American Energy — Utica LLC
PIK(b)
03/01/21 | | | 3.500 | % | | | 4,950,000 | | | | 2,376,000 | | |
MEDIA AND ENTERTAINMENT 0.3% | |
Global Eagle Entertainment, Inc.(b)
02/15/35 | | | 2.750 | % | | | 3,440,000 | | | | 3,440,860 | | |
The accompanying Notes to Financial Statements are an integral part of this statement.
Annual Report 2015
9
COLUMBIA CONVERTIBLE SECURITIES FUND
PORTFOLIO OF INVESTMENTS (continued)
February 28, 2015
Convertible Bonds (continued)
Issuer | | Coupon
Rate | | Principal
Amount ($) | | Value ($) | |
METALS 0.9% | |
Alpha Natural Resources, Inc.
12/15/20 | | | 4.875 | % | | | 7,320,000 | | | | 1,939,800 | | |
Royal Gold, Inc.
06/15/19 | | | 2.875 | % | | | 9,620,000 | | | | 10,378,729 | | |
Total | | | | | | | 12,318,529 | | |
MIDSTREAM 0.4% | |
Scorpio Tankers, Inc.(b) | |
07/01/19 | | | 2.375 | % | | | 6,400,000 | | | | 6,225,843 | | |
OIL FIELD SERVICES 1.8% | |
Cobalt International Energy, Inc.
12/01/19 | | | 2.625 | % | | | 9,294,000 | | | | 6,735,362 | | |
05/15/24 | | | 3.125 | % | | | 14,732,000 | | | | 11,371,262 | | |
Energy XXI Ltd.
12/15/18 | | | 3.000 | % | | | 9,850,000 | | | | 3,693,947 | | |
Vantage Drilling Co.(b)
07/15/43 | | | 5.500 | % | | | 5,082,000 | | | | 3,485,571 | | |
Total | | | | | | | 25,286,142 | | |
OTHER FINANCIAL INSTITUTIONS 2.0% | |
AirTran Holdings, Inc.
11/01/16 | | | 5.250 | % | | | 2,440,000 | | | | 7,213,250 | | |
Encore Capital Group, Inc.(b)
03/15/21 | | | 2.875 | % | | | 6,600,000 | | | | 6,038,340 | | |
Forest City Enterprises, Inc.
08/15/20 | | | 3.625 | % | | | 12,475,000 | | | | 14,471,000 | | |
Total | | | | | | | 27,722,590 | | |
OTHER INDUSTRY 1.2% | |
General Cable Corp.(c)
11/15/29 | | | 4.500 | % | | | 14,580,000 | | | | 10,142,213 | | |
WESCO International, Inc. | |
09/15/29 | | | 6.000 | % | | | 2,900,000 | | | | 7,115,875 | | |
Total | | | | | | | 17,258,088 | | |
OTHER REIT 3.4% | |
Blackstone Mortgage Trust, Inc.
12/01/18 | | | 5.250 | % | | | 8,080,000 | | | | 8,420,814 | | |
National Health Investors, Inc.
04/01/21 | | | 3.250 | % | | | 9,000,000 | | | | 9,590,625 | | |
RWT Holdings, Inc.(b)
11/15/19 | | | 5.625 | % | | | 7,120,000 | | | | 7,170,196 | | |
Starwood Property Trust, Inc.
10/15/17 | | | 3.750 | % | | | 9,730,000 | | | | 10,143,525 | | |
Convertible Bonds (continued)
Issuer | | Coupon
Rate | | Principal
Amount ($) | | Value ($) | |
Starwood Waypoint Residential Trust(b)
10/15/17 | | | 4.500 | % | | | 5,980,000 | | | | 6,203,473 | | |
07/01/19 | | | 3.000 | % | | | 6,380,000 | | | | 6,069,734 | | |
Total | | | | | | | 47,598,367 | | |
OTHER UTILITY 0.4% | |
EnerNOC, Inc.(b)
08/15/19 | | | 2.250 | % | | | 7,300,000 | | | | 5,770,891 | | |
PHARMACEUTICALS 13.0% | |
AMAG Pharmaceuticals, Inc.
02/15/19 | | | 2.500 | % | | | 5,210,000 | | | | 9,866,438 | | |
ARIAD Pharmaceuticals, Inc.(b)
06/15/19 | | | 3.625 | % | | | 6,300,000 | | | | 7,048,755 | | |
Acorda Therapeutics, Inc.
06/15/21 | | | 1.750 | % | | | 5,641,000 | | | | 5,863,114 | | |
Aegerion Pharmaceuticals, Inc.(b)
08/15/19 | | | 2.000 | % | | | 11,720,000 | | | | 11,026,750 | | |
BioMarin Pharmaceutical, Inc.
10/15/20 | | | 1.500 | % | | | 11,400,000 | | | | 15,632,250 | | |
Clovis Oncology, Inc.(b)
09/15/21 | | | 2.500 | % | | | 6,000,000 | | | | 8,542,380 | | |
Corsicanto Ltd.
01/15/32 | | | 3.500 | % | | | 5,650,000 | | | | 4,223,375 | | |
Gilead Sciences, Inc.
05/01/16 | | | 1.625 | % | | | 3,100,000 | | | | 14,122,980 | | |
Incyte Corp.
11/15/20 | | | 1.250 | % | | | 12,800,000 | | | | 22,474,240 | | |
Isis Pharmaceuticals, Inc.(b)
11/15/21 | | | 1.000 | % | | | 7,860,000 | | | | 9,569,550 | | |
Jazz Investments I Ltd.(b)
08/15/21 | | | 1.875 | % | | | 6,000,000 | | | | 7,005,900 | | |
Medicines Co. (The)(b)
01/15/22 | | | 2.500 | % | | | 9,830,000 | | | | 10,651,985 | | |
Mylan NV
09/15/15 | | | 3.750 | % | | | 4,000,000 | | | | 17,175,000 | | |
Salix Pharmaceuticals Ltd.
03/15/19 | | | 1.500 | % | | | 7,300,000 | | | | 17,624,937 | | |
TESARO, Inc.
10/01/21 | | | 3.000 | % | | | 4,600,000 | | | | 7,676,250 | | |
Theravance, Inc.
01/15/23 | | | 2.125 | % | | | 6,100,000 | | | | 5,639,773 | | |
United Therapeutics Corp.
09/15/16 | | | 1.000 | % | | | 2,455,000 | | | | 7,960,338 | | |
Total | | | | | | | 182,104,015 | | |
The accompanying Notes to Financial Statements are an integral part of this statement.
Annual Report 2015
10
COLUMBIA CONVERTIBLE SECURITIES FUND
PORTFOLIO OF INVESTMENTS (continued)
February 28, 2015
Convertible Bonds (continued)
Issuer | | Coupon
Rate | | Principal
Amount ($) | | Value ($) | |
PROPERTY & CASUALTY 1.5% | |
MGIC Investment Corp.
05/01/17 | | | 5.000 | % | | | | | 6,880,000 | | | | 7,623,900 | | |
Radian Group, Inc.
11/15/17 | | | 3.000 | % | | | | | 8,610,000 | | | | 12,619,031 | | |
Total | | | | | | | | | 20,242,931 | | |
RAILROADS 0.5% | |
Greenbrier Companies, Inc. (The)
04/01/18 | | | 3.500 | % | | | | | 4,360,000 | | | | 6,853,375 | | |
REFINING 0.4% | |
Clean Energy Fuels Corp.(b)
10/01/18 | | | 5.250 | % | | | | | | | 6,930,000 | | | | 5,108,789 | | |
RETAILERS 3.2% | |
HeartWare International, Inc.
12/15/17 | | | 3.500 | % | | | | | 6,100,000 | | | | 6,854,875 | | |
Iconix Brand Group, Inc.
03/15/18 | | | 1.500 | % | | | | | 8,347,000 | | | | 10,042,484 | | |
Priceline Group, Inc. (The)
03/15/18 | | | 1.000 | % | | | | | | | 14,780,000 | | | | 20,784,375 | | |
Restoration Hardware Holdings, Inc.(b)(d)
06/15/19 | | | 0.000 | % | | | | | 6,930,000 | | | | 6,986,965 | | |
Total | | | | | | | | | 44,668,699 | | |
TECHNOLOGY 26.8% | |
Bottomline Technologies de, Inc.
12/01/17 | | | 1.500 | % | | | | | | | 5,920,000 | | | | 6,422,963 | | |
Cepheid
02/01/21 | | | 1.250 | % | | | | | 8,840,000 | | | | 9,823,450 | | |
Ciena Corp.
12/15/20 | | | 4.000 | % | | | | | 4,410,000 | | | | 5,735,756 | | |
Ciena Corp.(b)
10/15/18 | | | 3.750 | % | | | | | 6,100,000 | | | | 7,809,586 | | |
Cornerstone OnDemand, Inc.
07/01/18 | | | 1.500 | % | | | | | 10,500,000 | | | | 10,368,750 | | |
Ctrip.com International Ltd.
10/15/18 | | | 1.250 | % | | | | | 7,200,000 | | | | 6,921,000 | | |
Electronic Arts, Inc.
07/15/16 | | | 0.750 | % | | | | | 7,380,000 | | | | 13,297,837 | | |
Electronics for Imaging, Inc.(b)
09/01/19 | | | 0.750 | % | | | | | 9,640,000 | | | | 9,761,175 | | |
Envestnet, Inc.
12/15/19 | | | 1.750 | % | | | | | 8,450,000 | | | | 9,178,812 | | |
Equinix, Inc.
06/15/16 | | | 4.750 | % | | | | | 3,700,000 | | | | 10,295,250 | | |
Convertible Bonds (continued)
Issuer | | Coupon
Rate | | Principal
Amount ($) | | Value ($) | |
Intel Corp.
08/01/39 | | | 3.250 | % | | | | | 16,700,000 | | | | 27,586,312 | | |
LinkedIn Corp.(b)
11/01/19 | | | 0.500 | % | | | | | 11,890,000 | | | | 13,495,150 | | |
Mentor Graphics Corp.
04/01/31 | | | 4.000 | % | | | | | 5,340,000 | | | | 6,541,500 | | |
Microchip Technology, Inc.(b)
02/15/25 | | | 1.625 | % | | | | | 19,656,000 | | | | 20,884,500 | | |
Micron Technology, Inc.
02/15/33 | | | 2.125 | % | | | | | | | 12,000,000 | | | | 33,675,000 | | |
NVIDIA Corp.
12/01/18 | | | 1.000 | % | | | | | 9,120,000 | | | | 10,989,600 | | |
NXP Semiconductors NV(b)
12/01/19 | | | 1.000 | % | | | | | 6,300,000 | | | | 6,886,688 | | |
Novellus Systems, Inc.
05/15/41 | | | 2.625 | % | | | | | 7,640,000 | | | | 18,134,304 | | |
PROS Holdings, Inc.(b)
12/01/19 | | | 2.000 | % | | | | | 6,700,000 | | | | 6,680,429 | | |
Palo Alto Networks, Inc.(b)(d)
07/01/19 | | | 0.000 | % | | | | | 7,570,000 | | | | 10,622,300 | | |
Qihoo 360 Technology Co., Ltd.(b)
08/15/21 | | | 1.750 | % | | | | | 7,210,000 | | | | 5,484,106 | | |
Red Hat, Inc.(b)
10/01/19 | | | 0.250 | % | | | | | 8,560,000 | | | | 10,132,900 | | |
Salesforce.com, Inc.
04/01/18 | | | 0.250 | % | | | | | 12,000,000 | | | | 14,565,000 | | |
SanDisk Corp.
08/15/17 | | | 1.500 | % | | | | | 3,930,000 | | | | 6,354,319 | | |
10/15/20 | | | 0.500 | % | | | | | 5,900,000 | | | | 6,353,563 | | |
ServiceNow, Inc.(d)
11/01/18 | | | 0.000 | % | | | | | 7,960,000 | | | | 9,586,825 | | |
Spansion LLC
09/01/20 | | | 2.000 | % | | | | | 2,500,000 | | | | 6,507,813 | | |
SunEdison, Inc.
01/01/21 | | | 2.750 | % | | | | | 4,600,000 | | | | 7,577,074 | | |
SunEdison, Inc.(b)
04/15/22 | | | 2.375 | % | | | | | 13,300,000 | | | | 14,796,250 | | |
Synchronoss Technologies, Inc.
08/15/19 | | | 0.750 | % | | | | | 5,680,000 | | | | 6,340,300 | | |
TiVo, Inc.(b)
10/01/21 | | | 2.000 | % | | | | | 13,395,000 | | | | 12,499,209 | | |
Twitter, Inc.(b)
09/15/21 | | | 1.000 | % | | | | | 11,000,000 | | | | 10,663,125 | | |
Verint Systems, Inc.
06/01/21 | | | 1.500 | % | | | | | 6,280,000 | | | | 7,151,350 | | |
The accompanying Notes to Financial Statements are an integral part of this statement.
Annual Report 2015
11
COLUMBIA CONVERTIBLE SECURITIES FUND
PORTFOLIO OF INVESTMENTS (continued)
February 28, 2015
Convertible Bonds (continued)
Issuer | | Coupon
Rate | | Principal
Amount ($) | | Value ($) | |
j2 Global, Inc.
06/15/29 | | | 3.250 | % | | | 9,373,000 | | | | 10,907,829 | | |
Total | | | | | | | 374,030,025 | | |
TOBACCO 1.0% | |
Vector Group Ltd.
04/15/20 | | | 1.750 | % | | | 5,120,000 | | | | 5,518,490 | | |
Vector Group Ltd.(c)
01/15/19 | | | 2.500 | % | | | 5,800,000 | | | | 8,451,354 | | |
Total | | | | | | | 13,969,844 | | |
Total Convertible Bonds
(Cost: $877,178,607) | | | | | | | 974,618,723 | | |
Money Market Funds 5.1%
| | | Shares | | Value ($) | |
Columbia Short-Term Cash Fund,
0.118%(e)(f) | | | 71,773,939 | | | | 71,773,939 | | |
Total Money Market Funds
(Cost: $71,773,939) | | | | | 71,773,939 | | |
Total Investments
(Cost: $1,298,306,896) | | | | | 1,422,865,106 | | |
Other Assets & Liabilities, Net | | | | | (25,192,517 | ) | |
Net Assets | | | | | 1,397,672,589 | | |
Notes to Portfolio of Investments
(a) Non-income producing.
(b) Security exempt from registration pursuant to Rule 144A under the Securities Act of 1933. This security may be resold in transactions exempt from registration, normally to qualified institutional buyers. At February 28, 2015, the value of these securities amounted to $320,255,536 or 22.91% of net assets.
(c) Variable rate security.
(d) Zero coupon bond.
(e) The rate shown is the seven-day current annualized yield at February 28, 2015.
(f) As defined in the Investment Company Act of 1940, an affiliated company is one in which the Fund owns 5% or more of the company's outstanding voting securities, or a company which is under common ownership or control with the Fund. Holdings and transactions in these affiliated companies during the year ended February 28, 2015, are as follows:
Issuer | | Beginning
Cost ($) | | Purchase
Cost ($) | | Proceeds
From Sales ($) | | Ending
Cost ($) | | Dividends —
Affiliated
Issuers ($) | | Value ($) | |
Columbia Short-Term Cash Fund | | | 36,240,405 | | | | 597,241,220 | | | | (561,707,686 | ) | | | 71,773,939 | | | | 41,806 | | | | 71,773,939 | | |
Abbreviation Legend
ADR American Depositary Receipt
PIK Payment-in-Kind
Fair Value Measurements
Generally accepted accounting principles (GAAP) require disclosure regarding the inputs and valuation techniques used to measure fair value and any changes in valuation inputs or techniques. In addition, investments shall be disclosed by major category.
The Fund categorizes its fair value measurements according to a three-level hierarchy that maximizes the use of observable inputs and minimizes the use of unobservable inputs by prioritizing that the most observable input be used when available. Observable inputs are those that market participants would use in pricing an investment based on market data obtained from sources independent of the reporting entity. Unobservable inputs are those that reflect the Fund's assumptions about the information market participants would use in pricing an investment. An investment's level within the fair value hierarchy is based on the lowest level of any input that is deemed significant to the asset or liability's fair value measurement. The input levels are not necessarily an indication of the risk or liquidity associated with investments at that level. For example, certain U.S. government securities are generally high quality and liquid, however, they are reflected as Level 2 because the inputs used to determine fair value may not always be quoted prices in an active market.
The accompanying Notes to Financial Statements are an integral part of this statement.
Annual Report 2015
12
COLUMBIA CONVERTIBLE SECURITIES FUND
PORTFOLIO OF INVESTMENTS (continued)
February 28, 2015
Fair Value Measurements (continued)
Fair value inputs are summarized in the three broad levels listed below:
> Level 1 — Valuations based on quoted prices for investments in active markets that the Fund has the ability to access at the measurement date (including NAV for open-end mutual funds). Valuation adjustments are not applied to Level 1 investments.
> Level 2 — Valuations based on other significant observable inputs (including quoted prices for similar securities, interest rates, prepayment speeds, credit risks, etc.).
> Level 3 — Valuations based on significant unobservable inputs (including the Fund's own assumptions and judgment in determining the fair value of investments).
Inputs that are used in determining fair value of an investment may include price information, credit data, volatility statistics, and other factors. These inputs can be either observable or unobservable. The availability of observable inputs can vary between investments, and is affected by various factors such as the type of investment, and the volume and level of activity for that investment or similar investments in the marketplace. The inputs will be considered by the Investment Manager, along with any other relevant factors in the calculation of an investment's fair value. The Fund uses prices and inputs that are current as of the measurement date, which may include periods of market dislocations. During these periods, the availability of prices and inputs may be reduced for many investments. This condition could cause an investment to be reclassified between the various levels within the hierarchy.
Foreign equity securities actively traded in markets where there is a significant delay in the local close relative to the New York Stock Exchange (NYSE) are classified as Level 2. The values of these securities may include an adjustment to reflect the impact of significant market movements following the close of local trading, as described in Note 2 to the financial statements — Security Valuation.
Investments falling into the Level 3 category are primarily supported by quoted prices from brokers and dealers participating in the market for those investments. However, these may be classified as Level 3 investments due to lack of market transparency and corroboration to support these quoted prices. Additionally, valuation models may be used as the pricing source for any remaining investments classified as Level 3. These models may rely on one or more significant unobservable inputs and/or significant assumptions by the Investment Manager. Inputs used in valuations may include, but are not limited to, financial statement analysis, capital account balances, discount rates and estimated cash flows, and comparable company data.
Under the direction of the Fund's Board of Trustees (the Board), the Investment Manager's Valuation Committee (the Committee) is responsible for overseeing the valuation procedures approved by the Board. The Committee consists of voting and non-voting members from various groups within the Investment Manager's organization, including operations and accounting, trading and investments, compliance, risk management and legal.
The Committee meets at least monthly to review and approve valuation matters, which may include a description of specific valuation determinations, data regarding pricing information received from approved pricing vendors and brokers and the results of Board-approved valuation control policies and procedures (the Policies). The Policies address, among other things, instances when market quotations are or are not readily available, including recommendations of third party pricing vendors and a determination of appropriate pricing methodologies; events that require specific valuation determinations and assessment of fair value techniques; securities with a potential for stale pricing, including those that are illiquid, restricted, or in default; and the effectiveness of third party pricing vendors, including periodic reviews of vendors. The Committee meets more frequently, as needed, to discuss additional valuation matters, which may include the need to review back-testing results, review time-sensitive information or approve related valuation actions. The Committee reports to the Board, with members of the Committee meeting with the Board at each of its regularly scheduled meetings to discuss valuation matters and actions during the period, similar to those described earlier.
For investments categorized as Level 3, the Committee monitors information similar to that described above, which may include:
(i) data specific to the issuer or comparable issuers, (ii) general market or specific sector news and (iii) quoted prices and specific or similar security transactions. The Committee considers this data and any changes from prior periods in order to assess the reasonableness of observable and unobservable inputs, any assumptions or internal models used to value those securities and changes in fair value. This data is also used to corroborate, when available, information received from approved pricing vendors and brokers. Various factors impact the frequency of monitoring this information (which may occur as often as daily). However, the Committee may determine that changes to inputs, assumptions and models are not required as a result of the monitoring procedures performed.
The accompanying Notes to Financial Statements are an integral part of this statement.
Annual Report 2015
13
COLUMBIA CONVERTIBLE SECURITIES FUND
PORTFOLIO OF INVESTMENTS (continued)
February 28, 2015
The following table is a summary of the inputs used to value the Fund's investments at February 28, 2015:
Description | | Level 1
Quoted Prices in Active
Markets for Identical
Assets ($) | | Level 2
Other Significant
Observable Inputs ($) | | Level 3
Significant
Unobservable Inputs ($) | | Total ($) | |
Equity Securities | |
Common Stocks | |
Health Care | | | 6,785,380 | | | | — | | | | — | | | | 6,785,380 | | |
Industrials | | | 7,177,093 | | | | — | | | | — | | | | 7,177,093 | | |
Materials | | | — | | | | 511,597 | | | | — | | | | 511,597 | | |
Convertible Preferred Stocks | |
Consumer Discretionary | | | 24,115,000 | | | | — | | | | — | | | | 24,115,000 | | |
Consumer Staples | | | 13,983,750 | | | | 23,949,333 | | | | — | | | | 37,933,083 | | |
Energy | | | — | | | | 41,610,724 | | | | — | | | | 41,610,724 | | |
Financials | | | 74,101,828 | | | | 37,557,197 | | | | — | | | | 111,659,025 | | |
Health Care | | | 13,443,452 | | | | 42,522,543 | | | | — | | | | 55,965,995 | | |
Industrials | | | 17,769,290 | | | | — | | | | — | | | | 17,769,290 | | |
Materials | | | 8,837,840 | | | | — | | | | — | | | | 8,837,840 | | |
Telecommunication Services | | | 10,630,400 | | | | — | | | | — | | | | 10,630,400 | | |
Utilities | | | 37,352,017 | | | | 16,125,000 | | | | — | | | | 53,477,017 | | |
Total Equity Securities | | | 214,196,050 | | | | 162,276,394 | | | | — | | | | 376,472,444 | | |
Bonds | |
Convertible Bonds | | | — | | | | 974,618,723 | | | | — | | | | 974,618,723 | | |
Total Bonds | | | — | | | | 974,618,723 | | | | — | | | | 974,618,723 | | |
Mutual Funds | |
Money Market Funds | | | 71,773,939 | | | | — | | | | — | | | | 71,773,939 | | |
Total Mutual Funds | | | 71,773,939 | | | | — | | | | — | | | | 71,773,939 | | |
Total | | | 285,969,989 | | | | 1,136,895,117 | | | | — | | | | 1,422,865,106 | | |
See the Portfolio of Investments for all investment classifications not indicated in the table.
The Fund's assets assigned to the Level 2 input category are generally valued using the market approach, in which a security's value is determined through reference to prices and information from market transactions for similar or identical assets. These assets include certain foreign securities for which a third party statistical pricing service may be employed for purposes of fair market valuation. The model utilized by such third party statistical pricing service takes into account a security's correlation to available market data including, but not limited to, intraday index, ADR, and ETF movements.
There were no transfers of financial assets between levels during the period.
The accompanying Notes to Financial Statements are an integral part of this statement.
Annual Report 2015
14
COLUMBIA CONVERTIBLE SECURITIES FUND
STATEMENT OF ASSETS AND LIABILITIES
February 28, 2015
Assets | |
Investments, at value | |
Unaffiliated issuers (identified cost $1,226,532,957) | | $ | 1,351,091,167 | | |
Affiliated issuers (identified cost $71,773,939) | | | 71,773,939 | | |
Total investments (identified cost $1,298,306,896) | | | 1,422,865,106 | | |
Cash | | | 35 | | |
Receivable for: | |
Investments sold | | | 17,163,698 | | |
Capital shares sold | | | 2,568,638 | | |
Dividends | | | 682,534 | | |
Interest | | | 5,101,628 | | |
Reclaims | | | 4,724 | | |
Expense reimbursement due from Investment Manager | | | 6,188 | | |
Prepaid expenses | | | 2,863 | | |
Other assets | | | 7,817 | | |
Total assets | | | 1,448,403,231 | | |
Liabilities | |
Payable for: | |
Investments purchased | | | 48,370,000 | | |
Capital shares purchased | | | 1,269,005 | | |
Investment management fees | | | 27,498 | | |
Distribution and/or service fees | | | 4,202 | | |
Transfer agent fees | | | 880,774 | | |
Administration fees | | | 2,120 | | |
Compensation of board members | | | 119,514 | | |
Other expenses | | | 57,529 | | |
Total liabilities | | | 50,730,642 | | |
Net assets applicable to outstanding capital stock | | $ | 1,397,672,589 | | |
Represented by | |
Paid-in capital | | $ | 1,245,405,720 | | |
Excess of distributions over net investment income | | | (1,111,742 | ) | |
Accumulated net realized gain | | | 28,820,401 | | |
Unrealized appreciation (depreciation) on: | |
Investments | | | 124,558,210 | | |
Total — representing net assets applicable to outstanding capital stock | | $ | 1,397,672,589 | | |
The accompanying Notes to Financial Statements are an integral part of this statement.
Annual Report 2015
15
COLUMBIA CONVERTIBLE SECURITIES FUND
STATEMENT OF ASSETS AND LIABILITIES (continued)
February 28, 2015
Class A | |
Net assets | | $ | 386,856,179 | | |
Shares outstanding | | | 19,808,726 | | |
Net asset value per share | | $ | 19.53 | | |
Maximum offering price per share(a) | | $ | 20.72 | | |
Class B | |
Net assets | | $ | 726,438 | | |
Shares outstanding | | | 37,936 | | |
Net asset value per share | | $ | 19.15 | | |
Class C | |
Net assets | | $ | 54,654,882 | | |
Shares outstanding | | | 2,807,860 | | |
Net asset value per share | | $ | 19.46 | | |
Class I | |
Net assets | | $ | 97,006,263 | | |
Shares outstanding | | | 4,953,596 | | |
Net asset value per share | | $ | 19.58 | | |
Class R | |
Net assets | | $ | 2,411,556 | | |
Shares outstanding | | | 123,599 | | |
Net asset value per share | | $ | 19.51 | | |
Class R4 | |
Net assets | | $ | 3,026,865 | | |
Shares outstanding | | | 153,713 | | |
Net asset value per share | | $ | 19.69 | | |
Class R5 | |
Net assets | | $ | 35,858,709 | | |
Shares outstanding | | | 1,822,014 | | |
Net asset value per share | | $ | 19.68 | | |
Class W | |
Net assets | | $ | 129,714 | | |
Shares outstanding | | | 6,658 | | |
Net asset value per share | | $ | 19.48 | | |
Class Y | |
Net assets | | $ | 61,143 | | |
Shares outstanding | | | 3,087 | | |
Net asset value per share | | $ | 19.81 | | |
Class Z | |
Net assets | | $ | 816,940,840 | | |
Shares outstanding | | | 41,773,976 | | |
Net asset value per share | | $ | 19.56 | | |
(a) The maximum offering price per share is calculated by dividing the net asset value per share by 1.0 minus the maximum sales charge of 5.75%.
The accompanying Notes to Financial Statements are an integral part of this statement.
Annual Report 2015
16
COLUMBIA CONVERTIBLE SECURITIES FUND
STATEMENT OF OPERATIONS
Year ended February 28, 2015
Net investment income | |
Income: | |
Dividends — unaffiliated issuers | | $ | 10,966,356 | | |
Dividends — affiliated issuers | | | 41,806 | | |
Interest | | | 19,289,993 | | |
Total income | | | 30,298,155 | | |
Expenses: | |
Investment management fees | | | 8,505,776 | | |
Distribution and/or service fees | |
Class A | | | 899,677 | | |
Class B | | | 8,338 | | |
Class C | | | 449,799 | | |
Class R | | | 12,188 | | |
Class W | | | 11,510 | | |
Transfer agent fees | |
Class A | | | 842,877 | | |
Class B | | | 1,952 | | |
Class C | | | 105,500 | | |
Class R | | | 5,709 | | |
Class R4 | | | 5,717 | | |
Class R5 | | | 9,198 | | |
Class W | | | 10,214 | | |
Class Z | | | 1,439,384 | | |
Administration fees | | | 659,319 | | |
Compensation of board members | | | 33,361 | | |
Custodian fees | | | 12,627 | | |
Printing and postage fees | | | 82,205 | | |
Registration fees | | | 140,254 | | |
Professional fees | | | 41,571 | | |
Line of credit interest expense | | | 689 | | |
Other | | | 22,123 | | |
Total expenses | | | 13,299,988 | | |
Fees waived or expenses reimbursed by Investment Manager and its affiliates | | | (2,214,261 | ) | |
Expense reductions | | | (1,112 | ) | |
Total net expenses | | | 11,084,615 | | |
Net investment income | | | 19,213,540 | | |
Realized and unrealized gain (loss) — net | |
Net realized gain (loss) on: | |
Investments | | | 55,066,615 | | |
Foreign currency translations | | | 14,296 | | |
Net realized gain | | | 55,080,911 | | |
Net change in unrealized appreciation (depreciation) on: | |
Investments | | | 10,801,014 | | |
Foreign currency translations | | | (4,756 | ) | |
Net change in unrealized appreciation | | | 10,796,258 | | |
Net realized and unrealized gain | | | 65,877,169 | | |
Net increase in net assets resulting from operations | | $ | 85,090,709 | | |
The accompanying Notes to Financial Statements are an integral part of this statement.
Annual Report 2015
17
COLUMBIA CONVERTIBLE SECURITIES FUND
STATEMENT OF CHANGES IN NET ASSETS
| | | Year ended
February 28,
2015(a) | | Year ended
February 28,
2014 | |
Operations | |
Net investment income | | $ | 19,213,540 | | | $ | 13,920,610 | | |
Net realized gain | | | 55,080,911 | | | | 56,079,634 | | |
Net change in unrealized appreciation | | | 10,796,258 | | | | 85,524,888 | | |
Net increase in net assets resulting from operations | | | 85,090,709 | | | | 155,525,132 | | |
Distributions to shareholders | |
Net investment income | |
Class A | | | (8,111,104 | ) | | | (5,470,325 | ) | |
Class B | | | (12,501 | ) | | | (15,796 | ) | |
Class C | | | (662,725 | ) | | | (322,779 | ) | |
Class I | | | (3,391,208 | ) | | | (4,677,311 | ) | |
Class R | | | (48,972 | ) | | | (42,946 | ) | |
Class R4 | | | (58,689 | ) | | | (2,650 | ) | |
Class R5 | | | (424,817 | ) | | | (10,061 | ) | |
Class W | | | (133,841 | ) | | | (617,803 | ) | |
Class Y | | | (17 | ) | | | — | | |
Class Z | | | (14,725,315 | ) | | | (3,403,510 | ) | |
Net realized gains | |
Class A | | | (9,082,238 | ) | | | — | | |
Class B | | | (20,052 | ) | | | — | | |
Class C | | | (1,153,184 | ) | | | — | | |
Class I | | | (2,791,830 | ) | | | — | | |
Class R | | | (61,052 | ) | | | — | | |
Class R4 | | | (66,065 | ) | | | — | | |
Class R5 | | | (574,489 | ) | | | — | | |
Class W | | | (3,675 | ) | | | — | | |
Class Y | | | (39 | ) | | | — | | |
Class Z | | | (16,567,793 | ) | | | — | | |
Total distributions to shareholders | | | (57,889,606 | ) | | | (14,563,181 | ) | |
Increase in net assets from capital stock activity | | | 365,660,577 | | | | 302,826,446 | | |
Total increase in net assets | | | 392,861,680 | | | | 443,788,397 | | |
Net assets at beginning of year | | | 1,004,810,909 | | | | 561,022,512 | | |
Net assets at end of year | | $ | 1,397,672,589 | | | $ | 1,004,810,909 | | |
Undistributed (excess of distributions over) net investment income | | $ | (1,111,742 | ) | | $ | 2,090,211 | | |
(a) Class Y shares are based on operations from October 1, 2014 (commencement of operations) through the stated period end.
The accompanying Notes to Financial Statements are an integral part of this statement.
Annual Report 2015
18
COLUMBIA CONVERTIBLE SECURITIES FUND
STATEMENT OF CHANGES IN NET ASSETS (continued)
| | | Year ended February 28, 2015(a) | | Year ended February 28, 2014 | |
| | | Shares | | Dollars ($) | | Shares | | Dollars ($) | |
Capital stock activity | |
Class A shares | |
Subscriptions(b) | | | 12,962,037 | | | | 248,929,628 | | | | 8,793,410 | | | | 154,082,393 | | |
Distributions reinvested | | | 634,558 | | | | 12,068,927 | | | | 183,612 | | | | 3,118,888 | | |
Redemptions | | | (10,623,258 | ) | | | (202,931,014 | ) | | | (5,676,984 | ) | | | (97,837,010 | ) | |
Net increase | | | 2,973,337 | | | | 58,067,541 | | | | 3,300,038 | | | | 59,364,271 | | |
Class B shares | |
Subscriptions | | | 6,119 | | | | 115,500 | | | | 5,964 | | | | 103,519 | | |
Distributions reinvested | | | 1,274 | | | | 23,780 | | | | 597 | | | | 9,894 | | |
Redemptions(b) | | | (17,733 | ) | | | (330,055 | ) | | | (45,001 | ) | | | (743,165 | ) | |
Net decrease | | | (10,340 | ) | | | (190,775 | ) | | | (38,440 | ) | | | (629,752 | ) | |
Class C shares | |
Subscriptions | | | 1,451,455 | | | | 27,745,546 | | | | 738,084 | | | | 13,076,747 | | |
Distributions reinvested | | | 61,615 | | | | 1,165,961 | | | | 10,144 | | | | 172,583 | | |
Redemptions | | | (388,218 | ) | | | (7,367,326 | ) | | | (192,142 | ) | | | (3,305,414 | ) | |
Net increase | | | 1,124,852 | | | | 21,544,181 | | | | 556,086 | | | | 9,943,916 | | |
Class I shares | |
Subscriptions | | | 148,653 | | | | 2,866,277 | | | | 179,769 | | | | 3,030,442 | | |
Distributions reinvested | | | 323,085 | | | | 6,182,897 | | | | 277,612 | | | | 4,677,228 | | |
Redemptions | | | (3,326,073 | ) | | | (64,334,483 | ) | | | (4,123,467 | ) | | | (72,667,287 | ) | |
Net decrease | | | (2,854,335 | ) | | | (55,285,309 | ) | | | (3,666,086 | ) | | | (64,959,617 | ) | |
Class R shares | |
Subscriptions | | | 45,507 | | | | 870,161 | | | | 37,934 | | | | 652,380 | | |
Distributions reinvested | | | 1,012 | | | | 19,251 | | | | 584 | | | | 9,876 | | |
Redemptions | | | (49,087 | ) | | | (937,748 | ) | | | (33,220 | ) | | | (581,876 | ) | |
Net increase (decrease) | | | (2,568 | ) | | | (48,336 | ) | | | 5,298 | | | | 80,380 | | |
Class R4 shares | |
Subscriptions | | | 207,877 | | | | 4,043,798 | | | | 35,060 | | | | 642,022 | | |
Distributions reinvested | | | 6,518 | | | | 124,620 | | | | 145 | | | | 2,578 | | |
Redemptions | | | (96,040 | ) | | | (1,844,277 | ) | | | (16 | ) | | | (300 | ) | |
Net increase | | | 118,355 | | | | 2,324,141 | | | | 35,189 | | | | 644,300 | | |
Class R5 shares | |
Subscriptions | | | 1,902,273 | | | | 36,662,649 | | | | 55,914 | | | | 979,220 | | |
Distributions reinvested | | | 52,437 | | | | 997,562 | | | | 561 | | | | 9,985 | | |
Redemptions | | | (181,542 | ) | | | (3,493,997 | ) | | | (7,798 | ) | | | (139,816 | ) | |
Net increase | | | 1,773,168 | | | | 34,166,214 | | | | 48,677 | | | | 849,389 | | |
The accompanying Notes to Financial Statements are an integral part of this statement.
Annual Report 2015
19
COLUMBIA CONVERTIBLE SECURITIES FUND
STATEMENT OF CHANGES IN NET ASSETS (continued)
| | | Year ended February 28, 2015(a) | | Year ended February 28, 2014 | |
| | | Shares | | Dollars ($) | | Shares | | Dollars ($) | |
Capital stock activity (continued) | |
Class W shares | |
Subscriptions | | | 39,675 | | | | 750,663 | | | | 497,760 | | | | 8,597,156 | | |
Distributions reinvested | | | 7,216 | | | | 137,388 | | | | 36,682 | | | | 617,733 | | |
Redemptions | | | (1,506,880 | ) | | | (28,229,007 | ) | | | (768,943 | ) | | | (13,391,118 | ) | |
Net decrease | | | (1,459,989 | ) | | | (27,340,956 | ) | | | (234,501 | ) | | | (4,176,229 | ) | |
Class Y shares | |
Subscriptions | | | 3,087 | | | | 59,000 | | | | — | | | | — | | |
Net increase | | | 3,087 | | | | 59,000 | | | | — | | | | — | | |
Class Z shares | |
Subscriptions | | | 26,318,341 | | | | 498,393,075 | | | | 19,068,281 | | | | 346,642,971 | | |
Distributions reinvested | | | 272,902 | | | | 5,186,538 | | | | 70,743 | | | | 1,203,526 | | |
Redemptions | | | (8,991,309 | ) | | | (171,214,737 | ) | | | (2,664,182 | ) | | | (46,136,709 | ) | |
Net increase | | | 17,599,934 | | | | 332,364,876 | | | | 16,474,842 | | | | 301,709,788 | | |
Total net increase | | | 19,265,501 | | | | 365,660,577 | | | | 16,481,103 | | | | 302,826,446 | | |
(a) Class Y shares are based on operations from October 1, 2014 (commencement of operations) through the stated period end.
(b) Includes conversions of Class B shares to Class A shares, if any.
The accompanying Notes to Financial Statements are an integral part of this statement.
Annual Report 2015
20
COLUMBIA CONVERTIBLE SECURITIES FUND
The following tables are intended to help you understand the Fund's financial performance. Certain information reflects financial results for a single share of a class held for the periods shown. Per share net investment income (loss) amounts are calculated based on average shares outstanding during the period. Total return assumes reinvestment of all dividends and distributions, if any. Total return does not reflect payment of sales charges, if any. Total return and portfolio turnover are not annualized for periods of less than one year. The portfolio turnover rate is calculated without regard to purchase and sales transactions of short-term instruments and certain derivatives, if any. If such transactions were included, the Fund's portfolio turnover rate may be higher.
| | | Year Ended February 28, | | Year Ended
February 29, | | Year Ended
February 28, | |
Class A | | 2015 | | 2014 | | 2013 | | 2012 | | 2011 | |
Per share data | |
Net asset value, beginning of period | | $ | 19.22 | | | $ | 15.68 | | | $ | 14.99 | | | $ | 15.55 | | | $ | 12.92 | | |
Income from investment operations: | |
Net investment income | | | 0.28 | | | | 0.34 | | | | 0.41 | | | | 0.42 | | | | 0.45 | | |
Net realized and unrealized gain (loss) | | | 0.92 | | | | 3.58 | | | | 0.73 | | | | (0.56 | ) | | | 2.67 | | |
Total from investment operations | | | 1.20 | | | | 3.92 | | | | 1.14 | | | | (0.14 | ) | | | 3.12 | | |
Less distributions to shareholders: | |
Net investment income | | | (0.43 | ) | | | (0.38 | ) | | | (0.45 | ) | | | (0.42 | ) | | | (0.49 | ) | |
Net realized gains | | | (0.46 | ) | | | — | | | | — | | | | — | | | | — | | |
Total distributions to shareholders | | | (0.89 | ) | | | (0.38 | ) | | | (0.45 | ) | | | (0.42 | ) | | | (0.49 | ) | |
Net asset value, end of period | | $ | 19.53 | | | $ | 19.22 | | | $ | 15.68 | | | $ | 14.99 | | | $ | 15.55 | | |
Total return | | | 6.44 | % | | | 25.38 | % | | | 7.84 | % | | | (0.75 | %) | | | 24.72 | % | |
Ratios to average net assets(a) | |
Total gross expenses | | | 1.30 | %(b) | | | 1.35 | % | | | 1.39 | % | | | 1.27 | % | | | 1.31 | %(b) | |
Total net expenses(c) | | | 1.10 | %(b)(d) | | | 1.12 | %(d) | | | 1.15 | %(d) | | | 1.12 | %(d) | | | 1.15 | %(b)(d) | |
Net investment income | | | 1.49 | % | | | 1.97 | % | | | 2.80 | % | | | 2.86 | % | | | 3.27 | % | |
Supplemental data | |
Net assets, end of period (in thousands) | | $ | 386,856 | | | $ | 323,622 | | | $ | 212,252 | | | $ | 198,721 | | | $ | 224,608 | | |
Portfolio turnover | | | 78 | % | | | 76 | % | | | 71 | % | | | 66 | % | | | 118 | % | |
Notes to Financial Highlights
(a) In addition to the fees and expenses that the Fund bears directly, the Fund indirectly bears a pro rata share of the fees and expenses of any other funds in which it invests. Such indirect expenses are not included in the Fund's reported expense ratios.
(b) Ratios include line of credit interest expense which is less than 0.01%.
(c) Total net expenses include the impact of certain fee waivers/expense reimbursements made by the Investment Manager and certain of its affiliates, if applicable.
(d) The benefits derived from expense reductions had an impact of less than 0.01%.
The accompanying Notes to Financial Statements are an integral part of this statement.
Annual Report 2015
21
COLUMBIA CONVERTIBLE SECURITIES FUND
FINANCIAL HIGHLIGHTS (continued)
| | | Year Ended February 28, | | Year Ended
February 29, | | Year Ended
February 28, | |
Class B | | 2015 | | 2014 | | 2013 | | 2012 | | 2011 | |
Per share data | |
Net asset value, beginning of period | | $ | 18.86 | | | $ | 15.40 | | | $ | 14.72 | | | $ | 15.28 | | | $ | 12.70 | | |
Income from investment operations: | |
Net investment income | | | 0.14 | | | | 0.21 | | | | 0.30 | | | | 0.30 | | | | 0.35 | | |
Net realized and unrealized gain (loss) | | | 0.90 | | | | 3.51 | | | | 0.72 | | | | (0.55 | ) | | | 2.62 | | |
Total from investment operations | | | 1.04 | | | | 3.72 | | | | 1.02 | | | | (0.25 | ) | | | 2.97 | | |
Less distributions to shareholders: | |
Net investment income | | | (0.29 | ) | | | (0.26 | ) | | | (0.34 | ) | | | (0.31 | ) | | | (0.39 | ) | |
Net realized gains | | | (0.46 | ) | | | — | | | | — | | | | — | | | | — | | |
Total distributions to shareholders | | | (0.75 | ) | | | (0.26 | ) | | | (0.34 | ) | | | (0.31 | ) | | | (0.39 | ) | |
Net asset value, end of period | | $ | 19.15 | | | $ | 18.86 | | | $ | 15.40 | | | $ | 14.72 | | | $ | 15.28 | | |
Total return | | | 5.65 | % | | | 24.37 | % | | | 7.10 | % | | | (1.53 | %) | | | 23.83 | % | |
Ratios to average net assets(a) | |
Total gross expenses | | | 2.05 | %(b) | | | 2.10 | % | | | 2.13 | % | | | 2.04 | % | | | 2.06 | %(b) | |
Total net expenses(c) | | | 1.85 | %(b)(d) | | | 1.88 | %(d) | | | 1.89 | %(d) | | | 1.88 | %(d) | | | 1.90 | %(b)(d) | |
Net investment income | | | 0.74 | % | | | 1.23 | % | | | 2.07 | % | | | 2.04 | % | | | 2.61 | % | |
Supplemental data | |
Net assets, end of period (in thousands) | | $ | 726 | | | $ | 911 | | | $ | 1,335 | | | $ | 3,102 | | | $ | 12,089 | | |
Portfolio turnover | | | 78 | % | | | 76 | % | | | 71 | % | | | 66 | % | | | 118 | % | |
Notes to Financial Highlights
(a) In addition to the fees and expenses that the Fund bears directly, the Fund indirectly bears a pro rata share of the fees and expenses of any other funds in which it invests. Such indirect expenses are not included in the Fund's reported expense ratios.
(b) Ratios include line of credit interest expense which is less than 0.01%.
(c) Total net expenses include the impact of certain fee waivers/expense reimbursements made by the Investment Manager and certain of its affiliates, if applicable.
(d) The benefits derived from expense reductions had an impact of less than 0.01%.
The accompanying Notes to Financial Statements are an integral part of this statement.
Annual Report 2015
22
COLUMBIA CONVERTIBLE SECURITIES FUND
FINANCIAL HIGHLIGHTS (continued)
| | | Year Ended February 28, | | Year Ended
February 29, | | Year Ended
February 28, | |
Class C | | 2015 | | 2014 | | 2013 | | 2012 | | 2011 | |
Per share data | |
Net asset value, beginning of period | | $ | 19.16 | | | $ | 15.63 | | | $ | 14.95 | | | $ | 15.51 | | | $ | 12.88 | | |
Income from investment operations: | |
Net investment income | | | 0.14 | | | | 0.21 | | | | 0.30 | | | | 0.31 | | | | 0.35 | | |
Net realized and unrealized gain (loss) | | | 0.91 | | | | 3.58 | | | | 0.72 | | | | (0.56 | ) | | | 2.67 | | |
Total from investment operations | | | 1.05 | | | | 3.79 | | | | 1.02 | | | | (0.25 | ) | | | 3.02 | | |
Less distributions to shareholders: | |
Net investment income | | | (0.29 | ) | | | (0.26 | ) | | | (0.34 | ) | | | (0.31 | ) | | | (0.39 | ) | |
Net realized gains | | | (0.46 | ) | | | — | | | | — | | | | — | | | | — | | |
Total distributions to shareholders | | | (0.75 | ) | | | (0.26 | ) | | | (0.34 | ) | | | (0.31 | ) | | | (0.39 | ) | |
Net asset value, end of period | | $ | 19.46 | | | $ | 19.16 | | | $ | 15.63 | | | $ | 14.95 | | | $ | 15.51 | | |
Total return | | | 5.62 | % | | | 24.46 | % | | | 6.99 | % | | | (1.51 | %) | | | 23.88 | % | |
Ratios to average net assets(a) | |
Total gross expenses | | | 2.05 | %(b) | | | 2.10 | % | | | 2.14 | % | | | 2.02 | % | | | 2.06 | %(b) | |
Total net expenses(c) | | | 1.85 | %(b)(d) | | | 1.87 | %(d) | | | 1.90 | %(d) | | | 1.87 | %(d) | | | 1.90 | %(b)(d) | |
Net investment income | | | 0.74 | % | | | 1.21 | % | | | 2.05 | % | | | 2.10 | % | | | 2.53 | % | |
Supplemental data | |
Net assets, end of period (in thousands) | | $ | 54,655 | | | $ | 32,250 | | | $ | 17,617 | | | $ | 20,127 | | | $ | 21,717 | | |
Portfolio turnover | | | 78 | % | | | 76 | % | | | 71 | % | | | 66 | % | | | 118 | % | |
Notes to Financial Highlights
(a) In addition to the fees and expenses that the Fund bears directly, the Fund indirectly bears a pro rata share of the fees and expenses of any other funds in which it invests. Such indirect expenses are not included in the Fund's reported expense ratios.
(b) Ratios include line of credit interest expense which is less than 0.01%.
(c) Total net expenses include the impact of certain fee waivers/expense reimbursements made by the Investment Manager and certain of its affiliates, if applicable.
(d) The benefits derived from expense reductions had an impact of less than 0.01%.
The accompanying Notes to Financial Statements are an integral part of this statement.
Annual Report 2015
23
COLUMBIA CONVERTIBLE SECURITIES FUND
FINANCIAL HIGHLIGHTS (continued)
| | | Year Ended February 28, | | Year Ended
February 29, | | Year Ended
February 28, | |
Class I | | 2015 | | 2014 | | 2013 | | 2012 | | 2011(a) | |
Per share data | |
Net asset value, beginning of period | | $ | 19.27 | | | $ | 15.72 | | | $ | 15.02 | | | $ | 15.58 | | | $ | 13.69 | | |
Income from investment operations: | |
Net investment income | | | 0.37 | | | | 0.42 | | | | 0.48 | | | | 0.47 | | | | 0.17 | | |
Net realized and unrealized gain (loss) | | | 0.91 | | | | 3.58 | | | | 0.72 | | | | (0.57 | ) | | | 1.86 | | |
Total from investment operations | | | 1.28 | | | | 4.00 | | | | 1.20 | | | | (0.10 | ) | | | 2.03 | | |
Less distributions to shareholders: | |
Net investment income | | | (0.51 | ) | | | (0.45 | ) | | | (0.50 | ) | | | (0.46 | ) | | | (0.14 | ) | |
Net realized gains | | | (0.46 | ) | | | — | | | | — | | | | — | | | | — | | |
Total distributions to shareholders | | | (0.97 | ) | | | (0.45 | ) | | | (0.50 | ) | | | (0.46 | ) | | | (0.14 | ) | |
Net asset value, end of period | | $ | 19.58 | | | $ | 19.27 | | | $ | 15.72 | | | $ | 15.02 | | | $ | 15.58 | | |
Total return | | | 6.88 | % | | | 25.90 | % | | | 8.29 | % | | | (0.43 | %) | | | 14.92 | % | |
Ratios to average net assets(b) | |
Total gross expenses | | | 0.81 | %(c) | | | 0.85 | % | | | 0.89 | % | | | 0.84 | % | | | 0.90 | %(d) | |
Total net expenses(e) | | | 0.68 | %(c) | | | 0.69 | % | | | 0.74 | % | | | 0.77 | % | | | 0.86 | %(d)(f) | |
Net investment income | | | 1.91 | % | | | 2.43 | % | | | 3.21 | % | | | 3.28 | % | | | 2.63 | %(d) | |
Supplemental data | |
Net assets, end of period (in thousands) | | $ | 97,006 | | | $ | 150,494 | | | $ | 180,374 | | | $ | 186,160 | | | $ | 82,875 | | |
Portfolio turnover | | | 78 | % | | | 76 | % | | | 71 | % | | | 66 | % | | | 118 | % | |
Notes to Financial Highlights
(a) Based on operations from September 27, 2010 (commencement of operations) through the stated period end.
(b) In addition to the fees and expenses that the Fund bears directly, the Fund indirectly bears a pro rata share of the fees and expenses of any other funds in which it invests. Such indirect expenses are not included in the Fund's reported expense ratios.
(c) Ratios include line of credit interest expense which is less than 0.01%.
(d) Annualized.
(e) Total net expenses include the impact of certain fee waivers/expense reimbursements made by the Investment Manager and certain of its affiliates, if applicable.
(f) The benefits derived from expense reductions had an impact of less than 0.01%.
The accompanying Notes to Financial Statements are an integral part of this statement.
Annual Report 2015
24
COLUMBIA CONVERTIBLE SECURITIES FUND
FINANCIAL HIGHLIGHTS (continued)
| | | Year Ended February 28, | | Year Ended
February 29, | |
Class R | | 2015 | | 2014 | | 2013 | | 2012(a) | |
Per share data | |
Net asset value, beginning of period | | $ | 19.21 | | | $ | 15.67 | | | $ | 14.99 | | | $ | 13.80 | | |
Income from investment operations: | |
Net investment income | | | 0.24 | | | | 0.30 | | | | 0.38 | | | | 0.11 | | |
Net realized and unrealized gain | | | 0.90 | | | | 3.58 | | | | 0.72 | | | | 1.20 | (b) | |
Total from investment operations | | | 1.14 | | | | 3.88 | | | | 1.10 | | | | 1.31 | | |
Less distributions to shareholders: | |
Net investment income | | | (0.38 | ) | | | (0.34 | ) | | | (0.42 | ) | | | (0.12 | ) | |
Net realized gains | | | (0.46 | ) | | | — | | | | — | | | | — | | |
Total distributions to shareholders | | | (0.84 | ) | | | (0.34 | ) | | | (0.42 | ) | | | (0.12 | ) | |
Net asset value, end of period | | $ | 19.51 | | | $ | 19.21 | | | $ | 15.67 | | | $ | 14.99 | | |
Total return | | | 6.13 | % | | | 25.08 | % | | | 7.55 | % | | | 9.57 | % | |
Ratios to average net assets(c) | |
Total gross expenses | | | 1.55 | %(d) | | | 1.60 | % | | | 1.64 | % | | | 1.28 | %(e) | |
Total net expenses(f) | | | 1.35 | %(d)(g) | | | 1.37 | %(g) | | | 1.40 | %(g) | | | 1.20 | %(e) | |
Net investment income | | | 1.24 | % | | | 1.72 | % | | | 2.56 | % | | | 2.64 | %(e) | |
Supplemental data | |
Net assets, end of period (in thousands) | | $ | 2,412 | | | $ | 2,423 | | | $ | 1,894 | | | $ | 2,068 | | |
Portfolio turnover | | | 78 | % | | | 76 | % | | | 71 | % | | | 66 | % | |
Notes to Financial Highlights
(a) Based on operations from November 16, 2011 (commencement of operations) through the stated period end.
(b) Calculation of the net gain (loss) per share (both realized and unrealized) does not correlate to the aggregate realized and unrealized gain (loss) presented in the Statement of Operations due to the timing of subscriptions and redemptions of Fund shares in relation to fluctuations in the market value of the portfolio.
(c) In addition to the fees and expenses that the Fund bears directly, the Fund indirectly bears a pro rata share of the fees and expenses of any other funds in which it invests. Such indirect expenses are not included in the Fund's reported expense ratios.
(d) Ratios include line of credit interest expense which is less than 0.01%.
(e) Annualized.
(f) Total net expenses include the impact of certain fee waivers/expense reimbursements made by the Investment Manager and certain of its affiliates, if applicable.
(g) The benefits derived from expense reductions had an impact of less than 0.01%.
The accompanying Notes to Financial Statements are an integral part of this statement.
Annual Report 2015
25
COLUMBIA CONVERTIBLE SECURITIES FUND
FINANCIAL HIGHLIGHTS (continued)
| | | Year ended February 28, | |
Class R4 | | 2015 | | 2014 | | 2013(a) | |
Per share data | |
Net asset value, beginning of period | | $ | 19.37 | | | $ | 15.80 | | | $ | 14.75 | | |
Income from investment operations: | |
Net investment income | | | 0.33 | | | | 0.37 | | | | 0.14 | | |
Net realized and unrealized gain | | | 0.93 | | | | 3.62 | | | | 1.04 | | |
Total from investment operations | | | 1.26 | | | | 3.99 | | | | 1.18 | | |
Less distributions to shareholders: | |
Net investment income | | | (0.48 | ) | | | (0.42 | ) | | | (0.13 | ) | |
Net realized gains | | | (0.46 | ) | | | — | | | | — | | |
Total distributions to shareholders | | | (0.94 | ) | | | (0.42 | ) | | | (0.13 | ) | |
Net asset value, end of period | | $ | 19.69 | | | $ | 19.37 | | | $ | 15.80 | | |
Total return | | | 6.71 | % | | | 25.68 | % | | | 8.05 | % | |
Ratios to average net assets(b) | |
Total gross expenses | | | 1.05 | %(c) | | | 1.10 | % | | | 1.24 | %(d) | |
Total net expenses(e) | | | 0.85 | %(c)(f) | | | 0.85 | %(f) | | | 0.92 | %(d) | |
Net investment income | | | 1.74 | % | | | 2.09 | % | | | 2.96 | %(d) | |
Supplemental data | |
Net assets, end of period (in thousands) | | $ | 3,027 | | | $ | 685 | | | $ | 3 | | |
Portfolio turnover | | | 78 | % | | | 76 | % | | | 71 | % | |
Notes to Financial Highlights
(a) Based on operations from November 8, 2012 (commencement of operations) through the stated period end.
(b) In addition to the fees and expenses that the Fund bears directly, the Fund indirectly bears a pro rata share of the fees and expenses of any other funds in which it invests. Such indirect expenses are not included in the Fund's reported expense ratios.
(c) Ratios include line of credit interest expense which is less than 0.01%.
(d) Annualized.
(e) Total net expenses include the impact of certain fee waivers/expense reimbursements made by the Investment Manager and certain of its affiliates, if applicable.
(f) The benefits derived from expense reductions had an impact of less than 0.01%.
The accompanying Notes to Financial Statements are an integral part of this statement.
Annual Report 2015
26
COLUMBIA CONVERTIBLE SECURITIES FUND
FINANCIAL HIGHLIGHTS (continued)
| | | Year ended February 28, | |
Class R5 | | 2015 | | 2014 | | 2013(a) | |
Per share data | |
Net asset value, beginning of period | | $ | 19.37 | | | $ | 15.80 | | | $ | 14.75 | | |
Income from investment operations: | |
Net investment income | | | 0.35 | | | | 0.40 | | | | 0.14 | | |
Net realized and unrealized gain | | | 0.92 | | | | 3.62 | | | | 1.04 | | |
Total from investment operations | | | 1.27 | | | | 4.02 | | | | 1.18 | | |
Less distributions to shareholders: | |
Net investment income | | | (0.50 | ) | | | (0.45 | ) | | | (0.13 | ) | |
Net realized gains | | | (0.46 | ) | | | — | | | | — | | |
Total distributions to shareholders | | | (0.96 | ) | | | (0.45 | ) | | | (0.13 | ) | |
Net asset value, end of period | | $ | 19.68 | | | $ | 19.37 | | | $ | 15.80 | | |
Total return | | | 6.80 | % | | | 25.86 | % | | | 8.08 | % | |
Ratios to average net assets(b) | |
Total gross expenses | | | 0.86 | %(c) | | | 0.90 | % | | | 1.01 | %(d) | |
Total net expenses(e) | | | 0.73 | %(c) | | | 0.71 | % | | | 0.79 | %(d) | |
Net investment income | | | 1.86 | % | | | 2.25 | % | | | 3.09 | %(d) | |
Supplemental data | |
Net assets, end of period (in thousands) | | $ | 35,859 | | | $ | 946 | | | $ | 3 | | |
Portfolio turnover | | | 78 | % | | | 76 | % | | | 71 | % | |
Notes to Financial Highlights
(a) Based on operations from November 8, 2012 (commencement of operations) through the stated period end.
(b) In addition to the fees and expenses that the Fund bears directly, the Fund indirectly bears a pro rata share of the fees and expenses of any other funds in which it invests. Such indirect expenses are not included in the Fund's reported expense ratios.
(c) Ratios include line of credit interest expense which is less than 0.01%.
(d) Annualized.
(e) Total net expenses include the impact of certain fee waivers/expense reimbursements made by the Investment Manager and certain of its affiliates, if applicable.
The accompanying Notes to Financial Statements are an integral part of this statement.
Annual Report 2015
27
COLUMBIA CONVERTIBLE SECURITIES FUND
FINANCIAL HIGHLIGHTS (continued)
| | | Year Ended February 28, | | Year Ended
February 29, | |
Class W | | 2015 | | 2014 | | 2013 | | 2012(a) | |
Per share data | |
Net asset value, beginning of period | | $ | 19.20 | | | $ | 15.66 | | | $ | 14.98 | | | $ | 13.80 | | |
Income from investment operations: | |
Net investment income | | | 0.31 | | | | 0.34 | | | | 0.42 | | | | 0.14 | | |
Net realized and unrealized gain | | | 0.87 | | | | 3.58 | | | | 0.72 | | | | 1.17 | (b) | |
Total from investment operations | | | 1.18 | | | | 3.92 | | | | 1.14 | | | | 1.31 | | |
Less distributions to shareholders: | |
Net investment income | | | (0.44 | ) | | | (0.38 | ) | | | (0.46 | ) | | | (0.13 | ) | |
Net realized gains | | | (0.46 | ) | | | — | | | | — | | | | — | | |
Total distributions to shareholders | | | (0.90 | ) | | | (0.38 | ) | | | (0.46 | ) | | | (0.13 | ) | |
Net asset value, end of period | | $ | 19.48 | | | $ | 19.20 | | | $ | 15.66 | | | $ | 14.98 | | |
Total return | | | 6.33 | % | | | 25.41 | % | | | 7.87 | % | | | 9.56 | % | |
Ratios to average net assets(c) | |
Total gross expenses | | | 1.25 | %(d) | | | 1.35 | % | | | 1.39 | % | | | 0.85 | %(e) | |
Total net expenses(f) | | | 1.05 | %(d)(g) | | | 1.12 | %(g) | | | 1.15 | %(g) | | | 0.77 | %(e) | |
Net investment income | | | 1.55 | % | | | 1.98 | % | | | 2.83 | % | | | 3.44 | %(e) | |
Supplemental data | |
Net assets, end of period (in thousands) | | $ | 130 | | | $ | 28,153 | | | $ | 26,640 | | | $ | 28,830 | | |
Portfolio turnover | | | 78 | % | | | 76 | % | | | 71 | % | | | 66 | % | |
Notes to Financial Highlights
(a) Based on operations from November 16, 2011 (commencement of operations) through the stated period end.
(b) Calculation of the net gain (loss) per share (both realized and unrealized) does not correlate to the aggregate realized and unrealized gain (loss) presented in the Statement of Operations due to the timing of subscriptions and redemptions of Fund shares in relation to fluctuations in the market value of the portfolio.
(c) In addition to the fees and expenses that the Fund bears directly, the Fund indirectly bears a pro rata share of the fees and expenses of any other funds in which it invests. Such indirect expenses are not included in the Fund's reported expense ratios.
(d) Ratios include line of credit interest expense which is less than 0.01%.
(e) Annualized.
(f) Total net expenses include the impact of certain fee waivers/expense reimbursements made by the Investment Manager and certain of its affiliates, if applicable.
(g) The benefits derived from expense reductions had an impact of less than 0.01%.
The accompanying Notes to Financial Statements are an integral part of this statement.
Annual Report 2015
28
COLUMBIA CONVERTIBLE SECURITIES FUND
FINANCIAL HIGHLIGHTS (continued)
Class Y | | Year ended
February 28,
2015(a) | |
Per share data | |
Net asset value, beginning of period | | $ | 19.21 | | |
Income from investment operations: | |
Net investment income | | | 0.13 | | |
Net realized and unrealized gain | | | 0.90 | | |
Total from investment operations | | | 1.03 | | |
Less distributions to shareholders: | |
Net investment income | | | (0.13 | ) | |
Net realized gains | | | (0.30 | ) | |
Total distributions to shareholders | | | (0.43 | ) | |
Net asset value, end of period | | $ | 19.81 | | |
Total return | | | 5.48 | % | |
Ratios to average net assets(b) | |
Total gross expenses | | | 0.81 | %(c)(d) | |
Total net expenses(e) | | | 0.69 | %(c)(d) | |
Net investment income | | | 1.88 | %(c) | |
Supplemental data | |
Net assets, end of period (in thousands) | | $ | 61 | | |
Portfolio turnover | | | 78 | % | |
Notes to Financial Highlights
(a) Based on operations from October 1, 2014 (commencement of operations) through the stated period end.
(b) In addition to the fees and expenses that the Fund bears directly, the Fund indirectly bears a pro rata share of the fees and expenses of any other funds in which it invests. Such indirect expenses are not included in the Fund's reported expense ratios.
(c) Annualized.
(d) Ratios include line of credit interest expense which is less than 0.01%.
(e) Total net expenses include the impact of certain fee waivers/expense reimbursements made by the Investment Manager and certain of its affiliates, if applicable.
The accompanying Notes to Financial Statements are an integral part of this statement.
Annual Report 2015
29
COLUMBIA CONVERTIBLE SECURITIES FUND
FINANCIAL HIGHLIGHTS (continued)
| | | Year Ended February 28, | | Year Ended
February 29, | | Year Ended
February 28, | |
Class Z | | 2015 | | 2014 | | 2013 | | 2012 | | 2011 | |
Per share data | |
Net asset value, beginning of period | | $ | 19.25 | | | $ | 15.70 | | | $ | 15.01 | | | $ | 15.58 | | | $ | 12.93 | | |
Income from investment operations: | |
Net investment income | | | 0.33 | | | | 0.38 | | | | 0.45 | | | | 0.45 | | | | 0.49 | | |
Net realized and unrealized gain (loss) | | | 0.92 | | | | 3.59 | | | | 0.73 | | | | (0.57 | ) | | | 2.68 | | |
Total from investment operations | | | 1.25 | | | | 3.97 | | | | 1.18 | | | | (0.12 | ) | | | 3.17 | | |
Less distributions to shareholders: | |
Net investment income | | | (0.48 | ) | | | (0.42 | ) | | | (0.49 | ) | | | (0.45 | ) | | | (0.52 | ) | |
Net realized gains | | | (0.46 | ) | | | — | | | | — | | | | — | | | | — | | |
Total distributions to shareholders | | | (0.94 | ) | | | (0.42 | ) | | | (0.49 | ) | | | (0.45 | ) | | | (0.52 | ) | |
Net asset value, end of period | | $ | 19.56 | | | $ | 19.25 | | | $ | 15.70 | | | $ | 15.01 | | | $ | 15.58 | | |
Total return | | | 6.70 | % | | | 25.72 | % | | | 8.10 | % | | | (0.56 | %) | | | 25.17 | % | |
Ratios to average net assets(a) | |
Total gross expenses | | | 1.05 | %(b) | | | 1.10 | % | | | 1.14 | % | | | 1.02 | % | | | 1.06 | %(b) | |
Total net expenses(c) | | | 0.85 | %(b)(d) | | | 0.87 | %(d) | | | 0.90 | %(d) | | | 0.87 | %(d) | | | 0.90 | %(b)(d) | |
Net investment income | | | 1.74 | % | | | 2.18 | % | | | 3.06 | % | | | 3.08 | % | | | 3.52 | % | |
Supplemental data | |
Net assets, end of period (in thousands) | | $ | 816,941 | | | $ | 465,328 | | | $ | 120,906 | | | $ | 130,380 | | | $ | 166,597 | | |
Portfolio turnover | | | 78 | % | | | 76 | % | | | 71 | % | | | 66 | % | | | 118 | % | |
Notes to Financial Highlights
(a) In addition to the fees and expenses that the Fund bears directly, the Fund indirectly bears a pro rata share of the fees and expenses of any other funds in which it invests. Such indirect expenses are not included in the Fund's reported expense ratios.
(b) Ratios include line of credit interest expense which is less than 0.01%.
(c) Total net expenses include the impact of certain fee waivers/expense reimbursements made by the Investment Manager and certain of its affiliates, if applicable.
(d) The benefits derived from expense reductions had an impact of less than 0.01%.
The accompanying Notes to Financial Statements are an integral part of this statement.
Annual Report 2015
30
COLUMBIA CONVERTIBLE SECURITIES FUND
NOTES TO FINANCIAL STATEMENTS
February 28, 2015
Note 1. Organization
Columbia Convertible Securities Fund (the Fund), a series of Columbia Funds Series Trust (the Trust), is a diversified fund. The Trust is registered under the Investment Company Act of 1940, as amended (the 1940 Act), as an open-end management investment company organized as a Delaware statutory trust.
Fund Shares
The Trust may issue an unlimited number of shares (without par value). The Fund offers Class A, Class B, Class C, Class I, Class R, Class R4, Class R5, Class W, Class Y and Class Z shares. Although all share classes generally have identical voting, dividend and liquidation rights, each share class votes separately when required by the Trust's organizational documents or by law. Different share classes pay different distribution amounts to the extent the expenses of such share classes differ, and distributions in liquidation will be proportional to the net asset value of each share class. Each share class has its own expense structure and sales charges.
Class A shares are subject to a maximum front-end sales charge of 5.75% based on the initial investment amount. Class A shares purchased without an initial sales charge in accounts aggregating $1 million to $50 million at the time of purchase are subject to a contingent deferred sales charge (CDSC) if the shares are sold within 18 months of purchase, charged as follows: 1.00% CDSC if redeemed within 12 months of purchase, and 0.50% CDSC if redeemed more than 12, but less than 18, months after purchase.
Class B shares may be subject to a maximum CDSC of 5.00% based upon the holding period after purchase. Class B shares will generally convert to Class A shares eight years after purchase. The Fund no longer accepts investments by new or existing investors in the Fund's Class B shares, except in connection with the reinvestment of any dividend and/or capital gain distributions in Class B shares of the Fund and exchanges by existing Class B shareholders of certain other funds within the Columbia Family of Funds.
Class C shares are subject to a 1.00% CDSC on shares redeemed within one year of purchase.
Class I shares are not subject to sales charges and are available only to the Columbia Family of Funds.
Class R shares are not subject to sales charges and are generally available only to certain retirement plans and other investors as described in the Fund's prospectus.
Class R4 shares are not subject to sales charges and are generally available only to omnibus retirement plans and certain investors as described in the Fund's prospectus.
Class R5 shares are not subject to sales charges and are generally available only to investors purchasing through authorized investment professionals and omnibus retirement plans.
Class W shares are not subject to sales charges and are available only to investors purchasing through authorized investment programs managed by investment professionals, including discretionary managed account programs.
Class Y shares are not subject to sales charges and are generally available only to certain retirement plans as described in the Fund's prospectus. Class Y shares commenced operations on October 1, 2014.
Class Z shares are not subject to sales charges and are available only to eligible investors, which are subject to different investment minimums as described in the Fund's prospectus.
Note 2. Summary of Significant Accounting Policies
Basis of Preparation
The Fund is an investment company that applies the accounting and reporting guidance in the Financial Accounting Standards Board (FASB) Accounting Standards Codification Topic 946, Financial Services — Investment Companies (ASC 946). The financial statements are prepared in accordance with U.S. generally accepted accounting principles (GAAP) which requires management to make certain estimates and assumptions that affect the reported amounts of assets and liabilities, the disclosure of contingent assets and liabilities at the date of the financial statements and the reported amounts of income and expenses during the reporting period. Actual results could differ from those estimates.
The following is a summary of significant accounting policies followed by the Fund in the preparation of its financial statements.
Annual Report 2015
31
COLUMBIA CONVERTIBLE SECURITIES FUND
NOTES TO FINANCIAL STATEMENTS (continued)
February 28, 2015
Security Valuation
Debt securities generally are valued by pricing services approved by the Board of Trustees (the Board) based upon market transactions for normal, institutional-size trading units of similar securities. The services may use various pricing techniques that take into account, as applicable, factors such as yield, quality, coupon rate, maturity, type of issue, trading characteristics and other data, as well as broker quotes. Debt securities for which quotations are readily available may also be valued based upon an over-the-counter or exchange bid quotation.
All equity securities are valued at the close of business of the New York Stock Exchange (NYSE). Equity securities are valued at the last quoted sales price on the principal exchange or market on which they trade, except for securities traded on the NASDAQ Stock Market, which are valued at the NASDAQ official close price. Unlisted securities or listed securities for which there were no sales during the day are valued at the mean of the latest quoted bid and ask prices on such exchanges or markets.
Foreign equity securities are valued based on quotations from the principal market in which such securities are traded. If any foreign security prices are not readily available as a result of limited share activity, the securities are valued at the mean of the latest quoted bid and ask prices on such exchanges or markets. Foreign currency exchange rates are generally determined at 4:00 p.m. Eastern (U.S.) time. Many securities markets and exchanges outside the U.S. close prior to the close of the NYSE; therefore, the closing prices for securities in such markets or on such exchanges may not fully reflect events that occur after such close but before the close of the NYSE. In those situations, foreign securities will be fair valued pursuant to a policy adopted by the Board, including, if available, utilizing a third party pricing service to determine these fair values. The third party pricing service takes into account multiple factors, including, but not limited to, movements in the U.S. securities markets, certain depositary receipts, futures contracts and foreign exchange rates that have occurred subsequent to the close of the foreign exchange or market, to determine a good faith estimate that reasonably reflects the current market conditions as of the close of the NYSE. The fair value of a security is likely to be different from the quoted or published price, if available.
Investments in open-end investment companies, including money market funds, are valued at their net asset value.
Investments for which market quotations are not readily available, or that have quotations which management believes are not reliable, are valued at fair value as determined in good faith under procedures established by and under the general supervision of the Board. If a security or class of securities (such as foreign securities) is valued at fair value, such value is likely to be different from the quoted or published price for the security.
The determination of fair value often requires significant judgment. To determine fair value, management may use assumptions including but not limited to future cash flows and estimated risk premiums. Multiple inputs from various sources may be used to determine fair value.
Foreign Currency Transactions and Translations
The values of all assets and liabilities denominated in foreign currencies are generally translated into U.S. dollars at exchange rates determined at the close of the NYSE. Net realized and unrealized gains (losses) on foreign currency transactions and translations include gains (losses) arising from the fluctuation in exchange rates between trade and settlement dates on securities transactions, gains (losses) arising from the disposition of foreign currency and currency gains (losses) between the accrual and payment dates on dividends, interest income and foreign withholding taxes.
For financial statement purposes, the Fund does not distinguish that portion of gains (losses) on investments which is due to changes in foreign exchange rates from that which is due to changes in market prices of the investments. Such fluctuations are included with the net realized and unrealized gains (losses) on investments in the Statement of Operations.
Security Transactions
Security transactions are accounted for on the trade date. Cost is determined and gains (losses) are based upon the specific identification method for both financial statement and federal income tax purposes.
Income Recognition
Interest income is recorded on an accrual basis. Market premiums and discounts, including original issue discounts, are amortized and accreted, respectively, over the expected life of the security on all debt securities, unless otherwise noted. For convertible securities,
Annual Report 2015
32
COLUMBIA CONVERTIBLE SECURITIES FUND
NOTES TO FINANCIAL STATEMENTS (continued)
February 28, 2015
premiums attributable to the conversion feature are not amortized.
The Fund may place a debt security on non-accrual status and reduce related interest income when it becomes probable that the interest will not be collected and the amount of uncollectible interest can be reasonably estimated. A defaulted debt security is removed from non-accrual status when the issuer resumes interest payments or when collectability of interest is reasonably assured.
Corporate actions and dividend income are generally recorded net of any non-reclaimable tax withholdings, on the ex-dividend date or upon receipt of ex-dividend notification in the case of certain foreign securities.
The Fund may receive distributions from holdings in business development companies (BDCs), exchange-traded funds (ETFs), other regulated investment companies (RICs), and real estate investment trusts (REITs), which report information on the character of their distributions annually. These distributions are allocated to dividend income, capital gain and return of capital based on actual information reported. To the extent actual information has not yet been reported by the REITs, estimates for return of capital are made by the Fund's management. Return of capital is recorded as a reduction of the cost basis of securities held. If the Fund no longer owns the applicable securities, return of capital is recorded as a realized gain. Management's estimates are subsequently adjusted when the actual character of the distributions is disclosed by the REITs, which could result in a proportionate change in return of capital to shareholders. No estimates are made for the BDCs, ETFs, and RICs.
Awards from class action litigation are recorded as a reduction of cost basis if the Fund still owns the applicable securities on the payment date. If the Fund no longer owns the applicable securities, the proceeds are recorded as realized gains.
The value of additional securities received as an income payment is recorded as income and increases the cost basis of such securities.
Expenses
General expenses of the Trust are allocated to the Fund and other funds of the Trust based upon relative net assets or other expense allocation methodologies determined by the nature of the expense. Expenses directly attributable to the Fund are charged to the Fund.
Expenses directly attributable to a specific class of shares are charged to that share class.
Determination of Class Net Asset Value
All income, expenses (other than class-specific expenses, which are charged to that share class, as shown in the Statement of Operations) and realized and unrealized gains (losses) are allocated to each class of the Fund on a daily basis, based on the relative net assets of each class, for purposes of determining the net asset value of each class.
Federal Income Tax Status
The Fund intends to qualify each year as a regulated investment company under Subchapter M of the Internal Revenue Code, as amended, and will distribute substantially all of its taxable income (including net short-term capital gains), if any, for its tax year, and as such will not be subject to federal income taxes. In addition, the Fund intends to distribute in each calendar year substantially all of its net investment income, capital gains and certain other amounts, if any, such that the Fund should not be subject to federal excise tax. Therefore, no federal income or excise tax provision is recorded.
Distributions to Shareholders
Distributions from net investment income, if any, are declared and paid each calendar quarter. Net realized capital gains, if any, are distributed at least annually. Income distributions and capital gain distributions are determined in accordance with federal income tax regulations, which may differ from GAAP.
Guarantees and Indemnifications
Under the Trust's organizational documents and, in some cases, by contract, its officers and trustees are indemnified against certain liabilities arising out of the performance of their duties to the Trust or its funds. In addition, certain of the Fund's contracts with its service providers contain general indemnification clauses. The Fund's maximum exposure under these arrangements is unknown since the amount of any future claims that may be made against the Fund cannot be determined, and the Fund has no historical basis for predicting the likelihood of any such claims.
Annual Report 2015
33
COLUMBIA CONVERTIBLE SECURITIES FUND
NOTES TO FINANCIAL STATEMENTS (continued)
February 28, 2015
Note 3. Fees and Compensation Paid to Affiliates
Investment Management Fees
Under an Investment Management Services Agreement, Columbia Management Investment Advisers, LLC (the Investment Manager), a wholly-owned subsidiary of Ameriprise Financial, Inc. (Ameriprise Financial), determines which securities will be purchased, held or sold. The investment management fee is an annual fee that is equal to a percentage of the Fund's average daily net assets that declines from 0.76% to 0.62% as the Fund's net assets increase. The effective investment management fee rate for the year ended February 28, 2015 was 0.73% of the Fund's average daily net assets.
Administration Fees
Under an Administrative Services Agreement, the Investment Manager also serves as the Fund Administrator. The Fund pays the Fund Administrator an annual fee for administration and accounting services equal to a percentage of the Fund's average daily net assets that declines from 0.06% to 0.05% as the Fund's net assets increase. The effective administration fee rate for the year ended February 28, 2015 was 0.06% of the Fund's average daily net assets.
Other Expenses
Other expenses are for, among other things, miscellaneous expenses of the Fund or the Board, including payments to a company providing limited administrative services to the Fund and the Board. That company's expenses include boardroom and office expense, employee compensation, employee health and retirement benefits, and certain other expenses. For the year ended February 28, 2015, other expenses paid by the Fund to this company were $2,806.
Compensation of Board Members
Board members are compensated for their services to the Fund as disclosed in the Statement of Operations. Under a Deferred Compensation Plan (the Plan), the Board members who are not "interested persons" of the Fund, as defined under the 1940 Act, may elect to defer payment of up to 100% of their compensation. Deferred amounts are treated as though equivalent dollar amounts had been invested in shares of certain funds managed by the Investment Manager. The Fund's liability for these amounts is adjusted for market value changes and remains in the Fund until distributed in accordance with the Plan.
Transfer Agent Fees
Under a Transfer and Dividend Disbursing Agent Agreement, Columbia Management Investment Services Corp. (the Transfer Agent), an affiliate of the Investment Manager and a wholly-owned subsidiary of Ameriprise Financial, is responsible for providing transfer agency services to the Fund. The Transfer Agent has contracted with Boston Financial Data Services (BFDS) to serve as sub-transfer agent.
Effective November 1, 2014, the Transfer Agent receives a monthly transfer agency fee based on the number or the average value of accounts, depending on the type of account. Prior to November 1, 2014, the Transfer Agent received a monthly account-based service fee based on the number of open accounts. In addition, the Transfer Agent also receives sub-transfer agency fees based on a percentage of the average aggregate value of the Fund's shares maintained in omnibus accounts (other than omnibus accounts for which American Enterprise Investment Services Inc. is the broker of record or accounts where the beneficial shareholder is a customer of Ameriprise Financial Services, Inc., for which the Transfer Agent receives a per account fee). The Transfer Agent pays the fees of BFDS for services as sub-transfer agent and is not entitled to reimbursement for such fees from the Fund (with the exception of out-of-pocket fees).
The Transfer Agent also receives compensation from the Fund for various shareholder services and reimbursements for certain out-of-pocket fees. Total transfer agent fees for Class R5 shares are subject to an annual limitation of not more than 0.05% of the average daily net assets attributable to Class R5 shares. Class I and Class Y shares do not pay transfer agency fees.
For the year ended February 28, 2015, the Fund's effective transfer agent fee rates as a percentage of average daily net assets of each class were as follows:
Class A | | | 0.23 | % | |
Class B | | | 0.23 | | |
Class C | | | 0.23 | | |
Class R | | | 0.23 | | |
Class R4 | | | 0.23 | | |
Class R5 | | | 0.05 | | |
Class W | | | 0.22 | | |
Class Z | | | 0.23 | | |
An annual minimum account balance fee of $20 may apply to certain accounts with a value below the applicable share class's initial minimum investment
Annual Report 2015
34
COLUMBIA CONVERTIBLE SECURITIES FUND
NOTES TO FINANCIAL STATEMENTS (continued)
February 28, 2015
requirements to reduce the impact of small accounts on transfer agent fees. These minimum account balance fees are remitted to the Fund and recorded as part of expense reductions in the Statement of Operations. For the year ended February 28, 2015, these minimum account balance fees reduced total expenses of the Fund by $1,112.
Distribution and Service Fees
The Fund has an agreement with Columbia Management Investment Distributors, Inc. (the Distributor), an affiliate of the Investment Manager and a wholly-owned subsidiary of Ameriprise Financial, for distribution and shareholder services. The Board has approved, and the Fund has adopted, distribution and shareholder service plans (the Plans) applicable to certain share classes, which set the distribution and service fees for the Fund. These fees are calculated daily and are intended to compensate the Distributor and/or eligible selling and/or servicing agents for selling shares of the Fund and providing services to investors.
Under the Plans, the Fund pays a monthly combined distribution and service fee to the Distributor at the maximum annual rate of 0.25% of the average daily net assets attributable to Class A shares of the Fund. Also under the Plans, the Fund pays a monthly service fee at the maximum annual rate of 0.25% of the average daily net assets attributable to Class B, Class C and Class W shares of the Fund and the payment of a monthly distribution fee at the maximum annual rates of 0.75%, 0.75%, 0.50% and 0.25% of the average daily net assets attributable to Class B, Class C, Class R and Class W shares, respectively.
Although the Fund may pay a distribution fee up to 0.25% of the Fund's average daily net assets attributable to Class W shares and a service fee of up to 0.25% of the Fund's average daily net assets attributable to Class W shares, the aggregate fee shall not exceed 0.25% of the Fund's average daily net assets attributable to Class W shares.
Sales Charges
Sales charges, including front-end charges and CDSCs, received by the Distributor for distributing Fund shares were $590,276 for Class A, $178 for Class B and $6,933 for Class C shares for the year ended February 28, 2015.
Expenses Waived/Reimbursed by the Investment Manager and its Affiliates
The Investment Manager and certain of its affiliates have contractually agreed to waive fees and/or reimburse expenses (excluding certain fees and expenses described below) for the periods disclosed below, unless sooner terminated at the sole discretion of the Board, so that the Fund's net operating expenses, after giving effect to fees waived/expenses reimbursed and any balance credits and/or overdraft charges from the Fund's custodian, do not exceed the following annual rates as a percentage of the class' average daily net assets:
| | | July 1, 2014
through
June 30, 2015 | | Prior to
July 1, 2014 | |
Class A | | | 1.13 | % | | | 1.10 | % | |
Class B | | | 1.88 | | | | 1.85 | | |
Class C | | | 1.88 | | | | 1.85 | | |
Class I | | | 0.72 | | | | 0.66 | | |
Class R | | | 1.38 | | | | 1.35 | | |
Class R4 | | | 0.88 | | | | 0.85 | | |
Class R5 | | | 0.77 | | | | 0.71 | | |
Class W | | | 1.13 | | | | 1.10 | | |
Class Y | | | 0.72 | * | | | — | | |
Class Z | | | 0.88 | | | | 0.85 | | |
*Expense cap rate is contractual from October 1, 2014 (the commencement of operations of Class Y shares) through September 30, 2015.
Under the agreement governing these fee waivers and/or expense reimbursement arrangements, the following fees and expenses are excluded from the waiver/reimbursement commitment, and therefore will be paid by the Fund, if applicable: taxes (including foreign transaction taxes), expenses associated with investments in affiliated and non-affiliated pooled investment vehicles (including mutual funds and exchange-traded funds), transaction costs and brokerage commissions, costs related to any securities lending program, dividend expenses associated with securities sold short, inverse floater program fees and expenses, transaction charges and interest on borrowed money, interest, extraordinary expenses and any other expenses the exclusion of which is specifically approved by the Board. This agreement may be modified or amended only with approval from all parties. Any fees waived and/or expenses reimbursed under the expense reimbursement arrangements described above are not recoverable by the Investment Manager or its affiliates in future periods.
Annual Report 2015
35
COLUMBIA CONVERTIBLE SECURITIES FUND
NOTES TO FINANCIAL STATEMENTS (continued)
February 28, 2015
In addition, effective July 1, 2014, the Fund's expense ratio is subject to a voluntary expense reimbursement arrangement pursuant to which fees are waived and/or expenses reimbursed (excluding certain fees and expenses immediately described above), so that the Fund's net operating expenses, after giving effect to fees waived/expenses reimbursed and any balance credits and/or overdraft charges from the Fund's custodian, do not exceed the annual rates of 1.10% for Class A, 1.85% for Class B, 1.85% for Class C, 0.69% for Class I, 1.35% for Class R, 0.85% for Class R4, 0.74% for Class R5, 1.10% for Class W, 0.69% for Class Y (effective October 1, 2014) and 0.85% for Class Z. This arrangement may be revised or discontinued at any time.
Note 4. Federal Tax Information
The timing and character of income and capital gain distributions are determined in accordance with income tax regulations, which may differ from GAAP because of temporary or permanent book to tax differences.
At February 28, 2015, these differences are primarily due to differing treatment for principal and/or interest from fixed income securities, deferral/reversal of wash sale losses, Trustees' deferred compensation, deemed distributions, foreign currency transactions, and amortization/accretion on certain convertible securities. To the extent these differences are permanent, reclassifications are made among the components of the Fund's net assets in the Statement of Assets and Liabilities. Temporary differences do not require reclassifications. In the Statement of Assets and Liabilities the following reclassifications were made:
Excess of distributions over net investment income | | $ | 5,153,696 | | |
Accumulated net realized gain | | | (5,153,696 | ) | |
Net investment income (loss) and net realized gains (losses), as disclosed in the Statement of Operations, and net assets were not affected by this reclassification.
The tax character of distributions paid during the years indicated was as follows:
Year Ended February 28, | | 2015 | | 2014 | |
Ordinary income | | $ | 34,784,198 | | | $ | 14,563,181 | | |
Long-term capital gains | | | 23,105,408 | | | | — | | |
Total | | $ | 57,889,606 | | | $ | 14,563,181 | | |
Short-term capital gain distributions, if any, are considered ordinary income distributions for tax purposes.
At February 28, 2015, the components of distributable earnings on a tax basis were as follows:
Undistributed ordinary income | | $ | 14,025,788 | | |
Undistributed long-term capital gains | | | 25,908,982 | | |
Net unrealized appreciation | | | 112,585,915 | | |
At February 28, 2015, the cost of investments for federal income tax purposes was $1,310,279,191 and the aggregate gross unrealized appreciation and depreciation based on that cost was:
Unrealized appreciation | | $ | 151,962,225 | | |
Unrealized depreciation | | | (39,376,310 | ) | |
Net unrealized appreciation | | $ | 112,585,915 | | |
Management of the Fund has concluded that there are no significant uncertain tax positions in the Fund that would require recognition in the financial statements. However, management's conclusion may be subject to review and adjustment at a later date based on factors including, but not limited to, new tax laws, regulations, and administrative interpretations (including relevant court decisions). Generally, the Fund's federal tax returns for the prior three fiscal years remain subject to examination by the Internal Revenue Service.
Note 5. Portfolio Information
The cost of purchases and proceeds from sales of securities, excluding short-term investments and derivatives, if any, aggregated to $1,206,526,670 and $892,173,439, respectively, for the year ended February 28, 2015. The amount of purchase and sale activity impacts the portfolio turnover rate reported in the Financial Highlights.
Note 6. Affiliated Money Market Fund
The Fund invests in Columbia Short-Term Cash Fund, an affiliated money market fund established for the exclusive use by the Fund and other affiliated funds. The income earned by the Fund from such investments is included as Dividends — affiliated issuers in the Statement of Operations. As an investing fund, the Fund indirectly bears its proportionate share of the expenses of Columbia Short-Term Cash Fund.
Note 7. Shareholder Concentration
At February 28, 2015, two unaffiliated shareholders of record owned 57.2% of the outstanding shares of the Fund in one or more accounts. The Fund has no knowledge about whether any portion of those shares was owned beneficially. Affiliated shareholders of record owned 17.8% of the outstanding shares of the Fund in
Annual Report 2015
36
COLUMBIA CONVERTIBLE SECURITIES FUND
NOTES TO FINANCIAL STATEMENTS (continued)
February 28, 2015
one or more accounts. Subscription and redemption activity by concentrated accounts may have a significant effect on the operations of the Fund.
Note 8. Line of Credit
The Fund has entered into a revolving credit facility with a syndicate of banks led by JPMorgan Chase Bank, N.A. (JPMorgan) whereby the Fund may borrow for the temporary funding of shareholder redemptions or for other temporary or emergency purposes. Pursuant to a December 9, 2014 amendment, the credit facility agreement, which is a collective agreement between the Fund and certain other funds managed by the Investment Manager, severally and not jointly, permits collective borrowings up to $550 million. Interest is charged to each participating fund based on its borrowings at a rate equal to the higher of (i) the overnight federal funds rate plus 1.00% or (ii) the one-month LIBOR rate plus 1.00%. Each borrowing under the credit facility matures no later than 60 days after the date of borrowing. The Fund also pays a commitment fee equal to its pro rata share of the amount of the credit facility at a rate of 0.075% per annum. The commitment fee is included in other expenses in the Statement of Operations. Prior to the December 9, 2014 amendment, the credit facility agreement permitted borrowings up to $500 million under the same terms and interest rates as described above.
For the year ended February 28, 2015, the average daily loan balance outstanding on days when borrowing existed was $10,750,000 at a weighted average interest rate of 1.15%. Interest expense incurred by the Fund is recorded as line of credit interest expense in the Statement of Operations.
Note 9. Significant Risks
Credit Risk
Credit risk is the risk that the value of debt securities in the Fund's portfolio may decline because the issuer may default and fail to pay interest or repay principal when due. Rating agencies assign credit ratings to debt securities to indicate their credit risk. Lower rated or unrated debt securities held by the Fund may present increased credit risk as compared to higher-rated debt securities.
Interest Rate Risk
Interest rate risk is the risk of losses attributable to changes in interest rates. In general, if prevailing interest rates rise, the values of debt securities tend to fall, and if interest rates fall, the values of debt securities tend to
rise. Actions by governments and central banking authorities can result in increases in interest rates. Increasing interest rates may negatively affect the value of debt securities held by the Fund, resulting in a negative impact on the Fund's performance and net asset value per share. In general, the longer the maturity or duration of a debt security, the greater its sensitivity to changes in interest rates.
Convertible Securities Risk
Convertible securities are subject to the usual risks associated with debt securities, such as interest rate risk and credit risk. Convertible securities also react to changes in the value of the common stock into which they convert, and are thus subject to market risk. The Fund may also be forced to convert a convertible security at an inopportune time, which may decrease the Fund's return.
Liquidity Risk
Liquidity risk is the risk associated with a lack of marketability of investments which may make it difficult to sell the investment at a desirable time or price. Changing regulatory, market or other conditions or environments (for example, the interest rate or credit environments) may adversely affect the liquidity of the Fund's investments. The Fund may have to accept a lower selling price for the holding, sell other investments, or forego another, more appealing investment opportunity. Generally, the less liquid the market at the time the Fund sells a portfolio investment, the greater the risk of loss or decline of value to the Fund. A less liquid market can lead to an increase in Fund redemptions, which may negatively impact Fund performance and net asset value per share, including, for example, if the Fund is forced to sell securities in a down market.
Note 10. Subsequent Events
Management has evaluated the events and transactions that have occurred through the date the financial statements were issued and noted no items requiring adjustment of the financial statements or additional disclosure.
Note 11. Information Regarding Pending and Settled Legal Proceedings
In December 2005, without admitting or denying the allegations, American Express Financial Corporation (AEFC, which is now known as Ameriprise Financial, Inc. (Ameriprise Financial)) entered into settlement agreements with the Securities and Exchange Commission (SEC) and Minnesota Department of
Annual Report 2015
37
COLUMBIA CONVERTIBLE SECURITIES FUND
NOTES TO FINANCIAL STATEMENTS (continued)
February 28, 2015
Commerce (MDOC) related to market timing activities. As a result, AEFC was censured and ordered to cease and desist from committing or causing any violations of certain provisions of the Investment Advisers Act of 1940, the Investment Company Act of 1940, and various Minnesota laws. AEFC agreed to pay disgorgement of $10 million and civil money penalties of $7 million. AEFC also agreed to retain an independent distribution consultant to assist in developing a plan for distribution of all disgorgement and civil penalties ordered by the SEC in accordance with various undertakings detailed at www.sec.gov/litigation/admin/ia-2451.pdf. Ameriprise Financial and its affiliates have cooperated with the SEC and the MDOC in these legal proceedings, and have made regular reports to the Funds' Boards of Trustees.
Ameriprise Financial and certain of its affiliates have historically been involved in a number of legal, arbitration and regulatory proceedings, including routine litigation, class actions, and governmental actions, concerning matters arising in connection with the conduct of their business activities. Ameriprise Financial believes that the Funds are not currently the subject of, and that neither Ameriprise Financial nor any of its affiliates are the subject of, any pending legal, arbitration or regulatory proceedings that are likely to have a material adverse effect on the Funds or the ability of Ameriprise Financial or its affiliates to perform under their contracts with the Funds. Ameriprise Financial is required to make quarterly (10-Q), annual (10-K) and, as necessary, 8-K filings with the Securities and Exchange Commission on legal and regulatory matters that relate to Ameriprise Financial and its affiliates. Copies of these filings may be obtained by accessing the SEC website at www.sec.gov.
There can be no assurance that these matters, or the adverse publicity associated with them, will not result in increased fund redemptions, reduced sale of fund shares or other adverse consequences to the Funds. Further, although we believe proceedings are not likely to have a material adverse effect on the Funds or the ability of Ameriprise Financial or its affiliates to perform under their contracts with the Funds, these proceedings are subject to uncertainties and, as such, we are unable to estimate the possible loss or range of loss that may result. An adverse outcome in one or more of these proceedings could result in adverse judgments, settlements, fines, penalties or other relief that could have a material adverse effect on the consolidated financial condition or results of operations of Ameriprise Financial.
Annual Report 2015
38
COLUMBIA CONVERTIBLE SECURITIES FUND
REPORT OF INDEPENDENT REGISTERED PUBLIC ACCOUNTING FIRM
To the Trustees of Columbia Funds Series Trust and the Shareholders of
Columbia Convertible Securities Fund
In our opinion, the accompanying statement of assets and liabilities, including the portfolio of investments, and the related statements of operations and of changes in net assets and the financial highlights present fairly, in all material respects, the financial position of Columbia Convertible Securities Fund (the "Fund", a series of Columbia Funds Series Trust) at February 28, 2015, and the results of its operations, the changes in its net assets and the financial highlights for each of the periods indicated, in conformity with accounting principles generally accepted in the United States of America. These financial statements and financial highlights (hereafter referred to as "financial statements") are the responsibility of the Fund's management; our responsibility is to express an opinion on these financial statements based on our audits. We conducted our audits of these financial statements in accordance with the standards of the Public Company Accounting Oversight Board (United States). Those standards require that we plan and perform the audit to obtain reasonable assurance about whether the financial statements are free of material misstatement. An audit includes examining, on a test basis, evidence supporting the amounts and disclosures in the financial statements, assessing the accounting principles used and significant estimates made by management, and evaluating the overall financial statement presentation. We believe that our audits, which included confirmation of securities at February 28, 2015 by correspondence with the custodian, brokers and transfer agent, and the application of alternative auditing procedures where such confirmations had not been received, provide a reasonable basis for our opinion.
PricewaterhouseCoopers LLP
Minneapolis, Minnesota
April 21, 2015
Annual Report 2015
39
COLUMBIA CONVERTIBLE SECURITIES FUND
FEDERAL INCOME TAX INFORMATION
(Unaudited)
The Fund hereby designates the following tax attributes for the fiscal year ended February 28, 2015. Shareholders will be notified in early 2016 of the amounts for use in preparing 2015 income tax returns.
Tax Designations
| Qualified Dividend Income | | | 24.72 | % | |
| Dividends Received Deduction | | | 24.61 | % | |
Capital Gain Dividend | | $ | 42,736,802 | | |
Qualified Dividend Income. For taxable, non-corporate shareholders, the percentage of ordinary income distributed during the fiscal year that represents qualified dividend income subject to reduced tax rates.
Dividends Received Deduction. The percentage of ordinary income distributed during the fiscal year that qualifies for the corporate dividends received deduction.
Capital Gain Dividend. The Fund designates as a capital gain dividend the amount reflected above, or if subsequently determined to be different, the net capital gain of such fiscal period.
Annual Report 2015
40
COLUMBIA CONVERTIBLE SECURITIES FUND
Shareholders elect the Board that oversees the Funds' operations. The Board appoints officers who are responsible for day-to-day business decisions based on policies set by the Board. The following table provides basic biographical information about the Funds' Board members, including their principal occupations during the past five years, although specific titles for individuals may have varied over the period. Under current Board policy, members may serve through the end of the calendar year in which he or she reaches either the mandatory retirement age established by the Board or the fifteenth anniversary of the first Board meeting they attended as a member of the Board.
Independent Trustees
Name,
Address,
Year of Birth | | Position Held With
Funds and Length of
Service | | Principal Occupation(s)
During Past Five Years
and Other Relevant
Professional Experience | | Number of
Funds in the
Fund Family
Overseen by
Board Member | | Other Present or Past
Directorships/
Trusteeships
(Within Past 5 Years) | |
Kathleen Blatz
901 S. Marquette Ave.
Minneapolis, MN 55402
1954 | | Board member since 1/06 for RiverSource Funds and since 6/11 for Nations Funds | | Attorney; specializing in arbitration and mediation; Chief Justice, Minnesota Supreme Court, 1998-2006; Associate Justice, Minnesota Supreme Court, 1996-1998; Fourth Judicial District Court Judge, Hennepin Country, 1994-1996; Attorney in private practice and public service, 1984-1993; State Representative, Minnesota House of Representatives, 1979-1993, which included service on the Tax and Financial Institutions and Insurance Committees | | | 127 | | | Trustee, BlueCross BlueShield of Minnesota (Chair of the Business Development Committee) since 2009; Chair of the Robina Foundation since August 2013 | |
Edward J. Boudreau, Jr.
901 S. Marquette Ave.
Minneapolis, MN 55402
1944 | | Board member since 6/11 for RiverSource Funds and since 1/05 for Nations Funds | | Managing Director, E.J. Boudreau & Associates (consulting) since 2000; FINRA Industry Arbitrator, 2002-present; Chairman and Chief Executive Officer, John Hancock Funds (asset management), Chairman and Interested Trustee for open-end and closed-end funds offered by John Hancock, 1989-2000; John Hancock Life Insurance Company, including SVP and Treasurer and SVP Information Technology, 1968-1988 | | | 125 | | | Former Trustee, BofA Funds Series Trust (11 funds), 2005-2011; Trustee, Boston Museum of Science (Chair of Finance Committee), 1985-2013 | |
Pamela G. Carlton
901 S. Marquette Ave.
Minneapolis, MN 55402
1954 | | Board member since 7/07 for RiverSource Funds and since 6/11 for Nations Funds | | President, Springboard — Partners in Cross Cultural Leadership (consulting company) since 2003; Managing Director of US Equity Research, JP Morgan Chase, 1999-2003; Director of US Equity Research, Chase Asset Management, 1996- 1999; Co-Director Latin America Research, 1993-1996, COO Global Research, 1992-1996, Co-Director of US Research, 1991-1992, Investment Banker, Morgan Stanley, 1982-1991 | | | 127 | | | None | |
Annual Report 2015
41
COLUMBIA CONVERTIBLE SECURITIES FUND
TRUSTEES AND OFFICERS (continued)
Independent Trustees (continued)
Name,
Address,
Year of Birth | | Position Held With
Funds and Length of
Service | | Principal Occupation(s)
During Past Five Years
and Other Relevant
Professional Experience | | Number of
Funds in the
Fund Family
Overseen by
Board Member | | Other Present or Past
Directorships/
Trusteeships
(Within Past 5 Years) | |
William P. Carmichael
901 S. Marquette Ave.
Minneapolis, MN 55402
1943 | | Chair of the Board since 1/14, Board member since 6/11 for RiverSource Funds and since 2003 for Nations Funds | | Retired; Co-founder, The Succession Fund (provides exit strategies to owners of privately held companies) 1998-2007; Adjunct Professor of Finances, Kelley School of Business, Indiana University, 1993-2007; Senior Vice President, Sara Lee Corporation, 1991-1993; Senior Vice President and Chief Financial Officer, Beatrice Foods Company, 1984-1990; Vice President, Esmark, Inc, 1973-1984.; Associate, Price Waterhouse, 1968-1972 | | | 127 | | | Director, Cobra Electronics Corporation (electronic equipment manufacturer), 1994-August 2014; The Finish Line (athletic shoes and apparel) since July 2003; Director, International Textile Corp. since 2012; former Director, McMoRan Exploration Company (oil and gas exploration and development) 2010-2013; former Trustee, BofA Funds Series Trust (11 funds) 2009-2011; Director, Spectrum Brands, Inc. (consumer products), 2002-2009; Director, Simmons Company (bedding), 2004-2010 | |
Patricia M. Flynn
901 S. Marquette Ave.
Minneapolis, MN 55402
1950 | | Board member since 11/04 for RiverSource Funds and since 6/11 for Nations Funds | | Trustee Professor of Economics and Management, Bentley University since 1976 (also teaches and conducts research on corporate governance); Dean, McCallum Graduate School of Business, Bentley University, 1992-2002 | | | 127 | | | Trustee, MA Taxpayers Foundation since 1997; Board of Governors, Innovation Institute, MA Technology Collaborative since 2010 | |
William A. Hawkins
901 S. Marquette Ave.
Minneapolis, MN 55402
1942 | | Board member since 6/11 for RiverSource Funds and since 1/05 for Nations Funds | | Managing Director, Overton Partners (financial consulting), since August 2010; President and Chief Executive Officer, California General Bank, N.A., January 2008-August 2010; Operation Hope, COO, 2004-2007; IndyMac Bancorp, President, CBG, 1999-2003; American General Bank, President, 1997-1999; Griffin Financial Services, CEO, 1981-1997; The Griffin Funds, CEO, 1992-1998 | | | 125 | | | Trustee, BofA Funds Series Trust (11 funds) | |
R. Glenn Hilliard
901 S. Marquette Ave.
Minneapolis, MN 55402
1943 | | Board member since 6/11 for RiverSource Funds and since 1/05 for Nations Funds | | Chairman and Chief Executive Officer, Hilliard Group LLC (investing and consulting) since April 2003; Non-Executive Director & Chairman, CNO Financial Group, Inc. (insurance), September 2003-May 2011 | | | 125 | | | Chairman, BofA Funds Series Trust (11 funds); former Director, CNO Financial Group, Inc. (insurance) 2003-2011 | |
Annual Report 2015
42
COLUMBIA CONVERTIBLE SECURITIES FUND
TRUSTEES AND OFFICERS (continued)
Independent Trustees (continued)
Name,
Address,
Year of Birth | | Position Held With
Funds and Length of
Service | | Principal Occupation(s)
During Past Five Years
and Other Relevant
Professional Experience | | Number of
Funds in the
Fund Family
Overseen by
Board Member | | Other Present or Past
Directorships/
Trusteeships
(Within Past 5 Years) | |
Catherine James Paglia
901 S. Marquette Ave.
Minneapolis, MN 55402
1952 | | Board member since 11/04 for RiverSource Funds and since 6/11 for Nations Funds | | Director, Enterprise Asset Management, Inc. (private real estate and asset management company) since September 1998; Managing Director and Partner, Interlaken Capital, Inc., 1989-1997; Managing Director, Morgan Stanley, 1982-1989; Vice President, Investment Banking, 1980-1982, Associate, Investment Banking, 1976-1980, Dean Witter Reynolds, Inc. | | | 127 | | | Director, Valmont Industries, Inc. (irrigation systems manufacturer) since 2012; Trustee, Carleton College (on the Investment Committee); Trustee, Carnegie Endowment for International Peace (on the Investment Committee) | |
Leroy C. Richie
901 S. Marquette Ave.
Minneapolis, MN 55402
1941 | | Board member since 2000 for Seligman Funds, since 11/08 for RiverSource Funds and since 6/11 for Nations Funds | | Counsel, Lewis & Munday, P.C. (law firm) since 2004; Vice President and General Counsel, Automotive Legal Affairs, Chrysler Corporation, 1993-1997 | | | 127 | | | Lead Outside Director, Digital Ally, Inc. (digital imaging) since September 2005; Director, Infinity, Inc. (oil and gas exploration and production) since 1994; Director, OGE Energy Corp. (energy and energy services) since November 2007-2014 | |
Minor M. Shaw
901 S. Marquette Ave.
Minneapolis, MN 55402
1947 | | Board member since 6/11 for RiverSource Funds and since 2003 for Nations Funds | | President, Micco LLC (private investments) since 2011; President, Micco Corp. (family investment business) 1998-2011 | | | 125 | | | Director, Piedmont Natural Gas; Director, BlueCross BlueShield of South Carolina since April 2008; Chair of the Duke Endowment; Director, National Association of Corporate Directors, Carolinas Chapter, since 2013; Chair of Greenville-Spartanburg Airport Commission; former Trustee, BofA Funds Series Trust (11 funds), 2003-2011 | |
Alison Taunton-Rigby
901 S. Marquette Ave.
Minneapolis, MN 55402
1944 | | Board member since 11/02 for RiverSource Funds and since 6/11 for Nations Funds | | Managing Director, Forester Biotech (consulting) since 2001; Chief Executive Officer and Director, RiboNovix, Inc., (biotechnology) 2003-2010; President and Chief Executive Officer of CMT Inc., 2001-2003; Aquila Biopharmaceuticals Inc., 1996-2000; Cambridge Biotech Corporation, 1995-1996, Mitotix Inc., 1993-1994 | | | 127 | | | Director, Healthways, Inc. (health and well-being solutions) since 2005; Director, ICI Mutual Insurance Company, RRG since 2011; Director, Abt Associates (government contractor) since 2001; Director, Boston Children's Hospital since 2002 | |
Annual Report 2015
43
COLUMBIA CONVERTIBLE SECURITIES FUND
TRUSTEES AND OFFICERS (continued)
Interested Trustee Not Affiliated with Investment Manager*
Name,
Address,
Year of Birth | | Position Held With
Funds and Length of
Service | | Principal Occupation(s)
During Past Five Years | | Number of
Funds in the
Fund Family
Overseen by
Board Member | | Other Present or Past
Directorships/
Trusteeships
(Within Past 5 Years) | |
Anthony M. Santomero
901 S. Marquette Ave.
Minneapolis, MN 55402
1946 | | Board member since 6/11 for RiverSource Funds and since 1/08 for Nations Funds | | Richard K. Mellon Professor Emeritus of Finance, The Wharton School, University of Pennsylvania, since 2002; Senior Advisor, McKinsey & Company (consulting), 2006-2008; President, Federal Reserve Bank of Philadelphia, 2000-2006, Professor of Finance, The Wharton School, University of Pennsylvania, 1972-2002 | | | 125 | | | Director, Renaissance Reinsurance Ltd. since May 2008; Trustee, Penn Mutual Life Insurance Company since March 2008; Director, Citigroup Inc. since 2009; Director, Citibank, N.A. since 2009; former Trustee, BofA Funds Series Trust (11 funds), 2008-2011 | |
*Dr. Santomero is not an affiliated person of the Investment Manager or Ameriprise Financial. However, he is currently deemed by the Funds to be an "interested person" (as defined in the 1940 Act) of the Funds because he serves as a Director of Citigroup Inc. and Citibank, N.A., companies that may directly or through subsidiaries and affiliates engage from time-to-time in brokerage execution, principal transactions and lending relationships with the Funds or accounts advised/managed by the Investment Manager.
Annual Report 2015
44
COLUMBIA CONVERTIBLE SECURITIES FUND
TRUSTEES AND OFFICERS (continued)
Interested Trustee Affiliated with Investment Manager*
Name,
Address,
Year of Birth | | Position Held With
Funds and Length of
Service | | Principal Occupation(s)
During Past Five Years | | Number of
Funds in the
Fund Family
Overseen by
Board Member | | Other Present or Past
Directorships/
Trusteeships
(Within Past 5 Years) | |
William F. Truscott
53600 Ameriprise Financial Center
Minneapolis, MN 55474
1960 | | Board member since 11/01 for RiverSource Funds and since 6/11 for Nations Funds; Senior Vice President since 2002 for RiverSource Funds and since 5/10 for Nations Funds | | Chairman of the Board and President, Columbia Management Investment Advisers, LLC since May 2010 and February 2012, respectively (previously President and Chief Investment Officer, 2001-April 2010); Chief Executive Officer, Global Asset Management, Ameriprise Financial, Inc. since September 2012 (previously Chief Executive Officer, U.S. Asset Management & President, Annuities, May 2010-September 2012 and President — U.S. Asset Management and Chief Investment Officer, 2005-April 2010); Director and Chief Executive Officer, Columbia Management Investment Distributors, Inc. since May 2010 and February 2012, respectively (previously Chairman of the Board and Chief Executive Officer, 2006-April 2010); Chairman of the Board and Chief Executive Officer, RiverSource Distributors, Inc. since 2006; Director, Threadneedle Asset Management Holdings, SARL since 2014; President and Chief Executive Officer, Ameriprise Certificate Company, 2006-August 2012 | | | 186 | | | Former Director, Ameriprise Certificate Company, 2006-January 2013 | |
*Interested person (as defined under the 1940 Act) by reason of being an officer, director, security holder and/or employee of the Investment Manager or Ameriprise Financial.
The Statement of Additional Information has additional information about the Fund's Board members and is available, without charge, upon request by calling 800.345.6611; contacting your financial intermediary or visiting columbiathreadneedle.com/us.
Annual Report 2015
45
COLUMBIA CONVERTIBLE SECURITIES FUND
TRUSTEES AND OFFICERS (continued)
The Board has appointed officers who are responsible for day-to-day business decisions based on policies it has established. The officers serve at the pleasure of the Board. In addition to Mr. Truscott, who is Senior Vice President, the Funds' other officers are:
Fund Officers
Name,
Address and
Year of Birth | | Position and Year
First Appointed to
Position for any Fund
in the Columbia
Funds Complex or a
Predecessor Thereof | | Principal Occupation(s) During Past Five Years | |
Christopher O. Petersen
5228 Ameriprise
Financial Center
Minneapolis, MN 55474
Born 1970 | | President and Principal Executive Officer (2015) | | Vice President and Lead Chief Counsel, Ameriprise Financial, Inc. since January 2015 (previously, Vice President and Chief Counsel January 2010-December 2014; and Vice President and Group Counsel or Counsel 2004-January 2010); officer of Columbia Funds and affiliated funds since 2007. | |
Michael G. Clarke
225 Franklin Street
Boston, MA 02110
Born 1969 | | Treasurer (2011) and Chief Financial Officer (2009) | | Vice President — Mutual Fund Administration, Columbia Management Investment Advisers, LLC, since May 2010; Managing Director of Fund Administration, Columbia Management Advisors, LLC, September 2004-April 2010; senior officer of Columbia Funds and affiliated funds since 2002. | |
Paul B. Goucher
100 Park Avenue
New York, NY 10017
Born 1968 | | Senior Vice President (2011), Chief Legal Officer (2015) and Assistant Secretary (2008) | | Vice President and Lead Chief Counsel, Ameriprise Financial, Inc. since November 2008 and January 2013, respectively (previously Chief Counsel, January 2010-January 2013 and Group Counsel, November 2008-January 2010). | |
Thomas P. McGuire
225 Franklin Street
Boston, MA 02110
Born 1972 | | Vice President and Chief Compliance Officer (2012) | | Vice President — Asset Management Compliance, Ameriprise Financial, Inc., since May 2010; Chief Compliance Officer, Ameriprise Certificate Company since September 2010; Compliance Executive, Bank of America, 2005-April 2010. | |
Colin Moore
225 Franklin Street
Boston, MA 02110
Born 1958 | | Senior Vice President (2010) | | Executive Vice President and Global Chief Investment Officer, Ameriprise Financial, Inc., since July 2013; Director and Global Chief Investment Officer, Columbia Management Investment Advisers, LLC since May 2010; Manager, Managing Director and Chief Investment Officer, Columbia Management Advisors, LLC, 2007-April 2010. | |
Michael E. DeFao
225 Franklin Street
Boston, MA 02110
Born 1968 | | Vice President (2011) and Assistant Secretary (2010) | | Vice President and Chief Counsel, Ameriprise Financial, Inc. since May 2010; Associate General Counsel, Bank of America, 2005-April 2010. | |
Joseph F. DiMaria
225 Franklin Street
Boston, MA 02110
Born 1968 | | Vice President (2011), Assistant Treasurer (2012) and Chief Accounting Officer (2008) | | Vice President — Mutual Fund Treasurer, Columbia Management Investment Advisers, LLC since May 2010; Director of Fund Administration, Columbia Management Advisors, LLC, 2006-April 2010. | |
Amy Johnson
5228 Ameriprise
Financial Center
Minneapolis, MN 55474
Born 1965 | | Vice President (2006) | | Managing Director and Chief Operating Officer, Columbia Management Investment Advisers, LLC since May 2010 (previously Chief Administrative Officer, 2009-April 2010, and Vice President — Asset Management and Trust Company Services, 2006-2009). | |
Lyn Kephart-Strong
5228 Ameriprise
Financial Center
Minneapolis, MN 55474
Born 1960 | | Vice President (2015) | | President, Columbia Management Investment Services Corp. since October 2014; Vice President & Resolution Officer, Ameriprise Trust Company since August 2009; President, RiverSource Service Corporation 2004-2010. | |
Ryan C. Larrenaga
225 Franklin Street
Boston, MA 02110
Born 1970 | | Vice President and Secretary (2015) | | Vice President and Group Counsel, Ameriprise Financial, Inc. since August 2011 (previously, Counsel from May 2010 to August 2011); Assistant General Counsel, Bank of America, 2005-April 2010; officer of Columbia Funds and affiliated funds since 2005. | |
Annual Report 2015
46
COLUMBIA CONVERTIBLE SECURITIES FUND
IMPORTANT INFORMATION ABOUT THIS REPORT
Each fund mails one shareholder report to each shareholder address. If you would like more than one report, please call shareholder services at 800.345.6611 and additional reports will be sent to you.
The policy of the Board is to vote the proxies of the companies in which each fund holds investments consistent with the procedures as stated in the Statement of Additional Information (SAI). You may obtain a copy of the SAI without charge by calling 800.345.6611; contacting your financial intermediary; visiting columbiathreadneedle.com/us; or searching the website of the Securities and Exchange Commission (SEC) at sec.gov. Information regarding how each fund voted proxies relating to portfolio securities is filed with the SEC by August 31st for the most recent 12-month period ending June 30th of that year, and is available without charge by visiting columbiathreadneedle.com/us; or searching the website of the SEC at sec.gov.
Each fund files a complete schedule of portfolio holdings with the SEC for the first and third quarters of each fiscal year on Form N-Q. Each fund's Form N-Q is available on the SEC's website at sec.gov and may be reviewed and copied at the SEC's Public Reference Room in Washington, D.C. Information on the operation of the Public Reference Room may be obtained by calling 800.SEC.0330. Each fund's complete schedule of portfolio holdings, as filed on Form N-Q, can also be obtained without charge, upon request, by calling 800.345.6611.
Annual Report 2015
47
Columbia Convertible Securities Fund
P.O. Box 8081
Boston, MA 02266-8081

This information is for use with concurrent or prior delivery of a fund prospectus. Please read and consider the investment objectives, risks, charges and expenses for any fund carefully before investing. For a prospectus and summary prospectus, which contains this and other important information about the Fund, go to columbiathreadneedle.com/us. The Fund is distributed by Columbia Management Investment Distributors, Inc., member FINRA, and managed by Columbia Management Investment Advisers, LLC.
Columbia Threadneedle Investments (Columbia Threadneedle) is the global brand name of the Columbia and Threadneedle group of companies.
All rights reserved. Columbia Management Investment Distributors, Inc., 225 Franklin Street, Boston, MA 02110-2804
© 2015 Columbia Management Investment Advisers, LLC.
columbiathreadneedle.com/us
ANN134_02_E01_(04/15)

ANNUAL REPORT
February 28, 2015

COLUMBIA LARGE CAP ENHANCED CORE FUND

 Dear Shareholder,
In a world that is changing faster than ever before, investors want asset managers who offer a global perspective while generating strong and sustainable returns. To that end, Columbia Management, in conjunction with its U.K.-based affiliate, Threadneedle Investments, has rebranded to Columbia Threadneedle Investments. The new global brand represents the combined capabilities, resources and reach of the global group, offering investors access to the best of both firms.
With a presence in 18 countries and more than 450 investment professionals*, our collective perspective and world view as Columbia Threadneedle Investments gives us deeper insight into what might affect the real-life financial outcomes clients are seeking. Putting our views into a global context enables us to build richer perspectives and create the right solutions, and provides us with enhanced capabilities to deliver consistent investment performance, which may ultimately lead to better investor outcomes.
As a result of the rebrand, you will begin to see our new logo and colors reflected in printed materials, such as this shareholder report, as well as on our new website — columbiathreadneedle.com/us. We encourage you to visit us online and view a new video on the "About Us" tab that speaks to the strength of the firm.
While we are introducing a new brand, in many ways, the investment company you know well has not changed. The following remain in effect:
n Fund and strategy names
n Established investment teams, philosophies and processes
n Account services, features, servicing phone numbers and mailing addresses
n Columbia Management Investment Distributors as distributor and Columbia Management Investment Advisers as investment adviser
We recognize that the money we manage represents the hard work and savings of people like you, and that everyone has different ambitions and different definitions of success. Investors have varying goals — funding their children's education, enjoying their retirement, putting money aside for unexpected events, and more. Whatever your ambitions, we believe our wide range of investment products and solutions can help give you confidence that you will reach your goals.
The world is constantly changing, but our priority remains the same: to help you secure your finances, meet your goals and achieve success. Thank you for your continued investment with us. Our service representatives are available at 800.345.6611 to help with any questions.
Sincerely,

Christopher O. Petersen
President, Columbia Funds
Investors should consider the investment objectives, risks, charges and expenses of a mutual fund carefully before investing. For a free prospectus and summary prospectus, which contains this and other important information about a fund, visit columbiathreadneedle.com/us. The prospectus should be read carefully before investing.
* Source: Ameriprise as of December 1, 2014
Columbia Funds are distributed by Columbia Management Investment Distributors, Inc., member FINRA, and managed by Columbia Management Investment Advisers, LLC.
© 2015 Columbia Management Investment Advisers, LLC. All rights reserved.
COLUMBIA LARGE CAP ENHANCED CORE FUND
Performance Overview | | | 2 | | |
Manager Discussion of Fund Performance | | | 4 | | |
Understanding Your Fund's Expenses | | | 7 | | |
Portfolio of Investments | | | 8 | | |
Statement of Assets and Liabilities | | | 14 | | |
Statement of Operations | | | 16 | | |
Statement of Changes in Net Assets | | | 17 | | |
Financial Highlights | | | 19 | | |
Notes to Financial Statements | | | 25 | | |
Report of Independent Registered
Public Accounting Firm | | | 33 | | |
Federal Income Tax Information | | | 34 | | |
Trustees and Officers | | | 35 | | |
Important Information About This Report | | | 41 | | |
Fund Investment Manager
Columbia Management Investment
Advisers, LLC
225 Franklin Street
Boston, MA 02110
Fund Distributor
Columbia Management Investment
Distributors, Inc.
225 Franklin Street
Boston, MA 02110
Fund Transfer Agent
Columbia Management Investment
Services Corp.
P.O. Box 8081
Boston, MA 02266-8081
For more information about any of the funds, please visit columbiathreadneedle.com/us or call 800.345.6611. Customer Service Representatives are available to answer your questions Monday through Friday from 8 a.m. to 7 p.m. Eastern time.
The views expressed in this report reflect the current views of the respective parties. These views are not guarantees of future performance and involve certain risks, uncertainties and assumptions that are difficult to predict, so actual outcomes and results may differ significantly from the views expressed. These views are subject to change at any time based upon economic, market or other conditions and the respective parties disclaim any responsibility to update such views. These views may not be relied on as investment advice and, because investment decisions for a Columbia fund are based on numerous factors, may not be relied on as an indication of trading intent on behalf of any particular Columbia fund. References to specific securities should not be construed as a recommendation or investment advice.
COLUMBIA LARGE CAP ENHANCED CORE FUND
Performance Summary
n Columbia Large Cap Enhanced Core Fund (the Fund) Class A shares returned 18.60% for the 12-month period that ended February 28, 2015.
n The Fund outperformed its benchmark, the S&P 500 Index, which returned 15.51% for the same time period.
n Stock selection generally accounted for the Fund's performance advantage over its benchmark during the period.
Average Annual Total Returns (%) (for period ended February 28, 2015)
| | | Inception | | 1 Year | | 5 Years | | 10 Years | |
Class A | | 07/31/96 | | | 18.60 | | | | 17.05 | | | | 8.14 | | |
Class I* | | 09/27/10 | | | 19.09 | | | | 17.43 | | | | 8.32 | | |
Class R* | | 01/23/06 | | | 18.30 | | | | 16.77 | | | | 7.87 | | |
Class R5* | | 06/25/14 | | | 18.94 | | | | 17.11 | | | | 8.17 | | |
Class Y* | | 07/15/09 | | | 19.08 | | | | 17.49 | | | | 8.37 | | |
Class Z | | 07/31/96 | | | 18.92 | | | | 17.35 | | | | 8.42 | | |
S&P 500 Index | | | | | 15.51 | | | | 16.18 | | | | 7.99 | | |
All results shown assume reinvestment of distributions during the period. Returns do not reflect the deduction of taxes that a shareholder may pay on Fund distributions or on the redemption of Fund shares. Performance results reflect the effect of any fee waivers or reimbursements of Fund expenses by Columbia Management Investment Advisers, LLC and/or any of its affiliates. Absent these fee waivers or expense reimbursement arrangements, performance results would have been lower.
The performance information shown represents past performance and is not a guarantee of future results. The investment return and principal value of your investment will fluctuate so that your shares, when redeemed, may be worth more or less than their original cost. Current performance may be lower or higher than the performance information shown. You may obtain performance information current to the most recent month-end by contacting your financial intermediary, visiting columbiathreadneedle.com/us or calling 800.345.6611.
*The returns shown for periods prior to the share class inception date (including returns for the Life of the Fund, if shown, which are since Fund inception) include the returns of the Fund's oldest share class. Since the Fund launched more than one share class at its inception, Class A shares were used. These returns are adjusted to reflect any higher class-related operating expenses of the newer share classes, as applicable. Please visit columbiathreadneedle.com/us/investment-products/mutual-funds/appended-performance for more information.
The S&P 500 Index, an unmanaged index, measures the performance of 500 widely held, large-capitalization U.S. stocks and is frequently used as a general measure of market performance.
Indices are not available for investment, are not professionally managed and do not reflect sales charges, fees, brokerage commissions, taxes or other expenses of investing. Securities in the Fund may not match those in an index.
Annual Report 2015
2
COLUMBIA LARGE CAP ENHANCED CORE FUND
PERFORMANCE OVERVIEW (continued)
Performance of a Hypothetical $10,000 Investment (March 1, 2005 – February 28, 2015)
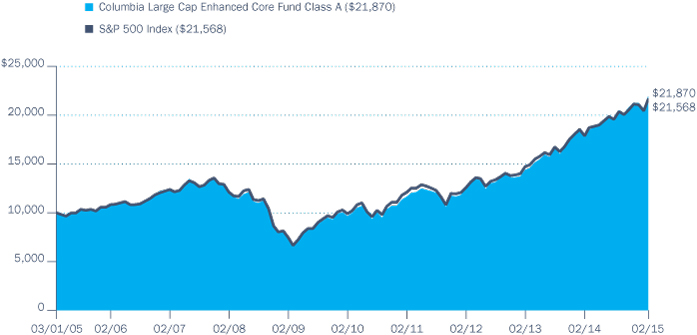
The chart above shows the change in value of a hypothetical $10,000 investment in Class A shares of Columbia Large Cap Enhanced Core Fund during the stated time period, and does not reflect the deduction of taxes that a shareholder may pay on Fund distributions or on the redemption of Fund shares.
Annual Report 2015
3
COLUMBIA LARGE CAP ENHANCED CORE FUND
MANAGER DISCUSSION OF FUND PERFORMANCE
Portfolio Management
Brian Condon, CFA
Peter Albanese
Morningstar Style BoxTM
The Morningstar Style BoxTM is based on a fund's portfolio holdings. For equity funds, the vertical axis shows the market capitalization of the stocks owned, and the horizontal axis shows investment style (value, blend, or growth). Information shown is based on the most recent data provided by Morningstar.
©2015 Morningstar, Inc. All rights reserved. The Morningstar information contained herein: (1) is proprietary to Morningstar and/or its content providers; (2) may not be copied or distributed; and (3) is not warranted to be accurate, complete or timely. Neither Morningstar nor its content providers are responsible for any damages or losses arising from any use of this information.
Top Ten Holdings (%)
(At February 28, 2015) | |
Apple, Inc. | | | 4.9 | | |
Microsoft Corp. | | | 2.7 | | |
Johnson & Johnson | | | 2.3 | | |
Pfizer, Inc. | | | 2.0 | | |
Berkshire Hathaway, Inc.,
Class B | | | 1.9 | | |
JPMorgan Chase & Co. | | | 1.9 | | |
Home Depot, Inc. (The) | | | 1.7 | | |
Cisco Systems, Inc. | | | 1.7 | | |
Merck & Co., Inc. | | | 1.6 | | |
Comcast Corp., Class A | | | 1.6 | | |
Percentages indicated are based upon total investments (excluding Money Market Funds and short term cash equivalents).
For further detail about these holdings, please refer to the section entitled "Portfolio of Investments."
Fund holdings are as of the date given, are subject to change at any time, and are not recommendations to buy or sell any security.
For the 12-month period that ended February 28, 2015, the Fund's Class A shares returned 18.60%. The Fund outperformed its benchmark, the S&P 500 Index, which returned 15.51% during the same time period. Stock selection across a range of sectors generally accounted for the Fund's performance advantage relative to the benchmark. Sector allocation modestly detracted from relative results. Overall, we seek to enhance returns relative to the benchmark through stock selection and not sector allocation.
Stocks Climbed as U.S. Economy Strengthened
After a cold and difficult winter brought many parts of the United States to a standstill early in 2014, the pace of U.S. economic growth picked up and good news appeared in most sectors. The labor market added 267,000 new jobs monthly, on average, during the 12-month period ended February 28, 2015. Solid new job growth drove the unemployment rate down to 5.5%, and prospects for higher wages generally buoyed consumer confidence during the period. Manufacturing activity remained solid, as capacity utilization rose to a post-recovery high. However, another stormy winter in the Northeast and Midwest nipped growth early in 2015. Manufacturing activity and consumer confidence slipped as harsh weather weighed on short-term expectations. The housing market's recovery was restrained by both periods of bad weather, tighter borrowing standards, rising prices and higher mortgage rates.
Investors responded favorably to the generally good economic news. However, concerns about increased global tensions, uncertainty about the Federal Reserve's (the Fed's) next move and sinking oil prices resulted in bouts of volatility that became more pronounced as the period wore on. The Fed spent 2014 winding down its monthly bond purchases, ending its program of quantitative easing in October, and suggested that it would raise short-term interest rates sometime in 2015. However, the timing of that move remained unclear, especially as some weaker data appeared in the final months of the period. In this environment, interest rates dropped sharply. The yield on the 10-year U.S. Treasury bond, which started the period at 2.6%, dropped to 2.0%, having traded even lower in the final months of the period. Large company stocks were the strongest equity market performers, while small cap stocks pulled up the rear. Within the benchmark, lower beta (less volatile) stocks outperformed higher beta stocks by approximately 14 percentage points. The quintile of stocks with the greatest growth characteristics outperformed those that were more value-oriented by approximately 12 percentage points. Stocks of companies with the least exposure to leverage outperformed higher leveraged companies by five percentage points and stocks ranked in the top quintile by momentum outperformed those ranked in the bottom quintile by more than 10 percentage points.
Stock Selection Models Aided Results
We divide the metrics for our stock selection model into three broad categories: valuation (fundamental measures, such as earnings and cash flow relative to market values), catalyst (price momentum and business momentum) and quality (quality of earnings and financial strength). During
Annual Report 2015
4
COLUMBIA LARGE CAP ENHANCED CORE FUND
MANAGER DISCUSSION OF FUND PERFORMANCE (continued)
this 12-month period, the stocks that we consider to have the strongest valuations and appeared inexpensive relative to their peers (top 20% of stocks in the benchmark, ranked using our aggregate quality score) outperformed stocks with weaker valuations by approximately seven percentage points. Given the market's preference for quality during the period, stocks in the portfolio that were ranked in the top quintile by our quality measurements outperformed lower quality stocks by approximately seven percentage points. Stocks scored on our catalyst measures were mixed.
Security Selection Drove Performance
Security selection was the primary contributor to performance relative to the benchmark, most notably within information technology, energy, industrials and consumer staples. In the information technology sector, software and hardware storage & peripherals did well during the period. Within software, game developer Electronic Arts delivered on earnings, largely driven by better-than-expected growth in high-margin digital revenues. A strong holiday season for video game sales boosted the company's results. Technology hardware leader Apple enjoyed another strong year. Both Electronic Arts and Apple were overweight in the portfolio relative to the benchmark. The Fund's performance advantage in the energy sector was the result of prudent stock selection in a period of sharply falling prices. Energy results were negative, but the Fund's energy holdings held up considerably better than the benchmark's return in the sector. Within industrials, airlines and aerospace & defense names were solid contributors to returns. Southwest Airlines, which was a top contributor in the last fiscal year, benefited from falling energy costs. The company continues to perform well following the successful integration of AirTran, which has helped increase revenues and profits. An expiring regulation that will allow Southwest to fly to international destinations was also viewed favorably by investors. In the consumer staples sector, food and staples retailing posted solid gains. Grocery store Kroger was a standout performer as the company continued to gain market share and beat earnings estimates. Lower gasoline prices had a favorable impact on profit margins as well.
Sector allocation detracted modestly from relative results during the period, primarily in the telecommunications services sector where the Fund was underweight in several strong performers. Financials also detracted somewhat from relative returns. An underweight in real estate investment trusts, which were strong performers for the period, detracted slightly from returns, as did security selection within the group. An underweight in Berkshire Hathaway Class B shares also detracted from results relative to the benchmark. The Fund's weakest performers for the period were from a range of sectors, but all were portfolio overweights relative to the benchmark. Priceline, which generates a substantial portion of its revenues from Europe, struggled as the U.S. dollar strengthened against major currencies. Our quantitative scoring of the company changed during the period, which led us to sell the position from the Fund. In the energy sector, which was hurt by plummeting commodity prices, National Oilwell Varco and Marathon Oil struggled. Emerson Electric
Portfolio Breakdown (%)
(At February 28, 2015) | |
Common Stocks | | | 96.1 | | |
Consumer Discretionary | | | 11.6 | | |
Consumer Staples | | | 9.1 | | |
Energy | | | 7.7 | | |
Financials | | | 15.8 | | |
Health Care | | | 14.3 | | |
Industrials | | | 9.8 | | |
Information Technology | | | 19.4 | | |
Materials | | | 3.3 | | |
Telecommunication Services | | | 1.8 | | |
Utilities | | | 3.3 | | |
Money Market Funds | | | 3.9 | | |
Total | | | 100.0 | | |
Percentages indicated are based upon total investments. The Fund's portfolio composition is subject to change.
Investment Risks
Market risk may affect a single issuer, sector of the economy, industry or the market as a whole. Investing in derivatives is a specialized activity that involves special risks, which may result in significant losses. The Fund's net value will generally decline when the performance of its targeted index declines. See the Fund's prospectus for more information on these and other risks.
Annual Report 2015
5
COLUMBIA LARGE CAP ENHANCED CORE FUND
MANAGER DISCUSSION OF FUND PERFORMANCE (continued)
declined on falling energy expenditures and a stronger dollar. Caterpillar's revenue exposure to oil, gas and other natural resources put the company and its earnings under pressure.
Portfolio Activity
During the 12-month period, we established new positions in several names, including 3M, Boeing, Electronic Arts, Walt Disney and Corning. We liquidated positions in QUALCOMM, Priceline, Goldman Sachs, Phillips 66 and Lockheed Martin, among others. We used S&P 500 Index futures to equitize the Fund's cash position, which modestly trimmed relative results. The index has no cash position.
Looking Forward
In the current economic environment, we plan to maintain our investment discipline and continue to seek to identify stocks that we believe have the potential to outperform within each sector. We also currently plan to seek to minimize sector weight differences between the Fund and its investment benchmark. We plan to continue to favor stocks with attributes considered most important in the Fund's stock selection model: companies with attractive valuations relative to their peers, companies with strong business and market momentum and companies with good earnings quality and financial strength. Over the long run, we have found that stocks with these characteristics have tended to outperform their peers in different macroeconomic environments.
Our strategy is based on individual quantitative stock selection. Consequently, we do not rely on macroeconomic scenarios or market outlooks to make security selections. We do not try to predict when equities, as an asset class, will perform well or when they will perform poorly. Instead, we seek to keep the Fund substantially invested at all times.
Annual Report 2015
6
COLUMBIA LARGE CAP ENHANCED CORE FUND
UNDERSTANDING YOUR FUND'S EXPENSES
(Unaudited)
As an investor, you incur two types of costs. There are transaction costs, which generally include sales charges on purchases and may include redemption fees. There are also ongoing costs, which generally include management fees, distribution and/or service fees, and other fund expenses. The following information is intended to help you understand your ongoing costs (in dollars) of investing in the Fund and to help you compare these costs with the ongoing costs of investing in other mutual funds.
Analyzing Your Fund's Expenses
To illustrate these ongoing costs, we have provided examples and calculated the expenses paid by investors in each share class of the Fund during the period. The actual and hypothetical information in the table is based on an initial investment of $1,000 at the beginning of the period indicated and held for the entire period. Expense information is calculated two ways and each method provides you with different information. The amount listed in the "Actual" column is calculated using the Fund's actual operating expenses and total return for the period. You may use the Actual information, together with the amount invested, to estimate the expenses that you paid over the period. Simply divide your account value by $1,000 (for example, an $8,600 account value divided by $1,000 = 8.6), then multiply the results by the expenses paid during the period under the "Actual" column. The amount listed in the "Hypothetical" column assumes a 5% annual rate of return before expenses (which is not the Fund's actual return) and then applies the Fund's actual expense ratio for the period to the hypothetical return. You should not use the hypothetical account values and expenses to estimate either your actual account balance at the end of the period or the expenses you paid during the period. See "Compare With Other Funds" below for details on how to use the hypothetical data.
Compare With Other Funds
Since all mutual funds are required to include the same hypothetical calculations about expenses in shareholder reports, you can use this information to compare the ongoing cost of investing in the Fund with other funds. To do so, compare the hypothetical example with the 5% hypothetical examples that appear in the shareholder reports of other funds. As you compare hypothetical examples of other funds, it is important to note that hypothetical examples are meant to highlight the ongoing costs of investing in a fund only and do not reflect any transaction costs, such as sales charges, or redemption or exchange fees. Therefore, the hypothetical calculations are useful in comparing ongoing costs only, and will not help you determine the relative total costs of owning different funds. If transaction costs were included in these calculations, your costs would be higher.
September 1, 2014 – February 28, 2015
| | | Account Value at the Beginning
of the Period ($) | | Account Value at the End of the
Period ($) | | Expenses Paid During the
Period ($) | | Fund's Annualized
Expense Ratio (%) | |
| | | Actual | | Hypothetical | | Actual | | Hypothetical | | Actual | | Hypothetical | | Actual | |
Class A | | | 1,000.00 | | | | 1,000.00 | | | | 1,069.00 | | | | 1,020.44 | | | | 4.64 | | | | 4.53 | | | | 0.90 | | |
Class I | | | 1,000.00 | | | | 1,000.00 | | | | 1,070.90 | | | | 1,022.44 | | | | 2.58 | | | | 2.52 | | | | 0.50 | | |
Class R | | | 1,000.00 | | | | 1,000.00 | | | | 1,067.50 | | | | 1,019.20 | | | | 5.93 | | | | 5.79 | | | | 1.15 | | |
Class R5 | | | 1,000.00 | | | | 1,000.00 | | | | 1,071.20 | | | | 1,022.19 | | | | 2.84 | | | | 2.77 | | | | 0.55 | | |
Class Y | | | 1,000.00 | | | | 1,000.00 | | | | 1,070.90 | | | | 1,022.44 | | | | 2.58 | | | | 2.52 | | | | 0.50 | | |
Class Z | | | 1,000.00 | | | | 1,000.00 | | | | 1,070.70 | | | | 1,021.69 | | | | 3.36 | | | | 3.28 | | | | 0.65 | | |
Expenses paid during the period are equal to the annualized expense ratio for each class as indicated above, multiplied by the average account value over the period and then multiplied by the number of days in the Fund's most recent fiscal half year and divided by 365.
Expenses do not include fees and expenses incurred indirectly by the Fund from its investment in underlying funds, including affiliated and non-affiliated pooled investment vehicles, such as mutual funds and exchange-traded funds.
Had Columbia Management Investment Advisers, LLC and/or certain of its affiliates not waived/reimbursed certain fees and expenses, account value at the end of the period would have been reduced.
Annual Report 2015
7
COLUMBIA LARGE CAP ENHANCED CORE FUND
PORTFOLIO OF INVESTMENTS
February 28, 2015
(Percentages represent value of investments compared to net assets)
Common Stocks 98.4%
Issuer | | Shares | | Value ($) | |
CONSUMER DISCRETIONARY 11.9% | |
Auto Components 1.0% | |
Delphi Automotive PLC | | | 55,400 | | | | 4,367,736 | | |
Hotels, Restaurants & Leisure 1.2% | |
Darden Restaurants, Inc. | | | 56,700 | | | | 3,628,800 | | |
Marriott International, Inc., Class A | | | 10,600 | | | | 880,860 | | |
Wyndham Worldwide Corp. | | | 12,600 | | | | 1,152,648 | | |
Total | | | | | 5,662,308 | | |
Household Durables 0.1% | |
Whirlpool Corp. | | | 2,300 | | | | 487,485 | | |
Internet & Catalog Retail 0.8% | |
Expedia, Inc. | | | 40,000 | | | | 3,670,000 | | |
Media 4.1% | |
Comcast Corp., Class A | | | 118,400 | | | | 7,030,592 | | |
DIRECTV(a) | | | 31,500 | | | | 2,790,900 | | |
News Corp., Class A(a) | | | 221,300 | | | | 3,822,958 | | |
Time Warner, Inc. | | | 6,000 | | | | 491,160 | | |
Walt Disney Co. (The) | | | 43,300 | | | | 4,506,664 | | |
Total | | | | | 18,642,274 | | |
Specialty Retail 4.5% | |
Best Buy Co., Inc. | | | 103,300 | | | | 3,935,730 | | |
Home Depot, Inc. (The) | | | 67,800 | | | | 7,780,050 | | |
L Brands, Inc. | | | 33,100 | | | | 3,040,566 | | |
Lowe's Companies, Inc. | | | 78,200 | | | | 5,793,838 | | |
Total | | | | | 20,550,184 | | |
Textiles, Apparel & Luxury Goods 0.2% | |
VF Corp. | | | 12,200 | | | | 935,252 | | |
Total Consumer Discretionary | | | | | 54,315,239 | | |
CONSUMER STAPLES 9.3% | |
Beverages 1.2% | |
Coca-Cola Co. (The) | | | 16,200 | | | | 701,460 | | |
Dr. Pepper Snapple Group, Inc. | | | 48,200 | | | | 3,797,678 | | |
PepsiCo, Inc. | | | 11,400 | | | | 1,128,372 | | |
Total | | | | | 5,627,510 | | |
Food & Staples Retailing 3.0% | |
CVS Health Corp. | | | 48,800 | | | | 5,068,856 | | |
Kroger Co. (The) | | | 67,200 | | | | 4,781,280 | | |
Wal-Mart Stores, Inc. | | | 44,100 | | | | 3,701,313 | | |
Total | | | | | 13,551,449 | | |
Common Stocks (continued)
Issuer | | Shares | | Value ($) | |
Food Products 1.6% | |
Archer-Daniels-Midland Co. | | | 80,700 | | | | 3,863,916 | | |
Tyson Foods, Inc., Class A | | | 84,000 | | | | 3,470,040 | | |
Total | | | | | 7,333,956 | | |
Household Products 0.5% | |
Procter & Gamble Co. (The) | | | 26,500 | | | | 2,255,945 | | |
Tobacco 3.0% | |
Altria Group, Inc. | | | 117,200 | | | | 6,597,188 | | |
Philip Morris International, Inc. | | | 74,900 | | | | 6,213,704 | | |
Reynolds American, Inc. | | | 9,600 | | | | 725,952 | | |
Total | | | | | 13,536,844 | | |
Total Consumer Staples | | | | | 42,305,704 | | |
ENERGY 7.8% | |
Energy Equipment & Services 0.8% | |
National Oilwell Varco, Inc. | | | 70,500 | | | | 3,831,675 | | |
Oil, Gas & Consumable Fuels 7.0% | |
Chevron Corp. | | | 41,200 | | | | 4,395,216 | | |
ConocoPhillips | | | 78,000 | | | | 5,085,600 | | |
EOG Resources, Inc. | | | 39,200 | | | | 3,517,024 | | |
Exxon Mobil Corp. | | | 64,900 | | | | 5,746,246 | | |
Hess Corp. | | | 53,000 | | | | 3,979,240 | | |
Marathon Oil Corp. | | | 73,700 | | | | 2,053,282 | | |
Tesoro Corp. | | | 24,100 | | | | 2,213,344 | | |
Valero Energy Corp. | | | 79,500 | | | | 4,904,355 | | |
Total | | | | | 31,894,307 | | |
Total Energy | | | | | 35,725,982 | | |
FINANCIALS 16.1% | |
Banks 4.8% | |
Bank of America Corp. | | | 37,400 | | | | 591,294 | | |
Citigroup, Inc. | | | 129,900 | | | | 6,809,358 | | |
JPMorgan Chase & Co. | | | 139,600 | | | | 8,554,688 | | |
KeyCorp | | | 209,200 | | | | 2,914,156 | | |
Wells Fargo & Co. | | | 51,600 | | | | 2,827,164 | | |
Total | | | | | 21,696,660 | | |
Capital Markets 1.5% | |
BlackRock, Inc. | | | 7,750 | | | | 2,878,505 | | |
Invesco Ltd. | | | 98,900 | | | | 3,982,703 | | |
Total | | | | | 6,861,208 | | |
The accompanying Notes to Financial Statements are an integral part of this statement.
Annual Report 2015
8
COLUMBIA LARGE CAP ENHANCED CORE FUND
PORTFOLIO OF INVESTMENTS (continued)
February 28, 2015
Common Stocks (continued)
Issuer | | Shares | | Value ($) | |
Consumer Finance 1.8% | |
Capital One Financial Corp. | | | 56,500 | | | | 4,447,115 | | |
Navient Corp. | | | 173,200 | | | | 3,706,480 | | |
Total | | | | | 8,153,595 | | |
Diversified Financial Services 2.7% | |
Berkshire Hathaway, Inc., Class B(a) | | | 58,400 | | | | 8,608,744 | | |
Moody's Corp. | | | 36,500 | | | | 3,538,310 | | |
Total | | | | | 12,147,054 | | |
Insurance 2.7% | |
Aon PLC | | | 22,400 | | | | 2,248,064 | | |
Assurant, Inc. | | | 22,400 | | | | 1,372,448 | | |
Lincoln National Corp. | | | 69,700 | | | | 4,017,508 | | |
MetLife, Inc. | | | 96,300 | | | | 4,894,929 | | |
Total | | | | | 12,532,949 | | |
Real Estate Investment Trusts (REITs) 2.6% | |
Host Hotels & Resorts, Inc. | | | 150,200 | | | | 3,154,200 | | |
Public Storage | | | 19,900 | | | | 3,924,678 | | |
Simon Property Group, Inc. | | | 26,300 | | | | 5,006,468 | | |
Total | | | | | 12,085,346 | | |
Total Financials | | | | | 73,476,812 | | |
HEALTH CARE 14.7% | |
Biotechnology 2.9% | |
Biogen Idec, Inc.(a) | | | 7,500 | | | | 3,071,925 | | |
Celgene Corp.(a) | | | 26,900 | | | | 3,269,157 | | |
Gilead Sciences, Inc.(a) | | | 49,800 | | | | 5,155,794 | | |
Vertex Pharmaceuticals, Inc.(a) | | | 13,900 | | | | 1,660,077 | | |
Total | | | | | 13,156,953 | | |
Health Care Equipment & Supplies 1.6% | |
CR Bard, Inc. | | | 22,900 | | | | 3,873,306 | | |
Medtronic PLC | | | 41,500 | | | | 3,219,985 | | |
Total | | | | | 7,093,291 | | |
Health Care Providers & Services 3.1% | |
Aetna, Inc. | | | 12,500 | | | | 1,244,375 | | |
AmerisourceBergen Corp. | | | 38,700 | | | | 3,976,812 | | |
Anthem, Inc. | | | 34,100 | | | | 4,993,945 | | |
Cardinal Health, Inc. | | | 47,000 | | | | 4,135,530 | | |
Total | | | | | 14,350,662 | | |
Common Stocks (continued)
Issuer | | Shares | | Value ($) | |
Pharmaceuticals 7.1% | |
AbbVie, Inc. | | | 55,800 | | | | 3,375,900 | | |
Eli Lilly & Co. | | | 39,300 | | | | 2,757,681 | | |
Johnson & Johnson | | | 99,000 | | | | 10,148,490 | | |
Merck & Co., Inc. | | | 122,400 | | | | 7,165,296 | | |
Pfizer, Inc. | | | 255,100 | | | | 8,755,032 | | |
Total | | | | | 32,202,399 | | |
Total Health Care | | | | | 66,803,305 | | |
INDUSTRIALS 10.0% | |
Aerospace & Defense 4.2% | |
Boeing Co. (The) | | | 38,400 | | | | 5,792,640 | | |
General Dynamics Corp. | | | 31,500 | | | | 4,371,570 | | |
Honeywell International, Inc. | | | 8,500 | | | | 873,630 | | |
L-3 Communications Holdings, Inc. | | | 25,300 | | | | 3,274,579 | | |
Northrop Grumman Corp. | | | 28,200 | | | | 4,673,022 | | |
Total | | | | | 18,985,441 | | |
Air Freight & Logistics 1.9% | |
CH Robinson Worldwide, Inc. | | | 47,900 | | | | 3,558,970 | | |
United Parcel Service, Inc., Class B | | | 49,700 | | | | 5,055,981 | | |
Total | | | | | 8,614,951 | | |
Airlines 0.2% | |
Southwest Airlines Co. | | | 15,300 | | | | 661,572 | | |
Electrical Equipment 1.3% | |
Emerson Electric Co. | | | 65,800 | | | | 3,811,136 | | |
Rockwell Automation, Inc. | | | 17,700 | | | | 2,071,608 | | |
Total | | | | | 5,882,744 | | |
Industrial Conglomerates 1.9% | |
3M Co. | | | 36,000 | | | | 6,071,400 | | |
General Electric Co. | | | 107,300 | | | | 2,788,727 | | |
Total | | | | | 8,860,127 | | |
Machinery 0.4% | |
Caterpillar, Inc. | | | 24,100 | | | | 1,997,890 | | |
Professional Services 0.1% | |
Equifax, Inc. | | | 6,800 | | | | 634,916 | | |
Total Industrials | | | | | 45,637,641 | | |
INFORMATION TECHNOLOGY 19.9% | |
Communications Equipment 1.7% | |
Cisco Systems, Inc. | | | 254,500 | | | | 7,510,295 | | |
The accompanying Notes to Financial Statements are an integral part of this statement.
Annual Report 2015
9
COLUMBIA LARGE CAP ENHANCED CORE FUND
PORTFOLIO OF INVESTMENTS (continued)
February 28, 2015
Common Stocks (continued)
Issuer | | Shares | | Value ($) | |
Electronic Equipment, Instruments & Components 0.9% | |
Corning, Inc. | | | 172,200 | | | | 4,201,680 | | |
Internet Software & Services 2.8% | |
Facebook, Inc., Class A(a) | | | 53,700 | | | | 4,240,689 | | |
Google, Inc., Class A(a) | | | 3,625 | | | | 2,039,534 | | |
Google, Inc., Class C(a) | | | 3,775 | | | | 2,107,960 | | |
VeriSign, Inc.(a) | | | 64,600 | | | | 4,135,692 | | |
Total | | | | | 12,523,875 | | |
IT Services 2.0% | |
International Business Machines Corp. | | | 2,000 | | | | 323,880 | | |
MasterCard, Inc., Class A | | | 63,400 | | | | 5,714,242 | | |
Visa, Inc., Class A | | | 11,600 | | | | 3,147,196 | | |
Total | | | | | 9,185,318 | | |
Semiconductors & Semiconductor Equipment 1.8% | |
Broadcom Corp., Class A | | | 65,900 | | | | 2,980,657 | | |
Intel Corp. | | | 23,700 | | | | 788,025 | | |
NVIDIA Corp. | | | 172,500 | | | | 3,805,350 | | |
Xilinx, Inc. | | | 18,900 | | | | 800,793 | | |
Total | | | | | 8,374,825 | | |
Software 5.2% | |
Electronic Arts, Inc.(a) | | | 79,600 | | | | 4,551,528 | | |
Microsoft Corp.(b) | | | 278,000 | | | | 12,190,300 | | |
Oracle Corp. | | | 157,600 | | | | 6,906,032 | | |
Total | | | | | 23,647,860 | | |
Technology Hardware, Storage & Peripherals 5.5% | |
Apple, Inc. | | | 171,175 | | | | 21,989,140 | | |
EMC Corp. | | | 73,100 | | | | 2,115,514 | | |
Hewlett-Packard Co. | | | 28,400 | | | | 989,456 | | |
Total | | | | | 25,094,110 | | |
Total Information Technology | | | | | 90,537,963 | | |
MATERIALS 3.3% | |
Chemicals 1.0% | |
LyondellBasell Industries NV, Class A | | | 53,300 | | | | 4,579,003 | | |
Containers & Packaging 0.8% | |
Ball Corp. | | | 49,900 | | | | 3,578,329 | | |
Metals & Mining 0.6% | |
Alcoa, Inc. | | | 204,600 | | | | 3,026,034 | | |
Common Stocks (continued)
Issuer | | Shares | | Value ($) | |
Paper & Forest Products 0.9% | |
International Paper Co. | | | 70,900 | | | | 3,999,469 | | |
Total Materials | | | | | 15,182,835 | | |
TELECOMMUNICATION SERVICES 2.0% | |
Diversified Telecommunication Services 2.0% | |
AT&T, Inc. | | | 99,300 | | | | 3,431,808 | | |
CenturyLink, Inc. | | | 96,000 | | | | 3,634,560 | | |
Frontier Communications Corp. | | | 64,900 | | | | 517,902 | | |
Verizon Communications, Inc. | | | 29,800 | | | | 1,473,610 | | |
Total | | | | | 9,057,880 | | |
Total Telecommunication Services | | | | | 9,057,880 | | |
UTILITIES 3.4% | |
Electric Utilities 1.6% | |
Edison International | | | 55,900 | | | | 3,591,575 | | |
Entergy Corp. | | | 43,800 | | | | 3,482,538 | | |
Exelon Corp. | | | 11,400 | | | | 386,688 | | |
Total | | | | | 7,460,801 | | |
Independent Power and Renewable Electricity Producers 0.9% | |
AES Corp. (The) | | | 295,700 | | | | 3,835,229 | | |
Multi-Utilities 0.9% | |
Public Service Enterprise Group, Inc. | | | 95,300 | | | | 4,008,318 | | |
Total Utilities | | | | | 15,304,348 | | |
Total Common Stocks
(Cost: $349,266,050) | | | | | 448,347,709 | | |
Money Market Funds 4.0%
| | | Shares | | Value ($) | |
Columbia Short-Term Cash Fund,
0.118%(c)(d) | | | 18,051,769 | | | | 18,051,769 | | |
Total Money Market Funds
(Cost: $18,051,769) | | | | | 18,051,769 | | |
Total Investments
(Cost: $367,317,819) | | | | | 466,399,478 | | |
Other Assets & Liabilities, Net | | | | | (10,817,378 | ) | |
Net Assets | | | | | 455,582,100 | | |
The accompanying Notes to Financial Statements are an integral part of this statement.
Annual Report 2015
10
COLUMBIA LARGE CAP ENHANCED CORE FUND
PORTFOLIO OF INVESTMENTS (continued)
February 28, 2015
Investments in Derivatives
Futures Contracts Outstanding at February 28, 2015
At February 28, 2015, securities totaling $1,162,025 were pledged as collateral to cover initial margin requirements on open futures contracts.
Long Futures Contracts Outstanding
Contract Description | | Number of
Contracts | | Trading
Currency | | Notional
Market
Value ($) | | Expiration
Date | | Unrealized
Appreciation ($) | | Unrealized
Depreciation ($) | |
S&P 500 Index | | | 15 | | | | USD | | | | 7,885,500 | | | 03/2015 | | | 373,873 | | | | — | | |
Notes to Portfolio of Investments
(a) Non-income producing.
(b) This security, or a portion of this security, has been pledged as collateral in connection with open futures contracts. These values are denoted within the Investments in Derivatives section of the Portfolio of Investments.
(c) The rate shown is the seven-day current annualized yield at February 28, 2015.
(d) As defined in the Investment Company Act of 1940, an affiliated company is one in which the Fund owns 5% or more of the company's outstanding voting securities, or a company which is under common ownership or control with the Fund. Holdings and transactions in these affiliated companies during the year ended February 28, 2015, are as follows:
Issuer | | Beginning
Cost ($) | | Purchase
Cost ($) | | Proceeds
From Sales ($) | | Ending
Cost ($) | | Dividends —
Affiliated
Issuers ($) | | Value ($) | |
Columbia Short-Term Cash Fund | | | 5,596,363 | | | | 196,484,219 | | | | (184,028,813 | ) | | | 18,051,769 | | | | 9,274 | | | | 18,051,769 | | |
Currency Legend
USD US Dollar
Fair Value Measurements
Generally accepted accounting principles (GAAP) require disclosure regarding the inputs and valuation techniques used to measure fair value and any changes in valuation inputs or techniques. In addition, investments shall be disclosed by major category.
The Fund categorizes its fair value measurements according to a three-level hierarchy that maximizes the use of observable inputs and minimizes the use of unobservable inputs by prioritizing that the most observable input be used when available. Observable inputs are those that market participants would use in pricing an investment based on market data obtained from sources independent of the reporting entity. Unobservable inputs are those that reflect the Fund's assumptions about the information market participants would use in pricing an investment. An investment's level within the fair value hierarchy is based on the lowest level of any input that is deemed significant to the asset or liability's fair value measurement. The input levels are not necessarily an indication of the risk or liquidity associated with investments at that level. For example, certain U.S. government securities are generally high quality and liquid, however, they are reflected as Level 2 because the inputs used to determine fair value may not always be quoted prices in an active market.
Fair value inputs are summarized in the three broad levels listed below:
> Level 1 — Valuations based on quoted prices for investments in active markets that the Fund has the ability to access at the measurement date (including NAV for open-end mutual funds). Valuation adjustments are not applied to Level 1 investments.
> Level 2 — Valuations based on other significant observable inputs (including quoted prices for similar securities, interest rates, prepayment speeds, credit risks, etc.).
> Level 3 — Valuations based on significant unobservable inputs (including the Fund's own assumptions and judgment in determining the fair value of investments).
The accompanying Notes to Financial Statements are an integral part of this statement.
Annual Report 2015
11
COLUMBIA LARGE CAP ENHANCED CORE FUND
PORTFOLIO OF INVESTMENTS (continued)
February 28, 2015
Fair Value Measurements (continued)
Inputs that are used in determining fair value of an investment may include price information, credit data, volatility statistics, and other factors. These inputs can be either observable or unobservable. The availability of observable inputs can vary between investments, and is affected by various factors such as the type of investment, and the volume and level of activity for that investment or similar investments in the marketplace. The inputs will be considered by the Investment Manager, along with any other relevant factors in the calculation of an investment's fair value. The Fund uses prices and inputs that are current as of the measurement date, which may include periods of market dislocations. During these periods, the availability of prices and inputs may be reduced for many investments. This condition could cause an investment to be reclassified between the various levels within the hierarchy.
Investments falling into the Level 3 category are primarily supported by quoted prices from brokers and dealers participating in the market for those investments. However, these may be classified as Level 3 investments due to lack of market transparency and corroboration to support these quoted prices. Additionally, valuation models may be used as the pricing source for any remaining investments classified as Level 3. These models may rely on one or more significant unobservable inputs and/or significant assumptions by the Investment Manager. Inputs used in valuations may include, but are not limited to, financial statement analysis, capital account balances, discount rates and estimated cash flows, and comparable company data.
Under the direction of the Fund's Board of Trustees (the Board), the Investment Manager's Valuation Committee (the Committee) is responsible for overseeing the valuation procedures approved by the Board. The Committee consists of voting and non-voting members from various groups within the Investment Manager's organization, including operations and accounting, trading and investments, compliance, risk management and legal.
The Committee meets at least monthly to review and approve valuation matters, which may include a description of specific valuation determinations, data regarding pricing information received from approved pricing vendors and brokers and the results of Board-approved valuation control policies and procedures (the Policies). The Policies address, among other things, instances when market quotations are or are not readily available, including recommendations of third party pricing vendors and a determination of appropriate pricing methodologies; events that require specific valuation determinations and assessment of fair value techniques; securities with a potential for stale pricing, including those that are illiquid, restricted, or in default; and the effectiveness of third party pricing vendors, including periodic reviews of vendors. The Committee meets more frequently, as needed, to discuss additional valuation matters, which may include the need to review back-testing results, review time-sensitive information or approve related valuation actions. The Committee reports to the Board, with members of the Committee meeting with the Board at each of its regularly scheduled meetings to discuss valuation matters and actions during the period, similar to those described earlier.
For investments categorized as Level 3, the Committee monitors information similar to that described above, which may include: (i) data specific to the issuer or comparable issuers, (ii) general market or specific sector news and (iii) quoted prices and specific or similar security transactions. The Committee considers this data and any changes from prior periods in order to assess the reasonableness of observable and unobservable inputs, any assumptions or internal models used to value those securities and changes in fair value. This data is also used to corroborate, when available, information received from approved pricing vendors and brokers. Various factors impact the frequency of monitoring this information (which may occur as often as daily). However, the Committee may determine that changes to inputs, assumptions and models are not required as a result of the monitoring procedures performed.
The following table is a summary of the inputs used to value the Fund's investments at February 28, 2015:
Description | | Level 1
Quoted Prices in Active
Markets for Identical
Assets ($) | | Level 2
Other Significant
Observable Inputs ($) | | Level 3
Significant
Unobservable Inputs ($) | | Total ($) | |
Equity Securities | |
Common Stocks | |
Consumer Discretionary | | | 54,315,239 | | | | — | | | | — | | | | 54,315,239 | | |
Consumer Staples | | | 42,305,704 | | | | — | | | | — | | | | 42,305,704 | | |
Energy | | | 35,725,982 | | | | — | | | | — | | | | 35,725,982 | | |
Financials | | | 73,476,812 | | | | — | | | | — | | | | 73,476,812 | | |
Health Care | | | 66,803,305 | | | | — | | | | — | | | | 66,803,305 | | |
Industrials | | | 45,637,641 | | | | — | | | | — | | | | 45,637,641 | | |
Information Technology | | | 90,537,963 | | | | — | | | | — | | | | 90,537,963 | | |
Materials | | | 15,182,835 | | | | — | | | | — | | | | 15,182,835 | | |
Telecommunication Services | | | 9,057,880 | | | | — | | | | — | | | | 9,057,880 | | |
Utilities | | | 15,304,348 | | | | — | | | | — | | | | 15,304,348 | | |
Total Equity Securities | | | 448,347,709 | | | | — | | | | — | | | | 448,347,709 | | |
The accompanying Notes to Financial Statements are an integral part of this statement.
Annual Report 2015
12
COLUMBIA LARGE CAP ENHANCED CORE FUND
PORTFOLIO OF INVESTMENTS (continued)
February 28, 2015
Fair Value Measurements (continued)
Description | | Level 1
Quoted Prices in Active
Markets for Identical
Assets ($) | | Level 2
Other Significant
Observable Inputs ($) | | Level 3
Significant
Unobservable Inputs ($) | | Total ($) | |
Mutual Funds | |
Money Market Funds | | | 18,051,769 | | | | — | | | | — | | | | 18,051,769 | | |
Total Mutual Funds | | | 18,051,769 | | | | — | | | | — | | | | 18,051,769 | | |
Investments in Securities | | | 466,399,478 | | | | — | | | | — | | | | 466,399,478 | | |
Derivatives | |
Assets | |
Futures Contracts | | | 373,873 | | | | — | | | | — | | | | 373,873 | | |
Total | | | 466,773,351 | | | | — | | | | — | | | | 466,773,351 | | |
See the Portfolio of Investments for all investment classifications not indicated in the table.
There were no transfers of financial assets between levels during the period.
Derivative instruments are valued at unrealized appreciation (depreciation).
The accompanying Notes to Financial Statements are an integral part of this statement.
Annual Report 2015
13
COLUMBIA LARGE CAP ENHANCED CORE FUND
STATEMENT OF ASSETS AND LIABILITIES
February 28, 2015
Assets | |
Investments, at value | |
Unaffiliated issuers (identified cost $349,266,050) | | $ | 448,347,709 | | |
Affiliated issuers (identified cost $18,051,769) | | | 18,051,769 | | |
Total investments (identified cost $367,317,819) | | | 466,399,478 | | |
Receivable for: | |
Capital shares sold | | | 416,140 | | |
Dividends | | | 1,019,643 | | |
Variation margin | | | 977 | | |
Expense reimbursement due from Investment Manager | | | 4,485 | | |
Prepaid expenses | | | 1,593 | | |
Other assets | | | 4,438 | | |
Total assets | | | 467,846,754 | | |
Liabilities | |
Payable for: | |
Investments purchased | | | 11,617,449 | | |
Capital shares purchased | | | 360,658 | | |
Variation margin | | | 63,504 | | |
Investment management fees | | | 7,992 | | |
Distribution and/or service fees | | | 908 | | |
Transfer agent fees | | | 70,021 | | |
Administration fees | | | 749 | | |
Compensation of board members | | | 105,632 | | |
Other expenses | | | 37,741 | | |
Total liabilities | | | 12,264,654 | | |
Net assets applicable to outstanding capital stock | | $ | 455,582,100 | | |
Represented by | |
Paid-in capital | | $ | 363,846,129 | | |
Undistributed net investment income | | | 3,899,926 | | |
Accumulated net realized loss | | | (11,619,487 | ) | |
Unrealized appreciation (depreciation) on: | |
Investments | | | 99,081,659 | | |
Futures contracts | | | 373,873 | | |
Total — representing net assets applicable to outstanding capital stock | | $ | 455,582,100 | | |
The accompanying Notes to Financial Statements are an integral part of this statement.
Annual Report 2015
14
COLUMBIA LARGE CAP ENHANCED CORE FUND
STATEMENT OF ASSETS AND LIABILITIES (continued)
February 28, 2015
Class A | |
Net assets | | $ | 85,261,311 | | |
Shares outstanding | | | 3,866,233 | | |
Net asset value per share | | $ | 22.05 | | |
Class I | |
Net assets | | $ | 12,521,793 | | |
Shares outstanding | | | 569,294 | | |
Net asset value per share | | $ | 22.00 | | |
Class R | |
Net assets | | $ | 23,413,977 | | |
Shares outstanding | | | 1,063,266 | | |
Net asset value per share | | $ | 22.02 | | |
Class R5 | |
Net assets | | $ | 423,869 | | |
Shares outstanding | | | 19,328 | | |
Net asset value per share | | $ | 21.93 | | |
Class Y | |
Net assets | | $ | 3,511,403 | | |
Shares outstanding | | | 159,531 | | |
Net asset value per share | | $ | 22.01 | | |
Class Z | |
Net assets | | $ | 330,449,747 | | |
Shares outstanding | | | 15,015,366 | | |
Net asset value per share | | $ | 22.01 | | |
The accompanying Notes to Financial Statements are an integral part of this statement.
Annual Report 2015
15
COLUMBIA LARGE CAP ENHANCED CORE FUND
STATEMENT OF OPERATIONS
Year Ended February 28, 2015
Net investment income | |
Income: | |
Dividends — unaffiliated issuers | | $ | 9,978,713 | | |
Dividends — affiliated issuers | | | 9,274 | | |
Total income | | | 9,987,987 | | |
Expenses: | |
Investment management fees | | | 2,285,536 | | |
Distribution and/or service fees | |
Class A | | | 108,603 | | |
Class R | | | 70,888 | | |
Transfer agent fees | |
Class A | | | 88,822 | | |
Class R | | | 28,827 | | |
Class R5(a) | | | 53 | | |
Class Z | | | 504,804 | | |
Administration fees | | | 198,742 | | |
Compensation of board members | | | 21,962 | | |
Custodian fees | | | 15,439 | | |
Printing and postage fees | | | 31,783 | | |
Registration fees | | | 107,576 | | |
Professional fees | | | 28,817 | | |
Other | | | 11,988 | | |
Total expenses | | | 3,503,840 | | |
Fees waived or expenses reimbursed by Investment Manager and its affiliates | | | (1,207,802 | ) | |
Expense reductions | | | (60 | ) | |
Total net expenses | | | 2,295,978 | | |
Net investment income | | | 7,692,009 | | |
Realized and unrealized gain (loss) — net | |
Net realized gain (loss) on: | |
Investments | | | 32,204,970 | | |
Futures contracts | | | 598,691 | | |
Net realized gain | | | 32,803,661 | | |
Net change in unrealized appreciation (depreciation) on: | |
Investments | | | 19,092,665 | | |
Futures contracts | | | 167,664 | | |
Net change in unrealized appreciation | | | 19,260,329 | | |
Net realized and unrealized gain | | | 52,063,990 | | |
Net increase in net assets resulting from operations | | $ | 59,755,999 | | |
(a) Class R5 shares are based on operations from June 25, 2014 (commencement of operations) through the stated period end.
The accompanying Notes to Financial Statements are an integral part of this statement.
Annual Report 2015
16
COLUMBIA LARGE CAP ENHANCED CORE FUND
STATEMENT OF CHANGES IN NET ASSETS
| | | Year Ended
February 28,
2015(a) | | Year Ended
February 28,
2014 | |
Operations | |
Net investment income | | $ | 7,692,009 | | | $ | 4,052,547 | | |
Net realized gain | | | 32,803,661 | | | | 63,437,529 | | |
Net change in unrealized appreciation (depreciation) | | | 19,260,329 | | | | (2,529,685 | ) | |
Net increase in net assets resulting from operations | | | 59,755,999 | | | | 64,960,391 | | |
Distributions to shareholders | |
Net investment income | |
Class A | | | (534,094 | ) | | | (323,578 | ) | |
Class I | | | (183,701 | ) | | | (321,177 | ) | |
Class R | | | (142,581 | ) | | | (28,784 | ) | |
Class R5 | | | (2,624 | ) | | | — | | |
Class Y | | | (46,507 | ) | | | (60,362 | ) | |
Class Z | | | (3,318,025 | ) | | | (3,460,430 | ) | |
Total distributions to shareholders | | | (4,227,532 | ) | | | (4,194,331 | ) | |
Increase (decrease) in net assets from capital stock activity | | | 130,637,322 | | | | (59,818,974 | ) | |
Total increase in net assets | | | 186,165,789 | | | | 947,086 | | |
Net assets at beginning of year | | | 269,416,311 | | | | 268,469,225 | | |
Net assets at end of year | | $ | 455,582,100 | | | $ | 269,416,311 | | |
Undistributed net investment income | | $ | 3,899,926 | | | $ | 461,347 | | |
(a) Class R5 shares are based on operations from June 25, 2014 (commencement of operations) through the stated period end.
The accompanying Notes to Financial Statements are an integral part of this statement.
Annual Report 2015
17
COLUMBIA LARGE CAP ENHANCED CORE FUND
STATEMENT OF CHANGES IN NET ASSETS (continued)
| | | Year Ended February 28, 2015(a) | | Year Ended February 28, 2014 | |
| | | Shares | | Dollars ($) | | Shares | | Dollars ($) | |
Capital stock activity | |
Class A shares | |
Subscriptions | | | 2,816,680 | | | | 58,950,189 | | | | 685,849 | | | | 11,415,643 | | |
Distributions reinvested | | | 21,783 | | | | 466,340 | | | | 12,578 | | | | 226,220 | | |
Redemptions | | | (329,060 | ) | | | (6,787,438 | ) | | | (219,812 | ) | | | (3,850,464 | ) | |
Net increase | | | 2,509,403 | | | | 52,629,091 | | | | 478,615 | | | | 7,791,399 | | |
Class I shares | |
Subscriptions | | | 2,332,257 | | | | 45,826,823 | | | | 2,615,545 | | | | 42,658,290 | | |
Distributions reinvested | | | 8,714 | | | | 183,662 | | | | 18,505 | | | | 321,105 | | |
Redemptions | | | (2,855,235 | ) | | | (58,597,902 | ) | | | (3,965,275 | ) | | | (67,244,199 | ) | |
Net decrease | | | (514,264 | ) | | | (12,587,417 | ) | | | (1,331,225 | ) | | | (24,264,804 | ) | |
Class R shares | |
Subscriptions | | | 1,183,183 | | | | 24,033,094 | | | | 82,559 | | | | 1,344,602 | | |
Distributions reinvested | | | 3,085 | | | | 66,161 | | | | 1,359 | | | | 24,333 | | |
Redemptions | | | (268,544 | ) | | | (5,572,574 | ) | | | (23,840 | ) | | | (404,324 | ) | |
Net increase | | | 917,724 | | | | 18,526,681 | | | | 60,078 | | | | 964,611 | | |
Class R5 shares | |
Subscriptions | | | 20,347 | | | | 413,572 | | | | — | | | | — | | |
Distributions reinvested | | | 121 | | | | 2,595 | | | | — | | | | — | | |
Redemptions | | | (1,140 | ) | | | (24,076 | ) | | | — | | | | — | | |
Net increase | | | 19,328 | | | | 392,091 | | | | — | | | | — | | |
Class Y shares | |
Subscriptions | | | 3,375 | | | | 72,625 | | | | 11,788 | | | | 210,304 | | |
Redemptions | | | (28,059 | ) | | | (576,519 | ) | | | (39,384 | ) | | | (670,000 | ) | |
Net decrease | | | (24,684 | ) | | | (503,894 | ) | | | (27,596 | ) | | | (459,696 | ) | |
Class Z shares | |
Subscriptions | | | 5,984,935 | | | | 124,768,558 | | | | 1,925,147 | | | | 33,078,637 | | |
Distributions reinvested | | | 19,220 | | | | 410,481 | | | | 14,959 | | | | 266,740 | | |
Redemptions | | | (2,598,255 | ) | | | (52,998,269 | ) | | | (4,642,277 | ) | | | (77,195,861 | ) | |
Net increase (decrease) | | | 3,405,900 | | | | 72,180,770 | | | | (2,702,171 | ) | | | (43,850,484 | ) | |
Total net increase (decrease) | | | 6,313,407 | | | | 130,637,322 | | | | (3,522,299 | ) | | | (59,818,974 | ) | |
(a) Class R5 shares are based on operations from June 25, 2014 (commencement of operations) through the stated period end.
The accompanying Notes to Financial Statements are an integral part of this statement.
Annual Report 2015
18
COLUMBIA LARGE CAP ENHANCED CORE FUND
The following tables are intended to help you understand the Fund's financial performance. Certain information reflects financial results for a single share of a class held for the periods shown. Per share net investment income (loss) amounts are calculated based on average shares outstanding during the period. Total return assumes reinvestment of all dividends and distributions, if any. Total return does not reflect payment of sales charges, if any. Total return and portfolio turnover are not annualized for periods of less than one year. The portfolio turnover rate is calculated without regard to purchase and sales transactions of short-term instruments and certain derivatives, if any. If such transactions were included, the Fund's portfolio turnover rate may be higher.
| | | Year Ended February 28, | | Year Ended
February 29, | | Year Ended
February 28, | |
Class A | | 2015 | | 2014 | | 2013 | | 2012 | | 2011 | |
Per share data | |
Net asset value, beginning of period | | $ | 18.77 | | | $ | 15.04 | | | $ | 13.67 | | | $ | 12.81 | | | $ | 10.73 | | |
Income from investment operations: | |
Net investment income | | | 0.51 | | | | 0.23 | | | | 0.22 | | | | 0.17 | | | | 0.14 | | |
Net realized and unrealized gain | | | 2.97 | | | | 3.76 | | | | 1.36 | | | | 0.89 | | | | 2.08 | | |
Total from investment operations | | | 3.48 | | | | 3.99 | | | | 1.58 | | | | 1.06 | | | | 2.22 | | |
Less distributions to shareholders: | |
Net investment income | | | (0.20 | ) | | | (0.26 | ) | | | (0.21 | ) | | | (0.20 | ) | | | (0.14 | ) | |
Total distributions to shareholders | | | (0.20 | ) | | | (0.26 | ) | | | (0.21 | ) | | | (0.20 | ) | | | (0.14 | ) | |
Net asset value, end of period | | $ | 22.05 | | | $ | 18.77 | | | $ | 15.04 | | | $ | 13.67 | | | $ | 12.81 | | |
Total return | | | 18.60 | % | | | 26.58 | % | | | 11.71 | % | | | 8.41 | % | | | 20.84 | % | |
Ratios to average net assets(a) | |
Total gross expenses | | | 1.27 | % | | | 1.26 | % | | | 1.28 | % | | | 1.19 | %(b) | | | 0.96 | %(b) | |
Total net expenses(c) | | | 0.90 | %(d) | | | 0.89 | %(d) | | | 0.89 | %(d) | | | 0.94 | %(b)(d) | | | 0.95 | %(b)(d) | |
Net investment income | | | 2.51 | % | | | 1.34 | % | | | 1.53 | % | | | 1.33 | % | | | 1.22 | % | |
Supplemental data | |
Net assets, end of period (in thousands) | | $ | 85,261 | | | $ | 25,474 | | | $ | 13,209 | | | $ | 12,404 | | | $ | 12,213 | | |
Portfolio turnover | | | 91 | % | | | 101 | % | | | 92 | % | | | 67 | % | | | 63 | % | |
Notes to Financial Highlights
(a) In addition to the fees and expenses that the Fund bears directly, the Fund indirectly bears a pro rata share of the fees and expenses of any other funds in which it invests. Such indirect expenses are not included in the Fund's reported expense ratios.
(b) Ratios include line of credit interest expense which is less than 0.01%.
(c) Total net expenses include the impact of certain fee waivers/expense reimbursements made by the Investment Manager and certain of its affiliates, if applicable.
(d) The benefits derived from expense reductions had an impact of less than 0.01%.
The accompanying Notes to Financial Statements are an integral part of this statement.
Annual Report 2015
19
COLUMBIA LARGE CAP ENHANCED CORE FUND
FINANCIAL HIGHLIGHTS (continued)
| | | Year Ended February 28, | | Year Ended
February 29, | | Year Ended
February 28, | |
Class I | | 2015 | | 2014 | | 2013 | | 2012 | | 2011(a) | |
Per share data | |
Net asset value, beginning of period | | $ | 18.72 | | | $ | 15.00 | | | $ | 13.63 | | | $ | 12.78 | | | $ | 11.11 | | |
Income from investment operations: | |
Net investment income | | | 0.42 | | | | 0.29 | | | | 0.28 | | | | 0.21 | | | | 0.09 | | |
Net realized and unrealized gain | | | 3.14 | | | | 3.75 | | | | 1.36 | | | | 0.88 | | | | 1.75 | | |
Total from investment operations | | | 3.56 | | | | 4.04 | | | | 1.64 | | | | 1.09 | | | | 1.84 | | |
Less distributions to shareholders: | |
Net investment income | | | (0.28 | ) | | | (0.32 | ) | | | (0.27 | ) | | | (0.24 | ) | | | (0.17 | ) | |
Total distributions to shareholders | | | (0.28 | ) | | | (0.32 | ) | | | (0.27 | ) | | | (0.24 | ) | | | (0.17 | ) | |
Net asset value, end of period | | $ | 22.00 | | | $ | 18.72 | | | $ | 15.00 | | | $ | 13.63 | | | $ | 12.78 | | |
Total return | | | 19.09 | % | | | 27.06 | % | | | 12.15 | % | | | 8.73 | % | | | 16.65 | % | |
Ratios to average net assets(b) | |
Total gross expenses | | | 0.81 | % | | | 0.80 | % | | | 0.84 | % | | | 0.74 | %(c) | | | 0.59 | %(c)(d) | |
Total net expenses(e) | | | 0.50 | % | | | 0.48 | % | | | 0.50 | % | | | 0.61 | %(c) | | | 0.57 | %(c)(d)(f) | |
Net investment income | | | 2.07 | % | | | 1.72 | % | | | 2.01 | % | | | 1.72 | % | | | 1.68 | %(d) | |
Supplemental data | |
Net assets, end of period (in thousands) | | $ | 12,522 | | | $ | 20,286 | | | $ | 36,224 | | | $ | 13,297 | | | $ | 7,466 | | |
Portfolio turnover | | | 91 | % | | | 101 | % | | | 92 | % | | | 67 | % | | | 63 | % | |
Notes to Financial Highlights
(a) Based on operations from September 27, 2010 (commencement of operations) through the stated period end.
(b) In addition to the fees and expenses that the Fund bears directly, the Fund indirectly bears a pro rata share of the fees and expenses of any other funds in which it invests. Such indirect expenses are not included in the Fund's reported expense ratios.
(c) Ratios include line of credit interest expense which is less than 0.01%.
(d) Annualized.
(e) Total net expenses include the impact of certain fee waivers/expense reimbursements made by the Investment Manager and certain of its affiliates, if applicable.
(f) The benefits derived from expense reductions had an impact of less than 0.01%.
The accompanying Notes to Financial Statements are an integral part of this statement.
Annual Report 2015
20
COLUMBIA LARGE CAP ENHANCED CORE FUND
FINANCIAL HIGHLIGHTS (continued)
| | | Year Ended February 28, | | Year Ended
February 29, | | Year Ended
February 28, | |
Class R | | 2015 | | 2014 | | 2013 | | 2012 | | 2011 | |
Per share data | |
Net asset value, beginning of period | | $ | 18.75 | | | $ | 15.03 | | | $ | 13.65 | | | $ | 12.80 | | | $ | 10.72 | | |
Income from investment operations: | |
Net investment income | | | 0.43 | | | | 0.18 | | | | 0.20 | | | | 0.14 | | | | 0.12 | | |
Net realized and unrealized gain | | | 2.99 | | | | 3.76 | | | | 1.36 | | | | 0.88 | | | | 2.08 | | |
Total from investment operations | | | 3.42 | | | | 3.94 | | | | 1.56 | | | | 1.02 | | | | 2.20 | | |
Less distributions to shareholders: | |
Net investment income | | | (0.15 | ) | | | (0.22 | ) | | | (0.18 | ) | | | (0.17 | ) | | | (0.12 | ) | |
Total distributions to shareholders | | | (0.15 | ) | | | (0.22 | ) | | | (0.18 | ) | | | (0.17 | ) | | | (0.12 | ) | |
Net asset value, end of period | | $ | 22.02 | | | $ | 18.75 | | | $ | 15.03 | | | $ | 13.65 | | | $ | 12.80 | | |
Total return | | | 18.30 | % | | | 26.26 | % | | | 11.54 | % | | | 8.08 | % | | | 20.58 | % | |
Ratios to average net assets(a) | |
Total gross expenses | | | 1.52 | % | | | 1.51 | % | | | 1.53 | % | | | 1.44 | %(b) | | | 1.21 | %(b) | |
Total net expenses(c) | | | 1.15 | %(d) | | | 1.14 | %(d) | | | 1.12 | %(d) | | | 1.19 | %(b)(d) | | | 1.20 | %(b)(d) | |
Net investment income | | | 2.08 | % | | | 1.08 | % | | | 1.45 | % | | | 1.11 | % | | | 1.02 | % | |
Supplemental data | |
Net assets, end of period (in thousands) | | $ | 23,414 | | | $ | 2,729 | | | $ | 1,284 | | | $ | 204 | | | $ | 175 | | |
Portfolio turnover | | | 91 | % | | | 101 | % | | | 92 | % | | | 67 | % | | | 63 | % | |
Notes to Financial Highlights
(a) In addition to the fees and expenses that the Fund bears directly, the Fund indirectly bears a pro rata share of the fees and expenses of any other funds in which it invests. Such indirect expenses are not included in the Fund's reported expense ratios.
(b) Ratios include line of credit interest expense which is less than 0.01%.
(c) Total net expenses include the impact of certain fee waivers/expense reimbursements made by the Investment Manager and certain of its affiliates, if applicable.
(d) The benefits derived from expense reductions had an impact of less than 0.01%.
The accompanying Notes to Financial Statements are an integral part of this statement.
Annual Report 2015
21
COLUMBIA LARGE CAP ENHANCED CORE FUND
FINANCIAL HIGHLIGHTS (continued)
Class R5 | | Year Ended
February 28,
2015(a) | |
Per share data | |
Net asset value, beginning of period | | $ | 19.88 | | |
Income from investment operations: | |
Net investment income | | | 0.62 | | |
Net realized and unrealized gain | | | 1.66 | | |
Total from investment operations | | | 2.28 | | |
Less distributions to shareholders: | |
Net investment income | | | (0.23 | ) | |
Total distributions to shareholders | | | (0.23 | ) | |
Net asset value, end of period | | $ | 21.93 | | |
Total return | | | 11.49 | % | |
Ratios to average net assets(b) | |
Total gross expenses | | | 0.88 | %(c) | |
Total net expenses(d) | | | 0.55 | %(c) | |
Net investment income | | | 4.41 | %(c) | |
Supplemental data | |
Net assets, end of period (in thousands) | | $ | 424 | | |
Portfolio turnover | | | 91 | % | |
Notes to Financial Highlights
(a) Based on operations from June 25, 2014 (commencement of operations) through the stated period end.
(b) In addition to the fees and expenses that the Fund bears directly, the Fund indirectly bears a pro rata share of the fees and expenses of any other funds in which it invests. Such indirect expenses are not included in the Fund's reported expense ratios.
(c) Annualized.
(d) Total net expenses include the impact of certain fee waivers/expense reimbursements made by the Investment Manager and certain of its affiliates, if applicable.
The accompanying Notes to Financial Statements are an integral part of this statement.
Annual Report 2015
22
COLUMBIA LARGE CAP ENHANCED CORE FUND
FINANCIAL HIGHLIGHTS (continued)
| | | Year Ended February 28, | | Year Ended
February 29, | | Year Ended
February 28, | |
Class Y | | 2015 | | 2014 | | 2013 | | 2012 | | 2011 | |
Per share data | |
Net asset value, beginning of period | | $ | 18.73 | | | $ | 15.00 | | | $ | 13.63 | | | $ | 12.78 | | | $ | 10.70 | | |
Income from investment operations: | |
Net investment income | | | 0.46 | | | | 0.29 | | | | 0.27 | | | | 0.18 | | | | 0.17 | | |
Net realized and unrealized gain | | | 3.10 | | | | 3.76 | | | | 1.36 | | | | 0.91 | | | | 2.09 | | |
Total from investment operations | | | 3.56 | | | | 4.05 | | | | 1.63 | | | | 1.09 | | | | 2.26 | | |
Less distributions to shareholders: | |
Net investment income | | | (0.28 | ) | | | (0.32 | ) | | | (0.26 | ) | | | (0.24 | ) | | | (0.18 | ) | |
Total distributions to shareholders | | | (0.28 | ) | | | (0.32 | ) | | | (0.26 | ) | | | (0.24 | ) | | | (0.18 | ) | |
Net asset value, end of period | | $ | 22.01 | | | $ | 18.73 | | | $ | 15.00 | | | $ | 13.63 | | | $ | 12.78 | | |
Total return | | | 19.08 | % | | | 27.11 | % | | | 12.13 | % | | | 8.74 | % | | | 21.30 | % | |
Ratios to average net assets(a) | |
Total gross expenses | | | 0.81 | % | | | 0.80 | % | | | 0.83 | % | | | 0.74 | %(b) | | | 0.59 | %(b) | |
Total net expenses(c) | | | 0.50 | % | | | 0.48 | % | | | 0.52 | % | | | 0.60 | %(b) | | | 0.58 | %(b)(d) | |
Net investment income | | | 2.30 | % | | | 1.72 | % | | | 1.90 | % | | | 1.46 | % | | | 1.53 | % | |
Supplemental data | |
Net assets, end of period (in thousands) | | $ | 3,511 | | | $ | 3,451 | | | $ | 3,177 | | | $ | 3,024 | | | $ | 31,588 | | |
Portfolio turnover | | | 91 | % | | | 101 | % | | | 92 | % | | | 67 | % | | | 63 | % | |
Notes to Financial Highlights
(a) In addition to the fees and expenses that the Fund bears directly, the Fund indirectly bears a pro rata share of the fees and expenses of any other funds in which it invests. Such indirect expenses are not included in the Fund's reported expense ratios.
(b) Ratios include line of credit interest expense which is less than 0.01%.
(c) Total net expenses include the impact of certain fee waivers/expense reimbursements made by the Investment Manager and certain of its affiliates, if applicable.
(d) The benefits derived from expense reductions had an impact of less than 0.01%.
The accompanying Notes to Financial Statements are an integral part of this statement.
Annual Report 2015
23
COLUMBIA LARGE CAP ENHANCED CORE FUND
FINANCIAL HIGHLIGHTS (continued)
| | | Year Ended February 28, | | Year Ended
February 29, | | Year Ended
February 28, | |
Class Z | | 2015 | | 2014 | | 2013 | | 2012 | | 2011 | |
Per share data | |
Net asset value, beginning of period | | $ | 18.73 | | | $ | 14.99 | | | $ | 13.62 | | | $ | 12.78 | | | $ | 10.70 | | |
Income from investment operations: | |
Net investment income | | | 0.47 | | | | 0.27 | | | | 0.25 | | | | 0.19 | | | | 0.16 | | |
Net realized and unrealized gain | | | 3.06 | | | | 3.77 | | | | 1.37 | | | | 0.88 | | | | 2.09 | | |
Total from investment operations | | | 3.53 | | | | 4.04 | | | | 1.62 | | | | 1.07 | | | | 2.25 | | |
Less distributions to shareholders: | |
Net investment income | | | (0.25 | ) | | | (0.30 | ) | | | (0.25 | ) | | | (0.23 | ) | | | (0.17 | ) | |
Total distributions to shareholders | | | (0.25 | ) | | | (0.30 | ) | | | (0.25 | ) | | | (0.23 | ) | | | (0.17 | ) | |
Net asset value, end of period | | $ | 22.01 | | | $ | 18.73 | | | $ | 14.99 | | | $ | 13.62 | | | $ | 12.78 | | |
Total return | | | 18.92 | % | | | 27.03 | % | | | 12.02 | % | | | 8.54 | % | | | 21.18 | % | |
Ratios to average net assets(a) | |
Total gross expenses | | | 1.02 | % | | | 1.01 | % | | | 1.03 | % | | | 0.94 | %(b) | | | 0.71 | %(b) | |
Total net expenses(c) | | | 0.65 | %(d) | | | 0.64 | %(d) | | | 0.64 | %(d) | | | 0.70 | %(b)(d) | | | 0.70 | %(b)(d) | |
Net investment income | | | 2.32 | % | | | 1.57 | % | | | 1.77 | % | | | 1.54 | % | | | 1.46 | % | |
Supplemental data | |
Net assets, end of period (in thousands) | | $ | 330,450 | | | $ | 217,477 | | | $ | 214,575 | | | $ | 254,500 | | | $ | 365,205 | | |
Portfolio turnover | | | 91 | % | | | 101 | % | | | 92 | % | | | 67 | % | | | 63 | % | |
Notes to Financial Highlights
(a) In addition to the fees and expenses that the Fund bears directly, the Fund indirectly bears a pro rata share of the fees and expenses of any other funds in which it invests. Such indirect expenses are not included in the Fund's reported expense ratios.
(b) Ratios include line of credit interest expense which is less than 0.01%.
(c) Total net expenses include the impact of certain fee waivers/expense reimbursements made by the Investment Manager and certain of its affiliates, if applicable.
(d) The benefits derived from expense reductions had an impact of less than 0.01%.
The accompanying Notes to Financial Statements are an integral part of this statement.
Annual Report 2015
24
COLUMBIA LARGE CAP ENHANCED CORE FUND
NOTES TO FINANCIAL STATEMENTS
February 28, 2015
Note 1. Organization
Columbia Large Cap Enhanced Core Fund (the Fund), a series of Columbia Funds Series Trust (the Trust), is a diversified fund. The Trust is registered under the Investment Company Act of 1940, as amended (the 1940 Act), as an open-end management investment company organized as a Delaware statutory trust.
Fund Shares
The Trust may issue an unlimited number of shares (without par value). The Fund offers Class A, Class I, Class R, Class R5, Class Y and Class Z shares. Although all share classes generally have identical voting, dividend and liquidation rights, each share class votes separately when required by the Trust's organizational documents or by law. Different share classes pay different distribution amounts to the extent the expenses of such share classes differ, and distributions in liquidation will be proportional to the net asset value of each share class. Each share class has its own expense structure and sales charges.
Class A shares are not subject to any front-end sales charge or contingent deferred sales charge.
Class I shares are not subject to sales charges and are available only to the Columbia Family of Funds.
Class R shares are not subject to sales charges and are generally available only to certain retirement plans and other investors as described in the Fund's prospectus.
Class R5 shares are not subject to sales charges and are generally available only to investors purchasing through authorized investment professionals and omnibus retirement plans. Class R5 shares commenced operations on June 25, 2014.
Class Y shares are not subject to sales charges and are generally available only to certain retirement plans as described in the Fund's prospectus.
Class Z shares are not subject to sales charges and are available only to eligible investors, which are subject to different investment minimums as described in the Fund's prospectus.
Note 2. Summary of Significant Accounting Policies
Basis of Preparation
The Fund is an investment company that applies the accounting and reporting guidance in the Financial Accounting Standards Board (FASB) Accounting
Standards Codification Topic 946, Financial Services — Investment Companies (ASC 946). The financial statements are prepared in accordance with U.S. generally accepted accounting principles (GAAP) which requires management to make certain estimates and assumptions that affect the reported amounts of assets and liabilities, the disclosure of contingent assets and liabilities at the date of the financial statements and the reported amounts of income and expenses during the reporting period. Actual results could differ from those estimates.
The following is a summary of significant accounting policies followed by the Fund in the preparation of its financial statements.
Security Valuation
All equity securities are valued at the close of business of the New York Stock Exchange (NYSE). Equity securities are valued at the last quoted sales price on the principal exchange or market on which they trade, except for securities traded on the NASDAQ Stock Market, which are valued at the NASDAQ official close price. Unlisted securities or listed securities for which there were no sales during the day are valued at the mean of the latest quoted bid and ask prices on such exchanges or markets.
Foreign equity securities are valued based on quotations from the principal market in which such securities are traded. If any foreign security prices are not readily available as a result of limited share activity, the securities are valued at the mean of the latest quoted bid and ask prices on such exchanges or markets. Foreign currency exchange rates are generally determined at 4:00 p.m. Eastern (U.S.) time. Many securities markets and exchanges outside the U.S. close prior to the close of the NYSE; therefore, the closing prices for securities in such markets or on such exchanges may not fully reflect events that occur after such close but before the close of the NYSE. In those situations, foreign securities will be fair valued pursuant to a policy adopted by the Board of Trustees (the Board), including, if available, utilizing a third party pricing service to determine these fair values. The third party pricing service takes into account multiple factors, including, but not limited to, movements in the U.S. securities markets, certain depositary receipts, futures contracts and foreign exchange rates that have occurred subsequent to the close of the foreign exchange or market, to determine a good faith estimate that reasonably reflects the current market conditions as of the close of the NYSE. The fair
Annual Report 2015
25
COLUMBIA LARGE CAP ENHANCED CORE FUND
NOTES TO FINANCIAL STATEMENTS (continued)
February 28, 2015
value of a security is likely to be different from the quoted or published price, if available.
Investments in open-end investment companies, including money market funds, are valued at their net asset value.
Futures and options on futures contracts are valued based upon the settlement price established each day by the board of trade or exchange on which they are traded.
Investments for which market quotations are not readily available, or that have quotations which management believes are not reliable, are valued at fair value as determined in good faith under procedures established by and under the general supervision of the Board. If a security or class of securities (such as foreign securities) is valued at fair value, such value is likely to be different from the quoted or published price for the security.
The determination of fair value often requires significant judgment. To determine fair value, management may use assumptions including but not limited to future cash flows and estimated risk premiums. Multiple inputs from various sources may be used to determine fair value.
Derivative Instruments
The Fund invests in certain derivative instruments, as detailed below, to meet its investment objectives. Derivatives are instruments whose values depend on, or are derived from, in whole or in part, the value of one or more other assets, such as securities, currencies, commodities or indices. Derivative instruments may be used to increase investment flexibility (including to maintain cash reserves while maintaining exposure to certain other assets), for risk management (hedging) purposes, to facilitate trading, to reduce transaction costs and to pursue higher investment returns. The Fund may also use derivative instruments to mitigate certain investment risks, such as foreign currency exchange rate risk, interest rate risk and credit risk. Derivatives may involve various risks, including the potential inability of the counterparty to fulfill its obligation under the terms of the contract, the potential for an illiquid secondary market (making it difficult for the Fund to sell, including at favorable prices) and the potential for market movements which may expose the Fund to gains or losses in excess of the amount shown in the Statement of Assets and Liabilities. The notional amounts of derivative instruments, if applicable, are not recorded in the financial statements.
A derivative instrument may suffer a marked-to-market loss if the value of the contract decreases due to an
unfavorable change in the market rates or values of the underlying instrument. Losses can also occur if the counterparty does not perform under the contract. The Fund's risk of loss from counterparty credit risk on over-the-counter derivatives is generally limited to the aggregate unrealized gain netted against any collateral held by the Fund and the amount of any variation margin held by the counterparty. With exchange-traded or centrally cleared derivatives, there is reduced counterparty credit risk to the Fund since the exchange's clearinghouse, as counterparty to such instruments, guarantees against a possible default. The clearinghouse stands between the buyer and the seller of the contract; therefore, the counterparty credit risk is failure of the clearinghouse. However, credit risk still exists in exchange-traded or centrally cleared derivatives with respect to initial and variation margin that is held in a broker's customer account. While brokers are required to segregate customer margin from their own assets, in the event that a broker becomes insolvent or goes into bankruptcy and at that time there is a shortfall in the aggregate amount of margin held by the broker for all its clients, U.S. bankruptcy laws will typically allocate that shortfall on a pro-rata basis across all the broker's customers (including the Fund), potentially resulting in losses to the Fund.
In order to better define its contractual rights and to secure rights that will help the Fund mitigate its counterparty risk, the Fund may enter into an International Swaps and Derivatives Association, Inc. Master Agreement (ISDA Master Agreement) or similar agreement with its derivative contract counterparties. An ISDA Master Agreement is an agreement between the Fund and a counterparty that governs over-the-counter derivatives and forward foreign currency exchange contracts and typically contains, among other things, collateral posting terms and netting provisions in the event of a default and/or termination event. Under an ISDA Master Agreement, the Fund may, under certain circumstances, offset with the counterparty certain derivative instrument's payables and/or receivables with collateral held and/or posted and create one single net payment. The provisions of the ISDA Master Agreement typically permit a single net payment in the event of default (close-out netting) including the bankruptcy or insolvency of the counterparty. Note, however, that bankruptcy or insolvency laws of a particular jurisdiction may impose restrictions on or prohibitions against the right of offset in bankruptcy, insolvency or other events.
Annual Report 2015
26
COLUMBIA LARGE CAP ENHANCED CORE FUND
NOTES TO FINANCIAL STATEMENTS (continued)
February 28, 2015
Collateral (margin) requirements differ by type of derivative. Margin requirements are established by the exchange or clearinghouse for exchange-traded and centrally cleared derivatives. Brokers can ask for margin in excess of the minimum in certain circumstances. Collateral terms are contract specific for over-the-counter derivatives. For over-the-counter derivatives traded under an ISDA Master Agreement, the collateral requirements are typically calculated by netting the marked-to-market amount for each transaction under such agreement and comparing that amount to the value of any variation margin currently pledged by the Fund and/or the counterparty. Generally, the amount of collateral due from or to a party has to exceed a minimum transfer amount threshold (e.g., $500,000) before a transfer has to be made. To the extent amounts due to the Fund from its counterparties are not fully collateralized, contractually or otherwise, the Fund bears the risk of loss from counterparty nonperformance. The Fund attempts to mitigate counterparty risk by only entering into agreements with counterparties that it believes have the financial resources to honor their obligations and by monitoring the financial stability of those counterparties.
Certain ISDA Master Agreements allow counterparties to over-the-counter derivatives to terminate derivative contracts prior to maturity in the event the Fund's net assets decline by a stated percentage over a specified time period or if the Fund fails to meet the terms of the ISDA Master Agreement, which would cause the Fund to accelerate payment of any net liability owed to the counterparty. The Fund also has termination rights if the counterparty fails to meet the terms of the ISDA Master Agreement. In addition to considering counterparty credit risk, the Fund would consider terminating the derivative contracts based on whether termination would result in a net liability owed from the counterparty.
For financial reporting purposes, the Fund does not offset derivative assets and derivative liabilities that are subject to netting arrangements in the Statement of Assets and Liabilities.
Futures Contracts
Futures contracts are exchange traded and represent commitments for the future purchase or sale of an asset at a specified price on a specified date. The Fund bought and sold futures contracts to maintain appropriate equity market exposure while keeping sufficient cash to accommodate daily redemptions. These instruments may be used for other purposes in future periods. Upon entering into futures contracts, the Fund bears risks that
it may not achieve the anticipated benefits of the futures contracts and may realize a loss. Additional risks include counterparty credit risk, the possibility of an illiquid market, and that a change in the value of the contract or option may not correlate with changes in the value of the underlying asset.
Upon entering into a futures contract, the Fund pledges cash or securities with the broker in an amount sufficient to meet the initial margin requirement. The initial margin deposit must be maintained at an established level over the life of the contract. Cash deposited as initial margin is recorded in the Statement of Assets and Liabilities as margin deposits. Securities deposited as initial margin are designated in the Portfolio of Investments. Subsequent payments (variation margin) are made or received by the Fund each day. The variation margin payments are equal to the daily change in the contract value and are recorded as variation margin receivable or payable and are offset in unrealized gains or losses. The Fund recognizes a realized gain or loss when the contract is closed or expires. Futures contracts involve, to varying degrees, risk of loss in excess of the variation margin disclosed in the Statement of Assets and Liabilities.
Effects of Derivative Transactions in the Financial Statements
The following tables are intended to provide additional information about the effect of derivatives on the financial statements of the Fund, including: the fair value of derivatives by risk category and the location of those fair values in the Statement of Assets and Liabilities; and the impact of derivative transactions over the period in the Statement of Operations, including realized gains or losses and unrealized gains or losses. The derivative schedules following the Portfolio of Investments present additional information regarding derivative instruments outstanding at the end of the period, if any.
The following table is a summary of the fair value of derivative instruments (not considered to be hedging instruments for accounting disclosure purposes) at February 28, 2015:
Asset Derivatives | |
Risk Exposure
Category | | Statement of Assets and
Liabilities Location | | Fair Value ($) | |
Equity risk
| | Net assets — unrealized
appreciation on
futures contracts | | | 373,873
| * | |
*Includes cumulative appreciation (depreciation) as reported in the tables following the Portfolio of Investments. Only the current day's variation margin is reported in receivables or payables in the Statement of Assets and Liabilities.
Annual Report 2015
27
COLUMBIA LARGE CAP ENHANCED CORE FUND
NOTES TO FINANCIAL STATEMENTS (continued)
February 28, 2015
The following table indicates the effect of derivative instruments (not considered to be hedging instruments for accounting disclosure purposes) in the Statement of Operations for the year ended February 28, 2015:
Amount of Realized Gain (Loss) on Derivatives Recognized in Income | |
Risk Exposure Category | | Futures Contracts ($) | |
Equity risk | | | 598,691 | | |
Change in Unrealized Appreciation (Depreciation) on
Derivatives Recognized in Income | |
Risk Exposure Category | | Futures Contracts ($) | |
Equity risk | | | 167,664 | | |
The following table is a summary of the average outstanding volume by derivative instrument for the year ended February 28, 2015:
Derivative Instrument | | Average Notional Amounts ($)* | |
Futures contracts — Long | | | 8,256,938 | | |
*Based on the ending quarterly outstanding amounts for the year ended February 28, 2015.
Security Transactions
Security transactions are accounted for on the trade date. Cost is determined and gains (losses) are based upon the specific identification method for both financial statement and federal income tax purposes.
Income Recognition
Corporate actions and dividend income are generally recorded net of any non-reclaimable tax withholdings, on the ex-dividend date or upon receipt of ex-dividend notification in the case of certain foreign securities.
The Fund may receive distributions from holdings in business development companies (BDCs), exchange-traded funds (ETFs), other regulated investment companies (RICs), and real estate investment trusts (REITs), which report information on the character of their distributions annually. These distributions are allocated to dividend income, capital gain and return of capital based on actual information reported. To the extent actual information has not yet been reported by the REITs, estimates for return of capital are made by the Fund's management. Return of capital is recorded as a reduction of the cost basis of securities held. If the Fund no longer owns the applicable securities, return of capital is recorded as a realized gain. Management's estimates are subsequently adjusted when the actual character of the distributions is disclosed by the REITs, which could result in a proportionate change in return of capital to
shareholders. No estimates are made for the BDCs, ETFs, and RICs.
Awards from class action litigation are recorded as a reduction of cost basis if the Fund still owns the applicable securities on the payment date. If the Fund no longer owns the applicable securities, the proceeds are recorded as realized gains.
Expenses
General expenses of the Trust are allocated to the Fund and other funds of the Trust based upon relative net assets or other expense allocation methodologies determined by the nature of the expense. Expenses directly attributable to the Fund are charged to the Fund. Expenses directly attributable to a specific class of shares are charged to that share class.
Determination of Class Net Asset Value
All income, expenses (other than class-specific expenses, which are charged to that share class, as shown in the Statement of Operations) and realized and unrealized gains (losses) are allocated to each class of the Fund on a daily basis, based on the relative net assets of each class, for purposes of determining the net asset value of each class.
Federal Income Tax Status
The Fund intends to qualify each year as a regulated investment company under Subchapter M of the Internal Revenue Code, as amended, and will distribute substantially all of its taxable income (including net short-term capital gains), if any, for its tax year, and as such will not be subject to federal income taxes. In addition, the Fund intends to distribute in each calendar year substantially all of its net investment income, capital gains and certain other amounts, if any, such that the Fund should not be subject to federal excise tax. Therefore, no federal income or excise tax provision is recorded.
Distributions to Shareholders
Distributions from net investment income, if any, are declared and paid semi-annually. Net realized capital gains, if any, are distributed at least annually. Income distributions and capital gain distributions are determined in accordance with federal income tax regulations, which may differ from GAAP.
Guarantees and Indemnifications
Under the Trust's organizational documents and, in some cases, by contract, its officers and trustees are indemnified against certain liabilities arising out of the
Annual Report 2015
28
COLUMBIA LARGE CAP ENHANCED CORE FUND
NOTES TO FINANCIAL STATEMENTS (continued)
February 28, 2015
performance of their duties to the Trust or its funds. In addition, certain of the Fund's contracts with its service providers contain general indemnification clauses. The Fund's maximum exposure under these arrangements is unknown since the amount of any future claims that may be made against the Fund cannot be determined, and the Fund has no historical basis for predicting the likelihood of any such claims.
Note 3. Fees and Compensation Paid to Affiliates
Investment Management Fees
Under an Investment Management Services Agreement, Columbia Management Investment Advisers, LLC (the Investment Manager), a wholly-owned subsidiary of Ameriprise Financial, Inc. (Ameriprise Financial), determines which securities will be purchased, held or sold. The investment management fee is an annual fee that is equal to a percentage of the Fund's average daily net assets that declines from 0.69% to 0.52% as the Fund's net assets increase.
Effective July 1, 2014, the Investment Manager has contractually agreed to waive 0.05% of the Fund's investment management fee through June 30, 2015. Prior to July 1, 2014, the Investment Manager contractually agreed to waive 0.10% of the Fund's investment management fee. The effective investment management fee waiver for the year ended February 28, 2015 was 0.06% of the Fund's average daily net assets.
The effective investment management fee rate, net of fee waivers, for the year ended February 28, 2015 was 0.63% of the Fund's average daily net assets.
Administration Fees
Under an Administrative Services Agreement, the Investment Manager also serves as the Fund Administrator. The Fund pays the Fund Administrator an annual fee for administration and accounting services equal to a percentage of the Fund's average daily net assets that declines from 0.06% to 0.03% as the Fund's net assets increase. The effective administration fee rate for the year ended February 28, 2015 was 0.06% of the Fund's average daily net assets.
Other Expenses
Other expenses are for, among other things, miscellaneous expenses of the Fund or the Board, including payments to a company providing limited administrative services to the Fund and the Board. That company's expenses include boardroom and office
expense, employee compensation, employee health and retirement benefits, and certain other expenses. For the year ended February 28, 2015, other expenses paid by the Fund to this company were $1,595.
Compensation of Board Members
Board members are compensated for their services to the Fund as disclosed in the Statement of Operations. Under a Deferred Compensation Plan (the Plan), the Board members who are not "interested persons" of the Fund, as defined under the 1940 Act, may elect to defer payment of up to 100% of their compensation. Deferred amounts are treated as though equivalent dollar amounts had been invested in shares of certain funds managed by the Investment Manager. The Fund's liability for these amounts is adjusted for market value changes and remains in the Fund until distributed in accordance with the Plan.
Transfer Agent Fees
Under a Transfer and Dividend Disbursing Agent Agreement, Columbia Management Investment Services Corp. (the Transfer Agent), an affiliate of the Investment Manager and a wholly-owned subsidiary of Ameriprise Financial, is responsible for providing transfer agency services to the Fund. The Transfer Agent has contracted with Boston Financial Data Services (BFDS) to serve as sub-transfer agent.
Effective November 1, 2014, the Transfer Agent receives a monthly transfer agency fee based on the number or the average value of accounts, depending on the type of account. Prior to November 1, 2014, the Transfer Agent received a monthly account-based service fee based on the number of open accounts. In addition, the Transfer Agent also receives sub-transfer agency fees based on a percentage of the average aggregate value of the Fund's shares maintained in omnibus accounts (other than omnibus accounts for which American Enterprise Investment Services Inc. is the broker of record or accounts where the beneficial shareholder is a customer of Ameriprise Financial Services, Inc., for which the Transfer Agent receives a per account fee). The Transfer Agent pays the fees of BFDS for services as sub-transfer agent and is not entitled to reimbursement for such fees from the Fund (with the exception of out-of-pocket fees).
The Transfer Agent also receives compensation from the Fund for various shareholder services and reimbursements for certain out-of-pocket fees. Total transfer agent fees for Class R5 shares are subject to an annual limitation of not more than 0.05% of the average
Annual Report 2015
29
COLUMBIA LARGE CAP ENHANCED CORE FUND
NOTES TO FINANCIAL STATEMENTS (continued)
February 28, 2015
daily net assets attributable to Class R5 shares. Class I and Class Y shares do not pay transfer agency fees.
For the year ended February 28, 2015, the Fund's effective transfer agent fee rates as a percentage of average daily net assets of each class were as follows:
Class A | | | 0.20 | % | |
Class R | | | 0.20 | | |
Class R5 | | | 0.05 | * | |
Class Z | | | 0.20 | | |
*Annualized.
An annual minimum account balance fee of $20 may apply to certain accounts with a value below the applicable share class's initial minimum investment requirements to reduce the impact of small accounts on transfer agent fees. These minimum account balance fees are remitted to the Fund and recorded as part of expense reductions in the Statement of Operations. For the year ended February 28, 2015, these minimum account balance fees reduced total expenses of the Fund by $60.
Distribution and Service Fees
The Fund has an agreement with Columbia Management Investment Distributors, Inc. (the Distributor), an affiliate of the Investment Manager and a wholly-owned subsidiary of Ameriprise Financial, for distribution and shareholder services. The Board has approved, and the Fund has adopted, distribution and shareholder service plans (the Plans) applicable to certain share classes, which set the distribution and service fees for the Fund. These fees are calculated daily and are intended to compensate the Distributor and/or eligible selling and/or servicing agents for selling shares of the Fund and providing services to investors.
Under the Plans, the Fund pays a monthly combined distribution and service fee to the Distributor at the maximum annual rate of 0.25% of the average daily net assets attributable to Class A shares of the Fund. Also under the Plans, the Fund pays a monthly distribution fee at the maximum annual rate of 0.50% of the average daily net assets attributable to Class R shares of the Fund.
Expenses Waived/Reimbursed by the Investment Manager and its Affiliates
The Investment Manager and certain of its affiliates have contractually agreed to waive fees and/or reimburse expenses (excluding certain fees and expenses described below) for the periods disclosed below, unless
sooner terminated at the sole discretion of the Board, so that the Fund's net operating expenses, after giving effect to fees waived/expenses reimbursed and any balance credits and/or overdraft charges from the Fund's custodian, do not exceed the following annual rates as a percentage of the class' average daily net assets:
| | | July 1, 2014
through
June 30, 2015 | | Prior to
July 1, 2014 | |
Class A | | | 1.02 | % | | | 0.90 | % | |
Class I | | | 0.62 | | | | 0.49 | | |
Class R | | | 1.27 | | | | 1.15 | | |
Class R5 | | | 0.67 | | | | 0.54 | * | |
Class Y | | | 0.62 | | | | 0.49 | | |
Class Z | | | 0.77 | | | | 0.65 | | |
*Fee rate is contractual from June 25, 2014 (the commencement of operations of Class R5 shares) through June 30, 2014.
Under the agreement governing these fee waivers and/or expense reimbursement arrangements, the following fees and expenses are excluded from the waiver/reimbursement commitment, and therefore will be paid by the Fund, if applicable: taxes (including foreign transaction taxes), expenses associated with investments in affiliated and non-affiliated pooled investment vehicles (including mutual funds and exchange-traded funds), transaction costs and brokerage commissions, costs related to any securities lending program, dividend expenses associated with securities sold short, inverse floater program fees and expenses, transaction charges and interest on borrowed money, interest, extraordinary expenses and any other expenses the exclusion of which is specifically approved by the Board. This agreement may be modified or amended only with approval from all parties. Any fees waived and/or expenses reimbursed under the expense reimbursement arrangements described above are not recoverable by the Investment Manager or its affiliates in future periods.
In addition, effective July 1, 2014, the Fund's expense ratio is subject to a voluntary expense reimbursement arrangement pursuant to which fees are waived and/or expenses reimbursed (excluding certain fees and expenses immediately described above), so that the Fund's net operating expenses, after giving effect to fees waived/expenses reimbursed and any balance credits and/or overdraft charges from the Fund's custodian, do not exceed the annual rates of 0.90% for Class A, 0.50% for Class I, 1.15% for Class R, 0.55% for Class R5, 0.50% for Class Y and 0.65% for Class Z. This arrangement may be revised or discontinued at any time.
Annual Report 2015
30
COLUMBIA LARGE CAP ENHANCED CORE FUND
NOTES TO FINANCIAL STATEMENTS (continued)
February 28, 2015
Note 4. Federal Tax Information
The timing and character of income and capital gain distributions are determined in accordance with income tax regulations, which may differ from GAAP because of temporary or permanent book to tax differences.
At February 28, 2015, these differences are primarily due to differing treatment for capital loss carryforwards, deferral/reversal of wash sale losses, Trustees' deferred compensation, re-characterization of distributions for investments, derivative investments and tax straddles. To the extent these differences are permanent, reclassifications are made among the components of the Fund's net assets in the Statement of Assets and Liabilities. Temporary differences do not require reclassifications. In the Statement of Assets and Liabilities the following reclassifications were made:
Undistributed net investment income | | $ | (25,898 | ) | |
Accumulated net realized loss | | | 25,898 | | |
Net investment income (loss) and net realized gains (losses), as disclosed in the Statement of Operations, and net assets were not affected by this reclassification.
The tax character of distributions paid during the years indicated was as follows:
Year Ended February 28, | | 2015 | | 2014 | |
Ordinary income | | $ | 4,227,532 | | | $ | 4,194,331 | | |
Short-term capital gain distributions, if any, are considered ordinary income distributions for tax purposes.
At February 28, 2015, the components of distributable earnings on a tax basis were as follows:
Undistributed ordinary income | | $ | 4,004,772 | | |
Capital loss carryforwards | | | (10,116,156 | ) | |
Net unrealized appreciation | | $ | 98,006,201 | | |
At February 28, 2015, the cost of investments for federal income tax purposes was $368,393,277 and the aggregate gross unrealized appreciation and depreciation based on that cost was:
Unrealized appreciation | | $ | 100,704,197 | | |
Unrealized depreciation | | | (2,697,996 | ) | |
Net unrealized appreciation | | $ | 98,006,201 | | |
The following capital loss carryforwards, determined at February 28, 2015, may be available to reduce taxable income arising from future net realized gains on
investments, if any, to the extent permitted by the Internal Revenue Code:
Year of Expiration | | Amount ($) | |
2018 | | | 10,116,156 | | |
For the year ended February 28, 2015, $33,622,817 of capital loss carryforward was utilized.
Management of the Fund has concluded that there are no significant uncertain tax positions in the Fund that would require recognition in the financial statements. However, management's conclusion may be subject to review and adjustment at a later date based on factors including, but not limited to, new tax laws, regulations, and administrative interpretations (including relevant court decisions). Generally, the Fund's federal tax returns for the prior three fiscal years remain subject to examination by the Internal Revenue Service.
Note 5. Portfolio Information
The cost of purchases and proceeds from sales of securities, excluding short-term investments and derivatives, if any, aggregated to $426,887,563 and $296,660,693, respectively, for the year ended February 28, 2015. The amount of purchase and sale activity impacts the portfolio turnover rate reported in the Financial Highlights.
Note 6. Affiliated Money Market Fund
The Fund invests in Columbia Short-Term Cash Fund, an affiliated money market fund established for the exclusive use by the Fund and other affiliated funds. The income earned by the Fund from such investments is included as Dividends — affiliated issuers in the Statement of Operations. As an investing fund, the Fund indirectly bears its proportionate share of the expenses of Columbia Short-Term Cash Fund.
Note 7. Shareholder Concentration
At February 28, 2015, one unaffiliated shareholder of record owned 65.8% of the outstanding shares of the Fund in one or more accounts. The Fund has no knowledge about whether any portion of those shares was owned beneficially. Subscription and redemption activity by concentrated accounts may have a significant effect on the operations of the Fund.
Note 8. Line of Credit
The Fund has entered into a revolving credit facility with a syndicate of banks led by JPMorgan Chase Bank, N.A. (JPMorgan) whereby the Fund may borrow for the
Annual Report 2015
31
COLUMBIA LARGE CAP ENHANCED CORE FUND
NOTES TO FINANCIAL STATEMENTS (continued)
February 28, 2015
temporary funding of shareholder redemptions or for other temporary or emergency purposes. Pursuant to a December 9, 2014 amendment, the credit facility agreement, which is a collective agreement between the Fund and certain other funds managed by the Investment Manager, severally and not jointly, permits collective borrowings up to $550 million. Interest is charged to each participating fund based on its borrowings at a rate equal to the higher of (i) the overnight federal funds rate plus 1.00% or (ii) the one-month LIBOR rate plus 1.00%. Each borrowing under the credit facility matures no later than 60 days after the date of borrowing. The Fund also pays a commitment fee equal to its pro rata share of the amount of the credit facility at a rate of 0.075% per annum. The commitment fee is included in other expenses in the Statement of Operations. Prior to the December 9, 2014 amendment, the credit facility agreement permitted borrowings up to $500 million under the same terms and interest rates as described above.
The Fund had no borrowings during the year ended February 28, 2015.
Note 9. Subsequent Events
Management has evaluated the events and transactions that have occurred through the date the financial statements were issued and noted no items requiring adjustment of the financial statements or additional disclosure.
Note 10. Information Regarding Pending and Settled Legal Proceedings
In December 2005, without admitting or denying the allegations, American Express Financial Corporation (AEFC, which is now known as Ameriprise Financial, Inc. (Ameriprise Financial)) entered into settlement agreements with the Securities and Exchange Commission (SEC) and Minnesota Department of Commerce (MDOC) related to market timing activities. As a result, AEFC was censured and ordered to cease and desist from committing or causing any violations of certain provisions of the Investment Advisers Act of 1940, the Investment Company Act of 1940, and various Minnesota laws. AEFC agreed to pay disgorgement of $10 million and civil money penalties of $7 million. AEFC also agreed to retain an independent distribution consultant to assist in developing a plan for distribution of all disgorgement and civil penalties ordered by the SEC in accordance with various undertakings detailed at www.sec.gov/litigation/admin/ia-2451.pdf. Ameriprise
Financial and its affiliates have cooperated with the SEC and the MDOC in these legal proceedings, and have made regular reports to the Funds' Boards of Trustees.
Ameriprise Financial and certain of its affiliates have historically been involved in a number of legal, arbitration and regulatory proceedings, including routine litigation, class actions, and governmental actions, concerning matters arising in connection with the conduct of their business activities. Ameriprise Financial believes that the Funds are not currently the subject of, and that neither Ameriprise Financial nor any of its affiliates are the subject of, any pending legal, arbitration or regulatory proceedings that are likely to have a material adverse effect on the Funds or the ability of Ameriprise Financial or its affiliates to perform under their contracts with the Funds. Ameriprise Financial is required to make quarterly (10-Q), annual (10-K) and, as necessary, 8-K filings with the Securities and Exchange Commission on legal and regulatory matters that relate to Ameriprise Financial and its affiliates. Copies of these filings may be obtained by accessing the SEC website at www.sec.gov.
There can be no assurance that these matters, or the adverse publicity associated with them, will not result in increased fund redemptions, reduced sale of fund shares or other adverse consequences to the Funds. Further, although we believe proceedings are not likely to have a material adverse effect on the Funds or the ability of Ameriprise Financial or its affiliates to perform under their contracts with the Funds, these proceedings are subject to uncertainties and, as such, we are unable to estimate the possible loss or range of loss that may result. An adverse outcome in one or more of these proceedings could result in adverse judgments, settlements, fines, penalties or other relief that could have a material adverse effect on the consolidated financial condition or results of operations of Ameriprise Financial.
Annual Report 2015
32
COLUMBIA LARGE CAP ENHANCED CORE FUND
REPORT OF INDEPENDENT REGISTERED PUBLIC ACCOUNTING FIRM
To the Trustees of Columbia Funds Series Trust and the Shareholders of
Columbia Large Cap Enhanced Core Fund
In our opinion, the accompanying statement of assets and liabilities, including the portfolio of investments, and the related statements of operations and of changes in net assets and the financial highlights present fairly, in all material respects, the financial position of Columbia Large Cap Enhanced Core Fund (the "Fund", a series of Columbia Funds Series Trust) at February 28, 2015, and the results of its operations, the changes in its net assets and the financial highlights for each of the periods indicated, in conformity with accounting principles generally accepted in the United States of America. These financial statements and financial highlights (hereafter referred to as "financial statements") are the responsibility of the Fund's management; our responsibility is to express an opinion on these financial statements based on our audits. We conducted our audits of these financial statements in accordance with the standards of the Public Company Accounting Oversight Board (United States). Those standards require that we plan and perform the audit to obtain reasonable assurance about whether the financial statements are free of material misstatement. An audit includes examining, on a test basis, evidence supporting the amounts and disclosures in the financial statements, assessing the accounting principles used and significant estimates made by management, and evaluating the overall financial statement presentation. We believe that our audits, which included confirmation of securities at February 28, 2015 by correspondence with the custodian, brokers and transfer agent, provide a reasonable basis for our opinion.
PricewaterhouseCoopers LLP
Minneapolis, Minnesota
April 21, 2015
Annual Report 2015
33
COLUMBIA LARGE CAP ENHANCED CORE FUND
FEDERAL INCOME TAX INFORMATION
(Unaudited)
The Fund hereby designates the following tax attributes for the fiscal year ended February 28, 2015. Shareholders will be notified in early 2016 of the amounts for use in preparing 2015 income tax returns.
Tax Designations:
| Qualified Dividend Income | | | 100.00 | % | |
| Dividends Received Deduction | | | 100.00 | % | |
Qualified Dividend Income. For taxable, non-corporate shareholders, the percentage of ordinary income distributed during the fiscal year that represents qualified dividend income subject to reduced tax rates.
Dividends Received Deduction. The percentage of ordinary income distributed during the fiscal year that qualifies for the corporate dividends received deduction.
Annual Report 2015
34
COLUMBIA LARGE CAP ENHANCED CORE FUND
Shareholders elect the Board that oversees the Funds' operations. The Board appoints officers who are responsible for day-to-day business decisions based on policies set by the Board. The following table provides basic biographical information about the Funds' Board members, including their principal occupations during the past five years, although specific titles for individuals may have varied over the period. Under current Board policy, members may serve through the end of the calendar year in which he or she reaches either the mandatory retirement age established by the Board or the fifteenth anniversary of the first Board meeting they attended as a member of the Board.
Independent Trustees
Name,
Address,
Year of Birth | | Position Held With
Funds and Length of
Service | | Principal Occupation(s)
During Past Five Years
and Other Relevant
Professional Experience | | Number of
Funds in the
Fund Family
Overseen by
Board Member | | Other Present or Past
Directorships/
Trusteeships
(Within Past 5 Years) | |
Kathleen Blatz
901 S. Marquette Ave.
Minneapolis, MN 55402
1954 | | Board member since 1/06 for RiverSource Funds and since 6/11 for Nations Funds | | Attorney; specializing in arbitration and mediation; Chief Justice, Minnesota Supreme Court, 1998-2006; Associate Justice, Minnesota Supreme Court, 1996-1998; Fourth Judicial District Court Judge, Hennepin Country, 1994-1996; Attorney in private practice and public service, 1984-1993; State Representative, Minnesota House of Representatives, 1979-1993, which included service on the Tax and Financial Institutions and Insurance Committees | | | 127 | | | Trustee, BlueCross BlueShield of Minnesota (Chair of the Business Development Committee) since 2009; Chair of the Robina Foundation since August 2013 | |
Edward J. Boudreau, Jr.
901 S. Marquette Ave.
Minneapolis, MN 55402
1944 | | Board member since 6/11 for RiverSource Funds and since 1/05 for Nations Funds | | Managing Director, E.J. Boudreau & Associates (consulting) since 2000; FINRA Industry Arbitrator, 2002-present; Chairman and Chief Executive Officer, John Hancock Funds (asset management), Chairman and Interested Trustee for open-end and closed-end funds offered by John Hancock, 1989-2000; John Hancock Life Insurance Company, including SVP and Treasurer and SVP Information Technology, 1968-1988 | | | 125 | | | Former Trustee, BofA Funds Series Trust (11 funds), 2005-2011; Trustee, Boston Museum of Science (Chair of Finance Committee), 1985-2013 | |
Pamela G. Carlton
901 S. Marquette Ave.
Minneapolis, MN 55402
1954 | | Board member since 7/07 for RiverSource Funds and since 6/11 for Nations Funds | | President, Springboard — Partners in Cross Cultural Leadership (consulting company) since 2003; Managing Director of US Equity Research, JP Morgan Chase, 1999-2003; Director of US Equity Research, Chase Asset Management, 1996- 1999; Co-Director Latin America Research, 1993-1996, COO Global Research, 1992-1996, Co-Director of US Research, 1991-1992, Investment Banker, Morgan Stanley, 1982-1991 | | | 127 | | | None | |
Annual Report 2015
35
COLUMBIA LARGE CAP ENHANCED CORE FUND
TRUSTEES AND OFFICERS (continued)
Independent Trustees (continued)
Name,
Address,
Year of Birth | | Position Held With
Funds and Length of
Service | | Principal Occupation(s)
During Past Five Years
and Other Relevant
Professional Experience | | Number of
Funds in the
Fund Family
Overseen by
Board Member | | Other Present or Past
Directorships/
Trusteeships
(Within Past 5 Years) | |
William P. Carmichael
901 S. Marquette Ave.
Minneapolis, MN 55402
1943 | | Chair of the Board since 1/14, Board member since 6/11 for RiverSource Funds and since 2003 for Nations Funds | | Retired; Co-founder, The Succession Fund (provides exit strategies to owners of privately held companies) 1998-2007; Adjunct Professor of Finances, Kelley School of Business, Indiana University, 1993-2007; Senior Vice President, Sara Lee Corporation, 1991-1993; Senior Vice President and Chief Financial Officer, Beatrice Foods Company, 1984-1990; Vice President, Esmark, Inc, 1973-1984.; Associate, Price Waterhouse, 1968-1972 | | | 127 | | | Director, Cobra Electronics Corporation (electronic equipment manufacturer), 1994-August 2014; The Finish Line (athletic shoes and apparel) since July 2003; Director, International Textile Corp. since 2012; former Director, McMoRan Exploration Company (oil and gas exploration and development) 2010-2013; former Trustee, BofA Funds Series Trust (11 funds) 2009-2011; Director, Spectrum Brands, Inc. (consumer products), 2002-2009; Director, Simmons Company (bedding), 2004-2010 | |
Patricia M. Flynn
901 S. Marquette Ave.
Minneapolis, MN 55402
1950 | | Board member since 11/04 for RiverSource Funds and since 6/11 for Nations Funds | | Trustee Professor of Economics and Management, Bentley University since 1976 (also teaches and conducts research on corporate governance); Dean, McCallum Graduate School of Business, Bentley University, 1992-2002 | | | 127 | | | Trustee, MA Taxpayers Foundation since 1997; Board of Governors, Innovation Institute, MA Technology Collaborative since 2010 | |
William A. Hawkins
901 S. Marquette Ave.
Minneapolis, MN 55402
1942 | | Board member since 6/11 for RiverSource Funds and since 1/05 for Nations Funds | | Managing Director, Overton Partners (financial consulting), since August 2010; President and Chief Executive Officer, California General Bank, N.A., January 2008-August 2010; Operation Hope, COO, 2004-2007; IndyMac Bancorp, President, CBG, 1999-2003; American General Bank, President, 1997-1999; Griffin Financial Services, CEO, 1981-1997; The Griffin Funds, CEO, 1992-1998 | | | 125 | | | Trustee, BofA Funds Series Trust (11 funds) | |
R. Glenn Hilliard
901 S. Marquette Ave.
Minneapolis, MN 55402
1943 | | Board member since 6/11 for RiverSource Funds and since 1/05 for Nations Funds | | Chairman and Chief Executive Officer, Hilliard Group LLC (investing and consulting) since April 2003; Non-Executive Director & Chairman, CNO Financial Group, Inc. (insurance), September 2003-May 2011 | | | 125 | | | Chairman, BofA Funds Series Trust (11 funds); former Director, CNO Financial Group, Inc. (insurance) 2003-2011 | |
Annual Report 2015
36
COLUMBIA LARGE CAP ENHANCED CORE FUND
TRUSTEES AND OFFICERS (continued)
Independent Trustees (continued)
Name,
Address,
Year of Birth | | Position Held With
Funds and Length of
Service | | Principal Occupation(s)
During Past Five Years
and Other Relevant
Professional Experience | | Number of
Funds in the
Fund Family
Overseen by
Board Member | | Other Present or Past
Directorships/
Trusteeships
(Within Past 5 Years) | |
Catherine James Paglia
901 S. Marquette Ave.
Minneapolis, MN 55402
1952 | | Board member since 11/04 for RiverSource Funds and since 6/11 for Nations Funds | | Director, Enterprise Asset Management, Inc. (private real estate and asset management company) since September 1998; Managing Director and Partner, Interlaken Capital, Inc., 1989-1997; Managing Director, Morgan Stanley, 1982-1989; Vice President, Investment Banking, 1980-1982, Associate, Investment Banking, 1976-1980, Dean Witter Reynolds, Inc. | | | 127 | | | Director, Valmont Industries, Inc. (irrigation systems manufacturer) since 2012; Trustee, Carleton College (on the Investment Committee); Trustee, Carnegie Endowment for International Peace (on the Investment Committee) | |
Leroy C. Richie
901 S. Marquette Ave.
Minneapolis, MN 55402
1941 | | Board member since 2000 for Seligman Funds, since 11/08 for RiverSource Funds and since 6/11 for Nations Funds | | Counsel, Lewis & Munday, P.C. (law firm) since 2004; Vice President and General Counsel, Automotive Legal Affairs, Chrysler Corporation, 1993-1997 | | | 127 | | | Lead Outside Director, Digital Ally, Inc. (digital imaging) since September 2005; Director, Infinity, Inc. (oil and gas exploration and production) since 1994; Director, OGE Energy Corp. (energy and energy services) since November 2007-2014 | |
Minor M. Shaw
901 S. Marquette Ave.
Minneapolis, MN 55402
1947 | | Board member since 6/11 for RiverSource Funds and since 2003 for Nations Funds | | President, Micco LLC (private investments) since 2011; President, Micco Corp. (family investment business) 1998-2011 | | | 125 | | | Director, Piedmont Natural Gas; Director, BlueCross BlueShield of South Carolina since April 2008; Chair of the Duke Endowment; Director, National Association of Corporate Directors, Carolinas Chapter, since 2013; Chair of Greenville-Spartanburg Airport Commission; former Trustee, BofA Funds Series Trust (11 funds), 2003-2011 | |
Alison Taunton-Rigby
901 S. Marquette Ave.
Minneapolis, MN 55402
1944 | | Board member since 11/02 for RiverSource Funds and since 6/11 for Nations Funds | | Managing Director, Forester Biotech (consulting) since 2001; Chief Executive Officer and Director, RiboNovix, Inc., (biotechnology) 2003-2010; President and Chief Executive Officer of CMT Inc., 2001-2003; Aquila Biopharmaceuticals Inc., 1996-2000; Cambridge Biotech Corporation, 1995-1996, Mitotix Inc., 1993-1994 | | | 127 | | | Director, Healthways, Inc. (health and well-being solutions) since 2005; Director, ICI Mutual Insurance Company, RRG since 2011; Director, Abt Associates (government contractor) since 2001; Director, Boston Children's Hospital since 2002 | |
Annual Report 2015
37
COLUMBIA LARGE CAP ENHANCED CORE FUND
TRUSTEES AND OFFICERS (continued)
Interested Trustee Not Affiliated with Investment Manager*
Name,
Address,
Year of Birth | | Position Held With
Funds and Length of
Service | | Principal Occupation
During Past Five Years | | Number of
Funds in the
Fund Family
Overseen by
Board Member | | Other Present or Past
Directorships/
Trusteeships
(Within Past 5 Years) | |
Anthony M. Santomero
901 S. Marquette Ave.
Minneapolis, MN 55402
1946 | | Board member since 6/11 for RiverSource Funds and since 1/08 for Nations Funds | | Richard K. Mellon Professor Emeritus of Finance, The Wharton School, University of Pennsylvania, since 2002; Senior Advisor, McKinsey & Company (consulting), 2006-2008; President, Federal Reserve Bank of Philadelphia, 2000-2006, Professor of Finance, The Wharton School, University of Pennsylvania, 1972-2002 | | | 125 | | | Director, Renaissance Reinsurance Ltd. since May 2008; Trustee, Penn Mutual Life Insurance Company since March 2008; Director, Citigroup Inc. since 2009; Director, Citibank, N.A. since 2009; former Trustee, BofA Funds Series Trust (11 funds), 2008-2011 | |
* Dr. Santomero is not an affiliated person of the Investment Manager or Ameriprise Financial. However, he is currently deemed by the Funds to be an "interested person" (as defined in the 1940 Act) of the Funds because he serves as a Director of Citigroup Inc. and Citibank, N.A., companies that may directly or through subsidiaries and affiliates engage from time-to-time in brokerage execution, principal transactions and lending relationships with the Funds or accounts advised/managed by the Investment Manager.
Annual Report 2015
38
COLUMBIA LARGE CAP ENHANCED CORE FUND
TRUSTEES AND OFFICERS (continued)
Interested Trustee Affiliated with Investment Manager*
Name,
Address,
Year of Birth | | Position Held With
Funds and Length of
Service | | Principal Occupation
During Past Five Years | | Number of
Funds in the
Fund Family
Overseen by
Board Member | | Other Present or Past
Directorships/
Trusteeships
(Within Past 5 Years) | |
William F. Truscott
53600 Ameriprise
Financial Center
Minneapolis, MN 55474
1960 | | Board member since 11/01 for RiverSource Funds and since 6/11 for Nations Funds; Senior Vice President since 2002 for RiverSource Funds and since 5/10 for Nations Funds | | Chairman of the Board and President, Columbia Management Investment Advisers, LLC since May 2010 and February 2012, respectively (previously President and Chief Investment Officer, 2001-April 2010); Chief Executive Officer, Global Asset Management, Ameriprise Financial, Inc. since September 2012 (previously Chief Executive Officer, U.S. Asset Management & President, Annuities, May 2010-September 2012 and President — U.S. Asset Management and Chief Investment Officer, 2005-April 2010); Director and Chief Executive Officer, Columbia Management Investment Distributors, Inc. since May 2010 and February 2012, respectively (previously Chairman of the Board and Chief Executive Officer, 2006-April 2010); Chairman of the Board and Chief Executive Officer, RiverSource Distributors, Inc. since 2006; Director, Threadneedle Asset Management Holdings, SARL since 2014; President and Chief Executive Officer, Ameriprise Certificate Company, 2006-August 2012 | | | 186 | | | Former Director, Ameriprise Certificate Company, 2006-January 2013 | |
* Interested person (as defined under the 1940 Act) by reason of being an officer, director, security holder and/or employee of the Investment Manager or Ameriprise Financial.
The Statement of Additional Information has additional information about the Fund's Board members and is available, without charge, upon request by calling 800.345.6611; contacting your financial intermediary or visiting columbiathreadneedle.com/us.
Annual Report 2015
39
COLUMBIA LARGE CAP ENHANCED CORE FUND
TRUSTEES AND OFFICERS (continued)
The Board has appointed officers who are responsible for day-to-day business decisions based on policies it has established. The officers serve at the pleasure of the Board. In addition to Mr. Truscott, who is Senior Vice President, the Funds' other officers are:
Fund Officers
Name,
Address and
Year of Birth | | Position and Year
First Appointed to
Position for any Fund
in the Columbia
Funds Complex or a
Predecessor Thereof | | Principal Occupation(s) During Past Five Years | |
Christopher O. Petersen
5228 Ameriprise
Financial Center
Minneapolis, MN 55474
Born 1970 | | President and Principal Executive Officer (2015) | | Vice President and Lead Chief Counsel, Ameriprise Financial, Inc. since January 2015 (previously, Vice President and Chief Counsel January 2010-December 2014; and Vice President and Group Counsel or Counsel 2004-January 2010); officer of Columbia Funds and affiliated funds since 2007. | |
Michael G. Clarke
225 Franklin Street
Boston, MA 02110
Born 1969 | | Treasurer (2011) and Chief Financial Officer (2009) | | Vice President — Mutual Fund Administration, Columbia Management Investment Advisers, LLC, since May 2010; Managing Director of Fund Administration, Columbia Management Advisors, LLC, September 2004-April 2010; senior officer of Columbia Funds and affiliated funds since 2002. | |
Paul B. Goucher
100 Park Avenue
New York, NY 10017
Born 1968 | | Senior Vice President (2011), Chief Legal Officer (2015) and Assistant Secretary (2008) | | Vice President and Lead Chief Counsel, Ameriprise Financial, Inc. since November 2008 and January 2013, respectively (previously Chief Counsel, January 2010-January 2013 and Group Counsel, November 2008-January 2010). | |
Thomas P. McGuire
225 Franklin Street
Boston, MA 02110
Born 1972 | | Vice President and Chief Compliance Officer (2012) | | Vice President — Asset Management Compliance, Ameriprise Financial, Inc., since May 2010; Chief Compliance Officer, Ameriprise Certificate Company since September 2010; Compliance Executive, Bank of America, 2005-April 2010. | |
Colin Moore
225 Franklin Street
Boston, MA 02110
Born 1958 | | Senior Vice President (2010) | | Executive Vice President and Global Chief Investment Officer, Ameriprise Financial, Inc., since July 2013; Director and Global Chief Investment Officer, Columbia Management Investment Advisers, LLC since May 2010; Manager, Managing Director and Chief Investment Officer, Columbia Management Advisors, LLC, 2007-April 2010. | |
Michael E. DeFao
225 Franklin Street
Boston, MA 02110
Born 1968 | | Vice President (2011) and Assistant Secretary (2010) | | Vice President and Chief Counsel, Ameriprise Financial, Inc. since May 2010; Associate General Counsel, Bank of America, 2005-April 2010. | |
Joseph F. DiMaria
225 Franklin Street
Boston, MA 02110
Born 1968 | | Vice President (2011), Assistant Treasurer (2012) and Chief Accounting Officer (2008) | | Vice President — Mutual Fund Treasurer, Columbia Management Investment Advisers, LLC since May 2010; Director of Fund Administration, Columbia Management Advisors, LLC, 2006-April 2010. | |
Amy Johnson
5228 Ameriprise
Financial Center
Minneapolis, MN 55474
Born 1965 | | Vice President (2006) | | Managing Director and Chief Operating Officer, Columbia Management Investment Advisers, LLC since May 2010 (previously Chief Administrative Officer, 2009-April 2010, and Vice President — Asset Management and Trust Company Services, 2006-2009). | |
Lyn Kephart-Strong
5228 Ameriprise
Financial Center
Minneapolis, MN 55474
Born 1960 | | Vice President (2015) | | President, Columbia Management Investment Services Corp. since October 2014; Vice President & Resolution Officer, Ameriprise Trust Company since August 2009; President, RiverSource Service Corporation 2004-2010. | |
Ryan C. Larrenaga
225 Franklin Street
Boston, MA 02110
Born 1970 | | Vice President and Secretary (2015) | | Vice President and Group Counsel, Ameriprise Financial, Inc. since August 2011 (previously, Counsel from May 2010 to August 2011); Assistant General Counsel, Bank of America, 2005-April 2010; officer of Columbia Funds and affiliated funds since 2005. | |
Annual Report 2015
40
COLUMBIA LARGE CAP ENHANCED CORE FUND
IMPORTANT INFORMATION ABOUT THIS REPORT
Each fund mails one shareholder report to each shareholder address. If you would like more than one report, please call shareholder services at 800.345.6611 and additional reports will be sent to you.
The policy of the Board is to vote the proxies of the companies in which each fund holds investments consistent with the procedures as stated in the Statement of Additional Information (SAI). You may obtain a copy of the SAI without charge by calling 800.345.6611; contacting your financial intermediary; visiting columbiathreadneedle.com/us; or searching the website of the Securities and Exchange Commission (SEC) at sec.gov. Information regarding how each fund voted proxies relating to portfolio securities is filed with the SEC by August 31st for the most recent 12-month period ending June 30th of that year, and is available without charge by visiting columbiathreadneedle.com/us; or searching the website of the SEC at sec.gov.
Each fund files a complete schedule of portfolio holdings with the SEC for the first and third quarters of each fiscal year on Form N-Q. Each fund's Form N-Q is available on the SEC's website at sec.gov and may be reviewed and copied at the SEC's Public Reference Room in Washington, D.C. Information on the operation of the Public Reference Room may be obtained by calling 800.SEC.0330. Each fund's complete schedule of portfolio holdings, as filed on Form N-Q, can also be obtained without charge, upon request, by calling 800.345.6611.
Annual Report 2015
41
Columbia Large Cap Enhanced Core Fund
P.O. Box 8081
Boston, MA 02266-8081

This information is for use with concurrent or prior delivery of a fund prospectus. Please read and consider the investment objectives, risks, charges and expenses for any fund carefully before investing. For a prospectus and summary prospectus, which contains this and other important information about the Fund, go to columbiathreadneedle.com/us. The Fund is distributed by Columbia Management Investment Distributors, Inc., member FINRA, and managed by Columbia Management Investment Advisers, LLC.
Columbia Threadneedle Investments (Columbia Threadneedle) is the global brand name of the Columbia and Threadneedle group of companies.
All rights reserved. Columbia Management Investment Distributors, Inc., 225 Franklin Street, Boston, MA 02110-2804
© 2015 Columbia Management Investment Advisers, LLC.
columbiathreadneedle.com/us
ANN173_02_E01_(04/15)

ANNUAL REPORT
February 28, 2015

COLUMBIA LARGE CAP INDEX FUND

 Dear Shareholder,
In a world that is changing faster than ever before, investors want asset managers who offer a global perspective while generating strong and sustainable returns. To that end, Columbia Management, in conjunction with its U.K.-based affiliate, Threadneedle Investments, has rebranded to Columbia Threadneedle Investments. The new global brand represents the combined capabilities, resources and reach of the global group, offering investors access to the best of both firms.
With a presence in 18 countries and more than 450 investment professionals*, our collective perspective and world view as Columbia Threadneedle Investments gives us deeper insight into what might affect the real-life financial outcomes clients are seeking. Putting our views into a global context enables us to build richer perspectives and create the right solutions, and provides us with enhanced capabilities to deliver consistent investment performance, which may ultimately lead to better investor outcomes.
As a result of the rebrand, you will begin to see our new logo and colors reflected in printed materials, such as this shareholder report, as well as on our new website — columbiathreadneedle.com/us. We encourage you to visit us online and view a new video on the "About Us" tab that speaks to the strength of the firm.
While we are introducing a new brand, in many ways, the investment company you know well has not changed. The following remain in effect:
n Fund and strategy names
n Established investment teams, philosophies and processes
n Account services, features, servicing phone numbers and mailing addresses
n Columbia Management Investment Distributors as distributor and Columbia Management Investment Advisers as investment adviser
We recognize that the money we manage represents the hard work and savings of people like you, and that everyone has different ambitions and different definitions of success. Investors have varying goals — funding their children's education, enjoying their retirement, putting money aside for unexpected events, and more. Whatever your ambitions, we believe our wide range of investment products and solutions can help give you confidence that you will reach your goals.
The world is constantly changing, but our priority remains the same: to help you secure your finances, meet your goals and achieve success. Thank you for your continued investment with us. Our service representatives are available at 800.345.6611 to help with any questions.
Sincerely,

Christopher O. Petersen
President, Columbia Funds
Investors should consider the investment objectives, risks, charges and expenses of a mutual fund carefully before investing. For a free prospectus and summary prospectus, which contains this and other important information about a fund, visit columbiathreadneedle.com/us. The prospectus should be read carefully before investing.
* Source: Ameriprise as of December 1, 2014
Columbia Funds are distributed by Columbia Management Investment Distributors, Inc., member FINRA, and managed by Columbia Management Investment Advisers, LLC.
© 2015 Columbia Management Investment Advisers, LLC. All rights reserved.
COLUMBIA LARGE CAP INDEX FUND
Performance Overview | | | 2 | | |
Manager Discussion of Fund Performance | | | 4 | | |
Understanding Your Fund's Expenses | | | 6 | | |
Portfolio of Investments | | | 7 | | |
Statement of Assets and Liabilities | | | 19 | | |
Statement of Operations | | | 21 | | |
Statement of Changes in Net Assets | | | 22 | | |
Financial Highlights | | | 24 | | |
Notes to Financial Statements | | | 29 | | |
Report of Independent Registered
Public Accounting Firm | | | 37 | | |
Federal Income Tax Information | | | 38 | | |
Trustees and Officers | | | 39 | | |
Important Information About This Report | | | 45 | | |
Fund Investment Manager
Columbia Management Investment
Advisers, LLC
225 Franklin Street
Boston, MA 02110
Fund Distributor
Columbia Management Investment
Distributors, Inc.
225 Franklin Street
Boston, MA 02110
Fund Transfer Agent
Columbia Management Investment
Services Corp.
P.O. Box 8081
Boston, MA 02266-8081
For more information about any of the funds, please visit columbiathreadneedle.com/us or call 800.345.6611. Customer Service Representatives are available to answer your questions Monday through Friday from 8 a.m. to 7 p.m. Eastern time.
The views expressed in this report reflect the current views of the respective parties. These views are not guarantees of future performance and involve certain risks, uncertainties and assumptions that are difficult to predict, so actual outcomes and results may differ significantly from the views expressed. These views are subject to change at any time based upon economic, market or other conditions and the respective parties disclaim any responsibility to update such views. These views may not be relied on as investment advice and, because investment decisions for a Columbia fund are based on numerous factors, may not be relied on as an indication of trading intent on behalf of any particular Columbia fund. References to specific securities should not be construed as a recommendation or investment advice.
COLUMBIA LARGE CAP INDEX FUND
Performance Summary
n Columbia Large Cap Index Fund (the Fund) Class A shares returned 14.98% for the 12-month period that ended February 28, 2015.
n The Fund underperformed its benchmark, the unmanaged S&P 500 Index, which returned 15.51% for the same period.
n Mutual funds, unlike unmanaged indices, incur operating expenses, which accounted for the Fund's underperformance relative to the benchmark.
Average Annual Total Returns (%) (for period ended February 28, 2015)
| | | Inception | | 1 Year | | 5 Years | | 10 Years | |
Class A | | 10/10/95 | | | 14.98 | | | | 15.68 | | | | 7.56 | | |
Class B* | | 09/23/05 | | | | | | | | | | | | | |
Excluding sales charges | | | | | | | 14.20 | | | | 14.84 | | | | 6.78 | | |
Including sales charges | | | | | | | 9.20 | | | | 14.61 | | | | 6.78 | | |
Class I* | | 11/16/11 | | | 15.27 | | | | 15.96 | | | | 7.79 | | |
Class R5* | | 11/08/12 | | | 15.25 | | | | 15.98 | | | | 7.83 | | |
Class Z | | 12/15/93 | | | 15.27 | | | | 15.98 | | | | 7.83 | | |
S&P 500 Index | | | | | | | 15.51 | | | | 16.18 | | | | 7.99 | | |
Returns for Class B are shown with and without the applicable contingent deferred sales charge (CDSC) of 5.00% in the first year, declining to 1.00% in the sixth year and eliminated thereafter. The Fund's other classes are not subject to sales charges and have limited eligibility. Please see the Fund's prospectus for details. Performance for different share classes will vary based on differences in sales charges and fees associated with each class. All results shown assume reinvestment of distributions during the period. Returns do not reflect the deduction of taxes that a shareholder may pay on Fund distributions or on the redemption of Fund shares. Performance results reflect the effect of any fee waivers or reimbursements of Fund expenses by Columbia Management Investment Advisers, LLC and/or any of its affiliates. Absent these fee waivers or expense reimbursement arrangements, performance results would have been lower.
The performance information shown represents past performance and is not a guarantee of future results. The investment return and principal value of your investment will fluctuate so that your shares, when redeemed, may be worth more or less than their original cost. Current performance may be lower or higher than the performance information shown. You may obtain performance information current to the most recent month-end by contacting your financial intermediary, visiting columbiathreadneedle.com/us or calling 800.345.6611.
*The returns shown for periods prior to the share class inception date (including returns for the Life of the Fund, if shown, which are since Fund inception) include the returns of the Fund's oldest share class. These returns are adjusted to reflect any higher class-related operating expenses of the newer share classes, as applicable. Please visit columbiathreadneedle.com/us/investment-products/mutual-funds/appended-performance for more information.
The S&P 500 Index, an unmanaged index, measures the performance of 500 widely held, large-capitalization U.S. stocks and is frequently used as a general measure of market performance.
Indices are not available for investment, are not professionally managed and do not reflect sales charges, fees, brokerage commissions, taxes or other expenses of investing. Securities in the Fund may not match those in an index.
Annual Report 2015
2
COLUMBIA LARGE CAP INDEX FUND
PERFORMANCE OVERVIEW (continued)
Performance of a Hypothetical $10,000 Investment (March 1, 2005 – February 28, 2015)
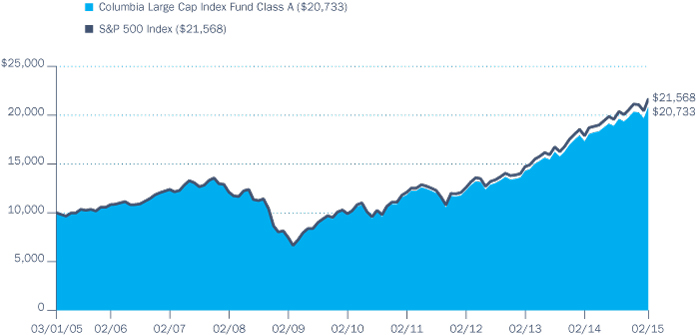
The chart above shows the change in value of a hypothetical $10,000 investment in Class A shares of Columbia Large Cap Index during the stated time period, and does not reflect the deduction of taxes that a shareholder may pay on Fund distributions or on the redemption of Fund shares.
Annual Report 2015
3
COLUMBIA LARGE CAP INDEX FUND
MANAGER DISCUSSION OF FUND PERFORMANCE
Portfolio Management
Christopher Lo, CFA*
Vadim Shteyn
*Effective December 3, 2014, Christopher Lo was added as a Portfolio Manager to the Fund.
Morningstar Style BoxTM

The Morningstar Style BoxTM is based on a fund's portfolio holdings. For equity funds, the vertical axis shows the market capitalization of the stocks owned, and the horizontal axis shows investment style (value, blend, or growth). Information shown is based on the most recent data provided by Morningstar.
© 2015 Morningstar, Inc. All rights reserved. The Morningstar information contained herein: (1) is proprietary to Morningstar and/or its content providers; (2) may not be copied or distributed; and (3) is not warranted to be accurate, complete or timely. Neither Morningstar nor its content providers are responsible for any damages or losses arising from any use of this information.
Top Ten Holdings (%)
(at February 28, 2015) | |
Apple, Inc. | | | 4.0 | | |
Exxon Mobil Corp. | | | 2.0 | | |
Microsoft Corp. | | | 1.9 | | |
Johnson & Johnson | | | 1.5 | | |
Berkshire Hathaway, Inc., Class B | | | 1.4 | | |
General Electric Co. | | | 1.4 | | |
Wells Fargo & Co. | | | 1.4 | | |
Procter & Gamble Co. (The) | | | 1.2 | | |
JPMorgan Chase & Co. | | | 1.2 | | |
Pfizer, Inc. | | | 1.2 | | |
Percentages indicated are based upon total investments (excluding Money Market Funds).
For further detail about these holdings, please refer to the section entitled "Portfolio of Investments."
Fund holdings are as of the date given, are subject to change at any time, and are not recommendations to buy or sell any security.
For the 12-month period that ended February 28, 2015, the Fund's Class A shares returned 14.98%. The Fund underperformed its benchmark, the unmanaged S&P 500 Index, which increased 15.51% for the same period. Mutual funds, unlike unmanaged indices, incur operating expenses, which accounted for the Fund's underperformance relative to the benchmark.
U.S. Equity Market Posted Strong Gains
The S&P 500 Index posted healthy double-digit gains during the annual period, achieving new highs and broad market participation, even as significant shifts were seen in the business world and wider society.
A torrent of corporate mergers helped drive stocks higher. Alibaba, the dominant Chinese online retailer, executed the largest Initial Public Offering ever in September 2014. A near halving in the price of crude oil during the annual period was bad news for many energy companies, but the decline in the cost of fuel was a boon for airlines. Volatility heightened in the second half of 2014 and into January 2015, as concerns about global economic growth, emerging markets' health, geopolitical tensions and plunging oil prices had investors on edge. A stronger U.S. dollar also led to many companies missing fourth quarter 2014 earnings or reducing forward estimates. After declining in January 2015, the S&P 500 Index again gained ground in February 2015, enjoying its best monthly performance since November 2011. Also, after an 18-month run of posting at least one new closing high per month from July 2013 to December 2014 and then taking a breather in January, the S&P 500 Index posted four new closing highs in February 2015. As the market moved higher, volatility moved lower, as concerns about Greece and Ukraine declined and corporate earnings improved. Still, for the annual period as a whole, investors generally rotated toward traditionally defensive sectors, such as consumer staples and healthcare, helped in part by the steady decline in long-term interest rates. More cyclical sectors, such as materials and industrials, were not in favor overall.
S&P 500 Index Enjoyed Broad-Based Gains
Nine of the ten sectors of the S&P 500 Index posted positive returns during the 12 months ended February 28, 2015, with energy being the sole sector posting negative returns. In terms of total return, healthcare, information technology and consumer staples were the best relative performers. On the basis of impact, which takes weightings and total returns into account, information technology, healthcare and financials were the biggest contributors to the index's return. The top performing industries for the annual period were computers and peripherals, airlines, healthcare providers and services, semiconductors and semiconductor equipment and specialty retail.
Conversely, energy, materials and industrials, each traditionally considered a more cyclical sector, were the weakest sectors from a total return perspective. On the basis of impact, energy, telecommunication services and materials were the weakest. The worst performing industries for the annual period were independent power and renewable electricity producers, leisure products, trading companies and distributors, energy equipment and services and construction and engineering.
Annual Report 2015
4
COLUMBIA LARGE CAP INDEX FUND
MANAGER DISCUSSION OF FUND PERFORMANCE (continued)
Top individual contributors within the S&P 500 Index included information technology giants Apple, Microsoft and Intel; diversified conglomerate Berkshire Hathaway Class B; and financials company Wells Fargo. Top detractors were information technology companies Google and International Business Machines; energy-related companies Exxon Mobil and Halliburton; and gold and copper mining company Freeport-McMoRan Copper & Gold.
As always, each sector and stock in the S&P 500 Index was represented in the Fund with approximately the same weighting as in the index and therefore had a similar effect.
Index Additions and Deletions Drove Portfolio Changes
During the annual period, there were 18 additions and 16 deletions to the index and the Fund's portfolio. Among those stocks added to the index and Fund were consumer staples firm Keurig Green Mountain; information technology companies Google and Avago Technologies; healthcare companies Mallinckrodt, Universal Health Services, Endo International and HCA Holdings; financials firms Navient and Affiliated Managers Group; consumer discretionary companies Under Armour and Royal Caribbean Cruises; and industrials company United Rentals.
Deletions included energy companies WPX Energy, Rowan and Peabody Energy; consumer staples companies Beam Suntory and Safeway; consumer discretionary companies International Game Technology and Graham Holdings; materials firms Cliffs Natural Resources, United States Steel and Bemis; and healthcare companies Forest Laboratories and Covidien.
Looking Ahead
At this time, we do not anticipate any changes in the portfolio beyond the customary quarterly rebalancings and stock substitutions we make to align the Fund with the S&P 500 Index.
From a broad perspective, the Federal Reserve has given strong signals that economic growth in the U.S. has reached self-sustaining momentum and no longer needs unconventional efforts to support the expansion. We believe several factors support this view. First, the rapid drop in oil prices may act as a significant short-term boost to global economic growth. Second, we believe consumer spending, which currently accounts for approximately 68% of U.S. gross domestic product, should remain relatively healthy, and, in our view, could even accelerate. Third, the economic expansion appears to be in a phase of higher capital expenditures, or capex. Investment-led expansions tend to last longer than those that are led by consumer spending. At the end of the annual period, capacity utilization, a capex leading indicator, was nearing the critical 80% level, which has historically meant demand is sufficiently high to warrant the expansion of capital investments. Further, prior underinvestment in fixed assets and the old age of those assets may suggest a sustained expansion in capex. As the Fund seeks to closely approximate the performance of the S&P 500 Index, we will continue to match its industry and risk characteristics by investing primarily in the securities that comprise the index.
Portfolio Breakdown (%)
(at February 28, 2015) | |
Common Stocks | | | 95.3 | | |
Consumer Discretionary | | | 11.9 | | |
Consumer Staples | | | 9.3 | | |
Energy | | | 7.7 | | |
Financials | | | 15.3 | | |
Health Care | | | 14.1 | | |
Industrials | | | 9.8 | | |
Information Technology | | | 19.0 | | |
Materials | | | 3.1 | | |
Telecommunication Services | | | 2.2 | | |
Utilities | | | 2.9 | | |
Money Market Funds | | | 4.7 | | |
Total | | | 100.0 | | |
Percentages indicated are based upon total investments. The Fund's portfolio composition is subject to change.
Investment Risks
Market risk may affect a single issuer, sector of the economy, industry or the market as a whole. Investing in derivatives is a specialized activity that involves special risks, which may result in significant losses. The Fund's net value will generally decline when the performance of its targeted index declines. See the Fund's prospectus for more information on these and other risks.
Annual Report 2015
5
COLUMBIA LARGE CAP INDEX FUND
UNDERSTANDING YOUR FUND'S EXPENSES
(Unaudited)
As an investor, you incur two types of costs. There are transaction costs, which generally include sales charges on purchases and may include redemption fees. There are also ongoing costs, which generally include management fees, distribution and/or service fees, and other fund expenses. The following information is intended to help you understand your ongoing costs (in dollars) of investing in the Fund and to help you compare these costs with the ongoing costs of investing in other mutual funds.
Analyzing Your Fund's Expenses
To illustrate these ongoing costs, we have provided examples and calculated the expenses paid by investors in each share class of the Fund during the period. The actual and hypothetical information in the table is based on an initial investment of $1,000 at the beginning of the period indicated and held for the entire period. Expense information is calculated two ways and each method provides you with different information. The amount listed in the "Actual" column is calculated using the Fund's actual operating expenses and total return for the period. You may use the Actual information, together with the amount invested, to estimate the expenses that you paid over the period. Simply divide your account value by $1,000 (for example, an $8,600 account value divided by $1,000 = 8.6), then multiply the results by the expenses paid during the period under the "Actual" column. The amount listed in the "Hypothetical" column assumes a 5% annual rate of return before expenses (which is not the Fund's actual return) and then applies the Fund's actual expense ratio for the period to the hypothetical return. You should not use the hypothetical account values and expenses to estimate either your actual account balance at the end of the period or the expenses you paid during the period. See "Compare With Other Funds" below for details on how to use the hypothetical data.
Compare With Other Funds
Since all mutual funds are required to include the same hypothetical calculations about expenses in shareholder reports, you can use this information to compare the ongoing cost of investing in the Fund with other funds. To do so, compare the hypothetical example with the 5% hypothetical examples that appear in the shareholder reports of other funds. As you compare hypothetical examples of other funds, it is important to note that hypothetical examples are meant to highlight the ongoing costs of investing in a fund only and do not reflect any transaction costs, such as sales charges, or redemption or exchange fees. Therefore, the hypothetical calculations are useful in comparing ongoing costs only, and will not help you determine the relative total costs of owning different funds. If transaction costs were included in these calculations, your costs would be higher.
September 1, 2014 – February 28, 2015
| | | Account Value at the Beginning
of the Period ($) | | Account Value at the End of the
Period ($) | | Expenses Paid During the
Period ($) | | Fund's Annualized
Expense Ratio (%) | |
| | | Actual | | Hypothetical | | Actual | | Hypothetical | | Actual | | Hypothetical | | Actual | |
Class A | | | 1,000.00 | | | | 1,000.00 | | | | 1,058.80 | | | | 1,022.69 | | | | 2.31 | | | | 2.27 | | | | 0.45 | | |
Class B | | | 1,000.00 | | | | 1,000.00 | | | | 1,055.20 | | | | 1,018.95 | | | | 6.15 | | | | 6.04 | | | | 1.20 | | |
Class I | | | 1,000.00 | | | | 1,000.00 | | | | 1,060.20 | | | | 1,023.93 | | | | 1.03 | | | | 1.01 | | | | 0.20 | | |
Class R5 | | | 1,000.00 | | | | 1,000.00 | | | | 1,060.10 | | | | 1,023.93 | | | | 1.03 | | | | 1.01 | | | | 0.20 | | |
Class Z | | | 1,000.00 | | | | 1,000.00 | | | | 1,060.10 | | | | 1,023.93 | | | | 1.03 | | | | 1.01 | | | | 0.20 | | |
Expenses paid during the period are equal to the annualized expense ratio for each class as indicated above, multiplied by the average account value over the period and then multiplied by the number of days in the Fund's most recent fiscal half year and divided by 365.
Expenses do not include fees and expenses incurred indirectly by the Fund from its investment in underlying funds, including affiliated and non-affiliated pooled investment vehicles, such as mutual funds and exchange-traded funds.
Had Columbia Management Investment Advisers, LLC and/or certain of its affiliates not waived/reimbursed certain fees and expenses, account value at the end of the period would have been reduced.
Annual Report 2015
6
COLUMBIA LARGE CAP INDEX FUND
PORTFOLIO OF INVESTMENTS
February 28, 2015
(Percentages represent value of investments compared to net assets)
Common Stocks 95.2%
Issuer | | Shares | | Value ($) | |
CONSUMER DISCRETIONARY 11.9% | |
Auto Components 0.4% | |
BorgWarner, Inc. | | | 42,929 | | | | 2,638,416 | | |
Delphi Automotive PLC | | | 55,907 | | | | 4,407,708 | | |
Goodyear Tire & Rubber Co. (The) | | | 51,835 | | | | 1,385,550 | | |
Johnson Controls, Inc. | | | 125,773 | | | | 6,390,526 | | |
Total | | | | | 14,822,200 | | |
Automobiles 0.6% | |
Ford Motor Co. | | | 726,596 | | | | 11,872,579 | | |
General Motors Co. | | | 254,804 | | | | 9,506,737 | | |
Harley-Davidson, Inc. | | | 40,439 | | | | 2,570,707 | | |
Total | | | | | 23,950,023 | | |
Distributors 0.1% | |
Genuine Parts Co. | | | 28,868 | | | | 2,773,637 | | |
Diversified Consumer Services 0.1% | |
H&R Block, Inc. | | | 51,945 | | | | 1,773,922 | | |
Hotels, Restaurants & Leisure 1.6% | |
Carnival Corp. | | | 85,032 | | | | 3,740,558 | | |
Chipotle Mexican Grill, Inc.(a) | | | 5,864 | | | | 3,899,384 | | |
Darden Restaurants, Inc. | | | 23,434 | | | | 1,499,776 | | |
Marriott International, Inc., Class A | | | 40,122 | | | | 3,334,138 | | |
McDonald's Corp. | | | 183,726 | | | | 18,170,501 | | |
Royal Caribbean Cruises Ltd. | | | 31,530 | | | | 2,409,523 | | |
Starbucks Corp. | | | 141,262 | | | | 13,205,878 | | |
Starwood Hotels & Resorts Worldwide, Inc. | | | 33,702 | | | | 2,707,282 | | |
Wyndham Worldwide Corp. | | | 23,273 | | | | 2,129,014 | | |
Wynn Resorts Ltd. | | | 15,293 | | | | 2,179,252 | | |
Yum! Brands, Inc. | | | 82,605 | | | | 6,700,092 | | |
Total | | | | | 59,975,398 | | |
Household Durables 0.4% | |
D.R. Horton, Inc. | | | 62,640 | | | | 1,710,698 | | |
Garmin Ltd. | | | 22,737 | | | | 1,128,437 | | |
Harman International Industries, Inc. | | | 12,945 | | | | 1,786,281 | | |
Leggett & Platt, Inc. | | | 25,982 | | | | 1,170,489 | | |
Lennar Corp., Class A | | | 33,710 | | | | 1,692,579 | | |
Mohawk Industries, Inc.(a) | | | 11,710 | | | | 2,158,738 | | |
Newell Rubbermaid, Inc. | | | 51,186 | | | | 2,011,098 | | |
PulteGroup, Inc. | | | 63,009 | | | | 1,421,483 | | |
Whirlpool Corp. | | | 14,689 | | | | 3,113,334 | | |
Total | | | | | 16,193,137 | | |
Common Stocks (continued)
Issuer | | Shares | | Value ($) | |
Internet & Catalog Retail 1.3% | |
Amazon.com, Inc.(a) | | | 71,681 | | | | 27,250,249 | | |
Expedia, Inc. | | | 18,629 | | | | 1,709,211 | | |
Netflix, Inc.(a) | | | 11,372 | | | | 5,400,676 | | |
Priceline Group, Inc. (The)(a) | | | 9,889 | | | | 12,237,440 | | |
TripAdvisor, Inc.(a) | | | 21,046 | | | | 1,878,355 | | |
Total | | | | | 48,475,931 | | |
Leisure Products 0.1% | |
Hasbro, Inc. | | | 21,347 | | | | 1,330,238 | | |
Mattel, Inc. | | | 63,965 | | | | 1,683,559 | | |
Total | | | | | 3,013,797 | | |
Media 3.4% | |
Cablevision Systems Corp., Class A | | | 41,333 | | | | 776,234 | | |
CBS Corp., Class B Non Voting | | | 90,013 | | | | 5,319,768 | | |
Comcast Corp., Class A | | | 486,371 | | | | 28,880,710 | | |
DIRECTV(a) | | | 94,816 | | | | 8,400,698 | | |
Discovery Communications, Inc., Class A(a) | | | 28,032 | | | | 905,434 | | |
Discovery Communications, Inc., Class C(a) | | | 51,582 | | | | 1,573,767 | | |
Gannett Co., Inc. | | | 42,640 | | | | 1,509,456 | | |
Interpublic Group of Companies, Inc. (The) | | | 78,945 | | | | 1,760,473 | | |
News Corp., Class A(a) | | | 94,191 | | | | 1,627,149 | | |
Omnicom Group, Inc. | | | 46,853 | | | | 3,726,688 | | |
Scripps Networks Interactive, Inc., Class A | | | 19,167 | | | | 1,385,774 | | |
Time Warner Cable, Inc. | | | 52,958 | | | | 8,158,180 | | |
Time Warner, Inc. | | | 158,287 | | | | 12,957,374 | | |
Twenty-First Century Fox, Inc., Class A | | | 350,054 | | | | 12,251,890 | | |
Viacom, Inc., Class B | | | 69,751 | | | | 4,878,385 | | |
Walt Disney Co. (The) | | | 294,514 | | | | 30,653,017 | | |
Total | | | | | 124,764,997 | | |
Multiline Retail 0.7% | |
Dollar General Corp.(a) | | | 57,286 | | | | 4,160,109 | | |
Dollar Tree, Inc.(a) | | | 38,828 | | | | 3,093,815 | | |
Family Dollar Stores, Inc. | | | 18,122 | | | | 1,426,926 | | |
Kohl's Corp. | | | 38,145 | | | | 2,815,101 | | |
Macy's, Inc. | | | 65,176 | | | | 4,153,015 | | |
Nordstrom, Inc. | | | 26,567 | | | | 2,136,784 | | |
Target Corp. | | | 120,243 | | | | 9,238,270 | | |
Total | | | | | 27,024,020 | | |
The accompanying Notes to Financial Statements are an integral part of this statement.
Annual Report 2015
7
COLUMBIA LARGE CAP INDEX FUND
PORTFOLIO OF INVESTMENTS (continued)
February 28, 2015
Common Stocks (continued)
Issuer | | Shares | | Value ($) | |
Specialty Retail 2.4% | |
AutoNation, Inc.(a) | | | 14,089 | | | | 866,474 | | |
AutoZone, Inc.(a) | | | 6,037 | | | | 3,879,859 | | |
Bed Bath & Beyond, Inc.(a) | | | 34,971 | | | | 2,610,935 | | |
Best Buy Co., Inc. | | | 54,969 | | | | 2,094,319 | | |
CarMax, Inc.(a) | | | 40,665 | | | | 2,729,028 | | |
GameStop Corp., Class A | | | 20,492 | | | | 757,589 | | |
Gap, Inc. (The) | | | 50,390 | | | | 2,096,224 | | |
Home Depot, Inc. (The) | | | 248,802 | | | | 28,550,030 | | |
L Brands, Inc. | | | 46,406 | | | | 4,262,855 | | |
Lowe's Companies, Inc. | | | 183,668 | | | | 13,607,962 | | |
O'Reilly Automotive, Inc.(a) | | | 19,154 | | | | 3,986,522 | | |
PetSmart, Inc. | | | 18,776 | | | | 1,556,718 | | |
Ross Stores, Inc. | | | 39,607 | | | | 4,190,817 | | |
Staples, Inc. | | | 120,778 | | | | 2,024,843 | | |
Tiffany & Co. | | | 21,254 | | | | 1,875,028 | | |
TJX Companies, Inc. (The) | | | 130,053 | | | | 8,926,838 | | |
Tractor Supply Co. | | | 25,660 | | | | 2,261,159 | | |
Urban Outfitters, Inc.(a) | | | 18,895 | | | | 736,149 | | |
Total | | | | | 87,013,349 | | |
Textiles, Apparel & Luxury Goods 0.8% | |
Coach, Inc. | | | 52,034 | | | | 2,266,081 | | |
Fossil Group, Inc.(a) | | | 8,491 | | | | 730,311 | | |
Michael Kors Holdings Ltd.(a) | | | 38,880 | | | | 2,620,901 | | |
Nike, Inc., Class B | | | 131,749 | | | | 12,795,463 | | |
PVH Corp. | | | 15,565 | | | | 1,658,139 | | |
Ralph Lauren Corp. | | | 11,430 | | | | 1,570,596 | | |
Under Armour, Inc., Class A(a) | | | 31,470 | | | | 2,423,505 | | |
VF Corp. | | | 65,227 | | | | 5,000,302 | | |
Total | | | | | 29,065,298 | | |
Total Consumer Discretionary | | | | | 438,845,709 | | |
CONSUMER STAPLES 9.3% | |
Beverages 2.1% | |
Brown-Forman Corp., Class B | | | 29,549 | | | | 2,709,348 | | |
Coca-Cola Co. (The) | | | 744,214 | | | | 32,224,466 | | |
Coca-Cola Enterprises, Inc. | | | 41,990 | | | | 1,939,938 | | |
Constellation Brands, Inc., Class A(a) | | | 31,672 | | | | 3,633,412 | | |
Dr. Pepper Snapple Group, Inc. | | | 36,714 | | | | 2,892,696 | | |
Molson Coors Brewing Co., Class B | | | 30,079 | | | | 2,282,695 | | |
Common Stocks (continued)
Issuer | | Shares | | Value ($) | |
Monster Beverage Corp.(a) | | | 27,223 | | | | 3,841,710 | | |
PepsiCo, Inc. | | | 282,537 | | | | 27,965,512 | | |
Total | | | | | 77,489,777 | | |
Food & Staples Retailing 2.4% | |
Costco Wholesale Corp. | | | 82,648 | | | | 12,145,950 | | |
CVS Health Corp. | | | 216,428 | | | | 22,480,377 | | |
Kroger Co. (The) | | | 92,702 | | | | 6,595,747 | | |
SYSCO Corp. | | | 110,979 | | | | 4,327,071 | | |
Wal-Mart Stores, Inc. | | | 298,156 | | | | 25,024,233 | | |
Walgreens Boots Alliance, Inc. | | | 164,217 | | | | 13,643,149 | | |
Whole Foods Market, Inc. | | | 67,915 | | | | 3,836,518 | | |
Total | | | | | 88,053,045 | | |
Food Products 1.5% | |
Archer-Daniels-Midland Co. | | | 121,547 | | | | 5,819,670 | | |
Campbell Soup Co. | | | 33,816 | | | | 1,575,487 | | |
ConAgra Foods, Inc. | | | 80,202 | | | | 2,805,466 | | |
General Mills, Inc. | | | 113,989 | | | | 6,131,468 | | |
Hershey Co. (The) | | | 27,938 | | | | 2,899,406 | | |
Hormel Foods Corp. | | | 25,372 | | | | 1,484,516 | | |
JM Smucker Co. (The) | | | 19,211 | | | | 2,215,989 | | |
Kellogg Co. | | | 47,599 | | | | 3,069,184 | | |
Keurig Green Mountain, Inc. | | | 22,950 | | | | 2,927,961 | | |
Kraft Foods Group, Inc. | | | 111,173 | | | | 7,121,742 | | |
McCormick & Co., Inc. | | | 24,393 | | | | 1,838,744 | | |
Mead Johnson Nutrition Co. | | | 38,133 | | | | 3,994,813 | | |
Mondelez International, Inc., Class A | | | 317,162 | | | | 11,714,379 | | |
Tyson Foods, Inc., Class A | | �� | 55,322 | | | | 2,285,352 | | |
Total | | | | | 55,884,177 | | |
Household Products 1.7% | |
Clorox Co. (The) | | | 24,439 | | | | 2,655,053 | | |
Colgate-Palmolive Co. | | | 161,750 | | | | 11,455,135 | | |
Kimberly-Clark Corp. | | | 70,304 | | | | 7,709,536 | | |
Procter & Gamble Co. (The) | | | 510,130 | | | | 43,427,367 | | |
Total | | | | | 65,247,091 | | |
Personal Products 0.1% | |
Avon Products, Inc. | | | 82,069 | | | | 698,407 | | |
Estee Lauder Companies, Inc. (The),
Class A | | | 42,293 | | | | 3,496,363 | | |
Total | | | | | 4,194,770 | | |
The accompanying Notes to Financial Statements are an integral part of this statement.
Annual Report 2015
8
COLUMBIA LARGE CAP INDEX FUND
PORTFOLIO OF INVESTMENTS (continued)
February 28, 2015
Common Stocks (continued)
Issuer | | Shares | | Value ($) | |
Tobacco 1.5% | |
Altria Group, Inc. | | | 373,128 | | | | 21,003,375 | | |
Lorillard, Inc. | | | 67,956 | | | | 4,649,550 | | |
Philip Morris International, Inc. | | | 293,327 | | | | 24,334,408 | | |
Reynolds American, Inc. | | | 58,175 | | | | 4,399,193 | | |
Total | | | | | 54,386,526 | | |
Total Consumer Staples | | | | | 345,255,386 | | |
ENERGY 7.8% | |
Energy Equipment & Services 1.3% | |
Baker Hughes, Inc. | | | 81,697 | | | | 5,106,880 | | |
Cameron International Corp.(a) | | | 37,266 | | | | 1,754,483 | | |
Diamond Offshore Drilling, Inc. | | | 12,698 | | | | 386,400 | | |
Ensco PLC, Class A | | | 44,245 | | | | 1,082,675 | | |
FMC Technologies, Inc.(a) | | | 44,136 | | | | 1,762,351 | | |
Halliburton Co. | | | 159,982 | | | | 6,869,627 | | |
Helmerich & Payne, Inc. | | | 20,433 | | | | 1,370,237 | | |
Nabors Industries Ltd. | | | 54,642 | | | | 699,964 | | |
National Oilwell Varco, Inc. | | | 81,297 | | | | 4,418,492 | | |
Noble Corp. PLC | | | 47,580 | | | | 791,731 | | |
Schlumberger Ltd. | | | 242,930 | | | | 20,444,989 | | |
Transocean Ltd. | | | 64,280 | | | | 1,036,836 | | |
Total | | | | | 45,724,665 | | |
Oil, Gas & Consumable Fuels 6.5% | |
Anadarko Petroleum Corp. | | | 95,614 | | | | 8,053,567 | | |
Apache Corp. | | | 71,075 | | | | 4,679,578 | | |
Cabot Oil & Gas Corp. | | | 77,983 | | | | 2,261,507 | | |
Chesapeake Energy Corp. | | | 97,950 | | | | 1,633,806 | | |
Chevron Corp. | | | 356,895 | | | | 38,073,559 | | |
Cimarex Energy Co. | | | 16,475 | | | | 1,806,978 | | |
ConocoPhillips | | | 232,374 | | | | 15,150,785 | | |
CONSOL Energy, Inc. | | | 43,458 | | | | 1,399,348 | | |
Denbury Resources, Inc. | | | 66,563 | | | | 559,129 | | |
Devon Energy Corp. | | | 72,594 | | | | 4,471,064 | | |
EOG Resources, Inc. | | | 103,459 | | | | 9,282,341 | | |
EQT Corp. | | | 28,615 | | | | 2,283,763 | | |
Exxon Mobil Corp.(b) | | | 799,425 | | | | 70,781,089 | | |
Hess Corp. | | | 47,972 | | | | 3,601,738 | | |
Kinder Morgan, Inc. | | | 320,773 | | | | 13,154,901 | | |
Marathon Oil Corp. | | | 127,410 | | | | 3,549,643 | | |
Common Stocks (continued)
Issuer | | Shares | | Value ($) | |
Marathon Petroleum Corp. | | | 52,885 | | | | 5,552,925 | | |
Murphy Oil Corp. | | | 31,493 | | | | 1,602,679 | | |
Newfield Exploration Co.(a) | | | 30,055 | | | | 992,717 | | |
Noble Energy, Inc. | | | 71,985 | | | | 3,399,852 | | |
Occidental Petroleum Corp. | | | 146,399 | | | | 11,401,554 | | |
ONEOK, Inc. | | | 39,317 | | | | 1,740,170 | | |
Phillips 66 | | | 104,495 | | | | 8,198,678 | | |
Pioneer Natural Resources Co. | | | 28,121 | | | | 4,289,015 | | |
QEP Resources, Inc. | | | 31,296 | | | | 672,238 | | |
Range Resources Corp. | | | 31,859 | | | | 1,578,295 | | |
Southwestern Energy Co.(a) | | | 71,585 | | | | 1,795,352 | | |
Spectra Energy Corp. | | | 126,666 | | | | 4,495,376 | | |
Tesoro Corp. | | | 23,828 | | | | 2,188,363 | | |
Valero Energy Corp. | | | 98,398 | | | | 6,070,173 | | |
Williams Companies, Inc. (The) | | | 127,005 | | | | 6,228,325 | | |
Total | | | | | 240,948,508 | | |
Total Energy | | | | | 286,673,173 | | |
FINANCIALS 15.2% | |
Banks 5.5% | |
Bank of America Corp. | | | 1,985,377 | | | | 31,388,810 | | |
BB&T Corp. | | | 135,977 | | | | 5,173,925 | | |
Citigroup, Inc. | | | 571,931 | | | | 29,980,623 | | |
Comerica, Inc. | | | 33,915 | | | | 1,552,629 | | |
Fifth Third Bancorp | | | 155,568 | | | | 3,011,796 | | |
Huntington Bancshares, Inc. | | | 153,772 | | | | 1,682,266 | | |
JPMorgan Chase & Co. | | | 705,737 | | | | 43,247,563 | | |
KeyCorp | | | 163,550 | | | | 2,278,252 | | |
M&T Bank Corp. | | | 24,947 | | | | 3,018,587 | | |
PNC Financial Services Group, Inc. (The) | | | 99,355 | | | | 9,136,686 | | |
Regions Financial Corp. | | | 259,863 | | | | 2,497,283 | | |
SunTrust Banks, Inc. | | | 98,450 | | | | 4,036,450 | | |
U.S. Bancorp | | | 337,810 | | | | 15,069,704 | | |
Wells Fargo & Co. | | | 891,234 | | | | 48,830,711 | | |
Zions Bancorporation | | | 38,321 | | | | 1,024,512 | | |
Total | | | | | 201,929,797 | | |
Capital Markets 2.1% | |
Affiliated Managers Group, Inc.(a) | | | 10,495 | | | | 2,271,328 | | |
Ameriprise Financial, Inc.(c) | | | 34,836 | | | | 4,655,135 | | |
Bank of New York Mellon Corp. (The) | | | 212,527 | | | | 8,318,307 | | |
The accompanying Notes to Financial Statements are an integral part of this statement.
Annual Report 2015
9
COLUMBIA LARGE CAP INDEX FUND
PORTFOLIO OF INVESTMENTS (continued)
February 28, 2015
Common Stocks (continued)
Issuer | | Shares | | Value ($) | |
BlackRock, Inc. | | | 24,057 | | | | 8,935,251 | | |
Charles Schwab Corp. (The) | | | 216,945 | | | | 6,365,166 | | |
E*TRADE Financial Corp.(a) | | | 54,519 | | | | 1,419,402 | | |
Franklin Resources, Inc. | | | 74,015 | | | | 3,984,227 | | |
Goldman Sachs Group, Inc. (The) | | | 76,471 | | | | 14,513,431 | | |
Invesco Ltd. | | | 81,348 | | | | 3,275,884 | | |
Legg Mason, Inc. | | | 18,954 | | | | 1,085,496 | | |
Morgan Stanley | | | 288,240 | | | | 10,316,110 | | |
Northern Trust Corp. | | | 41,782 | | | | 2,917,637 | | |
State Street Corp. | | | 78,816 | | | | 5,867,851 | | |
T. Rowe Price Group, Inc. | | | 48,980 | | | | 4,045,748 | | |
Total | | | | | 77,970,973 | | |
Consumer Finance 0.8% | |
American Express Co. | | | 167,981 | | | | 13,705,569 | | |
Capital One Financial Corp. | | | 104,952 | | | | 8,260,772 | | |
Discover Financial Services | | | 85,609 | | | | 5,220,437 | | |
Navient Corp. | | | 77,455 | | | | 1,657,537 | | |
Total | | | | | 28,844,315 | | |
Diversified Financial Services 2.0% | |
Berkshire Hathaway, Inc., Class B(a) | | | 344,270 | | | | 50,748,841 | | |
CME Group, Inc. | | | 59,766 | | | | 5,733,352 | | |
Intercontinental Exchange, Inc. | | | 21,281 | | | | 5,008,696 | | |
Leucadia National Corp. | | | 59,814 | | | | 1,419,386 | | |
McGraw Hill Financial, Inc. | | | 51,264 | | | | 5,285,318 | | |
Moody's Corp. | | | 34,656 | | | | 3,359,553 | | |
NASDAQ OMX Group, Inc. (The) | | | 22,153 | | | | 1,111,195 | | |
Total | | | | | 72,666,341 | | |
Insurance 2.5% | |
ACE Ltd. | | | 62,637 | | | | 7,141,244 | | |
Aflac, Inc. | | | 85,059 | | | | 5,294,923 | | |
Allstate Corp. (The) | | | 79,187 | | | | 5,590,602 | | |
American International Group, Inc. | | | 264,298 | | | | 14,623,608 | | |
Aon PLC | | | 53,819 | | | | 5,401,275 | | |
Assurant, Inc. | | | 13,254 | | | | 812,073 | | |
Chubb Corp. (The) | | | 44,515 | | | | 4,471,532 | | |
Cincinnati Financial Corp. | | | 27,780 | | | | 1,465,673 | | |
Genworth Financial, Inc., Class A(a) | | | 93,763 | | | | 726,663 | | |
Hartford Financial Services Group, Inc. (The) | | | 81,448 | | | | 3,336,110 | | |
Common Stocks (continued)
Issuer | | Shares | | Value ($) | |
Lincoln National Corp. | | | 49,051 | | | | 2,827,300 | | |
Loews Corp. | | | 56,509 | | | | 2,317,434 | | |
Marsh & McLennan Companies, Inc. | | | 102,105 | | | | 5,808,753 | | |
MetLife, Inc. | | | 214,468 | | | | 10,901,408 | | |
Principal Financial Group, Inc. | | | 51,570 | | | | 2,638,837 | | |
Progressive Corp. (The) | | | 100,992 | | | | 2,691,437 | | |
Prudential Financial, Inc. | | | 86,453 | | | | 6,989,725 | | |
Torchmark Corp. | | | 24,286 | | | | 1,293,230 | | |
Travelers Companies, Inc. (The) | | | 62,564 | | | | 6,721,876 | | |
Unum Group | | | 47,562 | | | | 1,596,181 | | |
XL Group PLC | | | 48,710 | | | | 1,763,302 | | |
Total | | | | | 94,413,186 | | |
Real Estate Investment Trusts (REITs) 2.3% | |
American Tower Corp. | | | 79,268 | | | | 7,858,629 | | |
Apartment Investment & Management
Co., Class A | | | 29,149 | | | | 1,098,334 | | |
AvalonBay Communities, Inc. | | | 24,927 | | | | 4,196,211 | | |
Boston Properties, Inc. | | | 28,893 | | | | 3,970,187 | | |
Crown Castle International Corp. | | | 63,023 | | | | 5,439,515 | | |
Equity Residential | | | 68,405 | | | | 5,269,237 | | |
Essex Property Trust, Inc. | | | 12,060 | | | | 2,682,506 | | |
General Growth Properties, Inc. | | | 118,465 | | | | 3,436,670 | | |
HCP, Inc. | | | 86,713 | | | | 3,673,163 | | |
Health Care REIT, Inc. | | | 65,068 | | | | 5,017,393 | | |
Host Hotels & Resorts, Inc. | | | 142,985 | | | | 3,002,685 | | |
Iron Mountain, Inc. | | | 35,196 | | | | 1,293,453 | | |
Kimco Realty Corp. | | | 77,661 | | | | 2,040,931 | | |
Macerich Co. (The) | | | 26,578 | | | | 2,223,250 | | |
Plum Creek Timber Co., Inc. | | | 33,206 | | | | 1,442,469 | | |
ProLogis, Inc. | | | 94,394 | | | | 4,031,568 | | |
Public Storage | | | 27,403 | | | | 5,404,420 | | |
Simon Property Group, Inc. | | | 58,665 | | | | 11,167,469 | | |
Ventas, Inc. | | | 60,463 | | | | 4,502,680 | | |
Vornado Realty Trust | | | 32,965 | | | | 3,627,469 | | |
Weyerhaeuser Co. | | | 98,986 | | | | 3,475,398 | | |
Total | | | | | 84,853,637 | | |
Real Estate Management & Development —% | |
CBRE Group, Inc., Class A(a) | | | 52,795 | | | | 1,808,757 | | |
The accompanying Notes to Financial Statements are an integral part of this statement.
Annual Report 2015
10
COLUMBIA LARGE CAP INDEX FUND
PORTFOLIO OF INVESTMENTS (continued)
February 28, 2015
Common Stocks (continued)
Issuer | | Shares | | Value ($) | |
Thrifts & Mortgage Finance —% | |
Hudson City Bancorp, Inc. | | | 90,834 | | | | 886,540 | | |
People's United Financial, Inc. | | | 58,150 | | | | 879,809 | | |
Total | | | | | 1,766,349 | | |
Total Financials | | | | | 564,253,355 | | |
HEALTH CARE 14.0% | |
Biotechnology 2.9% | |
Alexion Pharmaceuticals, Inc.(a) | | | 37,443 | | | | 6,753,594 | | |
Amgen, Inc. | | | 143,603 | | | | 22,649,065 | | |
Biogen Idec, Inc.(a) | | | 44,595 | | | | 18,265,666 | | |
Celgene Corp.(a) | | | 150,783 | | | | 18,324,658 | | |
Gilead Sciences, Inc.(a) | | | 284,826 | | | | 29,488,036 | | |
Regeneron Pharmaceuticals, Inc.(a) | | | 13,999 | | | | 5,793,346 | | |
Vertex Pharmaceuticals, Inc.(a) | | | 45,410 | | | | 5,423,316 | | |
Total | | | | | 106,697,681 | | |
Health Care Equipment & Supplies 2.1% | |
Abbott Laboratories | | | 284,286 | | | | 13,466,628 | | |
Baxter International, Inc. | | | 102,329 | | | | 7,076,050 | | |
Becton Dickinson and Co. | | | 36,251 | | | | 5,318,747 | | |
Boston Scientific Corp.(a) | | | 250,424 | | | | 4,232,166 | | |
CareFusion Corp.(a) | | | 38,488 | | | | 2,312,359 | | |
CR Bard, Inc. | | | 14,141 | | | | 2,391,809 | | |
DENTSPLY International, Inc. | | | 26,728 | | | | 1,416,851 | | |
Edwards Lifesciences Corp.(a) | | | 20,206 | | | | 2,687,802 | | |
Intuitive Surgical, Inc.(a) | | | 6,837 | | | | 3,418,500 | | |
Medtronic PLC | | | 267,533 | | | | 20,757,885 | | |
St. Jude Medical, Inc. | | | 53,969 | | | | 3,598,653 | | |
Stryker Corp. | | | 56,423 | | | | 5,346,079 | | |
Varian Medical Systems, Inc.(a) | | | 18,873 | | | | 1,754,623 | | |
Zimmer Holdings, Inc. | | | 31,974 | | | | 3,849,350 | | |
Total | | | | | 77,627,502 | | |
Health Care Providers & Services 2.4% | |
Aetna, Inc. | | | 66,400 | | | | 6,610,120 | | |
AmerisourceBergen Corp. | | | 39,212 | | | | 4,029,425 | | |
Anthem, Inc. | | | 50,964 | | | | 7,463,678 | | |
Cardinal Health, Inc. | | | 62,491 | | | | 5,498,583 | | |
CIGNA Corp. | | | 49,390 | | | | 6,007,306 | | |
DaVita HealthCare Partners, Inc.(a) | | | 32,459 | | | | 2,421,441 | | |
Common Stocks (continued)
Issuer | | Shares | | Value ($) | |
Express Scripts Holding Co.(a) | | | 138,557 | | | | 11,748,248 | | |
Five Star Quality Care, Inc.(d)(e) | | | — | | | | 1 | | |
HCA Holdings, Inc.(a) | | | 57,260 | | | | 4,096,380 | | |
Humana, Inc. | | | 28,958 | | | | 4,760,116 | | |
Laboratory Corp. of America Holdings(a) | | | 18,818 | | | | 2,315,179 | | |
McKesson Corp. | | | 43,777 | | | | 10,011,800 | | |
Patterson Companies, Inc. | | | 16,162 | | | | 809,312 | | |
Quest Diagnostics, Inc. | | | 27,293 | | | | 1,914,331 | | |
Tenet Healthcare Corp.(a) | | | 18,560 | | | | 859,328 | | |
UnitedHealth Group, Inc. | | | 181,198 | | | | 20,589,529 | | |
Universal Health Services, Inc., Class B | | | 17,190 | | | | 1,948,486 | | |
Total | | | | | 91,083,263 | | |
Health Care Technology 0.1% | |
Cerner Corp.(a) | | | 57,386 | | | | 4,135,235 | | |
Life Sciences Tools & Services 0.4% | |
Agilent Technologies, Inc. | | | 62,958 | | | | 2,657,457 | | |
PerkinElmer, Inc. | | | 21,315 | | | | 1,001,805 | | |
Thermo Fisher Scientific, Inc. | | | 75,525 | | | | 9,818,250 | | |
Waters Corp.(a) | | | 15,728 | | | | 1,893,337 | | |
Total | | | | | 15,370,849 | | |
Pharmaceuticals 6.1% | |
AbbVie, Inc. | | | 300,797 | | | | 18,198,219 | | |
Actavis PLC(a) | | | 50,052 | | | | 14,583,151 | | |
Allergan, Inc. | | | 56,250 | | | | 13,091,625 | | |
Bristol-Myers Squibb Co. | | | 313,160 | | | | 19,077,707 | | |
Eli Lilly & Co. | | | 184,988 | | | | 12,980,608 | | |
Endo International PLC(a) | | | 31,370 | | | | 2,685,272 | | |
Hospira, Inc.(a) | | | 31,938 | | | | 2,795,853 | | |
Johnson & Johnson | | | 528,434 | | | | 54,169,769 | | |
Mallinckrodt PLC(a) | | | 21,950 | | | | 2,562,004 | | |
Merck & Co., Inc. | | | 538,223 | | | | 31,507,574 | | |
Mylan NV | | | 70,651 | | | | 4,050,069 | | |
Perrigo Co. PLC | | | 26,569 | | | | 4,104,113 | | |
Pfizer, Inc. | | | 1,189,497 | | | | 40,823,537 | | |
Zoetis, Inc. | | | 94,647 | | | | 4,362,280 | | |
Total | | | | | 224,991,781 | | |
Total Health Care | | | | | 519,906,311 | | |
The accompanying Notes to Financial Statements are an integral part of this statement.
Annual Report 2015
11
COLUMBIA LARGE CAP INDEX FUND
PORTFOLIO OF INVESTMENTS (continued)
February 28, 2015
Common Stocks (continued)
Issuer | | Shares | | Value ($) | |
INDUSTRIALS 9.8% | |
Aerospace & Defense 2.6% | |
Boeing Co. (The) | | | 125,182 | | | | 18,883,705 | | |
General Dynamics Corp. | | | 59,433 | | | | 8,248,112 | | |
Honeywell International, Inc. | | | 147,792 | | | | 15,190,062 | | |
L-3 Communications Holdings, Inc. | | | 16,074 | | | | 2,080,458 | | |
Lockheed Martin Corp. | | | 50,702 | | | | 10,142,935 | | |
Northrop Grumman Corp. | | | 38,130 | | | | 6,318,522 | | |
Precision Castparts Corp. | | | 26,916 | | | | 5,821,931 | | |
Raytheon Co. | | | 58,204 | | | | 6,330,849 | | |
Rockwell Collins, Inc. | | | 25,107 | | | | 2,236,531 | | |
Textron, Inc. | | | 52,120 | | | | 2,309,437 | | |
United Technologies Corp. | | | 160,057 | | | | 19,512,549 | | |
Total | | | | | 97,075,091 | | |
Air Freight & Logistics 0.7% | |
CH Robinson Worldwide, Inc. | | | 27,627 | | | | 2,052,686 | | |
Expeditors International of
Washington, Inc. | | | 36,433 | | | | 1,759,714 | | |
FedEx Corp. | | | 49,724 | | | | 8,800,154 | | |
United Parcel Service, Inc., Class B | | | 131,587 | | | | 13,386,345 | | |
Total | | | | | 25,998,899 | | |
Airlines 0.4% | |
Delta Air Lines, Inc. | | | 158,005 | | | | 7,034,383 | | |
Southwest Airlines Co. | | | 128,151 | | | | 5,541,249 | | |
Total | | | | | 12,575,632 | | |
Building Products 0.1% | |
Allegion PLC | | | 18,067 | | | | 1,043,008 | | |
Masco Corp. | | | 67,246 | | | | 1,761,173 | | |
Total | | | | | 2,804,181 | | |
Commercial Services & Supplies 0.4% | |
ADT Corp. (The) | | | 32,947 | | | | 1,292,181 | | |
Cintas Corp. | | | 18,341 | | | | 1,531,107 | | |
Pitney Bowes, Inc. | | | 37,946 | | | | 879,209 | | |
Republic Services, Inc. | | | 47,666 | | | | 1,950,493 | | |
Stericycle, Inc.(a) | | | 16,035 | | | | 2,164,244 | | |
Tyco International PLC | | | 79,005 | | | | 3,335,591 | | |
Waste Management, Inc. | | | 80,399 | | | | 4,380,137 | | |
Total | | | | | 15,532,962 | | |
Common Stocks (continued)
Issuer | | Shares | | Value ($) | |
Construction & Engineering 0.1% | |
Fluor Corp. | | | 27,902 | | | | 1,618,316 | | |
Jacobs Engineering Group, Inc.(a) | | | 24,652 | | | | 1,093,070 | | |
Quanta Services, Inc.(a) | | | 41,087 | | | | 1,182,484 | | |
Total | | | | | 3,893,870 | | |
Electrical Equipment 0.5% | |
AMETEK, Inc. | | | 46,420 | | | | 2,466,759 | | |
Eaton Corp. PLC | | | 89,601 | | | | 6,362,567 | | |
Emerson Electric Co. | | | 130,958 | | | | 7,585,087 | | |
Rockwell Automation, Inc. | | | 25,625 | | | | 2,999,150 | | |
Total | | | | | 19,413,563 | | |
Industrial Conglomerates 2.2% | |
3M Co. | | | 120,983 | | | | 20,403,783 | | |
Danaher Corp. | | | 115,417 | | | | 10,073,596 | | |
General Electric Co. | | | 1,895,846 | | | | 49,273,037 | | |
Roper Industries, Inc. | | | 18,911 | | | | 3,168,916 | | |
Total | | | | | 82,919,332 | | |
Machinery 1.4% | |
Caterpillar, Inc. | | | 114,301 | | | | 9,475,553 | | |
Cummins, Inc. | | | 32,067 | | | | 4,560,889 | | |
Deere & Co. | | | 67,663 | | | | 6,130,268 | | |
Dover Corp. | | | 31,225 | | | | 2,249,761 | | |
Flowserve Corp. | | | 25,744 | | | | 1,599,475 | | |
Illinois Tool Works, Inc. | | | 67,900 | | | | 6,712,594 | | |
Ingersoll-Rand PLC | | | 50,106 | | | | 3,366,622 | | |
Joy Global, Inc. | | | 18,536 | | | | 821,516 | | |
PACCAR, Inc. | | | 66,850 | | | | 4,281,742 | | |
Pall Corp. | | | 20,124 | | | | 2,028,700 | | |
Parker-Hannifin Corp. | | | 28,061 | | | | 3,442,804 | | |
Pentair PLC | | | 35,265 | | | | 2,344,065 | | |
Snap-On, Inc. | | | 10,978 | | | | 1,616,291 | | |
Stanley Black & Decker, Inc. | | | 29,564 | | | | 2,907,324 | | |
Xylem, Inc. | | | 34,345 | | | | 1,226,116 | | |
Total | | | | | 52,763,720 | | |
Professional Services 0.2% | |
Dun & Bradstreet Corp. (The) | | | 6,788 | | | | 899,274 | | |
Equifax, Inc. | | | 22,769 | | | | 2,125,942 | | |
Nielsen NV | | | 61,140 | | | | 2,764,139 | | |
Robert Half International, Inc. | | | 25,654 | | | | 1,589,522 | | |
Total | | | | | 7,378,877 | | |
The accompanying Notes to Financial Statements are an integral part of this statement.
Annual Report 2015
12
COLUMBIA LARGE CAP INDEX FUND
PORTFOLIO OF INVESTMENTS (continued)
February 28, 2015
Common Stocks (continued)
Issuer | | Shares | | Value ($) | |
Road & Rail 1.0% | |
CSX Corp. | | | 187,923 | | | | 6,447,638 | | |
Kansas City Southern | | | 20,832 | | | | 2,413,179 | | |
Norfolk Southern Corp. | | | 58,431 | | | | 6,378,328 | | |
Ryder System, Inc. | | | 10,011 | | | | 940,934 | | |
Union Pacific Corp. | | | 167,848 | | | | 20,185,400 | | |
Total | | | | | 36,365,479 | | |
Trading Companies & Distributors 0.2% | |
Fastenal Co. | | | 51,483 | | | | 2,139,119 | | |
United Rentals, Inc.(a) | | | 18,835 | | | | 1,752,785 | | |
WW Grainger, Inc. | | | 11,447 | | | | 2,711,909 | | |
Total | | | | | 6,603,813 | | |
Total Industrials | | | | | 363,325,419 | | |
INFORMATION TECHNOLOGY 19.0% | |
Communications Equipment 1.6% | |
Cisco Systems, Inc. | | | 965,399 | | | | 28,488,925 | | |
F5 Networks, Inc.(a) | | | 13,933 | | | | 1,645,696 | | |
Harris Corp. | | | 19,738 | | | | 1,533,248 | | |
Juniper Networks, Inc. | | | 72,686 | | | | 1,737,922 | | |
Motorola Solutions, Inc. | | | 36,001 | | | | 2,445,908 | | |
QUALCOMM, Inc. | | | 313,874 | | | | 22,759,004 | | |
Total | | | | | 58,610,703 | | |
Electronic Equipment, Instruments & Components 0.4% | |
Amphenol Corp., Class A | | | 58,418 | | | | 3,298,280 | | |
Corning, Inc. | | | 241,995 | | | | 5,904,678 | | |
FLIR Systems, Inc. | | | 26,594 | | | | 858,454 | | |
TE Connectivity Ltd. | | | 76,781 | | | | 5,538,214 | | |
Total | | | | | 15,599,626 | | |
Internet Software & Services 3.1% | |
Akamai Technologies, Inc.(a) | | | 33,592 | | | | 2,334,980 | | |
eBay, Inc.(a) | | | 213,438 | | | | 12,360,195 | | |
Facebook, Inc., Class A(a) | | | 394,735 | | | | 31,172,223 | | |
Google, Inc., Class A(a) | | | 53,804 | | | | 30,271,744 | | |
Google, Inc., Class C(a) | | | 53,754 | | | | 30,016,234 | | |
VeriSign, Inc.(a) | | | 20,567 | | | | 1,316,699 | | |
Yahoo!, Inc.(a) | | | 166,339 | | | | 7,365,491 | | |
Total | | | | | 114,837,566 | | |
Common Stocks (continued)
Issuer | | Shares | | Value ($) | |
IT Services 3.2% | |
Accenture PLC, Class A | | | 118,462 | | | | 10,665,134 | | |
Alliance Data Systems Corp.(a) | | | 12,065 | | | | 3,360,223 | | |
Automatic Data Processing, Inc. | | | 91,010 | | | | 8,085,328 | | |
Cognizant Technology Solutions Corp.,
Class A(a) | | | 114,957 | | | | 7,183,088 | | |
Computer Sciences Corp. | | | 26,518 | | | | 1,880,657 | | |
Fidelity National Information Services, Inc. | | | 53,578 | | | | 3,621,337 | | |
Fiserv, Inc.(a) | | | 46,069 | | | | 3,596,607 | | |
International Business Machines Corp. | | | 173,762 | | | | 28,139,018 | | |
MasterCard, Inc., Class A | | | 185,010 | | | | 16,674,951 | | |
Paychex, Inc. | | | 61,649 | | | | 3,072,278 | | |
Teradata Corp.(a) | | | 28,873 | | | | 1,285,426 | | |
Total System Services, Inc. | | | 31,237 | | | | 1,193,253 | | |
Visa, Inc., Class A | | | 92,211 | | | | 25,017,767 | | |
Western Union Co. (The) | | | 98,654 | | | | 1,925,726 | | |
Xerox Corp. | | | 202,575 | | | | 2,765,149 | | |
Total | | | | | 118,465,942 | | |
Semiconductors & Semiconductor Equipment 2.3% | |
Altera Corp. | | | 57,552 | | | | 2,130,000 | | |
Analog Devices, Inc. | | | 58,749 | | | | 3,439,166 | | |
Applied Materials, Inc. | | | 230,007 | | | | 5,761,675 | | |
Avago Technologies Ltd. | | | 47,735 | | | | 6,091,941 | | |
Broadcom Corp., Class A | | | 101,711 | | | | 4,600,389 | | |
First Solar, Inc.(a) | | | 14,185 | | | | 847,483 | | |
Intel Corp. | | | 912,790 | | | | 30,350,267 | | |
KLA-Tencor Corp. | | | 31,059 | | | | 2,017,437 | | |
Lam Research Corp. | | | 30,019 | | | | 2,475,367 | | |
Linear Technology Corp. | | | 45,043 | | | | 2,170,397 | | |
Microchip Technology, Inc. | | | 37,950 | | | | 1,945,696 | | |
Micron Technology, Inc.(a) | | | 202,651 | | | | 6,215,306 | | |
NVIDIA Corp. | | | 97,494 | | | | 2,150,718 | | |
Texas Instruments, Inc. | | | 199,419 | | | | 11,725,837 | | |
Xilinx, Inc. | | | 49,916 | | | | 2,114,941 | | |
Total | | | | | 84,036,620 | | |
Software 3.5% | |
Adobe Systems, Inc.(a) | | | 89,443 | | | | 7,074,941 | | |
Autodesk, Inc.(a) | | | 42,958 | | | | 2,759,622 | | |
CA, Inc. | | | 60,469 | | | | 1,966,452 | | |
The accompanying Notes to Financial Statements are an integral part of this statement.
Annual Report 2015
13
COLUMBIA LARGE CAP INDEX FUND
PORTFOLIO OF INVESTMENTS (continued)
February 28, 2015
Common Stocks (continued)
Issuer | | Shares | | Value ($) | |
Citrix Systems, Inc.(a) | | | 30,387 | | | | 1,934,892 | | |
Electronic Arts, Inc.(a) | | | 58,706 | | | | 3,356,809 | | |
Intuit, Inc. | | | 53,893 | | | | 5,261,574 | | |
Microsoft Corp. | | | 1,556,162 | | | | 68,237,704 | | |
Oracle Corp. | | | 610,700 | | | | 26,760,874 | | |
Red Hat, Inc.(a) | | | 35,461 | | | | 2,451,064 | | |
salesforce.com, Inc.(a) | | | 110,777 | | | | 7,685,708 | | |
Symantec Corp. | | | 130,290 | | | | 3,278,097 | | |
Total | | | | | 130,767,737 | | |
Technology Hardware, Storage & Peripherals 4.9% | |
Apple, Inc. | | | 1,107,229 | | | | 142,234,637 | | |
EMC Corp. | | | 384,178 | | | | 11,118,111 | | |
Hewlett-Packard Co. | | | 352,323 | | | | 12,274,933 | | |
NetApp, Inc. | | | 58,849 | | | | 2,274,514 | | |
SanDisk Corp. | | | 41,650 | | | | 3,329,085 | | |
Seagate Technology PLC | | | 61,781 | | | | 3,776,055 | | |
Western Digital Corp. | | | 41,201 | | | | 4,407,683 | | |
Total | | | | | 179,415,018 | | |
Total Information Technology | | | | | 701,733,212 | | |
MATERIALS 3.1% | |
Chemicals 2.3% | |
Air Products & Chemicals, Inc. | | | 36,300 | | | | 5,667,882 | | |
Airgas, Inc. | | | 12,698 | | | | 1,488,459 | | |
CF Industries Holdings, Inc. | | | 9,377 | | | | 2,871,519 | | |
Dow Chemical Co. (The) | | | 209,137 | | | | 10,297,906 | | |
Eastman Chemical Co. | | | 28,047 | | | | 2,088,379 | | |
Ecolab, Inc. | | | 50,983 | | | | 5,890,576 | | |
EI du Pont de Nemours & Co. | | | 171,022 | | | | 13,314,063 | | |
FMC Corp. | | | 25,165 | | | | 1,595,713 | | |
International Flavors & Fragrances, Inc. | | | 15,286 | | | | 1,863,822 | | |
LyondellBasell Industries NV, Class A | | | 78,458 | | | | 6,740,327 | | |
Monsanto Co. | | | 91,392 | | | | 11,006,338 | | |
Mosaic Co. (The) | | | 59,573 | | | | 3,172,858 | | |
PPG Industries, Inc. | | | 25,912 | | | | 6,099,166 | | |
Praxair, Inc. | | | 55,012 | | | | 7,036,035 | | |
Sherwin-Williams Co. (The) | | | 15,396 | | | | 4,390,939 | | |
Sigma-Aldrich Corp. | | | 22,494 | | | | 3,105,522 | | |
Total | | | | | 86,629,504 | | |
Common Stocks (continued)
Issuer | | Shares | | Value ($) | |
Construction Materials 0.1% | |
Martin Marietta Materials, Inc. | | | 11,675 | | | | 1,661,703 | | |
Vulcan Materials Co. | | | 24,874 | | | | 2,064,542 | | |
Total | | | | | 3,726,245 | | |
Containers & Packaging 0.2% | |
Avery Dennison Corp. | | | 17,199 | | | | 921,006 | | |
Ball Corp. | | | 25,857 | | | | 1,854,205 | | |
MeadWestvaco Corp. | | | 31,467 | | | | 1,669,639 | | |
Owens-Illinois, Inc.(a) | | | 31,132 | | | | 814,413 | | |
Sealed Air Corp. | | | 39,874 | | | | 1,879,262 | | |
Total | | | | | 7,138,525 | | |
Metals & Mining 0.4% | |
Alcoa, Inc. | | | 222,555 | | | | 3,291,588 | | |
Allegheny Technologies, Inc. | | | 20,528 | | | | 690,973 | | |
Freeport-McMoRan, Inc. | | | 196,166 | | | | 4,243,071 | | |
Newmont Mining Corp. | | | 94,166 | | | | 2,479,391 | | |
Nucor Corp. | | | 60,215 | | | | 2,831,911 | | |
Total | | | | | 13,536,934 | | |
Paper & Forest Products 0.1% | |
International Paper Co. | | | 79,975 | | | | 4,511,390 | | |
Total Materials | | | | | 115,542,598 | | |
TELECOMMUNICATION SERVICES 2.2% | |
Diversified Telecommunication Services 2.2% | |
AT&T, Inc. | | | 979,250 | | | | 33,842,880 | | |
CenturyLink, Inc. | | | 107,752 | | | | 4,079,491 | | |
Frontier Communications Corp. | | | 189,191 | | | | 1,509,744 | | |
Level 3 Communications, Inc.(a) | | | 52,635 | | | | 2,834,921 | | |
Verizon Communications, Inc. | | | 783,416 | | | | 38,739,921 | | |
Windstream Holdings, Inc. | | | 113,798 | | | | 897,866 | | |
Total | | | | | 81,904,823 | | |
Total Telecommunication Services | | | | | 81,904,823 | | |
UTILITIES 2.9% | |
Electric Utilities 1.7% | |
American Electric Power Co., Inc. | | | 92,355 | | | | 5,317,801 | | |
Duke Energy Corp. | | | 133,537 | | | | 10,489,331 | | |
Edison International | | | 61,521 | | | | 3,952,724 | | |
Entergy Corp. | | | 34,070 | | | | 2,708,906 | | |
Eversource Energy | | | 59,806 | | | | 3,094,960 | | |
The accompanying Notes to Financial Statements are an integral part of this statement.
Annual Report 2015
14
COLUMBIA LARGE CAP INDEX FUND
PORTFOLIO OF INVESTMENTS (continued)
February 28, 2015
Common Stocks (continued)
Issuer | | Shares | | Value ($) | |
Exelon Corp. | | | 162,253 | | | | 5,503,622 | | |
FirstEnergy Corp. | | | 79,447 | | | | 2,779,056 | | |
NextEra Energy, Inc. | | | 82,393 | | | | 8,524,380 | | |
Pepco Holdings, Inc. | | | 47,554 | | | | 1,290,616 | | |
Pinnacle West Capital Corp. | | | 20,844 | | | | 1,335,683 | | |
PPL Corp. | | | 125,551 | | | | 4,281,289 | | |
Southern Co. (The) | | | 169,872 | | | | 7,778,439 | | |
Xcel Energy, Inc. | | | 95,456 | | | | 3,367,688 | | |
Total | | | | | 60,424,495 | | |
Gas Utilities —% | |
AGL Resources, Inc. | | | 22,563 | | | | 1,108,069 | | |
Independent Power and Renewable Electricity Producers 0.1% | |
AES Corp. (The) | | | 123,838 | | | | 1,606,179 | | |
NRG Energy, Inc. | | | 63,843 | | | | 1,530,955 | | |
Total | | | | | 3,137,134 | | |
Multi-Utilities 1.1% | |
Ameren Corp. | | | 45,809 | | | | 1,942,760 | | |
CenterPoint Energy, Inc. | | | 81,134 | | | | 1,686,776 | | |
CMS Energy Corp. | | | 51,921 | | | | 1,823,985 | | |
Consolidated Edison, Inc. | | | 55,299 | | | | 3,491,579 | | |
Dominion Resources, Inc. | | | 110,240 | | | | 7,947,201 | | |
DTE Energy Co. | | | 33,407 | | | | 2,740,376 | | |
Common Stocks (continued)
Issuer | | Shares | | Value ($) | |
Integrys Energy Group, Inc. | | | 15,087 | | | | 1,127,451 | | |
NiSource, Inc. | | | 59,607 | | | | 2,557,736 | | |
PG&E Corp. | | | 89,689 | | | | 4,818,990 | | |
Public Service Enterprise Group, Inc. | | | 95,530 | | | | 4,017,992 | | |
SCANA Corp. | | | 26,901 | | | | 1,532,012 | | |
Sempra Energy | | | 43,638 | | | | 4,721,632 | | |
TECO Energy, Inc. | | | 44,295 | | | | 869,511 | | |
Wisconsin Energy Corp. | | | 42,565 | | | | 2,169,964 | | |
Total | | | | | 41,447,965 | | |
Total Utilities | | | | | 106,117,663 | | |
Total Common Stocks
(Cost: $2,133,171,657) | | | | | 3,523,557,649 | | |
Money Market Funds 4.6%
| | | Shares | | Value ($) | |
Columbia Short-Term Cash Fund,
0.118%(c)(f) | | | 172,199,950 | | | | 172,199,950 | | |
Total Money Market Funds
(Cost: $172,199,950) | | | | | 172,199,950 | | |
Total Investments
(Cost: $2,305,371,607) | | | | | 3,695,757,599 | | |
Other Assets & Liabilities, Net | | | | | 7,538,071 | | |
Net Assets | | | | | 3,703,295,670 | | |
Investments in Derivatives
Futures Contracts Outstanding at February 28, 2015
At February 28, 2015, securities totaling $11,156,040 were pledged as collateral to cover initial margin requirements on open futures contracts.
Long Futures Contracts Outstanding
Contract Description | | Number of
Contracts | | Trading
Currency | | Notional Market
Value ($) | | Expiration
Date | | Unrealized
Appreciation ($) | | Unrealized
Depreciation ($) | |
S&P 500 | | | 340 | | | USD | | | | | 178,738,000 | | | 03/2015 | | | 7,420,955 | | | | — | | |
The accompanying Notes to Financial Statements are an integral part of this statement.
Annual Report 2015
15
COLUMBIA LARGE CAP INDEX FUND
PORTFOLIO OF INVESTMENTS (continued)
February 28, 2015
Notes to Portfolio of Investments
(a) Non-income producing.
(b) This security, or a portion of this security, has been pledged as collateral in connection with open futures contracts. These values are denoted within the Investments in Derivatives section of the Portfolio of Investments.
(c) As defined in the Investment Company Act of 1940, an affiliated company is one in which the Fund owns 5% or more of the company's outstanding voting securities, or a company which is under common ownership or control with the Fund. Holdings and transactions in these affiliated companies during the year ended February 28, 2015, are as follows:
Issuer | |
Beginning
Cost ($) | |
Purchase
Cost ($) | | Proceeds
From Sales ($) | | Realized
Gain (Loss) ($) | | Ending
Cost ($) | | Dividends —
Affiliated
Issuers ($) | | Value ($) | |
Ameriprise
Financial, Inc. | | | 1,179,415 | | | | 5,589 | | | | (197,896 | ) | | | 80,506 | | | | 1,067,614 | | | | 82,174 | | | | 4,655,135 | | |
Columbia
Short-Term
Cash Fund | | | 42,522,199 | | | | 477,001,999 | | | | (347,324,248 | ) | | | — | | | | 172,199,950 | | | | 83,552 | | | | 172,199,950 | | |
Total | | | 43,701,614 | | | | 477,007,588 | | | | (347,522,144 | ) | | | 80,506 | | | | 173,267,564 | | | | 165,726 | | | | 176,855,085 | | |
(d) Identifies securities considered by the Investment Manager to be illiquid as to their marketability. The aggregate value of such securities at February 28, 2015 was $1, which represents less than 0.01% of net assets. Information concerning such security holdings at February 28, 2015 is as follows:
Security Description | | Acquisition Dates | | Cost ($) | |
Five Star Quality Care, Inc. | | 01/02/2002 | | | 2 | | |
(e) Represents fractional shares.
(f) The rate shown is the seven-day current annualized yield at February 28, 2015.
Currency Legend
USD US Dollar
Fair Value Measurements
Generally accepted accounting principles (GAAP) require disclosure regarding the inputs and valuation techniques used to measure fair value and any changes in valuation inputs or techniques. In addition, investments shall be disclosed by major category.
The Fund categorizes its fair value measurements according to a three-level hierarchy that maximizes the use of observable inputs and minimizes the use of unobservable inputs by prioritizing that the most observable input be used when available. Observable inputs are those that market participants would use in pricing an investment based on market data obtained from sources independent of the reporting entity. Unobservable inputs are those that reflect the Fund's assumptions about the information market participants would use in pricing an investment. An investment's level within the fair value hierarchy is based on the lowest level of any input that is deemed significant to the asset or liability's fair value measurement. The input levels are not necessarily an indication of the risk or liquidity associated with investments at that level. For example, certain U.S. government securities are generally high quality and liquid, however, they are reflected as Level 2 because the inputs used to determine fair value may not always be quoted prices in an active market.
Fair value inputs are summarized in the three broad levels listed below:
> Level 1 — Valuations based on quoted prices for investments in active markets that the Fund has the ability to access at the measurement date (including NAV for open-end mutual funds). Valuation adjustments are not applied to Level 1 investments.
> Level 2 — Valuations based on other significant observable inputs (including quoted prices for similar securities, interest rates, prepayment speeds, credit risks, etc.).
> Level 3 — Valuations based on significant unobservable inputs (including the Fund's own assumptions and judgment in determining the fair value of investments).
The accompanying Notes to Financial Statements are an integral part of this statement.
Annual Report 2015
16
COLUMBIA LARGE CAP INDEX FUND
PORTFOLIO OF INVESTMENTS (continued)
February 28, 2015
Fair Value Measurements (continued)
Inputs that are used in determining fair value of an investment may include price information, credit data, volatility statistics, and other factors. These inputs can be either observable or unobservable. The availability of observable inputs can vary between investments, and is affected by various factors such as the type of investment, and the volume and level of activity for that investment or similar investments in the marketplace. The inputs will be considered by the Investment Manager, along with any other relevant factors in the calculation of an investment's fair value. The Fund uses prices and inputs that are current as of the measurement date, which may include periods of market dislocations. During these periods, the availability of prices and inputs may be reduced for many investments. This condition could cause an investment to be reclassified between the various levels within the hierarchy.
Investments falling into the Level 3 category are primarily supported by quoted prices from brokers and dealers participating in the market for those investments. However, these may be classified as Level 3 investments due to lack of market transparency and corroboration to support these quoted prices. Additionally, valuation models may be used as the pricing source for any remaining investments classified as Level 3. These models may rely on one or more significant unobservable inputs and/or significant assumptions by the Investment Manager. Inputs used in valuations may include, but are not limited to, financial statement analysis, capital account balances, discount rates and estimated cash flows, and comparable company data.
Under the direction of the Fund's Board of Trustees (the Board), the Investment Manager's Valuation Committee (the Committee) is responsible for overseeing the valuation procedures approved by the Board. The Committee consists of voting and non-voting members from various groups within the Investment Manager's organization, including operations and accounting, trading and investments, compliance, risk management and legal.
The Committee meets at least monthly to review and approve valuation matters, which may include a description of specific valuation determinations, data regarding pricing information received from approved pricing vendors and brokers and the results of Board-approved valuation control policies and procedures (the Policies). The Policies address, among other things, instances when market quotations are or are not readily available, including recommendations of third party pricing vendors and a determination of appropriate pricing methodologies; events that require specific valuation determinations and assessment of fair value techniques; securities with a potential for stale pricing, including those that are illiquid, restricted, or in default; and the effectiveness of third party pricing vendors, including periodic reviews of vendors. The Committee meets more frequently, as needed, to discuss additional valuation matters, which may include the need to review back-testing results, review time-sensitive information or approve related valuation actions. The Committee reports to the Board, with members of the Committee meeting with the Board at each of its regularly scheduled meetings to discuss valuation matters and actions during the period, similar to those described earlier.
For investments categorized as Level 3, the Committee monitors information similar to that described above, which may include: (i) data specific to the issuer or comparable issuers, (ii) general market or specific sector news and (iii) quoted prices and specific or similar security transactions. The Committee considers this data and any changes from prior periods in order to assess the reasonableness of observable and unobservable inputs, any assumptions or internal models used to value those securities and changes in fair value. This data is also used to corroborate, when available, information received from approved pricing vendors and brokers. Various factors impact the frequency of monitoring this information (which may occur as often as daily). However, the Committee may determine that changes to inputs, assumptions and models are not required as a result of the monitoring procedures performed.
The accompanying Notes to Financial Statements are an integral part of this statement.
Annual Report 2015
17
COLUMBIA LARGE CAP INDEX FUND
PORTFOLIO OF INVESTMENTS (continued)
February 28, 2015
Fair Value Measurements (continued)
The following table is a summary of the inputs used to value the Fund's investments at February 28, 2015:
Description | | Level 1
Quoted Prices in Active
Markets for Identical
Assets ($) | | Level 2
Other Significant
Observable Inputs ($) | | Level 3
Significant
Unobservable Inputs ($) | | Total ($) | |
Equity Securities | |
Common Stocks | �� |
Consumer Discretionary | | | 438,845,709 | | | | — | | | | — | | | | 438,845,709 | | |
Consumer Staples | | | 345,255,386 | | | | — | | | | — | | | | 345,255,386 | | |
Energy | | | 286,673,173 | | | | — | | | | — | | | | 286,673,173 | | |
Financials | | | 564,253,355 | | | | — | | | | — | | | | 564,253,355 | | |
Health Care | | | 519,906,310 | | | | 1 | | | | — | | | | 519,906,311 | | |
Industrials | | | 363,325,419 | | | | — | | | | — | | | | 363,325,419 | | |
Information Technology | | | 701,733,212 | | | | — | | | | — | | | | 701,733,212 | | |
Materials | | | 115,542,598 | | | | — | | | | — | | | | 115,542,598 | | |
Telecommunication Services | | | 81,904,823 | | | | — | | | | — | | | | 81,904,823 | | |
Utilities | | | 106,117,663 | | | | — | | | | — | | | | 106,117,663 | | |
Total Equity Securities | | | 3,523,557,648 | | | | 1 | | | | — | | | | 3,523,557,649 | | |
Mutual Funds | |
Money Market Funds | | | 172,199,950 | | | | — | | | | — | | | | 172,199,950 | | |
Total Mutual Funds | | | 172,199,950 | | | | — | | | | — | | | | 172,199,950 | | |
Investments in Securities | | | 3,695,757,598 | | | | 1 | | | | — | | | | 3,695,757,599 | | |
Derivatives | |
Assets | |
Futures Contracts | | | 7,420,955 | | | | — | | | | — | | | | 7,420,955 | | |
Total | | | 3,703,178,553 | | | | 1 | | | | — | | | | 3,703,178,554 | | |
See the Portfolio of Investments for all investment classifications not indicated in the table.
The Fund's assets assigned to the Level 2 input category are generally valued using the market approach, in which a security's value is determined through reference to prices and information from market transactions for similar or identical assets.
There were no transfers of financial assets between levels during the period.
Derivative instruments are valued at unrealized appreciation (depreciation).
The accompanying Notes to Financial Statements are an integral part of this statement.
Annual Report 2015
18
COLUMBIA LARGE CAP INDEX FUND
STATEMENT OF ASSETS AND LIABILITIES
February 28, 2015
Assets | |
Investments, at value | |
Unaffiliated issuers (identified cost $2,132,104,043) | | $ | 3,518,902,514 | | |
Affiliated issuers (identified cost $173,267,564) | | | 176,855,085 | | |
Total investments (identified cost $2,305,371,607) | | | 3,695,757,599 | | |
Receivable for: | |
Investments sold | | | 362,670 | | |
Capital shares sold | | | 3,517,879 | | |
Dividends | | | 7,602,920 | | |
Reclaims | | | 664 | | |
Variation margin | | | 47 | | |
Expense reimbursement due from Investment Manager | | | 188 | | |
Total assets | | | 3,707,241,967 | | |
Liabilities | |
Payable for: | |
Investments purchased | | | 763,266 | | |
Capital shares purchased | | | 2,370,341 | | |
Variation margin | | | 604,482 | | |
Investment management fees | | | 10,171 | | |
Distribution and/or service fees | | | 7,742 | | |
Administration fees | | | 10,171 | | |
Compensation of board members | | | 179,299 | | |
Other expenses | | | 825 | | |
Total liabilities | | | 3,946,297 | | |
Net assets applicable to outstanding capital stock | | $ | 3,703,295,670 | | |
Represented by | |
Paid-in capital | | $ | 2,306,378,595 | | |
Undistributed net investment income | | | 27,684,138 | | |
Accumulated net realized loss | | | (28,574,010 | ) | |
Unrealized appreciation (depreciation) on: | |
Investments — unaffiliated issuers | | | 1,386,798,471 | | |
Investments — affiliated issuers | | | 3,587,521 | | |
Futures contracts | | | 7,420,955 | | |
Total — representing net assets applicable to outstanding capital stock | | $ | 3,703,295,670 | | |
The accompanying Notes to Financial Statements are an integral part of this statement.
Annual Report 2015
19
COLUMBIA LARGE CAP INDEX FUND
STATEMENT OF ASSETS AND LIABILITIES (continued)
February 28, 2015
Class A | |
Net assets | | $ | 1,126,444,056 | | |
Shares outstanding | | | 27,743,823 | | |
Net asset value per share | | $ | 40.60 | | |
Class B | |
Net assets | | $ | 243,129 | | |
Shares outstanding | | | 5,974 | | |
Net asset value per share | | $ | 40.70 | | |
Class I | |
Net assets | | $ | 2,873 | | |
Shares outstanding | | | 70 | | |
Net asset value per share(a) | | $ | 40.78 | | |
Class R5 | |
Net assets | | $ | 170,244,202 | | |
Shares outstanding | | | 4,122,688 | | |
Net asset value per share | | $ | 41.29 | | |
Class Z | |
Net assets | | $ | 2,406,361,410 | | |
Shares outstanding | | | 59,003,846 | | |
Net asset value per share | | $ | 40.78 | | |
(a) Net asset value per share rounds to this amount due to fractional shares outstanding.
The accompanying Notes to Financial Statements are an integral part of this statement.
Annual Report 2015
20
COLUMBIA LARGE CAP INDEX FUND
STATEMENT OF OPERATIONS
Year Ended February 28, 2015
Net investment income | |
Income: | |
Dividends — unaffiliated issuers | | $ | 86,407,170 | | |
Dividends — affiliated issuers | | | 165,726 | | |
Interest | | | 16 | | |
Foreign taxes withheld | | | (7,707 | ) | |
Total income | | | 86,565,205 | | |
Expenses: | |
Investment management fees | | | 3,376,904 | | |
Distribution and/or service fees | |
Class A | | | 2,317,373 | | |
Class B | | | 2,433 | | |
Administration fees | | | 3,376,904 | | |
Compensation of board members | | | 66,045 | | |
Other | | | 11,688 | | |
Total expenses | | | 9,151,347 | | |
Fees waived or expenses reimbursed by Investment Manager and its affiliates | | | (77,734 | ) | |
Expense reductions | | | (5,884 | ) | |
Total net expenses | | | 9,067,729 | | |
Net investment income | | | 77,497,476 | | |
Realized and unrealized gain (loss) — net | |
Net realized gain (loss) on: | |
Investments — unaffiliated issuers | | | 4,046,665 | | |
Investments — affiliated issuers | | | 80,506 | | |
Futures contracts | | | 8,931,997 | | |
Net realized gain | | | 13,059,168 | | |
Net change in unrealized appreciation (depreciation) on: | |
Investments — unaffiliated issuers | | | 387,117,354 | | |
Investments — affiliated issuers | | | 800,681 | | |
Futures contracts | | | 6,784,911 | | |
Net change in unrealized appreciation | | | 394,702,946 | | |
Net realized and unrealized gain | | | 407,762,114 | | |
Net increase in net assets resulting from operations | | $ | 485,259,590 | | |
The accompanying Notes to Financial Statements are an integral part of this statement.
Annual Report 2015
21
COLUMBIA LARGE CAP INDEX FUND
STATEMENT OF CHANGES IN NET ASSETS
| | | Year Ended
February 28,
2015 | | Year Ended
February 28,
2014 | |
Operations | |
Net investment income | | $ | 77,497,476 | | | $ | 51,430,402 | | |
Net realized gain | | | 13,059,168 | | | | 6,747,490 | | |
Net change in unrealized appreciation | | | 394,702,946 | | | | 567,426,528 | | |
Net increase in net assets resulting from operations | | | 485,259,590 | | | | 625,604,420 | | |
Distributions to shareholders | |
Net investment income | |
Class A | | | (14,829,787 | ) | | | (10,466,528 | ) | |
Class B | | | (1,921 | ) | | | (2,117 | ) | |
Class I | | | (49 | ) | | | (61 | ) | |
Class R5 | | | (2,613,002 | ) | | | (1,139,886 | ) | |
Class Z | | | (39,992,685 | ) | | | (37,934,014 | ) | |
Net realized gains | |
Class A | | | (398,619 | ) | | | — | | |
Class B | | | (96 | ) | | | — | | |
Class I | | | (1 | ) | | | — | | |
Class R5 | | | (61,227 | ) | | | — | | |
Class Z | | | (899,951 | ) | | | — | | |
Total distributions to shareholders | | | (58,797,338 | ) | | | (49,542,606 | ) | |
Increase in net assets from capital stock activity | | | 73,317,379 | | | | 121,836,159 | | |
Total increase in net assets | | | 499,779,631 | | | | 697,897,973 | | |
Net assets at beginning of year | | | 3,203,516,039 | | | | 2,505,618,066 | | |
Net assets at end of year | | $ | 3,703,295,670 | | | $ | 3,203,516,039 | | |
Undistributed net investment income | | $ | 27,684,138 | | | $ | 8,262,504 | | |
The accompanying Notes to Financial Statements are an integral part of this statement.
Annual Report 2015
22
COLUMBIA LARGE CAP INDEX FUND
STATEMENT OF CHANGES IN NET ASSETS (continued)
| | | Year Ended February 28, 2015 | | Year Ended February 28, 2014 | |
| | | Shares | | Dollars ($) | | Shares | | Dollars ($) | |
Capital stock activity | |
Class A shares | |
Subscriptions(a) | | | 12,232,068 | | | | 466,788,193 | | | | 9,195,065 | | | | 304,489,416 | | |
Distributions reinvested | | | 367,515 | | | | 14,549,403 | | | | 292,428 | | | | 9,969,572 | | |
Redemptions | | | (7,070,021 | ) | | | (270,204,930 | ) | | | (5,931,914 | ) | | | (194,976,467 | ) | |
Net increase | | | 5,529,562 | | | | 211,132,666 | | | | 3,555,579 | | | | 119,482,521 | | |
Class B shares | |
Subscriptions | | | 284 | | | | 10,627 | | | | 77 | | | | 2,589 | | |
Distributions reinvested | | | 48 | | | | 1,904 | | | | 58 | | | | 1,986 | | |
Redemptions(a) | | | (1,627 | ) | | | (59,770 | ) | | | (7,445 | ) | | | (229,990 | ) | |
Net decrease | | | (1,295 | ) | | | (47,239 | ) | | | (7,310 | ) | | | (225,415 | ) | |
Class I shares | |
Redemptions | | | (33 | ) | | | (1,200 | ) | | | — | | | | — | | |
Net increase (decrease) | | | (33 | ) | | | (1,200 | ) | | | — | | | | — | | |
Class R5 shares | |
Subscriptions | | | 2,040,503 | | | | 78,666,552 | | | | 2,961,184 | | | | 100,202,156 | | |
Distributions reinvested | | | 62,516 | | | | 2,517,400 | | | | 29,415 | | | | 1,037,128 | | |
Redemptions | | | (681,138 | ) | | | (26,562,692 | ) | | | (289,884 | ) | | | (10,149,666 | ) | |
Net increase | | | 1,421,881 | | | | 54,621,260 | | | | 2,700,715 | | | | 91,089,618 | | |
Class Z shares | |
Subscriptions | | | 10,922,158 | | | | 418,946,102 | | | | 12,109,711 | | | | 403,555,317 | | |
Distributions reinvested | | | 798,567 | | | | 31,695,172 | | | | 848,375 | | | | 29,003,243 | | |
Redemptions | | | (16,830,574 | ) | | | (643,029,382 | ) | | | (15,825,212 | ) | | | (521,069,125 | ) | |
Net decrease | | | (5,109,849 | ) | | | (192,388,108 | ) | | | (2,867,126 | ) | | | (88,510,565 | ) | |
Total net increase | | | 1,840,266 | | | | 73,317,379 | | | | 3,381,858 | | | | 121,836,159 | | |
(a) Includes conversions of Class B shares to Class A shares, if any.
The accompanying Notes to Financial Statements are an integral part of this statement.
Annual Report 2015
23
COLUMBIA LARGE CAP INDEX FUND
The following tables are intended to help you understand the Fund's financial performance. Certain information reflects financial results for a single share of a class held for the periods shown. Per share net investment income (loss) amounts are calculated based on average shares outstanding during the period. Total return assumes reinvestment of all dividends and distributions, if any. Total return does not reflect payment of sales charges, if any. Total return and portfolio turnover are not annualized for periods of less than one year. The portfolio turnover rate is calculated without regard to purchase and sales transactions of short-term instruments and certain derivatives, if any. If such transactions were included, the Fund's portfolio turnover rate may be higher.
| | | Year Ended February 28, | | Year Ended
February 29, | | Year Ended
February 28, | |
Class A | | 2015 | | 2014 | | 2013 | | 2012 | | 2011 | |
Per share data | |
Net asset value, beginning of period | | $ | 35.85 | | | $ | 29.16 | | | $ | 26.35 | | | $ | 25.62 | | | $ | 21.30 | | |
Income from investment operations: | |
Net investment income | | | 0.83 | | | | 0.53 | | | | 0.50 | | | | 0.42 | | | | 0.37 | | |
Net realized and unrealized gain | | | 4.52 | | | | 6.67 | | | | 2.88 | | | | 0.74 | | | | 4.30 | | |
Total from investment operations | | | 5.35 | | | | 7.20 | | | | 3.38 | | | | 1.16 | | | | 4.67 | | |
Less distributions to shareholders: | |
Net investment income | | | (0.58 | ) | | | (0.51 | ) | | | (0.57 | ) | | | (0.43 | ) | | | (0.35 | ) | |
Net realized gains | | | (0.02 | ) | | | — | | | | — | | | | — | | | | — | | |
Total distributions to shareholders | | | (0.60 | ) | | | (0.51 | ) | | | (0.57 | ) | | | (0.43 | ) | | | (0.35 | ) | |
Net asset value, end of period | | $ | 40.60 | | | $ | 35.85 | | | $ | 29.16 | | | $ | 26.35 | | | $ | 25.62 | | |
Total return | | | 14.98 | % | | | 24.80 | % | | | 12.98 | % | | | 4.67 | % | | | 22.09 | % | |
Ratios to average net assets(a) | |
Total gross expenses | | | 0.45 | % | | | 0.45 | % | | | 0.45 | %(b) | | | 0.45 | % | | | 0.45 | % | |
Total net expenses(c) | | | 0.45 | %(d) | | | 0.45 | %(d) | | | 0.44 | %(b)(d) | | | 0.42 | %(d) | | | 0.39 | % | |
Net investment income | | | 2.18 | % | | | 1.63 | % | | | 1.85 | % | | | 1.72 | % | | | 1.64 | % | |
Supplemental data | |
Net assets, end of period (in thousands) | | $ | 1,126,444 | | | $ | 796,430 | | | $ | 544,128 | | | $ | 472,381 | | | $ | 383,538 | | |
Portfolio turnover | | | 5 | % | | | 3 | % | | | 7 | % | | | 6 | % | | | 2 | % | |
Notes to Financial Highlights
(a) In addition to the fees and expenses that the Fund bears directly, the Fund indirectly bears a pro rata share of the fees and expenses of any other funds in which it invests. Such indirect expenses are not included in the Fund's reported expense ratios.
(b) Ratios include line of credit interest expense which is less than 0.01%.
(c) Total net expenses include the impact of certain fee waivers/expense reimbursements made by the Investment Manager and certain of its affiliates, if applicable.
(d) The benefits derived from expense reductions had an impact of less than 0.01%.
The accompanying Notes to Financial Statements are an integral part of this statement.
Annual Report 2015
24
COLUMBIA LARGE CAP INDEX FUND
FINANCIAL HIGHLIGHTS (continued)
| | | Year Ended February 28, | | Year Ended
February 29, | | Year Ended
February 28, | |
Class B | | 2015 | | 2014 | | 2013 | | 2012 | | 2011 | |
Per share data | |
Net asset value, beginning of period | | $ | 35.93 | | | $ | 29.24 | | | $ | 26.44 | | | $ | 25.70 | | | $ | 21.37 | | |
Income from investment operations: | |
Net investment income | | | 0.50 | | | | 0.28 | | | | 0.28 | | | | 0.22 | | | | 0.20 | | |
Net realized and unrealized gain | | | 4.59 | | | | 6.69 | | | | 2.89 | | | | 0.76 | | | | 4.32 | | |
Total from investment operations | | | 5.09 | | | | 6.97 | | | | 3.17 | | | | 0.98 | | | | 4.52 | | |
Less distributions to shareholders: | |
Net investment income | | | (0.30 | ) | | | (0.28 | ) | | | (0.37 | ) | | | (0.24 | ) | | | (0.19 | ) | |
Net realized gains | | | (0.02 | ) | | | — | | | | — | | | | — | | | | — | | |
Total distributions to shareholders | | | (0.32 | ) | | | (0.28 | ) | | | (0.37 | ) | | | (0.24 | ) | | | (0.19 | ) | |
Net asset value, end of period | | $ | 40.70 | | | $ | 35.93 | | | $ | 29.24 | | | $ | 26.44 | | | $ | 25.70 | | |
Total return | | | 14.20 | % | | | 23.88 | % | | | 12.08 | % | | | 3.90 | % | | | 21.22 | % | |
Ratios to average net assets(a) | |
Total gross expenses | | | 1.20 | % | | | 1.20 | % | | | 1.20 | %(b) | | | 1.20 | % | | | 1.20 | % | |
Total net expenses(c) | | | 1.20 | %(d) | | | 1.20 | %(d) | | | 1.18 | %(b)(d) | | | 1.17 | %(d) | | | 1.14 | % | |
Net investment income | | | 1.31 | % | | | 0.86 | % | | | 1.04 | % | | | 0.90 | % | | | 0.87 | % | |
Supplemental data | |
Net assets, end of period (in thousands) | | $ | 243 | | | $ | 261 | | | $ | 426 | | | $ | 1,305 | | | $ | 3,550 | | |
Portfolio turnover | | | 5 | % | | | 3 | % | | | 7 | % | | | 6 | % | | | 2 | % | |
Notes to Financial Highlights
(a) In addition to the fees and expenses that the Fund bears directly, the Fund indirectly bears a pro rata share of the fees and expenses of any other funds in which it invests. Such indirect expenses are not included in the Fund's reported expense ratios.
(b) Ratios include line of credit interest expense which is less than 0.01%.
(c) Total net expenses include the impact of certain fee waivers/expense reimbursements made by the Investment Manager and certain of its affiliates, if applicable.
(d) The benefits derived from expense reductions had an impact of less than 0.01%.
The accompanying Notes to Financial Statements are an integral part of this statement.
Annual Report 2015
25
COLUMBIA LARGE CAP INDEX FUND
FINANCIAL HIGHLIGHTS (continued)
| | | Year Ended February 28, | | Year Ended
February 29, | |
Class I | | 2015 | | 2014 | | 2013 | | 2012(a) | |
Per share data | |
Net asset value, beginning of period | | $ | 36.01 | | | $ | 29.28 | | | $ | 26.45 | | | $ | 24.22 | | |
Income from investment operations: | |
Net investment income | | | 0.89 | | | | 0.62 | | | | 0.57 | | | | 0.15 | | |
Net realized and unrealized gain | | | 4.59 | | | | 6.70 | | | | 2.89 | | | | 2.49 | | |
Total from investment operations | | | 5.48 | | | | 7.32 | | | | 3.46 | | | | 2.64 | | |
Less distributions to shareholders: | |
Net investment income | | | (0.69 | ) | | | (0.59 | ) | | | (0.63 | ) | | | (0.41 | ) | |
Net realized gains | | | (0.02 | ) | | | — | | | | — | | | | — | | |
Total distributions to shareholders | | | (0.71 | ) | | | (0.59 | ) | | | (0.63 | ) | | | (0.41 | ) | |
Net asset value, end of period | | $ | 40.78 | | | $ | 36.01 | | | $ | 29.28 | | | $ | 26.45 | | |
Total return | | | 15.27 | % | | | 25.12 | % | | | 13.28 | % | | | 11.08 | % | |
Ratios to average net assets(b) | |
Total gross expenses | | | 0.20 | % | | | 0.22 | % | | | 0.22 | %(c) | | | 0.15 | %(d) | |
Total net expenses(e) | | | 0.20 | % | | | 0.20 | % | | | 0.19 | %(c) | | | 0.15 | %(d) | |
Net investment income | | | 2.33 | % | | | 1.88 | % | | | 2.09 | % | | | 2.06 | %(d) | |
Supplemental data | |
Net assets, end of period (in thousands) | | $ | 3 | | | $ | 4 | | | $ | 3 | | | $ | 3 | | |
Portfolio turnover | | | 5 | % | | | 3 | % | | | 7 | % | | | 6 | % | |
Notes to Financial Highlights
(a) Based on operations from November 16, 2011 (commencement of operations) through the stated period end.
(b) In addition to the fees and expenses that the Fund bears directly, the Fund indirectly bears a pro rata share of the fees and expenses of any other funds in which it invests. Such indirect expenses are not included in the Fund's reported expense ratios.
(c) Ratios include line of credit interest expense which is less than 0.01%.
(d) Annualized.
(e) Total net expenses include the impact of certain fee waivers/expense reimbursements made by the Investment Manager and certain of its affiliates, if applicable.
The accompanying Notes to Financial Statements are an integral part of this statement.
Annual Report 2015
26
COLUMBIA LARGE CAP INDEX FUND
FINANCIAL HIGHLIGHTS (continued)
| | | Year Ended February 28, | |
Class R5 | | 2015 | | 2014 | | 2013(a) | |
Per share data | |
Net asset value, beginning of period | | $ | 36.45 | | | $ | 29.63 | | | $ | 27.28 | | |
Income from investment operations: | |
Net investment income | | | 0.94 | | | | 0.68 | | | | 0.21 | | |
Net realized and unrealized gain | | | 4.60 | | | | 6.74 | | | | 2.68 | | |
Total from investment operations | | | 5.54 | | | | 7.42 | | | | 2.89 | | |
Less distributions to shareholders: | |
Net investment income | | | (0.68 | ) | | | (0.60 | ) | | | (0.54 | ) | |
Net realized gains | | | (0.02 | ) | | | — | | | | — | | |
Total distributions to shareholders | | | (0.70 | ) | | | (0.60 | ) | | | (0.54 | ) | |
Net asset value, end of period | | $ | 41.29 | | | $ | 36.45 | | | $ | 29.63 | | |
Total return | | | 15.25 | % | | | 25.14 | % | | | 10.73 | % | |
Ratios to average net assets(b) | |
Total gross expenses | | | 0.20 | % | | | 0.20 | % | | | 0.14 | %(c) | |
Total net expenses(d) | | | 0.20 | % | | | 0.20 | % | | | 0.14 | %(c) | |
Net investment income | | | 2.44 | % | | | 1.96 | % | | | 2.48 | %(c) | |
Supplemental data | |
Net assets, end of period (in thousands) | | $ | 170,244 | | | $ | 98,439 | | | $ | 3 | | |
Portfolio turnover | | | 5 | % | | | 3 | % | | | 7 | % | |
Notes to Financial Highlights
(a) Based on operations from November 8, 2012 (commencement of operations) through the stated period end.
(b) In addition to the fees and expenses that the Fund bears directly, the Fund indirectly bears a pro rata share of the fees and expenses of any other funds in which it invests. Such indirect expenses are not included in the Fund's reported expense ratios.
(c) Annualized.
(d) Total net expenses include the impact of certain fee waivers/expense reimbursements made by the Investment Manager and certain of its affiliates, if applicable.
The accompanying Notes to Financial Statements are an integral part of this statement.
Annual Report 2015
27
COLUMBIA LARGE CAP INDEX FUND
FINANCIAL HIGHLIGHTS (continued)
| | | Year Ended February 28, | | Year Ended
February 29, | | Year Ended
February 28, | |
Class Z | | 2015 | | 2014 | | 2013 | | 2012 | | 2011 | |
Per share data | |
Net asset value, beginning of period | | $ | 36.00 | | | $ | 29.28 | | | $ | 26.45 | | | $ | 25.72 | | | $ | 21.37 | | |
Income from investment operations: | |
Net investment income | | | 0.89 | | | | 0.62 | | | | 0.57 | | | | 0.48 | | | | 0.43 | | |
Net realized and unrealized gain | | | 4.59 | | | | 6.69 | | | | 2.89 | | | | 0.74 | | | | 4.33 | | |
Total from investment operations | | | 5.48 | | | | 7.31 | | | | 3.46 | | | | 1.22 | | | | 4.76 | | |
Less distributions to shareholders: | |
Net investment income | | | (0.68 | ) | | | (0.59 | ) | | | (0.63 | ) | | | (0.49 | ) | | | (0.41 | ) | |
Net realized gains | | | (0.02 | ) | | | — | | | | — | | | | — | | | | — | | |
Total distributions to shareholders | | | (0.70 | ) | | | (0.59 | ) | | | (0.63 | ) | | | (0.49 | ) | | | (0.41 | ) | |
Net asset value, end of period | | $ | 40.78 | | | $ | 36.00 | | | $ | 29.28 | | | $ | 26.45 | | | $ | 25.72 | | |
Total return | | | 15.27 | % | | | 25.09 | % | | | 13.28 | % | | | 4.91 | % | | | 22.44 | % | |
Ratios to average net assets(a) | |
Total gross expenses | | | 0.20 | % | | | 0.20 | % | | | 0.20 | %(b) | | | 0.20 | % | | | 0.20 | % | |
Total net expenses(c) | | | 0.20 | %(d) | | | 0.20 | %(d) | | | 0.19 | %(b)(d) | | | 0.16 | %(d) | | | 0.14 | % | |
Net investment income | | | 2.33 | % | | | 1.88 | % | | | 2.06 | % | | | 1.95 | % | | | 1.88 | % | |
Supplemental data | |
Net assets, end of period (in thousands) | | $ | 2,406,361 | | | $ | 2,308,382 | | | $ | 1,961,058 | | | $ | 3,148,041 | | | $ | 3,050,979 | | |
Portfolio turnover | | | 5 | % | | | 3 | % | | | 7 | % | | | 6 | % | | | 2 | % | |
Notes to Financial Highlights
(a) In addition to the fees and expenses that the Fund bears directly, the Fund indirectly bears a pro rata share of the fees and expenses of any other funds in which it invests. Such indirect expenses are not included in the Fund's reported expense ratios.
(b) Ratios include line of credit interest expense which is less than 0.01%.
(c) Total net expenses include the impact of certain fee waivers/expense reimbursements made by the Investment Manager and certain of its affiliates, if applicable.
(d) The benefits derived from expense reductions had an impact of less than 0.01%.
The accompanying Notes to Financial Statements are an integral part of this statement.
Annual Report 2015
28
COLUMBIA LARGE CAP INDEX FUND
NOTES TO FINANCIAL STATEMENTS
February 28, 2015
Note 1. Organization
Columbia Large Cap Index Fund (the Fund), a series of Columbia Funds Series Trust (the Trust), is a diversified fund. The Trust is registered under the Investment Company Act of 1940, as amended (the 1940 Act), as an open-end management investment company organized as a Delaware statutory trust.
Fund Shares
The Trust may issue an unlimited number of shares (without par value). The Fund offers Class A, Class B, Class I, Class R5 and Class Z shares. Although all share classes generally have identical voting, dividend and liquidation rights, each share class votes separately when required by the Trust's organizational documents or by law. Different share classes pay different distribution amounts to the extent the expenses of such share classes differ, and distributions in liquidation will be proportional to the net asset value of each share class. Each share class has its own expense structure and sales charges.
Class A shares are not subject to any front-end sales charge or contingent deferred sales charge (CDSC).
Class B shares may be subject to a maximum CDSC of 5.00% based upon the holding period after purchase. Class B shares will generally convert to Class A shares eight years after purchase. The Fund no longer accepts investments by new or existing investors in the Fund's Class B shares, except in connection with the reinvestment of any dividend and/or capital gain distributions in Class B shares of the Fund and exchanges by existing Class B shareholders of certain other funds within the Columbia Family of Funds.
Class I shares are not subject to sales charges and are available only to the Columbia Family of Funds.
Class R5 shares are not subject to sales charges and are generally available only to investors purchasing through authorized investment professionals and omnibus retirement plans.
Class Z shares are not subject to sales charges and are available only to eligible investors, which are subject to different investment minimums as described in the Fund's prospectus.
Note 2. Summary of Significant Accounting Policies
Basis of Preparation
The Fund is an investment company that applies the accounting and reporting guidance in the Financial
Accounting Standards Board (FASB) Accounting Standards Codification Topic 946, Financial Services — Investment Companies (ASC 946). The financial statements are prepared in accordance with U.S. generally accepted accounting principles (GAAP) which requires management to make certain estimates and assumptions that affect the reported amounts of assets and liabilities, the disclosure of contingent assets and liabilities at the date of the financial statements and the reported amounts of income and expenses during the reporting period. Actual results could differ from those estimates.
The following is a summary of significant accounting policies followed by the Fund in the preparation of its financial statements.
Security Valuation
All equity securities are valued at the close of business of the New York Stock Exchange (NYSE). Equity securities are valued at the last quoted sales price on the principal exchange or market on which they trade, except for securities traded on the NASDAQ Stock Market, which are valued at the NASDAQ official close price. Unlisted securities or listed securities for which there were no sales during the day are valued at the mean of the latest quoted bid and ask prices on such exchanges or markets.
Foreign equity securities are valued based on quotations from the principal market in which such securities are traded. If any foreign security prices are not readily available as a result of limited share activity, the securities are valued at the mean of the latest quoted bid and ask prices on such exchanges or markets. Foreign currency exchange rates are generally determined at 4:00 p.m. Eastern (U.S.) time. Many securities markets and exchanges outside the U.S. close prior to the close of the NYSE; therefore, the closing prices for securities in such markets or on such exchanges may not fully reflect events that occur after such close but before the close of the NYSE. In those situations, foreign securities will be fair valued pursuant to a policy adopted by the Board of Trustees (the Board), including, if available, utilizing a third party pricing service to determine these fair values. The third party pricing service takes into account multiple factors, including, but not limited to, movements in the U.S. securities markets, certain depositary receipts, futures contracts and foreign exchange rates that have occurred subsequent to the close of the foreign exchange or market, to determine a good faith estimate that reasonably reflects the current market conditions as of the close of the NYSE. The fair
Annual Report 2015
29
COLUMBIA LARGE CAP INDEX FUND
NOTES TO FINANCIAL STATEMENTS (continued)
February 28, 2015
value of a security is likely to be different from the quoted or published price, if available.
Investments in open-end investment companies, including money market funds, are valued at their net asset value.
Futures and options on futures contracts are valued based upon the settlement price established each day by the board of trade or exchange on which they are traded.
Investments for which market quotations are not readily available, or that have quotations which management believes are not reliable, are valued at fair value as determined in good faith under procedures established by and under the general supervision of the Board. If a security or class of securities (such as foreign securities) is valued at fair value, such value is likely to be different from the quoted or published price for the security.
The determination of fair value often requires significant judgment. To determine fair value, management may use assumptions including but not limited to future cash flows and estimated risk premiums. Multiple inputs from various sources may be used to determine fair value.
Derivative Instruments
The Fund invests in certain derivative instruments, as detailed below, to meet its investment objectives. Derivatives are instruments whose values depend on, or are derived from, in whole or in part, the value of one or more other assets, such as securities, currencies, commodities or indices. Derivative instruments may be used to increase investment flexibility (including to maintain cash reserves while maintaining exposure to certain other assets), for risk management (hedging) purposes, to facilitate trading, to reduce transaction costs and to pursue higher investment returns. The Fund may also use derivative instruments to mitigate certain investment risks, such as foreign currency exchange rate risk, interest rate risk and credit risk. Derivatives may involve various risks, including the potential inability of the counterparty to fulfill its obligation under the terms of the contract, the potential for an illiquid secondary market (making it difficult for the Fund to sell, including at favorable prices) and the potential for market movements which may expose the Fund to gains or losses in excess of the amount shown in the Statement of Assets and Liabilities. The notional amounts of derivative instruments, if applicable, are not recorded in the financial statements.
A derivative instrument may suffer a marked-to-market loss if the value of the contract decreases due to an
unfavorable change in the market rates or values of the underlying instrument. Losses can also occur if the counterparty does not perform under the contract. The Fund's risk of loss from counterparty credit risk on over-the-counter derivatives is generally limited to the aggregate unrealized gain netted against any collateral held by the Fund and the amount of any variation margin held by the counterparty. With exchange-traded or centrally cleared derivatives, there is reduced counterparty credit risk to the Fund since the exchange's clearinghouse, as counterparty to such instruments, guarantees against a possible default. The clearinghouse stands between the buyer and the seller of the contract; therefore, the counterparty credit risk is failure of the clearinghouse. However, credit risk still exists in exchange-traded or centrally cleared derivatives with respect to initial and variation margin that is held in a broker's customer account. While brokers are required to segregate customer margin from their own assets, in the event that a broker becomes insolvent or goes into bankruptcy and at that time there is a shortfall in the aggregate amount of margin held by the broker for all its clients, U.S. bankruptcy laws will typically allocate that shortfall on a pro-rata basis across all the broker's customers (including the Fund), potentially resulting in losses to the Fund.
In order to better define its contractual rights and to secure rights that will help the Fund mitigate its counterparty risk, the Fund may enter into an International Swaps and Derivatives Association, Inc. Master Agreement (ISDA Master Agreement) or similar agreement with its derivative contract counterparties. An ISDA Master Agreement is an agreement between the Fund and a counterparty that governs over-the-counter derivatives and forward foreign currency exchange contracts and typically contains, among other things, collateral posting terms and netting provisions in the event of a default and/or termination event. Under an ISDA Master Agreement, the Fund may, under certain circumstances, offset with the counterparty certain derivative instrument's payables and/or receivables with collateral held and/or posted and create one single net payment. The provisions of the ISDA Master Agreement typically permit a single net payment in the event of default (close-out netting) including the bankruptcy or insolvency of the counterparty. Note, however, that bankruptcy or insolvency laws of a particular jurisdiction may impose restrictions on or prohibitions against the right of offset in bankruptcy, insolvency or other events.
Annual Report 2015
30
COLUMBIA LARGE CAP INDEX FUND
NOTES TO FINANCIAL STATEMENTS (continued)
February 28, 2015
Collateral (margin) requirements differ by type of derivative. Margin requirements are established by the exchange or clearinghouse for exchange-traded and centrally cleared derivatives. Brokers can ask for margin in excess of the minimum in certain circumstances. Collateral terms are contract specific for over-the-counter derivatives. For over-the-counter derivatives traded under an ISDA Master Agreement, the collateral requirements are typically calculated by netting the marked-to-market amount for each transaction under such agreement and comparing that amount to the value of any variation margin currently pledged by the Fund and/or the counterparty. Generally, the amount of collateral due from or to a party has to exceed a minimum transfer amount threshold (e.g., $500,000) before a transfer has to be made. To the extent amounts due to the Fund from its counterparties are not fully collateralized, contractually or otherwise, the Fund bears the risk of loss from counterparty nonperformance. The Fund attempts to mitigate counterparty risk by only entering into agreements with counterparties that it believes have the financial resources to honor their obligations and by monitoring the financial stability of those counterparties.
Certain ISDA Master Agreements allow counterparties to over-the-counter derivatives to terminate derivative contracts prior to maturity in the event the Fund's net assets decline by a stated percentage over a specified time period or if the Fund fails to meet the terms of the ISDA Master Agreement, which would cause the Fund to accelerate payment of any net liability owed to the counterparty. The Fund also has termination rights if the counterparty fails to meet the terms of the ISDA Master Agreement. In addition to considering counterparty credit risk, the Fund would consider terminating the derivative contracts based on whether termination would result in a net liability owed from the counterparty.
For financial reporting purposes, the Fund does not offset derivative assets and derivative liabilities that are subject to netting arrangements in the Statement of Assets and Liabilities.
Futures Contracts
Futures contracts are exchange traded and represent commitments for the future purchase or sale of an asset at a specified price on a specified date. The Fund bought and sold futures contracts to maintain appropriate equity market exposure while keeping sufficient cash to accommodate daily redemptions. These instruments may be used for other purposes in future periods. Upon entering into futures contracts, the Fund bears risks that it may not achieve the anticipated benefits of the futures
contracts and may realize a loss. Additional risks include counterparty credit risk, the possibility of an illiquid market, and that a change in the value of the contract or option may not correlate with changes in the value of the underlying asset.
Upon entering into a futures contract, the Fund pledges cash or securities with the broker in an amount sufficient to meet the initial margin requirement. The initial margin deposit must be maintained at an established level over the life of the contract. Cash deposited as initial margin is recorded in the Statement of Assets and Liabilities as margin deposits. Securities deposited as initial margin are designated in the Portfolio of Investments. Subsequent payments (variation margin) are made or received by the Fund each day. The variation margin payments are equal to the daily change in the contract value and are recorded as variation margin receivable or payable and are offset in unrealized gains or losses. The Fund recognizes a realized gain or loss when the contract is closed or expires. Futures contracts involve, to varying degrees, risk of loss in excess of the variation margin disclosed in the Statement of Assets and Liabilities.
Effects of Derivative Transactions in the Financial Statements
The following tables are intended to provide additional information about the effect of derivatives on the financial statements of the Fund, including: the fair value of derivatives by risk category and the location of those fair values in the Statement of Assets and Liabilities; and the impact of derivative transactions over the period in the Statement of Operations, including realized gains or losses and unrealized gains or losses. The derivative schedules following the Portfolio of Investments present additional information regarding derivative instruments outstanding at the end of the period, if any.
The following table is a summary of the fair value of derivative instruments (not considered to be hedging instruments for accounting disclosure purposes) at February 28, 2015:
Asset Derivatives | |
Risk Exposure
Category | | Statement of Assets and
Liabilities Location | | Fair Value ($) | |
Equity risk
| | Net assets — unrealized
appreciation on futures
contracts | | | 7,420,955* | | |
*Includes cumulative appreciation (depreciation) as reported in the tables following the Portfolio of Investments. Only the current day's variation margin is reported in receivables or payables in the Statement of Assets and Liabilities.
Annual Report 2015
31
COLUMBIA LARGE CAP INDEX FUND
NOTES TO FINANCIAL STATEMENTS (continued)
February 28, 2015
The following table indicates the effect of derivative instruments (not considered to be hedging instruments for accounting disclosure purposes) in the Statement of Operations for the year ended February 28, 2015:
Amount of Realized Gain (Loss) on Derivatives Recognized in Income | |
Risk Exposure Category | | Futures Contracts ($) | |
Equity risk | | | 8,931,997 | | |
Change in Unrealized Appreciation (Depreciation) on
Derivatives Recognized in Income | |
Risk Exposure Category | | Futures Contracts ($) | |
Equity risk | | | 6,784,911 | | |
The following table is a summary of the average outstanding volume by derivative instrument for the year ended February 28, 2015:
Derivative Instrument | | Average Notional Amounts ($)* | |
Futures contracts — Long | | | 106,453,856 | | |
*Based on the ending quarterly outstanding amounts for the year ended February 28, 2015.
Security Transactions
Security transactions are accounted for on the trade date. Cost is determined and gains (losses) are based upon the specific identification method for both financial statement and federal income tax purposes.
Income Recognition
Corporate actions and dividend income are generally recorded net of any non-reclaimable tax withholdings, on the ex-dividend date or upon receipt of ex-dividend notification in the case of certain foreign securities.
The Fund may receive distributions from holdings in business development companies (BDCs), exchange-traded funds (ETFs), other regulated investment companies (RICs), and real estate investment trusts (REITs), which report information on the character of their distributions annually. These distributions are allocated to dividend income, capital gain and return of capital based on actual information reported. To the extent actual information has not yet been reported by the REITs, estimates for return of capital are made by the Fund's management. Return of capital is recorded as a reduction of the cost basis of securities held. If the Fund no longer owns the applicable securities, return of capital is recorded as a realized gain. Management's estimates are subsequently adjusted when the actual character of the distributions is disclosed by the REITs, which could result in a proportionate change in return of capital to
shareholders. No estimates are made for the BDCs, ETFs, and RICs.
Awards from class action litigation are recorded as a reduction of cost basis if the Fund still owns the applicable securities on the payment date. If the Fund no longer owns the applicable securities, the proceeds are recorded as realized gains.
Expenses
General expenses of the Trust are allocated to the Fund and other funds of the Trust based upon relative net assets or other expense allocation methodologies determined by the nature of the expense. Expenses directly attributable to the Fund are charged to the Fund. Expenses directly attributable to a specific class of shares are charged to that share class.
Determination of Class Net Asset Value
All income, expenses (other than class-specific expenses, which are charged to that share class, as shown in the Statement of Operations) and realized and unrealized gains (losses) are allocated to each class of the Fund on a daily basis, based on the relative net assets of each class, for purposes of determining the net asset value of each class.
Federal Income Tax Status
The Fund intends to qualify each year as a regulated investment company under Subchapter M of the Internal Revenue Code, as amended, and will distribute substantially all of its taxable income (including net short-term capital gains), if any, for its tax year, and as such will not be subject to federal income taxes. In addition, the Fund intends to distribute in each calendar year substantially all of its net investment income, capital gains and certain other amounts, if any, such that the Fund should not be subject to federal excise tax. Therefore, no federal income or excise tax provision is recorded.
Foreign Taxes
The Fund may be subject to foreign taxes on income, gains on investments or currency repatriation, a portion of which may be recoverable. The Fund will accrue such taxes and recoveries, as applicable, based upon its current interpretation of tax rules and regulations that exist in the markets in which it invests.
Realized gains in certain countries may be subject to foreign taxes at the Fund level, based on statutory rates. The Fund accrues for such foreign taxes on realized and unrealized gains at the appropriate rate for each
Annual Report 2015
32
COLUMBIA LARGE CAP INDEX FUND
NOTES TO FINANCIAL STATEMENTS (continued)
February 28, 2015
jurisdiction, as applicable. The amount, if any, is disclosed as a liability on the Statement of Assets and Liabilities.
Distributions to Shareholders
Distributions from net investment income, if any, are declared and paid semi-annually. Net realized capital gains, if any, are distributed at least annually. Income distributions and capital gain distributions are determined in accordance with federal income tax regulations, which may differ from GAAP.
Guarantees and Indemnifications
Under the Trust's organizational documents and, in some cases, by contract, its officers and trustees are indemnified against certain liabilities arising out of the performance of their duties to the Trust or its funds. In addition, certain of the Fund's contracts with its service providers contain general indemnification clauses. The Fund's maximum exposure under these arrangements is unknown since the amount of any future claims that may be made against the Fund cannot be determined, and the Fund has no historical basis for predicting the likelihood of any such claims.
Note 3. Fees and Compensation Paid to Affiliates
Investment Management Fees
Under an Investment Management Services Agreement, Columbia Management Investment Advisers, LLC (the Investment Manager), a wholly-owned subsidiary of Ameriprise Financial, Inc. (Ameriprise Financial), determines which securities will be purchased, held or sold. The investment management fee is an annual fee that is equal to 0.10% of the Fund's average daily net assets.
Administration Fees
Under an Administrative Services Agreement, the Investment Manager also serves as the Fund Administrator. The Fund pays the Fund Administrator an annual fee for administration and accounting services equal to 0.10% of the Fund's average daily net assets.
The Investment Manager, from the administration fee it receives from the Fund, pays all operating expenses of the Fund, with the exception of brokerage fees and commissions, interest, taxes, fees and expenses of Trustees who are not officers, directors or employees of the Investment Manager or its affiliates, distribution and/or shareholder servicing and plan administration
fees and any extraordinary non-recurring expenses that may arise, including litigation expenses.
Other Expenses
Other expenses are for, among other things, miscellaneous expenses of the Fund or the Board, including payments to a company providing limited administrative services to the Fund and the Board. That company's expenses include boardroom and office expense, employee compensation, employee health and retirement benefits, and certain other expenses. For the year ended February 28, 2015, other expenses paid by the Fund to this company were $6,054.
Compensation of Board Members
Board members are compensated for their services to the Fund as disclosed in the Statement of Operations. Under a Deferred Compensation Plan (the Plan), the Board members who are not "interested persons" of the Fund, as defined under the 1940 Act, may elect to defer payment of up to 100% of their compensation. Deferred amounts are treated as though equivalent dollar amounts had been invested in shares of certain funds managed by the Investment Manager. The Fund's liability for these amounts is adjusted for market value changes and remains in the Fund until distributed in accordance with the Plan.
Transfer Agent Fees
Under a Transfer and Dividend Disbursing Agent Agreement, Columbia Management Investment Services Corp. (the Transfer Agent), an affiliate of the Investment Manager and a wholly-owned subsidiary of Ameriprise Financial, is responsible for providing transfer agency services to the Fund. The Transfer Agent has contracted with Boston Financial Data Services (BFDS) to serve as sub-transfer agent.
The transfer agent fees are payable by the Investment Manager. The Transfer Agent pays the fees of BFDS for services as sub-transfer agent and is not entitled to reimbursement for such fees from the Fund. The Transfer Agent also receives compensation from the Investment Manager for various shareholder services and reimbursements for certain out-of-pocket expenses.
An annual minimum account balance fee of $20 may apply to certain accounts with a value below the applicable share class's initial minimum investment requirements to reduce the impact of small accounts on transfer agent fees. These minimum account balance fees are remitted to the Fund and recorded as part of expense reductions in the Statement of Operations. For the year ended February 28, 2015, these minimum
Annual Report 2015
33
COLUMBIA LARGE CAP INDEX FUND
NOTES TO FINANCIAL STATEMENTS (continued)
February 28, 2015
account balance fees reduced total expenses of the Fund by $5,884.
Distribution and Service Fees
The Fund has an agreement with Columbia Management Investment Distributors, Inc. (the Distributor), an affiliate of the Investment Manager and a wholly-owned subsidiary of Ameriprise Financial, for distribution and shareholder services. The Board has approved, and the Fund has adopted, distribution and shareholder service plans (the Plans) applicable to certain share classes, which set the distribution and service fees for the Fund. These fees are calculated daily and are intended to compensate the Distributor and/or eligible selling and/or servicing agents for selling shares of the Fund and providing services to investors.
Under the Plans, the Fund pays a monthly combined distribution and service fee to the Distributor at the maximum annual rate of 0.25% of the average daily net assets attributable to Class A shares of the Fund. Also under the Plans, the Fund pays a monthly service fee at the maximum annual rate of 0.25% of the average daily net assets attributable to Class B shares of the Fund and the payment of a monthly distribution fee at the maximum annual rate of 0.75% of the average daily net assets attributable to Class B shares of the Fund.
Expenses Waived/Reimbursed by the Investment Manager and its Affiliates
The Investment Manager and certain of its affiliates have contractually agreed to waive fees and/or reimburse expenses (excluding certain fees and expenses described below) for the period disclosed below, unless sooner terminated at the sole discretion of the Board, so that the Fund's net operating expenses, after giving effect to fees waived/expenses reimbursed and any balance credits and/or overdraft charges from the Fund's custodian, do not exceed the following annual rates as a percentage of the class' average daily net assets:
| | | Fee Rates Contractual
through
June 30, 2015 | |
Class A | | | 0.45 | % | |
Class B | | | 1.20 | | |
Class I | | | 0.20 | | |
Class R5 | | | 0.20 | | |
Class Z | | | 0.20 | | |
Under the agreement governing these fee waivers and/or expense reimbursement arrangements, the following
fees and expenses are excluded from the waiver/reimbursement commitment, and therefore will be paid by the Fund, if applicable: taxes (including foreign transaction taxes), expenses associated with investments in affiliated and non-affiliated pooled investment vehicles (including mutual funds and exchange-traded funds), transaction costs and brokerage commissions, costs related to any securities lending program, dividend expenses associated with securities sold short, inverse floater program fees and expenses, transaction charges and interest on borrowed money, interest, extraordinary expenses and any other expenses the exclusion of which is specifically approved by the Board. This agreement may be modified or amended only with approval from all parties. Any fees waived and/or expenses reimbursed under the expense reimbursement arrangements described above are not recoverable by the Investment Manager or its affiliates in future periods.
Note 4. Federal Tax Information
The timing and character of income and capital gain distributions are determined in accordance with income tax regulations, which may differ from GAAP because of temporary or permanent book to tax differences.
At February 28, 2015, these differences are primarily due to differing treatment for deferral/reversal of wash sale losses, Trustees' deferred compensation, re-characterization of distributions for investments and derivative investments. To the extent these differences are permanent, reclassifications are made among the components of the Fund's net assets in the Statement of Assets and Liabilities. Temporary differences do not require reclassifications. In the Statement of Assets and Liabilities the following reclassifications were made:
Undistributed net investment income | | $ | (638,398 | ) | |
Accumulated net realized loss | | | 638,398 | | |
Paid-in capital | | | — | | |
Net investment income (loss) and net realized gains (losses), as disclosed in the Statement of Operations, and net assets were not affected by this reclassification.
The tax character of distributions paid during the years indicated was as follows:
Year Ended February 28, | | 2015 | | 2014 | |
Ordinary income | | $ | 58,797,338 | | | $ | 49,542,606 | | |
Short-term capital gain distributions, if any, are considered ordinary income distributions for tax purposes.
Annual Report 2015
34
COLUMBIA LARGE CAP INDEX FUND
NOTES TO FINANCIAL STATEMENTS (continued)
February 28, 2015
At February 28, 2015, the components of distributable earnings on a tax basis were as follows:
Undistributed ordinary income | | $ | 37,116,430 | | |
Net unrealized appreciation | | | 1,359,950,591 | | |
At February 28, 2015, the cost of investments for federal income tax purposes was $2,335,807,008 and the aggregate gross unrealized appreciation and depreciation based on that cost was:
Unrealized appreciation | | $ | 1,494,950,092 | | |
Unrealized depreciation | | | (134,999,501 | ) | |
Net unrealized appreciation | | | 1,359,950,591 | | |
For the year ended February 28, 2015, $189,210 of capital loss carryforward was utilized.
Management of the Fund has concluded that there are no significant uncertain tax positions in the Fund that would require recognition in the financial statements. However, management's conclusion may be subject to review and adjustment at a later date based on factors including, but not limited to, new tax laws, regulations, and administrative interpretations (including relevant court decisions). Generally, the Fund's federal tax returns for the prior three fiscal years remain subject to examination by the Internal Revenue Service.
Note 5. Portfolio Information
The cost of purchases and proceeds from sales of securities, excluding short-term investments and derivatives, if any, aggregated to $179,184,370 and $168,006,358, respectively, for the year ended February 28, 2015. The amount of purchase and sale activity impacts the portfolio turnover rate reported in the Financial Highlights.
Note 6. Affiliated Money Market Fund
The Fund invests in Columbia Short-Term Cash Fund, an affiliated money market fund established for the exclusive use by the Fund and other affiliated funds. The income earned by the Fund from such investments is included as Dividends — affiliated issuers in the Statement of Operations. As an investing fund, the Fund indirectly bears its proportionate share of the expenses of Columbia Short-Term Cash Fund.
Note 7. Shareholder Concentration
At February 28, 2015, three unaffiliated shareholders of record owned 36.4% of the outstanding shares of the Fund in one or more accounts. The Fund has no knowledge about whether any portion of those shares
was owned beneficially. Subscription and redemption activity by concentrated accounts may have a significant effect on the operations of the Fund.
Note 8. Line of Credit
The Fund has entered into a revolving credit facility with a syndicate of banks led by JPMorgan Chase Bank, N.A. (JPMorgan) whereby the Fund may borrow for the temporary funding of shareholder redemptions or for other temporary or emergency purposes. Pursuant to a December 9, 2014 amendment, the credit facility agreement, which is a collective agreement between the Fund and certain other funds managed by the Investment Manager, severally and not jointly, permits collective borrowings up to $550 million. Interest is charged to each participating fund based on its borrowings at a rate equal to the higher of (i) the overnight federal funds rate plus 1.00% or (ii) the one-month LIBOR rate plus 1.00%. Each borrowing under the credit facility matures no later than 60 days after the date of borrowing. The Fund also pays a commitment fee equal to its pro rata share of the amount of the credit facility at a rate of 0.075% per annum. The commitment fee is included in other expenses in the Statement of Operations. Prior to the December 9, 2014 amendment, the credit facility agreement permitted borrowings up to $500 million under the same terms and interest rates as described above.
The Fund had no borrowings during the year ended February 28, 2015.
Note 9. Subsequent Events
Management has evaluated the events and transactions that have occurred through the date the financial statements were issued and noted no items requiring adjustment of the financial statements or additional disclosure.
Note 10. Information Regarding Pending and Settled Legal Proceedings
In December 2005, without admitting or denying the allegations, American Express Financial Corporation (AEFC, which is now known as Ameriprise Financial, Inc. (Ameriprise Financial)) entered into settlement agreements with the Securities and Exchange Commission (SEC) and Minnesota Department of Commerce (MDOC) related to market timing activities. As a result, AEFC was censured and ordered to cease and desist from committing or causing any violations of certain provisions of the Investment Advisers Act of 1940,
Annual Report 2015
35
COLUMBIA LARGE CAP INDEX FUND
NOTES TO FINANCIAL STATEMENTS (continued)
February 28, 2015
the Investment Company Act of 1940, and various Minnesota laws. AEFC agreed to pay disgorgement of $10 million and civil money penalties of $7 million. AEFC also agreed to retain an independent distribution consultant to assist in developing a plan for distribution of all disgorgement and civil penalties ordered by the SEC in accordance with various undertakings detailed at www.sec.gov/litigation/admin/ia-2451.pdf. Ameriprise Financial and its affiliates have cooperated with the SEC and the MDOC in these legal proceedings, and have made regular reports to the Funds' Boards of Trustees.
Ameriprise Financial and certain of its affiliates have historically been involved in a number of legal, arbitration and regulatory proceedings, including routine litigation, class actions, and governmental actions, concerning matters arising in connection with the conduct of their business activities. Ameriprise Financial believes that the Funds are not currently the subject of, and that neither Ameriprise Financial nor any of its affiliates are the subject of, any pending legal, arbitration or regulatory proceedings that are likely to have a material adverse effect on the Funds or the ability of Ameriprise Financial or its affiliates to perform under their contracts with the Funds. Ameriprise Financial is required to make quarterly (10-Q), annual (10-K) and, as necessary, 8-K filings with the Securities and Exchange Commission on legal and regulatory matters that relate to Ameriprise Financial and its affiliates. Copies of these filings may be obtained by accessing the SEC website at www.sec.gov.
There can be no assurance that these matters, or the adverse publicity associated with them, will not result in increased fund redemptions, reduced sale of fund shares or other adverse consequences to the Funds. Further, although we believe proceedings are not likely to have a material adverse effect on the Funds or the ability of Ameriprise Financial or its affiliates to perform under their contracts with the Funds, these proceedings are subject to uncertainties and, as such, we are unable to estimate the possible loss or range of loss that may result. An adverse outcome in one or more of these proceedings could result in adverse judgments, settlements, fines, penalties or other relief that could have a material adverse effect on the consolidated financial condition or results of operations of Ameriprise Financial.
Annual Report 2015
36
COLUMBIA LARGE CAP INDEX FUND
REPORT OF INDEPENDENT REGISTERED PUBLIC ACCOUNTING FIRM
To the Trustees of Columbia Funds Series Trust and the Shareholders of
Columbia Large Cap Index Fund
In our opinion, the accompanying statement of assets and liabilities, including the portfolio of investments, and the related statements of operations and of changes in net assets and the financial highlights present fairly, in all material respects, the financial position of Columbia Large Cap Index Fund (the "Fund", a series of Columbia Funds Series Trust) at February 28, 2015, and the results of its operations, the changes in its net assets and the financial highlights for each of the periods indicated, in conformity with accounting principles generally accepted in the United States of America. These financial statements and financial highlights (hereafter referred to as "financial statements") are the responsibility of the Fund's management; our responsibility is to express an opinion on these financial statements based on our audits. We conducted our audits of these financial statements in accordance with the standards of the Public Company Accounting Oversight Board (United States). Those standards require that we plan and perform the audit to obtain reasonable assurance about whether the financial statements are free of material misstatement. An audit includes examining, on a test basis, evidence supporting the amounts and disclosures in the financial statements, assessing the accounting principles used and significant estimates made by management, and evaluating the overall financial statement presentation. We believe that our audits, which included confirmation of securities at February 28, 2015 by correspondence with the custodian, brokers and transfer agent, provide a reasonable basis for our opinion.
PricewaterhouseCoopers LLP
Minneapolis, Minnesota
April 21, 2015
Annual Report 2015
37
COLUMBIA LARGE CAP INDEX FUND
FEDERAL INCOME TAX INFORMATION
(Unaudited)
The Fund hereby designates the following tax attributes for the fiscal year ended February 28, 2015. Shareholders will be notified in early 2016 of the amounts for use in preparing 2015 income tax returns.
Tax Designations:
| Qualified Dividend Income | | | 95.37 | % | |
| Dividends Received Deduction | | | 93.27 | % | |
Qualified Dividend Income. For taxable, non-corporate shareholders, the percentage of ordinary income distributed during the fiscal year that represents qualified dividend income subject to reduced tax rates.
Dividends Received Deduction. The percentage of ordinary income distributed during the fiscal year that qualifies for the corporate dividends received deduction.
Annual Report 2015
38
COLUMBIA LARGE CAP INDEX FUND
Shareholders elect the Board that oversees the Funds' operations. The Board appoints officers who are responsible for day-to-day business decisions based on policies set by the Board. The following table provides basic biographical information about the Funds' Board members, including their principal occupations during the past five years, although specific titles for individuals may have varied over the period. Under current Board policy, members may serve through the end of the calendar year in which he or she reaches either the mandatory retirement age established by the Board or the fifteenth anniversary of the first Board meeting they attended as a member of the Board.
Independent Trustees
Name,
Address,
Year of Birth | | Position Held With
Funds and Length of
Service | | Principal Occupation(s)
During Past Five Years
and Other Relevant
Professional Experience | | Number of
Funds in the
Fund Family
Overseen by
Board Member | | Other Present or Past
Directorships/
Trusteeships
(Within Past 5 Years) | |
Kathleen Blatz
901 S. Marquette Ave.
Minneapolis, MN 55402
1954 | | Board member since 1/06 for RiverSource Funds and since 6/11 for Nations Funds | | Attorney; specializing in arbitration and mediation; Chief Justice, Minnesota Supreme Court, 1998-2006; Associate Justice, Minnesota Supreme Court, 1996-1998; Fourth Judicial District Court Judge, Hennepin Country, 1994-1996; Attorney in private practice and public service, 1984-1993; State Representative, Minnesota House of Representatives, 1979-1993, which included service on the Tax and Financial Institutions and Insurance Committees | | | 127 | | | Trustee, BlueCross BlueShield of Minnesota (Chair of the Business Development Committee) since 2009; Chair of the Robina Foundation since August 2013 | |
Edward J. Boudreau, Jr.
901 S. Marquette Ave.
Minneapolis, MN 55402
1944 | | Board member since 6/11 for RiverSource Funds and since 1/05 for Nations Funds | | Managing Director, E.J. Boudreau & Associates (consulting) since 2000; FINRA Industry Arbitrator, 2002-present; Chairman and Chief Executive Officer, John Hancock Funds (asset management), Chairman and Interested Trustee for open-end and closed-end funds offered by John Hancock, 1989-2000; John Hancock Life Insurance Company, including SVP and Treasurer and SVP Information Technology, 1968-1988 | | | 125 | | | Former Trustee, BofA Funds Series Trust (11 funds), 2005-2011; Trustee, Boston Museum of Science (Chair of Finance Committee), 1985-2013 | |
Pamela G. Carlton
901 S. Marquette Ave.
Minneapolis, MN 55402
1954 | | Board member since 7/07 for RiverSource Funds and since 6/11 for Nations Funds | | President, Springboard — Partners in Cross Cultural Leadership (consulting company) since 2003; Managing Director of US Equity Research, JP Morgan Chase, 1999-2003; Director of US Equity Research, Chase Asset Management, 1996- 1999; Co-Director Latin America Research, 1993-1996, COO Global Research, 1992-1996, Co-Director of US Research, 1991-1992, Investment Banker, Morgan Stanley, 1982-1991 | | | 127 | | | None | |
Annual Report 2015
39
COLUMBIA LARGE CAP INDEX FUND
TRUSTEES AND OFFICERS (continued)
Independent Trustees (continued)
Name,
Address,
Year of Birth | | Position Held With
Funds and Length of
Service | | Principal Occupation(s)
During Past Five Years
and Other Relevant
Professional Experience | | Number of
Funds in the
Fund Family
Overseen by
Board Member | | Other Present or Past
Directorships/
Trusteeships
(Within Past 5 Years) | |
William P. Carmichael
901 S. Marquette Ave.
Minneapolis, MN 55402
1943 | | Chair of the Board since 1/14, Board member since 6/11 for RiverSource Funds and since 2003 for Nations Funds | | Retired; Co-founder, The Succession Fund (provides exit strategies to owners of privately held companies) 1998-2007; Adjunct Professor of Finances, Kelley School of Business, Indiana University, 1993-2007; Senior Vice President, Sara Lee Corporation, 1991-1993; Senior Vice President and Chief Financial Officer, Beatrice Foods Company, 1984-1990; Vice President, Esmark, Inc, 1973-1984.; Associate, Price Waterhouse, 1968-1972 | | | 127 | | | Director, Cobra Electronics Corporation (electronic equipment manufacturer), 1994-August 2014; The Finish Line (athletic shoes and apparel) since July 2003; Director, International Textile Corp. since 2012; former Director, McMoRan Exploration Company (oil and gas exploration and development) 2010-2013; former Trustee, BofA Funds Series Trust (11 funds) 2009-2011; Director, Spectrum Brands, Inc. (consumer products), 2002-2009; Director, Simmons Company (bedding), 2004-2010 | |
Patricia M. Flynn
901 S. Marquette Ave.
Minneapolis, MN 55402
1950 | | Board member since 11/04 for RiverSource Funds and since 6/11 for Nations Funds | | Trustee Professor of Economics and Management, Bentley University since 1976 (also teaches and conducts research on corporate governance); Dean, McCallum Graduate School of Business, Bentley University, 1992-2002 | | | 127 | | | Trustee, MA Taxpayers Foundation since 1997; Board of Governors, Innovation Institute, MA Technology Collaborative since 2010 | |
William A. Hawkins
901 S. Marquette Ave.
Minneapolis, MN 55402
1942 | | Board member since 6/11 for RiverSource Funds and since 1/05 for Nations Funds | | Managing Director, Overton Partners (financial consulting), since August 2010; President and Chief Executive Officer, California General Bank, N.A., January 2008-August 2010; Operation Hope, COO, 2004-2007; IndyMac Bancorp, President, CBG, 1999-2003; American General Bank, President, 1997-1999; Griffin Financial Services, CEO, 1981-1997; The Griffin Funds, CEO, 1992-1998 | | | 125 | | | Trustee, BofA Funds Series Trust (11 funds) | |
R. Glenn Hilliard
901 S. Marquette Ave.
Minneapolis, MN 55402
1943 | | Board member since 6/11 for RiverSource Funds and since 1/05 for Nations Funds | | Chairman and Chief Executive Officer, Hilliard Group LLC (investing and consulting) since April 2003; Non-Executive Director & Chairman, CNO Financial Group, Inc. (insurance), September 2003-May 2011 | | | 125 | | | Chairman, BofA Funds Series Trust (11 funds); former Director, CNO Financial Group, Inc. (insurance) 2003-2011 | |
Annual Report 2015
40
COLUMBIA LARGE CAP INDEX FUND
TRUSTEES AND OFFICERS (continued)
Independent Trustees (continued)
Name,
Address,
Year of Birth | | Position Held With
Funds and Length of
Service | | Principal Occupation(s)
During Past Five Years
and Other Relevant
Professional Experience | | Number of
Funds in the
Fund Family
Overseen by
Board Member | | Other Present or Past
Directorships/
Trusteeships
(Within Past 5 Years) | |
Catherine James Paglia
901 S. Marquette Ave.
Minneapolis, MN 55402
1952 | | Board member since 11/04 for RiverSource Funds and since 6/11 for Nations Funds | | Director, Enterprise Asset Management, Inc. (private real estate and asset management company) since September 1998; Managing Director and Partner, Interlaken Capital, Inc., 1989-1997; Managing Director, Morgan Stanley, 1982-1989; Vice President, Investment Banking, 1980-1982, Associate, Investment Banking, 1976-1980, Dean Witter Reynolds, Inc. | | | 127 | | | Director, Valmont Industries, Inc. (irrigation systems manufacturer) since 2012; Trustee, Carleton College (on the Investment Committee); Trustee, Carnegie Endowment for International Peace (on the Investment Committee) | |
Leroy C. Richie
901 S. Marquette Ave.
Minneapolis, MN 55402
1941 | | Board member since 2000 for Seligman Funds, since 11/08 for RiverSource Funds and since 6/11 for Nations Funds | | Counsel, Lewis & Munday, P.C. (law firm) since 2004; Vice President and General Counsel, Automotive Legal Affairs, Chrysler Corporation, 1993-1997 | | | 127 | | | Lead Outside Director, Digital Ally, Inc. (digital imaging) since September 2005; Director, Infinity, Inc. (oil and gas exploration and production) since 1994; Director, OGE Energy Corp. (energy and energy services) since November 2007-2014 | |
Minor M. Shaw
901 S. Marquette Ave.
Minneapolis, MN 55402
1947 | | Board member since 6/11 for RiverSource Funds and since 2003 for Nations Funds | | President, Micco LLC (private investments) since 2011; President, Micco Corp. (family investment business) 1998-2011 | | | 125 | | | Director, Piedmont Natural Gas; Director, BlueCross BlueShield of South Carolina since April 2008; Chair of the Duke Endowment; Director, National Association of Corporate Directors, Carolinas Chapter, since 2013; Chair of Greenville-Spartanburg Airport Commission; former Trustee, BofA Funds Series Trust (11 funds), 2003-2011 | |
Alison Taunton-Rigby
901 S. Marquette Ave.
Minneapolis, MN 55402
1944 | | Board member since 11/02 for RiverSource Funds and since 6/11 for Nations Funds | | Managing Director, Forester Biotech (consulting) since 2001; Chief Executive Officer and Director, RiboNovix, Inc., (biotechnology) 2003-2010; President and Chief Executive Officer of CMT Inc., 2001-2003; Aquila Biopharmaceuticals Inc., 1996-2000; Cambridge Biotech Corporation, 1995-1996, Mitotix Inc., 1993-1994 | | | 127 | | | Director, Healthways, Inc. (health and well-being solutions) since 2005; Director, ICI Mutual Insurance Company, RRG since 2011; Director, Abt Associates (government contractor) since 2001; Director, Boston Children's Hospital since 2002 | |
Annual Report 2015
41
COLUMBIA LARGE CAP INDEX FUND
TRUSTEES AND OFFICERS (continued)
Interested Trustee Not Affiliated with Investment Manager*
Name,
Address,
Year of Birth | | Position Held With
Funds and Length of
Service | | Principal Occupation
During Past Five Years | | Number of
Funds in the
Fund Family
Overseen by
Board Member | | Other Present or Past
Directorships/
Trusteeships
(Within Past 5 Years) | |
Anthony M. Santomero
901 S. Marquette Ave.
Minneapolis, MN 55402
1946 | | Board member since 6/11 for RiverSource Funds and since 1/08 for Nations Funds | | Richard K. Mellon Professor Emeritus of Finance, The Wharton School, University of Pennsylvania, since 2002; Senior Advisor, McKinsey & Company (consulting), 2006-2008; President, Federal Reserve Bank of Philadelphia, 2000-2006, Professor of Finance, The Wharton School, University of Pennsylvania, 1972-2002 | | | 125 | | | Director, Renaissance Reinsurance Ltd. since May 2008; Trustee, Penn Mutual Life Insurance Company since March 2008; Director, Citigroup Inc. since 2009; Director, Citibank, N.A. since 2009; former Trustee, BofA Funds Series Trust (11 funds), 2008-2011 | |
* Dr. Santomero is not an affiliated person of the Investment Manager or Ameriprise Financial. However, he is currently deemed by the Funds to be an "interested person" (as defined in the 1940 Act) of the Funds because he serves as a Director of Citigroup Inc. and Citibank, N.A., companies that may directly or through subsidiaries and affiliates engage from time-to-time in brokerage execution, principal transactions and lending relationships with the Funds or accounts advised/managed by the Investment Manager.
Annual Report 2015
42
COLUMBIA LARGE CAP INDEX FUND
TRUSTEES AND OFFICERS (continued)
Interested Trustee Affiliated with Investment Manager*
Name,
Address,
Year of Birth | | Position Held With
Funds and Length of
Service | | Principal Occupation
During Past Five Years | | Number of
Funds in the
Fund Family
Overseen by
Board Member | | Other Present or Past
Directorships/
Trusteeships
(Within Past 5 Years) | |
William F. Truscott
53600 Ameriprise
Financial Center
Minneapolis, MN 55474
1960 | | Board member since 11/01 for RiverSource Funds and since 6/11 for Nations Funds; Senior Vice President since 2002 for RiverSource Funds and since 5/10 for Nations Funds | | Chairman of the Board and President, Columbia Management Investment Advisers, LLC since May 2010 and February 2012, respectively (previously President and Chief Investment Officer, 2001-April 2010); Chief Executive Officer, Global Asset Management, Ameriprise Financial, Inc. since September 2012 (previously Chief Executive Officer, U.S. Asset Management & President, Annuities, May 2010-September 2012 and President — U.S. Asset Management and Chief Investment Officer, 2005-April 2010); Director and Chief Executive Officer, Columbia Management Investment Distributors, Inc. since May 2010 and February 2012, respectively (previously Chairman of the Board and Chief Executive Officer, 2006-April 2010); Chairman of the Board and Chief Executive Officer, RiverSource Distributors, Inc. since 2006; Director, Threadneedle Asset Management Holdings, SARL since 2014; President and Chief Executive Officer, Ameriprise Certificate Company, 2006-August 2012 | | | 186 | | | Former Director, Ameriprise Certificate Company, 2006-January 2013 | |
* Interested person (as defined under the 1940 Act) by reason of being an officer, director, security holder and/or employee of the Investment Manager or Ameriprise Financial.
The Statement of Additional Information has additional information about the Fund's Board members and is available, without charge, upon request by calling 800.345.6611; contacting your financial intermediary or visiting columbiathreadneedle.com/us.
Annual Report 2015
43
COLUMBIA LARGE CAP INDEX FUND
TRUSTEES AND OFFICERS (continued)
The Board has appointed officers who are responsible for day-to-day business decisions based on policies it has established. The officers serve at the pleasure of the Board. In addition to Mr. Truscott, who is Senior Vice President, the Funds' other officers are:
Fund Officers
Name,
Address and
Year of Birth | | Position and Year
First Appointed to
Position for any Fund
in the Columbia
Funds Complex or a
Predecessor Thereof | | Principal Occupation(s) During Past Five Years | |
Christopher O. Petersen
5228 Ameriprise
Financial Center
Minneapolis, MN 55474
Born 1970 | | President and Principal Executive Officer (2015) | | Vice President and Lead Chief Counsel, Ameriprise Financial, Inc. since January 2015 (previously, Vice President and Chief Counsel January 2010-December 2014; and Vice President and Group Counsel or Counsel 2004-January 2010); officer of Columbia Funds and affiliated funds since 2007. | |
Michael G. Clarke
225 Franklin Street
Boston, MA 02110
Born 1969 | | Treasurer (2011) and Chief Financial Officer (2009) | | Vice President — Mutual Fund Administration, Columbia Management Investment Advisers, LLC, since May 2010; Managing Director of Fund Administration, Columbia Management Advisors, LLC, September 2004-April 2010; senior officer of Columbia Funds and affiliated funds since 2002. | |
Paul B. Goucher
100 Park Avenue
New York, NY 10017
Born 1968 | | Senior Vice President (2011), Chief Legal Officer (2015) and Assistant Secretary (2008) | | Vice President and Lead Chief Counsel, Ameriprise Financial, Inc. since November 2008 and January 2013, respectively (previously Chief Counsel, January 2010-January 2013 and Group Counsel, November 2008-January 2010). | |
Thomas P. McGuire
225 Franklin Street
Boston, MA 02110
Born 1972 | | Vice President and Chief Compliance Officer (2012) | | Vice President — Asset Management Compliance, Ameriprise Financial, Inc., since May 2010; Chief Compliance Officer, Ameriprise Certificate Company since September 2010; Compliance Executive, Bank of America, 2005-April 2010. | |
Colin Moore
225 Franklin Street
Boston, MA 02110
Born 1958 | | Senior Vice President (2010) | | Executive Vice President and Global Chief Investment Officer, Ameriprise Financial, Inc., since July 2013; Director and Global Chief Investment Officer, Columbia Management Investment Advisers, LLC since May 2010; Manager, Managing Director and Chief Investment Officer, Columbia Management Advisors, LLC, 2007-April 2010. | |
Michael E. DeFao
225 Franklin Street
Boston, MA 02110
Born 1968 | | Vice President (2011) and Assistant Secretary (2010) | | Vice President and Chief Counsel, Ameriprise Financial, Inc. since May 2010; Associate General Counsel, Bank of America, 2005-April 2010. | |
Joseph F. DiMaria
225 Franklin Street
Boston, MA 02110
Born 1968 | | Vice President (2011), Assistant Treasurer (2012) and Chief Accounting Officer (2008) | | Vice President — Mutual Fund Treasurer, Columbia Management Investment Advisers, LLC since May 2010; Director of Fund Administration, Columbia Management Advisors, LLC, 2006-April 2010. | |
Amy Johnson
5228 Ameriprise
Financial Center
Minneapolis, MN 55474
Born 1965 | | Vice President (2006) | | Managing Director and Chief Operating Officer, Columbia Management Investment Advisers, LLC since May 2010 (previously Chief Administrative Officer, 2009-April 2010, and Vice President — Asset Management and Trust Company Services, 2006-2009). | |
Lyn Kephart-Strong
5228 Ameriprise
Financial Center
Minneapolis, MN 55474
Born 1960 | | Vice President (2015) | | President, Columbia Management Investment Services Corp. since October 2014; Vice President & Resolution Officer, Ameriprise Trust Company since August 2009; President, RiverSource Service Corporation 2004-2010. | |
Ryan C. Larrenaga
225 Franklin Street
Boston, MA 02110
Born 1970 | | Vice President and Secretary (2015) | | Vice President and Group Counsel, Ameriprise Financial, Inc. since August 2011 (previously, Counsel from May 2010 to August 2011); Assistant General Counsel, Bank of America, 2005-April 2010; officer of Columbia Funds and affiliated funds since 2005. | |
Annual Report 2015
44
COLUMBIA LARGE CAP INDEX FUND
IMPORTANT INFORMATION ABOUT THIS REPORT
Each fund mails one shareholder report to each shareholder address. If you would like more than one report, please call shareholder services at 800.345.6611 and additional reports will be sent to you.
The policy of the Board is to vote the proxies of the companies in which each fund holds investments consistent with the procedures as stated in the Statement of Additional Information (SAI). You may obtain a copy of the SAI without charge by calling 800.345.6611; contacting your financial intermediary; visiting columbiathreadneedle.com/us; or searching the website of the Securities and Exchange Commission (SEC) at sec.gov. Information regarding how each fund voted proxies relating to portfolio securities is filed with the SEC by August 31st for the most recent 12-month period ending June 30th of that year, and is available without charge by visiting columbiathreadneedle.com/us; or searching the website of the SEC at sec.gov.
Each fund files a complete schedule of portfolio holdings with the SEC for the first and third quarters of each fiscal year on Form N-Q. Each fund's Form N-Q is available on the SEC's website at sec.gov and may be reviewed and copied at the SEC's Public Reference Room in Washington, D.C. Information on the operation of the Public Reference Room may be obtained by calling 800.SEC.0330. Each fund's complete schedule of portfolio holdings, as filed on Form N-Q, can also be obtained without charge, upon request, by calling 800.345.6611.
Annual Report 2015
45
Columbia Large Cap Index Fund
P.O. Box 8081
Boston, MA 02266-8081

This information is for use with concurrent or prior delivery of a fund prospectus. Please read and consider the investment objectives, risks, charges and expenses for any fund carefully before investing. For a prospectus and summary prospectus, which contains this and other important information about the Fund, go to columbiathreadneedle.com/us. The Fund is distributed by Columbia Management Investment Distributors, Inc., member FINRA, and managed by Columbia Management Investment Advisers, LLC.
Columbia Threadneedle Investments (Columbia Threadneedle) is the global brand name of the Columbia and Threadneedle group of companies.
All rights reserved. Columbia Management Investment Distributors, Inc., 225 Franklin Street, Boston, MA 02110-2804
© 2015 Columbia Management Investment Advisers, LLC.
columbiathreadneedle.com/us
ANN175_02_E01_(04/15)

ANNUAL REPORT
February 28, 2015

COLUMBIA MARSICO 21ST CENTURY FUND

ABOUT COLUMBIA THREADNEEDLE INVESTMENTS
Columbia Threadneedle Investments is a leading global asset management group that provides a broad range of actively managed investment strategies and solutions for individual, institutional and corporate clients around the world.
With more than 2,000 people, including over 450 investment professionals based in North America, Europe and Asia, we manage $506 billion* of assets across developed and emerging market equities, fixed income, asset allocation solutions and alternatives. We are the 11th largest manager of long-term mutual fund assets in the U.S.** and the 5th largest manager of retail funds in the U.K.***
Our priority is the investment success of our clients. We aim to deliver the investment outcomes they expect through an investment approach that is team-based, performance-driven and risk-aware. Our culture is dynamic and interactive. By sharing our insights across asset classes and geographies, we generate richer perspectives on global, regional and local investment landscapes. The ability to exchange and debate investment ideas in a collaborative environment enriches our teams' investment processes. More importantly, it results in better informed investment decisions for our clients.
Columbia funds are distributed by Columbia Management Investment Distributors, Inc., member FINRA, and managed by Columbia Management Investment Advisers, LLC.
Columbia Threadneedle Investments (Columbia Threadneedle) is the global brand name of the Columbia and Threadneedle group of companies.
* In U.S. dollars as of December 31, 2014. Source: Ameriprise Q4 Earnings Release. Includes all assets managed by entities in the Columbia and Threadneedle groups of companies. Contact us for more current data.
** Source: ICI as of December 31, 2014 for Columbia Management Investment Advisers, LLC.
*** Source: Investment Association as of December 2014 for Threadneedle Asset Management Limited.
© 2015 Columbia Management Investment Advisers, LLC. All rights reserved.
Not part of the shareholder report
Get the market insight you need from our investment experts
Connect with Columbia Threadneedle Investments
Investor insight
Find economic and market commentary, investment videos, white papers, mutual fund commentary and more at columbiathreadneedle.com/us.
Columbia Threadneedle Investor Newsletter (e-newsletter)
Read our award-winning* shareholder newsletter. Our quarterly newsletter is available online and provides timely and relevant content about economic trends, fund news, service enhancements and changes. Sign up to receive the newsletter electronically at columbiathreadneedle.com/
us/newsletter.
Investment videos
Get analysis of current events and trends that may affect your investments. Visit our online video library to watch and discover what our thought leaders are saying about the financial markets and economy.
Social media
We offer you multiple ways to access our market commentary and investment insights.
n Perspectives blog at columbiathreadneedle.com/us
Read timely posts by our investment team, including our chief investment officer, chief economist and portfolio managers.
n twitter.com/CTinvest_US
Follow us on Twitter for quick, up-to-the-minute comments on market news and more.
n youtube.com/CTinvestUS
View our commentaries on the economy, markets and current investment opportunities.
n linkedin.com/company/columbia-threadneedle-investments-us
Connect with us on LinkedIn for updates from our thought leaders.
*Columbia Threadneedle Investor Newsletter was awarded top honors in the Mutual Fund Education Alliance STAR Awards competition for excellence in mutual fund marketing and communications in 2011, 2012 and 2013. Materials in the competition were evaluated on educational value, message comprehension, effective design and objectives.
Not part of the shareholder report
Stay informed
Become a subscriber to receive the latest investment publications and mutual fund commentaries
Subscribe to Columbia Threadneedle Investments
Email subscription center
Subscribe to the latest information from Columbia Threadneedle. Visit our email subscription center at columbiathreadneedle.com/us/subscribe to register for economic and market commentary, product and service updates, white papers and more.
n Columbia Threadneedle Investor Newsletter
Quarterly newsletter featuring the latest macro- and micro-economic trends, investment themes, products, service changes and other items of interest to our investors
n Investment Strategy Outlook
Quarterly publication featuring the Columbia Threadneedle Asset Allocation Team's perspective on global economic investment conditions and markets
n MarketTrack
Quarterly publication featuring more than 40 charts and graphs that highlight the current state of the economy and the markets; includes straightforward insight on current investment opportunities
n White papers
Frequent articles that delve deep into a variety of investment topics
n Mutual fund updates
Quarterly portfolio manager commentary and fund fact sheets available for Columbia funds. (Not all funds have a commentary.)
Register your information online at columbiathreadneedle.com/us/subscribe and select the publications you would like to receive. Update your subscriptions at any time by accessing the email subscription center.
CT-MK (03/15) 5383/1125800
 Dear Shareholder,
In a world that is changing faster than ever before, investors want asset managers who offer a global perspective while generating strong and sustainable returns. To that end, Columbia Management, in conjunction with its U.K.-based affiliate, Threadneedle Investments, has rebranded to Columbia Threadneedle Investments. The new global brand represents the combined capabilities, resources and reach of the global group, offering investors access to the best of both firms.
With a presence in 18 countries and more than 450 investment professionals*, our collective perspective and world view as Columbia Threadneedle Investments gives us deeper insight into what might affect the real-life financial outcomes clients are seeking. Putting our views into a global context enables us to build richer perspectives and create the right solutions, and provides us with enhanced capabilities to deliver consistent investment performance, which may ultimately lead to better investor outcomes.
As a result of the rebrand, you will begin to see our new logo and colors reflected in printed materials, such as this shareholder report, as well as on our new website — columbiathreadneedle.com/us. We encourage you to visit us online and view a new video on the "About Us" tab that speaks to the strength of the firm.
While we are introducing a new brand, in many ways, the investment company you know well has not changed. The following remain in effect:
n Fund and strategy names
n Established investment teams, philosophies and processes
n Account services, features, servicing phone numbers and mailing addresses
n Columbia Management Investment Distributors as distributor and Columbia Management Investment Advisers as investment adviser
We recognize that the money we manage represents the hard work and savings of people like you, and that everyone has different ambitions and different definitions of success. Investors have varying goals — funding their children's education, enjoying their retirement, putting money aside for unexpected events, and more. Whatever your ambitions, we believe our wide range of investment products and solutions can help give you confidence that you will reach your goals.
The world is constantly changing, but our priority remains the same: to help you secure your finances, meet your goals and achieve success. Thank you for your continued investment with us. Our service representatives are available at 800.345.6611 to help with any questions.
Sincerely,

Christopher O. Petersen
President, Columbia Funds
Investors should consider the investment objectives, risks, charges and expenses of a mutual fund carefully before investing. For a free prospectus and summary prospectus, which contains this and other important information about a fund, visit columbiathreadneedle.com/us. The prospectus should be read carefully before investing.
* Source: Ameriprise as of December 1, 2014
Columbia Funds are distributed by Columbia Management Investment Distributors, Inc., member FINRA, and managed by Columbia Management Investment Advisers, LLC.
© 2015 Columbia Management Investment Advisers, LLC. All rights reserved.
COLUMBIA MARSICO 21ST CENTURY FUND
Fund Investment Manager
Columbia Management Investment
Advisers, LLC
225 Franklin Street
Boston, MA 02110
Fund Distributor
Columbia Management Investment
Distributors, Inc.
225 Franklin Street
Boston, MA 02110
Fund Transfer Agent
Columbia Management Investment
Services Corp.
P.O. Box 8081
Boston, MA 02266-8081
For more information about any of the funds, please visit columbiathreadneedle.com/us or call 800.345.6611. Customer Service Representatives are available to answer your questions Monday through Friday from 8 a.m. to 7 p.m. Eastern time.
The views expressed in this report reflect the current views of the respective parties. These views are not guarantees of future performance and involve certain risks, uncertainties and assumptions that are difficult to predict, so actual outcomes and results may differ significantly from the views expressed. These views are subject to change at any time based upon economic, market or other conditions and the respective parties disclaim any responsibility to update such views. These views may not be relied on as investment advice and, because investment decisions for a Columbia fund are based on numerous factors, may not be relied on as an indication of trading intent on behalf of any particular Columbia fund. References to specific securities should not be construed as a recommendation or investment advice.
Performance Overview | | | 3 | | |
Manager Discussion of Fund Performance | | | 5 | | |
Understanding Your Fund's Expenses | | | 8 | | |
Portfolio of Investments | | | 9 | | |
Statement of Assets and Liabilities | | | 13 | | |
Statement of Operations | | | 15 | | |
Statement of Changes in Net Assets | | | 16 | | |
Financial Highlights | | | 18 | | |
Notes to Financial Statements | | | 25 | | |
Report of Independent Registered
Public Accounting Firm | | | 32 | | |
Trustees and Officers | | | 33 | | |
Important Information About This Report | | | 39 | | |
COLUMBIA MARSICO 21ST CENTURY FUND
Performance Summary
n Columbia Marsico 21st Century Fund (the Fund) Class A shares returned 8.43% excluding sales charges for the 12-month period that ended February 28, 2015.
n The Fund underperformed its benchmark, the Russell 3000 Index, which returned 14.12% during the same time period.
n The Fund's underperformance relative to the benchmark is attributable to stock selection in the consumer discretionary, healthcare and information technology sectors.
Average Annual Total Returns (%) (for period ended February 28, 2015)
| | | Inception | | 1 Year | | 5 Years | | 10 Years | |
Class A | | 04/10/00 | | | | | | | | | | | | | |
Excluding sales charges | | | | | | | 8.43 | | | | 13.07 | | | | 7.54 | | |
Including sales charges | | | | | | | 2.19 | | | | 11.74 | | | | 6.90 | | |
Class B | | 04/10/00 | | | | | | | | | | | | | |
Excluding sales charges | | | | | | | 7.65 | | | | 12.24 | | | | 6.73 | | |
Including sales charges | | | | | | | 2.65 | | | | 11.98 | | | | 6.73 | | |
Class C | | 04/10/00 | | | | | | | | | | | | | |
Excluding sales charges | | | | | | | 7.65 | | | | 12.24 | | | | 6.74 | | |
Including sales charges | | | | | | | 6.65 | | | | 12.24 | | | | 6.74 | | |
Class R* | | 01/23/06 | | | 8.20 | | | | 12.79 | | | | 7.26 | | |
Class R4* | | 11/08/12 | | | 8.74 | | | | 13.21 | | | | 7.60 | | |
Class R5* | | 01/08/14 | | | 8.89 | | | | 13.17 | | | | 7.59 | | |
Class Z | | 04/10/00 | | | 8.69 | | | | 13.35 | | | | 7.80 | | |
Russell 3000 Index | | | | | | | 14.12 | | | | 16.36 | | | | 8.30 | | |
Returns for Class A are shown with and without the maximum initial sales charge of 5.75%. Returns for Class B are shown with and without the applicable contingent deferred sales charge (CDSC) of 5.00% in the first year, declining to 1.00% in the sixth year and eliminated thereafter. Returns for Class C are shown with and without the 1.00% CDSC for the first year only. The Fund's other classes are not subject to sales charges and have limited eligibility. Please see the Fund's prospectus for details. Performance for different share classes will vary based on differences in sales charges and fees associated with each class. All results shown assume reinvestment of distributions during the period. Returns do not reflect the deduction of taxes that a shareholder may pay on Fund distributions or on the redemption of Fund shares. Performance results reflect the effect of any fee waivers or reimbursements of Fund expenses by Columbia Management Investment Advisers, LLC and/or any of its affiliates. Absent these fee waivers or expense reimbursement arrangements, performance results would have been lower.
The performance information shown represents past performance and is not a guarantee of future results. The investment return and principal value of your investment will fluctuate so that your shares, when redeemed, may be worth more or less than their original cost. Current performance may be lower or higher than the performance information shown. You may obtain performance information current to the most recent month-end by contacting your financial intermediary, visiting columbiathreadneedle.com/us or calling 800.345.6611.
*The returns shown for periods prior to the share class inception date (including returns for the Life of the Fund, if shown, which are since Fund inception) include the returns of the Fund's oldest share class. Since the Fund launched more than one class of shares at its inception, Class A shares were used. These returns are adjusted to reflect any higher class-related operating expenses of the newer share classes, as applicable. Please visit columbiathreadneedle.com/us/investment-products/mutual-funds/appended-performance for more information.
The Russell 3000 Index, an unmanaged index, measures the performance of the 3,000 largest U.S. companies based on total market capitalization, which represents approximately 98% of the investable U.S. equity market.
Indices are not available for investment, are not professionally managed and do not reflect sales charges, fees, brokerage commissions, taxes or other expenses of investing. Securities in the Fund may not match those in an index.
Annual Report 2015
3
COLUMBIA MARSICO 21ST CENTURY FUND
PERFORMANCE OVERVIEW (continued)
Performance of a Hypothetical $10,000 Investment (March 1, 2005 – February 28, 2015)
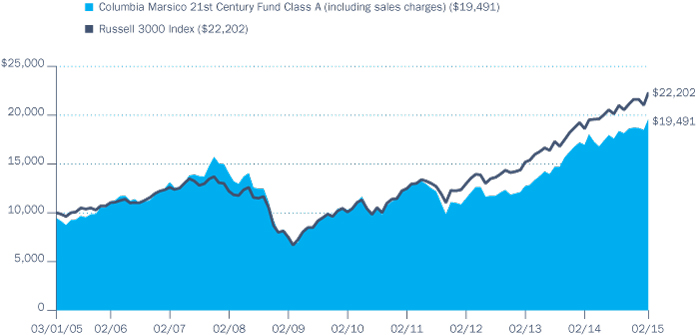
The chart above shows the change in value of a hypothetical $10,000 investment in Class A shares of Columbia Marsico 21st Century Fund during the stated time period, and does not reflect the deduction of taxes that a shareholder may pay on Fund distributions or on the redemption of Fund shares.
Annual Report 2015
4
COLUMBIA MARSICO 21ST CENTURY FUND
MANAGER DISCUSSION OF FUND PERFORMANCE
For the 12-month period that ended February 28, 2015, the Fund's Class A shares returned 8.43% excluding sales charges. The Fund underperformed its benchmark, the Russell 3000 Index, which returned 14.12% for the same time period. Stock selection in the consumer discretionary, healthcare and information technology sectors detracted from performance vs. the benchmark. Stock selection in the materials, consumer staples and telecommunication services sectors aided results.
U.S. Equities Rose Despite Investor Concerns
U.S. stocks generally registered solid gains during the period ending February 28, 2015. These gains occurred even as investors grappled with concerns about U.S. Federal Reserve (Fed) policy, slower growth in emerging and many developed markets and the implications of lower oil prices. Crude oil prices fell sharply during the period and ended 2014 at their lowest levels since 2009. The decline stemmed in part from slowing growth in demand, stagnating economic growth in Europe and technological advances, such as more efficient motor vehicles. Increased supply was also a primary reason for falling oil prices, as fracking technologies drove petroleum supplies sharply higher in the U.S., while other countries maintained or increased production. By February 2015, dramatic declines in oil prices gave way to relative stability as prices oscillated between $48 and $54 a barrel.
The continued advance of the U.S. dollar through the period reflected impressive gains in U.S. labor markets as well as commitments by foreign central banks to extend easier monetary policy in Europe, China and Japan. Though certainly not blistering, U.S. economic strength at the end of the period could be seen in upward revisions to previous increases, which took the three-month average increase in jobs to a powerful 330,000. Strong job gains, low inflation and falling oil prices translated to hefty increases in consumer spending near the end of the period, including a 4.2% gain in the fourth quarter of 2014. This strong growth was accompanied by a remarkably benign core inflation backdrop. In the U.S. and around the globe, inflation was in sharp retreat by the end of the period, reflecting both the direct effects of falling energy costs and the echo effects of lower prices for other goods and services. The prospects for firming Fed policy continue to be debated and remain unresolved.
Large-cap stocks significantly outperformed small-cap stocks in the United States during the period. Small-cap stocks were under pressure on concerns that valuations were stretched and that smaller companies, due to borrowing needs, may be more vulnerable to rising interest rates as the Fed begins to tighten monetary policy.
Contributors and Detractors
The Fund benefited from stock selection in the materials sector as paint retailer Sherwin-Williams was among the top performers during the period. Stock selection in consumer staples also contributed to performance. The beverage company Constellation Brands, for example, performed well on the back of its 2013 acquisition of Grupo Modelo. Additionally, the company is expanding its brewery in Mexico and diversifying its wine line-up to include Mondavi, Clos du Bois and Kim Crawford. The specialty coffee company
Portfolio Management
Marsico Capital Management, LLC
Brandon Geisler
Morningstar Style BoxTM

The Morningstar Style BoxTM is based on a fund's portfolio holdings. For equity funds, the vertical axis shows the market capitalization of the stocks owned, and the horizontal axis shows investment style (value, blend, or growth). Information shown is based on the most recent data provided by Morningstar.
© 2015 Morningstar, Inc. All rights reserved. The Morningstar information contained herein: (1) is proprietary to Morningstar and/or its content providers; (2) may not be copied or distributed; and (3) is not warranted to be accurate, complete or timely. Neither Morningstar nor its content providers are responsible for any damages or losses arising from any use of this information.
Top Ten Holdings (%)
(at February 28, 2015) | |
Facebook, Inc., Class A | | | 4.9 | | |
Biogen Idec, Inc. | | | 4.1 | | |
Actavis PLC | | | 4.0 | | |
Walt Disney Co. (The) | | | 3.7 | | |
Constellation Brands, Inc.,
Class A | | | 3.6 | | |
Apple, Inc. | | | 3.1 | | |
MasterCard, Inc., Class A | | | 2.9 | | |
salesforce.com, Inc. | | | 2.9 | | |
LinkedIn Corp., Class A | | | 2.8 | | |
Comcast Corp., Class A | | | 2.6 | | |
Percentages indicated are based upon total investments (excluding Money Market Funds).
For further detail about these holdings, please refer to the section entitled "Portfolio of Investments."
Fund holdings are as of the date given, are subject to change at any time, and are not recommendations to buy or sell any security.
Annual Report 2015
5
COLUMBIA MARSICO 21ST CENTURY FUND
MANAGER DISCUSSION OF FUND PERFORMANCE (continued)
Portfolio Breakdown (%)
(at February 28, 2015) | |
Common Stocks | | | 99.8 | | |
Consumer Discretionary | | | 19.7 | | |
Consumer Staples | | | 4.5 | | |
Energy | | | 1.4 | | |
Financials | | | 4.5 | | |
Health Care | | | 20.2 | | |
Industrials | | | 11.9 | | |
Information Technology | | | 31.6 | | |
Materials | | | 4.2 | | |
Telecommunication Services | | | 1.8 | | |
Money Market Funds | | | 0.2 | | |
Total | | | 100.0 | | |
Percentages indicated are based upon total investments. The Fund's portfolio composition is subject to change.
Investment Risks
Market risk may affect a single issuer, sector of the economy, industry or the market as a whole. Investments in a limited number of companies subjects the Fund to greater risk of loss. Growth securities, at times, may not perform as well as value securities or the stock market in general and may be out of favor with investors. Foreign investments subject the Fund to risks, including political, economic, market, social and others within a particular country, as well as to currency instabilities and less stringent financial and accounting standards generally applicable to U.S. issuers. Risks are enhanced for emerging market issuers. The Fund may invest significantly in issuers within a particular sector, which may be negatively affected by market, economic or other conditions, making the Fund more vulnerable to unfavorable developments in the sector. See the Funds' prospectus for more information on these and other risks.
Keurig Green Mountain also performed well thanks to strong execution and promising new partnership agreements. The company's portfolio of licensed and owned brands continued to gain share at the at-home coffee market, relieving investor concerns about private label entry.
Stock selection in the consumer discretionary sector was the primary source of underperformance during the period. Wynn Resorts was the largest individual detractor. A slowing economy in China and the Chinese government's efforts to crack down on corruption resulted in disappointing results from Wynn's VIP business in the Macau market. Apple also detracted from returns. Although the company performed well during the 12-month period, the Fund purchased the stock in the second half of the period, causing a drag on performance. Antero Resources also underperformed in part because of a decline in commodity prices for crude oil and natural gas. A lower outlook for commodity prices has impacted the company's growth outlook.
Portfolio Activity
We re-initiated a position in Apple following a re-fresh in its product cycle with the iPhone 6, ongoing software development, significant new additions to senior management and a continued push for more enterprise business. We do not believe Apple's shares reflect upcoming hardware, software and services innovation. We expect the iPhone to gain market share as larger screen sizes help power an acceleration in growth. We established a position in Activis, a leading company in specialty pharmaceuticals. With its recent acquisition of Allergen, as well as an aging population and demographic tailwinds, we believe Activis is positioned to benefit from increasing healthcare consumption.
We also added Comcast to the portfolio. Comcast is the largest domestic provider of cable services (video, high-speed data and telephone) with over 22 million basic subscribers. Given the proliferation of mobile devices and new ways to consume content, we feel that demand for faster speeds and broadband services will only increase, with direct benefits to Comcast.
Hilton Worldwide Holdings was sold during the period and was replaced in the portfolio by Electronic Arts. Twenty-First Century Fox was replaced in the portfolio by Time Warner during the period. We believe the targets set out by Twenty-First Century Fox management were too aggressive, which implied a valuation that was too rich, setting the company up to potentially disappoint investors. LKQ Corp. was also sold during the period. The auto parts company continued to deliver top-line growth, but we sold the stock after not seeing that growth flow through to the bottom line. In addition, falling scrap prices continue to weigh on the stock.
Looking Ahead
Two top-of-mind items for many investors at the end of 2014 were declining oil prices (and their commensurate effects) and central bank policies. On balance, lower oil prices improve U.S. prospects for growth and low inflation. Oil prices may slide further, but we believe will eventually settle and perhaps climb again in the future, as low prices should ease fracking activity and tighten supply. We will continue to monitor the
Annual Report 2015
6
COLUMBIA MARSICO 21ST CENTURY FUND
MANAGER DISCUSSION OF FUND PERFORMANCE (continued)
economic effects and geopolitical consequences of potentially extended and deeper reductions in oil prices. Also, while central banks of other countries focus on efforts to stimulate their economies, the Fed may confront a much better than recently expected pace of economic expansion.
As always, we continue to favor investments in companies that we believe are gaining market share in large and growing markets. The Fund emphasizes investments in businesses with strong recurring revenues, strong free cash flow generation, pricing power and responsible capital allocation. In this lower growth environment, share buybacks and dividends may be material contributors to total returns.
Annual Report 2015
7
COLUMBIA MARSICO 21ST CENTURY FUND
UNDERSTANDING YOUR FUND'S EXPENSES
(Unaudited)
As an investor, you incur two types of costs. There are transaction costs, which generally include sales charges on purchases and may include redemption fees. There are also ongoing costs, which generally include management fees, distribution and/or service fees, and other fund expenses. The following information is intended to help you understand your ongoing costs (in dollars) of investing in the Fund and to help you compare these costs with the ongoing costs of investing in other mutual funds.
Analyzing Your Fund's Expenses
To illustrate these ongoing costs, we have provided examples and calculated the expenses paid by investors in each share class of the Fund during the period. The actual and hypothetical information in the table is based on an initial investment of $1,000 at the beginning of the period indicated and held for the entire period. Expense information is calculated two ways and each method provides you with different information. The amount listed in the "Actual" column is calculated using the Fund's actual operating expenses and total return for the period. You may use the Actual information, together with the amount invested, to estimate the expenses that you paid over the period. Simply divide your account value by $1,000 (for example, an $8,600 account value divided by $1,000 = 8.6), then multiply the results by the expenses paid during the period under the "Actual" column. The amount listed in the "Hypothetical" column assumes a 5% annual rate of return before expenses (which is not the Fund's actual return) and then applies the Fund's actual expense ratio for the period to the hypothetical return. You should not use the hypothetical account values and expenses to estimate either your actual account balance at the end of the period or the expenses you paid during the period. See "Compare With Other Funds" below for details on how to use the hypothetical data.
Compare With Other Funds
Since all mutual funds are required to include the same hypothetical calculations about expenses in shareholder reports, you can use this information to compare the ongoing cost of investing in the Fund with other funds. To do so, compare the hypothetical example with the 5% hypothetical examples that appear in the shareholder reports of other funds. As you compare hypothetical examples of other funds, it is important to note that hypothetical examples are meant to highlight the ongoing costs of investing in a fund only and do not reflect any transaction costs, such as sales charges, or redemption or exchange fees. Therefore, the hypothetical calculations are useful in comparing ongoing costs only, and will not help you determine the relative total costs of owning different funds. If transaction costs were included in these calculations, your costs would be higher.
September 1, 2014 – February 28, 2015
| | | Account Value at the Beginning
of the Period ($) | | Account Value at the End of the
Period ($) | | Expenses Paid During the
Period ($) | | Fund's Annualized
Expense Ratio (%) | |
| | | Actual | | Hypothetical | | Actual | | Hypothetical | | Actual | | Hypothetical | | Actual | |
Class A | | | 1,000.00 | | | | 1,000.00 | | | | 1,062.80 | | | | 1,018.85 | | | | 6.27 | | | | 6.14 | | | | 1.22 | | |
Class B | | | 1,000.00 | | | | 1,000.00 | | | | 1,058.90 | | | | 1,015.11 | | | | 10.11 | | | | 9.90 | | | | 1.97 | | |
Class C | | | 1,000.00 | | | | 1,000.00 | | | | 1,058.90 | | | | 1,015.11 | | | | 10.11 | | | | 9.90 | | | | 1.97 | | |
Class R | | | 1,000.00 | | | | 1,000.00 | | | | 1,061.30 | | | | 1,017.60 | | | | 7.55 | | | | 7.39 | | | | 1.47 | | |
Class R4 | | | 1,000.00 | | | | 1,000.00 | | | | 1,064.30 | | | | 1,020.09 | | | | 4.99 | | | | 4.89 | | | | 0.97 | | |
Class R5 | | | 1,000.00 | | | | 1,000.00 | | | | 1,064.80 | | | | 1,020.69 | | | | 4.38 | | | | 4.28 | | | | 0.85 | | |
Class Z | | | 1,000.00 | | | | 1,000.00 | | | | 1,063.90 | | | | 1,020.09 | | | | 4.99 | | | | 4.89 | | | | 0.97 | | |
Expenses paid during the period are equal to the annualized expense ratio for each class as indicated above, multiplied by the average account value over the period and then multiplied by the number of days in the Fund's most recent fiscal half year and divided by 365.
Expenses do not include fees and expenses incurred indirectly by the Fund from its investment in underlying funds, including affiliated and non-affiliated pooled investment vehicles, such as mutual funds and exchange-traded funds.
Annual Report 2015
8
COLUMBIA MARSICO 21ST CENTURY FUND
PORTFOLIO OF INVESTMENTS
February 28, 2015
(Percentages represent value of investments compared to net assets)
Common Stocks 99.0%
Issuer | | Shares | | Value ($) | |
CONSUMER DISCRETIONARY 19.5% | |
Automobiles 1.2% | |
Tesla Motors, Inc.(a) | | | 60,409 | | | | 12,283,566 | | |
Hotels, Restaurants & Leisure 6.8% | |
Domino's Pizza, Inc. | | | 156,048 | | | | 15,843,554 | | |
Norwegian Cruise Line Holdings Ltd.(a) | | | 524,127 | | | | 25,849,944 | | |
Popeyes Louisiana Kitchen, Inc.(a) | | | 126,342 | | | | 7,581,783 | | |
Wynn Resorts Ltd. | | | 145,150 | | | | 20,683,875 | | |
Total | | | | | 69,959,156 | | |
Media 8.7% | |
Comcast Corp., Class A | | | 443,118 | | | | 26,312,347 | | |
Time Warner, Inc. | | | 308,134 | | | | 25,223,849 | | |
Walt Disney Co. (The) | | | 362,250 | | | | 37,702,980 | | |
Total | | | | | 89,239,176 | | |
Multiline Retail 1.1% | |
Burlington Stores, Inc.(a) | | | 200,434 | | | | 11,138,117 | | |
Specialty Retail 1.7% | |
O'Reilly Automotive, Inc.(a) | | | 37,110 | | | | 7,723,704 | | |
Signet Jewelers Ltd. | | | 86,627 | | | | 10,384,845 | | |
Total | | | | | 18,108,549 | | |
Total Consumer Discretionary | | | | | 200,728,564 | | |
CONSUMER STAPLES 4.5% | |
Beverages 4.0% | |
Constellation Brands, Inc., Class A(a) | | | 316,096 | | | | 36,262,533 | | |
Remy Cointreau SA | | | 69,244 | | | | 5,085,505 | | |
Total | | | | | 41,348,038 | | |
Food Products 0.5% | |
Keurig Green Mountain, Inc. | | | 35,087 | | | | 4,476,400 | | |
Total Consumer Staples | | | | | 45,824,438 | | |
ENERGY 1.4% | |
Oil, Gas & Consumable Fuels 1.4% | |
Antero Resources Corp.(a) | | | 359,006 | | | | 14,162,787 | | |
Total Energy | | | | | 14,162,787 | | |
FINANCIALS 4.4% | |
Banks 1.2% | |
First Republic Bank | | | 214,680 | | | | 12,236,760 | | |
Common Stocks (continued)
Issuer | | Shares | | Value ($) | |
Capital Markets 3.2% | |
Charles Schwab Corp. (The) | | | 562,134 | | | | 16,493,012 | | |
Morgan Stanley | | | 470,360 | | | | 16,834,184 | | |
Total | | | | | 33,327,196 | | |
Total Financials | | | | | 45,563,956 | | |
HEALTH CARE 20.1% | |
Biotechnology 8.5% | |
Alkermes PLC(a) | | | 305,951 | | | | 21,493,058 | | |
Biogen Idec, Inc.(a) | | | 101,657 | | | | 41,637,691 | | |
Gilead Sciences, Inc.(a) | | | 171,026 | | | | 17,706,322 | | |
Juno Therapeutics, Inc.(a) | | | 64,431 | | | | 3,023,102 | | |
Receptos, Inc.(a) | | | 26,947 | | | | 3,412,568 | | |
Total | | | | | 87,272,741 | | |
Health Care Equipment & Supplies 0.8% | |
DexCom, Inc.(a) | | | 139,499 | | | | 8,473,169 | | |
Health Care Providers & Services 2.2% | |
Envision Healthcare Holdings, Inc.(a) | | | 604,114 | | | | 22,122,655 | | |
Health Care Technology 0.4% | |
Inovalon Holdings, Inc., Class A(a) | | | 125,937 | | | | 3,911,603 | | |
Life Sciences Tools & Services 0.9% | |
Illumina, Inc.(a) | | | 49,386 | | | | 9,652,988 | | |
Pharmaceuticals 7.3% | |
Actavis PLC(a) | | | 140,807 | | | | 41,025,527 | | |
Endo International PLC(a) | | | 212,473 | | | | 18,187,689 | | |
Merck & Co., Inc. | | | 267,487 | | | | 15,658,689 | | |
Total | | | | | 74,871,905 | | |
Total Health Care | | | | | 206,305,061 | | |
INDUSTRIALS 11.8% | |
Aerospace & Defense 6.5% | |
B/E Aerospace, Inc.(a) | | | 285,850 | | | | 18,162,909 | | |
Boeing Co. (The) | | | 171,465 | | | | 25,865,495 | | |
Lockheed Martin Corp. | | | 111,560 | | | | 22,317,578 | | |
Total | | | | | 66,345,982 | | |
Airlines 1.7% | |
Delta Air Lines, Inc. | | | 400,688 | | | | 17,838,630 | | |
The accompanying Notes to Financial Statements are an integral part of this statement.
Annual Report 2015
9
COLUMBIA MARSICO 21ST CENTURY FUND
PORTFOLIO OF INVESTMENTS (continued)
February 28, 2015
Common Stocks (continued)
Issuer | | Shares | | Value ($) | |
Road & Rail 3.6% | |
Genesee & Wyoming, Inc., Class A(a) | | | 163,685 | | | | 16,875,923 | | |
Union Pacific Corp. | | | 170,972 | | | | 20,561,093 | | |
Total | | | | | 37,437,016 | | |
Total Industrials | | | | | 121,621,628 | | |
INFORMATION TECHNOLOGY 31.3% | |
Communications Equipment 0.6% | |
Palo Alto Networks, Inc.(a) | | | 42,235 | | | | 6,006,662 | | |
Internet Software & Services 11.1% | |
Alibaba Group Holding Ltd., ADR(a) | | | 273,738 | | | | 23,300,578 | | |
CoStar Group, Inc.(a) | | | 63,143 | | | | 12,575,560 | | |
Facebook, Inc., Class A(a) | | | 627,500 | | | | 49,553,675 | | |
LinkedIn Corp., Class A(a) | | | 107,236 | | | | 28,653,459 | | |
Total | | | | | 114,083,272 | | |
IT Services 5.4% | |
FleetCor Technologies, Inc.(a) | | | 170,975 | | | | 26,232,694 | | |
MasterCard, Inc., Class A | | | 326,929 | | | | 29,466,111 | | |
Total | | | | | 55,698,805 | | |
Semiconductors & Semiconductor Equipment 5.8% | |
ARM Holdings PLC | | | 1,192,366 | | | | 21,335,280 | | |
| ASML Holding NV | | | 184,050 | | | | 19,818,504 | | |
NXP Semiconductors NV(a) | | | 213,320 | | | | 18,109,801 | | |
Total | | | | | 59,263,585 | | |
Software 5.4% | |
Electronic Arts, Inc.(a) | | | 453,702 | | | | 25,942,680 | | |
salesforce.com, Inc.(a) | | | 422,594 | | | | 29,319,572 | | |
Total | | | | | 55,262,252 | | |
Common Stocks (continued)
Issuer | | Shares | | Value ($) | |
Technology Hardware, Storage & Peripherals 3.0% | |
Apple, Inc. | | | 243,542 | | | | 31,285,405 | | |
Total Information Technology | | | | | 321,599,981 | | |
MATERIALS 4.2% | |
Chemicals 4.2% | |
Monsanto Co. | | | 166,495 | | | | 20,050,993 | | |
Sherwin-Williams Co. (The) | | | 80,988 | | | | 23,097,777 | | |
Total | | | | | 43,148,770 | | |
Total Materials | | | | | 43,148,770 | | |
TELECOMMUNICATION SERVICES 1.8% | |
Wireless Telecommunication Services 1.8% | |
SBA Communications Corp., Class A(a) | | | 150,372 | | | | 18,752,892 | | |
Total Telecommunication Services | | | | | 18,752,892 | | |
Total Common Stocks
(Cost: $772,910,466) | | | | | 1,017,708,077 | | |
Money Market Funds 0.2%
| | | Shares | | Value ($) | |
Columbia Short-Term Cash Fund,
0.118%(b)(c) | | | 2,149,309 | | | | 2,149,309 | | |
Total Money Market Funds
(Cost: $2,149,309) | | | | | 2,149,309 | | |
Total Investments
(Cost: $775,059,775) | | | | | 1,019,857,386 | | |
Other Assets & Liabilities, Net | | | | | 8,739,986 | | |
Net Assets | | | | | 1,028,597,372 | | |
Notes to Portfolio of Investments
(a) Non-income producing.
(b) The rate shown is the seven-day current annualized yield at February 28, 2015.
(c) As defined in the Investment Company Act of 1940, an affiliated company is one in which the Fund owns 5% or more of the company's outstanding voting securities, or a company which is under common ownership or control with the Fund. Holdings and transactions in these affiliated companies during the year ended February 28, 2015, are as follows:
Issuer | | Beginning
Cost ($) | | Purchase
Cost ($) | | Proceeds
From Sales ($) | | Ending
Cost ($) | | Dividends —
Affiliated
Issuers ($) | | Value ($) | |
Columbia Short-Term Cash Fund | | | 10,487,581 | | | | 467,445,250 | | | | (475,783,522 | ) | | | 2,149,309 | | | | 27,393 | | | | 2,149,309 | | |
The accompanying Notes to Financial Statements are an integral part of this statement.
Annual Report 2015
10
COLUMBIA MARSICO 21ST CENTURY FUND
PORTFOLIO OF INVESTMENTS (continued)
February 28, 2015
Abbreviation Legend
ADR American Depositary Receipt
Fair Value Measurements
Generally accepted accounting principles (GAAP) require disclosure regarding the inputs and valuation techniques used to measure fair value and any changes in valuation inputs or techniques. In addition, investments shall be disclosed by major category.
The Fund categorizes its fair value measurements according to a three-level hierarchy that maximizes the use of observable inputs and minimizes the use of unobservable inputs by prioritizing that the most observable input be used when available. Observable inputs are those that market participants would use in pricing an investment based on market data obtained from sources independent of the reporting entity. Unobservable inputs are those that reflect the Fund's assumptions about the information market participants would use in pricing an investment. An investment's level within the fair value hierarchy is based on the lowest level of any input that is deemed significant to the asset or liability's fair value measurement. The input levels are not necessarily an indication of the risk or liquidity associated with investments at that level. For example, certain U.S. government securities are generally high quality and liquid, however, they are reflected as Level 2 because the inputs used to determine fair value may not always be quoted prices in an active market.
Fair value inputs are summarized in the three broad levels listed below:
> Level 1 — Valuations based on quoted prices for investments in active markets that the Fund has the ability to access at the measurement date (including NAV for open-end mutual funds). Valuation adjustments are not applied to Level 1 investments.
> Level 2 — Valuations based on other significant observable inputs (including quoted prices for similar securities, interest rates, prepayment speeds, credit risks, etc.).
> Level 3 — Valuations based on significant unobservable inputs (including the Fund's own assumptions and judgment in determining the fair value of investments).
Inputs that are used in determining fair value of an investment may include price information, credit data, volatility statistics, and other factors. These inputs can be either observable or unobservable. The availability of observable inputs can vary between investments, and is affected by various factors such as the type of investment, and the volume and level of activity for that investment or similar investments in the marketplace. The inputs will be considered by the Investment Manager, along with any other relevant factors in the calculation of an investment's fair value. The Fund uses prices and inputs that are current as of the measurement date, which may include periods of market dislocations. During these periods, the availability of prices and inputs may be reduced for many investments. This condition could cause an investment to be reclassified between the various levels within the hierarchy.
Foreign equity securities actively traded in markets where there is a significant delay in the local close relative to the New York Stock Exchange (NYSE) are classified as Level 2. The values of these securities may include an adjustment to reflect the impact of significant market movements following the close of local trading, as described in Note 2 to the financial statements — Security Valuation.
Investments falling into the Level 3 category are primarily supported by quoted prices from brokers and dealers participating in the market for those investments. However, these may be classified as Level 3 investments due to lack of market transparency and corroboration to support these quoted prices. Additionally, valuation models may be used as the pricing source for any remaining investments classified as Level 3. These models may rely on one or more significant unobservable inputs and/or significant assumptions by the Investment Manager. Inputs used in valuations may include, but are not limited to, financial statement analysis, capital account balances, discount rates and estimated cash flows, and comparable company data.
Under the direction of the Fund's Board of Trustees (the Board), the Investment Manager's Valuation Committee (the Committee) is responsible for overseeing the valuation procedures approved by the Board. The Committee consists of voting and non-voting members from various groups within the Investment Manager's organization, including operations and accounting, trading and investments, compliance, risk management and legal.
The Committee meets at least monthly to review and approve valuation matters, which may include a description of specific valuation determinations, data regarding pricing information received from approved pricing vendors and brokers and the results of Board-approved valuation control policies and procedures (the Policies). The Policies address, among other things, instances when market quotations are or are not readily available, including recommendations of third party pricing vendors and a determination of appropriate pricing methodologies; events that require specific valuation determinations and assessment of fair value techniques; securities with a potential for stale pricing, including those that are illiquid, restricted, or in default; and the effectiveness of third party pricing vendors, including periodic reviews of vendors. The Committee meets more frequently, as needed, to discuss additional valuation matters, which may include the need to review back-testing results, review time-sensitive information or approve related valuation actions. The Committee reports to the Board, with members of the Committee meeting with the Board at each of its regularly scheduled meetings to discuss valuation matters and actions during the period, similar to those described earlier.
The accompanying Notes to Financial Statements are an integral part of this statement.
Annual Report 2015
11
COLUMBIA MARSICO 21ST CENTURY FUND
PORTFOLIO OF INVESTMENTS (continued)
February 28, 2015
Fair Value Measurements (continued)
For investments categorized as Level 3, the Committee monitors information similar to that described above, which may include: (i) data specific to the issuer or comparable issuers, (ii) general market or specific sector news and (iii) quoted prices and specific or similar security transactions. The Committee considers this data and any changes from prior periods in order to assess the reasonableness of observable and unobservable inputs, any assumptions or internal models used to value those securities and changes in fair value. This data is also used to corroborate, when available, information received from approved pricing vendors and brokers. Various factors impact the frequency of monitoring this information (which may occur as often as daily). However, the Committee may determine that changes to inputs, assumptions and models are not required as a result of the monitoring procedures performed.
The following table is a summary of the inputs used to value the Fund's investments at February 28, 2015:
Description | | Level 1
Quoted Prices in Active
Markets for Identical
Assets ($) | |
Level 2
Other Significant
Observable Inputs ($) | |
Level 3
Significant
Unobservable Inputs ($) | |
Total ($) | |
Equity Securities | |
Common Stocks | |
Consumer Discretionary | | | 200,728,564 | | | | — | | | | — | | | | 200,728,564 | | |
Consumer Staples | | | 40,738,933 | | | | 5,085,505 | | | | — | | | | 45,824,438 | | |
Energy | | | 14,162,787 | | | | — | | | | — | | | | 14,162,787 | | |
Financials | | | 45,563,956 | | | | — | | | | — | | | | 45,563,956 | | |
Health Care | | | 206,305,061 | | | | — | | | | — | | | | 206,305,061 | | |
Industrials | | | 121,621,628 | | | | — | | | | — | | | | 121,621,628 | | |
Information Technology | | | 300,264,701 | | | | 21,335,280 | | | | — | | | | 321,599,981 | | |
Materials | | | 43,148,770 | | | | — | | | | — | | | | 43,148,770 | | |
Telecommunication Services | | | 18,752,892 | | | | — | | | | — | | | | 18,752,892 | | |
Total Equity Securities | | | 991,287,292 | | | | 26,420,785 | | | | — | | | | 1,017,708,077 | | |
Mutual Funds | |
Money Market Funds | | | 2,149,309 | | | | — | | | | — | | | | 2,149,309 | | |
Total Mutual Funds | | | 2,149,309 | | | | — | | | | — | | | | 2,149,309 | | |
Total | | | 993,436,601 | | | | 26,420,785 | | | | — | | | | 1,019,857,386 | | |
See the Portfolio of Investments for all investment classifications not indicated in the table.
The Fund's assets assigned to the Level 2 input category are generally valued using the market approach, in which a security's value is determined through reference to prices and information from market transactions for similar or identical assets. These assets include certain foreign securities for which a third party statistical pricing service may be employed for purposes of fair market valuation. The model utilized by such third party statistical pricing service takes into account a security's correlation to available market data including, but not limited to, intraday index, ADR, and ETF movements.
There were no transfers of financial assets between levels during the period.
The accompanying Notes to Financial Statements are an integral part of this statement.
Annual Report 2015
12
COLUMBIA MARSICO 21ST CENTURY FUND
STATEMENT OF ASSETS AND LIABILITIES
February 28, 2015
Assets | |
Investments, at value | |
Unaffiliated issuers (identified cost $772,910,466) | | $ | 1,017,708,077 | | |
Affiliated issuers (identified cost $2,149,309) | | | 2,149,309 | | |
Total investments (identified cost $775,059,775) | | | 1,019,857,386 | | |
Receivable for: | |
Investments sold | | | 17,158,902 | | |
Capital shares sold | | | 261,919 | | |
Dividends | | | 624,468 | | |
Reclaims | | | 22,433 | | |
Prepaid expenses | | | 2,708 | | |
Total assets | | | 1,037,927,816 | | |
Liabilities | |
Payable for: | |
Investments purchased | | | 6,937,996 | | |
Capital shares purchased | | | 1,784,329 | | |
Investment management fees | | | 19,452 | | |
Distribution and/or service fees | | | 11,388 | | |
Transfer agent fees | | | 375,145 | | |
Administration fees | | | 1,625 | | |
Compensation of board members | | | 121,282 | | |
Other expenses | | | 79,227 | | |
Total liabilities | | | 9,330,444 | | |
Net assets applicable to outstanding capital stock | | $ | 1,028,597,372 | | |
Represented by | |
Paid-in capital | | $ | 2,248,212,317 | | |
Excess of distributions over net investment income | | | (935,096 | ) | |
Accumulated net realized loss | | | (1,463,476,409 | ) | |
Unrealized appreciation (depreciation) on: | |
Investments | | | 244,797,611 | | |
Foreign currency translations | | | (1,051 | ) | |
Total — representing net assets applicable to outstanding capital stock | | $ | 1,028,597,372 | | |
The accompanying Notes to Financial Statements are an integral part of this statement.
Annual Report 2015
13
COLUMBIA MARSICO 21ST CENTURY FUND
STATEMENT OF ASSETS AND LIABILITIES (continued)
February 28, 2015
Class A | |
Net assets | | $ | 483,251,556 | | |
Shares outstanding | | | 22,484,386 | | |
Net asset value per share | | $ | 21.49 | | |
Maximum offering price per share(a) | | $ | 22.80 | | |
Class B | |
Net assets | | $ | 29,420,140 | | |
Shares outstanding | | | 1,514,257 | | |
Net asset value per share | | $ | 19.43 | | |
Class C | |
Net assets | | $ | 252,224,122 | | |
Shares outstanding | | | 12,983,406 | | |
Net asset value per share | | $ | 19.43 | | |
Class R | |
Net assets | | $ | 21,010,168 | | |
Shares outstanding | | | 994,757 | | |
Net asset value per share | | $ | 21.12 | | |
Class R4 | |
Net assets | | $ | 897,827 | | |
Shares outstanding | | | 39,875 | | |
Net asset value per share | | $ | 22.52 | | |
Class R5 | |
Net assets | | $ | 50,507 | | |
Shares outstanding | | | 2,277 | | |
Net asset value per share | | $ | 22.18 | | |
Class Z | |
Net assets | | $ | 241,743,052 | | |
Shares outstanding | | | 10,917,491 | | |
Net asset value per share | | $ | 22.14 | | |
(a) The maximum offering price per share is calculated by dividing the net asset value per share by 1.0 minus the maximum sales charge of 5.75%.
The accompanying Notes to Financial Statements are an integral part of this statement.
Annual Report 2015
14
COLUMBIA MARSICO 21ST CENTURY FUND
STATEMENT OF OPERATIONS
Year Ended February 28, 2015
Net investment income | |
Income: | |
Dividends — unaffiliated issuers | | $ | 6,441,987 | | |
Dividends — affiliated issuers | | | 27,393 | | |
Interest | | | 3 | | |
Foreign taxes withheld | | | (54,826 | ) | |
Total income | | | 6,414,557 | | |
Expenses: | |
Investment management fees | | | 7,141,978 | | |
Distribution and/or service fees | |
Class A | | | 1,271,798 | | |
Class B | | | 391,434 | | |
Class C | | | 2,502,528 | | |
Class R | | | 105,353 | | |
Transfer agent fees | |
Class A | | | 957,056 | | |
Class B | | | 73,553 | | |
Class C | | | 471,511 | | |
Class R | | | 39,689 | | |
Class R4 | | | 1,017 | | |
Class R5 | | | 6 | | |
Class Z | | | 422,701 | | |
Administration fees | | | 596,455 | | |
Compensation of board members | | | 32,718 | | |
Custodian fees | | | 10,888 | | |
Printing and postage fees | | | 141,684 | | |
Registration fees | | | 100,102 | | |
Professional fees | | | 50,300 | | |
Other | | | 24,683 | | |
Total expenses | | | 14,335,454 | | |
Expense reductions | | | (873 | ) | |
Total net expenses | | | 14,334,581 | | |
Net investment loss | | | (7,920,024 | ) | |
Realized and unrealized gain (loss) — net | |
Net realized gain (loss) on: | |
Investments | | | 162,042,920 | | |
Foreign currency translations | | | (5,700 | ) | |
Net realized gain | | | 162,037,220 | | |
Net change in unrealized appreciation (depreciation) on: | |
Investments | | | (76,658,272 | ) | |
Foreign currency translations | | | 821 | | |
Net change in unrealized depreciation | | | (76,657,451 | ) | |
Net realized and unrealized gain | | | 85,379,769 | | |
Net increase in net assets resulting from operations | | $ | 77,459,745 | | |
The accompanying Notes to Financial Statements are an integral part of this statement.
Annual Report 2015
15
COLUMBIA MARSICO 21ST CENTURY FUND
STATEMENT OF CHANGES IN NET ASSETS
| | | Year Ended
February 28,
2015 | | Year Ended
February 28,
2014 | |
Operations | |
Net investment loss | | $ | (7,920,024 | ) | | $ | (8,233,668 | ) | |
Net realized gain | | | 162,037,220 | | | | 273,459,769 | | |
Net change in unrealized appreciation (depreciation) | | | (76,657,451 | ) | | | 93,241,817 | | |
Net increase in net assets resulting from operations | | | 77,459,745 | | | | 358,467,918 | | |
Decrease in net assets from capital stock activity | | | (201,760,853 | ) | | | (244,221,256 | ) | |
Total increase (decrease) in net assets | | | (124,301,108 | ) | | | 114,246,662 | | |
Net assets at beginning of year | | | 1,152,898,480 | | | | 1,038,651,818 | | |
Net assets at end of year | | $ | 1,028,597,372 | | | $ | 1,152,898,480 | | |
Excess of distributions over net investment income | | $ | (935,096 | ) | | $ | (1,763,644 | ) | |
The accompanying Notes to Financial Statements are an integral part of this statement.
Annual Report 2015
16
COLUMBIA MARSICO 21ST CENTURY FUND
STATEMENT OF CHANGES IN NET ASSETS (continued)
| | | Year Ended February 28, 2015 | | Year Ended February 28, 2014(a) | |
| | | Shares | | Dollars ($) | | Shares | | Dollars ($) | |
Capital stock activity | |
Class A shares | |
Subscriptions(b) | | | 1,822,398 | | | | 35,828,885 | | | | 2,379,705 | | | | 40,165,532 | | |
Redemptions | | | (8,698,301 | ) | | | (172,353,015 | ) | | | (10,242,751 | ) | | | (166,735,036 | ) | |
Net decrease | | | (6,875,903 | ) | | | (136,524,130 | ) | | | (7,863,046 | ) | | | (126,569,504 | ) | |
Class B shares | |
Subscriptions | | | 5,175 | | | | 92,504 | | | | 10,854 | | | | 166,346 | | |
Redemptions(b) | | | (1,314,748 | ) | | | (23,424,857 | ) | | | (1,256,756 | ) | | | (18,902,601 | ) | |
Net decrease | | | (1,309,573 | ) | | | (23,332,353 | ) | | | (1,245,902 | ) | | | (18,736,255 | ) | |
Class C shares | |
Subscriptions | | | 330,566 | | | | 5,960,073 | | | | 361,220 | | | | 5,630,721 | | |
Redemptions | | | (2,284,607 | ) | | | (41,075,556 | ) | | | (3,638,190 | ) | | | (54,347,508 | ) | |
Net decrease | | | (1,954,041 | ) | | | (35,115,483 | ) | | | (3,276,970 | ) | | | (48,716,787 | ) | |
Class R shares | |
Subscriptions | | | 126,730 | | | | 2,465,018 | | | | 297,146 | | | | 4,992,150 | | |
Redemptions | | | (397,081 | ) | | | (7,624,823 | ) | | | (661,105 | ) | | | (10,829,059 | ) | |
Net decrease | | | (270,351 | ) | | | (5,159,805 | ) | | | (363,959 | ) | | | (5,836,909 | ) | |
Class R4 shares | |
Subscriptions | | | 40,807 | | | | 857,251 | | | | 12,178 | | | | 186,985 | | |
Redemptions | | | (11,930 | ) | | | (264,813 | ) | | | (1,368 | ) | | | (24,726 | ) | |
Net increase | | | 28,877 | | | | 592,438 | | | | 10,810 | | | | 162,259 | | |
Class R5 shares | |
Subscriptions | | | 2,573 | | | | 54,344 | | | | 128 | | | | 2,500 | | |
Redemptions | | | (424 | ) | | | (8,972 | ) | | | — | | | | — | | |
Net increase | | | 2,149 | | | | 45,372 | | | | 128 | | | | 2,500 | | |
Class Z shares | |
Subscriptions | | | 3,982,334 | | | | 81,594,747 | | | | 1,958,565 | | | | 34,257,815 | | |
Redemptions | | | (4,139,957 | ) | | | (83,861,639 | ) | | | (4,693,563 | ) | | | (78,784,375 | ) | |
Net decrease | | | (157,623 | ) | | | (2,266,892 | ) | | | (2,734,998 | ) | | | (44,526,560 | ) | |
Total net decrease | | | (10,536,465 | ) | | | (201,760,853 | ) | | | (15,473,937 | ) | | | (244,221,256 | ) | |
(a) Class R5 shares are for the period from January 8, 2014 (commencement of operations) through the stated period end.
(b) Includes conversions of Class B shares to Class A shares, if any.
The accompanying Notes to Financial Statements are an integral part of this statement.
Annual Report 2015
17
COLUMBIA MARSICO 21ST CENTURY FUND
The following tables are intended to help you understand the Fund's financial performance. Certain information reflects financial results for a single share of a class held for the periods shown. Per share net investment income (loss) amounts are calculated based on average shares outstanding during the period. Total return assumes reinvestment of all dividends and distributions, if any. Total return does not reflect payment of sales charges, if any. Total return and portfolio turnover are not annualized for periods of less than one year. The portfolio turnover rate is calculated without regard to purchase and sales transactions of short-term instruments and certain derivatives, if any. If such transactions were included, the Fund's portfolio turnover rate may be higher.
| | | Year Ended February 28, | | Year Ended
February 29, | | Year Ended
February 28, | |
Class A | | 2015 | | 2014 | | 2013 | | 2012 | | 2011 | |
Per share data | |
Net asset value, beginning of period | | $ | 19.82 | | | $ | 14.14 | | | $ | 13.25 | | | $ | 14.22 | | | $ | 11.63 | | |
Income from investment operations: | |
Net investment income (loss) | | | (0.12 | ) | | | (0.10 | ) | | | 0.01 | | | | (0.03 | ) | | | (0.06 | ) | |
Net realized and unrealized gain (loss) | | | 1.79 | | | | 5.78 | | | | 0.88 | | | | (0.94 | ) | | | 2.65 | | |
Total from investment operations | | | 1.67 | | | | 5.68 | | | | 0.89 | | | | (0.97 | ) | | | 2.59 | | |
Less distributions to shareholders: | |
Net investment income | | | — | | | | — | | | | (0.00 | )(a) | | | — | | | | — | | |
Total distributions to shareholders | | | — | | | | — | | | | (0.00 | )(a) | | | — | | | | — | | |
Net asset value, end of period | | $ | 21.49 | | | $ | 19.82 | | | $ | 14.14 | | | $ | 13.25 | | | $ | 14.22 | | |
Total return | | | 8.43 | % | | | 40.17 | % | | | 6.74 | % | | | (6.82 | %) | | | 22.27 | %(b) | |
Ratios to average net assets(c) | |
Total gross expenses | | | 1.21 | % | | | 1.23 | %(d) | | | 1.36 | %(d) | | | 1.37 | %(d) | | | 1.31 | % | |
Total net expenses(e) | | | 1.21 | %(f) | | | 1.23 | %(d)(f) | | | 1.35 | %(d)(f) | | | 1.37 | %(d)(f) | | | 1.31 | %(f) | |
Net investment income (loss) | | | (0.60 | %) | | | (0.60 | %) | | | 0.06 | % | | | (0.23 | %) | | | (0.47 | %) | |
Supplemental data | |
Net assets, end of period (in thousands) | | $ | 483,252 | | | $ | 581,859 | | | $ | 526,471 | | | $ | 811,890 | | | $ | 1,711,839 | | |
Portfolio turnover | | | 81 | % | | | 99 | % | | | 65 | % | | | 104 | % | | | 87 | % | |
Notes to Financial Highlights
(a) Rounds to zero.
(b) Total return includes a reimbursement of a loss experienced by the Fund due to a compliance violation. The reimbursement had an impact of less than 0.01% on total return.
(c) In addition to the fees and expenses that the Fund bears directly, the Fund indirectly bears a pro rata share of the fees and expenses of any other funds in which it invests. Such indirect expenses are not included in the Fund's reported expense ratios.
(d) Ratios include line of credit interest expense which is less than 0.01%.
(e) Total net expenses include the impact of certain fee waivers/expense reimbursements made by the Investment Manager and certain of its affiliates, if applicable.
(f) The benefits derived from expense reductions had an impact of less than 0.01%.
The accompanying Notes to Financial Statements are an integral part of this statement.
Annual Report 2015
18
COLUMBIA MARSICO 21ST CENTURY FUND
FINANCIAL HIGHLIGHTS (continued)
| | | Year Ended February 28, | | Year Ended
February 29, | | Year Ended
February 28, | |
Class B | | 2015 | | 2014 | | 2013 | | 2012 | | 2011 | |
Per share data | |
Net asset value, beginning of period | | $ | 18.05 | | | $ | 12.98 | | | $ | 12.25 | | | $ | 13.25 | | | $ | 10.91 | | |
Income from investment operations: | |
Net investment loss | | | (0.24 | ) | | | (0.21 | ) | | | (0.08 | ) | | | (0.12 | ) | | | (0.14 | ) | |
Net realized and unrealized gain (loss) | | | 1.62 | | | | 5.28 | | | | 0.81 | | | | (0.88 | ) | | | 2.48 | | |
Total from investment operations | | | 1.38 | | | | 5.07 | | | | 0.73 | | | | (1.00 | ) | | | 2.34 | | |
Net asset value, end of period | | $ | 19.43 | | | $ | 18.05 | | | $ | 12.98 | | | $ | 12.25 | | | $ | 13.25 | | |
Total return | | | 7.65 | % | | | 39.06 | % | | | 5.96 | % | | | (7.55 | %) | | | 21.45 | %(a) | |
Ratios to average net assets(b) | |
Total gross expenses | | | 1.96 | % | | | 1.98 | %(c) | | | 2.10 | %(c) | | | 2.12 | %(c) | | | 2.06 | % | |
Total net expenses(d) | | | 1.96 | %(e) | | | 1.98 | %(c)(e) | | | 2.10 | %(c)(e) | | | 2.12 | %(c)(e) | | | 2.06 | %(e) | |
Net investment loss | | | (1.37 | %) | | | (1.35 | %) | | | (0.67 | %) | | | (0.97 | %) | | | (1.21 | %) | |
Supplemental data | |
Net assets, end of period (in thousands) | | $ | 29,420 | | | $ | 50,972 | | | $ | 52,823 | | | $ | 72,692 | | | $ | 110,427 | | |
Portfolio turnover | | | 81 | % | | | 99 | % | | | 65 | % | | | 104 | % | | | 87 | % | |
Notes to Financial Highlights
(a) Total return includes a reimbursement of a loss experienced by the Fund due to a compliance violation. The reimbursement had an impact of less than 0.01% on total return.
(b) In addition to the fees and expenses that the Fund bears directly, the Fund indirectly bears a pro rata share of the fees and expenses of any other funds in which it invests. Such indirect expenses are not included in the Fund's reported expense ratios.
(c) Ratios include line of credit interest expense which is less than 0.01%.
(d) Total net expenses include the impact of certain fee waivers/expense reimbursements made by the Investment Manager and certain of its affiliates, if applicable.
(e) The benefits derived from expense reductions had an impact of less than 0.01%.
The accompanying Notes to Financial Statements are an integral part of this statement.
Annual Report 2015
19
COLUMBIA MARSICO 21ST CENTURY FUND
FINANCIAL HIGHLIGHTS (continued)
| | | Year Ended February 28, | | Year Ended
February 29, | | Year Ended
February 28, | |
Class C | | 2015 | | 2014 | | 2013 | | 2012 | | 2011 | |
Per share data | |
Net asset value, beginning of period | | $ | 18.05 | | | $ | 12.98 | | | $ | 12.25 | | | $ | 13.25 | | | $ | 10.91 | | |
Income from investment operations: | |
Net investment loss | | | (0.24 | ) | | | (0.21 | ) | | | (0.08 | ) | | | (0.12 | ) | | | (0.14 | ) | |
Net realized and unrealized gain (loss) | | | 1.62 | | | | 5.28 | | | | 0.81 | | | | (0.88 | ) | | | 2.48 | | |
Total from investment operations | | | 1.38 | | | | 5.07 | | | | 0.73 | | | | (1.00 | ) | | | 2.34 | | |
Net asset value, end of period | | $ | 19.43 | | | $ | 18.05 | | | $ | 12.98 | | | $ | 12.25 | | | $ | 13.25 | | |
Total return | | | 7.65 | % | | | 39.06 | % | | | 5.96 | % | | | (7.55 | %) | | | 21.45 | %(a) | |
Ratios to average net assets(b) | |
Total gross expenses | | | 1.96 | % | | | 1.98 | %(c) | | | 2.10 | %(c) | | | 2.12 | %(c) | | | 2.06 | % | |
Total net expenses(d) | | | 1.96 | %(e) | | | 1.98 | %(c)(e) | | | 2.10 | %(c)(e) | | | 2.12 | %(c)(e) | | | 2.06 | %(e) | |
Net investment loss | | | (1.35 | %) | | | (1.36 | %) | | | (0.68 | %) | | | (0.97 | %) | | | (1.22 | %) | |
Supplemental data | |
Net assets, end of period (in thousands) | | $ | 252,224 | | | $ | 269,583 | | | $ | 236,373 | | | $ | 342,021 | | | $ | 586,725 | | |
Portfolio turnover | | | 81 | % | | | 99 | % | | | 65 | % | | | 104 | % | | | 87 | % | |
Notes to Financial Highlights
(a) Total return includes a reimbursement of a loss experienced by the Fund due to a compliance violation. The reimbursement had an impact of less than 0.01% on total return.
(b) In addition to the fees and expenses that the Fund bears directly, the Fund indirectly bears a pro rata share of the fees and expenses of any other funds in which it invests. Such indirect expenses are not included in the Fund's reported expense ratios.
(c) Ratios include line of credit interest expense which is less than 0.01%.
(d) Total net expenses include the impact of certain fee waivers/expense reimbursements made by the Investment Manager and certain of its affiliates, if applicable.
(e) The benefits derived from expense reductions had an impact of less than 0.01%.
The accompanying Notes to Financial Statements are an integral part of this statement.
Annual Report 2015
20
COLUMBIA MARSICO 21ST CENTURY FUND
FINANCIAL HIGHLIGHTS (continued)
| | | Year Ended February 28, | | Year Ended
February 29, | | Year Ended
February 28, | |
Class R | | 2015 | | 2014 | | 2013 | | 2012 | | 2011 | |
Per share data | |
Net asset value, beginning of period | | $ | 19.52 | | | $ | 13.97 | | | $ | 13.12 | | | $ | 14.11 | | | $ | 11.57 | | |
Income from investment operations: | |
Net investment loss | | | (0.16 | ) | | | (0.14 | ) | | | (0.02 | ) | | | (0.06 | ) | | | (0.09 | ) | |
Net realized and unrealized gain (loss) | | | 1.76 | | | | 5.69 | | | | 0.87 | | | | (0.93 | ) | | | 2.63 | | |
Total from investment operations | | | 1.60 | | | | 5.55 | | | | 0.85 | | | | (0.99 | ) | | | 2.54 | | |
Net asset value, end of period | | $ | 21.12 | | | $ | 19.52 | | | $ | 13.97 | | | $ | 13.12 | | | $ | 14.11 | | |
Total return | | | 8.20 | % | | | 39.73 | % | | | 6.48 | % | | | (7.02 | %) | | | 21.95 | %(a) | |
Ratios to average net assets(b) | |
Total gross expenses | | | 1.46 | % | | | 1.48 | %(c) | | | 1.61 | %(c) | | | 1.62 | %(c) | | | 1.56 | % | |
Total net expenses(d) | | | 1.46 | %(e) | | | 1.48 | %(c)(e) | | | 1.60 | %(c)(e) | | | 1.62 | %(c)(e) | | | 1.56 | %(e) | |
Net investment loss | | | (0.85 | %) | | | (0.85 | %) | | | (0.17 | %) | | | (0.46 | %) | | | (0.71 | %) | |
Supplemental data | |
Net assets, end of period (in thousands) | | $ | 21,010 | | | $ | 24,700 | | | $ | 22,756 | | | $ | 30,137 | | | $ | 40,468 | | |
Portfolio turnover | | | 81 | % | | | 99 | % | | | 65 | % | | | 104 | % | | | 87 | % | |
Notes to Financial Highlights
(a) Total return includes a reimbursement of a loss experienced by the Fund due to a compliance violation. The reimbursement had an impact of less than 0.01% on total return.
(b) In addition to the fees and expenses that the Fund bears directly, the Fund indirectly bears a pro rata share of the fees and expenses of any other funds in which it invests. Such indirect expenses are not included in the Fund's reported expense ratios.
(c) Ratios include line of credit interest expense which is less than 0.01%.
(d) Total net expenses include the impact of certain fee waivers/expense reimbursements made by the Investment Manager and certain of its affiliates, if applicable.
(e) The benefits derived from expense reductions had an impact of less than 0.01%.
The accompanying Notes to Financial Statements are an integral part of this statement.
Annual Report 2015
21
COLUMBIA MARSICO 21ST CENTURY FUND
FINANCIAL HIGHLIGHTS (continued)
| | | Year Ended February 28, | |
Class R4 | | 2015 | | 2014 | | 2013(a) | |
Per share data | |
Net asset value, beginning of period | | $ | 20.71 | | | $ | 14.74 | | | $ | 13.29 | | |
Income from investment operations: | |
Net investment income (loss) | | | (0.06 | ) | | | (0.06 | ) | | | 0.01 | | |
Net realized and unrealized gain | | | 1.87 | | | | 6.03 | | | | 1.48 | | |
Total from investment operations | | | 1.81 | | | | 5.97 | | | | 1.49 | | |
Less distributions to shareholders: | |
Net investment income | | | — | | | | — | | | | (0.04 | ) | |
Total distributions to shareholders | | | — | | | | — | | | | (0.04 | ) | |
Net asset value, end of period | | $ | 22.52 | | | $ | 20.71 | | | $ | 14.74 | | |
Total return | | | 8.74 | % | | | 40.50 | % | | | 11.20 | % | |
Ratios to average net assets(b) | |
Total gross expenses | | | 0.97 | % | | | 0.98 | %(c) | | | 1.02 | %(c)(d) | |
Total net expenses(e) | | | 0.97 | %(f) | | | 0.98 | %(c)(f) | | | 1.02 | %(c)(d) | |
Net investment income (loss) | | | (0.28 | %) | | | (0.34 | %) | | | 0.28 | %(d) | |
Supplemental data | |
Net assets, end of period (in thousands) | | $ | 898 | | | $ | 228 | | | $ | 3 | | |
Portfolio turnover | | | 81 | % | | | 99 | % | | | 65 | % | |
Notes to Financial Highlights
(a) Based on operations from November 8, 2012 (commencement of operations) through the stated period end.
(b) In addition to the fees and expenses that the Fund bears directly, the Fund indirectly bears a pro rata share of the fees and expenses of any other funds in which it invests. Such indirect expenses are not included in the Fund's reported expense ratios.
(c) Ratios include line of credit interest expense which is less than 0.01%.
(d) Annualized.
(e) Total net expenses include the impact of certain fee waivers/expense reimbursements made by the Investment Manager and certain of its affiliates, if applicable.
(f) The benefits derived from expense reductions had an impact of less than 0.01%.
The accompanying Notes to Financial Statements are an integral part of this statement.
Annual Report 2015
22
COLUMBIA MARSICO 21ST CENTURY FUND
FINANCIAL HIGHLIGHTS (continued)
| | | Year Ended February 28, | |
Class R5 | | 2015 | | 2014(a) | |
Per share data | |
Net asset value, beginning of period | | $ | 20.37 | | | $ | 19.48 | | |
Income from investment operations: | |
Net investment loss | | | (0.02 | ) | | | (0.01 | ) | |
Net realized and unrealized gain | | | 1.83 | | | | 0.90 | | |
Total from investment operations | | | 1.81 | | | | 0.89 | | |
Net asset value, end of period | | $ | 22.18 | | | $ | 20.37 | | |
Total return | | | 8.89 | % | | | 4.57 | % | |
Ratios to average net assets(b) | |
Total gross expenses | | | 0.84 | % | | | 0.80 | %(c) | |
Total net expenses(d) | | | 0.84 | % | | | 0.80 | %(c) | |
Net investment loss | | | (0.09 | %) | | | (0.51 | %)(c) | |
Supplemental data | |
Net assets, end of period (in thousands) | | $ | 51 | | | $ | 3 | | |
Portfolio turnover | | | 81 | % | | | 99 | % | |
Notes to Financial Highlights
(a) Based on operations from January 8, 2014 (commencement of operations) through the stated period end.
(b) In addition to the fees and expenses that the Fund bears directly, the Fund indirectly bears a pro rata share of the fees and expenses of any other funds in which it invests. Such indirect expenses are not included in the Fund's reported expense ratios.
(c) Annualized.
(d) Total net expenses include the impact of certain fee waivers/expense reimbursements made by the Investment Manager and certain of its affiliates, if applicable.
The accompanying Notes to Financial Statements are an integral part of this statement.
Annual Report 2015
23
COLUMBIA MARSICO 21ST CENTURY FUND
FINANCIAL HIGHLIGHTS (continued)
| | | Year Ended February 28, | | Year Ended
February 29, | | Year Ended
February 28, | |
Class Z | | 2015 | | 2014 | | 2013 | | 2012 | | 2011 | |
Per share data | |
Net asset value, beginning of period | | $ | 20.37 | | | $ | 14.50 | | | $ | 13.57 | | | $ | 14.54 | | | $ | 11.86 | | |
Income from investment operations: | |
Net investment income (loss) | | | (0.07 | ) | | | (0.06 | ) | | | 0.04 | | | | 0.01 | | | | (0.03 | ) | |
Net realized and unrealized gain (loss) | | | 1.84 | | | | 5.93 | | | | 0.92 | | | | (0.98 | ) | | | 2.71 | | |
Total from investment operations | | | 1.77 | | | | 5.87 | | | | 0.96 | | | | (0.97 | ) | | | 2.68 | | |
Less distributions to shareholders: | |
Net investment income | | | — | | | | — | | | | (0.03 | ) | | | — | | | | — | | |
Total distributions to shareholders | | | — | | | | — | | | | (0.03 | ) | | | — | | | | — | | |
Net asset value, end of period | | $ | 22.14 | | | $ | 20.37 | | | $ | 14.50 | | | $ | 13.57 | | | $ | 14.54 | | |
Total return | | | 8.69 | % | | | 40.48 | % | | | 7.09 | % | | | (6.67 | %) | | | 22.60 | %(a) | |
Ratios to average net assets(b) | |
Total gross expenses | | | 0.97 | % | | | 0.98 | %(c) | | | 1.11 | %(c) | | | 1.12 | %(c) | | | 1.06 | % | |
Total net expenses(d) | | | 0.97 | %(e) | | | 0.98 | %(c)(e) | | | 1.10 | %(c)(e) | | | 1.12 | %(c)(e) | | | 1.06 | %(e) | |
Net investment income (loss) | | | (0.34 | %) | | | (0.36 | %) | | | 0.27 | % | | | 0.04 | % | | | (0.20 | %) | |
Supplemental data | |
Net assets, end of period (in thousands) | | $ | 241,743 | | | $ | 225,554 | | | $ | 200,226 | | | $ | 449,867 | | | $ | 1,245,671 | | |
Portfolio turnover | | | 81 | % | | | 99 | % | | | 65 | % | | | 104 | % | | | 87 | % | |
Notes to Financial Highlights
(a) Total return includes a reimbursement of a loss experienced by the Fund due to a compliance violation. The reimbursement had an impact of less than 0.01% on total return.
(b) In addition to the fees and expenses that the Fund bears directly, the Fund indirectly bears a pro rata share of the fees and expenses of any other funds in which it invests. Such indirect expenses are not included in the Fund's reported expense ratios.
(c) Ratios include line of credit interest expense which is less than 0.01%.
(d) Total net expenses include the impact of certain fee waivers/expense reimbursements made by the Investment Manager and certain of its affiliates, if applicable.
(e) The benefits derived from expense reductions had an impact of less than 0.01%.
The accompanying Notes to Financial Statements are an integral part of this statement.
Annual Report 2015
24
COLUMBIA MARSICO 21ST CENTURY FUND
NOTES TO FINANCIAL STATEMENTS
February 28, 2015
Note 1. Organization
Columbia Marsico 21st Century Fund (the Fund), a series of Columbia Funds Series Trust (the Trust), is a diversified fund. The Trust is registered under the Investment Company Act of 1940, as amended (the 1940 Act), as an open-end management investment company organized as a Delaware statutory trust.
Fund Shares
The Trust may issue an unlimited number of shares (without par value). The Fund offers Class A, Class B, Class C, Class R, Class R4, Class R5 and Class Z shares. Although all share classes generally have identical voting, dividend and liquidation rights, each share class votes separately when required by the Trust's organizational documents or by law. Different share classes pay different distribution amounts to the extent the expenses of such share classes differ, and distributions in liquidation will be proportional to the net asset value of each share class. Each share class has its own expense structure and sales charges.
Class A shares are subject to a maximum front-end sales charge of 5.75% based on the initial investment amount. Class A shares purchased without an initial sales charge in accounts aggregating $1 million to $50 million at the time of purchase are subject to a contingent deferred sales charge (CDSC) if the shares are sold within 18 months of purchase, charged as follows: 1.00% CDSC if redeemed within 12 months of purchase, and 0.50% CDSC if redeemed more than 12, but less than 18, months after purchase.
Class B shares may be subject to a maximum CDSC of 5.00% based upon the holding period after purchase. Class B shares will generally convert to Class A shares eight years after purchase. The Fund no longer accepts investments by new or existing investors in the Fund's Class B shares, except in connection with the reinvestment of any dividend and/or capital gain distributions in Class B shares of the Fund and exchanges by existing Class B shareholders of certain other funds within the Columbia Family of Funds.
Class C shares are subject to a 1.00% CDSC on shares redeemed within one year of purchase.
Class R shares are not subject to sales charges and are generally available only to certain retirement plans and other investors as described in the Fund's prospectus.
Class R4 shares are not subject to sales charges and are generally available only to omnibus retirement plans
and certain investors as described in the Fund's prospectus.
Class R5 shares are not subject to sales charges and are generally available only to investors purchasing through authorized investment professionals and omnibus retirement plans.
Class Z shares are not subject to sales charges and are available only to eligible investors, which are subject to different investment minimums as described in the Fund's prospectus.
Note 2. Summary of Significant Accounting Policies
Basis of Preparation
The Fund is an investment company that applies the accounting and reporting guidance in the Financial Accounting Standards Board (FASB) Accounting Standards Codification Topic 946, Financial Services — Investment Companies (ASC 946). The financial statements are prepared in accordance with U.S. generally accepted accounting principles (GAAP) which requires management to make certain estimates and assumptions that affect the reported amounts of assets and liabilities, the disclosure of contingent assets and liabilities at the date of the financial statements and the reported amounts of income and expenses during the reporting period. Actual results could differ from those estimates.
The following is a summary of significant accounting policies followed by the Fund in the preparation of its financial statements.
Security Valuation
All equity securities are valued at the close of business of the New York Stock Exchange (NYSE). Equity securities are valued at the last quoted sales price on the principal exchange or market on which they trade, except for securities traded on the NASDAQ Stock Market, which are valued at the NASDAQ official close price. Unlisted securities or listed securities for which there were no sales during the day are valued at the mean of the latest quoted bid and ask prices on such exchanges or markets.
Foreign equity securities are valued based on quotations from the principal market in which such securities are traded. If any foreign security prices are not readily available as a result of limited share activity, the securities are valued at the mean of the latest quoted bid and ask prices on such exchanges or markets.
Annual Report 2015
25
COLUMBIA MARSICO 21ST CENTURY FUND
NOTES TO FINANCIAL STATEMENTS (continued)
February 28, 2015
Foreign currency exchange rates are generally determined at 4:00 p.m. Eastern (U.S.) time. Many securities markets and exchanges outside the U.S. close prior to the close of the NYSE; therefore, the closing prices for securities in such markets or on such exchanges may not fully reflect events that occur after such close but before the close of the NYSE. In those situations, foreign securities will be fair valued pursuant to a policy adopted by the Board of Trustees (the Board), including, if available, utilizing a third party pricing service to determine these fair values. The third party pricing service takes into account multiple factors, including, but not limited to, movements in the U.S. securities markets, certain depositary receipts, futures contracts and foreign exchange rates that have occurred subsequent to the close of the foreign exchange or market, to determine a good faith estimate that reasonably reflects the current market conditions as of the close of the NYSE. The fair value of a security is likely to be different from the quoted or published price, if available.
Investments in open-end investment companies, including money market funds, are valued at their net asset value.
Investments for which market quotations are not readily available, or that have quotations which management believes are not reliable, are valued at fair value as determined in good faith under procedures established by and under the general supervision of the Board. If a security or class of securities (such as foreign securities) is valued at fair value, such value is likely to be different from the quoted or published price for the security.
The determination of fair value often requires significant judgment. To determine fair value, management may use assumptions including but not limited to future cash flows and estimated risk premiums. Multiple inputs from various sources may be used to determine fair value.
Foreign Currency Transactions and Translations
The values of all assets and liabilities denominated in foreign currencies are generally translated into U.S. dollars at exchange rates determined at the close of the NYSE. Net realized and unrealized gains (losses) on foreign currency transactions and translations include gains (losses) arising from the fluctuation in exchange rates between trade and settlement dates on securities transactions, gains (losses) arising from the disposition of foreign currency and currency gains (losses) between the accrual and payment dates on dividends, interest income and foreign withholding taxes.
For financial statement purposes, the Fund does not distinguish that portion of gains (losses) on investments which is due to changes in foreign exchange rates from that which is due to changes in market prices of the investments. Such fluctuations are included with the net realized and unrealized gains (losses) on investments in the Statement of Operations.
Security Transactions
Security transactions are accounted for on the trade date. Cost is determined and gains (losses) are based upon the specific identification method for both financial statement and federal income tax purposes.
Income Recognition
Corporate actions and dividend income are generally recorded net of any non-reclaimable tax withholdings, on the ex-dividend date or upon receipt of ex-dividend notification in the case of certain foreign securities.
Awards from class action litigation are recorded as a reduction of cost basis if the Fund still owns the applicable securities on the payment date. If the Fund no longer owns the applicable securities, the proceeds are recorded as realized gains.
Expenses
General expenses of the Trust are allocated to the Fund and other funds of the Trust based upon relative net assets or other expense allocation methodologies determined by the nature of the expense. Expenses directly attributable to the Fund are charged to the Fund. Expenses directly attributable to a specific class of shares are charged to that share class.
Determination of Class Net Asset Value
All income, expenses (other than class-specific expenses, which are charged to that share class, as shown in the Statement of Operations) and realized and unrealized gains (losses) are allocated to each class of the Fund on a daily basis, based on the relative net assets of each class, for purposes of determining the net asset value of each class.
Federal Income Tax Status
The Fund intends to qualify each year as a regulated investment company under Subchapter M of the Internal Revenue Code, as amended, and will distribute substantially all of its taxable income (including net short-term capital gains), if any, for its tax year, and as such will not be subject to federal income taxes. In addition, the Fund intends to distribute in each calendar
Annual Report 2015
26
COLUMBIA MARSICO 21ST CENTURY FUND
NOTES TO FINANCIAL STATEMENTS (continued)
February 28, 2015
year substantially all of its net investment income, capital gains and certain other amounts, if any, such that the Fund should not be subject to federal excise tax. Therefore, no federal income or excise tax provision is recorded.
Foreign Taxes
The Fund may be subject to foreign taxes on income, gains on investments or currency repatriation, a portion of which may be recoverable. The Fund will accrue such taxes and recoveries, as applicable, based upon its current interpretation of tax rules and regulations that exist in the markets in which it invests.
Realized gains in certain countries may be subject to foreign taxes at the Fund level, based on statutory rates. The Fund accrues for such foreign taxes on realized and unrealized gains at the appropriate rate for each jurisdiction, as applicable. The amount, if any, is disclosed as a liability on the Statement of Assets and Liabilities.
Distributions to Shareholders
Distributions from net investment income, if any, are declared and paid semi-annually. Net realized capital gains, if any, are distributed at least annually. Income distributions and capital gain distributions are determined in accordance with federal income tax regulations, which may differ from GAAP.
Guarantees and Indemnifications
Under the Trust's organizational documents and, in some cases, by contract, its officers and trustees are indemnified against certain liabilities arising out of the performance of their duties to the Trust or its funds. In addition, certain of the Fund's contracts with its service providers contain general indemnification clauses. The Fund's maximum exposure under these arrangements is unknown since the amount of any future claims that may be made against the Fund cannot be determined, and the Fund has no historical basis for predicting the likelihood of any such claims.
Note 3. Fees and Compensation Paid to Affiliates
Investment Management Fees
Under an Investment Management Services Agreement, Columbia Management Investment Advisers, LLC (the Investment Manager), a wholly-owned subsidiary of Ameriprise Financial, Inc. (Ameriprise Financial), is responsible for the ultimate oversight of investments
made by the Fund. The Fund's subadviser (see Subadvisory Agreement below) has the primary responsibility for the day-to-day portfolio management of the Fund. The investment management fee is an annual fee that is equal to a percentage of the Fund's average daily net assets that declines from 0.71% to 0.54% as the Fund's net assets increase. The effective investment management fee rate for the year ended February 28, 2015 was 0.68% of the Fund's average daily net assets.
Subadvisory Agreement
The Investment Manager has entered into a Subadvisory Agreement with Marsico Capital Management, LLC (Marsico) to serve as the subadviser to the Fund. The Investment Manager compensates Marsico to manage the investment of the Fund's assets.
Administration Fees
Under an Administrative Services Agreement, the Investment Manager also serves as the Fund Administrator. The Fund pays the Fund Administrator an annual fee for administration and accounting services equal to a percentage of the Fund's average daily net assets that declines from 0.06% to 0.03% as the Fund's net assets increase. The effective administration fee rate for the year ended February 28, 2015 was 0.06% of the Fund's average daily net assets.
Other Expenses
Other expenses are for, among other things, miscellaneous expenses of the Fund or the Board, including payments to a company providing limited administrative services to the Fund and the Board. That company's expenses include boardroom and office expense, employee compensation, employee health and retirement benefits, and certain other expenses. For the year ended February 28, 2015, other expenses paid by the Fund to this company were $2,676.
Compensation of Board Members
Board members are compensated for their services to the Fund as disclosed in the Statement of Operations. Under a Deferred Compensation Plan (the Plan), the Board members who are not "interested persons" of the Fund, as defined under the 1940 Act, may elect to defer payment of up to 100% of their compensation. Deferred amounts are treated as though equivalent dollar amounts had been invested in shares of certain funds managed by the Investment Manager. The Fund's liability for these amounts is adjusted for market value changes
Annual Report 2015
27
COLUMBIA MARSICO 21ST CENTURY FUND
NOTES TO FINANCIAL STATEMENTS (continued)
February 28, 2015
and remains in the Fund until distributed in accordance with the Plan.
Transfer Agent Fees
Under a Transfer and Dividend Disbursing Agent Agreement, Columbia Management Investment Services Corp. (the Transfer Agent), an affiliate of the Investment Manager and a wholly-owned subsidiary of Ameriprise Financial, is responsible for providing transfer agency services to the Fund. The Transfer Agent has contracted with Boston Financial Data Services (BFDS) to serve as sub-transfer agent.
Effective November 1, 2014, the Transfer Agent receives a monthly transfer agency fee based on the number or the average value of accounts, depending on the type of account. Prior to November 1, 2014, the Transfer Agent received a monthly account-based service fee based on the number of open accounts. In addition, the Transfer Agent also receives sub-transfer agency fees based on a percentage of the average aggregate value of the Fund's shares maintained in omnibus accounts (other than omnibus accounts for which American Enterprise Investment Services Inc. is the broker of record or accounts where the beneficial shareholder is a customer of Ameriprise Financial Services, Inc., for which the Transfer Agent receives a per account fee). The Transfer Agent pays the fees of BFDS for services as sub-transfer agent and is not entitled to reimbursement for such fees from the Fund (with the exception of out-of-pocket fees).
The Transfer Agent also receives compensation from the Fund for various shareholder services and reimbursements for certain out-of-pocket fees. Total transfer agent fees for Class R5 shares are subject to an annual limitation of not more than 0.05% of the average daily net assets attributable to Class R5 shares.
For the year ended February 28, 2015, the Fund's effective transfer agent fee rates as a percentage of average daily net assets of each class were as follows:
Class A | | | 0.19 | % | |
Class B | | | 0.19 | | |
Class C | | | 0.19 | | |
Class R | | | 0.19 | | |
Class R4 | | | 0.19 | | |
Class R5 | | | 0.05 | | |
Class Z | | | 0.19 | | |
An annual minimum account balance fee of $20 may apply to certain accounts with a value below the applicable share class's initial minimum investment
requirements to reduce the impact of small accounts on transfer agent fees. These minimum account balance fees are remitted to the Fund and recorded as part of expense reductions in the Statement of Operations. For the year ended February 28, 2015, these minimum account balance fees reduced total expenses of the Fund by $873.
Distribution and Service Fees
The Fund has an agreement with Columbia Management Investment Distributors, Inc. (the Distributor), an affiliate of the Investment Manager and a wholly-owned subsidiary of Ameriprise Financial, for distribution and shareholder services. The Board has approved, and the Fund has adopted, distribution and shareholder service plans (the Plans) applicable to certain share classes, which set the distribution and service fees for the Fund. These fees are calculated daily and are intended to compensate the Distributor and/or eligible selling and/or servicing agents for selling shares of the Fund and providing services to investors.
Under the Plans, the Fund pays a monthly combined distribution and service fee to the Distributor at the maximum annual rate of 0.25% of the average daily net assets attributable to Class A shares of the Fund. Also under the Plans, the Fund pays a monthly service fee at the maximum annual rate of 0.25% of the average daily net assets attributable to Class B and Class C shares of the Fund and the payment of a monthly distribution fee at the maximum annual rates of 0.75%, 0.75% and 0.50% of the average daily net assets attributable to Class B, Class C and Class R shares, respectively.
Sales Charges
Sales charges, including front-end charges and CDSCs, received by the Distributor for distributing Fund shares were $157,362 for Class A, $5,822 for Class B and $1,587 for Class C shares for the year ended February 28, 2015.
Expenses Waived/Reimbursed by the Investment Manager and its Affiliates
The Fund's expense ratio is subject to an expense reimbursement arrangement pursuant to which fees will be waived and/or expenses reimbursed (excluding certain fees and expenses described below), so that the Fund's net operating expenses, after giving effect to fees waived/expenses reimbursed and any balance credits
Annual Report 2015
28
COLUMBIA MARSICO 21ST CENTURY FUND
NOTES TO FINANCIAL STATEMENTS (continued)
February 28, 2015
and/or overdraft charges from the Fund's custodian, do not exceed the annual rates of:
| | | Voluntary
Expense Cap
Effective
July 1, 2014 | | Contractual
Expense Cap
Prior to
July 1, 2014 | |
Class A | | | 1.30 | % | | | 1.29 | % | |
Class B | | | 2.05 | | | | 2.04 | | |
Class C | | | 2.05 | | | | 2.04 | | |
Class R | | | 1.55 | | | | 1.54 | | |
Class R4 | | | 1.05 | | | | 1.04 | | |
Class R5 | | | 0.96 | | | | 0.94 | | |
Class Z | | | 1.05 | | | | 1.04 | | |
The voluntary expense cap arrangement may be revised or discontinued at any time. Under the arrangements, the following fees and expenses are excluded from the waiver/reimbursement commitment, and therefore will be paid by the Fund, if applicable: taxes (including foreign transaction taxes), expenses associated with investments in affiliated and non-affiliated pooled investment vehicles (including mutual funds and exchange-traded funds), transaction costs and brokerage commissions, costs related to any securities lending program, dividend expenses associated with securities sold short, inverse floater program fees and expenses, transaction charges and interest on borrowed money, interest and extraordinary expenses. Any fees waived and/or expenses reimbursed under the expense reimbursement arrangements described above are not recoverable by the Investment Manager or its affiliates in future periods.
Note 4. Federal Tax Information
The timing and character of income and capital gain distributions are determined in accordance with income tax regulations, which may differ from GAAP because of temporary or permanent book to tax differences.
At February 28, 2015, these differences are primarily due to differing treatment for capital loss carryforwards, deferral/reversal of wash sale losses, Trustees' deferred compensation, foreign currency transactions, net operating loss reclassification, and late-year ordinary losses. To the extent these differences are permanent, reclassifications are made among the components of the Fund's net assets in the Statement of Assets and Liabilities. Temporary differences do not require
reclassifications. In the Statement of Assets and Liabilities the following reclassifications were made:
Excess of distributions over net investment income | | $ | 8,748,572 | | |
Accumulated net realized loss | | | 5,700 | | |
Paid-in capital | | | (8,754,272 | ) | |
Net investment income (loss) and net realized gains (losses), as disclosed in the Statement of Operations, and net assets were not affected by this reclassification.
For the years ended February 28, 2015 and 2014, there were no distributions.
At February 28, 2015, the components of distributable earnings on a tax basis were as follows:
Capital loss carryforwards | | | (1,461,784,105 | ) | |
Net unrealized appreciation | | | 243,105,307 | | |
At February 28, 2015, the cost of investments for federal income tax purposes was $776,752,079 and the aggregate gross unrealized appreciation and depreciation based on that cost was:
Unrealized appreciation | | $ | 252,997,848 | | |
Unrealized depreciation | | | (9,892,541 | ) | |
Net unrealized appreciation | | $ | 243,105,307 | | |
The following capital loss carryforwards, determined at February 28, 2015, may be available to reduce taxable income arising from future net realized gains on investments, if any, to the extent permitted by the Internal Revenue Code:
Year of Expiration | | Amount ($) | |
2018 | | | 1,461,784,105 | | |
For the year ended February 28, 2015, $157,270,245 of capital loss carryforward was utilized.
Under current tax rules, regulated investment companies can elect to treat certain late-year ordinary losses incurred and post-October capital losses (capital losses realized after October 31) as arising on the first day of the following taxable year. As of February 28, 2015, the Fund will elect to treat late-year ordinary losses of $815,200 as arising on March 1, 2015.
Management of the Fund has concluded that there are no significant uncertain tax positions in the Fund that would require recognition in the financial statements. However, management's conclusion may be subject to review and adjustment at a later date based on factors including, but not limited to, new tax laws, regulations, and administrative interpretations (including relevant court decisions). Generally, the Fund's federal tax returns
Annual Report 2015
29
COLUMBIA MARSICO 21ST CENTURY FUND
NOTES TO FINANCIAL STATEMENTS (continued)
February 28, 2015
for the prior three fiscal years remain subject to examination by the Internal Revenue Service.
Note 5. Portfolio Information
The cost of purchases and proceeds from sales of securities, excluding short-term investments and derivatives, if any, aggregated to $836,782,803 and $1,047,949,315, respectively, for the year ended February 28, 2015. The amount of purchase and sale activity impacts the portfolio turnover rate reported in the Financial Highlights.
Note 6. Affiliated Money Market Fund
The Fund invests in Columbia Short-Term Cash Fund, an affiliated money market fund established for the exclusive use by the Fund and other affiliated funds. The income earned by the Fund from such investments is included as Dividends — affiliated issuers in the Statement of Operations. As an investing fund, the Fund indirectly bears its proportionate share of the expenses of Columbia Short-Term Cash Fund.
Note 7. Shareholder Concentration
At February 28, 2015, one unaffiliated shareholder of record owned 16.9% of the outstanding shares of the Fund in one or more accounts. The Fund has no knowledge about whether any portion of those shares was owned beneficially. Affiliated shareholders of record owned 16.6% of the outstanding shares of the Fund in one or more accounts. Subscription and redemption activity by concentrated accounts may have a significant effect on the operations of the Fund.
Note 8. Line of Credit
The Fund has entered into a revolving credit facility with a syndicate of banks led by JPMorgan Chase Bank, N.A. (JPMorgan) whereby the Fund may borrow for the temporary funding of shareholder redemptions or for other temporary or emergency purposes. Pursuant to a December 9, 2014 amendment, the credit facility agreement, which is a collective agreement between the Fund and certain other funds managed by the Investment Manager, severally and not jointly, permits collective borrowings up to $550 million. Interest is charged to each participating fund based on its borrowings at a rate equal to the higher of (i) the overnight federal funds rate plus 1.00% or (ii) the one-month LIBOR rate plus 1.00%. Each borrowing under the credit facility matures no later than 60 days after the date of borrowing. The Fund also pays a commitment fee equal to its pro rata share of the amount of the credit facility at a rate of 0.075% per
annum. The commitment fee is included in other expenses in the Statement of Operations. Prior to the December 9, 2014 amendment, the credit facility agreement permitted borrowings up to $500 million under the same terms and interest rates as described above.
The Fund had no borrowings during the year ended February 28, 2015.
Note 9. Significant Risks
Health Care Sector Risk
Sector risk occurs when a fund invests a significant portion of its assets in securities of companies conducting business in a related group of industries within an economic sector. Companies in the same economic sector may be similarly affected by economic, regulatory, political or market events or conditions, making a fund more vulnerable to unfavorable developments in that economic sector than funds that invest more broadly. The Fund may be more susceptible to the particular risks that may affect companies in the health care sector than if it were invested in a wider variety of companies in unrelated sectors.
Information Technology Sector Risk
Sector risk occurs when a fund invests a significant portion of its assets in securities of companies conducting business in a related group of industries within an economic sector. Companies in the same economic sector may be similarly affected by economic, regulatory, political or market events or conditions, making a fund more vulnerable to unfavorable developments in that economic sector than funds that invest more broadly. The Fund may be more susceptible to the particular risks that may affect companies in the information technology sector than if it were invested in a wider variety of companies in unrelated sectors.
Note 10. Subsequent Events
Management has evaluated the events and transactions that have occurred through the date the financial statements were issued and noted no items requiring adjustment of the financial statements or additional disclosure.
Note 11. Information Regarding Pending and Settled Legal Proceedings
In December 2005, without admitting or denying the allegations, American Express Financial Corporation (AEFC, which is now known as Ameriprise Financial, Inc.
Annual Report 2015
30
COLUMBIA MARSICO 21ST CENTURY FUND
NOTES TO FINANCIAL STATEMENTS (continued)
February 28, 2015
(Ameriprise Financial)) entered into settlement agreements with the Securities and Exchange Commission (SEC) and Minnesota Department of Commerce (MDOC) related to market timing activities. As a result, AEFC was censured and ordered to cease and desist from committing or causing any violations of certain provisions of the Investment Advisers Act of 1940, the Investment Company Act of 1940, and various Minnesota laws. AEFC agreed to pay disgorgement of $10 million and civil money penalties of $7 million. AEFC also agreed to retain an independent distribution consultant to assist in developing a plan for distribution of all disgorgement and civil penalties ordered by the SEC in accordance with various undertakings detailed at www.sec.gov/litigation/admin/ia-2451.pdf. Ameriprise Financial and its affiliates have cooperated with the SEC and the MDOC in these legal proceedings, and have made regular reports to the Funds' Boards of Trustees.
Ameriprise Financial and certain of its affiliates have historically been involved in a number of legal, arbitration and regulatory proceedings, including routine litigation, class actions, and governmental actions, concerning matters arising in connection with the conduct of their business activities. Ameriprise Financial believes that the Funds are not currently the subject of, and that neither Ameriprise Financial nor any of its affiliates are the subject of, any pending legal, arbitration or regulatory proceedings that are likely to have a material adverse effect on the Funds or the ability of Ameriprise Financial or its affiliates to perform under their contracts with the Funds. Ameriprise Financial is required to make quarterly (10-Q), annual (10-K) and, as necessary, 8-K filings with the Securities and Exchange Commission on legal and regulatory matters that relate to Ameriprise Financial and its affiliates. Copies of these filings may be obtained by accessing the SEC website at www.sec.gov.
There can be no assurance that these matters, or the adverse publicity associated with them, will not result in increased fund redemptions, reduced sale of fund shares or other adverse consequences to the Funds. Further, although we believe proceedings are not likely to have a material adverse effect on the Funds or the ability of Ameriprise Financial or its affiliates to perform under their contracts with the Funds, these proceedings are subject to uncertainties and, as such, we are unable to estimate the possible loss or range of loss that may result. An adverse outcome in one or more of these proceedings could result in adverse judgments, settlements, fines, penalties or other relief that could have a material adverse effect on the consolidated
financial condition or results of operations of Ameriprise Financial.
Annual Report 2015
31
COLUMBIA MARSICO 21ST CENTURY FUND
REPORT OF INDEPENDENT REGISTERED PUBLIC ACCOUNTING FIRM
To the Trustees of Columbia Funds Series Trust and the Shareholders of
Columbia Marsico 21st Century Fund
In our opinion, the accompanying statement of assets and liabilities, including the portfolio of investments, and the related statements of operations and of changes in net assets and the financial highlights present fairly, in all material respects, the financial position of Columbia Marsico 21st Century Fund (the "Fund", a series of Columbia Funds Series Trust) at February 28, 2015, and the results of its operations, the changes in its net assets and the financial highlights for each of the periods indicated, in conformity with accounting principles generally accepted in the United States of America. These financial statements and financial highlights (hereafter referred to as "financial statements") are the responsibility of the Fund's management; our responsibility is to express an opinion on these financial statements based on our audits. We conducted our audits of these financial statements in accordance with the standards of the Public Company Accounting Oversight Board (United States). Those standards require that we plan and perform the audit to obtain reasonable assurance about whether the financial statements are free of material misstatement. An audit includes examining, on a test basis, evidence supporting the amounts and disclosures in the financial statements, assessing the accounting principles used and significant estimates made by management, and evaluating the overall financial statement presentation. We believe that our audits, which included confirmation of securities at February 28, 2015 by correspondence with the custodian, brokers and transfer agent, and the application of alternative auditing procedures where such confirmations had not been received, provide a reasonable basis for our opinion.
PricewaterhouseCoopers LLP
Minneapolis, Minnesota
April 21, 2015
Annual Report 2015
32
COLUMBIA MARSICO 21ST CENTURY FUND
Shareholders elect the Board that oversees the Funds' operations. The Board appoints officers who are responsible for day-to-day business decisions based on policies set by the Board. The following table provides basic biographical information about the Funds' Board members, including their principal occupations during the past five years, although specific titles for individuals may have varied over the period. Under current Board policy, members may serve through the end of the calendar year in which he or she reaches either the mandatory retirement age established by the Board or the fifteenth anniversary of the first Board meeting they attended as a member of the Board.
Independent Trustees
Name,
Address,
Year of Birth | | Position Held With
Funds and Length of
Service | | Principal Occupation(s)
During Past Five Years
and Other Relevant
Professional Experience | | Number of
Funds in the
Fund Family
Overseen by
Board Member | | Other Present or Past
Directorships/
Trusteeships
(Within Past 5 Years) | |
Kathleen Blatz
901 S. Marquette Ave.
Minneapolis, MN 55402
1954 | | Board member since 1/06 for RiverSource Funds and since 6/11 for Nations Funds | | Attorney; specializing in arbitration and mediation; Chief Justice, Minnesota Supreme Court, 1998-2006; Associate Justice, Minnesota Supreme Court, 1996-1998; Fourth Judicial District Court Judge, Hennepin Country, 1994-1996; Attorney in private practice and public service, 1984-1993; State Representative, Minnesota House of Representatives, 1979-1993, which included service on the Tax and Financial Institutions and Insurance Committees | | | 127 | | | Trustee, BlueCross BlueShield of Minnesota (Chair of the Business Development Committee) since 2009; Chair of the Robina Foundation since August 2013 | |
Edward J. Boudreau, Jr.
901 S. Marquette Ave.
Minneapolis, MN 55402
1944 | | Board member since 6/11 for RiverSource Funds and since 1/05 for Nations Funds | | Managing Director, E.J. Boudreau & Associates (consulting) since 2000; FINRA Industry Arbitrator, 2002-present; Chairman and Chief Executive Officer, John Hancock Funds (asset management), Chairman and Interested Trustee for open-end and closed-end funds offered by John Hancock, 1989-2000; John Hancock Life Insurance Company, including SVP and Treasurer and SVP Information Technology, 1968-1988 | | | 125 | | | Former Trustee, BofA Funds Series Trust (11 funds), 2005-2011; Trustee, Boston Museum of Science (Chair of Finance Committee), 1985-2013 | |
Pamela G. Carlton
901 S. Marquette Ave.
Minneapolis, MN 55402
1954 | | Board member since 7/07 for RiverSource Funds and since 6/11 for Nations Funds | | President, Springboard — Partners in Cross Cultural Leadership (consulting company) since 2003; Managing Director of US Equity Research, JP Morgan Chase, 1999-2003; Director of US Equity Research, Chase Asset Management, 1996- 1999; Co-Director Latin America Research, 1993-1996, COO Global Research, 1992-1996, Co-Director of US Research, 1991-1992, Investment Banker, Morgan Stanley, 1982-1991 | | | 127 | | | None | |
Annual Report 2015
33
COLUMBIA MARSICO 21ST CENTURY FUND
TRUSTEES AND OFFICERS (continued)
Independent Trustees (continued)
Name,
Address,
Year of Birth | | Position Held With
Funds and Length of
Service | | Principal Occupation(s)
During Past Five Years
and Other Relevant
Professional Experience | | Number of
Funds in the
Fund Family
Overseen by
Board Member | | Other Present or Past
Directorships/
Trusteeships
(Within Past 5 Years) | |
William P. Carmichael
901 S. Marquette Ave.
Minneapolis, MN 55402
1943 | | Chair of the Board since 1/14, Board member since 6/11 for RiverSource Funds and since 2003 for Nations Funds | | Retired; Co-founder, The Succession Fund (provides exit strategies to owners of privately held companies) 1998-2007; Adjunct Professor of Finances, Kelley School of Business, Indiana University, 1993-2007; Senior Vice President, Sara Lee Corporation, 1991-1993; Senior Vice President and Chief Financial Officer, Beatrice Foods Company, 1984-1990; Vice President, Esmark, Inc, 1973-1984.; Associate, Price Waterhouse, 1968-1972 | | | 127 | | | Director, Cobra Electronics Corporation (electronic equipment manufacturer), 1994-August 2014; The Finish Line (athletic shoes and apparel) since July 2003; Director, International Textile Corp. since 2012; former Director, McMoRan Exploration Company (oil and gas exploration and development) 2010-2013; former Trustee, BofA Funds Series Trust (11 funds) 2009-2011; Director, Spectrum Brands, Inc. (consumer products), 2002-2009; Director, Simmons Company (bedding), 2004-2010 | |
Patricia M. Flynn
901 S. Marquette Ave.
Minneapolis, MN 55402
1950 | | Board member since 11/04 for RiverSource Funds and since 6/11 for Nations Funds | | Trustee Professor of Economics and Management, Bentley University since 1976 (also teaches and conducts research on corporate governance); Dean, McCallum Graduate School of Business, Bentley University, 1992-2002 | | | 127 | | | Trustee, MA Taxpayers Foundation since 1997; Board of Governors, Innovation Institute, MA Technology Collaborative since 2010 | |
William A. Hawkins
901 S. Marquette Ave.
Minneapolis, MN 55402
1942 | | Board member since 6/11 for RiverSource Funds and since 1/05 for Nations Funds | | Managing Director, Overton Partners (financial consulting), since August 2010; President and Chief Executive Officer, California General Bank, N.A., January 2008-August 2010; Operation Hope, COO, 2004-2007; IndyMac Bancorp, President, CBG, 1999-2003; American General Bank, President, 1997-1999; Griffin Financial Services, CEO, 1981-1997; The Griffin Funds, CEO, 1992-1998 | | | 125 | | | Trustee, BofA Funds Series Trust (11 funds) | |
R. Glenn Hilliard
901 S. Marquette Ave.
Minneapolis, MN 55402
1943 | | Board member since 6/11 for RiverSource Funds and since 1/05 for Nations Funds | | Chairman and Chief Executive Officer, Hilliard Group LLC (investing and consulting) since April 2003; Non-Executive Director & Chairman, CNO Financial Group, Inc. (insurance), September 2003-May 2011 | | | 125 | | | Chairman, BofA Funds Series Trust (11 funds); former Director, CNO Financial Group, Inc. (insurance) 2003-2011 | |
Annual Report 2015
34
COLUMBIA MARSICO 21ST CENTURY FUND
TRUSTEES AND OFFICERS (continued)
Independent Trustees (continued)
Name,
Address,
Year of Birth | | Position Held With
Funds and Length of
Service | | Principal Occupation(s)
During Past Five Years
and Other Relevant
Professional Experience | | Number of
Funds in the
Fund Family
Overseen by
Board Member | | Other Present or Past
Directorships/
Trusteeships
(Within Past 5 Years) | |
Catherine James Paglia
901 S. Marquette Ave.
Minneapolis, MN 55402
1952 | | Board member since 11/04 for RiverSource Funds and since 6/11 for Nations Funds | | Director, Enterprise Asset Management, Inc. (private real estate and asset management company) since September 1998; Managing Director and Partner, Interlaken Capital, Inc., 1989-1997; Managing Director, Morgan Stanley, 1982-1989; Vice President, Investment Banking, 1980-1982, Associate, Investment Banking, 1976-1980, Dean Witter Reynolds, Inc. | | | 127 | | | Director, Valmont Industries, Inc. (irrigation systems manufacturer) since 2012; Trustee, Carleton College (on the Investment Committee); Trustee, Carnegie Endowment for International Peace (on the Investment Committee) | |
Leroy C. Richie
901 S. Marquette Ave.
Minneapolis, MN 55402
1941 | | Board member since 2000 for Seligman Funds, since 11/08 for RiverSource Funds and since 6/11 for Nations Funds | | Counsel, Lewis & Munday, P.C. (law firm) since 2004; Vice President and General Counsel, Automotive Legal Affairs, Chrysler Corporation, 1993-1997 | | | 127 | | | Lead Outside Director, Digital Ally, Inc. (digital imaging) since September 2005; Director, Infinity, Inc. (oil and gas exploration and production) since 1994; Director, OGE Energy Corp. (energy and energy services) since November 2007-2014 | |
Minor M. Shaw
901 S. Marquette Ave.
Minneapolis, MN 55402
1947 | | Board member since 6/11 for RiverSource Funds and since 2003 for Nations Funds | | President, Micco LLC (private investments) since 2011; President, Micco Corp. (family investment business) 1998-2011 | | | 125 | | | Director, Piedmont Natural Gas; Director, BlueCross BlueShield of South Carolina since April 2008; Chair of the Duke Endowment; Director, National Association of Corporate Directors, Carolinas Chapter, since 2013; Chair of Greenville-Spartanburg Airport Commission; former Trustee, BofA Funds Series Trust (11 funds), 2003-2011 | |
Alison Taunton-Rigby
901 S. Marquette Ave.
Minneapolis, MN 55402
1944 | | Board member since 11/02 for RiverSource Funds and since 6/11 for Nations Funds | | Managing Director, Forester Biotech (consulting) since 2001; Chief Executive Officer and Director, RiboNovix, Inc., (biotechnology) 2003-2010; President and Chief Executive Officer of CMT Inc., 2001-2003; Aquila Biopharmaceuticals Inc., 1996-2000; Cambridge Biotech Corporation, 1995-1996, Mitotix Inc., 1993-1994 | | | 127 | | | Director, Healthways, Inc. (health and well-being solutions) since 2005; Director, ICI Mutual Insurance Company, RRG since 2011; Director, Abt Associates (government contractor) since 2001; Director, Boston Children's Hospital since 2002 | |
Annual Report 2015
35
COLUMBIA MARSICO 21ST CENTURY FUND
TRUSTEES AND OFFICERS (continued)
Interested Trustee Not Affiliated with Investment Manager*
Name,
Address,
Year of Birth | | Position Held With
Funds and Length of
Service | | Principal Occupation
During Past Five Years | | Number of
Funds in the
Fund Family
Overseen by
Board Member | | Other Present or Past
Directorships/
Trusteeships
(Within Past 5 Years) | |
Anthony M. Santomero
901 S. Marquette Ave.
Minneapolis, MN 55402
1946 | | Board member since 6/11 for RiverSource Funds and since 1/08 for Nations Funds | | Richard K. Mellon Professor Emeritus of Finance, The Wharton School, University of Pennsylvania, since 2002; Senior Advisor, McKinsey & Company (consulting), 2006-2008; President, Federal Reserve Bank of Philadelphia, 2000-2006, Professor of Finance, The Wharton School, University of Pennsylvania, 1972-2002 | | | 125 | | | Director, Renaissance Reinsurance Ltd. since May 2008; Trustee, Penn Mutual Life Insurance Company since March 2008; Director, Citigroup Inc. since 2009; Director, Citibank, N.A. since 2009; former Trustee, BofA Funds Series Trust (11 funds), 2008-2011 | |
* Dr. Santomero is not an affiliated person of the Investment Manager or Ameriprise Financial. However, he is currently deemed by the Funds to be an "interested person" (as defined in the 1940 Act) of the Funds because he serves as a Director of Citigroup Inc. and Citibank, N.A., companies that may directly or through subsidiaries and affiliates engage from time-to-time in brokerage execution, principal transactions and lending relationships with the Funds or accounts advised/managed by the Investment Manager.
Annual Report 2015
36
COLUMBIA MARSICO 21ST CENTURY FUND
TRUSTEES AND OFFICERS (continued)
Interested Trustee Affiliated with Investment Manager*
Name,
Address,
Year of Birth | | Position Held With
Funds and Length of
Service | | Principal Occupation
During Past Five Years | | Number of
Funds in the
Fund Family
Overseen by
Board Member | | Other Present or Past
Directorships/
Trusteeships
(Within Past 5 Years) | |
William F. Truscott
53600 Ameriprise
Financial Center
Minneapolis, MN 55474
1960 | | Board member since 11/01 for RiverSource Funds and since 6/11 for Nations Funds; Senior Vice President since 2002 for RiverSource Funds and since 5/10 for Nations Funds | | Chairman of the Board and President, Columbia Management Investment Advisers, LLC since May 2010 and February 2012, respectively (previously President and Chief Investment Officer, 2001-April 2010); Chief Executive Officer, Global Asset Management, Ameriprise Financial, Inc. since September 2012 (previously Chief Executive Officer, U.S. Asset Management & President, Annuities, May 2010-September 2012 and President — U.S. Asset Management and Chief Investment Officer, 2005-April 2010); Director and Chief Executive Officer, Columbia Management Investment Distributors, Inc. since May 2010 and February 2012, respectively (previously Chairman of the Board and Chief Executive Officer, 2006-April 2010); Chairman of the Board and Chief Executive Officer, RiverSource Distributors, Inc. since 2006; Director, Threadneedle Asset Management Holdings, SARL since 2014; President and Chief Executive Officer, Ameriprise Certificate Company, 2006-August 2012 | | | 186 | | | Former Director, Ameriprise Certificate Company, 2006-January 2013 | |
* Interested person (as defined under the 1940 Act) by reason of being an officer, director, security holder and/or employee of the Investment Manager or Ameriprise Financial.
The Statement of Additional Information has additional information about the Fund's Board members and is available, without charge, upon request by calling 800.345.6611; contacting your financial intermediary or visiting columbiathreadneedle.com/us.
Annual Report 2015
37
COLUMBIA MARSICO 21ST CENTURY FUND
TRUSTEES AND OFFICERS (continued)
The Board has appointed officers who are responsible for day-to-day business decisions based on policies it has established. The officers serve at the pleasure of the Board. In addition to Mr. Truscott, who is Senior Vice President, the Funds' other officers are:
Fund Officers
Name,
Address and
Year of Birth | | Position and Year
First Appointed to
Position for any Fund
in the Columbia
Funds Complex or a
Predecessor Thereof | | Principal Occupation(s) During Past Five Years | |
Christopher O. Petersen
5228 Ameriprise
Financial Center
Minneapolis, MN 55474
Born 1970 | | President and Principal Executive Officer (2015) | | Vice President and Lead Chief Counsel, Ameriprise Financial, Inc. since January 2015 (previously, Vice President and Chief Counsel January 2010-December 2014; and Vice President and Group Counsel or Counsel 2004-January 2010); officer of Columbia Funds and affiliated funds since 2007. | |
Michael G. Clarke
225 Franklin Street
Boston, MA 02110
Born 1969 | | Treasurer (2011) and Chief Financial Officer (2009) | | Vice President — Mutual Fund Administration, Columbia Management Investment Advisers, LLC, since May 2010; Managing Director of Fund Administration, Columbia Management Advisors, LLC, September 2004-April 2010; senior officer of Columbia Funds and affiliated funds since 2002. | |
Paul B. Goucher
100 Park Avenue
New York, NY 10017
Born 1968 | | Senior Vice President (2011), Chief Legal Officer (2015) and Assistant Secretary (2008) | | Vice President and Lead Chief Counsel, Ameriprise Financial, Inc. since November 2008 and January 2013, respectively (previously Chief Counsel, January 2010-January 2013 and Group Counsel, November 2008-January 2010). | |
Thomas P. McGuire
225 Franklin Street
Boston, MA 02110
Born 1972 | | Vice President and Chief Compliance Officer (2012) | | Vice President — Asset Management Compliance, Ameriprise Financial, Inc., since May 2010; Chief Compliance Officer, Ameriprise Certificate Company since September 2010; Compliance Executive, Bank of America, 2005-April 2010. | |
Colin Moore
225 Franklin Street
Boston, MA 02110
Born 1958 | | Senior Vice President (2010) | | Executive Vice President and Global Chief Investment Officer, Ameriprise Financial, Inc., since July 2013; Director and Global Chief Investment Officer, Columbia Management Investment Advisers, LLC since May 2010; Manager, Managing Director and Chief Investment Officer, Columbia Management Advisors, LLC, 2007-April 2010. | |
Michael E. DeFao
225 Franklin Street
Boston, MA 02110
Born 1968 | | Vice President (2011) and Assistant Secretary (2010) | | Vice President and Chief Counsel, Ameriprise Financial, Inc. since May 2010; Associate General Counsel, Bank of America, 2005-April 2010. | |
Joseph F. DiMaria
225 Franklin Street
Boston, MA 02110
Born 1968 | | Vice President (2011), Assistant Treasurer (2012) and Chief Accounting Officer (2008) | | Vice President — Mutual Fund Treasurer, Columbia Management Investment Advisers, LLC since May 2010; Director of Fund Administration, Columbia Management Advisors, LLC, 2006-April 2010. | |
Amy Johnson
5228 Ameriprise
Financial Center
Minneapolis, MN 55474
Born 1965 | | Vice President (2006) | | Managing Director and Chief Operating Officer, Columbia Management Investment Advisers, LLC since May 2010 (previously Chief Administrative Officer, 2009-April 2010, and Vice President — Asset Management and Trust Company Services, 2006-2009). | |
Lyn Kephart-Strong
5228 Ameriprise
Financial Center
Minneapolis, MN 55474
Born 1960 | | Vice President (2015) | | President, Columbia Management Investment Services Corp. since October 2014; Vice President & Resolution Officer, Ameriprise Trust Company since August 2009; President, RiverSource Service Corporation 2004-2010. | |
Ryan C. Larrenaga
225 Franklin Street
Boston, MA 02110
Born 1970 | | Vice President and Secretary (2015) | | Vice President and Group Counsel, Ameriprise Financial, Inc. since August 2011 (previously, Counsel from May 2010 to August 2011); Assistant General Counsel, Bank of America, 2005-April 2010; officer of Columbia Funds and affiliated funds since 2005. | |
Annual Report 2015
38
COLUMBIA MARSICO 21ST CENTURY FUND
IMPORTANT INFORMATION ABOUT THIS REPORT
Each fund mails one shareholder report to each shareholder address. If you would like more than one report, please call shareholder services at 800.345.6611 and additional reports will be sent to you.
The policy of the Board is to vote the proxies of the companies in which each fund holds investments consistent with the procedures as stated in the Statement of Additional Information (SAI). You may obtain a copy of the SAI without charge by calling 800.345.6611; contacting your financial intermediary; visiting columbiathreadneedle.com/us; or searching the website of the Securities and Exchange Commission (SEC) at sec.gov. Information regarding how each fund voted proxies relating to portfolio securities is filed with the SEC by August 31st for the most recent 12-month period ending June 30th of that year, and is available without charge by visiting columbiathreadneedle.com/us; or searching the website of the SEC at sec.gov.
Each fund files a complete schedule of portfolio holdings with the SEC for the first and third quarters of each fiscal year on Form N-Q. Each fund's Form N-Q is available on the SEC's website at sec.gov and may be reviewed and copied at the SEC's Public Reference Room in Washington, D.C. Information on the operation of the Public Reference Room may be obtained by calling 800.SEC.0330. Each fund's complete schedule of portfolio holdings, as filed on Form N-Q, can also be obtained without charge, upon request, by calling 800.345.6611.
Annual Report 2015
39
Columbia Marsico 21st Century Fund
P.O. Box 8081
Boston, MA 02266-8081

This information is for use with concurrent or prior delivery of a fund prospectus. Please read and consider the investment objectives, risks, charges and expenses for any fund carefully before investing. For a prospectus and summary prospectus, which contains this and other important information about the Fund, go to columbiathreadneedle.com/us. The Fund is distributed by Columbia Management Investment Distributors, Inc., member FINRA, and managed by Columbia Management Investment Advisers, LLC.
Columbia Threadneedle Investments (Columbia Threadneedle) is the global brand name of the Columbia and Threadneedle group of companies.
All rights reserved. Columbia Management Investment Distributors, Inc., 225 Franklin Street, Boston, MA 02110-2804
© 2015 Columbia Management Investment Advisers, LLC.
columbiathreadneedle.com/us
ANN184_02_E01_(04/15)

ANNUAL REPORT
February 28, 2015

COLUMBIA MARSICO FOCUSED EQUITIES FUND

ABOUT COLUMBIA THREADNEEDLE INVESTMENTS
Columbia Threadneedle Investments is a leading global asset management group that provides a broad range of actively managed investment strategies and solutions for individual, institutional and corporate clients around the world.
With more than 2,000 people, including over 450 investment professionals based in North America, Europe and Asia, we manage $506 billion* of assets across developed and emerging market equities, fixed income, asset allocation solutions and alternatives. We are the 11th largest manager of long-term mutual fund assets in the U.S.** and the 5th largest manager of retail funds in the U.K.***
Our priority is the investment success of our clients. We aim to deliver the investment outcomes they expect through an investment approach that is team-based, performance-driven and risk-aware. Our culture is dynamic and interactive. By sharing our insights across asset classes and geographies, we generate richer perspectives on global, regional and local investment landscapes. The ability to exchange and debate investment ideas in a collaborative environment enriches our teams' investment processes. More importantly, it results in better informed investment decisions for our clients.
Columbia funds are distributed by Columbia Management Investment Distributors, Inc., member FINRA, and managed by Columbia Management Investment Advisers, LLC.
Columbia Threadneedle Investments (Columbia Threadneedle) is the global brand name of the Columbia and Threadneedle group of companies.
* In U.S. dollars as of December 31, 2014. Source: Ameriprise Q4 Earnings Release. Includes all assets managed by entities in the Columbia and Threadneedle groups of companies. Contact us for more current data.
** Source: ICI as of December 31, 2014 for Columbia Management Investment Advisers, LLC.
*** Source: Investment Association as of December 2014 for Threadneedle Asset Management Limited.
© 2015 Columbia Management Investment Advisers, LLC. All rights reserved.
Not part of the shareholder report
Get the market insight you need from our investment experts
Connect with Columbia Threadneedle Investments
Investor insight
Find economic and market commentary, investment videos, white papers, mutual fund commentary and more at columbiathreadneedle.com/us.
Columbia Threadneedle Investor Newsletter (e-newsletter)
Read our award-winning* shareholder newsletter. Our quarterly newsletter is available online and provides timely and relevant content about economic trends, fund news, service enhancements and changes. Sign up to receive the newsletter electronically at columbiathreadneedle.com/
us/newsletter.
Investment videos
Get analysis of current events and trends that may affect your investments. Visit our online video library to watch and discover what our thought leaders are saying about the financial markets and economy.
Social media
We offer you multiple ways to access our market commentary and investment insights.
n Perspectives blog at columbiathreadneedle.com/us
Read timely posts by our investment team, including our chief investment officer, chief economist and portfolio managers.
n twitter.com/CTinvest_US
Follow us on Twitter for quick, up-to-the-minute comments on market news and more.
n youtube.com/CTinvestUS
View our commentaries on the economy, markets and current investment opportunities.
n linkedin.com/company/columbia-threadneedle-investments-us
Connect with us on LinkedIn for updates from our thought leaders.
*Columbia Threadneedle Investor Newsletter was awarded top honors in the Mutual Fund Education Alliance STAR Awards competition for excellence in mutual fund marketing and communications in 2011, 2012 and 2013. Materials in the competition were evaluated on educational value, message comprehension, effective design and objectives.
Not part of the shareholder report
 Dear Shareholder,
In a world that is changing faster than ever before, investors want asset managers who offer a global perspective while generating strong and sustainable returns. To that end, Columbia Management, in conjunction with its U.K.-based affiliate, Threadneedle Investments, has rebranded to Columbia Threadneedle Investments. The new global brand represents the combined capabilities, resources and reach of the global group, offering investors access to the best of both firms.
With a presence in 18 countries and more than 450 investment professionals*, our collective perspective and world view as Columbia Threadneedle Investments gives us deeper insight into what might affect the real-life financial outcomes clients are seeking. Putting our views into a global context enables us to build richer perspectives and create the right solutions, and provides us with enhanced capabilities to deliver consistent investment performance, which may ultimately lead to better investor outcomes.
As a result of the rebrand, you will begin to see our new logo and colors reflected in printed materials, such as this shareholder report, as well as on our new website — columbiathreadneedle.com/us. We encourage you to visit us online and view a new video on the "About Us" tab that speaks to the strength of the firm.
While we are introducing a new brand, in many ways, the investment company you know well has not changed. The following remain in effect:
n Fund and strategy names
n Established investment teams, philosophies and processes
n Account services, features, servicing phone numbers and mailing addresses
n Columbia Management Investment Distributors as distributor and Columbia Management Investment Advisers as investment adviser
We recognize that the money we manage represents the hard work and savings of people like you, and that everyone has different ambitions and different definitions of success. Investors have varying goals — funding their children's education, enjoying their retirement, putting money aside for unexpected events, and more. Whatever your ambitions, we believe our wide range of investment products and solutions can help give you confidence that you will reach your goals.
The world is constantly changing, but our priority remains the same: to help you secure your finances, meet your goals and achieve success. Thank you for your continued investment with us. Our service representatives are available at 800.345.6611 to help with any questions.
Sincerely,

Christopher O. Petersen
President, Columbia Funds
Investors should consider the investment objectives, risks, charges and expenses of a mutual fund carefully before investing. For a free prospectus and summary prospectus, which contains this and other important information about a fund, visit columbiathreadneedle.com/us. The prospectus should be read carefully before investing.
* Source: Ameriprise as of December 1, 2014
Columbia Funds are distributed by Columbia Management Investment Distributors, Inc., member FINRA, and managed by Columbia Management Investment Advisers, LLC.
© 2015 Columbia Management Investment Advisers, LLC. All rights reserved.
COLUMBIA MARSICO FOCUSED EQUITIES FUND
Performance Overview | | | 2 | | |
Manager Discussion of Fund Performance | | | 4 | | |
Understanding Your Fund's Expenses | | | 7 | | |
Portfolio of Investments | | | 8 | | |
Statement of Assets and Liabilities | | | 12 | | |
Statement of Operations | | | 14 | | |
Statement of Changes in Net Assets | | | 15 | | |
Financial Highlights | | | 17 | | |
Notes to Financial Statements | | | 24 | | |
Report of Independent Registered
Public Accounting Firm | | | 31 | | |
Federal Income Tax Information | | | 32 | | |
Trustees and Officers | | | 33 | | |
Important Information About This Report | | | 39 | | |
Fund Investment Manager
Columbia Management Investment
Advisers, LLC
225 Franklin Street
Boston, MA 02110
Fund Distributor
Columbia Management Investment
Distributors, Inc.
225 Franklin Street
Boston, MA 02110
Fund Transfer Agent
Columbia Management Investment
Services Corp.
P.O. Box 8081
Boston, MA 02266-8081
For more information about any of the funds, please visit columbiathreadneedle.com/us or call 800.345.6611. Customer Service Representatives are available to answer your questions Monday through Friday from 8 a.m. to 7 p.m. Eastern time.
The views expressed in this report reflect the current views of the respective parties. These views are not guarantees of future performance and involve certain risks, uncertainties and assumptions that are difficult to predict, so actual outcomes and results may differ significantly from the views expressed. These views are subject to change at any time based upon economic, market or other conditions and the respective parties disclaim any responsibility to update such views. These views may not be relied on as investment advice and, because investment decisions for a Columbia fund are based on numerous factors, may not be relied on as an indication of trading intent on behalf of any particular Columbia fund. References to specific securities should not be construed as a recommendation or investment advice.
COLUMBIA MARSICO FOCUSED EQUITIES FUND
Performance Summary
n Columbia Marsico Focused Equities Fund (the Fund) Class A shares returned 12.29% excluding sales charges for the 12-month period that ended February 28, 2015.
n The Fund underperformed its benchmark, the S&P 500 Index, which returned 15.51% during the same time period.
n Stock selection in the consumer discretionary, information technology and financials sectors detracted from Fund performance, relative to the benchmark, during the period.
Average Annual Total Returns (%) (for period ended February 28, 2015)
| | | Inception | | 1 Year | | 5 Years | | 10 Years | |
Class A | | 12/31/97 | | | | | | | | | | | | | |
Excluding sales charges | | | | | | | 12.29 | | | | 15.87 | | | | 8.44 | | |
Including sales charges | | | | | | | 5.85 | | | | 14.50 | | | | 7.80 | | |
Class B | | 12/31/97 | | | | | | | | | | | | | |
Excluding sales charges | | | | | | | 11.48 | | | | 15.01 | | | | 7.63 | | |
Including sales charges | | | | | | | 6.80 | | | | 14.79 | | | | 7.63 | | |
Class C | | 12/31/97 | | | | | | | | | | | | | |
Excluding sales charges | | | | | | | 11.47 | | | | 15.00 | | | | 7.63 | | |
Including sales charges | | | | | | | 10.53 | | | | 15.00 | | | | 7.63 | | |
Class I* | | 09/27/10 | | | 12.91 | | | | 16.43 | | | | 8.70 | | |
Class R4* | | 11/08/12 | | | 12.64 | | | | 16.01 | | | | 8.50 | | |
Class R5* | | 12/11/13 | | | 12.77 | | | | 15.99 | | | | 8.49 | | |
Class Z | | 12/31/97 | | | 12.59 | | | | 16.16 | | | | 8.71 | | |
S&P 500 Index | | | | | | | 15.51 | | | | 16.18 | | | | 7.99 | | |
Returns for Class A are shown with and without the maximum initial sales charge of 5.75%. Returns for Class B are shown with and without the applicable contingent deferred sales charge (CDSC) of 5.00% in the first year, declining to 1.00% in the sixth year and eliminated thereafter. Returns for Class C are shown with and without the 1.00% CDSC for the first year only. The Fund's other classes are not subject to sales charges and have limited eligibility. Please see the Fund's prospectus for details. Performance for different share classes will vary based on differences in sales charges and fees associated with each class. All results shown assume reinvestment of distributions during the period. Returns do not reflect the deduction of taxes that a shareholder may pay on Fund distributions or on the redemption of Fund shares. Performance results reflect the effect of any fee waivers or reimbursements of Fund expenses by Columbia Management Investment Advisers, LLC and/or any of its affiliates. Absent these fee waivers or expense reimbursement arrangements, performance results would have been lower.
The performance information shown represents past performance and is not a guarantee of future results. The investment return and principal value of your investment will fluctuate so that your shares, when redeemed, may be worth more or less than their original cost. Current performance may be lower or higher than the performance information shown. You may obtain performance information current to the most recent month-end by contacting your financial intermediary, visiting columbiathreadneedle.com/us or calling 800.345.6611.
*The returns shown for periods prior to the share class inception date (including returns for the Life of the Fund, if shown, which are since Fund inception) include the returns of the Fund's oldest share class. Since the Fund launched more than one class of shares at its inception, Class A shares were used. These returns are adjusted to reflect any higher class-related operating expenses of the newer share classes, as applicable. Please visit columbiathreadneedle.com/us/investment-products/mutual-funds/appended-performance for more information.
The S&P 500 Index, an unmanaged index, measures the performance of 500 widely held, large-capitalization U.S. stocks and is frequently used as a general measure of market performance.
Indices are not available for investment, are not professionally managed and do not reflect sales charges, fees, brokerage commissions, taxes or other expenses of investing. Securities in the Fund may not match those in an index.
Annual Report 2015
2
COLUMBIA MARSICO FOCUSED EQUITIES FUND
PERFORMANCE OVERVIEW (continued)
Performance of a Hypothetical $10,000 Investment (March 1, 2005 – February 28, 2015)
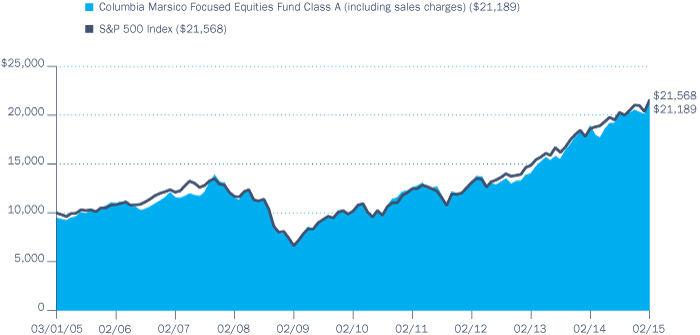
The chart above shows the change in value of a hypothetical $10,000 investment in Class A shares of Columbia Marsico Focused Equities Fund during the stated time period, and does not reflect the deduction of taxes that a shareholder may pay on Fund distributions or on the redemption of Fund shares.
Annual Report 2015
3
COLUMBIA MARSICO FOCUSED EQUITIES FUND
MANAGER DISCUSSION OF FUND PERFORMANCE
Portfolio Management
Marsico Capital Management, LLC
Thomas Marsico
Coralie Witter, CFA
Morningstar Style BoxTM

The Morningstar Style Box(TM) is based on a fund's portfolio holdings. For equity funds, the vertical axis shows the market capitalization of the stocks owned, and the horizontal axis shows investment style (value, blend, or growth). Information shown is based on the most recent data provided by Morningstar.
© 2015 Morningstar, Inc. All rights reserved. The Morningstar information contained herein: (1) is proprietary to Morningstar and/or its content providers; (2) may not be copied or distributed; and (3) is not warranted to be accurate, complete or timely. Neither Morningstar nor its content providers are responsible for any damages or losses arising from any use of this information.
Top Ten Holdings (%)
(at February 28, 2015) | |
Facebook, Inc., Class A | | | 6.5 | | |
Biogen Idec, Inc. | | | 6.2 | | |
Apple, Inc. | | | 6.1 | | |
Visa, Inc., Class A | | | 5.3 | | |
Walt Disney Co. (The) | | | 5.2 | | |
Canadian Pacific Railway Ltd. | | | 5.2 | | |
Gilead Sciences, Inc. | | | 5.1 | | |
Sherwin-Williams Co. (The) | | | 4.7 | | |
Starbucks Corp. | | | 3.9 | | |
Monsanto Co. | | | 3.8 | | |
Percentages indicated are based upon total investments (excluding Money Market Funds).
For further detail about these holdings, please refer to the section entitled "Portfolio of Investments."
Fund holdings are as of the date given, are subject to change at any time, and are not recommendations to buy or sell any security.
For the 12-month period that ended February 28, 2015, the Fund's Class A shares returned 12.29% excluding sales charges. The Fund underperformed its benchmark, the S&P 500 Index, which returned 15.51% for the same time period. Stock selection in the consumer discretionary, information technology and financials sectors detracted from performance, relative to the benchmark, during the period. Stock selection in the healthcare, materials and industrial sectors, along with an underweight relative to the benchmark to energy, contributed to Fund returns.
U.S. Equities Rose Despite Investor Concerns
U.S. stocks generally registered solid gains during the period ending February 28, 2015. These gains occurred even as investors grappled with concerns about U.S. Federal Reserve (Fed) policy, slower growth in emerging and many developed markets and the implications of lower oil prices. Crude oil prices fell sharply during the period and ended 2014 at their lowest levels since 2009. The decline stemmed in part from slowing growth in demand, stagnating economic growth in Europe and technological advances, such as more efficient motor vehicles. Increased supply was also a primary reason for falling oil prices, as fracking technologies drove petroleum supplies sharply higher in the U.S., while other countries maintained or increased production. By February 2015, dramatic declines in oil prices gave way to relative stability as prices oscillated between $48 and $54 a barrel.
The continued advance of the U.S. dollar through the period reflected impressive gains in U.S. labor markets as well as commitments by foreign central banks to extend easier monetary policy in Europe, China and Japan. Though certainly not blistering, U.S. economic strength at the end of the period could be seen in upward revisions to previous increases, which took the three-month average increase in jobs to a powerful 330,000. Strong job gains, low inflation and falling oil prices translated to hefty increases in consumer spending near the end of the period, including a 4.2% gain in the fourth quarter of 2014. This strong growth was accompanied by a remarkably benign core inflation backdrop. In the U.S. and around the globe, inflation was in sharp retreat by the end of the period, reflecting both the direct effects of falling energy costs and the echo effects of lower prices for other goods and services. The prospects for firming Fed policy continue to be debated and remain unresolved.
Portfolio Recap
Stock selection in the consumer discretionary, information technology and financials sectors was the biggest detractor from Fund performance during the year. Wynn Resorts was the largest individual detractor. A slowing economy in China and the Chinese government's efforts to crack down on corruption resulted in disappointing results from Wynn's VIP business in the Macau market. Google also detracted from returns. The company continues to be negatively affected by the continued shift to mobile devices, causing lower earnings estimates, leading to underperformance. Priceline was hurt by the continued shift toward booking on mobile devices. We sold our positions in Google and Priceline during the period.
Annual Report 2015
4
COLUMBIA MARSICO FOCUSED EQUITIES FUND
MANAGER DISCUSSION OF FUND PERFORMANCE (continued)
The Fund benefited from stock selection in the healthcare, materials and industrials sectors during the period. Alibaba Group Holding emerged as the largest individual contributor. The company's performance was strong throughout the initial public offering process, which, combined with a strong management team, led to positive investor sentiment. Paint retailer Sherwin-Williams was another top contributor, as the company benefited from acquisitions as well as higher sales volume at its stores. The Fund's position in Pacira Pharmaceuticals also contributed to performance. Pacira Pharmaceuticals' primary product is EXPAREL, a long-acting local anesthesia drug that can be used in the operating room to reduce complications, enable shortened stays and create economic value.
Portfolio Activity
We re-initiated a position in Apple following a re-fresh in its product cycle with the iPhone 6, ongoing software development, significant new additions to senior management and a continued push for more enterprise business. We do not believe Apple's shares reflect upcoming hardware, software and services innovation. We expect the iPhone to gain market share as larger screen sizes help power an acceleration in growth.
We established a position in Hospital Corporation of America (HCA), a leading provider of hospital and healthcare services based on our belief that the Affordable Care Act should have a positive impact on HCA's business as nonpayment rates from uninsured patients decline and enrollment in exchanges and Medicaid increase. We also added Nike to the portfolio. The company has a leading global brand that will benefit from a trend toward "athleisure" apparel. Nike's scale is a critical component to their ability to win big endorsements, despite being a 40-year-old brand. Nike can leverage its $30 billion revenue base to maintain and win endorsements over the competition.
We sold TJX Companies during the period. The retailer performed well while it was held in the portfolio, as TJX's value-oriented, fast-turning merchandise resonated with cash-strapped consumers coming out of the recession. We became concerned, however, about the competitive retail environment as we saw that department stores were adding in-store promotions and growing their own off-price retail outlet models. We also sold the Fund's position in Rolls Royce after the company reported weaker-than-expected fiscal-year results. Continental Resources was also sold during the period. The company is a leading energy driller and producer in the Bakken shale region primarily located in North Dakota and Montana. However, falling crude oil prices and increased supply have led to negative returns for the energy sector.
Looking Ahead
Two top-of-mind items for many investors at the end of 2014 were declining oil prices (and their commensurate effects) and central bank policies. On balance, lower oil prices improve U.S. prospects for growth and low inflation. Oil prices may slide further, but we believe they will eventually settle and perhaps climb again in the future, as low prices may slow fracking activity and tighten supply. We will continue to monitor the economic effects and geopolitical consequences of potentially extended and deeper reductions in oil prices. Also, while central banks of other
Portfolio Breakdown (%)
(at February 28, 2015) | |
Common Stocks | | | 97.8 | | |
Consumer Discretionary | | | 24.8 | | |
Consumer Staples | | | 1.8 | | |
Financials | | | 2.9 | | |
Health Care | | | 28.6 | | |
Industrials | | | 7.0 | | |
Information Technology | | | 24.4 | | |
Materials | | | 8.3 | | |
Money Market Funds | | | 2.2 | | |
Total | | | 100.0 | | |
Percentages indicated are based upon total investments. The Fund's portfolio composition is subject to change.
Investment Risks
Market risk may affect a single issuer, sector of the economy, industry or the market as a whole. Growth securities, at times, may not perform as well as value securities or the stock market in general and may be out of favor with investors. Foreign investments subject the Fund to risks, including political, economic, market, social and others within a particular country, as well as to currency instabilities and less stringent financial and accounting standards generally applicable to U.S. issuers. Risks are enhanced for emerging market issuers. Investments in a limited number of companies or sectors, subject the Fund to greater risk of loss. The Fund may invest significantly in issuers within a particular sector, which may be negatively affected by market, economic or other conditions, making the Fund more vulnerable to unfavorable developments in the sector. See the Fund's prospectus for more information on these and other risks.
Annual Report 2015
5
COLUMBIA MARSICO FOCUSED EQUITIES FUND
MANAGER DISCUSSION OF FUND PERFORMANCE (continued)
countries focus on efforts to stimulate their economies, the Fed may confront a much better than recently expected pace of economic expansion.
As always, we continue to favor investments in companies that we believe are gaining market share in large and growing markets. The Fund emphasizes investments in businesses with strong recurring revenues, strong free cash flow generation, pricing power and responsible capital allocation. In this lower growth environment, share buybacks and dividends may be material contributors to total returns.
Annual Report 2015
6
COLUMBIA MARSICO FOCUSED EQUITIES FUND
UNDERSTANDING YOUR FUND'S EXPENSES
(Unaudited)
As an investor, you incur two types of costs. There are transaction costs, which generally include sales charges on purchases and may include redemption fees. There are also ongoing costs, which generally include management fees, distribution and/or service fees, and other fund expenses. The following information is intended to help you understand your ongoing costs (in dollars) of investing in the Fund and to help you compare these costs with the ongoing costs of investing in other mutual funds.
Analyzing Your Fund's Expenses
To illustrate these ongoing costs, we have provided examples and calculated the expenses paid by investors in each share class of the Fund during the period. The actual and hypothetical information in the table is based on an initial investment of $1,000 at the beginning of the period indicated and held for the entire period. Expense information is calculated two ways and each method provides you with different information. The amount listed in the "Actual" column is calculated using the Fund's actual operating expenses and total return for the period. You may use the Actual information, together with the amount invested, to estimate the expenses that you paid over the period. Simply divide your account value by $1,000 (for example, an $8,600 account value divided by $1,000 = 8.6), then multiply the results by the expenses paid during the period under the "Actual" column. The amount listed in the "Hypothetical" column assumes a 5% annual rate of return before expenses (which is not the Fund's actual return) and then applies the Fund's actual expense ratio for the period to the hypothetical return. You should not use the hypothetical account values and expenses to estimate either your actual account balance at the end of the period or the expenses you paid during the period. See "Compare With Other Funds" below for details on how to use the hypothetical data.
Compare With Other Funds
Since all mutual funds are required to include the same hypothetical calculations about expenses in shareholder reports, you can use this information to compare the ongoing cost of investing in the Fund with other funds. To do so, compare the hypothetical example with the 5% hypothetical examples that appear in the shareholder reports of other funds. As you compare hypothetical examples of other funds, it is important to note that hypothetical examples are meant to highlight the ongoing costs of investing in a fund only and do not reflect any transaction costs, such as sales charges, or redemption or exchange fees. Therefore, the hypothetical calculations are useful in comparing ongoing costs only, and will not help you determine the relative total costs of owning different funds. If transaction costs were included in these calculations, your costs would be higher.
September 1, 2014 – February 28, 2015
| | | Account Value at the Beginning
of the Period ($) | | Account Value at the End of the
Period ($) | | Expenses Paid During the
Period ($) | | Fund's Annualized
Expense Ratio (%) | |
| | | Actual | | Hypothetical | | Actual | | Hypothetical | | Actual | | Hypothetical | | Actual | |
Class A | | | 1,000.00 | | | | 1,000.00 | | | | 1,053.40 | | | | 1,018.85 | | | | 6.25 | | | | 6.14 | | | | 1.22 | | |
Class B | | | 1,000.00 | | | | 1,000.00 | | | | 1,049.70 | | | | 1,015.11 | | | | 10.07 | | | | 9.90 | | | | 1.97 | | |
Class C | | | 1,000.00 | | | | 1,000.00 | | | | 1,049.40 | | | | 1,015.11 | | | | 10.07 | | | | 9.90 | | | | 1.97 | | |
Class I | | | 1,000.00 | | | | 1,000.00 | | | | 1,056.20 | | | | 1,021.39 | | | | 3.64 | | | | 3.58 | | | | 0.71 | | |
Class R4 | | | 1,000.00 | | | | 1,000.00 | | | | 1,054.90 | | | | 1,020.09 | | | | 4.97 | | | | 4.89 | | | | 0.97 | | |
Class R5 | | | 1,000.00 | | | | 1,000.00 | | | | 1,055.90 | | | | 1,020.84 | | | | 4.20 | | | | 4.13 | | | | 0.82 | | |
Class Z | | | 1,000.00 | | | | 1,000.00 | | | | 1,055.10 | | | | 1,020.09 | | | | 4.97 | | | | 4.89 | | | | 0.97 | | |
Expenses paid during the period are equal to the annualized expense ratio for each class as indicated above, multiplied by the average account value over the period and then multiplied by the number of days in the Fund's most recent fiscal half year and divided by 365.
Expenses do not include fees and expenses incurred indirectly by the Fund from its investment in underlying funds, including affiliated and non-affiliated pooled investment vehicles, such as mutual funds and exchange-traded funds.
Had Columbia Management Investment Advisers, LLC and/or certain of its affiliates not waived/reimbursed certain fees and expenses, account value at the end of the period would have been reduced.
Annual Report 2015
7
COLUMBIA MARSICO FOCUSED EQUITIES FUND
PORTFOLIO OF INVESTMENTS
February 28, 2015
(Percentages represent value of investments compared to net assets)
Common Stocks 96.9%
Issuer | | Shares | | Value ($) | |
CONSUMER DISCRETIONARY 24.6% | |
Automobiles 2.0% | |
Tesla Motors, Inc.(a) | | | 106,298 | | | | 21,614,634 | | |
Hotels, Restaurants & Leisure 8.2% | |
Starbucks Corp. | | | 438,858 | | | | 41,026,640 | | |
Starwood Hotels & Resorts Worldwide, Inc. | | | 335,819 | | | | 26,976,340 | | |
Wynn Resorts Ltd. | | | 154,247 | | | | 21,980,198 | | |
Total | | | | | 89,983,178 | | |
Media 7.8% | |
Comcast Corp., Class A | | | 507,293 | | | | 30,123,058 | | |
Walt Disney Co. (The) | | | 531,959 | | | | 55,366,293 | | |
Total | | | | | 85,489,351 | | |
Multiline Retail 2.9% | |
Dollar Tree, Inc.(a) | | | 390,436 | | | | 31,109,941 | | |
Textiles, Apparel & Luxury Goods 3.7% | |
Nike, Inc., Class B | | | 409,991 | | | | 39,818,326 | | |
Total Consumer Discretionary | | | | | 268,015,430 | | |
CONSUMER STAPLES 1.8% | |
Food & Staples Retailing 1.8% | |
CVS Health Corp. | | | 183,484 | | | | 19,058,483 | | |
Total Consumer Staples | | | | | 19,058,483 | | |
FINANCIALS 2.8% | |
Capital Markets 2.8% | |
Charles Schwab Corp. (The) | | | 1,055,826 | | | | 30,977,935 | | |
Total Financials | | | | | 30,977,935 | | |
HEALTH CARE 28.4% | |
Biotechnology 13.6% | |
Biogen Idec, Inc.(a) | | | 159,253 | | | | 65,228,436 | | |
Celgene Corp.(a) | | | 242,408 | | | | 29,459,844 | | |
Gilead Sciences, Inc.(a) | | | 522,733 | | | | 54,118,548 | | |
Total | | | | | 148,806,828 | | |
Health Care Providers & Services 6.7% | |
HCA Holdings, Inc.(a) | | | 511,697 | | | | 36,606,803 | | |
UnitedHealth Group, Inc. | | | 317,365 | | | | 36,062,185 | | |
Total | | | | | 72,668,988 | | |
Common Stocks (continued)
Issuer | | Shares | | Value ($) | |
Pharmaceuticals 8.1% | |
Actavis PLC(a) | | | 124,836 | | | | 36,372,217 | | |
Novartis AG, Registered Shares | | | 207,922 | | | | 21,253,473 | | |
Pacira Pharmaceuticals, Inc.(a) | | | 242,024 | | | | 27,777,095 | | |
Valeant Pharmaceuticals
International, Inc.(a) | | | 14,808 | | | | 2,924,284 | | |
Total | | | | | 88,327,069 | | |
Total Health Care | | | | | 309,802,885 | | |
INDUSTRIALS 7.0% | |
Aerospace & Defense 2.0% | |
Boeing Co. (The) | | | 143,645 | | | | 21,668,848 | | |
Road & Rail 5.0% | |
Canadian Pacific Railway Ltd. | | | 290,351 | | | | 54,475,655 | | |
Total Industrials | | | | | 76,144,503 | | |
INFORMATION TECHNOLOGY 24.1% | |
Internet Software & Services 9.9% | |
Alibaba Group Holding Ltd., ADR(a) | | | 308,296 | | | | 26,242,155 | | |
Facebook, Inc., Class A(a) | | | 871,979 | | | | 68,860,182 | | |
LinkedIn Corp., Class A(a) | | | 46,875 | | | | 12,525,000 | | |
Total | | | | | 107,627,337 | | |
IT Services 5.2% | |
Visa, Inc., Class A | | | 207,804 | | | | 56,379,303 | | |
Semiconductors & Semiconductor Equipment 3.1% | |
| ASML Holding NV | | | 320,698 | | | | 34,532,761 | | |
Technology Hardware, Storage & Peripherals 5.9% | |
Apple, Inc. | | | 503,132 | | | | 64,632,337 | | |
Total Information Technology | | | | | 263,171,738 | | |
MATERIALS 8.2% | |
Chemicals 8.2% | |
Monsanto Co. | | | 334,281 | | | | 40,257,461 | | |
Sherwin-Williams Co. (The) | | | 173,667 | | | | 49,529,828 | | |
Total | | | | | 89,787,289 | | |
Total Materials | | | | | 89,787,289 | | |
Total Common Stocks
(Cost: $712,156,207) | | | | | 1,056,958,263 | | |
The accompanying Notes to Financial Statements are an integral part of this statement.
Annual Report 2015
8
COLUMBIA MARSICO FOCUSED EQUITIES FUND
PORTFOLIO OF INVESTMENTS (continued)
February 28, 2015
Money Market Funds 2.2%
| | | Shares | | Value ($) | |
Columbia Short-Term Cash Fund,
0.118%(b)(c) | | | 23,630,450 | | | | 23,630,450 | | |
Total Money Market Funds
(Cost: $23,630,450) | | | | | 23,630,450 | | |
Total Investments
(Cost: $735,786,657) | | | | | 1,080,588,713 | | |
Other Assets & Liabilities, Net | | | | | 9,953,409 | | |
Net Assets | | | | | 1,090,542,122 | | |
Notes to Portfolio of Investments
(a) Non-income producing.
(b) The rate shown is the seven-day current annualized yield at February 28, 2015.
(c) As defined in the Investment Company Act of 1940, an affiliated company is one in which the Fund owns 5% or more of the company's outstanding voting securities, or a company which is under common ownership or control with the Fund. Holdings and transactions in these affiliated companies during the year ended February 28, 2015, are as follows:
Issuer | | Beginning
Cost ($) | | Purchase
Cost ($) | | Proceeds
From Sales ($) | | Ending
Cost ($) | | Dividends —
Affiliated
Issuers ($) | | Value ($) | |
Columbia Short-Term Cash Fund | | | 23,368,987 | | | | 516,098,862 | | | | (515,837,399 | ) | | | 23,630,450 | | | | 19,689 | | | | 23,630,450 | | |
Abbreviation Legend
ADR American Depositary Receipt
Fair Value Measurements
Generally accepted accounting principles (GAAP) require disclosure regarding the inputs and valuation techniques used to measure fair value and any changes in valuation inputs or techniques. In addition, investments shall be disclosed by major category.
The Fund categorizes its fair value measurements according to a three-level hierarchy that maximizes the use of observable inputs and minimizes the use of unobservable inputs by prioritizing that the most observable input be used when available. Observable inputs are those that market participants would use in pricing an investment based on market data obtained from sources independent of the reporting entity. Unobservable inputs are those that reflect the Fund's assumptions about the information market participants would use in pricing an investment. An investment's level within the fair value hierarchy is based on the lowest level of any input that is deemed significant to the asset or liability's fair value measurement. The input levels are not necessarily an indication of the risk or liquidity associated with investments at that level. For example, certain U.S. government securities are generally high quality and liquid, however, they are reflected as Level 2 because the inputs used to determine fair value may not always be quoted prices in an active market.
Fair value inputs are summarized in the three broad levels listed below:
> Level 1 — Valuations based on quoted prices for investments in active markets that the Fund has the ability to access at the measurement date (including NAV for open-end mutual funds). Valuation adjustments are not applied to Level 1 investments.
> Level 2 — Valuations based on other significant observable inputs (including quoted prices for similar securities, interest rates, prepayment speeds, credit risks, etc.).
> Level 3 — Valuations based on significant unobservable inputs (including the Fund's own assumptions and judgment in determining the fair value of investments).
Inputs that are used in determining fair value of an investment may include price information, credit data, volatility statistics, and other factors. These inputs can be either observable or unobservable. The availability of observable inputs can vary between investments, and is affected by
The accompanying Notes to Financial Statements are an integral part of this statement.
Annual Report 2015
9
COLUMBIA MARSICO FOCUSED EQUITIES FUND
PORTFOLIO OF INVESTMENTS (continued)
February 28, 2015
Fair Value Measurements (continued)
various factors such as the type of investment, and the volume and level of activity for that investment or similar investments in the marketplace. The inputs will be considered by the Investment Manager, along with any other relevant factors in the calculation of an investment's fair value. The Fund uses prices and inputs that are current as of the measurement date, which may include periods of market dislocations. During these periods, the availability of prices and inputs may be reduced for many investments. This condition could cause an investment to be reclassified between the various levels within the hierarchy.
Foreign equity securities actively traded in markets where there is a significant delay in the local close relative to the New York Stock Exchange (NYSE) are classified as Level 2. The values of these securities may include an adjustment to reflect the impact of significant market movements following the close of local trading, as described in Note 2 to the financial statements — Security Valuation.
Investments falling into the Level 3 category are primarily supported by quoted prices from brokers and dealers participating in the market for those investments. However, these may be classified as Level 3 investments due to lack of market transparency and corroboration to support these quoted prices. Additionally, valuation models may be used as the pricing source for any remaining investments classified as Level 3. These models may rely on one or more significant unobservable inputs and/or significant assumptions by the Investment Manager. Inputs used in valuations may include, but are not limited to, financial statement analysis, capital account balances, discount rates and estimated cash flows, and comparable company data.
Under the direction of the Fund's Board of Trustees (the Board), the Investment Manager's Valuation Committee (the Committee) is responsible for overseeing the valuation procedures approved by the Board. The Committee consists of voting and non-voting members from various groups within the Investment Manager's organization, including operations and accounting, trading and investments, compliance, risk management and legal.
The Committee meets at least monthly to review and approve valuation matters, which may include a description of specific valuation determinations, data regarding pricing information received from approved pricing vendors and brokers and the results of Board-approved valuation control policies and procedures (the Policies). The Policies address, among other things, instances when market quotations are or are not readily available, including recommendations of third party pricing vendors and a determination of appropriate pricing methodologies; events that require specific valuation determinations and assessment of fair value techniques; securities with a potential for stale pricing, including those that are illiquid, restricted, or in default; and the effectiveness of third party pricing vendors, including periodic reviews of vendors. The Committee meets more frequently, as needed, to discuss additional valuation matters, which may include the need to review back-testing results, review time-sensitive information or approve related valuation actions. The Committee reports to the Board, with members of the Committee meeting with the Board at each of its regularly scheduled meetings to discuss valuation matters and actions during the period, similar to those described earlier.
For investments categorized as Level 3, the Committee monitors information similar to that described above, which may include: (i) data specific to the issuer or comparable issuers, (ii) general market or specific sector news and (iii) quoted prices and specific or similar security transactions. The Committee considers this data and any changes from prior periods in order to assess the reasonableness of observable and unobservable inputs, any assumptions or internal models used to value those securities and changes in fair value. This data is also used to corroborate, when available, information received from approved pricing vendors and brokers. Various factors impact the frequency of monitoring this information (which may occur as often as daily). However, the Committee may determine that changes to inputs, assumptions and models are not required as a result of the monitoring procedures performed.
The accompanying Notes to Financial Statements are an integral part of this statement.
Annual Report 2015
10
COLUMBIA MARSICO FOCUSED EQUITIES FUND
PORTFOLIO OF INVESTMENTS (continued)
February 28, 2015
Fair Value Measurements (continued)
The following table is a summary of the inputs used to value the Fund's investments at February 28, 2015:
Description | | Level 1
Quoted Prices in Active
Markets for Identical
Assets ($) | | Level 2
Other Significant
Observable Inputs ($) | | Level 3
Significant
Unobservable Inputs ($) | | Total ($) | |
Equity Securities | |
Common Stocks | |
Consumer Discretionary | | | 268,015,430 | | | | — | | | | — | | | | 268,015,430 | | |
Consumer Staples | | | 19,058,483 | | | | — | | | | — | | | | 19,058,483 | | |
Financials | | | 30,977,935 | | | | — | | | | — | | | | 30,977,935 | | |
Health Care | | | 288,549,412 | | | | 21,253,473 | | | | — | | | | 309,802,885 | | |
Industrials | | | 76,144,503 | | | | — | | | | — | | | | 76,144,503 | | |
Information Technology | | | 263,171,738 | | | | — | | | | — | | | | 263,171,738 | | |
Materials | | | 89,787,289 | | | | — | | | | — | | | | 89,787,289 | | |
Total Equity Securities | | | 1,035,704,790 | | | | 21,253,473 | | | | — | | | | 1,056,958,263 | | |
Mutual Funds | |
Money Market Funds | | | 23,630,450 | | | | — | | | | — | | | | 23,630,450 | | |
Total Mutual Funds | | | 23,630,450 | | | | — | | | | — | | | | 23,630,450 | | |
Total | | | 1,059,335,240 | | | | 21,253,473 | | | | — | | | | 1,080,588,713 | | |
See the Portfolio of Investments for all investment classifications not indicated in the table.
The Fund's assets assigned to the Level 2 input category are generally valued using the market approach, in which a security's value is determined through reference to prices and information from market transactions for similar or identical assets. These assets include certain foreign securities for which a third party statistical pricing service may be employed for purposes of fair market valuation. The model utilized by such third party statistical pricing service takes into account a security's correlation to available market data including, but not limited to, intraday index, ADR, and ETF movements.
There were no transfers of financial assets between levels during the period.
The accompanying Notes to Financial Statements are an integral part of this statement.
Annual Report 2015
11
COLUMBIA MARSICO FOCUSED EQUITIES FUND
STATEMENT OF ASSETS AND LIABILITIES
February 28, 2015
Assets | |
Investments, at value | |
Unaffiliated issuers (identified cost $712,156,207) | | $ | 1,056,958,263 | | |
Affiliated issuers (identified cost $23,630,450) | | | 23,630,450 | | |
Total investments (identified cost $735,786,657) | | | 1,080,588,713 | | |
Receivable for: | |
Investments sold | | | 11,295,610 | | |
Capital shares sold | | | 335,923 | | |
Dividends | | | 380,478 | | |
Expense reimbursement due from Investment Manager | | | 1,168 | | |
Prepaid expenses | | | 2,581 | | |
Total assets | | | 1,092,604,473 | | |
Liabilities | |
Payable for: | |
Capital shares purchased | | | 1,477,401 | | |
Investment management fees | | | 20,504 | | |
Distribution and/or service fees | | | 10,216 | | |
Transfer agent fees | | | 328,907 | | |
Administration fees | | | 1,710 | | |
Compensation of board members | | | 148,596 | | |
Other expenses | | | 75,017 | | |
Total liabilities | | | 2,062,351 | | |
Net assets applicable to outstanding capital stock | | $ | 1,090,542,122 | | |
Represented by | |
Paid-in capital | | $ | 690,035,487 | | |
Excess of distributions over net investment income | | | (147,214 | ) | |
Accumulated net realized gain | | | 55,851,793 | | |
Unrealized appreciation (depreciation) on: | |
Investments | | | 344,802,056 | | |
Total — representing net assets applicable to outstanding capital stock | | $ | 1,090,542,122 | | |
The accompanying Notes to Financial Statements are an integral part of this statement.
Annual Report 2015
12
COLUMBIA MARSICO FOCUSED EQUITIES FUND
STATEMENT OF ASSETS AND LIABILITIES (continued)
February 28, 2015
Class A | |
Net assets | | $ | 543,322,501 | | |
Shares outstanding | | | 26,498,710 | | |
Net asset value per share | | $ | 20.50 | | |
Maximum offering price per share(a) | | $ | 21.75 | | |
Class B | |
Net assets | | $ | 6,310,226 | | |
Shares outstanding | | | 377,914 | | |
Net asset value per share | | $ | 16.70 | | |
Class C | |
Net assets | | $ | 227,979,119 | | |
Shares outstanding | | | 13,561,048 | | |
Net asset value per share | | $ | 16.81 | | |
Class I | |
Net assets | | $ | 2,625 | | |
Shares outstanding | | | 121 | | |
Net asset value per share(b) | | $ | 21.62 | | |
Class R4 | |
Net assets | | $ | 18,847,857 | | |
Shares outstanding | | | 861,595 | | |
Net asset value per share | | $ | 21.88 | | |
Class R5 | |
Net assets | | $ | 8,682,425 | | |
Shares outstanding | | | 395,384 | | |
Net asset value per share | | $ | 21.96 | | |
Class Z | |
Net assets | | $ | 285,397,369 | | |
Shares outstanding | | | 13,310,797 | | |
Net asset value per share | | $ | 21.44 | | |
(a) The maximum offering price per share is calculated by dividing the net asset value per share by 1.0 minus the maximum sales charge of 5.75%.
(b) Net asset value per share rounds to this amount due to fractional shares outstanding.
The accompanying Notes to Financial Statements are an integral part of this statement.
Annual Report 2015
13
COLUMBIA MARSICO FOCUSED EQUITIES FUND
STATEMENT OF OPERATIONS
Year Ended February 28, 2015
Net investment income | |
Income: | |
Dividends — unaffiliated issuers | | $ | 10,885,680 | | |
Dividends — affiliated issuers | | | 19,689 | | |
Interest | | | 92 | | |
Foreign taxes withheld | | | (220,107 | ) | |
Total income | | | 10,685,354 | | |
Expenses: | |
Investment management fees | | | 7,353,958 | | |
Distribution and/or service fees | |
Class A | | | 1,365,131 | | |
Class B | | | 80,005 | | |
Class C | | | 2,288,914 | | |
Transfer agent fees | |
Class A | | | 1,111,655 | | |
Class B | | | 16,205 | | |
Class C | | | 466,082 | | |
Class R4 | | | 33,848 | | |
Class R5 | | | 3,638 | | |
Class Z | | | 552,703 | | |
Administration fees | | | 613,569 | | |
Compensation of board members | | | 34,800 | | |
Custodian fees | | | 10,941 | | |
Printing and postage fees | | | 130,508 | | |
Registration fees | | | 102,138 | | |
Professional fees | | | 40,568 | | |
Line of credit interest expense | | | 687 | | |
Other | | | 22,138 | | |
Total expenses | | | 14,227,488 | | |
Fees waived or expenses reimbursed by Investment Manager and its affiliates | | | (53,706 | ) | |
Expense reductions | | | (2,712 | ) | |
Total net expenses | | | 14,171,070 | | |
Net investment loss | | | (3,485,716 | ) | |
Realized and unrealized gain (loss) — net | |
Net realized gain (loss) on: | |
Investments | | | 146,576,019 | | |
Foreign currency translations | | | (33,441 | ) | |
Net realized gain | | | 146,542,578 | | |
Net change in unrealized appreciation (depreciation) on: | |
Investments | | | (21,372,754 | ) | |
Foreign currency translations | | | 4,322 | | |
Net change in unrealized depreciation | | | (21,368,432 | ) | |
Net realized and unrealized gain | | | 125,174,146 | | |
Net increase in net assets resulting from operations | | $ | 121,688,430 | | |
The accompanying Notes to Financial Statements are an integral part of this statement.
Annual Report 2015
14
COLUMBIA MARSICO FOCUSED EQUITIES FUND
STATEMENT OF CHANGES IN NET ASSETS
| | | Year Ended
February 28,
2015 | | Year Ended
February 28,
2014(a) | |
Operations | |
Net investment loss | | $ | (3,485,716 | ) | | $ | (2,083,459 | ) | |
Net realized gain | | | 146,542,578 | | | | 374,659,679 | | |
Net change in unrealized appreciation (depreciation) | | | (21,368,432 | ) | | | 27,361,680 | | |
Net increase in net assets resulting from operations | | | 121,688,430 | | | | 399,937,900 | | |
Distributions to shareholders | |
Net realized gains | |
Class A | | | (80,162,713 | ) | | | (170,605,553 | ) | |
Class B | | | (1,339,657 | ) | | | (3,454,473 | ) | |
Class C | | | (38,715,086 | ) | | | (67,788,644 | ) | |
Class I | | | (384 | ) | | | (751 | ) | |
Class R4 | | | (2,349,929 | ) | | | (908,593 | ) | |
Class R5 | | | (1,053,402 | ) | | | (467 | ) | |
Class Z | | | (38,715,563 | ) | | | (75,591,871 | ) | |
Total distributions to shareholders | | | (162,336,734 | ) | | | (318,350,352 | ) | |
Decrease in net assets from capital stock activity | | | (26,347,769 | ) | | | (501,168,509 | ) | |
Total decrease in net assets | | | (66,996,073 | ) | | | (419,580,961 | ) | |
Net assets at beginning of year | | | 1,157,538,195 | | | | 1,577,119,156 | | |
Net assets at end of year | | $ | 1,090,542,122 | | | $ | 1,157,538,195 | | |
Excess of distributions over net investment income | | $ | (147,214 | ) | | $ | (132,615 | ) | |
(a) Class R5 shares are based on operations from December 11, 2013 (commencement of operations) through the stated period end.
The accompanying Notes to Financial Statements are an integral part of this statement.
Annual Report 2015
15
COLUMBIA MARSICO FOCUSED EQUITIES FUND
STATEMENT OF CHANGES IN NET ASSETS (continued)
| | | Year Ended February 28, 2015 | | Year Ended February 28, 2014(a) | |
| | | Shares | | Dollars ($) | | Shares | | Dollars ($) | |
Capital stock activity | |
Class A shares | |
Subscriptions(b) | | | 4,820,728 | | | | 97,594,452 | | | | 7,067,886 | | | | 150,566,827 | | |
Distributions reinvested | | | 2,776,625 | | | | 54,757,149 | | | | 6,258,648 | | | | 125,665,169 | | |
Redemptions | | | (9,322,975 | ) | | | (189,037,130 | ) | | | (29,842,200 | ) | | | (664,540,582 | ) | |
Net decrease | | | (1,725,622 | ) | | | (36,685,529 | ) | | | (16,515,666 | ) | | | (388,308,586 | ) | |
Class B shares | |
Subscriptions | | | 44,374 | | | | 720,662 | | | | 102,567 | | | | 1,739,618 | | |
Distributions reinvested | | | 37,916 | | | | 613,457 | | | | 93,608 | | | | 1,579,933 | | |
Redemptions(b) | | | (300,958 | ) | | | (5,014,838 | ) | | | (407,274 | ) | | | (7,720,689 | ) | |
Net decrease | | | (218,668 | ) | | | (3,680,719 | ) | | | (211,099 | ) | | | (4,401,138 | ) | |
Class C shares | |
Subscriptions | | | 1,597,783 | | | | 26,272,969 | | | | 2,357,613 | | | | 40,917,705 | | |
Distributions reinvested | | | 1,135,959 | | | | 18,508,823 | | | | 1,885,234 | | | | 31,909,674 | | |
Redemptions | | | (2,928,365 | ) | | | (49,238,868 | ) | | | (2,735,924 | ) | | | (52,329,957 | ) | |
Net increase (decrease) | | | (194,623 | ) | | | (4,457,076 | ) | | | 1,506,923 | | | | 20,497,422 | | |
Class R4 shares | |
Subscriptions | | | 627,616 | | | | 13,845,661 | | | | 210,609 | | | | 4,907,728 | | |
Distributions reinvested | | | 111,789 | | | | 2,349,570 | | | | 43,577 | | | | 907,917 | | |
Redemptions | | | (112,189 | ) | | | (2,400,603 | ) | | | (19,917 | ) | | | (458,531 | ) | |
Net increase | | | 627,216 | | | | 13,794,628 | | | | 234,269 | | | | 5,357,114 | | |
Class R5 shares | |
Subscriptions | | | 107,825 | | | | 2,321,122 | | | | 276,595 | | | | 6,200,928 | | |
Distributions reinvested | | | 49,924 | | | | 1,053,035 | | | | — | | | | — | | |
Redemptions | | | (38,960 | ) | | | (825,076 | ) | | | — | | | | — | | |
Net increase | | | 118,789 | | | | 2,549,081 | | | | 276,595 | | | | 6,200,928 | | |
Class Z shares | |
Subscriptions | | | 3,573,420 | | | | 75,216,851 | | | | 2,967,890 | | | | 66,185,831 | | |
Distributions reinvested | | | 1,368,412 | | | | 28,209,168 | | | | 2,588,091 | | | | 53,355,729 | | |
Redemptions | | | (4,785,626 | ) | | | (101,294,173 | ) | | | (11,247,022 | ) | | | (260,055,809 | ) | |
Net increase (decrease) | | | 156,206 | | | | 2,131,846 | | | | (5,691,041 | ) | | | (140,514,249 | ) | |
Total net decrease | | | (1,236,702 | ) | | | (26,347,769 | ) | | | (20,400,019 | ) | | | (501,168,509 | ) | |
(a) Class R5 shares are based on operations from December 11, 2013 (commencement of operations) through the stated period end.
(b) Includes conversions of Class B shares to Class A shares, if any.
The accompanying Notes to Financial Statements are an integral part of this statement.
Annual Report 2015
16
COLUMBIA MARSICO FOCUSED EQUITIES FUND
The following tables are intended to help you understand the Fund's financial performance. Certain information reflects financial results for a single share of a class held for the periods shown. Per share net investment income (loss) amounts are calculated based on average shares outstanding during the period. Total return assumes reinvestment of all dividends and distributions, if any. Total return does not reflect payment of sales charges, if any. Total return and portfolio turnover are not annualized for periods of less than one year. The portfolio turnover rate is calculated without regard to purchase and sales transactions of short-term instruments and certain derivatives, if any. If such transactions were included, the Fund's portfolio turnover rate may be higher.
| | | Year Ended February 28, | | Year Ended
February 29, | | Year Ended
February 28, | |
Class A | | 2015 | | 2014 | | 2013 | | 2012 | | 2011 | |
Per share data | |
Net asset value, beginning of period | | $ | 21.22 | | | $ | 20.84 | | | $ | 24.18 | | | $ | 23.53 | | | $ | 18.99 | | |
Income from investment operations: | |
Net investment income (loss) | | | (0.05 | ) | | | (0.02 | ) | | | 0.06 | | | | 0.02 | | | | 0.00 | (a) | |
Net realized and unrealized gain | | | 2.41 | | | | 6.50 | | | | 1.28 | | | | 0.95 | | | | 4.54 | | |
Total from investment operations | | | 2.36 | | | | 6.48 | | | | 1.34 | | | | 0.97 | | | | 4.54 | | |
Less distributions to shareholders: | |
Net investment income | | | — | | | | — | | | | (0.11 | ) | | | (0.01 | ) | | | — | | |
Net realized gains | | | (3.08 | ) | | | (6.10 | ) | | | (4.57 | ) | | | (0.31 | ) | | | — | | |
Total distributions to shareholders | | | (3.08 | ) | | | (6.10 | ) | | | (4.68 | ) | | | (0.32 | ) | | | — | | |
Net asset value, end of period | | $ | 20.50 | | | $ | 21.22 | | | $ | 20.84 | | | $ | 24.18 | | | $ | 23.53 | | |
Total return | | | 12.29 | % | | | 34.77 | % | | | 6.84 | % | | | 4.26 | % | | | 23.91 | % | |
Ratios to average net assets(b) | |
Total gross expenses | | | 1.22 | %(c) | | | 1.21 | %(c) | | | 1.34 | % | | | 1.36 | % | | | 1.30 | %(c) | |
Total net expenses(d) | | | 1.22 | %(c)(e) | | | 1.21 | %(c)(e) | | | 1.29 | %(e) | | | 1.36 | %(e) | | | 1.30 | %(c)(e) | |
Net investment income (loss) | | | (0.23 | %) | | | (0.07 | %) | | | 0.28 | % | | | 0.09 | % | | | 0.01 | % | |
Supplemental data | |
Net assets, end of period (in thousands) | | $ | 543,323 | | | $ | 598,791 | | | $ | 932,546 | | | $ | 1,137,240 | | | $ | 1,370,199 | | |
Portfolio turnover | | | 53 | % | | | 95 | % | | | 76 | % | | | 90 | % | | | 77 | % | |
Notes to Financial Highlights
(a) Rounds to zero.
(b) In addition to the fees and expenses that the Fund bears directly, the Fund indirectly bears a pro rata share of the fees and expenses of any other funds in which it invests. Such indirect expenses are not included in the Fund's reported expense ratios.
(c) Ratios include line of credit interest expense which is less than 0.01%.
(d) Total net expenses include the impact of certain fee waivers/expense reimbursements made by the Investment Manager and certain of its affiliates, if applicable.
(e) The benefits derived from expense reductions had an impact of less than 0.01%.
The accompanying Notes to Financial Statements are an integral part of this statement.
Annual Report 2015
17
COLUMBIA MARSICO FOCUSED EQUITIES FUND
FINANCIAL HIGHLIGHTS (continued)
| | | Year Ended February 28, | | Year Ended
February 29, | | Year Ended
February 28, | |
Class B | | 2015 | | 2014 | | 2013 | | 2012 | | 2011 | |
Per share data | |
Net asset value, beginning of period | | $ | 17.84 | | | $ | 18.35 | | | $ | 21.88 | | | $ | 21.48 | | | $ | 17.46 | | |
Income from investment operations: | |
Net investment loss | | | (0.16 | ) | | | (0.16 | ) | | | (0.09 | ) | | | (0.15 | ) | | | (0.14 | ) | |
Net realized and unrealized gain | | | 1.98 | | | | 5.61 | | | | 1.13 | | | | 0.86 | | | | 4.16 | | |
Total from investment operations | | | 1.82 | | | | 5.45 | | | | 1.04 | | | | 0.71 | | | | 4.02 | | |
Less distributions to shareholders: | |
Net realized gains | | | (2.96 | ) | | | (5.96 | ) | | | (4.57 | ) | | | (0.31 | ) | | | — | | |
Total distributions to shareholders | | | (2.96 | ) | | | (5.96 | ) | | | (4.57 | ) | | | (0.31 | ) | | | — | | |
Net asset value, end of period | | $ | 16.70 | | | $ | 17.84 | | | $ | 18.35 | | | $ | 21.88 | | | $ | 21.48 | | |
Total return | | | 11.48 | % | | | 33.71 | % | | | 6.09 | % | | | 3.44 | % | | | 23.02 | % | |
Ratios to average net assets(a) | |
Total gross expenses | | | 1.97 | %(b) | | | 1.96 | %(b) | | | 2.09 | % | | | 2.12 | % | | | 2.05 | %(b) | |
Total net expenses(c) | | | 1.97 | %(b)(d) | | | 1.96 | %(b)(d) | | | 2.04 | %(d) | | | 2.12 | %(d) | | | 2.05 | %(b)(d) | |
Net investment loss | | | (0.98 | %) | | | (0.84 | %) | | | (0.46 | %) | | | (0.70 | %) | | | (0.74 | %) | |
Supplemental data | |
Net assets, end of period (in thousands) | | $ | 6,310 | | | $ | 10,640 | | | $ | 14,818 | | | $ | 23,745 | | | $ | 45,196 | | |
Portfolio turnover | | | 53 | % | | | 95 | % | | | 76 | % | | | 90 | % | | | 77 | % | |
Notes to Financial Highlights
(a) In addition to the fees and expenses that the Fund bears directly, the Fund indirectly bears a pro rata share of the fees and expenses of any other funds in which it invests. Such indirect expenses are not included in the Fund's reported expense ratios.
(b) Ratios include line of credit interest expense which is less than 0.01%.
(c) Total net expenses include the impact of certain fee waivers/expense reimbursements made by the Investment Manager and certain of its affiliates, if applicable.
(d) The benefits derived from expense reductions had an impact of less than 0.01%.
The accompanying Notes to Financial Statements are an integral part of this statement.
Annual Report 2015
18
COLUMBIA MARSICO FOCUSED EQUITIES FUND
FINANCIAL HIGHLIGHTS (continued)
| | | Year Ended February 28, | | Year Ended
February 29, | | Year Ended
February 28, | |
Class C | | 2015 | | 2014 | | 2013 | | 2012 | | 2011 | |
Per share data | |
Net asset value, beginning of period | | $ | 17.94 | | | $ | 18.42 | | | $ | 21.96 | | | $ | 21.55 | | | $ | 17.52 | | |
Income from investment operations: | |
Net investment loss | | | (0.16 | ) | | | (0.16 | ) | | | (0.10 | ) | | | (0.14 | ) | | | (0.14 | ) | |
Net realized and unrealized gain | | | 1.99 | | | | 5.64 | | | | 1.13 | | | | 0.86 | | | | 4.17 | | |
Total from investment operations | | | 1.83 | | | | 5.48 | | | | 1.03 | | | | 0.72 | | | | 4.03 | | |
Less distributions to shareholders: | |
Net realized gains | | | (2.96 | ) | | | (5.96 | ) | | | (4.57 | ) | | | (0.31 | ) | | | — | | |
Total distributions to shareholders | | | (2.96 | ) | | | (5.96 | ) | | | (4.57 | ) | | | (0.31 | ) | | | — | | |
Net asset value, end of period | | $ | 16.81 | | | $ | 17.94 | | | $ | 18.42 | | | $ | 21.96 | | | $ | 21.55 | | |
Total return | | | 11.47 | % | | | 33.75 | % | | | 6.02 | % | | | 3.47 | % | | | 23.00 | % | |
Ratios to average net assets(a) | |
Total gross expenses | | | 1.97 | %(b) | | | 1.96 | %(b) | | | 2.09 | % | | | 2.11 | % | | | 2.05 | %(b) | |
Total net expenses(c) | | | 1.97 | %(b)(d) | | | 1.96 | %(b)(d) | | | 2.04 | %(d) | | | 2.11 | %(d) | | | 2.05 | %(b)(d) | |
Net investment loss | | | (0.98 | %) | | | (0.85 | %) | | | (0.47 | %) | | | (0.66 | %) | | | (0.73 | %) | |
Supplemental data | |
Net assets, end of period (in thousands) | | $ | 227,979 | | | $ | 246,747 | | | $ | 225,678 | | | $ | 262,048 | | | $ | 304,857 | | |
Portfolio turnover | | | 53 | % | | | 95 | % | | | 76 | % | | | 90 | % | | | 77 | % | |
Notes to Financial Highlights
(a) In addition to the fees and expenses that the Fund bears directly, the Fund indirectly bears a pro rata share of the fees and expenses of any other funds in which it invests. Such indirect expenses are not included in the Fund's reported expense ratios.
(b) Ratios include line of credit interest expense which is less than 0.01%.
(c) Total net expenses include the impact of certain fee waivers/expense reimbursements made by the Investment Manager and certain of its affiliates, if applicable.
(d) The benefits derived from expense reductions had an impact of less than 0.01%.
The accompanying Notes to Financial Statements are an integral part of this statement.
Annual Report 2015
19
COLUMBIA MARSICO FOCUSED EQUITIES FUND
FINANCIAL HIGHLIGHTS (continued)
| | | Year Ended February 28, | | Year Ended
February 29, | | Year Ended
February 28, | |
Class I | | 2015 | | 2014 | | 2013 | | 2012 | | 2011(a) | |
Per share data | |
Net asset value, beginning of period | | $ | 22.18 | | | $ | 21.53 | | | $ | 24.81 | | | $ | 24.04 | | | $ | 20.59 | | |
Income from investment operations: | |
Net investment income | | | 0.06 | | | | 0.09 | | | | 0.17 | | | | 0.10 | | | | 0.00 | (b) | |
Net realized and unrealized gain | | | 2.55 | | | | 6.74 | | | | 1.32 | | | | 1.07 | | | | 3.52 | | |
Total from investment operations | | | 2.61 | | | | 6.83 | | | | 1.49 | | | | 1.17 | | | | 3.52 | | |
Less distributions to shareholders: | |
Net investment income | | | — | | | | — | | | | (0.20 | ) | | | (0.09 | ) | | | (0.07 | ) | |
Net realized gains | | | (3.17 | ) | | | (6.18 | ) | | | (4.57 | ) | | | (0.31 | ) | | | — | | |
Total distributions to shareholders | | | (3.17 | ) | | | (6.18 | ) | | | (4.77 | ) | | | (0.40 | ) | | | (0.07 | ) | |
Net asset value, end of period | | $ | 21.62 | | | $ | 22.18 | | | $ | 21.53 | | | $ | 24.81 | | | $ | 24.04 | | |
Total return | | | 12.91 | % | | | 35.39 | % | | | 7.29 | % | | | 5.04 | % | | | 17.09 | % | |
Ratios to average net assets(c) | |
Total gross expenses | | | 0.71 | %(d) | | | 0.73 | %(d) | | | 0.88 | % | | | 0.91 | % | | | 0.89 | %(e) | |
Total net expenses(f) | | | 0.71 | %(d) | | | 0.73 | %(d) | | | 0.86 | % | | | 0.91 | %(g) | | | 0.89 | %(e)(g) | |
Net investment income | | | 0.28 | % | | | 0.40 | % | | | 0.71 | % | | | 0.44 | % | | | 0.00 | %(b)(e) | |
Supplemental data | |
Net assets, end of period (in thousands) | | $ | 3 | | | $ | 3 | | | $ | 3 | | | $ | 3 | | | $ | 28,852 | | |
Portfolio turnover | | | 53 | % | | | 95 | % | | | 76 | % | | | 90 | % | | | 77 | % | |
Notes to Financial Highlights
(a) Based on operations from September 27, 2010 (commencement of operations) through the stated period end.
(b) Rounds to zero.
(c) In addition to the fees and expenses that the Fund bears directly, the Fund indirectly bears a pro rata share of the fees and expenses of any other funds in which it invests. Such indirect expenses are not included in the Fund's reported expense ratios.
(d) Ratios include line of credit interest expense which is less than 0.01%.
(e) Annualized.
(f) Total net expenses include the impact of certain fee waivers/expense reimbursements made by the Investment Manager and certain of its affiliates, if applicable.
(g) The benefits derived from expense reductions had an impact of less than 0.01%.
The accompanying Notes to Financial Statements are an integral part of this statement.
Annual Report 2015
20
COLUMBIA MARSICO FOCUSED EQUITIES FUND
FINANCIAL HIGHLIGHTS (continued)
| | | Year Ended February 28, | |
Class R4 | | 2015 | | 2014 | | 2013(a) | |
Per share data | |
Net asset value, beginning of period | | $ | 22.42 | | | $ | 21.72 | | | $ | 22.72 | | |
Income from investment operations: | |
Net investment income | | | 0.01 | | | | 0.00 | (b) | | | 0.01 | | |
Net realized and unrealized gain | | | 2.57 | | | | 6.84 | | | | 2.25 | | |
Total from investment operations | | | 2.58 | | | | 6.84 | | | | 2.26 | | |
Less distributions to shareholders: | |
Net investment income | | | — | | | | — | | | | (0.18 | ) | |
Net realized gains | | | (3.12 | ) | | | (6.14 | ) | | | (3.08 | ) | |
Total distributions to shareholders | | | (3.12 | ) | | | (6.14 | ) | | | (3.26 | ) | |
Net asset value, end of period | | $ | 21.88 | | | $ | 22.42 | | | $ | 21.72 | | |
Total return | | | 12.64 | % | | | 35.07 | % | | | 10.88 | % | |
Ratios to average net assets(c) | |
Total gross expenses | | | 0.98 | %(d) | | | 0.97 | %(d) | | | 1.03 | %(e) | |
Total net expenses(f) | | | 0.97 | %(d)(g) | | | 0.97 | %(d)(g) | | | 0.99 | %(e) | |
Net investment income | | | 0.03 | % | | | 0.02 | % | | | 0.18 | %(e) | |
Supplemental data | |
Net assets, end of period (in thousands) | | $ | 18,848 | | | $ | 5,255 | | | $ | 2 | | |
Portfolio turnover | | | 53 | % | | | 95 | % | | | 76 | % | |
Notes to Financial Highlights
(a) Based on operations from November 8, 2012 (commencement of operations) through the stated period end.
(b) Rounds to zero.
(c) In addition to the fees and expenses that the Fund bears directly, the Fund indirectly bears a pro rata share of the fees and expenses of any other funds in which it invests. Such indirect expenses are not included in the Fund's reported expense ratios.
(d) Ratios include line of credit interest expense which is less than 0.01%.
(e) Annualized.
(f) Total net expenses include the impact of certain fee waivers/expense reimbursements made by the Investment Manager and certain of its affiliates, if applicable.
(g) The benefits derived from expense reductions had an impact of less than 0.01%.
The accompanying Notes to Financial Statements are an integral part of this statement.
Annual Report 2015
21
COLUMBIA MARSICO FOCUSED EQUITIES FUND
FINANCIAL HIGHLIGHTS (continued)
| | | Year Ended February 28, | |
Class R5 | | 2015 | | 2014(a) | |
Per share data | |
Net asset value, beginning of period | | $ | 22.49 | | | $ | 25.48 | | |
Income from investment operations: | |
Net investment income | | | 0.04 | | | | (0.00 | )(b) | |
Net realized and unrealized gain | | | 2.58 | | | | 1.77 | | |
Total from investment operations | | | 2.62 | | | | 1.77 | | |
Less distributions to shareholders: | |
Net realized gains | | | (3.15 | ) | | | (4.76 | ) | |
Total distributions to shareholders | | | (3.15 | ) | | | (4.76 | ) | |
Net asset value, end of period | | $ | 21.96 | | | $ | 22.49 | | |
Total return | | | 12.77 | % | | | 8.59 | % | |
Ratios to average net assets(c) | |
Total gross expenses | | | 0.82 | %(d) | | | 0.81 | %(d)(e) | |
Total net expenses(f) | | | 0.82 | %(d) | | | 0.81 | %(d)(e) | |
Net investment income (loss) | | | 0.17 | % | | | (0.02 | %)(e) | |
Supplemental data | |
Net assets, end of period (in thousands) | | $ | 8,682 | | | $ | 6,220 | | |
Portfolio turnover | | | 53 | % | | | 95 | % | |
Notes to Financial Highlights
(a) Based on operations from December 11, 2013 (commencement of operations) through the stated period end.
(b) Rounds to zero.
(c) In addition to the fees and expenses that the Fund bears directly, the Fund indirectly bears a pro rata share of the fees and expenses of any other funds in which it invests. Such indirect expenses are not included in the Fund's reported expense ratios.
(d) Ratios include line of credit interest expense which is less than 0.01%.
(e) Annualized.
(f) Total net expenses include the impact of certain fee waivers/expense reimbursements made by the Investment Manager and certain of its affiliates, if applicable.
The accompanying Notes to Financial Statements are an integral part of this statement.
Annual Report 2015
22
COLUMBIA MARSICO FOCUSED EQUITIES FUND
FINANCIAL HIGHLIGHTS (continued)
| | | Year Ended February 28, | | Year Ended
February 29, | | Year Ended
February 28, | |
Class Z | | 2015 | | 2014 | | 2013 | | 2012 | | 2011 | |
Per share data | |
Net asset value, beginning of period | | $ | 22.04 | | | $ | 21.44 | | | $ | 24.73 | | | $ | 24.05 | | | $ | 19.39 | | |
Income from investment operations: | |
Net investment income | | | 0.01 | | | | 0.04 | | | | 0.13 | | | | 0.08 | | | | 0.06 | | |
Net realized and unrealized gain | | | 2.51 | | | | 6.70 | | | | 1.31 | | | | 0.97 | | | | 4.64 | | |
Total from investment operations | | | 2.52 | | | | 6.74 | | | | 1.44 | | | | 1.05 | | | | 4.70 | | |
Less distributions to shareholders: | |
Net investment income | | | — | | | | — | | | | (0.16 | ) | | | (0.06 | ) | | | (0.04 | ) | |
Net realized gains | | | (3.12 | ) | | | (6.14 | ) | | | (4.57 | ) | | | (0.31 | ) | | | — | | |
Total distributions to shareholders | | | (3.12 | ) | | | (6.14 | ) | | | (4.73 | ) | | | (0.37 | ) | | | (0.04 | ) | |
Net asset value, end of period | | $ | 21.44 | | | $ | 22.04 | | | $ | 21.44 | | | $ | 24.73 | | | $ | 24.05 | | |
Total return | | | 12.59 | % | | | 35.08 | % | | | 7.12 | % | | | 4.51 | % | | | 24.23 | % | |
Ratios to average net assets(a) | |
Total gross expenses | | | 0.98 | %(b) | | | 0.96 | %(b) | | | 1.09 | % | | | 1.11 | % | | | 1.05 | %(b) | |
Total net expenses(c) | | | 0.97 | %(b)(d) | | | 0.96 | %(b)(d) | | | 1.04 | %(d) | | | 1.11 | %(d) | | | 1.05 | %(b)(d) | |
Net investment income | | | 0.03 | % | | | 0.16 | % | | | 0.55 | % | | | 0.34 | % | | | 0.28 | % | |
Supplemental data | |
Net assets, end of period (in thousands) | | $ | 285,397 | | | $ | 289,882 | | | $ | 404,071 | | | $ | 1,028,756 | | | $ | 1,101,015 | | |
Portfolio turnover | | | 53 | % | | | 95 | % | | | 76 | % | | | 90 | % | | | 77 | % | |
Notes to Financial Highlights
(a) In addition to the fees and expenses that the Fund bears directly, the Fund indirectly bears a pro rata share of the fees and expenses of any other funds in which it invests. Such indirect expenses are not included in the Fund's reported expense ratios.
(b) Ratios include line of credit interest expense which is less than 0.01%.
(c) Total net expenses include the impact of certain fee waivers/expense reimbursements made by the Investment Manager and certain of its affiliates, if applicable.
(d) The benefits derived from expense reductions had an impact of less than 0.01%.
The accompanying Notes to Financial Statements are an integral part of this statement.
Annual Report 2015
23
COLUMBIA MARSICO FOCUSED EQUITIES FUND
NOTES TO FINANCIAL STATEMENTS
February 28, 2015
Note 1. Organization
Columbia Marsico Focused Equities Fund (the Fund), a series of Columbia Funds Series Trust (the Trust), is a non-diversified fund. The Trust is registered under the Investment Company Act of 1940, as amended (the 1940 Act), as an open-end management investment company organized as a Delaware statutory trust.
Fund Shares
The Trust may issue an unlimited number of shares (without par value). The Fund offers Class A, Class B, Class C, Class I, Class R4, Class R5 and Class Z shares. Although all share classes generally have identical voting, dividend and liquidation rights, each share class votes separately when required by the Trust's organizational documents or by law. Different share classes pay different distribution amounts to the extent the expenses of such share classes differ, and distributions in liquidation will be proportional to the net asset value of each share class. Each share class has its own expense structure and sales charges.
Class A shares are subject to a maximum front-end sales charge of 5.75% based on the initial investment amount. Class A shares purchased without an initial sales charge in accounts aggregating $1 million to $50 million at the time of purchase are subject to a contingent deferred sales charge (CDSC) if the shares are sold within 18 months of purchase, charged as follows: 1.00% CDSC if redeemed within 12 months of purchase, and 0.50% CDSC if redeemed more than 12, but less than 18, months after purchase.
Class B shares may be subject to a maximum CDSC of 5.00% based upon the holding period after purchase. Class B shares will generally convert to Class A shares eight years after purchase. The Fund no longer accepts investments by new or existing investors in the Fund's Class B shares, except in connection with the reinvestment of any dividend and/or capital gain distributions in Class B shares of the Fund and exchanges by existing Class B shareholders of certain other funds within the Columbia Family of Funds.
Class C shares are subject to a 1.00% CDSC on shares redeemed within one year of purchase.
Class I shares are not subject to sales charges and are available only to the Columbia Family of Funds.
Class R4 shares are not subject to sales charges and are generally available only to omnibus retirement plans and certain investors as described in the Fund's prospectus.
Class R5 shares are not subject to sales charges and are generally available only to investors purchasing through authorized investment professionals and omnibus retirement plans.
Class Z shares are not subject to sales charges and are available only to eligible investors, which are subject to different investment minimums as described in the Fund's prospectus.
Note 2. Summary of Significant Accounting Policies
Basis of Preparation
The Fund is an investment company that applies the accounting and reporting guidance in the Financial Accounting Standards Board (FASB) Accounting Standards Codification Topic 946, Financial Services — Investment Companies (ASC 946). The financial statements are prepared in accordance with U.S. generally accepted accounting principles (GAAP) which requires management to make certain estimates and assumptions that affect the reported amounts of assets and liabilities, the disclosure of contingent assets and liabilities at the date of the financial statements and the reported amounts of income and expenses during the reporting period. Actual results could differ from those estimates.
The following is a summary of significant accounting policies followed by the Fund in the preparation of its financial statements.
Security Valuation
All equity securities are valued at the close of business of the New York Stock Exchange (NYSE). Equity securities are valued at the last quoted sales price on the principal exchange or market on which they trade, except for securities traded on the NASDAQ Stock Market, which are valued at the NASDAQ official close price. Unlisted securities or listed securities for which there were no sales during the day are valued at the mean of the latest quoted bid and ask prices on such exchanges or markets.
Foreign equity securities are valued based on quotations from the principal market in which such securities are traded. If any foreign security prices are not readily available as a result of limited share activity, the securities are valued at the mean of the latest quoted bid and ask prices on such exchanges or markets. Foreign currency exchange rates are generally determined at 4:00 p.m. Eastern (U.S.) time. Many securities markets and exchanges outside the U.S. close
Annual Report 2015
24
COLUMBIA MARSICO FOCUSED EQUITIES FUND
NOTES TO FINANCIAL STATEMENTS (continued)
February 28, 2015
prior to the close of the NYSE; therefore, the closing prices for securities in such markets or on such exchanges may not fully reflect events that occur after such close but before the close of the NYSE. In those situations, foreign securities will be fair valued pursuant to a policy adopted by the Board of Trustees (the Board), including, if available, utilizing a third party pricing service to determine these fair values. The third party pricing service takes into account multiple factors, including, but not limited to, movements in the U.S. securities markets, certain depositary receipts, futures contracts and foreign exchange rates that have occurred subsequent to the close of the foreign exchange or market, to determine a good faith estimate that reasonably reflects the current market conditions as of the close of the NYSE. The fair value of a security is likely to be different from the quoted or published price, if available.
Investments in open-end investment companies, including money market funds, are valued at their net asset value.
Investments for which market quotations are not readily available, or that have quotations which management believes are not reliable, are valued at fair value as determined in good faith under procedures established by and under the general supervision of the Board. If a security or class of securities (such as foreign securities) is valued at fair value, such value is likely to be different from the quoted or published price for the security.
The determination of fair value often requires significant judgment. To determine fair value, management may use assumptions including but not limited to future cash flows and estimated risk premiums. Multiple inputs from various sources may be used to determine fair value.
Foreign Currency Transactions and Translations
The values of all assets and liabilities denominated in foreign currencies are generally translated into U.S. dollars at exchange rates determined at the close of the NYSE. Net realized and unrealized gains (losses) on foreign currency transactions and translations include gains (losses) arising from the fluctuation in exchange rates between trade and settlement dates on securities transactions, gains (losses) arising from the disposition of foreign currency and currency gains (losses) between the accrual and payment dates on dividends, interest income and foreign withholding taxes.
For financial statement purposes, the Fund does not distinguish that portion of gains (losses) on investments which is due to changes in foreign exchange rates from
that which is due to changes in market prices of the investments. Such fluctuations are included with the net realized and unrealized gains (losses) on investments in the Statement of Operations.
Security Transactions
Security transactions are accounted for on the trade date. Cost is determined and gains (losses) are based upon the specific identification method for both financial statement and federal income tax purposes.
Income Recognition
Corporate actions and dividend income are generally recorded net of any non-reclaimable tax withholdings, on the ex-dividend date or upon receipt of ex-dividend notification in the case of certain foreign securities.
The Fund may receive distributions from holdings in business development companies (BDCs), exchange-traded funds (ETFs), other regulated investment companies (RICs), and real estate investment trusts (REITs), which report information on the character of their distributions annually. These distributions are allocated to dividend income, capital gain and return of capital based on actual information reported. To the extent actual information has not yet been reported by the REITs, estimates for return of capital are made by the Fund's management. Return of capital is recorded as a reduction of the cost basis of securities held. If the Fund no longer owns the applicable securities, return of capital is recorded as a realized gain. Management's estimates are subsequently adjusted when the actual character of the distributions is disclosed by the REITs, which could result in a proportionate change in return of capital to shareholders. No estimates are made for the BDCs, ETFs, and RICs.
Awards from class action litigation are recorded as a reduction of cost basis if the Fund still owns the applicable securities on the payment date. If the Fund no longer owns the applicable securities, the proceeds are recorded as realized gains.
Expenses
General expenses of the Trust are allocated to the Fund and other funds of the Trust based upon relative net assets or other expense allocation methodologies determined by the nature of the expense. Expenses directly attributable to the Fund are charged to the Fund. Expenses directly attributable to a specific class of shares are charged to that share class.
Annual Report 2015
25
COLUMBIA MARSICO FOCUSED EQUITIES FUND
NOTES TO FINANCIAL STATEMENTS (continued)
February 28, 2015
Determination of Class Net Asset Value
All income, expenses (other than class-specific expenses, which are charged to that share class, as shown in the Statement of Operations) and realized and unrealized gains (losses) are allocated to each class of the Fund on a daily basis, based on the relative net assets of each class, for purposes of determining the net asset value of each class.
Federal Income Tax Status
The Fund intends to qualify each year as a regulated investment company under Subchapter M of the Internal Revenue Code, as amended, and will distribute substantially all of its taxable income (including net short-term capital gains), if any, for its tax year, and as such will not be subject to federal income taxes. In addition, the Fund intends to distribute in each calendar year substantially all of its net investment income, capital gains and certain other amounts, if any, such that the Fund should not be subject to federal excise tax. Therefore, no federal income or excise tax provision is recorded.
Foreign Taxes
The Fund may be subject to foreign taxes on income, gains on investments or currency repatriation, a portion of which may be recoverable. The Fund will accrue such taxes and recoveries, as applicable, based upon its current interpretation of tax rules and regulations that exist in the markets in which it invests.
Realized gains in certain countries may be subject to foreign taxes at the Fund level, based on statutory rates. The Fund accrues for such foreign taxes on realized and unrealized gains at the appropriate rate for each jurisdiction, as applicable. The amount, if any, is disclosed as a liability on the Statement of Assets and Liabilities.
Distributions to Shareholders
Distributions from net investment income, if any, are declared and paid semi-annually. Net realized capital gains, if any, are distributed at least annually. Income distributions and capital gain distributions are determined in accordance with federal income tax regulations, which may differ from GAAP.
Guarantees and Indemnifications
Under the Trust's organizational documents and, in some cases, by contract, its officers and trustees are indemnified against certain liabilities arising out of the performance of their duties to the Trust or its funds. In
addition, certain of the Fund's contracts with its service providers contain general indemnification clauses. The Fund's maximum exposure under these arrangements is unknown since the amount of any future claims that may be made against the Fund cannot be determined, and the Fund has no historical basis for predicting the likelihood of any such claims.
Note 3. Fees and Compensation Paid to Affiliates
Investment Management Fees
Under an Investment Management Services Agreement, Columbia Management Investment Advisers, LLC (the Investment Manager), a wholly-owned subsidiary of Ameriprise Financial, Inc. (Ameriprise Financial), is responsible for the ultimate oversight of investments made by the Fund. The Fund's subadviser (see Subadvisory Agreement below) has the primary responsibility for the day-to-day portfolio management of the Fund. The investment management fee is an annual fee that is equal to a percentage of the Fund's average daily net assets that declines from 0.71% to 0.54% as the Fund's net assets increase. The effective investment management fee rate for the year ended February 28, 2015 was 0.68% of the Fund's average daily net assets.
Subadvisory Agreement
The Investment Manager has entered into a Subadvisory Agreement with Marsico Capital Management, LLC (Marsico) to serve as the subadviser to the Fund. The Investment Manager compensates Marsico to manage the investment of the Fund's assets.
Administration Fees
Under an Administrative Services Agreement, the Investment Manager also serves as the Fund Administrator. The Fund pays the Fund Administrator an annual fee for administration and accounting services equal to a percentage of the Fund's average daily net assets that declines from 0.06% to 0.03% as the Fund's net assets increase. The effective administration fee rate for the year ended February 28, 2015 was 0.06% of the Fund's average daily net assets.
Other Expenses
Other expenses are for, among other things, miscellaneous expenses of the Fund or the Board, including payments to a company providing limited administrative services to the Fund and the Board. That company's expenses include boardroom and office
Annual Report 2015
26
COLUMBIA MARSICO FOCUSED EQUITIES FUND
NOTES TO FINANCIAL STATEMENTS (continued)
February 28, 2015
expense, employee compensation, employee health and retirement benefits, and certain other expenses. For the year ended February 28, 2015, other expenses paid by the Fund to this company were $2,722.
Compensation of Board Members
Board members are compensated for their services to the Fund as disclosed in the Statement of Operations. Under a Deferred Compensation Plan (the Plan), the Board members who are not "interested persons" of the Fund, as defined under the 1940 Act, may elect to defer payment of up to 100% of their compensation. Deferred amounts are treated as though equivalent dollar amounts had been invested in shares of certain funds managed by the Investment Manager. The Fund's liability for these amounts is adjusted for market value changes and remains in the Fund until distributed in accordance with the Plan.
Transfer Agent Fees
Under a Transfer and Dividend Disbursing Agent Agreement, Columbia Management Investment Services Corp. (the Transfer Agent), an affiliate of the Investment Manager and a wholly-owned subsidiary of Ameriprise Financial, is responsible for providing transfer agency services to the Fund. The Transfer Agent has contracted with Boston Financial Data Services (BFDS) to serve as sub-transfer agent.
Effective November 1, 2014, the Transfer Agent receives a monthly transfer agency fee based on the number or the average value of accounts, depending on the type of account. Prior to November 1, 2014, the Transfer Agent received a monthly account-based service fee based on the number of open accounts. In addition, the Transfer Agent also receives sub-transfer agency fees based on a percentage of the average aggregate value of the Fund's shares maintained in omnibus accounts (other than omnibus accounts for which American Enterprise Investment Services Inc. is the broker of record or accounts where the beneficial shareholder is a customer of Ameriprise Financial Services, Inc., for which the Transfer Agent receives a per account fee). The Transfer Agent pays the fees of BFDS for services as sub-transfer agent and is not entitled to reimbursement for such fees from the Fund (with the exception of out-of-pocket fees).
The Transfer Agent also receives compensation from the Fund for various shareholder services and reimbursements for certain out-of-pocket fees. Class I shares do not pay transfer agency fees. Total transfer agent fees for Class R5 shares are subject to an annual
limitation of not more than 0.05% of the average daily net assets attributable to Class R5 shares.
For the year ended February 28, 2015, the Fund's effective transfer agent fee rates as a percentage of average daily net assets of each class were as follows:
Class A | | | 0.20 | % | |
Class B | | | 0.20 | | |
Class C | | | 0.20 | | |
Class R4 | | | 0.20 | | |
Class R5 | | | 0.05 | | |
Class Z | | | 0.20 | | |
An annual minimum account balance fee of $20 may apply to certain accounts with a value below the applicable share class's initial minimum investment requirements to reduce the impact of small accounts on transfer agent fees. These minimum account balance fees are remitted to the Fund and recorded as part of expense reductions in the Statement of Operations. For the year ended February 28, 2015, these minimum account balance fees reduced total expenses of the Fund by $2,712.
Distribution and Service Fees
The Fund has an agreement with Columbia Management Investment Distributors, Inc. (the Distributor), an affiliate of the Investment Manager and a wholly-owned subsidiary of Ameriprise Financial, for distribution and shareholder services. The Board has approved, and the Fund has adopted, distribution and shareholder service plans (the Plans) applicable to certain share classes, which set the distribution and service fees for the Fund. These fees are calculated daily and are intended to compensate the Distributor and/or eligible selling and/or servicing agents for selling shares of the Fund and providing services to investors.
Under the Plans, the Fund pays a monthly combined distribution and service fee to the Distributor at the maximum annual rate of 0.25% of the average daily net assets attributable to Class A shares of the Fund. Also under the Plans, the Fund pays a monthly service fee at the maximum annual rate of 0.25% of the average daily net assets attributable to Class B and Class C shares of the Fund and the payment of a monthly distribution fee at the maximum annual rate of 0.75% of the average daily net assets attributable to Class B and Class C shares of the Fund.
Annual Report 2015
27
COLUMBIA MARSICO FOCUSED EQUITIES FUND
NOTES TO FINANCIAL STATEMENTS (continued)
February 28, 2015
Sales Charges
Sales charges, including front-end charges and CDSCs, received by the Distributor for distributing Fund shares were $170,020 for Class A, $1,196 for Class B and $5,665 for Class C shares for the year ended February 28, 2015.
Expenses Waived/Reimbursed by the Investment Manager and its Affiliates
The Fund's expense ratio is subject to an expense reimbursement arrangement pursuant to which fees will be waived and/or expenses reimbursed (excluding certain fees and expenses described below), so that the Fund's net operating expenses, after giving effect to fees waived/expenses reimbursed and any balance credits and/or overdraft charges from the Fund's custodian, do not exceed the annual rates of:
| | | Voluntary
Expense Cap
Effective
July 1, 2014 | | Contractual
Expense Cap
Prior to
July 1, 2014 | |
Class A | | | 1.22 | % | | | 1.24 | % | |
Class B | | | 1.97 | | | | 1.99 | | |
Class C | | | 1.97 | | | | 1.99 | | |
Class I | | | 0.82 | | | | 0.84 | | |
Class R4 | | | 0.97 | | | | 0.99 | | |
Class R5 | | | 0.87 | | | | 0.89 | | |
Class Z | | | 0.97 | | | | 0.99 | | |
The voluntary expense cap arrangement may be revised or discontinued at any time. Under the arrangements, the following fees and expenses are excluded from the waiver/reimbursement commitment, and therefore will be paid by the Fund, if applicable: taxes (including foreign transaction taxes), expenses associated with investments in affiliated and non-affiliated pooled investment vehicles (including mutual funds and exchange-traded funds), transaction costs and brokerage commissions, costs related to any securities lending program, dividend expenses associated with securities sold short, inverse floater program fees and expenses, transaction charges and interest on borrowed money, interest and extraordinary expenses. Any fees waived and/or expenses reimbursed under the expense reimbursement arrangements described above are not recoverable by the Investment Manager or its affiliates in future periods.
Note 4. Federal Tax Information
The timing and character of income and capital gain distributions are determined in accordance with income
tax regulations, which may differ from GAAP because of temporary or permanent book to tax differences.
At February 28, 2015, these differences are primarily due to differing treatment for deferral/reversal of wash sale losses, Trustees' deferred compensation, foreign currency transactions, net operating loss reclassification and earnings and profits distributed to shareholders on the redemption of shares. To the extent these differences are permanent, reclassifications are made among the components of the Fund's net assets in the Statement of Assets and Liabilities. Temporary differences do not require reclassifications. In the Statement of Assets and Liabilities the following reclassifications were made:
Excess of distributions over net investment income | | $ | 3,471,117 | | |
Accumulated net realized gain | | | (12,924,264 | ) | |
Paid-in capital | | | 9,453,147 | | |
Net investment income (loss) and net realized gains (losses), as disclosed in the Statement of Operations, and net assets were not affected by this reclassification.
The tax character of distributions paid during the years indicated was as follows:
Year Ended February 28, | | 2015 | | 2014 | |
Ordinary income | | $ | 23,249,494 | | | $ | 46,585,152 | | |
Long-term capital gains | | | 139,087,240 | | | | 271,765,200 | | |
Total | | $ | 162,336,734 | | | $ | 318,350,352 | | |
Short-term capital gain distributions, if any, are considered ordinary income distributions for tax purposes.
At February 28, 2015, the components of distributable earnings on a tax basis were as follows:
Undistributed ordinary income | | | 8,560,220 | | |
Undistributed long-term capital gains | | | 47,965,406 | | |
Net unrealized appreciation | | | 344,128,223 | | |
At February 28, 2015, the cost of investments for federal income tax purposes was $736,460,490 and the aggregate gross unrealized appreciation and depreciation based on that cost was:
Unrealized appreciation | | $ | 351,085,157 | | |
Unrealized depreciation | | | (6,956,934 | ) | |
Net unrealized appreciation | | $ | 344,128,223 | | |
Management of the Fund has concluded that there are no significant uncertain tax positions in the Fund that would require recognition in the financial statements. However, management's conclusion may be subject to
Annual Report 2015
28
COLUMBIA MARSICO FOCUSED EQUITIES FUND
NOTES TO FINANCIAL STATEMENTS (continued)
February 28, 2015
review and adjustment at a later date based on factors including, but not limited to, new tax laws, regulations, and administrative interpretations (including relevant court decisions). Generally, the Fund's federal tax returns for the prior three fiscal years remain subject to examination by the Internal Revenue Service.
Note 5. Portfolio Information
The cost of purchases and proceeds from sales of securities, excluding short-term investments and derivatives, if any, aggregated to $568,980,436 and $792,750,936, respectively, for the year ended February 28, 2015. The amount of purchase and sale activity impacts the portfolio turnover rate reported in the Financial Highlights.
Note 6. Affiliated Money Market Fund
The Fund invests in Columbia Short-Term Cash Fund, an affiliated money market fund established for the exclusive use by the Fund and other affiliated funds. The income earned by the Fund from such investments is included as Dividends — affiliated issuers in the Statement of Operations. As an investing fund, the Fund indirectly bears its proportionate share of the expenses of Columbia Short-Term Cash Fund.
Note 7. Shareholder Concentration
At February 28, 2015, one unaffiliated shareholder of record owned 33.2% of the outstanding shares of the Fund in one or more accounts. The Fund has no knowledge about whether any portion of those shares was owned beneficially. Subscription and redemption activity by concentrated accounts may have a significant effect on the operations of the Fund.
Note 8. Line of Credit
The Fund has entered into a revolving credit facility with a syndicate of banks led by JPMorgan Chase Bank, N.A. (JPMorgan) whereby the Fund may borrow for the temporary funding of shareholder redemptions or for other temporary or emergency purposes. Pursuant to a December 9, 2014 amendment, the credit facility agreement, which is a collective agreement between the Fund and certain other funds managed by the Investment Manager, severally and not jointly, permits collective borrowings up to $550 million. Interest is charged to each participating fund based on its borrowings at a rate equal to the higher of (i) the overnight federal funds rate plus 1.00% or (ii) the one-month LIBOR rate plus 1.00%. Each borrowing under the credit facility matures no later than 60 days after the date of borrowing. The Fund also
pays a commitment fee equal to its pro rata share of the amount of the credit facility at a rate of 0.075% per annum. The commitment fee is included in other expenses in the Statement of Operations. Prior to the December 9, 2014 amendment, the credit facility agreement permitted borrowings up to $500 million under the same terms and interest rates as described above.
For the year ended February 28, 2015, the average daily loan balance outstanding on days when borrowing existed was $7,133,333 at a weighted average interest rate of 1.16%. Interest expense incurred by the Fund is recorded as line of credit interest expense in the Statement of Operations.
Note 9. Significant Risks
Consumer Discretionary Sector Risk
Sector risk occurs when a fund invests a significant portion of its assets in securities of companies conducting business in a related group of industries within an economic sector. Companies in the same economic sector may be similarly affected by economic, regulatory, political or market events or conditions, making a fund more vulnerable to unfavorable developments in that economic sector than funds that invest more broadly. The Fund may be more susceptible to the particular risks that may affect companies in the consumer discretionary sector than if it were invested in a wider variety of companies in unrelated sectors.
Health Care Sector Risk
Sector risk occurs when a fund invests a significant portion of its assets in securities of companies conducting business in a related group of industries within an economic sector. Companies in the same economic sector may be similarly affected by economic, regulatory, political or market events or conditions, making a fund more vulnerable to unfavorable developments in that economic sector than funds that invest more broadly. The Fund may be more susceptible to the particular risks that may affect companies in the health care sector than if it were invested in a wider variety of companies in unrelated sectors.
Information Technology Sector Risk
Sector risk occurs when a fund invests a significant portion of its assets in securities of companies conducting business in a related group of industries within an economic sector. Companies in the same economic sector may be similarly affected by economic,
Annual Report 2015
29
COLUMBIA MARSICO FOCUSED EQUITIES FUND
NOTES TO FINANCIAL STATEMENTS (continued)
February 28, 2015
regulatory, political or market events or conditions, making a fund more vulnerable to unfavorable developments in that economic sector than funds that invest more broadly. The Fund may be more susceptible to the particular risks that may affect companies in the information technology sector than if it were invested in a wider variety of companies in unrelated sectors.
Non-Diversification Risk
A non-diversified fund is permitted to invest a greater percentage of its total assets in fewer issuers than a diversified fund. The Fund may, therefore, have a greater risk of loss from a few issuers than a similar fund that invests more broadly.
Note 10. Subsequent Events
Management has evaluated the events and transactions that have occurred through the date the financial statements were issued and noted no items requiring adjustment of the financial statements or additional disclosure.
Note 11. Information Regarding Pending and Settled Legal Proceedings
In December 2005, without admitting or denying the allegations, American Express Financial Corporation (AEFC, which is now known as Ameriprise Financial, Inc. (Ameriprise Financial)) entered into settlement agreements with the Securities and Exchange Commission (SEC) and Minnesota Department of Commerce (MDOC) related to market timing activities. As a result, AEFC was censured and ordered to cease and desist from committing or causing any violations of certain provisions of the Investment Advisers Act of 1940, the Investment Company Act of 1940, and various Minnesota laws. AEFC agreed to pay disgorgement of $10 million and civil money penalties of $7 million. AEFC also agreed to retain an independent distribution consultant to assist in developing a plan for distribution of all disgorgement and civil penalties ordered by the SEC in accordance with various undertakings detailed at www.sec.gov/litigation/admin/ia-2451.pdf. Ameriprise Financial and its affiliates have cooperated with the SEC and the MDOC in these legal proceedings, and have made regular reports to the Funds' Boards of Trustees.
Ameriprise Financial and certain of its affiliates have historically been involved in a number of legal, arbitration and regulatory proceedings, including routine litigation, class actions, and governmental actions, concerning matters arising in connection with the conduct of their
business activities. Ameriprise Financial believes that the Funds are not currently the subject of, and that neither Ameriprise Financial nor any of its affiliates are the subject of, any pending legal, arbitration or regulatory proceedings that are likely to have a material adverse effect on the Funds or the ability of Ameriprise Financial or its affiliates to perform under their contracts with the Funds. Ameriprise Financial is required to make quarterly (10-Q), annual (10-K) and, as necessary, 8-K filings with the Securities and Exchange Commission on legal and regulatory matters that relate to Ameriprise Financial and its affiliates. Copies of these filings may be obtained by accessing the SEC website at www.sec.gov.
There can be no assurance that these matters, or the adverse publicity associated with them, will not result in increased fund redemptions, reduced sale of fund shares or other adverse consequences to the Funds. Further, although we believe proceedings are not likely to have a material adverse effect on the Funds or the ability of Ameriprise Financial or its affiliates to perform under their contracts with the Funds, these proceedings are subject to uncertainties and, as such, we are unable to estimate the possible loss or range of loss that may result. An adverse outcome in one or more of these proceedings could result in adverse judgments, settlements, fines, penalties or other relief that could have a material adverse effect on the consolidated financial condition or results of operations of Ameriprise Financial.
Annual Report 2015
30
COLUMBIA MARSICO FOCUSED EQUITIES FUND
REPORT OF INDEPENDENT REGISTERED PUBLIC ACCOUNTING FIRM
To the Trustees of Columbia Funds Series Trust and the Shareholders of
Columbia Marsico Focused Equities Fund
In our opinion, the accompanying statement of assets and liabilities, including the portfolio of investments, and the related statements of operations and of changes in net assets and the financial highlights present fairly, in all material respects, the financial position of Columbia Marsico Focused Equities Fund (the "Fund", a series of Columbia Funds Series Trust) at February 28, 2015, and the results of its operations, the changes in its net assets and the financial highlights for each of the periods indicated, in conformity with accounting principles generally accepted in the United States of America. These financial statements and financial highlights (hereafter referred to as "financial statements") are the responsibility of the Fund's management; our responsibility is to express an opinion on these financial statements based on our audits. We conducted our audits of these financial statements in accordance with the standards of the Public Company Accounting Oversight Board (United States). Those standards require that we plan and perform the audit to obtain reasonable assurance about whether the financial statements are free of material misstatement. An audit includes examining, on a test basis, evidence supporting the amounts and disclosures in the financial statements, assessing the accounting principles used and significant estimates made by management, and evaluating the overall financial statement presentation. We believe that our audits, which included confirmation of securities at February 28, 2015 by correspondence with the custodian, brokers and transfer agent, provide a reasonable basis for our opinion.
PricewaterhouseCoopers LLP
Minneapolis, Minnesota
April 21, 2015
Annual Report 2015
31
COLUMBIA MARSICO FOCUSED EQUITIES FUND
FEDERAL INCOME TAX INFORMATION
(Unaudited)
The Fund hereby designates the following tax attributes for the fiscal year ended February 28, 2015. Shareholders will be notified in early 2016 of the amounts for use in preparing 2015 income tax returns.
Tax Designations:
| Qualified Dividend Income | | | 35.07 | % | |
| Dividends Received Deduction | | | 32.40 | % | |
Capital Gain Dividend | | $ | 122,182,285 | | |
Qualified Dividend Income. For taxable, non-corporate shareholders, the percentage of ordinary income distributed during the fiscal year that represents qualified dividend income subject to reduced tax rates.
Dividends Received Deduction. The percentage of ordinary income distributed during the fiscal year that qualifies for the corporate dividends received deduction.
Capital Gain Dividend. The Fund designates as a capital gain dividend the amount reflected above, or if subsequently determined to be different, the net capital gain of such fiscal period.
Annual Report 2015
32
COLUMBIA MARSICO FOCUSED EQUITIES FUND
Shareholders elect the Board that oversees the Funds' operations. The Board appoints officers who are responsible for day-to-day business decisions based on policies set by the Board. The following table provides basic biographical information about the Funds' Board members, including their principal occupations during the past five years, although specific titles for individuals may have varied over the period. Under current Board policy, members may serve through the end of the calendar year in which he or she reaches either the mandatory retirement age established by the Board or the fifteenth anniversary of the first Board meeting they attended as a member of the Board.
Independent Trustees
Name,
Address,
Year of Birth | | Position Held With
Funds and Length of
Service | | Principal Occupation(s)
During Past Five Years
and Other Relevant
Professional Experience | | Number of
Funds in the
Fund Family
Overseen by
Board Member | | Other Present or Past
Directorships/
Trusteeships
(Within Past 5 Years) | |
Kathleen Blatz
901 S. Marquette Ave.
Minneapolis, MN 55402
1954 | | Board member since 1/06 for RiverSource Funds and since 6/11 for Nations Funds | | Attorney; specializing in arbitration and mediation; Chief Justice, Minnesota Supreme Court, 1998-2006; Associate Justice, Minnesota Supreme Court, 1996-1998; Fourth Judicial District Court Judge, Hennepin Country, 1994-1996; Attorney in private practice and public service, 1984-1993; State Representative, Minnesota House of Representatives, 1979-1993, which included service on the Tax and Financial Institutions and Insurance Committees | | | 127 | | | Trustee, BlueCross BlueShield of Minnesota (Chair of the Business Development Committee) since 2009; Chair of the Robina Foundation since August 2013 | |
Edward J. Boudreau, Jr.
901 S. Marquette Ave.
Minneapolis, MN 55402
1944 | | Board member since 6/11 for RiverSource Funds and since 1/05 for Nations Funds | | Managing Director, E.J. Boudreau & Associates (consulting) since 2000; FINRA Industry Arbitrator, 2002-present; Chairman and Chief Executive Officer, John Hancock Funds (asset management), Chairman and Interested Trustee for open-end and closed-end funds offered by John Hancock, 1989-2000; John Hancock Life Insurance Company, including SVP and Treasurer and SVP Information Technology, 1968-1988 | | | 125 | | | Former Trustee, BofA Funds Series Trust (11 funds), 2005-2011; Trustee, Boston Museum of Science (Chair of Finance Committee), 1985-2013 | |
Pamela G. Carlton
901 S. Marquette Ave.
Minneapolis, MN 55402
1954 | | Board member since 7/07 for RiverSource Funds and since 6/11 for Nations Funds | | President, Springboard — Partners in Cross Cultural Leadership (consulting company) since 2003; Managing Director of US Equity Research, JP Morgan Chase, 1999-2003; Director of US Equity Research, Chase Asset Management, 1996- 1999; Co-Director Latin America Research, 1993-1996, COO Global Research, 1992-1996, Co-Director of US Research, 1991-1992, Investment Banker, Morgan Stanley, 1982-1991 | | | 127 | | | None | |
Annual Report 2015
33
COLUMBIA MARSICO FOCUSED EQUITIES FUND
TRUSTEES AND OFFICERS (continued)
Independent Trustees (continued)
Name,
Address,
Year of Birth | | Position Held With
Funds and Length of
Service | | Principal Occupation(s)
During Past Five Years
and Other Relevant
Professional Experience | | Number of
Funds in the
Fund Family
Overseen by
Board Member | | Other Present or Past
Directorships/
Trusteeships
(Within Past 5 Years) | |
William P. Carmichael
901 S. Marquette Ave.
Minneapolis, MN 55402
1943 | | Chair of the Board since 1/14, Board member since 6/11 for RiverSource Funds and since 2003 for Nations Funds | | Retired; Co-founder, The Succession Fund (provides exit strategies to owners of privately held companies) 1998-2007; Adjunct Professor of Finances, Kelley School of Business, Indiana University, 1993-2007; Senior Vice President, Sara Lee Corporation, 1991-1993; Senior Vice President and Chief Financial Officer, Beatrice Foods Company, 1984-1990; Vice President, Esmark, Inc, 1973-1984.; Associate, Price Waterhouse, 1968-1972 | | | 127 | | | Director, Cobra Electronics Corporation (electronic equipment manufacturer), 1994-August 2014; The Finish Line (athletic shoes and apparel) since July 2003; Director, International Textile Corp. since 2012; former Director, McMoRan Exploration Company (oil and gas exploration and development) 2010-2013; former Trustee, BofA Funds Series Trust (11 funds) 2009-2011; Director, Spectrum Brands, Inc. (consumer products), 2002-2009; Director, Simmons Company (bedding), 2004-2010 | |
Patricia M. Flynn
901 S. Marquette Ave.
Minneapolis, MN 55402
1950 | | Board member since 11/04 for RiverSource Funds and since 6/11 for Nations Funds | | Trustee Professor of Economics and Management, Bentley University since 1976 (also teaches and conducts research on corporate governance); Dean, McCallum Graduate School of Business, Bentley University, 1992-2002 | | | 127 | | | Trustee, MA Taxpayers Foundation since 1997; Board of Governors, Innovation Institute, MA Technology Collaborative since 2010 | |
William A. Hawkins
901 S. Marquette Ave.
Minneapolis, MN 55402
1942 | | Board member since 6/11 for RiverSource Funds and since 1/05 for Nations Funds | | Managing Director, Overton Partners (financial consulting), since August 2010; President and Chief Executive Officer, California General Bank, N.A., January 2008-August 2010; Operation Hope, COO, 2004-2007; IndyMac Bancorp, President, CBG, 1999-2003; American General Bank, President, 1997-1999; Griffin Financial Services, CEO, 1981-1997; The Griffin Funds, CEO, 1992-1998 | | | 125 | | | Trustee, BofA Funds Series Trust (11 funds) | |
R. Glenn Hilliard
901 S. Marquette Ave.
Minneapolis, MN 55402
1943 | | Board member since 6/11 for RiverSource Funds and since 1/05 for Nations Funds | | Chairman and Chief Executive Officer, Hilliard Group LLC (investing and consulting) since April 2003; Non-Executive Director & Chairman, CNO Financial Group, Inc. (insurance), September 2003-May 2011 | | | 125 | | | Chairman, BofA Funds Series Trust (11 funds); former Director, CNO Financial Group, Inc. (insurance) 2003-2011 | |
Annual Report 2015
34
COLUMBIA MARSICO FOCUSED EQUITIES FUND
TRUSTEES AND OFFICERS (continued)
Independent Trustees (continued)
Name,
Address,
Year of Birth | | Position Held With
Funds and Length of
Service | | Principal Occupation(s)
During Past Five Years
and Other Relevant
Professional Experience | | Number of
Funds in the
Fund Family
Overseen by
Board Member | | Other Present or Past
Directorships/
Trusteeships
(Within Past 5 Years) | |
Catherine James Paglia
901 S. Marquette Ave.
Minneapolis, MN 55402
1952 | | Board member since 11/04 for RiverSource Funds and since 6/11 for Nations Funds | | Director, Enterprise Asset Management, Inc. (private real estate and asset management company) since September 1998; Managing Director and Partner, Interlaken Capital, Inc., 1989-1997; Managing Director, Morgan Stanley, 1982-1989; Vice President, Investment Banking, 1980-1982, Associate, Investment Banking, 1976-1980, Dean Witter Reynolds, Inc. | | | 127 | | | Director, Valmont Industries, Inc. (irrigation systems manufacturer) since 2012; Trustee, Carleton College (on the Investment Committee); Trustee, Carnegie Endowment for International Peace (on the Investment Committee) | |
Leroy C. Richie
901 S. Marquette Ave.
Minneapolis, MN 55402
1941 | | Board member since 2000 for Seligman Funds, since 11/08 for RiverSource Funds and since 6/11 for Nations Funds | | Counsel, Lewis & Munday, P.C. (law firm) since 2004; Vice President and General Counsel, Automotive Legal Affairs, Chrysler Corporation, 1993-1997 | | | 127 | | | Lead Outside Director, Digital Ally, Inc. (digital imaging) since September 2005; Director, Infinity, Inc. (oil and gas exploration and production) since 1994; Director, OGE Energy Corp. (energy and energy services) since November 2007-2014 | |
Minor M. Shaw
901 S. Marquette Ave.
Minneapolis, MN 55402
1947 | | Board member since 6/11 for RiverSource Funds and since 2003 for Nations Funds | | President, Micco LLC (private investments) since 2011; President, Micco Corp. (family investment business) 1998-2011 | | | 125 | | | Director, Piedmont Natural Gas; Director, BlueCross BlueShield of South Carolina since April 2008; Chair of the Duke Endowment; Director, National Association of Corporate Directors, Carolinas Chapter, since 2013; Chair of Greenville-Spartanburg Airport Commission; former Trustee, BofA Funds Series Trust (11 funds), 2003-2011 | |
Alison Taunton-Rigby
901 S. Marquette Ave.
Minneapolis, MN 55402
1944 | | Board member since 11/02 for RiverSource Funds and since 6/11 for Nations Funds | | Managing Director, Forester Biotech (consulting) since 2001; Chief Executive Officer and Director, RiboNovix, Inc., (biotechnology) 2003-2010; President and Chief Executive Officer of CMT Inc., 2001-2003; Aquila Biopharmaceuticals Inc., 1996-2000; Cambridge Biotech Corporation, 1995-1996, Mitotix Inc., 1993-1994 | | | 127 | | | Director, Healthways, Inc. (health and well-being solutions) since 2005; Director, ICI Mutual Insurance Company, RRG since 2011; Director, Abt Associates (government contractor) since 2001; Director, Boston Children's Hospital since 2002 | |
Annual Report 2015
35
COLUMBIA MARSICO FOCUSED EQUITIES FUND
TRUSTEES AND OFFICERS (continued)
Interested Trustee Not Affiliated with Investment Manager*
Name,
Address,
Year of Birth | | Position Held With
Funds and Length of
Service | | Principal Occupation
During Past Five Years | | Number of
Funds in the
Fund Family
Overseen by
Board Member | | Other Present or Past
Directorships/
Trusteeships
(Within Past 5 Years) | |
Anthony M. Santomero
901 S. Marquette Ave.
Minneapolis, MN 55402
1946 | | Board member since 6/11 for RiverSource Funds and since 1/08 for Nations Funds | | Richard K. Mellon Professor Emeritus of Finance, The Wharton School, University of Pennsylvania, since 2002; Senior Advisor, McKinsey & Company (consulting), 2006-2008; President, Federal Reserve Bank of Philadelphia, 2000-2006, Professor of Finance, The Wharton School, University of Pennsylvania, 1972-2002 | | | 125 | | | Director, Renaissance Reinsurance Ltd. since May 2008; Trustee, Penn Mutual Life Insurance Company since March 2008; Director, Citigroup Inc. since 2009; Director, Citibank, N.A. since 2009; former Trustee, BofA Funds Series Trust (11 funds), 2008-2011 | |
* Dr. Santomero is not an affiliated person of the Investment Manager or Ameriprise Financial. However, he is currently deemed by the Funds to be an "interested person" (as defined in the 1940 Act) of the Funds because he serves as a Director of Citigroup Inc. and Citibank, N.A., companies that may directly or through subsidiaries and affiliates engage from time-to-time in brokerage execution, principal transactions and lending relationships with the Funds or accounts advised/managed by the Investment Manager.
Annual Report 2015
36
COLUMBIA MARSICO FOCUSED EQUITIES FUND
TRUSTEES AND OFFICERS (continued)
Interested Trustee Affiliated with Investment Manager*
Name,
Address,
Year of Birth | | Position Held With
Funds and Length of
Service | | Principal Occupation
During Past Five Years | | Number of
Funds in the
Fund Family
Overseen by
Board Member | | Other Present or Past
Directorships/
Trusteeships
(Within Past 5 Years) | |
William F. Truscott
53600 Ameriprise
Financial Center
Minneapolis, MN 55474
1960 | | Board member since 11/01 for RiverSource Funds and since 6/11 for Nations Funds; Senior Vice President since 2002 for RiverSource Funds and since 5/10 for Nations Funds | | Chairman of the Board and President, Columbia Management Investment Advisers, LLC since May 2010 and February 2012, respectively (previously President and Chief Investment Officer, 2001-April 2010); Chief Executive Officer, Global Asset Management, Ameriprise Financial, Inc. since September 2012 (previously Chief Executive Officer, U.S. Asset Management & President, Annuities, May 2010-September 2012 and President — U.S. Asset Management and Chief Investment Officer, 2005-April 2010); Director and Chief Executive Officer, Columbia Management Investment Distributors, Inc. since May 2010 and February 2012, respectively (previously Chairman of the Board and Chief Executive Officer, 2006-April 2010); Chairman of the Board and Chief Executive Officer, RiverSource Distributors, Inc. since 2006; Director, Threadneedle Asset Management Holdings, SARL since 2014; President and Chief Executive Officer, Ameriprise Certificate Company, 2006-August 2012 | | | 186 | | | Former Director, Ameriprise Certificate Company, 2006-January 2013 | |
* Interested person (as defined under the 1940 Act) by reason of being an officer, director, security holder and/or employee of the Investment Manager or Ameriprise Financial.
The Statement of Additional Information has additional information about the Fund's Board members and is available, without charge, upon request by calling 800.345.6611; contacting your financial intermediary or visiting columbiathreadneedle.com/us.
Annual Report 2015
37
COLUMBIA MARSICO FOCUSED EQUITIES FUND
TRUSTEES AND OFFICERS (continued)
The Board has appointed officers who are responsible for day-to-day business decisions based on policies it has established. The officers serve at the pleasure of the Board. In addition to Mr. Truscott, who is Senior Vice President, the Funds' other officers are:
Fund Officers
Name,
Address and
Year of Birth | | Position and Year
First Appointed to
Position for any Fund
in the Columbia
Funds Complex or a
Predecessor Thereof | | Principal Occupation(s) During Past Five Years | |
Christopher O. Petersen
5228 Ameriprise
Financial Center
Minneapolis, MN 55474
Born 1970 | | President and Principal Executive Officer (2015) | | Vice President and Lead Chief Counsel, Ameriprise Financial, Inc. since January 2015 (previously, Vice President and Chief Counsel January 2010-December 2014; and Vice President and Group Counsel or Counsel 2004-January 2010); officer of Columbia Funds and affiliated funds since 2007. | |
Michael G. Clarke
225 Franklin Street
Boston, MA 02110
Born 1969 | | Treasurer (2011) and Chief Financial Officer (2009) | | Vice President — Mutual Fund Administration, Columbia Management Investment Advisers, LLC, since May 2010; Managing Director of Fund Administration, Columbia Management Advisors, LLC, September 2004-April 2010; senior officer of Columbia Funds and affiliated funds since 2002. | |
Paul B. Goucher
100 Park Avenue
New York, NY 10017
Born 1968 | | Senior Vice President (2011), Chief Legal Officer (2015) and Assistant Secretary (2008) | | Vice President and Lead Chief Counsel, Ameriprise Financial, Inc. since November 2008 and January 2013, respectively (previously Chief Counsel, January 2010-January 2013 and Group Counsel, November 2008-January 2010). | |
Thomas P. McGuire
225 Franklin Street
Boston, MA 02110
Born 1972 | | Vice President and Chief Compliance Officer (2012) | | Vice President — Asset Management Compliance, Ameriprise Financial, Inc., since May 2010; Chief Compliance Officer, Ameriprise Certificate Company since September 2010; Compliance Executive, Bank of America, 2005-April 2010. | |
Colin Moore
225 Franklin Street
Boston, MA 02110
Born 1958 | | Senior Vice President (2010) | | Executive Vice President and Global Chief Investment Officer, Ameriprise Financial, Inc., since July 2013; Director and Global Chief Investment Officer, Columbia Management Investment Advisers, LLC since May 2010; Manager, Managing Director and Chief Investment Officer, Columbia Management Advisors, LLC, 2007-April 2010. | |
Michael E. DeFao
225 Franklin Street
Boston, MA 02110
Born 1968 | | Vice President (2011) and Assistant Secretary (2010) | | Vice President and Chief Counsel, Ameriprise Financial, Inc. since May 2010; Associate General Counsel, Bank of America, 2005-April 2010. | |
Joseph F. DiMaria
225 Franklin Street
Boston, MA 02110
Born 1968 | | Vice President (2011), Assistant Treasurer (2012) and Chief Accounting Officer (2008) | | Vice President — Mutual Fund Treasurer, Columbia Management Investment Advisers, LLC since May 2010; Director of Fund Administration, Columbia Management Advisors, LLC, 2006-April 2010. | |
Amy Johnson
5228 Ameriprise
Financial Center
Minneapolis, MN 55474
Born 1965 | | Vice President (2006) | | Managing Director and Chief Operating Officer, Columbia Management Investment Advisers, LLC since May 2010 (previously Chief Administrative Officer, 2009-April 2010, and Vice President — Asset Management and Trust Company Services, 2006-2009). | |
Lyn Kephart-Strong
5228 Ameriprise
Financial Center
Minneapolis, MN 55474
Born 1960 | | Vice President (2015) | | President, Columbia Management Investment Services Corp. since October 2014; Vice President & Resolution Officer, Ameriprise Trust Company since August 2009; President, RiverSource Service Corporation 2004-2010. | |
Ryan C. Larrenaga
225 Franklin Street
Boston, MA 02110
Born 1970 | | Vice President and Secretary (2015) | | Vice President and Group Counsel, Ameriprise Financial, Inc. since August 2011 (previously, Counsel from May 2010 to August 2011); Assistant General Counsel, Bank of America, 2005-April 2010; officer of Columbia Funds and affiliated funds since 2005. | |
Annual Report 2015
38
COLUMBIA MARSICO FOCUSED EQUITIES FUND
IMPORTANT INFORMATION ABOUT THIS REPORT
Each fund mails one shareholder report to each shareholder address. If you would like more than one report, please call shareholder services at 800.345.6611 and additional reports will be sent to you.
The policy of the Board is to vote the proxies of the companies in which each fund holds investments consistent with the procedures as stated in the Statement of Additional Information (SAI). You may obtain a copy of the SAI without charge by calling 800.345.6611; contacting your financial intermediary; visiting columbiathreadneedle.com/us; or searching the website of the Securities and Exchange Commission (SEC) at sec.gov. Information regarding how each fund voted proxies relating to portfolio securities is filed with the SEC by August 31st for the most recent 12-month period ending June 30th of that year, and is available without charge by visiting columbiathreadneedle.com/us; or searching the website of the SEC at sec.gov.
Each fund files a complete schedule of portfolio holdings with the SEC for the first and third quarters of each fiscal year on Form N-Q. Each fund's Form N-Q is available on the SEC's website at sec.gov and may be reviewed and copied at the SEC's Public Reference Room in Washington, D.C. Information on the operation of the Public Reference Room may be obtained by calling 800.SEC.0330. Each fund's complete schedule of portfolio holdings, as filed on Form N-Q, can also be obtained without charge, upon request, by calling 800.345.6611.
Annual Report 2015
39
Columbia Marsico Focused Equities Fund
P.O. Box 8081
Boston, MA 02266-8081

This information is for use with concurrent or prior delivery of a fund prospectus. Please read and consider the investment objectives, risks, charges and expenses for any fund carefully before investing. For a prospectus and summary prospectus, which contains this and other important information about the Fund, go to columbiathreadneedle.com/us. The Fund is distributed by Columbia Management Investment Distributors, Inc., member FINRA, and managed by Columbia Management Investment Advisers, LLC.
Columbia Threadneedle Investments (Columbia Threadneedle) is the global brand name of the Columbia and Threadneedle group of companies.
All rights reserved. Columbia Management Investment Distributors, Inc., 225 Franklin Street, Boston, MA 02110-2804
© 2015 Columbia Management Investment Advisers, LLC.
columbiathreadneedle.com/us
ANN186_02_E01_(04/15)

ANNUAL REPORT
February 28, 2015

COLUMBIA MARSICO INTERNATIONAL OPPORTUNITIES FUND
(to be renamed Columbia International Opportunities Fund, effective May 1, 2015)

ABOUT COLUMBIA THREADNEEDLE INVESTMENTS
Columbia Threadneedle Investments is a leading global asset management group that provides a broad range of actively managed investment strategies and solutions for individual, institutional and corporate clients around the world.
With more than 2,000 people, including over 450 investment professionals based in North America, Europe and Asia, we manage $506 billion* of assets across developed and emerging market equities, fixed income, asset allocation solutions and alternatives. We are the 11th largest manager of long-term mutual fund assets in the U.S.** and the 5th largest manager of retail funds in the U.K.***
Our priority is the investment success of our clients. We aim to deliver the investment outcomes they expect through an investment approach that is team-based, performance-driven and risk-aware. Our culture is dynamic and interactive. By sharing our insights across asset classes and geographies, we generate richer perspectives on global, regional and local investment landscapes. The ability to exchange and debate investment ideas in a collaborative environment enriches our teams' investment processes. More importantly, it results in better informed investment decisions for our clients.
Columbia funds are distributed by Columbia Management Investment Distributors, Inc., member FINRA, and managed by Columbia Management Investment Advisers, LLC.
Columbia Threadneedle Investments (Columbia Threadneedle) is the global brand name of the Columbia and Threadneedle group of companies.
* In U.S. dollars as of December 31, 2014. Source: Ameriprise Q4 Earnings Release. Includes all assets managed by entities in the Columbia and Threadneedle groups of companies. Contact us for more current data.
** Source: ICI as of December 31, 2014 for Columbia Management Investment Advisers, LLC.
*** Source: Investment Association as of December 2014 for Threadneedle Asset Management Limited.
© 2015 Columbia Management Investment Advisers, LLC. All rights reserved.
Not part of the shareholder report
Get the market insight you need from our investment experts
Connect with Columbia Threadneedle Investments
Investor insight
Find economic and market commentary, investment videos, white papers, mutual fund commentary and more at columbiathreadneedle.com/us.
Columbia Threadneedle Investor Newsletter (e-newsletter)
Read our award-winning* shareholder newsletter. Our quarterly newsletter is available online and provides timely and relevant content about economic trends, fund news, service enhancements and changes. Sign up to receive the newsletter electronically at columbiathreadneedle.com/
us/newsletter.
Investment videos
Get analysis of current events and trends that may affect your investments. Visit our online video library to watch and discover what our thought leaders are saying about the financial markets and economy.
Social media
We offer you multiple ways to access our market commentary and investment insights.
n Perspectives blog at columbiathreadneedle.com/us
Read timely posts by our investment team, including our chief investment officer, chief economist and portfolio managers.
n twitter.com/CTinvest_US
Follow us on Twitter for quick, up-to-the-minute comments on market news and more.
n youtube.com/CTinvestUS
View our commentaries on the economy, markets and current investment opportunities.
n linkedin.com/company/columbia-threadneedle-investments-us
Connect with us on LinkedIn for updates from our thought leaders.
*Columbia Threadneedle Investor Newsletter was awarded top honors in the Mutual Fund Education Alliance STAR Awards competition for excellence in mutual fund marketing and communications in 2011, 2012 and 2013. Materials in the competition were evaluated on educational value, message comprehension, effective design and objectives.
Not part of the shareholder report
Stay informed
Become a subscriber to receive the latest investment publications and mutual fund commentaries
Subscribe to Columbia Threadneedle Investments
Email subscription center
Subscribe to the latest information from Columbia Threadneedle. Visit our email subscription center at columbiathreadneedle.com/us/subscribe to register for economic and market commentary, product and service updates, white papers and more.
n Columbia Threadneedle Investor Newsletter
Quarterly newsletter featuring the latest macro- and micro-economic trends, investment themes, products, service changes and other items of interest to our investors
n Investment Strategy Outlook
Quarterly publication featuring the Columbia Threadneedle Asset Allocation Team's perspective on global economic investment conditions and markets
n MarketTrack
Quarterly publication featuring more than 40 charts and graphs that highlight the current state of the economy and the markets; includes straightforward insight on current investment opportunities
n White papers
Frequent articles that delve deep into a variety of investment topics
n Mutual fund updates
Quarterly portfolio manager commentary and fund fact sheets available for Columbia funds. (Not all funds have a commentary.)
Register your information online at columbiathreadneedle.com/us/subscribe and select the publications you would like to receive. Update your subscriptions at any time by accessing the email subscription center.
CT-MK (03/15) 5383/1125800
 Dear Shareholder,
In a world that is changing faster than ever before, investors want asset managers who offer a global perspective while generating strong and sustainable returns. To that end, Columbia Management, in conjunction with its U.K.-based affiliate, Threadneedle Investments, has rebranded to Columbia Threadneedle Investments. The new global brand represents the combined capabilities, resources and reach of the global group, offering investors access to the best of both firms.
With a presence in 18 countries and more than 450 investment professionals*, our collective perspective and world view as Columbia Threadneedle Investments gives us deeper insight into what might affect the real-life financial outcomes clients are seeking. Putting our views into a global context enables us to build richer perspectives and create the right solutions, and provides us with enhanced capabilities to deliver consistent investment performance, which may ultimately lead to better investor outcomes.
As a result of the rebrand, you will begin to see our new logo and colors reflected in printed materials, such as this shareholder report, as well as on our new website — columbiathreadneedle.com/us. We encourage you to visit us online and view a new video on the "About Us" tab that speaks to the strength of the firm.
While we are introducing a new brand, in many ways, the investment company you know well has not changed. The following remain in effect:
n Fund and strategy names
n Established investment teams, philosophies and processes
n Account services, features, servicing phone numbers and mailing addresses
n Columbia Management Investment Distributors as distributor and Columbia Management Investment Advisers as investment adviser
We recognize that the money we manage represents the hard work and savings of people like you, and that everyone has different ambitions and different definitions of success. Investors have varying goals — funding their children's education, enjoying their retirement, putting money aside for unexpected events, and more. Whatever your ambitions, we believe our wide range of investment products and solutions can help give you confidence that you will reach your goals.
The world is constantly changing, but our priority remains the same: to help you secure your finances, meet your goals and achieve success. Thank you for your continued investment with us. Our service representatives are available at 800.345.6611 to help with any questions.
Sincerely,

Christopher O. Petersen
President, Columbia Funds
Investors should consider the investment objectives, risks, charges and expenses of a mutual fund carefully before investing. For a free prospectus and summary prospectus, which contains this and other important information about a fund, visit columbiathreadneedle.com/us. The prospectus should be read carefully before investing.
* Source: Ameriprise as of December 1, 2014
Columbia Funds are distributed by Columbia Management Investment Distributors, Inc., member FINRA, and managed by Columbia Management Investment Advisers, LLC.
© 2015 Columbia Management Investment Advisers, LLC. All rights reserved.
COLUMBIA MARSICO INTERNATIONAL OPPORTUNITIES FUND
Fund Investment Manager
Columbia Management Investment
Advisers, LLC
225 Franklin Street
Boston, MA 02110
Fund Distributor
Columbia Management Investment
Distributors, Inc.
225 Franklin Street
Boston, MA 02110
Fund Transfer Agent
Columbia Management Investment
Services Corp.
P.O. Box 8081
Boston, MA 02266-8081
For more information about any of the funds, please visit columbiathreadneedle.com/us or call 800.345.6611. Customer Service Representatives are available to answer your questions Monday through Friday from 8 a.m. to 7 p.m. Eastern time.
The views expressed in this report reflect the current views of the respective parties. These views are not guarantees of future performance and involve certain risks, uncertainties and assumptions that are difficult to predict, so actual outcomes and results may differ significantly from the views expressed. These views are subject to change at any time based upon economic, market or other conditions and the respective parties disclaim any responsibility to update such views. These views may not be relied on as investment advice and, because investment decisions for a Columbia fund are based on numerous factors, may not be relied on as an indication of trading intent on behalf of any particular Columbia fund. References to specific securities should not be construed as a recommendation or investment advice.
Performance Overview | | | 3 | | |
Manager Discussion of Fund Performance | | | 5 | | |
Understanding Your Fund's Expenses | | | 8 | | |
Portfolio of Investments | | | 9 | | |
Statement of Assets and Liabilities | | | 12 | | |
Statement of Operations | | | 14 | | |
Statement of Changes in Net Assets | | | 15 | | |
Financial Highlights | | | 17 | | |
Notes to Financial Statements | | | 24 | | |
Report of Independent Registered
Public Accounting Firm | | | 31 | | |
Federal Income Tax Information | | | 32 | | |
Trustees and Officers | | | 33 | | |
Important Information About This Report | | | 39 | | |
COLUMBIA MARSICO INTERNATIONAL OPPORTUNITIES FUND
Performance Summary
n Columbia Marsico International Opportunities Fund (the Fund) Class A shares returned 2.18% excluding sales charges for the 12-month period that ended February 28, 2015.
n The Fund outperformed its benchmark, the MSCI EAFE Index (Net), which returned -0.03% during the same time period.
n The currency effect was the most significant contributor to Fund performance. The Fund also benefited from an overweight relative to the benchmark in the information technology, consumer discretionary and healthcare sectors, while maintaining little exposure to energy, which was the weakest performing sector in the benchmark.
Average Annual Total Returns (%) (for period ended February 28, 2015)
| | | Inception | | 1 Year | | 5 Years | | 10 Years | |
Class A | | 08/01/00 | | | | | | | | | | | | | |
Excluding sales charges | | | | | | | 2.18 | | | | 7.47 | | | | 5.03 | | |
Including sales charges | | | | | | | -3.68 | | | | 6.20 | | | | 4.41 | | |
Class B | | 08/01/00 | | | | | | | | | | | | | |
Excluding sales charges | | | | | | | 1.43 | | | | 6.67 | | | | 4.25 | | |
Including sales charges | | | | | | | -3.57 | | | | 6.36 | | | | 4.25 | | |
Class C | | 08/01/00 | | | | | | | | | | | | | |
Excluding sales charges | | | | | | | 1.43 | | | | 6.67 | | | | 4.24 | | |
Including sales charges | | | | | | | 0.43 | | | | 6.67 | | | | 4.24 | | |
Class I* | | 09/27/10 | | | 2.60 | | | | 7.98 | | | | 5.28 | | |
Class R* | | 01/23/06 | | | 1.94 | | | | 7.20 | | | | 4.78 | | |
Class R4* | | 11/08/12 | | | 2.45 | | | | 7.59 | | | | 5.09 | | |
Class Z | | 08/01/00 | | | 2.46 | | | | 7.74 | | | | 5.29 | | |
MSCI EAFE Index (Net) | | | | | | | -0.03 | | | | 7.78 | | | | 4.84 | | |
Returns for Class A are shown with and without the maximum initial sales charge of 5.75%. Returns for Class B are shown with and without the applicable contingent deferred sales charge (CDSC) of 5.00% in the first year, declining to 1.00% in the sixth year and eliminated thereafter. Returns for Class C are shown with and without the 1.00% CDSC for the first year only. The Fund's other classes are not subject to sales charges and have limited eligibility. Please see the Fund's prospectus for details. Performance for different share classes will vary based on differences in sales charges and fees associated with each class. All results shown assume reinvestment of distributions during the period. Returns do not reflect the deduction of taxes that a shareholder may pay on Fund distributions or on the redemption of Fund shares. Performance results reflect the effect of any fee waivers or reimbursements of Fund expenses by Columbia Management Investment Advisers, LLC and/or any of its affiliates. Absent these fee waivers or expense reimbursement arrangements, performance results would have been lower.
The performance information shown represents past performance and is not a guarantee of future results. The investment return and principal value of your investment will fluctuate so that your shares, when redeemed, may be worth more or less than their original cost. Current performance may be lower or higher than the performance information shown. You may obtain performance information current to the most recent month-end by contacting your financial intermediary, visiting columbiathreadneedle.com/us or calling 800.345.6611.
*The returns shown for periods prior to the share class inception date (including returns for the Life of the Fund, if shown, which are since Fund inception) include the returns of the Fund's oldest share class. Since the Fund launched more than one class of shares at its inception, Class A shares were used. These returns are adjusted to reflect any higher class-related operating expenses of the newer share classes, as applicable. Please visit columbiathreadneedle.com/us/investment-products/mutual-funds/appended-performance for more information.
The MSCI EAFE Index (Net) is a free float-adjusted market capitalization index that is designed to measure the equity market performance of developed markets, excluding the U.S. and Canada. The index is compiled from a composite of securities markets of Europe, Australasia and the Far East and is widely recognized by investors in foreign markets as the measurement index for portfolios of non-North American securities.
Indices are not available for investment, are not professionally managed and do not reflect sales charges, fees, brokerage commissions, taxes (except the MSCI EAFE Index (Net), which reflects reinvested dividends net of withholding taxes) or other expenses of investing. Securities in the Fund may not match those in an index.
Annual Report 2015
3
COLUMBIA MARSICO INTERNATIONAL OPPORTUNITIES FUND
PERFORMANCE OVERVIEW (continued)
Performance of a Hypothetical $10,000 Investment (March 1, 2005 – February 28, 2015)

The chart above shows the change in value of a hypothetical $10,000 investment in Class A shares of Columbia Marsico International Opportunities Fund during the stated time period, and does not reflect the deduction of taxes that a shareholder may pay on Fund distributions or on the redemption of Fund shares.
Annual Report 2015
4
COLUMBIA MARSICO INTERNATIONAL OPPORTUNITIES FUND
MANAGER DISCUSSION OF FUND PERFORMANCE
Effective May 1, 2015, the Fund will be renamed Columbia International Opportunities Fund. At that time, Columbia Management Investment Advisers, LLC will replace Marsico Capital Management, LLC in providing day-to-day management of the Fund's portfolio.
For the 12-month period that ended February 28, 2015, the Fund's Class A shares returned 2.18% excluding sales charges. The Fund outperformed its benchmark, the MSCI EAFE Index (Net), which returned -0.03% for the same time period. The currency effect was the most significant contributor to Fund performance. The Fund also benefited from an overweight relative to the benchmark in the information technology, consumer discretionary and healthcare sectors, while maintaining little exposure to energy, which was the weakest performing sector in the benchmark.
International Stock Markets Were Volatile as Oil Prices Fell
International stock markets were volatile and posted mixed results during the reporting period. During the second half of the period, crude oil prices fell sharply, trading at their lowest levels since 2009, although they did rebound slightly toward the end of the period. The decline stemmed in part from slowing growth in demand, as reflected in China's continuing economic sputter, and stagnating growth in Europe. Importantly, increased oil supply was also a primary contributor to falling prices, as fracking technologies drove petroleum supplies higher in the U.S., while other countries maintained or increased production.
The U.S. dollar strengthened vs. many other major world currencies during the period, a reflection of growing confidence in the U.S. economy and a firming of short-term interest rates, along with widespread expectations of quantitative easing from the European Central Bank and the Bank of Japan.
Portfolio Recap
The currency effect was the most significant contributor to performance during the period. The Fund was overweight relative to the benchmark in stocks denominated in the U.S. dollar and British pound sterling, both of which strengthened significantly against other major currencies. The Fund was also underweight in equities denominated in Japanese yen which depreciated vs. other major currencies. Although currency had a positive effect on performance, it is a by-product, not a central focus, of our stock selection process.
The Fund benefited from its stock selection and overweight in healthcare, which was among the top-contributing sectors within the benchmark. Gilead Sciences, for example, benefited from FDA approval of its revolutionary hepatitis C drugs, Solvadi and Harnovi. Solvadi, is a single pill that is being used with an amalgam of other, older drugs to treat hepatitis C, while Harnovi, with its once-per-day fixed dose combination treatment, is expected to be a major improvement over existing treatment options.
Portfolio Management
Marsico Capital Management, LLC
Munish Malhotra, CFA
Effective May 1, 2015, Simon Haines, William Davies and David Dudding will replace Munish Malhotra as Portfolio Managers of the Fund and Marsico Capital Management, LLC will no longer serve as subadviser to the Fund.
Morningstar Style BoxTM

The Morningstar Style BoxTM is based on a fund's portfolio holdings. For equity funds, the vertical axis shows the market capitalization of the stocks owned, and the horizontal axis shows investment style (value, blend, or growth). Information shown is based on the most recent data provided by Morningstar.
© 2015 Morningstar, Inc. All rights reserved. The Morningstar information contained herein: (1) is proprietary to Morningstar and/or its content providers; (2) may not be copied or distributed; and (3) is not warranted to be accurate, complete or timely. Neither Morningstar nor its content providers are responsible for any damages or losses arising from any use of this information.
Annual Report 2015
5
COLUMBIA MARSICO INTERNATIONAL OPPORTUNITIES FUND
MANAGER DISCUSSION OF FUND PERFORMANCE (continued)
Top Ten Holdings (%)
(at February 28, 2015) | |
Liberty Global PLC, Class C
(United Kingdom) | | | 6.1 | | |
Canadian Pacific Railway Ltd.
(Canada) | | | 5.0 | | |
Tencent Holdings Ltd. (China) | | | 4.8 | | |
Baidu, Inc., ADR (China) | | | 4.0 | | |
Endo International PLC
(United States) | | | 4.0 | | |
ASML Holding NV (Netherlands) | | | 4.0 | | |
Alibaba Group Holding Ltd.,
ADR (China) | | | 3.9 | | |
MasterCard, Inc., Class A
(United States) | | | 3.4 | | |
Hargreaves Lansdown PLC
(United Kingdom) | | | 3.3 | | |
Domino's Pizza Group PLC
(United Kingdom) | | | 3.2 | | |
Percentages indicated are based upon total investments (excluding Money Market Funds).
For further detail about these holdings, please refer to the section entitled "Portfolio of Investments."
Fund holdings are as of the date given, are subject to change at any time, and are not recommendations to buy or sell any security.
Portfolio Breakdown (%)
(at February 28, 2015) | |
Common Stocks | | | 98.8 | | |
Consumer Discretionary | | | 28.4 | | |
Consumer Staples | | | 4.9 | | |
Financials | | | 4.7 | | |
Health Care | | | 19.4 | | |
Industrials | | | 9.7 | | |
Information Technology | | | 31.7 | | |
Money Market Funds | | | 1.2 | | |
Total | | | 100.0 | | |
Percentages indicated are based upon total investments. The Fund's portfolio composition is subject to change.
Liberty Global, the largest cable operator in Europe, emerged as the largest contributor to Fund performance. The company benefited from synergies created by its acquisition of U.K.-based internet provider Virgin Media in 2013 and the completion of its tender offer for Netherlands-based cable operator Ziggo. Liberty Global is also capitalizing on the consolidation of Europe's fragmented telecommunications industry and from increasing demand for bundles of television, telephone and broadband services. Netherlands-based ASML Holding also performed well. The company has an 85% market share in the manufacture of lithography machines that print circuits onto silicon chips. ASML's shares rose after it met milestones in the development of extreme-ultraviolet (EUV) lithography.
Stock selection in consumer discretionary was the primary source of underperformance during the period. Among individual detractors, Sands China's stock struggled in the face of a weakening Chinese economy and the Chinese government's anticorruption campaign. Because we believe these headwinds will persist, at least in the near term, we sold the position. Meanwhile, shares of sporting goods manufacturer Adidas declined after the company issued a profit warning in July. The announcement surprised investors who expected an increase in World Cup-related sales. The company blamed the earnings shortfall on the impact of a weak euro, weak sales in Russia, disappointing results from its golf division and, ironically, the cost of World Cup marketing.
Portfolio Activity
We initiated a position in Tencent Holdings, China's largest social network with a reported 82 million users, representing 75% of China's internet population. Online advertising penetration is still low in China, and Tencent has an opportunity to generate significant revenue as online advertising grows. The Fund also added Ireland-based Endo Holdings, a company that makes and markets pharmaceutical and generic drugs. The company has been adding to its portfolio through acquisitions and lessening its dependence on old-line generics as it transitions to a growth-oriented specialty pharmaceutical company. We also purchased Alibaba Group Holding, a company that enables Chinese consumers to "leapfrog" physical retail merchants and use online and mobile devices to order goods.
We sold Hong Kong-based Anton Oilfield Services because of management's inability to execute amid uncertainty around declining global oil prices and the slowing Chinese economy. Another Hong Kong company, AIA Group, was sold as we felt the stock lacked near-term catalysts to move it higher. We also sold Mexico-based Alsea, which operates Domino's Pizza, Starbucks, Burger King and other franchise outlets in South America. We sold the stock after what we considered to be a questionable acquisition in Spain that wasn't consistent with the company's Latin American growth strategy.
Looking Ahead
Two key issues affecting stock markets at the end of the period were declining oil prices (and their commensurate effects) and central bank
Annual Report 2015
6
COLUMBIA MARSICO INTERNATIONAL OPPORTUNITIES FUND
MANAGER DISCUSSION OF FUND PERFORMANCE (continued)
policies. On balance, we believe lower oil prices improve prospects for growth and low inflation. Thus, we anticipate the slide in oil prices to be a positive for the U.S. economy as well as other countries which are net importers of oil, such as China, Japan and India. We believe oil prices will eventually move higher as fracking activity eases and supply tightens. We will continue to monitor the economic effects and geopolitical consequences of potentially extended and deeper reductions in oil prices.
As always, we continue to favor investments in companies that we believe are gaining market share in large and growing markets. The Fund emphasizes investments in businesses with strong recurring revenues, strong free cash flow generation, pricing power and responsible capital allocation. We are also evaluating investment opportunities in companies that are poised to benefit from increased pricing power in their businesses as a result of consolidation. In this lower growth environment, share buybacks and dividends may be material contributors to total returns.
Country Breakdown (%)
(at February 28, 2015) | |
Australia | | | 2.6 | | |
Belgium | | | 5.9 | | |
Bermuda | | | 3.0 | | |
Canada | | | 14.1 | | |
China | | | 12.6 | | |
France | | | 1.9 | | |
Germany | | | 5.7 | | |
Hong Kong | | | 1.5 | | |
India | | | 2.0 | | |
Ireland | | | 5.8 | | |
Japan | | | 3.5 | | |
Netherlands | | | 6.8 | | |
Switzerland | | | 4.5 | | |
United Kingdom | | | 16.9 | | |
United States(a) | | | 13.2 | | |
Total | | | 100.0 | | |
Country Breakdown is based primarily on issuer's place of organization/incorporation. Percentages indicated are based upon total investments. The Fund's portfolio composition is subject to change.
(a) Includes investments in Money Market Funds.
Investment Risks
Market risk may affect a single issuer, sector of the economy, industry or the market as a whole. Growth securities, at times, may not perform as well as value securities or the stock market in general and may be out of favor with investors. International investing involves certain risks and volatility due to potential political, economic or currency instabilities and different financial and accounting standards. Risks are enhanced for emerging market issuers. See the Fund's prospectus for more information on these and other risks.
Annual Report 2015
7
COLUMBIA MARSICO INTERNATIONAL OPPORTUNITIES FUND
UNDERSTANDING YOUR FUND'S EXPENSES
(Unaudited)
As an investor, you incur two types of costs. There are transaction costs, which generally include sales charges on purchases and may include redemption fees. There are also ongoing costs, which generally include management fees, distribution and/or service fees, and other fund expenses. The following information is intended to help you understand your ongoing costs (in dollars) of investing in the Fund and to help you compare these costs with the ongoing costs of investing in other mutual funds.
Analyzing Your Fund's Expenses
To illustrate these ongoing costs, we have provided examples and calculated the expenses paid by investors in each share class of the Fund during the period. The actual and hypothetical information in the table is based on an initial investment of $1,000 at the beginning of the period indicated and held for the entire period. Expense information is calculated two ways and each method provides you with different information. The amount listed in the "Actual" column is calculated using the Fund's actual operating expenses and total return for the period. You may use the Actual information, together with the amount invested, to estimate the expenses that you paid over the period. Simply divide your account value by $1,000 (for example, an $8,600 account value divided by $1,000 = 8.6), then multiply the results by the expenses paid during the period under the "Actual" column. The amount listed in the "Hypothetical" column assumes a 5% annual rate of return before expenses (which is not the Fund's actual return) and then applies the Fund's actual expense ratio for the period to the hypothetical return. You should not use the hypothetical account values and expenses to estimate either your actual account balance at the end of the period or the expenses you paid during the period. See "Compare With Other Funds" below for details on how to use the hypothetical data.
Compare With Other Funds
Since all mutual funds are required to include the same hypothetical calculations about expenses in shareholder reports, you can use this information to compare the ongoing cost of investing in the Fund with other funds. To do so, compare the hypothetical example with the 5% hypothetical examples that appear in the shareholder reports of other funds. As you compare hypothetical examples of other funds, it is important to note that hypothetical examples are meant to highlight the ongoing costs of investing in a fund only and do not reflect any transaction costs, such as sales charges, or redemption or exchange fees. Therefore, the hypothetical calculations are useful in comparing ongoing costs only, and will not help you determine the relative total costs of owning different funds. If transaction costs were included in these calculations, your costs would be higher.
September 1, 2014 – February 28, 2015
| | | Account Value at the Beginning
of the Period ($) | | Account Value at the End of the
Period ($) | | Expenses Paid During the
Period ($) | | Fund's Annualized
Expense Ratio (%) | |
| | | Actual | | Hypothetical | | Actual | | Hypothetical | | Actual | | Hypothetical | | Actual | |
Class A | | | 1,000.00 | | | | 1,000.00 | | | | 1,038.90 | | | | 1,017.60 | | | | 7.47 | | | | 7.39 | | | | 1.47 | | |
Class B | | | 1,000.00 | | | | 1,000.00 | | | | 1,034.70 | | | | 1,013.86 | | | | 11.26 | | | | 11.15 | | | | 2.22 | | |
Class C | | | 1,000.00 | | | | 1,000.00 | | | | 1,034.70 | | | | 1,013.86 | | | | 11.26 | | | | 11.15 | | | | 2.22 | | |
Class I | | | 1,000.00 | | | | 1,000.00 | | | | 1,040.40 | | | | 1,019.50 | | | | 5.54 | | | | 5.49 | | | | 1.09 | | |
Class R | | | 1,000.00 | | | | 1,000.00 | | | | 1,037.70 | | | | 1,016.36 | | | | 8.74 | | | | 8.65 | | | | 1.72 | | |
Class R4 | | | 1,000.00 | | | | 1,000.00 | | | | 1,039.90 | | | | 1,018.85 | | | | 6.20 | | | | 6.14 | | | | 1.22 | | |
Class Z | | | 1,000.00 | | | | 1,000.00 | | | | 1,039.40 | | | | 1,018.85 | | | | 6.20 | | | | 6.14 | | | | 1.22 | | |
Expenses paid during the period are equal to the annualized expense ratio for each class as indicated above, multiplied by the average account value over the period and then multiplied by the number of days in the Fund's most recent fiscal half year and divided by 365.
Expenses do not include fees and expenses incurred indirectly by the Fund from its investment in underlying funds, including affiliated and non-affiliated pooled investment vehicles, such as mutual funds and exchange-traded funds.
Had Columbia Management Investment Advisers, LLC and/or certain of its affiliates not waived/reimbursed certain fees and expenses, account value at the end of the period would have been reduced.
Annual Report 2015
8
COLUMBIA MARSICO INTERNATIONAL OPPORTUNITIES FUND
PORTFOLIO OF INVESTMENTS
February 28, 2015
(Percentages represent value of investments compared to net assets)
Common Stocks 99.8%
Issuer | | Shares | | Value ($) | |
AUSTRALIA 2.6% | |
Domino's Pizza Enterprises Ltd. | | | 83,878 | | | | 2,280,223 | | |
BELGIUM 6.0% | |
Anheuser-Busch InBev NV | | | 20,897 | | | | 2,658,851 | | |
UCB SA | | | 32,791 | | | | 2,508,088 | | |
Total | | | | | 5,166,939 | | |
BERMUDA 3.0% | |
Norwegian Cruise Line Holdings Ltd.(a) | | | 53,013 | | | | 2,614,601 | | |
CANADA 14.3% | |
Canadian Pacific Railway Ltd. | | | 23,190 | | | | 4,342,676 | | |
Constellation Software, Inc. | | | 2,491 | | | | 838,901 | | |
Gildan Activewear, Inc. | | | 29,000 | | | | 1,763,755 | | |
Novadaq Technologies, Inc.(a) | | | 91,565 | | | | 1,515,401 | | |
Restaurant Brands International, Inc. | | | 29,800 | | | | 1,317,293 | | |
Valeant Pharmaceuticals International, Inc.(a) | | | 13,098 | | | | 2,580,309 | | |
Total | | | | | 12,358,335 | | |
CHINA 12.7% | |
Alibaba Group Holding Ltd., ADR(a) | | | 40,107 | | | | 3,413,908 | | |
Baidu, Inc., ADR(a) | | | 17,067 | | | | 3,477,401 | | |
Tencent Holdings Ltd. | | | 236,700 | | | | 4,129,882 | | |
Total | | | | | 11,021,191 | | |
FRANCE 1.9% | |
Remy Cointreau SA | | | 22,376 | | | | 1,643,366 | | |
GERMANY 5.8% | |
Bayerische Motoren Werke AG | | | 19,298 | | | | 2,440,284 | | |
Infineon Technologies AG | | | 222,749 | | | | 2,578,670 | | |
Total | | | | | 5,018,954 | | |
HONG KONG 1.5% | |
Wynn Macau Ltd. | | | 494,400 | | | | 1,294,872 | | |
INDIA 2.0% | |
Tata Motors Ltd., ADR | | | 35,764 | | | | 1,760,304 | | |
IRELAND 5.9% | |
Actavis PLC(a) | | | 9,017 | | | | 2,627,193 | | |
Ryanair Holdings PLC, ADR | | | 38,788 | | | | 2,457,220 | | |
Total | | | | | 5,084,413 | | |
Common Stocks (continued)
Issuer | | Shares | | Value ($) | |
JAPAN 3.5% | |
FANUC Corp. | | | 8,900 | | | | 1,709,592 | | |
Start Today Co., Ltd. | | | 53,900 | | | | 1,310,870 | | |
Total | | | | | 3,020,462 | | |
NETHERLANDS 6.9% | |
| ASML Holding NV | | | 31,724 | | | | 3,429,727 | | |
NXP Semiconductors NV(a) | | | 30,098 | | | | 2,555,170 | | |
Total | | | | | 5,984,897 | | |
SWITZERLAND 4.5% | |
Novartis AG, Registered Shares | | | 25,112 | | | | 2,566,911 | | |
Partners Group Holding AG | | | 4,309 | | | | 1,323,186 | | |
Total | | | | | 3,890,097 | | |
UNITED KINGDOM 17.1% | |
ARM Holdings PLC | | | 145,235 | | | | 2,598,723 | | |
| ASOS PLC(a) | | | 26,411 | | | | 1,319,468 | | |
Domino's Pizza Group PLC | | | 251,347 | | | | 2,803,605 | | |
Hargreaves Lansdown PLC | | | 162,640 | | | | 2,837,338 | | |
Liberty Global PLC, Class C(a) | | | 101,121 | | | | 5,275,483 | | |
Total | | | | | 14,834,617 | | |
UNITED STATES 12.1% | |
Alkermes PLC(a) | | | 24,260 | | | | 1,704,265 | | |
Endo International PLC(a) | | | 40,332 | | | | 3,452,419 | | |
MasterCard, Inc., Class A | | | 33,086 | | | | 2,982,041 | | |
Micron Technology, Inc.(a) | | | 56,920 | | | | 1,745,737 | | |
Wayfair, Inc., Class A(a) | | | 27,422 | | | | 640,304 | | |
Total | | | | | 10,524,766 | | |
Total Common Stocks
(Cost: $72,972,436) | | | | | 86,498,037 | | |
Money Market Funds 1.2%
| | | Shares | | Value ($) | |
Columbia Short-Term Cash Fund,
0.118%(b)(c) | | | 1,030,338 | | | | 1,030,338 | | |
Total Money Market Funds
(Cost: $1,030,338) | | | | | 1,030,338 | | |
Total Investments
(Cost: $74,002,774) | | | | | 87,528,375 | | |
Other Assets & Liabilities, Net | | | | | (862,728 | ) | |
Net Assets | | | | | 86,665,647 | | |
The accompanying Notes to Financial Statements are an integral part of this statement.
Annual Report 2015
9
COLUMBIA MARSICO INTERNATIONAL OPPORTUNITIES FUND
PORTFOLIO OF INVESTMENTS (continued)
February 28, 2015
Notes to Portfolio of Investments
(a) Non-income producing.
(b) The rate shown is the seven-day current annualized yield at February 28, 2015.
(c) As defined in the Investment Company Act of 1940, an affiliated company is one in which the Fund owns 5% or more of the company's outstanding voting securities, or a company which is under common ownership or control with the Fund. Holdings and transactions in these affiliated companies during the year ended February 28, 2015, are as follows:
Issuer | | Beginning
Cost ($) | | Purchase
Cost ($) | | Proceeds
From Sales ($) | | Ending
Cost ($) | | Dividends —
Affiliated
Issuers ($) | | Value ($) | |
Columbia Short-Term Cash Fund | | | 14,356,974 | | | | 93,639,689 | | | | (106,966,325 | ) | | | 1,030,338 | | | | 3,500 | | | | 1,030,338 | | |
Abbreviation Legend
ADR American Depositary Receipt
Fair Value Measurements
Generally accepted accounting principles (GAAP) require disclosure regarding the inputs and valuation techniques used to measure fair value and any changes in valuation inputs or techniques. In addition, investments shall be disclosed by major category.
The Fund categorizes its fair value measurements according to a three-level hierarchy that maximizes the use of observable inputs and minimizes the use of unobservable inputs by prioritizing that the most observable input be used when available. Observable inputs are those that market participants would use in pricing an investment based on market data obtained from sources independent of the reporting entity. Unobservable inputs are those that reflect the Fund's assumptions about the information market participants would use in pricing an investment. An investment's level within the fair value hierarchy is based on the lowest level of any input that is deemed significant to the asset or liability's fair value measurement. The input levels are not necessarily an indication of the risk or liquidity associated with investments at that level. For example, certain U.S. government securities are generally high quality and liquid, however, they are reflected as Level 2 because the inputs used to determine fair value may not always be quoted prices in an active market.
Fair value inputs are summarized in the three broad levels listed below:
> Level 1 — Valuations based on quoted prices for investments in active markets that the Fund has the ability to access at the measurement date (including NAV for open-end mutual funds). Valuation adjustments are not applied to Level 1 investments.
> Level 2 — Valuations based on other significant observable inputs (including quoted prices for similar securities, interest rates, prepayment speeds, credit risks, etc.).
> Level 3 — Valuations based on significant unobservable inputs (including the Fund's own assumptions and judgment in determining the fair value of investments).
Inputs that are used in determining fair value of an investment may include price information, credit data, volatility statistics, and other factors. These inputs can be either observable or unobservable. The availability of observable inputs can vary between investments, and is affected by various factors such as the type of investment, and the volume and level of activity for that investment or similar investments in the marketplace. The inputs will be considered by the Investment Manager, along with any other relevant factors in the calculation of an investment's fair value. The Fund uses prices and inputs that are current as of the measurement date, which may include periods of market dislocations. During these periods, the availability of prices and inputs may be reduced for many investments. This condition could cause an investment to be reclassified between the various levels within the hierarchy.
Foreign equity securities actively traded in markets where there is a significant delay in the local close relative to the New York Stock Exchange (NYSE) are classified as Level 2. The values of these securities may include an adjustment to reflect the impact of significant market movements following the close of local trading, as described in Note 2 to the financial statements — Security Valuation.
Investments falling into the Level 3 category are primarily supported by quoted prices from brokers and dealers participating in the market for those investments. However, these may be classified as Level 3 investments due to lack of market transparency and corroboration to support these quoted prices. Additionally, valuation models may be used as the pricing source for any remaining investments classified as Level 3. These models may rely on one or more significant unobservable inputs and/or significant assumptions by the Investment Manager. Inputs used in valuations may include, but are not limited to, financial statement analysis, capital account balances, discount rates and estimated cash flows, and comparable company data.
Under the direction of the Fund's Board of Trustees (the Board), the Investment Manager's Valuation Committee (the Committee) is responsible for overseeing the valuation procedures approved by the Board. The Committee consists of voting and non-voting members from various groups within the Investment Manager's organization, including operations and accounting, trading and investments, compliance, risk management and legal.
The accompanying Notes to Financial Statements are an integral part of this statement.
Annual Report 2015
10
COLUMBIA MARSICO INTERNATIONAL OPPORTUNITIES FUND
PORTFOLIO OF INVESTMENTS (continued)
February 28, 2015
Fair Value Measurements (continued)
The Committee meets at least monthly to review and approve valuation matters, which may include a description of specific valuation determinations, data regarding pricing information received from approved pricing vendors and brokers and the results of Board-approved valuation control policies and procedures (the Policies). The Policies address, among other things, instances when market quotations are or are not readily available, including recommendations of third party pricing vendors and a determination of appropriate pricing methodologies; events that require specific valuation determinations and assessment of fair value techniques; securities with a potential for stale pricing, including those that are illiquid, restricted, or in default; and the effectiveness of third party pricing vendors, including periodic reviews of vendors. The Committee meets more frequently, as needed, to discuss additional valuation matters, which may include the need to review back-testing results, review time-sensitive information or approve related valuation actions. The Committee reports to the Board, with members of the Committee meeting with the Board at each of its regularly scheduled meetings to discuss valuation matters and actions during the period, similar to those described earlier.
For investments categorized as Level 3, the Committee monitors information similar to that described above, which may include: (i) data specific to the issuer or comparable issuers, (ii) general market or specific sector news and (iii) quoted prices and specific or similar security transactions. The Committee considers this data and any changes from prior periods in order to assess the reasonableness of observable and unobservable inputs, any assumptions or internal models used to value those securities and changes in fair value. This data is also used to corroborate, when available, information received from approved pricing vendors and brokers. Various factors impact the frequency of monitoring this information (which may occur as often as daily). However, the Committee may determine that changes to inputs, assumptions and models are not required as a result of the monitoring procedures performed.
The following table is a summary of the inputs used to value the Fund's investments at February 28, 2015:
Description | | Level 1
Quoted Prices in Active
Markets for Identical
Assets ($) | | Level 2
Other Significant
Observable Inputs ($) | | Level 3
Significant
Unobservable Inputs ($) | | Total ($) | |
Equity Securities | |
Common Stocks | |
Consumer Discretionary | | | 13,371,740 | | | | 11,449,322 | | | | — | | | | 24,821,062 | | |
Consumer Staples | | | — | | | | 4,302,217 | | | | — | | | | 4,302,217 | | |
Financials | | | — | | | | 4,160,524 | | | | — | | | | 4,160,524 | | |
Health Care | | | 11,879,587 | | | | 5,074,999 | | | | — | | | | 16,954,586 | | |
Industrials | | | 6,799,896 | | | | 1,709,592 | | | | — | | | | 8,509,488 | | |
Information Technology | | | 15,013,158 | | | | 12,737,002 | | | | — | | | | 27,750,160 | | |
Total Equity Securities | | | 47,064,381 | | | | 39,433,656 | | | | — | | | | 86,498,037 | | |
Mutual Funds | |
Money Market Funds | | | 1,030,338 | | | | — | | | | — | | | | 1,030,338 | | |
Total Mutual Funds | | | 1,030,338 | | | | — | | | | — | | | | 1,030,338 | | |
Total | | | 48,094,719 | | | | 39,433,656 | | | | — | | | | 87,528,375 | | |
See the Portfolio of Investments for all investment classifications not indicated in the table.
The Fund's assets assigned to the Level 2 input category are generally valued using the market approach, in which a security's value is determined through reference to prices and information from market transactions for similar or identical assets. These assets include certain foreign securities for which a third party statistical pricing service may be employed for purposes of fair market valuation. The model utilized by such third party statistical pricing service takes into account a security's correlation to available market data including, but not limited to, intraday index, ADR, and ETF movements.
There were no transfers of financial assets between levels during the period.
The accompanying Notes to Financial Statements are an integral part of this statement.
Annual Report 2015
11
COLUMBIA MARSICO INTERNATIONAL OPPORTUNITIES FUND
STATEMENT OF ASSETS AND LIABILITIES
February 28, 2015
Assets | |
Investments, at value | |
Unaffiliated issuers (identified cost $72,972,436) | | $ | 86,498,037 | | |
Affiliated issuers (identified cost $1,030,338) | | | 1,030,338 | | |
Total investments (identified cost $74,002,774) | | | 87,528,375 | | |
Receivable for: | |
Investments sold | | | 744,451 | | |
Capital shares sold | | | 7,199 | | |
Dividends | | | 21,049 | | |
Reclaims | | | 283,094 | | |
Expense reimbursement due from Investment Manager | | | 315 | | |
Prepaid expenses | | | 1,373 | | |
Total assets | | | 88,585,856 | | |
Liabilities | |
Disbursements in excess of cash | | | 16,499 | | |
Payable for: | |
Investments purchased | | | 1,398,202 | | |
Capital shares purchased | | | 333,154 | | |
Investment management fees | | | 1,887 | | |
Distribution and/or service fees | | | 655 | | |
Transfer agent fees | | | 25,541 | | |
Administration fees | | | 191 | | |
Compensation of board members | | | 89,213 | | |
Other expenses | | | 54,867 | | |
Total liabilities | | | 1,920,209 | | |
Net assets applicable to outstanding capital stock | | $ | 86,665,647 | | |
Represented by | |
Paid-in capital | | $ | 656,138,959 | | |
Excess of distributions over net investment income | | | (88,513 | ) | |
Accumulated net realized loss | | | (582,890,224 | ) | |
Unrealized appreciation (depreciation) on: | |
Investments | | | 13,525,601 | | |
Foreign currency translations | | | (20,176 | ) | |
Total — representing net assets applicable to outstanding capital stock | | $ | 86,665,647 | | |
The accompanying Notes to Financial Statements are an integral part of this statement.
Annual Report 2015
12
COLUMBIA MARSICO INTERNATIONAL OPPORTUNITIES FUND
STATEMENT OF ASSETS AND LIABILITIES (continued)
February 28, 2015
Class A | |
Net assets | | $ | 40,395,824 | | |
Shares outstanding | | | 2,906,097 | | |
Net asset value per share | | $ | 13.90 | | |
Maximum offering price per share(a) | | $ | 14.75 | | |
Class B | |
Net assets | | $ | 1,637,290 | | |
Shares outstanding | | | 127,760 | | |
Net asset value per share | | $ | 12.82 | | |
Class C | |
Net assets | | $ | 11,657,240 | | |
Shares outstanding | | | 909,087 | | |
Net asset value per share | | $ | 12.82 | | |
Class I | |
Net assets | | $ | 2,495 | | |
Shares outstanding | | | 173 | | |
Net asset value per share(b) | | $ | 14.41 | | |
Class R | |
Net assets | | $ | 755,175 | | |
Shares outstanding | | | 54,936 | | |
Net asset value per share | | $ | 13.75 | | |
Class R4 | |
Net assets | | $ | 469,796 | | |
Shares outstanding | | | 32,778 | | |
Net asset value per share | | $ | 14.33 | | |
Class Z | |
Net assets | | $ | 31,747,827 | | |
Shares outstanding | | | 2,227,881 | | |
Net asset value per share | | $ | 14.25 | | |
(a) The maximum offering price per share is calculated by dividing the net asset value per share by 1.0 minus the maximum sales charge of 5.75%.
(b) Net asset value per share rounds to this amount due to fractional shares outstanding.
The accompanying Notes to Financial Statements are an integral part of this statement.
Annual Report 2015
13
COLUMBIA MARSICO INTERNATIONAL OPPORTUNITIES FUND
STATEMENT OF OPERATIONS
Year Ended February 28, 2015
Net investment income | |
Income: | |
Dividends — unaffiliated issuers | | $ | 1,736,408 | | |
Dividends — affiliated issuers | | | 3,500 | | |
Foreign taxes withheld | | | (191,836 | ) | |
Total income | | | 1,548,072 | | |
Expenses: | |
Investment management fees | | | 1,047,963 | | |
Distribution and/or service fees | |
Class A | | | 145,357 | | |
Class B | | | 25,378 | | |
Class C | | | 128,761 | | |
Class R | | | 4,050 | | |
Transfer agent fees | |
Class A | | | 95,502 | | |
Class B | | | 4,139 | | |
Class C | | | 21,177 | | |
Class R | | | 1,333 | | |
Class R4 | | | 470 | | |
Class Z | | | 93,955 | | |
Administration fees | | | 106,123 | | |
Compensation of board members | | | 18,525 | | |
Custodian fees | | | 32,698 | | |
Printing and postage fees | | | 36,169 | | |
Registration fees | | | 76,618 | | |
Professional fees | | | 62,507 | | |
Other | | | 16,650 | | |
Total expenses | | | 1,917,375 | | |
Fees waived or expenses reimbursed by Investment Manager and its affiliates | | | (23,439 | ) | |
Expense reductions | | | (400 | ) | |
Total net expenses | | | 1,893,536 | | |
Net investment loss | | | (345,464 | ) | |
Realized and unrealized gain (loss) — net | |
Net realized gain (loss) on: | |
Investments | | | 19,412,361 | | |
Foreign currency translations | | | (51,663 | ) | |
Net realized gain | | | 19,360,698 | | |
Net change in unrealized appreciation (depreciation) on: | |
Investments | | | (20,355,318 | ) | |
Foreign currency translations | | | (39,999 | ) | |
Net change in unrealized depreciation | | | (20,395,317 | ) | |
Net realized and unrealized loss | | | (1,034,619 | ) | |
Net decrease in net assets from operations | | $ | (1,380,083 | ) | |
The accompanying Notes to Financial Statements are an integral part of this statement.
Annual Report 2015
14
COLUMBIA MARSICO INTERNATIONAL OPPORTUNITIES FUND
STATEMENT OF CHANGES IN NET ASSETS
| | | Year Ended
February 28,
2015 | | Year Ended
February 28,
2014 | |
Operations | |
Net investment income (loss) | | $ | (345,464 | ) | | $ | 1,346,438 | | |
Net realized gain | | | 19,360,698 | | | | 74,077,178 | | |
Net change in unrealized depreciation | | | (20,395,317 | ) | | | (39,609,643 | ) | |
Net increase (decrease) in net assets resulting from operations | | | (1,380,083 | ) | | | 35,813,973 | | |
Distributions to shareholders | |
Net investment income | |
Class A | | | (134,593 | ) | | | (1,182,566 | ) | |
Class B | | | (2,339 | ) | | | (61,428 | ) | |
Class C | | | (11,388 | ) | | | (228,213 | ) | |
Class I | | | (6 | ) | | | (40 | ) | |
Class R | | | (1,430 | ) | | | (13,571 | ) | |
Class R4 | | | (519 | ) | | | (2,043 | ) | |
Class Z | | | (152,742 | ) | | | (2,337,733 | ) | |
Total distributions to shareholders | | | (303,017 | ) | | | (3,825,594 | ) | |
Decrease in net assets from capital stock activity | | | (100,974,055 | ) | | | (208,664,068 | ) | |
Total decrease in net assets | | | (102,657,155 | ) | | | (176,675,689 | ) | |
Net assets at beginning of year | | | 189,322,802 | | | | 365,998,491 | | |
Net assets at end of year | | $ | 86,665,647 | | | $ | 189,322,802 | | |
Undistributed (excess of distributions over) net investment income | | $ | (88,513 | ) | | $ | 202,181 | | |
The accompanying Notes to Financial Statements are an integral part of this statement.
Annual Report 2015
15
COLUMBIA MARSICO INTERNATIONAL OPPORTUNITIES FUND
STATEMENT OF CHANGES IN NET ASSETS (continued)
| | | Year Ended February 28, 2015 | | Year Ended February 28, 2014 | |
| | | Shares | | Dollars ($) | | Shares | | Dollars ($) | |
Capital stock activity | |
Class A shares | |
Subscriptions(a) | | | 626,862 | | | | 8,221,851 | | | | 1,126,356 | | | | 14,523,089 | | |
Distributions reinvested | | | 8,531 | | | | 115,341 | | | | 86,253 | | | | 1,042,804 | | |
Redemptions | | | (4,579,012 | ) | | | (61,173,536 | ) | | | (1,500,126 | ) | | | (19,205,047 | ) | |
Net decrease | | | (3,943,619 | ) | | | (52,836,344 | ) | | | (287,517 | ) | | | (3,639,154 | ) | |
Class B shares | |
Subscriptions | | | 573 | | | | 6,876 | | | | 9,326 | | | | 114,197 | | |
Distributions reinvested | | | 148 | | | | 1,857 | | | | 3,886 | | | | 43,832 | | |
Redemptions(a) | | | (174,751 | ) | | | (2,109,347 | ) | | | (212,873 | ) | | | (2,524,595 | ) | |
Net decrease | | | (174,030 | ) | | | (2,100,614 | ) | | | (199,661 | ) | | | (2,366,566 | ) | |
Class C shares | |
Subscriptions | | | 32,189 | | | | 394,736 | | | | 45,178 | | | | 538,390 | | |
Distributions reinvested | | | 694 | | | | 8,704 | | | | 15,745 | | | | 177,765 | | |
Redemptions | | | (347,061 | ) | | | (4,213,401 | ) | | | (560,161 | ) | | | (6,592,971 | ) | |
Net decrease | | | (314,178 | ) | | | (3,809,961 | ) | | | (499,238 | ) | | | (5,876,816 | ) | |
Class I shares | |
Redemptions | | | (51 | ) | | | (700 | ) | | | — | | | | — | | |
Net decrease | | | (51 | ) | | | (700 | ) | | | — | | | | — | | |
Class R shares | |
Subscriptions | | | 8,440 | | | | 110,557 | | | | 10,517 | | | | 133,019 | | |
Distributions reinvested | | | 76 | | | | 1,024 | | | | 1,125 | | | | 13,513 | | |
Redemptions | | | (24,678 | ) | | | (321,958 | ) | | | (29,684 | ) | | | (373,282 | ) | |
Net decrease | | | (16,162 | ) | | | (210,377 | ) | | | (18,042 | ) | | | (226,750 | ) | |
Class R4 shares | |
Subscriptions | | | 27,506 | | | | 376,035 | | | | 17,600 | | | | 228,755 | | |
Distributions reinvested | | | 37 | | | | 513 | | | | 161 | | | | 2,003 | | |
Redemptions | | | (11,175 | ) | | | (153,404 | ) | | | (1,575 | ) | | | (20,685 | ) | |
Net increase | | | 16,368 | | | | 223,144 | | | | 16,186 | | | | 210,073 | | |
Class Z shares | |
Subscriptions | | | 314,532 | | | | 4,275,196 | | | | 484,226 | | | | 6,310,430 | | |
Distributions reinvested | | | 8,951 | | | | 123,879 | | | | 72,625 | | | | 896,915 | | |
Redemptions | | | (3,509,255 | ) | | | (46,638,278 | ) | | | (15,795,159 | ) | | | (203,972,200 | ) | |
Net decrease | | | (3,185,772 | ) | | | (42,239,203 | ) | | | (15,238,308 | ) | | | (196,764,855 | ) | |
Total net decrease | | | (7,617,444 | ) | | | (100,974,055 | ) | | | (16,226,580 | ) | | | (208,664,068 | ) | |
(a) Includes conversions of Class B shares to Class A shares, if any.
The accompanying Notes to Financial Statements are an integral part of this statement.
Annual Report 2015
16
COLUMBIA MARSICO INTERNATIONAL OPPORTUNITIES FUND
The following tables are intended to help you understand the Fund's financial performance. Certain information reflects financial results for a single share of a class held for the periods shown. Per share net investment income (loss) amounts are calculated based on average shares outstanding during the period. Total return assumes reinvestment of all dividends and distributions, if any. Total return does not reflect payment of sales charges, if any. Total return and portfolio turnover are not annualized for periods of less than one year. The portfolio turnover rate is calculated without regard to purchase and sales transactions of short-term instruments and certain derivatives, if any. If such transactions were included, the Fund's portfolio turnover rate may be higher.
| | | Year Ended February 28, | | Year Ended
February 29, | | Year Ended
February 28, | |
Class A | | 2015 | | 2014 | | 2013 | | 2012 | | 2011 | |
Per share data | |
Net asset value, beginning of period | | $ | 13.63 | | | $ | 12.04 | | | $ | 11.24 | | | $ | 11.96 | | | $ | 10.00 | | |
Income from investment operations: | |
Net investment income (loss) | | | (0.02 | ) | | | 0.02 | | | | 0.12 | | | | 0.01 | | | | 0.05 | | |
Net realized and unrealized gain (loss) | | | 0.32 | (a) | | | 1.74 | | | | 0.68 | | | | (0.73 | ) | | | 2.08 | | |
Total from investment operations | | | 0.30 | | | | 1.76 | | | | 0.80 | | | | (0.72 | ) | | | 2.13 | | |
Less distributions to shareholders: | |
Net investment income | | | (0.03 | ) | | | (0.17 | ) | | | — | | | | — | | | | (0.17 | ) | |
Total distributions to shareholders | | | (0.03 | ) | | | (0.17 | ) | | | — | | | | — | | | | (0.17 | ) | |
Net asset value, end of period | | $ | 13.90 | | | $ | 13.63 | | | $ | 12.04 | | | $ | 11.24 | | | $ | 11.96 | | |
Total return | | | 2.18 | % | | | 14.80 | % | | | 7.12 | % | | | (6.02 | %) | | | 21.39 | % | |
Ratios to average net assets(b) | |
Total gross expenses | | | 1.46 | % | | | 1.41 | %(c) | | | 1.49 | %(c) | | | 1.53 | % | | | 1.51 | %(c) | |
Total net expenses(d) | | | 1.44 | %(e) | | | 1.41 | %(c)(e) | | | 1.49 | %(c)(e) | | | 1.53 | %(e) | | | 1.51 | %(c)(e) | |
Net investment income (loss) | | | (0.18 | %) | | | 0.16 | % | | | 1.10 | % | | | 0.06 | % | | | 0.47 | % | |
Supplemental data | |
Net assets, end of period (in thousands) | | $ | 40,396 | | | $ | 93,346 | | | $ | 85,963 | | | $ | 99,757 | | | $ | 141,821 | | |
Portfolio turnover | | | 165 | % | | | 141 | % | | | 73 | % | | | 86 | % | | | 105 | % | |
Notes to Financial Highlights
(a) Calculation of the net gain (loss) per share (both realized and unrealized) does not correlate to the aggregate realized and unrealized gain (loss) presented in the Statement of Operations due to the timing of subscriptions and redemptions of Fund shares in relation to fluctuations in the market value of the portfolio.
(b) In addition to the fees and expenses that the Fund bears directly, the Fund indirectly bears a pro rata share of the fees and expenses of any other funds in which it invests. Such indirect expenses are not included in the Fund's reported expense ratios.
(c) Ratios include line of credit interest expense which is less than 0.01%.
(d) Total net expenses include the impact of certain fee waivers/expense reimbursements made by the Investment Manager and certain of its affiliates, if applicable.
(e) The benefits derived from expense reductions had an impact of less than 0.01%.
The accompanying Notes to Financial Statements are an integral part of this statement.
Annual Report 2015
17
COLUMBIA MARSICO INTERNATIONAL OPPORTUNITIES FUND
FINANCIAL HIGHLIGHTS (continued)
| | | Year Ended February 28, | | Year Ended
February 29, | | Year Ended
February 28, | |
Class B | | 2015 | | 2014 | | 2013 | | 2012 | | 2011 | |
Per share data | |
Net asset value, beginning of period | | $ | 12.65 | | | $ | 11.26 | | | $ | 10.58 | | | $ | 11.35 | | | $ | 9.51 | | |
Income from investment operations: | |
Net investment income (loss) | | | (0.13 | ) | | | (0.06 | ) | | | 0.04 | | | | (0.07 | ) | | | (0.03 | ) | |
Net realized and unrealized gain (loss) | | | 0.31 | (a) | | | 1.61 | | | | 0.64 | | | | (0.70 | ) | | | 1.98 | | |
Total from investment operations | | | 0.18 | | | | 1.55 | | | | 0.68 | | | | (0.77 | ) | | | 1.95 | | |
Less distributions to shareholders: | |
Net investment income | | | (0.01 | ) | | | (0.16 | ) | | | — | | | | — | | | | (0.11 | ) | |
Total distributions to shareholders | | | (0.01 | ) | | | (0.16 | ) | | | — | | | | — | | | | (0.11 | ) | |
Net asset value, end of period | | $ | 12.82 | | | $ | 12.65 | | | $ | 11.26 | | | $ | 10.58 | | | $ | 11.35 | | |
Total return | | | 1.43 | % | | | 13.89 | % | | | 6.43 | % | | | (6.78 | %) | | | 20.50 | % | |
Ratios to average net assets(b) | |
Total gross expenses | | | 2.22 | % | | | 2.16 | %(c) | | | 2.24 | %(c) | | | 2.27 | % | | | 2.26 | %(c) | |
Total net expenses(d) | | | 2.20 | %(e) | | | 2.16 | %(c)(e) | | | 2.24 | %(c)(e) | | | 2.27 | %(e) | | | 2.26 | %(c)(e) | |
Net investment income (loss) | | | (1.04 | %) | | | (0.47 | %) | | | 0.40 | % | | | (0.65 | %) | | | (0.27 | %) | |
Supplemental data | |
Net assets, end of period (in thousands) | | $ | 1,637 | | | $ | 3,816 | | | $ | 5,645 | | | $ | 8,381 | | | $ | 14,862 | | |
Portfolio turnover | | | 165 | % | | | 141 | % | | | 73 | % | | | 86 | % | | | 105 | % | |
Notes to Financial Highlights
(a) Calculation of the net gain (loss) per share (both realized and unrealized) does not correlate to the aggregate realized and unrealized gain (loss) presented in the Statement of Operations due to the timing of subscriptions and redemptions of Fund shares in relation to fluctuations in the market value of the portfolio.
(b) In addition to the fees and expenses that the Fund bears directly, the Fund indirectly bears a pro rata share of the fees and expenses of any other funds in which it invests. Such indirect expenses are not included in the Fund's reported expense ratios.
(c) Ratios include line of credit interest expense which is less than 0.01%.
(d) Total net expenses include the impact of certain fee waivers/expense reimbursements made by the Investment Manager and certain of its affiliates, if applicable.
(e) The benefits derived from expense reductions had an impact of less than 0.01%.
The accompanying Notes to Financial Statements are an integral part of this statement.
Annual Report 2015
18
COLUMBIA MARSICO INTERNATIONAL OPPORTUNITIES FUND
FINANCIAL HIGHLIGHTS (continued)
| | | Year Ended February 28, | | Year Ended
February 29, | | Year Ended
February 28, | |
Class C | | 2015 | | 2014 | | 2013 | | 2012 | | 2011 | |
Per share data | |
Net asset value, beginning of period | | $ | 12.65 | | | $ | 11.26 | | | $ | 10.59 | | | $ | 11.36 | | | $ | 9.51 | | |
Income from investment operations: | |
Net investment income (loss) | | | (0.14 | ) | | | (0.06 | ) | | | 0.04 | | | | (0.07 | ) | | | (0.03 | ) | |
Net realized and unrealized gain (loss) | | | 0.32 | (a) | | | 1.61 | | | | 0.63 | | | | (0.70 | ) | | | 1.99 | | |
Total from investment operations | | | 0.18 | | | | 1.55 | | | | 0.67 | | | | (0.77 | ) | | | 1.96 | | |
Less distributions to shareholders: | |
Net investment income | | | (0.01 | ) | | | (0.16 | ) | | | — | | | | — | | | | (0.11 | ) | |
Total distributions to shareholders | | | (0.01 | ) | | | (0.16 | ) | | | — | | | | — | | | | (0.11 | ) | |
Net asset value, end of period | | $ | 12.82 | | | $ | 12.65 | | | $ | 11.26 | | | $ | 10.59 | | | $ | 11.36 | | |
Total return | | | 1.43 | % | | | 13.89 | % | | | 6.33 | % | | | (6.78 | %) | | | 20.60 | % | |
Ratios to average net assets(b) | |
Total gross expenses | | | 2.23 | % | | | 2.16 | %(c) | | | 2.24 | %(c) | | | 2.28 | % | | | 2.26 | %(c) | |
Total net expenses(d) | | | 2.20 | %(e) | | | 2.16 | %(c)(e) | | | 2.24 | %(c)(e) | | | 2.28 | %(e) | | | 2.26 | %(c)(e) | |
Net investment income (loss) | | | (1.11 | %) | | | (0.52 | %) | | | 0.37 | % | | | (0.68 | %) | | | (0.30 | %) | |
Supplemental data | |
Net assets, end of period (in thousands) | | $ | 11,657 | | | $ | 15,478 | | | $ | 19,402 | | | $ | 25,608 | | | $ | 39,789 | | |
Portfolio turnover | | | 165 | % | | | 141 | % | | | 73 | % | | | 86 | % | | | 105 | % | |
Notes to Financial Highlights
(a) Calculation of the net gain (loss) per share (both realized and unrealized) does not correlate to the aggregate realized and unrealized gain (loss) presented in the Statement of Operations due to the timing of subscriptions and redemptions of Fund shares in relation to fluctuations in the market value of the portfolio.
(b) In addition to the fees and expenses that the Fund bears directly, the Fund indirectly bears a pro rata share of the fees and expenses of any other funds in which it invests. Such indirect expenses are not included in the Fund's reported expense ratios.
(c) Ratios include line of credit interest expense which is less than 0.01%.
(d) Total net expenses include the impact of certain fee waivers/expense reimbursements made by the Investment Manager and certain of its affiliates, if applicable.
(e) The benefits derived from expense reductions had an impact of less than 0.01%.
The accompanying Notes to Financial Statements are an integral part of this statement.
Annual Report 2015
19
COLUMBIA MARSICO INTERNATIONAL OPPORTUNITIES FUND
FINANCIAL HIGHLIGHTS (continued)
| | | Year Ended February 28, | | Year Ended
February 29, | | Year Ended
February 28, | |
Class I | | 2015 | | 2014 | | 2013 | | 2012 | | 2011(a) | |
Per share data | |
Net asset value, beginning of period | | $ | 14.08 | | | $ | 12.40 | | | $ | 11.52 | | | $ | 12.14 | | | $ | 11.18 | | |
Income from investment operations: | |
Net investment income (loss) | | | 0.00 | (b) | | | 0.07 | | | | 0.17 | | | | 0.12 | | | | (0.01 | ) | |
Net realized and unrealized gain (loss) | | | 0.37 | (c) | | | 1.79 | | | | 0.71 | | | | (0.74 | ) | | | 1.17 | | |
Total from investment operations | | | 0.37 | | | | 1.86 | | | | 0.88 | | | | (0.62 | ) | | | 1.16 | | |
Less distributions to shareholders: | |
Net investment income | | | (0.04 | ) | | | (0.18 | ) | | | — | | | | — | | | | (0.20 | ) | |
Total distributions to shareholders | | �� | (0.04 | ) | | | (0.18 | ) | | | — | | | | — | | | | (0.20 | ) | |
Net asset value, end of period | | $ | 14.41 | | | $ | 14.08 | | | $ | 12.40 | | | $ | 11.52 | | | $ | 12.14 | | |
Total return | | | 2.60 | % | | | 15.18 | % | | | 7.64 | % | | | (5.11 | %) | | | 10.44 | % | |
Ratios to average net assets(d) | |
Total gross expenses | | | 1.09 | % | | | 0.99 | %(e) | | | 1.04 | %(e) | | | 1.12 | % | | | 1.10 | %(e)(f) | |
Total net expenses(g) | | | 1.07 | % | | | 0.99 | %(e) | | | 1.04 | %(e) | | | 1.12 | %(h) | | | 1.10 | %(e)(f)(h) | |
Net investment income (loss) | | | 0.01 | % | | | 0.56 | % | | | 1.50 | % | | | 1.00 | % | | | (0.24 | %)(f) | |
Supplemental data | |
Net assets, end of period (in thousands) | | $ | 2 | | | $ | 3 | | | $ | 3 | | | $ | 3 | | | $ | 34,072 | | |
Portfolio turnover | | | 165 | % | | | 141 | % | | | 73 | % | | | 86 | % | | | 105 | % | |
Notes to Financial Highlights
(a) Based on operations from September 27, 2010 (commencement of operations) through the stated period end.
(b) Rounds to zero.
(c) Calculation of the net gain (loss) per share (both realized and unrealized) does not correlate to the aggregate realized and unrealized gain (loss) presented in the Statement of Operations due to the timing of subscriptions and redemptions of Fund shares in relation to fluctuations in the market value of the portfolio.
(d) In addition to the fees and expenses that the Fund bears directly, the Fund indirectly bears a pro rata share of the fees and expenses of any other funds in which it invests. Such indirect expenses are not included in the Fund's reported expense ratios.
(e) Ratios include line of credit interest expense which is less than 0.01%.
(f) Annualized.
(g) Total net expenses include the impact of certain fee waivers/expense reimbursements made by the Investment Manager and certain of its affiliates, if applicable.
(h) The benefits derived from expense reductions had an impact of less than 0.01%.
The accompanying Notes to Financial Statements are an integral part of this statement.
Annual Report 2015
20
COLUMBIA MARSICO INTERNATIONAL OPPORTUNITIES FUND
FINANCIAL HIGHLIGHTS (continued)
| | | Year Ended February 28, | | Year Ended
February 29, | | Year Ended
February 28, | |
Class R | | 2015 | | 2014 | | 2013 | | 2012 | | 2011 | |
Per share data | |
Net asset value, beginning of period | | $ | 13.51 | | | $ | 11.96 | | | $ | 11.19 | | | $ | 11.94 | | | $ | 9.99 | | |
Income from investment operations: | |
Net investment income (loss) | | | (0.08 | ) | | | (0.00 | )(a) | | | 0.10 | | | | (0.02 | ) | | | 0.01 | | |
Net realized and unrealized gain (loss) | | | 0.34 | (b) | | | 1.71 | | | | 0.67 | | | | (0.73 | ) | | | 2.09 | | |
Total from investment operations | | | 0.26 | | | | 1.71 | | | | 0.77 | | | | (0.75 | ) | | | 2.10 | | |
Less distributions to shareholders: | |
Net investment income | | | (0.02 | ) | | | (0.16 | ) | | | — | | | | — | | | | (0.15 | ) | |
Total distributions to shareholders | | | (0.02 | ) | | | (0.16 | ) | | | — | | | | — | | | | (0.15 | ) | |
Net asset value, end of period | | $ | 13.75 | | | $ | 13.51 | | | $ | 11.96 | | | $ | 11.19 | | | $ | 11.94 | | |
Total return | | | 1.94 | % | | | 14.51 | % | | | 6.88 | % | | | (6.28 | %) | | | 21.08 | % | |
Ratios to average net assets(c) | |
Total gross expenses | | | 1.73 | % | | | 1.66 | %(d) | | | 1.74 | %(d) | | | 1.77 | % | | | 1.76 | %(d) | |
Total net expenses(e) | | | 1.70 | %(f) | | | 1.66 | %(d)(f) | | | 1.74 | %(d)(f) | | | 1.77 | %(f) | | | 1.76 | %(d)(f) | |
Net investment income (loss) | | | (0.61 | %) | | | (0.04 | %) | | | 0.88 | % | | | (0.17 | %) | | | 0.12 | % | |
Supplemental data | |
Net assets, end of period (in thousands) | | $ | 755 | | | $ | 960 | | | $ | 1,067 | | | $ | 1,640 | | | $ | 3,020 | | |
Portfolio turnover | | | 165 | % | | | 141 | % | | | 73 | % | | | 86 | % | | | 105 | % | |
Notes to Financial Highlights
(a) Rounds to zero.
(b) Calculation of the net gain (loss) per share (both realized and unrealized) does not correlate to the aggregate realized and unrealized gain (loss) presented in the Statement of Operations due to the timing of subscriptions and redemptions of Fund shares in relation to fluctuations in the market value of the portfolio.
(c) In addition to the fees and expenses that the Fund bears directly, the Fund indirectly bears a pro rata share of the fees and expenses of any other funds in which it invests. Such indirect expenses are not included in the Fund's reported expense ratios.
(d) Ratios include line of credit interest expense which is less than 0.01%.
(e) Total net expenses include the impact of certain fee waivers/expense reimbursements made by the Investment Manager and certain of its affiliates, if applicable.
(f) The benefits derived from expense reductions had an impact of less than 0.01%.
The accompanying Notes to Financial Statements are an integral part of this statement.
Annual Report 2015
21
COLUMBIA MARSICO INTERNATIONAL OPPORTUNITIES FUND
FINANCIAL HIGHLIGHTS (continued)
| | | Year Ended February 28, | |
Class R4 | | 2015 | | 2014 | | 2013(a) | |
Per share data | |
Net asset value, beginning of period | | $ | 14.02 | | | $ | 12.36 | | | $ | 11.17 | | |
Income from investment operations: | |
Net investment income (loss) | | | (0.03 | ) | | | 0.01 | | | | 0.03 | | |
Net realized and unrealized gain | | | 0.37 | (b) | | | 1.83 | | | | 1.16 | | |
Total from investment operations | | | 0.34 | | | | 1.84 | | | | 1.19 | | |
Less distributions to shareholders: | |
Net investment income | | | (0.03 | ) | | | (0.18 | ) | | | — | | |
Total distributions to shareholders | | | (0.03 | ) | | | (0.18 | ) | | | — | | |
Net asset value, end of period | | $ | 14.33 | | | $ | 14.02 | | | $ | 12.36 | | |
Total return | | | 2.45 | % | | | 15.04 | % | | | 10.65 | % | |
Ratios to average net assets(c) | |
Total gross expenses | | | 1.25 | % | | | 1.16 | %(d) | | | 1.15 | %(d)(e) | |
Total net expenses(f) | | | 1.21 | %(g) | | | 1.16 | %(d)(g) | | | 1.15 | %(d)(e) | |
Net investment income (loss) | | | (0.22 | %) | | | 0.09 | % | | | 0.93 | %(e) | |
Supplemental data | |
Net assets, end of period (in thousands) | | $ | 470 | | | $ | 230 | | | $ | 3 | | |
Portfolio turnover | | | 165 | % | | | 141 | % | | | 73 | % | |
Notes to Financial Highlights
(a) Based on operations from November 8, 2012 (commencement of operations) through the stated period end.
(b) Calculation of the net gain (loss) per share (both realized and unrealized) does not correlate to the aggregate realized and unrealized gain (loss) presented in the Statement of Operations due to the timing of subscriptions and redemptions of Fund shares in relation to fluctuations in the market value of the portfolio.
(c) In addition to the fees and expenses that the Fund bears directly, the Fund indirectly bears a pro rata share of the fees and expenses of any other funds in which it invests. Such indirect expenses are not included in the Fund's reported expense ratios.
(d) Ratios include line of credit interest expense which is less than 0.01%.
(e) Annualized.
(f) Total net expenses include the impact of certain fee waivers/expense reimbursements made by the Investment Manager and certain of its affiliates, if applicable.
(g) The benefits derived from expense reductions had an impact of less than 0.01%.
The accompanying Notes to Financial Statements are an integral part of this statement.
Annual Report 2015
22
COLUMBIA MARSICO INTERNATIONAL OPPORTUNITIES FUND
FINANCIAL HIGHLIGHTS (continued)
| | | Year Ended February 28, | | Year Ended
February 29, | | Year Ended
February 28, | |
Class Z | | 2015 | | 2014 | | 2013 | | 2012 | | 2011 | |
Per share data | |
Net asset value, beginning of period | | $ | 13.94 | | | $ | 12.30 | | | $ | 11.44 | | | $ | 12.15 | | | $ | 10.15 | | |
Income from investment operations: | |
Net investment income (loss) | | | (0.01 | ) | | | 0.12 | | | | 0.16 | | | | 0.04 | | | | 0.07 | | |
Net realized and unrealized gain (loss) | | | 0.35 | (a) | | | 1.69 | | | | 0.70 | | | | (0.75 | ) | | | 2.13 | | |
Total from investment operations | | | 0.34 | | | | 1.81 | | | | 0.86 | | | | (0.71 | ) | | | 2.20 | | |
Less distributions to shareholders: | |
Net investment income | | | (0.03 | ) | | | (0.17 | ) | | | — | | | | — | | | | (0.20 | ) | |
Total distributions to shareholders | | | (0.03 | ) | | | (0.17 | ) | | | — | | | | — | | | | (0.20 | ) | |
Net asset value, end of period | | $ | 14.25 | | | $ | 13.94 | | | $ | 12.30 | | | $ | 11.44 | | | $ | 12.15 | | |
Total return | | | 2.46 | % | | | 14.94 | % | | | 7.52 | % | | | (5.84 | %) | | | 21.75 | % | |
Ratios to average net assets(b) | |
Total gross expenses | | | 1.22 | % | | | 1.15 | %(c) | | | 1.24 | %(c) | | | 1.28 | % | | | 1.26 | %(c) | |
Total net expenses(d) | | | 1.20 | %(e) | | | 1.15 | %(c)(e) | | | 1.24 | %(c)(e) | | | 1.28 | %(e) | | | 1.26 | %(c)(e) | |
Net investment income (loss) | | | (0.11 | %) | | | 0.93 | % | | | 1.40 | % | | | 0.38 | % | | | 0.67 | % | |
Supplemental data | |
Net assets, end of period (in thousands) | | $ | 31,748 | | | $ | 75,489 | | | $ | 253,916 | | | $ | 456,645 | | | $ | 945,793 | | |
Portfolio turnover | | | 165 | % | | | 141 | % | | | 73 | % | | | 86 | % | | | 105 | % | |
Notes to Financial Highlights
(a) Calculation of the net gain (loss) per share (both realized and unrealized) does not correlate to the aggregate realized and unrealized gain (loss) presented in the Statement of Operations due to the timing of subscriptions and redemptions of Fund shares in relation to fluctuations in the market value of the portfolio.
(b) In addition to the fees and expenses that the Fund bears directly, the Fund indirectly bears a pro rata share of the fees and expenses of any other funds in which it invests. Such indirect expenses are not included in the Fund's reported expense ratios.
(c) Ratios include line of credit interest expense which is less than 0.01%.
(d) Total net expenses include the impact of certain fee waivers/expense reimbursements made by the Investment Manager and certain of its affiliates, if applicable.
(e) The benefits derived from expense reductions had an impact of less than 0.01%.
The accompanying Notes to Financial Statements are an integral part of this statement.
Annual Report 2015
23
COLUMBIA MARSICO INTERNATIONAL OPPORTUNITIES FUND
NOTES TO FINANCIAL STATEMENTS
February 28, 2015
Note 1. Organization
Columbia Marsico International Opportunities Fund (the Fund), a series of Columbia Funds Series Trust (the Trust), is a diversified fund. The Trust is registered under the Investment Company Act of 1940, as amended (the 1940 Act), as an open-end management investment company organized as a Delaware statutory trust.
On January 28, 2015, the Board of Trustees (the Board) voted to change the Fund's name from Columbia Marsico International Opportunities Fund to Columbia International Opportunities Fund effective on or about May 1, 2015.
Fund Shares
The Trust may issue an unlimited number of shares (without par value). The Fund offers Class A, Class B, Class C, Class I, Class R, Class R4 and Class Z shares. Although all share classes generally have identical voting, dividend and liquidation rights, each share class votes separately when required by the Trust's organizational documents or by law. Different share classes pay different distribution amounts to the extent the expenses of such share classes differ, and distributions in liquidation will be proportional to the net asset value of each share class. Each share class has its own expense structure and sales charges.
Class A shares are subject to a maximum front-end sales charge of 5.75% based on the initial investment amount. Class A shares purchased without an initial sales charge in accounts aggregating $1 million to $50 million at the time of purchase are subject to a contingent deferred sales charge (CDSC) if the shares are sold within 18 months of purchase, charged as follows: 1.00% CDSC if redeemed within 12 months of purchase, and 0.50% CDSC if redeemed more than 12, but less than 18, months after purchase.
Class B shares may be subject to a maximum CDSC of 5.00% based upon the holding period after purchase. Class B shares will generally convert to Class A shares eight years after purchase. The Fund no longer accepts investments by new or existing investors in the Fund's Class B shares, except in connection with the reinvestment of any dividend and/or capital gain distributions in Class B shares of the Fund and exchanges by existing Class B shareholders of certain other funds within the Columbia Family of Funds.
Class C shares are subject to a 1.00% CDSC on shares redeemed within one year of purchase.
Class I shares are not subject to sales charges and are available only to the Columbia Family of Funds.
Class R shares are not subject to sales charges and are generally available only to certain retirement plans and other investors as described in the Fund's prospectus.
Class R4 shares are not subject to sales charges and are generally available only to omnibus retirement plans and certain investors as described in the Fund's prospectus.
Class Z shares are not subject to sales charges and are available only to eligible investors, which are subject to different investment minimums as described in the Fund's prospectus.
Note 2. Summary of Significant Accounting Policies
Basis of Preparation
The Fund is an investment company that applies the accounting and reporting guidance in the Financial Accounting Standards Board (FASB) Accounting Standards Codification Topic 946, Financial Services — Investment Companies (ASC 946). The financial statements are prepared in accordance with U.S. generally accepted accounting principles (GAAP), which requires management to make certain estimates and assumptions that affect the reported amounts of assets and liabilities, the disclosure of contingent assets and liabilities at the date of the financial statements and the reported amounts of income and expenses during the reporting period. Actual results could differ from those estimates.
The following is a summary of significant accounting policies followed by the Fund in the preparation of its financial statements.
Security Valuation
All equity securities are valued at the close of business of the New York Stock Exchange (NYSE). Equity securities are valued at the last quoted sales price on the principal exchange or market on which they trade, except for securities traded on the NASDAQ Stock Market, which are valued at the NASDAQ official close price. Unlisted securities or listed securities for which there were no sales during the day are valued at the mean of the latest quoted bid and ask prices on such exchanges or markets.
Foreign equity securities are valued based on quotations from the principal market in which such securities are traded. If any foreign security prices are not readily available as a result of limited share activity, the securities are valued at the mean of the latest quoted bid and ask prices on such exchanges or markets.
Annual Report 2015
24
COLUMBIA MARSICO INTERNATIONAL OPPORTUNITIES FUND
NOTES TO FINANCIAL STATEMENTS (continued)
February 28, 2015
Foreign currency exchange rates are generally determined at 4:00 p.m. Eastern (U.S.) time. Many securities markets and exchanges outside the U.S. close prior to the close of the NYSE; therefore, the closing prices for securities in such markets or on such exchanges may not fully reflect events that occur after such close but before the close of the NYSE. In those situations, foreign securities will be fair valued pursuant to a policy adopted by the Board, including, if available, utilizing a third party pricing service to determine these fair values. The third party pricing service takes into account multiple factors, including, but not limited to, movements in the U.S. securities markets, certain depositary receipts, futures contracts and foreign exchange rates that have occurred subsequent to the close of the foreign exchange or market, to determine a good faith estimate that reasonably reflects the current market conditions as of the close of the NYSE. The fair value of a security is likely to be different from the quoted or published price, if available.
Investments in open-end investment companies, including money market funds, are valued at their net asset value.
Investments for which market quotations are not readily available, or that have quotations which management believes are not reliable, are valued at fair value as determined in good faith under procedures established by and under the general supervision of the Board. If a security or class of securities (such as foreign securities) is valued at fair value, such value is likely to be different from the quoted or published price for the security.
The determination of fair value often requires significant judgment. To determine fair value, management may use assumptions including but not limited to future cash flows and estimated risk premiums. Multiple inputs from various sources may be used to determine fair value.
Foreign Currency Transactions and Translations
The values of all assets and liabilities denominated in foreign currencies are generally translated into U.S. dollars at exchange rates determined at the close of the NYSE. Net realized and unrealized gains (losses) on foreign currency transactions and translations include gains (losses) arising from the fluctuation in exchange rates between trade and settlement dates on securities transactions, gains (losses) arising from the disposition of foreign currency and currency gains (losses) between the accrual and payment dates on dividends, interest income and foreign withholding taxes.
For financial statement purposes, the Fund does not distinguish that portion of gains (losses) on investments
which is due to changes in foreign exchange rates from that which is due to changes in market prices of the investments. Such fluctuations are included with the net realized and unrealized gains (losses) on investments in the Statement of Operations.
Security Transactions
Security transactions are accounted for on the trade date. Cost is determined and gains (losses) are based upon the specific identification method for both financial statement and federal income tax purposes.
Income Recognition
Corporate actions and dividend income are generally recorded net of any non-reclaimable tax withholdings, on the ex-dividend date or upon receipt of ex-dividend notification in the case of certain foreign securities.
Awards from class action litigation are recorded as a reduction of cost basis if the Fund still owns the applicable securities on the payment date. If the Fund no longer owns the applicable securities, the proceeds are recorded as realized gains.
Expenses
General expenses of the Trust are allocated to the Fund and other funds of the Trust based upon relative net assets or other expense allocation methodologies determined by the nature of the expense. Expenses directly attributable to the Fund are charged to the Fund. Expenses directly attributable to a specific class of shares are charged to that share class.
Determination of Class Net Asset Value
All income, expenses (other than class-specific expenses, which are charged to that share class, as shown in the Statement of Operations) and realized and unrealized gains (losses) are allocated to each class of the Fund on a daily basis, based on the relative net assets of each class, for purposes of determining the net asset value of each class.
Federal Income Tax Status
The Fund intends to qualify each year as a regulated investment company under Subchapter M of the Internal Revenue Code, as amended, and will distribute substantially all of its taxable income (including net short-term capital gains), if any, for its tax year, and as such will not be subject to federal income taxes. In addition, the Fund intends to distribute in each calendar year substantially all of its net investment income, capital gains and certain other amounts, if any, such that the Fund should not be subject to federal excise tax.
Annual Report 2015
25
COLUMBIA MARSICO INTERNATIONAL OPPORTUNITIES FUND
NOTES TO FINANCIAL STATEMENTS (continued)
February 28, 2015
Therefore, no federal income or excise tax provision is recorded.
Foreign Taxes
The Fund may be subject to foreign taxes on income, gains on investments or currency repatriation, a portion of which may be recoverable. The Fund will accrue such taxes and recoveries, as applicable, based upon its current interpretation of tax rules and regulations that exist in the markets in which it invests.
Realized gains in certain countries may be subject to foreign taxes at the Fund level, based on statutory rates. The Fund accrues for such foreign taxes on realized and unrealized gains at the appropriate rate for each jurisdiction, as applicable. The amount, if any, is disclosed as a liability on the Statement of Assets and Liabilities.
Distributions to Shareholders
Distributions from net investment income, if any, are declared and paid semi-annually. Net realized capital gains, if any, are distributed at least annually. Income distributions and capital gain distributions are determined in accordance with federal income tax regulations, which may differ from GAAP.
Guarantees and Indemnifications
Under the Trust's organizational documents and, in some cases, by contract, its officers and trustees are indemnified against certain liabilities arising out of the performance of their duties to the Trust or its funds. In addition, certain of the Fund's contracts with its service providers contain general indemnification clauses. The Fund's maximum exposure under these arrangements is unknown since the amount of any future claims that may be made against the Fund cannot be determined, and the Fund has no historical basis for predicting the likelihood of any such claims.
Note 3. Fees and Compensation Paid to Affiliates
Investment Management Fees
Under an Investment Management Services Agreement, Columbia Management Investment Advisers, LLC (the Investment Manager), a wholly-owned subsidiary of Ameriprise Financial, Inc. (Ameriprise Financial), is responsible for the ultimate oversight of investments made by the Fund. The Fund's subadviser (see Subadvisory Agreement below) has the primary responsibility for the day-to-day portfolio management of the Fund. The investment management fee is an annual
fee that is equal to a percentage of the Fund's average daily net assets that declines from 0.79% to 0.62% as the Fund's net assets increase. The effective investment management fee rate for the year ended February 28, 2015 was 0.79% of the Fund's average daily net assets.
Subadvisory Agreement
The Investment Manager has entered into a Subadvisory Agreement with Marsico Capital Management, LLC (Marsico) to serve as the subadviser to the Fund. The Investment Manager compensates Marsico to manage the investment of the Fund's assets.
On January 28, 2015, the Board voted to terminate Marsico as subadvisor to the Fund effective on or about May 1, 2015. At that time, the Investment Manager will assume day-to-day portfolio management responsibility for the Fund. In addition, effective on or about May 1, 2015, the Investment Manager will enter into a personnel-sharing arrangement with its affiliate, Threadneedle Investments (Threadneedle). Threadneedle, like the Investment Manager, is a wholly-owned subsidiary of Ameriprise Financial and is an SEC-registered investment adviser. Pursuant to this arrangement, certain employees of Threadneedle serve as "associated persons" of the Investment Manager and, in this capacity, are subject to the oversight and supervision of the Investment Manager and consistent with the investment objectives, policies and limitations set forth in the Fund's prospectus and Statement of Additional Information (SAI), may provide research and related services, and discretionary investment management services (including acting as portfolio managers) to the Fund.
Administration Fees
Under an Administrative Services Agreement, the Investment Manager also serves as the Fund Administrator. The Fund pays the Fund Administrator an annual fee for administration and accounting services equal to a percentage of the Fund's average daily net assets that declines from 0.08% to 0.05% as the Fund's net assets increase. The effective administration fee rate for the year ended February 28, 2015 was 0.08% of the Fund's average daily net assets.
Other Expenses
Other expenses are for, among other things, miscellaneous expenses of the Fund or the Board, including payments to a company providing limited administrative services to the Fund and the Board. That company's expenses include boardroom and office expense, employee compensation, employee health and
Annual Report 2015
26
COLUMBIA MARSICO INTERNATIONAL OPPORTUNITIES FUND
NOTES TO FINANCIAL STATEMENTS (continued)
February 28, 2015
retirement benefits, and certain other expenses. For the year ended February 28, 2015, other expenses paid by the Fund to this company were $1,331.
Compensation of Board Members
Board members are compensated for their services to the Fund as disclosed in the Statement of Operations. Under a Deferred Compensation Plan (the Plan), the Board members who are not "interested persons" of the Fund, as defined under the 1940 Act, may elect to defer payment of up to 100% of their compensation. Deferred amounts are treated as though equivalent dollar amounts had been invested in shares of certain funds managed by the Investment Manager. The Fund's liability for these amounts is adjusted for market value changes and remains in the Fund until distributed in accordance with the Plan.
Transfer Agent Fees
Under a Transfer and Dividend Disbursing Agent Agreement, Columbia Management Investment Services Corp. (the Transfer Agent), an affiliate of the Investment Manager and a wholly-owned subsidiary of Ameriprise Financial, is responsible for providing transfer agency services to the Fund. The Transfer Agent has contracted with Boston Financial Data Services (BFDS) to serve as sub-transfer agent.
Effective November 1, 2014, the Transfer Agent receives a monthly transfer agency fee based on the number or the average value of accounts, depending on the type of account. Prior to November 1, 2014, the Transfer Agent received a monthly account-based service fee based on the number of open accounts. In addition, the Transfer Agent also receives sub-transfer agency fees based on a percentage of the average aggregate value of the Fund's shares maintained in omnibus accounts (other than omnibus accounts for which American Enterprise Investment Services Inc. is the broker of record or accounts where the beneficial shareholder is a customer of Ameriprise Financial Services, Inc., for which the Transfer Agent receives a per account fee). The Transfer Agent pays the fees of BFDS for services as sub-transfer agent and is not entitled to reimbursement for such fees from the Fund (with the exception of out-of-pocket fees).
The Transfer Agent also receives compensation from the Fund for various shareholder services and reimbursements for certain out-of-pocket fees. Class I shares do not pay transfer agency fees.
For the year ended February 28, 2015, the Fund's effective transfer agent fee rates as a percentage of average daily net assets of each class were as follows:
Class A | | | 0.16 | % | |
Class B | | | 0.16 | | |
Class C | | | 0.16 | | |
Class R | | | 0.16 | | |
Class R4 | | | 0.17 | | |
Class Z | | | 0.16 | | |
An annual minimum account balance fee of $20 may apply to certain accounts with a value below the applicable share class's initial minimum investment requirements to reduce the impact of small accounts on transfer agent fees. These minimum account balance fees are remitted to the Fund and recorded as part of expense reductions in the Statement of Operations. For the year ended February 28, 2015, these minimum account balance fees reduced total expenses of the Fund by $400.
Distribution and Service Fees
The Fund has an agreement with Columbia Management Investment Distributors, Inc. (the Distributor), an affiliate of the Investment Manager and a wholly-owned subsidiary of Ameriprise Financial, for distribution and shareholder services. The Board has approved, and the Fund has adopted, distribution and shareholder service plans (the Plans) applicable to certain share classes, which set the distribution and service fees for the Fund. These fees are calculated daily and are intended to compensate the Distributor and/or eligible selling and/or servicing agents for selling shares of the Fund and providing services to investors.
Under the Plans, the Fund pays a monthly combined distribution and service fee to the Distributor at the maximum annual rate of 0.25% of the average daily net assets attributable to Class A shares of the Fund. Also under the Plans, the Fund pays a monthly service fee at the maximum annual rate of 0.25% of the average daily net assets attributable to Class B and Class C shares of the Fund and the payment of a monthly distribution fee at the maximum annual rates of 0.75%, 0.75% and 0.50% of the average daily net assets attributable to Class B, Class C and Class R shares of the Fund, respectively.
Sales Charges
Sales charges, including front-end charges and CDSCs, received by the Distributor for distributing Fund shares were $10,573 for Class A, $818 for Class B and $144
Annual Report 2015
27
COLUMBIA MARSICO INTERNATIONAL OPPORTUNITIES FUND
NOTES TO FINANCIAL STATEMENTS (continued)
February 28, 2015
for Class C shares for the year ended February 28, 2015.
Expenses Waived/Reimbursed by the Investment Manager and its Affiliates
The Fund's expense ratio is subject to an expense reimbursement arrangement pursuant to which fees will be waived and/or expenses reimbursed (excluding certain fees and expenses described below), so that the Fund's net operating expenses, after giving effect to fees waived/expenses reimbursed and any balance credits and/or overdraft charges from the Fund's custodian, do not exceed the annual rates of:
| | | Voluntary
Expense Cap
Effective
July 1, 2014 | | Contractual
Expense Cap
Prior to
July 1, 2014 | |
Class A | | | 1.47 | % | | | 1.48 | % | |
Class B | | | 2.22 | | | | 2.23 | | |
Class C | | | 2.22 | | | | 2.23 | | |
Class I | | | 1.09 | | | | 1.09 | | |
Class R | | | 1.72 | | | | 1.73 | | |
Class R4 | | | 1.22 | | | | 1.23 | | |
Class Z | | | 1.22 | | | | 1.23 | | |
The voluntary expense cap arrangement may be revised or discontinued at any time. Under the arrangements, the following fees and expenses are excluded from the waiver/reimbursement commitment, and therefore will be paid by the Fund, if applicable: taxes (including foreign transaction taxes), expenses associated with investments in affiliated and non-affiliated pooled investment vehicles (including mutual funds and exchange-traded funds), transaction costs and brokerage commissions, costs related to any securities lending program, dividend expenses associated with securities sold short, inverse floater program fees and expenses, transaction charges and interest on borrowed money, interest and extraordinary expenses. Any fees waived and/or expenses reimbursed under the expense reimbursement arrangements described above are not recoverable by the Investment Manager or its affiliates in future periods.
Note 4. Federal Tax Information
The timing and character of income and capital gain distributions are determined in accordance with income tax regulations, which may differ from GAAP because of temporary or permanent book to tax differences.
At February 28, 2015, these differences are primarily due to differing treatment for capital loss carryforwards, deferral/reversal of wash sale losses, Trustees' deferred
compensation, foreign currency transactions and net operating loss reclassification. To the extent these differences are permanent, reclassifications are made among the components of the Fund's net assets in the Statement of Assets and Liabilities. Temporary differences do not require reclassifications. In the Statement of Assets and Liabilities the following reclassifications were made:
Excess of distributions over net investment income | | $ | 357,787 | | |
Accumulated net realized loss | | | 51,663 | | |
Paid-in capital | | | (409,450 | ) | |
Net investment income (loss) and net realized gains (losses), as disclosed in the Statement of Operations, and net assets were not affected by this reclassification.
The tax character of distributions paid during the years indicated was as follows:
Year Ended February 28, | | 2015 | | 2014 | |
Ordinary income | | $ | 303,017 | | | $ | 3,825,594 | | |
Short-term capital gain distributions, if any, are considered ordinary income distributions for tax purposes.
At February 28, 2015, the components of distributable earnings on a tax basis were as follows:
Capital loss carryforwards | | $ | (581,236,373 | ) | |
Net unrealized appreciation | | | 11,871,750 | | |
At February 28, 2015, the cost of investments for federal income tax purposes was $75,656,625 and the aggregate gross unrealized appreciation and depreciation based on that cost was:
Unrealized appreciation | | $ | 12,122,657 | | |
Unrealized depreciation | | | (250,907 | ) | |
Net unrealized appreciation | | $ | 11,871,750 | | |
The following capital loss carryforwards, determined at February 28, 2015, may be available to reduce taxable income arising from future net realized gains on investments, if any, to the extent permitted by the Internal Revenue Code:
Year of Expiration | | Amount ($) | |
2017 | | | 160,687,779 | | |
2018 | | | 420,548,594 | | |
Total | | | 581,236,373 | | |
For the year ended February 28, 2015, $18,814,107 of capital loss carryforward was utilized.
Management of the Fund has concluded that there are no significant uncertain tax positions in the Fund that
Annual Report 2015
28
COLUMBIA MARSICO INTERNATIONAL OPPORTUNITIES FUND
NOTES TO FINANCIAL STATEMENTS (continued)
February 28, 2015
would require recognition in the financial statements. However, management's conclusion may be subject to review and adjustment at a later date based on factors including, but not limited to, new tax laws, regulations, and administrative interpretations (including relevant court decisions). Generally, the Fund's federal tax returns for the prior three fiscal years remain subject to examination by the Internal Revenue Service.
Note 5. Portfolio Information
The cost of purchases and proceeds from sales of securities, excluding short-term investments and derivatives, if any, aggregated to $212,851,820 and $302,839,731, respectively, for the year ended February 28, 2015. The amount of purchase and sale activity impacts the portfolio turnover rate reported in the Financial Highlights.
Note 6. Affiliated Money Market Fund
The Fund invests in Columbia Short-Term Cash Fund, an affiliated money market fund established for the exclusive use by the Fund and other affiliated funds. The income earned by the Fund from such investments is included as Dividends — affiliated issuers in the Statement of Operations. As an investing fund, the Fund indirectly bears its proportionate share of the expenses of Columbia Short-Term Cash Fund.
Note 7. Shareholder Concentration
At February 28, 2015, two unaffiliated shareholders of record owned 32.3% of the outstanding shares of the Fund in one or more accounts. The Fund has no knowledge about whether any portion of those shares was owned beneficially. Affiliated shareholders of record owned 11.7% of the outstanding shares of the Fund in one or more accounts. Subscription and redemption activity by concentrated accounts may have a significant effect on the operations of the Fund.
Note 8. Line of Credit
The Fund has entered into a revolving credit facility with a syndicate of banks led by JPMorgan Chase Bank, N.A. (JPMorgan) whereby the Fund may borrow for the temporary funding of shareholder redemptions or for other temporary or emergency purposes. Pursuant to a December 9, 2014 amendment, the credit facility agreement, which is a collective agreement between the Fund and certain other funds managed by the Investment Manager, severally and not jointly, permits collective borrowings up to $550 million. Interest is charged to each participating fund based on its borrowings at a rate equal to the higher of (i) the overnight federal funds rate
plus 1.00% or (ii) the one-month LIBOR rate plus 1.00%. Each borrowing under the credit facility matures no later than 60 days after the date of borrowing. The Fund also pays a commitment fee equal to its pro rata share of the amount of the credit facility at a rate of 0.075% per annum. The commitment fee is included in other expenses in the Statement of Operations. Prior to the December 9, 2014 amendment, the credit facility agreement permitted borrowings up to $500 million under the same terms and interest rates as described above.
The Fund had no borrowings during the year ended February 28, 2015.
Note 9. Significant Risks
Consumer Discretionary Sector Risk
Sector risk occurs when a fund invests a significant portion of its assets in securities of companies conducting business in a related group of industries within an economic sector. Companies in the same economic sector may be similarly affected by economic, regulatory, political or market events or conditions, making a fund more vulnerable to unfavorable developments in that economic sector than funds that invest more broadly. The Fund may be more susceptible to the particular risks that may affect companies in the consumer discretionary sector than if it were invested in a wider variety of companies in unrelated sectors.
Foreign Securities and Emerging Market Countries Risk
Investing in foreign securities may include certain risks and considerations not typically associated with investing in U.S. securities, such as fluctuating currency values and changing local and regional economic, political and social conditions, which may result in greater market volatility. In addition, certain foreign securities may not be as liquid as U.S. securities. Investing in emerging markets may accentuate these risks. These countries are also more likely to experience high levels of inflation, deflation or currency devaluation which could hurt their economies and securities markets.
Information Technology Sector Risk
Sector risk occurs when a fund invests a significant portion of its assets in securities of companies conducting business in a related group of industries within an economic sector. Companies in the same economic sector may be similarly affected by economic, regulatory, political or market events or conditions, making a fund more vulnerable to unfavorable
Annual Report 2015
29
COLUMBIA MARSICO INTERNATIONAL OPPORTUNITIES FUND
NOTES TO FINANCIAL STATEMENTS (continued)
February 28, 2015
developments in that economic sector than funds that invest more broadly. The Fund may be more susceptible to the particular risks that may affect companies in the information technology sector than if it were invested in a wider variety of companies in unrelated sectors.
Note 10. Subsequent Events
Management has evaluated the events and transactions that have occurred through the date the financial statements were issued and noted no items requiring adjustment of the financial statements or additional disclosure.
Note 11. Information Regarding Pending and Settled Legal Proceedings
In December 2005, without admitting or denying the allegations, American Express Financial Corporation (AEFC, which is now known as Ameriprise Financial, Inc. (Ameriprise Financial)) entered into settlement agreements with the Securities and Exchange Commission (SEC) and Minnesota Department of Commerce (MDOC) related to market timing activities. As a result, AEFC was censured and ordered to cease and desist from committing or causing any violations of certain provisions of the Investment Advisers Act of 1940, the Investment Company Act of 1940, and various Minnesota laws. AEFC agreed to pay disgorgement of $10 million and civil money penalties of $7 million. AEFC also agreed to retain an independent distribution consultant to assist in developing a plan for distribution of all disgorgement and civil penalties ordered by the SEC in accordance with various undertakings detailed at www.sec.gov/litigation/admin/ia-2451.pdf. Ameriprise Financial and its affiliates have cooperated with the SEC and the MDOC in these legal proceedings, and have made regular reports to the Funds' Boards of Trustees.
Ameriprise Financial and certain of its affiliates have historically been involved in a number of legal, arbitration and regulatory proceedings, including routine litigation, class actions, and governmental actions, concerning matters arising in connection with the conduct of their business activities. Ameriprise Financial believes that the Funds are not currently the subject of, and that neither Ameriprise Financial nor any of its affiliates are the subject of, any pending legal, arbitration or regulatory proceedings that are likely to have a material adverse effect on the Funds or the ability of Ameriprise Financial or its affiliates to perform under their contracts with the Funds. Ameriprise Financial is required to make quarterly (10-Q), annual (10-K) and, as necessary, 8-K filings with the Securities and Exchange Commission
on legal and regulatory matters that relate to Ameriprise Financial and its affiliates. Copies of these filings may be obtained by accessing the SEC website at www.sec.gov.
There can be no assurance that these matters, or the adverse publicity associated with them, will not result in increased fund redemptions, reduced sale of fund shares or other adverse consequences to the Funds. Further, although we believe proceedings are not likely to have a material adverse effect on the Funds or the ability of Ameriprise Financial or its affiliates to perform under their contracts with the Funds, these proceedings are subject to uncertainties and, as such, we are unable to estimate the possible loss or range of loss that may result. An adverse outcome in one or more of these proceedings could result in adverse judgments, settlements, fines, penalties or other relief that could have a material adverse effect on the consolidated financial condition or results of operations of Ameriprise Financial.
Annual Report 2015
30
COLUMBIA MARSICO INTERNATIONAL OPPORTUNITIES FUND
REPORT OF INDEPENDENT REGISTERED PUBLIC ACCOUNTING FIRM
To the Trustees of Columbia Funds Series Trust and the Shareholders of
Columbia Marsico International Opportunities Fund
In our opinion, the accompanying statement of assets and liabilities, including the portfolio of investments, and the related statements of operations and of changes in net assets and the financial highlights present fairly, in all material respects, the financial position of Columbia Marsico International Opportunities Fund (the "Fund", a series of Columbia Funds Series Trust) at February 28, 2015, and the results of its operations, the changes in its net assets and the financial highlights for each of the periods indicated, in conformity with accounting principles generally accepted in the United States of America. These financial statements and financial highlights (hereafter referred to as "financial statements") are the responsibility of the Fund's management; our responsibility is to express an opinion on these financial statements based on our audits. We conducted our audits of these financial statements in accordance with the standards of the Public Company Accounting Oversight Board (United States). Those standards require that we plan and perform the audit to obtain reasonable assurance about whether the financial statements are free of material misstatement. An audit includes examining, on a test basis, evidence supporting the amounts and disclosures in the financial statements, assessing the accounting principles used and significant estimates made by management, and evaluating the overall financial statement presentation. We believe that our audits, which included confirmation of securities at February 28, 2015 by correspondence with the custodian, brokers and transfer agent, and the application of alternative auditing procedures where such confirmations had not been received, provide a reasonable basis for our opinion.
PricewaterhouseCoopers LLP
Minneapolis, Minnesota
April 21, 2015
Annual Report 2015
31
COLUMBIA MARSICO INTERNATIONAL OPPORTUNITIES FUND
FEDERAL INCOME TAX INFORMATION
(Unaudited)
The Fund hereby designates the following tax attributes for the fiscal year ended February 28, 2015. Shareholders will be notified in early 2016 of the amounts for use in preparing 2015 income tax returns.
Tax Designations:
Foreign Taxes Paid | | $ | 161,841 | | |
Foreign Taxes Paid Per Share | | $ | 0.03 | | |
Foreign Source Income | | $ | 1,709,074 | | |
Foreign Source Income Per Share | | $ | 0.27 | | |
Foreign Taxes. The Fund makes the election to pass through to shareholders the foreign taxes paid. Eligible shareholders may claim a foreign tax credit. These taxes, and the corresponding foreign source income, are provided.
Annual Report 2015
32
COLUMBIA MARSICO INTERNATIONAL OPPORTUNITIES FUND
Shareholders elect the Board that oversees the Funds' operations. The Board appoints officers who are responsible for day-to-day business decisions based on policies set by the Board. The following table provides basic biographical information about the Funds' Board members, including their principal occupations during the past five years, although specific titles for individuals may have varied over the period. Under current Board policy, members may serve through the end of the calendar year in which he or she reaches either the mandatory retirement age established by the Board or the fifteenth anniversary of the first Board meeting they attended as a member of the Board.
Independent Trustees
Name,
Address,
Year of Birth | | Position Held With
Funds and Length of
Service | | Principal Occupation(s)
During Past Five Years
and Other Relevant
Professional Experience | | Number of
Funds in the
Fund Family
Overseen by
Board Member | | Other Present or Past
Directorships/
Trusteeships
(Within Past 5 Years) | |
Kathleen Blatz
901 S. Marquette Ave.
Minneapolis, MN 55402
1954 | | Board member since 1/06 for RiverSource Funds and since 6/11 for Nations Funds | | Attorney; specializing in arbitration and mediation; Chief Justice, Minnesota Supreme Court, 1998-2006; Associate Justice, Minnesota Supreme Court, 1996-1998; Fourth Judicial District Court Judge, Hennepin Country, 1994-1996; Attorney in private practice and public service, 1984-1993; State Representative, Minnesota House of Representatives, 1979-1993, which included service on the Tax and Financial Institutions and Insurance Committees | | | 127 | | | Trustee, BlueCross BlueShield of Minnesota (Chair of the Business Development Committee) since 2009; Chair of the Robina Foundation since August 2013 | |
Edward J. Boudreau, Jr.
901 S. Marquette Ave.
Minneapolis, MN 55402
1944 | | Board member since 6/11 for RiverSource Funds and since 1/05 for Nations Funds | | Managing Director, E.J. Boudreau & Associates (consulting) since 2000; FINRA Industry Arbitrator, 2002-present; Chairman and Chief Executive Officer, John Hancock Funds (asset management), Chairman and Interested Trustee for open-end and closed-end funds offered by John Hancock, 1989-2000; John Hancock Life Insurance Company, including SVP and Treasurer and SVP Information Technology, 1968-1988 | | | 125 | | | Former Trustee, BofA Funds Series Trust (11 funds), 2005-2011; Trustee, Boston Museum of Science (Chair of Finance Committee), 1985-2013 | |
Pamela G. Carlton
901 S. Marquette Ave.
Minneapolis, MN 55402
1954 | | Board member since 7/07 for RiverSource Funds and since 6/11 for Nations Funds | | President, Springboard — Partners in Cross Cultural Leadership (consulting company) since 2003; Managing Director of US Equity Research, JP Morgan Chase, 1999-2003; Director of US Equity Research, Chase Asset Management, 1996- 1999; Co-Director Latin America Research, 1993-1996, COO Global Research, 1992-1996, Co-Director of US Research, 1991-1992, Investment Banker, Morgan Stanley, 1982-1991 | | | 127 | | | None | |
Annual Report 2015
33
COLUMBIA MARSICO INTERNATIONAL OPPORTUNITIES FUND
TRUSTEES AND OFFICERS (continued)
Independent Trustees (continued)
Name,
Address,
Year of Birth | | Position Held With
Funds and Length of
Service | | Principal Occupation(s)
During Past Five Years
and Other Relevant
Professional Experience | | Number of
Funds in the
Fund Family
Overseen by
Board Member | | Other Present or Past
Directorships/
Trusteeships
(Within Past 5 Years) | |
William P. Carmichael
901 S. Marquette Ave.
Minneapolis, MN 55402
1943 | | Chair of the Board since 1/14, Board member since 6/11 for RiverSource Funds and since 2003 for Nations Funds | | Retired; Co-founder, The Succession Fund (provides exit strategies to owners of privately held companies) 1998-2007; Adjunct Professor of Finances, Kelley School of Business, Indiana University, 1993-2007; Senior Vice President, Sara Lee Corporation, 1991-1993; Senior Vice President and Chief Financial Officer, Beatrice Foods Company, 1984-1990; Vice President, Esmark, Inc, 1973-1984.; Associate, Price Waterhouse, 1968-1972 | | | 127 | | | Director, Cobra Electronics Corporation (electronic equipment manufacturer), 1994-August 2014; The Finish Line (athletic shoes and apparel) since July 2003; Director, International Textile Corp. since 2012; former Director, McMoRan Exploration Company (oil and gas exploration and development) 2010-2013; former Trustee, BofA Funds Series Trust (11 funds) 2009-2011; Director, Spectrum Brands, Inc. (consumer products), 2002-2009; Director, Simmons Company (bedding), 2004-2010 | |
Patricia M. Flynn
901 S. Marquette Ave.
Minneapolis, MN 55402
1950 | | Board member since 11/04 for RiverSource Funds and since 6/11 for Nations Funds | | Trustee Professor of Economics and Management, Bentley University since 1976 (also teaches and conducts research on corporate governance); Dean, McCallum Graduate School of Business, Bentley University, 1992-2002 | | | 127 | | | Trustee, MA Taxpayers Foundation since 1997; Board of Governors, Innovation Institute, MA Technology Collaborative since 2010 | |
William A. Hawkins
901 S. Marquette Ave.
Minneapolis, MN 55402
1942 | | Board member since 6/11 for RiverSource Funds and since 1/05 for Nations Funds | | Managing Director, Overton Partners (financial consulting), since August 2010; President and Chief Executive Officer, California General Bank, N.A., January 2008-August 2010; Operation Hope, COO, 2004-2007; IndyMac Bancorp, President, CBG, 1999-2003; American General Bank, President, 1997-1999; Griffin Financial Services, CEO, 1981-1997; The Griffin Funds, CEO, 1992-1998 | | | 125 | | | Trustee, BofA Funds Series Trust (11 funds) | |
R. Glenn Hilliard
901 S. Marquette Ave.
Minneapolis, MN 55402
1943 | | Board member since 6/11 for RiverSource Funds and since 1/05 for Nations Funds | | Chairman and Chief Executive Officer, Hilliard Group LLC (investing and consulting) since April 2003; Non-Executive Director & Chairman, CNO Financial Group, Inc. (insurance), September 2003-May 2011 | | | 125 | | | Chairman, BofA Funds Series Trust (11 funds); former Director, CNO Financial Group, Inc. (insurance) 2003-2011 | |
Annual Report 2015
34
COLUMBIA MARSICO INTERNATIONAL OPPORTUNITIES FUND
TRUSTEES AND OFFICERS (continued)
Independent Trustees (continued)
Name,
Address,
Year of Birth | | Position Held With
Funds and Length of
Service | | Principal Occupation(s)
During Past Five Years
and Other Relevant
Professional Experience | | Number of
Funds in the
Fund Family
Overseen by
Board Member | | Other Present or Past
Directorships/
Trusteeships
(Within Past 5 Years) | |
Catherine James Paglia
901 S. Marquette Ave.
Minneapolis, MN 55402
1952 | | Board member since 11/04 for RiverSource Funds and since 6/11 for Nations Funds | | Director, Enterprise Asset Management, Inc. (private real estate and asset management company) since September 1998; Managing Director and Partner, Interlaken Capital, Inc., 1989-1997; Managing Director, Morgan Stanley, 1982-1989; Vice President, Investment Banking, 1980-1982, Associate, Investment Banking, 1976-1980, Dean Witter Reynolds, Inc. | | | 127 | | | Director, Valmont Industries, Inc. (irrigation systems manufacturer) since 2012; Trustee, Carleton College (on the Investment Committee); Trustee, Carnegie Endowment for International Peace (on the Investment Committee) | |
Leroy C. Richie
901 S. Marquette Ave.
Minneapolis, MN 55402
1941 | | Board member since 2000 for Seligman Funds, since 11/08 for RiverSource Funds and since 6/11 for Nations Funds | | Counsel, Lewis & Munday, P.C. (law firm) since 2004; Vice President and General Counsel, Automotive Legal Affairs, Chrysler Corporation, 1993-1997 | | | 127 | | | Lead Outside Director, Digital Ally, Inc. (digital imaging) since September 2005; Director, Infinity, Inc. (oil and gas exploration and production) since 1994; Director, OGE Energy Corp. (energy and energy services) since November 2007-2014 | |
Minor M. Shaw
901 S. Marquette Ave.
Minneapolis, MN 55402
1947 | | Board member since 6/11 for RiverSource Funds and since 2003 for Nations Funds | | President, Micco LLC (private investments) since 2011; President, Micco Corp. (family investment business) 1998-2011 | | | 125 | | | Director, Piedmont Natural Gas; Director, BlueCross BlueShield of South Carolina since April 2008; Chair of the Duke Endowment; Director, National Association of Corporate Directors, Carolinas Chapter, since 2013; Chair of Greenville-Spartanburg Airport Commission; former Trustee, BofA Funds Series Trust (11 funds), 2003-2011 | |
Alison Taunton-Rigby
901 S. Marquette Ave.
Minneapolis, MN 55402
1944 | | Board member since 11/02 for RiverSource Funds and since 6/11 for Nations Funds | | Managing Director, Forester Biotech (consulting) since 2001; Chief Executive Officer and Director, RiboNovix, Inc., (biotechnology) 2003-2010; President and Chief Executive Officer of CMT Inc., 2001-2003; Aquila Biopharmaceuticals Inc., 1996-2000; Cambridge Biotech Corporation, 1995-1996, Mitotix Inc., 1993-1994 | | | 127 | | | Director, Healthways, Inc. (health and well-being solutions) since 2005; Director, ICI Mutual Insurance Company, RRG since 2011; Director, Abt Associates (government contractor) since 2001; Director, Boston Children's Hospital since 2002 | |
Annual Report 2015
35
COLUMBIA MARSICO INTERNATIONAL OPPORTUNITIES FUND
TRUSTEES AND OFFICERS (continued)
Interested Trustee Not Affiliated with Investment Manager*
Name,
Address,
Year of Birth | | Position Held With
Funds and Length of
Service | | Principal Occupation
During Past Five Years | | Number of
Funds in the
Fund Family
Overseen by
Board Member | | Other Present or Past
Directorships/
Trusteeships
(Within Past 5 Years) | |
Anthony M. Santomero
901 S. Marquette Ave.
Minneapolis, MN 55402
1946 | | Board member since 6/11 for RiverSource Funds and since 1/08 for Nations Funds | | Richard K. Mellon Professor Emeritus of Finance, The Wharton School, University of Pennsylvania, since 2002; Senior Advisor, McKinsey & Company (consulting), 2006-2008; President, Federal Reserve Bank of Philadelphia, 2000-2006, Professor of Finance, The Wharton School, University of Pennsylvania, 1972-2002 | | | 125 | | | Director, Renaissance Reinsurance Ltd. since May 2008; Trustee, Penn Mutual Life Insurance Company since March 2008; Director, Citigroup Inc. since 2009; Director, Citibank, N.A. since 2009; former Trustee, BofA Funds Series Trust (11 funds), 2008-2011 | |
* Dr. Santomero is not an affiliated person of the Investment Manager or Ameriprise Financial. However, he is currently deemed by the Funds to be an "interested person" (as defined in the 1940 Act) of the Funds because he serves as a Director of Citigroup Inc. and Citibank, N.A., companies that may directly or through subsidiaries and affiliates engage from time-to-time in brokerage execution, principal transactions and lending relationships with the Funds or accounts advised/managed by the Investment Manager.
Annual Report 2015
36
COLUMBIA MARSICO INTERNATIONAL OPPORTUNITIES FUND
TRUSTEES AND OFFICERS (continued)
Interested Trustee Affiliated with Investment Manager*
Name,
Address,
Year of Birth | | Position Held With
Funds and Length of
Service | | Principal Occupation
During Past Five Years | | Number of
Funds in the
Fund Family
Overseen by
Board Member | | Other Present or Past
Directorships/
Trusteeships
(Within Past 5 Years) | |
William F. Truscott
53600 Ameriprise
Financial Center
Minneapolis, MN 55474
1960 | | Board member since 11/01 for RiverSource Funds and since 6/11 for Nations Funds; Senior Vice President since 2002 for RiverSource Funds and since 5/10 for Nations Funds | | Chairman of the Board and President, Columbia Management Investment Advisers, LLC since May 2010 and February 2012, respectively (previously President and Chief Investment Officer, 2001-April 2010); Chief Executive Officer, Global Asset Management, Ameriprise Financial, Inc. since September 2012 (previously Chief Executive Officer, U.S. Asset Management & President, Annuities, May 2010-September 2012 and President — U.S. Asset Management and Chief Investment Officer, 2005-April 2010); Director and Chief Executive Officer, Columbia Management Investment Distributors, Inc. since May 2010 and February 2012, respectively (previously Chairman of the Board and Chief Executive Officer, 2006-April 2010); Chairman of the Board and Chief Executive Officer, RiverSource Distributors, Inc. since 2006; Director, Threadneedle Asset Management Holdings, SARL since 2014; President and Chief Executive Officer, Ameriprise Certificate Company, 2006-August 2012 | | | 186 | | | Former Director, Ameriprise Certificate Company, 2006-January 2013 | |
* Interested person (as defined under the 1940 Act) by reason of being an officer, director, security holder and/or employee of the Investment Manager or Ameriprise Financial.
The Statement of Additional Information has additional information about the Fund's Board members and is available, without charge, upon request by calling 800.345.6611; contacting your financial intermediary or visiting columbiathreadneedle.com/us.
Annual Report 2015
37
COLUMBIA MARSICO INTERNATIONAL OPPORTUNITIES FUND
TRUSTEES AND OFFICERS (continued)
The Board has appointed officers who are responsible for day-to-day business decisions based on policies it has established. The officers serve at the pleasure of the Board. In addition to Mr. Truscott, who is Senior Vice President, the Funds' other officers are:
Fund Officers
Name,
Address and
Year of Birth | | Position and Year
First Appointed to
Position for any Fund
in the Columbia
Funds Complex or a
Predecessor Thereof | | Principal Occupation(s) During Past Five Years | |
Christopher O. Petersen
5228 Ameriprise
Financial Center
Minneapolis, MN 55474
Born 1970 | | President and Principal Executive Officer (2015) | | Vice President and Lead Chief Counsel, Ameriprise Financial, Inc. since January 2015 (previously, Vice President and Chief Counsel January 2010-December 2014; and Vice President and Group Counsel or Counsel 2004-January 2010); officer of Columbia Funds and affiliated funds since 2007. | |
Michael G. Clarke
225 Franklin Street
Boston, MA 02110
Born 1969 | | Treasurer (2011) and Chief Financial Officer (2009) | | Vice President — Mutual Fund Administration, Columbia Management Investment Advisers, LLC, since May 2010; Managing Director of Fund Administration, Columbia Management Advisors, LLC, September 2004-April 2010; senior officer of Columbia Funds and affiliated funds since 2002. | |
Paul B. Goucher
100 Park Avenue
New York, NY 10017
Born 1968 | | Senior Vice President (2011), Chief Legal Officer (2015) and Assistant Secretary (2008) | | Vice President and Lead Chief Counsel, Ameriprise Financial, Inc. since November 2008 and January 2013, respectively (previously Chief Counsel, January 2010-January 2013 and Group Counsel, November 2008-January 2010). | |
Thomas P. McGuire
225 Franklin Street
Boston, MA 02110
Born 1972 | | Vice President and Chief Compliance Officer (2012) | | Vice President — Asset Management Compliance, Ameriprise Financial, Inc., since May 2010; Chief Compliance Officer, Ameriprise Certificate Company since September 2010; Compliance Executive, Bank of America, 2005-April 2010. | |
Colin Moore
225 Franklin Street
Boston, MA 02110
Born 1958 | | Senior Vice President (2010) | | Executive Vice President and Global Chief Investment Officer, Ameriprise Financial, Inc., since July 2013; Director and Global Chief Investment Officer, Columbia Management Investment Advisers, LLC since May 2010; Manager, Managing Director and Chief Investment Officer, Columbia Management Advisors, LLC, 2007-April 2010. | |
Michael E. DeFao
225 Franklin Street
Boston, MA 02110
Born 1968 | | Vice President (2011) and Assistant Secretary (2010) | | Vice President and Chief Counsel, Ameriprise Financial, Inc. since May 2010; Associate General Counsel, Bank of America, 2005-April 2010. | |
Joseph F. DiMaria
225 Franklin Street
Boston, MA 02110
Born 1968 | | Vice President (2011), Assistant Treasurer (2012) and Chief Accounting Officer (2008) | | Vice President — Mutual Fund Treasurer, Columbia Management Investment Advisers, LLC since May 2010; Director of Fund Administration, Columbia Management Advisors, LLC, 2006-April 2010. | |
Amy Johnson
5228 Ameriprise
Financial Center
Minneapolis, MN 55474
Born 1965 | | Vice President (2006) | | Managing Director and Chief Operating Officer, Columbia Management Investment Advisers, LLC since May 2010 (previously Chief Administrative Officer, 2009-April 2010, and Vice President — Asset Management and Trust Company Services, 2006-2009). | |
Lyn Kephart-Strong
5228 Ameriprise
Financial Center
Minneapolis, MN 55474
Born 1960 | | Vice President (2015) | | President, Columbia Management Investment Services Corp. since October 2014; Vice President & Resolution Officer, Ameriprise Trust Company since August 2009; President, RiverSource Service Corporation 2004-2010. | |
Ryan C. Larrenaga
225 Franklin Street
Boston, MA 02110
Born 1970 | | Vice President and Secretary (2015) | | Vice President and Group Counsel, Ameriprise Financial, Inc. since August 2011 (previously, Counsel from May 2010 to August 2011); Assistant General Counsel, Bank of America, 2005-April 2010; officer of Columbia Funds and affiliated funds since 2005. | |
Annual Report 2015
38
COLUMBIA MARSICO INTERNATIONAL OPPORTUNITIES FUND
IMPORTANT INFORMATION ABOUT THIS REPORT
Each fund mails one shareholder report to each shareholder address. If you would like more than one report, please call shareholder services at 800.345.6611 and additional reports will be sent to you.
The policy of the Board is to vote the proxies of the companies in which each fund holds investments consistent with the procedures as stated in the Statement of Additional Information (SAI). You may obtain a copy of the SAI without charge by calling 800.345.6611; contacting your financial intermediary; visiting columbiathreadneedle.com/us; or searching the website of the Securities and Exchange Commission (SEC) at sec.gov. Information regarding how each fund voted proxies relating to portfolio securities is filed with the SEC by August 31st for the most recent 12-month period ending June 30th of that year, and is available without charge by visiting columbiathreadneedle.com/us; or searching the website of the SEC at sec.gov.
Each fund files a complete schedule of portfolio holdings with the SEC for the first and third quarters of each fiscal year on Form N-Q. Each fund's Form N-Q is available on the SEC's website at sec.gov and may be reviewed and copied at the SEC's Public Reference Room in Washington, D.C. Information on the operation of the Public Reference Room may be obtained by calling 800.SEC.0330. Each fund's complete schedule of portfolio holdings, as filed on Form N-Q, can also be obtained without charge, upon request, by calling 800.345.6611.
Annual Report 2015
39
Columbia Marsico International Opportunities Fund
P.O. Box 8081
Boston, MA 02266-8081

This information is for use with concurrent or prior delivery of a fund prospectus. Please read and consider the investment objectives, risks, charges and expenses for any fund carefully before investing. For a prospectus and summary prospectus, which contains this and other important information about the Fund, go to columbiathreadneedle.com/us. The Fund is distributed by Columbia Management Investment Distributors, Inc., member FINRA, and managed by Columbia Management Investment Advisers, LLC.
Columbia Threadneedle Investments (Columbia Threadneedle) is the global brand name of the Columbia and Threadneedle group of companies.
All rights reserved. Columbia Management Investment Distributors, Inc., 225 Franklin Street, Boston, MA 02110-2804
© 2015 Columbia Management Investment Advisers, LLC.
columbiathreadneedle.com/us
ANN189_02_E01_(04/15)

ANNUAL REPORT
February 28, 2015

COLUMBIA MID CAP VALUE FUND

ABOUT COLUMBIA THREADNEEDLE INVESTMENTS
Columbia Threadneedle Investments is a leading global asset management group that provides a broad range of actively managed investment strategies and solutions for individual, institutional and corporate clients around the world.
With more than 2,000 people, including over 450 investment professionals based in North America, Europe and Asia, we manage $506 billion* of assets across developed and emerging market equities, fixed income, asset allocation solutions and alternatives. We are the 11th largest manager of long-term mutual fund assets in the U.S.** and the 5th largest manager of retail funds in the U.K.***
Our priority is the investment success of our clients. We aim to deliver the investment outcomes they expect through an investment approach that is team-based, performance-driven and risk-aware. Our culture is dynamic and interactive. By sharing our insights across asset classes and geographies, we generate richer perspectives on global, regional and local investment landscapes. The ability to exchange and debate investment ideas in a collaborative environment enriches our teams' investment processes. More importantly, it results in better informed investment decisions for our clients.
Columbia funds are distributed by Columbia Management Investment Distributors, Inc., member FINRA, and managed by Columbia Management Investment Advisers, LLC.
Columbia Threadneedle Investments (Columbia Threadneedle) is the global brand name of the Columbia and Threadneedle group of companies.
* In U.S. dollars as of December 31, 2014. Source: Ameriprise Q4 Earnings Release. Includes all assets managed by entities in the Columbia and Threadneedle groups of companies. Contact us for more current data.
** Source: ICI as of December 31, 2014 for Columbia Management Investment Advisers, LLC.
*** Source: Investment Association as of December 2014 for Threadneedle Asset Management Limited.
© 2015 Columbia Management Investment Advisers, LLC. All rights reserved.
Not part of the shareholder report
 Dear Shareholder,
In a world that is changing faster than ever before, investors want asset managers who offer a global perspective while generating strong and sustainable returns. To that end, Columbia Management, in conjunction with its U.K.-based affiliate, Threadneedle Investments, has rebranded to Columbia Threadneedle Investments. The new global brand represents the combined capabilities, resources and reach of the global group, offering investors access to the best of both firms.
With a presence in 18 countries and more than 450 investment professionals*, our collective perspective and world view as Columbia Threadneedle Investments gives us deeper insight into what might affect the real-life financial outcomes clients are seeking. Putting our views into a global context enables us to build richer perspectives and create the right solutions, and provides us with enhanced capabilities to deliver consistent investment performance, which may ultimately lead to better investor outcomes.
As a result of the rebrand, you will begin to see our new logo and colors reflected in printed materials, such as this shareholder report, as well as on our new website — columbiathreadneedle.com/us. We encourage you to visit us online and view a new video on the "About Us" tab that speaks to the strength of the firm.
While we are introducing a new brand, in many ways, the investment company you know well has not changed. The following remain in effect:
n Fund and strategy names
n Established investment teams, philosophies and processes
n Account services, features, servicing phone numbers and mailing addresses
n Columbia Management Investment Distributors as distributor and Columbia Management Investment Advisers as investment adviser
We recognize that the money we manage represents the hard work and savings of people like you, and that everyone has different ambitions and different definitions of success. Investors have varying goals — funding their children's education, enjoying their retirement, putting money aside for unexpected events, and more. Whatever your ambitions, we believe our wide range of investment products and solutions can help give you confidence that you will reach your goals.
The world is constantly changing, but our priority remains the same: to help you secure your finances, meet your goals and achieve success. Thank you for your continued investment with us. Our service representatives are available at 800.345.6611 to help with any questions.
Sincerely,

Christopher O. Petersen
President, Columbia Funds
Investors should consider the investment objectives, risks, charges and expenses of a mutual fund carefully before investing. For a free prospectus and summary prospectus, which contains this and other important information about a fund, visit columbiathreadneedle.com/us. The prospectus should be read carefully before investing.
* Source: Ameriprise as of December 1, 2014
Columbia Funds are distributed by Columbia Management Investment Distributors, Inc., member FINRA, and managed by Columbia Management Investment Advisers, LLC.
© 2015 Columbia Management Investment Advisers, LLC. All rights reserved.
COLUMBIA MID CAP VALUE FUND
Fund Investment Manager
Columbia Management Investment
Advisers, LLC
225 Franklin Street
Boston, MA 02110
Fund Distributor
Columbia Management Investment
Distributors, Inc.
225 Franklin Street
Boston, MA 02110
Fund Transfer Agent
Columbia Management Investment
Services Corp.
P.O. Box 8081
Boston, MA 02266-8081
For more information about any of the funds, please visit columbiathreadneedle.com/us or call 800.345.6611. Customer Service Representatives are available to answer your questions Monday through Friday from 8 a.m. to 7 p.m. Eastern time.
The views expressed in this report reflect the current views of the respective parties. These views are not guarantees of future performance and involve certain risks, uncertainties and assumptions that are difficult to predict, so actual outcomes and results may differ significantly from the views expressed. These views are subject to change at any time based upon economic, market or other conditions and the respective parties disclaim any responsibility to update such views. These views may not be relied on as investment advice and, because investment decisions for a Columbia fund are based on numerous factors, may not be relied on as an indication of trading intent on behalf of any particular Columbia fund. References to specific securities should not be construed as a recommendation or investment advice.
Performance Overview | | | 3 | | |
Manager Discussion of Fund Performance | | | 5 | | |
Understanding Your Fund's Expenses | | | 8 | | |
Portfolio of Investments | | | 9 | | |
Statement of Assets and Liabilities | | | 14 | | |
Statement of Operations | | | 17 | | |
Statement of Changes in Net Assets | | | 18 | | |
Financial Highlights | | | 21 | | |
Notes to Financial Statements | | | 32 | | |
Report of Independent Registered
Public Accounting Firm | | | 41 | | |
Federal Income Tax Information | | | 42 | | |
Trustees and Officers | | | 43 | | |
Important Information About This Report | | | 49 | | |
COLUMBIA MID CAP VALUE FUND
Performance Summary
n Columbia Mid Cap Value Fund (the Fund) Class A shares returned 8.50% excluding sales charges for the 12-month period that ended February 28, 2015.
n The Fund underperformed its benchmark, the Russell Midcap Value Index, which returned 13.63% during the same time period.
n An overweight in energy stocks, particularly equipment and service companies, detracted from performance relative to the benchmark as did underweights in real-estate investment trusts (REITs) and utilities.
Average Annual Total Returns (%) (for period ended February 28, 2015)
| | | Inception | | 1 Year | | 5 Years | | 10 Years | |
Class A | | 11/20/01 | | | | | | | | | | | | | |
Excluding sales charges | | | | | | | 8.50 | | | | 15.70 | | | | 8.47 | | |
Including sales charges | | | | | | | 2.24 | | | | 14.35 | | | | 7.83 | | |
Class B | | 11/20/01 | | | | | | | | | | | | | |
Excluding sales charges | | | | | | | 7.64 | | | | 14.83 | | | | 7.66 | | |
Including sales charges | | | | | | | 3.08 | | | | 14.60 | | | | 7.66 | | |
Class C | | 11/20/01 | | | | | | | | | | | | | |
Excluding sales charges | | | | | | | 7.73 | | | | 14.84 | | | | 7.67 | | |
Including sales charges | | | | | | | 6.81 | | | | 14.84 | | | | 7.67 | | |
Class I* | | 09/27/10 | | | 9.03 | | | | 16.17 | | | | 8.69 | | |
Class K* | | 03/07/11 | | | 8.63 | | | | 15.85 | | | | 8.54 | | |
Class R* | | 01/23/06 | | | 8.25 | | | | 15.41 | | | | 8.20 | | |
Class R4* | | 11/08/12 | | | 8.79 | | | | 15.85 | | | | 8.54 | | |
Class R5* | | 11/08/12 | | | 8.87 | | | | 15.92 | | | | 8.57 | | |
Class W* | | 09/27/10 | | | 8.50 | | | | 15.71 | | | | 8.47 | | |
Class Y* | | 07/15/09 | | | 8.97 | | | | 16.14 | | | | 8.69 | | |
Class Z | | 11/20/01 | | | 8.76 | | | | 15.98 | | | | 8.74 | | |
Russell Midcap Value Index | | | | | | | 13.63 | | | | 17.53 | | | | 9.59 | | |
Returns for Class A are shown with and without the maximum initial sales charge of 5.75%. Returns for Class B are shown with and without the applicable contingent deferred sales charge (CDSC) of 5.00% in the first year, declining to 1.00% in the sixth year and eliminated thereafter. Returns for Class C are shown with and without the 1.00% CDSC for the first year only. The Fund's other classes are not subject to sales charges and have limited eligibility. Please see the Fund's prospectus for details. Performance for different share classes will vary based on differences in sales charges and fees associated with each class. All results shown assume reinvestment of distributions during the period. Returns do not reflect the deduction of taxes that a shareholder may pay on Fund distributions or on the redemption of Fund shares. Performance results reflect the effect of any fee waivers or reimbursements of Fund expenses by Columbia Management Investment Advisers, LLC and/or any of its affiliates. Absent these fee waivers or expense reimbursement arrangements, performance results would have been lower.
The performance information shown represents past performance and is not a guarantee of future results. The investment return and principal value of your investment will fluctuate so that your shares, when redeemed, may be worth more or less than their original cost. Current performance may be lower or higher than the performance information shown. You may obtain performance information current to the most recent month-end by contacting your financial intermediary, visiting columbiathreadneedle.com/us or calling 800.345.6611.
*The returns shown for periods prior to the share class inception date (including returns for the Life of the Fund, if shown, which are since Fund inception) include the returns of the Fund's oldest share class. Since the Fund launched more than one share class at its inception, Class A shares were used. These returns are adjusted to reflect any higher class-related operating expenses of the newer share classes, as applicable. Please visit columbiathreadneedle.com/us/investment-products/mutual-funds/appended-performance for more information.
The Russell Midcap Value Index, an unmanaged index, measures the performance of those Russell Midcap Index companies with lower price-to-book ratios and forecasted growth values.
Indices are not available for investment, are not professionally managed and do not reflect sales charges, fees, brokerage commissions, taxes or other expenses of investing. Securities in the Fund may not match those in an index.
Annual Report 2015
3
COLUMBIA MID CAP VALUE FUND
PERFORMANCE OVERVIEW (continued)
Performance of a Hypothetical $10,000 Investment (March 1, 2005 – February 28, 2015)
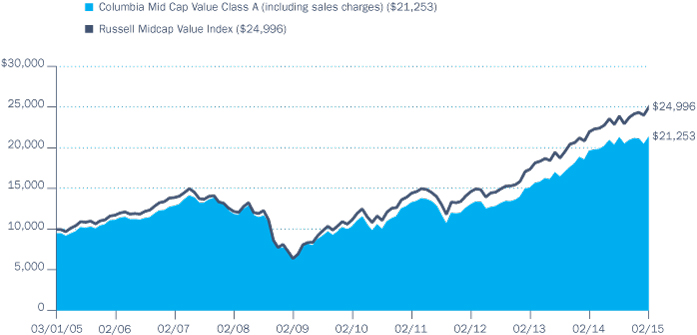
The chart above shows the change in value of a hypothetical $10,000 investment in Class A shares of Columbia Mid Cap Value Fund during the stated time period, and does not reflect the deduction of taxes that a shareholder may pay on Fund distributions or on the redemption of Fund shares.
Annual Report 2015
4
COLUMBIA MID CAP VALUE FUND
MANAGER DISCUSSION OF FUND PERFORMANCE
For the 12-month period that ended February 28, 2015, the Fund's Class A shares returned 8.50% excluding sales charges. The Fund underperformed its benchmark, the Russell Midcap Value Index, which returned 13.63% for the same time period. The Fund's overweight in energy stocks, particularly equipment and service companies, detracted from performance relative to the benchmark as energy prices declined more than 50% during the period. Underweights in real-estate investment trusts (REITs) and utilities also detracted from results.
Stocks Climb as U.S. Economy Strengthen
After a cold and difficult winter brought many parts of the United States to a standstill early in 2014, the pace of U.S. economic growth picked up and good news appeared in most sectors. The labor market added 267,000 new jobs monthly, on average, during the 12-month period ended February 28, 2015. Solid new job growth drove the unemployment rate down to 5.5%, and prospects for higher wages generally buoyed consumer confidence during the period. Manufacturing activity remained solid, as capacity utilization rose to a post-recovery high. However, another stormy winter in the Northeast and Midwest nipped growth early in 2015. Manufacturing activity and consumer confidence slipped as harsh weather weighed on short-term expectations. The housing market's recovery was restrained by both periods of bad weather, tighter borrowing standards, rising prices and higher mortgage rates.
Investors responded favorably to the generally good economic news. However, concerns about increased global tensions, uncertainty about the Federal Reserve's (the Fed's) next move and sinking oil prices resulted in bouts of volatility that became more pronounced as the period continued. The Fed spent 2014 winding down its monthly bond purchases, ending its program of quantitative easing in October, and suggested that it would raise short-term interest rates sometime in 2015. However, the timing of that move remained unclear, especially as some weaker data appeared in the final months of the period. In this environment, interest rates dropped sharply. The yield on the 10-year U.S. Treasury bond, which started the period at 2.6%, dropped to 2.0%, having traded even lower in the final months of the period. Large company stocks were the strongest equity market performers, while mid-cap stocks lagged, partly because mid-cap energy-related equipment and services companies fared worse in the oil sell-off than did their larger-cap counterparts. Within the mid-cap universe, value edged out growth for the 12-month period. Continued low interest rates favored utilities and REITs, which make up a far larger portion of the mid-cap value index than mid-cap growth.
Contributors and Detractors
Stock selection within information technology helped relative performance, primarily due to an improving U.S. economy and growing demand in key global markets. Standout individual performers included semiconductor maker Skyworks Solutions and interactive software provider Electronic Arts, both of which enjoyed triple-digit gains for the period. Skyworks continued to benefit from its exposure to the smartphone market and increased dollar content per phone, including the
Portfolio Management
David Hoffman
Diane Sobin, CFA
Jonas Patrikson, CFA
Morningstar Style BoxTM
The Morningstar Style BoxTM is based on a fund's portfolio holdings. For equity funds, the vertical axis shows the market capitalization of the stocks owned, and the horizontal axis shows investment style (value, blend, or growth). Information shown is based on the most recent data provided by Morningstar.
© 2015 Morningstar, Inc. All rights reserved. The Morningstar information contained herein: (1) is proprietary to Morningstar and/or its content providers; (2) may not be copied or distributed; and (3) is not warranted to be accurate, complete or timely. Neither Morningstar nor its content providers are responsible for any damages or losses arising from any use of this information.
Top Ten Holdings (%)
(at February 28, 2015) | |
M&T Bank Corp. | | | 2.1 | | |
Fifth Third Bancorp | | | 2.1 | | |
SL Green Realty Corp. | | | 2.0 | | |
D.R. Horton, Inc. | | | 1.9 | | |
Edison International | | | 1.9 | | |
Lincoln National Corp. | | | 1.9 | | |
Great Plains Energy, Inc. | | | 1.8 | | |
Raymond James Financial, Inc. | | | 1.7 | | |
UDR, Inc. | | | 1.6 | | |
Teleflex, Inc. | | | 1.6 | | |
Percentages indicated are based upon total investments (excluding Money Market Funds).
For further detail about these holdings, please refer to the section entitled "Portfolio of Investments."
Fund holdings are as of the date given, are subject to change at any time, and are not recommendations to buy or sell any security.
Annual Report 2015
5
COLUMBIA MID CAP VALUE FUND
MANAGER DISCUSSION OF FUND PERFORMANCE (continued)
Portfolio Breakdown (%)
(at February 28, 2015) | |
Common Stocks | | | 95.3 | | |
Consumer Discretionary | | | 12.8 | | |
Consumer Staples | | | 2.0 | | |
Energy | | | 5.7 | | |
Financials | | | 32.5 | | |
Health Care | | | 5.7 | | |
Industrials | | | 8.7 | | |
Information Technology | | | 9.8 | | |
Materials | | | 6.5 | | |
Telecommunication Services | | | 1.3 | | |
Utilities | | | 10.3 | | |
Money Market Funds | | | 4.7 | | |
Total | | | 100.0 | | |
Percentages indicated are based upon total investments. The Fund's portfolio composition is subject to change.
Investment Risks
Market risk may affect a single issuer, sector of the economy, industry or the market as a whole. Foreign investments subject the fund to risks, including political, economic, market, social and others within a particular country, as well as to currency instabilities and less stringent financial and accounting standards generally applicable to U.S. issuers. Investments in mid-cap companies involve risks and volatility greater than investments in larger, more established companies. Value securities may be unprofitable if the market fails to recognize their intrinsic worth or the portfolio manager misgauged that worth. The Fund may invest significantly in issuers within a particular sector, which may be negatively affected by market, economic or other conditions, making the Fund more vulnerable to unfavorable developments in the sector. See the Fund's prospectus for more information on these and other risks.
iPhone 6 rollout. Electronic Arts shares rose sharply during the holiday shopping season, as the company benefited from a price cut in Microsoft's Xbox One, which in turn generated interest in the purchase of additional consoles. Even more important, the price cut generated more demand for games sold by Electronic Arts.
Elsewhere in the portfolio, United Continental Holdings, in the industrials sector, benefited from falling oil prices while in materials, Sealed Air Corporation benefited from lower energy prices as resins became less expensive, offering the potential for higher profit margins, increased cash flow and debt reduction.
Energy and financials stocks detracted from performance. Within energy, Noble Energy disappointed, and on the equipment and service side, Weatherford International, Cameron International Corporation and Superior Energy Services shares incurred double-digit losses. We eliminated some energy-related holdings because of our growing caution on companies indirectly exposed to energy. These included industrials company Jacobs Engineering, an international engineering, architecture and construction firm; Manitowoc Company, and chemical company Methanex Corporation.
In the financials sector, stock selection as well as an overweight allocation to the banking industry hampered relative returns. The Fund had less exposure than the benchmark to REITs, which also detracted from results. In addition, an underweight in healthcare detracted from relative results during the period. The Fund did not hold several managed healthcare providers that posted exceptionally strong returns, and a position in Salix Pharmaceuticals was a significant loser. The company, which is dedicated to developing drugs to treat or prevent gastrointestinal issues, was found to have misrepresented key drug inventories. Its shares dropped 40% on news of inventory management issues, and we exited the name on concerns over the lack of management oversight. We also took profits in Jazz Pharmaceuticals earlier in the period, as the company grew beyond the Fund's investment parameters. These two sales, plus the acquisition of a third major pharmaceutical holding by another company not owned by the Fund, further decreased the Fund's exposure to healthcare over the period.
Looking Ahead
As we look ahead, we have found opportunities in retail and the broader consumer discretionary sector, where companies with good ideas have suffered temporary declines in their models. In financials, we've added new positions in "self-help" insurance companies, such as Voya Financial and Synchrony Financial. We believe that Voya Financials is executing well on its strategic plan in variable annuities, retirement services, investment management and life insurance segments. Synchrony Financial is the largest credit card issuer focused on the private label card business and may benefit from consumers having more money to spend.
Given recent market developments, we generally have a cautious approach towards companies where multiples have expanded
Annual Report 2015
6
COLUMBIA MID CAP VALUE FUND
MANAGER DISCUSSION OF FUND PERFORMANCE (continued)
disproportionately relative to their operating earnings. As such, we remain true to our longstanding belief that the best investment opportunities are found when attractive valuations are combined with improving operating leverage over the medium to long term.
Annual Report 2015
7
COLUMBIA MID CAP VALUE FUND
UNDERSTANDING YOUR FUND'S EXPENSES
(Unaudited)
As an investor, you incur two types of costs. There are transaction costs, which generally include sales charges on purchases and may include redemption fees. There are also ongoing costs, which generally include management fees, distribution and/or service fees, and other fund expenses. The following information is intended to help you understand your ongoing costs (in dollars) of investing in the Fund and to help you compare these costs with the ongoing costs of investing in other mutual funds.
Analyzing Your Fund's Expenses
To illustrate these ongoing costs, we have provided examples and calculated the expenses paid by investors in each share class of the Fund during the period. The actual and hypothetical information in the table is based on an initial investment of $1,000 at the beginning of the period indicated and held for the entire period. Expense information is calculated two ways and each method provides you with different information. The amount listed in the "Actual" column is calculated using the Fund's actual operating expenses and total return for the period. You may use the Actual information, together with the amount invested, to estimate the expenses that you paid over the period. Simply divide your account value by $1,000 (for example, an $8,600 account value divided by $1,000 = 8.6), then multiply the results by the expenses paid during the period under the "Actual" column. The amount listed in the "Hypothetical" column assumes a 5% annual rate of return before expenses (which is not the Fund's actual return) and then applies the Fund's actual expense ratio for the period to the hypothetical return. You should not use the hypothetical account values and expenses to estimate either your actual account balance at the end of the period or the expenses you paid during the period. See "Compare With Other Funds" below for details on how to use the hypothetical data.
Compare With Other Funds
Since all mutual funds are required to include the same hypothetical calculations about expenses in shareholder reports, you can use this information to compare the ongoing cost of investing in the Fund with other funds. To do so, compare the hypothetical example with the 5% hypothetical examples that appear in the shareholder reports of other funds. As you compare hypothetical examples of other funds, it is important to note that hypothetical examples are meant to highlight the ongoing costs of investing in a fund only and do not reflect any transaction costs, such as sales charges, or redemption or exchange fees. Therefore, the hypothetical calculations are useful in comparing ongoing costs only, and will not help you determine the relative total costs of owning different funds. If transaction costs were included in these calculations, your costs would be higher.
September 1, 2014 – February 28, 2015
| | | Account Value at the Beginning
of the Period ($) | | Account Value at the End of the
Period ($) | | Expenses Paid During the
Period ($) | | Fund's Annualized
Expense Ratio (%) | |
| | | Actual | | Hypothetical | | Actual | | Hypothetical | | Actual | | Hypothetical | | Actual | |
Class A | | | 1,000.00 | | | | 1,000.00 | | | | 1,003.70 | | | | 1,019.15 | | | | 5.79 | | | | 5.84 | | | | 1.16 | | |
Class B | | | 1,000.00 | | | | 1,000.00 | | | | 1,000.00 | | | | 1,015.41 | | | | 9.52 | | | | 9.60 | | | | 1.91 | | |
Class C | | | 1,000.00 | | | | 1,000.00 | | | | 1,000.60 | | | | 1,015.41 | | | | 9.53 | | | | 9.60 | | | | 1.91 | | |
Class I | | | 1,000.00 | | | | 1,000.00 | | | | 1,006.50 | | | | 1,021.39 | | | | 3.55 | | | | 3.58 | | | | 0.71 | | |
Class K | | | 1,000.00 | | | | 1,000.00 | | | | 1,004.50 | | | | 1,019.95 | | | | 5.00 | | | | 5.04 | | | | 1.00 | | |
Class R | | | 1,000.00 | | | | 1,000.00 | | | | 1,003.00 | | | | 1,017.85 | | | | 7.09 | | | | 7.14 | | | | 1.42 | | |
Class R4 | | | 1,000.00 | | | | 1,000.00 | | | | 1,005.40 | | | | 1,020.29 | | | | 4.65 | | | | 4.68 | | | | 0.93 | | |
Class R5 | | | 1,000.00 | | | | 1,000.00 | | | | 1,005.60 | | | | 1,021.04 | | | | 3.90 | | | | 3.93 | | | | 0.78 | | |
Class W | | | 1,000.00 | | | | 1,000.00 | | | | 1,003.70 | | | | 1,019.15 | | | | 5.79 | | | | 5.84 | | | | 1.16 | | |
Class Y | | | 1,000.00 | | | | 1,000.00 | | | | 1,006.50 | | | | 1,021.29 | | | | 3.65 | | | | 3.68 | | | | 0.73 | | |
Class Z | | | 1,000.00 | | | | 1,000.00 | | | | 1,005.00 | | | | 1,020.39 | | | | 4.55 | | | | 4.58 | | | | 0.91 | | |
Expenses paid during the period are equal to the annualized expense ratio for each class as indicated above, multiplied by the average account value over the period and then multiplied by the number of days in the Fund's most recent fiscal half year and divided by 365.
Expenses do not include fees and expenses incurred indirectly by the Fund from its investment in underlying funds, including affiliated and non-affiliated pooled investment vehicles, such as mutual funds and exchange-traded funds.
Annual Report 2015
8
COLUMBIA MID CAP VALUE FUND
PORTFOLIO OF INVESTMENTS
February 28, 2015
(Percentages represent value of investments compared to net assets)
Common Stocks 95.4%
Issuer | | Shares | | Value ($) | |
CONSUMER DISCRETIONARY 12.8% | |
Auto Components 1.3% | |
TRW Automotive Holdings Corp.(a) | | | 464,075 | | | | 48,375,178 | | |
Automobiles 1.1% | |
Harley-Davidson, Inc. | | | 645,736 | | | | 41,049,438 | | |
Diversified Consumer Services 0.7% | |
Houghton Mifflin Harcourt Co.(a) | | | 1,393,739 | | | | 27,568,157 | | |
Hotels, Restaurants & Leisure 2.3% | |
Royal Caribbean Cruises Ltd. | | | 455,300 | | | | 34,794,026 | | |
Starwood Hotels & Resorts
Worldwide, Inc. | | | 652,075 | | | | 52,381,185 | | |
Total | | | | | 87,175,211 | | |
Household Durables 1.8% | |
D.R. Horton, Inc. | | | 2,561,175 | | | | 69,945,689 | | |
Media 2.6% | |
Cinemark Holdings, Inc. | | | 665,450 | | | | 27,097,124 | | |
DISH Network Corp., Class A(a) | | | 605,548 | | | | 45,440,322 | | |
Interpublic Group of Companies,
Inc. (The) | | | 1,181,375 | | | | 26,344,662 | | |
Total | | | | | 98,882,108 | | |
Specialty Retail 3.0% | |
Best Buy Co., Inc. | | | 1,005,750 | | | | 38,319,075 | | |
Sally Beauty Holdings, Inc.(a) | | | 1,096,000 | | | | 36,737,920 | | |
Signet Jewelers Ltd. | | | 315,700 | | | | 37,846,116 | | |
Total | | | | | 112,903,111 | | |
Total Consumer Discretionary | | | | | 485,898,892 | | |
CONSUMER STAPLES 2.0% | |
Food Products 2.0% | |
Hershey Co. (The) | | | 298,425 | | | | 30,970,547 | | |
JM Smucker Co. (The) | | | 382,015 | | | | 44,065,430 | | |
Total | | | | | 75,035,977 | | |
Total Consumer Staples | | | | | 75,035,977 | | |
ENERGY 5.7% | |
Energy Equipment & Services 2.4% | |
Cameron International Corp.(a) | | | 536,675 | | | | 25,266,659 | | |
Oceaneering International, Inc. | | | 361,150 | | | | 19,693,510 | | |
Superior Energy Services, Inc. | | | 898,775 | | | | 20,114,584 | | |
Weatherford International PLC(a) | | | 2,072,700 | | | | 26,302,563 | | |
Total | | | | | 91,377,316 | | |
Common Stocks (continued)
Issuer | | Shares | | Value ($) | |
Oil, Gas & Consumable Fuels 3.3% | |
Cabot Oil & Gas Corp. | | | 954,050 | | | | 27,667,450 | | |
Cimarex Energy Co. | | | 358,590 | | | | 39,330,151 | | |
Noble Energy, Inc. | | | 853,225 | | | | 40,297,817 | | |
ONEOK, Inc. | | | 437,825 | | | | 19,378,134 | | |
Total | | | | | 126,673,552 | | |
Total Energy | | | | | 218,050,868 | | |
FINANCIALS 32.6% | |
Banks 7.2% | |
City National Corp. | | | 420,537 | | | | 38,003,929 | | |
Cullen/Frost Bankers, Inc. | | | 519,400 | | | | 35,215,320 | | |
East West Bancorp, Inc. | | | 1,245,150 | | | | 49,743,743 | | |
Fifth Third Bancorp | | | 3,900,701 | | | | 75,517,571 | | |
M&T Bank Corp. | | | 624,775 | | | | 75,597,775 | | |
Total | | | | | 274,078,338 | | |
Capital Markets 2.5% | |
Raymond James Financial, Inc. | | | 1,087,500 | | | | 62,128,875 | | |
TD Ameritrade Holding Corp. | | | 932,475 | | | | 33,820,868 | | |
Total | | | | | 95,949,743 | | |
Consumer Finance 1.1% | |
Synchrony Financial(a) | | | 1,274,375 | | | | 40,716,281 | | |
Diversified Financial Services 1.2% | |
Voya Financial, Inc. | | | 1,019,100 | | | | 45,034,029 | | |
Insurance 7.8% | |
Aon PLC | | | 494,500 | | | | 49,628,020 | | |
Brown & Brown, Inc. | | | 1,495,375 | | | | 48,061,353 | | |
Genworth Financial, Inc., Class A(a) | | | 2,100,700 | | | | 16,280,425 | | |
Hartford Financial Services Group,
Inc. (The) | | | 1,398,443 | | | | 57,280,225 | | |
Lincoln National Corp. | | | 1,182,125 | | | | 68,137,685 | | |
Principal Financial Group, Inc. | | | 1,143,202 | | | | 58,497,646 | | |
Total | | | | | 297,885,354 | | |
Real Estate Investment Trusts (REITs) 11.0% | |
Camden Property Trust | | | 360,925 | | | | 26,271,731 | | |
Colony Financial, Inc. | | | 802,175 | | | | 20,222,832 | | |
Extra Space Storage, Inc. | | | 459,554 | | | | 30,229,462 | | |
Host Hotels & Resorts, Inc. | | | 2,357,322 | | | | 49,503,762 | | |
Outfront Media, Inc. | | | 1,213,986 | | | | 36,358,881 | | |
Rayonier, Inc. | | | 1,394,209 | | | | 38,215,268 | | |
The accompanying Notes to Financial Statements are an integral part of this statement.
Annual Report 2015
9
COLUMBIA MID CAP VALUE FUND
PORTFOLIO OF INVESTMENTS (continued)
February 28, 2015
Common Stocks (continued)
Issuer | | Shares | | Value ($) | |
SL Green Realty Corp. | | | 582,175 | | | | 73,895,473 | | |
Taubman Centers, Inc. | | | 641,950 | | | | 46,438,663 | | |
UDR, Inc. | | | 1,873,825 | | | | 59,849,970 | | |
Weyerhaeuser Co. | | | 1,041,553 | | | | 36,568,926 | | |
Total | | | | | 417,554,968 | | |
Real Estate Management & Development 1.1% | |
CBRE Group, Inc., Class A(a) | | | 1,199,061 | | | | 41,079,830 | | |
Thrifts & Mortgage Finance 0.7% | |
Radian Group, Inc. | | | 1,747,275 | | | | 27,624,418 | | |
Total Financials | | | | | 1,239,922,961 | | |
HEALTH CARE 5.7% | |
Health Care Equipment & Supplies 2.8% | |
Teleflex, Inc. | | | 488,350 | | | | 59,427,311 | | |
Zimmer Holdings, Inc. | | | 402,725 | | | | 48,484,063 | | |
Total | | | | | 107,911,374 | | |
Health Care Providers & Services 2.3% | |
Community Health Systems, Inc.(a) | | | 531,600 | | | | 25,793,232 | | |
LifePoint Hospitals, Inc.(a) | | | 501,375 | | | | 36,078,945 | | |
WellCare Health Plans, Inc.(a) | | | 294,275 | | | | 26,723,113 | | |
Total | | | | | 88,595,290 | | |
Life Sciences Tools & Services 0.6% | |
PAREXEL International Corp.(a) | | | 341,800 | | | | 22,032,428 | | |
Total Health Care | | | | | 218,539,092 | | |
INDUSTRIALS 8.7% | |
Aerospace & Defense 1.1% | |
Textron, Inc. | | | 915,250 | | | | 40,554,727 | | |
Airlines 0.7% | |
United Continental Holdings, Inc.(a) | | | 425,000 | | | | 27,701,500 | | |
Building Products 0.7% | |
USG Corp.(a) | | | 968,250 | | | | 27,294,968 | | |
Industrial Conglomerates 1.3% | |
Carlisle Companies, Inc. | | | 523,425 | | | | 48,715,165 | | |
Machinery 1.7% | |
Crane Co. | | | 361,725 | | | | 24,174,082 | | |
Dover Corp. | | | 567,978 | | | | 40,922,815 | | |
Total | | | | | 65,096,897 | | |
Road & Rail 1.0% | |
Ryder System, Inc. | | | 426,525 | | | | 40,089,085 | | |
Common Stocks (continued)
Issuer | | Shares | | Value ($) | |
Trading Companies & Distributors 2.2% | |
AerCap Holdings NV(a) | | | 795,744 | | | | 35,410,608 | | |
United Rentals, Inc.(a) | | | 184,825 | | | | 17,199,814 | | |
WESCO International, Inc.(a) | | | 443,000 | | | | 30,757,490 | | |
Total | | | | | 83,367,912 | | |
Total Industrials | | | | | 332,820,254 | | |
INFORMATION TECHNOLOGY 9.8% | |
Communications Equipment 0.4% | |
F5 Networks, Inc.(a) | | | 120,675 | | | | 14,253,528 | | |
Electronic Equipment, Instruments & Components 1.6% | |
Arrow Electronics, Inc.(a) | | | 470,775 | | | | 29,169,219 | | |
FLIR Systems, Inc. | | | 974,025 | | | | 31,441,527 | | |
Total | | | | | 60,610,746 | | |
IT Services 1.2% | |
Xerox Corp. | | | 3,304,600 | | | | 45,107,790 | | |
Semiconductors & Semiconductor Equipment 2.7% | |
Applied Materials, Inc. | | | 479,975 | | | | 12,023,374 | | |
Broadcom Corp., Class A | | | 1,124,150 | | | | 50,845,304 | | |
Micron Technology, Inc.(a) | | | 418,575 | | | | 12,837,695 | | |
Skyworks Solutions, Inc. | | | 331,925 | | | | 29,126,419 | | |
Total | | | | | 104,832,792 | | |
Software 3.2% | |
Activision Blizzard, Inc. | | | 1,538,425 | | | | 35,876,071 | | |
Autodesk, Inc.(a) | | | 440,100 | | | | 28,272,024 | | |
Electronic Arts, Inc.(a) | | | 682,700 | | | | 39,036,786 | | |
PTC, Inc.(a) | | | 520,575 | | | | 18,040,526 | | |
Total | | | | | 121,225,407 | | |
Technology Hardware, Storage & Peripherals 0.7% | |
Western Digital Corp. | | | 258,500 | | | | 27,654,330 | | |
Total Information Technology | | | | | 373,684,593 | | |
MATERIALS 6.5% | |
Chemicals 2.2% | |
International Flavors & Fragrances, Inc. | | | 300,450 | | | | 36,633,868 | | |
PPG Industries, Inc. | | | 195,300 | | | | 45,969,714 | | |
Total | | | | | 82,603,582 | | |
Containers & Packaging 3.2% | |
Bemis Co., Inc. | | | 613,700 | | | | 29,948,560 | | |
Packaging Corp. of America | | | 550,800 | | | | 45,639,288 | | |
The accompanying Notes to Financial Statements are an integral part of this statement.
Annual Report 2015
10
COLUMBIA MID CAP VALUE FUND
PORTFOLIO OF INVESTMENTS (continued)
February 28, 2015
Common Stocks (continued)
Issuer | | Shares | | Value ($) | |
Sealed Air Corp. | | | 940,050 | | | | 44,304,557 | | |
Total | | | | | 119,892,405 | | |
Metals & Mining 1.1% | |
Steel Dynamics, Inc. | | | 2,381,900 | | | | 43,398,218 | | |
Total Materials | | | | | 245,894,205 | | |
TELECOMMUNICATION SERVICES 1.3% | |
Wireless Telecommunication Services 1.3% | |
SBA Communications Corp., Class A(a) | | | 299,625 | | | | 37,366,234 | | |
Telephone & Data Systems, Inc. | | | 456,075 | | | | 11,602,548 | | |
Total | | | | | 48,968,782 | | |
Total Telecommunication Services | | | | | 48,968,782 | | |
UTILITIES 10.3% | |
Electric Utilities 6.4% | |
Edison International | | | 1,079,300 | | | | 69,345,025 | | |
Great Plains Energy, Inc. | | | 2,417,975 | | | | 64,342,315 | | |
Portland General Electric Co. | | | 1,450,025 | | | | 54,071,432 | | |
PPL Corp. | | | 1,587,925 | | | | 54,148,242 | | |
Total | | | | | 241,907,014 | | |
Gas Utilities 0.9% | |
Questar Corp. | | | 1,513,475 | | | | 35,385,046 | | |
Common Stocks (continued)
Issuer | | Shares | | Value ($) | |
Independent Power and Renewable Electricity Producers 2.0% | |
AES Corp. (The) | | | 2,925,150 | | | | 37,939,195 | | |
NRG Energy, Inc. | | | 1,646,500 | | | | 39,483,070 | | |
Total | | | | | 77,422,265 | | |
Multi-Utilities 1.0% | |
CMS Energy Corp. | | | 1,057,050 | | | | 37,134,167 | | |
Total Utilities | | | | | 391,848,492 | | |
Total Common Stocks
(Cost: $2,514,801,419) | | | | | 3,630,664,116 | | |
Money Market Funds 4.7%
| | | Shares | | Value ($) | |
Columbia Short-Term Cash Fund,
0.118%(b)(c) | | | 179,304,267 | | | | 179,304,267 | | |
Total Money Market Funds
(Cost: $179,304,267) | | | | | 179,304,267 | | |
Total Investments
(Cost: $2,694,105,686) | | | | | 3,809,968,383 | | |
Other Assets & Liabilities, Net | | | | | (3,668,905 | ) | |
Net Assets | | | | | 3,806,299,478 | | |
Notes to Portfolio of Investments
(a) Non-income producing.
(b) The rate shown is the seven-day current annualized yield at February 28, 2015.
(c) As defined in the Investment Company Act of 1940, an affiliated company is one in which the Fund owns 5% or more of the company's outstanding voting securities, or a company which is under common ownership or control with the Fund. Holdings and transactions in these affiliated companies during the year ended February 28, 2015, are as follows:
Issuer | | Beginning
Cost ($) | | Purchase
Cost ($) | | Proceeds
From Sales ($) | | Ending
Cost ($) | | Dividends —
Affiliated
Issuers ($) | | Value ($) | |
Columbia Short-Term Cash Fund | | | 139,344,865 | | | | 823,446,775 | | | | (783,487,373 | ) | | | 179,304,267 | | | | 121,093 | | | | 179,304,267 | | |
The accompanying Notes to Financial Statements are an integral part of this statement.
Annual Report 2015
11
COLUMBIA MID CAP VALUE FUND
PORTFOLIO OF INVESTMENTS (continued)
February 28, 2015
Fair Value Measurements
Generally accepted accounting principles (GAAP) require disclosure regarding the inputs and valuation techniques used to measure fair value and any changes in valuation inputs or techniques. In addition, investments shall be disclosed by major category.
The Fund categorizes its fair value measurements according to a three-level hierarchy that maximizes the use of observable inputs and minimizes the use of unobservable inputs by prioritizing that the most observable input be used when available. Observable inputs are those that market participants would use in pricing an investment based on market data obtained from sources independent of the reporting entity. Unobservable inputs are those that reflect the Fund's assumptions about the information market participants would use in pricing an investment. An investment's level within the fair value hierarchy is based on the lowest level of any input that is deemed significant to the asset or liability's fair value measurement. The input levels are not necessarily an indication of the risk or liquidity associated with investments at that level. For example, certain U.S. government securities are generally high quality and liquid, however, they are reflected as Level 2 because the inputs used to determine fair value may not always be quoted prices in an active market.
Fair value inputs are summarized in the three broad levels listed below:
> Level 1 — Valuations based on quoted prices for investments in active markets that the Fund has the ability to access at the measurement date (including NAV for open-end mutual funds). Valuation adjustments are not applied to Level 1 investments.
> Level 2 — Valuations based on other significant observable inputs (including quoted prices for similar securities, interest rates, prepayment speeds, credit risks, etc.).
> Level 3 — Valuations based on significant unobservable inputs (including the Fund's own assumptions and judgment in determining the fair value of investments).
Inputs that are used in determining fair value of an investment may include price information, credit data, volatility statistics, and other factors. These inputs can be either observable or unobservable. The availability of observable inputs can vary between investments, and is affected by various factors such as the type of investment, and the volume and level of activity for that investment or similar investments in the marketplace. The inputs will be considered by the Investment Manager, along with any other relevant factors in the calculation of an investment's fair value. The Fund uses prices and inputs that are current as of the measurement date, which may include periods of market dislocations. During these periods, the availability of prices and inputs may be reduced for many investments. This condition could cause an investment to be reclassified between the various levels within the hierarchy.
Investments falling into the Level 3 category are primarily supported by quoted prices from brokers and dealers participating in the market for those investments. However, these may be classified as Level 3 investments due to lack of market transparency and corroboration to support these quoted prices. Additionally, valuation models may be used as the pricing source for any remaining investments classified as Level 3. These models may rely on one or more significant unobservable inputs and/or significant assumptions by the Investment Manager. Inputs used in valuations may include, but are not limited to, financial statement analysis, capital account balances, discount rates and estimated cash flows, and comparable company data.
Under the direction of the Fund's Board of Trustees (the Board), the Investment Manager's Valuation Committee (the Committee) is responsible for overseeing the valuation procedures approved by the Board. The Committee consists of voting and non-voting members from various groups within the Investment Manager's organization, including operations and accounting, trading and investments, compliance, risk management and legal.
The Committee meets at least monthly to review and approve valuation matters, which may include a description of specific valuation determinations, data regarding pricing information received from approved pricing vendors and brokers and the results of Board-approved valuation control policies and procedures (the Policies). The Policies address, among other things, instances when market quotations are or are not readily available, including recommendations of third party pricing vendors and a determination of appropriate pricing methodologies; events that require specific valuation determinations and assessment of fair value techniques; securities with a potential for stale pricing, including those that are illiquid, restricted, or in default; and the effectiveness of third party pricing vendors, including periodic reviews of vendors. The Committee meets more frequently, as needed, to discuss additional valuation matters, which may include the need to review back-testing results, review time-sensitive information or approve related valuation actions. The Committee reports to the Board, with members of the Committee meeting with the Board at each of its regularly scheduled meetings to discuss valuation matters and actions during the period, similar to those described earlier.
For investments categorized as Level 3, the Committee monitors information similar to that described above, which may include: (i) data specific to the issuer or comparable issuers, (ii) general market or specific sector news and (iii) quoted prices and specific or similar security transactions. The Committee considers this data and any changes from prior periods in order to assess the reasonableness of observable and unobservable inputs, any assumptions or internal models used to value those securities and changes in fair value. This data is also used to corroborate, when available, information received from approved pricing vendors and brokers. Various factors impact the frequency of monitoring this information (which may occur as often as daily). However, the Committee may determine that changes to inputs, assumptions and models are not required as a result of the monitoring procedures performed.
The accompanying Notes to Financial Statements are an integral part of this statement.
Annual Report 2015
12
COLUMBIA MID CAP VALUE FUND
PORTFOLIO OF INVESTMENTS (continued)
February 28, 2015
Fair Value Measurements (continued)
The following table is a summary of the inputs used to value the Fund's investments at February 28, 2015:
Description | | Level 1
Quoted Prices in Active
Markets for Identical
Assets ($) | |
Level 2
Other Significant
Observable Inputs ($) | |
Level 3
Significant
Unobservable Inputs ($) | |
Total ($) | |
Equity Securities | |
Common Stocks | |
Consumer Discretionary | | | 485,898,892 | | | | — | | | | — | | | | 485,898,892 | | |
Consumer Staples | | | 75,035,977 | | | | — | | | | — | | | | 75,035,977 | | |
Energy | | | 218,050,868 | | | | — | | | | — | | | | 218,050,868 | | |
Financials | | | 1,239,922,961 | | | | — | | | | — | | | | 1,239,922,961 | | |
Health Care | | | 218,539,092 | | | | — | | | | — | | | | 218,539,092 | | |
Industrials | | | 332,820,254 | | | | — | | | | — | | | | 332,820,254 | | |
Information Technology | | | 373,684,593 | | | | — | | | | — | | | | 373,684,593 | | |
Materials | | | 245,894,205 | | | | — | | | | — | | | | 245,894,205 | | |
Telecommunication Services | | | 48,968,782 | | | | — | | | | — | | | | 48,968,782 | | |
Utilities | | | 391,848,492 | | | | — | | | | — | | | | 391,848,492 | | |
Total Equity Securities | | | 3,630,664,116 | | | | — | | | | — | | | | 3,630,664,116 | | |
Mutual Funds | |
Money Market Funds | | | 179,304,267 | | | | — | | | | — | | | | 179,304,267 | | |
Total Mutual Funds | | | 179,304,267 | | | | — | | | | — | | | | 179,304,267 | | |
Total | | | 3,809,968,383 | | | | — | | | | — | | | | 3,809,968,383 | | |
See the Portfolio of Investments for all investment classifications not indicated in the table.
There were no transfers of financial assets between levels during the period.
The accompanying Notes to Financial Statements are an integral part of this statement.
Annual Report 2015
13
COLUMBIA MID CAP VALUE FUND
STATEMENT OF ASSETS AND LIABILITIES
February 28, 2015
Assets | |
Investments, at value | |
Unaffiliated issuers (identified cost $2,514,801,419) | | $ | 3,630,664,116 | | |
Affiliated issuers (identified cost $179,304,267) | | | 179,304,267 | | |
Total investments (identified cost $2,694,105,686) | | | 3,809,968,383 | | |
Receivable for: | |
Capital shares sold | | | 3,034,024 | | |
Dividends | | | 4,461,063 | | |
Prepaid expenses | | | 6,789 | | |
Total assets | | | 3,817,470,259 | | |
Liabilities | |
Payable for: | |
Investments purchased | | | 5,534,359 | | |
Capital shares purchased | | | 4,346,687 | | |
Investment management fees | | | 68,706 | | |
Distribution and/or service fees | | | 12,770 | | |
Transfer agent fees | | | 852,150 | | |
Administration fees | | | 5,208 | | |
Plan administration fees | | | 1 | | |
Compensation of board members | | | 172,646 | | |
Other expenses | | | 178,254 | | |
Total liabilities | | | 11,170,781 | | |
Net assets applicable to outstanding capital stock | | $ | 3,806,299,478 | | |
Represented by | |
Paid-in capital | | $ | 2,579,153,033 | | |
Excess of distributions over net investment income | | | (169,198 | ) | |
Accumulated net realized gain | | | 111,452,946 | | |
Unrealized appreciation (depreciation) on: | |
Investments | | | 1,115,862,697 | | |
Total — representing net assets applicable to outstanding capital stock | | $ | 3,806,299,478 | | |
The accompanying Notes to Financial Statements are an integral part of this statement.
Annual Report 2015
14
COLUMBIA MID CAP VALUE FUND
STATEMENT OF ASSETS AND LIABILITIES (continued)
February 28, 2015
Class A | |
Net assets | | $ | 1,112,700,600 | | |
Shares outstanding | | | 64,755,268 | | |
Net asset value per share | | $ | 17.18 | | |
Maximum offering price per share(a) | | $ | 18.23 | | |
Class B | |
Net assets | | $ | 9,249,991 | | |
Shares outstanding | | | 564,553 | | |
Net asset value per share | | $ | 16.38 | | |
Class C | |
Net assets | | $ | 138,393,428 | | |
Shares outstanding | | | 8,404,412 | | |
Net asset value per share | | $ | 16.47 | | |
Class I | |
Net assets | | $ | 2,979 | | |
Shares outstanding | | | 173 | | |
Net asset value per share(b) | | $ | 17.19 | | |
Class K | |
Net assets | | $ | 6,173 | | |
Shares outstanding | | | 358 | | |
Net asset value per share | | $ | 17.24 | | |
Class R | |
Net assets | | $ | 77,555,511 | | |
Shares outstanding | | | 4,525,682 | | |
Net asset value per share | | $ | 17.14 | | |
Class R4 | |
Net assets | | $ | 33,558,938 | | |
Shares outstanding | | | 1,915,662 | | |
Net asset value per share | | $ | 17.52 | | |
Class R5 | |
Net assets | | $ | 72,152,492 | | |
Shares outstanding | | | 4,117,283 | | |
Net asset value per share | | $ | 17.52 | | |
Class W | |
Net assets | | $ | 491,756 | | |
Shares outstanding | | | 28,621 | | |
Net asset value per share | | $ | 17.18 | | |
Class Y | |
Net assets | | $ | 27,859,828 | | |
Shares outstanding | | | 1,621,031 | | |
Net asset value per share | | $ | 17.19 | | |
The accompanying Notes to Financial Statements are an integral part of this statement.
Annual Report 2015
15
COLUMBIA MID CAP VALUE FUND
STATEMENT OF ASSETS AND LIABILITIES (continued)
February 28, 2015
Class Z | |
Net assets | | $ | 2,334,327,782 | | |
Shares outstanding | | | 135,603,399 | | |
Net asset value per share | | $ | 17.21 | | |
(a) The maximum offering price per share is calculated by dividing the net asset value per share by 1.0 minus the maximum sales charge of 5.75%.
(b) Net asset value per share rounds to this amount due to fractional shares outstanding.
The accompanying Notes to Financial Statements are an integral part of this statement.
Annual Report 2015
16
COLUMBIA MID CAP VALUE FUND
STATEMENT OF OPERATIONS
Year Ended February 28, 2015
Net investment income | |
Income: | |
Dividends — unaffiliated issuers | | $ | 59,412,610 | | |
Dividends — affiliated issuers | | | 121,093 | | |
Foreign taxes withheld | | | (54,213 | ) | |
Total income | | | 59,479,490 | | |
Expenses: | |
Investment management fees | | | 25,209,623 | | |
Distribution and/or service fees | |
Class A | | | 2,762,503 | | |
Class B | | | 119,812 | | |
Class C | | | 1,359,121 | | |
Class R | | | 341,024 | | |
Class W | | | 1,350 | | |
Transfer agent fees | |
Class A | | | 2,064,447 | | |
Class B | | | 22,340 | | |
Class C | | | 253,960 | | |
Class K | | | 4 | | |
Class R | | | 127,626 | | |
Class R4 | | | 31,243 | | |
Class R5 | | | 20,706 | | |
Class W | | | 1,008 | | |
Class Z | | | 4,455,846 | | |
Administration fees | | | 1,908,716 | | |
Plan administration fees | |
Class K | | | 18 | | |
Compensation of board members | | | 71,393 | | |
Custodian fees | | | 27,197 | | |
Printing and postage fees | | | 350,790 | | |
Registration fees | | | 195,215 | | |
Professional fees | | | 63,309 | | |
Other | | | 54,475 | | |
Total expenses | | | 39,441,726 | | |
Expense reductions | | | (6,750 | ) | |
Total net expenses | | | 39,434,976 | | |
Net investment income | | | 20,044,514 | | |
Realized and unrealized gain (loss) — net | |
Net realized gain (loss) on: | |
Investments | | | 412,964,434 | | |
Options purchased | | | (969,528 | ) | |
Options contracts written | | | 913,914 | | |
Net realized gain | | | 412,908,820 | | |
Net change in unrealized appreciation (depreciation) on: | |
Investments | | | (110,322,816 | ) | |
Net change in unrealized depreciation | | | (110,322,816 | ) | |
Net realized and unrealized gain | | | 302,586,004 | | |
Net increase in net assets resulting from operations | | $ | 322,630,518 | | |
The accompanying Notes to Financial Statements are an integral part of this statement.
Annual Report 2015
17
COLUMBIA MID CAP VALUE FUND
STATEMENT OF CHANGES IN NET ASSETS
| | | Year Ended
February 28,
2015 | | Year Ended
February 28,
2014 | |
Operations | |
Net investment income | | $ | 20,044,514 | | | $ | 15,549,311 | | |
Net realized gain | | | 412,908,820 | | | | 682,569,989 | | |
Net change in unrealized appreciation (depreciation) | | | (110,322,816 | ) | | | 316,029,652 | | |
Net increase in net assets resulting from operations | | | 322,630,518 | | | | 1,014,148,952 | | |
Distributions to shareholders | |
Net investment income | |
Class A | | | (4,766,548 | ) | | | (4,065,780 | ) | |
Class B | | | (12,726 | ) | | | — | | |
Class C | | | (163,650 | ) | | | (21 | ) | |
Class I | | | (358,705 | ) | | | (1,162,726 | ) | |
Class K | | | (44 | ) | | | (82 | ) | |
Class R | | | (170,576 | ) | | | (98,634 | ) | |
Class R4 | | | (111,541 | ) | | | (176,861 | ) | |
Class R5 | | | (335,311 | ) | | | (39,699 | ) | |
Class W | | | (2,270 | ) | | | (262,882 | ) | |
Class Y | | | (143,886 | ) | | | (59,760 | ) | |
Class Z | | | (16,189,669 | ) | | | (14,749,869 | ) | |
Net realized gains | |
Class A | | | (172,737,080 | ) | | | (110,660,927 | ) | |
Class B | | | (1,889,298 | ) | | | (1,645,296 | ) | |
Class C | | | (21,894,748 | ) | | | (13,376,576 | ) | |
Class I | | | (6,596,744 | ) | | | (8,972,565 | ) | |
Class K | | | (974 | ) | | | (1,686 | ) | |
Class R | | | (10,764,812 | ) | | | (6,445,418 | ) | |
Class R4 | | | (2,419,482 | ) | | | (1,168,173 | ) | |
Class R5 | | | (6,259,682 | ) | | | (1,491,804 | ) | |
Class W | | | (81,199 | ) | | | (2,213,063 | ) | |
Class Y | | | (2,476,273 | ) | | | (908,198 | ) | |
Class Z | | | (370,349,851 | ) | | | (240,782,029 | ) | |
Total distributions to shareholders | | | (617,725,069 | ) | | | (408,282,049 | ) | |
Increase (decrease) in net assets from capital stock activity | | | 230,753,029 | | | | (461,124,890 | ) | |
Total increase (decrease) in net assets | | | (64,341,522 | ) | | | 144,742,013 | | |
Net assets at beginning of year | | | 3,870,641,000 | | | | 3,725,898,987 | | |
Net assets at end of year | | $ | 3,806,299,478 | | | $ | 3,870,641,000 | | |
Excess of distributions over net investment income | | $ | (169,198 | ) | | $ | (142,532 | ) | |
The accompanying Notes to Financial Statements are an integral part of this statement.
Annual Report 2015
18
COLUMBIA MID CAP VALUE FUND
STATEMENT OF CHANGES IN NET ASSETS (continued)
| | | Year Ended February 28, 2015 | | Year Ended February 28, 2014 | |
| | | Shares | | Dollars ($) | | Shares | | Dollars ($) | |
Capital stock activity | |
Class A shares | |
Subscriptions(a) | | | 13,415,112 | | | | 241,409,995 | | | | 9,169,646 | | | | 160,138,369 | | |
Distributions reinvested | | | 9,391,185 | | | | 164,243,740 | | | | 6,160,842 | | | | 106,256,843 | | |
Redemptions | | | (17,000,791 | ) | | | (305,632,557 | ) | | | (18,258,395 | ) | | | (320,107,786 | ) | |
Net increase (decrease) | | | 5,805,506 | | | | 100,021,178 | | | | (2,927,907 | ) | | | (53,712,574 | ) | |
Class B shares | |
Subscriptions | | | 28,457 | | | | 498,264 | | | | 43,753 | | | | 736,390 | | |
Distributions reinvested | | | 103,025 | | | | 1,732,090 | | | | 88,045 | | | | 1,467,788 | | |
Redemptions(a) | | | (403,330 | ) | | | (6,952,178 | ) | | | (372,363 | ) | | | (6,310,149 | ) | |
Net decrease | | | (271,848 | ) | | | (4,721,824 | ) | | | (240,565 | ) | | | (4,105,971 | ) | |
Class C shares | |
Subscriptions | | | 1,199,715 | | | | 20,665,929 | | | | 669,422 | | | | 11,370,828 | | |
Distributions reinvested | | | 1,027,022 | | | | 17,262,321 | | | | 629,478 | | | | 10,538,700 | | |
Redemptions | | | (1,205,653 | ) | | | (20,857,272 | ) | | | (1,294,360 | ) | | | (22,036,287 | ) | |
Net increase (decrease) | | | 1,021,084 | | | | 17,070,978 | | | | 4,540 | | | | (126,759 | ) | |
Class I shares | |
Subscriptions | | | 2,050 | | | | 36,815 | | | | 29,438 | | | | 513,418 | | |
Distributions reinvested | | | 380,150 | | | | 6,954,904 | | | | 589,320 | | | | 10,133,695 | | |
Redemptions | | | (5,083,873 | ) | | | (93,280,205 | ) | | | (5,922,674 | ) | | | (109,296,578 | ) | |
Net decrease | | | (4,701,673 | ) | | | (86,288,486 | ) | | | (5,303,916 | ) | | | (98,649,465 | ) | |
Class K shares | |
Distributions reinvested | | | 28 | | | | 490 | | | | 17 | | | | 289 | | |
Redemptions | | | (548 | ) | | | (10,400 | ) | | | — | | | | — | | |
Net increase (decrease) | | | (520 | ) | | | (9,910 | ) | | | 17 | | | | 289 | | |
Class R shares | |
Subscriptions | | | 2,100,075 | | | | 37,594,686 | | | | 1,191,523 | | | | 20,737,688 | | |
Distributions reinvested | | | 563,949 | | | | 9,798,979 | | | | 366,748 | | | | 6,319,443 | | |
Redemptions | | | (1,474,651 | ) | | | (26,513,817 | ) | | | (1,904,641 | ) | | | (33,275,221 | ) | |
Net increase (decrease) | | | 1,189,373 | | | | 20,879,848 | | | | (346,370 | ) | | | (6,218,090 | ) | |
Class R4 shares | |
Subscriptions | | | 1,479,348 | | | | 26,228,312 | | | | 5,532,458 | | | | 97,518,368 | | |
Distributions reinvested | | | 143,482 | | | | 2,531,020 | | | | 77,048 | | | | 1,344,672 | | |
Redemptions | | | (265,407 | ) | | | (4,804,666 | ) | | | (5,051,443 | ) | | | (96,987,634 | ) | |
Net increase | | | 1,357,423 | | | | 23,954,666 | | | | 558,063 | | | | 1,875,406 | | |
Class R5 shares | |
Subscriptions | | | 2,742,088 | | | | 49,385,390 | | | | 1,504,220 | | | | 27,603,379 | | |
Distributions reinvested | | | 372,305 | | | | 6,561,008 | | | | 87,217 | | | | 1,531,135 | | |
Redemptions | | | (487,196 | ) | | | (8,921,619 | ) | | | (101,527 | ) | | | (1,867,200 | ) | |
Net increase | | | 2,627,197 | | | | 47,024,779 | | | | 1,489,910 | | | | 27,267,314 | | |
The accompanying Notes to Financial Statements are an integral part of this statement.
Annual Report 2015
19
COLUMBIA MID CAP VALUE FUND
STATEMENT OF CHANGES IN NET ASSETS (continued)
| | | Year Ended February 28, 2015 | | Year Ended February 28, 2014 | |
| | | Shares | | Dollars ($) | | Shares | | Dollars ($) | |
Capital stock activity (continued) | |
Class W shares | |
Subscriptions | | | — | | | | — | | | | 1,891,459 | | | | 33,155,124 | | |
Distributions reinvested | | | 4,736 | | | | 83,001 | | | | 144,261 | | | | 2,474,953 | | |
Redemptions | | | (10,721 | ) | | | (195,568 | ) | | | (6,966,374 | ) | | | (128,096,278 | ) | |
Net decrease | | | (5,985 | ) | | | (112,567 | ) | | | (4,930,654 | ) | | | (92,466,201 | ) | |
Class Y shares | |
Subscriptions | | | 1,173,529 | | | | 20,826,179 | | | | 332,077 | | | | 5,769,301 | | |
Distributions reinvested | | | 151,708 | | | | 2,619,536 | | | | 56,000 | | | | 965,514 | | |
Redemptions | | | (249,909 | ) | | | (4,477,660 | ) | | | (152,803 | ) | | | (2,663,342 | ) | |
Net increase | | | 1,075,328 | | | | 18,968,055 | | | | 235,274 | | | | 4,071,473 | | |
Class Z shares | |
Subscriptions | | | 17,182,452 | | | | 310,691,377 | | | | 13,105,450 | | | | 228,177,668 | | |
Distributions reinvested | | | 18,119,784 | | | | 317,379,875 | | | | 11,926,461 | | | | 205,872,527 | | |
Redemptions | | | (29,519,885 | ) | | | (534,104,940 | ) | | | (38,453,702 | ) | | | (673,110,507 | ) | |
Net increase (decrease) | | | 5,782,351 | | | | 93,966,312 | | | | (13,421,791 | ) | | | (239,060,312 | ) | |
Total net increase (decrease) | | | 13,878,236 | | | | 230,753,029 | | | | (24,883,399 | ) | | | (461,124,890 | ) | |
(a) Includes conversions of Class B shares to Class A shares, if any.
The accompanying Notes to Financial Statements are an integral part of this statement.
Annual Report 2015
20
COLUMBIA MID CAP VALUE FUND
The following tables are intended to help you understand the Fund's financial performance. Certain information reflects financial results for a single share of a class held for the periods shown. Per share net investment income (loss) amounts are calculated based on average shares outstanding during the period. Total return assumes reinvestment of all dividends and distributions, if any. Total return does not reflect payment of sales charges, if any. Total return and portfolio turnover are not annualized for periods of less than one year. The portfolio turnover rate is calculated without regard to purchase and sales transactions of short-term instruments and certain derivatives, if any. If such transactions were included, the Fund's portfolio turnover rate may be higher.
| | | Year Ended February 28, | | Year Ended
February 29, | | Year Ended
February 28, | |
Class A | | 2015 | | 2014 | | 2013 | | 2012 | | 2011 | |
Per share data | |
Net asset value, beginning of period | | $ | 18.64 | | | $ | 16.02 | | | $ | 13.91 | | | $ | 14.24 | | | $ | 11.18 | | |
Income from investment operations: | |
Net investment income | | | 0.07 | | | | 0.05 | | | | 0.11 | | | | 0.07 | | | | 0.13 | (a) | |
Net realized and unrealized gain (loss) | | | 1.44 | | | | 4.60 | | | | 2.10 | | | | (0.33 | ) | | | 3.07 | | |
Total from investment operations | | | 1.51 | | | | 4.65 | | | | 2.21 | | | | (0.26 | ) | | | 3.20 | | |
Less distributions to shareholders: | |
Net investment income | | | (0.07 | ) | | | (0.07 | ) | | | (0.10 | ) | | | (0.07 | ) | | | (0.14 | ) | |
Net realized gains | | | (2.90 | ) | | | (1.96 | ) | | | — | | | | — | | | | — | | |
Total distributions to shareholders | | | (2.97 | ) | | | (2.03 | ) | | | (0.10 | ) | | | (0.07 | ) | | | (0.14 | ) | |
Proceeds from regulatory settlements | | | — | | | | — | | | | — | | | | 0.00 | (b) | | | 0.00 | (b) | |
Net asset value, end of period | | $ | 17.18 | | | $ | 18.64 | | | $ | 16.02 | | | $ | 13.91 | | | $ | 14.24 | | |
Total return | | | 8.50 | % | | | 30.10 | % | | | 16.03 | % | | | (1.75 | %) | | | 28.87 | % | |
Ratios to average net assets(c) | |
Total gross expenses | | | 1.16 | % | | | 1.17 | % | | | 1.19 | % | | | 1.18 | % | | | 1.13 | % | |
Total net expenses(d) | | | 1.16 | %(e) | | | 1.17 | %(e) | | | 1.19 | %(e) | | | 1.18 | %(e) | | | 1.13 | %(e) | |
Net investment income | | | 0.39 | % | | | 0.27 | % | | | 0.75 | % | | | 0.59 | % | | | 1.05 | % | |
Supplemental data | |
Net assets, end of period (in thousands) | | $ | 1,112,701 | | | $ | 1,098,949 | | | $ | 991,510 | | | $ | 1,135,303 | | | $ | 1,511,519 | | |
Portfolio turnover | | | 25 | % | | | 48 | % | | | 36 | % | | | 39 | % | | | 50 | % | |
Notes to Financial Highlights
(a) Net investment income per share reflects special dividends. The effect of these dividends amounted to $0.08 per share.
(b) Rounds to zero.
(c) In addition to the fees and expenses that the Fund bears directly, the Fund indirectly bears a pro rata share of the fees and expenses of any other funds in which it invests. Such indirect expenses are not included in the Fund's reported expense ratios.
(d) Total net expenses include the impact of certain fee waivers/expense reimbursements made by the Investment Manager and certain of its affiliates, if applicable.
(e) The benefits derived from expense reductions had an impact of less than 0.01%.
The accompanying Notes to Financial Statements are an integral part of this statement.
Annual Report 2015
21
COLUMBIA MID CAP VALUE FUND
FINANCIAL HIGHLIGHTS (continued)
| | | Year Ended February 28, | | Year Ended
February 29, | | Year Ended
February 28, | |
Class B | | 2015 | | 2014 | | 2013 | | 2012 | | 2011 | |
Per share data | |
Net asset value, beginning of period | | $ | 17.98 | | | $ | 15.56 | | | $ | 13.52 | | | $ | 13.89 | | | $ | 10.94 | | |
Income from investment operations: | |
Net investment income (loss) | | | (0.07 | ) | | | (0.08 | ) | | | 0.00 | (a) | | | (0.02 | ) | | | 0.03 | (b) | |
Net realized and unrealized gain (loss) | | | 1.39 | | | | 4.46 | | | | 2.06 | | | | (0.34 | ) | | | 3.01 | | |
Total from investment operations | | | 1.32 | | | | 4.38 | | | | 2.06 | | | | (0.36 | ) | | | 3.04 | | |
Less distributions to shareholders: | |
Net investment income | | | (0.02 | ) | | | — | | | | (0.02 | ) | | | (0.01 | ) | | | (0.09 | ) | |
Net realized gains | | | (2.90 | ) | | | (1.96 | ) | | | — | | | | — | | | | — | | |
Total distributions to shareholders | | | (2.92 | ) | | | (1.96 | ) | | | (0.02 | ) | | | (0.01 | ) | | | (0.09 | ) | |
Proceeds from regulatory settlements | | | — | | | | — | | | | — | | | | 0.00 | (a) | | | 0.00 | (a) | |
Net asset value, end of period | | $ | 16.38 | | | $ | 17.98 | | | $ | 15.56 | | | $ | 13.52 | | | $ | 13.89 | | |
Total return | | | 7.64 | % | | | 29.16 | % | | | 15.22 | % | | | (2.55 | %) | | | 27.89 | % | |
Ratios to average net assets(c) | |
Total gross expenses | | | 1.91 | % | | | 1.92 | % | | | 1.94 | % | | | 1.93 | % | | | 1.88 | % | |
Total net expenses(d) | | | 1.91 | %(e) | | | 1.92 | %(e) | | | 1.94 | %(e) | | | 1.93 | %(e) | | | 1.88 | %(e) | |
Net investment income (loss) | | | (0.40 | %) | | | (0.48 | %) | | | 0.01 | % | | | (0.19 | %) | | | 0.28 | % | |
Supplemental data | |
Net assets, end of period (in thousands) | | $ | 9,250 | | | $ | 15,034 | | | $ | 16,759 | | | $ | 22,740 | | | $ | 44,651 | | |
Portfolio turnover | | | 25 | % | | | 48 | % | | | 36 | % | | | 39 | % | | | 50 | % | |
Notes to Financial Highlights
(a) Rounds to zero.
(b) Net investment income per share reflects special dividends. The effect of these dividends amounted to $0.08 per share.
(c) In addition to the fees and expenses that the Fund bears directly, the Fund indirectly bears a pro rata share of the fees and expenses of any other funds in which it invests. Such indirect expenses are not included in the Fund's reported expense ratios.
(d) Total net expenses include the impact of certain fee waivers/expense reimbursements made by the Investment Manager and certain of its affiliates, if applicable.
(e) The benefits derived from expense reductions had an impact of less than 0.01%.
The accompanying Notes to Financial Statements are an integral part of this statement.
Annual Report 2015
22
COLUMBIA MID CAP VALUE FUND
FINANCIAL HIGHLIGHTS (continued)
| | | Year Ended February 28, | | Year Ended
February 29, | | Year Ended
February 28, | |
Class C | | 2015 | | 2014 | | 2013 | | 2012 | | 2011 | |
Per share data | |
Net asset value, beginning of period | | $ | 18.05 | | | $ | 15.62 | | | $ | 13.57 | | | $ | 13.94 | | | $ | 10.98 | | |
Income from investment operations: | |
Net investment income (loss) | | | (0.06 | ) | | | (0.08 | ) | | | 0.00 | (a) | | | (0.02 | ) | | | 0.04 | (b) | |
Net realized and unrealized gain (loss) | | | 1.40 | | | | 4.47 | | | | 2.07 | | | | (0.34 | ) | | | 3.01 | | |
Total from investment operations | | | 1.34 | | | | 4.39 | | | | 2.07 | | | | (0.36 | ) | | | 3.05 | | |
Less distributions to shareholders: | |
Net investment income | | | (0.02 | ) | | | — | | | | (0.02 | ) | | | (0.01 | ) | | | (0.09 | ) | |
Net realized gains | | | (2.90 | ) | | | (1.96 | ) | | | — | | | | — | | | | — | | |
Total distributions to shareholders | | | (2.92 | ) | | | (1.96 | ) | | | (0.02 | ) | | | (0.01 | ) | | | (0.09 | ) | |
Proceeds from regulatory settlements | | | — | | | | — | | | | — | | | | 0.00 | (a) | | | 0.00 | (a) | |
Net asset value, end of period | | $ | 16.47 | | | $ | 18.05 | | | $ | 15.62 | | | $ | 13.57 | | | $ | 13.94 | | |
Total return | | | 7.73 | % | | | 29.11 | % | | | 15.24 | % | | | (2.54 | %) | | | 27.88 | % | |
Ratios to average net assets(c) | |
Total gross expenses | | | 1.91 | % | | | 1.92 | % | | | 1.94 | % | | | 1.93 | % | | | 1.88 | % | |
Total net expenses(d) | | | 1.91 | %(e) | | | 1.92 | %(e) | | | 1.94 | %(e) | | | 1.93 | %(e) | | | 1.88 | %(e) | |
Net investment income (loss) | | | (0.36 | %) | | | (0.49 | %) | | | 0.00 | %(a) | | | (0.17 | %) | | | 0.30 | % | |
Supplemental data | |
Net assets, end of period (in thousands) | | $ | 138,393 | | | $ | 133,282 | | | $ | 115,248 | | | $ | 125,463 | | | $ | 173,457 | | |
Portfolio turnover | | | 25 | % | | | 48 | % | | | 36 | % | | | 39 | % | | | 50 | % | |
Notes to Financial Highlights
(a) Rounds to zero.
(b) Net investment income per share reflects special dividends. The effect of these dividends amounted to $0.08 per share.
(c) In addition to the fees and expenses that the Fund bears directly, the Fund indirectly bears a pro rata share of the fees and expenses of any other funds in which it invests. Such indirect expenses are not included in the Fund's reported expense ratios.
(d) Total net expenses include the impact of certain fee waivers/expense reimbursements made by the Investment Manager and certain of its affiliates, if applicable.
(e) The benefits derived from expense reductions had an impact of less than 0.01%.
The accompanying Notes to Financial Statements are an integral part of this statement.
Annual Report 2015
23
COLUMBIA MID CAP VALUE FUND
FINANCIAL HIGHLIGHTS (continued)
| | | Year Ended February 28, | | Year Ended
February 29, | | Year Ended
February 28, | |
Class I | | 2015 | | 2014 | | 2013 | | 2012 | | 2011(a) | |
Per share data | |
Net asset value, beginning of period | | $ | 18.64 | | | $ | 16.03 | | | $ | 13.91 | | | $ | 14.24 | | | $ | 11.68 | | |
Income from investment operations: | |
Net investment income | | | 0.09 | | | | 0.12 | | | | 0.17 | | | | 0.13 | | | | 0.03 | | |
Net realized and unrealized gain (loss) | | | 1.51 | | | | 4.59 | | | | 2.12 | | | | (0.33 | ) | | | 2.58 | | |
Total from investment operations | | | 1.60 | | | | 4.71 | | | | 2.29 | | | | (0.20 | ) | | | 2.61 | | |
Less distributions to shareholders: | |
Net investment income | | | (0.15 | ) | | | (0.14 | ) | | | (0.17 | ) | | | (0.13 | ) | | | (0.05 | ) | |
Net realized gains | | | (2.90 | ) | | | (1.96 | ) | | | — | | | | — | | | | — | | |
Total distributions to shareholders | | | (3.05 | ) | | | (2.10 | ) | | | (0.17 | ) | | | (0.13 | ) | | | (0.05 | ) | |
Proceeds from regulatory settlements | | | — | | | | — | | | | — | | | | 0.00 | (b) | | | — | | |
Net asset value, end of period | | $ | 17.19 | | | $ | 18.64 | | | $ | 16.03 | | | $ | 13.91 | | | $ | 14.24 | | |
Total return | | | 9.03 | % | | | 30.59 | % | | | 16.61 | % | | | (1.32 | %) | | | 22.40 | % | |
Ratios to average net assets(c) | |
Total gross expenses | | | 0.72 | % | | | 0.73 | % | | | 0.74 | % | | | 0.73 | % | | | 0.72 | %(d) | |
Total net expenses(e) | | | 0.72 | % | | | 0.73 | % | | | 0.74 | % | | | 0.73 | % | | | 0.72 | %(d) | |
Net investment income | | | 0.51 | % | | | 0.69 | % | | | 1.19 | % | | | 1.03 | % | | | 0.53 | %(d) | |
Supplemental data | |
Net assets, end of period (in thousands) | | $ | 3 | | | $ | 87,662 | | | $ | 160,368 | | | $ | 143,562 | | | $ | 150,603 | | |
Portfolio turnover | | | 25 | % | | | 48 | % | | | 36 | % | | | 39 | % | | | 50 | % | |
Notes to Financial Highlights
(a) Based on operations from September 27, 2010 (commencement of operations) through the stated period end.
(b) Rounds to zero.
(c) In addition to the fees and expenses that the Fund bears directly, the Fund indirectly bears a pro rata share of the fees and expenses of any other funds in which it invests. Such indirect expenses are not included in the Fund's reported expense ratios.
(d) Annualized.
(e) Total net expenses include the impact of certain fee waivers/expense reimbursements made by the Investment Manager and certain of its affiliates, if applicable.
The accompanying Notes to Financial Statements are an integral part of this statement.
Annual Report 2015
24
COLUMBIA MID CAP VALUE FUND
FINANCIAL HIGHLIGHTS (continued)
| | | Year Ended February 28, | | Year Ended
February 29, | |
Class K | | 2015 | | 2014 | | 2013 | | 2012(a) | |
Per share data | |
Net asset value, beginning of period | | $ | 18.70 | | | $ | 16.07 | | | $ | 13.94 | | | $ | 14.06 | | |
Income from investment operations: | |
Net investment income | | | 0.10 | | | | 0.07 | | | | 0.13 | | | | 0.11 | | |
Net realized and unrealized gain (loss) | | | 1.44 | | | | 4.61 | | | | 2.13 | | | | (0.15 | ) | |
Total from investment operations | | | 1.54 | | | | 4.68 | | | | 2.26 | | | | (0.04 | ) | |
Less distributions to shareholders: | |
Net investment income | | | (0.10 | ) | | | (0.09 | ) | | | (0.13 | ) | | | (0.08 | ) | |
Net realized gains | | | (2.90 | ) | | | (1.96 | ) | | | — | | | | — | | |
Total distributions to shareholders | | | (3.00 | ) | | | (2.05 | ) | | | (0.13 | ) | | | (0.08 | ) | |
Proceeds from regulatory settlements | | | — | | | | — | | | | — | | | | 0.00 | (b) | |
Net asset value, end of period | | $ | 17.24 | | | $ | 18.70 | | | $ | 16.07 | | | $ | 13.94 | | |
Total return | | | 8.63 | % | | | 30.26 | % | | | 16.31 | % | | | (0.23 | %) | |
Ratios to average net assets(c) | |
Total gross expenses | | | 1.01 | % | | | 1.03 | % | | | 1.04 | % | | | 1.05 | %(d) | |
Total net expenses(e) | | | 1.01 | % | | | 1.03 | % | | | 1.01 | % | | | 1.03 | %(d) | |
Net investment income | | | 0.57 | % | | | 0.40 | % | | | 0.93 | % | | | 0.86 | %(d) | |
Supplemental data | |
Net assets, end of period (in thousands) | | $ | 6 | | | $ | 16 | | | $ | 14 | | | $ | 12 | | |
Portfolio turnover | | | 25 | % | | | 48 | % | | | 36 | % | | | 39 | % | |
Notes to Financial Highlights
(a) Based on operations from March 7, 2011 (commencement of operations) through the stated period end.
(b) Rounds to zero.
(c) In addition to the fees and expenses that the Fund bears directly, the Fund indirectly bears a pro rata share of the fees and expenses of any other funds in which it invests. Such indirect expenses are not included in the Fund's reported expense ratios.
(d) Annualized.
(e) Total net expenses include the impact of certain fee waivers/expense reimbursements made by the Investment Manager and certain of its affiliates, if applicable.
The accompanying Notes to Financial Statements are an integral part of this statement.
Annual Report 2015
25
COLUMBIA MID CAP VALUE FUND
FINANCIAL HIGHLIGHTS (continued)
| | | Year Ended February 28, | | Year Ended
February 29, | | Year Ended
February 28, | |
Class R | | 2015 | | 2014 | | 2013 | | 2012 | | 2011 | |
Per share data | |
Net asset value, beginning of period | | $ | 18.61 | | | $ | 16.00 | | | $ | 13.89 | | | $ | 14.23 | | | $ | 11.18 | | |
Income from investment operations: | |
Net investment income | | | 0.03 | | | | 0.00 | (a) | | | 0.07 | | | | 0.01 | | | | 0.10 | (b) | |
Net realized and unrealized gain (loss) | | | 1.44 | | | | 4.59 | | | | 2.11 | | | | (0.31 | ) | | | 3.07 | | |
Total from investment operations | | | 1.47 | | | | 4.59 | | | | 2.18 | | | | (0.30 | ) | | | 3.17 | | |
Less distributions to shareholders: | |
Net investment income | | | (0.04 | ) | | | (0.02 | ) | | | (0.07 | ) | | | (0.04 | ) | | | (0.12 | ) | |
Net realized gains | | | (2.90 | ) | | | (1.96 | ) | | | — | | | | — | | | | — | | |
Total distributions to shareholders | | | (2.94 | ) | | | (1.98 | ) | | | (0.07 | ) | | | (0.04 | ) | | | (0.12 | ) | |
Proceeds from regulatory settlements | | | — | | | | — | | | | — | | | | 0.00 | (a) | | | 0.00 | (a) | |
Net asset value, end of period | | $ | 17.14 | | | $ | 18.61 | | | $ | 16.00 | | | $ | 13.89 | | | $ | 14.23 | | |
Total return | | | 8.25 | % | | | 29.77 | % | | | 15.76 | % | | | (2.04 | %) | | | 28.53 | % | |
Ratios to average net assets(c) | |
Total gross expenses | | | 1.41 | % | | | 1.42 | % | | | 1.44 | % | | | 1.45 | % | | | 1.38 | % | |
Total net expenses(d) | | | 1.41 | %(e) | | | 1.42 | %(e) | | | 1.44 | %(e) | | | 1.43 | %(e) | | | 1.38 | %(e) | |
Net investment income | | | 0.15 | % | | | 0.02 | % | | | 0.50 | % | | | 0.15 | % | | | 0.80 | % | |
Supplemental data | |
Net assets, end of period (in thousands) | | $ | 77,556 | | | $ | 62,085 | | | $ | 58,923 | | | $ | 80,096 | | | $ | 337,001 | | |
Portfolio turnover | | | 25 | % | | | 48 | % | | | 36 | % | | | 39 | % | | | 50 | % | |
Notes to Financial Highlights
(a) Rounds to zero.
(b) Net investment income per share reflects special dividends. The effect of these dividends amounted to $0.08 per share.
(c) In addition to the fees and expenses that the Fund bears directly, the Fund indirectly bears a pro rata share of the fees and expenses of any other funds in which it invests. Such indirect expenses are not included in the Fund's reported expense ratios.
(d) Total net expenses include the impact of certain fee waivers/expense reimbursements made by the Investment Manager and certain of its affiliates, if applicable.
(e) The benefits derived from expense reductions had an impact of less than 0.01%.
The accompanying Notes to Financial Statements are an integral part of this statement.
Annual Report 2015
26
COLUMBIA MID CAP VALUE FUND
FINANCIAL HIGHLIGHTS (continued)
| | | Year Ended February 28, | |
Class R4 | | 2015 | | 2014 | | 2013(a) | |
Per share data | |
Net asset value, beginning of period | | $ | 18.95 | | | $ | 16.26 | | | $ | 14.24 | | |
Income from investment operations: | |
Net investment income | | | 0.12 | | | | 0.09 | | | | 0.06 | | |
Net realized and unrealized gain | | | 1.47 | | | | 4.67 | | | | 2.00 | | |
Total from investment operations | | | 1.59 | | | | 4.76 | | | | 2.06 | | |
Less distributions to shareholders: | |
Net investment income | | | (0.12 | ) | | | (0.11 | ) | | | (0.04 | ) | |
Net realized gains | | | (2.90 | ) | | | (1.96 | ) | | | — | | |
Total distributions to shareholders | | | (3.02 | ) | | | (2.07 | ) | | | (0.04 | ) | |
Net asset value, end of period | | $ | 17.52 | | | $ | 18.95 | | | $ | 16.26 | | |
Total return | | | 8.79 | % | | | 30.40 | % | | | 14.49 | % | |
Ratios to average net assets(b) | |
Total gross expenses | | | 0.92 | % | | | 0.92 | % | | | 0.85 | %(c) | |
Total net expenses(d) | | | 0.92 | %(e) | | | 0.92 | %(e) | | | 0.85 | %(c) | |
Net investment income | | | 0.68 | % | | | 0.48 | % | | | 1.19 | %(c) | |
Supplemental data | |
Net assets, end of period (in thousands) | | $ | 33,559 | | | $ | 10,580 | | | $ | 3 | | |
Portfolio turnover | | | 25 | % | | | 48 | % | | | 36 | % | |
Notes to Financial Highlights
(a) Based on operations from November 8, 2012 (commencement of operations) through the stated period end.
(b) In addition to the fees and expenses that the Fund bears directly, the Fund indirectly bears a pro rata share of the fees and expenses of any other funds in which it invests. Such indirect expenses are not included in the Fund's reported expense ratios.
(c) Annualized.
(d) Total net expenses include the impact of certain fee waivers/expense reimbursements made by the Investment Manager and certain of its affiliates, if applicable.
(e) The benefits derived from expense reductions had an impact of less than 0.01%.
The accompanying Notes to Financial Statements are an integral part of this statement.
Annual Report 2015
27
COLUMBIA MID CAP VALUE FUND
FINANCIAL HIGHLIGHTS (continued)
| | | Year Ended February 28, | |
Class R5 | | 2015 | | 2014 | | 2013(a) | |
Per share data | |
Net asset value, beginning of period | | $ | 18.96 | | | $ | 16.26 | | | $ | 14.24 | | |
Income from investment operations: | |
Net investment income | | | 0.15 | | | | 0.12 | | | | 0.06 | | |
Net realized and unrealized gain | | | 1.45 | | | | 4.67 | | | | 2.00 | | |
Total from investment operations | | | 1.60 | | | | 4.79 | | | | 2.06 | | |
Less distributions to shareholders: | |
Net investment income | | | (0.14 | ) | | | (0.13 | ) | | | (0.04 | ) | |
Net realized gains | | | (2.90 | ) | | | (1.96 | ) | | | — | | |
Total distributions to shareholders | | | (3.04 | ) | | | (2.09 | ) | | | (0.04 | ) | |
Net asset value, end of period | | $ | 17.52 | | | $ | 18.96 | | | $ | 16.26 | | |
Total return | | | 8.87 | % | | | 30.64 | % | | | 14.52 | % | |
Ratios to average net assets(b) | |
Total gross expenses | | | 0.78 | % | | | 0.80 | % | | | 0.77 | %(c) | |
Total net expenses(d) | | | 0.78 | % | | | 0.80 | % | | | 0.77 | %(c) | |
Net investment income | | | 0.84 | % | | | 0.67 | % | | | 1.28 | %(c) | |
Supplemental data | |
Net assets, end of period (in thousands) | | $ | 72,152 | | | $ | 28,245 | | | $ | 3 | | |
Portfolio turnover | | | 25 | % | | | 48 | % | | | 36 | % | |
Notes to Financial Highlights
(a) Based on operations from November 8, 2012 (commencement of operations) through the stated period end.
(b) In addition to the fees and expenses that the Fund bears directly, the Fund indirectly bears a pro rata share of the fees and expenses of any other funds in which it invests. Such indirect expenses are not included in the Fund's reported expense ratios.
(c) Annualized.
(d) Total net expenses include the impact of certain fee waivers/expense reimbursements made by the Investment Manager and certain of its affiliates, if applicable.
The accompanying Notes to Financial Statements are an integral part of this statement.
Annual Report 2015
28
COLUMBIA MID CAP VALUE FUND
FINANCIAL HIGHLIGHTS (continued)
| | | Year Ended February 28, | | Year Ended
February 29, | | Year Ended
February 28, | |
Class W | | 2015 | | 2014 | | 2013 | | 2012 | | 2011(a) | |
Per share data | |
Net asset value, beginning of period | | $ | 18.64 | | | $ | 16.03 | | | $ | 13.91 | | | $ | 14.24 | | | $ | 11.69 | | |
Income from investment operations: | |
Net investment income | | | 0.07 | | | | 0.04 | | | | 0.11 | | | | 0.09 | | | | 0.02 | | |
Net realized and unrealized gain (loss) | | | 1.45 | | | | 4.60 | | | | 2.11 | | | | (0.35 | ) | | | 2.57 | | |
Total from investment operations | | | 1.52 | | | | 4.64 | | | | 2.22 | | | | (0.26 | ) | | | 2.59 | | |
Less distributions to shareholders: | |
Net investment income | | | (0.08 | ) | | | (0.07 | ) | | | (0.10 | ) | | | (0.07 | ) | | | (0.04 | ) | |
Net realized gains | | | (2.90 | ) | | | (1.96 | ) | | | — | | | | — | | | | — | | |
Total distributions to shareholders | | | (2.98 | ) | | | (2.03 | ) | | | (0.10 | ) | | | (0.07 | ) | | | (0.04 | ) | |
Proceeds from regulatory settlements | | | — | | | | — | | | | — | | | | 0.00 | (b) | | | — | | |
Net asset value, end of period | | $ | 17.18 | | | $ | 18.64 | | | $ | 16.03 | | | $ | 13.91 | | | $ | 14.24 | | |
Total return | | | 8.50 | % | | | 30.02 | % | | | 16.09 | % | | | (1.74 | %) | | | 22.17 | % | |
Ratios to average net assets(c) | |
Total gross expenses | | | 1.16 | % | | | 1.16 | % | | | 1.19 | % | | | 1.19 | % | | | 1.14 | %(d) | |
Total net expenses(e) | | | 1.16 | %(f) | | | 1.16 | %(f) | | | 1.19 | %(f) | | | 1.19 | %(f) | | | 1.14 | %(d)(f) | |
Net investment income | | | 0.37 | % | | | 0.21 | % | | | 0.74 | % | | | 0.69 | % | | | 0.34 | %(d) | |
Supplemental data | |
Net assets, end of period (in thousands) | | $ | 492 | | | $ | 645 | | | $ | 79,581 | | | $ | 77,367 | | | $ | 3 | | |
Portfolio turnover | | | 25 | % | | | 48 | % | | | 36 | % | | | 39 | % | | | 50 | % | |
Notes to Financial Highlights
(a) Based on operations from September 27, 2010 (commencement of operations) through the stated period end.
(b) Rounds to zero.
(c) In addition to the fees and expenses that the Fund bears directly, the Fund indirectly bears a pro rata share of the fees and expenses of any other funds in which it invests. Such indirect expenses are not included in the Fund's reported expense ratios.
(d) Annualized.
(e) Total net expenses include the impact of certain fee waivers/expense reimbursements made by the Investment Manager and certain of its affiliates, if applicable.
(f) The benefits derived from expense reductions had an impact of less than 0.01%.
The accompanying Notes to Financial Statements are an integral part of this statement.
Annual Report 2015
29
COLUMBIA MID CAP VALUE FUND
FINANCIAL HIGHLIGHTS (continued)
| | | Year Ended February 28, | | Year Ended
February 29, | | Year Ended
February 28, | |
Class Y | | 2015 | | 2014 | | 2013 | | 2012 | | 2011 | |
Per share data | |
Net asset value, beginning of period | | $ | 18.65 | | | $ | 16.03 | | | $ | 13.91 | | | $ | 14.24 | | | $ | 11.18 | | |
Income from investment operations: | |
Net investment income | | | 0.16 | | | | 0.12 | | | | 0.18 | | | | 0.13 | | | | 0.16 | (a) | |
Net realized and unrealized gain (loss) | | | 1.43 | | | | 4.60 | | | | 2.09 | | | | (0.34 | ) | | | 3.08 | | |
Total from investment operations | | | 1.59 | | | | 4.72 | | | | 2.27 | | | | (0.21 | ) | | | 3.24 | | |
Less distributions to shareholders: | |
Net investment income | | | (0.15 | ) | | | (0.14 | ) | | | (0.15 | ) | | | (0.12 | ) | | | (0.18 | ) | |
Net realized gains | | | (2.90 | ) | | | (1.96 | ) | | | — | | | | — | | | | — | | |
Total distributions to shareholders | | | (3.05 | ) | | | (2.10 | ) | | | (0.15 | ) | | | (0.12 | ) | | | (0.18 | ) | |
Proceeds from regulatory settlements | | | — | | | | — | | | | — | | | | 0.00 | (b) | | | 0.00 | (b) | |
Net asset value, end of period | | $ | 17.19 | | | $ | 18.65 | | | $ | 16.03 | | | $ | 13.91 | | | $ | 14.24 | | |
Total return | | | 8.97 | % | | | 30.65 | % | | | 16.50 | % | | | (1.40 | %) | | | 29.23 | % | |
Ratios to average net assets(c) | |
Total gross expenses | | | 0.73 | % | | | 0.73 | % | | | 0.77 | % | | | 0.82 | % | | | 0.81 | % | |
Total net expenses(d) | | | 0.73 | % | | | 0.73 | % | | | 0.77 | % | | | 0.82 | % | | | 0.81 | %(e) | |
Net investment income | | | 0.88 | % | | | 0.69 | % | | | 1.19 | % | | | 0.97 | % | | | 1.25 | % | |
Supplemental data | |
Net assets, end of period (in thousands) | | $ | 27,860 | | | $ | 10,175 | | | $ | 4,975 | | | $ | 32 | | | $ | 33 | | |
Portfolio turnover | | | 25 | % | | | 48 | % | | | 36 | % | | | 39 | % | | | 50 | % | |
Notes to Financial Highlights
(a) Net investment income per share reflects special dividends. The effect of these dividends amounted to $0.08 per share.
(b) Rounds to zero.
(c) In addition to the fees and expenses that the Fund bears directly, the Fund indirectly bears a pro rata share of the fees and expenses of any other funds in which it invests. Such indirect expenses are not included in the Fund's reported expense ratios.
(d) Total net expenses include the impact of certain fee waivers/expense reimbursements made by the Investment Manager and certain of its affiliates, if applicable.
(e) The benefits derived from expense reductions had an impact of less than 0.01%.
The accompanying Notes to Financial Statements are an integral part of this statement.
Annual Report 2015
30
COLUMBIA MID CAP VALUE FUND
FINANCIAL HIGHLIGHTS (continued)
| | | Year Ended February 28, | | Year Ended
February 29, | | Year Ended
February 28, | |
Class Z | | 2015 | | 2014 | | 2013 | | 2012 | | 2011 | |
Per share data | |
Net asset value, beginning of period | | $ | 18.67 | | | $ | 16.05 | | | $ | 13.93 | | | $ | 14.26 | | | $ | 11.20 | | |
Income from investment operations: | |
Net investment income | | | 0.12 | | | | 0.09 | | | | 0.14 | | | | 0.11 | | | | 0.16 | (a) | |
Net realized and unrealized gain (loss) | | | 1.44 | | | | 4.60 | | | | 2.12 | | | | (0.33 | ) | | | 3.07 | | |
Total from investment operations | | | 1.56 | | | | 4.69 | | | | 2.26 | | | | (0.22 | ) | | | 3.23 | | |
Less distributions to shareholders: | |
Net investment income | | | (0.12 | ) | | | (0.11 | ) | | | (0.14 | ) | | | (0.11 | ) | | | (0.17 | ) | |
Net realized gains | | | (2.90 | ) | | | (1.96 | ) | | | — | | | | — | | | | — | | |
Total distributions to shareholders | | | (3.02 | ) | | | (2.07 | ) | | | (0.14 | ) | | | (0.11 | ) | | | (0.17 | ) | |
Proceeds from regulatory settlements | | | — | | | | — | | | | — | | | | 0.00 | (b) | | | 0.00 | (b) | |
Net asset value, end of period | | $ | 17.21 | | | $ | 18.67 | | | $ | 16.05 | | | $ | 13.93 | | | $ | 14.26 | | |
Total return | | | 8.76 | % | | | 30.37 | % | | | 16.36 | % | | | (1.50 | %) | | | 29.14 | % | |
Ratios to average net assets(c) | |
Total gross expenses | | | 0.91 | % | | | 0.92 | % | | | 0.94 | % | | | 0.93 | % | | | 0.88 | % | |
Total net expenses(d) | | | 0.91 | %(e) | | | 0.92 | %(e) | | | 0.94 | %(e) | | | 0.93 | %(e) | | | 0.88 | %(e) | |
Net investment income | | | 0.64 | % | | | 0.52 | % | | | 1.01 | % | | | 0.85 | % | | | 1.30 | % | |
Supplemental data | |
Net assets, end of period (in thousands) | | $ | 2,334,328 | | | $ | 2,423,967 | | | $ | 2,298,515 | | | $ | 2,460,299 | | | $ | 2,859,249 | | |
Portfolio turnover | | | 25 | % | | | 48 | % | | | 36 | % | | | 39 | % | | | 50 | % | |
Notes to Financial Highlights
(a) Net investment income per share reflects special dividends. The effect of these dividends amounted to $0.08 per share.
(b) Rounds to zero.
(c) In addition to the fees and expenses that the Fund bears directly, the Fund indirectly bears a pro rata share of the fees and expenses of any other funds in which it invests. Such indirect expenses are not included in the Fund's reported expense ratios.
(d) Total net expenses include the impact of certain fee waivers/expense reimbursements made by the Investment Manager and certain of its affiliates, if applicable.
(e) The benefits derived from expense reductions had an impact of less than 0.01%.
The accompanying Notes to Financial Statements are an integral part of this statement.
Annual Report 2015
31
COLUMBIA MID CAP VALUE FUND
NOTES TO FINANCIAL STATEMENTS
February 28, 2015
Note 1. Organization
Columbia Mid Cap Value Fund (the Fund), a series of Columbia Funds Series Trust (the Trust), is a diversified fund. The Trust is registered under the Investment Company Act of 1940, as amended (the 1940 Act), as an open-end management investment company organized as a Delaware statutory trust.
Fund Shares
The Trust may issue an unlimited number of shares (without par value). The Fund offers Class A, Class B, Class C, Class I, Class K, Class R, Class R4, Class R5, Class W, Class Y and Class Z shares. Although all share classes generally have identical voting, dividend and liquidation rights, each share class votes separately when required by the Trust's organizational documents or by law. Different share classes pay different distribution amounts to the extent the expenses of such share classes differ, and distributions in liquidation will be proportional to the net asset value of each share class. Each share class has its own expense structure and sales charges.
Class A shares are subject to a maximum front-end sales charge of 5.75% based on the initial investment amount. Class A shares purchased without an initial sales charge in accounts aggregating $1 million to $50 million at the time of purchase are subject to a contingent deferred sales charge (CDSC) if the shares are sold within 18 months of purchase, charged as follows: 1.00% CDSC if redeemed within 12 months of purchase, and 0.50% CDSC if redeemed more than 12, but less than 18, months after purchase.
Class B shares may be subject to a maximum CDSC of 5.00% based upon the holding period after purchase. Class B shares will generally convert to Class A shares eight years after purchase. The Fund no longer accepts investments by new or existing investors in the Fund's Class B shares, except in connection with the reinvestment of any dividend and/or capital gain distributions in Class B shares of the Fund and exchanges by existing Class B shareholders of certain other funds within the Columbia Family of Funds.
Class C shares are subject to a 1.00% CDSC on shares redeemed within one year of purchase.
Class I shares are not subject to sales charges and are available only to the Columbia Family of Funds.
Class K shares are not subject to sales charges, however this share class is closed to new investors.
Class R shares are not subject to sales charges and are generally available only to certain retirement plans and other investors as described in the Fund's prospectus.
Class R4 shares are not subject to sales charges and are generally available only to omnibus retirement plans and certain investors as described in the Fund's prospectus.
Class R5 shares are not subject to sales charges and are generally available only to investors purchasing through authorized investment professionals and omnibus retirement plans.
Class W shares are not subject to sales charges and are available only to investors purchasing through authorized investment programs managed by investment professionals, including discretionary managed account programs.
Class Y shares are not subject to sales charges and are generally available only to certain retirement plans as described in the Fund's prospectus.
Class Z shares are not subject to sales charges and are available only to eligible investors, which are subject to different investment minimums as described in the Fund's prospectus.
Note 2. Summary of Significant Accounting Policies
Basis of Preparation
The Fund is an investment company that applies the accounting and reporting guidance in the Financial Accounting Standards Board (FASB) Accounting Standards Codification Topic 946, Financial Services — Investment Companies (ASC 946). The financial statements are prepared in accordance with U.S. generally accepted accounting principles (GAAP) which requires management to make certain estimates and assumptions that affect the reported amounts of assets and liabilities, the disclosure of contingent assets and liabilities at the date of the financial statements and the reported amounts of income and expenses during the reporting period. Actual results could differ from those estimates.
The following is a summary of significant accounting policies followed by the Fund in the preparation of its financial statements.
Security Valuation
All equity securities are valued at the close of business of the New York Stock Exchange (NYSE). Equity securities
Annual Report 2015
32
COLUMBIA MID CAP VALUE FUND
NOTES TO FINANCIAL STATEMENTS (continued)
February 28, 2015
are valued at the last quoted sales price on the principal exchange or market on which they trade, except for securities traded on the NASDAQ Stock Market, which are valued at the NASDAQ official close price. Unlisted securities or listed securities for which there were no sales during the day are valued at the mean of the latest quoted bid and ask prices on such exchanges or markets.
Foreign equity securities are valued based on quotations from the principal market in which such securities are traded. If any foreign security prices are not readily available as a result of limited share activity, the securities are valued at the mean of the latest quoted bid and ask prices on such exchanges or markets. Foreign currency exchange rates are generally determined at 4:00 p.m. Eastern (U.S.) time. Many securities markets and exchanges outside the U.S. close prior to the close of the NYSE; therefore, the closing prices for securities in such markets or on such exchanges may not fully reflect events that occur after such close but before the close of the NYSE. In those situations, foreign securities will be fair valued pursuant to a policy adopted by the Board of Trustees (the Board), including, if available, utilizing a third party pricing service to determine these fair values. The third party pricing service takes into account multiple factors, including, but not limited to, movements in the U.S. securities markets, certain depositary receipts, futures contracts and foreign exchange rates that have occurred subsequent to the close of the foreign exchange or market, to determine a good faith estimate that reasonably reflects the current market conditions as of the close of the NYSE. The fair value of a security is likely to be different from the quoted or published price, if available.
Investments in open-end investment companies, including money market funds, are valued at their net asset value.
Investments for which market quotations are not readily available, or that have quotations which management believes are not reliable, are valued at fair value as determined in good faith under procedures established by and under the general supervision of the Board. If a security or class of securities (such as foreign securities) is valued at fair value, such value is likely to be different from the quoted or published price for the security.
The determination of fair value often requires significant judgment. To determine fair value, management may use assumptions including but not limited to future cash flows and estimated risk premiums. Multiple inputs from various sources may be used to determine fair value.
Option contracts are valued at the mean of the latest quoted bid and asked prices on their primary exchanges. Option contracts, including over-the-counter option contracts, with no readily available market value are valued using quotations obtained from independent brokers as of the close of the NYSE.
Derivative Instruments
The Fund invests in certain derivative instruments, as detailed below, to meet its investment objectives. Derivatives are instruments whose values depend on, or are derived from, in whole or in part, the value of one or more other assets, such as securities, currencies, commodities or indices. Derivative instruments may be used to increase investment flexibility (including to maintain cash reserves while maintaining exposure to certain other assets), for risk management (hedging) purposes, to facilitate trading, to reduce transaction costs and to pursue higher investment returns. The Fund may also use derivative instruments to mitigate certain investment risks, such as foreign currency exchange rate risk, interest rate risk and credit risk. Derivatives may involve various risks, including the potential inability of the counterparty to fulfill its obligation under the terms of the contract, the potential for an illiquid secondary market (making it difficult for the Fund to sell, including at favorable prices) and the potential for market movements which may expose the Fund to gains or losses in excess of the amount shown in the Statement of Assets and Liabilities. The notional amounts of derivative instruments, if applicable, are not recorded in the financial statements.
A derivative instrument may suffer a marked-to-market loss if the value of the contract decreases due to an unfavorable change in the market rates or values of the underlying instrument. Losses can also occur if the counterparty does not perform under the contract. The Fund's risk of loss from counterparty credit risk on over-the-counter derivatives is generally limited to the aggregate unrealized gain netted against any collateral held by the Fund and the amount of any variation margin held by the counterparty. With exchange-traded or centrally cleared derivatives, there is reduced counterparty credit risk to the Fund since the exchange's clearinghouse, as counterparty to such instruments, guarantees against a possible default. The clearinghouse stands between the buyer and the seller of the contract; therefore, the counterparty credit risk is failure of the clearinghouse. However, credit risk still exists in exchange-traded or centrally cleared derivatives with respect to initial and
Annual Report 2015
33
COLUMBIA MID CAP VALUE FUND
NOTES TO FINANCIAL STATEMENTS (continued)
February 28, 2015
variation margin that is held in a broker's customer account. While brokers are required to segregate customer margin from their own assets, in the event that a broker becomes insolvent or goes into bankruptcy and at that time there is a shortfall in the aggregate amount of margin held by the broker for all its clients, U.S. bankruptcy laws will typically allocate that shortfall on a pro-rata basis across all the broker's customers (including the Fund), potentially resulting in losses to the Fund.
In order to better define its contractual rights and to secure rights that will help the Fund mitigate its counterparty risk, the Fund may enter into an International Swaps and Derivatives Association, Inc. Master Agreement (ISDA Master Agreement) or similar agreement with its derivative contract counterparties. An ISDA Master Agreement is an agreement between the Fund and a counterparty that governs over-the-counter derivatives and forward foreign currency exchange contracts and typically contains, among other things, collateral posting terms and netting provisions in the event of a default and/or termination event. Under an ISDA Master Agreement, the Fund may, under certain circumstances, offset with the counterparty certain derivative instrument's payables and/or receivables with collateral held and/or posted and create one single net payment. The provisions of the ISDA Master Agreement typically permit a single net payment in the event of default (close-out netting) including the bankruptcy or insolvency of the counterparty. Note, however, that bankruptcy or insolvency laws of a particular jurisdiction may impose restrictions on or prohibitions against the right of offset in bankruptcy, insolvency or other events.
Collateral (margin) requirements differ by type of derivative. Margin requirements are established by the exchange or clearinghouse for exchange-traded and centrally cleared derivatives. Brokers can ask for margin in excess of the minimum in certain circumstances. Collateral terms are contract specific for over-the-counter derivatives. For over-the-counter derivatives traded under an ISDA Master Agreement, the collateral requirements are typically calculated by netting the marked-to-market amount for each transaction under such agreement and comparing that amount to the value of any variation margin currently pledged by the Fund and/or the counterparty. Generally, the amount of collateral due from or to a party has to exceed a minimum transfer amount threshold (e.g., $500,000) before a transfer has to be made. To the extent amounts due to the Fund from its counterparties are not fully collateralized, contractually or otherwise, the Fund bears the risk of loss from
counterparty nonperformance. The Fund attempts to mitigate counterparty risk by only entering into agreements with counterparties that it believes have the financial resources to honor their obligations and by monitoring the financial stability of those counterparties.
Certain ISDA Master Agreements allow counterparties to over-the-counter derivatives to terminate derivative contracts prior to maturity in the event the Fund's net assets decline by a stated percentage over a specified time period or if the Fund fails to meet the terms of the ISDA Master Agreement, which would cause the Fund to accelerate payment of any net liability owed to the counterparty. The Fund also has termination rights if the counterparty fails to meet the terms of the ISDA Master Agreement. In addition to considering counterparty credit risk, the Fund would consider terminating the derivative contracts based on whether termination would result in a net liability owed from the counterparty.
For financial reporting purposes, the Fund does not offset derivative assets and derivative liabilities that are subject to netting arrangements in the Statement of Assets and Liabilities.
Options Contracts
Options are contracts which entitle the holder to purchase or sell securities or other identified assets at a specified price, or in the case of index option contracts, to receive or pay the difference between the index value and the strike price of the index option contract. Option contracts can be either exchange-traded or over-the-counter. The Fund purchased and wrote option contracts to decrease the Fund's exposure to equity market risk and to increase return on investments. These instruments may be used for other purposes in future periods. Completion of transactions for option contracts traded in the over-the-counter market depends upon the performance of the other party. Cash collateral may be collected or posted by the Fund to secure certain over-the-counter option contract trades. Cash collateral held or posted by the Fund for such option contract trades must be returned to the counterparty or the Fund upon closure, exercise or expiration of the contract.
Options contracts purchased are recorded as investments. When the Fund writes an options contract, the premium received is recorded as an asset and an amount equivalent to the premium is recorded as a liability in the Statement of Assets and Liabilities and is subsequently adjusted to reflect the current fair value of the option written. Changes in the fair value of the written option are recorded as unrealized appreciation or
Annual Report 2015
34
COLUMBIA MID CAP VALUE FUND
NOTES TO FINANCIAL STATEMENTS (continued)
February 28, 2015
depreciation until the contract is exercised or has expired. The Fund will realize a gain or loss when the option contract is closed or expires. When option contracts are exercised, the proceeds on sales for a written call or purchased put option contract, or the purchase cost for a written put or purchased call option contract, is adjusted by the amount of premium received or paid.
For over-the-counter options purchased, the Fund bears the risk of loss of the amount of the premiums paid plus the positive change in market values net of any collateral held by the Fund should the counterparty fail to perform under the contracts. Option contracts written by the Fund do not typically give rise to counterparty credit risk, as options written generally obligate the Fund and not the counterparty to perform. The risk in writing a call option contract is that the Fund gives up the opportunity for profit if the market price of the security increases above the strike price and the option contract is exercised. The risk in writing a put option contract is that the Fund may incur a loss if the market price of the security decreases below the strike price and the option contract is exercised. Exercise of a written option could result in the Fund purchasing or selling a security or foreign currency when it otherwise would not, or at a price different from the current market value. In purchasing and writing options, the Fund bears the risk of an unfavorable change in the value of the underlying instrument or the risk that the Fund may not be able to enter into a closing transaction due to an illiquid market.
Contracts and premiums associated with options contracts written for the year ended February 28, 2015 are as follows:
| | | Calls | |
| | | Contracts | | Premiums | |
Balance at February 28, 2014 | | | — | | | $ | — | | |
Opened | | | 10,914 | | | | 1,043,101 | | |
Closed | | | — | | | | — | | |
Expired | | | (10,241 | ) | | | (913,914 | ) | |
Exercised | | | (673 | ) | | | (129,187 | ) | |
Balance at February 28, 2015 | | | — | | | $ | — | | |
Effects of Derivative Transactions in the Financial Statements
The following tables are intended to provide additional information about the effect of derivatives on the financial statements of the Fund, including: the fair value of derivatives by risk category and the location of those fair values in the Statement of Assets and Liabilities; and the impact of derivative transactions over the period
in the Statement of Operations, including realized gains or losses and unrealized gains or losses. The derivative schedules following the Portfolio of Investments present additional information regarding derivative instruments outstanding at the end of the period, if any.
At February 28, 2015, the Fund had no outstanding derivatives.
The following table indicates the effect of derivative instruments (not considered to be hedging instruments for accounting disclosure purposes) in the Statement of Operations for the year ended February 28, 2015:
Amount of Realized Gain (Loss) on Derivatives Recognized in Income | |
Risk Exposure Category | | Options Contracts
Written and Purchased ($) | |
Equity risk | | | (55,614 | ) | |
The following table is a summary of the average outstanding volume by derivative instrument for the year ended February 28, 2015:
Derivative Instrument | | Average market value ($)* | |
Options contracts — Written | | | 128,711 | | |
*Based on the ending quarterly outstanding amounts for the year ended February 28, 2015.
Security Transactions
Security transactions are accounted for on the trade date. Cost is determined and gains (losses) are based upon the specific identification method for both financial statement and federal income tax purposes.
Income Recognition
Corporate actions and dividend income are generally recorded net of any non-reclaimable tax withholdings, on the ex-dividend date or upon receipt of ex-dividend notification in the case of certain foreign securities.
The Fund may receive distributions from holdings in business development companies (BDCs), exchange-traded funds (ETFs), other regulated investment companies (RICs), and real estate investment trusts (REITs), which report information on the character of their distributions annually. These distributions are allocated to dividend income, capital gain and return of capital based on actual information reported. To the extent actual information has not yet been reported by the REITs, estimates for return of capital are made by the Fund's management. Return of capital is recorded as a reduction of the cost basis of securities held. If the Fund no longer owns the applicable securities, return of capital is recorded as a realized gain. Management's estimates are subsequently adjusted when
Annual Report 2015
35
COLUMBIA MID CAP VALUE FUND
NOTES TO FINANCIAL STATEMENTS (continued)
February 28, 2015
the actual character of the distributions is disclosed by the REITs, which could result in a proportionate change in return of capital to shareholders. No estimates are made for the BDCs, ETFs, and RICs.
Awards from class action litigation are recorded as a reduction of cost basis if the Fund still owns the applicable securities on the payment date. If the Fund no longer owns the applicable securities, the proceeds are recorded as realized gains.
Expenses
General expenses of the Trust are allocated to the Fund and other funds of the Trust based upon relative net assets or other expense allocation methodologies determined by the nature of the expense. Expenses directly attributable to the Fund are charged to the Fund. Expenses directly attributable to a specific class of shares are charged to that share class.
Determination of Class Net Asset Value
All income, expenses (other than class-specific expenses, which are charged to that share class, as shown in the Statement of Operations) and realized and unrealized gains (losses) are allocated to each class of the Fund on a daily basis, based on the relative net assets of each class, for purposes of determining the net asset value of each class.
Federal Income Tax Status
The Fund intends to qualify each year as a regulated investment company under Subchapter M of the Internal Revenue Code, as amended, and will distribute substantially all of its taxable income (including net short-term capital gains), if any, for its tax year, and as such will not be subject to federal income taxes. In addition, the Fund intends to distribute in each calendar year substantially all of its net investment income, capital gains and certain other amounts, if any, such that the Fund should not be subject to federal excise tax. Therefore, no federal income or excise tax provision is recorded.
Foreign Taxes
The Fund may be subject to foreign taxes on income, gains on investments or currency repatriation, a portion of which may be recoverable. The Fund will accrue such taxes and recoveries, as applicable, based upon its current interpretation of tax rules and regulations that exist in the markets in which it invests.
Realized gains in certain countries may be subject to foreign taxes at the Fund level, based on statutory rates.
The Fund accrues for such foreign taxes on realized and unrealized gains at the appropriate rate for each jurisdiction, as applicable. The amount, if any, is disclosed as a liability on the Statement of Assets and Liabilities.
Distributions to Shareholders
Distributions from net investment income, if any, are declared and paid each calendar quarter. Net realized capital gains, if any, are distributed at least annually. Income distributions and capital gain distributions are determined in accordance with federal income tax regulations, which may differ from GAAP.
Guarantees and Indemnifications
Under the Trust's organizational documents and, in some cases, by contract, its officers and trustees are indemnified against certain liabilities arising out of the performance of their duties to the Trust or its funds. In addition, certain of the Fund's contracts with its service providers contain general indemnification clauses. The Fund's maximum exposure under these arrangements is unknown since the amount of any future claims that may be made against the Fund cannot be determined, and the Fund has no historical basis for predicting the likelihood of any such claims.
Note 3. Fees and Compensation Paid to Affiliates
Investment Management Fees
Under an Investment Management Services Agreement, Columbia Management Investment Advisers, LLC (the Investment Manager), a wholly-owned subsidiary of Ameriprise Financial, Inc. (Ameriprise Financial), determines which securities will be purchased, held or sold. The investment management fee is an annual fee that is equal to a percentage of the Fund's average daily net assets that declines from 0.76% to 0.62% as the Fund's net assets increase. The effective investment management fee rate for the year ended February 28, 2015 was 0.66% of the Fund's average daily net assets.
The Investment Manager has entered into a personnel-sharing arrangement with its affiliate, Threadneedle Investments (Threadneedle). Threadneedle, like the Investment Manager, is a wholly-owned subsidiary of Ameriprise Financial and is an SEC-registered investment adviser. Pursuant to this arrangement, certain employees of Threadneedle serve as "associated persons" of the Investment Manager and, in this capacity, subject to the oversight and supervision of the Investment Manager and consistent with the investment objectives, policies
Annual Report 2015
36
COLUMBIA MID CAP VALUE FUND
NOTES TO FINANCIAL STATEMENTS (continued)
February 28, 2015
and limitations set forth in the Fund's prospectus and Statement of Additional Information (SAI), may provide research and related services, and discretionary investment management services (including acting as portfolio managers) to the Fund on behalf of the Investment Manager.
Administration Fees
Under an Administrative Services Agreement, the Investment Manager also serves as the Fund Administrator. The Fund pays the Fund Administrator an annual fee for administration and accounting services equal to a percentage of the Fund's average daily net assets that declines from 0.06% to 0.03% as the Fund's net assets increase. The effective administration fee rate for the year ended February 28, 2015 was 0.05% of the Fund's average daily net assets.
Other Expenses
Other expenses are for, among other things, miscellaneous expenses of the Fund or the Board, including payments to a company providing limited administrative services to the Fund and the Board. That company's expenses include boardroom and office expense, employee compensation, employee health and retirement benefits, and certain other expenses. For the year ended February 28, 2015, other expenses paid by the Fund to this company were $6,783.
Compensation of Board Members
Board members are compensated for their services to the Fund as disclosed in the Statement of Operations. Under a Deferred Compensation Plan (the Plan), the Board members who are not "interested persons" of the Fund, as defined under the 1940 Act, may elect to defer payment of up to 100% of their compensation. Deferred amounts are treated as though equivalent dollar amounts had been invested in shares of certain funds managed by the Investment Manager. The Fund's liability for these amounts is adjusted for market value changes and remains in the Fund until distributed in accordance with the Plan.
Transfer Agent Fees
Under a Transfer and Dividend Disbursing Agent Agreement, Columbia Management Investment Services Corp. (the Transfer Agent), an affiliate of the Investment Manager and a wholly-owned subsidiary of Ameriprise Financial, is responsible for providing transfer agency services to the Fund. The Transfer Agent has contracted with Boston Financial Data Services (BFDS) to serve as sub-transfer agent.
Effective November 1, 2014, the Transfer Agent receives a monthly transfer agency fee based on the number or the average value of accounts, depending on the type of account. Prior to November 1, 2014, the Transfer Agent received a monthly account-based service fee based on the number of open accounts. In addition, the Transfer Agent also receives sub-transfer agency fees based on a percentage of the average aggregate value of the Fund's shares maintained in omnibus accounts (other than omnibus accounts for which American Enterprise Investment Services Inc. is the broker of record or accounts where the beneficial shareholder is a customer of Ameriprise Financial Services, Inc., for which the Transfer agent receives a per account fee). The Transfer Agent pays the fees of BFDS for services as sub-transfer agent and is not entitled to reimbursement for such fees from the Fund (with the exception of out-of-pocket fees).
The Transfer Agent also receives compensation from the Fund for various shareholder services and reimbursements for certain out-of-pocket fees. Total transfer agent fees for Class K and Class R5 shares are subject to an annual limitation of not more than 0.05% of the average daily net assets attributable to each share class. Class I and Class Y shares do not pay transfer agency fees.
For the year ended February 28, 2015, the Fund's effective transfer agent fee rates as a percentage of average daily net assets of each class were as follows:
Class A | | | 0.19 | % | |
Class B | | | 0.19 | | |
Class C | | | 0.19 | | |
Class K | | | 0.05 | | |
Class R | | | 0.19 | | |
Class R4 | | | 0.19 | | |
Class R5 | | | 0.05 | | |
Class W | | | 0.19 | | |
Class Z | | | 0.19 | | |
An annual minimum account balance fee of $20 may apply to certain accounts with a value below the applicable share class's initial minimum investment requirements to reduce the impact of small accounts on transfer agent fees. These minimum account balance fees are remitted to the Fund and recorded as part of expense reductions in the Statement of Operations. For the year ended February 28, 2015, these minimum account balance fees reduced total expenses of the Fund by $6,750.
Plan Administration Fees
Under a Plan Administration Services Agreement with the Transfer Agent, the Fund pays an annual fee at a rate of
Annual Report 2015
37
COLUMBIA MID CAP VALUE FUND
NOTES TO FINANCIAL STATEMENTS (continued)
February 28, 2015
0.25% of the Fund's average daily net assets attributable to Class K shares for the provision of various administrative, recordkeeping, communication and educational services.
Distribution and Service Fees
The Fund has an agreement with Columbia Management Investment Distributors, Inc. (the Distributor), an affiliate of the Investment Manager and a wholly-owned subsidiary of Ameriprise Financial, for distribution and shareholder services. The Board has approved, and the Fund has adopted, distribution and shareholder service plans (the Plans) applicable to certain share classes, which set the distribution and service fees for the Fund. These fees are calculated daily and are intended to compensate the Distributor and/or eligible selling and/or servicing agents for selling shares of the Fund and providing services to investors.
Under the Plans, the Fund pays a monthly combined distribution and service fee to the Distributor at the maximum annual rate of 0.25% of the average daily net assets attributable to Class A shares of the Fund. Also under the Plans, the Fund pays a monthly service fee at the maximum annual rate of 0.25% of the average daily net assets attributable to Class B, Class C and Class W shares of the Fund and the payment of a monthly distribution fee at the maximum annual rates of 0.75%, 0.75%, 0.50% and 0.25% of the average daily net assets attributable to Class B, Class C, Class R and Class W shares, respectively.
Although the Fund may pay a distribution fee up to 0.25% of the Fund's average daily net assets attributable to Class W shares and a service fee of up to 0.25% of the Fund's average daily net assets attributable to Class W shares, the aggregate fee shall not exceed 0.25% of the Fund's average daily net assets attributable to Class W shares.
Sales Charges
Sales charges, including front-end charges and CDSCs, received by the Distributor for distributing Fund shares were $526,792 for Class A, $1,203 for Class B and $2,864 for Class C shares for the year ended February 28, 2015.
Expenses Waived/Reimbursed by the Investment Manager and its Affiliates
The Fund's expense ratio is subject to an expense reimbursement arrangement pursuant to which fees will be waived and/or expenses reimbursed (excluding certain fees and expenses described below), so that the
Fund's net operating expenses, after giving effect to fees waived/expenses reimbursed and any balance credits and/or overdraft charges from the Fund's custodian, do not exceed the annual rates of:
| | | Voluntary
Expense Cap
Effective
July 1, 2014 | | Contractual
Expense Cap
Prior to
July 1, 2014 | |
Class A | | | 1.28 | % | | | 1.26 | % | |
Class B | | | 2.03 | | | | 2.01 | | |
Class C | | | 2.03 | | | | 2.01 | | |
Class I | | | 0.89 | | | | 0.86 | | |
Class K | | | 1.19 | | | | 1.16 | | |
Class R | | | 1.53 | | | | 1.51 | | |
Class R4 | | | 1.03 | | | | 1.01 | | |
Class R5 | | | 0.94 | | | | 0.91 | | |
Class W | | | 1.28 | | | | 1.26 | | |
Class Y | | | 0.89 | | | | 0.86 | | |
Class Z | | | 1.03 | | | | 1.01 | | |
The voluntary expense cap arrangement may be revised or discontinued at any time. Under the arrangements, the following fees and expenses are excluded from the waiver/reimbursement commitment, and therefore will be paid by the Fund, if applicable: taxes (including foreign transaction taxes), expenses associated with investments in affiliated and non-affiliated pooled investment vehicles (including mutual funds and exchange-traded funds), transaction costs and brokerage commissions, costs related to any securities lending program, dividend expenses associated with securities sold short, inverse floater program fees and expenses, transaction charges and interest on borrowed money, interest and extraordinary expenses. Any fees waived and/or expenses reimbursed under the expense reimbursement arrangements described above are not recoverable by the Investment Manager or its affiliates in future periods.
Note 4. Federal Tax Information
The timing and character of income and capital gain distributions are determined in accordance with income tax regulations, which may differ from GAAP because of temporary or permanent book to tax differences.
At February 28, 2015, these differences are primarily due to differing treatment for deferral/reversal of wash sale losses, Trustees' deferred compensation, distribution reclassifications, tax straddles and post-October capital losses. To the extent these differences are permanent, reclassifications are made among the components of the Fund's net assets in the Statement
Annual Report 2015
38
COLUMBIA MID CAP VALUE FUND
NOTES TO FINANCIAL STATEMENTS (continued)
February 28, 2015
of Assets and Liabilities. Temporary differences do not require reclassifications. In the Statement of Assets and Liabilities the following reclassifications were made:
Excess of distributions over net investment income | | $ | 2,183,746 | | |
Accumulated net realized gain | | | (2,183,746 | ) | |
Paid-in capital | | | — | | |
Net investment income (loss) and net realized gains (losses), as disclosed in the Statement of Operations, and net assets were not affected by this reclassification.
The tax character of distributions paid during the years indicated was as follows:
Year Ended February 28, | | 2015 | | 2014 | |
Ordinary income | | $ | 107,032,132 | | | $ | 67,161,795 | | |
Long-term capital gains | | | 510,692,937 | | | | 341,120,254 | | |
Total | | | 617,725,069 | | | | 408,282,049 | | |
Short-term capital gain distributions, if any, are considered ordinary income distributions for tax purposes.
At February 28, 2015, the components of distributable earnings on a tax basis were as follows:
Undistributed long-term capital gains | | $ | 137,077,853 | | |
Net unrealized appreciation | | | 1,113,007,593 | | |
At February 28, 2015, the cost of investments for federal income tax purposes was $2,696,960,790 and the aggregate gross unrealized appreciation and depreciation based on that cost was:
Unrealized appreciation | | $ | 1,152,056,672 | | |
Unrealized depreciation | | | (39,049,079 | ) | |
Net unrealized appreciation | | | 1,113,007,593 | | |
Under current tax rules, regulated investment companies can elect to treat certain late-year ordinary losses incurred and post-October capital losses (capital losses realized after October 31) as arising on the first day of the following taxable year. As of February 28, 2015, the Fund will elect to treat post-October capital losses of $22,769,803 as arising on March 1, 2015.
Management of the Fund has concluded that there are no significant uncertain tax positions in the Fund that would require recognition in the financial statements. However, management's conclusion may be subject to review and adjustment at a later date based on factors including, but not limited to, new tax laws, regulations, and administrative interpretations (including relevant court decisions). Generally, the Fund's federal tax returns
for the prior three fiscal years remain subject to examination by the Internal Revenue Service.
Note 5. Portfolio Information
The cost of purchases and proceeds from sales of securities, excluding short-term investments and derivatives, if any, aggregated to $918,168,304 and $1,287,793,630, respectively, for the year ended February 28, 2015. The amount of purchase and sale activity impacts the portfolio turnover rate reported in the Financial Highlights.
Note 6. Affiliated Money Market Fund
The Fund invests in Columbia Short-Term Cash Fund, an affiliated money market fund established for the exclusive use by the Fund and other affiliated funds. The income earned by the Fund from such investments is included as Dividends — affiliated issuers in the Statement of Operations. As an investing fund, the Fund indirectly bears its proportionate share of the expenses of Columbia Short-Term Cash Fund.
Note 7. Shareholder Concentration
At February 28, 2015, two unaffiliated shareholders of record owned 36.3% of the outstanding shares of the Fund in one or more accounts. The Fund has no knowledge about whether any portion of those shares was owned beneficially. Subscription and redemption activity by concentrated accounts may have a significant effect on the operations of the Fund.
Note 8. Line of Credit
The Fund has entered into a revolving credit facility with a syndicate of banks led by JPMorgan Chase Bank, N.A. (JPMorgan) whereby the Fund may borrow for the temporary funding of shareholder redemptions or for other temporary or emergency purposes. Pursuant to a December 9, 2014 amendment, the credit facility agreement, which is a collective agreement between the Fund and certain other funds managed by the Investment Manager, severally and not jointly, permits collective borrowings up to $550 million. Interest is charged to each participating fund based on its borrowings at a rate equal to the higher of (i) the overnight federal funds rate plus 1.00% or (ii) the one-month LIBOR rate plus 1.00%. Each borrowing under the credit facility matures no later than 60 days after the date of borrowing. The Fund also pays a commitment fee equal to its pro rata share of the amount of the credit facility at a rate of 0.075% per annum. The commitment fee is included in other expenses
Annual Report 2015
39
COLUMBIA MID CAP VALUE FUND
NOTES TO FINANCIAL STATEMENTS (continued)
February 28, 2015
in the Statement of Operations. Prior to the December 9, 2014 amendment, the credit facility agreement permitted borrowings up to $500 million under the same terms and interest rates as described above.
The Fund had no borrowings during the year ended February 28, 2015.
Note 9. Significant Risks
Financial Sector Risk
Sector risk occurs when a fund invests a significant portion of its assets in securities of companies conducting business in a related group of industries within an economic sector. Companies in the same economic sector may be similarly affected by economic, regulatory, political or market events or conditions, making a fund more vulnerable to unfavorable developments in that economic sector than funds that invest more broadly. The Fund may be more susceptible to the particular risks that may affect companies in the financial sector than if it were invested in a wider variety of companies in unrelated sectors.
Note 10. Subsequent Events
Management has evaluated the events and transactions that have occurred through the date the financial statements were issued and noted no items requiring adjustment of the financial statements or additional disclosure.
Note 11. Information Regarding Pending and Settled Legal Proceedings
In December 2005, without admitting or denying the allegations, American Express Financial Corporation (AEFC, which is now known as Ameriprise Financial, Inc. (Ameriprise Financial)) entered into settlement agreements with the Securities and Exchange Commission (SEC) and Minnesota Department of Commerce (MDOC) related to market timing activities. As a result, AEFC was censured and ordered to cease and desist from committing or causing any violations of certain provisions of the Investment Advisers Act of 1940, the Investment Company Act of 1940, and various Minnesota laws. AEFC agreed to pay disgorgement of $10 million and civil money penalties of $7 million. AEFC also agreed to retain an independent distribution consultant to assist in developing a plan for distribution of all disgorgement and civil penalties ordered by the SEC in accordance with various undertakings detailed at www.sec.gov/litigation/admin/ia-2451.pdf. Ameriprise Financial and its affiliates have cooperated with the SEC
and the MDOC in these legal proceedings, and have made regular reports to the Funds' Boards of Trustees.
Ameriprise Financial and certain of its affiliates have historically been involved in a number of legal, arbitration and regulatory proceedings, including routine litigation, class actions, and governmental actions, concerning matters arising in connection with the conduct of their business activities. Ameriprise Financial believes that the Funds are not currently the subject of, and that neither Ameriprise Financial nor any of its affiliates are the subject of, any pending legal, arbitration or regulatory proceedings that are likely to have a material adverse effect on the Funds or the ability of Ameriprise Financial or its affiliates to perform under their contracts with the Funds. Ameriprise Financial is required to make quarterly (10-Q), annual (10-K) and, as necessary, 8-K filings with the Securities and Exchange Commission on legal and regulatory matters that relate to Ameriprise Financial and its affiliates. Copies of these filings may be obtained by accessing the SEC website at www.sec.gov.
There can be no assurance that these matters, or the adverse publicity associated with them, will not result in increased fund redemptions, reduced sale of fund shares or other adverse consequences to the Funds. Further, although we believe proceedings are not likely to have a material adverse effect on the Funds or the ability of Ameriprise Financial or its affiliates to perform under their contracts with the Funds, these proceedings are subject to uncertainties and, as such, we are unable to estimate the possible loss or range of loss that may result. An adverse outcome in one or more of these proceedings could result in adverse judgments, settlements, fines, penalties or other relief that could have a material adverse effect on the consolidated financial condition or results of operations of Ameriprise Financial.
Annual Report 2015
40
COLUMBIA MID CAP VALUE FUND
REPORT OF INDEPENDENT REGISTERED PUBLIC ACCOUNTING FIRM
To the Trustees of Columbia Funds Series Trust and the Shareholders of
Columbia Mid Cap Value Fund
In our opinion, the accompanying statement of assets and liabilities, including the portfolio of investments, and the related statements of operations and of changes in net assets and the financial highlights present fairly, in all material respects, the financial position of Columbia Mid Cap Value Fund (the "Fund", a series of Columbia Funds Series Trust) at February 28, 2015, and the results of its operations, the changes in its net assets and the financial highlights for each of the periods indicated, in conformity with accounting principles generally accepted in the United States of America. These financial statements and financial highlights (hereafter referred to as "financial statements") are the responsibility of the Fund's management; our responsibility is to express an opinion on these financial statements based on our audits. We conducted our audits of these financial statements in accordance with the standards of the Public Company Accounting Oversight Board (United States). Those standards require that we plan and perform the audit to obtain reasonable assurance about whether the financial statements are free of material misstatement. An audit includes examining, on a test basis, evidence supporting the amounts and disclosures in the financial statements, assessing the accounting principles used and significant estimates made by management, and evaluating the overall financial statement presentation. We believe that our audits, which included confirmation of securities at February 28, 2015 by correspondence with the custodian, brokers and transfer agent, provide a reasonable basis for our opinion.
PricewaterhouseCoopers LLP
Minneapolis, Minnesota
April 21, 2015
Annual Report 2015
41
COLUMBIA MID CAP VALUE FUND
FEDERAL INCOME TAX INFORMATION
(Unaudited)
The Fund hereby designates the following tax attributes for the fiscal year ended February 28, 2015. Shareholders will be notified in early 2016 of the amounts for use in preparing 2015 income tax returns.
Tax Designations:
| Qualified Dividend Income | | | 57.68 | % | |
| Dividends Received Deduction | | | 55.94 | % | |
Capital Gain Dividend | | $ | 436,181,300 | | |
Qualified Dividend Income. For taxable, non-corporate shareholders, the percentage of ordinary income distributed during the fiscal year that represents qualified dividend income subject to reduced tax rates.
Dividends Received Deduction. The percentage of ordinary income distributed during the fiscal year that qualifies for the corporate dividends received deduction.
Capital Gain Dividend. The Fund designates as a capital gain dividend the amount reflected above, or if subsequently determined to be different, the net capital gain of such fiscal period.
Annual Report 2015
42
COLUMBIA MID CAP VALUE FUND
Shareholders elect the Board that oversees the Funds' operations. The Board appoints officers who are responsible for day-to-day business decisions based on policies set by the Board. The following table provides basic biographical information about the Funds' Board members, including their principal occupations during the past five years, although specific titles for individuals may have varied over the period. Under current Board policy, members may serve through the end of the calendar year in which he or she reaches either the mandatory retirement age established by the Board or the fifteenth anniversary of the first Board meeting they attended as a member of the Board.
Independent Trustees
Name,
Address,
Year of Birth | | Position Held With
Funds and Length of
Service | | Principal Occupation(s)
During Past Five Years
and Other Relevant
Professional Experience | | Number of
Funds in the
Fund Family
Overseen by
Board Member | | Other Present or Past
Directorships/
Trusteeships
(Within Past 5 Years) | |
Kathleen Blatz
901 S. Marquette Ave.
Minneapolis, MN 55402
1954 | | Board member since 1/06 for RiverSource Funds and since 6/11 for Nations Funds | | Attorney; specializing in arbitration and mediation; Chief Justice, Minnesota Supreme Court, 1998-2006; Associate Justice, Minnesota Supreme Court, 1996-1998; Fourth Judicial District Court Judge, Hennepin Country, 1994-1996; Attorney in private practice and public service, 1984-1993; State Representative, Minnesota House of Representatives, 1979-1993, which included service on the Tax and Financial Institutions and Insurance Committees | | | 127 | | | Trustee, BlueCross BlueShield of Minnesota (Chair of the Business Development Committee) since 2009; Chair of the Robina Foundation since August 2013 | |
Edward J. Boudreau, Jr.
901 S. Marquette Ave.
Minneapolis, MN 55402
1944 | | Board member since 6/11 for RiverSource Funds and since 1/05 for Nations Funds | | Managing Director, E.J. Boudreau & Associates (consulting) since 2000; FINRA Industry Arbitrator, 2002-present; Chairman and Chief Executive Officer, John Hancock Funds (asset management), Chairman and Interested Trustee for open-end and closed-end funds offered by John Hancock, 1989-2000; John Hancock Life Insurance Company, including SVP and Treasurer and SVP Information Technology, 1968-1988 | | | 125 | | | Former Trustee, BofA Funds Series Trust (11 funds), 2005-2011; Trustee, Boston Museum of Science (Chair of Finance Committee), 1985-2013 | |
Pamela G. Carlton
901 S. Marquette Ave.
Minneapolis, MN 55402
1954 | | Board member since 7/07 for RiverSource Funds and since 6/11 for Nations Funds | | President, Springboard — Partners in Cross Cultural Leadership (consulting company) since 2003; Managing Director of US Equity Research, JP Morgan Chase, 1999-2003; Director of US Equity Research, Chase Asset Management, 1996- 1999; Co-Director Latin America Research, 1993-1996, COO Global Research, 1992-1996, Co-Director of US Research, 1991-1992, Investment Banker, Morgan Stanley, 1982-1991 | | | 127 | | | None | |
Annual Report 2015
43
COLUMBIA MID CAP VALUE FUND
TRUSTEES AND OFFICERS (continued)
Independent Trustees (continued)
Name,
Address,
Year of Birth | | Position Held With
Funds and Length of
Service | | Principal Occupation(s)
During Past Five Years
and Other Relevant
Professional Experience | | Number of
Funds in the
Fund Family
Overseen by
Board Member | | Other Present or Past
Directorships/
Trusteeships
(Within Past 5 Years) | |
William P. Carmichael
901 S. Marquette Ave.
Minneapolis, MN 55402
1943 | | Chair of the Board since 1/14, Board member since 6/11 for RiverSource Funds and since 2003 for Nations Funds | | Retired; Co-founder, The Succession Fund (provides exit strategies to owners of privately held companies) 1998-2007; Adjunct Professor of Finances, Kelley School of Business, Indiana University, 1993-2007; Senior Vice President, Sara Lee Corporation, 1991-1993; Senior Vice President and Chief Financial Officer, Beatrice Foods Company, 1984-1990; Vice President, Esmark, Inc, 1973-1984.; Associate, Price Waterhouse, 1968-1972 | | | 127 | | | Director, Cobra Electronics Corporation (electronic equipment manufacturer), 1994-August 2014; The Finish Line (athletic shoes and apparel) since July 2003; Director, International Textile Corp. since 2012; former Director, McMoRan Exploration Company (oil and gas exploration and development) 2010-2013; former Trustee, BofA Funds Series Trust (11 funds) 2009-2011; Director, Spectrum Brands, Inc. (consumer products), 2002-2009; Director, Simmons Company (bedding), 2004-2010 | |
Patricia M. Flynn
901 S. Marquette Ave.
Minneapolis, MN 55402
1950 | | Board member since 11/04 for RiverSource Funds and since 6/11 for Nations Funds | | Trustee Professor of Economics and Management, Bentley University since 1976 (also teaches and conducts research on corporate governance); Dean, McCallum Graduate School of Business, Bentley University, 1992-2002 | | | 127 | | | Trustee, MA Taxpayers Foundation since 1997; Board of Governors, Innovation Institute, MA Technology Collaborative since 2010 | |
William A. Hawkins
901 S. Marquette Ave.
Minneapolis, MN 55402
1942 | | Board member since 6/11 for RiverSource Funds and since 1/05 for Nations Funds | | Managing Director, Overton Partners (financial consulting), since August 2010; President and Chief Executive Officer, California General Bank, N.A., January 2008-August 2010; Operation Hope, COO, 2004-2007; IndyMac Bancorp, President, CBG, 1999-2003; American General Bank, President, 1997-1999; Griffin Financial Services, CEO, 1981-1997; The Griffin Funds, CEO, 1992-1998 | | | 125 | | | Trustee, BofA Funds Series Trust (11 funds) | |
R. Glenn Hilliard
901 S. Marquette Ave.
Minneapolis, MN 55402
1943 | | Board member since 6/11 for RiverSource Funds and since 1/05 for Nations Funds | | Chairman and Chief Executive Officer, Hilliard Group LLC (investing and consulting) since April 2003; Non-Executive Director & Chairman, CNO Financial Group, Inc. (insurance), September 2003-May 2011 | | | 125 | | | Chairman, BofA Funds Series Trust (11 funds); former Director, CNO Financial Group, Inc. (insurance) 2003-2011 | |
Annual Report 2015
44
COLUMBIA MID CAP VALUE FUND
TRUSTEES AND OFFICERS (continued)
Independent Trustees (continued)
Name,
Address,
Year of Birth | | Position Held With
Funds and Length of
Service | | Principal Occupation(s)
During Past Five Years
and Other Relevant
Professional Experience | | Number of
Funds in the
Fund Family
Overseen by
Board Member | | Other Present or Past
Directorships/
Trusteeships
(Within Past 5 Years) | |
Catherine James Paglia
901 S. Marquette Ave.
Minneapolis, MN 55402
1952 | | Board member since 11/04 for RiverSource Funds and since 6/11 for Nations Funds | | Director, Enterprise Asset Management, Inc. (private real estate and asset management company) since September 1998; Managing Director and Partner, Interlaken Capital, Inc., 1989-1997; Managing Director, Morgan Stanley, 1982-1989; Vice President, Investment Banking, 1980-1982, Associate, Investment Banking, 1976-1980, Dean Witter Reynolds, Inc. | | | 127 | | | Director, Valmont Industries, Inc. (irrigation systems manufacturer) since 2012; Trustee, Carleton College (on the Investment Committee); Trustee, Carnegie Endowment for International Peace (on the Investment Committee) | |
Leroy C. Richie
901 S. Marquette Ave.
Minneapolis, MN 55402
1941 | | Board member since 2000 for Seligman Funds, since 11/08 for RiverSource Funds and since 6/11 for Nations Funds | | Counsel, Lewis & Munday, P.C. (law firm) since 2004; Vice President and General Counsel, Automotive Legal Affairs, Chrysler Corporation, 1993-1997 | | | 127 | | | Lead Outside Director, Digital Ally, Inc. (digital imaging) since September 2005; Director, Infinity, Inc. (oil and gas exploration and production) since 1994; Director, OGE Energy Corp. (energy and energy services) since November 2007-2014 | |
Minor M. Shaw
901 S. Marquette Ave.
Minneapolis, MN 55402
1947 | | Board member since 6/11 for RiverSource Funds and since 2003 for Nations Funds | | President, Micco LLC (private investments) since 2011; President, Micco Corp. (family investment business) 1998-2011 | | | 125 | | | Director, Piedmont Natural Gas; Director, BlueCross BlueShield of South Carolina since April 2008; Chair of the Duke Endowment; Director, National Association of Corporate Directors, Carolinas Chapter, since 2013; Chair of Greenville-Spartanburg Airport Commission; former Trustee, BofA Funds Series Trust (11 funds), 2003-2011 | |
Alison Taunton-Rigby
901 S. Marquette Ave.
Minneapolis, MN 55402
1944 | | Board member since 11/02 for RiverSource Funds and since 6/11 for Nations Funds | | Managing Director, Forester Biotech (consulting) since 2001; Chief Executive Officer and Director, RiboNovix, Inc., (biotechnology) 2003-2010; President and Chief Executive Officer of CMT Inc., 2001-2003; Aquila Biopharmaceuticals Inc., 1996-2000; Cambridge Biotech Corporation, 1995-1996, Mitotix Inc., 1993-1994 | | | 127 | | | Director, Healthways, Inc. (health and well-being solutions) since 2005; Director, ICI Mutual Insurance Company, RRG since 2011; Director, Abt Associates (government contractor) since 2001; Director, Boston Children's Hospital since 2002 | |
Annual Report 2015
45
COLUMBIA MID CAP VALUE FUND
TRUSTEES AND OFFICERS (continued)
Interested Trustee Not Affiliated with Investment Manager*
Name,
Address,
Year of Birth | | Position Held With
Funds and Length of
Service | | Principal Occupation
During Past Five Years | | Number of
Funds in the
Fund Family
Overseen by
Board Member | | Other Present or Past
Directorships/
Trusteeships
(Within Past 5 Years) | |
Anthony M. Santomero
901 S. Marquette Ave.
Minneapolis, MN 55402
1946 | | Board member since 6/11 for RiverSource Funds and since 1/08 for Nations Funds | | Richard K. Mellon Professor Emeritus of Finance, The Wharton School, University of Pennsylvania, since 2002; Senior Advisor, McKinsey & Company (consulting), 2006-2008; President, Federal Reserve Bank of Philadelphia, 2000-2006, Professor of Finance, The Wharton School, University of Pennsylvania, 1972-2002 | | | 125 | | | Director, Renaissance Reinsurance Ltd. since May 2008; Trustee, Penn Mutual Life Insurance Company since March 2008; Director, Citigroup Inc. since 2009; Director, Citibank, N.A. since 2009; former Trustee, BofA Funds Series Trust (11 funds), 2008-2011 | |
* Dr. Santomero is not an affiliated person of the Investment Manager or Ameriprise Financial. However, he is currently deemed by the Funds to be an "interested person" (as defined in the 1940 Act) of the Funds because he serves as a Director of Citigroup Inc. and Citibank, N.A., companies that may directly or through subsidiaries and affiliates engage from time-to-time in brokerage execution, principal transactions and lending relationships with the Funds or accounts advised/managed by the Investment Manager.
Annual Report 2015
46
COLUMBIA MID CAP VALUE FUND
TRUSTEES AND OFFICERS (continued)
Interested Trustee Affiliated with Investment Manager*
Name,
Address,
Year of Birth | | Position Held With
Funds and Length of
Service | | Principal Occupation
During Past Five Years | | Number of
Funds in the
Fund Family
Overseen by
Board Member | | Other Present or Past
Directorships/
Trusteeships
(Within Past 5 Years) | |
William F. Truscott
53600 Ameriprise
Financial Center
Minneapolis, MN 55474
1960 | | Board member since 11/01 for RiverSource Funds and since 6/11 for Nations Funds; Senior Vice President since 2002 for RiverSource Funds and since 5/10 for Nations Funds | | Chairman of the Board and President, Columbia Management Investment Advisers, LLC since May 2010 and February 2012, respectively (previously President and Chief Investment Officer, 2001-April 2010); Chief Executive Officer, Global Asset Management, Ameriprise Financial, Inc. since September 2012 (previously Chief Executive Officer, U.S. Asset Management & President, Annuities, May 2010-September 2012 and President — U.S. Asset Management and Chief Investment Officer, 2005-April 2010); Director and Chief Executive Officer, Columbia Management Investment Distributors, Inc. since May 2010 and February 2012, respectively (previously Chairman of the Board and Chief Executive Officer, 2006-April 2010); Chairman of the Board and Chief Executive Officer, RiverSource Distributors, Inc. since 2006; Director, Threadneedle Asset Management Holdings, SARL since 2014; President and Chief Executive Officer, Ameriprise Certificate Company, 2006-August 2012 | | | 186 | | | Former Director, Ameriprise Certificate Company, 2006-January 2013 | |
* Interested person (as defined under the 1940 Act) by reason of being an officer, director, security holder and/or employee of the Investment Manager or Ameriprise Financial.
The Statement of Additional Information has additional information about the Fund's Board members and is available, without charge, upon request by calling 800.345.6611; contacting your financial intermediary or visiting columbiathreadneedle.com/us.
Annual Report 2015
47
COLUMBIA MID CAP VALUE FUND
TRUSTEES AND OFFICERS (continued)
The Board has appointed officers who are responsible for day-to-day business decisions based on policies it has established. The officers serve at the pleasure of the Board. In addition to Mr. Truscott, who is Senior Vice President, the Funds' other officers are:
Fund Officers
Name,
Address and
Year of Birth | | Position and Year
First Appointed to
Position for any Fund
in the Columbia
Funds Complex or a
Predecessor Thereof | | Principal Occupation(s) During Past Five Years | |
Christopher O. Petersen
5228 Ameriprise
Financial Center
Minneapolis, MN 55474
Born 1970 | | President and Principal Executive Officer (2015) | | Vice President and Lead Chief Counsel, Ameriprise Financial, Inc. since January 2015 (previously, Vice President and Chief Counsel January 2010-December 2014; and Vice President and Group Counsel or Counsel 2004-January 2010); officer of Columbia Funds and affiliated funds since 2007. | |
Michael G. Clarke
225 Franklin Street
Boston, MA 02110
Born 1969 | | Treasurer (2011) and Chief Financial Officer (2009) | | Vice President — Mutual Fund Administration, Columbia Management Investment Advisers, LLC, since May 2010; Managing Director of Fund Administration, Columbia Management Advisors, LLC, September 2004-April 2010; senior officer of Columbia Funds and affiliated funds since 2002. | |
Paul B. Goucher
100 Park Avenue
New York, NY 10017
Born 1968 | | Senior Vice President (2011), Chief Legal Officer (2015) and Assistant Secretary (2008) | | Vice President and Lead Chief Counsel, Ameriprise Financial, Inc. since November 2008 and January 2013, respectively (previously Chief Counsel, January 2010-January 2013 and Group Counsel, November 2008-January 2010). | |
Thomas P. McGuire
225 Franklin Street
Boston, MA 02110
Born 1972 | | Vice President and Chief Compliance Officer (2012) | | Vice President — Asset Management Compliance, Ameriprise Financial, Inc., since May 2010; Chief Compliance Officer, Ameriprise Certificate Company since September 2010; Compliance Executive, Bank of America, 2005-April 2010. | |
Colin Moore
225 Franklin Street
Boston, MA 02110
Born 1958 | | Senior Vice President (2010) | | Executive Vice President and Global Chief Investment Officer, Ameriprise Financial, Inc., since July 2013; Director and Global Chief Investment Officer, Columbia Management Investment Advisers, LLC since May 2010; Manager, Managing Director and Chief Investment Officer, Columbia Management Advisors, LLC, 2007-April 2010. | |
Michael E. DeFao
225 Franklin Street
Boston, MA 02110
Born 1968 | | Vice President (2011) and Assistant Secretary (2010) | | Vice President and Chief Counsel, Ameriprise Financial, Inc. since May 2010; Associate General Counsel, Bank of America, 2005-April 2010. | |
Joseph F. DiMaria
225 Franklin Street
Boston, MA 02110
Born 1968 | | Vice President (2011), Assistant Treasurer (2012) and Chief Accounting Officer (2008) | | Vice President — Mutual Fund Treasurer, Columbia Management Investment Advisers, LLC since May 2010; Director of Fund Administration, Columbia Management Advisors, LLC, 2006-April 2010. | |
Amy Johnson
5228 Ameriprise
Financial Center
Minneapolis, MN 55474
Born 1965 | | Vice President (2006) | | Managing Director and Chief Operating Officer, Columbia Management Investment Advisers, LLC since May 2010 (previously Chief Administrative Officer, 2009-April 2010, and Vice President — Asset Management and Trust Company Services, 2006-2009). | |
Lyn Kephart-Strong
5228 Ameriprise
Financial Center
Minneapolis, MN 55474
Born 1960 | | Vice President (2015) | | President, Columbia Management Investment Services Corp. since October 2014; Vice President & Resolution Officer, Ameriprise Trust Company since August 2009; President, RiverSource Service Corporation 2004-2010. | |
Ryan C. Larrenaga
225 Franklin Street
Boston, MA 02110
Born 1970 | | Vice President and Secretary (2015) | | Vice President and Group Counsel, Ameriprise Financial, Inc. since August 2011 (previously, Counsel from May 2010 to August 2011); Assistant General Counsel, Bank of America, 2005-April 2010; officer of Columbia Funds and affiliated funds since 2005. | |
Annual Report 2015
48
COLUMBIA MID CAP VALUE FUND
IMPORTANT INFORMATION ABOUT THIS REPORT
Each fund mails one shareholder report to each shareholder address. If you would like more than one report, please call shareholder services at 800.345.6611 and additional reports will be sent to you.
The policy of the Board is to vote the proxies of the companies in which each fund holds investments consistent with the procedures as stated in the Statement of Additional Information (SAI). You may obtain a copy of the SAI without charge by calling 800.345.6611; contacting your financial intermediary; visiting columbiathreadneedle.com/us; or searching the website of the Securities and Exchange Commission (SEC) at sec.gov. Information regarding how each fund voted proxies relating to portfolio securities is filed with the SEC by August 31st for the most recent 12-month period ending June 30th of that year, and is available without charge by visiting columbiathreadneedle.com/us; or searching the website of the SEC at sec.gov.
Each fund files a complete schedule of portfolio holdings with the SEC for the first and third quarters of each fiscal year on Form N-Q. Each fund's Form N-Q is available on the SEC's website at sec.gov and may be reviewed and copied at the SEC's Public Reference Room in Washington, D.C. Information on the operation of the Public Reference Room may be obtained by calling 800.SEC.0330. Each fund's complete schedule of portfolio holdings, as filed on Form N-Q, can also be obtained without charge, upon request, by calling 800.345.6611.
Annual Report 2015
49
Columbia Mid Cap Value Fund
P.O. Box 8081
Boston, MA 02266-8081

This information is for use with concurrent or prior delivery of a fund prospectus. Please read and consider the investment objectives, risks, charges and expenses for any fund carefully before investing. For a prospectus and summary prospectus, which contains this and other important information about the Fund, go to columbiathreadneedle.com/us. The Fund is distributed by Columbia Management Investment Distributors, Inc., member FINRA, and managed by Columbia Management Investment Advisers, LLC.
Columbia Threadneedle Investments (Columbia Threadneedle) is the global brand name of the Columbia and Threadneedle group of companies.
All rights reserved. Columbia Management Investment Distributors, Inc., 225 Franklin Street, Boston, MA 02110-2804
© 2015 Columbia Management Investment Advisers, LLC.
columbiathreadneedle.com/us
ANN197_02_E01_(04/15)

ANNUAL REPORT
February 28, 2015

COLUMBIA MID CAP INDEX FUND

ABOUT COLUMBIA THREADNEEDLE INVESTMENTS
Columbia Threadneedle Investments is a leading global asset management group that provides a broad range of actively managed investment strategies and solutions for individual, institutional and corporate clients around the world.
With more than 2,000 people, including over 450 investment professionals based in North America, Europe and Asia, we manage $506 billion* of assets across developed and emerging market equities, fixed income, asset allocation solutions and alternatives. We are the 11th largest manager of long-term mutual fund assets in the U.S.** and the 5th largest manager of retail funds in the U.K.***
Our priority is the investment success of our clients. We aim to deliver the investment outcomes they expect through an investment approach that is team-based, performance-driven and risk-aware. Our culture is dynamic and interactive. By sharing our insights across asset classes and geographies, we generate richer perspectives on global, regional and local investment landscapes. The ability to exchange and debate investment ideas in a collaborative environment enriches our teams' investment processes. More importantly, it results in better informed investment decisions for our clients.
Columbia funds are distributed by Columbia Management Investment Distributors, Inc., member FINRA, and managed by Columbia Management Investment Advisers, LLC.
Columbia Threadneedle Investments (Columbia Threadneedle) is the global brand name of the Columbia and Threadneedle group of companies.
* In U.S. dollars as of December 31, 2014. Source: Ameriprise Q4 Earnings Release. Includes all assets managed by entities in the Columbia and Threadneedle groups of companies. Contact us for more current data.
** Source: ICI as of December 31, 2014 for Columbia Management Investment Advisers, LLC.
*** Source: Investment Association as of December 2014 for Threadneedle Asset Management Limited.
© 2015 Columbia Management Investment Advisers, LLC. All rights reserved.
Not part of the shareholder report
Get the market insight you need from our investment experts
Connect with Columbia Threadneedle Investments
Investor insight
Find economic and market commentary, investment videos, white papers, mutual fund commentary and more at columbiathreadneedle.com/us.
Columbia Threadneedle Investor Newsletter (e-newsletter)
Read our award-winning* shareholder newsletter. Our quarterly newsletter is available online and provides timely and relevant content about economic trends, fund news, service enhancements and changes. Sign up to receive the newsletter electronically at columbiathreadneedle.com/
us/newsletter.
Investment videos
Get analysis of current events and trends that may affect your investments. Visit our online video library to watch and discover what our thought leaders are saying about the financial markets and economy.
Social media
We offer you multiple ways to access our market commentary and investment insights.
n Perspectives blog at columbiathreadneedle.com/us
Read timely posts by our investment team, including our chief investment officer, chief economist and portfolio managers.
n twitter.com/CTinvest_US
Follow us on Twitter for quick, up-to-the-minute comments on market news and more.
n youtube.com/CTinvestUS
View our commentaries on the economy, markets and current investment opportunities.
n linkedin.com/company/columbia-threadneedle-investments-us
Connect with us on LinkedIn for updates from our thought leaders.
*Columbia Threadneedle Investor Newsletter was awarded top honors in the Mutual Fund Education Alliance STAR Awards competition for excellence in mutual fund marketing and communications in 2011, 2012 and 2013. Materials in the competition were evaluated on educational value, message comprehension, effective design and objectives.
Not part of the shareholder report
Stay informed
Become a subscriber to receive the latest investment publications and mutual fund commentaries
Subscribe to Columbia Threadneedle Investments
Email subscription center
Subscribe to the latest information from Columbia Threadneedle. Visit our email subscription center at columbiathreadneedle.com/us/subscribe to register for economic and market commentary, product and service updates, white papers and more.
n Columbia Threadneedle Investor Newsletter
Quarterly newsletter featuring the latest macro- and micro-economic trends, investment themes, products, service changes and other items of interest to our investors
n Investment Strategy Outlook
Quarterly publication featuring the Columbia Threadneedle Asset Allocation Team's perspective on global economic investment conditions and markets
n MarketTrack
Quarterly publication featuring more than 40 charts and graphs that highlight the current state of the economy and the markets; includes straightforward insight on current investment opportunities
n White papers
Frequent articles that delve deep into a variety of investment topics
n Mutual fund updates
Quarterly portfolio manager commentary and fund fact sheets available for Columbia funds. (Not all funds have a commentary.)
Register your information online at columbiathreadneedle.com/us/subscribe and select the publications you would like to receive. Update your subscriptions at any time by accessing the email subscription center.
CT-MK (03/15) 5383/1125800
 Dear Shareholder,
In a world that is changing faster than ever before, investors want asset managers who offer a global perspective while generating strong and sustainable returns. To that end, Columbia Management, in conjunction with its U.K.-based affiliate, Threadneedle Investments, has rebranded to Columbia Threadneedle Investments. The new global brand represents the combined capabilities, resources and reach of the global group, offering investors access to the best of both firms.
With a presence in 18 countries and more than 450 investment professionals*, our collective perspective and world view as Columbia Threadneedle Investments gives us deeper insight into what might affect the real-life financial outcomes clients are seeking. Putting our views into a global context enables us to build richer perspectives and create the right solutions, and provides us with enhanced capabilities to deliver consistent investment performance, which may ultimately lead to better investor outcomes.
As a result of the rebrand, you will begin to see our new logo and colors reflected in printed materials, such as this shareholder report, as well as on our new website — columbiathreadneedle.com/us. We encourage you to visit us online and view a new video on the "About Us" tab that speaks to the strength of the firm.
While we are introducing a new brand, in many ways, the investment company you know well has not changed. The following remain in effect:
n Fund and strategy names
n Established investment teams, philosophies and processes
n Account services, features, servicing phone numbers and mailing addresses
n Columbia Management Investment Distributors as distributor and Columbia Management Investment Advisers as investment adviser
We recognize that the money we manage represents the hard work and savings of people like you, and that everyone has different ambitions and different definitions of success. Investors have varying goals — funding their children's education, enjoying their retirement, putting money aside for unexpected events, and more. Whatever your ambitions, we believe our wide range of investment products and solutions can help give you confidence that you will reach your goals.
The world is constantly changing, but our priority remains the same: to help you secure your finances, meet your goals and achieve success. Thank you for your continued investment with us. Our service representatives are available at 800.345.6611 to help with any questions.
Sincerely,

Christopher O. Petersen
President, Columbia Funds
Investors should consider the investment objectives, risks, charges and expenses of a mutual fund carefully before investing. For a free prospectus and summary prospectus, which contains this and other important information about a fund, visit columbiathreadneedle.com/us. The prospectus should be read carefully before investing.
* Source: Ameriprise as of December 1, 2014
Columbia Funds are distributed by Columbia Management Investment Distributors, Inc., member FINRA, and managed by Columbia Management Investment Advisers, LLC.
© 2015 Columbia Management Investment Advisers, LLC. All rights reserved.
COLUMBIA MID CAP INDEX FUND
Fund Investment Manager
Columbia Management Investment
Advisers, LLC
225 Franklin Street
Boston, MA 02110
Fund Distributor
Columbia Management Investment
Distributors, Inc.
225 Franklin Street
Boston, MA 02110
Fund Transfer Agent
Columbia Management Investment
Services Corp.
P.O. Box 8081
Boston, MA 02266-8081
For more information about any of the funds, please visit columbiathreadneedle.com/us or call 800.345.6611. Customer Service Representatives are available to answer your questions Monday through Friday from 8 a.m. to 7 p.m. Eastern time.
The views expressed in this report reflect the current views of the respective parties. These views are not guarantees of future performance and involve certain risks, uncertainties and assumptions that are difficult to predict, so actual outcomes and results may differ significantly from the views expressed. These views are subject to change at any time based upon economic, market or other conditions and the respective parties disclaim any responsibility to update such views. These views may not be relied on as investment advice and, because investment decisions for a Columbia fund are based on numerous factors, may not be relied on as an indication of trading intent on behalf of any particular Columbia fund. References to specific securities should not be construed as a recommendation or investment advice.
Performance Overview | | | 3 | | |
Manager Discussion of Fund Performance | | | 5 | | |
Understanding Your Fund's Expenses | | | 7 | | |
Portfolio of Investments | | | 8 | | |
Statement of Assets and Liabilities | | | 18 | | |
Statement of Operations | | | 20 | | |
Statement of Changes in Net Assets | | | 21 | | |
Financial Highlights | | | 23 | | |
Notes to Financial Statements | | | 27 | | |
Report of Independent Registered
Public Accounting Firm | | | 35 | | |
Federal Income Tax Information | | | 36 | | |
Trustees and Officers | | | 37 | | |
Important Information About This Report | | | 43 | | |
COLUMBIA MID CAP INDEX FUND
Performance Summary
n Columbia Mid Cap Index Fund (the Fund) Class A shares returned 10.58% for the 12-month period that ended February 28, 2015.
n The Fund underperformed its benchmark, the unmanaged S&P MidCap 400 Index, which returned 11.14% for the same period.
n Mutual funds, unlike unmanaged indices, incur operating expenses, which accounted for the Fund's underperformance relative to the benchmark.
Average Annual Total Returns (%) (for period ended February 28, 2015)
| | | Inception | | 1 Year | | 5 Years | | 10 Years | |
Class A | | 05/31/00 | | | 10.58 | | | | 16.49 | | | | 9.64 | | |
Class I* | | 09/27/10 | | | 11.00 | | | | 16.82 | | | | 9.94 | | |
Class R5* | | 11/08/12 | | | 10.92 | | | | 16.81 | | | | 9.94 | | |
Class Z | | 03/31/00 | | | 10.95 | | | | 16.79 | | | | 9.93 | | |
S&P MidCap 400 Index | | | | | | | 11.14 | | | | 17.02 | | | | 10.05 | | |
All results shown assume reinvestment of distributions during the period. Returns do not reflect the deduction of taxes that a shareholder may pay on Fund distributions or on the redemption of Fund shares. Performance results reflect the effect of any fee waivers or reimbursements of Fund expenses by Columbia Management Investment Advisers, LLC and/or any of its affiliates. Absent these fee waivers or expense reimbursement arrangements, performance results would have been lower.
The performance information shown represents past performance and is not a guarantee of future results. The investment return and principal value of your investment will fluctuate so that your shares, when redeemed, may be worth more or less than their original cost. Current performance may be lower or higher than the performance information shown. You may obtain performance information current to the most recent month-end by contacting your financial intermediary, visiting columbiathreadneedle.com/us or calling 800.345.6611.
*The returns shown for periods prior to the share class inception date (including returns for the Life of the Fund, if shown, which are since Fund inception) include the returns of the Fund's oldest share class. These returns are adjusted to reflect any higher class-related operating expenses of the newer share classes, as applicable. Please visit columbiathreadneedle.com/us/investment-products/mutual-funds/appended-performance for more information.
The S&P MidCap 400 Index is a market-value weighted index that tracks the performance of 400 mid-cap U.S. companies.
Indices are not available for investment, are not professionally managed and do not reflect sales charges, fees, brokerage commissions, taxes or other expenses of investing. Securities in the Fund may not match those in an index.
Annual Report 2015
3
COLUMBIA MID CAP INDEX FUND
PERFORMANCE OVERVIEW (continued)
Performance of a Hypothetical $10,000 Investment (March 1, 2005 – February 28, 2015)
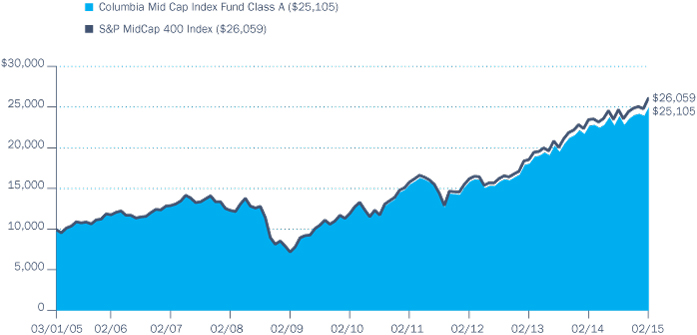
The chart above shows the change in value of a hypothetical $10,000 investment in Class A shares of Columbia Mid Cap Index Fund during the stated time period, and does not reflect the deduction of taxes that a shareholder may pay on Fund distributions or on the redemption of Fund shares.
Annual Report 2015
4
COLUMBIA MID CAP INDEX FUND
MANAGER DISCUSSION OF FUND PERFORMANCE
For the 12-month period that ended February 28, 2015, the Fund's Class A shares returned 10.58%. The Fund underperformed its benchmark, the unmanaged S&P MidCap 400 Index, which increased 11.14% for the same period. Mutual funds, unlike unmanaged indices, incur operating expenses, which accounted for the Fund's underperformance relative to the benchmark.
U.S. Equity Market Posted Strong Gains
The S&P MidCap 400 Index posted healthy double-digit gains during the annual period, achieving new highs and broad market participation, even as significant shifts were seen in the business world and wider society.
A torrent of corporate mergers helped drive stocks higher. Alibaba, the dominant Chinese online retailer, executed the largest Initial Public Offering ever in September 2014. A near halving in the price of crude oil during the annual period was bad news for many energy companies, but the decline in the cost of fuel was a boon for airlines. Volatility heightened in the second half of 2014 and into January 2015, as concerns about global economic growth, emerging markets' health, geopolitical tensions and plunging oil prices had investors on edge. A stronger U.S. dollar also led to many companies missing fourth quarter 2014 earnings or reducing forward estimates. After declining in January 2015, the S&P MidCap 400 Index again gained ground in February 2015. As the market moved higher, volatility moved lower, as concerns about Greece and Ukraine declined and corporate earnings improved. Still, for the annual period as a whole, investors generally rotated toward traditionally defensive sectors, such as consumer staples and healthcare, helped in part by the steady decline in long-term interest rates. More cyclical sectors, such as materials and industrials, were not in favor overall.
S&P MidCap 400 Index Enjoyed Broad-Based Gains
Nine of the ten sectors of the S&P MidCap 400 Index posted positive returns during the 12 months ended February 28, 2015, with energy being the sole sector posting negative returns. In terms of total return, telecommunication services, healthcare and consumer staples were the best relative performers. On the basis of impact, which takes weightings and total returns into account, financials, consumer discretionary and telecommunication services were the biggest contributors to the index's return. The top performing industries for the annual period were airlines, biotechnology, diversified telecommunication services, healthcare providers and services and internet and catalog retail.
Conversely, energy, materials and industrials, each traditionally considered a more cyclical sector, were the weakest sectors from a total return perspective. On the basis of impact, consumer staples, materials and industrials were the weakest. The worst performing industries for the annual period were technology hardware storage and peripherals, healthcare technology, marine, energy equipment and services, and oil gas and consumable fuels.
Top individual contributors within the S&P MidCap 400 Index included wireless semiconductor device manufacturer Skyworks Solutions, clothing manufacturer Hanesbrands, branded convenience food manufacturer
Portfolio Management
Christopher Lo, CFA*
Vadim Shteyn
*Effective December 3, 2014, Christopher Lo was added as a Portfolio Manager to the Fund.
Morningstar Style BoxTM

The Morningstar Style BoxTM is based on a fund's portfolio holdings. For equity funds, the vertical axis shows the market capitalization of the stocks owned, and the horizontal axis shows investment style (value, blend, or growth). Information shown is based on the most recent data provided by Morningstar.
© 2015 Morningstar, Inc. All rights reserved. The Morningstar information contained herein: (1) is proprietary to Morningstar and/or its content providers; (2) may not be copied or distributed; and (3) is not warranted to be accurate, complete or timely. Neither Morningstar nor its content providers are responsible for any damages or losses arising from any use of this information.
Top Ten Holdings (%)
(at February 28, 2015) | |
Skyworks Solutions, Inc. | | | 1.0 | | |
Hanesbrands, Inc. | | | 0.8 | | |
Equinix, Inc. | | | 0.7 | | |
SL Green Realty Corp. | | | 0.7 | | |
Henry Schein, Inc. | | | 0.7 | | |
Church & Dwight Co., Inc. | | | 0.7 | | |
Advance Auto Parts, Inc. | | | 0.7 | | |
Realty Income Corp. | | | 0.7 | | |
Qorvo, Inc. | | | 0.6 | | |
Salix Pharmaceuticals Ltd. | | | 0.6 | | |
Percentages indicated are based upon total investments (excluding Money Market Funds).
For further detail about these holdings, please refer to the section entitled "Portfolio of Investments."
Fund holdings are as of the date given, are subject to change at any time, and are not recommendations to buy or sell any security.
Annual Report 2015
5
COLUMBIA MID CAP INDEX FUND
MANAGER DISCUSSION OF FUND PERFORMANCE (continued)
Portfolio Breakdown (%)
(at February 28, 2015) | |
Common Stocks | | | 96.2 | | |
Consumer Discretionary | | | 13.4 | | |
Consumer Staples | | | 3.5 | | |
Energy | | | 3.9 | | |
Financials | | | 22.4 | | |
Health Care | | | 9.1 | | |
Industrials | | | 15.0 | | |
Information Technology | | | 17.3 | | |
Materials | | | 7.2 | | |
Telecommunication Services | | | 0.1 | | |
Utilities | | | 4.3 | | |
Money Market Funds | | | 3.8 | | |
Total | | | 100.0 | | |
Percentages indicated are based upon total investments. The Fund's portfolio composition is subject to change.
Investment Risks
Market risk may affect a single issuer, sector of the economy, industry or the market as a whole. Investments in mid-cap companies involve risks and volatility greater than investments in larger, more established companies. The Fund's net value will generally decline when the performance of its targeted index declines. Investing in derivatives is a specialized activity that involves special risks, which may result in significant losses. See the Fund's prospectus for more information on these and other risks.
Hillshire Brands, real estate investment trust SL Green Realty and healthcare management company Universal Health Services. Top detractors were diversified mining and natural resources company Cliffs Natural Resources, construction materials provider MDU Resources Group, semiconductor device manufacturer Cree, locations-based solutions provider Trimble Navigation and imaging systems manufacturer 3D Systems.
As always, each sector and stock in the S&P MidCap 400 Index was represented in the Fund with approximately the same weighting as in the index and therefore had a similar effect.
Index Additions and Deletions Drove Portfolio Changes
During the annual period, there were 51 additions and 51 deletions to the index and the Fund's portfolio. Among those stocks added to the index and Fund were Kate Spade, Cliffs Natural Resources, International Game Technology, Live Nation Entertainment, LaSalle Hotel Properties, United States Steel, Peabody Energy, Tanger Factory Outlet Centers, Tyler Technologies, TreeHouse Foods, Stifel Financial, Vista Outdoor and Teledyne Technologies.
Deletions included Keurig Green Mountain, Alpha Natural Resources, Under Armour, Bob Evans Farms, Cimarex Energy, Martin Marietta Materials, Hillshire Brands, Universal Health Services, Universal, Bally Technologies, RF Micro Devices, Astoria Financial and CARBO Ceramics.
Looking Ahead
We do not anticipate any changes in the portfolio beyond the customary quarterly rebalancings and stock substitutions we make to align the Fund with the S&P MidCap 400 Index.
From a broad perspective, the Federal Reserve has given strong signals that economic growth in the U.S. has reached self-sustaining momentum and no longer needs unconventional efforts to support the expansion. We believe several factors support this view. First, the rapid drop in oil prices may act as a significant short-term boost to global economic growth. Second, we believe consumer spending, which currently accounts for approximately 68% of U.S. gross domestic product, should remain relatively healthy, and, in our view, could even accelerate. Third, the economic expansion appears to be in a phase of higher capital expenditures, or capex. Investment-led expansions tend to last longer than those that are led by consumer spending. At the end of the annual period, capacity utilization, a capex leading indicator, was nearing the critical 80% level, which has historically meant demand is sufficiently high to warrant the expansion of capital investments. Further, prior underinvestment in fixed assets and the old age of those assets may suggest a sustained expansion in capex. As the Fund seeks to closely approximate the performance of the S&P MidCap 400 Index, we will continue to match its industry and risk characteristics by investing primarily in the securities that comprise the index.
Annual Report 2015
6
COLUMBIA MID CAP INDEX FUND
UNDERSTANDING YOUR FUND'S EXPENSES
(Unaudited)
As an investor, you incur two types of costs. There are transaction costs, which generally include sales charges on purchases and may include redemption fees. There are also ongoing costs, which generally include management fees, distribution and/or service fees, and other fund expenses. The following information is intended to help you understand your ongoing costs (in dollars) of investing in the Fund and to help you compare these costs with the ongoing costs of investing in other mutual funds.
Analyzing Your Fund's Expenses
To illustrate these ongoing costs, we have provided examples and calculated the expenses paid by investors in each share class of the Fund during the period. The actual and hypothetical information in the table is based on an initial investment of $1,000 at the beginning of the period indicated and held for the entire period. Expense information is calculated two ways and each method provides you with different information. The amount listed in the "Actual" column is calculated using the Fund's actual operating expenses and total return for the period. You may use the Actual information, together with the amount invested, to estimate the expenses that you paid over the period. Simply divide your account value by $1,000 (for example, an $8,600 account value divided by $1,000 = 8.6), then multiply the results by the expenses paid during the period under the "Actual" column. The amount listed in the "Hypothetical" column assumes a 5% annual rate of return before expenses (which is not the Fund's actual return) and then applies the Fund's actual expense ratio for the period to the hypothetical return. You should not use the hypothetical account values and expenses to estimate either your actual account balance at the end of the period or the expenses you paid during the period. See "Compare With Other Funds" below for details on how to use the hypothetical data.
Compare With Other Funds
Since all mutual funds are required to include the same hypothetical calculations about expenses in shareholder reports, you can use this information to compare the ongoing cost of investing in the Fund with other funds. To do so, compare the hypothetical example with the 5% hypothetical examples that appear in the shareholder reports of other funds. As you compare hypothetical examples of other funds, it is important to note that hypothetical examples are meant to highlight the ongoing costs of investing in a fund only and do not reflect any transaction costs, such as sales charges, or redemption or exchange fees. Therefore, the hypothetical calculations are useful in comparing ongoing costs only, and will not help you determine the relative total costs of owning different funds. If transaction costs were included in these calculations, your costs would be higher.
September 1, 2014 – February 28, 2015
| | | Account Value at the Beginning
of the Period ($) | | Account Value at the End of the
Period ($) | | Expenses Paid During the
Period ($) | | Fund's Annualized
Expense Ratio (%) | |
| | | Actual | | Hypothetical | | Actual | | Hypothetical | | Actual | | Hypothetical | | Actual | |
Class A | | | 1,000.00 | | | | 1,000.00 | | | | 1,052.60 | | | | 1,022.69 | | | | 2.30 | | | | 2.27 | | | | 0.45 | | |
Class I | | | 1,000.00 | | | | 1,000.00 | | | | 1,054.70 | | | | 1,023.93 | | | | 1.02 | | | | 1.01 | | | | 0.20 | | |
Class R5 | | | 1,000.00 | | | | 1,000.00 | | | | 1,054.10 | | | | 1,023.93 | | | | 1.02 | | | | 1.01 | | | | 0.20 | | |
Class Z | | | 1,000.00 | | | | 1,000.00 | | | | 1,054.20 | | | | 1,023.93 | | | | 1.02 | | | | 1.01 | | | | 0.20 | | |
Expenses paid during the period are equal to the annualized expense ratio for each class as indicated above, multiplied by the average account value over the period and then multiplied by the number of days in the Fund's most recent fiscal half year and divided by 365.
Expenses do not include fees and expenses incurred indirectly by the Fund from its investment in underlying funds, including affiliated and non-affiliated pooled investment vehicles, such as mutual funds and exchange-traded funds.
Had Columbia Management Investment Advisers, LLC and/or certain of its affiliates not waived/reimbursed certain fees and expenses, account value at the end of the period would have been reduced.
Annual Report 2015
7
COLUMBIA MID CAP INDEX FUND
PORTFOLIO OF INVESTMENTS
February 28, 2015
(Percentages represent value of investments compared to net assets)
Common Stocks 96.0%
Issuer | | Shares | | Value ($) | |
CONSUMER DISCRETIONARY 13.4% | |
Auto Components 0.5% | |
Dana Holding Corp. | | | 386,820 | | | | 8,452,017 | | |
Gentex Corp. | | | 665,976 | | | | 11,734,497 | | |
Total | | | | | 20,186,514 | | |
Automobiles 0.2% | |
Thor Industries, Inc. | | | 105,654 | | | | 6,514,626 | | |
Distributors 0.4% | |
LKQ Corp.(a) | | | 689,297 | | | | 16,939,474 | | |
Diversified Consumer Services 1.0% | |
Apollo Education Group, Inc., Class A(a) | | | 219,700 | | | | 6,074,705 | | |
DeVry Education Group, Inc. | | | 130,778 | | | | 4,779,936 | | |
Graham Holdings Co., Class B | | | 10,020 | | | | 9,883,528 | | |
Service Corp. International | | | 472,321 | | | | 11,737,177 | | |
Sotheby's | | | 139,672 | | | | 6,138,584 | | |
Total | | | | | 38,613,930 | | |
Hotels, Restaurants & Leisure 1.5% | |
Brinker International, Inc. | | | 144,569 | | | | 8,596,073 | | |
Cheesecake Factory, Inc. (The) | | | 104,705 | | | | 4,975,582 | | |
Domino's Pizza, Inc. | | | 125,120 | | | | 12,703,433 | | |
International Game Technology | | | 562,750 | | | | 10,039,460 | | |
International Speedway Corp., Class A | | | 63,589 | | | | 1,973,167 | | |
Life Time Fitness, Inc.(a) | | | 81,869 | | | | 4,732,028 | | |
Panera Bread Co., Class A(a) | | | 58,281 | | | | 9,408,302 | | |
Wendy's Co. (The) | | | 623,138 | | | | 6,910,600 | | |
Total | | | | | 59,338,645 | | |
Household Durables 1.7% | |
Jarden Corp.(a) | | | 406,961 | | | | 21,597,420 | | |
KB Home | | | 207,116 | | | | 2,889,268 | | |
MDC Holdings, Inc. | | | 88,838 | | | | 2,414,617 | | |
NVR, Inc.(a) | | | 8,850 | | | | 11,788,200 | | |
Tempur Sealy International, Inc.(a) | | | 138,554 | | | | 7,968,241 | | |
Toll Brothers, Inc.(a) | | | 368,266 | | | | 14,108,270 | | |
Tupperware Brands Corp. | | | 114,580 | | | | 8,181,012 | | |
Total | | | | | 68,947,028 | | |
Internet & Catalog Retail 0.1% | |
HSN, Inc. | | | 73,859 | | | | 4,990,653 | | |
Common Stocks (continued)
Issuer | | Shares | | Value ($) | |
Leisure Products 1.0% | |
Brunswick Corp. | | | 211,440 | | | | 11,468,506 | | |
Polaris Industries, Inc. | | | 138,944 | | | | 21,304,283 | | |
Vista Outdoor, Inc.(a) | | | 145,254 | | | | 6,341,790 | | |
Total | | | | | 39,114,579 | | |
Media 1.3% | |
AMC Networks, Inc., Class A(a) | | | 134,504 | | | | 9,686,978 | | |
Cinemark Holdings, Inc. | | | 236,873 | | | | 9,645,468 | | |
DreamWorks Animation SKG, Inc.,
Class A(a) | | | 164,770 | | | | 3,527,726 | | |
John Wiley & Sons, Inc., Class A | | | 106,724 | | | | 6,900,774 | | |
Live Nation Entertainment, Inc.(a) | | | 328,630 | | | | 8,409,642 | | |
Meredith Corp. | | | 82,908 | | | | 4,447,185 | | |
New York Times Co. (The), Class A | | | 297,449 | | | | 4,161,311 | | |
Time, Inc. | | | 248,000 | | | | 5,877,600 | | |
Total | | | | | 52,656,684 | | |
Multiline Retail 0.3% | |
Big Lots, Inc. | | | 121,580 | | | | 5,800,582 | | |
JCPenney Co., Inc.(a) | | | 693,430 | | | | 5,894,155 | | |
Total | | | | | 11,694,737 | | |
Specialty Retail 4.0% | |
Aaron's, Inc. | | | 146,719 | | | | 4,373,693 | | |
Abercrombie & Fitch Co., Class A | | | 162,330 | | | | 4,016,044 | | |
Advance Auto Parts, Inc. | | | 166,035 | | | | 25,723,803 | | |
American Eagle Outfitters, Inc. | | | 398,154 | | | | 5,960,365 | | |
ANN, Inc.(a) | | | 103,988 | | | | 3,734,209 | | |
Ascena Retail Group, Inc.(a) | | | 299,589 | | | | 4,014,493 | | |
Cabela's, Inc.(a) | | | 108,340 | | | | 5,898,030 | | |
Chico's FAS, Inc. | | | 347,868 | | | | 6,341,634 | | |
CST Brands, Inc. | | | 176,660 | | | | 7,354,356 | | |
Dick's Sporting Goods, Inc. | | | 223,160 | | | | 12,070,724 | | |
Foot Locker, Inc. | | | 323,197 | | | | 18,153,975 | | |
Guess?, Inc. | | | 145,398 | | | | 2,633,158 | | |
Murphy USA, Inc.(a) | | | 97,780 | | | | 6,941,402 | | |
Office Depot, Inc.(a) | | | 1,102,652 | | | | 10,331,849 | | |
Rent-A-Center, Inc. | | | 120,337 | | | | 3,321,301 | | |
Signet Jewelers Ltd. | | | 182,375 | | | | 21,863,115 | | |
Williams-Sonoma, Inc. | | | 194,808 | | | | 15,672,304 | | |
Total | | | | | 158,404,455 | | |
The accompanying Notes to Financial Statements are an integral part of this statement.
Annual Report 2015
8
COLUMBIA MID CAP INDEX FUND
PORTFOLIO OF INVESTMENTS (continued)
February 28, 2015
Common Stocks (continued)
Issuer | | Shares | | Value ($) | |
Textiles, Apparel & Luxury Goods 1.4% | |
Carter's, Inc. | | | 120,342 | | | | 10,682,759 | | |
Deckers Outdoor Corp.(a) | | | 78,782 | | | | 5,848,776 | | |
Hanesbrands, Inc. | | | 227,220 | | | | 28,979,639 | | |
Kate Spade & Co.(a) | | | 289,130 | | | | 9,960,528 | | |
Total | | | | | 55,471,702 | | |
Total Consumer Discretionary | | | | | 532,873,027 | | |
CONSUMER STAPLES 3.5% | |
Beverages 0.1% | |
Boston Beer Co., Inc. (The), Class A(a) | | | 20,300 | | | | 5,432,280 | | |
Food & Staples Retailing 0.4% | |
SUPERVALU, Inc.(a) | | | 469,221 | | | | 4,635,903 | | |
United Natural Foods, Inc.(a) | | | 113,471 | | | | 9,422,632 | | |
Total | | | | | 14,058,535 | | |
Food Products 1.9% | |
Dean Foods Co. | | | 213,415 | | | | 3,440,250 | | |
Flowers Foods, Inc. | | | 420,211 | | | | 9,093,366 | | |
Hain Celestial Group, Inc. (The)(a) | | | 229,560 | | | | 14,354,387 | | |
Ingredion, Inc. | | | 163,466 | | | | 13,438,540 | | |
Lancaster Colony Corp. | | | 44,155 | | | | 4,035,767 | | |
Post Holdings, Inc.(a) | | | 116,801 | | | | 5,779,313 | | |
Tootsie Roll Industries, Inc. | | | 45,378 | | | | 1,496,566 | | |
TreeHouse Foods, Inc.(a) | | | 96,280 | | | | 8,045,157 | | |
WhiteWave Foods Co. (The), Class A(a) | | | 396,600 | | | | 16,240,770 | | |
Total | | | | | 75,924,116 | | |
Household Products 1.1% | |
Church & Dwight Co., Inc. | | | 304,291 | | | | 25,907,336 | | |
Energizer Holdings, Inc. | | | 141,253 | | | | 18,903,889 | | |
Total | | | | | 44,811,225 | | |
Total Consumer Staples | | | | | 140,226,156 | | |
ENERGY 3.9% | |
Energy Equipment & Services 1.9% | |
Atwood Oceanics, Inc. | | | 136,145 | | | | 4,221,856 | | |
Dresser-Rand Group, Inc.(a) | | | 174,356 | | | | 14,190,835 | | |
Dril-Quip, Inc.(a) | | | 89,790 | | | | 6,524,141 | | |
Helix Energy Solutions Group, Inc.(a) | | | 223,258 | | | | 3,447,104 | | |
Oceaneering International, Inc. | | | 238,866 | | | | 13,025,363 | | |
Oil States International, Inc.(a) | | | 120,948 | | | | 5,258,819 | | |
Common Stocks (continued)
Issuer | | Shares | | Value ($) | |
Patterson-UTI Energy, Inc. | | | 333,033 | | | | 6,222,722 | | |
Rowan Companies PLC, Class A | | | 283,280 | | | | 6,121,681 | | |
Superior Energy Services, Inc. | | | 346,139 | | | | 7,746,591 | | |
Tidewater, Inc. | | | 106,657 | | | | 3,007,727 | | |
Unit Corp.(a) | | | 104,868 | | | | 3,202,669 | | |
Total | | | | | 72,969,508 | | |
Oil, Gas & Consumable Fuels 2.0% | |
California Resources Corp.(a) | | | 694,530 | | | | 4,972,835 | | |
Energen Corp. | | | 166,515 | | | | 10,763,530 | | |
Gulfport Energy Corp.(a) | | | 194,550 | | | | 8,912,335 | | |
HollyFrontier Corp. | | | 445,230 | | | | 19,585,668 | | |
Peabody Energy Corp. | | | 617,440 | | | | 4,877,776 | | |
Rosetta Resources, Inc.(a) | | | 139,872 | | | | 2,479,930 | | |
SM Energy Co. | | | 153,319 | | | | 7,439,038 | | |
Western Refining, Inc. | | | 165,990 | | | | 7,818,129 | | |
World Fuel Services Corp. | | | 163,920 | | | | 8,974,620 | | |
WPX Energy, Inc.(a) | | | 462,590 | | | | 4,986,720 | | |
Total | | | | | 80,810,581 | | |
Total Energy | | | | | 153,780,089 | | |
FINANCIALS 22.3% | |
Banks 4.5% | |
Associated Banc-Corp. | | | 345,709 | | | | 6,444,016 | | |
BancorpSouth, Inc. | | | 194,530 | | | | 4,355,527 | | |
Bank of Hawaii Corp. | | | 99,806 | | | | 6,014,310 | | |
Cathay General Bancorp | | | 168,605 | | | | 4,355,067 | | |
City National Corp. | | | 109,067 | | | | 9,856,385 | | |
Commerce Bancshares, Inc. | | | 188,366 | | | | 7,820,956 | | |
Cullen/Frost Bankers, Inc. | | | 124,789 | | | | 8,460,694 | | |
East West Bancorp, Inc. | | | 326,527 | | | | 13,044,754 | | |
First Horizon National Corp. | | | 535,110 | | | | 7,646,722 | | |
First Niagara Financial Group, Inc. | | | 805,089 | | | | 7,133,089 | | |
FirstMerit Corp. | | | 376,216 | | | | 6,828,320 | | |
Fulton Financial Corp. | | | 421,415 | | | | 5,099,121 | | |
Hancock Holding Co. | | | 185,541 | | | | 5,430,785 | | |
International Bancshares Corp. | | | 131,792 | | | | 3,263,170 | | |
PacWest Bancorp | | | 220,220 | | | | 10,093,784 | | |
Prosperity Bancshares, Inc. | | | 136,485 | | | | 7,060,369 | | |
Signature Bank(a) | | | 114,451 | | | | 14,117,531 | | |
SVB Financial Group(a) | | | 115,667 | | | | 14,215,474 | | |
The accompanying Notes to Financial Statements are an integral part of this statement.
Annual Report 2015
9
COLUMBIA MID CAP INDEX FUND
PORTFOLIO OF INVESTMENTS (continued)
February 28, 2015
Common Stocks (continued)
Issuer | | Shares | | Value ($) | |
Synovus Financial Corp. | | | 310,655 | | | | 8,695,233 | | |
TCF Financial Corp. | | | 380,389 | | | | 5,968,303 | | |
Trustmark Corp. | | | 153,400 | | | | 3,535,870 | | |
Umpqua Holdings Corp. | | | 494,200 | | | | 8,174,068 | | |
Valley National Bancorp | | | 500,231 | | | | 4,802,218 | | |
Webster Financial Corp. | | | 205,275 | | | | 7,088,146 | | |
Total | | | | | 179,503,912 | | |
Capital Markets 1.8% | |
Eaton Vance Corp. | | | 269,002 | | | | 11,324,984 | | |
Federated Investors, Inc., Class B | | | 216,510 | | | | 7,129,674 | | |
Janus Capital Group, Inc. | | | 334,230 | | | | 5,508,110 | | |
Raymond James Financial, Inc. | | | 286,566 | | | | 16,371,516 | | |
SEI Investments Co. | | | 296,715 | | | | 12,770,614 | | |
Stifel Financial Corp.(a) | | | 150,150 | | | | 8,223,716 | | |
Waddell & Reed Financial, Inc., Class A | | | 190,196 | | | | 9,407,094 | | |
Total | | | | | 70,735,708 | | |
Consumer Finance 0.2% | |
SLM Corp. | | | 962,550 | | | | 9,115,348 | | |
Diversified Financial Services 0.7% | |
CBOE Holdings, Inc. | | | 191,978 | | | | 11,524,439 | | |
MSCI, Inc. | | | 254,827 | | | | 14,298,343 | | |
Total | | | | | 25,822,782 | | |
Insurance 4.3% | |
Alleghany Corp.(a) | | | 36,638 | | | | 17,312,921 | | |
American Financial Group, Inc. | | | 167,897 | | | | 10,577,511 | | |
Arthur J Gallagher & Co. | | | 367,068 | | | | 17,248,525 | | |
Aspen Insurance Holdings Ltd. | | | 141,554 | | | | 6,490,251 | | |
Brown & Brown, Inc. | | | 268,153 | | | | 8,618,437 | | |
Everest Re Group Ltd. | | | 102,920 | | | | 18,261,096 | | |
First American Financial Corp. | | | 243,985 | | | | 8,546,795 | | |
Hanover Insurance Group, Inc. (The) | | | 100,150 | | | | 7,034,536 | | |
HCC Insurance Holdings, Inc. | | | 220,188 | | | | 12,304,105 | | |
Kemper Corp. | | | 113,811 | | | | 4,188,245 | | |
Mercury General Corp. | | | 82,621 | | | | 4,505,323 | | |
Old Republic International Corp. | | | 551,886 | | | | 8,366,592 | | |
Primerica, Inc. | | | 120,875 | | | | 6,374,948 | | |
Reinsurance Group of America, Inc. | | | 156,259 | | | | 13,955,491 | | |
RenaissanceRe Holdings Ltd. | | | 87,640 | | | | 8,985,729 | | |
StanCorp Financial Group, Inc. | | | 95,628 | | | | 6,326,748 | | |
WR Berkley Corp. | | | 230,943 | | | | 11,526,365 | | |
Total | | | | | 170,623,618 | | |
Common Stocks (continued)
Issuer | | Shares | | Value ($) | |
Real Estate Investment Trusts (REITs) 9.8% | |
Alexandria Real Estate Equities, Inc. | | | 163,791 | | | | 15,709,195 | | |
American Campus Communities, Inc. | | | 239,103 | | | | 9,867,781 | | |
BioMed Realty Trust, Inc. | | | 449,115 | | | | 9,988,318 | | |
Camden Property Trust | | | 196,527 | | | | 14,305,200 | | |
Corporate Office Properties Trust | | | 210,451 | | | | 6,187,259 | | |
Corrections Corp. of America | | | 264,945 | | | | 10,568,656 | | |
Duke Realty Corp. | | | 777,279 | | | | 16,602,679 | | |
Equity One, Inc. | | | 174,635 | | | | 4,676,725 | | |
Extra Space Storage, Inc. | | | 251,385 | | | | 16,536,105 | | |
Federal Realty Investment Trust | | | 154,983 | | | | 22,012,235 | | |
Highwoods Properties, Inc. | | | 207,604 | | | | 9,468,818 | | |
Home Properties, Inc. | | | 130,487 | | | | 8,712,617 | | |
Hospitality Properties Trust | | | 340,963 | | | | 10,505,070 | | |
Kilroy Realty Corp. | | | 190,975 | | | | 14,126,421 | | |
Lamar Advertising Co. Class A | | | 182,339 | | | | 10,593,896 | | |
LaSalle Hotel Properties | | | 254,000 | | | | 9,885,680 | | |
Liberty Property Trust | | | 337,891 | | | | 12,576,303 | | |
Mack-Cali Realty Corp. | | | 190,358 | | | | 3,580,634 | | |
Mid-America Apartment Communities, Inc. | | | 171,180 | | | | 12,405,415 | | |
National Retail Properties, Inc. | | | 299,998 | | | | 12,071,920 | | |
Omega Healthcare Investors, Inc. | | | 311,270 | | | | 12,469,476 | | |
Potlatch Corp. | | | 92,337 | | | | 3,687,016 | | |
Rayonier, Inc. | | | 288,255 | | | | 7,901,070 | | |
Realty Income Corp. | | | 506,530 | | | | 25,356,892 | | |
Regency Centers Corp. | | | 212,098 | | | | 13,919,992 | | |
Senior Housing Properties Trust | | | 524,865 | | | | 11,730,733 | | |
SL Green Realty Corp. | | | 219,537 | | | | 27,865,831 | | |
Tanger Factory Outlet Centers, Inc. | | | 218,130 | | | | 7,732,709 | | |
Taubman Centers, Inc. | | | 144,039 | | | | 10,419,781 | | |
UDR, Inc. | | | 580,527 | | | | 18,542,032 | | |
Urban Edge Properties(a) | | | 198,570 | | | | 4,753,766 | | |
Weingarten Realty Investors | | | 255,877 | | | | 9,267,865 | | |
WP Glimcher, Inc. | | | 418,860 | | | | 7,258,844 | | |
Total | | | | | 391,286,934 | | |
Real Estate Management & Development 0.5% | |
Alexander & Baldwin, Inc. | | | 103,136 | | | | 4,169,788 | | |
Jones Lang LaSalle, Inc. | | | 101,958 | | | | 16,440,728 | | |
Total | | | | | 20,610,516 | | |
The accompanying Notes to Financial Statements are an integral part of this statement.
Annual Report 2015
10
COLUMBIA MID CAP INDEX FUND
PORTFOLIO OF INVESTMENTS (continued)
February 28, 2015
Common Stocks (continued)
Issuer | | Shares | | Value ($) | |
Thrifts & Mortgage Finance 0.5% | |
New York Community Bancorp, Inc. | | | 1,006,864 | | | | 16,724,011 | | |
Washington Federal, Inc. | | | 223,329 | | | | 4,716,709 | | |
Total | | | | | 21,440,720 | | |
Total Financials | | | | | 889,139,538 | | |
HEALTH CARE 9.1% | |
Biotechnology 0.4% | |
United Therapeutics Corp.(a) | | | 108,068 | | | | 16,755,944 | | |
Health Care Equipment & Supplies 3.3% | |
Align Technology, Inc.(a) | | | 164,370 | | | | 9,426,620 | | |
Cooper Companies, Inc. (The) | | | 109,822 | | | | 18,007,513 | | |
Halyard Health, Inc.(a) | | | 105,850 | | | | 4,873,334 | | |
Hill-Rom Holdings, Inc. | | | 130,834 | | | | 6,269,565 | | |
Hologic, Inc.(a) | | | 551,456 | | | | 17,856,145 | | |
IDEXX Laboratories, Inc.(a) | | | 108,456 | | | | 17,009,155 | | |
ResMed, Inc. | | | 317,187 | | | | 20,414,155 | | |
Sirona Dental Systems, Inc.(a) | | | 125,950 | | | | 11,438,779 | | |
STERIS Corp. | | | 135,168 | | | | 8,721,040 | | |
Teleflex, Inc. | | | 94,207 | | | | 11,464,050 | | |
Thoratec Corp.(a) | | | 125,110 | | | | 5,094,479 | | |
Total | | | | | 130,574,835 | | |
Health Care Providers & Services 3.3% | |
Centene Corp.(a) | | | 266,900 | | | | 16,403,674 | | |
Community Health Systems, Inc.(a) | | | 264,498 | | | | 12,833,443 | | |
Health Net, Inc.(a) | | | 177,234 | | | | 10,164,370 | | |
Henry Schein, Inc.(a) | | | 191,560 | | | | 26,827,978 | | |
LifePoint Hospitals, Inc.(a) | | | 102,977 | | | | 7,410,225 | | |
Mednax, Inc.(a) | | | 228,412 | | | | 16,324,606 | | |
Omnicare, Inc. | | | 222,647 | | | | 17,085,931 | | |
Owens & Minor, Inc. | | | 143,480 | | | | 5,116,497 | | |
VCA, Inc.(a) | | | 191,352 | | | | 10,195,234 | | |
WellCare Health Plans, Inc.(a) | | | 99,866 | | | | 9,068,831 | | |
Total | | | | | 131,430,789 | | |
Health Care Technology 0.2% | |
Allscripts Healthcare Solutions, Inc.(a) | | | 385,433 | | | | 4,627,123 | | |
HMS Holdings Corp.(a) | | | 199,691 | | | | 3,502,580 | | |
Total | | | | | 8,129,703 | | |
Common Stocks (continued)
Issuer | | Shares | | Value ($) | |
Life Sciences Tools & Services 1.1% | |
Bio-Rad Laboratories, Inc., Class A(a) | | | 46,771 | | | | 5,948,336 | | |
Bio-Techne Corp. | | | 84,331 | | | | 8,224,802 | | |
Charles River Laboratories
International, Inc.(a) | | | 106,728 | | | | 8,182,836 | | |
Mettler-Toledo International, Inc.(a) | | | 64,931 | | | | 20,399,372 | | |
Total | | | | | 42,755,346 | | |
Pharmaceuticals 0.8% | |
Akorn, Inc.(a) | | | 169,490 | | | | 9,120,257 | | |
Salix Pharmaceuticals Ltd.(a) | | | 144,950 | | | | 22,786,140 | | |
Total | | | | | 31,906,397 | | |
Total Health Care | | | | | 361,553,014 | | |
INDUSTRIALS 15.0% | |
Aerospace & Defense 2.0% | |
B/E Aerospace, Inc.(a) | | | 239,534 | | | | 15,219,990 | | |
Esterline Technologies Corp.(a) | | | 72,653 | | | | 8,562,156 | | |
Exelis, Inc. | | | 424,785 | | | | 10,279,797 | | |
Huntington Ingalls Industries, Inc. | | | 109,839 | | | | 15,523,546 | | |
KLX, Inc.(a) | | | 119,762 | | | | 4,783,294 | | |
Orbital ATK, Inc. | | | 134,367 | | | | 8,905,845 | | |
Teledyne Technologies, Inc.(a) | | | 83,270 | | | | 8,396,114 | | |
Triumph Group, Inc. | | | 115,522 | | | | 6,907,061 | | |
Total | | | | | 78,577,803 | | |
Airlines 0.7% | |
Alaska Air Group, Inc. | | | 299,256 | | | | 19,047,644 | | |
JetBlue Airways Corp.(a) | | | 593,976 | | | | 10,210,448 | | |
Total | | | | | 29,258,092 | | |
Building Products 0.9% | |
AO Smith Corp. | | | 171,100 | | | | 10,784,433 | | |
Fortune Brands Home & Security, Inc. | | | 358,871 | | | | 16,622,905 | | |
Lennox International, Inc. | | | 93,502 | | | | 9,748,518 | | |
Total | | | | | 37,155,856 | | |
Commercial Services & Supplies 1.6% | |
Clean Harbors, Inc.(a) | | | 124,090 | | | | 6,910,572 | | |
Copart, Inc.(a) | | | 258,634 | | | | 9,678,084 | | |
Deluxe Corp. | | | 112,982 | | | | 7,518,952 | | |
Herman Miller, Inc. | | | 135,309 | | | | 4,190,520 | | |
HNI Corp. | | | 100,985 | | | | 5,150,235 | | |
MSA Safety, Inc. | | | 71,536 | | | | 3,618,291 | | |
The accompanying Notes to Financial Statements are an integral part of this statement.
Annual Report 2015
11
COLUMBIA MID CAP INDEX FUND
PORTFOLIO OF INVESTMENTS (continued)
February 28, 2015
Common Stocks (continued)
Issuer | | Shares | | Value ($) | |
Rollins, Inc. | | | 145,646 | | | | 4,884,967 | | |
RR Donnelley & Sons Co. | | | 454,478 | | | | 8,666,896 | | |
Waste Connections, Inc. | | | 282,324 | | | | 13,260,758 | | |
Total | | | | | 63,879,275 | | |
Construction & Engineering 0.5% | |
AECOM(a) | | | 349,895 | | | | 10,517,844 | | |
Granite Construction, Inc. | | | 81,932 | | | | 2,713,588 | | |
KBR, Inc. | | | 330,007 | | | | 5,375,814 | | |
Total | | | | | 18,607,246 | | |
Electrical Equipment 1.0% | |
Acuity Brands, Inc. | | | 98,652 | | | | 15,634,369 | | |
Hubbell, Inc., Class B | | | 123,565 | | | | 14,061,697 | | |
Regal-Beloit Corp. | | | 101,654 | | | | 7,922,913 | | |
Total | | | | | 37,618,979 | | |
Industrial Conglomerates 0.3% | |
Carlisle Companies, Inc. | | | 145,954 | | | | 13,583,939 | | |
Machinery 4.4% | |
AGCO Corp. | | | 190,391 | | | | 9,470,048 | | |
CLARCOR, Inc. | | | 114,018 | | | | 7,503,525 | | |
Crane Co. | | | 112,705 | | | | 7,532,075 | | |
Donaldson Co., Inc. | | | 290,465 | | | | 10,758,824 | | |
Graco, Inc. | | | 135,272 | | | | 10,250,912 | | |
Harsco Corp. | | | 183,814 | | | | 3,031,093 | | |
IDEX Corp. | | | 180,603 | | | | 13,953,388 | | |
ITT Corp. | | | 208,362 | | | | 8,557,427 | | |
Kennametal, Inc. | | | 179,936 | | | | 6,297,760 | | |
Lincoln Electric Holdings, Inc. | | | 176,695 | | | | 12,199,023 | | |
Nordson Corp. | | | 133,476 | | | | 10,268,309 | | |
Oshkosh Corp. | | | 181,520 | | | | 8,856,361 | | |
SPX Corp. | | | 93,423 | | | | 8,326,792 | | |
Terex Corp. | | | 246,575 | | | | 6,758,621 | | |
Timken Co. (The) | | | 169,455 | | | | 7,198,448 | | |
Trinity Industries, Inc. | | | 354,016 | | | | 11,902,018 | | |
Valmont Industries, Inc. | | | 55,971 | | | | 6,976,785 | | |
Wabtec Corp. | | | 218,950 | | | | 20,776,165 | | |
Woodward, Inc. | | | 132,777 | | | | 6,446,323 | | |
Total | | | | | 177,063,897 | | |
Marine 0.3% | |
Kirby Corp.(a) | | | 129,788 | | | | 10,004,059 | | |
Common Stocks (continued)
Issuer | | Shares | | Value ($) | |
Professional Services 1.1% | |
Corporate Executive Board Co. (The) | | | 76,518 | | | | 5,984,473 | | |
FTI Consulting, Inc.(a) | | | 93,313 | | | | 3,440,450 | | |
Manpowergroup, Inc. | | | 180,017 | | | | 14,484,168 | | |
Towers Watson & Co. | | | 159,080 | | | | 20,919,020 | | |
Total | | | | | 44,828,111 | | |
Road & Rail 1.5% | |
Con-way, Inc. | | | 131,743 | | | | 5,819,088 | | |
Genesee & Wyoming, Inc., Class A(a) | | | 116,434 | | | | 12,004,345 | | |
JB Hunt Transport Services, Inc. | | | 210,520 | | | | 17,999,460 | | |
Landstar System, Inc. | | | 101,758 | | | | 7,145,447 | | |
Old Dominion Freight Line, Inc.(a) | | | 154,840 | | | | 12,096,101 | | |
Werner Enterprises, Inc. | | | 101,344 | | | | 3,250,102 | | |
Total | | | | | 58,314,543 | | |
Trading Companies & Distributors 0.7% | |
GATX Corp. | | | 100,538 | | | | 6,258,490 | | |
MSC Industrial Direct Co., Inc., Class A | | | 114,910 | | | | 8,387,281 | | |
NOW, Inc.(a) | | | 243,540 | | | | 5,175,225 | | |
Watsco, Inc. | | | 62,083 | | | | 7,278,611 | | |
Total | | | | | 27,099,607 | | |
Total Industrials | | | | | 595,991,407 | | |
INFORMATION TECHNOLOGY 17.2% | |
Communications Equipment 1.1% | |
Arris Group, Inc.(a) | | | 299,680 | | | | 8,804,598 | | |
Ciena Corp.(a) | | | 242,402 | | | | 5,071,050 | | |
InterDigital, Inc. | | | 84,534 | | | | 4,469,312 | | |
JDS Uniphase Corp.(a) | | | 527,380 | | | | 7,262,023 | | |
Plantronics, Inc. | | | 97,639 | | | | 4,924,911 | | |
Polycom, Inc.(a) | | | 310,450 | | | | 4,290,419 | | |
Riverbed Technology, Inc.(a) | | | 352,821 | | | | 7,388,072 | | |
Total | | | | | 42,210,385 | | |
Electronic Equipment, Instruments & Components 3.6% | |
Arrow Electronics, Inc.(a) | | | 220,436 | | | | 13,658,215 | | |
Avnet, Inc. | | | 311,740 | | | | 14,280,809 | | |
Belden, Inc. | | | 97,390 | | | | 8,646,284 | | |
Cognex Corp.(a) | | | 198,000 | | | | 8,848,620 | | |
FEI Co. | | | 94,510 | | | | 7,465,345 | | |
Ingram Micro, Inc., Class A(a) | | | 354,696 | | | | 8,764,538 | | |
IPG Photonics Corp.(a) | | | 80,710 | | | | 7,740,089 | | |
The accompanying Notes to Financial Statements are an integral part of this statement.
Annual Report 2015
12
COLUMBIA MID CAP INDEX FUND
PORTFOLIO OF INVESTMENTS (continued)
February 28, 2015
Common Stocks (continued)
Issuer | | Shares | | Value ($) | |
Itron, Inc.(a) | | | 88,843 | | | | 3,240,993 | | |
Jabil Circuit, Inc. | | | 439,900 | | | | 9,664,603 | | |
Keysight Technologies, Inc.(a) | | | 381,000 | | | | 14,302,740 | | |
Knowles Corp.(a) | | | 193,440 | | | | 3,704,376 | | |
National Instruments Corp. | | | 229,266 | | | | 7,139,343 | | |
Tech Data Corp.(a) | | | 87,014 | | | | 5,177,333 | | |
Trimble Navigation Ltd.(a) | | | 589,148 | | | | 15,400,329 | | |
Vishay Intertechnology, Inc. | | | 308,568 | | | | 4,394,008 | | |
Zebra Technologies Corp., Class A(a) | | | 115,825 | | | | 10,545,866 | | |
Total | | | | | 142,973,491 | | |
Internet Software & Services 1.2% | |
AOL, Inc.(a) | | | 177,160 | | | | 7,182,066 | | |
Equinix, Inc. | | | 124,653 | | | | 27,944,086 | | |
Rackspace Hosting, Inc.(a) | | | 271,026 | | | | 13,461,862 | | |
Total | | | | | 48,588,014 | | |
IT Services 2.8% | |
Acxiom Corp.(a) | | | 175,173 | | | | 3,503,460 | | |
Broadridge Financial Solutions, Inc. | | | 272,992 | | | | 14,531,364 | | |
Convergys Corp. | | | 228,254 | | | | 5,101,477 | | |
CoreLogic, Inc.(a) | | | 204,127 | | | | 6,805,594 | | |
DST Systems, Inc. | | | 66,657 | | | | 7,084,973 | | |
Gartner, Inc.(a) | | | 200,237 | | | | 16,641,697 | | |
Global Payments, Inc. | | | 153,847 | | | | 14,132,385 | | |
Jack Henry & Associates, Inc. | | | 186,008 | | | | 12,183,524 | | |
Leidos Holdings, Inc. | | | 141,522 | | | | 6,371,321 | | |
NeuStar, Inc., Class A(a) | | | 124,835 | | | | 3,310,624 | | |
Science Applications International Corp. | | | 91,984 | | | | 5,029,685 | | |
VeriFone Systems, Inc.(a) | | | 257,166 | | | | 9,049,672 | | |
WEX, Inc.(a) | | | 88,187 | | | | 9,435,127 | | |
Total | | | | | 113,180,903 | | |
Semiconductors & Semiconductor Equipment 3.4% | |
Advanced Micro Devices, Inc.(a) | | | 1,428,530 | | | | 4,442,728 | | |
Atmel Corp.(a) | | | 949,344 | | | | 7,917,529 | | |
Cree, Inc.(a) | | | 253,968 | | | | 9,970,784 | | |
Cypress Semiconductor Corp. | | | 337,420 | | | | 4,976,945 | | |
Fairchild Semiconductor
International, Inc.(a) | | | 270,163 | | | | 4,711,643 | | |
Integrated Device Technology, Inc.(a) | | | 338,121 | | | | 6,978,817 | | |
Intersil Corp., Class A | | | 294,596 | | | | 4,592,752 | | |
Qorvo, Inc.(a) | | | 331,876 | | | | 23,032,194 | | |
Common Stocks (continued)
Issuer | | Shares | | Value ($) | |
Semtech Corp.(a) | | | 151,841 | | | | 4,392,760 | | |
Silicon Laboratories, Inc.(a) | | | 89,652 | | | | 4,539,977 | | |
Skyworks Solutions, Inc. | | | 433,674 | | | | 38,054,894 | | |
SunEdison, Inc.(a) | | | 573,211 | | | | 12,690,892 | | |
Teradyne, Inc. | | | 492,450 | | | | 9,514,134 | | |
Total | | | | | 135,816,049 | | |
Software 4.4% | |
ACI Worldwide, Inc.(a) | | | 261,438 | | | | 5,189,544 | | |
Advent Software, Inc. | | | 101,132 | | | | 4,467,000 | | |
ANSYS, Inc.(a) | | | 209,053 | | | | 17,972,286 | | |
Cadence Design Systems, Inc.(a) | | | 665,833 | | | | 12,221,365 | | |
CDK Global, Inc. | | | 365,380 | | | | 17,110,745 | | |
CommVault Systems, Inc.(a) | | | 97,855 | | | | 4,723,461 | | |
Factset Research Systems, Inc. | | | 88,314 | | | | 13,737,243 | | |
Fair Isaac Corp. | | | 73,032 | | | | 6,216,484 | | |
Fortinet, Inc.(a) | | | 314,990 | | | | 10,586,814 | | |
Informatica Corp.(a) | | | 247,194 | | | | 10,615,746 | | |
Mentor Graphics Corp. | | | 222,547 | | | | 5,220,953 | | |
PTC, Inc.(a) | | | 263,850 | | | | 9,143,722 | | |
Rovi Corp.(a) | | | 215,477 | | | | 5,361,068 | | |
SolarWinds, Inc.(a) | | | 149,683 | | | | 7,593,418 | | |
Solera Holdings, Inc. | | | 155,190 | | | | 8,650,291 | | |
Synopsys, Inc.(a) | | | 354,446 | | | | 16,449,839 | | |
Tyler Technologies, Inc.(a) | | | 75,140 | | | | 8,969,462 | | |
Ultimate Software Group, Inc. (The)(a) | | | 64,530 | | | | 10,624,542 | | |
Total | | | | | 174,853,983 | | |
Technology Hardware, Storage & Peripherals 0.7% | |
3D Systems Corp.(a) | | | 237,800 | | | | 7,245,766 | | |
Diebold, Inc. | | | 147,012 | | | | 5,248,328 | | |
Lexmark International, Inc., Class A | | | 140,560 | | | | 5,996,290 | | |
NCR Corp.(a) | | | 383,050 | | | | 11,265,500 | | |
Total | | | | | 29,755,884 | | |
Total Information Technology | | | | | 687,378,709 | | |
MATERIALS 7.2% | |
Chemicals 3.1% | |
Albemarle Corp. | | | 255,799 | | | | 14,470,549 | | |
Ashland, Inc. | | | 145,160 | | | | 18,525,319 | | |
Cabot Corp. | | | 145,689 | | | | 6,573,488 | | |
Cytec Industries, Inc. | | | 163,942 | | | | 8,611,873 | | |
The accompanying Notes to Financial Statements are an integral part of this statement.
Annual Report 2015
13
COLUMBIA MID CAP INDEX FUND
PORTFOLIO OF INVESTMENTS (continued)
February 28, 2015
Common Stocks (continued)
Issuer | | Shares | | Value ($) | |
Minerals Technologies, Inc. | | | 78,485 | | | | 5,747,457 | | |
NewMarket Corp. | | | 24,233 | | | | 11,416,166 | | |
Olin Corp. | | | 177,863 | | | | 4,987,279 | | |
PolyOne Corp. | | | 206,790 | | | | 8,217,835 | | |
RPM International, Inc. | | | 303,611 | | | | 15,347,536 | | |
Scotts Miracle-Gro Co., Class A | | | 100,997 | | | | 6,616,313 | | |
Sensient Technologies Corp. | | | 109,540 | | | | 6,967,839 | | |
Valspar Corp. (The) | | | 173,394 | | | | 15,024,590 | | |
Total | | | | | 122,506,244 | | |
Construction Materials 0.2% | |
Eagle Materials, Inc. | | | 114,330 | | | | 8,974,905 | | |
Containers & Packaging 2.0% | |
AptarGroup, Inc. | | | 147,232 | | | | 9,698,172 | | |
Bemis Co., Inc. | | | 227,190 | | | | 11,086,872 | | |
Greif, Inc., Class A | | | 77,093 | | | | 3,392,092 | | |
Packaging Corp. of America | | | 223,789 | | | | 18,543,156 | | |
Rock-Tenn Co., Class A | | | 318,564 | | | | 21,866,233 | | |
Silgan Holdings, Inc. | | | 99,195 | | | | 5,694,785 | | |
Sonoco Products Co. | | | 230,326 | | | | 10,786,167 | | |
Total | | | | | 81,067,477 | | |
Metals & Mining 1.6% | |
Carpenter Technology Corp. | | | 121,102 | | | | 5,129,881 | | |
Cliffs Natural Resources, Inc. | | | 348,460 | | | | 2,383,466 | | |
Commercial Metals Co. | | | 268,762 | | | | 4,044,868 | | |
Compass Minerals International, Inc. | | | 76,404 | | | | 6,927,551 | | |
Reliance Steel & Aluminum Co. | | | 177,591 | | | | 10,124,463 | | |
Royal Gold, Inc. | | | 148,295 | | | | 10,692,069 | | |
Steel Dynamics, Inc. | | | 546,859 | | | | 9,963,771 | | |
TimkenSteel Corp. | | | 87,197 | | | | 2,621,142 | | |
United States Steel Corp. | | | 330,930 | | | | 7,925,774 | | |
Worthington Industries, Inc. | | | 115,260 | | | | 3,112,020 | | |
Total | | | | | 62,925,005 | | |
Paper & Forest Products 0.3% | |
Domtar Corp. | | | 146,646 | | | | 6,628,399 | | |
Louisiana-Pacific Corp.(a) | | | 323,477 | | | | 5,444,118 | | |
Total | | | | | 12,072,517 | | |
Total Materials | | | | | 287,546,148 | | |
TELECOMMUNICATION SERVICES 0.1% | |
Wireless Telecommunication Services 0.1% | |
Telephone & Data Systems, Inc. | | | 223,355 | | | | 5,682,151 | | |
Total Telecommunication Services | | | | | 5,682,151 | | |
Common Stocks (continued)
Issuer | | Shares | | Value ($) | |
UTILITIES 4.3% | |
Electric Utilities 1.6% | |
Cleco Corp. | | | 137,339 | | | | 7,475,362 | | |
Great Plains Energy, Inc. | | | 349,976 | | | | 9,312,861 | | |
Hawaiian Electric Industries, Inc. | | | 233,296 | | | | 7,710,433 | | |
IDACORP, Inc. | | | 114,349 | | | | 7,160,534 | | |
OGE Energy Corp. | | | 453,378 | | | | 14,739,319 | | |
PNM Resources, Inc. | | | 181,180 | | | | 5,172,689 | | |
Westar Energy, Inc. | | | 297,381 | | | | 11,553,252 | | |
Total | | | | | 63,124,450 | | |
Gas Utilities 1.4% | |
Atmos Energy Corp. | | | 228,357 | | | | 12,112,055 | | |
National Fuel Gas Co. | | | 191,505 | | | | 12,334,837 | | |
ONE Gas, Inc. | | | 118,400 | | | | 4,926,624 | | |
Questar Corp. | | | 398,652 | | | | 9,320,484 | | |
UGI Corp. | | | 392,201 | | | | 13,330,912 | | |
WGL Holdings, Inc. | | | 113,075 | | | | 6,032,551 | | |
Total | | | | | 58,057,463 | | |
Multi-Utilities 1.0% | |
Alliant Energy Corp. | | | 252,338 | | | | 16,048,697 | | |
Black Hills Corp. | | | 101,572 | | | | 5,162,905 | | |
MDU Resources Group, Inc. | | | 441,526 | | | | 9,846,030 | | |
Vectren Corp. | | | 187,740 | | | | 8,382,591 | | |
Total | | | | | 39,440,223 | | |
Water Utilities 0.3% | |
Aqua America, Inc. | | | 401,778 | | | | 10,623,010 | | |
Total Utilities | | | | | 171,245,146 | | |
Total Common Stocks
(Cost: $2,346,503,497) | | | | | 3,825,415,385 | | |
Money Market Funds 3.8%
| | | Shares | | Value ($) | |
Columbia Short-Term Cash Fund,
0.118%(b)(c) | | | 152,697,480 | | | | 152,697,480 | | |
Total Money Market Funds
(Cost: $152,697,480) | | | | | 152,697,480 | | |
Total Investments
(Cost: $2,499,200,977) | | | | | 3,978,112,865 | | |
Other Assets & Liabilities, Net | | | | | 7,685,004 | | |
Net Assets | | | | | 3,985,797,869 | | |
The accompanying Notes to Financial Statements are an integral part of this statement.
Annual Report 2015
14
COLUMBIA MID CAP INDEX FUND
PORTFOLIO OF INVESTMENTS (continued)
February 28, 2015
Investments in Derivatives
Futures Contracts Outstanding at February 28, 2015
At February 28, 2015, cash totaling $7,309,700 was pledged as collateral to cover initial margin requirements on open futures contracts.
Long Futures Contracts Outstanding
Contract Description | | Number of
Contracts | | Trading
Currency | | Notional
Market
Value ($) | | Expiration
Date | | Unrealized
Appreciation ($) | | Unrealized
Depreciation ($) | |
S&P MID 400 EMINI | | | 1,074 | | | USD | | | | | 161,594,040 | | | 03/2015 | | | 9,027,105 | | | | — | | |
Notes to Portfolio of Investments
(a) Non-income producing.
(b) The rate shown is the seven-day current annualized yield at February 28, 2015.
(c) As defined in the Investment Company Act of 1940, an affiliated company is one in which the Fund owns 5% or more of the company's outstanding voting securities, or a company which is under common ownership or control with the Fund. Holdings and transactions in these affiliated companies during the year ended February 28, 2015, are as follows:
Issuer | | Beginning
Cost ($) | | Purchase
Cost ($) | | Proceeds
From Sales ($) | | Ending
Cost ($) | | Dividends —
Affiliated
Issuers ($) | | Value ($) | |
Columbia Short-Term Cash Fund | | | 84,086,540 | | | | 568,284,578 | | | | (499,673,638 | ) | | | 152,697,480 | | | | 89,516 | | | | 152,697,480 | | |
Currency Legend
USD US Dollar
Fair Value Measurements
Generally accepted accounting principles (GAAP) require disclosure regarding the inputs and valuation techniques used to measure fair value and any changes in valuation inputs or techniques. In addition, investments shall be disclosed by major category.
The Fund categorizes its fair value measurements according to a three-level hierarchy that maximizes the use of observable inputs and minimizes the use of unobservable inputs by prioritizing that the most observable input be used when available. Observable inputs are those that market participants would use in pricing an investment based on market data obtained from sources independent of the reporting entity. Unobservable inputs are those that reflect the Fund's assumptions about the information market participants would use in pricing an investment. An investment's level within the fair value hierarchy is based on the lowest level of any input that is deemed significant to the asset or liability's fair value measurement. The input levels are not necessarily an indication of the risk or liquidity associated with investments at that level. For example, certain U.S. government securities are generally high quality and liquid, however, they are reflected as Level 2 because the inputs used to determine fair value may not always be quoted prices in an active market.
Fair value inputs are summarized in the three broad levels listed below:
> Level 1 — Valuations based on quoted prices for investments in active markets that the Fund has the ability to access at the measurement date (including NAV for open-end mutual funds). Valuation adjustments are not applied to Level 1 investments.
> Level 2 — Valuations based on other significant observable inputs (including quoted prices for similar securities, interest rates, prepayment speeds, credit risks, etc.).
> Level 3 — Valuations based on significant unobservable inputs (including the Fund's own assumptions and judgment in determining the fair value of investments).
Inputs that are used in determining fair value of an investment may include price information, credit data, volatility statistics, and other factors. These inputs can be either observable or unobservable. The availability of observable inputs can vary between investments, and is affected by various factors such as the type of investment, and the volume and level of activity for that investment or similar investments in the marketplace. The inputs will be considered by the Investment Manager, along with any other relevant factors in the calculation of an investment's fair value. The Fund uses prices and inputs that are current as of the measurement date, which may include periods of market dislocations. During these periods, the availability of prices and inputs may be reduced for many investments. This condition could cause an investment to be reclassified between the various levels within the hierarchy.
The accompanying Notes to Financial Statements are an integral part of this statement.
Annual Report 2015
15
COLUMBIA MID CAP INDEX FUND
PORTFOLIO OF INVESTMENTS (continued)
February 28, 2015
Fair Value Measurements (continued)
Investments falling into the Level 3 category are primarily supported by quoted prices from brokers and dealers participating in the market for those investments. However, these may be classified as Level 3 investments due to lack of market transparency and corroboration to support these quoted prices. Additionally, valuation models may be used as the pricing source for any remaining investments classified as Level 3. These models may rely on one or more significant unobservable inputs and/or significant assumptions by the Investment Manager. Inputs used in valuations may include, but are not limited to, financial statement analysis, capital account balances, discount rates and estimated cash flows, and comparable company data.
Under the direction of the Fund's Board of Trustees (the Board), the Investment Manager's Valuation Committee (the Committee) is responsible for overseeing the valuation procedures approved by the Board. The Committee consists of voting and non-voting members from various groups within the Investment Manager's organization, including operations and accounting, trading and investments, compliance, risk management and legal.
The Committee meets at least monthly to review and approve valuation matters, which may include a description of specific valuation determinations, data regarding pricing information received from approved pricing vendors and brokers and the results of Board-approved valuation control policies and procedures (the Policies). The Policies address, among other things, instances when market quotations are or are not readily available, including recommendations of third party pricing vendors and a determination of appropriate pricing methodologies; events that require specific valuation determinations and assessment of fair value techniques; securities with a potential for stale pricing, including those that are illiquid, restricted, or in default; and the effectiveness of third party pricing vendors, including periodic reviews of vendors. The Committee meets more frequently, as needed, to discuss additional valuation matters, which may include the need to review back-testing results, review time-sensitive information or approve related valuation actions. The Committee reports to the Board, with members of the Committee meeting with the Board at each of its regularly scheduled meetings to discuss valuation matters and actions during the period, similar to those described earlier.
For investments categorized as Level 3, the Committee monitors information similar to that described above, which may include: (i) data specific to the issuer or comparable issuers, (ii) general market or specific sector news and (iii) quoted prices and specific or similar security transactions. The Committee considers this data and any changes from prior periods in order to assess the reasonableness of observable and unobservable inputs, any assumptions or internal models used to value those securities and changes in fair value. This data is also used to corroborate, when available, information received from approved pricing vendors and brokers. Various factors impact the frequency of monitoring this information (which may occur as often as daily). However, the Committee may determine that changes to inputs, assumptions and models are not required as a result of the monitoring procedures performed.
The accompanying Notes to Financial Statements are an integral part of this statement.
Annual Report 2015
16
COLUMBIA MID CAP INDEX FUND
PORTFOLIO OF INVESTMENTS (continued)
February 28, 2015
Fair Value Measurements (continued)
The following table is a summary of the inputs used to value the Fund's investments at February 28, 2015:
Description | | Level 1
Quoted Prices in Active
Markets for Identical
Assets ($) | | Level 2
Other Significant
Observable Inputs ($) | | Level 3
Significant
Unobservable Inputs ($) | | Total ($) | |
Equity Securities | |
Common Stocks | |
Consumer Discretionary | | | 532,873,027 | | | | — | | | | — | | | | 532,873,027 | | |
Consumer Staples | | | 140,226,156 | | | | — | | | | — | | | | 140,226,156 | | |
Energy | | | 153,780,089 | | | | — | | | | — | | | | 153,780,089 | | |
Financials | | | 889,139,538 | | | | — | | | | — | | | | 889,139,538 | | |
Health Care | | | 361,553,014 | | | | — | | | | — | | | | 361,553,014 | | |
Industrials | | | 595,991,407 | | | | — | | | | — | | | | 595,991,407 | | |
Information Technology | | | 687,378,709 | | | | — | | | | — | | | | 687,378,709 | | |
Materials | | | 287,546,148 | | | | — | | | | — | | | | 287,546,148 | | |
Telecommunication Services | | | 5,682,151 | | | | — | | | | — | | | | 5,682,151 | | |
Utilities | | | 171,245,146 | | | | — | | | | — | | | | 171,245,146 | | |
Total Equity Securities | | | 3,825,415,385 | | | | — | | | | — | | | | 3,825,415,385 | | |
Mutual Funds | |
Money Market Funds | | | 152,697,480 | | | | — | | | | — | | | | 152,697,480 | | |
Total Mutual Funds | | | 152,697,480 | | | | — | | | | — | | | | 152,697,480 | | |
Investments in Securities | | | 3,978,112,865 | | | | — | | | | — | | | | 3,978,112,865 | | |
Derivatives | |
Assets | |
Futures Contracts | | | 9,027,105 | | | | — | | | | — | | | | 9,027,105 | | |
Total | | | 3,987,139,970 | | | | — | | | | — | | | | 3,987,139,970 | | |
See the Portfolio of Investments for all investment classifications not indicated in the table.
There were no transfers of financial assets between levels during the period.
Derivative instruments are valued at unrealized appreciation (depreciation).
The accompanying Notes to Financial Statements are an integral part of this statement.
Annual Report 2015
17
COLUMBIA MID CAP INDEX FUND
STATEMENT OF ASSETS AND LIABILITIES
February 28, 2015
Assets | |
Investments, at value | |
Unaffiliated issuers (identified cost $2,346,503,497) | | $ | 3,825,415,385 | | |
Affiliated issuers (identified cost $152,697,480) | | | 152,697,480 | | |
Total investments (identified cost $2,499,200,977) | | | 3,978,112,865 | | |
Cash | | | 3,060 | | |
Margin deposits | | | 7,309,700 | | |
Receivable for: | |
Investments sold | | | 733,005 | | |
Capital shares sold | | | 6,832,324 | | |
Dividends | | | 4,051,025 | | |
Expense reimbursement due from Investment Manager | | | 25,071 | | |
Prepaid expenses | | | 6,906 | | |
Total assets | | | 3,997,073,956 | | |
Liabilities | |
Payable for: | |
Investments purchased | | | 625,797 | | |
Capital shares purchased | | | 8,647,114 | | |
Variation margin | | | 698,792 | | |
Investment management fees | | | 10,968 | | |
Distribution and/or service fees | | | 7,366 | | |
Transfer agent fees | | | 991,573 | | |
Administration fees | | | 10,968 | | |
Compensation of board members | | | 151,321 | | |
Other expenses | | | 132,188 | | |
Total liabilities | | | 11,276,087 | | |
Net assets applicable to outstanding capital stock | | $ | 3,985,797,869 | | |
Represented by | |
Paid-in capital | | $ | 2,449,194,441 | | |
Undistributed net investment income | | | 5,292,897 | | |
Accumulated net realized gain | | | 43,371,538 | | |
Unrealized appreciation (depreciation) on: | |
Investments | | | 1,478,911,888 | | |
Futures contracts | | | 9,027,105 | | |
Total — representing net assets applicable to outstanding capital stock | | $ | 3,985,797,869 | | |
The accompanying Notes to Financial Statements are an integral part of this statement.
Annual Report 2015
18
COLUMBIA MID CAP INDEX FUND
STATEMENT OF ASSETS AND LIABILITIES (continued)
February 28, 2015
Class A | |
Net assets | | $ | 1,067,529,258 | | |
Shares outstanding | | | 66,123,370 | | |
Net asset value per share | | $ | 16.14 | | |
Class I | |
Net assets | | $ | 2,709 | | |
Shares outstanding | | | 168 | | |
Net asset value per share(a) | | $ | 16.09 | | |
Class R5 | |
Net assets | | $ | 618,948,335 | | |
Shares outstanding | | | 37,888,299 | | |
Net asset value per share | | $ | 16.34 | | |
Class Z | |
Net assets | | $ | 2,299,317,567 | | |
Shares outstanding | | | 142,936,579 | | |
Net asset value per share | | $ | 16.09 | | |
(a) Net asset value per share rounds to this amount due to fractional shares outstanding.
The accompanying Notes to Financial Statements are an integral part of this statement.
Annual Report 2015
19
COLUMBIA MID CAP INDEX FUND
STATEMENT OF OPERATIONS
Year Ended February 28, 2015
Net investment income | |
Income: | |
Dividends — unaffiliated issuers | | $ | 53,280,923 | | |
Dividends — affiliated issuers | | | 89,516 | | |
Interest | | | 107 | | |
Total income | | | 53,370,546 | | |
Expenses: | |
Investment management fees | | | 3,796,538 | | |
Distribution and/or service fees | |
Class A | | | 2,492,055 | | |
Transfer agent fees | |
Class A | | | 1,954,121 | | |
Class R5 | | | 272,208 | | |
Class Z | | | 4,413,168 | | |
Administration fees | | | 3,796,538 | | |
Compensation of board members | | | 69,608 | | |
Custodian fees | | | 31,459 | | |
Printing and postage fees | | | 210,611 | | |
Registration fees | | | 79,154 | | |
Licensing fees | | | 49,184 | | |
Professional fees | | | 61,109 | | |
Other | | | 48,154 | | |
Total expenses | | | 17,273,907 | | |
Fees waived or expenses reimbursed by Investment Manager and its affiliates | | | (7,188,619 | ) | |
Expense reductions | | | (160 | ) | |
Total net expenses | | | 10,085,128 | | |
Net investment income | | | 43,285,418 | | |
Realized and unrealized gain (loss) — net | |
Net realized gain (loss) on: | |
Investments | | | 210,651,768 | | |
Futures contracts | | | 7,379,538 | | |
Net realized gain | | | 218,031,306 | | |
Net change in unrealized appreciation (depreciation) on: | |
Investments | | | 130,939,657 | | |
Futures contracts | | | 3,976,321 | | |
Net change in unrealized appreciation | | | 134,915,978 | | |
Net realized and unrealized gain | | | 352,947,284 | | |
Net increase in net assets resulting from operations | | $ | 396,232,702 | | |
The accompanying Notes to Financial Statements are an integral part of this statement.
Annual Report 2015
20
COLUMBIA MID CAP INDEX FUND
STATEMENT OF CHANGES IN NET ASSETS
| | | Year Ended
February 28,
2015 | | Year Ended
February 28,
2014 | |
Operations | |
Net investment income | | $ | 43,285,418 | | | $ | 36,746,200 | | |
Net realized gain | | | 218,031,306 | | | | 156,421,194 | | |
Net change in unrealized appreciation | | | 134,915,978 | | | | 556,699,124 | | |
Net increase in net assets resulting from operations | | | 396,232,702 | | | | 749,866,518 | | |
Distributions to shareholders | |
Net investment income | |
Class A | | | (9,156,888 | ) | | | (6,693,234 | ) | |
Class I | | | (32 | ) | | | (38 | ) | |
Class R5 | | | (6,127,850 | ) | | | (4,651,402 | ) | |
Class Z | | | (25,711,214 | ) | | | (21,708,037 | ) | |
Net realized gains | |
Class A | | | (50,942,346 | ) | | | (27,529,261 | ) | |
Class I | | | (134 | ) | | | (122 | ) | |
Class R5 | | | (26,657,902 | ) | | | (12,560,033 | ) | |
Class Z | | | (113,684,264 | ) | | | (71,839,464 | ) | |
Total distributions to shareholders | | | (232,280,630 | ) | | | (144,981,591 | ) | |
Increase in net assets from capital stock activity | | | 50,278,566 | | | | 559,531,734 | | |
Total increase in net assets | | | 214,230,638 | | | | 1,164,416,661 | | |
Net assets at beginning of year | | | 3,771,567,231 | | | | 2,607,150,570 | | |
Net assets at end of year | | $ | 3,985,797,869 | | | $ | 3,771,567,231 | | |
Undistributed net investment income | | $ | 5,292,897 | | | $ | 4,374,005 | | |
The accompanying Notes to Financial Statements are an integral part of this statement.
Annual Report 2015
21
COLUMBIA MID CAP INDEX FUND
STATEMENT OF CHANGES IN NET ASSETS (continued)
| | | Year Ended February 28, 2015 | | Year Ended February 28, 2014 | |
| | | Shares | | Dollars ($) | | Shares | | Dollars ($) | |
Capital stock activity | |
Class A shares | |
Subscriptions | | | 26,601,530 | | | | 414,514,294 | | | | 32,504,952 | | | | 462,759,080 | | |
Distributions reinvested | | | 3,521,634 | | | | 54,632,712 | | | | 2,225,447 | | | | 31,996,628 | | |
Redemptions | | | (26,683,853 | ) | | | (414,105,072 | ) | | | (18,254,055 | ) | | | (259,317,650 | ) | |
Net increase | | | 3,439,311 | | | | 55,041,934 | | | | 16,476,344 | | | | 235,438,058 | | |
Class I shares | |
Redemptions | | | (77 | ) | | | (1,200 | ) | | | — | | | | — | | |
Net decrease | | | (77 | ) | | | (1,200 | ) | | | — | | | | — | | |
Class R5 shares | |
Subscriptions | | | 15,239,143 | | | | 238,997,893 | | | | 37,420,766 | | | | 523,232,848 | | |
Distributions reinvested | | | 2,021,342 | | | | 31,714,967 | | | | 1,151,063 | | | | 17,031,261 | | |
Redemptions | | | (11,613,335 | ) | | | (183,705,443 | ) | | | (6,330,892 | ) | | | (93,569,039 | ) | |
Net increase | | | 5,647,150 | | | | 87,007,417 | | | | 32,240,937 | | | | 446,695,070 | | |
Class Z shares | |
Subscriptions | | | 26,769,888 | | | | 415,239,640 | | | | 42,311,877 | | | | 599,526,779 | | |
Distributions reinvested | | | 5,677,573 | | | | 87,759,915 | | | | 4,062,613 | | | | 57,960,240 | | |
Redemptions | | | (38,271,520 | ) | | | (594,769,140 | ) | | | (55,297,746 | ) | | | (780,088,413 | ) | |
Net decrease | | | (5,824,059 | ) | | | (91,769,585 | ) | | | (8,923,256 | ) | | | (122,601,394 | ) | |
Total net increase | | | 3,262,325 | | | | 50,278,566 | | | | 39,794,025 | | | | 559,531,734 | | |
The accompanying Notes to Financial Statements are an integral part of this statement.
Annual Report 2015
22
COLUMBIA MID CAP INDEX FUND
The following tables are intended to help you understand the Fund's financial performance. Certain information reflects financial results for a single share of a class held for the periods shown. Per share net investment income (loss) amounts are calculated based on average shares outstanding during the period. Total return assumes reinvestment of all dividends and distributions, if any. Total return does not reflect payment of sales charges, if any. Total return and portfolio turnover are not annualized for periods of less than one year. The portfolio turnover rate is calculated without regard to purchase and sales transactions of short-term instruments and certain derivatives, if any. If such transactions were included, the Fund's portfolio turnover rate may be higher.
| | | Year Ended February 28, | | Year Ended
February 29, | | Year Ended
February 28, | |
Class A | | 2015 | | 2014 | | 2013 | | 2012 | | 2011 | |
Per share data | |
Net asset value, beginning of period | | $ | 15.49 | | | $ | 12.82 | | | $ | 11.92 | | | $ | 12.33 | | | $ | 9.44 | | |
Income from investment operations: | |
Net investment income | | | 0.15 | | | | 0.14 | | | | 0.14 | | | | 0.10 | | | | 0.09 | | |
Net realized and unrealized gain | | | 1.44 | | | | 3.14 | | | | 1.45 | | | | 0.10 | | | | 2.94 | | |
Total from investment operations | | | 1.59 | | | | 3.28 | | | | 1.59 | | | | 0.20 | | | | 3.03 | | |
Less distributions to shareholders: | |
Net investment income | | | (0.14 | ) | | | (0.11 | ) | | | (0.15 | ) | | | (0.09 | ) | | | (0.09 | ) | |
Net realized gains | | | (0.80 | ) | | | (0.50 | ) | | | (0.54 | ) | | | (0.52 | ) | | | (0.05 | ) | |
Total distributions to shareholders | | | (0.94 | ) | | | (0.61 | ) | | | (0.69 | ) | | | (0.61 | ) | | | (0.14 | ) | |
Net asset value, end of period | | $ | 16.14 | | | $ | 15.49 | | | $ | 12.82 | | | $ | 11.92 | | | $ | 12.33 | | |
Total return | | | 10.58 | % | | | 26.04 | % | | | 14.03 | % | | | 2.12 | % | | | 32.16 | % | |
Ratios to average net assets(a) | |
Total gross expenses | | | 0.66 | % | | | 0.66 | % | | | 0.66 | % | | | 0.66 | % | | | 0.50 | % | |
Total net expenses(b) | | | 0.45 | %(c) | | | 0.45 | %(c) | | | 0.45 | %(c) | | | 0.45 | %(c) | | | 0.45 | %(c) | |
Net investment income | | | 0.96 | % | | | 0.95 | % | | | 1.18 | % | | | 0.83 | % | | | 0.83 | % | |
Supplemental data | |
Net assets, end of period (in thousands) | | $ | 1,067,529 | | | $ | 970,805 | | | $ | 592,450 | | | $ | 470,550 | | | $ | 339,724 | | |
Portfolio turnover | | | 13 | % | | | 14 | % | | | 20 | % | | | 15 | % | | | 10 | % | |
Notes to Financial Highlights
(a) In addition to the fees and expenses that the Fund bears directly, the Fund indirectly bears a pro rata share of the fees and expenses of any other funds in which it invests. Such indirect expenses are not included in the Fund's reported expense ratios.
(b) Total net expenses include the impact of certain fee waivers/expense reimbursements made by the Investment Manager and certain of its affiliates, if applicable.
(c) The benefits derived from expense reductions had an impact of less than 0.01%.
The accompanying Notes to Financial Statements are an integral part of this statement.
Annual Report 2015
23
COLUMBIA MID CAP INDEX FUND
FINANCIAL HIGHLIGHTS (continued)
| | | Year Ended February 28, | | Year Ended
February 29, | | Year Ended
February 28, | |
Class I | | 2015 | | 2014 | | 2013 | | 2012 | | 2011(a) | |
Per share data | |
Net asset value, beginning of period | | $ | 15.43 | | | $ | 12.77 | | | $ | 11.88 | | | $ | 12.29 | | | $ | 10.19 | | |
Income from investment operations: | |
Net investment income | | | 0.19 | | | | 0.17 | | | | 0.17 | | | | 0.12 | | | | 0.04 | | |
Net realized and unrealized gain | | | 1.45 | | | | 3.14 | | | | 1.44 | | | | 0.11 | | | | 2.22 | | |
Total from investment operations | | | 1.64 | | | | 3.31 | | | | 1.61 | | | | 0.23 | | | | 2.26 | | |
Less distributions to shareholders: | |
Net investment income | | | (0.18 | ) | | | (0.15 | ) | | | (0.18 | ) | | | (0.12 | ) | | | (0.11 | ) | |
Net realized gains | | | (0.80 | ) | | | (0.50 | ) | | | (0.54 | ) | | | (0.52 | ) | | | (0.05 | ) | |
Total distributions to shareholders | | | (0.98 | ) | | | (0.65 | ) | | | (0.72 | ) | | | (0.64 | ) | | | (0.16 | ) | |
Net asset value, end of period | | $ | 16.09 | | | $ | 15.43 | | | $ | 12.77 | | | $ | 11.88 | | | $ | 12.29 | | |
Total return | | | 11.00 | % | | | 26.36 | % | | | 14.34 | % | | | 2.40 | % | | | 22.27 | % | |
Ratios to average net assets(b) | |
Total gross expenses | | | 0.20 | % | | | 0.21 | % | | | 0.24 | % | | | 0.20 | % | | | 0.23 | %(c) | |
Total net expenses(d) | | | 0.20 | % | | | 0.20 | % | | | 0.15 | % | | | 0.19 | % | | | 0.19 | %(c)(e) | |
Net investment income | | | 1.21 | % | | | 1.21 | % | | | 1.48 | % | | | 1.08 | % | | | 0.92 | %(c) | |
Supplemental data | |
Net assets, end of period (in thousands) | | $ | 3 | | | $ | 4 | | | $ | 3 | | | $ | 3 | | | $ | 3 | | |
Portfolio turnover | | | 13 | % | | | 14 | % | | | 20 | % | | | 15 | % | | | 10 | % | |
Notes to Financial Highlights
(a) Based on operations from September 27, 2010 (commencement of operations) through the stated period end.
(b) In addition to the fees and expenses that the Fund bears directly, the Fund indirectly bears a pro rata share of the fees and expenses of any other funds in which it invests. Such indirect expenses are not included in the Fund's reported expense ratios.
(c) Annualized.
(d) Total net expenses include the impact of certain fee waivers/expense reimbursements made by the Investment Manager and certain of its affiliates, if applicable.
(e) The benefits derived from expense reductions had an impact of less than 0.01%.
The accompanying Notes to Financial Statements are an integral part of this statement.
Annual Report 2015
24
COLUMBIA MID CAP INDEX FUND
FINANCIAL HIGHLIGHTS (continued)
| | | Year Ended February 28, | |
Class R5 | | 2015 | | 2014 | | 2013(a) | |
Per share data | |
Net asset value, beginning of period | | $ | 15.66 | | | $ | 12.95 | | | $ | 11.81 | | |
Income from investment operations: | |
Net investment income | | | 0.19 | | | | 0.17 | | | | 0.07 | | |
Net realized and unrealized gain | | | 1.47 | | | | 3.19 | | | | 1.57 | | |
Total from investment operations | | | 1.66 | | | | 3.36 | | | | 1.64 | | |
Less distributions to shareholders: | |
Net investment income | | | (0.18 | ) | | | (0.15 | ) | | | (0.16 | ) | |
Net realized gains | | | (0.80 | ) | | | (0.50 | ) | | | (0.34 | ) | |
Total distributions to shareholders | | | (0.98 | ) | | | (0.65 | ) | | | (0.50 | ) | |
Net asset value, end of period | | $ | 16.34 | | | $ | 15.66 | | | $ | 12.95 | | |
Total return | | | 10.92 | % | | | 26.38 | % | | | 14.34 | % | |
Ratios to average net assets(b) | |
Total gross expenses | | | 0.26 | % | | | 0.27 | % | | | 0.21 | %(c) | |
Total net expenses(d) | | | 0.20 | % | | | 0.20 | % | | | 0.16 | %(c) | |
Net investment income | | | 1.21 | % | | | 1.16 | % | | | 1.82 | %(c) | |
Supplemental data | |
Net assets, end of period (in thousands) | | $ | 618,948 | | | $ | 504,850 | | | $ | 3 | | |
Portfolio turnover | | | 13 | % | | | 14 | % | | | 20 | % | |
Notes to Financial Highlights
(a) Based on operations from November 8, 2012 (commencement of operations) through the stated period end.
(b) In addition to the fees and expenses that the Fund bears directly, the Fund indirectly bears a pro rata share of the fees and expenses of any other funds in which it invests. Such indirect expenses are not included in the Fund's reported expense ratios.
(c) Annualized.
(d) Total net expenses include the impact of certain fee waivers/expense reimbursements made by the Investment Manager and certain of its affiliates, if applicable.
The accompanying Notes to Financial Statements are an integral part of this statement.
Annual Report 2015
25
COLUMBIA MID CAP INDEX FUND
FINANCIAL HIGHLIGHTS (continued)
| | | Year Ended February 28, | | Year Ended
February 29, | | Year Ended
February 28, | |
Class Z | | 2015 | | 2014 | | 2013 | | 2012 | | 2011 | |
Per share data | |
Net asset value, beginning of period | | $ | 15.43 | | | $ | 12.78 | | | $ | 11.88 | | | $ | 12.29 | | | $ | 9.41 | | |
Income from investment operations: | |
Net investment income | | | 0.19 | | | | 0.17 | | | | 0.16 | | | | 0.12 | | | | 0.11 | | |
Net realized and unrealized gain | | | 1.45 | | | | 3.13 | | | | 1.45 | | | | 0.11 | | | | 2.93 | | |
Total from investment operations | | | 1.64 | | | | 3.30 | | | | 1.61 | | | | 0.23 | | | | 3.04 | | |
Less distributions to shareholders: | |
Net investment income | | | (0.18 | ) | | | (0.15 | ) | | | (0.17 | ) | | | (0.12 | ) | | | (0.11 | ) | |
Net realized gains | | | (0.80 | ) | | | (0.50 | ) | | | (0.54 | ) | | | (0.52 | ) | | | (0.05 | ) | |
Total distributions to shareholders | | | (0.98 | ) | | | (0.65 | ) | | | (0.71 | ) | | | (0.64 | ) | | | (0.16 | ) | |
Net asset value, end of period | | $ | 16.09 | | | $ | 15.43 | | | $ | 12.78 | | | $ | 11.88 | | | $ | 12.29 | | |
Total return | | | 10.95 | % | | | 26.25 | % | | | 14.35 | % | | | 2.39 | % | | | 32.45 | % | |
Ratios to average net assets(a) | |
Total gross expenses | | | 0.41 | % | | | 0.41 | % | | | 0.41 | % | | | 0.41 | % | | | 0.25 | % | |
Total net expenses(b) | | | 0.20 | %(c) | | | 0.20 | %(c) | | | 0.20 | %(c) | | | 0.20 | %(c) | | | 0.20 | %(c) | |
Net investment income | | | 1.20 | % | | | 1.21 | % | | | 1.39 | % | | | 1.07 | % | | | 1.08 | % | |
Supplemental data | |
Net assets, end of period (in thousands) | | $ | 2,299,318 | | | $ | 2,295,909 | | | $ | 2,014,694 | | | $ | 2,517,203 | | | $ | 2,479,455 | | |
Portfolio turnover | | | 13 | % | | | 14 | % | | | 20 | % | | | 15 | % | | | 10 | % | |
Notes to Financial Highlights
(a) In addition to the fees and expenses that the Fund bears directly, the Fund indirectly bears a pro rata share of the fees and expenses of any other funds in which it invests. Such indirect expenses are not included in the Fund's reported expense ratios.
(b) Total net expenses include the impact of certain fee waivers/expense reimbursements made by the Investment Manager and certain of its affiliates, if applicable.
(c) The benefits derived from expense reductions had an impact of less than 0.01%.
The accompanying Notes to Financial Statements are an integral part of this statement.
Annual Report 2015
26
COLUMBIA MID CAP INDEX FUND
NOTES TO FINANCIAL STATEMENTS
February 28, 2015
Note 1. Organization
Columbia Mid Cap Index Fund (the Fund), a series of Columbia Funds Series Trust (the Trust), is a diversified fund. The Trust is registered under the Investment Company Act of 1940, as amended (the 1940 Act), as an open-end management investment company organized as a Delaware statutory trust.
Fund Shares
The Trust may issue an unlimited number of shares (without par value). The Fund offers Class A, Class I, Class R5 and Class Z shares. Although all share classes generally have identical voting, dividend and liquidation rights, each share class votes separately when required by the Trust's organizational documents or by law. Different share classes pay different distribution amounts to the extent the expenses of such share classes differ, and distributions in liquidation will be proportional to the net asset value of each share class. Each share class has its own expense structure and sales charges.
Class A shares are not subject to any front-end sales charge or contingent deferred sales charge.
Class I shares are not subject to sales charges and are available only to the Columbia Family of Funds.
Class R5 shares are not subject to sales charges and are generally available only to investors purchasing through authorized investment professionals and omnibus retirement plans.
Class Z shares are not subject to sales charges and are available only to eligible investors, which are subject to different investment minimums as described in the Fund's prospectus.
Note 2. Summary of Significant Accounting Policies
Basis of Preparation
The Fund is an investment company that applies the accounting and reporting guidance in the Financial Accounting Standards Board (FASB) Accounting Standards Codification Topic 946, Financial Services — Investment Companies (ASC 946). The financial statements are prepared in accordance with U.S. generally accepted accounting principles (GAAP) which requires management to make certain estimates and assumptions that affect the reported amounts of assets and liabilities, the disclosure of contingent assets and liabilities at the date of the financial statements and the
reported amounts of income and expenses during the reporting period. Actual results could differ from those estimates.
The following is a summary of significant accounting policies followed by the Fund in the preparation of its financial statements.
Security Valuation
All equity securities are valued at the close of business of the New York Stock Exchange (NYSE). Equity securities are valued at the last quoted sales price on the principal exchange or market on which they trade, except for securities traded on the NASDAQ Stock Market, which are valued at the NASDAQ official close price. Unlisted securities or listed securities for which there were no sales during the day are valued at the mean of the latest quoted bid and ask prices on such exchanges or markets.
Foreign equity securities are valued based on quotations from the principal market in which such securities are traded. If any foreign security prices are not readily available as a result of limited share activity, the securities are valued at the mean of the latest quoted bid and ask prices on such exchanges or markets. Foreign currency exchange rates are generally determined at 4:00 p.m. Eastern (U.S.) time. Many securities markets and exchanges outside the U.S. close prior to the close of the NYSE; therefore, the closing prices for securities in such markets or on such exchanges may not fully reflect events that occur after such close but before the close of the NYSE. In those situations, foreign securities will be fair valued pursuant to a policy adopted by the Board of Trustees (the Board), including, if available, utilizing a third party pricing service to determine these fair values. The third party pricing service takes into account multiple factors, including, but not limited to, movements in the U.S. securities markets, certain depositary receipts, futures contracts and foreign exchange rates that have occurred subsequent to the close of the foreign exchange or market, to determine a good faith estimate that reasonably reflects the current market conditions as of the close of the NYSE. The fair value of a security is likely to be different from the quoted or published price, if available.
Investments in open-end investment companies, including money market funds, are valued at their net asset value.
Futures and options on futures contracts are valued based upon the settlement price established each day by the board of trade or exchange on which they are traded.
Annual Report 2015
27
COLUMBIA MID CAP INDEX FUND
NOTES TO FINANCIAL STATEMENTS (continued)
February 28, 2015
Investments for which market quotations are not readily available, or that have quotations which management believes are not reliable, are valued at fair value as determined in good faith under procedures established by and under the general supervision of the Board. If a security or class of securities (such as foreign securities) is valued at fair value, such value is likely to be different from the quoted or published price for the security.
The determination of fair value often requires significant judgment. To determine fair value, management may use assumptions including but not limited to future cash flows and estimated risk premiums. Multiple inputs from various sources may be used to determine fair value.
Derivative Instruments
The Fund invests in certain derivative instruments, as detailed below, to meet its investment objectives. Derivatives are instruments whose values depend on, or are derived from, in whole or in part, the value of one or more other assets, such as securities, currencies, commodities or indices. Derivative instruments may be used to increase investment flexibility (including to maintain cash reserves while maintaining exposure to certain other assets), for risk management (hedging) purposes, to facilitate trading, to reduce transaction costs and to pursue higher investment returns. The Fund may also use derivative instruments to mitigate certain investment risks, such as foreign currency exchange rate risk, interest rate risk and credit risk. Derivatives may involve various risks, including the potential inability of the counterparty to fulfill its obligation under the terms of the contract, the potential for an illiquid secondary market (making it difficult for the Fund to sell, including at favorable prices) and the potential for market movements which may expose the Fund to gains or losses in excess of the amount shown in the Statement of Assets and Liabilities. The notional amounts of derivative instruments, if applicable, are not recorded in the financial statements.
A derivative instrument may suffer a marked-to-market loss if the value of the contract decreases due to an unfavorable change in the market rates or values of the underlying instrument. Losses can also occur if the counterparty does not perform under the contract. The Fund's risk of loss from counterparty credit risk on over-the-counter derivatives is generally limited to the aggregate unrealized gain netted against any collateral held by the Fund and the amount of any variation margin held by the counterparty. With exchange-traded or centrally cleared derivatives, there is reduced counterparty credit risk to the Fund since the exchange's clearinghouse, as
counterparty to such instruments, guarantees against a possible default. The clearinghouse stands between the buyer and the seller of the contract; therefore, the counterparty credit risk is failure of the clearinghouse. However, credit risk still exists in exchange-traded or centrally cleared derivatives with respect to initial and variation margin that is held in a broker's customer account. While brokers are required to segregate customer margin from their own assets, in the event that a broker becomes insolvent or goes into bankruptcy and at that time there is a shortfall in the aggregate amount of margin held by the broker for all its clients, U.S. bankruptcy laws will typically allocate that shortfall on a pro-rata basis across all the broker's customers (including the Fund), potentially resulting in losses to the Fund.
In order to better define its contractual rights and to secure rights that will help the Fund mitigate its counterparty risk, the Fund may enter into an International Swaps and Derivatives Association, Inc. Master Agreement (ISDA Master Agreement) or similar agreement with its derivative contract counterparties. An ISDA Master Agreement is an agreement between the Fund and a counterparty that governs over-the-counter derivatives and forward foreign currency exchange contracts and typically contains, among other things, collateral posting terms and netting provisions in the event of a default and/or termination event. Under an ISDA Master Agreement, the Fund may, under certain circumstances, offset with the counterparty certain derivative instrument's payables and/or receivables with collateral held and/or posted and create one single net payment. The provisions of the ISDA Master Agreement typically permit a single net payment in the event of default (close-out netting) including the bankruptcy or insolvency of the counterparty. Note, however, that bankruptcy or insolvency laws of a particular jurisdiction may impose restrictions on or prohibitions against the right of offset in bankruptcy, insolvency or other events.
Collateral (margin) requirements differ by type of derivative. Margin requirements are established by the exchange or clearinghouse for exchange-traded and centrally cleared derivatives. Brokers can ask for margin in excess of the minimum in certain circumstances. Collateral terms are contract specific for over-the-counter derivatives. For over-the-counter derivatives traded under an ISDA Master Agreement, the collateral requirements are typically calculated by netting the marked-to-market amount for each transaction under such agreement and comparing that amount to the value of any variation margin currently pledged by the Fund and/or the counterparty. Generally, the amount of collateral due from
Annual Report 2015
28
COLUMBIA MID CAP INDEX FUND
NOTES TO FINANCIAL STATEMENTS (continued)
February 28, 2015
or to a party has to exceed a minimum transfer amount threshold (e.g., $500,000) before a transfer has to be made. To the extent amounts due to the Fund from its counterparties are not fully collateralized, contractually or otherwise, the Fund bears the risk of loss from counterparty nonperformance. The Fund attempts to mitigate counterparty risk by only entering into agreements with counterparties that it believes have the financial resources to honor their obligations and by monitoring the financial stability of those counterparties.
Certain ISDA Master Agreements allow counterparties to over-the-counter derivatives to terminate derivative contracts prior to maturity in the event the Fund's net assets decline by a stated percentage over a specified time period or if the Fund fails to meet the terms of the ISDA Master Agreement, which would cause the Fund to accelerate payment of any net liability owed to the counterparty. The Fund also has termination rights if the counterparty fails to meet the terms of the ISDA Master Agreement. In addition to considering counterparty credit risk, the Fund would consider terminating the derivative contracts based on whether termination would result in a net liability owed from the counterparty.
For financial reporting purposes, the Fund does not offset derivative assets and derivative liabilities that are subject to netting arrangements in the Statement of Assets and Liabilities.
Futures Contracts
Futures contracts are exchange traded and represent commitments for the future purchase or sale of an asset at a specified price on a specified date. The Fund bought and sold futures contracts to maintain appropriate equity market exposure while keeping sufficient cash to accommodate daily redemptions. These instruments may be used for other purposes in future periods. Upon entering into futures contracts, the Fund bears risks that it may not achieve the anticipated benefits of the futures contracts and may realize a loss. Additional risks include counterparty credit risk, the possibility of an illiquid market, and that a change in the value of the contract or option may not correlate with changes in the value of the underlying asset.
Upon entering into a futures contract, the Fund pledges cash or securities with the broker in an amount sufficient to meet the initial margin requirement. The initial margin deposit must be maintained at an established level over the life of the contract. Cash deposited as initial margin is recorded in the Statement of Assets and Liabilities as margin deposits. Securities deposited as initial margin
are designated in the Portfolio of Investments. Subsequent payments (variation margin) are made or received by the Fund each day. The variation margin payments are equal to the daily change in the contract value and are recorded as variation margin receivable or payable and are offset in unrealized gains or losses. The Fund recognizes a realized gain or loss when the contract is closed or expires. Futures contracts involve, to varying degrees, risk of loss in excess of the variation margin disclosed in the Statement of Assets and Liabilities.
Effects of Derivative Transactions in the Financial Statements
The following tables are intended to provide additional information about the effect of derivatives on the financial statements of the Fund, including: the fair value of derivatives by risk category and the location of those fair values in the Statement of Assets and Liabilities; and the impact of derivative transactions over the period in the Statement of Operations, including realized gains or losses and unrealized gains or losses. The derivative schedules following the Portfolio of Investments present additional information regarding derivative instruments outstanding at the end of the period, if any.
The following table is a summary of the fair value of derivative instruments (not considered to be hedging instruments for accounting disclosure purposes) at February 28, 2015:
Asset Derivatives | |
Risk Exposure
Category | | Statement of Assets and
Liabilities Location | | Fair Value ($) | |
Equity risk
| | Net assets — unrealized
appreciation on
futures contracts | | | 9,027,105
| * | |
*Includes cumulative appreciation (depreciation) as reported in the tables following the Portfolio of Investments. Only the current day's variation margin is reported in receivables or payables in the Statement of Assets and Liabilities.
The following table indicates the effect of derivative instruments (not considered to be hedging instruments for accounting disclosure purposes) in the Statement of Operations for the year ended February 28, 2015:
Amount of Realized Gain (Loss) on Derivatives Recognized in Income | |
Risk Exposure Category | | Futures Contracts ($) | |
Equity risk | | | 7,379,538 | | |
Change in Unrealized Appreciation (Depreciation) on
Derivatives Recognized in Income | |
Risk Exposure Category | | Futures Contracts ($) | |
Equity risk | | | 3,976,321 | | |
Annual Report 2015
29
COLUMBIA MID CAP INDEX FUND
NOTES TO FINANCIAL STATEMENTS (continued)
February 28, 2015
The following table is a summary of the average outstanding volume by derivative instrument for the year ended February 28, 2015:
Derivative Instrument | | Average notional amounts ($)* | |
Futures contracts — Long | | | 114,291,383 | | |
*Based on the ending quarterly outstanding amounts for the year ended February 28, 2015.
Security Transactions
Security transactions are accounted for on the trade date. Cost is determined and gains (losses) are based upon the specific identification method for both financial statement and federal income tax purposes.
Income Recognition
Corporate actions and dividend income are generally recorded net of any non-reclaimable tax withholdings, on the ex-dividend date or upon receipt of ex-dividend notification in the case of certain foreign securities.
The Fund may receive distributions from holdings in business development companies (BDCs), exchange-traded funds (ETFs), other regulated investment companies (RICs), and real estate investment trusts (REITs), which report information on the character of their distributions annually. These distributions are allocated to dividend income, capital gain and return of capital based on actual information reported. To the extent actual information has not yet been reported by the REITs, estimates for return of capital are made by the Fund's management. Return of capital is recorded as a reduction of the cost basis of securities held. If the Fund no longer owns the applicable securities, return of capital is recorded as a realized gain. Management's estimates are subsequently adjusted when the actual character of the distributions is disclosed by the REITs, which could result in a proportionate change in return of capital to shareholders. No estimates are made for the BDCs, ETFs, and RICs.
Awards from class action litigation are recorded as a reduction of cost basis if the Fund still owns the applicable securities on the payment date. If the Fund no longer owns the applicable securities, the proceeds are recorded as realized gains.
Expenses
General expenses of the Trust are allocated to the Fund and other funds of the Trust based upon relative net assets or other expense allocation methodologies determined by the nature of the expense. Expenses directly attributable to the Fund are charged to the Fund. Expenses directly attributable to a specific class of shares are charged to that share class.
Determination of Class Net Asset Value
All income, expenses (other than class-specific expenses, which are charged to that share class, as shown in the Statement of Operations) and realized and unrealized gains (losses) are allocated to each class of the Fund on a daily basis, based on the relative net assets of each class, for purposes of determining the net asset value of each class.
Federal Income Tax Status
The Fund intends to qualify each year as a regulated investment company under Subchapter M of the Internal Revenue Code, as amended, and will distribute substantially all of its taxable income (including net short-term capital gains), if any, for its tax year, and as such will not be subject to federal income taxes. In addition, the Fund intends to distribute in each calendar year substantially all of its net investment income, capital gains and certain other amounts, if any, such that the Fund should not be subject to federal excise tax. Therefore, no federal income or excise tax provision is recorded.
Distributions to Shareholders
Distributions from net investment income, if any, are declared and paid semi-annually. Net realized capital gains, if any, are distributed at least annually. Income distributions and capital gain distributions are determined in accordance with federal income tax regulations, which may differ from GAAP.
Guarantees and Indemnifications
Under the Trust's organizational documents and, in some cases, by contract, its officers and trustees are indemnified against certain liabilities arising out of the performance of their duties to the Trust or its funds. In addition, certain of the Fund's contracts with its service providers contain general indemnification clauses. The Fund's maximum exposure under these arrangements is unknown since the amount of any future claims that may be made against the Fund cannot be determined, and the Fund has no historical basis for predicting the likelihood of any such claims.
Note 3. Fees and Compensation Paid to Affiliates
Investment Management Fees
Under an Investment Management Services Agreement, Columbia Management Investment Advisers, LLC (the Investment Manager), a wholly-owned subsidiary of Ameriprise Financial, Inc. (Ameriprise Financial), determines which securities will be purchased, held or
Annual Report 2015
30
COLUMBIA MID CAP INDEX FUND
NOTES TO FINANCIAL STATEMENTS (continued)
February 28, 2015
sold. The investment management fee is an annual fee that is equal to 0.10% of the Fund's average daily net assets.
Administration Fees
Under an Administrative Services Agreement, the Investment Manager also serves as the Fund Administrator. The Fund pays the Fund Administrator an annual fee for administration and accounting services equal to 0.10% of the Fund's average daily net assets.
Other Expenses
Other expenses are for, among other things, miscellaneous expenses of the Fund or the Board, including payments to a company providing limited administrative services to the Fund and the Board. That company's expenses include boardroom and office expense, employee compensation, employee health and retirement benefits, and certain other expenses. For the year ended February 28, 2015, other expenses paid by the Fund to this company were $6,694.
Compensation of Board Members
Board members are compensated for their services to the Fund as disclosed in the Statement of Operations. Under a Deferred Compensation Plan (the Plan), the Board members who are not "interested persons" of the Fund, as defined under the 1940 Act, may elect to defer payment of up to 100% of their compensation. Deferred amounts are treated as though equivalent dollar amounts had been invested in shares of certain funds managed by the Investment Manager. The Fund's liability for these amounts is adjusted for market value changes and remains in the Fund until distributed in accordance with the Plan.
Transfer Agent Fees
Under a Transfer and Dividend Disbursing Agent Agreement, Columbia Management Investment Services Corp. (the Transfer Agent), an affiliate of the Investment Manager and a wholly-owned subsidiary of Ameriprise Financial, is responsible for providing transfer agency services to the Fund. The Transfer Agent has contracted with Boston Financial Data Services (BFDS) to serve as sub-transfer agent.
Effective November 1, 2014, the Transfer Agent receives a monthly transfer agency fee based on the number or the average value of accounts, depending on the type of account. Prior to November 1, 2014, the Transfer Agent received a monthly account-based service fee based on the number of open accounts. In addition, the Transfer Agent also receives sub-transfer agency fees based on a
percentage of the average aggregate value of the Fund's shares maintained in omnibus accounts (other than omnibus accounts for which American Enterprise Investment Services Inc. is the broker of record or accounts where the beneficial shareholder is a customer of Ameriprise Financial Services, Inc., for which the Transfer Agent receives a per account fee). The Transfer Agent pays the fees of BFDS for services as sub-transfer agent and is not entitled to reimbursement for such fees from the Fund (with the exception of out-of-pocket fees).
The Transfer Agent also receives compensation from the Fund for various shareholder services and reimbursements for certain out-of-pocket fees. Class I shares do not pay transfer agency fees. Total transfer agent fees for Class R5 shares are subject to an annual limitation of not more than 0.05% of the average daily net assets attributable to Class R5 shares.
For the year ended February 28, 2015, the Fund's effective transfer agent fee rates as a percentage of average daily net assets of each class were as follows:
Class A | | | 0.20 | % | |
Class R5 | | | 0.05 | | |
Class Z | | | 0.20 | | |
An annual minimum account balance fee of $20 may apply to certain accounts with a value below the applicable share class's initial minimum investment requirements to reduce the impact of small accounts on transfer agent fees. These minimum account balance fees are remitted to the Fund and recorded as part of expense reductions in the Statement of Operations. For the year ended February 28, 2015, these minimum account balance fees reduced total expenses of the Fund by $160.
Distribution and Service Fees
The Fund has an agreement with Columbia Management Investment Distributors, Inc. (the Distributor), an affiliate of the Investment Manager and a wholly-owned subsidiary of Ameriprise Financial, for distribution and shareholder services. The Board has approved, and the Fund has adopted, distribution and shareholder service plans (the Plans) applicable to certain share classes, which set the distribution and service fees for the Fund. These fees are calculated daily and are intended to compensate the Distributor and/or eligible selling and/or servicing agents for selling shares of the Fund and providing services to investors.
Under the Plans, the Fund pays a monthly combined distribution and service fee to the Distributor at the maximum annual rate of 0.25% of the average daily net assets attributable to Class A shares of the Fund.
Annual Report 2015
31
COLUMBIA MID CAP INDEX FUND
NOTES TO FINANCIAL STATEMENTS (continued)
February 28, 2015
Expenses Waived/Reimbursed by the Investment Manager and its Affiliates
The Investment Manager and certain of its affiliates have contractually agreed to waive fees and/or reimburse expenses (excluding certain fees and expenses described below) for the period disclosed below, unless sooner terminated at the sole discretion of the Board, so that the Fund's net operating expenses, after giving effect to fees waived/expenses reimbursed and any balance credits and/or overdraft charges from the Fund's custodian, do not exceed the following annual rates as a percentage of the class' average daily net assets:
| | | Fee Rates Contractual
through
June 30, 2015 | |
Class A | | | 0.45 | % | |
Class I | | | 0.20 | | |
Class R5 | | | 0.20 | | |
Class Z | | | 0.20 | | |
Under the agreement governing these fee waivers and/or expense reimbursement arrangements, the following fees and expenses are excluded from the waiver/reimbursement commitment, and therefore will be paid by the Fund, if applicable: taxes (including foreign transaction taxes), expenses associated with investments in affiliated and non-affiliated pooled investment vehicles (including mutual funds and exchange-traded funds), transaction costs and brokerage commissions, costs related to any securities lending program, dividend expenses associated with securities sold short, inverse floater program fees and expenses, transaction charges and interest on borrowed money, interest, extraordinary expenses and any other expenses the exclusion of which is specifically approved by the Board. This agreement may be modified or amended only with approval from all parties. Any fees waived and/or expenses reimbursed under the expense reimbursement arrangements described above are not recoverable by the Investment Manager or its affiliates in future periods.
Note 4. Federal Tax Information
The timing and character of income and capital gain distributions are determined in accordance with income tax regulations, which may differ from GAAP because of temporary or permanent book to tax differences.
At February 28, 2015, these differences are primarily due to differing treatment for deferral/reversal of wash sale losses, Trustees' deferred compensation, derivative investments, and earnings and profits distributed to
shareholders on the redemption of shares. To the extent these differences are permanent, reclassifications are made among the components of the Fund's net assets in the Statement of Assets and Liabilities. Temporary differences do not require reclassifications. In the Statement of Assets and Liabilities the following reclassifications were made:
Undistributed net investment income | | $ | (1,370,542 | ) | |
Accumulated net realized gain | | | (17,143,150 | ) | |
Paid-in capital | | | 18,513,692 | | |
Net investment income (loss) and net realized gains (losses), as disclosed in the Statement of Operations, and net assets were not affected by this reclassification.
The tax character of distributions paid during the years indicated was as follows:
Year Ended February 28, | | 2015 | | 2014 | |
Ordinary income | | $ | 48,145,426 | | | $ | 44,152,563 | | |
Long-term capital gains | | | 184,135,204 | | | | 100,829,028 | | |
Total | | $ | 232,280,630 | | | $ | 144,981,591 | | |
Short-term capital gain distributions, if any, are considered ordinary income distributions for tax purposes.
At February 28, 2015, the components of distributable earnings on a tax basis were as follows:
Undistributed ordinary income | | $ | 7,158,215 | | |
Undistributed long-term capital gains | | | 66,336,311 | | |
Net unrealized appreciation | | | 1,463,256,700 | | |
At February 28, 2015, the cost of investments for federal income tax purposes was $2,514,856,165 and the aggregate gross unrealized appreciation and depreciation based on that cost was:
Unrealized appreciation | | $ | 1,543,991,305 | | |
Unrealized depreciation | | | (80,734,605 | ) | |
Net unrealized appreciation | | $ | 1,463,256,700 | | |
Management of the Fund has concluded that there are no significant uncertain tax positions in the Fund that would require recognition in the financial statements. However, management's conclusion may be subject to review and adjustment at a later date based on factors including, but not limited to, new tax laws, regulations, and administrative interpretations (including relevant court decisions). Generally, the Fund's federal tax returns for the prior three fiscal years remain subject to examination by the Internal Revenue Service.
Annual Report 2015
32
COLUMBIA MID CAP INDEX FUND
NOTES TO FINANCIAL STATEMENTS (continued)
February 28, 2015
Note 5. Portfolio Information
The cost of purchases and proceeds from sales of securities, excluding short-term investments and derivatives, if any, aggregated to $465,602,189 and $647,985,091, respectively, for the year ended February 28, 2015. The amount of purchase and sale activity impacts the portfolio turnover rate reported in the Financial Highlights.
Note 6. Affiliated Money Market Fund
The Fund invests in Columbia Short-Term Cash Fund, an affiliated money market fund established for the exclusive use by the Fund and other affiliated funds. The income earned by the Fund from such investments is included as Dividends — affiliated issuers in the Statement of Operations. As an investing fund, the Fund indirectly bears its proportionate share of the expenses of Columbia Short-Term Cash Fund.
Note 7. Shareholder Concentration
At February 28, 2015, two unaffiliated shareholders of record owned 33.6% of the outstanding shares of the Fund in one or more accounts. The Fund has no knowledge about whether any portion of those shares was owned beneficially. Subscription and redemption activity by concentrated accounts may have a significant effect on the operations of the Fund.
Note 8. Line of Credit
The Fund has entered into a revolving credit facility with a syndicate of banks led by JPMorgan Chase Bank, N.A. (JPMorgan) whereby the Fund may borrow for the temporary funding of shareholder redemptions or for other temporary or emergency purposes. Pursuant to a December 9, 2014 amendment, the credit facility agreement, which is a collective agreement between the Fund and certain other funds managed by the Investment Manager, severally and not jointly, permits collective borrowings up to $550 million. Interest is charged to each participating fund based on its borrowings at a rate equal to the higher of (i) the overnight federal funds rate plus 1.00% or (ii) the one-month LIBOR rate plus 1.00%. Each borrowing under the credit facility matures no later than 60 days after the date of borrowing. The Fund also pays a commitment fee equal to its pro rata share of the amount of the credit facility at a rate of 0.075% per annum. The commitment fee is included in other expenses in the Statement of Operations. Prior to the December 9, 2014 amendment, the credit facility agreement permitted borrowings up to $500 million
under the same terms and interest rates as described above.
The Fund had no borrowings during the year ended February 28, 2015.
Note 9. Significant Risks
Financial Sector Risk
Sector risk occurs when a fund invests a significant portion of its assets in securities of companies conducting business in a related group of industries within an economic sector. Companies in the same economic sector may be similarly affected by economic, regulatory, political or market events or conditions, making a fund more vulnerable to unfavorable developments in that economic sector than funds that invest more broadly. The Fund may be more susceptible to the particular risks that may affect companies in the financial sector than if it were invested in a wider variety of companies in unrelated sectors.
Note 10. Subsequent Events
Management has evaluated the events and transactions that have occurred through the date the financial statements were issued and noted no items requiring adjustment of the financial statements or additional disclosure.
Note 11. Information Regarding Pending and Settled Legal Proceedings
In December 2005, without admitting or denying the allegations, American Express Financial Corporation (AEFC, which is now known as Ameriprise Financial, Inc. (Ameriprise Financial)) entered into settlement agreements with the Securities and Exchange Commission (SEC) and Minnesota Department of Commerce (MDOC) related to market timing activities. As a result, AEFC was censured and ordered to cease and desist from committing or causing any violations of certain provisions of the Investment Advisers Act of 1940, the Investment Company Act of 1940, and various Minnesota laws. AEFC agreed to pay disgorgement of $10 million and civil money penalties of $7 million. AEFC also agreed to retain an independent distribution consultant to assist in developing a plan for distribution of all disgorgement and civil penalties ordered by the SEC in accordance with various undertakings detailed at www.sec.gov/litigation/admin/ia-2451.pdf. Ameriprise Financial and its affiliates have cooperated with the SEC and the MDOC in these legal proceedings, and have made regular reports to the Funds' Boards of Trustees.
Annual Report 2015
33
COLUMBIA MID CAP INDEX FUND
NOTES TO FINANCIAL STATEMENTS (continued)
February 28, 2015
Ameriprise Financial and certain of its affiliates have historically been involved in a number of legal, arbitration and regulatory proceedings, including routine litigation, class actions, and governmental actions, concerning matters arising in connection with the conduct of their business activities. Ameriprise Financial believes that the Funds are not currently the subject of, and that neither Ameriprise Financial nor any of its affiliates are the subject of, any pending legal, arbitration or regulatory proceedings that are likely to have a material adverse effect on the Funds or the ability of Ameriprise Financial or its affiliates to perform under their contracts with the Funds. Ameriprise Financial is required to make quarterly (10-Q), annual (10-K) and, as necessary, 8-K filings with the Securities and Exchange Commission on legal and regulatory matters that relate to Ameriprise Financial and its affiliates. Copies of these filings may be obtained by accessing the SEC website at www.sec.gov.
There can be no assurance that these matters, or the adverse publicity associated with them, will not result in increased fund redemptions, reduced sale of fund shares or other adverse consequences to the Funds. Further, although we believe proceedings are not likely to have a material adverse effect on the Funds or the ability of Ameriprise Financial or its affiliates to perform under their contracts with the Funds, these proceedings are subject to uncertainties and, as such, we are unable to estimate the possible loss or range of loss that may result. An adverse outcome in one or more of these proceedings could result in adverse judgments, settlements, fines, penalties or other relief that could have a material adverse effect on the consolidated financial condition or results of operations of Ameriprise Financial.
Annual Report 2015
34
COLUMBIA MID CAP INDEX FUND
REPORT OF INDEPENDENT REGISTERED PUBLIC ACCOUNTING FIRM
To the Trustees of Columbia Funds Series Trust and the Shareholders of
Columbia Mid Cap Index Fund
In our opinion, the accompanying statement of assets and liabilities, including the portfolio of investments, and the related statements of operations and of changes in net assets and the financial highlights present fairly, in all material respects, the financial position of Columbia Mid Cap Index Fund (the "Fund", a series of Columbia Funds Series Trust) at February 28, 2015, and the results of its operations, the changes in its net assets and the financial highlights for each of the periods indicated, in conformity with accounting principles generally accepted in the United States of America. These financial statements and financial highlights (hereafter referred to as "financial statements") are the responsibility of the Fund's management; our responsibility is to express an opinion on these financial statements based on our audits. We conducted our audits of these financial statements in accordance with the standards of the Public Company Accounting Oversight Board (United States). Those standards require that we plan and perform the audit to obtain reasonable assurance about whether the financial statements are free of material misstatement. An audit includes examining, on a test basis, evidence supporting the amounts and disclosures in the financial statements, assessing the accounting principles used and significant estimates made by management, and evaluating the overall financial statement presentation. We believe that our audits, which included confirmation of securities at February 28, 2015 by correspondence with the custodian, brokers and transfer agent, provide a reasonable basis for our opinion.
PricewaterhouseCoopers LLP
Minneapolis, Minnesota
April 21, 2015
Annual Report 2015
35
COLUMBIA MID CAP INDEX FUND
FEDERAL INCOME TAX INFORMATION
(Unaudited)
The Fund hereby designates the following tax attributes for the fiscal year ended February 28, 2015. Shareholders will be notified in early 2016 of the amounts for use in preparing 2015 income tax returns.
Tax Designations:
| Qualified Dividend Income | | | 84.41 | % | |
| Dividends Received Deduction | | | 84.35 | % | |
Capital Gain Dividend | | $ | 226,748,460 | | |
Qualified Dividend Income. For taxable, non-corporate shareholders, the percentage of ordinary income distributed during the fiscal year that represents qualified dividend income subject to reduced tax rates.
Dividends Received Deduction. The percentage of ordinary income distributed during the fiscal year that qualifies for the corporate dividends received deduction.
Capital Gain Dividend. The Fund designates as a capital gain dividend the amount reflected above, or if subsequently determined to be different, the net capital gain of such fiscal period.
Annual Report 2015
36
COLUMBIA MID CAP INDEX FUND
Shareholders elect the Board that oversees the Funds' operations. The Board appoints officers who are responsible for day-to-day business decisions based on policies set by the Board. The following table provides basic biographical information about the Funds' Board members, including their principal occupations during the past five years, although specific titles for individuals may have varied over the period. Under current Board policy, members may serve through the end of the calendar year in which he or she reaches either the mandatory retirement age established by the Board or the fifteenth anniversary of the first Board meeting they attended as a member of the Board.
Independent Trustees
Name,
Address,
Year of Birth | | Position Held With
Funds and Length of
Service | | Principal Occupation(s)
During Past Five Years
and Other Relevant
Professional Experience | | Number of
Funds in the
Fund Family
Overseen by
Board Member | | Other Present or Past
Directorships/
Trusteeships
(Within Past 5 Years) | |
Kathleen Blatz
901 S. Marquette Ave.
Minneapolis, MN 55402
1954 | | Board member since 1/06 for RiverSource Funds and since 6/11 for Nations Funds | | Attorney; specializing in arbitration and mediation; Chief Justice, Minnesota Supreme Court, 1998-2006; Associate Justice, Minnesota Supreme Court, 1996-1998; Fourth Judicial District Court Judge, Hennepin Country, 1994-1996; Attorney in private practice and public service, 1984-1993; State Representative, Minnesota House of Representatives, 1979-1993, which included service on the Tax and Financial Institutions and Insurance Committees | | | 127 | | | Trustee, BlueCross BlueShield of Minnesota (Chair of the Business Development Committee) since 2009; Chair of the Robina Foundation since August 2013 | |
Edward J. Boudreau, Jr.
901 S. Marquette Ave.
Minneapolis, MN 55402
1944 | | Board member since 6/11 for RiverSource Funds and since 1/05 for Nations Funds | | Managing Director, E.J. Boudreau & Associates (consulting) since 2000; FINRA Industry Arbitrator, 2002-present; Chairman and Chief Executive Officer, John Hancock Funds (asset management), Chairman and Interested Trustee for open-end and closed-end funds offered by John Hancock, 1989-2000; John Hancock Life Insurance Company, including SVP and Treasurer and SVP Information Technology, 1968-1988 | | | 125 | | | Former Trustee, BofA Funds Series Trust (11 funds), 2005-2011; Trustee, Boston Museum of Science (Chair of Finance Committee), 1985-2013 | |
Pamela G. Carlton
901 S. Marquette Ave.
Minneapolis, MN 55402
1954 | | Board member since 7/07 for RiverSource Funds and since 6/11 for Nations Funds | | President, Springboard — Partners in Cross Cultural Leadership (consulting company) since 2003; Managing Director of US Equity Research, JP Morgan Chase, 1999-2003; Director of US Equity Research, Chase Asset Management, 1996- 1999; Co-Director Latin America Research, 1993-1996, COO Global Research, 1992-1996, Co-Director of US Research, 1991-1992, Investment Banker, Morgan Stanley, 1982-1991 | | | 127 | | | None | |
Annual Report 2015
37
COLUMBIA MID CAP INDEX FUND
TRUSTEES AND OFFICERS (continued)
Independent Trustees (continued)
Name,
Address,
Year of Birth | | Position Held With
Funds and Length of
Service | | Principal Occupation(s)
During Past Five Years
and Other Relevant
Professional Experience | | Number of
Funds in the
Fund Family
Overseen by
Board Member | | Other Present or Past
Directorships/
Trusteeships
(Within Past 5 Years) | |
William P. Carmichael
901 S. Marquette Ave.
Minneapolis, MN 55402
1943 | | Chair of the Board since 1/14, Board member since 6/11 for RiverSource Funds and since 2003 for Nations Funds | | Retired; Co-founder, The Succession Fund (provides exit strategies to owners of privately held companies) 1998-2007; Adjunct Professor of Finances, Kelley School of Business, Indiana University, 1993-2007; Senior Vice President, Sara Lee Corporation, 1991-1993; Senior Vice President and Chief Financial Officer, Beatrice Foods Company, 1984-1990; Vice President, Esmark, Inc, 1973-1984.; Associate, Price Waterhouse, 1968-1972 | | | 127 | | | Director, Cobra Electronics Corporation (electronic equipment manufacturer), 1994-August 2014; The Finish Line (athletic shoes and apparel) since July 2003; Director, International Textile Corp. since 2012; former Director, McMoRan Exploration Company (oil and gas exploration and development) 2010-2013; former Trustee, BofA Funds Series Trust (11 funds) 2009-2011; Director, Spectrum Brands, Inc. (consumer products), 2002-2009; Director, Simmons Company (bedding), 2004-2010 | |
Patricia M. Flynn
901 S. Marquette Ave.
Minneapolis, MN 55402
1950 | | Board member since 11/04 for RiverSource Funds and since 6/11 for Nations Funds | | Trustee Professor of Economics and Management, Bentley University since 1976 (also teaches and conducts research on corporate governance); Dean, McCallum Graduate School of Business, Bentley University, 1992-2002 | | | 127 | | | Trustee, MA Taxpayers Foundation since 1997; Board of Governors, Innovation Institute, MA Technology Collaborative since 2010 | |
William A. Hawkins
901 S. Marquette Ave.
Minneapolis, MN 55402
1942 | | Board member since 6/11 for RiverSource Funds and since 1/05 for Nations Funds | | Managing Director, Overton Partners (financial consulting), since August 2010; President and Chief Executive Officer, California General Bank, N.A., January 2008-August 2010; Operation Hope, COO, 2004-2007; IndyMac Bancorp, President, CBG, 1999-2003; American General Bank, President, 1997-1999; Griffin Financial Services, CEO, 1981-1997; The Griffin Funds, CEO, 1992-1998 | | | 125 | | | Trustee, BofA Funds Series Trust (11 funds) | |
R. Glenn Hilliard
901 S. Marquette Ave.
Minneapolis, MN 55402
1943 | | Board member since 6/11 for RiverSource Funds and since 1/05 for Nations Funds | | Chairman and Chief Executive Officer, Hilliard Group LLC (investing and consulting) since April 2003; Non-Executive Director & Chairman, CNO Financial Group, Inc. (insurance), September 2003-May 2011 | | | 125 | | | Chairman, BofA Funds Series Trust (11 funds); former Director, CNO Financial Group, Inc. (insurance) 2003-2011 | |
Annual Report 2015
38
COLUMBIA MID CAP INDEX FUND
TRUSTEES AND OFFICERS (continued)
Independent Trustees (continued)
Name,
Address,
Year of Birth | | Position Held With
Funds and Length of
Service | | Principal Occupation(s)
During Past Five Years
and Other Relevant
Professional Experience | | Number of
Funds in the
Fund Family
Overseen by
Board Member | | Other Present or Past
Directorships/
Trusteeships
(Within Past 5 Years) | |
Catherine James Paglia
901 S. Marquette Ave.
Minneapolis, MN 55402
1952 | | Board member since 11/04 for RiverSource Funds and since 6/11 for Nations Funds | | Director, Enterprise Asset Management, Inc. (private real estate and asset management company) since September 1998; Managing Director and Partner, Interlaken Capital, Inc., 1989-1997; Managing Director, Morgan Stanley, 1982-1989; Vice President, Investment Banking, 1980-1982, Associate, Investment Banking, 1976-1980, Dean Witter Reynolds, Inc. | | | 127 | | | Director, Valmont Industries, Inc. (irrigation systems manufacturer) since 2012; Trustee, Carleton College (on the Investment Committee); Trustee, Carnegie Endowment for International Peace (on the Investment Committee) | |
Leroy C. Richie
901 S. Marquette Ave.
Minneapolis, MN 55402
1941 | | Board member since 2000 for Seligman Funds, since 11/08 for RiverSource Funds and since 6/11 for Nations Funds | | Counsel, Lewis & Munday, P.C. (law firm) since 2004; Vice President and General Counsel, Automotive Legal Affairs, Chrysler Corporation, 1993-1997 | | | 127 | | | Lead Outside Director, Digital Ally, Inc. (digital imaging) since September 2005; Director, Infinity, Inc. (oil and gas exploration and production) since 1994; Director, OGE Energy Corp. (energy and energy services) since November 2007-2014 | |
Minor M. Shaw
901 S. Marquette Ave.
Minneapolis, MN 55402
1947 | | Board member since 6/11 for RiverSource Funds and since 2003 for Nations Funds | | President, Micco LLC (private investments) since 2011; President, Micco Corp. (family investment business) 1998-2011 | | | 125 | | | Director, Piedmont Natural Gas; Director, BlueCross BlueShield of South Carolina since April 2008; Chair of the Duke Endowment; Director, National Association of Corporate Directors, Carolinas Chapter, since 2013; Chair of Greenville-Spartanburg Airport Commission; former Trustee, BofA Funds Series Trust (11 funds), 2003-2011 | |
Alison Taunton-Rigby
901 S. Marquette Ave.
Minneapolis, MN 55402
1944 | | Board member since 11/02 for RiverSource Funds and since 6/11 for Nations Funds | | Managing Director, Forester Biotech (consulting) since 2001; Chief Executive Officer and Director, RiboNovix, Inc., (biotechnology) 2003-2010; President and Chief Executive Officer of CMT Inc., 2001-2003; Aquila Biopharmaceuticals Inc., 1996-2000; Cambridge Biotech Corporation, 1995-1996, Mitotix Inc., 1993-1994 | | | 127 | | | Director, Healthways, Inc. (health and well-being solutions) since 2005; Director, ICI Mutual Insurance Company, RRG since 2011; Director, Abt Associates (government contractor) since 2001; Director, Boston Children's Hospital since 2002 | |
Annual Report 2015
39
COLUMBIA MID CAP INDEX FUND
TRUSTEES AND OFFICERS (continued)
Interested Trustee Not Affiliated with Investment Manager*
Name,
Address,
Year of Birth | | Position Held With
Funds and Length of
Service | | Principal Occupation
During Past Five Years | | Number of
Funds in the
Fund Family
Overseen by
Board Member | | Other Present or Past
Directorships/
Trusteeships
(Within Past 5 Years) | |
Anthony M. Santomero
901 S. Marquette Ave.
Minneapolis, MN 55402
1946 | | Board member since 6/11 for RiverSource Funds and since 1/08 for Nations Funds | | Richard K. Mellon Professor Emeritus of Finance, The Wharton School, University of Pennsylvania, since 2002; Senior Advisor, McKinsey & Company (consulting), 2006-2008; President, Federal Reserve Bank of Philadelphia, 2000-2006, Professor of Finance, The Wharton School, University of Pennsylvania, 1972-2002 | | | 125 | | | Director, Renaissance Reinsurance Ltd. since May 2008; Trustee, Penn Mutual Life Insurance Company since March 2008; Director, Citigroup Inc. since 2009; Director, Citibank, N.A. since 2009; former Trustee, BofA Funds Series Trust (11 funds), 2008-2011 | |
* Dr. Santomero is not an affiliated person of the Investment Manager or Ameriprise Financial. However, he is currently deemed by the Funds to be an "interested person" (as defined in the 1940 Act) of the Funds because he serves as a Director of Citigroup Inc. and Citibank, N.A., companies that may directly or through subsidiaries and affiliates engage from time-to-time in brokerage execution, principal transactions and lending relationships with the Funds or accounts advised/managed by the Investment Manager.
Annual Report 2015
40
COLUMBIA MID CAP INDEX FUND
TRUSTEES AND OFFICERS (continued)
Interested Trustee Affiliated with Investment Manager*
Name,
Address,
Year of Birth | | Position Held With
Funds and Length of
Service | | Principal Occupation
During Past Five Years | | Number of
Funds in the
Fund Family
Overseen by
Board Member | | Other Present or Past
Directorships/
Trusteeships
(Within Past 5 Years) | |
William F. Truscott
53600 Ameriprise
Financial Center
Minneapolis, MN 55474
1960 | | Board member since 11/01 for RiverSource Funds and since 6/11 for Nations Funds; Senior Vice President since 2002 for RiverSource Funds and since 5/10 for Nations Funds | | Chairman of the Board and President, Columbia Management Investment Advisers, LLC since May 2010 and February 2012, respectively (previously President and Chief Investment Officer, 2001-April 2010); Chief Executive Officer, Global Asset Management, Ameriprise Financial, Inc. since September 2012 (previously Chief Executive Officer, U.S. Asset Management & President, Annuities, May 2010-September 2012 and President — U.S. Asset Management and Chief Investment Officer, 2005-April 2010); Director and Chief Executive Officer, Columbia Management Investment Distributors, Inc. since May 2010 and February 2012, respectively (previously Chairman of the Board and Chief Executive Officer, 2006-April 2010); Chairman of the Board and Chief Executive Officer, RiverSource Distributors, Inc. since 2006; Director, Threadneedle Asset Management Holdings, SARL since 2014; President and Chief Executive Officer, Ameriprise Certificate Company, 2006-August 2012 | | | 186 | | | Former Director, Ameriprise Certificate Company, 2006-January 2013 | |
* Interested person (as defined under the 1940 Act) by reason of being an officer, director, security holder and/or employee of the Investment Manager or Ameriprise Financial.
The Statement of Additional Information has additional information about the Fund's Board members and is available, without charge, upon request by calling 800.345.6611; contacting your financial intermediary or visiting columbiathreadneedle.com/us.
Annual Report 2015
41
COLUMBIA MID CAP INDEX FUND
TRUSTEES AND OFFICERS (continued)
The Board has appointed officers who are responsible for day-to-day business decisions based on policies it has established. The officers serve at the pleasure of the Board. In addition to Mr. Truscott, who is Senior Vice President, the Funds' other officers are:
Fund Officers
Name,
Address and
Year of Birth | | Position and Year
First Appointed to
Position for any Fund
in the Columbia
Funds Complex or a
Predecessor Thereof | | Principal Occupation(s) During Past Five Years | |
Christopher O. Petersen
5228 Ameriprise
Financial Center
Minneapolis, MN 55474
Born 1970 | | President and Principal Executive Officer (2015) | | Vice President and Lead Chief Counsel, Ameriprise Financial, Inc. since January 2015 (previously, Vice President and Chief Counsel January 2010-December 2014; and Vice President and Group Counsel or Counsel 2004-January 2010); officer of Columbia Funds and affiliated funds since 2007. | |
Michael G. Clarke
225 Franklin Street
Boston, MA 02110
Born 1969 | | Treasurer (2011) and Chief Financial Officer (2009) | | Vice President — Mutual Fund Administration, Columbia Management Investment Advisers, LLC, since May 2010; Managing Director of Fund Administration, Columbia Management Advisors, LLC, September 2004-April 2010; senior officer of Columbia Funds and affiliated funds since 2002. | |
Paul B. Goucher
100 Park Avenue
New York, NY 10017
Born 1968 | | Senior Vice President (2011), Chief Legal Officer (2015) and Assistant Secretary (2008) | | Vice President and Lead Chief Counsel, Ameriprise Financial, Inc. since November 2008 and January 2013, respectively (previously Chief Counsel, January 2010-January 2013 and Group Counsel, November 2008-January 2010). | |
Thomas P. McGuire
225 Franklin Street
Boston, MA 02110
Born 1972 | | Vice President and Chief Compliance Officer (2012) | | Vice President — Asset Management Compliance, Ameriprise Financial, Inc., since May 2010; Chief Compliance Officer, Ameriprise Certificate Company since September 2010; Compliance Executive, Bank of America, 2005-April 2010. | |
Colin Moore
225 Franklin Street
Boston, MA 02110
Born 1958 | | Senior Vice President (2010) | | Executive Vice President and Global Chief Investment Officer, Ameriprise Financial, Inc., since July 2013; Director and Global Chief Investment Officer, Columbia Management Investment Advisers, LLC since May 2010; Manager, Managing Director and Chief Investment Officer, Columbia Management Advisors, LLC, 2007-April 2010. | |
Michael E. DeFao
225 Franklin Street
Boston, MA 02110
Born 1968 | | Vice President (2011) and Assistant Secretary (2010) | | Vice President and Chief Counsel, Ameriprise Financial, Inc. since May 2010; Associate General Counsel, Bank of America, 2005-April 2010. | |
Joseph F. DiMaria
225 Franklin Street
Boston, MA 02110
Born 1968 | | Vice President (2011), Assistant Treasurer (2012) and Chief Accounting Officer (2008) | | Vice President — Mutual Fund Treasurer, Columbia Management Investment Advisers, LLC since May 2010; Director of Fund Administration, Columbia Management Advisors, LLC, 2006-April 2010. | |
Amy Johnson
5228 Ameriprise
Financial Center
Minneapolis, MN 55474
Born 1965 | | Vice President (2006) | | Managing Director and Chief Operating Officer, Columbia Management Investment Advisers, LLC since May 2010 (previously Chief Administrative Officer, 2009-April 2010, and Vice President — Asset Management and Trust Company Services, 2006-2009). | |
Lyn Kephart-Strong
5228 Ameriprise
Financial Center
Minneapolis, MN 55474
Born 1960 | | Vice President (2015) | | President, Columbia Management Investment Services Corp. since October 2014; Vice President & Resolution Officer, Ameriprise Trust Company since August 2009; President, RiverSource Service Corporation 2004-2010. | |
Ryan C. Larrenaga
225 Franklin Street
Boston, MA 02110
Born 1970 | | Vice President and Secretary (2015) | | Vice President and Group Counsel, Ameriprise Financial, Inc. since August 2011 (previously, Counsel from May 2010 to August 2011); Assistant General Counsel, Bank of America, 2005-April 2010; officer of Columbia Funds and affiliated funds since 2005. | |
Annual Report 2015
42
COLUMBIA MID CAP INDEX FUND
IMPORTANT INFORMATION ABOUT THIS REPORT
Each fund mails one shareholder report to each shareholder address. If you would like more than one report, please call shareholder services at 800.345.6611 and additional reports will be sent to you.
The policy of the Board is to vote the proxies of the companies in which each fund holds investments consistent with the procedures as stated in the Statement of Additional Information (SAI). You may obtain a copy of the SAI without charge by calling 800.345.6611; contacting your financial intermediary; visiting columbiathreadneedle.com/us; or searching the website of the Securities and Exchange Commission (SEC) at sec.gov. Information regarding how each fund voted proxies relating to portfolio securities is filed with the SEC by August 31st for the most recent 12-month period ending June 30th of that year, and is available without charge by visiting columbiathreadneedle.com/us; or searching the website of the SEC at sec.gov.
Each fund files a complete schedule of portfolio holdings with the SEC for the first and third quarters of each fiscal year on Form N-Q. Each fund's Form N-Q is available on the SEC's website at sec.gov and may be reviewed and copied at the SEC's Public Reference Room in Washington, D.C. Information on the operation of the Public Reference Room may be obtained by calling 800.SEC.0330. Each fund's complete schedule of portfolio holdings, as filed on Form N-Q, can also be obtained without charge, upon request, by calling 800.345.6611.
Annual Report 2015
43
Columbia Mid Cap Index Fund
P.O. Box 8081
Boston, MA 02266-8081

This information is for use with concurrent or prior delivery of a fund prospectus. Please read and consider the investment objectives, risks, charges and expenses for any fund carefully before investing. For a prospectus and summary prospectus, which contains this and other important information about the Fund, go to columbiathreadneedle.com/us. The Fund is distributed by Columbia Management Investment Distributors, Inc., member FINRA, and managed by Columbia Management Investment Advisers, LLC.
Columbia Threadneedle Investments (Columbia Threadneedle) is the global brand name of the Columbia and Threadneedle group of companies.
All rights reserved. Columbia Management Investment Distributors, Inc., 225 Franklin Street, Boston, MA 02110-2804
© 2015 Columbia Management Investment Advisers, LLC.
columbiathreadneedle.com/us
ANN196_02_E01_(04/15)

ANNUAL REPORT
February 28, 2015

COLUMBIA SMALL CAP INDEX FUND

ABOUT COLUMBIA THREADNEEDLE INVESTMENTS
Columbia Threadneedle Investments is a leading global asset management group that provides a broad range of actively managed investment strategies and solutions for individual, institutional and corporate clients around the world.
With more than 2,000 people, including over 450 investment professionals based in North America, Europe and Asia, we manage $506 billion* of assets across developed and emerging market equities, fixed income, asset allocation solutions and alternatives. We are the 11th largest manager of long-term mutual fund assets in the U.S.** and the 5th largest manager of retail funds in the U.K.***
Our priority is the investment success of our clients. We aim to deliver the investment outcomes they expect through an investment approach that is team-based, performance-driven and risk-aware. Our culture is dynamic and interactive. By sharing our insights across asset classes and geographies, we generate richer perspectives on global, regional and local investment landscapes. The ability to exchange and debate investment ideas in a collaborative environment enriches our teams' investment processes. More importantly, it results in better informed investment decisions for our clients.
Columbia funds are distributed by Columbia Management Investment Distributors, Inc., member FINRA, and managed by Columbia Management Investment Advisers, LLC.
Columbia Threadneedle Investments (Columbia Threadneedle) is the global brand name of the Columbia and Threadneedle group of companies.
* In U.S. dollars as of December 31, 2014. Source: Ameriprise Q4 Earnings Release. Includes all assets managed by entities in the Columbia and Threadneedle groups of companies. Contact us for more current data.
** Source: ICI as of December 31, 2014 for Columbia Management Investment Advisers, LLC.
*** Source: Investment Association as of December 2014 for Threadneedle Asset Management Limited.
© 2015 Columbia Management Investment Advisers, LLC. All rights reserved.
Not part of the shareholder report

Dear Shareholder,
In a world that is changing faster than ever before, investors want asset managers who offer a global perspective while generating strong and sustainable returns. To that end, Columbia Management, in conjunction with its U.K.-based affiliate, Threadneedle Investments, has rebranded to Columbia Threadneedle Investments. The new global brand represents the combined capabilities, resources and reach of the global group, offering investors access to the best of both firms.
With a presence in 18 countries and more than 450 investment professionals*, our collective perspective and world view as Columbia Threadneedle Investments gives us deeper insight into what might affect the real-life financial outcomes clients are seeking. Putting our views into a global context enables us to build richer perspectives and create the right solutions, and provides us with enhanced capabilities to deliver consistent investment performance, which may ultimately lead to better investor outcomes.
As a result of the rebrand, you will begin to see our new logo and colors reflected in printed materials, such as this shareholder report, as well as on our new website — columbiathreadneedle.com/us. We encourage you to visit us online and view a new video on the "About Us" tab that speaks to the strength of the firm.
While we are introducing a new brand, in many ways, the investment company you know well has not changed. The following remain in effect:
n Fund and strategy names
n Established investment teams, philosophies and processes
n Account services, features, servicing phone numbers and mailing addresses
n Columbia Management Investment Distributors as distributor and Columbia Management Investment Advisers as investment adviser
We recognize that the money we manage represents the hard work and savings of people like you, and that everyone has different ambitions and different definitions of success. Investors have varying goals — funding their children's education, enjoying their retirement, putting money aside for unexpected events, and more. Whatever your ambitions, we believe our wide range of investment products and solutions can help give you confidence that you will reach your goals.
The world is constantly changing, but our priority remains the same: to help you secure your finances, meet your goals and achieve success. Thank you for your continued investment with us. Our service representatives are available at 800.345.6611 to help with any questions.
Sincerely,

Christopher O. Petersen
President, Columbia Funds
Investors should consider the investment objectives, risks, charges and expenses of a mutual fund carefully before investing. For a free prospectus and summary prospectus, which contains this and other important information about a fund, visit columbiathreadneedle.com/us. The prospectus should be read carefully before investing.
* Source: Ameriprise as of December 1, 2014
Columbia Funds are distributed by Columbia Management Investment Distributors, Inc., member FINRA, and managed by Columbia Management Investment Advisers, LLC.
© 2015 Columbia Management Investment Advisers, LLC. All rights reserved.
COLUMBIA SMALL CAP INDEX FUND
Fund Investment Manager
Columbia Management Investment
Advisers, LLC
225 Franklin Street
Boston, MA 02110
Fund Distributor
Columbia Management Investment
Distributors, Inc.
225 Franklin Street
Boston, MA 02110
Fund Transfer Agent
Columbia Management Investment
Services Corp.
P.O. Box 8081
Boston, MA 02266-8081
For more information about any of the funds, please visit columbiathreadneedle.com/us or call 800.345.6611. Customer Service Representatives are available to answer your questions Monday through Friday from 8 a.m. to 7 p.m. Eastern time.
The views expressed in this report reflect the current views of the respective parties. These views are not guarantees of future performance and involve certain risks, uncertainties and assumptions that are difficult to predict, so actual outcomes and results may differ significantly from the views expressed. These views are subject to change at any time based upon economic, market or other conditions and the respective parties disclaim any responsibility to update such views. These views may not be relied on as investment advice and, because investment decisions for a Columbia fund are based on numerous factors, may not be relied on as an indication of trading intent on behalf of any particular Columbia fund. References to specific securities should not be construed as a recommendation or investment advice.
Performance Overview | | | 3 | | |
Manager Discussion of Fund Performance | | | 5 | | |
Understanding Your Fund's Expenses | | | 7 | | |
Portfolio of Investments | | | 8 | | |
Statement of Assets and Liabilities | | | 21 | | |
Statement of Operations | | | 23 | | |
Statement of Changes in Net Assets | | | 24 | | |
Financial Highlights | | | 26 | | |
Notes to Financial Statements | | | 33 | | |
Report of Independent Registered
Public Accounting Firm | | | 41 | | |
Federal Income Tax Information | | | 42 | | |
Trustees and Officers | | | 43 | | |
Important Information About This Report | | | 49 | | |
COLUMBIA SMALL CAP INDEX FUND
Performance Summary
n Columbia Small Cap Index Fund (the Fund) Class A shares returned 7.19% for the 12-month period that ended February 28, 2015.
n The Fund underperformed its benchmark, the unmanaged S&P SmallCap 600 Index, which returned 7.75% for the same period.
n Mutual funds, unlike unmanaged indices, incur operating expenses, which accounted for the Fund's underperformance relative to the benchmark.
Average Annual Total Returns (%) (for period ended February 28, 2015)
| | | Inception | | 1 Year | | 5 Years | | 10 Years | |
Class A | | 10/15/96 | | | 7.19 | | | | 17.12 | | | | 8.81 | | |
Class B* | | 03/07/11 | | | | | | | | | | | | | |
Excluding sales charges | | | | | | | 6.39 | | | | 16.24 | | | | 8.00 | | |
Including sales charges | | | | | | | 1.45 | | | | 16.02 | | | | 8.00 | | |
Class I* | | 11/16/11 | | | 7.53 | | | | 17.33 | | | | 8.91 | | |
Class K* | | 03/07/11 | | | 7.22 | | | | 17.12 | | | | 8.81 | | |
Class R5* | | 11/08/12 | | | 7.49 | | | | 17.27 | | | | 8.88 | | |
Class W* | | 06/25/14 | | | 7.21 | | | | 17.13 | | | | 8.81 | | |
Class Z | | 10/15/96 | | | 7.47 | | | | 17.40 | | | | 9.08 | | |
S&P SmallCap 600 Index | | | | | | | 7.75 | | | | 17.63 | | | | 9.22 | | |
Returns for Class B are shown with and without the applicable contingent deferred sales charge (CDSC) of 5.00% in the first year, declining to 1.00% in the sixth year and eliminated thereafter. The Fund's other classes are not subject to sales charges and have limited eligibility. Please see the Fund's prospectus for details. Performance for different share classes will vary based on differences in sales charges and fees associated with each class. All results shown assume reinvestment of distributions during the period. Returns do not reflect the deduction of taxes that a shareholder may pay on Fund distributions or on the redemption of Fund shares. Performance results reflect the effect of any fee waivers or reimbursements of Fund expenses by Columbia Management Investment Advisers, LLC and/or any of its affiliates. Absent these fee waivers or expense reimbursement arrangements, performance results would have been lower.
The performance information shown represents past performance and is not a guarantee of future results. The investment return and principal value of your investment will fluctuate so that your shares, when redeemed, may be worth more or less than their original cost. Current performance may be lower or higher than the performance information shown. You may obtain performance information current to the most recent month-end by contacting your financial intermediary, visiting columbiathreadneedle.com/us or calling 800.345.6611.
*The returns shown for periods prior to the share class inception date (including returns for the Life of the Fund, if shown, which are since Fund inception) include the returns of the Fund's oldest share class. Since the Fund launched more than one share class at its inception, Class A shares were used. These returns are adjusted to reflect any higher class-related operating expenses of the newer share classes, as applicable. Please visit columbiathreadneedle.com/us/investment-products/mutual-funds/appended-performance for more information.
The S&P SmallCap 600 Index tracks the performance of 600 domestic companies traded on major stock exchanges. The S&P SmallCap 600 Index is heavily weighted with the stocks of companies with small market capitalizations.
Indices are not available for investment, are not professionally managed and do not reflect sales charges, fees, brokerage commissions, taxes or other expenses of investing. Securities in the Fund may not match those in an index.
Annual Report 2015
3
COLUMBIA SMALL CAP INDEX FUND
PERFORMANCE OVERVIEW (continued)
Performance of a Hypothetical $10,000 Investment (March 1, 2005 – February 28, 2015)
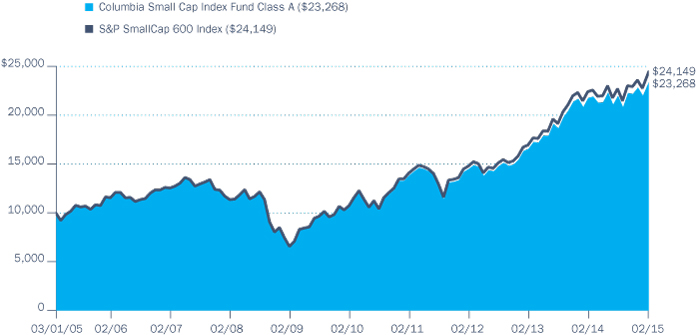
The chart above shows the change in value of a hypothetical $10,000 investment in Class A shares of Columbia Small Cap Index Fund during the stated time period, and does not reflect the deduction of taxes that a shareholder may pay on Fund distributions or on the redemption of Fund shares.
Annual Report 2015
4
COLUMBIA SMALL CAP INDEX FUND
MANAGER DISCUSSION OF FUND PERFORMANCE
For the 12-month period that ended February 28, 2015, the Fund's Class A shares returned 7.19%. The Fund underperformed its benchmark, the unmanaged S&P SmallCap 600 Index, which returned 7.75% for the same period. Mutual funds, unlike unmanaged indices, incur operating expenses, which accounted for the Fund's underperformance relative to the benchmark.
U.S. Equity Market Posted Strong Gains
The S&P SmallCap 600 Index posted healthy gains during the annual period, achieving new highs and broad market participation, even as significant shifts were seen in the business world and wider society.
A torrent of corporate mergers helped drive stocks higher. Alibaba, the dominant Chinese online retailer, executed the largest Initial Public Offering ever in September 2014. A near halving in the price of crude oil during the annual period was bad news for many energy companies, but the decline in the cost of fuel was a boon for airlines. Volatility heightened in the second half of 2014 and into January 2015, as concerns about global economic growth, emerging markets' health, geopolitical tensions and plunging oil prices had investors on edge. A stronger U.S. dollar also led to many companies missing fourth quarter 2014 earnings or reducing forward estimates. After declining in January 2015, the S&P SmallCap 600 Index again gained ground in February 2015, outpacing its large- and mid-cap counterparts for the month. As the market moved higher, volatility moved lower, as concerns about Greece and Ukraine declined and corporate earnings improved. Still, for the annual period as a whole, investors generally rotated toward traditionally defensive sectors, such as healthcare and utilities, helped in part by the steady decline in long-term interest rates. More cyclical sectors, such as materials, were not in favor overall.
S&P SmallCap 600 Index Enjoyed Broad-Based Gains
Seven of the ten sectors of the S&P SmallCap 600 Index posted positive returns during the 12 months ended February 28, 2015. In terms of total return, healthcare, utilities and information technology were the best relative performers. On the basis of impact, which takes weightings and total returns into account, healthcare, information technology and financials were the biggest contributors to the index's return. The top performing industries for the annual period were marine, pharmaceuticals, airlines, water utilities and diversified financial services.
Conversely, energy, materials and telecommunication services, the first two traditionally considered more cyclical sectors, were the weakest sectors from both a total return perspective and on the basis of impact, each posting negative returns. The worst performing industries for the annual period were oil gas and consumable fuels, energy equipment and services, tobacco, real estate management and development and healthcare technology.
Top individual contributors within the S&P SmallCap 600 Index included semiconductor manufacturer TriQuint Semiconductor, specialty pharmaceuticals company Questcor Pharmaceuticals, fast-food restaurant operator and franchiser Jack in the Box, footwear company Skechers
Portfolio Management
Christopher Lo, CFA*
Vadim Shteyn
*Effective December 3, 2014, Christopher Lo was added as a Portfolio Manager to the Fund.
Morningstar Style BoxTM

The Morningstar Style BoxTM is based on a fund's portfolio holdings. For equity funds, the vertical axis shows the market capitalization of the stocks owned, and the horizontal axis shows investment style (value, blend, or growth). Information shown is based on the most recent data provided by Morningstar.
© 2015 Morningstar, Inc. All rights reserved. The Morningstar information contained herein: (1) is proprietary to Morningstar and/or its content providers; (2) may not be copied or distributed; and (3) is not warranted to be accurate, complete or timely. Neither Morningstar nor its content providers are responsible for any damages or losses arising from any use of this information.
Top Ten Holdings (%)
(at February 28, 2015) | |
MAXIMUS, Inc. | | | 0.6 | | |
West Pharmaceutical
Services, Inc. | | | 0.6 | | |
Toro Co. (The) | | | 0.5 | | |
Jack in the Box, Inc. | | | 0.5 | | |
Manhattan Associates, Inc. | | | 0.5 | | |
Buffalo Wild Wings, Inc. | | | 0.5 | | |
Cracker Barrel Old Country
Store, Inc. | | | 0.5 | | |
PAREXEL International Corp. | | | 0.5 | | |
EPR Properties | | | 0.5 | | |
Curtiss-Wright Corp. | | | 0.5 | | |
Percentages indicated are based upon total investments (excluding Money Market Funds).
Annual Report 2015
5
COLUMBIA SMALL CAP INDEX FUND
MANAGER DISCUSSION OF FUND PERFORMANCE (continued)
For further detail about these holdings, please refer to the section entitled "Portfolio of Investments."
Fund holdings are as of the date given, are subject to change at any time, and are not recommendations to buy or sell any security.
Portfolio Breakdown (%)
(at February 28, 2015) | |
Common Stocks | | | 97.8 | | |
Consumer Discretionary | | | 15.0 | | |
Consumer Staples | | | 2.9 | | |
Energy | | | 3.5 | | |
Financials | | | 22.7 | | |
Health Care | | | 11.8 | | |
Industrials | | | 15.7 | | |
Information Technology | | | 16.5 | | |
Materials | | | 5.3 | | |
Telecommunication Services | | | 0.7 | | |
Utilities | | | 3.7 | | |
Money Market Funds | | | 2.2 | | |
Rights | | | 0.0 | (a) | |
Total | | | 100.0 | | |
Percentages indicated are based upon total investments. The Fund's portfolio composition is subject to change.
(a) Rounds to zero.
Investment Risks
Market risk may affect a single issuer, sector of the economy, industry or the market as a whole. Investments in small-cap companies involve risks and volatility greater than investments in larger, more established companies. The Fund's net value will generally decline when the performance of its targeted index declines. Investing in derivatives is a specialized activity that involves special risks, which may result in significant losses. The Fund may invest significantly in issuers within a particular sector, which may be negatively affected by market, economic or other conditions, making the Fund more vulnerable to unfavorable developments in the sector. See the Fund's prospectus for more information on these and other risks.
U.S.A. and specialty pharmaceuticals company Akorn. Top detractors were renewable energy equipment provider GT Advanced Technologies, hardwood flooring retailer Lumber Liquidators Holdings, oil and gas exploration and production company Stone Energy, information technology services provider Medidata Solutions and investment advisory firm Financial Engines.
As always, each sector and stock in the S&P SmallCap 600 Index was represented in the Fund with approximately the same weighting as in the index and therefore had a similar effect.
Index Additions and Deletions Drove Portfolio Changes
During the annual period, there were 63 additions and 63 deletions to the index and the Fund's portfolio. Among those stocks added to the index and Fund were Albany Molecular Research, Scientific Games, Bob Evans Farms, Chesapeake Lodging Trust, Sagent Pharmaceuticals, Universal, Montpelier Re Holdings, Central Pacific Financial, Astoria Financial, CARBO Ceramics, Popeyes Louisiana Kitchen, ManTech International, General Cable, The Brink's Company, Intrepid Potash, Veritiv, MedAssets and Rex Energy.
Deletions included Kate Spade, PacWest Bancorp, PolyOne, Live Nation Entertainment, LaSalle Hotel Properties, OpenTable, ITT Educational Services, GT Advanced Technologies, Tanger Factory Outlet Centers, Sabine Oil & Gas, Symmetry Medical, TreeHouse Foods, TriQuint Semiconductor, Stifel Financial, Akorn, Digital River, Teledyne Technologies and MWI Veterinary Supply.
Looking Ahead
We do not anticipate any changes in the portfolio beyond the customary quarterly rebalancings and stock substitutions we make to align the Fund with the S&P SmallCap 600 Index.
From a broad perspective, the Federal Reserve has given strong signals that economic growth in the U.S. has reached self-sustaining momentum and no longer needs unconventional efforts to support the expansion. We believe several factors support this view. First, the rapid drop in oil prices may act as a significant short-term boost to global economic growth. Second, we believe consumer spending, which currently accounts for approximately 68% of U.S. gross domestic product, should remain relatively healthy, and, in our view, could even accelerate. Third, the economic expansion appears to be in a phase of higher capital expenditures, or capex. Investment-led expansions tend to last longer than those that are led by consumer spending. At the end of the annual period, capacity utilization, a capex leading indicator, was nearing the critical 80% level, which has historically meant demand is sufficiently high to warrant the expansion of capital investments. Further, prior underinvestment in fixed assets and the old age of those assets may suggest a sustained expansion in capex. As the Fund seeks to closely approximate the performance of the S&P SmallCap 600 Index, we will continue to match its industry and risk characteristics by investing primarily in the securities that comprise the index.
Annual Report 2015
6
COLUMBIA SMALL CAP INDEX FUND
UNDERSTANDING YOUR FUND'S EXPENSES
(Unaudited)
As an investor, you incur two types of costs. There are transaction costs, which generally include sales charges on purchases and may include redemption fees. There are also ongoing costs, which generally include management fees, distribution and/or service fees, and other fund expenses. The following information is intended to help you understand your ongoing costs (in dollars) of investing in the Fund and to help you compare these costs with the ongoing costs of investing in other mutual funds.
Analyzing Your Fund's Expenses
To illustrate these ongoing costs, we have provided examples and calculated the expenses paid by investors in each share class of the Fund during the period. The actual and hypothetical information in the table is based on an initial investment of $1,000 at the beginning of the period indicated and held for the entire period. Expense information is calculated two ways and each method provides you with different information. The amount listed in the "Actual" column is calculated using the Fund's actual operating expenses and total return for the period. You may use the Actual information, together with the amount invested, to estimate the expenses that you paid over the period. Simply divide your account value by $1,000 (for example, an $8,600 account value divided by $1,000 = 8.6), then multiply the results by the expenses paid during the period under the "Actual" column. The amount listed in the "Hypothetical" column assumes a 5% annual rate of return before expenses (which is not the Fund's actual return) and then applies the Fund's actual expense ratio for the period to the hypothetical return. You should not use the hypothetical account values and expenses to estimate either your actual account balance at the end of the period or the expenses you paid during the period. See "Compare With Other Funds" below for details on how to use the hypothetical data.
Compare With Other Funds
Since all mutual funds are required to include the same hypothetical calculations about expenses in shareholder reports, you can use this information to compare the ongoing cost of investing in the Fund with other funds. To do so, compare the hypothetical example with the 5% hypothetical examples that appear in the shareholder reports of other funds. As you compare hypothetical examples of other funds, it is important to note that hypothetical examples are meant to highlight the ongoing costs of investing in a fund only and do not reflect any transaction costs, such as sales charges, or redemption or exchange fees. Therefore, the hypothetical calculations are useful in comparing ongoing costs only, and will not help you determine the relative total costs of owning different funds. If transaction costs were included in these calculations, your costs would be higher.
September 1, 2014 – February 28, 2015
| | | Account Value at the Beginning
of the Period ($) | | Account Value at the End of the
Period ($) | | Expenses Paid During the
Period ($) | | Fund's Annualized
Expense Ratio (%) | |
| | | Actual | | Hypothetical | | Actual | | Hypothetical | | Actual | | Hypothetical | | Actual | |
Class A | | | 1,000.00 | | | | 1,000.00 | | | | 1,061.20 | | | | 1,022.69 | | | | 2.31 | | | | 2.27 | | | | 0.45 | | |
Class B | | | 1,000.00 | | | | 1,000.00 | | | | 1,057.20 | | | | 1,018.95 | | | | 6.15 | | | | 6.04 | | | | 1.20 | | |
Class I | | | 1,000.00 | | | | 1,000.00 | | | | 1,062.80 | | | | 1,023.93 | | | | 1.03 | | | | 1.01 | | | | 0.20 | | |
Class K | | | 1,000.00 | | | | 1,000.00 | | | | 1,061.50 | | | | 1,022.69 | | | | 2.31 | | | | 2.27 | | | | 0.45 | | |
Class R5 | | | 1,000.00 | | | | 1,000.00 | | | | 1,062.60 | | | | 1,023.93 | | | | 1.03 | | | | 1.01 | | | | 0.20 | | |
Class W | | | 1,000.00 | | | | 1,000.00 | | | | 1,061.40 | | | | 1,022.69 | | | | 2.31 | | | | 2.27 | | | | 0.45 | | |
Class Z | | | 1,000.00 | | | | 1,000.00 | | | | 1,062.70 | | | | 1,023.93 | | | | 1.03 | | | | 1.01 | | | | 0.20 | | |
Expenses paid during the period are equal to the annualized expense ratio for each class as indicated above, multiplied by the average account value over the period and then multiplied by the number of days in the Fund's most recent fiscal half year and divided by 365.
Expenses do not include fees and expenses incurred indirectly by the Fund from its investment in underlying funds, including affiliated and non-affiliated pooled investment vehicles, such as mutual funds and exchange-traded funds.
Had Columbia Management Investment Advisers, LLC and/or certain of its affiliates not waived/reimbursed certain fees and expenses, account value at the end of the period would have been reduced.
Annual Report 2015
7
COLUMBIA SMALL CAP INDEX FUND
PORTFOLIO OF INVESTMENTS
February 28, 2015
(Percentages represent value of investments compared to net assets)
Common Stocks 97.4%
Issuer | | Shares | | Value ($) | |
CONSUMER DISCRETIONARY 15.0% | |
Auto Components 0.6% | |
Dorman Products, Inc.(a) | | | 137,015 | | | | 6,043,732 | | |
Drew Industries, Inc.(a) | | | 105,637 | | | | 6,231,527 | | |
Standard Motor Products, Inc. | | | 93,059 | | | | 3,901,033 | | |
Superior Industries International, Inc. | | | 103,494 | | | | 2,009,853 | | |
Total | | | | | 18,186,145 | | |
Automobiles 0.1% | |
Winnebago Industries, Inc. | | | 120,420 | | | | 2,794,948 | | |
Distributors 0.4% | |
Pool Corp. | | | 193,982 | | | | 13,417,735 | | |
VOXX International Corp.(a) | | | 89,504 | | | | 769,734 | | |
Total | | | | | 14,187,469 | | |
Diversified Consumer Services 0.4% | |
American Public Education, Inc.(a) | | | 77,124 | | | | 2,498,818 | | |
Capella Education Co. | | | 48,623 | | | | 3,151,743 | | |
Career Education Corp.(a) | | | 267,478 | | | | 1,428,332 | | |
Regis Corp.(a) | | | 199,920 | | | | 3,206,717 | | |
Strayer Education, Inc.(a) | | | 48,705 | | | �� | 2,964,673 | | |
Universal Technical Institute, Inc. | | | 96,482 | | | | 949,383 | | |
Total | | | | | 14,199,666 | | |
Hotels, Restaurants & Leisure 4.5% | |
Biglari Holdings, Inc.(a) | | | 7,659 | | | | 3,333,273 | | |
BJ's Restaurants, Inc.(a) | | | 96,702 | | | | 5,049,778 | | |
Bob Evans Farms, Inc. | | | 105,430 | | | | 6,176,089 | | |
Boyd Gaming Corp.(a) | | | 348,723 | | | | 4,815,865 | | |
Buffalo Wild Wings, Inc.(a) | | | 84,543 | | | | 16,157,858 | | |
Cracker Barrel Old Country Store, Inc. | | | 106,828 | | | | 16,134,233 | | |
DineEquity, Inc. | | | 73,661 | | | | 7,994,428 | | |
Interval Leisure Group, Inc. | | | 175,988 | | | | 4,751,676 | | |
Jack in the Box, Inc. | | | 172,584 | | | | 16,687,147 | | |
Marcus Corp. (The) | | | 81,993 | | | | 1,598,044 | | |
Marriott Vacations Worldwide Corp. | | | 126,737 | | | | 9,639,616 | | |
Monarch Casino & Resort, Inc.(a) | | | 45,035 | | | | 819,637 | | |
Papa John's International, Inc. | | | 132,746 | | | | 8,209,013 | | |
Pinnacle Entertainment, Inc.(a) | | | 267,934 | | | | 6,896,621 | | |
Popeyes Louisiana Kitchen, Inc.(a) | | | 104,240 | | | | 6,255,442 | | |
Red Robin Gourmet Burgers, Inc.(a) | | | 62,614 | | | | 5,226,391 | | |
Ruby Tuesday, Inc.(a) | | | 276,615 | | | | 1,820,127 | | |
Ruth's Hospitality Group, Inc. | | | 157,938 | | | | 2,410,134 | | |
Common Stocks (continued)
Issuer | | Shares | | Value ($) | |
Scientific Games Corp., Class A(a) | | | 219,780 | | | | 2,969,228 | | |
Sonic Corp. | | | 224,993 | | | | 7,152,528 | | |
Texas Roadhouse, Inc. | | | 279,158 | | | | 10,507,507 | | |
Total | | | | | 144,604,635 | | |
Household Durables 1.6% | |
Ethan Allen Interiors, Inc. | | | 116,292 | | | | 3,120,114 | | |
Helen of Troy Ltd.(a) | | | 119,288 | | | | 9,139,846 | | |
iRobot Corp.(a) | | | 132,045 | | | | 4,337,678 | | |
La-Z-Boy, Inc. | | | 231,267 | | | | 5,770,112 | | |
M/I Homes, Inc.(a) | | | 109,323 | | | | 2,379,962 | | |
Meritage Homes Corp.(a) | | | 166,031 | | | | 7,390,040 | | |
Ryland Group, Inc. (The) | | | 205,986 | | | | 9,372,363 | | |
Standard Pacific Corp.(a) | | | 675,597 | | | | 5,904,718 | | |
Universal Electronics, Inc.(a) | | | 70,559 | | | | 3,987,289 | | |
Total | | | | | 51,402,122 | | |
Internet & Catalog Retail 0.3% | |
Blue Nile, Inc.(a) | | | 52,912 | | | | 1,586,301 | | |
FTD Companies, Inc.(a) | | | 83,450 | | | | 2,904,060 | | |
Nutrisystem, Inc. | | | 128,542 | | | | 2,212,208 | | |
PetMed Express, Inc. | | | 90,538 | | | | 1,393,380 | | |
Total | | | | | 8,095,949 | | |
Leisure Products 0.3% | |
Arctic Cat, Inc. | | | 57,779 | | | | 2,106,622 | | |
Callaway Golf Co. | | | 346,525 | | | | 3,115,260 | | |
Sturm Ruger & Co., Inc. | | | 86,660 | | | | 4,502,854 | | |
Total | | | | | 9,724,736 | | |
Media 0.3% | |
EW Scripps Co. (The), Class A(a) | | | 134,064 | | | | 3,091,516 | | |
Harte-Hanks, Inc. | | | 191,310 | | | | 1,482,652 | | |
Scholastic Corp. | | | 119,870 | | | | 4,436,389 | | |
Sizmek, Inc.(a) | | | 99,133 | | | | 783,151 | | |
Total | | | | | 9,793,708 | | |
Multiline Retail 0.2% | |
Fred's, Inc., Class A | | | 154,869 | | | | 2,892,953 | | |
Tuesday Morning Corp.(a) | | | 195,402 | | | | 3,708,730 | | |
Total | | | | | 6,601,683 | | |
Specialty Retail 4.2% | |
Aeropostale, Inc.(a) | | | 353,450 | | | | 1,424,403 | | |
Barnes & Noble, Inc.(a) | | | 191,070 | | | | 4,757,643 | | |
Big 5 Sporting Goods Corp. | | | 81,225 | | | | 1,038,056 | | |
The accompanying Notes to Financial Statements are an integral part of this statement.
Annual Report 2015
8
COLUMBIA SMALL CAP INDEX FUND
PORTFOLIO OF INVESTMENTS (continued)
February 28, 2015
Common Stocks (continued)
Issuer | | Shares | | Value ($) | |
Brown Shoe Co., Inc. | | | 195,484 | | | | 5,864,520 | | |
Buckle, Inc. (The) | | | 125,331 | | | | 6,304,149 | | |
Cato Corp. (The), Class A | | | 114,705 | | | | 5,086,020 | | |
Children's Place, Inc. (The) | | | 94,691 | | | | 5,396,440 | | |
Christopher & Banks Corp.(a) | | | 164,962 | | | | 824,810 | | |
Finish Line, Inc., Class A (The) | | | 213,627 | | | | 5,229,589 | | |
Francesca's Holdings Corp.(a) | | | 188,945 | | | | 2,832,286 | | |
Genesco, Inc.(a) | | | 107,632 | | | | 7,903,418 | | |
Group 1 Automotive, Inc. | | | 95,535 | | | | 7,770,817 | | |
Haverty Furniture Companies, Inc. | | | 92,216 | | | | 2,125,579 | | |
Hibbett Sports, Inc.(a) | | | 111,683 | | | | 5,462,416 | | |
Kirkland's, Inc.(a) | | | 66,444 | | | | 1,579,374 | | |
Lithia Motors, Inc., Class A | | | 102,022 | | | | 9,636,998 | | |
Lumber Liquidators Holdings, Inc.(a) | | | 120,878 | | | | 6,268,733 | | |
MarineMax, Inc.(a) | | | 111,029 | | | | 2,814,585 | | |
Men's Wearhouse, Inc. (The) | | | 203,930 | | | | 10,235,247 | | |
Monro Muffler Brake, Inc. | | | 141,051 | | | | 8,920,065 | | |
Outerwall, Inc. | | | 84,488 | | | | 5,451,166 | | |
PEP Boys-Manny, Moe & Jack (The)(a) | | | 239,022 | | | | 2,122,515 | | |
Select Comfort Corp.(a) | | | 238,041 | | | | 7,641,116 | | |
Sonic Automotive, Inc., Class A | | | 148,591 | | | | 3,674,655 | | |
Stage Stores, Inc. | | | 142,032 | | | | 3,042,325 | | |
Stein Mart, Inc. | | | 126,471 | | | | 2,079,183 | | |
Vitamin Shoppe, Inc.(a) | | | 137,923 | | | | 5,847,935 | | |
Zumiez, Inc.(a) | | | 96,608 | | | | 3,750,323 | | |
Total | | | | | 135,084,366 | | |
Textiles, Apparel & Luxury Goods 2.1% | |
Crocs, Inc.(a) | | | 368,518 | | | | 4,108,976 | | |
G-III Apparel Group Ltd.(a) | | | 85,330 | | | | 8,979,276 | | |
Iconix Brand Group, Inc.(a) | | | 214,311 | | | | 7,237,283 | | |
Movado Group, Inc. | | | 80,983 | | | | 2,080,453 | | |
Oxford Industries, Inc. | | | 64,736 | | | | 3,562,422 | | |
Perry Ellis International, Inc.(a) | | | 53,722 | | | | 1,267,839 | | |
Quiksilver, Inc.(a) | | | 550,428 | | | | 1,155,899 | | |
Skechers U.S.A., Inc., Class A(a) | | | 183,158 | | | | 12,480,386 | | |
Steven Madden Ltd.(a) | | | 252,472 | | | | 9,217,753 | | |
Unifi, Inc.(a) | | | 64,170 | | | | 2,073,974 | | |
Wolverine World Wide, Inc. | | | 453,702 | | | | 13,865,133 | | |
Total | | | | | 66,029,394 | | |
Total Consumer Discretionary | | | | | 480,704,821 | | |
Common Stocks (continued)
Issuer | | Shares | | Value ($) | |
CONSUMER STAPLES 2.9% | |
Food & Staples Retailing 0.8% | |
Andersons, Inc. (The) | | | 120,059 | | | | 5,315,012 | | |
Casey's General Stores, Inc. | | | 172,550 | | | | 15,141,263 | | |
SpartanNash Co. | | | 167,499 | | | | 4,447,098 | | |
Total | | | | | 24,903,373 | | |
Food Products 1.7% | |
B&G Foods, Inc. | | | 239,716 | | | | 6,867,863 | | |
Cal-Maine Foods, Inc. | | | 133,996 | | | | 5,042,270 | | |
Calavo Growers, Inc. | | | 68,752 | | | | 2,884,146 | | |
Darling Ingredients, Inc.(a) | | | 735,663 | | | | 12,815,250 | | |
Diamond Foods, Inc.(a) | | | 117,884 | | | | 3,176,974 | | |
J&J Snack Foods Corp. | | | 66,707 | | | | 6,750,081 | | |
Sanderson Farms, Inc. | | | 91,727 | | | | 7,816,058 | | |
Seneca Foods Corp., Class A(a) | | | 31,643 | | | | 855,627 | | |
Snyders-Lance, Inc. | | | 232,291 | | | | 7,166,177 | | |
Total | | | | | 53,374,446 | | |
Household Products 0.2% | |
Central Garden and Pet Co., Class A(a) | | | 191,492 | | | | 1,853,642 | | |
WD-40 Co. | | | 61,439 | | | | 4,988,847 | | |
Total | | | | | 6,842,489 | | |
Personal Products 0.1% | |
Inter Parfums, Inc. | | | 76,019 | | | | 2,161,220 | | |
Medifast, Inc.(a) | | | 50,109 | | | | 1,585,449 | | |
Total | | | | | 3,746,669 | | |
Tobacco 0.1% | |
Universal Corp. | | | 103,560 | | | | 4,961,559 | | |
Total Consumer Staples | | | | | 93,828,536 | | |
ENERGY 3.5% | |
Energy Equipment & Services 1.9% | |
Basic Energy Services, Inc.(a) | | | 156,251 | | | | 1,162,507 | | |
Bristow Group, Inc. | | | 157,055 | | | | 9,727,987 | | |
C&J Energy Services, Inc.(a) | | | 205,165 | | | | 2,796,399 | | |
CARBO Ceramics, Inc. | | | 87,680 | | | | 3,195,059 | | |
Era Group, Inc.(a) | | | 86,449 | | | | 1,907,065 | | |
Exterran Holdings, Inc. | | | 304,920 | | | | 9,900,752 | | |
Geospace Technologies Corp.(a) | | | 58,720 | | | | 1,093,954 | | |
Gulf Island Fabrication, Inc. | | | 59,637 | | | | 955,981 | | |
Gulfmark Offshore, Inc., Class A | | | 117,650 | | | | 1,934,166 | | |
The accompanying Notes to Financial Statements are an integral part of this statement.
Annual Report 2015
9
COLUMBIA SMALL CAP INDEX FUND
PORTFOLIO OF INVESTMENTS (continued)
February 28, 2015
Common Stocks (continued)
Issuer | | Shares | | Value ($) | |
Hornbeck Offshore Services, Inc.(a) | | | 144,439 | | | | 3,012,998 | | |
ION Geophysical Corp.(a) | | | 572,139 | | | | 1,304,477 | | |
Matrix Service Co.(a) | | | 118,526 | | | | 2,204,584 | | |
Newpark Resources, Inc.(a) | | | 375,190 | | | | 3,553,049 | | |
Paragon Offshore PLC | | | 378,600 | | | | 779,916 | | |
Pioneer Energy Services Corp.(a) | | | 285,018 | | | | 1,516,296 | | |
SEACOR Holdings, Inc.(a) | | | 78,834 | | | | 5,716,253 | | |
Tesco Corp. | | | 161,145 | | | | 1,712,971 | | |
Tetra Technologies, Inc.(a) | | | 355,579 | | | | 2,122,807 | | |
US Silica Holdings, Inc. | | | 240,840 | | | | 7,805,624 | | |
Total | | | | | 62,402,845 | | |
Oil, Gas & Consumable Fuels 1.6% | |
Approach Resources, Inc.(a) | | | 162,554 | | | | 1,256,542 | | |
Arch Coal, Inc. | | | 948,240 | | | | 1,242,194 | | |
Bill Barrett Corp.(a) | | | 221,790 | | | | 2,226,772 | | |
Bonanza Creek Energy, Inc.(a) | | | 168,080 | | | | 4,529,756 | | |
Carrizo Oil & Gas, Inc.(a) | | | 189,435 | | | | 9,015,212 | | |
Cloud Peak Energy, Inc.(a) | | | 272,514 | | | | 2,259,141 | | |
Comstock Resources, Inc. | | | 198,829 | | | | 1,033,911 | | |
Contango Oil & Gas Co.(a) | | | 70,968 | | | | 1,669,877 | | |
Green Plains, Inc. | | | 152,890 | | | | 3,554,692 | | |
Northern Oil and Gas, Inc.(a) | | | 256,030 | | | | 2,206,979 | | |
PDC Energy, Inc.(a) | | | 160,257 | | | | 8,282,082 | | |
Penn Virginia Corp.(a) | | | 319,655 | | | | 2,122,509 | | |
Petroquest Energy, Inc.(a) | | | 262,475 | | | | 766,427 | | |
Rex Energy Corp.(a) | | | 217,530 | | | | 1,065,897 | | |
Stone Energy Corp.(a) | | | 250,935 | | | | 4,250,839 | | |
Swift Energy Co.(a) | | | 195,917 | | | | 613,220 | | |
Synergy Resources Corp.(a) | | | 394,520 | | | | 4,714,514 | | |
Total | | | | | 50,810,564 | | |
Total Energy | | | | | 113,213,409 | | |
FINANCIALS 22.6% | |
Banks 7.5% | |
Bank of the Ozarks, Inc. | | | 312,412 | | | | 11,434,279 | | |
Banner Corp. | | | 87,433 | | | | 3,817,325 | | |
BBCN Bancorp, Inc. | | | 355,112 | | | | 4,882,790 | | |
Boston Private Financial Holdings, Inc. | | | 369,775 | | | | 4,640,676 | | |
Cardinal Financial Corp. | | | 143,075 | | | | 2,799,978 | | |
Central Pacific Financial Corp. | | | 121,890 | | | | 2,796,157 | | |
Common Stocks (continued)
Issuer | | Shares | | Value ($) | |
City Holding Co. | | | 67,980 | | | | 3,137,277 | | |
Columbia Banking System, Inc. | | | 238,465 | | | | 6,719,944 | | |
Community Bank System, Inc. | | | 181,350 | | | | 6,441,552 | | |
CVB Financial Corp. | | | 430,184 | | | | 6,732,380 | | |
First BanCorp(a) | | | 466,239 | | | | 3,072,515 | | |
First Commonwealth Financial Corp. | | | 409,732 | | | | 3,474,527 | | |
First Financial Bancorp | | | 274,155 | | | | 4,778,522 | | |
First Financial Bankshares, Inc. | | | 286,182 | | | | 7,518,001 | | |
First Midwest Bancorp, Inc. | | | 336,342 | | | | 5,751,448 | | |
FNB Corp. | | | 775,013 | | | | 9,943,417 | | |
Glacier Bancorp, Inc. | | | 335,137 | | | | 8,140,478 | | |
Hanmi Financial Corp. | | | 142,470 | | | | 2,810,933 | | |
Home Bancshares, Inc. | | | 262,440 | | | | 8,306,226 | | |
Independent Bank Corp. | | | 116,286 | | | | 4,863,080 | | |
LegacyTexas Financial Group, Inc. | | | 162,473 | | | | 3,736,879 | | |
MB Financial, Inc. | | | 287,228 | | | | 8,958,641 | | |
National Penn Bancshares, Inc. | | | 552,926 | | | | 5,932,896 | | |
NBT Bancorp, Inc. | | | 195,330 | | | | 4,689,873 | | |
OFG Bancorp | | | 199,580 | | | | 3,482,671 | | |
Old National Bancorp | | | 477,806 | | | | 6,732,287 | | |
Pinnacle Financial Partners, Inc. | | | 148,143 | | | | 6,222,006 | | |
PrivateBancorp, Inc. | | | 314,113 | | | | 10,909,144 | | |
S&T Bancorp, Inc. | | | 133,097 | | | | 3,770,638 | | |
Simmons First National Corp., Class A | | | 70,842 | | | | 2,900,980 | | |
Southside Bancshares, Inc. | | | 98,440 | | | | 2,826,212 | | |
Sterling Bancorp | | | 401,580 | | | | 5,509,678 | | |
Susquehanna Bancshares, Inc. | | | 809,753 | | | | 10,858,788 | | |
Texas Capital Bancshares, Inc.(a) | | | 204,189 | | | | 9,480,495 | | |
Tompkins Financial Corp. | | | 52,753 | | | | 2,740,518 | | |
UMB Financial Corp. | | | 168,677 | | | | 8,693,613 | | |
United Bankshares, Inc. | | | 284,408 | | | | 10,651,080 | | |
United Community Banks, Inc. | | | 201,865 | | | | 3,839,472 | | |
Westamerica Bancorporation | | | 115,640 | | | | 4,980,615 | | |
Wilshire Bancorp, Inc. | | | 314,820 | | | | 2,993,938 | | |
Wintrust Financial Corp. | | | 208,681 | | | | 9,826,788 | | |
Total | | | | | 241,798,717 | | |
Capital Markets 1.5% | |
Calamos Asset Management, Inc.,
Class A | | | 76,122 | | | | 972,078 | | |
Evercore Partners, Inc., Class A | | | 160,845 | | | | 8,240,089 | | |
The accompanying Notes to Financial Statements are an integral part of this statement.
Annual Report 2015
10
COLUMBIA SMALL CAP INDEX FUND
PORTFOLIO OF INVESTMENTS (continued)
February 28, 2015
Common Stocks (continued)
Issuer | | Shares | | Value ($) | |
Financial Engines, Inc. | | | 232,088 | | | | 9,353,146 | | |
FXCM, Inc., Class A | | | 189,600 | | | | 400,056 | | |
Greenhill & Co., Inc. | | | 118,160 | | | | 4,573,974 | | |
HFF, Inc., Class A | | | 146,427 | | | | 5,209,873 | | |
Interactive Brokers Group, Inc., Class A | | | 261,160 | | | | 8,323,169 | | |
Investment Technology Group, Inc.(a) | | | 155,403 | | | | 3,499,676 | | |
Piper Jaffray Companies(a) | | | 72,748 | | | | 3,982,953 | | |
Virtus Investment Partners, Inc. | | | 31,567 | | | | 4,165,897 | | |
Total | | | | | 48,720,911 | | |
Consumer Finance 1.1% | |
Cash America International, Inc. | | | 129,040 | | | | 2,784,683 | | |
Encore Capital Group, Inc.(a) | | | 106,845 | | | | 4,270,595 | | |
Enova International, Inc.(a) | | | 118,071 | | | | 2,726,259 | | |
Ezcorp, Inc., Class A(a) | | | 217,824 | | | | 2,274,083 | | |
First Cash Financial Services, Inc.(a) | | | 126,453 | | | | 6,087,447 | | |
Green Dot Corp., Class A(a) | | | 161,755 | | | | 2,508,820 | | |
PRA Group, Inc.(a) | | | 223,714 | | | | 11,205,834 | | |
World Acceptance Corp.(a) | | | 40,150 | | | | 3,296,717 | | |
Total | | | | | 35,154,438 | | |
Diversified Financial Services 0.4% | |
MarkeTaxess Holdings, Inc. | | | 166,974 | | | | 13,289,461 | | |
Insurance 2.5% | |
American Equity Investment Life
Holding Co. | | | 337,700 | | | | 9,621,073 | | |
AMERISAFE, Inc. | | | 84,080 | | | | 3,492,683 | | |
eHealth, Inc.(a) | | | 79,598 | | | | 724,342 | | |
Employers Holdings, Inc. | | | 140,666 | | | | 3,318,311 | | |
HCI Group, Inc. | | | 40,740 | | | | 1,927,817 | | |
Horace Mann Educators Corp. | | | 187,227 | | | | 6,034,326 | | |
Infinity Property & Casualty Corp. | | | 51,344 | | | | 3,981,727 | | |
Meadowbrook Insurance Group, Inc. | | | 208,110 | | | | 1,739,800 | | |
Montpelier Re Holdings Ltd. | | | 164,640 | | | | 5,933,626 | | |
Navigators Group, Inc. (The)(a) | | | 48,466 | | | | 3,620,895 | | |
ProAssurance Corp. | | | 255,446 | | | | 11,492,516 | | |
RLI Corp. | | | 165,296 | | | | 7,998,673 | | |
Safety Insurance Group, Inc. | | | 56,317 | | | | 3,294,544 | | |
Selective Insurance Group, Inc. | | | 252,049 | | | | 6,863,294 | | |
Stewart Information Services Corp. | | | 99,060 | | | | 3,727,628 | | |
United Fire Group, Inc. | | | 93,985 | | | | 2,710,527 | | |
Common Stocks (continued)
Issuer | | Shares | | Value ($) | |
United Insurance Holdings Corp. | | | 71,910 | | | | 1,755,323 | | |
Universal Insurance Holdings, Inc. | | | 130,090 | | | | 3,239,241 | | |
Total | | | | | 81,476,346 | | |
Real Estate Investment Trusts (REITs) 8.5% | |
Acadia Realty Trust | | | 301,972 | | | | 10,315,364 | | |
Agree Realty Corp. | | | 76,875 | | | | 2,523,806 | | |
American Assets Trust, Inc. | | | 165,610 | | | | 6,793,322 | | |
Associated Estates Realty Corp. | | | 257,515 | | | | 6,167,484 | | |
Aviv REIT, Inc. | | | 109,760 | | | | 3,949,165 | | |
Capstead Mortgage Corp. | | | 427,995 | | | | 5,123,100 | | |
CareTrust REIT, Inc. | | | 124,876 | | | | 1,587,174 | | |
Cedar Realty Trust, Inc. | | | 327,276 | | | | 2,448,024 | | |
Chesapeake Lodging Trust | | | 245,150 | | | | 8,717,534 | | |
Coresite Realty Corp. | | | 96,980 | | | | 4,600,731 | | |
Cousins Properties, Inc. | | | 918,791 | | | | 9,858,627 | | |
DiamondRock Hospitality Co. | | | 874,198 | | | | 12,658,387 | | |
EastGroup Properties, Inc. | | | 142,632 | | | | 8,985,816 | | |
Education Realty Trust, Inc. | | | 212,178 | | | | 7,438,961 | | |
EPR Properties | | | 255,295 | | | | 15,575,548 | | |
Franklin Street Properties Corp. | | | 398,315 | | | | 5,030,718 | | |
Geo Group, Inc. (The) | | | 331,217 | | | | 14,292,014 | | |
Getty Realty Corp. | | | 116,431 | | | | 2,100,415 | | |
Government Properties Income Trust | | | 314,225 | | | | 7,349,723 | | |
Healthcare Realty Trust, Inc. | | | 438,562 | | | | 12,516,560 | | |
Inland Real Estate Corp. | | | 393,584 | | | | 4,211,349 | | |
Kite Realty Group Trust | | | 372,870 | | | | 10,559,678 | | |
Lexington Realty Trust | | | 933,649 | | | | 10,111,419 | | |
LTC Properties, Inc. | | | 155,651 | | | | 6,946,704 | | |
Medical Properties Trust, Inc. | | | 904,379 | | | | 13,692,298 | | |
Parkway Properties, Inc. | | | 376,091 | | | | 6,622,963 | | |
Pennsylvania Real Estate
Investment Trust | | | 307,304 | | | | 7,000,385 | | |
Post Properties, Inc. | | | 243,284 | | | | 13,835,561 | | |
PS Business Parks, Inc. | | | 86,580 | | | | 7,201,724 | | |
Retail Opportunity Investments Corp. | | | 415,310 | | | | 6,956,443 | | |
Sabra Health Care REIT, Inc. | | | 263,761 | | | | 8,622,347 | | |
Saul Centers, Inc. | | | 50,412 | | | | 2,715,694 | | |
Sovran Self Storage, Inc. | | | 150,797 | | | | 13,876,340 | | |
Summit Hotel Properties, Inc. | | | 384,150 | | | | 5,043,890 | | |
The accompanying Notes to Financial Statements are an integral part of this statement.
Annual Report 2015
11
COLUMBIA SMALL CAP INDEX FUND
PORTFOLIO OF INVESTMENTS (continued)
February 28, 2015
Common Stocks (continued)
Issuer | | Shares | | Value ($) | |
Universal Health Realty Income Trust | | | 57,766 | | | | 2,936,246 | | |
Urstadt Biddle Properties, Inc., Class A | | | 123,006 | | | | 2,794,696 | | |
Total | | | | | 271,160,210 | | |
Real Estate Management & Development 0.1% | |
Forestar Group, Inc.(a) | | | 155,946 | | | | 2,242,503 | | |
Thrifts & Mortgage Finance 1.0% | |
Astoria Financial Corp. | | | 392,290 | | | | 5,146,845 | | |
Bank Mutual Corp. | | | 193,446 | | | | 1,387,008 | | |
BofI Holding, Inc.(a) | | | 58,230 | | | | 5,147,532 | | |
Brookline Bancorp, Inc. | | | 311,624 | | | | 3,016,520 | | |
Dime Community Bancshares, Inc. | | | 134,994 | | | | 2,100,507 | | |
Northwest Bancshares, Inc. | | | 424,106 | | | | 5,010,813 | | |
Oritani Financial Corp. | | | 170,188 | | | | 2,435,390 | | |
Provident Financial Services, Inc. | | | 240,581 | | | | 4,378,574 | | |
TrustCo Bank Corp. | | | 423,895 | | | | 2,865,530 | | |
Total | | | | | 31,488,719 | | |
Total Financials | | | | | 725,331,305 | | |
HEALTH CARE 11.8% | |
Biotechnology 0.7% | |
Acorda Therapeutics, Inc.(a) | | | 187,385 | | | | 6,341,108 | | |
Emergent Biosolutions, Inc.(a) | | | 130,839 | | | | 3,921,245 | | |
Ligand Pharmaceuticals, Inc.(a) | | | 81,390 | | | | 4,482,147 | | |
Momenta Pharmaceuticals, Inc.(a) | | | 208,541 | | | | 2,846,585 | | |
Repligen Corp.(a) | | | 137,400 | | | | 3,532,554 | | |
Spectrum Pharmaceuticals, Inc.(a) | | | 258,395 | | | | 1,609,801 | | |
Total | | | | | 22,733,440 | | |
Health Care Equipment & Supplies 4.3% | |
Abaxis, Inc. | | | 94,629 | | | | 5,764,799 | | |
ABIOMED, Inc.(a) | | | 164,414 | | | | 9,994,727 | | |
Analogic Corp. | | | 55,270 | | | | 4,789,698 | | |
Angiodynamics, Inc.(a) | | | 114,210 | | | | 2,124,306 | | |
Anika Therapeutics, Inc.(a) | | | 64,790 | | | | 2,586,417 | | |
Cantel Medical Corp. | | | 157,675 | | | | 7,158,445 | | |
CONMED Corp. | | | 122,968 | | | | 6,308,258 | | |
CryoLife, Inc. | | | 112,340 | | | | 1,177,323 | | |
Cyberonics, Inc.(a) | | | 117,543 | | | | 8,051,695 | | |
Cynosure Inc., Class A(a) | | | 96,706 | | | | 2,941,797 | | |
Greatbatch, Inc.(a) | | | 111,652 | | | | 5,933,187 | | |
Haemonetics Corp.(a) | | | 229,327 | | | | 10,195,878 | | |
Common Stocks (continued)
Issuer | | Shares | | Value ($) | |
ICU Medical, Inc.(a) | | | 60,399 | | | | 5,370,075 | | |
Integra LifeSciences Holdings Corp.(a) | | | 112,779 | | | | 6,767,868 | | |
Invacare Corp. | | | 130,542 | | | | 2,476,382 | | |
Masimo Corp.(a) | | | 213,060 | | | | 6,278,878 | | |
Meridian Bioscience, Inc. | | | 186,030 | | | | 3,683,394 | | |
Merit Medical Systems, Inc.(a) | | | 193,888 | | | | 3,802,144 | | |
Natus Medical, Inc.(a) | | | 145,390 | | | | 5,203,508 | | |
Neogen Corp.(a) | | | 164,959 | | | | 8,437,653 | | |
NuVasive, Inc.(a) | | | 210,131 | | | | 9,613,493 | | |
SurModics, Inc.(a) | | | 57,439 | | | | 1,381,408 | | |
Vascular Solutions, Inc.(a) | | | 70,020 | | | | 2,043,184 | | |
West Pharmaceutical Services, Inc. | | | 317,472 | | | | 17,372,068 | | |
Total | | | | | 139,456,585 | | |
Health Care Providers & Services 3.4% | |
Air Methods Corp.(a) | | | 159,370 | | | | 8,445,016 | | |
Almost Family, Inc.(a) | | | 35,134 | | | | 1,251,473 | | |
Amedisys, Inc.(a) | | | 149,114 | | | | 4,498,769 | | |
AMN Healthcare Services, Inc.(a) | | | 208,310 | | | | 4,699,474 | | |
Amsurg Corp.(a) | | | 214,979 | | | | 12,920,238 | | |
Bio-Reference Laboratories, Inc.(a) | | | 110,240 | | | | 3,851,786 | | |
Chemed Corp. | | | 75,988 | | | | 8,851,082 | | |
Corvel Corp.(a) | | | 39,668 | | | | 1,405,437 | | |
Cross Country Healthcare, Inc.(a) | | | 131,241 | | | | 1,700,883 | | |
Ensign Group, Inc. (The) | | | 100,424 | | | | 4,425,686 | | |
ExamWorks Group, Inc.(a) | | | 152,070 | | | | 6,143,628 | | |
Hanger, Inc.(a) | | | 157,644 | | | | 4,081,403 | | |
Healthways, Inc.(a) | | | 158,091 | | | | 3,538,077 | | |
IPC Healthcare, Inc.(a) | | | 76,931 | | | | 3,326,497 | | |
Kindred Healthcare, Inc. | | | 353,405 | | | | 7,499,254 | | |
Landauer, Inc. | | | 42,666 | | | | 1,627,281 | | |
LHC Group, Inc.(a) | | | 54,860 | | | | 1,854,268 | | |
Magellan Health, Inc.(a) | | | 123,496 | | | | 7,912,389 | | |
Molina Healthcare, Inc.(a) | | | 140,529 | | | | 8,950,292 | | |
PharMerica Corp.(a) | | | 134,539 | | | | 3,363,475 | | |
Providence Service Corp. (The)(a) | | | 53,110 | | | | 2,443,060 | | |
Select Medical Holdings Corp. | | | 432,790 | | | | 5,868,632 | | |
Total | | | | | 108,658,100 | | |
Health Care Technology 1.0% | |
Computer Programs & Systems, Inc. | | | 46,571 | | | | 2,449,635 | | |
The accompanying Notes to Financial Statements are an integral part of this statement.
Annual Report 2015
12
COLUMBIA SMALL CAP INDEX FUND
PORTFOLIO OF INVESTMENTS (continued)
February 28, 2015
Common Stocks (continued)
Issuer | | Shares | | Value ($) | |
HealthStream, Inc.(a) | | | 95,049 | | | | 2,459,868 | | |
MedAssets, Inc.(a) | | | 268,950 | | | | 5,166,529 | | |
Medidata Solutions, Inc.(a) | | | 242,342 | | | | 11,659,074 | | |
Omnicell, Inc.(a) | | | 159,045 | | | | 5,574,527 | | |
Quality Systems, Inc. | | | 196,533 | | | | 3,415,744 | | |
Total | | | | | 30,725,377 | | |
Life Sciences Tools & Services 0.9% | |
Affymetrix, Inc.(a) | | | 328,701 | | | | 3,845,802 | | |
Albany Molecular Research, Inc.(a) | | | 106,330 | | | | 1,724,672 | | |
Cambrex Corp.(a) | | | 138,463 | | | | 4,742,358 | | |
Luminex Corp.(a) | | | 170,294 | | | | 2,680,427 | | |
PAREXEL International Corp.(a) | | | 245,758 | | | | 15,841,561 | | |
Total | | | | | 28,834,820 | | |
Pharmaceuticals 1.5% | |
ANI Pharmaceuticals, Inc.(a) | | | 36,390 | | | | 2,451,231 | | |
Depomed, Inc.(a) | | | 262,390 | | | | 5,759,461 | | |
Impax Laboratories, Inc.(a) | | | 295,990 | | | | 11,925,437 | | |
Lannett Co., Inc.(a) | | | 118,200 | | | | 7,375,680 | | |
Medicines Co. (The)(a) | | | 292,237 | | | | 8,406,197 | | |
Prestige Brands Holdings, Inc.(a) | | | 233,058 | | | | 8,982,055 | | |
Sagent Pharmaceuticals, Inc.(a) | | | 101,210 | | | | 2,750,888 | | |
Total | | | | | 47,650,949 | | |
Total Health Care | | | | | 378,059,271 | | |
INDUSTRIALS 15.6% | |
Aerospace & Defense 1.8% | |
AAR Corp. | | | 169,283 | | | | 4,976,920 | | |
Aerovironment, Inc.(a) | | | 89,599 | | | | 2,455,909 | | |
American Science & Engineering, Inc. | | | 32,996 | | | | 1,725,361 | | |
Cubic Corp. | | | 97,187 | | | | 5,079,964 | | |
Curtiss-Wright Corp. | | | 214,527 | | | | 15,570,370 | | |
Engility Holdings, Inc. | | | 78,586 | | | | 2,836,955 | | |
GenCorp, Inc.(a) | | | 280,027 | | | | 5,404,521 | | |
Moog, Inc., Class A(a) | | | 181,594 | | | | 13,703,083 | | |
National Presto Industries, Inc. | | | 21,927 | | | | 1,329,653 | | |
Taser International, Inc.(a) | | | 234,600 | | | | 5,508,408 | | |
Total | | | | | 58,591,144 | | |
Air Freight & Logistics 0.7% | |
Atlas Air Worldwide Holdings, Inc.(a) | | | 110,805 | | | | 5,025,007 | | |
Forward Air Corp. | | | 136,019 | | | | 7,277,016 | | |
Common Stocks (continued)
Issuer | | Shares | | Value ($) | |
HUB Group, Inc., Class A(a) | | | 155,427 | | | | 6,274,588 | | |
UTi Worldwide, Inc.(a) | | | 409,850 | | | | 5,360,838 | | |
Total | | | | | 23,937,449 | | |
Airlines 0.5% | |
Allegiant Travel Co. | | | 60,922 | | | | 11,186,497 | | |
Skywest, Inc. | | | 228,619 | | | | 3,342,410 | | |
Total | | | | | 14,528,907 | | |
Building Products 1.1% | |
AAON, Inc. | | | 187,359 | | | | 4,217,451 | | |
American Woodmark Corp.(a) | | | 55,860 | | | | 2,941,588 | | |
Apogee Enterprises, Inc. | | | 129,380 | | | | 5,932,073 | | |
Gibraltar Industries, Inc.(a) | | | 129,337 | | | | 1,896,080 | | |
Griffon Corp. | | | 188,175 | | | | 3,071,016 | | |
PGT, Inc.(a) | | | 212,720 | | | | 2,163,362 | | |
Quanex Building Products Corp. | | | 167,674 | | | | 3,284,734 | | |
Simpson Manufacturing Co., Inc. | | | 185,856 | | | | 6,727,987 | | |
Universal Forest Products, Inc. | | | 89,230 | | | | 4,822,882 | | |
Total | | | | | 35,057,173 | | |
Commercial Services & Supplies 2.7% | |
ABM Industries, Inc. | | | 231,588 | | | | 7,200,071 | | |
Brady Corp., Class A | | | 212,956 | | | | 5,741,294 | | |
Brink's Co. (The) | | | 216,980 | | | | 6,105,817 | | |
G&K Services, Inc., Class A | | | 89,019 | | | | 6,408,478 | | |
Healthcare Services Group, Inc. | | | 315,686 | | | | 10,597,579 | | |
Interface, Inc. | | | 295,909 | | | | 5,974,403 | | |
Matthews International Corp., Class A | | | 132,160 | | | | 6,392,579 | | |
Mobile Mini, Inc. | | | 205,969 | | | | 8,545,654 | | |
Tetra Tech, Inc. | | | 279,664 | | | | 7,111,855 | | |
U.S. Ecology, Inc. | | | 96,610 | | | | 4,716,500 | | |
Unifirst Corp. | | | 69,872 | | | | 8,302,890 | | |
United Stationers, Inc. | | | 173,764 | | | | 7,018,328 | | |
Viad Corp. | | | 89,652 | | | | 2,381,157 | | |
Total | | | | | 86,496,605 | | |
Construction & Engineering 0.8% | |
Aegion Corp.(a) | | | 166,988 | | | | 3,020,813 | | |
Comfort Systems U.S.A., Inc. | | | 166,423 | | | | 3,112,110 | | |
Dycom Industries, Inc.(a) | | | 152,144 | | | | 6,747,586 | | |
EMCOR Group, Inc. | | | 289,229 | | | | 12,734,753 | | |
Orion Marine Group, Inc.(a) | | | 122,938 | | | | 1,253,968 | | |
Total | | | | | 26,869,230 | | |
The accompanying Notes to Financial Statements are an integral part of this statement.
Annual Report 2015
13
COLUMBIA SMALL CAP INDEX FUND
PORTFOLIO OF INVESTMENTS (continued)
February 28, 2015
Common Stocks (continued)
Issuer | | Shares | | Value ($) | |
Electrical Equipment 1.1% | |
AZZ, Inc. | | | 114,665 | | | | 5,208,084 | | |
Encore Wire Corp. | | | 83,304 | | | | 3,106,406 | | |
EnerSys | | | 202,614 | | | | 13,230,694 | | |
Franklin Electric Co., Inc. | | | 176,266 | | | | 6,430,184 | | |
General Cable Corp. | | | 217,420 | | | | 3,269,997 | | |
Powell Industries, Inc. | | | 41,385 | | | | 1,396,330 | | |
Vicor Corp.(a) | | | 74,069 | | | | 976,230 | | |
Total | | | | | 33,617,925 | | |
Machinery 3.6% | |
Actuant Corp., Class A | | | 275,524 | | | | 7,009,331 | | |
Albany International Corp., Class A | | | 128,252 | | | | 4,836,383 | | |
Astec Industries, Inc. | | | 83,987 | | | | 3,592,124 | | |
Barnes Group, Inc. | | | 218,900 | | | | 8,760,378 | | |
Briggs & Stratton Corp. | | | 202,644 | | | | 4,223,101 | | |
CIRCOR International, Inc. | | | 78,952 | | | | 4,237,354 | | |
EnPro Industries, Inc. | | | 107,153 | | | | 7,047,453 | | |
ESCO Technologies, Inc. | | | 117,552 | | | | 4,530,454 | | |
Federal Signal Corp. | | | 279,596 | | | | 4,610,538 | | |
Hillenbrand, Inc. | | | 280,345 | | | | 8,886,936 | | |
John Bean Technologies Corp. | | | 130,078 | | | | 4,495,496 | | |
Lindsay Corp. | | | 54,498 | | | | 4,772,935 | | |
Lydall, Inc.(a) | | | 76,638 | | | | 2,441,687 | | |
Mueller Industries, Inc. | | | 254,130 | | | | 8,846,265 | | |
Standex International Corp. | | | 56,968 | | | | 4,130,180 | | |
Tennant Co. | | | 82,190 | | | | 5,372,760 | | |
Titan International, Inc. | | | 239,480 | | | | 2,390,010 | | |
Toro Co. (The) | | | 248,679 | | | | 16,823,134 | | |
Watts Water Technologies, Inc., Class A | | | 127,115 | | | | 6,988,783 | | |
Total | | | | | 113,995,302 | | |
Marine 0.2% | |
Matson, Inc. | | | 192,270 | | | | 7,588,897 | | |
Professional Services 1.5% | |
CDI Corp. | | | 64,844 | | | | 1,193,130 | | |
Exponent, Inc. | | | 57,475 | | | | 4,973,312 | | |
Heidrick & Struggles International, Inc. | | | 73,352 | | | | 1,756,047 | | |
Insperity, Inc. | | | 100,712 | | | | 5,216,881 | | |
Kelly Services, Inc., Class A | | | 132,919 | | | | 2,300,828 | | |
Korn/Ferry International(a) | | | 224,687 | | | | 6,875,422 | | |
Common Stocks (continued)
Issuer | | Shares | | Value ($) | |
Navigant Consulting, Inc.(a) | | | 216,622 | | | | 3,030,542 | | |
On Assignment, Inc.(a) | | | 210,452 | | | | 8,041,371 | | |
Resources Connection, Inc. | | | 170,117 | | | | 3,014,473 | | |
TrueBlue, Inc.(a) | | | 189,921 | | | | 4,370,082 | | |
Wageworks, Inc.(a) | | | 146,860 | | | | 8,437,107 | | |
Total | | | | | 49,209,195 | | |
Road & Rail 1.0% | |
ArcBest Corp. | | | 108,155 | | | | 4,529,531 | | |
Celadon Group, Inc. | | | 98,250 | | | | 2,579,063 | | |
Heartland Express, Inc. | | | 247,036 | | | | 6,217,896 | | |
Knight Transportation, Inc. | | | 271,869 | | | | 8,987,989 | | |
Roadrunner Transportation Systems,
Inc.(a) | | | 123,670 | | | | 3,174,609 | | |
Saia, Inc.(a) | | | 110,590 | | | | 5,090,458 | | |
Total | | | | | 30,579,546 | | |
Trading Companies & Distributors 0.6% | |
Aceto Corp. | | | 122,040 | | | | 2,612,876 | | |
Applied Industrial Technologies, Inc. | | | 184,401 | | | | 8,078,608 | | |
DXP Enterprises, Inc.(a) | | | 57,510 | | | | 2,633,958 | | |
Kaman Corp. | | | 121,131 | | | | 5,026,936 | | |
Veritiv Corp.(a) | | | 36,450 | | | | 1,846,193 | | |
Total | | | | | 20,198,571 | | |
Total Industrials | | | | | 500,669,944 | | |
INFORMATION TECHNOLOGY 16.4% | |
Communications Equipment 1.2% | |
ADTRAN, Inc. | | | 242,650 | | | | 5,224,255 | | |
Bel Fuse, Inc., Class B | | | 47,760 | | | | 911,738 | | |
Black Box Corp. | | | 69,023 | | | | 1,517,816 | | |
CalAmp Corp.(a) | | | 161,605 | | | | 3,094,736 | | |
Comtech Telecommunications Corp. | | | 72,427 | | | | 2,588,541 | | |
Digi International, Inc.(a) | | | 110,997 | | | | 1,174,348 | | |
Harmonic, Inc.(a) | | | 393,366 | | | | 3,072,188 | | |
Ixia(a) | | | 262,651 | | | | 2,988,968 | | |
NETGEAR, Inc.(a) | | | 154,505 | | | | 4,981,241 | | |
Viasat, Inc.(a) | | | 192,525 | | | | 12,579,584 | | |
Total | | | | | 38,133,415 | | |
Electronic Equipment, Instruments & Components 4.0% | |
Agilysys, Inc.(a) | | | 66,244 | | | | 655,153 | | |
Anixter International, Inc.(a) | | | 121,751 | | | | 9,604,936 | | |
The accompanying Notes to Financial Statements are an integral part of this statement.
Annual Report 2015
14
COLUMBIA SMALL CAP INDEX FUND
PORTFOLIO OF INVESTMENTS (continued)
February 28, 2015
Common Stocks (continued)
Issuer | | Shares | | Value ($) | |
Badger Meter, Inc. | | | 64,548 | | | | 3,769,603 | | |
Benchmark Electronics, Inc.(a) | | | 237,301 | | | | 5,567,081 | | |
Checkpoint Systems, Inc.(a) | | | 186,713 | | | | 2,520,626 | | |
Coherent, Inc.(a) | | | 112,209 | | | | 7,208,306 | | |
CTS Corp. | | | 149,527 | | | | 2,610,741 | | |
Daktronics, Inc. | | | 175,123 | | | | 1,791,508 | | |
DTS, Inc.(a) | | | 76,768 | | | | 2,262,353 | | |
Electro Scientific Industries, Inc. | | | 118,783 | | | | 820,791 | | |
Fabrinet(a) | | | 132,540 | | | | 2,379,093 | | |
FARO Technologies, Inc.(a) | | | 77,166 | | | | 4,627,645 | | |
II-VI, Inc.(a) | | | 232,313 | | | | 4,063,154 | | |
Insight Enterprises, Inc.(a) | | | 183,034 | | | | 4,813,794 | | |
Littelfuse, Inc. | | | 100,457 | | | | 10,077,846 | | |
Mercury Systems, Inc.(a) | | | 143,949 | | | | 2,450,012 | | |
Methode Electronics, Inc. | | | 170,441 | | | | 6,628,451 | | |
MTS Systems Corp. | | | 67,431 | | | | 4,885,376 | | |
Newport Corp.(a) | | | 178,001 | | | | 3,552,900 | | |
OSI Systems, Inc.(a) | | | 83,267 | | | | 6,034,360 | | |
Park Electrochemical Corp. | | | 93,587 | | | | 2,031,774 | | |
Plexus Corp.(a) | | | 150,244 | | | | 6,047,321 | | |
Rofin-Sinar Technologies, Inc.(a) | | | 125,299 | | | | 3,003,417 | | |
Rogers Corp.(a) | | | 81,696 | | | | 6,395,163 | | |
Sanmina Corp.(a) | | | 368,420 | | | | 8,363,134 | | |
Scansource, Inc.(a) | | | 127,535 | | | | 4,637,173 | | |
SYNNEX Corp. | | | 124,755 | | | | 9,512,569 | | |
TTM Technologies, Inc.(a) | | | 238,273 | | | | 2,099,185 | | |
Total | | | | | 128,413,465 | | |
Internet Software & Services 1.9% | |
Blucora, Inc.(a) | | | 183,159 | | | | 2,714,416 | | |
comScore, Inc.(a) | | | 152,773 | | | | 7,881,559 | | |
Dealertrack Technologies, Inc.(a) | | | 197,941 | | | | 7,872,114 | | |
Dice Holdings, Inc.(a) | | | 166,195 | | | | 1,455,868 | | |
j2 Global, Inc. | | | 202,870 | | | | 13,643,007 | | |
Liquidity Services, Inc.(a) | | | 109,620 | | | | 1,083,046 | | |
LivePerson, Inc.(a) | | | 222,162 | | | | 2,562,639 | | |
LogMeIn, Inc.(a) | | | 108,924 | | | | 5,740,295 | | |
Monster Worldwide, Inc.(a) | | | 396,270 | | | | 2,662,934 | | |
NIC, Inc. | | | 271,275 | | | | 4,747,313 | | |
Perficient, Inc.(a) | | | 153,773 | | | | 3,057,007 | | |
Common Stocks (continued)
Issuer | | Shares | | Value ($) | |
QuinStreet, Inc.(a) | | | 154,659 | | | | 1,037,762 | | |
Stamps.com, Inc.(a) | | | 65,390 | | | | 3,665,763 | | |
XO Group, Inc.(a) | | | 108,077 | | | | 1,677,355 | | |
Total | | | | | 59,801,078 | | |
IT Services 2.3% | |
CACI International, Inc., Class A(a) | | | 106,309 | | | | 9,279,713 | | |
Cardtronics, Inc.(a) | | | 198,888 | | | | 7,277,312 | | |
Ciber, Inc.(a) | | | 315,369 | | | | 1,236,246 | | |
CSG Systems International, Inc. | | | 153,347 | | | | 4,586,609 | | |
ExlService Holdings, Inc.(a) | | | 139,390 | | | | 4,864,711 | | |
Forrester Research, Inc. | | | 48,790 | | | | 1,835,480 | | |
Heartland Payment Systems, Inc. | | | 161,800 | | | | 7,933,054 | | |
iGATE Corp.(a) | | | 158,772 | | | | 6,795,442 | | |
Mantech International Corp., Class A | | | 104,900 | | | | 3,472,190 | | |
MAXIMUS, Inc. | | | 294,203 | | | | 17,425,644 | | |
Sykes Enterprises, Inc.(a) | | | 174,033 | | | | 4,046,267 | | |
TeleTech Holdings, Inc.(a) | | | 78,365 | | | | 1,904,269 | | |
Virtusa Corp.(a) | | | 119,908 | | | | 4,719,579 | | |
Total | | | | | 75,376,516 | | |
Semiconductors & Semiconductor Equipment 3.7% | |
Advanced Energy Industries, Inc.(a) | | | 168,363 | | | | 4,481,823 | | |
Brooks Automation, Inc. | | | 298,969 | | | | 3,587,628 | | |
Cabot Microelectronics Corp.(a) | | | 106,287 | | | | 5,506,730 | | |
Ceva, Inc.(a) | | | 90,195 | | | | 1,795,782 | | |
Cirrus Logic, Inc.(a) | | | 282,150 | | | | 8,495,537 | | |
Cohu, Inc. | | | 114,066 | | | | 1,242,179 | | |
Diodes, Inc.(a) | | | 163,667 | | | | 4,662,873 | | |
DSP Group, Inc.(a) | | | 96,543 | | | | 1,089,970 | | |
Entropic Communications, Inc.(a) | | | 402,357 | | | | 1,186,953 | | |
Exar Corp.(a) | | | 210,282 | | | | 2,254,223 | | |
Kopin Corp.(a) | | | 270,859 | | | | 1,172,819 | | |
Kulicke & Soffa Industries, Inc.(a) | | | 343,905 | | | | 5,502,480 | | |
Micrel, Inc. | | | 199,938 | | | | 2,985,074 | | |
Microsemi Corp.(a) | | | 424,548 | | | | 13,687,428 | | |
MKS Instruments, Inc. | | | 236,946 | | | | 8,378,411 | | |
Monolithic Power Systems, Inc. | | | 160,958 | | | | 8,487,315 | | |
Nanometrics, Inc.(a) | | | 107,910 | | | | 1,929,431 | | |
Pericom Semiconductor Corp. | | | 88,789 | | | | 1,385,108 | | |
Power Integrations, Inc. | | | 131,894 | | | | 7,235,705 | | |
The accompanying Notes to Financial Statements are an integral part of this statement.
Annual Report 2015
15
COLUMBIA SMALL CAP INDEX FUND
PORTFOLIO OF INVESTMENTS (continued)
February 28, 2015
Common Stocks (continued)
Issuer | | Shares | | Value ($) | |
Rudolph Technologies, Inc.(a) | | | 148,245 | | | | 1,827,861 | | |
Synaptics, Inc.(a) | | | 164,839 | | | | 14,167,912 | | |
Tessera Technologies, Inc. | | | 209,794 | | | | 8,404,348 | | |
Ultratech, Inc.(a) | | | 126,284 | | | | 2,278,163 | | |
Veeco Instruments, Inc.(a) | | | 179,655 | | | | 5,477,681 | | |
Total | | | | | 117,223,434 | | |
Software 2.7% | |
Blackbaud, Inc. | | | 206,780 | | | | 9,387,812 | | |
Bottomline Technologies de, Inc.(a) | | | 170,702 | | | | 4,520,189 | | |
Ebix, Inc. | | | 131,078 | | | | 3,444,730 | | |
EPIQ Systems, Inc. | | | 139,865 | | | | 2,461,624 | | |
Interactive Intelligence Group, Inc.(a) | | | 75,365 | | | | 3,198,491 | | |
Manhattan Associates, Inc.(a) | | | 333,388 | | | | 16,619,392 | | |
MicroStrategy, Inc., Class A(a) | | | 40,389 | | | | 7,202,974 | | |
Monotype Imaging Holdings, Inc. | | | 174,991 | | | | 5,601,462 | | |
Netscout Systems, Inc.(a) | | | 167,444 | | | | 6,751,342 | | |
Progress Software Corp.(a) | | | 224,183 | | | | 6,129,163 | | |
Synchronoss Technologies, Inc.(a) | | | 160,778 | | | | 7,116,034 | | |
Take-Two Interactive Software, Inc.(a) | | | 375,788 | | | | 9,954,624 | | |
Tangoe, Inc.(a) | | | 163,110 | | | | 2,024,195 | | |
VASCO Data Security International,
Inc.(a) | | | 131,123 | | | | 3,359,371 | | |
Total | | | | | 87,771,403 | | |
Technology Hardware, Storage & Peripherals 0.6% | |
Electronics for Imaging, Inc.(a) | | | 210,008 | | | | 8,526,325 | | |
QLogic Corp.(a) | | | 393,740 | | | | 5,910,037 | | |
Super Micro Computer, Inc.(a) | | | 156,092 | | | | 6,271,777 | | |
Total | | | | | 20,708,139 | | |
Total Information Technology | | | | | 527,427,450 | | |
MATERIALS 5.2% | |
Chemicals 2.3% | |
A. Schulman, Inc. | | | 130,183 | | | | 5,543,192 | | |
American Vanguard Corp. | | | 113,131 | | | | 1,274,986 | | |
Balchem Corp. | | | 137,322 | | | | 8,091,012 | | |
Calgon Carbon Corp.(a) | | | 237,726 | | | | 4,904,287 | | |
Flotek Industries, Inc.(a) | | | 224,085 | | | | 3,827,372 | | |
FutureFuel Corp. | | | 99,610 | | | | 1,225,203 | | |
H.B. Fuller Co. | | | 224,653 | | | | 10,041,989 | | |
Hawkins, Inc. | | | 42,227 | | | | 1,646,431 | | |
Common Stocks (continued)
Issuer | | Shares | | Value ($) | |
Innophos Holdings, Inc. | | | 97,120 | | | | 5,451,346 | | |
Intrepid Potash, Inc.(a) | | | 251,270 | | | | 3,547,932 | | |
Koppers Holdings, Inc. | | | 91,552 | | | | 1,475,818 | | |
Kraton Performance Polymers, Inc.(a) | | | 146,655 | | | | 2,959,498 | | |
LSB Industries, Inc.(a) | | | 86,865 | | | | 3,264,387 | | |
OM Group, Inc. | | | 137,663 | | | | 3,963,318 | | |
Quaker Chemical Corp. | | | 59,273 | | | | 4,811,782 | | |
Rayonier Advanced Materials, Inc. | | | 190,530 | | | | 3,536,237 | | |
Stepan Co. | | | 85,469 | | | | 3,511,067 | | |
Tredegar Corp. | | | 114,298 | | | | 2,349,967 | | |
Zep, Inc. | | | 103,130 | | | | 1,715,052 | | |
Total | | | | | 73,140,876 | | |
Construction Materials 0.1% | |
Headwaters, Inc.(a) | | | 328,373 | | | | 5,391,885 | | |
Containers & Packaging 0.1% | |
Myers Industries, Inc. | | | 111,209 | | | | 2,213,059 | | |
Metals & Mining 1.3% | |
AK Steel Holding Corp.(a) | | | 791,005 | | | | 3,496,242 | | |
AM Castle & Co.(a) | | | 77,696 | | | | 250,181 | | |
Century Aluminum Co.(a) | | | 230,454 | | | | 4,371,712 | | |
Globe Specialty Metals, Inc. | | | 286,613 | | | | 4,772,106 | | |
Haynes International, Inc. | | | 55,474 | | | | 2,240,040 | | |
Kaiser Aluminum Corp. | | | 79,479 | | | | 6,004,639 | | |
Materion Corp. | | | 90,029 | | | | 3,296,862 | | |
Olympic Steel, Inc. | | | 40,714 | | | | 614,374 | | |
RTI International Metals, Inc.(a) | | | 137,218 | | | | 3,824,266 | | |
Stillwater Mining Co.(a) | | | 536,843 | | | | 7,784,224 | | |
SunCoke Energy, Inc. | | | 295,797 | | | | 5,398,295 | | |
Total | | | | | 42,052,941 | | |
Paper & Forest Products 1.4% | |
Boise Cascade Co.(a) | | | 176,060 | | | | 6,269,497 | | |
Clearwater Paper Corp.(a) | | | 87,251 | | | | 5,327,546 | | |
Deltic Timber Corp. | | | 49,460 | | | | 3,273,263 | | |
KapStone Paper and Packaging Corp. | | | 377,378 | | | | 13,004,446 | | |
Neenah Paper, Inc. | | | 74,285 | | | | 4,488,300 | | |
PH Glatfelter Co. | | | 191,829 | | | | 4,699,810 | | |
Schweitzer-Mauduit International, Inc. | | | 136,097 | | | | 6,372,061 | | |
Wausau Paper Corp. | | | 223,360 | | | | 2,097,350 | | |
Total | | | | | 45,532,273 | | |
Total Materials | | | | | 168,331,034 | | |
The accompanying Notes to Financial Statements are an integral part of this statement.
Annual Report 2015
16
COLUMBIA SMALL CAP INDEX FUND
PORTFOLIO OF INVESTMENTS (continued)
February 28, 2015
Common Stocks (continued)
Issuer | | Shares | | Value ($) | |
TELECOMMUNICATION SERVICES 0.7% | |
Diversified Telecommunication Services 0.6% | |
8x8, Inc.(a) | | | 399,630 | | | | 2,961,258 | | |
Atlantic Tele-Network, Inc. | | | 44,804 | | | | 3,083,859 | | |
Cincinnati Bell, Inc.(a) | | | 934,674 | | | | 3,131,158 | | |
Consolidated Communications
Holdings, Inc. | | | 209,520 | | | | 4,458,586 | | |
General Communication, Inc., Class A(a) | | | 136,232 | | | | 1,889,538 | | |
Iridium Communications, Inc.(a) | | | 351,750 | | | | 3,369,765 | | |
Lumos Networks Corp. | | | 84,324 | | | | 1,452,059 | | |
Total | | | | | 20,346,223 | | |
Wireless Telecommunication Services 0.1% | |
Spok Holdings, Inc. | | | 96,859 | | | | 1,800,609 | | |
Total Telecommunication Services | | | | | 22,146,832 | | |
UTILITIES 3.7% | |
Electric Utilities 1.0% | |
Allete, Inc. | | | 188,801 | | | | 10,353,847 | | |
El Paso Electric Co. | | | 180,285 | | | | 6,818,379 | | |
UIL Holdings Corp. | | | 252,597 | | | | 12,768,778 | | |
Total | | | | | 29,941,004 | | |
Gas Utilities 1.9% | |
Laclede Group, Inc. (The) | | | 193,037 | | | | 9,991,595 | | |
New Jersey Resources Corp. | | | 188,733 | | | | 11,810,911 | | |
Northwest Natural Gas Co. | | | 121,535 | | | | 5,742,529 | | |
Piedmont Natural Gas Co., Inc. | | | 349,953 | | | | 13,053,247 | | |
South Jersey Industries, Inc. | | | 150,298 | | | | 8,518,890 | | |
Southwest Gas Corp. | | | 207,807 | | | | 11,899,029 | | |
Total | | | | | 61,016,201 | | |
Common Stocks (continued)
Issuer | | Shares | | Value ($) | |
Multi-Utilities 0.6% | |
Avista Corp. | | | 255,784 | | | | 8,722,234 | | |
NorthWestern Corp. | | | 205,092 | | | | 11,113,936 | | |
Total | | | | | 19,836,170 | | |
Water Utilities 0.2% | |
American States Water Co. | | | 171,534 | | | | 6,883,660 | | |
Total Utilities | | | | | 117,677,035 | | |
Total Common Stocks
(Cost: $2,062,308,431) | | | | | 3,127,389,637 | | |
Rights —% | |
INFORMATION TECHNOLOGY —% | |
Electronic Equipment, Instruments & Components —% | |
Gerber Scientific, Inc.(a)(b)(c)(d) | | | 112,391 | | | | — | | |
Total Information Technology | | | | | — | | |
| Total Rights (Cost: $—) | | | | | — | | |
Money Market Funds 2.2%
| | | Shares | | Value ($) | |
Columbia Short-Term Cash Fund,
0.118%(e)(f) | | | 69,923,613 | | | | 69,923,613 | | |
Total Money Market Funds
(Cost: $69,923,613) | | | | | 69,923,613 | | |
Total Investments
(Cost: $2,132,232,044) | | | | | 3,197,313,250 | | |
Other Assets & Liabilities, Net | | | | | 13,015,544 | | |
Net Assets | | | | | 3,210,328,794 | | |
Investments in Derivatives
Futures Contracts Outstanding at February 28, 2015
At February 28, 2015, cash totaling $3,473,100 was pledged as collateral to cover initial margin requirements on open futures contracts.
Long Futures Contracts Outstanding
Contract Description | | Number of
Contracts | | Trading
Currency | | Notional
Market
Value ($) | | Expiration
Date | | Unrealized
Appreciation ($) | | Unrealized
Depreciation ($) | |
RUSSELL 2000 EMINI ICE | | | 666 | | | USD | | | | | 82,024,560 | | | 03/2015 | | | 5,550,688 | | | | — | | |
The accompanying Notes to Financial Statements are an integral part of this statement.
Annual Report 2015
17
COLUMBIA SMALL CAP INDEX FUND
PORTFOLIO OF INVESTMENTS (continued)
February 28, 2015
Notes to Portfolio of Investments
(a) Non-income producing.
(b) Negligible market value.
(c) Represents fair value as determined in good faith under procedures approved by the Board of Trustees. At February 28, 2015, the value of these securities amounted to $0.
(d) Identifies securities considered by the Investment Manager to be illiquid as to their marketability. The aggregate value of such securities at February 28, 2015 was $0. Information concerning such security holdings at February 28, 2015 is as follows:
Security Description | | Acquisition Dates | | Cost ($) | |
Gerber Scientific, Inc. | | 8/22/11 | | | — | | |
(e) The rate shown is the seven-day current annualized yield at February 28, 2015.
(f) As defined in the Investment Company Act of 1940, an affiliated company is one in which the Fund owns 5% or more of the company's outstanding voting securities, or a company which is under common ownership or control with the Fund. Holdings and transactions in these affiliated companies during the year ended February 28, 2015, are as follows:
Issuer | | Beginning
Cost ($) | | Purchase
Cost ($) | | Proceeds
From Sales ($) | | Ending
Cost ($) | | Dividends —
Affiliated
Issuers ($) | | Value ($) | |
Columbia Short-Term Cash Fund | | | 69,671,430 | | | | 540,473,411 | | | | (540,221,228 | ) | | | 69,923,613 | | | | 73,257 | | | | 69,923,613 | | |
Currency Legend
USD US Dollar
Fair Value Measurements
Generally accepted accounting principles (GAAP) require disclosure regarding the inputs and valuation techniques used to measure fair value and any changes in valuation inputs or techniques. In addition, investments shall be disclosed by major category.
The Fund categorizes its fair value measurements according to a three-level hierarchy that maximizes the use of observable inputs and minimizes the use of unobservable inputs by prioritizing that the most observable input be used when available. Observable inputs are those that market participants would use in pricing an investment based on market data obtained from sources independent of the reporting entity. Unobservable inputs are those that reflect the Fund's assumptions about the information market participants would use in pricing an investment. An investment's level within the fair value hierarchy is based on the lowest level of any input that is deemed significant to the asset or liability's fair value measurement. The input levels are not necessarily an indication of the risk or liquidity associated with investments at that level. For example, certain U.S. government securities are generally high quality and liquid, however, they are reflected as Level 2 because the inputs used to determine fair value may not always be quoted prices in an active market.
Fair value inputs are summarized in the three broad levels listed below:
> Level 1 — Valuations based on quoted prices for investments in active markets that the Fund has the ability to access at the measurement date (including NAV for open-end mutual funds). Valuation adjustments are not applied to Level 1 investments.
> Level 2 — Valuations based on other significant observable inputs (including quoted prices for similar securities, interest rates, prepayment speeds, credit risks, etc.).
> Level 3 — Valuations based on significant unobservable inputs (including the Fund's own assumptions and judgment in determining the fair value of investments).
Inputs that are used in determining fair value of an investment may include price information, credit data, volatility statistics, and other factors. These inputs can be either observable or unobservable. The availability of observable inputs can vary between investments, and is affected by various factors such as the type of investment, and the volume and level of activity for that investment or similar investments in the marketplace. The inputs will be considered by the Investment Manager, along with any other relevant factors in the calculation of an investment's fair value. The Fund uses prices and inputs that are current as of the measurement date, which may include periods of market dislocations. During these periods, the availability of prices and inputs may be reduced for many investments. This condition could cause an investment to be reclassified between the various levels within the hierarchy.
The accompanying Notes to Financial Statements are an integral part of this statement.
Annual Report 2015
18
COLUMBIA SMALL CAP INDEX FUND
PORTFOLIO OF INVESTMENTS (continued)
February 28, 2015
Fair Value Measurements (continued)
Investments falling into the Level 3 category are primarily supported by quoted prices from brokers and dealers participating in the market for those investments. However, these may be classified as Level 3 investments due to lack of market transparency and corroboration to support these quoted prices. Additionally, valuation models may be used as the pricing source for any remaining investments classified as Level 3. These models may rely on one or more significant unobservable inputs and/or significant assumptions by the Investment Manager. Inputs used in valuations may include, but are not limited to, financial statement analysis, capital account balances, discount rates and estimated cash flows, and comparable company data.
Under the direction of the Fund's Board of Trustees (the Board), the Investment Manager's Valuation Committee (the Committee) is responsible for overseeing the valuation procedures approved by the Board. The Committee consists of voting and non-voting members from various groups within the Investment Manager's organization, including operations and accounting, trading and investments, compliance, risk management and legal.
The Committee meets at least monthly to review and approve valuation matters, which may include a description of specific valuation determinations, data regarding pricing information received from approved pricing vendors and brokers and the results of Board-approved valuation control policies and procedures (the Policies). The Policies address, among other things, instances when market quotations are or are not readily available, including recommendations of third party pricing vendors and a determination of appropriate pricing methodologies; events that require specific valuation determinations and assessment of fair value techniques; securities with a potential for stale pricing, including those that are illiquid, restricted, or in default; and the effectiveness of third party pricing vendors, including periodic reviews of vendors. The Committee meets more frequently, as needed, to discuss additional valuation matters, which may include the need to review back-testing results, review time-sensitive information or approve related valuation actions. The Committee reports to the Board, with members of the Committee meeting with the Board at each of its regularly scheduled meetings to discuss valuation matters and actions during the period, similar to those described earlier.
For investments categorized as Level 3, the Committee monitors information similar to that described above, which may include: (i) data specific to the issuer or comparable issuers, (ii) general market or specific sector news and (iii) quoted prices and specific or similar security transactions. The Committee considers this data and any changes from prior periods in order to assess the reasonableness of observable and unobservable inputs, any assumptions or internal models used to value those securities and changes in fair value. This data is also used to corroborate, when available, information received from approved pricing vendors and brokers. Various factors impact the frequency of monitoring this information (which may occur as often as daily). However, the Committee may determine that changes to inputs, assumptions and models are not required as a result of the monitoring procedures performed.
The following table is a summary of the inputs used to value the Fund's investments at February 28, 2015:
Description | | Level 1
Quoted Prices in Active
Markets for Identical
Assets ($) | |
Level 2
Other Significant
Observable Inputs ($) | |
Level 3
Significant
Unobservable Inputs ($) | |
Total ($) | |
Equity Securities | |
Common Stocks | |
Consumer Discretionary | | | 480,704,821 | | | | — | | | | — | | | | 480,704,821 | | |
Consumer Staples | | | 93,828,536 | | | | — | | | | — | | | | 93,828,536 | | |
Energy | | | 113,213,409 | | | | — | | | | — | | | | 113,213,409 | | |
Financials | | | 725,331,305 | | | | — | | | | — | | | | 725,331,305 | | |
Health Care | | | 378,059,271 | | | | — | | | | — | | | | 378,059,271 | | |
Industrials | | | 500,669,944 | | | | — | | | | — | | | | 500,669,944 | | |
Information Technology | | | 527,427,450 | | | | — | | | | — | | | | 527,427,450 | | |
Materials | | | 168,331,034 | | | | — | | | | — | | | | 168,331,034 | | |
Telecommunication Services | | | 22,146,832 | | | | — | | | | — | | | | 22,146,832 | | |
Utilities | | | 117,677,035 | | | | — | | | | — | | | | 117,677,035 | | |
Rights | |
Information Technology | | | — | | | | — | | | | 0 | (a) | | | 0 | (a) | |
Total Equity Securities | | | 3,127,389,637 | | | | — | | | | 0 | (a) | | | 3,127,389,637 | | |
The accompanying Notes to Financial Statements are an integral part of this statement.
Annual Report 2015
19
COLUMBIA SMALL CAP INDEX FUND
PORTFOLIO OF INVESTMENTS (continued)
February 28, 2015
Fair Value Measurements (continued)
Description | | Level 1
Quoted Prices in Active
Markets for Identical
Assets ($) | |
Level 2
Other Significant
Observable Inputs ($) | |
Level 3
Significant
Unobservable Inputs ($) | |
Total ($) | |
Mutual Funds | |
Money Market Funds | | | 69,923,613 | | | | — | | | | — | | | | 69,923,613 | | |
Total Mutual Funds | | | 69,923,613 | | | | — | | | | — | | | | 69,923,613 | | |
Investments in Securities | | | 3,197,313,250 | | | | — | | | | 0 | (a) | | | 3,197,313,250 | | |
Derivatives | |
Assets | |
Futures Contracts | | | 5,550,688 | | | | — | | | | — | | | | 5,550,688 | | |
Total | | | 3,202,863,938 | | | | — | | | | 0 | (a) | | | 3,202,863,938 | | |
(a) Rounds to zero.
See the Portfolio of Investments for all investment classifications not indicated in the table.
There were no transfers of financial assets between levels during the period.
Derivative instruments are valued at unrealized appreciation (depreciation).
The Fund does not hold any significant investments with unobservable inputs which are categorized as Level 3.
The Fund's assets assigned to the Level 3 category are valued utilizing the valuation technique deemed the most appropriate in the circumstances. Certain rights classified as Level 3 are valued using an income approach. To determine fair value for these securities, management considered estimates of future distributions related to the potential actions of the respective company's restructuring. Significant increases (decreases) to any of these inputs would result in a significantly lower (higher) fair value measurement.
The accompanying Notes to Financial Statements are an integral part of this statement.
Annual Report 2015
20
COLUMBIA SMALL CAP INDEX FUND
STATEMENT OF ASSETS AND LIABILITIES
February 28, 2015
Assets | |
Investments, at value | |
Unaffiliated issuers (identified cost $2,062,308,431) | | $ | 3,127,389,637 | | |
Affiliated issuers (identified cost $69,923,613) | | | 69,923,613 | | |
Total investments (identified cost $2,132,232,044) | | | 3,197,313,250 | | |
Margin deposits | | | 3,473,100 | | |
Receivable for: | |
Investments sold | | | 10,958,250 | | |
Capital shares sold | | | 3,234,821 | | |
Dividends | | | 2,994,367 | | |
Expense reimbursement due from Investment Manager | | | 167 | | |
Total assets | | | 3,217,973,955 | | |
Liabilities | |
Disbursements in excess of cash | | | 2,142,962 | | |
Payable for: | |
Investments purchased | | | 955,687 | | |
Capital shares purchased | | | 3,932,696 | | |
Variation margin | | | 420,221 | | |
Investment management fees | | | 8,832 | | |
Distribution and/or service fees | | | 9,098 | | |
Administration fees | | | 8,832 | | |
Plan administration fees | | | 2,537 | | |
Compensation of board members | | | 163,600 | | |
Other expenses | | | 696 | | |
Total liabilities | | | 7,645,161 | | |
Net assets applicable to outstanding capital stock | | $ | 3,210,328,794 | | |
Represented by | |
Paid-in capital | | $ | 2,108,108,334 | | |
Undistributed net investment income | | | 3,139,742 | | |
Accumulated net realized gain | | | 28,448,824 | | |
Unrealized appreciation (depreciation) on: | |
Investments | | | 1,065,081,206 | | |
Futures contracts | | | 5,550,688 | | |
Total — representing net assets applicable to outstanding capital stock | | $ | 3,210,328,794 | | |
The accompanying Notes to Financial Statements are an integral part of this statement.
Annual Report 2015
21
COLUMBIA SMALL CAP INDEX FUND
STATEMENT OF ASSETS AND LIABILITIES (continued)
February 28, 2015
Class A | |
Net assets | | $ | 1,231,774,167 | | |
Shares outstanding | | | 52,887,283 | | |
Net asset value per share | | $ | 23.29 | | |
Class B | |
Net assets | | $ | 5,664,425 | | |
Shares outstanding | | | 244,572 | | |
Net asset value per share | | $ | 23.16 | | |
Class I | |
Net assets | | $ | 2,468 | | |
Shares outstanding | | | 106 | | |
Net asset value per share(a) | | $ | 23.32 | | |
Class K | |
Net assets | | $ | 13,023,349 | | |
Shares outstanding | | | 557,323 | | |
Net asset value per share | | $ | 23.37 | | |
Class R5 | |
Net assets | | $ | 166,247,472 | | |
Shares outstanding | | | 6,992,289 | | |
Net asset value per share | | $ | 23.78 | | |
Class W | |
Net assets | | $ | 67,779,630 | | |
Shares outstanding | | | 2,931,532 | | |
Net asset value per share | | $ | 23.12 | | |
Class Z | |
Net assets | | $ | 1,725,837,283 | | |
Shares outstanding | | | 73,789,978 | | |
Net asset value per share | | $ | 23.39 | | |
(a) Net asset value per share rounds to this amount due to fractional shares outstanding.
The accompanying Notes to Financial Statements are an integral part of this statement.
Annual Report 2015
22
COLUMBIA SMALL CAP INDEX FUND
STATEMENT OF OPERATIONS
Year Ended February 28, 2015
Net investment income | |
Income: | |
Dividends — unaffiliated issuers | | $ | 39,531,174 | | |
Dividends — affiliated issuers | | | 73,257 | | |
Interest | | | 87 | | |
Foreign taxes withheld | | | (6,591 | ) | |
Total income | | | 39,597,927 | | |
Expenses: | |
Investment management fees | | | 2,955,890 | | |
Distribution and/or service fees | |
Class A | | | 2,861,728 | | |
Class B | | | 71,139 | | |
Class W(a) | | | 52,368 | | |
Administration fees | | | 2,955,890 | | |
Plan administration fees | |
Class K | | | 31,462 | | |
Compensation of board members | | | 59,707 | | |
Other | | | 10,437 | | |
Total expenses | | | 8,998,621 | | |
Fees waived or expenses reimbursed by Investment Manager and its affiliates | | | (70,146 | ) | |
Expense reductions | | | (2,828 | ) | |
Total net expenses | | | 8,925,647 | | |
Net investment income | | | 30,672,280 | | |
Realized and unrealized gain (loss) — net | |
Net realized gain (loss) on: | |
Investments | | | 211,382,473 | | |
Futures contracts | | | 1,986,908 | | |
Net realized gain | | | 213,369,381 | | |
Net change in unrealized appreciation (depreciation) on: | |
Investments | | | (25,155,198 | ) | |
Futures contracts | | | 693,672 | | |
Net change in unrealized depreciation | | | (24,461,526 | ) | |
Net realized and unrealized gain | | | 188,907,855 | | |
Net increase in net assets resulting from operations | | $ | 219,580,135 | | |
(a) Based on operations from June 25, 2014 (commencement of operations) through the stated period end.
The accompanying Notes to Financial Statements are an integral part of this statement.
Annual Report 2015
23
COLUMBIA SMALL CAP INDEX FUND
STATEMENT OF CHANGES IN NET ASSETS
| | | Year Ended
February 28,
2015(a) | | Year Ended
February 28,
2014 | |
Operations | |
Net investment income | | $ | 30,672,280 | | | $ | 21,511,579 | | |
Net realized gain | | | 213,369,381 | | | | 173,970,914 | | |
Net change in unrealized appreciation (depreciation) | | | (24,461,526 | ) | | | 468,684,271 | | |
Net increase in net assets resulting from operations | | | 219,580,135 | | | | 664,166,764 | | |
Distributions to shareholders | |
Net investment income | |
Class A | | | (9,063,779 | ) | | | (6,654,997 | ) | |
Class B | | | (7,070 | ) | | | (3,954 | ) | |
Class I | | | (26 | ) | | | (31 | ) | |
Class K | | | (96,665 | ) | | | (79,225 | ) | |
Class R5 | | | (1,350,713 | ) | | | (419,714 | ) | |
Class W | | | (499,115 | ) | | | — | | |
Class Z | | | (17,034,267 | ) | | | (13,990,244 | ) | |
Net realized gains | |
Class A | | | (83,792,409 | ) | | | (50,037,594 | ) | |
Class B | | | (492,490 | ) | | | (577,915 | ) | |
Class I | | | (177 | ) | | | (180 | ) | |
Class K | | | (902,686 | ) | | | (615,780 | ) | |
Class R5 | | | (8,689,693 | ) | | | (1,943,999 | ) | |
Class W | | | (2,806,647 | ) | | | — | | |
Class Z | | | (118,368,963 | ) | | | (80,628,656 | ) | |
Total distributions to shareholders | | | (243,104,700 | ) | | | (154,952,289 | ) | |
Increase in net assets from capital stock activity | | | 381,211,734 | | | | 358,468,551 | | |
Total increase in net assets | | | 357,687,169 | | | | 867,683,026 | | |
Net assets at beginning of year | | | 2,852,641,625 | | | | 1,984,958,599 | | |
Net assets at end of year | | $ | 3,210,328,794 | | | $ | 2,852,641,625 | | |
Undistributed net investment income | | $ | 3,139,742 | | | $ | 1,528,277 | | |
(a) Class W shares are based on operations from June 25, 2014 (commencement of operations) through the stated period end.
The accompanying Notes to Financial Statements are an integral part of this statement.
Annual Report 2015
24
COLUMBIA SMALL CAP INDEX FUND
STATEMENT OF CHANGES IN NET ASSETS (continued)
| | | Year ended February 28, 2015(a) | | Year ended February 28, 2014 | |
| | | Shares | | Dollars ($) | | Shares | | Dollars ($) | |
Capital stock activity | |
Class A shares | |
Subscriptions(b) | | | 17,321,688 | | | | 396,157,532 | | | | 19,882,789 | | | | 432,044,976 | | |
Distributions reinvested | | | 3,792,241 | | | | 85,751,001 | | | | 2,444,682 | | | | 53,421,096 | | |
Redemptions | | | (15,535,240 | ) | | | (354,019,081 | ) | | | (11,235,169 | ) | | | (245,339,703 | ) | |
Net increase | | | 5,578,689 | | | | 127,889,452 | | | | 11,092,302 | | | | 240,126,369 | | |
Class B shares | |
Subscriptions | | | 6,915 | | | | 158,500 | | | | 23,579 | | | | 504,218 | | |
Distributions reinvested | | | 22,120 | | | | 498,875 | | | | 27,173 | | | | 581,060 | | |
Redemptions(b) | | | (188,409 | ) | | | (4,261,122 | ) | | | (258,854 | ) | | | (5,599,592 | ) | |
Net decrease | | | (159,374 | ) | | | (3,603,747 | ) | | | (208,102 | ) | | | (4,514,314 | ) | |
Class I shares | |
Redemptions | | | (46 | ) | | | (1,100 | ) | | | — | | | | — | | |
Net increase (decrease) | | | (46 | ) | | | (1,100 | ) | | | — | | | | — | | |
Class K shares | |
Subscriptions | | | 84,413 | | | | 1,943,751 | | | | 100,700 | | | | 2,181,086 | | |
Distributions reinvested | | | 44,044 | | | | 999,154 | | | | 31,816 | | | | 694,817 | | |
Redemptions | | | (112,355 | ) | | | (2,573,565 | ) | | | (104,881 | ) | | | (2,302,520 | ) | |
Net increase | | | 16,102 | | | | 369,340 | | | | 27,635 | | | | 573,383 | | |
Class R5 shares | |
Subscriptions | | | 4,892,620 | | | | 113,702,536 | | | | 3,840,376 | | | | 85,575,154 | | |
Distributions reinvested | | | 408,553 | | | | 9,402,196 | | | | 97,658 | | | | 2,230,263 | | |
Redemptions | | | (1,631,742 | ) | | | (37,962,764 | ) | | | (619,362 | ) | | | (13,677,166 | ) | |
Net increase | | | 3,669,431 | | | | 85,141,968 | | | | 3,318,672 | | | | 74,128,251 | | |
Class W shares | |
Subscriptions | | | 2,949,425 | | | | 68,406,217 | | | | — | | | | — | | |
Distributions reinvested | | | 148,970 | | | | 3,305,611 | | | | — | | | | — | | |
Redemptions | | | (166,863 | ) | | | (3,765,601 | ) | | | — | | | | — | | |
Net increase | | | 2,931,532 | | | | 67,946,227 | | | | — | | | | — | | |
Class Z shares | |
Subscriptions | | | 17,901,224 | | | | 410,896,361 | | | | 15,910,019 | | | | 343,579,759 | | |
Distributions reinvested | | | 3,806,276 | | | | 86,333,330 | | | | 2,645,949 | | | | 57,907,206 | | |
Redemptions | | | (17,182,275 | ) | | | (393,760,097 | ) | | | (16,215,593 | ) | | | (353,332,103 | ) | |
Net increase | | | 4,525,225 | | | | 103,469,594 | | | | 2,340,375 | | | | 48,154,862 | | |
Total net increase | | | 16,561,559 | | | | 381,211,734 | | | | 16,570,882 | | | | 358,468,551 | | |
(a) Class W shares are based on operations from June 25, 2014 (commencement of operations) through the stated period end.
(b) Includes conversions of Class B shares to Class A shares, if any.
The accompanying Notes to Financial Statements are an integral part of this statement.
Annual Report 2015
25
COLUMBIA SMALL CAP INDEX FUND
The following tables are intended to help you understand the Fund's financial performance. Certain information reflects financial results for a single share of a class held for the periods shown. Per share net investment income (loss) amounts are calculated based on average shares outstanding during the period. Total return assumes reinvestment of all dividends and distributions, if any. Total return does not reflect payment of sales charges, if any. Total return and portfolio turnover are not annualized for periods of less than one year. The portfolio turnover rate is calculated without regard to purchase and sales transactions of short-term instruments and certain derivatives, if any. If such transactions were included, the Fund's portfolio turnover rate may be higher.
| | | Year Ended February 28, | | Year Ended
February 29, | | Year Ended
February 28, | |
Class A | | 2015 | | 2014 | | 2013 | | 2012 | | 2011 | |
Per share data | |
Net asset value, beginning of period | | $ | 23.54 | | | $ | 19.00 | | | $ | 17.75 | | | $ | 18.01 | | | $ | 13.97 | | |
Income from investment operations: | |
Net investment income | | | 0.20 | | | | 0.16 | | | | 0.24 | | | | 0.12 | | | | 0.12 | | |
Net realized and unrealized gain | | | 1.40 | | | | 5.72 | | | | 2.14 | | | | 0.66 | | | | 4.14 | | |
Total from investment operations | | | 1.60 | | | | 5.88 | | | | 2.38 | | | | 0.78 | | | | 4.26 | | |
Less distributions to shareholders: | |
Net investment income | | | (0.18 | ) | | | (0.15 | ) | | | (0.25 | ) | | | (0.12 | ) | | | (0.12 | ) | |
Net realized gains | | | (1.67 | ) | | | (1.19 | ) | | | (0.88 | ) | | | (0.92 | ) | | | (0.10 | ) | |
Total distributions to shareholders | | | (1.85 | ) | | | (1.34 | ) | | | (1.13 | ) | | | (1.04 | ) | | | (0.22 | ) | |
Proceeds from regulatory settlements | | | — | | | | — | | | | — | | | | 0.00 | (a) | | | — | | |
Net asset value, end of period | | $ | 23.29 | | | $ | 23.54 | | | $ | 19.00 | | | $ | 17.75 | | | $ | 18.01 | | |
Total return | | | 7.19 | % | | | 31.63 | % | | | 14.32 | % | | | 4.65 | % | | | 30.55 | % | |
Ratios to average net assets(b) | |
Total gross expenses | | | 0.45 | % | | | 0.45 | % | | | 0.45 | %(c) | | | 0.45 | % | | | 0.45 | % | |
Total net expenses(d) | | | 0.45 | %(e) | | | 0.45 | %(e) | | | 0.45 | %(c)(e) | | | 0.45 | %(e) | | | 0.45 | % | |
Net investment income | | | 0.89 | % | | | 0.73 | % | | | 1.37 | % | | | 0.74 | % | | | 0.73 | % | |
Supplemental data | |
Net assets, end of period (in thousands) | | $ | 1,231,774 | | | $ | 1,113,746 | | | $ | 687,934 | | | $ | 570,806 | | | $ | 183,578 | | |
Portfolio turnover | | | 17 | % | | | 15 | % | | | 17 | % | | | 20 | % | | | 14 | % | |
Notes to Financial Highlights
(a) Rounds to zero.
(b) In addition to the fees and expenses that the Fund bears directly, the Fund indirectly bears a pro rata share of the fees and expenses of any other funds in which it invests. Such indirect expenses are not included in the Fund's reported expense ratios.
(c) Ratios include line of credit interest expense which is less than 0.01%.
(d) Total net expenses include the impact of certain fee waivers/expense reimbursements made by the Investment Manager and certain of its affiliates, if applicable.
(e) The benefits derived from expense reductions had an impact of less than 0.01%.
The accompanying Notes to Financial Statements are an integral part of this statement.
Annual Report 2015
26
COLUMBIA SMALL CAP INDEX FUND
FINANCIAL HIGHLIGHTS (continued)
| | | Year Ended February 28, | | Year Ended
February 29, | |
Class B | | 2015 | | 2014 | | 2013 | | 2012(a) | |
Per share data | |
Net asset value, beginning of period | | $ | 23.44 | | | $ | 18.95 | | | $ | 17.73 | | | $ | 17.82 | | |
Income from investment operations: | |
Net investment income (loss) | | | 0.02 | | | | (0.01 | ) | | | 0.11 | | | | 0.00 | (b) | |
Net realized and unrealized gain | | | 1.40 | | | | 5.70 | | | | 2.13 | | | | 0.84 | | |
Total from investment operations | | | 1.42 | | | | 5.69 | | | | 2.24 | | | | 0.84 | | |
Less distributions to shareholders: | |
Net investment income | | | (0.03 | ) | | | (0.01 | ) | | | (0.14 | ) | | | (0.01 | ) | |
Net realized gains | | | (1.67 | ) | | | (1.19 | ) | | | (0.88 | ) | | | (0.92 | ) | |
Total distributions to shareholders | | | (1.70 | ) | | | (1.20 | ) | | | (1.02 | ) | | | (0.93 | ) | |
Proceeds from regulatory settlements | | | — | | | | — | | | | — | | | | 0.00 | (b) | |
Net asset value, end of period | | $ | 23.16 | | | $ | 23.44 | | | $ | 18.95 | | | $ | 17.73 | | |
Total return | | | 6.39 | % | | | 30.64 | % | | | 13.45 | % | | | 4.97 | % | |
Ratios to average net assets(c) | |
Total gross expenses | | | 1.20 | % | | | 1.20 | % | | | 1.20 | %(d) | | | 1.20 | %(e) | |
Total net expenses(f) | | | 1.20 | %(g) | | | 1.20 | %(g) | | | 1.20 | %(d)(g) | | | 1.20 | %(e)(g) | |
Net investment income (loss) | | | 0.11 | % | | | (0.02 | %) | | | 0.61 | % | | | 0.01 | %(e) | |
Supplemental data | |
Net assets, end of period (in thousands) | | $ | 5,664 | | | $ | 9,469 | | | $ | 11,596 | | | $ | 17,410 | | |
Portfolio turnover | | | 17 | % | | | 15 | % | | | 17 | % | | | 20 | % | |
Notes to Financial Highlights
(a) Based on operations from March 7, 2011 (commencement of operations) through the stated period end.
(b) Rounds to zero.
(c) In addition to the fees and expenses that the Fund bears directly, the Fund indirectly bears a pro rata share of the fees and expenses of any other funds in which it invests. Such indirect expenses are not included in the Fund's reported expense ratios.
(d) Ratios include line of credit interest expense which is less than 0.01%.
(e) Annualized.
(f) Total net expenses include the impact of certain fee waivers/expense reimbursements made by the Investment Manager and certain of its affiliates, if applicable.
(g) The benefits derived from expense reductions had an impact of less than 0.01%.
The accompanying Notes to Financial Statements are an integral part of this statement.
Annual Report 2015
27
COLUMBIA SMALL CAP INDEX FUND
FINANCIAL HIGHLIGHTS (continued)
| | | Year Ended February 28, | | Year Ended
February 29, | |
Class I | | 2015 | | 2014 | | 2013 | | 2012(a) | |
Per share data | |
Net asset value, beginning of period | | $ | 23.56 | | | $ | 19.01 | | | $ | 17.76 | | | $ | 16.47 | | |
Income from investment operations: | |
Net investment income | | | 0.27 | | | | 0.21 | | | | 0.29 | | | | 0.05 | | |
Net realized and unrealized gain | | | 1.41 | | | | 5.73 | | | | 2.14 | | | | 1.87 | | |
Total from investment operations | | | 1.68 | | | | 5.94 | | | | 2.43 | | | | 1.92 | | |
Less distributions to shareholders: | |
Net investment income | | | (0.25 | ) | | | (0.20 | ) | | | (0.30 | ) | | | (0.17 | ) | |
Net realized gains | | | (1.67 | ) | | | (1.19 | ) | | | (0.88 | ) | | | (0.46 | ) | |
Total distributions to shareholders | | | (1.92 | ) | | | (1.39 | ) | | | (1.18 | ) | | | (0.63 | ) | |
Proceeds from regulatory settlements | | | — | | | | — | | | | — | | | | 0.00 | (b) | |
Net asset value, end of period | | $ | 23.32 | | | $ | 23.56 | | | $ | 19.01 | | | $ | 17.76 | | |
Total return | | | 7.53 | % | | | 31.97 | % | | | 14.63 | % | | | 12.03 | % | |
Ratios to average net assets(c) | |
Total gross expenses | | | 0.20 | % | | | 0.22 | % | | | 0.18 | %(d) | | | 0.17 | %(e) | |
Total net expenses(f) | | | 0.20 | % | | | 0.20 | % | | | 0.18 | %(d) | | | 0.17 | %(e) | |
Net investment income | | | 1.17 | % | | | 0.98 | % | | | 1.65 | % | | | 1.09 | %(e) | |
Supplemental data | |
Net assets, end of period (in thousands) | | $ | 2 | | | $ | 4 | | | $ | 3 | | | $ | 3 | | |
Portfolio turnover | | | 17 | % | | | 15 | % | | | 17 | % | | | 20 | % | |
Notes to Financial Highlights
(a) Based on operations from November 16, 2011 (commencement of operations) through the stated period end.
(b) Rounds to zero.
(c) In addition to the fees and expenses that the Fund bears directly, the Fund indirectly bears a pro rata share of the fees and expenses of any other funds in which it invests. Such indirect expenses are not included in the Fund's reported expense ratios.
(d) Ratios include line of credit interest expense which is less than 0.01%.
(e) Annualized.
(f) Total net expenses include the impact of certain fee waivers/expense reimbursements made by the Investment Manager and certain of its affiliates, if applicable.
The accompanying Notes to Financial Statements are an integral part of this statement.
Annual Report 2015
28
COLUMBIA SMALL CAP INDEX FUND
FINANCIAL HIGHLIGHTS (continued)
| | | Year Ended February 28, | | Year Ended
February 29, | |
Class K | | 2015 | | 2014 | | 2013 | | 2012(a) | |
Per share data | |
Net asset value, beginning of period | | $ | 23.61 | | | $ | 19.05 | | | $ | 17.80 | | | $ | 17.87 | | |
Income from investment operations: | |
Net investment income | | | 0.20 | | | | 0.16 | | | | 0.24 | | | | 0.13 | | |
Net realized and unrealized gain | | | 1.41 | | | | 5.74 | | | | 2.14 | | | | 0.84 | | |
Total from investment operations | | | 1.61 | | | | 5.90 | | | | 2.38 | | | | 0.97 | | |
Less distributions to shareholders: | |
Net investment income | | | (0.18 | ) | | | (0.15 | ) | | | (0.25 | ) | | | (0.12 | ) | |
Net realized gains | | | (1.67 | ) | | | (1.19 | ) | | | (0.88 | ) | | | (0.92 | ) | |
Total distributions to shareholders | | | (1.85 | ) | | | (1.34 | ) | | | (1.13 | ) | | | (1.04 | ) | |
Proceeds from regulatory settlements | | | — | | | | — | | | | — | | | | 0.00 | (b) | |
Net asset value, end of period | | $ | 23.37 | | | $ | 23.61 | | | $ | 19.05 | | | $ | 17.80 | | |
Total return | | | 7.22 | % | | | 31.65 | % | | | 14.27 | % | | | 5.76 | % | |
Ratios to average net assets(c) | |
Total gross expenses | | | 0.45 | % | | | 0.45 | % | | | 0.45 | %(d) | | | 0.45 | %(e) | |
Total net expenses(f) | | | 0.45 | % | | | 0.45 | % | | | 0.45 | %(d) | | | 0.45 | %(e) | |
Net investment income | | | 0.88 | % | | | 0.73 | % | | | 1.37 | % | | | 0.76 | %(e) | |
Supplemental data | |
Net assets, end of period (in thousands) | | $ | 13,023 | | | $ | 12,781 | | | $ | 9,784 | | | $ | 9,858 | | |
Portfolio turnover | | | 17 | % | | | 15 | % | | | 17 | % | | | 20 | % | |
Notes to Financial Highlights
(a) Based on operations from March 7, 2011 (commencement of operations) through the stated period end.
(b) Rounds to zero.
(c) In addition to the fees and expenses that the Fund bears directly, the Fund indirectly bears a pro rata share of the fees and expenses of any other funds in which it invests. Such indirect expenses are not included in the Fund's reported expense ratios.
(d) Ratios include line of credit interest expense which is less than 0.01%.
(e) Annualized.
(f) Total net expenses include the impact of certain fee waivers/expense reimbursements made by the Investment Manager and certain of its affiliates, if applicable.
The accompanying Notes to Financial Statements are an integral part of this statement.
Annual Report 2015
29
COLUMBIA SMALL CAP INDEX FUND
FINANCIAL HIGHLIGHTS (continued)
| | | Year Ended February 28, | |
Class R5 | | 2015 | | 2014 | | 2013(a) | |
Per share data | |
Net asset value, beginning of period | | $ | 23.99 | | | $ | 19.33 | | | $ | 17.47 | | |
Income from investment operations: | |
Net investment income | | | 0.27 | | | | 0.23 | | | | 0.07 | | |
Net realized and unrealized gain | | | 1.43 | | | | 5.82 | | | | 2.40 | | |
Total from investment operations | | | 1.70 | | | | 6.05 | | | | 2.47 | | |
Less distributions to shareholders: | |
Net investment income | | | (0.24 | ) | | | (0.20 | ) | | | (0.30 | ) | |
Net realized gains | | | (1.67 | ) | | | (1.19 | ) | | | (0.31 | ) | |
Total distributions to shareholders | | | (1.91 | ) | | | (1.39 | ) | | | (0.61 | ) | |
Net asset value, end of period | | $ | 23.78 | | | $ | 23.99 | | | $ | 19.33 | | |
Total return | | | 7.49 | % | | | 32.01 | % | | | 14.51 | % | |
Ratios to average net assets(b) | |
Total gross expenses | | | 0.20 | % | | | 0.20 | % | | | 0.24 | %(c) | |
Total net expenses(d) | | | 0.20 | % | | | 0.20 | % | | | 0.20 | %(c) | |
Net investment income | | | 1.17 | % | | | 0.99 | % | | | 1.44 | %(c) | |
Supplemental data | |
Net assets, end of period (in thousands) | | $ | 166,247 | | | $ | 79,726 | | | $ | 81 | | |
Portfolio turnover | | | 17 | % | | | 15 | % | | | 17 | % | |
Notes to Financial Highlights
(a) Based on operations from November 8, 2012 (commencement of operations) through the stated period end.
(b) In addition to the fees and expenses that the Fund bears directly, the Fund indirectly bears a pro rata share of the fees and expenses of any other funds in which it invests. Such indirect expenses are not included in the Fund's reported expense ratios.
(c) Annualized.
(d) Total net expenses include the impact of certain fee waivers/expense reimbursements made by the Investment Manager and certain of its affiliates, if applicable.
The accompanying Notes to Financial Statements are an integral part of this statement.
Annual Report 2015
30
COLUMBIA SMALL CAP INDEX FUND
FINANCIAL HIGHLIGHTS (continued)
Class W | | Year Ended
February 28,
2015(a) | |
Per share data | |
Net asset value, beginning of period | | $ | 23.08 | | |
Income from investment operations: | |
Net investment income | | | 0.18 | | |
Net realized and unrealized gain | | | 1.03 | | |
Total from investment operations | | | 1.21 | | |
Less distributions to shareholders: | |
Net investment income | | | (0.18 | ) | |
Net realized gains | | | (0.99 | ) | |
Total distributions to shareholders | | | (1.17 | ) | |
Net asset value, end of period | | $ | 23.12 | | |
Total return | | | 5.45 | % | |
Ratios to average net assets(b) | |
Total gross expenses | | | 0.46 | %(c) | |
Total net expenses(d) | | | 0.45 | %(c)(e) | |
Net investment income | | | 1.22 | %(c) | |
Supplemental data | |
Net assets, end of period (in thousands) | | $ | 67,780 | | |
Portfolio turnover | | | 17 | % | |
Notes to Financial Highlights
(a) Based on operations from June 25, 2014 (commencement of operations) through the stated period end.
(b) In addition to the fees and expenses that the Fund bears directly, the Fund indirectly bears a pro rata share of the fees and expenses of any other funds in which it invests. Such indirect expenses are not included in the Fund's reported expense ratios.
(c) Annualized.
(d) Total net expenses include the impact of certain fee waivers/expense reimbursements made by the Investment Manager and certain of its affiliates, if applicable.
(e) The benefits derived from expense reductions had an impact of less than 0.01%.
The accompanying Notes to Financial Statements are an integral part of this statement.
Annual Report 2015
31
COLUMBIA SMALL CAP INDEX FUND
FINANCIAL HIGHLIGHTS (continued)
| | | Year Ended February 28, | | Year Ended
February 29, | | Year Ended
February 28, | |
Class Z | | 2015 | | 2014 | | 2013 | | 2012 | | 2011 | |
Per share data | |
Net asset value, beginning of period | | $ | 23.63 | | | $ | 19.06 | | | $ | 17.81 | | | $ | 18.06 | | | $ | 14.01 | | |
Income from investment operations: | |
Net investment income | | | 0.26 | | | | 0.21 | | | | 0.29 | | | | 0.16 | | | | 0.15 | | |
Net realized and unrealized gain | | | 1.41 | | | | 5.75 | | | | 2.14 | | | | 0.66 | | | | 4.15 | | |
Total from investment operations | | | 1.67 | | | | 5.96 | | | | 2.43 | | | | 0.82 | | | | 4.30 | | |
Less distributions to shareholders: | |
Net investment income | | | (0.24 | ) | | | (0.20 | ) | | | (0.30 | ) | | | (0.15 | ) | | | (0.15 | ) | |
Net realized gains | | | (1.67 | ) | | | (1.19 | ) | | | (0.88 | ) | | | (0.92 | ) | | | (0.10 | ) | |
Total distributions to shareholders | | | (1.91 | ) | | | (1.39 | ) | | | (1.18 | ) | | | (1.07 | ) | | | (0.25 | ) | |
Proceeds from regulatory settlements | | | — | | | | — | | | | — | | | | 0.00 | (a) | | | — | | |
Net asset value, end of period | | $ | 23.39 | | | $ | 23.63 | | | $ | 19.06 | | | $ | 17.81 | | | $ | 18.06 | | |
Total return | | | 7.47 | % | | | 31.99 | % | | | 14.54 | % | | | 4.92 | % | | | 30.81 | % | |
Ratios to average net assets(b) | |
Total gross expenses | | | 0.20 | % | | | 0.20 | % | | | 0.20 | %(c) | | | 0.20 | % | | | 0.20 | % | |
Total net expenses(d) | | | 0.20 | %(e) | | | 0.20 | %(e) | | | 0.20 | %(c)(e) | | | 0.20 | %(e) | | | 0.20 | % | |
Net investment income | | | 1.14 | % | | | 0.98 | % | | | 1.64 | % | | | 0.96 | % | | | 0.97 | % | |
Supplemental data | |
Net assets, end of period (in thousands) | | $ | 1,725,837 | | | $ | 1,636,915 | | | $ | 1,275,562 | | | $ | 1,700,205 | | | $ | 1,681,152 | | |
Portfolio turnover | | | 17 | % | | | 15 | % | | | 17 | % | | | 20 | % | | | 14 | % | |
Notes to Financial Highlights
(a) Rounds to zero.
(b) In addition to the fees and expenses that the Fund bears directly, the Fund indirectly bears a pro rata share of the fees and expenses of any other funds in which it invests. Such indirect expenses are not included in the Fund's reported expense ratios.
(c) Ratios include line of credit interest expense which is less than 0.01%.
(d) Total net expenses include the impact of certain fee waivers/expense reimbursements made by the Investment Manager and certain of its affiliates, if applicable.
(e) The benefits derived from expense reductions had an impact of less than 0.01%.
The accompanying Notes to Financial Statements are an integral part of this statement.
Annual Report 2015
32
COLUMBIA SMALL CAP INDEX FUND
NOTES TO FINANCIAL STATEMENTS
February 28, 2015
Note 1. Organization
Columbia Small Cap Index Fund (the Fund), a series of Columbia Funds Series Trust (the Trust), is a diversified fund. The Trust is registered under the Investment Company Act of 1940, as amended (the 1940 Act), as an open-end management investment company organized as a Delaware statutory trust.
Fund Shares
The Trust may issue an unlimited number of shares (without par value). The Fund offers Class A, Class B, Class I, Class K, Class R5, Class W and Class Z shares. Although all share classes generally have identical voting, dividend and liquidation rights, each share class votes separately when required by the Trust's organizational documents or by law. Different share classes pay different distribution amounts to the extent the expenses of such share classes differ, and distributions in liquidation will be proportional to the net asset value of each share class. Each share class has its own expense structure and sales charges.
Class A shares are not subject to any front-end sales charge or contingent deferred sales charge (CDSC).
Class B shares may be subject to a maximum CDSC of 5.00% based upon the holding period after purchase. Class B shares will generally convert to Class A shares eight years after purchase. The Fund no longer accepts investments by new or existing investors in the Fund's Class B shares, except in connection with the reinvestment of any dividend and/or capital gain distributions in Class B shares of the Fund and exchanges by existing Class B shareholders of certain other funds within the Columbia Family of Funds.
Class I shares are not subject to sales charges and are available only to the Columbia Family of Funds.
Class K shares are not subject to sales charges, however this share class is closed to new investors.
Class R5 shares are not subject to sales charges and are generally available only to investors purchasing through authorized investment professionals and omnibus retirement plans.
Class W shares are not subject to sales charges and are available only to investors purchasing through authorized investment programs managed by investment professionals, including discretionary managed account programs. Class W shares commenced operations on June 25, 2014.
Class Z shares are not subject to sales charges and are available only to eligible investors, which are subject to different investment minimums as described in the Fund's prospectus.
Note 2. Summary of Significant Accounting Policies
Basis of Preparation
The Fund is an investment company that applies the accounting and reporting guidance in the Financial Accounting Standards Board (FASB) Accounting Standards Codification Topic 946, Financial Services — Investment Companies (ASC 946). The financial statements are prepared in accordance with U.S. generally accepted accounting principles (GAAP) which requires management to make certain estimates and assumptions that affect the reported amounts of assets and liabilities, the disclosure of contingent assets and liabilities at the date of the financial statements and the reported amounts of income and expenses during the reporting period. Actual results could differ from those estimates.
The following is a summary of significant accounting policies followed by the Fund in the preparation of its financial statements.
Security Valuation
All equity securities are valued at the close of business of the New York Stock Exchange (NYSE). Equity securities are valued at the last quoted sales price on the principal exchange or market on which they trade, except for securities traded on the NASDAQ Stock Market, which are valued at the NASDAQ official close price. Unlisted securities or listed securities for which there were no sales during the day are valued at the mean of the latest quoted bid and ask prices on such exchanges or markets.
Foreign equity securities are valued based on quotations from the principal market in which such securities are traded. If any foreign security prices are not readily available as a result of limited share activity, the securities are valued at the mean of the latest quoted bid and ask prices on such exchanges or markets. Foreign currency exchange rates are generally determined at 4:00 p.m. Eastern (U.S.) time. Many securities markets and exchanges outside the U.S. close prior to the close of the NYSE; therefore, the closing prices for securities in such markets or on such exchanges may not fully reflect events that occur after
Annual Report 2015
33
COLUMBIA SMALL CAP INDEX FUND
NOTES TO FINANCIAL STATEMENTS (continued)
February 28, 2015
such close but before the close of the NYSE. In those situations, foreign securities will be fair valued pursuant to a policy adopted by the Board of Trustees (the Board), including, if available, utilizing a third party pricing service to determine these fair values. The third party pricing service takes into account multiple factors, including, but not limited to, movements in the U.S. securities markets, certain depositary receipts, futures contracts and foreign exchange rates that have occurred subsequent to the close of the foreign exchange or market, to determine a good faith estimate that reasonably reflects the current market conditions as of the close of the NYSE. The fair value of a security is likely to be different from the quoted or published price, if available.
Investments in open-end investment companies, including money market funds, are valued at their net asset value.
Futures and options on futures contracts are valued based upon the settlement price established each day by the board of trade or exchange on which they are traded.
Investments for which market quotations are not readily available, or that have quotations which management believes are not reliable, are valued at fair value as determined in good faith under procedures established by and under the general supervision of the Board. If a security or class of securities (such as foreign securities) is valued at fair value, such value is likely to be different from the quoted or published price for the security.
The determination of fair value often requires significant judgment. To determine fair value, management may use assumptions including but not limited to future cash flows and estimated risk premiums. Multiple inputs from various sources may be used to determine fair value.
Derivative Instruments
The Fund invests in certain derivative instruments, as detailed below, to meet its investment objectives. Derivatives are instruments whose values depend on, or are derived from, in whole or in part, the value of one or more other assets, such as securities, currencies, commodities or indices. Derivative instruments may be used to increase investment flexibility (including to maintain cash reserves while maintaining exposure to certain other assets), for risk management (hedging) purposes, to facilitate trading, to reduce transaction costs and to pursue higher investment returns. The Fund may also use derivative instruments to mitigate certain investment risks, such as foreign currency exchange rate risk, interest rate risk and credit risk. Derivatives may
involve various risks, including the potential inability of the counterparty to fulfill its obligation under the terms of the contract, the potential for an illiquid secondary market (making it difficult for the Fund to sell, including at favorable prices) and the potential for market movements which may expose the Fund to gains or losses in excess of the amount shown in the Statement of Assets and Liabilities. The notional amounts of derivative instruments, if applicable, are not recorded in the financial statements.
A derivative instrument may suffer a marked-to-market loss if the value of the contract decreases due to an unfavorable change in the market rates or values of the underlying instrument. Losses can also occur if the counterparty does not perform under the contract. The Fund's risk of loss from counterparty credit risk on over-the-counter derivatives is generally limited to the aggregate unrealized gain netted against any collateral held by the Fund and the amount of any variation margin held by the counterparty. With exchange-traded or centrally cleared derivatives, there is reduced counterparty credit risk to the Fund since the exchange's clearinghouse, as counterparty to such instruments, guarantees against a possible default. The clearinghouse stands between the buyer and the seller of the contract; therefore, the counterparty credit risk is failure of the clearinghouse. However, credit risk still exists in exchange-traded or centrally cleared derivatives with respect to initial and variation margin that is held in a broker's customer account. While brokers are required to segregate customer margin from their own assets, in the event that a broker becomes insolvent or goes into bankruptcy and at that time there is a shortfall in the aggregate amount of margin held by the broker for all its clients, U.S. bankruptcy laws will typically allocate that shortfall on a pro-rata basis across all the broker's customers (including the Fund), potentially resulting in losses to the Fund.
In order to better define its contractual rights and to secure rights that will help the Fund mitigate its counterparty risk, the Fund may enter into an International Swaps and Derivatives Association, Inc. Master Agreement (ISDA Master Agreement) or similar agreement with its derivative contract counterparties. An ISDA Master Agreement is an agreement between the Fund and a counterparty that governs over-the-counter derivatives and forward foreign currency exchange contracts and typically contains, among other things, collateral posting terms and netting provisions in the event of a default and/or termination event. Under an
Annual Report 2015
34
COLUMBIA SMALL CAP INDEX FUND
NOTES TO FINANCIAL STATEMENTS (continued)
February 28, 2015
ISDA Master Agreement, the Fund may, under certain circumstances, offset with the counterparty certain derivative instrument's payables and/or receivables with collateral held and/or posted and create one single net payment. The provisions of the ISDA Master Agreement typically permit a single net payment in the event of default (close-out netting) including the bankruptcy or insolvency of the counterparty. Note, however, that bankruptcy or insolvency laws of a particular jurisdiction may impose restrictions on or prohibitions against the right of offset in bankruptcy, insolvency or other events.
Collateral (margin) requirements differ by type of derivative. Margin requirements are established by the exchange or clearinghouse for exchange-traded and centrally cleared derivatives. Brokers can ask for margin in excess of the minimum in certain circumstances. Collateral terms are contract specific for over-the-counter derivatives. For over-the-counter derivatives traded under an ISDA Master Agreement, the collateral requirements are typically calculated by netting the marked-to-market amount for each transaction under such agreement and comparing that amount to the value of any variation margin currently pledged by the Fund and/or the counterparty. Generally, the amount of collateral due from or to a party has to exceed a minimum transfer amount threshold (e.g., $500,000) before a transfer has to be made. To the extent amounts due to the Fund from its counterparties are not fully collateralized, contractually or otherwise, the Fund bears the risk of loss from counterparty nonperformance. The Fund attempts to mitigate counterparty risk by only entering into agreements with counterparties that it believes have the financial resources to honor their obligations and by monitoring the financial stability of those counterparties.
Certain ISDA Master Agreements allow counterparties to over-the-counter derivatives to terminate derivative contracts prior to maturity in the event the Fund's net assets decline by a stated percentage over a specified time period or if the Fund fails to meet the terms of the ISDA Master Agreement, which would cause the Fund to accelerate payment of any net liability owed to the counterparty. The Fund also has termination rights if the counterparty fails to meet the terms of the ISDA Master Agreement. In addition to considering counterparty credit risk, the Fund would consider terminating the derivative contracts based on whether termination would result in a net liability owed from the counterparty.
For financial reporting purposes, the Fund does not offset derivative assets and derivative liabilities that are
subject to netting arrangements in the Statement of Assets and Liabilities.
Futures Contracts
Futures contracts are exchange traded and represent commitments for the future purchase or sale of an asset at a specified price on a specified date. The Fund bought and sold futures contracts to maintain appropriate equity market exposure while keeping sufficient cash to accommodate daily redemptions. These instruments may be used for other purposes in future periods. Upon entering into futures contracts, the Fund bears risks that it may not achieve the anticipated benefits of the futures contracts and may realize a loss. Additional risks include counterparty credit risk, the possibility of an illiquid market, and that a change in the value of the contract or option may not correlate with changes in the value of the underlying asset.
Upon entering into a futures contract, the Fund pledges cash or securities with the broker in an amount sufficient to meet the initial margin requirement. The initial margin deposit must be maintained at an established level over the life of the contract. Cash deposited as initial margin is recorded in the Statement of Assets and Liabilities as margin deposits. Securities deposited as initial margin are designated in the Portfolio of Investments. Subsequent payments (variation margin) are made or received by the Fund each day. The variation margin payments are equal to the daily change in the contract value and are recorded as variation margin receivable or payable and are offset in unrealized gains or losses. The Fund recognizes a realized gain or loss when the contract is closed or expires. Futures contracts involve, to varying degrees, risk of loss in excess of the variation margin disclosed in the Statement of Assets and Liabilities.
Effects of Derivative Transactions in the Financial Statements
The following tables are intended to provide additional information about the effect of derivatives on the financial statements of the Fund, including: the fair value of derivatives by risk category and the location of those fair values in the Statement of Assets and Liabilities; and the impact of derivative transactions over the period in the Statement of Operations, including realized gains or losses and unrealized gains or losses. The derivative schedules following the Portfolio of Investments present additional information regarding derivative instruments outstanding at the end of the period, if any.
Annual Report 2015
35
COLUMBIA SMALL CAP INDEX FUND
NOTES TO FINANCIAL STATEMENTS (continued)
February 28, 2015
The following table is a summary of the fair value of derivative instruments (not considered to be hedging instruments for accounting disclosure purposes) at February 28, 2015:
Asset Derivatives | |
Risk Exposure
Category | | Statement of Assets
and Liabilities Location | | Fair Value ($) | |
Equity risk
| | Net assets — unrealized
appreciation on futures
contracts | | | 5,550,688
| * | |
*Includes cumulative appreciation (depreciation) as reported in the tables following the Portfolio of Investments. Only the current day's variation margin is reported in receivables or payables in the Statement of Assets and Liabilities.
The following table indicates the effect of derivative instruments (not considered to be hedging instruments for accounting disclosure purposes) in the Statement of Operations for the year ended February 28, 2015:
Amount of Realized Gain (Loss) on Derivatives Recognized in Income | |
Risk Exposure Category | | Futures Contracts ($) | |
Equity risk | | | 1,986,908 | | |
Change in Unrealized Appreciation (Depreciation) on Derivatives Recognized in Income | |
Risk Exposure Category | | Futures Contracts ($) | |
Equity risk | | | 693,672 | | |
The following table is a summary of the average outstanding volume by derivative instrument for the year ended February 28, 2015:
Derivative Instrument | | Average notional amounts($)* | |
Futures contracts — Long | | | 69,596,435 | | |
*Based on the ending quarterly outstanding amounts for the year ended February 28, 2015.
Security Transactions
Security transactions are accounted for on the trade date. Cost is determined and gains (losses) are based upon the specific identification method for both financial statement and federal income tax purposes.
Income Recognition
Corporate actions and dividend income are generally recorded net of any non-reclaimable tax withholdings, on the ex-dividend date or upon receipt of ex-dividend notification in the case of certain foreign securities.
The Fund may receive distributions from holdings in business development companies (BDCs), exchange-traded funds (ETFs), other regulated investment companies (RICs), and real estate investment trusts
(REITs), which report information on the character of their distributions annually. These distributions are allocated to dividend income, capital gain and return of capital based on actual information reported. To the extent actual information has not yet been reported by the REITs, estimates for return of capital are made by the Fund's management. Return of capital is recorded as a reduction of the cost basis of securities held. If the Fund no longer owns the applicable securities, return of capital is recorded as a realized gain. Management's estimates are subsequently adjusted when the actual character of the distributions is disclosed by the REITs, which could result in a proportionate change in return of capital to shareholders. No estimates are made for the BDCs, ETFs, and RICs.
Awards from class action litigation are recorded as a reduction of cost basis if the Fund still owns the applicable securities on the payment date. If the Fund no longer owns the applicable securities, the proceeds are recorded as realized gains.
Expenses
General expenses of the Trust are allocated to the Fund and other funds of the Trust based upon relative net assets or other expense allocation methodologies determined by the nature of the expense. Expenses directly attributable to the Fund are charged to the Fund. Expenses directly attributable to a specific class of shares are charged to that share class.
Determination of Class Net Asset Value
All income, expenses (other than class-specific expenses, which are charged to that share class, as shown in the Statement of Operations) and realized and unrealized gains (losses) are allocated to each class of the Fund on a daily basis, based on the relative net assets of each class, for purposes of determining the net asset value of each class.
Federal Income Tax Status
The Fund intends to qualify each year as a regulated investment company under Subchapter M of the Internal Revenue Code, as amended, and will distribute substantially all of its taxable income (including net short-term capital gains), if any, for its tax year, and as such will not be subject to federal income taxes. In addition, the Fund intends to distribute in each calendar year substantially all of its net investment income, capital gains and certain other amounts, if any, such that the Fund should not be subject to federal excise tax.
Annual Report 2015
36
COLUMBIA SMALL CAP INDEX FUND
NOTES TO FINANCIAL STATEMENTS (continued)
February 28, 2015
Therefore, no federal income or excise tax provision is recorded.
Foreign Taxes
The Fund may be subject to foreign taxes on income, gains on investments or currency repatriation, a portion of which may be recoverable. The Fund will accrue such taxes and recoveries, as applicable, based upon its current interpretation of tax rules and regulations that exist in the markets in which it invests.
Realized gains in certain countries may be subject to foreign taxes at the Fund level, based on statutory rates. The Fund accrues for such foreign taxes on realized and unrealized gains at the appropriate rate for each jurisdiction, as applicable. The amount, if any, is disclosed as a liability on the Statement of Assets and Liabilities.
Distributions to Shareholders
Distributions from net investment income, if any, are declared and paid semi-annually. Net realized capital gains, if any, are distributed at least annually. Income distributions and capital gain distributions are determined in accordance with federal income tax regulations, which may differ from GAAP.
Guarantees and Indemnifications
Under the Trust's organizational documents and, in some cases, by contract, its officers and trustees are indemnified against certain liabilities arising out of the performance of their duties to the Trust or its funds. In addition, certain of the Fund's contracts with its service providers contain general indemnification clauses. The Fund's maximum exposure under these arrangements is unknown since the amount of any future claims that may be made against the Fund cannot be determined, and the Fund has no historical basis for predicting the likelihood of any such claims.
Note 3. Fees and Compensation Paid to Affiliates
Investment Management Fees
Under an Investment Management Services Agreement, Columbia Management Investment Advisers, LLC (the Investment Manager), a wholly-owned subsidiary of Ameriprise Financial, Inc. (Ameriprise Financial), determines which securities will be purchased, held or sold. The investment management fee is an annual fee that is equal to 0.10% of the Fund's average daily net assets.
Administration Fees
Under an Administrative Services Agreement, the Investment Manager also serves as the Fund Administrator. The Fund pays the Fund Administrator an annual fee for administration and accounting services equal to 0.10% of the Fund's average daily net assets.
The Investment Manager, from the administration fee it receives from the Fund, pays all operating expenses of the Fund, with the exception of brokerage fees and commissions, interest, taxes, fees and expenses of Trustees who are not officers, directors or employees of the Investment Manager or its affiliates, distribution and/or shareholder servicing and plan administration fees and any extraordinary non-recurring expenses that may arise, including litigation expenses.
Other Expenses
Other expenses are for, among other things, miscellaneous expenses of the Fund or the Board, including payments to a company providing limited administrative services to the Fund and the Board. That company's expenses include boardroom and office expense, employee compensation, employee health and retirement benefits, and certain other expenses. For the year ended February 28, 2015, other expenses paid by the Fund to this company were $5,444.
Compensation of Board Members
Board members are compensated for their services to the Fund as disclosed in the Statement of Operations. Under a Deferred Compensation Plan (the Plan), the Board members who are not "interested persons" of the Fund, as defined under the 1940 Act, may elect to defer payment of up to 100% of their compensation. Deferred amounts are treated as though equivalent dollar amounts had been invested in shares of certain funds managed by the Investment Manager. The Fund's liability for these amounts is adjusted for market value changes and remains in the Fund until distributed in accordance with the Plan.
Transfer Agent Fees
Under a Transfer and Dividend Disbursing Agent Agreement, Columbia Management Investment Services Corp. (the Transfer Agent), an affiliate of the Investment Manager and a wholly-owned subsidiary of Ameriprise Financial, is responsible for providing transfer agency services to the Fund. The Transfer Agent has contracted with Boston Financial Data Services (BFDS) to serve as sub-transfer agent.
Annual Report 2015
37
COLUMBIA SMALL CAP INDEX FUND
NOTES TO FINANCIAL STATEMENTS (continued)
February 28, 2015
The transfer agent fees are payable by the Investment Manager. The Transfer Agent pays the fees of BFDS for services as sub-transfer agent and is not entitled to reimbursement for such fees from the Fund. The Transfer Agent also receives compensation from the Investment Manager for various shareholder services and reimbursements for certain out-of-pocket expenses.
An annual minimum account balance fee of $20 may apply to certain accounts with a value below the applicable share class's initial minimum investment requirements to reduce the impact of small accounts on transfer agent fees. These minimum account balance fees are remitted to the Fund and recorded as part of expense reductions in the Statement of Operations. For the year ended February 28, 2015, these minimum account balance fees reduced total expenses of the Fund by $2,828.
Plan Administration Fees
Under a Plan Administration Services Agreement with the Transfer Agent, the Fund pays an annual fee at a rate of 0.25% of the Fund's average daily net assets attributable to Class K shares for the provision of various administrative, recordkeeping, communication and educational services.
Distribution and Service Fees
The Fund has an agreement with Columbia Management Investment Distributors, Inc. (the Distributor), an affiliate of the Investment Manager and a wholly-owned subsidiary of Ameriprise Financial, for distribution and shareholder services. The Board has approved, and the Fund has adopted, distribution and shareholder service plans (the Plans) applicable to certain share classes, which set the distribution and service fees for the Fund. These fees are calculated daily and are intended to compensate the Distributor and/or eligible selling and/or servicing agents for selling shares of the Fund and providing services to investors.
Under the Plans, the Fund pays a monthly combined distribution and service fee to the Distributor at the maximum annual rate of 0.25% of the average daily net assets attributable to Class A shares of the Fund. Also under the Plans, the Fund pays a monthly service fee at the maximum annual rate of 0.25% of the average daily net assets attributable to Class B and Class W shares of the Fund and the payment of a monthly distribution fee at the maximum annual rates of 0.75% and 0.25% of the average daily net assets attributable to Class B and Class W shares, respectively.
Although the Fund may pay a distribution fee up to 0.25% of the Fund's average daily net assets attributable to Class W shares and a service fee of up to 0.25% of the Fund's average daily net assets attributable to Class W shares, the aggregate fee shall not exceed 0.25% of the Fund's average daily net assets attributable to Class W shares.
Sales Charges
Sales charges, including CDSCs, received by the Distributor for distributing Fund shares were $990 for Class B shares for the year ended February 28, 2015.
Expenses Waived/Reimbursed by the Investment Manager and its Affiliates
The Investment Manager and certain of its affiliates have contractually agreed to waive fees and/or reimburse expenses (excluding certain fees and expenses described below) for the period disclosed below, unless sooner terminated at the sole discretion of the Board, so that the Fund's net operating expenses, after giving effect to fees waived/expenses reimbursed and any balance credits and/or overdraft charges from the Fund's custodian, do not exceed the following annual rates as a percentage of the class' average daily net assets:
| | | Fee Rates Contractual
through
June 30, 2015 | |
Class A | | | 0.45 | % | |
Class B | | | 1.20 | | |
Class I | | | 0.20 | | |
Class K | | | 0.45 | | |
Class R5 | | | 0.20 | | |
Class W | | | 0.45 | * | |
Class Z | | | 0.20 | | |
*Fee rate is contractual from June 25, 2014 (the commencement of operations of Class W shares) through June 30, 2015.
Under the agreement governing these fee waivers and/or expense reimbursement arrangements, the following fees and expenses are excluded from the waiver/reimbursement commitment, and therefore will be paid by the Fund, if applicable: taxes (including foreign transaction taxes), expenses associated with investments in affiliated and non-affiliated pooled investment vehicles (including mutual funds and exchange-traded funds), transaction costs and brokerage commissions, costs related to any securities lending program, dividend expenses associated with securities sold short, inverse floater program fees and expenses, transaction charges and interest on borrowed money,
Annual Report 2015
38
COLUMBIA SMALL CAP INDEX FUND
NOTES TO FINANCIAL STATEMENTS (continued)
February 28, 2015
interest, extraordinary expenses and any other expenses the exclusion of which is specifically approved by the Board. This agreement may be modified or amended only with approval from all parties. Any fees waived and/or expenses reimbursed under the expense reimbursement arrangements described above are not recoverable by the Investment Manager or its affiliates in future periods.
Note 4. Federal Tax Information
The timing and character of income and capital gain distributions are determined in accordance with income tax regulations, which may differ from GAAP because of temporary or permanent book to tax differences.
At February 28, 2015, these differences are primarily due to differing treatment for deferral/reversal of wash sale losses, Trustees' deferred compensation, re-characterization of distributions for investments and derivative investments. To the extent these differences are permanent, reclassifications are made among the components of the Fund's net assets in the Statement of Assets and Liabilities. Temporary differences do not require reclassifications. In the Statement of Assets and Liabilities the following reclassifications were made:
Undistributed net investment income | | $ | (1,009,180 | ) | |
Accumulated net realized gain | | | 1,009,180 | | |
Net investment income (loss) and net realized gains (losses), as disclosed in the Statement of Operations, and net assets were not affected by this reclassification.
The tax character of distributions paid during the years indicated was as follows:
Year Ended February 28, | | 2015 | | 2014 | |
Ordinary income | | $ | 37,872,925 | | | $ | 35,592,677 | | |
Long-term capital gains | | | 205,231,775 | | | | 119,359,612 | | |
Total | | $ | 243,104,700 | | | $ | 154,952,289 | | |
Short-term capital gain distributions, if any, are considered ordinary income distributions for tax purposes.
At February 28, 2015, the components of distributable earnings on a tax basis were as follows:
Undistributed ordinary income | | $ | 18,338,614 | | |
Undistributed long-term capital gains | | | 64,154,537 | | |
Net unrealized appreciation | | | 1,019,851,837 | | |
At February 28, 2015, the cost of investments for federal income tax purposes was $2,177,461,413 and the
aggregate gross unrealized appreciation and depreciation based on that cost was:
Unrealized appreciation | | $ | 1,122,413,229 | | |
Unrealized depreciation | | | (102,561,392 | ) | |
Net unrealized appreciation | | | 1,019,851,837 | | |
Management of the Fund has concluded that there are no significant uncertain tax positions in the Fund that would require recognition in the financial statements. However, management's conclusion may be subject to review and adjustment at a later date based on factors including, but not limited to, new tax laws, regulations, and administrative interpretations (including relevant court decisions). Generally, the Fund's federal tax returns for the prior three fiscal years remain subject to examination by the Internal Revenue Service.
Note 5. Portfolio Information
The cost of purchases and proceeds from sales of securities, excluding short-term investments and derivatives, if any, aggregated to $685,287,400 and $500,962,363, respectively, for the year ended February 28, 2015. The amount of purchase and sale activity impacts the portfolio turnover rate reported in the Financial Highlights.
Note 6. Affiliated Money Market Fund
The Fund invests in Columbia Short-Term Cash Fund, an affiliated money market fund established for the exclusive use by the Fund and other affiliated funds. The income earned by the Fund from such investments is included as Dividends — affiliated issuers in the Statement of Operations. As an investing fund, the Fund indirectly bears its proportionate share of the expenses of Columbia Short-Term Cash Fund.
Note 7. Shareholder Concentration
At February 28, 2015, two unaffiliated shareholders of record owned 31.7% of the outstanding shares of the Fund in one or more accounts. The Fund has no knowledge about whether any portion of those shares was owned beneficially. Affiliated shareholders of record owned 15.3% of the outstanding shares of the Fund in one or more accounts. Subscription and redemption activity by concentrated accounts may have a significant effect on the operations of the Fund.
Note 8. Line of Credit
The Fund has entered into a revolving credit facility with a syndicate of banks led by JPMorgan Chase Bank, N.A. (JPMorgan) whereby the Fund may borrow for the temporary funding of shareholder redemptions or for
Annual Report 2015
39
COLUMBIA SMALL CAP INDEX FUND
NOTES TO FINANCIAL STATEMENTS (continued)
February 28, 2015
other temporary or emergency purposes. Pursuant to a December 9, 2014 amendment, the credit facility agreement, which is a collective agreement between the Fund and certain other funds managed by the Investment Manager, severally and not jointly, permits collective borrowings up to $550 million. Interest is charged to each participating fund based on its borrowings at a rate equal to the higher of (i) the overnight federal funds rate plus 1.00% or (ii) the one-month LIBOR rate plus 1.00%. Each borrowing under the credit facility matures no later than 60 days after the date of borrowing. The Fund also pays a commitment fee equal to its pro rata share of the amount of the credit facility at a rate of 0.075% per annum. The commitment fee is included in other expenses in the Statement of Operations. Prior to the December 9, 2014 amendment, the credit facility agreement permitted borrowings up to $500 million under the same terms and interest rates as described above.
The Fund had no borrowings during the year ended February 28, 2015.
Note 9. Significant Risks
Financial Sector Risk
Sector risk occurs when a fund invests a significant portion of its assets in securities of companies conducting business in a related group of industries within an economic sector. Companies in the same economic sector may be similarly affected by economic, regulatory, political or market events or conditions, making a fund more vulnerable to unfavorable developments in that economic sector than funds that invest more broadly. The Fund may be more susceptible to the particular risks that may affect companies in the financial sector than if it were invested in a wider variety of companies in unrelated sectors.
Note 10. Subsequent Events
Management has evaluated the events and transactions that have occurred through the date the financial statements were issued and noted no items requiring adjustment of the financial statements or additional disclosure.
Note 11. Information Regarding Pending and Settled Legal Proceedings
In December 2005, without admitting or denying the allegations, American Express Financial Corporation (AEFC, which is now known as Ameriprise Financial, Inc. (Ameriprise Financial)) entered into settlement agreements with the Securities and Exchange
Commission (SEC) and Minnesota Department of Commerce (MDOC) related to market timing activities. As a result, AEFC was censured and ordered to cease and desist from committing or causing any violations of certain provisions of the Investment Advisers Act of 1940, the Investment Company Act of 1940, and various Minnesota laws. AEFC agreed to pay disgorgement of $10 million and civil money penalties of $7 million. AEFC also agreed to retain an independent distribution consultant to assist in developing a plan for distribution of all disgorgement and civil penalties ordered by the SEC in accordance with various undertakings detailed at www.sec.gov/litigation/admin/ia-2451.pdf. Ameriprise Financial and its affiliates have cooperated with the SEC and the MDOC in these legal proceedings, and have made regular reports to the Funds' Boards of Trustees.
Ameriprise Financial and certain of its affiliates have historically been involved in a number of legal, arbitration and regulatory proceedings, including routine litigation, class actions, and governmental actions, concerning matters arising in connection with the conduct of their business activities. Ameriprise Financial believes that the Funds are not currently the subject of, and that neither Ameriprise Financial nor any of its affiliates are the subject of, any pending legal, arbitration or regulatory proceedings that are likely to have a material adverse effect on the Funds or the ability of Ameriprise Financial or its affiliates to perform under their contracts with the Funds. Ameriprise Financial is required to make quarterly (10-Q), annual (10-K) and, as necessary, 8-K filings with the Securities and Exchange Commission on legal and regulatory matters that relate to Ameriprise Financial and its affiliates. Copies of these filings may be obtained by accessing the SEC website at www.sec.gov.
There can be no assurance that these matters, or the adverse publicity associated with them, will not result in increased fund redemptions, reduced sale of fund shares or other adverse consequences to the Funds. Further, although we believe proceedings are not likely to have a material adverse effect on the Funds or the ability of Ameriprise Financial or its affiliates to perform under their contracts with the Funds, these proceedings are subject to uncertainties and, as such, we are unable to estimate the possible loss or range of loss that may result. An adverse outcome in one or more of these proceedings could result in adverse judgments, settlements, fines, penalties or other relief that could have a material adverse effect on the consolidated financial condition or results of operations of Ameriprise Financial.
Annual Report 2015
40
COLUMBIA SMALL CAP INDEX FUND
REPORT OF INDEPENDENT REGISTERED PUBLIC ACCOUNTING FIRM
To the Trustees of Columbia Funds Series Trust and the Shareholders of
Columbia Small Cap Index Fund
In our opinion, the accompanying statement of assets and liabilities, including the portfolio of investments, and the related statements of operations and of changes in net assets and the financial highlights present fairly, in all material respects, the financial position of Columbia Small Cap Index Fund (the "Fund", a series of Columbia Funds Series Trust) at February 28, 2015, and the results of its operations, the changes in its net assets and the financial highlights for each of the periods indicated, in conformity with accounting principles generally accepted in the United States of America. These financial statements and financial highlights (hereafter referred to as "financial statements") are the responsibility of the Fund's management; our responsibility is to express an opinion on these financial statements based on our audits. We conducted our audits of these financial statements in accordance with the standards of the Public Company Accounting Oversight Board (United States). Those standards require that we plan and perform the audit to obtain reasonable assurance about whether the financial statements are free of material misstatement. An audit includes examining, on a test basis, evidence supporting the amounts and disclosures in the financial statements, assessing the accounting principles used and significant estimates made by management, and evaluating the overall financial statement presentation. We believe that our audits, which included confirmation of securities at February 28, 2015 by correspondence with the custodian, brokers and transfer agent, provide a reasonable basis for our opinion.
PricewaterhouseCoopers LLP
Minneapolis, Minnesota
April 21, 2015
Annual Report 2015
41
COLUMBIA SMALL CAP INDEX FUND
FEDERAL INCOME TAX INFORMATION
(Unaudited)
The Fund hereby designates the following tax attributes for the fiscal year ended February 28, 2015. Shareholders will be notified in early 2016 of the amounts for use in preparing 2015 income tax returns.
Tax Designations:
| Qualified Dividend Income | | | 61.02 | % | |
| Dividends Received Deduction | | | 60.97 | % | |
Capital Gain Dividend | | $ | 204,568,893 | | |
Qualified Dividend Income. For taxable, non-corporate shareholders, the percentage of ordinary income distributed during the fiscal year that represents qualified dividend income subject to reduced tax rates.
Dividends Received Deduction. The percentage of ordinary income distributed during the fiscal year that qualifies for the corporate dividends received deduction.
Capital Gain Dividend. The Fund designates as a capital gain dividend the amount reflected above, or if subsequently determined to be different, the net capital gain of such fiscal period.
Annual Report 2015
42
COLUMBIA SMALL CAP INDEX FUND
Shareholders elect the Board that oversees the Funds' operations. The Board appoints officers who are responsible for day-to-day business decisions based on policies set by the Board. The following table provides basic biographical information about the Funds' Board members, including their principal occupations during the past five years, although specific titles for individuals may have varied over the period. Under current Board policy, members may serve through the end of the calendar year in which he or she reaches either the mandatory retirement age established by the Board or the fifteenth anniversary of the first Board meeting they attended as a member of the Board.
Independent Trustees
Name,
Address,
Year of Birth | | Position Held With
Funds and Length of
Service | | Principal Occupation(s)
During Past Five Years
and Other Relevant
Professional Experience | | Number of
Funds in the
Fund Family
Overseen by
Board Member | | Other Present or Past
Directorships/
Trusteeships
(Within Past 5 Years) | |
Kathleen Blatz
901 S. Marquette Ave.
Minneapolis, MN 55402
1954 | | Board member since 1/06 for RiverSource Funds and since 6/11 for Nations Funds | | Attorney; specializing in arbitration and mediation; Chief Justice, Minnesota Supreme Court, 1998-2006; Associate Justice, Minnesota Supreme Court, 1996-1998; Fourth Judicial District Court Judge, Hennepin Country, 1994-1996; Attorney in private practice and public service, 1984-1993; State Representative, Minnesota House of Representatives, 1979-1993, which included service on the Tax and Financial Institutions and Insurance Committees | | | 127 | | | Trustee, BlueCross BlueShield of Minnesota (Chair of the Business Development Committee) since 2009; Chair of the Robina Foundation since August 2013 | |
Edward J. Boudreau, Jr.
901 S. Marquette Ave.
Minneapolis, MN 55402
1944 | | Board member since 6/11 for RiverSource Funds and since 1/05 for Nations Funds | | Managing Director, E.J. Boudreau & Associates (consulting) since 2000; FINRA Industry Arbitrator, 2002-present; Chairman and Chief Executive Officer, John Hancock Funds (asset management), Chairman and Interested Trustee for open-end and closed-end funds offered by John Hancock, 1989-2000; John Hancock Life Insurance Company, including SVP and Treasurer and SVP Information Technology, 1968-1988 | | | 125 | | | Former Trustee, BofA Funds Series Trust (11 funds), 2005-2011; Trustee, Boston Museum of Science (Chair of Finance Committee), 1985-2013 | |
Pamela G. Carlton
901 S. Marquette Ave.
Minneapolis, MN 55402
1954 | | Board member since 7/07 for RiverSource Funds and since 6/11 for Nations Funds | | President, Springboard — Partners in Cross Cultural Leadership (consulting company) since 2003; Managing Director of US Equity Research, JP Morgan Chase, 1999-2003; Director of US Equity Research, Chase Asset Management, 1996- 1999; Co-Director Latin America Research, 1993-1996, COO Global Research, 1992-1996, Co-Director of US Research, 1991-1992, Investment Banker, Morgan Stanley, 1982-1991 | | | 127 | | | None | |
Annual Report 2015
43
COLUMBIA SMALL CAP INDEX FUND
TRUSTEES AND OFFICERS (continued)
Independent Trustees (continued)
Name,
Address,
Year of Birth | | Position Held With
Funds and Length of
Service | | Principal Occupation(s)
During Past Five Years
and Other Relevant
Professional Experience | | Number of
Funds in the
Fund Family
Overseen by
Board Member | | Other Present or Past
Directorships/
Trusteeships
(Within Past 5 Years) | |
William P. Carmichael
901 S. Marquette Ave.
Minneapolis, MN 55402
1943 | | Chair of the Board since 1/14, Board member since 6/11 for RiverSource Funds and since 2003 for Nations Funds | | Retired; Co-founder, The Succession Fund (provides exit strategies to owners of privately held companies) 1998-2007; Adjunct Professor of Finances, Kelley School of Business, Indiana University, 1993-2007; Senior Vice President, Sara Lee Corporation, 1991-1993; Senior Vice President and Chief Financial Officer, Beatrice Foods Company, 1984-1990; Vice President, Esmark, Inc, 1973-1984.; Associate, Price Waterhouse, 1968-1972 | | | 127 | | | Director, Cobra Electronics Corporation (electronic equipment manufacturer), 1994-August 2014; The Finish Line (athletic shoes and apparel) since July 2003; Director, International Textile Corp. since 2012; former Director, McMoRan Exploration Company (oil and gas exploration and development) 2010-2013; former Trustee, BofA Funds Series Trust (11 funds) 2009-2011; Director, Spectrum Brands, Inc. (consumer products), 2002-2009; Director, Simmons Company (bedding), 2004-2010 | |
Patricia M. Flynn
901 S. Marquette Ave.
Minneapolis, MN 55402
1950 | | Board member since 11/04 for RiverSource Funds and since 6/11 for Nations Funds | | Trustee Professor of Economics and Management, Bentley University since 1976 (also teaches and conducts research on corporate governance); Dean, McCallum Graduate School of Business, Bentley University, 1992-2002 | | | 127 | | | Trustee, MA Taxpayers Foundation since 1997; Board of Governors, Innovation Institute, MA Technology Collaborative since 2010 | |
William A. Hawkins
901 S. Marquette Ave.
Minneapolis, MN 55402
1942 | | Board member since 6/11 for RiverSource Funds and since 1/05 for Nations Funds | | Managing Director, Overton Partners (financial consulting), since August 2010; President and Chief Executive Officer, California General Bank, N.A., January 2008-August 2010; Operation Hope, COO, 2004-2007; IndyMac Bancorp, President, CBG, 1999-2003; American General Bank, President, 1997-1999; Griffin Financial Services, CEO, 1981-1997; The Griffin Funds, CEO, 1992-1998 | | | 125 | | | Trustee, BofA Funds Series Trust (11 funds) | |
R. Glenn Hilliard
901 S. Marquette Ave.
Minneapolis, MN 55402
1943 | | Board member since 6/11 for RiverSource Funds and since 1/05 for Nations Funds | | Chairman and Chief Executive Officer, Hilliard Group LLC (investing and consulting) since April 2003; Non-Executive Director & Chairman, CNO Financial Group, Inc. (insurance), September 2003-May 2011 | | | 125 | | | Chairman, BofA Funds Series Trust (11 funds); former Director, CNO Financial Group, Inc. (insurance) 2003-2011 | |
Annual Report 2015
44
COLUMBIA SMALL CAP INDEX FUND
TRUSTEES AND OFFICERS (continued)
Independent Trustees (continued)
Name,
Address,
Year of Birth | | Position Held With
Funds and Length of
Service | | Principal Occupation(s)
During Past Five Years
and Other Relevant
Professional Experience | | Number of
Funds in the
Fund Family
Overseen by
Board Member | | Other Present or Past
Directorships/
Trusteeships
(Within Past 5 Years) | |
Catherine James Paglia
901 S. Marquette Ave.
Minneapolis, MN 55402
1952 | | Board member since 11/04 for RiverSource Funds and since 6/11 for Nations Funds | | Director, Enterprise Asset Management, Inc. (private real estate and asset management company) since September 1998; Managing Director and Partner, Interlaken Capital, Inc., 1989-1997; Managing Director, Morgan Stanley, 1982-1989; Vice President, Investment Banking, 1980-1982, Associate, Investment Banking, 1976-1980, Dean Witter Reynolds, Inc. | | | 127 | | | Director, Valmont Industries, Inc. (irrigation systems manufacturer) since 2012; Trustee, Carleton College (on the Investment Committee); Trustee, Carnegie Endowment for International Peace (on the Investment Committee) | |
Leroy C. Richie
901 S. Marquette Ave.
Minneapolis, MN 55402
1941 | | Board member since 2000 for Seligman Funds, since 11/08 for RiverSource Funds and since 6/11 for Nations Funds | | Counsel, Lewis & Munday, P.C. (law firm) since 2004; Vice President and General Counsel, Automotive Legal Affairs, Chrysler Corporation, 1993-1997 | | | 127 | | | Lead Outside Director, Digital Ally, Inc. (digital imaging) since September 2005; Director, Infinity, Inc. (oil and gas exploration and production) since 1994; Director, OGE Energy Corp. (energy and energy services) since November 2007-2014 | |
Minor M. Shaw
901 S. Marquette Ave.
Minneapolis, MN 55402
1947 | | Board member since 6/11 for RiverSource Funds and since 2003 for Nations Funds | | President, Micco LLC (private investments) since 2011; President, Micco Corp. (family investment business) 1998-2011 | | | 125 | | | Director, Piedmont Natural Gas; Director, BlueCross BlueShield of South Carolina since April 2008; Chair of the Duke Endowment; Director, National Association of Corporate Directors, Carolinas Chapter, since 2013; Chair of Greenville-Spartanburg Airport Commission; former Trustee, BofA Funds Series Trust (11 funds), 2003-2011 | |
Alison Taunton-Rigby
901 S. Marquette Ave.
Minneapolis, MN 55402
1944 | | Board member since 11/02 for RiverSource Funds and since 6/11 for Nations Funds | | Managing Director, Forester Biotech (consulting) since 2001; Chief Executive Officer and Director, RiboNovix, Inc., (biotechnology) 2003-2010; President and Chief Executive Officer of CMT Inc., 2001-2003; Aquila Biopharmaceuticals Inc., 1996-2000; Cambridge Biotech Corporation, 1995-1996, Mitotix Inc., 1993-1994 | | | 127 | | | Director, Healthways, Inc. (health and well-being solutions) since 2005; Director, ICI Mutual Insurance Company, RRG since 2011; Director, Abt Associates (government contractor) since 2001; Director, Boston Children's Hospital since 2002 | |
Annual Report 2015
45
COLUMBIA SMALL CAP INDEX FUND
TRUSTEES AND OFFICERS (continued)
Interested Trustee Not Affiliated with Investment Manager*
Name,
Address,
Year of Birth | | Position Held With
Funds and Length of
Service | | Principal Occupation
During Past Five Years | | Number of
Funds in the
Fund Family
Overseen by
Board Member | | Other Present or Past
Directorships/
Trusteeships
(Within Past 5 Years) | |
Anthony M. Santomero
901 S. Marquette Ave.
Minneapolis, MN 55402
1946 | | Board member since 6/11 for RiverSource Funds and since 1/08 for Nations Funds | | Richard K. Mellon Professor Emeritus of Finance, The Wharton School, University of Pennsylvania, since 2002; Senior Advisor, McKinsey & Company (consulting), 2006-2008; President, Federal Reserve Bank of Philadelphia, 2000-2006, Professor of Finance, The Wharton School, University of Pennsylvania, 1972-2002 | | | 125 | | | Director, Renaissance Reinsurance Ltd. since May 2008; Trustee, Penn Mutual Life Insurance Company since March 2008; Director, Citigroup Inc. since 2009; Director, Citibank, N.A. since 2009; former Trustee, BofA Funds Series Trust (11 funds), 2008-2011 | |
* Dr. Santomero is not an affiliated person of the Investment Manager or Ameriprise Financial. However, he is currently deemed by the Funds to be an "interested person" (as defined in the 1940 Act) of the Funds because he serves as a Director of Citigroup Inc. and Citibank, N.A., companies that may directly or through subsidiaries and affiliates engage from time-to-time in brokerage execution, principal transactions and lending relationships with the Funds or accounts advised/managed by the Investment Manager.
Annual Report 2015
46
COLUMBIA SMALL CAP INDEX FUND
TRUSTEES AND OFFICERS (continued)
Interested Trustee Affiliated with Investment Manager*
Name,
Address,
Year of Birth | | Position Held With
Funds and Length of
Service | | Principal Occupation
During Past Five Years | | Number of
Funds in the
Fund Family
Overseen by
Board Member | | Other Present or Past
Directorships/
Trusteeships
(Within Past 5 Years) | |
William F. Truscott
53600 Ameriprise
Financial Center
Minneapolis, MN 55474
1960 | | Board member since 11/01 for RiverSource Funds and since 6/11 for Nations Funds; Senior Vice President since 2002 for RiverSource Funds and since 5/10 for Nations Funds | | Chairman of the Board and President, Columbia Management Investment Advisers, LLC since May 2010 and February 2012, respectively (previously President and Chief Investment Officer, 2001-April 2010); Chief Executive Officer, Global Asset Management, Ameriprise Financial, Inc. since September 2012 (previously Chief Executive Officer, U.S. Asset Management & President, Annuities, May 2010-September 2012 and President — U.S. Asset Management and Chief Investment Officer, 2005-April 2010); Director and Chief Executive Officer, Columbia Management Investment Distributors, Inc. since May 2010 and February 2012, respectively (previously Chairman of the Board and Chief Executive Officer, 2006-April 2010); Chairman of the Board and Chief Executive Officer, RiverSource Distributors, Inc. since 2006; Director, Threadneedle Asset Management Holdings, SARL since 2014; President and Chief Executive Officer, Ameriprise Certificate Company, 2006-August 2012 | | | 186 | | | Former Director, Ameriprise Certificate Company, 2006-January 2013 | |
* Interested person (as defined under the 1940 Act) by reason of being an officer, director, security holder and/or employee of the Investment Manager or Ameriprise Financial.
The Statement of Additional Information has additional information about the Fund's Board members and is available, without charge, upon request by calling 800.345.6611; contacting your financial intermediary or visiting columbiathreadneedle.com/us.
Annual Report 2015
47
COLUMBIA SMALL CAP INDEX FUND
TRUSTEES AND OFFICERS (continued)
The Board has appointed officers who are responsible for day-to-day business decisions based on policies it has established. The officers serve at the pleasure of the Board. In addition to Mr. Truscott, who is Senior Vice President, the Funds' other officers are:
Fund Officers
Name,
Address and
Year of Birth | | Position and Year
First Appointed to
Position for any Fund
in the Columbia
Funds Complex or a
Predecessor Thereof | | Principal Occupation(s) During Past Five Years | |
Christopher O. Petersen
5228 Ameriprise
Financial Center
Minneapolis, MN 55474
Born 1970 | | President and Principal Executive Officer (2015) | | Vice President and Lead Chief Counsel, Ameriprise Financial, Inc. since January 2015 (previously, Vice President and Chief Counsel January 2010-December 2014; and Vice President and Group Counsel or Counsel 2004-January 2010); officer of Columbia Funds and affiliated funds since 2007. | |
Michael G. Clarke
225 Franklin Street
Boston, MA 02110
Born 1969 | | Treasurer (2011) and Chief Financial Officer (2009) | | Vice President — Mutual Fund Administration, Columbia Management Investment Advisers, LLC, since May 2010; Managing Director of Fund Administration, Columbia Management Advisors, LLC, September 2004-April 2010; senior officer of Columbia Funds and affiliated funds since 2002. | |
Paul B. Goucher
100 Park Avenue
New York, NY 10017
Born 1968 | | Senior Vice President (2011), Chief Legal Officer (2015) and Assistant Secretary (2008) | | Vice President and Lead Chief Counsel, Ameriprise Financial, Inc. since November 2008 and January 2013, respectively (previously Chief Counsel, January 2010-January 2013 and Group Counsel, November 2008-January 2010). | |
Thomas P. McGuire
225 Franklin Street
Boston, MA 02110
Born 1972 | | Vice President and Chief Compliance Officer (2012) | | Vice President — Asset Management Compliance, Ameriprise Financial, Inc., since May 2010; Chief Compliance Officer, Ameriprise Certificate Company since September 2010; Compliance Executive, Bank of America, 2005-April 2010. | |
Colin Moore
225 Franklin Street
Boston, MA 02110
Born 1958 | | Senior Vice President (2010) | | Executive Vice President and Global Chief Investment Officer, Ameriprise Financial, Inc., since July 2013; Director and Global Chief Investment Officer, Columbia Management Investment Advisers, LLC since May 2010; Manager, Managing Director and Chief Investment Officer, Columbia Management Advisors, LLC, 2007-April 2010. | |
Michael E. DeFao
225 Franklin Street
Boston, MA 02110
Born 1968 | | Vice President (2011) and Assistant Secretary (2010) | | Vice President and Chief Counsel, Ameriprise Financial, Inc. since May 2010; Associate General Counsel, Bank of America, 2005-April 2010. | |
Joseph F. DiMaria
225 Franklin Street
Boston, MA 02110
Born 1968 | | Vice President (2011), Assistant Treasurer (2012) and Chief Accounting Officer (2008) | | Vice President — Mutual Fund Treasurer, Columbia Management Investment Advisers, LLC since May 2010; Director of Fund Administration, Columbia Management Advisors, LLC, 2006-April 2010. | |
Amy Johnson
5228 Ameriprise
Financial Center
Minneapolis, MN 55474
Born 1965 | | Vice President (2006) | | Managing Director and Chief Operating Officer, Columbia Management Investment Advisers, LLC since May 2010 (previously Chief Administrative Officer, 2009-April 2010, and Vice President — Asset Management and Trust Company Services, 2006-2009). | |
Lyn Kephart-Strong
5228 Ameriprise
Financial Center
Minneapolis, MN 55474
Born 1960 | | Vice President (2015) | | President, Columbia Management Investment Services Corp. since October 2014; Vice President & Resolution Officer, Ameriprise Trust Company since August 2009; President, RiverSource Service Corporation 2004-2010. | |
Ryan C. Larrenaga
225 Franklin Street
Boston, MA 02110
Born 1970 | | Vice President and Secretary (2015) | | Vice President and Group Counsel, Ameriprise Financial, Inc. since August 2011 (previously, Counsel from May 2010 to August 2011); Assistant General Counsel, Bank of America, 2005-April 2010; officer of Columbia Funds and affiliated funds since 2005. | |
Annual Report 2015
48
COLUMBIA SMALL CAP INDEX FUND
IMPORTANT INFORMATION ABOUT THIS REPORT
Each fund mails one shareholder report to each shareholder address. If you would like more than one report, please call shareholder services at 800.345.6611 and additional reports will be sent to you.
The policy of the Board is to vote the proxies of the companies in which each fund holds investments consistent with the procedures as stated in the Statement of Additional Information (SAI). You may obtain a copy of the SAI without charge by calling 800.345.6611; contacting your financial intermediary; visiting columbiathreadneedle.com/us; or searching the website of the Securities and Exchange Commission (SEC) at sec.gov. Information regarding how each fund voted proxies relating to portfolio securities is filed with the SEC by August 31st for the most recent 12-month period ending June 30th of that year, and is available without charge by visiting columbiathreadneedle.com/us; or searching the website of the SEC at sec.gov.
Each fund files a complete schedule of portfolio holdings with the SEC for the first and third quarters of each fiscal year on Form N-Q. Each fund's Form N-Q is available on the SEC's website at sec.gov and may be reviewed and copied at the SEC's Public Reference Room in Washington, D.C. Information on the operation of the Public Reference Room may be obtained by calling 800.SEC.0330. Each fund's complete schedule of portfolio holdings, as filed on Form N-Q, can also be obtained without charge, upon request, by calling 800.345.6611.
Annual Report 2015
49
Columbia Small Cap Index Fund
P.O. Box 8081
Boston, MA 02266-8081

This information is for use with concurrent or prior delivery of a fund prospectus. Please read and consider the investment objectives, risks, charges and expenses for any fund carefully before investing. For a prospectus and summary prospectus, which contains this and other important information about the Fund, go to columbiathreadneedle.com/us. The Fund is distributed by Columbia Management Investment Distributors, Inc., member FINRA, and managed by Columbia Management Investment Advisers, LLC.
Columbia Threadneedle Investments (Columbia Threadneedle) is the global brand name of the Columbia and Threadneedle group of companies.
All rights reserved. Columbia Management Investment Distributors, Inc., 225 Franklin Street, Boston, MA 02110-2804
© 2015 Columbia Management Investment Advisers, LLC.
columbiathreadneedle.com/us
ANN228_02_E01_(04/15)

ANNUAL REPORT
February 28, 2015

COLUMBIA INTERNATIONAL VALUE FUND

ABOUT COLUMBIA THREADNEEDLE INVESTMENTS
Columbia Threadneedle Investments is a leading global asset management group that provides a broad range of actively managed investment strategies and solutions for individual, institutional and corporate clients around the world.
With more than 2,000 people, including over 450 investment professionals based in North America, Europe and Asia, we manage $506 billion* of assets across developed and emerging market equities, fixed income, asset allocation solutions and alternatives. We are the 11th largest manager of long-term mutual fund assets in the U.S.** and the 5th largest manager of retail funds in the U.K.***
Our priority is the investment success of our clients. We aim to deliver the investment outcomes they expect through an investment approach that is team-based, performance-driven and risk-aware. Our culture is dynamic and interactive. By sharing our insights across asset classes and geographies, we generate richer perspectives on global, regional and local investment landscapes. The ability to exchange and debate investment ideas in a collaborative environment enriches our teams' investment processes. More importantly, it results in better informed investment decisions for our clients.
Columbia funds are distributed by Columbia Management Investment Distributors, Inc., member FINRA, and managed by Columbia Management Investment Advisers, LLC.
Columbia Threadneedle Investments (Columbia Threadneedle) is the global brand name of the Columbia and Threadneedle group of companies.
* In U.S. dollars as of December 31, 2014. Source: Ameriprise Q4 Earnings Release. Includes all assets managed by entities in the Columbia and Threadneedle groups of companies. Contact us for more current data.
** Source: ICI as of December 31, 2014 for Columbia Management Investment Advisers, LLC.
*** Source: Investment Association as of December 2014 for Threadneedle Asset Management Limited.
© 2015 Columbia Management Investment Advisers, LLC. All rights reserved.
Not part of the shareholder report
Get the market insight you need from our investment experts
Connect with Columbia Threadneedle Investments
Investor insight
Find economic and market commentary, investment videos, white papers, mutual fund commentary and more at columbiathreadneedle.com/us.
Columbia Threadneedle Investor Newsletter (e-newsletter)
Read our award-winning* shareholder newsletter. Our quarterly newsletter is available online and provides timely and relevant content about economic trends, fund news, service enhancements and changes. Sign up to receive the newsletter electronically at columbiathreadneedle.com/
us/newsletter.
Investment videos
Get analysis of current events and trends that may affect your investments. Visit our online video library to watch and discover what our thought leaders are saying about the financial markets and economy.
Social media
We offer you multiple ways to access our market commentary and investment insights.
n Perspectives blog at columbiathreadneedle.com/us
Read timely posts by our investment team, including our chief investment officer, chief economist and portfolio managers.
n twitter.com/CTinvest_US
Follow us on Twitter for quick, up-to-the-minute comments on market news and more.
n youtube.com/CTinvestUS
View our commentaries on the economy, markets and current investment opportunities.
n linkedin.com/company/columbia-threadneedle-investments-us
Connect with us on LinkedIn for updates from our thought leaders.
*Columbia Threadneedle Investor Newsletter was awarded top honors in the Mutual Fund Education Alliance STAR Awards competition for excellence in mutual fund marketing and communications in 2011, 2012 and 2013. Materials in the competition were evaluated on educational value, message comprehension, effective design and objectives.
Not part of the shareholder report
Stay informed
Become a subscriber to receive the latest investment publications and mutual fund commentaries
Subscribe to Columbia Threadneedle Investments
Email subscription center
Subscribe to the latest information from Columbia Threadneedle. Visit our email subscription center at columbiathreadneedle.com/us/subscribe to register for economic and market commentary, product and service updates, white papers and more.
n Columbia Threadneedle Investor Newsletter
Quarterly newsletter featuring the latest macro- and micro-economic trends, investment themes, products, service changes and other items of interest to our investors
n Investment Strategy Outlook
Quarterly publication featuring the Columbia Threadneedle Asset Allocation Team's perspective on global economic investment conditions and markets
n MarketTrack
Quarterly publication featuring more than 40 charts and graphs that highlight the current state of the economy and the markets; includes straightforward insight on current investment opportunities
n White papers
Frequent articles that delve deep into a variety of investment topics
n Mutual fund updates
Quarterly portfolio manager commentary and fund fact sheets available for Columbia funds. (Not all funds have a commentary.)
Register your information online at columbiathreadneedle.com/us/subscribe and select the publications you would like to receive. Update your subscriptions at any time by accessing the email subscription center.
CT-MK (03/15) 5383/1125800
 Dear Shareholder,
In a world that is changing faster than ever before, investors want asset managers who offer a global perspective while generating strong and sustainable returns. To that end, Columbia Management, in conjunction with its U.K.-based affiliate, Threadneedle Investments, has rebranded to Columbia Threadneedle Investments. The new global brand represents the combined capabilities, resources and reach of the global group, offering investors access to the best of both firms.
With a presence in 18 countries and more than 450 investment professionals*, our collective perspective and world view as Columbia Threadneedle Investments gives us deeper insight into what might affect the real-life financial outcomes clients are seeking. Putting our views into a global context enables us to build richer perspectives and create the right solutions, and provides us with enhanced capabilities to deliver consistent investment performance, which may ultimately lead to better investor outcomes.
As a result of the rebrand, you will begin to see our new logo and colors reflected in printed materials, such as this shareholder report, as well as on our new website — columbiathreadneedle.com/us. We encourage you to visit us online and view a new video on the "About Us" tab that speaks to the strength of the firm.
While we are introducing a new brand, in many ways, the investment company you know well has not changed. The following remain in effect:
n Fund and strategy names
n Established investment teams, philosophies and processes
n Account services, features, servicing phone numbers and mailing addresses
n Columbia Management Investment Distributors as distributor and Columbia Management Investment Advisers as investment adviser
We recognize that the money we manage represents the hard work and savings of people like you, and that everyone has different ambitions and different definitions of success. Investors have varying goals — funding their children's education, enjoying their retirement, putting money aside for unexpected events, and more. Whatever your ambitions, we believe our wide range of investment products and solutions can help give you confidence that you will reach your goals.
The world is constantly changing, but our priority remains the same: to help you secure your finances, meet your goals and achieve success. Thank you for your continued investment with us. Our service representatives are available at 800.345.6611 to help with any questions.
Sincerely,

Christopher O. Petersen
President, Columbia Funds
Investors should consider the investment objectives, risks, charges and expenses of a mutual fund carefully before investing. For a free prospectus and summary prospectus, which contains this and other important information about a fund, visit columbiathreadneedle.com/us. The prospectus should be read carefully before investing.
* Source: Ameriprise as of December 1, 2014
Columbia Funds are distributed by Columbia Management Investment Distributors, Inc., member FINRA, and managed by Columbia Management Investment Advisers, LLC.
© 2015 Columbia Management Investment Advisers, LLC. All rights reserved.
COLUMBIA INTERNATIONAL VALUE FUND
Fund Investment Manager
Columbia Management Investment
Advisers, LLC
225 Franklin Street
Boston, MA 02110
Fund Distributor
Columbia Management Investment
Distributors, Inc.
225 Franklin Street
Boston, MA 02110
Fund Transfer Agent
Columbia Management Investment
Services Corp.
P.O. Box 8081
Boston, MA 02266-8081
For more information about any of the funds, please visit columbiathreadneedle.com/us or call 800.345.6611. Customer Service Representatives are available to answer your questions Monday through Friday from 8 a.m. to 7 p.m. Eastern time.
The views expressed in this report reflect the current views of the respective parties. These views are not guarantees of future performance and involve certain risks, uncertainties and assumptions that are difficult to predict, so actual outcomes and results may differ significantly from the views expressed. These views are subject to change at any time based upon economic, market or other conditions and the respective parties disclaim any responsibility to update such views. These views may not be relied on as investment advice and, because investment decisions for a Columbia fund are based on numerous factors, may not be relied on as an indication of trading intent on behalf of any particular Columbia fund. References to specific securities should not be construed as a recommendation or investment advice.
Performance Overview | | | 3 | | |
Manager Discussion of Fund Performance | | | 5 | | |
Understanding Your Fund's Expenses | | | 8 | | |
Portfolio of Investments | | | 9 | | |
Statement of Assets and Liabilities | | | 15 | | |
Statement of Operations | | | 17 | | |
Statement of Changes in Net Assets | | | 18 | | |
Financial Highlights | | | 20 | | |
Notes to Financial Statements | | | 28 | | |
Report of Independent Registered
Public Accounting Firm | | | 39 | | |
Federal Income Tax Information | | | 40 | | |
Trustees and Officers | | | 41 | | |
Important Information About This Report | | | 47 | | |
COLUMBIA INTERNATIONAL VALUE FUND
Performance Summary
n Columbia International Value Fund (the Fund) Class A shares returned -3.19% excluding sales charges for the 12-month period that ended February 28, 2015.
n The Fund underperformed its benchmark, the MSCI EAFE Value Index (Net), which returned -1.58% for the same time period.
n The Fund's tilt toward growth at the beginning of the period generally accounted for its shortfall relative to the benchmark.
Average Annual Total Returns (%) (for period ended February 28, 2015)
| | | Inception | | 1 Year | | 5 Years | | 10 Years | |
Class A | | 12/27/95 | | | | | | | | | | | | | |
Excluding sales charges | | | | | | | -3.19 | | | | 5.44 | | | | 3.82 | | |
Including sales charges | | | | | | | -8.77 | | | | 4.20 | | | | 3.21 | | |
Class B | | 05/22/98 | | | | | | | | | | | | | |
Excluding sales charges | | | | | | | -3.91 | | | | 4.67 | | | | 3.07 | | |
Including sales charges | | | | | | | -8.56 | | | | 4.34 | | | | 3.07 | | |
Class C | | 06/15/98 | | | | | | | | | | | | | |
Excluding sales charges | | | | | | | -3.86 | | | | 4.66 | | | | 3.05 | | |
Including sales charges | | | | | | | -4.79 | | | | 4.66 | | | | 3.05 | | |
Class I* | | 09/27/10 | | | -2.74 | | | | 5.05 | | | | 3.63 | | |
Class R* | | 09/27/10 | | | -3.38 | | | | 5.16 | | | | 3.54 | | |
Class R4* | | 11/08/12 | | | -2.87 | | | | 5.59 | | | | 3.90 | | |
Class R5* | | 11/08/12 | | | -2.82 | | | | 5.62 | | | | 3.91 | | |
Class Z | | 12/27/95 | | | -2.91 | | | | 5.70 | | | | 4.08 | | |
MSCI EAFE Value Index (Net) | | | | | | | -1.58 | | | | 6.93 | | | | 4.17 | | |
Returns for Class A are shown with and without the maximum initial sales charge of 5.75%. Returns for Class B are shown with and without the applicable contingent deferred sales charge (CDSC) of 5.00% in the first year, declining to 1.00% in the sixth year and eliminated thereafter. Returns for Class C are shown with and without the 1.00% CDSC for the first year only. The Fund's other classes are not subject to sales charges and have limited eligibility. Please see the Fund's prospectus for details. Performance for different share classes will vary based on differences in sales charges and fees associated with each class. All results shown assume reinvestment of distributions during the period. Returns do not reflect the deduction of taxes that a shareholder may pay on Fund distributions or on the redemption of Fund shares. Performance results reflect the effect of any fee waivers or reimbursements of Fund expenses by Columbia Management Investment Advisers, LLC and/or any of its affiliates. Absent these fee waivers or expense reimbursement arrangements, performance results would have been lower.
The performance information shown represents past performance and is not a guarantee of future results. The investment return and principal value of your investment will fluctuate so that your shares, when redeemed, may be worth more or less than their original cost. Current performance may be lower or higher than the performance information shown. You may obtain performance information current to the most recent month-end by contacting your financial intermediary, visiting columbiathreadneedle.com/us or calling 800.345.6611.
*The returns shown for periods prior to the share class inception date (including returns for the Life of the Fund, if shown, which are since Fund inception) include the returns of the Fund's oldest share class. Since the Fund launched more than one share class at its inception, Class A shares were used. These returns are adjusted to reflect any higher class-related operating expenses of the newer share classes, as applicable. Please visit columbiathreadneedle.com/us/investment-products/mutual-funds/appended-performance for more information.
The MSCI EAFE Value Index (Net) is a subset of the MSCI EAFE Index (Net), and constituents of the index include securities from Europe, Australasia and the Far East. The index generally represents approximately 50% of the free float-adjusted market capitalization of the MSCI EAFE Index (Net), and consists of those securities classified by MSCI Inc. as most representing the value style, such as, higher book value-to-price ratios, higher forward earnings-to-price ratios, higher dividend yields and lower forecasted growth rates than securities representing the growth style.
Indices are not available for investment, are not professionally managed and do not reflect sales charges, fees, brokerage commissions, taxes (except the MSCI EAFE Value Index (Net), which reflects reinvested dividends net of withholding taxes) or other expenses of investing. Securities in the Fund may not match those in an index.
Annual Report 2015
3
COLUMBIA INTERNATIONAL VALUE FUND
PERFORMANCE OVERVIEW (continued)
Performance of a Hypothetical $10,000 Investment (March 1, 2005 – February 28, 2015)
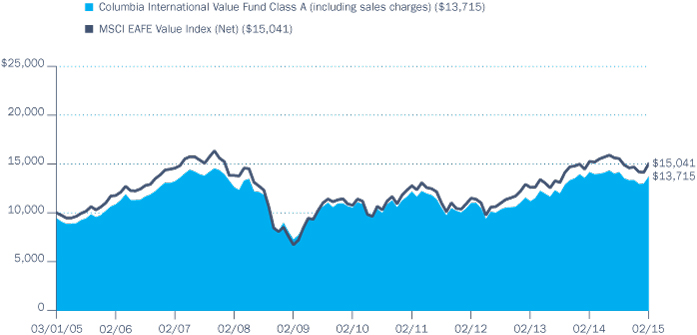
The chart above shows the change in value of a hypothetical $10,000 investment in Class A shares of Columbia International Value Fund during the stated time period, and does not reflect the deduction of taxes that a shareholder may pay on Fund distributions or on the redemption of Fund shares.
Annual Report 2015
4
COLUMBIA INTERNATIONAL VALUE FUND
MANAGER DISCUSSION OF FUND PERFORMANCE
For the 12-month period that ended February 28, 2015, the Fund's Class A shares returned -3.19% excluding sales charges. The Fund underperformed its benchmark, the MSCI EAFE Value Index (Net), which returned -1.58% for the same time period. The Fund's tilt toward growth at the beginning of the period generally accounted for its shortfall relative to the benchmark.
Global Stock Market Returns Trimmed by Rising U.S. Dollar
The stock markets of developed economies rose nicely over the 12-month period ended February 28, 2015. The benchmark gained 15.00% when measured in local currencies. However, when measured in U.S. dollars — the return most significant to U.S. investors — the results were slightly negative for the period as the dollar rose against major currencies. Despite any number of concerns that could have rattled markets, such as civil war in the Ukraine and continued unrest in the Middle East, all countries and sectors in the benchmark were positive performers for the year, when measured in local currencies. Energy was the notable exception, as the sector was weighed down by as much as a 60% drop in the price of oil.
Contributors and Detractors
The Fund's tilt toward growth at the beginning of the period generally accounted for its modest shortfall relative to the benchmark. We expected global growth to continue its previous steady pace of recovery. However, growth came in well below expectations early in the 12-month period, inflation collapsed and interest rates, in turn, fell sharply. Against this backdrop, the Fund was underexposed to some of the slower growth, higher yielding sectors, such as telecommunication services and utilities, which were the big beneficiaries as investors scrambled for yield.
Yet, there were bright spots that bolstered returns. An out-of-benchmark position in biotechnology yielded several solid performers for the period. We have observed that many major global pharmaceutical companies have propped up earnings by cutting research and development expenditures, which can help in the near term but puts the longer term pipeline of drugs at risk. Ultimately we believe this pipeline will need to be replenished, and the most obvious source would be through acquisitions of biotechnology companies that have experienced key breakthroughs in potentially promising products and therapies. With this in mind, we invested in Puma Biotechnology and Auspex Pharmaceuticals, both of which experienced double-digit gains because of recent success from clinical trials of treatments with considerable market potential. Phase 3 trials for Puma Biotechnology's supplemental breast cancer treatment showed a magnitude of benefit greater than the market was expecting. The market potential for this type of treatment is in the billions of dollars. Auspex Pharmaceuticals announced positive top line efficacy and safety results from its Phase 3 program related to the treatment of Huntington's disease.
In addition, the Fund was overweight in consumer discretionary stocks, particularly in Japanese automotive companies. As the Japanese yen weakened, the profits of many Japan's automakers received a significant
Portfolio Management
Fred Copper, CFA
Daisuke Nomoto, CMA (SAAJ)
Morningstar Style BoxTM
The Morningstar Style BoxTM is based on a fund's portfolio holdings. For equity funds, the vertical axis shows the market capitalization of the stocks owned, and the horizontal axis shows investment style (value, blend, or growth). Information shown is based on the most recent data provided by Morningstar.
© 2015 Morningstar, Inc. All rights reserved. The Morningstar information contained herein: (1) is proprietary to Morningstar and/or its content providers; (2) may not be copied or distributed; and (3) is not warranted to be accurate, complete or timely. Neither Morningstar nor its content providers are responsible for any damages or losses arising from any use of this information.
Annual Report 2015
5
COLUMBIA INTERNATIONAL VALUE FUND
MANAGER DISCUSSION OF FUND PERFORMANCE (continued)
Top Ten Holdings (%)
(at February 28, 2015) | |
Royal Dutch Shell PLC,
Class B (United Kingdom) | | | 3.9 | | |
iShares MSCI EAFE ETF
(United States) | | | 2.7 | | |
HSBC Holdings PLC
(United Kingdom) | | | 2.3 | | |
Allianz SE, Registered Shares
(Germany) | | | 2.1 | | |
ING Groep NV-CVA
(Netherlands) | | | 2.0 | | |
BNP Paribas SA (France) | | | 2.0 | | |
AXA SA (France) | | | 1.9 | | |
Koninklijke Ahold NV
(Netherlands) | | | 1.7 | | |
Nordea Bank AB (Sweden) | | | 1.6 | | |
DBS Group Holdings Ltd.
(Singapore) | | | 1.6 | | |
Percentages indicated are based upon total investments.
For further detail about these holdings, please refer to the section entitled "Portfolio of Investments."
Fund holdings are as of the date given, are subject to change at any time, and are not recommendations to buy or sell any security.
Portfolio Breakdown (%)
(at February 28, 2015) | |
Common Stocks | | | 97.3 | | |
Consumer Discretionary | | | 13.2 | | |
Consumer Staples | | | 3.7 | | |
Energy | | | 8.9 | | |
Financials | | | 34.5 | | |
Health Care | | | 8.3 | | |
Industrials | | | 7.8 | | |
Information Technology | | | 7.0 | | |
Materials | | | 4.5 | | |
Telecommunication Services | | | 5.4 | | |
Utilities | | | 4.0 | | |
Exchange-Traded Funds | | | 2.7 | | |
Total | | | 100.0 | | |
Percentages indicated are based upon total investments. The Fund's portfolio composition is subject to change.
boost. Two of the Fund's top performing stocks for the period were Fuji Heavy Industries, maker of Subaru, and Toyo Tire & Rubber Co. Both enjoyed significant gains and remain in the portfolio. An underweight in the materials sector, which lagged, also aided performance.
By contrast, stock selection within the information technology sector detracted from performance. Xchanging, a London based business process outsourcer, was down sharply for the year, as a ramp up in capital spending coincided with a slowdown in some of its key markets, resulting in an unexpected drop in cash flow. In the financial sector, K.Wah International, a Hong Kong-based property developer, weighed on performance as its position in Galaxy Entertainment, a Macau casino operator, suffered due to a crackdown by the Chinese government on the use of Macau casinos as a way for Chinese nationals to move money out of China. We sold K.Wah International. An out-of-benchmark investment in two Korean home shopping channel operators also hurt performance. Hyundai Home Shopping Network and GS Home Shopping fell as consumer spending weakened.
Looking Ahead
We are fairly optimistic at this time in our outlook for global stock markets in the year ahead, particularly outside the United States. Japan has embarked on a dramatic program of reform, which has thus far relied primarily on benefits achieved through a weaker yen, but which progressively emphasizes true structural change in the economy. We believe this has the potential to bolster the Japanese stock market. In Europe, the combination of a weaker euro, falling oil prices, a rejuvenated banking sector and aggressive monetary policy all have the potential to contribute to strong performance across the continent. Commodity-exposed areas, such as Australia and many emerging markets, may face tough tests in 2015, as the dramatic fall in many commodity prices puts strains on corporate and government finances.
Against this backdrop, we have maintained the Fund's bias towards stocks that we consider to be more growth-oriented. We have not compromised our requirements for value; however, in an environment of low global economic growth, which we believe we are in, growth is a scarce commodity. As a result, we have actively sought value within areas of the market that are more tilted towards growth. Although this approach was a significant impediment to performance early in the prior period, when large, defensive value stocks were in favor, we believe it helped later in the fiscal year; and we believe it has the potential to be an enduring theme in market leadership in the period ahead.
Annual Report 2015
6
COLUMBIA INTERNATIONAL VALUE FUND
MANAGER DISCUSSION OF FUND PERFORMANCE (continued)
Country Breakdown (%)
(at February 28, 2015) | |
Australia | | | 4.2 | | |
Belgium | | | 1.9 | | |
Denmark | | | 0.7 | | |
France | | | 9.5 | | |
Germany | | | 6.7 | | |
Hong Kong | | | 1.3 | | |
Ireland | | | 2.8 | | |
Israel | | | 1.5 | | |
Italy | | | 4.1 | | |
Japan | | | 22.4 | | |
Netherlands | | | 3.7 | | |
Norway | | | 1.8 | | |
Portugal | | | 0.0 | (a) | |
Singapore | | | 1.6 | | |
South Korea | | | 2.1 | | |
Spain | | | 3.7 | | |
Sweden | | | 2.6 | | |
Switzerland | | | 3.8 | | |
Taiwan | | | 1.2 | | |
United Kingdom | | | 18.4 | | |
United States | | | 6.0 | | |
Total | | | 100.0 | | |
Country Breakdown is based primarily on issuer's place of organization/incorporation. Percentages indicated are based upon total investments. The Fund's portfolio composition is subject to change.
(a) Rounds to zero.
Investment Risks
Market risk may affect a single issuer, sector of the economy, industry or the market as a whole. Value securities may be unprofitable if the market fails to recognize their intrinsic worth or the portfolio manager misgauged that worth. International investing involves certain risks and volatility due to potential political, economic or currency instabilities and different financial and accounting standards. Risks are enhanced for emerging market issuers. Investing in derivatives is a specialized activity that involves special risks that subject the Fund to significant loss potential, including when used as leverage, and may result in greater fluctuation in Fund value. See the Fund's prospectus for more information on these and other risks.
Annual Report 2015
7
COLUMBIA INTERNATIONAL VALUE FUND
UNDERSTANDING YOUR FUND'S EXPENSES
(Unaudited)
As an investor, you incur two types of costs. There are transaction costs, which generally include sales charges on purchases and may include redemption fees. There are also ongoing costs, which generally include management fees, distribution and/or service fees, and other fund expenses. The following information is intended to help you understand your ongoing costs (in dollars) of investing in the Fund and to help you compare these costs with the ongoing costs of investing in other mutual funds.
Analyzing Your Fund's Expenses
To illustrate these ongoing costs, we have provided examples and calculated the expenses paid by investors in each share class of the Fund during the period. The actual and hypothetical information in the table is based on an initial investment of $1,000 at the beginning of the period indicated and held for the entire period. Expense information is calculated two ways and each method provides you with different information. The amount listed in the "Actual" column is calculated using the Fund's actual operating expenses and total return for the period. You may use the Actual information, together with the amount invested, to estimate the expenses that you paid over the period. Simply divide your account value by $1,000 (for example, an $8,600 account value divided by $1,000 = 8.6), then multiply the results by the expenses paid during the period under the "Actual" column. The amount listed in the "Hypothetical" column assumes a 5% annual rate of return before expenses (which is not the Fund's actual return) and then applies the Fund's actual expense ratio for the period to the hypothetical return. You should not use the hypothetical account values and expenses to estimate either your actual account balance at the end of the period or the expenses you paid during the period. See "Compare With Other Funds" below for details on how to use the hypothetical data.
Compare With Other Funds
Since all mutual funds are required to include the same hypothetical calculations about expenses in shareholder reports, you can use this information to compare the ongoing cost of investing in the Fund with other funds. To do so, compare the hypothetical example with the 5% hypothetical examples that appear in the shareholder reports of other funds. As you compare hypothetical examples of other funds, it is important to note that hypothetical examples are meant to highlight the ongoing costs of investing in a fund only and do not reflect any transaction costs, such as sales charges, or redemption or exchange fees. Therefore, the hypothetical calculations are useful in comparing ongoing costs only, and will not help you determine the relative total costs of owning different funds. If transaction costs were included in these calculations, your costs would be higher.
September 1, 2014 – February 28, 2015
| | | Account Value at the Beginning
of the Period ($) | | Account Value at the End of the
Period ($) | | Expenses Paid During the
Period ($) | | Fund's Annualized
Expense Ratio (%) | |
| | | Actual | | Hypothetical | | Actual | | Hypothetical | | Actual | | Hypothetical | | Actual | |
Class A | | | 1,000.00 | | | | 1,000.00 | | | | 969.60 | | | | 1,017.85 | | | | 6.97 | | | | 7.14 | | | | 1.42 | | |
Class B | | | 1,000.00 | | | | 1,000.00 | | | | 966.20 | | | | 1,014.11 | | | | 10.64 | | | | 10.90 | | | | 2.17 | | |
Class C | | | 1,000.00 | | | | 1,000.00 | | | | 966.10 | | | | 1,014.11 | | | | 10.64 | | | | 10.90 | | | | 2.17 | | |
Class I | | | 1,000.00 | | | | 1,000.00 | | | | 971.50 | | | | 1,019.80 | | | | 5.06 | | | | 5.19 | | | | 1.03 | | |
Class R | | | 1,000.00 | | | | 1,000.00 | | | | 968.70 | | | | 1,016.60 | | | | 8.20 | | | | 8.40 | | | | 1.67 | | |
Class R4 | | | 1,000.00 | | | | 1,000.00 | | | | 971.10 | | | | 1,019.10 | | | | 5.75 | | | | 5.89 | | | | 1.17 | | |
Class R5 | | | 1,000.00 | | | | 1,000.00 | | | | 971.40 | | | | 1,019.60 | | | | 5.26 | | | | 5.39 | | | | 1.07 | | |
Class Z | | | 1,000.00 | | | | 1,000.00 | | | | 970.80 | | | | 1,019.10 | | | | 5.75 | | | | 5.89 | | | | 1.17 | | |
Expenses paid during the period are equal to the annualized expense ratio for each class as indicated above, multiplied by the average account value over the period and then multiplied by the number of days in the Fund's most recent fiscal half year and divided by 365.
Expenses do not include fees and expenses incurred indirectly by the Fund from its investment in underlying funds, including affiliated and non-affiliated pooled investment vehicles, such as mutual funds and exchange-traded funds.
Had Columbia Management Investment Advisers, LLC and/or certain of its affiliates not waived/reimbursed certain fees and expenses, account value at the end of the period would have been reduced.
Annual Report 2015
8
COLUMBIA INTERNATIONAL VALUE FUND
PORTFOLIO OF INVESTMENTS
February 28, 2015
(Percentages represent value of investments compared to net assets)
Common Stocks 95.7%
Issuer | | Shares | | Value ($) | |
AUSTRALIA 4.1% | |
Australia and New Zealand Banking
Group Ltd. | | | 87,132 | | | | 2,403,774 | | |
Macquarie Group Ltd. | | | 38,013 | | | | 2,160,500 | | |
National Australia Bank Ltd. | | | 44,474 | | | | 1,315,863 | | |
Westpac Banking Corp. | | | 60,286 | | | | 1,793,225 | | |
Total | | | | | 7,673,362 | | |
BELGIUM 1.9% | |
Delhaize Group SA | | | 12,106 | | | | 1,086,216 | | |
KBC Groep NV(a) | | | 40,385 | | | | 2,450,356 | | |
Total | | | | | 3,536,572 | | |
DENMARK 0.7% | |
Novo Nordisk A/S, Class B | | | 26,543 | | | | 1,272,539 | | |
FRANCE 9.3% | |
AXA SA | | | 141,305 | | | | 3,587,910 | | |
BNP Paribas SA | | | 62,533 | | | | 3,645,131 | | |
Casino Guichard Perrachon SA | | | 19,674 | | | | 1,851,562 | | |
CNP Assurances | | | 107,875 | | | | 1,788,430 | | |
Publicis Groupe SA | | | 29,421 | | | | 2,399,141 | | |
Sanofi | | | 18,407 | | | | 1,806,476 | | |
Total SA | | | 45,807 | | | | 2,472,542 | | |
Total | | | | | 17,551,192 | | |
GERMANY 6.6% | |
Allianz SE, Registered Shares | | | 23,115 | | | | 3,869,680 | | |
BASF SE | | | 14,107 | | | | 1,352,109 | | |
Continental AG | | | 9,575 | | | | 2,285,489 | | |
Duerr AG | | | 12,679 | | | | 1,356,414 | | |
Freenet AG | | | 85,182 | | | | 2,541,786 | | |
Jenoptik AG | | | 67,220 | | | | 927,870 | | |
Total | | | | | 12,333,348 | | |
HONG KONG 1.3% | |
Cheung Kong Holdings Ltd. | | | 121,000 | | | | 2,395,053 | | |
IRELAND 2.8% | |
Amarin Corp. PLC, ADR(a) | | | 236,973 | | | | 357,829 | | |
Dragon Oil PLC | | | 230,314 | | | | 1,918,303 | | |
Smurfit Kappa Group PLC | | | 103,727 | | | | 2,905,955 | | |
Total | | | | | 5,182,087 | | |
Common Stocks (continued)
Issuer | | Shares | | Value ($) | |
ISRAEL 1.5% | |
Bezeq Israeli Telecommunication
Corp., Ltd. (The) | | | 1,791,625 | | | | 2,863,294 | | |
ITALY 4.0% | |
Banco Popolare SC(a) | | | 72,219 | | | | 1,113,654 | | |
Enel SpA | | | 465,427 | | | | 2,144,803 | | |
ENI SpA | | | 88,464 | | | | 1,651,248 | | |
Esprinet SpA | | | 116,557 | | | | 981,509 | | |
Recordati SpA | | | 91,146 | | | | 1,641,131 | | |
Total | | | | | 7,532,345 | | |
JAPAN 22.1% | |
Aozora Bank Ltd. | | | 328,000 | | | | 1,182,404 | | |
Central Japan Railway Co. | | | 15,100 | | | | 2,809,640 | | |
COMSYS Holdings Corp. | | | 104,500 | | | | 1,264,512 | | |
CyberAgent, Inc. | | | 22,448 | | | | 1,158,898 | | |
CYBERDYNE, Inc.(a) | | | 14,200 | | | | 352,187 | | |
Daiichikosho Co., Ltd. | | | 79,800 | | | | 2,514,740 | | |
Fuji Heavy Industries Ltd. | | | 72,300 | | | | 2,464,822 | | |
Fuyo General Lease Co., Ltd. | | | 36,600 | | | | 1,276,852 | | |
Hoya Corp. | | | 49,700 | | | | 2,006,506 | | |
Hulic REIT, Inc. | | | 738 | | | | 1,121,007 | | |
Invincible Investment Corp. | | | 1,788 | | | | 799,235 | | |
IT Holdings Corp. | | | 58,100 | | | | 1,021,658 | | |
ITOCHU Corp. | | | 137,400 | | | | 1,538,813 | | |
KDDI Corp. | | | 30,300 | | | | 2,102,863 | | |
Kenedix Retail REIT Corp.(a) | | | 187 | | | | 427,697 | | |
Keyence Corp. | | | 2,100 | | | | 1,073,944 | | |
Mazda Motor Corp. | | | 53,400 | | | | 1,144,716 | | |
Mitsubishi UFJ Financial Group, Inc. | | | 376,431 | | | | 2,451,678 | | |
Nakanishi, Inc. | | | 36,800 | | | | 1,414,356 | | |
Nihon M&A Center, Inc. | | | 50,400 | | | | 1,662,307 | | |
Nishi-Nippon City Bank Ltd. (The) | | | 348,000 | | | | 1,115,464 | | |
ORIX Corp. | | | 93,300 | | | | 1,326,658 | | |
Sumitomo Mitsui Financial Group, Inc. | | | 59,842 | | | | 2,384,319 | | |
Tanseisha Co., Ltd. | | | 126,800 | | | | 852,420 | | |
Temp Holdings Co., Ltd. | | | 42,400 | | | | 1,425,194 | | |
Tokai Tokyo Financial Holdings, Inc. | | | 177,800 | | | | 1,306,157 | | |
Toyo Tire & Rubber Co., Ltd. | | | 82,200 | | | | 1,860,747 | | |
The accompanying Notes to Financial Statements are an integral part of this statement.
Annual Report 2015
9
COLUMBIA INTERNATIONAL VALUE FUND
PORTFOLIO OF INVESTMENTS (continued)
February 28, 2015
Common Stocks (continued)
Issuer | | Shares | | Value ($) | |
Toyota Motor Corp. | | | 21,500 | | | | 1,453,276 | | |
Total | | | | | 41,513,070 | | |
NETHERLANDS 3.6% | |
ING Groep NV-CVA(a) | | | 246,731 | | | | 3,687,374 | | |
Koninklijke Ahold NV | | | 164,918 | | | | 3,094,006 | | |
Total | | | | | 6,781,380 | | |
NORWAY 1.7% | |
Atea ASA | | | 118,091 | | | | 1,332,482 | | |
Kongsberg Automotive ASA(a) | | | 2,081,695 | | | | 1,545,104 | | |
Spectrum ASA | | | 87,880 | | | | 378,296 | | |
Total | | | | | 3,255,882 | | |
PORTUGAL —% | |
Banco Espirito Santo SA, Registered
Shares(a)(b) | | | 829,472 | | | | 37,129 | | |
SINGAPORE 1.5% | |
DBS Group Holdings Ltd. | | | 202,700 | | | | 2,906,478 | | |
SOUTH KOREA 2.1% | |
GS Home Shopping, Inc. | | | 5,483 | | | | 1,169,895 | | |
Hyundai Home Shopping Network Corp. | | | 13,635 | | | | 1,664,414 | | |
LF Corp. | | | 38,014 | | | | 1,091,584 | | |
Total | | | | | 3,925,893 | | |
SPAIN 3.6% | |
Banco Santander SA | | | 214,517 | | | | 1,568,281 | | |
Endesa SA | | | 130,789 | | | | 2,644,716 | | |
Iberdrola SA | | | 387,970 | | | | 2,651,402 | | |
Total | | | | | 6,864,399 | | |
SWEDEN 2.5% | |
Nordea Bank AB | | | 225,475 | | | | 3,042,574 | | |
Saab AB, Class B | | | 63,667 | | | | 1,705,270 | | |
Total | | | | | 4,747,844 | | |
SWITZERLAND 3.8% | |
Autoneum Holding AG | | | 10,804 | | | | 2,016,082 | | |
Baloise Holding AG, Registered Shares | | | 13,380 | | | | 1,740,305 | | |
Nestlé SA, Registered Shares | | | 10,372 | | | | 809,437 | | |
Zurich Insurance Group AG | | | 7,860 | | | | 2,512,958 | | |
Total | | | | | 7,078,782 | | |
Common Stocks (continued)
Issuer | | Shares | | Value ($) | |
TAIWAN 1.1% | |
Pegatron Corp. | | | 419,000 | | | | 1,146,551 | | |
Wistron NeWeb Corp. | | | 435,100 | | | | 1,015,744 | | |
Total | | | | | 2,162,295 | | |
UNITED KINGDOM 18.3% | |
AstraZeneca PLC | | | 34,349 | | | | 2,370,164 | | |
AstraZeneca PLC, ADR | | | 14,675 | | | | 1,011,107 | | |
Aviva PLC | | | 277,050 | | | | 2,305,431 | | |
BHP Billiton PLC | | | 66,063 | | | | 1,648,691 | | |
| BP PLC | | | 366,787 | | | | 2,537,148 | | |
Close Brothers Group PLC | | | 63,580 | | | | 1,610,773 | | |
Crest Nicholson Holdings PLC | | | 231,923 | | | | 1,582,959 | | |
DCC PLC | | | 30,936 | | | | 1,848,334 | | |
HSBC Holdings PLC | | | 476,900 | | | | 4,250,443 | | |
John Wood Group PLC | | | 38,066 | | | | 391,102 | | |
KAZ Minerals PLC(a) | | | 385,383 | | | | 1,508,854 | | |
Optimal Payments PLC(a) | | | 414,929 | | | | 2,379,786 | | |
Royal Dutch Shell PLC, Class B | | | 210,840 | | | | 7,179,024 | | |
Vodafone Group PLC | | | 724,552 | | | | 2,510,139 | | |
Xchanging PLC | | | 491,980 | | | | 1,093,743 | | |
Total | | | | | 34,227,698 | | |
UNITED STATES 3.2% | |
Alkermes PLC(a) | | | 6,141 | | | | 431,405 | | |
Arrowhead Research Corp.(a) | | | 37,585 | | | | 283,015 | | |
Auspex Pharmaceuticals, Inc.(a) | | | 4,045 | | | | 271,986 | | |
BioMarin Pharmaceutical, Inc.(a) | | | 3,439 | | | | 368,214 | | |
Dynavax Technologies Corp.(a) | | | 16,315 | | | | 287,144 | | |
Flex Pharma, Inc.(a) | | | 21,022 | | | | 365,468 | | |
Incyte Corp.(a) | | | 4,425 | | | | 379,886 | | |
Insmed, Inc.(a) | | | 15,945 | | | | 295,620 | | |
Novavax, Inc.(a) | | | 30,050 | | | | 274,958 | | |
Pharmacyclics, Inc.(a) | | | 1,451 | | | | 313,314 | | |
Puma Biotechnology, Inc.(a) | | | 2,688 | | | | 572,571 | | |
Receptos, Inc.(a) | | | 2,215 | | | | 280,508 | | |
Regulus Therapeutics, Inc.(a) | | | 13,210 | | | | 244,649 | | |
Stillwater Mining Co.(a) | | | 62,490 | | | | 906,105 | | |
TESARO, Inc.(a) | | | 5,655 | | | | 301,581 | | |
Verastem, Inc.(a) | | | 4,553 | | | | 33,874 | | |
Vertex Pharmaceuticals, Inc.(a) | | | 2,973 | | | | 355,065 | | |
Total | | | | | 5,965,363 | | |
Total Common Stocks
(Cost: $174,672,305) | | | | | 179,806,005 | | |
The accompanying Notes to Financial Statements are an integral part of this statement.
Annual Report 2015
10
COLUMBIA INTERNATIONAL VALUE FUND
PORTFOLIO OF INVESTMENTS (continued)
February 28, 2015
Exchange-Traded Funds 2.7%
| | | Shares | | Value ($) | |
iShares MSCI EAFE ETF | | | 77,350 | | | | 5,033,165 | | |
Total Exchange-Traded Funds
(Cost: $5,033,880) | | | | | 5,033,165 | | |
Total Investments
(Cost: $179,706,185) | | | | | 184,839,170 | (c) | |
Other Assets & Liabilities, Net | | | | | 2,961,947 | | |
Net Assets | | | | | 187,801,117 | | |
Investments in Derivatives
Forward Foreign Currency Exchange Contracts Open at February 28, 2015
Counterparty | | Exchange Date | | Currency to
be Delivered | | Currency to
be Received | | Unrealized
Appreciation ($) | | Unrealized
Depreciation ($) | |
Toronto Dominion
| | 3/31/15
| | | 2,716,000
CAD | | | | 2,158,648
USD | | | | —
| | | | (13,053
| ) | |
Toronto Dominion
| | 3/31/15
| | | 985,000
CAD | | | | 791,862
USD | | | | 4,261
| | | | —
| | |
Toronto Dominion
| | 3/31/15
| | | 8,773,000
ILS | | | | 2,242,156
USD | | | | 39,639
| | | | —
| | |
Toronto Dominion
| | 3/31/15
| | | 79,482,000
JPY | | | | 678,616
USD | | | | 13,912
| | | | —
| | |
Toronto Dominion
| | 3/31/15
| | | 70,591,000
JPY | | | | 594,035
USD | | | | 3,687
| | | | —
| | |
Toronto Dominion
| | 3/31/15
| | | 3,833,931,000
KRW | | | | 3,511,247
USD | | | | 33,009
| | | | —
| | |
Toronto Dominion
| | 3/31/15
| | | 640,538,000
KRW | | | | 576,542
USD | | | | —
| | | | (4,570
| ) | |
Toronto Dominion
| | 3/31/15
| | | 8,141,000
NOK | | | | 1,068,694
USD | | | | 7,655
| | | | —
| | |
Toronto Dominion
| | 3/31/15
| | | 61,462,000
TWD | | | | 1,952,414
USD | | | | —
| | | | (1,759
| ) | |
Toronto Dominion
| | 3/31/15
| | | 5,280,926
USD | | | | 6,836,000
AUD | | | | 50,773
| | | | —
| | |
Toronto Dominion
| | 3/31/15
| | | 389,701
USD | | | | 2,552,000
DKK | | | | —
| | | | (6,547
| ) | |
Toronto Dominion
| | 3/31/15
| | | 8,486,145
USD | | | | 5,592,000
GBP | | | | 145,128
| | | | —
| | |
Toronto Dominion
| | 3/31/15
| | | 1,189,033
USD | | | | 766,000
GBP | | | | —
| | | | (6,709
| ) | |
Toronto Dominion
| | 3/31/15
| | | 594,128
USD | | | | 790,000
NZD | | | | 1,562
| | | | —
| | |
Toronto Dominion
| | 3/31/15
| | | 1,076,875
USD | | | | 8,939,000
SEK | | | | —
| | | | (4,327
| ) | |
Toronto Dominion
| | 3/31/15
| | | 594,513
USD | | | | 805,000
SGD | | | | —
| | | | (4,308
| ) | |
Total | | | | | | | | | 299,626 | | | | (41,273 | ) | |
The accompanying Notes to Financial Statements are an integral part of this statement.
Annual Report 2015
11
COLUMBIA INTERNATIONAL VALUE FUND
PORTFOLIO OF INVESTMENTS (continued)
February 28, 2015
Notes to Portfolio of Investments
(a) Non-income producing.
(b) Represents fair value as determined in good faith under procedures approved by the Board of Trustees. At February 28, 2015, the value of these securities amounted to $37,129, which represents 0.02% of net assets.
(c) As defined in the Investment Company Act of 1940, an affiliated company is one in which the Fund owns 5% or more of the company's outstanding voting securities, or a company which is under common ownership or control with the Fund. Holdings and transactions in these affiliated companies during the year ended February 28, 2015, are as follows:
| Issuer | | Beginning
Cost ($) | | Purchase
Cost ($) | | Proceeds
From Sales ($) | | Ending
Cost ($) | | Dividends —
Affiliated
Issuers ($) | | Value ($) | |
Columbia Short-Term Cash Fund* | | | 1,008,820 | | | | 61,560,490 | | | | (62,569,310 | ) | | | — | | | | 885 | | | | — | | |
* Issuer was not an affiliate for the entire year ended February 28, 2015.
Abbreviation Legend
ADR American Depositary Receipt
Currency Legend
AUD Australian Dollar
CAD Canadian Dollar
DKK Danish Krone
GBP British Pound
ILS Israeli Shekel
JPY Japanese Yen
KRW Korean Won
NOK Norwegian Krone
NZD New Zealand Dollar
SEK Swedish Krona
SGD Singapore Dollar
TWD Taiwan Dollar
USD US Dollar
Fair Value Measurements
Generally accepted accounting principles (GAAP) require disclosure regarding the inputs and valuation techniques used to measure fair value and any changes in valuation inputs or techniques. In addition, investments shall be disclosed by major category.
The Fund categorizes its fair value measurements according to a three-level hierarchy that maximizes the use of observable inputs and minimizes the use of unobservable inputs by prioritizing that the most observable input be used when available. Observable inputs are those that market participants would use in pricing an investment based on market data obtained from sources independent of the reporting entity. Unobservable inputs are those that reflect the Fund's assumptions about the information market participants would use in pricing an investment. An investment's level within the fair value hierarchy is based on the lowest level of any input that is deemed significant to the asset or liability's fair value measurement. The input levels are not necessarily an indication of the risk or liquidity associated with investments at that level. For example, certain U.S. government securities are generally high quality and liquid, however, they are reflected as Level 2 because the inputs used to determine fair value may not always be quoted prices in an active market.
Fair value inputs are summarized in the three broad levels listed below:
> Level 1 — Valuations based on quoted prices for investments in active markets that the Fund has the ability to access at the measurement date (including NAV for open-end mutual funds). Valuation adjustments are not applied to Level 1 investments.
> Level 2 — Valuations based on other significant observable inputs (including quoted prices for similar securities, interest rates, prepayment speeds, credit risks, etc.).
The accompanying Notes to Financial Statements are an integral part of this statement.
Annual Report 2015
12
COLUMBIA INTERNATIONAL VALUE FUND
PORTFOLIO OF INVESTMENTS (continued)
February 28, 2015
Fair Value Measurements (continued)
> Level 3 — Valuations based on significant unobservable inputs (including the Fund's own assumptions and judgment in determining the fair value of investments).
Inputs that are used in determining fair value of an investment may include price information, credit data, volatility statistics, and other factors. These inputs can be either observable or unobservable. The availability of observable inputs can vary between investments, and is affected by various factors such as the type of investment, and the volume and level of activity for that investment or similar investments in the marketplace. The inputs will be considered by the Investment Manager, along with any other relevant factors in the calculation of an investment's fair value. The Fund uses prices and inputs that are current as of the measurement date, which may include periods of market dislocations. During these periods, the availability of prices and inputs may be reduced for many investments. This condition could cause an investment to be reclassified between the various levels within the hierarchy.
Foreign equity securities actively traded in markets where there is a significant delay in the local close relative to the New York Stock Exchange (NYSE) are classified as Level 2. The values of these securities may include an adjustment to reflect the impact of significant market movements following the close of local trading, as described in Note 2 to the financial statements — Security Valuation.
Investments falling into the Level 3 category are primarily supported by quoted prices from brokers and dealers participating in the market for those investments. However, these may be classified as Level 3 investments due to lack of market transparency and corroboration to support these quoted prices. Additionally, valuation models may be used as the pricing source for any remaining investments classified as Level 3. These models may rely on one or more significant unobservable inputs and/or significant assumptions by the Investment Manager. Inputs used in valuations may include, but are not limited to, financial statement analysis, capital account balances, discount rates and estimated cash flows, and comparable company data.
Under the direction of the Fund's Board of Trustees (the Board), the Investment Manager's Valuation Committee (the Committee) is responsible for overseeing the valuation procedures approved by the Board. The Committee consists of voting and non-voting members from various groups within the Investment Manager's organization, including operations and accounting, trading and investments, compliance, risk management and legal.
The Committee meets at least monthly to review and approve valuation matters, which may include a description of specific valuation determinations, data regarding pricing information received from approved pricing vendors and brokers and the results of Board-approved valuation control policies and procedures (the Policies). The Policies address, among other things, instances when market quotations are or are not readily available, including recommendations of third party pricing vendors and a determination of appropriate pricing methodologies; events that require specific valuation determinations and assessment of fair value techniques; securities with a potential for stale pricing, including those that are illiquid, restricted, or in default; and the effectiveness of third party pricing vendors, including periodic reviews of vendors. The Committee meets more frequently, as needed, to discuss additional valuation matters, which may include the need to review back-testing results, review time-sensitive information or approve related valuation actions. The Committee reports to the Board, with members of the Committee meeting with the Board at each of its regularly scheduled meetings to discuss valuation matters and actions during the period, similar to those described earlier.
For investments categorized as Level 3, the Committee monitors information similar to that described above, which may include: (i) data specific to the issuer or comparable issuers, (ii) general market or specific sector news and (iii) quoted prices and specific or similar security transactions. The Committee considers this data and any changes from prior periods in order to assess the reasonableness of observable and unobservable inputs, any assumptions or internal models used to value those securities and changes in fair value. This data is also used to corroborate, when available, information received from approved pricing vendors and brokers. Various factors impact the frequency of monitoring this information (which may occur as often as daily). However, the Committee may determine that changes to inputs, assumptions and models are not required as a result of the monitoring procedures performed.
The following table is a summary of the inputs used to value the Fund's investments at February 28, 2015:
Description | | Level 1
Quoted Prices in Active
Markets for Identical
Assets ($) | |
Level 2
Other Significant
Observable Inputs ($) | |
Level 3
Significant
Unobservable Inputs ($) | |
Total ($) | |
Equity Securities | |
Common Stocks | |
Consumer Discretionary | | | — | | | | 24,351,867 | | | | — | | | | 24,351,867 | | |
Consumer Staples | | | — | | | | 6,841,221 | | | | — | | | | 6,841,221 | | |
Energy | | | — | | | | 16,527,662 | | | | — | | | | 16,527,662 | | |
Financials | | | — | | | | 63,539,665 | | | | 37,129 | | | | 63,576,794 | | |
Health Care | | | 6,428,195 | | | | 8,856,852 | | | | — | | | | 15,285,047 | | |
The accompanying Notes to Financial Statements are an integral part of this statement.
Annual Report 2015
13
COLUMBIA INTERNATIONAL VALUE FUND
PORTFOLIO OF INVESTMENTS (continued)
February 28, 2015
Fair Value Measurements (continued)
Description | | Level 1
Quoted Prices in Active
Markets for Identical
Assets ($) | |
Level 2
Other Significant
Observable Inputs ($) | |
Level 3
Significant
Unobservable Inputs ($) | |
Total ($) | |
Industrials | | | — | | | | 14,462,904 | | | | — | | | | 14,462,904 | | |
Information Technology | | | — | | | | 12,979,793 | | | | — | | | | 12,979,793 | | |
Materials | | | 906,105 | | | | 7,415,609 | | | | — | | | | 8,321,714 | | |
Telecommunication Services | | | — | | | | 10,018,082 | | | | — | | | | 10,018,082 | | |
Utilities | | | — | | | | 7,440,921 | | | | — | | | | 7,440,921 | | |
Exchange-Traded Funds | | | 5,033,165 | | | | — | | | | — | | | | 5,033,165 | | |
Total Equity Securities | | | 12,367,465 | | | | 172,434,576 | | | | 37,129 | | | | 184,839,170 | | |
Investments in Securities | | | 12,367,465 | | | | 172,434,576 | | | | 37,129 | | | | 184,839,170 | | |
Derivatives | |
Assets | |
Forward Foreign Currency Exchange
Contracts | | | — | | | | 299,626 | | | | — | | | | 299,626 | | |
Liabilities | |
Forward Foreign Currency Exchange
Contracts | | | — | | | | (41,273 | ) | | | — | | | | (41,273 | ) | |
Total | | | 12,367,465 | | | | 172,692,929 | | | | 37,129 | | | | 185,097,523 | | |
See the Portfolio of Investments for all investment classifications not indicated in the table.
The Fund's assets assigned to the Level 2 input category are generally valued using the market approach, in which a security's value is determined through reference to prices and information from market transactions for similar or identical assets. These assets include certain foreign securities for which a third party statistical pricing service may be employed for purposes of fair market valuation. The model utilized by such third party statistical pricing service takes into account a security's correlation to available market data including, but not limited to, intraday index, ADR, and ETF movements.
There were no transfers of financial assets between levels during the period.
Derivative instruments are valued at unrealized appreciation (depreciation).
The Fund does not hold any significant investments with unobservable inputs which are categorized as Level 3.
The Fund's assets assigned to the Level 3 category are valued utilizing the valuation technique deemed the most appropriate in the circumstances. Certain common stocks classified as Level 3 securities are valued using the market approach. To determine fair value for these securities, management considered various factors which may have included, but were not limited to, the closing prices of similar securities from the issuer and quoted bids from market participants.
The accompanying Notes to Financial Statements are an integral part of this statement.
Annual Report 2015
14
COLUMBIA INTERNATIONAL VALUE FUND
STATEMENT OF ASSETS AND LIABILITIES
February 28, 2015
Assets | |
Investments, at value | |
(identified cost $179,706,185) | | $ | 184,839,170 | | |
Unrealized appreciation on forward foreign currency exchange contracts | | | 299,626 | | |
Receivable for: | |
Investments sold | | | 15,055,773 | | |
Capital shares sold | | | 338,088 | | |
Dividends | | | 378,331 | | |
Reclaims | | | 1,022,620 | | |
Expense reimbursement due from Investment Manager | | | 631 | | |
Prepaid expenses | | | 1,664 | | |
Total assets | | | 201,935,903 | | |
Liabilities | |
Disbursements in excess of cash | | | 144,438 | | |
Unrealized depreciation on forward foreign currency exchange contracts | | | 41,273 | | |
Payable for: | |
Investments purchased | | | 7,137,284 | | |
Capital shares purchased | | | 437,523 | | |
Collateral and deposits | | | 6,100,000 | | |
Investment management fees | | | 4,059 | | |
Distribution and/or service fees | | | 1,188 | | |
Transfer agent fees | | | 65,658 | | |
Administration fees | | | 411 | | |
Compensation of board members | | | 127,361 | | |
Other expenses | | | 75,591 | | |
Total liabilities | | | 14,134,786 | | |
Net assets applicable to outstanding capital stock | | $ | 187,801,117 | | |
Represented by | |
Paid-in capital | | $ | 729,096,721 | | |
Excess of distributions over net investment income | | | (520,986 | ) | |
Accumulated net realized loss | | | (546,012,869 | ) | |
Unrealized appreciation (depreciation) on: | |
Investments | | | 5,132,985 | | |
Foreign currency translations | | | (153,087 | ) | |
Forward foreign currency exchange contracts | | | 258,353 | | |
Total — representing net assets applicable to outstanding capital stock | | $ | 187,801,117 | | |
The accompanying Notes to Financial Statements are an integral part of this statement.
Annual Report 2015
15
COLUMBIA INTERNATIONAL VALUE FUND
STATEMENT OF ASSETS AND LIABILITIES (continued)
February 28, 2015
Class A | |
Net assets | | $ | 83,340,271 | | |
Shares outstanding | | | 5,762,506 | | |
Net asset value per share | | $ | 14.46 | | |
Maximum offering price per share(a) | | $ | 15.34 | | |
Class B | |
Net assets | | $ | 257,183 | | |
Shares outstanding | | | 18,518 | | |
Net asset value per share | | $ | 13.89 | | |
Class C | |
Net assets | | $ | 22,207,055 | | |
Shares outstanding | | | 1,604,719 | | |
Net asset value per share | | $ | 13.84 | | |
Class I | |
Net assets | | $ | 2,328 | | |
Shares outstanding | | | 166 | | |
Net asset value per share | | $ | 14.02 | | |
Class R | |
Net assets | | $ | 260,386 | | |
Shares outstanding | | | 17,986 | | |
Net asset value per share | | $ | 14.48 | | |
Class R4 | |
Net assets | | $ | 2,673,939 | | |
Shares outstanding | | | 180,846 | | |
Net asset value per share | | $ | 14.79 | | |
Class R5 | |
Net assets | | $ | 354,939 | | |
Shares outstanding | | | 24,026 | | |
Net asset value per share | | $ | 14.77 | | |
Class Z | |
Net assets | | $ | 78,705,016 | | |
Shares outstanding | | | 5,376,735 | | |
Net asset value per share | | $ | 14.64 | | |
(a) The maximum offering price per share is calculated by dividing the net asset value per share by 1.0 minus the maximum sales charge of 5.75%.
The accompanying Notes to Financial Statements are an integral part of this statement.
Annual Report 2015
16
COLUMBIA INTERNATIONAL VALUE FUND
STATEMENT OF OPERATIONS
Year Ended February 28, 2015
Net investment income | |
Income: | |
Dividends — unaffiliated issuers | | $ | 9,615,275 | | |
Dividends — affiliated issuers | | | 885 | | |
Interest | | | 2,728 | | |
Foreign taxes withheld | | | (995,144 | ) | |
Total income | | | 8,623,744 | | |
Expenses: | |
Investment management fees | | | 1,809,257 | | |
Distribution and/or service fees | |
Class A | | | 243,787 | | |
Class B | | | 3,548 | | |
Class C | | | 239,951 | | |
Class R | | | 1,131 | | |
Transfer agent fees | |
Class A | | | 193,045 | | |
Class B | | | 698 | | |
Class C | | | 47,608 | | |
Class R | | | 454 | | |
Class R4 | | | 4,670 | | |
Class R5 | | | 718 | | |
Class Z | | | 203,781 | | |
Administration fees | | | 183,216 | | |
Compensation of board members | | | 21,826 | | |
Custodian fees | | | 77,085 | | |
Printing and postage fees | | | 47,880 | | |
Registration fees | | | 90,952 | | |
Professional fees | | | 66,372 | | |
Line of credit interest expense | | | 948 | | |
Other | | | 12,112 | | |
Total expenses | | | 3,249,039 | | |
Fees waived or expenses reimbursed by Investment Manager and its affiliates | | | (89,781 | ) | |
Expense reductions | | | (701 | ) | |
Total net expenses | | | 3,158,557 | | |
Net investment income | | | 5,465,187 | | |
Realized and unrealized gain (loss) — net | |
Net realized gain (loss) on: | |
Investments | | | 14,472,058 | | |
Foreign currency translations | | | (83,117 | ) | |
Forward foreign currency exchange contracts | | | (860,564 | ) | |
Options contracts written | | | 24,771 | | |
Net realized gain | | | 13,553,148 | | |
Net change in unrealized appreciation (depreciation) on: | |
Investments | | | (27,382,905 | ) | |
Foreign currency translations | | | (220,264 | ) | |
Forward foreign currency exchange contracts | | | 27,412 | | |
Net change in unrealized depreciation | | | (27,575,757 | ) | |
Net realized and unrealized loss | | | (14,022,609 | ) | |
Net decrease in net assets from operations | | $ | (8,557,422 | ) | |
The accompanying Notes to Financial Statements are an integral part of this statement.
Annual Report 2015
17
COLUMBIA INTERNATIONAL VALUE FUND
STATEMENT OF CHANGES IN NET ASSETS
| | | Year Ended
February 28,
2015 | | Year Ended
February 28,
2014 | |
Operations | |
Net investment income | | $ | 5,465,187 | | | $ | 14,016,532 | | |
Net realized gain (loss) | | | 13,553,148 | | | | (26,406,641 | ) | |
Net change in unrealized appreciation (depreciation) | | | (27,575,757 | ) | | | 113,296,382 | | |
Net increase (decrease) in net assets resulting from operations | | | (8,557,422 | ) | | | 100,906,273 | | |
Distributions to shareholders | |
Net investment income | |
Class A | | | (3,697,826 | ) | | | (5,224,071 | ) | |
Class B | | | (10,683 | ) | | | (21,115 | ) | |
Class C | | | (777,041 | ) | | | (1,104,350 | ) | |
Class I | | | (106 | ) | | | (136 | ) | |
Class R | | | (8,896 | ) | | | (7,978 | ) | |
Class R4 | | | (104,695 | ) | | | (88,546 | ) | |
Class R5 | | | (47,879 | ) | | | (412,230 | ) | |
Class Z | | | (3,996,745 | ) | | | (6,141,628 | ) | |
Total distributions to shareholders | | | (8,643,871 | ) | | | (13,000,054 | ) | |
Decrease in net assets from capital stock activity | | | (67,334,364 | ) | | | (465,549,679 | ) | |
Total decrease in net assets | | | (84,535,657 | ) | | | (377,643,460 | ) | |
Net assets at beginning of year | | | 272,336,774 | | | | 649,980,234 | | |
Net assets at end of year | | $ | 187,801,117 | | | $ | 272,336,774 | | |
Undistributed (excess of distributions over) net investment income | | $ | (520,986 | ) | | $ | 2,610,510 | | |
The accompanying Notes to Financial Statements are an integral part of this statement.
Annual Report 2015
18
COLUMBIA INTERNATIONAL VALUE FUND
STATEMENT OF CHANGES IN NET ASSETS (continued)
| | | Year Ended February 28, 2015 | | Year Ended February 28, 2014 | |
| | | Shares | | Dollars ($) | | Shares | | Dollars ($) | |
Capital stock activity | |
Class A shares | |
Subscriptions(a) | | | 1,011,605 | | | | 14,742,889 | | | | 1,646,238 | | | | 21,934,027 | | |
Distributions reinvested | | | 194,023 | | | | 2,775,884 | | | | 253,224 | | | | 3,717,336 | | |
Redemptions | | | (2,748,762 | ) | | | (40,415,599 | ) | | | (7,741,276 | ) | | | (109,208,073 | ) | |
Net decrease | | | (1,543,134 | ) | | | (22,896,826 | ) | | | (5,841,814 | ) | | | (83,556,710 | ) | |
Class B shares | |
Subscriptions | | | 647 | | | | 9,424 | | | | 5,057 | | | | 62,262 | | |
Distributions reinvested | | | 670 | | | | 9,296 | | | | 1,315 | | | | 18,578 | | |
Redemptions(a) | | | (13,105 | ) | | | (182,047 | ) | | | (17,876 | ) | | | (246,890 | ) | |
Net decrease | | | (11,788 | ) | | | (163,327 | ) | | | (11,504 | ) | | | (166,050 | ) | |
Class C shares | |
Subscriptions | | | 177,327 | | | | 2,490,130 | | | | 155,209 | | | | 1,704,861 | | |
Distributions reinvested | | | 38,021 | | | | 522,484 | | | | 52,538 | | | | 739,728 | | |
Redemptions | | | (404,112 | ) | | | (5,669,227 | ) | | | (535,264 | ) | | | (7,344,198 | ) | |
Net decrease | | | (188,764 | ) | | | (2,656,613 | ) | | | (327,517 | ) | | | (4,899,609 | ) | |
Class I shares | |
Redemptions | | | (13 | ) | | | (197 | ) | | | — | | | | — | | |
Net increase (decrease) | | | (13 | ) | | | (197 | ) | | | — | | | | — | | |
Class R shares | |
Subscriptions | | | 6,241 | | | | 91,361 | | | | 5,216 | | | | 74,673 | | |
Distributions reinvested | | | 626 | | | | 8,896 | | | | 534 | | | | 7,855 | | |
Redemptions | | | (2,072 | ) | | | (30,083 | ) | | | (175 | ) | | | (2,553 | ) | |
Net increase | | | 4,795 | | | | 70,174 | | | | 5,575 | | | | 79,975 | | |
Class R4 shares | |
Subscriptions | | | 108,014 | | | | 1,602,547 | | | | 145,365 | | | | 2,230,240 | | |
Distributions reinvested | | | 7,238 | | | | 104,595 | | | | 5,901 | | | | 88,398 | | |
Redemptions | | | (64,715 | ) | | | (940,624 | ) | | | (21,157 | ) | | | (329,483 | ) | |
Net increase | | | 50,537 | | | | 766,518 | | | | 130,109 | | | | 1,989,155 | | |
Class R5 shares | |
Subscriptions | | | 5,257 | | | | 80,287 | | | | 604,487 | | | | 8,276,537 | | |
Distributions reinvested | | | 3,266 | | | | 47,776 | | | | 27,527 | | | | 412,080 | | |
Redemptions | | | (198,036 | ) | | | (3,025,348 | ) | | | (471,617 | ) | | | (7,257,758 | ) | |
Net increase (decrease) | | | (189,513 | ) | | | (2,897,285 | ) | | | 160,397 | | | | 1,430,859 | | |
Class Z shares | |
Subscriptions | | | 1,474,144 | | | | 22,311,927 | | | | 3,622,263 | | | | 49,175,543 | | |
Distributions reinvested | | | 231,084 | | | | 3,350,698 | | | | 338,804 | | | | 5,027,852 | | |
Redemptions | | | (4,332,826 | ) | | | (65,219,433 | ) | | | (30,882,263 | ) | | | (434,630,694 | ) | |
Net decrease | | | (2,627,598 | ) | | | (39,556,808 | ) | | | (26,921,196 | ) | | | (380,427,299 | ) | |
Total net decrease | | | (4,505,478 | ) | | | (67,334,364 | ) | | | (32,805,950 | ) | | | (465,549,679 | ) | |
(a) Includes conversions of Class B shares to Class A shares, if any.
The accompanying Notes to Financial Statements are an integral part of this statement.
Annual Report 2015
19
COLUMBIA INTERNATIONAL VALUE FUND
The following tables are intended to help you understand the Fund's financial performance. Certain information reflects financial results for a single share of a class held for the periods shown. The per share amounts and percentages reflect income and expenses assuming inclusion of the Fund's proportionate share of the income and expenses of Columbia International Value Master Portfolio for all periods prior to the Fund's conversion to a stand-alone fund after the close of business on December 13, 2013. Per share net investment income (loss) amounts are calculated based on average shares outstanding during the period. Total return assumes reinvestment of all dividends and distributions, if any. Total return does not reflect payment of sales charges, if any. Total return and portfolio turnover are not annualized for periods of less than one year. The portfolio turnover rate is calculated without regard to purchase and sales transactions of short-term instruments and certain derivatives, if any. If such transactions were included, the Fund's portfolio turnover rate may be higher.
| | | Year Ended February 28, | | Year Ended
February 29, | | Year Ended
February 28, | |
Class A | | 2015 | | 2014 | | 2013 | | 2012 | | 2011 | |
Per share data | |
Net asset value, beginning of period | | $ | 15.55 | | | $ | 12.85 | | | $ | 13.14 | | | $ | 15.12 | | | $ | 13.48 | | |
Income from investment operations: | |
Net investment income | | | 0.34 | | | | 0.41 | | | | 0.39 | | | | 0.39 | | | | 0.22 | | |
Net realized and unrealized gain (loss) | | | (0.85 | ) | | | 3.00 | | | | (0.20 | ) | | | (1.88 | ) | | | 1.81 | | |
Total from investment operations | | | (0.51 | ) | | | 3.41 | | | | 0.19 | | | | (1.49 | ) | | | 2.03 | | |
Less distributions to shareholders: | |
Net investment income | | | (0.58 | ) | | | (0.71 | ) | | | (0.46 | ) | | | (0.49 | ) | | | (0.39 | ) | |
Tax return of capital | | | — | | | | — | | | | (0.02 | ) | | | — | | | | — | | |
Total distributions to shareholders | | | (0.58 | ) | | | (0.71 | ) | | | (0.48 | ) | | | (0.49 | ) | | | (0.39 | ) | |
Proceeds from regulatory settlements | | | — | | | | — | | | | — | | | | 0.00 | (a) | | | 0.00 | (a) | |
Net asset value, end of period | | $ | 14.46 | | | $ | 15.55 | | | $ | 12.85 | | | $ | 13.14 | | | $ | 15.12 | | |
Total return | | | (3.19 | %) | | | 26.87 | % | | | 1.56 | % | | | (9.51 | %) | | | 15.47 | % | |
Ratios to average net assets(b) | |
Total gross expenses | | | 1.46 | %(c) | | | 1.48 | %(c) | | | 1.57 | %(c) | | | 1.53 | %(c) | | | 1.48 | %(c) | |
Total net expenses(d) | | | 1.42 | %(c)(e) | | | 1.43 | %(c)(e) | | | 1.43 | %(c)(e) | | | 1.41 | %(c)(e) | | | 1.48 | %(c)(e) | |
Net investment income | | | 2.31 | % | | | 2.85 | % | | | 3.09 | % | | | 2.87 | % | | | 1.61 | % | |
Supplemental data | |
Net assets, end of period (in thousands) | | $ | 83,340 | | | $ | 113,594 | | | $ | 168,944 | | | $ | 225,747 | | | $ | 367,847 | | |
Portfolio turnover | | | 80 | % | | | 14 | %(f) | | | — | % | | | — | % | | | — | % | |
Portfolio turnover of Columbia International Value Fund
Master Portfolio | | | — | % | | | 100 | %(g) | | | 13 | % | | | 16 | % | | | 7 | % | |
Notes to Financial Highlights
(a) Rounds to zero.
(b) In addition to the fees and expenses that the Fund bears directly, the Fund indirectly bears a pro rata share of the fees and expenses of any other funds in which it invests. Such indirect expenses are not included in the Fund's reported expense ratios.
(c) Ratios include line of credit interest expense which is less than 0.01%.
(d) Total net expenses include the impact of certain fee waivers/expense reimbursements made by the Investment Manager and certain of its affiliates, if applicable.
(e) The benefits derived from expense reductions had an impact of less than 0.01%.
(f) Amount represents results after the Fund's conversion to a stand-alone structure.
(g) Amount represents results prior to the Fund's conversion to a stand-alone structure.
The accompanying Notes to Financial Statements are an integral part of this statement.
Annual Report 2015
20
COLUMBIA INTERNATIONAL VALUE FUND
FINANCIAL HIGHLIGHTS (continued)
| | | Year Ended February 28, | | Year Ended
February 29, | | Year Ended
February 28, | |
Class B | | 2015 | | 2014 | | 2013 | | 2012 | | 2011 | |
Per share data | |
Net asset value, beginning of period | | $ | 14.95 | | | $ | 12.39 | | | $ | 12.68 | | | $ | 14.61 | | | $ | 13.02 | | |
Income from investment operations: | |
Net investment income | | | 0.24 | | | | 0.26 | | | | 0.29 | | | | 0.27 | | | | 0.21 | | |
Net realized and unrealized gain (loss) | | | (0.83 | ) | | | 2.92 | | | | (0.19 | ) | | | (1.81 | ) | | | 1.67 | | |
Total from investment operations | | | (0.59 | ) | | | 3.18 | | | | 0.10 | | | | (1.54 | ) | | | 1.88 | | |
Less distributions to shareholders: | |
Net investment income | | | (0.47 | ) | | | (0.62 | ) | | | (0.38 | ) | | | (0.39 | ) | | | (0.29 | ) | |
Tax return of capital | | | — | | | | — | | | | (0.01 | ) | | | — | | | | — | | |
Total distributions to shareholders | | | (0.47 | ) | | | (0.62 | ) | | | (0.39 | ) | | | (0.39 | ) | | | (0.29 | ) | |
Proceeds from regulatory settlements | | | — | | | | — | | | | — | | | | 0.00 | (a) | | | 0.00 | (a) | |
Net asset value, end of period | | $ | 13.89 | | | $ | 14.95 | | | $ | 12.39 | | | $ | 12.68 | | | $ | 14.61 | | |
Total return | | | (3.91 | %) | | | 25.96 | % | | | 0.84 | % | | | (10.28 | %) | | | 14.75 | % | |
Ratios to average net assets(b) | |
Total gross expenses | | | 2.20 | %(c) | | | 2.23 | %(c) | | | 2.32 | %(c) | | | 2.27 | %(c) | | | 2.23 | %(c) | |
Total net expenses(d) | | | 2.17 | %(c)(e) | | | 2.17 | %(c)(e) | | | 2.18 | %(c)(e) | | | 2.16 | %(c)(e) | | | 2.23 | %(c)(e) | |
Net investment income | | | 1.69 | % | | | 1.85 | % | | | 2.41 | % | | | 2.05 | % | | | 1.62 | % | |
Supplemental data | |
Net assets, end of period (in thousands) | | $ | 257 | | | $ | 453 | | | $ | 518 | | | $ | 807 | | | $ | 1,437 | | |
Portfolio turnover | | | 80 | % | | | 14 | %(f) | | | — | % | | | — | % | | | — | % | |
Portfolio turnover of Columbia International Value Fund
Master Portfolio | | | — | % | | | 100 | %(g) | | | 13 | % | | | 16 | % | | | 7 | % | |
Notes to Financial Highlights
(a) Rounds to zero.
(b) In addition to the fees and expenses that the Fund bears directly, the Fund indirectly bears a pro rata share of the fees and expenses of any other funds in which it invests. Such indirect expenses are not included in the Fund's reported expense ratios.
(c) Ratios include line of credit interest expense which is less than 0.01%.
(d) Total net expenses include the impact of certain fee waivers/expense reimbursements made by the Investment Manager and certain of its affiliates, if applicable.
(e) The benefits derived from expense reductions had an impact of less than 0.01%.
(f) Amount represents results after the Fund's conversion to a stand-alone structure.
(g) Amount represents results prior to the Fund's conversion to a stand-alone structure.
The accompanying Notes to Financial Statements are an integral part of this statement.
Annual Report 2015
21
COLUMBIA INTERNATIONAL VALUE FUND
FINANCIAL HIGHLIGHTS (continued)
| | | Year Ended February 28, | | Year Ended
February 29, | | Year Ended
February 28, | |
Class C | | 2015 | | 2014 | | 2013 | | 2012 | | 2011 | |
Per share data | |
Net asset value, beginning of period | | $ | 14.89 | | | $ | 12.35 | | | $ | 12.64 | | | $ | 14.56 | | | $ | 12.99 | | |
Income from investment operations: | |
Net investment income | | | 0.22 | | | | 0.26 | | | | 0.28 | | | | 0.27 | | | | 0.12 | | |
Net realized and unrealized gain (loss) | | | (0.80 | ) | | | 2.90 | | | | (0.18 | ) | | | (1.80 | ) | | | 1.74 | | |
Total from investment operations | | | (0.58 | ) | | | 3.16 | | | | 0.10 | | | | (1.53 | ) | | | 1.86 | | |
Less distributions to shareholders: | |
Net investment income | | | (0.47 | ) | | | (0.62 | ) | | | (0.38 | ) | | | (0.39 | ) | | | (0.29 | ) | |
Tax return of capital | | | — | | | | — | | | | (0.01 | ) | | | — | | | | — | | |
Total distributions to shareholders | | | (0.47 | ) | | | (0.62 | ) | | | (0.39 | ) | | | (0.39 | ) | | | (0.29 | ) | |
Proceeds from regulatory settlements | | | — | | | | — | | | | — | | | | 0.00 | (a) | | | 0.00 | (a) | |
Net asset value, end of period | | $ | 13.84 | | | $ | 14.89 | | | $ | 12.35 | | | $ | 12.64 | | | $ | 14.56 | | |
Total return | | | (3.86 | %) | | | 25.88 | % | | | 0.85 | % | | | (10.24 | %) | | | 14.62 | % | |
Ratios to average net assets(b) | |
Total gross expenses | | | 2.21 | %(c) | | | 2.23 | %(c) | | | 2.32 | %(c) | | | 2.28 | %(c) | | | 2.23 | %(c) | |
Total net expenses(d) | | | 2.17 | %(c)(e) | | | 2.17 | %(c)(e) | | | 2.18 | %(c)(e) | | | 2.16 | %(c)(e) | | | 2.23 | %(c)(e) | |
Net investment income | | | 1.54 | % | | | 1.91 | % | | | 2.35 | % | | | 2.10 | % | | | 0.89 | % | |
Supplemental data | |
Net assets, end of period (in thousands) | | $ | 22,207 | | | $ | 26,710 | | | $ | 26,193 | | | $ | 34,910 | | | $ | 57,793 | | |
Portfolio turnover | | | 80 | % | | | 14 | (f) | | | — | % | | | — | % | | | — | % | |
Portfolio turnover of Columbia International Value
Master Portfolio | | | — | % | | | 100 | %(g) | | | 13 | % | | | 16 | % | | | 7 | % | |
Notes to Financial Highlights
(a) Rounds to zero.
(b) In addition to the fees and expenses that the Fund bears directly, the Fund indirectly bears a pro rata share of the fees and expenses of any other funds in which it invests. Such indirect expenses are not included in the Fund's reported expense ratios.
(c) Ratios include line of credit interest expense which is less than 0.01%.
(d) Total net expenses include the impact of certain fee waivers/expense reimbursements made by the Investment Manager and certain of its affiliates, if applicable.
(e) The benefits derived from expense reductions had an impact of less than 0.01%.
(f) Amount represents results after the Fund's conversion to a stand-alone structure.
(g) Amount represents results prior to the Fund's conversion to a stand-alone structure.
The accompanying Notes to Financial Statements are an integral part of this statement.
Annual Report 2015
22
COLUMBIA INTERNATIONAL VALUE FUND
FINANCIAL HIGHLIGHTS (continued)
| | | Year Ended February 28, | | Year Ended
February 29, | | Year Ended
February 28, | |
Class I | | 2015 | | 2014 | | 2013 | | 2012 | | 2011(a) | |
Per share data | |
Net asset value, beginning of period | | $ | 15.09 | | | $ | 12.48 | | | $ | 12.77 | | | $ | 15.27 | | | $ | 13.93 | | |
Income from investment operations: | |
Net investment income (loss) | | | 0.38 | | | | 0.42 | | | | 0.40 | | | | 0.70 | | | | (0.00 | )(b) | |
Net realized and unrealized gain (loss) | | | (0.81 | ) | | | 2.95 | | | | (0.16 | ) | | | (2.65 | ) | | | 1.67 | | |
Total from investment operations | | | (0.43 | ) | | | 3.37 | | | | 0.24 | | | | (1.95 | ) | | | 1.67 | | |
Less distributions to shareholders: | |
Net investment income | | | (0.64 | ) | | | (0.76 | ) | | | (0.51 | ) | | | (0.55 | ) | | | (0.33 | ) | |
Tax return of capital | | | — | | | | — | | | | (0.02 | ) | | | — | | | | — | | |
Total distributions to shareholders | | | (0.64 | ) | | | (0.76 | ) | | | (0.53 | ) | | | (0.55 | ) | | | (0.33 | ) | |
Proceeds from regulatory settlements | | | — | | | | — | | | | — | | | | 0.00 | (b) | | | 0.00 | (b) | |
Net asset value, end of period | | $ | 14.02 | | | $ | 15.09 | | | $ | 12.48 | | | $ | 12.77 | | | $ | 15.27 | | |
Total return | | | (2.74 | %) | | | 27.35 | % | | | 2.00 | % | | | (12.47 | %) | | | 12.22 | % | |
Ratios to average net assets(c) | |
Total gross expenses | | | 1.03 | %(d) | | | 1.00 | %(d) | | | 1.13 | %(d) | | | 1.06 | %(d) | | | 1.07 | %(d)(e) | |
Total net expenses(f) | | | 1.03 | %(d) | | | 0.99 | %(d) | | | 1.04 | %(d) | | | 1.06 | %(d)(g) | | | 1.07 | %(d)(e)(g) | |
Net investment income (loss) | | | 2.66 | % | | | 3.00 | % | | | 3.31 | % | | | 4.77 | % | | | (0.05 | %)(e) | |
Supplemental data | |
Net assets, end of period (in thousands) | | $ | 2 | | | $ | 3 | | | $ | 2 | | | $ | 2 | | | $ | 34,506 | | |
Portfolio turnover | | | 80 | % | | | 14 | %(h) | | | — | % | | | — | % | | | — | % | |
Portfolio turnover of Columbia International Value
Master Portfolio | | | — | % | | | 100 | %(i) | | | 13 | % | | | 16 | % | | | 7 | % | |
Notes to Financial Highlights
(a) Based on operations from September 27, 2010 (commencement of operations) through the stated period end.
(b) Rounds to zero.
(c) In addition to the fees and expenses that the Fund bears directly, the Fund indirectly bears a pro rata share of the fees and expenses of any other funds in which it invests. Such indirect expenses are not included in the Fund's reported expense ratios.
(d) Ratios include line of credit interest expense which is less than 0.01%.
(e) Annualized.
(f) Total net expenses include the impact of certain fee waivers/expense reimbursements made by the Investment Manager and certain of its affiliates, if applicable.
(g) The benefits derived from expense reductions had an impact of less than 0.01%.
(h) Amount represents results after the Fund's conversion to a stand-alone structure.
(i) Amount represents results prior to the Fund's conversion to a stand-alone structure.
The accompanying Notes to Financial Statements are an integral part of this statement.
Annual Report 2015
23
COLUMBIA INTERNATIONAL VALUE FUND
FINANCIAL HIGHLIGHTS (continued)
| | | Year Ended February 28, | | Year Ended
February 29, | | Year Ended
February 28, | |
Class R | | 2015 | | 2014 | | 2013 | | 2012 | | 2011(a) | |
Per share data | |
Net asset value, beginning of period | | $ | 15.56 | | | $ | 12.87 | | | $ | 13.15 | | | $ | 15.15 | | | $ | 13.78 | | |
Income from investment operations: | |
Net investment income | | | 0.27 | | | | 0.31 | | | | 0.15 | | | | 0.25 | | | | 0.02 | | |
Net realized and unrealized gain (loss) | | | (0.81 | ) | | | 3.06 | | | | 0.02 | (b) | | | (1.79 | ) | | | 1.60 | | |
Total from investment operations | | | (0.54 | ) | | | 3.37 | | | | 0.17 | | | | (1.54 | ) | | | 1.62 | | |
Less distributions to shareholders: | |
Net investment income | | | (0.54 | ) | | | (0.68 | ) | | | (0.44 | ) | | | (0.46 | ) | | | (0.25 | ) | |
Tax return of capital | | | — | | | | — | | | | (0.01 | ) | | | — | | | | — | | |
Total distributions to shareholders | | | (0.54 | ) | | | (0.68 | ) | | | (0.45 | ) | | | (0.46 | ) | | | (0.25 | ) | |
Proceeds from regulatory settlements | | | — | | | | — | | | | — | | | | 0.00 | (c) | | | 0.00 | (c) | |
Net asset value, end of period | | $ | 14.48 | | | $ | 15.56 | | | $ | 12.87 | | | $ | 13.15 | | | $ | 15.15 | | |
Total return | | | (3.38 | %) | | | 26.50 | % | | | 1.39 | % | | | (9.90 | %) | | | 11.92 | % | |
Ratios to average net assets(d) | |
Total gross expenses | | | 1.71 | %(e) | | | 1.71 | %(e) | | | 1.85 | %(e) | | | 1.86 | %(e) | | | 1.77 | %(e)(f) | |
Total net expenses(g) | | | 1.67 | %(e)(h) | | | 1.67 | %(e)(h) | | | 1.70 | %(e)(h) | | | 1.64 | %(e)(h) | | | 1.77 | %(e)(f)(h) | |
Net investment income | | | 1.87 | % | | | 2.13 | % | | | 1.16 | % | | | 1.94 | % | | | 0.40 | %(f) | |
Supplemental data | |
Net assets, end of period (in thousands) | | $ | 260 | | | $ | 205 | | | $ | 98 | | | $ | 8 | | | $ | 3 | | |
Portfolio turnover | | | 80 | % | | | 14 | %(i) | | | — | % | | | — | % | | | — | % | |
Portfolio turnover of Columbia International Value
Master Portfolio | | | — | % | | | 100 | %(j) | | | 13 | % | | | 16 | % | | | 7 | % | |
Notes to Financial Highlights
(a) Based on operations from September 27, 2010 (commencement of operations) through the stated period end.
(b) Calculation of the net gain (loss) per share (both realized and unrealized) does not correlate to the aggregate realized and unrealized gain (loss) presented in the Statement of Operations due to the timing of subscriptions and redemptions Fund shares in relation to fluctuations in the market value of the portfolio.
(c) Rounds to zero.
(d) In addition to the fees and expenses that the Fund bears directly, the Fund indirectly bears a pro rata share of the fees and expenses of any other funds in which it invests. Such indirect expenses are not included in the Fund's reported expense ratios.
(e) Ratios include line of credit interest expense which is less than 0.01%.
(f) Annualized.
(g) Total net expenses include the impact of certain fee waivers/expense reimbursements made by the Investment Manager and certain of its affiliates, if applicable.
(h) The benefits derived from expense reductions had an impact of less than 0.01%.
(i) Amount represents results after the Fund's conversion to a stand-alone structure.
(j) Amount represents results prior to the Fund's conversion to a stand-alone structure.
The accompanying Notes to Financial Statements are an integral part of this statement.
Annual Report 2015
24
COLUMBIA INTERNATIONAL VALUE FUND
FINANCIAL HIGHLIGHTS (continued)
| | | Year Ended February 28, | |
Class R4 | | 2015 | | 2014 | | 2013(a) | |
Per share data | |
Net asset value, beginning of period | | $ | 15.88 | | | $ | 13.10 | | | $ | 12.51 | | |
Income from investment operations: | |
Net investment income | | | 0.35 | | | | 0.30 | | | | 0.02 | | |
Net realized and unrealized gain (loss) | | | (0.82 | ) | | | 3.22 | | | | 1.05 | (b) | |
Total from investment operations | | | (0.47 | ) | | | 3.52 | | | | 1.07 | | |
Less distributions to shareholders: | |
Net investment income | | | (0.62 | ) | | | (0.74 | ) | | | (0.46 | ) | |
Tax return of capital | | | — | | | | — | | | | (0.02 | ) | |
Total distributions to shareholders | | | (0.62 | ) | | | (0.74 | ) | | | (0.48 | ) | |
Net asset value, end of period | | $ | 14.79 | | | $ | 15.88 | | | $ | 13.10 | | |
Total return | | | (2.87 | %) | | | 27.21 | % | | | 8.64 | % | |
Ratios to average net assets(c) | |
Total gross expenses | | | 1.21 | %(d) | | | 1.25 | %(d) | | | 1.31 | %(d)(e) | |
Total net expenses(f) | | | 1.17 | %(d)(g) | | | 1.17 | %(d)(g) | | | 1.21 | %(d)(e) | |
Net investment income | | | 2.34 | % | | | 2.09 | % | | | 0.59 | %(e) | |
Supplemental data | |
Net assets, end of period (in thousands) | | $ | 2,674 | | | $ | 2,070 | | | $ | 3 | | |
Portfolio turnover | | | 80 | % | | | 14 | %(h) | | | — | % | |
Portfolio turnover of Columbia International Value Master Portfolio | | | — | % | | | 100 | %(i) | | | 13 | % | |
Notes to Financial Highlights
(a) Based on operations from November 8, 2012 (commencement of operations) through the stated period end.
(b) Calculation of the net gain (loss) per share (both realized and unrealized) does not correlate to the aggregate realized and unrealized gain (loss) presented in the Statement of Operations due to the timing of subscriptions and redemptions of Fund shares in relation to fluctuations in the market value of the portfolio.
(c) In addition to the fees and expenses that the Fund bears directly, the Fund indirectly bears a pro rata share of the fees and expenses of any other funds in which it invests. Such indirect expenses are not included in the Fund's reported expense ratios.
(d) Ratios include line of credit interest expense which is less than 0.01%.
(e) Annualized.
(f) Total net expenses include the impact of certain fee waivers/expense reimbursements made by the Investment Manager and certain of its affiliates, if applicable.
(g) The benefits derived from expense reductions had an impact of less than 0.01%.
(h) Amount represents results after the Fund's conversion to a stand-alone structure.
(i) Amount represents results prior to the Fund's conversion to a stand-alone structure.
The accompanying Notes to Financial Statements are an integral part of this statement.
Annual Report 2015
25
COLUMBIA INTERNATIONAL VALUE FUND
FINANCIAL HIGHLIGHTS (continued)
| | | Year Ended February 28, | |
Class R5 | | 2015 | | 2014 | | 2013(a) | |
Per share data | |
Net asset value, beginning of period | | $ | 15.87 | | | $ | 13.09 | | | $ | 12.51 | | |
Income from investment operations: | |
Net investment income | | | 0.51 | | | | 0.37 | | | | 0.07 | | |
Net realized and unrealized gain (loss) | | | (0.97 | ) | | | 3.16 | | | | 1.00 | (b) | |
Total from investment operations | | | (0.46 | ) | | | 3.53 | | | | 1.07 | | |
Less distributions to shareholders: | |
Net investment income | | | (0.64 | ) | | | (0.75 | ) | | | (0.47 | ) | |
Tax return of capital | | | — | | | | — | | | | (0.02 | ) | |
Total distributions to shareholders | | | (0.64 | ) | | | (0.75 | ) | | | (0.49 | ) | |
Net asset value, end of period | | $ | 14.77 | | | $ | 15.87 | | | $ | 13.09 | | |
Total return | | | (2.82 | %) | | | 27.34 | % | | | 8.64 | % | |
Ratios to average net assets(c) | |
Total gross expenses | | | 1.05 | %(d) | | | 1.09 | %(d) | | | 1.28 | %(d)(e) | |
Total net expenses(f) | | | 1.05 | %(d) | | | 1.07 | %(d) | | | 1.09 | %(d)(e) | |
Net investment income | | | 3.31 | % | | | 2.49 | % | | | 1.88 | %(e) | |
Supplemental data | |
Net assets, end of period (in thousands) | | $ | 355 | | | $ | 3,388 | | | $ | 696 | | |
Portfolio turnover | | | 80 | % | | | 14 | %(g) | | | — | % | |
Portfolio turnover of Columbia International Value Master Portfolio | | | — | % | | | 100 | %(h) | | | 13 | % | |
Notes to Financial Highlights
(a) Based on operations from November 8, 2012 (commencement of operations) through the stated period end.
(b) Calculation of the net gain (loss) per share (both realized and unrealized) does not correlate to the aggregate realized and unrealized gain (loss) presented in the Statement of Operations due to the timing of subscriptions and redemptions of Fund shares in relation to fluctuations in the market value of the portfolio.
(c) In addition to the fees and expenses that the Fund bears directly, the Fund indirectly bears a pro rata share of the fees and expenses of any other funds in which it invests. Such indirect expenses are not included in the Fund's reported expense ratios.
(d) Ratios include line of credit interest expense which is less than 0.01%.
(e) Annualized.
(f) Total net expenses include the impact of certain fee waivers/expense reimbursements made by the Investment Manager and certain of its affiliates, if applicable.
(g) Amount represents results after the Fund's conversion to a stand-alone structure.
(h) Amount represents results prior to the Fund's conversion to a stand-alone structure.
The accompanying Notes to Financial Statements are an integral part of this statement.
Annual Report 2015
26
COLUMBIA INTERNATIONAL VALUE FUND
FINANCIAL HIGHLIGHTS (continued)
| | | Year Ended February 28, | | Year Ended
February 29, | | Year Ended
February 28, | |
Class Z | | 2015 | | 2014 | | 2013 | | 2012 | | 2011 | |
Per share data | |
Net asset value, beginning of period | | $ | 15.73 | | | $ | 12.99 | | | $ | 13.27 | | | $ | 15.28 | | | $ | 13.62 | | |
Income from investment operations: | |
Net investment income | | | 0.40 | | | | 0.58 | | | | 0.42 | | | | 0.42 | | | | 0.26 | | |
Net realized and unrealized gain (loss) | | | (0.87 | ) | | | 2.90 | | | | (0.19 | ) | | | (1.90 | ) | | | 1.83 | | |
Total from investment operations | | | (0.47 | ) | | | 3.48 | | | | 0.23 | | | | (1.48 | ) | | | 2.09 | | |
Less distributions to shareholders: | |
Net investment income | | | (0.62 | ) | | | (0.74 | ) | | | (0.49 | ) | | | (0.53 | ) | | | (0.43 | ) | |
Tax return of capital | | | — | | | | — | | | | (0.02 | ) | | | — | | | | — | | |
Total distributions to shareholders | | | (0.62 | ) | | | (0.74 | ) | | | (0.51 | ) | | | (0.53 | ) | | | (0.43 | ) | |
Proceeds from regulatory settlements | | | — | | | | — | | | | — | | | | 0.00 | (a) | | | 0.00 | (a) | |
Net asset value, end of period | | $ | 14.64 | | | $ | 15.73 | | | $ | 12.99 | | | $ | 13.27 | | | $ | 15.28 | | |
Total return | | | (2.91 | %) | | | 27.13 | % | | | 1.86 | % | | | (9.35 | %) | | | 15.74 | % | |
Ratios to average net assets(b) | |
Total gross expenses | | | 1.21 | %(c) | | | 1.26 | %(c) | | | 1.32 | %(c) | | | 1.27 | %(c) | | | 1.23 | %(c) | |
Total net expenses(d) | | | 1.17 | %(c)(e) | | | 1.19 | %(c)(e) | | | 1.18 | %(c)(e) | | | 1.16 | %(c)(e) | | | 1.23 | %(c)(e) | |
Net investment income | | | 2.65 | % | | | 4.05 | % | | | 3.35 | % | | | 3.09 | % | | | 1.85 | % | |
Supplemental data | |
Net assets, end of period (in thousands) | | $ | 78,705 | | | $ | 125,914 | | | $ | 453,526 | | | $ | 924,777 | | | $ | 1,277,799 | | |
Portfolio turnover | | | 80 | % | | | 14 | %(g) | | | — | % | | | — | % | | | — | % | |
Portfolio turnover of Columbia International Value Fund
Master Portfolio | | | — | % | | | 100 | (h) | | | 13 | % | | | 16 | % | | | 7 | % | |
Notes to Financial Highlights
(a) Rounds to zero.
(b) In addition to the fees and expenses that the Fund bears directly, the Fund indirectly bears a pro rata share of the fees and expenses of any other funds in which it invests. Such indirect expenses are not included in the Fund's reported expense ratios.
(c) Ratios include line of credit interest expense which is less than 0.01%.
(d) Total net expenses include the impact of certain fee waivers/expense reimbursements made by the Investment Manager and certain of its affiliates, if applicable.
(e) The benefits derived from expense reductions had an impact of less than 0.01%.
(g) Amount represents results after the Fund's conversion to a stand-alone structure.
(h) Amount represents results prior to the Fund's conversion to a stand-alone structure.
The accompanying Notes to Financial Statements are an integral part of this statement.
Annual Report 2015
27
COLUMBIA INTERNATIONAL VALUE FUND
NOTES TO FINANCIAL STATEMENTS
February 28, 2015
Note 1. Organization
Columbia International Value Fund (the Fund), a series of Columbia Funds Series Trust (the Trust), is a diversified fund. The Trust is registered under the Investment Company Act of 1940, as amended (the 1940 Act), as an open-end management investment company organized as a Delaware statutory trust.
Fund Shares
The Trust may issue an unlimited number of shares (without par value). The Fund offers Class A, Class B, Class C, Class I, Class R, Class R4, Class R5 and Class Z shares. Although all share classes generally have identical voting, dividend and liquidation rights, each share class votes separately when required by the Trust's organizational documents or by law. Different share classes pay different distribution amounts to the extent the expenses of such share classes differ, and distributions in liquidation will be proportional to the net asset value of each share class. Each share class has its own expense structure and sales charges.
Class A shares are subject to a maximum front-end sales charge of 5.75% based on the initial investment amount. Class A shares purchased without an initial sales charge in accounts aggregating $1 million to $50 million at the time of purchase are subject to a contingent deferred sales charge (CDSC) if the shares are sold within 18 months of purchase, charged as follows: 1.00% CDSC if redeemed within 12 months of purchase, and 0.50% CDSC if redeemed more than 12, but less than 18, months after purchase.
Class B shares may be subject to a maximum CDSC of 5.00% based upon the holding period after purchase. Class B shares will generally convert to Class A shares eight years after purchase. The Fund no longer accepts investments by new or existing investors in the Fund's Class B shares, except in connection with the reinvestment of any dividend and/or capital gain distributions in Class B shares of the Fund and exchanges by existing Class B shareholders of certain other funds within the Columbia Family of Funds.
Class C shares are subject to a 1.00% CDSC on shares redeemed within one year of purchase.
Class I shares are not subject to sales charges and are available only to the Columbia Family of Funds.
Class R shares are not subject to sales charges and are generally available only to certain retirement plans and other investors as described in the Fund's prospectus.
Class R4 shares are not subject to sales charges and are generally available only to omnibus retirement plans and certain investors as described in the Fund's prospectus.
Class R5 shares are not subject to sales charges and are generally available only to investors purchasing through authorized investment professionals and omnibus retirement plans.
Class Z shares are not subject to sales charges and are available only to eligible investors, which are subject to different investment minimums as described in the Fund's prospectus.
Note 2. Summary of Significant Accounting Policies
Basis of Preparation
The Fund is an investment company that applies the accounting and reporting guidance in the Financial Accounting Standards Board (FASB) Accounting Standards Codification Topic 946, Financial Services — Investment Companies (ASC 946). The financial statements are prepared in accordance with U.S. generally accepted accounting principles (GAAP), which requires management to make certain estimates and assumptions that affect the reported amounts of assets and liabilities, the disclosure of contingent assets and liabilities at the date of the financial statements and the reported amounts of income and expenses during the reporting period. Actual results could differ from those estimates.
The following is a summary of significant accounting policies followed by the Fund in the preparation of its financial statements.
Security Valuation
All equity securities and exchange-traded funds (ETFs) are valued at the close of business of the New York Stock Exchange (NYSE). Equity securities and ETFs are valued at the last quoted sales price on the principal exchange or market on which they trade, except for securities traded on the NASDAQ Stock Market, which are valued at the NASDAQ official close price. Unlisted securities or listed securities for which there were no sales during the day are valued at the mean of the latest quoted bid and ask prices on such exchanges or markets.
Foreign equity securities are valued based on quotations from the principal market in which such securities are traded. If any foreign security prices are not readily available as a result of limited share activity, the
Annual Report 2015
28
COLUMBIA INTERNATIONAL VALUE FUND
NOTES TO FINANCIAL STATEMENTS (continued)
February 28, 2015
securities are valued at the mean of the latest quoted bid and ask prices on such exchanges or markets. Foreign currency exchange rates are generally determined at 4:00 p.m. Eastern (U.S.) time. Many securities markets and exchanges outside the U.S. close prior to the close of the NYSE; therefore, the closing prices for securities in such markets or on such exchanges may not fully reflect events that occur after such close but before the close of the NYSE. In those situations, foreign securities will be fair valued pursuant to a policy adopted by the Board of Trustees (the Board), including, if available, utilizing a third party pricing service to determine these fair values. The third party pricing service takes into account multiple factors, including, but not limited to, movements in the U.S. securities markets, certain depositary receipts, futures contracts and foreign exchange rates that have occurred subsequent to the close of the foreign exchange or market, to determine a good faith estimate that reasonably reflects the current market conditions as of the close of the NYSE. The fair value of a security is likely to be different from the quoted or published price, if available.
Investments in open-end investment companies, including money market funds, are valued at their net asset value.
Forward foreign currency exchange contracts are marked-to-market based upon foreign currency exchange rates provided by a pricing service.
Option contracts are valued at the mean of the latest quoted bid and asked prices on their primary exchanges. Option contracts, including over-the-counter option contracts, with no readily available market value are valued using quotations obtained from independent brokers as of the close of the NYSE.
Investments for which market quotations are not readily available, or that have quotations which management believes are not reliable, are valued at fair value as determined in good faith under procedures established by and under the general supervision of the Board. If a security or class of securities (such as foreign securities) is valued at fair value, such value is likely to be different from the quoted or published price for the security.
The determination of fair value often requires significant judgment. To determine fair value, management may use assumptions including but not limited to future cash flows and estimated risk premiums. Multiple inputs from various sources may be used to determine fair value.
Foreign Currency Transactions and Translations
The values of all assets and liabilities denominated in foreign currencies are generally translated into U.S. dollars at exchange rates determined at the close of the NYSE. Net realized and unrealized gains (losses) on foreign currency transactions and translations include gains (losses) arising from the fluctuation in exchange rates between trade and settlement dates on securities transactions, gains (losses) arising from the disposition of foreign currency and currency gains (losses) between the accrual and payment dates on dividends, interest income and foreign withholding taxes.
For financial statement purposes, the Fund does not distinguish that portion of gains (losses) on investments which is due to changes in foreign exchange rates from that which is due to changes in market prices of the investments. Such fluctuations are included with the net realized and unrealized gains (losses) on investments in the Statement of Operations.
Derivative Instruments
The Fund invests in certain derivative instruments, as detailed below, to meet its investment objectives. Derivatives are instruments whose values depend on, or are derived from, in whole or in part, the value of one or more other assets, such as securities, currencies, commodities or indices. Derivative instruments may be used to increase investment flexibility (including to maintain cash reserves while maintaining exposure to certain other assets), for risk management (hedging) purposes, to facilitate trading, to reduce transaction costs and to pursue higher investment returns. The Fund may also use derivative instruments to mitigate certain investment risks, such as foreign currency exchange rate risk, interest rate risk and credit risk. Derivatives may involve various risks, including the potential inability of the counterparty to fulfill its obligation under the terms of the contract, the potential for an illiquid secondary market (making it difficult for the Fund to sell, including at favorable prices) and the potential for market movements which may expose the Fund to gains or losses in excess of the amount shown in the Statement of Assets and Liabilities. The notional amounts of derivative instruments, if applicable, are not recorded in the financial statements.
A derivative instrument may suffer a marked-to-market loss if the value of the contract decreases due to an unfavorable change in the market rates or values of the underlying instrument. Losses can also occur if the counterparty does not perform under the contract. The
Annual Report 2015
29
COLUMBIA INTERNATIONAL VALUE FUND
NOTES TO FINANCIAL STATEMENTS (continued)
February 28, 2015
Fund's risk of loss from counterparty credit risk on over-the-counter derivatives is generally limited to the aggregate unrealized gain netted against any collateral held by the Fund and the amount of any variation margin held by the counterparty. With exchange-traded or centrally cleared derivatives, there is reduced counterparty credit risk to the Fund since the exchange's clearinghouse, as counterparty to such instruments, guarantees against a possible default. The clearinghouse stands between the buyer and the seller of the contract; therefore, the counterparty credit risk is failure of the clearinghouse. However, credit risk still exists in exchange-traded or centrally cleared derivatives with respect to initial and variation margin that is held in a broker's customer account. While brokers are required to segregate customer margin from their own assets, in the event that a broker becomes insolvent or goes into bankruptcy and at that time there is a shortfall in the aggregate amount of margin held by the broker for all its clients, U.S. bankruptcy laws will typically allocate that shortfall on a pro-rata basis across all the broker's customers (including the Fund), potentially resulting in losses to the Fund.
In order to better define its contractual rights and to secure rights that will help the Fund mitigate its counterparty risk, the Fund may enter into an International Swaps and Derivatives Association, Inc. Master Agreement (ISDA Master Agreement) or similar agreement with its derivative contract counterparties. An ISDA Master Agreement is an agreement between the Fund and a counterparty that governs over-the-counter derivatives and forward foreign currency exchange contracts and typically contains, among other things, collateral posting terms and netting provisions in the event of a default and/or termination event. Under an ISDA Master Agreement, the Fund may, under certain circumstances, offset with the counterparty certain derivative instrument's payables and/or receivables with collateral held and/or posted and create one single net payment. The provisions of the ISDA Master Agreement typically permit a single net payment in the event of default (close-out netting) including the bankruptcy or insolvency of the counterparty. Note, however, that bankruptcy or insolvency laws of a particular jurisdiction may impose restrictions on or prohibitions against the right of offset in bankruptcy, insolvency or other events.
Collateral (margin) requirements differ by type of derivative. Margin requirements are established by the exchange or clearinghouse for exchange-traded and centrally cleared derivatives. Brokers can ask for margin
in excess of the minimum in certain circumstances. Collateral terms are contract specific for over-the-counter derivatives. For over-the-counter derivatives traded under an ISDA Master Agreement, the collateral requirements are typically calculated by netting the marked-to-market amount for each transaction under such agreement and comparing that amount to the value of any variation margin currently pledged by the Fund and/or the counterparty. Generally, the amount of collateral due from or to a party has to exceed a minimum transfer amount threshold (e.g., $500,000) before a transfer has to be made. To the extent amounts due to the Fund from its counterparties are not fully collateralized, contractually or otherwise, the Fund bears the risk of loss from counterparty nonperformance. The Fund attempts to mitigate counterparty risk by only entering into agreements with counterparties that it believes have the financial resources to honor their obligations and by monitoring the financial stability of those counterparties.
Certain ISDA Master Agreements allow counterparties to over-the-counter derivatives to terminate derivative contracts prior to maturity in the event the Fund's net assets decline by a stated percentage over a specified time period or if the Fund fails to meet the terms of the ISDA Master Agreement, which would cause the Fund to accelerate payment of any net liability owed to the counterparty. The Fund also has termination rights if the counterparty fails to meet the terms of the ISDA Master Agreement. In addition to considering counterparty credit risk, the Fund would consider terminating the derivative contracts based on whether termination would result in a net liability owed from the counterparty.
For financial reporting purposes, the Fund does not offset derivative assets and derivative liabilities that are subject to netting arrangements in the Statement of Assets and Liabilities.
Forward Foreign Currency Exchange Contracts
Forward foreign currency exchange contracts are over-the-counter agreements between two parties to buy and sell a currency at a set price on a future date. The Fund utilized forward foreign currency exchange contracts to hedge the currency exposure associated with some or all of the Fund's securities, to shift investment exposure from one currency to another, to shift U.S. dollar exposure to achieve a representative weighted mix of major currencies in its benchmark and/or to recover an underweight country exposure in its portfolio. These instruments may be used for other purposes in future periods.
Annual Report 2015
30
COLUMBIA INTERNATIONAL VALUE FUND
NOTES TO FINANCIAL STATEMENTS (continued)
February 28, 2015
The values of forward foreign currency exchange contracts fluctuate daily with changes in foreign currency exchange rates. Changes in the value of these contracts are recorded as unrealized appreciation or depreciation until the contract is exercised or has expired. The Fund will realize a gain or loss when the forward foreign currency exchange contract is closed or expires.
The use of forward foreign currency exchange contracts does not eliminate fluctuations in the prices of the Fund's portfolio securities. The risks of forward foreign currency exchange contracts include movement in the values of the foreign currencies relative to the U.S. dollar (or other foreign currencies) and the possibility that counterparties will not complete their contractual obligations, which may be in excess of the amount reflected, if any, in the Statement of Assets and Liabilities.
Options Contracts
Options are contracts which entitle the holder to purchase or sell securities or other identified assets at a specified price, or in the case of index option contracts, to receive or pay the difference between the index value and the strike price of the index option contract. Option contracts can be either exchange-traded or over-the-counter. The Fund purchased and wrote option contracts to decrease the Fund's exposure to equity market risk and to increase return on investments and to facilitate buying and selling of securities for investments. These instruments may be used for other purposes in future periods. Completion of transactions for option contracts traded in the over-the-counter market depends upon the performance of the other party. Cash collateral may be collected or posted by the Fund to secure certain over-the-counter option contract trades. Cash collateral held or posted by the Fund for such option contract trades must be returned to the counterparty or the Fund upon closure, exercise or expiration of the contract.
Options contracts purchased are recorded as investments. When the Fund writes an options contract, the premium received is recorded as an asset and an amount equivalent to the premium is recorded as a liability in the Statement of Assets and Liabilities and is subsequently adjusted to reflect the current fair value of the option written. Changes in the fair value of the written
option are recorded as unrealized appreciation or depreciation until the contract is exercised or has expired. The Fund will realize a gain or loss when the option contract is closed or expires. When option contracts are exercised, the proceeds on sales for a written call or purchased put option contract, or the purchase cost for a written put or purchased call option contract, is adjusted by the amount of premium received or paid.
For over-the-counter options purchased, the Fund bears the risk of loss of the amount of the premiums paid plus the positive change in market values net of any collateral held by the Fund should the counterparty fail to perform under the contracts. Option contracts written by the Fund do not typically give rise to counterparty credit risk, as options written generally obligate the Fund and not the counterparty to perform. The risk in writing a call option contract is that the Fund gives up the opportunity for profit if the market price of the security increases above the strike price and the option contract is exercised. The risk in writing a put option contract is that the Fund may incur a loss if the market price of the security decreases below the strike price and the option contract is exercised. Exercise of a written option could result in the Fund purchasing or selling a security or foreign currency when it otherwise would not, or at a price different from the current market value. In purchasing and writing options, the Fund bears the risk of an unfavorable change in the value of the underlying instrument or the risk that the Fund may not be able to enter into a closing transaction due to an illiquid market.
Contracts and premiums associated with options contracts written for the year ended February 28, 2015 are as follows:
| | | Calls | |
| | | Contracts | | Premiums ($) | |
Balance at February 28, 2014 | | | — | | | | — | | |
Opened | | | 1,270 | | | | 41,297 | | |
Closed | | | — | | | | — | | |
Expired | | | (158 | ) | | | (16,524 | ) | |
Exercised | | | (1,112 | ) | | | (24,773 | ) | |
Balance at February 28, 2015 | | | — | | | | — | | |
Annual Report 2015
31
COLUMBIA INTERNATIONAL VALUE FUND
NOTES TO FINANCIAL STATEMENTS (continued)
February 28, 2015
Offsetting of Derivative Assets and Derivative Liabilities
The following tables present the Fund's gross and net amount of assets and liabilities available for offset under netting arrangements as well as any related collateral received or pledged by the Fund as of February 28, 2015:
| | | | | | | | Gross Amounts Not Offset in
the Statement of Assets and Liabilities | | | |
| | Gross
Amounts of
Recognized
Assets ($) | | Gross Amounts
Offset in the
Statement of
Assets and
Liabilities ($) | | Net Amounts of
Assets
Presented in the
Statement of
Assets and
Liabilities ($) | | Financial
Instruments ($)(a) | | Cash
Collateral
Received ($) | | Securities
Collateral
Received ($) | | Net
Amount ($)(b) | |
Asset Derivatives: | |
Forward Foreign Currency
Exchange Contracts | | | 299,626 | | | | — | | | | 299,626 | | | | 41,273 | | | | — | | | | — | | | | 258,353 | | |
| | | | | | | | Gross Amounts Not Offset in
the Statement of Assets and Liabilities | | | |
| | Gross
Amounts of
Recognized
Liabilities ($) | | Gross Amounts
Offset in the
Statement of
Assets and
Liabilities ($) | | Net Amounts of
Liabilities
Presented in the
Statement of
Assets and
Liabilities ($) | | Financial
Instruments ($)(c) | | Cash
Collateral
Pledged ($) | | Securities
Collateral
Pledged ($) | | Net
Amount($)(d) | |
Liability Derivatives: | |
Forward Foreign Currency
Exchange Contracts | | | 41,273 | | | | — | | | | 41,273 | | | | 41,273 | | | | — | | | | — | | | | — | | |
(a) Represents the amount of assets that could be offset by liabilities with the same counterparty under master netting or similar agreements that management elects not to offset on the Statement of Assets and Liabilities.
(b) Represents the net amount due from counterparties in the event of default.
(c) Represents the amount of liabilities that could be offset by assets with the same counterparty under master netting or similar agreements that management elects not to offset on the Statement of Assets and Liabilities.
(d) Represents the net amount due to counterparties in the event of default.
Effects of Derivative Transactions in the Financial Statements
The following tables are intended to provide additional information about the effect of derivatives on the financial statements of the Fund, including: the fair value of derivatives by risk category and the location of those fair values in the Statement of Assets and Liabilities; and the impact of derivative transactions over the period in the Statement of Operations, including realized gains or losses and unrealized gains or losses. The derivative schedules following the Portfolio of Investments present additional information regarding derivative instruments outstanding at the end of the period, if any.
The following table is a summary of the fair value of derivative instruments (not considered to be hedging
instruments for accounting disclosure purposes) at February 28, 2015:
Asset Derivatives | |
Risk Exposure
Category | | Statement of Assets and
Liabilities Location | | Fair Value ($) | |
Foreign exchange
risk
| | Unrealized appreciation on
forward foreign currency
exchange contracts | | | 299,626
| | |
Liability Derivatives | |
Risk Exposure
Category | | Statement of Assets and
Liabilities Location | | Fair Value ($) | |
Foreign exchange
risk
| | Unrealized depreciation on
forward foreign currency
exchange contracts | | | 41,273
| | |
*Includes cumulative appreciation (depreciation) as reported in the tables following the Portfolio of Investments. Only the current day's variation margin is reported in receivables or payables in the Statement of Assets and Liabilities.
The following table indicates the effect of derivative instruments (not considered to be hedging instruments
Annual Report 2015
32
COLUMBIA INTERNATIONAL VALUE FUND
NOTES TO FINANCIAL STATEMENTS (continued)
February 28, 2015
for accounting disclosure purposes) in the Statement of Operations for the year ended February 28, 2015:
Amount of Realized Gain (Loss) on Derivatives Recognized in Income | |
Risk Exposure
Category | | Forward Foreign
Currency Exchange
Contracts ($) | | Options
Contracts
Written and
Purchased ($) | |
Total ($) | |
Equity risk | | | — | | | | 24,771 | | | | 24,771 | | |
Foreign exchange
risk | | | (860,564 | ) | | | — | | | | (860,564 | ) | |
Total | | | (860,564 | ) | | | 24,771 | | | | (835,793 | ) | |
Change in Unrealized Appreciation (Depreciation) on Derivatives Recognized in Income | |
Risk Exposure
Category | | Forward Foreign
Currency Exchange
Contracts ($) | | Options
Contracts
Written and
Purchased ($) | |
Total ($) | |
Foreign exchange
risk | | | 27,412 | | | | — | | | | 27,412 | | |
The following table is a summary of the average outstanding volume by derivative instrument for the year ended February 28, 2015:
Derivative Instrument | | Average market
value ($)* | |
Options contracts — Written | | | (4,611 | ) | |
Derivative Instrument | | Average
unrealized
appreciation ($)** | | Average
unrealized
depreciation ($)** | |
Forward foreign currency
exchange contracts | | | 242,351 | | | | (303,594 | ) | |
*Based on the daily outstanding amounts for the year ended February 28, 2015.
**Based on the ending quarterly outstanding amounts for the year ended February 28, 2015.
Security Transactions
Security transactions are accounted for on the trade date. Cost is determined and gains (losses) are based upon the specific identification method for both financial statement and federal income tax purposes.
Income Recognition
Corporate actions and dividend income are generally recorded net of any non-reclaimable tax withholdings, on the ex-dividend date or upon receipt of ex-dividend notification in the case of certain foreign securities.
Awards from class action litigation are recorded as a reduction of cost basis if the Fund still owns the applicable securities on the payment date. If the Fund no
longer owns the applicable securities, the proceeds are recorded as realized gains.
Expenses
General expenses of the Trust are allocated to the Fund and other funds of the Trust based upon relative net assets or other expense allocation methodologies determined by the nature of the expense. Expenses directly attributable to the Fund are charged to the Fund. Expenses directly attributable to a specific class of shares are charged to that share class.
Determination of Class Net Asset Value
All income, expenses (other than class-specific expenses, which are charged to that share class, as shown in the Statement of Operations) and realized and unrealized gains (losses) are allocated to each class of the Fund on a daily basis, based on the relative net assets of each class, for purposes of determining the net asset value of each class.
Federal Income Tax Status
The Fund intends to qualify each year as a regulated investment company under Subchapter M of the Internal Revenue Code, as amended, and will distribute substantially all of its taxable income (including net short-term capital gains), if any, for its tax year, and as such will not be subject to federal income taxes. In addition, the Fund intends to distribute in each calendar year substantially all of its net investment income, capital gains and certain other amounts, if any, such that the Fund should not be subject to federal excise tax. Therefore, no federal income or excise tax provision is recorded.
Foreign Taxes
The Fund may be subject to foreign taxes on income, gains on investments or currency repatriation, a portion of which may be recoverable. The Fund will accrue such taxes and recoveries, as applicable, based upon its current interpretation of tax rules and regulations that exist in the markets in which it invests.
Realized gains in certain countries may be subject to foreign taxes at the Fund level, based on statutory rates. The Fund accrues for such foreign taxes on realized and unrealized gains at the appropriate rate for each jurisdiction, as applicable. The amount, if any, is disclosed as a liability on the Statement of Assets and Liabilities.
Annual Report 2015
33
COLUMBIA INTERNATIONAL VALUE FUND
NOTES TO FINANCIAL STATEMENTS (continued)
February 28, 2015
Distributions to Shareholders
Distributions from net investment income, if any, are declared and paid semi-annually. Net realized capital gains, if any, are distributed at least annually. Income distributions and capital gain distributions are determined in accordance with federal income tax regulations, which may differ from GAAP.
Guarantees and Indemnifications
Under the Trust's organizational documents and, in some cases, by contract, its officers and trustees are indemnified against certain liabilities arising out of the performance of their duties to the Trust or its funds. In addition, certain of the Fund's contracts with its service providers contain general indemnification clauses. The Fund's maximum exposure under these arrangements is unknown since the amount of any future claims that may be made against the Fund cannot be determined, and the Fund has no historical basis for predicting the likelihood of any such claims.
Note 3. Fees and Compensation Paid to Affiliates
Investment Management Fees
Under an Investment Management Services Agreement, Columbia Management Investment Advisers, LLC (the Investment Manager), a wholly-owned subsidiary of Ameriprise Financial, Inc. (Ameriprise Financial), determines which securities will be purchased, held or sold. The investment management fee is an annual fee that is equal to a percentage of the Fund's average daily net assets that declines from 0.79% to 0.62% as the Fund's net assets increase. The effective investment management fee rate for the year ended February 28, 2015 was 0.79% of the Fund's average daily net assets.
Administration Fees
Under an Administrative Services Agreement, the Investment Manager also serves as the Fund Administrator. The Fund pays the Fund Administrator an annual fee for administration and accounting services equal to a percentage of the Fund's average daily net assets that declines from 0.08% to 0.05% as the Fund's net assets increase. The effective administration fee rate for the year ended February 28, 2015 was 0.08% of the Fund's average daily net assets.
Other Expenses
Other expenses are for, among other things, miscellaneous expenses of the Fund or the Board,
including payments to a company providing limited administrative services to the Fund and the Board. That company's expenses include boardroom and office expense, employee compensation, employee health and retirement benefits, and certain other expenses. For the year ended February 28, 2015, other expenses paid by the Fund to this company were $1,469.
Compensation of Board Members
Board members are compensated for their services to the Fund as disclosed in the Statement of Operations. Under a Deferred Compensation Plan (the Plan), the Board members who are not "interested persons" of the Fund, as defined under the 1940 Act, may elect to defer payment of up to 100% of their compensation. Deferred amounts are treated as though equivalent dollar amounts had been invested in shares of certain funds managed by the Investment Manager. The Fund's liability for these amounts is adjusted for market value changes and remains in the Fund until distributed in accordance with the Plan.
Transfer Agent Fees
Under a Transfer and Dividend Disbursing Agent Agreement, Columbia Management Investment Services Corp. (the Transfer Agent), an affiliate of the Investment Manager and a wholly-owned subsidiary of Ameriprise Financial, is responsible for providing transfer agency services to the Fund. The Transfer Agent has contracted with Boston Financial Data Services (BFDS) to serve as sub-transfer agent.
Effective November 1, 2014, the Transfer Agent receives a monthly transfer agency fee based on the number or the average value of accounts, depending on the type of account. Prior to November 1, 2014, the Transfer Agent received a monthly account-based service fee based on the number of open accounts. In addition, the Transfer Agent also receives sub-transfer agency fees based on a percentage of the average aggregate value of the Fund's shares maintained in omnibus accounts (other than omnibus accounts for which American Enterprise Investment Services Inc. is the broker of record or accounts where the beneficial shareholder is a customer of Ameriprise Financial Services, Inc., for which the Transfer Agent receives a per account fee). The Transfer Agent pays the fees of BFDS for services as sub-transfer agent and is not entitled to reimbursement for such fees from the Fund (with the exception of out-of-pocket fees).
The Transfer Agent also receives compensation from the Fund for various shareholder services and
Annual Report 2015
34
COLUMBIA INTERNATIONAL VALUE FUND
NOTES TO FINANCIAL STATEMENTS (continued)
February 28, 2015
reimbursements for certain out-of-pocket fees. Class I shares do not pay transfer agency fees. Total transfer agent fees for Class R5 shares are subject to an annual limitation of not more than 0.05% of the average daily net assets attributable to Class R5 shares.
For the year ended February 28, 2015, the Fund's effective transfer agent fee rates as a percentage of average daily net assets of each class were as follows:
Class A | | | 0.20 | % | |
Class B | | | 0.20 | | |
Class C | | | 0.20 | | |
Class R | | | 0.20 | | |
Class R4 | | | 0.20 | | |
Class R5 | | | 0.05 | | |
Class Z | | | 0.20 | | |
An annual minimum account balance fee of $20 may apply to certain accounts with a value below the applicable share class's initial minimum investment requirements to reduce the impact of small accounts on transfer agent fees. These minimum account balance fees are remitted to the Fund and recorded as part of expense reductions in the Statement of Operations. For the year ended February 28, 2015, these minimum account balance fees reduced total expenses of the Fund by $701.
Distribution and Service Fees
The Fund has an agreement with Columbia Management Investment Distributors, Inc. (the Distributor), an affiliate of the Investment Manager and a wholly-owned subsidiary of Ameriprise Financial, for distribution and shareholder services. The Board has approved, and the Fund has adopted, distribution and shareholder service plans (the Plans) applicable to certain share classes, which set the distribution and service fees for the Fund. These fees are calculated daily and are intended to compensate the Distributor and/or eligible selling and/or servicing agents for selling shares of the Fund and providing services to investors.
Under the Plans, the Fund pays a monthly combined distribution and service fee to the Distributor at the maximum annual rate of 0.25% of the average daily net assets attributable to Class A shares of the Fund. Also under the Plans, the Fund pays a monthly service fee at the maximum annual rate of 0.25% of the average daily net assets attributable to Class B and Class C shares of the Fund and the payment of a monthly distribution fee at the maximum annual rates of 0.75%, 0.75% and
0.50% of the average daily net assets attributable to Class B, Class C and Class R shares, respectively.
Sales Charges
Sales charges, including front-end charges and CDSCs, received by the Distributor for distributing Fund shares were $45,763 for Class A, $161 for Class B, and $273 for Class C, shares for the year ended February 28, 2015.
Expenses Waived/Reimbursed by the Investment Manager and its Affiliates
The Fund's expense ratio is subject to an expense reimbursement arrangement pursuant to which fees will be waived and/or expenses reimbursed (excluding certain fees and expenses described below), so that the Fund's net operating expenses, after giving effect to fees waived/expenses reimbursed and any balance credits and/or overdraft charges from the Fund's custodian, do not exceed the annual rates of:
| | | Voluntary
Expense Cap
Effective
July 1, 2014 | | Contractual
Expense Cap
Prior to
July 1, 2014 | |
Class A | | | 1.42 | % | | | 1.41 | % | |
Class B | | | 2.17 | | | | 2.16 | | |
Class C | | | 2.17 | | | | 2.16 | | |
Class I | | | 1.03 | | | | 1.02 | | |
Class R | | | 1.67 | | | | 1.66 | | |
Class R4 | | | 1.17 | | | | 1.16 | | |
Class R5 | | | 1.08 | | | | 1.07 | | |
Class Z | | | 1.17 | | | | 1.16 | | |
The voluntary expense cap arrangement may be revised or discontinued at any time. Under the arrangements, the following fees and expenses are excluded from the waiver/reimbursement commitment, and therefore will be paid by the Fund, if applicable: taxes (including foreign transaction taxes), expenses associated with investments in affiliated and non-affiliated pooled investment vehicles (including mutual funds and exchange-traded funds), transaction costs and brokerage commissions, costs related to any securities lending program, dividend expenses associated with securities sold short, inverse floater program fees and expenses, transaction charges and interest on borrowed money, interest and extraordinary expenses. Any fees waived and/or expenses reimbursed under the expense reimbursement arrangements described above are not recoverable by the Investment Manager or its affiliates in future periods.
Annual Report 2015
35
COLUMBIA INTERNATIONAL VALUE FUND
NOTES TO FINANCIAL STATEMENTS (continued)
February 28, 2015
Note 4. Federal Tax Information
The timing and character of income and capital gain distributions are determined in accordance with income tax regulations, which may differ from GAAP because of temporary or permanent book to tax differences.
At February 28, 2015, these differences are primarily due to differing treatment for capital loss carryforwards, deferral/reversal of wash sale losses, Trustees' deferred compensation, foreign currency transactions, passive foreign investment company (PFIC) holdings and derivative investments. To the extent these differences are permanent, reclassifications are made among the components of the Fund's net assets in the Statement of Assets and Liabilities. Temporary differences do not require reclassifications. In the Statement of Assets and Liabilities the following reclassifications were made:
Excess of distributions over net investment income | | $ | 47,188 | | |
Accumulated net realized loss | | | (47,191 | ) | |
Paid-in capital | | | 3 | | |
Net investment income (loss) and net realized gains (losses), as disclosed in the Statement of Operations, and net assets were not affected by this reclassification.
The tax character of distributions paid during the years indicated was as follows:
Year Ended February 28, | | 2015 | | 2014 | |
Ordinary income | | $ | 8,643,871 | | | $ | 13,000,054 | | |
Short-term capital gain distributions, if any, are considered ordinary income distributions for tax purposes.
At February 28, 2015, the components of distributable earnings on a tax basis were as follows:
Undistributed ordinary income | | $ | 328,286 | | |
Capital loss carryforwards | | | (545,585,785 | ) | |
Net unrealized appreciation | | | 4,254,219 | | |
At February 28, 2015, the cost of investments for federal income tax purposes was $180,584,951 and the aggregate gross unrealized appreciation and depreciation based on that cost was:
Unrealized appreciation | | $ | 16,929,419 | | |
Unrealized depreciation | | | (12,675,200 | ) | |
Net unrealized appreciation | | $ | 4,254,219 | | |
The following capital loss carryforwards, determined at February 28, 2015, may be available to reduce taxable income arising from future net realized gains on
investments, if any, to the extent permitted by the Internal Revenue Code:
Year of Expiration | | Amount ($) | |
2018 | | | 185,725,377 | | |
2019 | | | 68,376,538 | | |
No expiration — long-term | | | 291,483,870 | | |
Total | | | 545,585,785 | | |
Capital loss carryforwards with no expiration are required to be utilized prior to any capital losses which carry an expiration date. As a result of this ordering rule, capital loss carryforwards which carry an expiration date may be more likely to expire unused.
For the year ended February 28, 2015, $12,403,572 of capital loss carryforward was utilized.
Management of the Fund has concluded that there are no significant uncertain tax positions in the Fund that would require recognition in the financial statements. However, management's conclusion may be subject to review and adjustment at a later date based on factors including, but not limited to, new tax laws, regulations, and administrative interpretations (including relevant court decisions). Generally, the Fund's federal tax returns for the prior three fiscal years remain subject to examination by the Internal Revenue Service.
Note 5. Portfolio Information
The cost of purchases and proceeds from sales of securities, excluding short-term investments and derivatives, if any, aggregated to $181,808,928 and $255,512,791, respectively, for the year ended February 28, 2015. The amount of purchase and sale activity impacts the portfolio turnover rate reported in the Financial Highlights.
Note 6. Affiliated Money Market Fund
The Fund invests in Columbia Short-Term Cash Fund, an affiliated money market fund established for the exclusive use by the Fund and other affiliated funds. The income earned by the Fund from such investments is included as Dividends—affiliated issuers in the Statement of Operations. As an investing fund, the Fund indirectly bears its proportionate share of the expenses of Columbia Short-Term Cash Fund.
Note 7. Shareholder Concentration
At February 28, 2015, two unaffiliated shareholders of record owned 35.4% of the outstanding shares of the Fund in one or more accounts. The Fund has no knowledge about whether any portion of those shares
Annual Report 2015
36
COLUMBIA INTERNATIONAL VALUE FUND
NOTES TO FINANCIAL STATEMENTS (continued)
February 28, 2015
was owned beneficially. Subscription and redemption activity by concentrated accounts may have a significant effect on the operations of the Fund.
Note 8. Line of Credit
The Fund has entered into a revolving credit facility with a syndicate of banks led by JPMorgan Chase Bank, N.A. (JPMorgan) whereby the Fund may borrow for the temporary funding of shareholder redemptions or for other temporary or emergency purposes. Pursuant to a December 9, 2014 amendment, the credit facility agreement, which is a collective agreement between the Fund and certain other funds managed by the Investment Manager, severally and not jointly, permits collective borrowings up to $550 million. Interest is charged to each participating fund based on its borrowings at a rate equal to the higher of (i) the overnight federal funds rate plus 1.00% or (ii) the one-month LIBOR rate plus 1.00%. Each borrowing under the credit facility matures no later than 60 days after the date of borrowing. The Fund also pays a commitment fee equal to its pro rata share of the amount of the credit facility at a rate of 0.075% per annum. The commitment fee is included in other expenses in the Statement of Operations. Prior to the December 9, 2014 amendment, the credit facility agreement permitted borrowings up to $500 million under the same terms and interest rates as described above.
For the year ended February 28, 2015, the average daily loan balance outstanding on days when borrowing existed was $3,483,333 at a weighted average interest rate of 1.16%. Interest expense incurred by the Fund is recorded as line of credit interest expense in the Statement of Operations.
Note 9. Significant Risks
Financial Sector Risk
Sector risk occurs when a fund invests a significant portion of its assets in securities of companies conducting business in a related group of industries within an economic sector. Companies in the same economic sector may be similarly affected by economic, regulatory, political or market events or conditions, making a fund more vulnerable to unfavorable developments in that economic sector than funds that invest more broadly. The Fund may be more susceptible to the particular risks that may affect companies in the financial sector than if it were invested in a wider variety of companies in unrelated sectors.
Foreign Securities and Emerging Market Countries Risk
Investing in foreign securities may include certain risks and considerations not typically associated with investing in U.S. securities, such as fluctuating currency values and changing local and regional economic, political and social conditions, which may result in greater market volatility. In addition, certain foreign securities may not be as liquid as U.S. securities. Investing in emerging markets may accentuate these risks. These countries are also more likely to experience high levels of inflation, deflation or currency devaluation which could hurt their economies and securities markets.
Note 10. Subsequent Events
Management has evaluated the events and transactions that have occurred through the date the financial statements were issued and noted no items requiring adjustment of the financial statements or additional disclosure.
Note 11. Information Regarding Pending and Settled Legal Proceedings
In December 2005, without admitting or denying the allegations, American Express Financial Corporation (AEFC, which is now known as Ameriprise Financial, Inc. (Ameriprise Financial)) entered into settlement agreements with the Securities and Exchange Commission (SEC) and Minnesota Department of Commerce (MDOC) related to market timing activities. As a result, AEFC was censured and ordered to cease and desist from committing or causing any violations of certain provisions of the Investment Advisers Act of 1940, the Investment Company Act of 1940, and various Minnesota laws. AEFC agreed to pay disgorgement of $10 million and civil money penalties of $7 million. AEFC also agreed to retain an independent distribution consultant to assist in developing a plan for distribution of all disgorgement and civil penalties ordered by the SEC in accordance with various undertakings detailed at www.sec.gov/litigation/admin/ia-2451.pdf. Ameriprise Financial and its affiliates have cooperated with the SEC and the MDOC in these legal proceedings, and have made regular reports to the Funds' Boards of Trustees.
Ameriprise Financial and certain of its affiliates have historically been involved in a number of legal, arbitration and regulatory proceedings, including routine litigation, class actions, and governmental actions, concerning matters arising in connection with the conduct of their business activities. Ameriprise Financial believes that the
Annual Report 2015
37
COLUMBIA INTERNATIONAL VALUE FUND
NOTES TO FINANCIAL STATEMENTS (continued)
February 28, 2015
Funds are not currently the subject of, and that neither Ameriprise Financial nor any of its affiliates are the subject of, any pending legal, arbitration or regulatory proceedings that are likely to have a material adverse effect on the Funds or the ability of Ameriprise Financial or its affiliates to perform under their contracts with the Funds. Ameriprise Financial is required to make quarterly (10-Q), annual (10-K) and, as necessary, 8-K filings with the Securities and Exchange Commission on legal and regulatory matters that relate to Ameriprise Financial and its affiliates. Copies of these filings may be obtained by accessing the SEC website at www.sec.gov.
There can be no assurance that these matters, or the adverse publicity associated with them, will not result in increased fund redemptions, reduced sale of fund shares or other adverse consequences to the Funds. Further, although we believe proceedings are not likely to have a material adverse effect on the Funds or the ability of Ameriprise Financial or its affiliates to perform under their contracts with the Funds, these proceedings are subject to uncertainties and, as such, we are unable to estimate the possible loss or range of loss that may result. An adverse outcome in one or more of these proceedings could result in adverse judgments, settlements, fines, penalties or other relief that could have a material adverse effect on the consolidated financial condition or results of operations of Ameriprise Financial.
Annual Report 2015
38
COLUMBIA INTERNATIONAL VALUE FUND
REPORT OF INDEPENDENT REGISTERED PUBLIC ACCOUNTING FIRM
To the Trustees of Columbia Funds Series Trust and the Shareholders of
Columbia International Value Fund
In our opinion, the accompanying statement of assets and liabilities, including the portfolio of investments, and the related statements of operations and of changes in net assets and the financial highlights present fairly, in all material respects, the financial position of Columbia International Value Fund (the "Fund", a series of Columbia Funds Series Trust) at February 28, 2015, and the results of its operations, the changes in its net assets and the financial highlights for each of the periods indicated, in conformity with accounting principles generally accepted in the United States of America. These financial statements and financial highlights (hereafter referred to as "financial statements") are the responsibility of the Fund's management; our responsibility is to express an opinion on these financial statements based on our audits. We conducted our audits of these financial statements in accordance with the standards of the Public Company Accounting Oversight Board (United States). Those standards require that we plan and perform the audit to obtain reasonable assurance about whether the financial statements are free of material misstatement. An audit includes examining, on a test basis, evidence supporting the amounts and disclosures in the financial statements, assessing the accounting principles used and significant estimates made by management, and evaluating the overall financial statement presentation. We believe that our audits, which included confirmation of securities at February 28, 2015 by correspondence with the custodian, brokers and transfer agent, and the application of alternative auditing procedures where such confirmations had not been received, provide a reasonable basis for our opinion.
PricewaterhouseCoopers LLP
Minneapolis, Minnesota
April 21, 2015
Annual Report 2015
39
COLUMBIA INTERNATIONAL VALUE FUND
FEDERAL INCOME TAX INFORMATION
(Unaudited)
The Fund hereby designates the following tax attributes for the fiscal year ended February 28, 2015. Shareholders will be notified in early 2016 of the amounts for use in preparing 2015 income tax returns.
Tax Designations:
| Qualified Dividend Income | | | 100.00 | % | |
| Dividends Received Deduction | | | 0.28 | % | |
Foreign Taxes Paid | | $ | 911,081 | | |
Foreign Taxes Paid Per Share | | $ | 0.07 | | |
Foreign Source Income | | $ | 9,414,445 | | |
Foreign Source Income Per Share | | $ | 0.72 | | |
Qualified Dividend Income. For taxable, non-corporate shareholders, the percentage of ordinary income distributed during the fiscal year that represents qualified dividend income subject to reduced tax rates.
Dividends Received Deduction. The percentage of ordinary income distributed during the fiscal year that qualifies for the corporate dividends received deduction.
Foreign Taxes. The Fund makes the election to pass through to shareholders the foreign taxes paid. Eligible shareholders may claim a foreign tax credit. These taxes, and the corresponding foreign source income, are provided.
Annual Report 2015
40
COLUMBIA INTERNATIONAL VALUE FUND
Shareholders elect the Board that oversees the Funds' operations. The Board appoints officers who are responsible for day-to-day business decisions based on policies set by the Board. The following table provides basic biographical information about the Funds' Board members, including their principal occupations during the past five years, although specific titles for individuals may have varied over the period. Under current Board policy, members may serve through the end of the calendar year in which he or she reaches either the mandatory retirement age established by the Board or the fifteenth anniversary of the first Board meeting they attended as a member of the Board.
Independent Trustees
Name,
Address,
Year of Birth | | Position Held With
Funds and Length of
Service | | Principal Occupation(s)
During Past Five Years
and Other Relevant
Professional Experience | | Number of
Funds in the
Fund Family
Overseen by
Board Member | | Other Present or Past
Directorships/
Trusteeships
(Within Past 5 Years) | |
Kathleen Blatz
901 S. Marquette Ave.
Minneapolis, MN 55402
1954 | | Board member since 1/06 for RiverSource Funds and since 6/11 for Nations Funds | | Attorney; specializing in arbitration and mediation; Chief Justice, Minnesota Supreme Court, 1998-2006; Associate Justice, Minnesota Supreme Court, 1996-1998; Fourth Judicial District Court Judge, Hennepin Country, 1994-1996; Attorney in private practice and public service, 1984-1993; State Representative, Minnesota House of Representatives, 1979-1993, which included service on the Tax and Financial Institutions and Insurance Committees | | | 127 | | | Trustee, BlueCross BlueShield of Minnesota (Chair of the Business Development Committee) since 2009; Chair of the Robina Foundation since August 2013 | |
Edward J. Boudreau, Jr.
901 S. Marquette Ave.
Minneapolis, MN 55402
1944 | | Board member since 6/11 for RiverSource Funds and since 1/05 for Nations Funds | | Managing Director, E.J. Boudreau & Associates (consulting) since 2000; FINRA Industry Arbitrator, 2002-present; Chairman and Chief Executive Officer, John Hancock Funds (asset management), Chairman and Interested Trustee for open-end and closed-end funds offered by John Hancock, 1989-2000; John Hancock Life Insurance Company, including SVP and Treasurer and SVP Information Technology, 1968-1988 | | | 125 | | | Former Trustee, BofA Funds Series Trust (11 funds), 2005-2011; Trustee, Boston Museum of Science (Chair of Finance Committee), 1985-2013 | |
Pamela G. Carlton
901 S. Marquette Ave.
Minneapolis, MN 55402
1954 | | Board member since 7/07 for RiverSource Funds and since 6/11 for Nations Funds | | President, Springboard — Partners in Cross Cultural Leadership (consulting company) since 2003; Managing Director of US Equity Research, JP Morgan Chase, 1999-2003; Director of US Equity Research, Chase Asset Management, 1996-1999; Co-Director Latin America Research, 1993-1996, COO Global Research, 1992-1996, Co-Director of US Research, 1991-1992, Investment Banker, Morgan Stanley, 1982-1991 | | | 127 | | | None | |
Annual Report 2015
41
COLUMBIA INTERNATIONAL VALUE FUND
TRUSTEES AND OFFICERS (continued)
Independent Trustees (continued)
Name,
Address,
Year of Birth | | Position Held With
Funds and Length of
Service | | Principal Occupation(s)
During Past Five Years
and Other Relevant
Professional Experience | | Number of
Funds in the
Fund Family
Overseen by
Board Member | | Other Present or Past
Directorships/
Trusteeships
(Within Past 5 Years) | |
William P. Carmichael
901 S. Marquette Ave.
Minneapolis, MN 55402
1943 | | Chair of the Board since 1/14, Board member since 6/11 for RiverSource Funds and since 2003 for Nations Funds | | Retired; Co-founder, The Succession Fund (provides exit strategies to owners of privately held companies) 1998-2007; Adjunct Professor of Finances, Kelley School of Business, Indiana University, 1993-2007; Senior Vice President, Sara Lee Corporation, 1991-1993; Senior Vice President and Chief Financial Officer, Beatrice Foods Company, 1984-1990; Vice President, Esmark, Inc, 1973-1984.; Associate, Price Waterhouse, 1968-1972 | | | 127 | | | Director, Cobra Electronics Corporation (electronic equipment manufacturer), 1994-August 2014; The Finish Line (athletic shoes and apparel) since July 2003; Director, International Textile Corp. since 2012; former Director, McMoRan Exploration Company (oil and gas exploration and development) 2010-2013; former Trustee, BofA Funds Series Trust (11 funds) 2009-2011; Director, Spectrum Brands, Inc. (consumer products), 2002-2009; Director, Simmons Company (bedding), 2004-2010 | |
Patricia M. Flynn
901 S. Marquette Ave.
Minneapolis, MN 55402
1950 | | Board member since 11/04 for RiverSource Funds and since 6/11 for Nations Funds | | Trustee Professor of Economics and Management, Bentley University since 1976 (also teaches and conducts research on corporate governance); Dean, McCallum Graduate School of Business, Bentley University, 1992-2002 | | | 127 | | | Trustee, MA Taxpayers Foundation since 1997; Board of Governors, Innovation Institute, MA Technology Collaborative since 2010 | |
William A. Hawkins
901 S. Marquette Ave.
Minneapolis, MN 55402
1942 | | Board member since 6/11 for RiverSource Funds and since 1/05 for Nations Funds | | Managing Director, Overton Partners (financial consulting), since August 2010; President and Chief Executive Officer, California General Bank, N.A., January 2008-August 2010; Operation Hope, COO, 2004-2007; IndyMac Bancorp, President, CBG, 1999-2003; American General Bank, President, 1997-1999; Griffin Financial Services, CEO, 1981-1997; The Griffin Funds, CEO, 1992-1998 | | | 125 | | | Trustee, BofA Funds Series Trust (11 funds) | |
R. Glenn Hilliard
901 S. Marquette Ave.
Minneapolis, MN 55402
1943 | | Board member since 6/11 for RiverSource Funds and since 1/05 for Nations Funds | | Chairman and Chief Executive Officer, Hilliard Group LLC (investing and consulting) since April 2003; Non-Executive Director & Chairman, CNO Financial Group, Inc. (insurance), September 2003-May 2011 | | | 125 | | | Chairman, BofA Funds Series Trust (11 funds); former Director, CNO Financial Group, Inc. (insurance) 2003-2011 | |
Annual Report 2015
42
COLUMBIA INTERNATIONAL VALUE FUND
TRUSTEES AND OFFICERS (continued)
Independent Trustees (continued)
Name,
Address,
Year of Birth | | Position Held With
Funds and Length of
Service | | Principal Occupation(s)
During Past Five Years
and Other Relevant
Professional Experience | | Number of
Funds in the
Fund Family
Overseen by
Board Member | | Other Present or Past
Directorships/
Trusteeships
(Within Past 5 Years) | |
Catherine James Paglia
901 S. Marquette Ave.
Minneapolis, MN 55402
1952 | | Board member since 11/04 for RiverSource Funds and since 6/11 for Nations Funds | | Director, Enterprise Asset Management, Inc. (private real estate and asset management company) since September 1998; Managing Director and Partner, Interlaken Capital, Inc., 1989-1997; Managing Director, Morgan Stanley, 1982-1989; Vice President, Investment Banking, 1980-1982, Associate, Investment Banking, 1976-1980, Dean Witter Reynolds, Inc. | | | 127 | | | Director, Valmont Industries, Inc. (irrigation systems manufacturer) since 2012; Trustee, Carleton College (on the Investment Committee); Trustee, Carnegie Endowment for International Peace (on the Investment Committee) | |
Leroy C. Richie
901 S. Marquette Ave.
Minneapolis, MN 55402
1941 | | Board member since 2000 for Seligman Funds, since 11/08 for RiverSource Funds and since 6/11 for Nations Funds | | Counsel, Lewis & Munday, P.C. (law firm) since 2004; Vice President and General Counsel, Automotive Legal Affairs, Chrysler Corporation, 1993-1997 | | | 127 | | | Lead Outside Director, Digital Ally, Inc. (digital imaging) since September 2005; Director, Infinity, Inc. (oil and gas exploration and production) since 1994; Director, OGE Energy Corp. (energy and energy services) since November 2007-2014 | |
Minor M. Shaw
901 S. Marquette Ave.
Minneapolis, MN 55402
1947 | | Board member since 6/11 for RiverSource Funds and since 2003 for Nations Funds | | President, Micco LLC (private investments) since 2011; President, Micco Corp. (family investment business) 1998-2011 | | | 125 | | | Director, Piedmont Natural Gas; Director, BlueCross BlueShield of South Carolina since April 2008; Chair of the Duke Endowment; Director, National Association of Corporate Directors, Carolinas Chapter, since 2013; Chair of Greenville-Spartanburg Airport Commission; former Trustee, BofA Funds Series Trust (11 funds), 2003-2011 | |
Alison Taunton-Rigby
901 S. Marquette Ave.
Minneapolis, MN 55402
1944 | | Board member since 11/02 for RiverSource Funds and since 6/11 for Nations Funds | | Managing Director, Forester Biotech (consulting) since 2001; Chief Executive Officer and Director, RiboNovix, Inc., (biotechnology) 2003-2010; President and Chief Executive Officer of CMT Inc., 2001-2003; Aquila Biopharmaceuticals Inc., 1996-2000; Cambridge Biotech Corporation, 1995-1996, Mitotix Inc., 1993-1994 | | | 127 | | | Director, Healthways, Inc. (health and well-being solutions) since 2005; Director, ICI Mutual Insurance Company, RRG since 2011; Director, Abt Associates (government contractor) since 2001; Director, Boston Children's Hospital since 2002 | |
Annual Report 2015
43
COLUMBIA INTERNATIONAL VALUE FUND
TRUSTEES AND OFFICERS (continued)
Interested Trustee Not Affiliated with Investment Manager*
Name,
Address,
Year of Birth | | Position Held With
Funds and Length of
Service | | Principal Occupation
During Past Five Years | | Number of
Funds in the
Fund Family
Overseen by
Board Member | | Other Present or Past
Directorships/
Trusteeships
(Within Past 5 Years) | |
Anthony M. Santomero
901 S. Marquette Ave.
Minneapolis, MN 55402
1946 | | Board member since 6/11 for RiverSource Funds and since 1/08 for Nations Funds | | Richard K. Mellon Professor Emeritus of Finance, The Wharton School, University of Pennsylvania, since 2002; Senior Advisor, McKinsey & Company (consulting), 2006-2008; President, Federal Reserve Bank of Philadelphia, 2000-2006, Professor of Finance, The Wharton School, University of Pennsylvania, 1972-2002 | | | 125 | | | Director, Renaissance Reinsurance Ltd. since May 2008; Trustee, Penn Mutual Life Insurance Company since March 2008; Director, Citigroup Inc. since 2009; Director, Citibank, N.A. since 2009; former Trustee, BofA Funds Series Trust (11 funds), 2008-2011 | |
* Dr. Santomero is not an affiliated person of the Investment Manager or Ameriprise Financial. However, he is currently deemed by the Funds to be an "interested person" (as defined in the 1940 Act) of the Funds because he serves as a Director of Citigroup Inc. and Citibank, N.A., companies that may directly or through subsidiaries and affiliates engage from time-to-time in brokerage execution, principal transactions and lending relationships with the Funds or accounts advised/managed by the Investment Manager.
Annual Report 2015
44
COLUMBIA INTERNATIONAL VALUE FUND
TRUSTEES AND OFFICERS (continued)
Interested Trustee Affiliated with Investment Manager*
Name,
Address,
Year of Birth | | Position Held With
Funds and Length of
Service | | Principal Occupation
During Past Five Years | | Number of
Funds in the
Fund Family
Overseen by
Board Member | | Other Present or Past
Directorships/
Trusteeships
(Within Past 5 Years) | |
William F. Truscott
53600 Ameriprise
Financial Center
Minneapolis, MN 55474
1960 | | Board member since 11/01 for RiverSource Funds and since 6/11 for Nations Funds; Senior Vice President since 2002 for RiverSource Funds and since 5/10 for Nations Funds | | Chairman of the Board and President, Columbia Management Investment Advisers, LLC since May 2010 and February 2012, respectively (previously President and Chief Investment Officer, 2001-April 2010); Chief Executive Officer, Global Asset Management, Ameriprise Financial, Inc. since September 2012 (previously Chief Executive Officer, U.S. Asset Management & President, Annuities, May 2010-September 2012 and President — U.S. Asset Management and Chief Investment Officer, 2005-April 2010); Director and Chief Executive Officer, Columbia Management Investment Distributors, Inc. since May 2010 and February 2012, respectively (previously Chairman of the Board and Chief Executive Officer, 2006-April 2010); Chairman of the Board and Chief Executive Officer, RiverSource Distributors, Inc. since 2006; Director, Threadneedle Asset Management Holdings, SARL since 2014; President and Chief Executive Officer, Ameriprise Certificate Company, 2006-August 2012 | | | 186 | | | Former Director, Ameriprise Certificate Company, 2006-January 2013 | |
* Interested person (as defined under the 1940 Act) by reason of being an officer, director, security holder and/or employee of the Investment Manager or Ameriprise Financial.
The Statement of Additional Information has additional information about the Fund's Board members and is available, without charge, upon request by calling 800.345.6611; contacting your financial intermediary or visiting columbiathreadneedle.com/us.
Annual Report 2015
45
COLUMBIA INTERNATIONAL VALUE FUND
TRUSTEES AND OFFICERS (continued)
The Board has appointed officers who are responsible for day-to-day business decisions based on policies it has established. The officers serve at the pleasure of the Board. In addition to Mr. Truscott, who is Senior Vice President, the Funds' other officers are:
Fund Officers
Name,
Address and
Year of Birth | | Position and Year
First Appointed to
Position for any Fund
in the Columbia
Funds Complex or a
Predecessor Thereof | | Principal Occupation(s) During Past Five Years | |
Christopher O. Petersen
5228 Ameriprise
Financial Center
Minneapolis, MN 55474
Born 1970 | | President and Principal Executive Officer (2015) | | Vice President and Lead Chief Counsel, Ameriprise Financial, Inc. since January 2015 (previously, Vice President and Chief Counsel January 2010-December 2014; and Vice President and Group Counsel or Counsel 2004-January 2010); officer of Columbia Funds and affiliated funds since 2007. | |
Michael G. Clarke
225 Franklin Street
Boston, MA 02110
Born 1969 | | Treasurer (2011) and Chief Financial Officer (2009) | | Vice President — Mutual Fund Administration, Columbia Management Investment Advisers, LLC, since May 2010; Managing Director of Fund Administration, Columbia Management Advisors, LLC, September 2004-April 2010; senior officer of Columbia Funds and affiliated funds since 2002. | |
Paul B. Goucher
100 Park Avenue
New York, NY 10017
Born 1968 | | Senior Vice President (2011), Chief Legal Officer (2015) and Assistant Secretary (2008) | | Vice President and Lead Chief Counsel, Ameriprise Financial, Inc. since November 2008 and January 2013, respectively (previously Chief Counsel, January 2010-January 2013 and Group Counsel, November 2008-January 2010). | |
Thomas P. McGuire
225 Franklin Street
Boston, MA 02110
Born 1972 | | Vice President and Chief Compliance Officer (2012) | | Vice President — Asset Management Compliance, Ameriprise Financial, Inc., since May 2010; Chief Compliance Officer, Ameriprise Certificate Company since September 2010; Compliance Executive, Bank of America, 2005-April 2010. | |
Colin Moore
225 Franklin Street
Boston, MA 02110
Born 1958 | | Senior Vice President (2010) | | Executive Vice President and Global Chief Investment Officer, Ameriprise Financial, Inc., since July 2013; Director and Global Chief Investment Officer, Columbia Management Investment Advisers, LLC since May 2010; Manager, Managing Director and Chief Investment Officer, Columbia Management Advisors, LLC, 2007-April 2010. | |
Michael E. DeFao
225 Franklin Street
Boston, MA 02110
Born 1968 | | Vice President (2011) and Assistant Secretary (2010) | | Vice President and Chief Counsel, Ameriprise Financial, Inc. since May 2010; Associate General Counsel, Bank of America, 2005-April 2010. | |
Joseph F. DiMaria
225 Franklin Street
Boston, MA 02110
Born 1968 | | Vice President (2011), Assistant Treasurer (2012) and Chief Accounting Officer (2008) | | Vice President — Mutual Fund Treasurer, Columbia Management Investment Advisers, LLC since May 2010; Director of Fund Administration, Columbia Management Advisors, LLC, 2006-April 2010. | |
Amy Johnson
5228 Ameriprise
Financial Center
Minneapolis, MN 55474
Born 1965 | | Vice President (2006) | | Managing Director and Chief Operating Officer, Columbia Management Investment Advisers, LLC since May 2010 (previously Chief Administrative Officer, 2009-April 2010, and Vice President — Asset Management and Trust Company Services, 2006-2009). | |
Lyn Kephart-Strong
5228 Ameriprise
Financial Center
Minneapolis, MN 55474
Born 1960 | | Vice President (2015) | | President, Columbia Management Investment Services Corp. since October 2014; Vice President & Resolution Officer, Ameriprise Trust Company since August 2009; President, RiverSource Service Corporation 2004-2010. | |
Ryan C. Larrenaga
225 Franklin Street
Boston, MA 02110
Born 1970 | | Vice President and Secretary (2015) | | Vice President and Group Counsel, Ameriprise Financial, Inc. since August 2011 (previously, Counsel from May 2010 to August 2011); Assistant General Counsel, Bank of America, 2005-April 2010; officer of Columbia Funds and affiliated funds since 2005. | |
Annual Report 2015
46
COLUMBIA INTERNATIONAL VALUE FUND
IMPORTANT INFORMATION ABOUT THIS REPORT
Each fund mails one shareholder report to each shareholder address. If you would like more than one report, please call shareholder services at 800.345.6611 and additional reports will be sent to you.
The policy of the Board is to vote the proxies of the companies in which each fund holds investments consistent with the procedures as stated in the Statement of Additional Information (SAI). You may obtain a copy of the SAI without charge by calling 800.345.6611; contacting your financial intermediary; visiting columbiathreadneedle.com/us; or searching the website of the Securities and Exchange Commission (SEC) at sec.gov. Information regarding how each fund voted proxies relating to portfolio securities is filed with the SEC by August 31st for the most recent 12-month period ending June 30th of that year, and is available without charge by visiting columbiathreadneedle.com/us; or searching the website of the SEC at sec.gov.
Each fund files a complete schedule of portfolio holdings with the SEC for the first and third quarters of each fiscal year on Form N-Q. Each fund's Form N-Q is available on the SEC's website at sec.gov and may be reviewed and copied at the SEC's Public Reference Room in Washington, D.C. Information on the operation of the Public Reference Room may be obtained by calling 800.SEC.0330. Each fund's complete schedule of portfolio holdings, as filed on Form N-Q, can also be obtained without charge, upon request, by calling 800.345.6611.
Annual Report 2015
47
Columbia International Value Fund
P.O. Box 8081
Boston, MA 02266-8081

This information is for use with concurrent or prior delivery of a fund prospectus. Please read and consider the investment objectives, risks, charges and expenses for any fund carefully before investing. For a prospectus and summary prospectus, which contains this and other important information about the Fund, go to columbiathreadneedle.com/us. The Fund is distributed by Columbia Management Investment Distributors, Inc., member FINRA, and managed by Columbia Management Investment Advisers, LLC.
Columbia Threadneedle Investments (Columbia Threadneedle) is the global brand name of the Columbia and Threadneedle group of companies.
All rights reserved. Columbia Management Investment Distributors, Inc., 225 Franklin Street, Boston, MA 02110-2804
© 2015 Columbia Management Investment Advisers, LLC.
columbiathreadneedle.com/us
ANN170_02_E01_(04/15)

ANNUAL REPORT
February 28, 2015

COLUMBIA MARSICO GLOBAL FUND

 Dear Shareholder,
In a world that is changing faster than ever before, investors want asset managers who offer a global perspective while generating strong and sustainable returns. To that end, Columbia Management, in conjunction with its U.K.-based affiliate, Threadneedle Investments, has rebranded to Columbia Threadneedle Investments. The new global brand represents the combined capabilities, resources and reach of the global group, offering investors access to the best of both firms.
With a presence in 18 countries and more than 450 investment professionals*, our collective perspective and world view as Columbia Threadneedle Investments gives us deeper insight into what might affect the real-life financial outcomes clients are seeking. Putting our views into a global context enables us to build richer perspectives and create the right solutions, and provides us with enhanced capabilities to deliver consistent investment performance, which may ultimately lead to better investor outcomes.
As a result of the rebrand, you will begin to see our new logo and colors reflected in printed materials, such as this shareholder report, as well as on our new website — columbiathreadneedle.com/us. We encourage you to visit us online and view a new video on the "About Us" tab that speaks to the strength of the firm.
While we are introducing a new brand, in many ways, the investment company you know well has not changed. The following remain in effect:
n Fund and strategy names
n Established investment teams, philosophies and processes
n Account services, features, servicing phone numbers and mailing addresses
n Columbia Management Investment Distributors as distributor and Columbia Management Investment Advisers as investment adviser
We recognize that the money we manage represents the hard work and savings of people like you, and that everyone has different ambitions and different definitions of success. Investors have varying goals — funding their children's education, enjoying their retirement, putting money aside for unexpected events, and more. Whatever your ambitions, we believe our wide range of investment products and solutions can help give you confidence that you will reach your goals.
The world is constantly changing, but our priority remains the same: to help you secure your finances, meet your goals and achieve success. Thank you for your continued investment with us. Our service representatives are available at 800.345.6611 to help with any questions.
Sincerely,

Christopher O. Petersen
President, Columbia Funds
Investors should consider the investment objectives, risks, charges and expenses of a mutual fund carefully before investing. For a free prospectus and summary prospectus, which contains this and other important information about a fund, visit columbiathreadneedle.com/us. The prospectus should be read carefully before investing.
* Source: Ameriprise as of December 1, 2014
Columbia Funds are distributed by Columbia Management Investment Distributors, Inc., member FINRA, and managed by Columbia Management Investment Advisers, LLC.
© 2015 Columbia Management Investment Advisers, LLC. All rights reserved.
COLUMBIA MARSICO GLOBAL FUND
Performance Overview | | | 2 | | |
Manager Discussion of Fund Performance | | | 4 | | |
Understanding Your Fund's Expenses | | | 7 | | |
Portfolio of Investments | | | 8 | | |
Statement of Assets and Liabilities | | | 11 | | |
Statement of Operations | | | 13 | | |
Statement of Changes in Net Assets | | | 14 | | |
Financial Highlights | | | 16 | | |
Notes to Financial Statements | | | 22 | | |
Report of Independent Registered
Public Accounting Firm | | | 29 | | |
Federal Income Tax Information | | | 30 | | |
Trustees and Officers | | | 31 | | |
Important Information About This Report | | | 37 | | |
Fund Investment Manager
Columbia Management Investment
Advisers, LLC
225 Franklin Street
Boston, MA 02110
Fund Distributor
Columbia Management Investment
Distributors, Inc.
225 Franklin Street
Boston, MA 02110
Fund Transfer Agent
Columbia Management Investment
Services Corp.
P.O. Box 8081
Boston, MA 02266-8081
For more information about any of the funds, please visit columbiathreadneedle.com/us or call 800.345.6611. Customer Service Representatives are available to answer your questions Monday through Friday from 8 a.m. to 7 p.m. Eastern time.
The views expressed in this report reflect the current views of the respective parties. These views are not guarantees of future performance and involve certain risks, uncertainties and assumptions that are difficult to predict, so actual outcomes and results may differ significantly from the views expressed. These views are subject to change at any time based upon economic, market or other conditions and the respective parties disclaim any responsibility to update such views. These views may not be relied on as investment advice and, because investment decisions for a Columbia fund are based on numerous factors, may not be relied on as an indication of trading intent on behalf of any particular Columbia fund. References to specific securities should not be construed as a recommendation or investment advice.
COLUMBIA MARSICO GLOBAL FUND
Performance Summary
n Columbia Marsico Global Fund (the Fund) Class A shares returned 7.53% excluding sales charges for the 12-month period that ended February 28, 2015.
n The Fund slightly underperformed its benchmark, the MSCI All Country World Index (Net), which returned 7.55% during the same time period.
n While the currency effect was the most significant contributor to Fund performance, stock selection in the materials sector, along with an overweight relative to the benchmark in healthcare, also contributed.
Average Annual Total Returns (%) (for period ended February 28, 2015)
| | | Inception | | 1 Year | | 5 Years | | Life | |
Class A | | 04/30/08 | | | | | | | |
Excluding sales charges | | | | | 7.53 | | | | 15.22 | | | | 7.12 | | |
Including sales charges | | | | | 1.33 | | | | 13.86 | | | | 6.20 | | |
Class C | | 04/30/08 | | | | | | | |
Excluding sales charges | | | | | 6.74 | | | | 14.35 | | | | 6.33 | | |
Including sales charges | | | | | 5.79 | | | | 14.35 | | | | 6.33 | | |
Class R | | 04/30/08 | | | 7.30 | | | | 14.92 | | | | 6.85 | | |
Class R4* | | 01/08/14 | | | 7.83 | | | | 15.28 | | | | 7.16 | | |
Class R5* | | 01/08/14 | | | 7.90 | | | | 15.30 | | | | 7.17 | | |
Class Z | | 04/30/08 | | | 7.83 | | | | 15.49 | | | | 7.39 | | |
MSCI All Country World Index (Net) | | | | | 7.55 | | | | 10.71 | | | | 4.02 | | |
Returns for Class A are shown with and without the maximum initial sales charge of 5.75%. Returns for Class C are shown with and without the 1.00% contingent deferred sales charges for the first year only. The Fund's other classes are not subject to sales charges and have limited eligibility. Please see the Fund's prospectus for details. Performance for different share classes will vary based on differences in sales charges and fees associated with each class. All results shown assume reinvestment of distributions during the period. Returns do not reflect the deduction of taxes that a shareholder may pay on Fund distributions or on the redemption of Fund shares. Performance results reflect the effect of any fee waivers or reimbursements of Fund expenses by Columbia Management Investment Advisers, LLC and/or any of its affiliates. Absent these fee waivers or expense reimbursement arrangements, performance results would have been lower.
The performance information shown represents past performance and is not a guarantee of future results. The investment return and principal value of your investment will fluctuate so that your shares, when redeemed, may be worth more or less than their original cost. Current performance may be lower or higher than the performance information shown. You may obtain performance information current to the most recent month-end by contacting your financial intermediary, visiting columbiathreadneedle.com/us or calling 800.345.6611.
*The returns shown for periods prior to the share class inception date (including returns for the Life of the Fund, if shown, which are since Fund inception) include the returns of the Fund's oldest share class. Since the Fund launched more than one class of shares at its inception, Class A shares were used. These returns are adjusted to reflect any higher class-related operating expenses of the newer share classes, as applicable. Please visit columbiathreadneedle.com/us/investment-products/mutual-funds/appended-performance for more information.
The MSCI All Country World Index (Net) is a free float-adjusted market capitalization weighted index that is designed to measure the equity market performance of developed and emerging markets. The index consists of 45 country indices comprising 24 developed and 21 emerging market country indices.
Indices are not available for investment, are not professionally managed and do not reflect sales charges, fees, brokerage commissions, taxes (except the MSCI All Country World Index (Net), which reflects reinvested dividends net of withholding taxes) or other expenses of investing. Securities in the Fund may not match those in an index.
Annual Report 2015
2
COLUMBIA MARSICO GLOBAL FUND
PERFORMANCE OVERVIEW (continued)
Performance of a Hypothetical $10,000 Investment (April 30, 2008 – February 28, 2015)
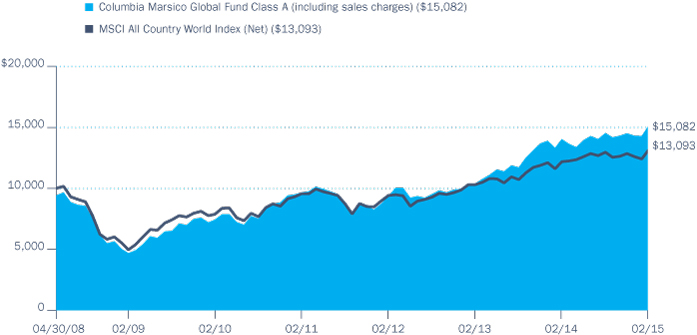
The chart above shows the change in value of a hypothetical $10,000 investment in Class A shares of Columbia Marsico Global Fund during the stated time period, and does not reflect the deduction of taxes that a shareholder may pay on Fund distributions or on the redemption of Fund shares.
Annual Report 2015
3
COLUMBIA MARSICO GLOBAL FUND
MANAGER DISCUSSION OF FUND PERFORMANCE
Portfolio Management
Marsico Capital Management, LLC
Thomas Marsico
Morningstar Style BoxTM

The Morningstar Style BoxTM is based on a fund's portfolio holdings. For equity funds, the vertical axis shows the market capitalization of the stocks owned, and the horizontal axis shows investment style (value, blend, or growth). Information shown is based on the most recent data provided by Morningstar.
© 2015 Morningstar, Inc. All rights reserved. The Morningstar information contained herein: (1) is proprietary to Morningstar and/or its content providers; (2) may not be copied or distributed; and (3) is not warranted to be accurate, complete or timely. Neither Morningstar nor its content providers are responsible for any damages or losses arising from any use of this information.
Top Ten Holdings (%)
(at February 28, 2015) | |
ASML Holding NV (Netherlands) | | | 4.9 | | |
Facebook, Inc., Class A
(United States) | | | 4.7 | | |
Apple, Inc. (United States) | | | 4.6 | | |
Liberty Global PLC, Class C
(United Kingdom) | | | 4.5 | | |
Canadian Pacific Railway Ltd.
(Canada) | | | 4.4 | | |
Gilead Sciences, Inc.
(United States) | | | 4.4 | | |
Novartis AG, Registered Shares
(Switzerland) | | | 4.3 | | |
Domino's Pizza Group PLC
(United Kingdom) | | | 3.8 | | |
Bayerische Motoren Werke AG
(Germany) | | | 3.4 | | |
Actavis PLC (Ireland) | | | 3.4 | | |
Percentages indicated are based upon total investments (excluding Money Market Funds).
For the 12-month period that ended February 28, 2015, the Fund's Class A shares returned 7.53% excluding sales charges. The Fund slightly underperformed its benchmark, the MSCI All Country World Index (Net), which returned 7.55% for the same 12-month period. While the currency effect was the most significant contributor to Fund performance, stock selection in the materials sector, along with an overweight relative to the benchmark in healthcare, also contributed. Stock selection in the consumer discretionary sector was the primary detractor during the period.
International Stock Markets Were Volatile as Oil Prices Fell
International stock markets were volatile and posted mixed results during the reporting period. During the second half of the period, crude oil prices fell sharply, trading at their lowest levels since 2009, although they did rebound slightly toward the end of the period. The decline stemmed in part from slowing growth in demand, as reflected in China's continuing economic sputter, as well as stagnating growth in Europe. Importantly, increased oil supply was also a primary contributor to falling prices, as fracking technologies drove petroleum supplies higher in the U.S., while other countries maintained or increased production.
In contrast with other major economies, employment gains in the United States built momentum throughout the year, averaging approximately 290,000 per month over the six months through February. Real gross domestic product ranged from an annualized 5% in the second quarter to 2.2% in the fourth quarter of 2014. The U.S. dollar strengthened vs. many other major world currencies during the period, a reflection of growing confidence in the U.S. economy and a firming of short-term interest rates, along with widespread expectations of quantitative easing from the European Central Bank and the Bank of Japan.
Portfolio Recap
The currency effect was the most significant contributor to performance during the reporting period. Relative to the benchmark, the Fund was overweight in stocks denominated in the U.S. dollar and British pound sterling, both of which strengthened significantly vs. other major currencies. The Fund was also underweight in securities denominated in Japanese yen which depreciated vs. other major currencies. Although currency had a positive effect on performance, it is a byproduct, not a central focus, of our stock selection process.
The Fund also benefited from its overweight in health care and information technology, two strong-performing sectors in the benchmark. In addition, the Fund was helped by its underweight to energy, the weakest-performing sector in the benchmark. The Fund's positive contribution from sector allocation was offset somewhat by its cash balance which created an opportunity cost to performance given the strong market return.
Stock selection in the materials and industrials sectors added to results. Paint retailer Sherwin-Williams performed well due in part to its strong market share with contractors, new and residential construction and the renovation of existing homes. The company also reported strong sales from its stores during the period. We currently believe Sherwin-Williams has pricing power and will continue to gain market share in its category.
Annual Report 2015
4
COLUMBIA MARSICO GLOBAL FUND
MANAGER DISCUSSION OF FUND PERFORMANCE (continued)
Canadian Pacific Railway was the Fund's leading holding within the industrials sector and aided performance during the period. We consider Canadian Pacific to be a "life cycle change" company as the railroad operator takes steps to improve operations and cut costs. Biotech company Gilead Sciences emerged as the Fund's largest individual contributor. The company benefited from FDA approval of its revolutionary hepatitis C drugs, Solvadi and Harnovi. Solvadi, is a single pill that is being used with an amalgam of other, older drugs to treat hepatitis C, while Harnovi, its once-per-day fixed dose combination treatment, is expected to be a major improvement over existing treatment options.
Stock selection in the consumer discretionary and information technology sectors was the primary source of underperformance during the period. Hotel/casino operator Wynn Macau was the Fund's largest individual detractor during the period. A slowing economy in China and the Chinese government's efforts to crack down on corruption resulted in disappointing results from Wynn's VIP business in the Macau market. While we have confidence in the company's long-term prospects, we believe the near-term results will be a challenge and elected to sell the position. Online travel services company Priceline also underperformed and was sold during the period. Priceline's international business was negatively impacted by the strengthening U.S. dollar and currency translation as weak currencies were exchanged for dollars. PriceSmart, an operator of shopping warehouse clubs, also underperformed as it was negatively impacted by currency headwinds and was sold during the period.
Portfolio Activity
We re-initiated a position in Apple following a period of consolidation for the company. We believe that the company shares characteristics of both an offensive and defensive growth investment, and we do not think Apple shares reflect upcoming hardware, software and services innovation. We expect market share gains for iPhone with the release of larger screen sizes to power a re-acceleration in growth. Liberty Global, the largest international cable company, with 27 million customers in 14 countries, was added to the portfolio during the period. We believe the growth of the cable industry in Europe is lagging the U.S. and offers significant upside opportunity. We believe that the recent acquisitions of U.K.-based Virgin media and Dutch cable operator Ziggo should provide for deeper penetration of Liberty Global into European markets and help contribute to earnings.
We also purchased Swiss pharmaceutical company Norvartis, which has a diversified mix of products focused mainly on cancer, heart disease, auto immune disease neuroscience and specialty care. Though the pharmaceutical division saw limited growth in 2014 mainly due to patent expiration issues, the company has presented late-stage data and associated filings for several promising drugs going forward. The expected return to growth driven by these new drugs is the core of our investment thesis in Norvartis.
In addition to Wynn Macau, Priceline and PriceSmart, we sold Mexico-based Alsea, which operates Domino's Pizza, Starbucks, Burger King and other franchise outlets in South America. We sold the stock after what we
For further detail about these holdings, please refer to the section entitled "Portfolio of Investments."
Fund holdings are as of the date given, are subject to change at any time, and are not recommendations to buy or sell any security.
Portfolio Breakdown (%)
(at February 28, 2015) | |
Common Stocks | | | 90.4 | | |
Consumer Discretionary | | | 24.8 | | |
Financials | | | 1.6 | | |
Health Care | | | 24.5 | | |
Industrials | | | 8.1 | | |
Information Technology | | | 25.6 | | |
Materials | | | 5.8 | | |
Money Market Funds | | | 9.6 | | |
Total | | | 100.0 | | |
Percentages indicated are based upon total investments. The Fund's portfolio composition is subject to change.
Country Breakdown (%)
(at February 28, 2015) | |
Australia | | | 0.2 | | |
Belgium | | | 1.5 | | |
Canada | | | 6.0 | | |
China | | | 4.2 | | |
France | | | 3.4 | | |
Germany | | | 3.1 | | |
India | | | 2.7 | | |
Ireland | | | 3.0 | | |
Netherlands | | | 4.4 | | |
Switzerland | | | 3.9 | | |
United Kingdom | | | 13.4 | | |
United States(a) | | | 54.2 | | |
Total | | | 100.0 | | |
Country Breakdown is based primarily on issuer's place of organization/incorporation. Percentages indicated are based upon total investments. The Fund's portfolio composition is subject to change.
(a) Includes investments in Money Market Funds.
Annual Report 2015
5
COLUMBIA MARSICO GLOBAL FUND
MANAGER DISCUSSION OF FUND PERFORMANCE (continued)
Investment Risks
Market risk may affect a single issuer, sector of the economy, industry or the market as a whole. Growth securities, at times, may not perform as well as value securities or the stock market in general and may be out of favor with investors. International investing involves certain risks and volatility due to potential political, economic or currency instabilities and different financial and accounting standards. Risks are enhanced for emerging market issuers. See the Fund's prospectus for more information on these and other risks.
considered to be a questionable acquisition in Spain that wasn't consistent with their Latin American growth strategy. U.K.-based television company Sky PLC was also sold when we became more concerned about increased competition from telecommunications carriers which could pressure the satellite provider's earnings.
Looking Ahead
Two key issues affecting stock markets at the end of the period were declining oil prices (and their commensurate effects) and central bank policies. On balance, lower oil prices improve prospects for growth and low inflation. Thus the slide in oil prices is a positive for the U.S. economy as well as other countries which are net importers of oil, such as China, Japan and India. We believe oil prices will eventually move higher as fracking activity eases and supply tightens. Compared with much of the rest of the world, we believe the U.S. economy currently appears to be relatively healthy. While central banks of other countries focus on efforts to stimulate their economies, the U.S Federal Reserve may confront a much better-than-expected pace of economic expansion.
We continue to favor companies that we believe are gaining market share in large and growing markets. The Fund emphasizes investments in businesses with strong recurring revenues, strong free cash flow generation, pricing power and responsible capital allocation. We are also evaluating investment opportunities in companies that are poised to benefit from increased pricing power in their businesses as a result of consolidation. In this lower growth environment, share buybacks and dividends may be material contributors to total returns.
Annual Report 2015
6
COLUMBIA MARSICO GLOBAL FUND
UNDERSTANDING YOUR FUND'S EXPENSES
(Unaudited)
As an investor, you incur two types of costs. There are transaction costs, which generally include sales charges on purchases and may include redemption fees. There are also ongoing costs, which generally include management fees, distribution and/or service fees, and other fund expenses. The following information is intended to help you understand your ongoing costs (in dollars) of investing in the Fund and to help you compare these costs with the ongoing costs of investing in other mutual funds.
Analyzing Your Fund's Expenses
To illustrate these ongoing costs, we have provided examples and calculated the expenses paid by investors in each share class of the Fund during the period. The actual and hypothetical information in the table is based on an initial investment of $1,000 at the beginning of the period indicated and held for the entire period. Expense information is calculated two ways and each method provides you with different information. The amount listed in the "Actual" column is calculated using the Fund's actual operating expenses and total return for the period. You may use the Actual information, together with the amount invested, to estimate the expenses that you paid over the period. Simply divide your account value by $1,000 (for example, an $8,600 account value divided by $1,000 = 8.6), then multiply the results by the expenses paid during the period under the "Actual" column. The amount listed in the "Hypothetical" column assumes a 5% annual rate of return before expenses (which is not the Fund's actual return) and then applies the Fund's actual expense ratio for the period to the hypothetical return. You should not use the hypothetical account values and expenses to estimate either your actual account balance at the end of the period or the expenses you paid during the period. See "Compare With Other Funds" below for details on how to use the hypothetical data.
Compare With Other Funds
Since all mutual funds are required to include the same hypothetical calculations about expenses in shareholder reports, you can use this information to compare the ongoing cost of investing in the Fund with other funds. To do so, compare the hypothetical example with the 5% hypothetical examples that appear in the shareholder reports of other funds. As you compare hypothetical examples of other funds, it is important to note that hypothetical examples are meant to highlight the ongoing costs of investing in a fund only and do not reflect any transaction costs, such as sales charges, or redemption or exchange fees. Therefore, the hypothetical calculations are useful in comparing ongoing costs only, and will not help you determine the relative total costs of owning different funds. If transaction costs were included in these calculations, your costs would be higher.
September 1, 2014 – February 28, 2015
| | | Account Value at the Beginning
of the Period ($) | | Account Value at the End of the
Period ($) | | Expenses Paid During the
Period ($) | | Fund's Annualized
Expense Ratio (%) | |
| | | Actual | | Hypothetical | | Actual | | Hypothetical | | Actual | | Hypothetical | | Actual | |
Class A | | | 1,000.00 | | | | 1,000.00 | | | | 1,038.50 | | | | 1,017.50 | | | | 7.57 | | | | 7.49 | | | | 1.49 | | |
Class C | | | 1,000.00 | | | | 1,000.00 | | | | 1,034.40 | | | | 1,013.76 | | | | 11.36 | | | | 11.25 | | | | 2.24 | | |
Class R | | | 1,000.00 | | | | 1,000.00 | | | | 1,037.40 | | | | 1,016.26 | | | | 8.84 | | | | 8.75 | | | | 1.74 | | |
Class R4 | | | 1,000.00 | | | | 1,000.00 | | | | 1,039.60 | | | | 1,018.75 | | | | 6.31 | | | | 6.24 | | | | 1.24 | | |
Class R5 | | | 1,000.00 | | | | 1,000.00 | | | | 1,040.30 | | | | 1,019.05 | | | | 6.00 | | | | 5.94 | | | | 1.18 | | |
Class Z | | | 1,000.00 | | | | 1,000.00 | | | | 1,039.60 | | | | 1,018.75 | | | | 6.31 | | | | 6.24 | | | | 1.24 | | |
Expenses paid during the period are equal to the annualized expense ratio for each class as indicated above, multiplied by the average account value over the period and then multiplied by the number of days in the Fund's most recent fiscal half year and divided by 365.
Expenses do not include fees and expenses incurred indirectly by the Fund from its investment in underlying funds, including affiliated and non-affiliated pooled investment vehicles, such as mutual funds and exchange-traded funds.
Had Columbia Management Investment Advisers, LLC and/or certain of its affiliates not waived/reimbursed certain fees and expenses, account value at the end of the period would have been reduced.
Annual Report 2015
7
COLUMBIA MARSICO GLOBAL FUND
PORTFOLIO OF INVESTMENTS
February 28, 2015
(Percentages represent value of investments compared to net assets)
Common Stocks 87.6%
Issuer | | Shares | | Value ($) | |
AUSTRALIA 0.2% | |
Domino's Pizza Enterprises Ltd. | | | 4,303 | | | | 116,977 | | |
BELGIUM 1.5% | |
UCB SA | | | 10,732 | | | | 820,859 | | |
CANADA 5.8% | |
Canadian Pacific Railway Ltd. | | | 11,416 | | | | 2,137,817 | | |
Valeant Pharmaceuticals International, Inc.(a) | | | 5,449 | | | | 1,076,069 | | |
Total | | | | | 3,213,886 | | |
CHINA 4.1% | |
Alibaba Group Holding Ltd., ADR(a) | | | 13,935 | | | | 1,186,147 | | |
Tencent Holdings Ltd. | | | 61,000 | | | | 1,064,313 | | |
Total | | | | | 2,250,460 | | |
FRANCE 3.3% | |
Hermes International | | | 2,175 | | | | 701,825 | | |
Safran SA | | | 15,596 | | | | 1,097,775 | | |
Total | | | | | 1,799,600 | | |
GERMANY 3.0% | |
Bayerische Motoren Werke AG | | | 12,892 | | | | 1,630,228 | | |
INDIA 2.6% | |
Tata Motors Ltd., ADR | | | 29,231 | | | | 1,438,750 | | |
IRELAND 2.9% | |
Actavis PLC(a) | | | 5,588 | | | | 1,628,120 | | |
NETHERLANDS 4.3% | |
| ASML Holding NV | | | 21,850 | | | | 2,352,808 | | |
SWITZERLAND 3.8% | |
Novartis AG, Registered Shares | | | 20,480 | | | | 2,093,435 | | |
UNITED KINGDOM 12.9% | |
ARM Holdings PLC | | | 68,175 | | | | 1,219,871 | | |
BAE Systems PLC | | | 131,000 | | | | 1,075,941 | | |
Domino's Pizza Group PLC | | | 164,680 | | | | 1,836,894 | | |
Hargreaves Lansdown PLC | | | 48,859 | | | | 852,370 | | |
Liberty Global PLC, Class C(a) | | | 41,338 | | | | 2,156,603 | | |
Total | | | | | 7,141,679 | | |
Common Stocks (continued)
Issuer | | Shares | | Value ($) | |
UNITED STATES 43.2% | |
Apple, Inc. | | | 17,323 | | | | 2,225,313 | | |
Biogen Idec, Inc.(a) | | | 3,722 | | | | 1,524,494 | | |
Celldex Therapeutics, Inc.(a) | | | 43,073 | | | | 1,100,084 | | |
Dollar Tree, Inc.(a) | | | 13,444 | | | | 1,071,218 | | |
Electronic Arts, Inc.(a) | | | 9,227 | | | | 527,600 | | |
Facebook, Inc., Class A(a) | | | 28,896 | | | | 2,281,917 | | |
FleetCor Technologies, Inc.(a) | | | 6,718 | | | | 1,030,743 | | |
Gilead Sciences, Inc.(a) | | | 20,581 | | | | 2,130,751 | | |
Inovalon Holdings, Inc., Class A(a) | | | 1,508 | | | | 46,838 | | |
Juno Therapeutics, Inc.(a) | | | 13,231 | | | | 620,799 | | |
LinkedIn Corp., Class A(a) | | | 1,022 | | | | 273,078 | | |
Monsanto Co. | | | 12,681 | | | | 1,527,173 | | |
Nike, Inc., Class B | | | 13,560 | | | | 1,316,947 | | |
Pacira Pharmaceuticals, Inc.(a) | | | 8,366 | | | | 960,166 | | |
Shake Shack, Inc., Class A(a) | | | 1,810 | | | | 78,101 | | |
Sherwin-Williams Co. (The) | | | 5,602 | | | | 1,597,690 | | |
Starwood Hotels & Resorts Worldwide, Inc. | | | 8,105 | | | | 651,075 | | |
Tesla Motors, Inc.(a) | | | 4,015 | | | | 816,410 | | |
UnitedHealth Group, Inc. | | | 9,744 | | | | 1,107,211 | | |
Visa, Inc., Class A | | | 5,654 | | | | 1,533,987 | | |
Walt Disney Co. (The) | | | 13,836 | | | | 1,440,051 | | |
Total | | | | | 23,861,646 | | |
Total Common Stocks
(Cost: $40,203,487) | | | | | 48,348,448 | | |
Money Market Funds 9.3%
| | | Shares | | Value ($) | |
Columbia Short-Term Cash Fund,
0.118%(b)(c) | | | 5,141,885 | | | | 5,141,885 | | |
Total Money Market Funds
(Cost: $5,141,885) | | | | | 5,141,885 | | |
Total Investments
(Cost: $45,345,372) | | | | | 53,490,333 | | |
Other Assets & Liabilities, Net | | | | | 1,705,794 | | |
Net Assets | | | | | 55,196,127 | | |
The accompanying Notes to Financial Statements are an integral part of this statement.
Annual Report 2015
8
COLUMBIA MARSICO GLOBAL FUND
PORTFOLIO OF INVESTMENTS (continued)
February 28, 2015
Notes to Portfolio of Investments
(a) Non-income producing.
(b) The rate shown is the seven-day current annualized yield at February 28, 2015.
(c) As defined in the Investment Company Act of 1940, an affiliated company is one in which the Fund owns 5% or more of the company's outstanding voting securities, or a company which is under common ownership or control with the Fund. Holdings and transactions in these affiliated companies during the year ended February 28, 2015, are as follows:
Issuer | | Beginning
Cost ($) | | Purchase
Cost ($) | | Proceeds
From Sales ($) | | Ending
Cost ($) | | Dividends —
Affiliated
Issuers ($) | | Value ($) | |
Columbia Short-Term Cash Fund | | | 1,435,339 | | | | 40,241,522 | | | | (36,534,976 | ) | | | 5,141,885 | | | | 3,242 | | | | 5,141,885 | | |
Abbreviation Legend
ADR American Depositary Receipt
Fair Value Measurements
Generally accepted accounting principles (GAAP) require disclosure regarding the inputs and valuation techniques used to measure fair value and any changes in valuation inputs or techniques. In addition, investments shall be disclosed by major category.
The Fund categorizes its fair value measurements according to a three-level hierarchy that maximizes the use of observable inputs and minimizes the use of unobservable inputs by prioritizing that the most observable input be used when available. Observable inputs are those that market participants would use in pricing an investment based on market data obtained from sources independent of the reporting entity. Unobservable inputs are those that reflect the Fund's assumptions about the information market participants would use in pricing an investment. An investment's level within the fair value hierarchy is based on the lowest level of any input that is deemed significant to the asset or liability's fair value measurement. The input levels are not necessarily an indication of the risk or liquidity associated with investments at that level. For example, certain U.S. government securities are generally high quality and liquid, however, they are reflected as Level 2 because the inputs used to determine fair value may not always be quoted prices in an active market.
Fair value inputs are summarized in the three broad levels listed below:
> Level 1 — Valuations based on quoted prices for investments in active markets that the Fund has the ability to access at the measurement date (including NAV for open-end mutual funds). Valuation adjustments are not applied to Level 1 investments.
> Level 2 — Valuations based on other significant observable inputs (including quoted prices for similar securities, interest rates, prepayment speeds, credit risks, etc.).
> Level 3 — Valuations based on significant unobservable inputs (including the Fund's own assumptions and judgment in determining the fair value of investments).
Inputs that are used in determining fair value of an investment may include price information, credit data, volatility statistics, and other factors. These inputs can be either observable or unobservable. The availability of observable inputs can vary between investments, and is affected by various factors such as the type of investment, and the volume and level of activity for that investment or similar investments in the marketplace. The inputs will be considered by the Investment Manager, along with any other relevant factors in the calculation of an investment's fair value. The Fund uses prices and inputs that are current as of the measurement date, which may include periods of market dislocations. During these periods, the availability of prices and inputs may be reduced for many investments. This condition could cause an investment to be reclassified between the various levels within the hierarchy.
Foreign equity securities actively traded in markets where there is a significant delay in the local close relative to the New York Stock Exchange (NYSE) are classified as Level 2. The values of these securities may include an adjustment to reflect the impact of significant market movements following the close of local trading, as described in Note 2 to the financial statements — Security Valuation.
Investments falling into the Level 3 category are primarily supported by quoted prices from brokers and dealers participating in the market for those investments. However, these may be classified as Level 3 investments due to lack of market transparency and corroboration to support these quoted prices. Additionally, valuation models may be used as the pricing source for any remaining investments classified as Level 3. These models may rely on one or more significant unobservable inputs and/or significant assumptions by the Investment Manager. Inputs used in valuations may include, but are not limited to, financial statement analysis, capital account balances, discount rates and estimated cash flows, and comparable company data.
Under the direction of the Fund's Board of Trustees (the Board), the Investment Manager's Valuation Committee (the Committee) is responsible for overseeing the valuation procedures approved by the Board. The Committee consists of voting and non-voting members from various groups within the Investment Manager's organization, including operations and accounting, trading and investments, compliance, risk management and legal.
The accompanying Notes to Financial Statements are an integral part of this statement.
Annual Report 2015
9
COLUMBIA MARSICO GLOBAL FUND
PORTFOLIO OF INVESTMENTS (continued)
February 28, 2015
Fair Value Measurements (continued)
The Committee meets at least monthly to review and approve valuation matters, which may include a description of specific valuation determinations, data regarding pricing information received from approved pricing vendors and brokers and the results of Board-approved valuation control policies and procedures (the Policies). The Policies address, among other things, instances when market quotations are or are not readily available, including recommendations of third party pricing vendors and a determination of appropriate pricing methodologies; events that require specific valuation determinations and assessment of fair value techniques; securities with a potential for stale pricing, including those that are illiquid, restricted, or in default; and the effectiveness of third party pricing vendors, including periodic reviews of vendors. The Committee meets more frequently, as needed, to discuss additional valuation matters, which may include the need to review back-testing results, review time-sensitive information or approve related valuation actions. The Committee reports to the Board, with members of the Committee meeting with the Board at each of its regularly scheduled meetings to discuss valuation matters and actions during the period, similar to those described earlier.
For investments categorized as Level 3, the Committee monitors information similar to that described above, which may include: (i) data specific to the issuer or comparable issuers, (ii) general market or specific sector news and (iii) quoted prices and specific or similar security transactions. The Committee considers this data and any changes from prior periods in order to assess the reasonableness of observable and unobservable inputs, any assumptions or internal models used to value those securities and changes in fair value. This data is also used to corroborate, when available, information received from approved pricing vendors and brokers. Various factors impact the frequency of monitoring this information (which may occur as often as daily). However, the Committee may determine that changes to inputs, assumptions and models are not required as a result of the monitoring procedures performed.
The following table is a summary of the inputs used to value the Fund's investments at February 28, 2015:
Description | | Level 1
Quoted Prices in Active
Markets for Identical
Assets ($) | | Level 2
Other Significant
Observable Inputs ($) | | Level 3
Significant
Unobservable Inputs ($) | | Total ($) | |
Equity Securities | |
Common Stocks | |
Consumer Discretionary | | | 8,969,156 | | | | 4,285,923 | | | | — | | | | 13,255,079 | | |
Financials | | | — | | | | 852,370 | | | | — | | | | 852,370 | | |
Health Care | | | 10,194,531 | | | | 2,914,294 | | | | — | | | | 13,108,825 | | |
Industrials | | | 2,137,817 | | | | 2,173,716 | | | | — | | | | 4,311,533 | | |
Information Technology | | | 11,411,593 | | | | 2,284,184 | | | | — | | | | 13,695,777 | | |
Materials | | | 3,124,864 | | | | — | | | | — | | | | 3,124,864 | | |
Total Equity Securities | | | 35,837,961 | | | | 12,510,487 | | | | — | | | | 48,348,448 | | |
Mutual Funds | |
Money Market Funds | | | 5,141,885 | | | | — | | | | — | | | | 5,141,885 | | |
Total Mutual Funds | | | 5,141,885 | | | | — | | | | — | | | | 5,141,885 | | |
Total | | | 40,979,846 | | | | 12,510,487 | | | | — | | | | 53,490,333 | | |
See the Portfolio of Investments for all investment classifications not indicated in the table.
The Fund's assets assigned to the Level 2 input category are generally valued using the market approach, in which a security's value is determined through reference to prices and information from market transactions for similar or identical assets. These assets include certain foreign securities for which a third party statistical pricing service may be employed for purposes of fair market valuation. The model utilized by such third party statistical pricing service takes into account a security's correlation to available market data including, but not limited to, intraday index, ADR, and ETF movements.
There were no transfers of financial assets between levels during the period.
The accompanying Notes to Financial Statements are an integral part of this statement.
Annual Report 2015
10
COLUMBIA MARSICO GLOBAL FUND
STATEMENT OF ASSETS AND LIABILITIES
February 28, 2015
Assets | |
Investments, at value | |
Unaffiliated issuers (identified cost $40,203,487) | | $ | 48,348,448 | | |
Affiliated issuers (identified cost $5,141,885) | | | 5,141,885 | | |
Total investments (identified cost $45,345,372) | | | 53,490,333 | | |
Receivable for: | |
Investments sold | | | 1,956,075 | | |
Capital shares sold | | | 535,728 | | |
Dividends | | | 10,744 | | |
Reclaims | | | 27,856 | | |
Expense reimbursement due from Investment Manager | | | 455 | | |
Prepaid expenses | | | 1,244 | | |
Total assets | | | 56,022,435 | | |
Liabilities | |
Payable for: | |
Investments purchased | | | 719,716 | | |
Capital shares purchased | | | 19,433 | | |
Investment management fees | | | 1,185 | | |
Distribution and/or service fees | | | 480 | | |
Transfer agent fees | | | 8,038 | | |
Administration fees | | | 120 | | |
Compensation of board members | | | 34,935 | | |
Other expenses | | | 42,401 | | |
Total liabilities | | | 826,308 | | |
Net assets applicable to outstanding capital stock | | $ | 55,196,127 | | |
Represented by | |
Paid-in capital | | $ | 47,267,089 | | |
Excess of distributions over net investment income | | | (128,079 | ) | |
Accumulated net realized loss | | | (85,290 | ) | |
Unrealized appreciation (depreciation) on: | |
Investments | | | 8,144,961 | | |
Foreign currency translations | | | (2,554 | ) | |
Total — representing net assets applicable to outstanding capital stock | | $ | 55,196,127 | | |
The accompanying Notes to Financial Statements are an integral part of this statement.
Annual Report 2015
11
COLUMBIA MARSICO GLOBAL FUND
STATEMENT OF ASSETS AND LIABILITIES (continued)
February 28, 2015
Class A | |
Net assets | | $ | 32,186,212 | | |
Shares outstanding | | | 2,370,384 | | |
Net asset value per share | | $ | 13.58 | | |
Maximum offering price per share(a) | | $ | 14.41 | | |
Class C | |
Net assets | | $ | 9,521,210 | | |
Shares outstanding | | | 728,606 | | |
Net asset value per share | | $ | 13.07 | | |
Class R | |
Net assets | | $ | 647,102 | | |
Shares outstanding | | | 48,265 | | |
Net asset value per share | | $ | 13.41 | | |
Class R4 | |
Net assets | | $ | 3,917,231 | | |
Shares outstanding | | | 284,849 | | |
Net asset value per share | | $ | 13.75 | | |
Class R5 | |
Net assets | | $ | 50,784 | | |
Shares outstanding | | | 3,690 | | |
Net asset value per share | | $ | 13.76 | | |
Class Z | |
Net assets | | $ | 8,873,588 | | |
Shares outstanding | | | 645,332 | | |
Net asset value per share | | $ | 13.75 | | |
(a) The maximum offering price per share is calculated by dividing the net asset value per share by 1.0 minus the maximum sales charge of 5.75%.
The accompanying Notes to Financial Statements are an integral part of this statement.
Annual Report 2015
12
COLUMBIA MARSICO GLOBAL FUND
STATEMENT OF OPERATIONS
Year Ended February 28, 2015
Net investment income | |
Income: | |
Dividends — unaffiliated issuers | | $ | 560,184 | | |
Dividends — affiliated issuers | | | 3,242 | | |
Foreign taxes withheld | | | (33,412 | ) | |
Total income | | | 530,014 | | |
Expenses: | |
Investment management fees | | | 386,626 | | |
Distribution and/or service fees | |
Class A | | | 65,743 | | |
Class C | | | 79,623 | | |
Class R | | | 6,744 | | |
Transfer agent fees | |
Class A | | | 45,054 | | |
Class C | | | 13,609 | | |
Class R | | | 2,192 | | |
Class R4 | | | 6,807 | | |
Class R5 | | | 7 | | |
Class Z | | | 15,683 | | |
Administration fees | | | 39,152 | | |
Compensation of board members | | | 13,043 | | |
Custodian fees | | | 9,678 | | |
Printing and postage fees | | | 26,102 | | |
Registration fees | | | 96,101 | | |
Professional fees | | | 45,217 | | |
Line of credit interest expense | | | 297 | | |
Other | | | 10,895 | | |
Total expenses | | | 862,573 | | |
Fees waived or expenses reimbursed by Investment Manager and its affiliates | | | (101,593 | ) | |
Total net expenses | | | 760,980 | | |
Net investment loss | | | (230,966 | ) | |
Realized and unrealized gain (loss) — net | |
Net realized gain (loss) on: | |
Investments | | | 1,427,474 | | |
Foreign currency translations | | | (1,828 | ) | |
Net realized gain | | | 1,425,646 | | |
Net change in unrealized appreciation (depreciation) on: | |
Investments | | | 2,419,894 | | |
Foreign currency translations | | | (4,178 | ) | |
Net change in unrealized appreciation | | | 2,415,716 | | |
Net realized and unrealized gain | | | 3,841,362 | | |
Net increase in net assets resulting from operations | | $ | 3,610,396 | | |
The accompanying Notes to Financial Statements are an integral part of this statement.
Annual Report 2015
13
COLUMBIA MARSICO GLOBAL FUND
STATEMENT OF CHANGES IN NET ASSETS
| | | Year Ended
February 28,
2015 | | Year Ended
February 28,
2014(a) | |
Operations | |
Net investment loss | | $ | (230,966 | ) | | $ | (175,409 | ) | |
Net realized gain | | | 1,425,646 | | | | 5,704,656 | | |
Net change in unrealized appreciation | | | 2,415,716 | | | | 3,789,504 | | |
Net increase in net assets resulting from operations | | | 3,610,396 | | | | 9,318,751 | | |
Distributions to shareholders | |
Net realized gains | |
Class A | | | (2,764,186 | ) | | | (804,813 | ) | |
Class C | | | (887,467 | ) | | | (166,058 | ) | |
Class R | | | (182,013 | ) | | | (75,117 | ) | |
Class R4 | | | (459,456 | ) | | | — | | |
Class R5 | | | (947 | ) | | | — | | |
Class Z | | | (961,963 | ) | | | (397,428 | ) | |
Total distributions to shareholders | | | (5,256,032 | ) | | | (1,443,416 | ) | |
Increase in net assets from capital stock activity | | | 6,284,927 | | | | 23,577,435 | | |
Total increase in net assets | | | 4,639,291 | | | | 31,452,770 | | |
Net assets at beginning of year | | | 50,556,836 | | | | 19,104,066 | | |
Net assets at end of year | | $ | 55,196,127 | | | $ | 50,556,836 | | |
Excess of distributions over net investment income | | $ | (128,079 | ) | | $ | (29,293 | ) | |
(a) Class R4 and Class R5 shares are based on operations from January 8, 2014 (commencement of operations) through the stated period end.
The accompanying Notes to Financial Statements are an integral part of this statement.
Annual Report 2015
14
COLUMBIA MARSICO GLOBAL FUND
STATEMENT OF CHANGES IN NET ASSETS (continued)
| | | Year Ended February 28, 2015 | | Year Ended February 28, 2014(a) | |
| | | Shares | | Dollars ($) | | Shares | | Dollars ($) | |
Capital stock activity | |
Class A shares | |
Subscriptions | | | 1,148,935 | | | | 15,263,367 | | | | 1,049,052 | | | | 13,400,823 | | |
Distributions reinvested | | | 189,257 | | | | 2,462,861 | | | | 51,041 | | | | 694,671 | | |
Redemptions | | | (811,624 | ) | | | (10,777,832 | ) | | | (240,126 | ) | | | (3,170,487 | ) | |
Net increase | | | 526,568 | | | | 6,948,396 | | | | 859,967 | | | | 10,925,007 | | |
Class C shares | |
Subscriptions | | | 346,459 | | | | 4,469,314 | | | | 310,059 | | | | 4,080,661 | | |
Distributions reinvested | | | 52,657 | | | | 662,210 | | | | 7,590 | | | | 100,724 | | |
Redemptions | | | (213,551 | ) | | | (2,732,087 | ) | | | (20,590 | ) | | | (243,674 | ) | |
Net increase | | | 185,565 | | | | 2,399,437 | | | | 297,059 | | | | 3,937,711 | | |
Class R shares | |
Subscriptions | | | 12,829 | | | | 166,892 | | | | 16,140 | | | | 207,063 | | |
Distributions reinvested | | | 4,350 | | | | 56,032 | | | | 1,391 | | | | 18,775 | | |
Redemptions | | | (137,884 | ) | | | (1,808,527 | ) | | | (2,417 | ) | | | (32,052 | ) | |
Net increase (decrease) | | | (120,705 | ) | | | (1,585,603 | ) | | | 15,114 | | | | 193,786 | | |
Class R4 shares | |
Subscriptions | | | 282,964 | | | | 3,943,393 | | | | 106,637 | | | | 1,420,629 | | |
Distributions reinvested | | | 34,739 | | | | 458,438 | | | | — | | | | — | | |
Redemptions | | | (137,419 | ) | | | (1,819,453 | ) | | | (2,072 | ) | | | (28,099 | ) | |
Net increase | | | 180,284 | | | | 2,582,378 | | | | 104,565 | | | | 1,392,530 | | |
Class R5 shares | |
Subscriptions | | | 3,476 | | | | 46,139 | | | | 179 | | | | 2,500 | | |
Distributions reinvested | | | 54 | | | | 690 | | | | — | | | | — | | |
Redemptions | | | (19 | ) | | | (239 | ) | | | — | | | | — | | |
Net increase | | | 3,511 | | | | 46,590 | | | | 179 | | | | 2,500 | | |
Class Z shares | |
Subscriptions | | | 278,958 | | | | 3,651,945 | | | | 584,378 | | | | 7,509,466 | | |
Distributions reinvested | | | 53,219 | | | | 700,855 | | | | 15,635 | | | | 214,665 | | |
Redemptions | | | (631,949 | ) | | | (8,459,071 | ) | | | (46,964 | ) | | | (598,230 | ) | |
Net increase (decrease) | | | (299,772 | ) | | | (4,106,271 | ) | | | 553,049 | | | | 7,125,901 | | |
Total net increase | | | 475,451 | | | | 6,284,927 | | | | 1,829,933 | | | | 23,577,435 | | |
(a) Class R4 and Class R5 shares are based on operations from January 8, 2014 (commencement of operations) through the stated period end.
The accompanying Notes to Financial Statements are an integral part of this statement.
Annual Report 2015
15
COLUMBIA MARSICO GLOBAL FUND
The following tables are intended to help you understand the Fund's financial performance. Certain information reflects financial results for a single share of a class held for the periods shown. Per share net investment income (loss) amounts are calculated based on average shares outstanding during the period. Total return assumes reinvestment of all dividends and distributions, if any. Total return does not reflect payment of sales charges, if any. Total return and portfolio turnover are not annualized for periods of less than one year. The portfolio turnover rate is calculated without regard to purchase and sales transactions of short-term instruments and certain derivatives, if any. If such transactions were included, the Fund's portfolio turnover rate may be higher.
| | | Year Ended February 28, | | Year Ended
February 29, | | Year Ended
February 28, | |
Class A | | 2015 | | 2014 | | 2013 | | 2012 | | 2011 | |
Per share data | |
Net asset value, beginning of period | | $ | 14.05 | | | $ | 10.78 | | | $ | 9.71 | | | $ | 10.16 | | | $ | 7.85 | | |
Income from investment operations: | |
Net investment loss | | | (0.06 | ) | | | (0.06 | ) | | | (0.04 | ) | | | (0.05 | ) | | | (0.05 | ) | |
Net realized and unrealized gain (loss) | | | 1.02 | | | | 3.82 | | | | 1.11 | | | | (0.28 | ) | | | 2.42 | | |
Total from investment operations | | | 0.96 | | | | 3.76 | | | | 1.07 | | | | (0.33 | ) | | | 2.37 | | |
Less distributions to shareholders: | |
Net investment income | | | — | | | | — | | | | — | | | | (0.01 | ) | | | (0.06 | ) | |
Net realized gains | | | (1.43 | ) | | | (0.49 | ) | | | — | | | | (0.10 | ) | | | — | | |
Tax return of capital | | | — | | | | — | | | | — | | | | (0.01 | ) | | | — | | |
Total distributions to shareholders | | | (1.43 | ) | | | (0.49 | ) | | | — | | | | (0.12 | ) | | | (0.06 | ) | |
Net asset value, end of period | | $ | 13.58 | | | $ | 14.05 | | | $ | 10.78 | | | $ | 9.71 | | | $ | 10.16 | | |
Total return | | | 7.53 | % | | | 35.05 | % | | | 11.02 | % | | | (3.27 | %) | | | 30.23 | % | |
Ratios to average net assets(a) | |
Total gross expenses | | | 1.71 | %(b) | | | 1.80 | % | | | 2.18 | % | | | 3.58 | % | | | 5.38 | % | |
Total net expenses(c) | | | 1.49 | %(b) | | | 1.51 | % | | | 1.57 | % | | | 1.60 | % | | | 1.60 | %(d) | |
Net investment loss | | | (0.44 | %) | | | (0.50 | %) | | | (0.41 | %) | | | (0.50 | %) | | | (0.59 | %) | |
Supplemental data | |
Net assets, end of period (in thousands) | | $ | 32,186 | | | $ | 25,902 | | | $ | 10,610 | | | $ | 3,786 | | | $ | 3,343 | | |
Portfolio turnover | | | 98 | % | | | 149 | % | | | 98 | % | | | 112 | % | | | 104 | % | |
Notes to Financial Highlights
(a) In addition to the fees and expenses that the Fund bears directly, the Fund indirectly bears a pro rata share of the fees and expenses of any other funds in which it invests. Such indirect expenses are not included in the Fund's reported expense ratios.
(b) Ratios include line of credit interest expense which is less than 0.01%.
(c) Total net expenses include the impact of certain fee waivers/expense reimbursements made by the Investment Manager and certain of its affiliates, if applicable.
(d) The benefits derived from expense reductions had an impact of less than 0.01%.
The accompanying Notes to Financial Statements are an integral part of this statement.
Annual Report 2015
16
COLUMBIA MARSICO GLOBAL FUND
FINANCIAL HIGHLIGHTS (continued)
| | | Year Ended February 28, | | Year Ended
February 29, | | Year Ended
February 28, | |
Class C | | 2015 | | 2014 | | 2013 | | 2012 | | 2011 | |
Per share data | |
Net asset value, beginning of period | | $ | 13.67 | | | $ | 10.51 | | | $ | 9.53 | | | $ | 10.04 | | | $ | 7.78 | | |
Income from investment operations: | |
Net investment loss | | | (0.15 | ) | | | (0.15 | ) | | | (0.11 | ) | | | (0.11 | ) | | | (0.12 | ) | |
Net realized and unrealized gain (loss) | | | 0.98 | | | | 3.71 | | | | 1.09 | | | | (0.30 | ) | | | 2.39 | | |
Total from investment operations | | | 0.83 | | | | 3.56 | | | | 0.98 | | | | (0.41 | ) | | | 2.27 | | |
Less distributions to shareholders: | |
Net investment income | | | — | | | | — | | | | — | | | | (0.00 | )(a) | | | (0.01 | ) | |
Net realized gains | | | (1.43 | ) | | | (0.40 | ) | | | — | | | | (0.10 | ) | | | — | | |
Tax return of capital | | | — | | | | — | | | | — | | | | (0.00 | )(a) | | | — | | |
Total distributions to shareholders | | | (1.43 | ) | | | (0.40 | ) | | | — | | | | (0.10 | ) | | | (0.01 | ) | |
Net asset value, end of period | | $ | 13.07 | | | $ | 13.67 | | | $ | 10.51 | | | $ | 9.53 | | | $ | 10.04 | | |
Total return | | | 6.74 | % | | | 34.01 | % | | | 10.28 | % | | | (4.04 | %) | | | 29.14 | % | |
Ratios to average net assets(b) | |
Total gross expenses | | | 2.46 | %(c) | | | 2.54 | % | | | 3.03 | % | | | 4.32 | % | | | 6.13 | % | |
Total net expenses(d) | | | 2.24 | %(c) | | | 2.26 | % | | | 2.32 | % | | | 2.35 | % | | | 2.35 | %(e) | |
Net investment loss | | | (1.18 | %) | | | (1.24 | %) | | | (1.10 | %) | | | (1.25 | %) | | | (1.33 | %) | |
Supplemental data | |
Net assets, end of period (in thousands) | | $ | 9,521 | | | $ | 7,423 | | | $ | 2,586 | | | $ | 2,012 | | | $ | 2,051 | | |
Portfolio turnover | | | 98 | % | | | 149 | % | | | 98 | % | | | 112 | % | | | 104 | % | |
Notes to Financial Highlights
(a) Rounds to zero.
(b) In addition to the fees and expenses that the Fund bears directly, the Fund indirectly bears a pro rata share of the fees and expenses of any other funds in which it invests. Such indirect expenses are not included in the Fund's reported expense ratios.
(c) Ratios include line of credit interest expense which is less than 0.01%.
(d) Total net expenses include the impact of certain fee waivers/expense reimbursements made by the Investment Manager and certain of its affiliates, if applicable.
(e) The benefits derived from expense reductions had an impact of less than 0.01%.
The accompanying Notes to Financial Statements are an integral part of this statement.
Annual Report 2015
17
COLUMBIA MARSICO GLOBAL FUND
FINANCIAL HIGHLIGHTS (continued)
| | | Year Ended February 28, | | Year Ended
February 29, | | Year Ended
February 28, | |
Class R | | 2015 | | 2014 | | 2013 | | 2012 | | 2011 | |
Per share data | |
Net asset value, beginning of period | | $ | 13.92 | | | $ | 10.70 | | | $ | 9.65 | | | $ | 10.13 | | | $ | 7.83 | | |
Income from investment operations: | |
Net investment loss | | | (0.06 | ) | | | (0.09 | ) | | | (0.06 | ) | | | (0.07 | ) | | | (0.07 | ) | |
Net realized and unrealized gain (loss) | | | 0.98 | | | | 3.77 | | | | 1.11 | | | | (0.30 | ) | | | 2.41 | | |
Total from investment operations | | | 0.92 | | | | 3.68 | | | | 1.05 | | | | (0.37 | ) | | | 2.34 | | |
Less distributions to shareholders: | |
Net investment income | | | — | | | | — | | | | — | | | | (0.00 | )(a) | | | (0.04 | ) | |
Net realized gains | | | (1.43 | ) | | | (0.46 | ) | | | — | | | | (0.10 | ) | | | — | | |
Tax return of capital | | | — | | | | — | | | | — | | | | (0.01 | ) | | | — | | |
Total distributions to shareholders | | | (1.43 | ) | | | (0.46 | ) | | | — | | | | (0.11 | ) | | | (0.04 | ) | |
Net asset value, end of period | | $ | 13.41 | | | $ | 13.92 | | | $ | 10.70 | | | $ | 9.65 | | | $ | 10.13 | | |
Total return | | | 7.30 | % | | | 34.55 | % | | | 10.88 | % | | | (3.62 | %) | | | 29.94 | % | |
Ratios to average net assets(b) | |
Total gross expenses | | | 1.92 | %(c) | | | 2.06 | % | | | 2.53 | % | | | 3.82 | % | | | 5.63 | % | |
Total net expenses(d) | | | 1.75 | %(c) | | | 1.77 | % | | | 1.82 | % | | | 1.85 | % | | | 1.85 | %(e) | |
Net investment loss | | | (0.41 | %) | | | (0.69 | %) | | | (0.61 | %) | | | (0.75 | %) | | | (0.82 | %) | |
Supplemental data | |
Net assets, end of period (in thousands) | | $ | 647 | | | $ | 2,353 | | | $ | 1,645 | | | $ | 1,195 | | | $ | 1,245 | | |
Portfolio turnover | | | 98 | % | | | 149 | % | | | 98 | % | | | 112 | % | | | 104 | % | |
Notes to Financial Highlights
(a) Rounds to zero.
(b) In addition to the fees and expenses that the Fund bears directly, the Fund indirectly bears a pro rata share of the fees and expenses of any other funds in which it invests. Such indirect expenses are not included in the Fund's reported expense ratios.
(c) Ratios include line of credit interest expense which is less than 0.01%.
(d) Total net expenses include the impact of certain fee waivers/expense reimbursements made by the Investment Manager and certain of its affiliates, if applicable.
(e) The benefits derived from expense reductions had an impact of less than 0.01%.
The accompanying Notes to Financial Statements are an integral part of this statement.
Annual Report 2015
18
COLUMBIA MARSICO GLOBAL FUND
FINANCIAL HIGHLIGHTS (continued)
| | | Year Ended February 28, | |
Class R4 | | 2015 | | 2014(a) | |
Per share data | |
Net asset value, beginning of period | | $ | 14.17 | | | $ | 13.95 | | |
Income from investment operations: | |
Net investment loss | | | (0.02 | ) | | | (0.01 | ) | |
Net realized and unrealized gain | | | 1.03 | | | | 0.23 | | |
Total from investment operations | | | 1.01 | | | | 0.22 | | |
Less distributions to shareholders: | |
Net realized gains | | | (1.43 | ) | | | — | | |
Total distributions to shareholders | | | (1.43 | ) | | | — | | |
Net asset value, end of period | | $ | 13.75 | | | $ | 14.17 | | |
Total return | | | 7.83 | % | | | 1.58 | % | |
Ratios to average net assets(b) | |
Total gross expenses | | | 1.45 | %(c) | | | 1.47 | %(d) | |
Total net expenses(e) | | | 1.24 | %(c) | | | 1.25 | %(d) | |
Net investment loss | | | (0.12 | %) | | | (0.33 | %)(d) | |
Supplemental data | |
Net assets, end of period (in thousands) | | $ | 3,917 | | | $ | 1,482 | | |
Portfolio turnover | | | 98 | % | | | 149 | % | |
Notes to Financial Highlights
(a) Based on operations from January 8, 2014 (commencement of operations) through the stated period end.
(b) In addition to the fees and expenses that the Fund bears directly, the Fund indirectly bears a pro rata share of the fees and expenses of any other funds in which it invests. Such indirect expenses are not included in the Fund's reported expense ratios.
(c) Ratios include line of credit interest expense which is less than 0.01%.
(d) Annualized.
(e) Total net expenses include the impact of certain fee waivers/expense reimbursements made by the Investment Manager and certain of its affiliates, if applicable.
The accompanying Notes to Financial Statements are an integral part of this statement.
Annual Report 2015
19
COLUMBIA MARSICO GLOBAL FUND
FINANCIAL HIGHLIGHTS (continued)
| | | Year Ended February 28, | |
Class R5 | | 2015 | | 2014(a) | |
Per share data | |
Net asset value, beginning of period | | $ | 14.17 | | | $ | 13.95 | | |
Income from investment operations: | |
Net investment loss | | | (0.07 | ) | | | (0.01 | ) | |
Net realized and unrealized gain | | | 1.09 | | | | 0.23 | | |
Total from investment operations | | | 1.02 | | | | 0.22 | | |
Less distributions to shareholders: | |
Net realized gains | | | (1.43 | ) | | | — | | |
Total distributions to shareholders | | | (1.43 | ) | | | — | | |
Net asset value, end of period | | $ | 13.76 | | | $ | 14.17 | | |
Total return | | | 7.90 | % | | | 1.58 | % | |
Ratios to average net assets(b) | |
Total gross expenses | | | 1.37 | %(c) | | | 1.38 | %(d) | |
Total net expenses(e) | | | 1.18 | %(c) | | | 1.20 | %(d) | |
Net investment loss | | | (0.55 | %) | | | (0.37 | %)(d) | |
Supplemental data | |
Net assets, end of period (in thousands) | | $ | 51 | | | $ | 3 | | |
Portfolio turnover | | | 98 | % | | | 149 | % | |
Notes to Financial Highlights
(a) Based on operations from January 8, 2014 (commencement of operations) through the stated period end.
(b) In addition to the fees and expenses that the Fund bears directly, the Fund indirectly bears a pro rata share of the fees and expenses of any other funds in which it invests. Such indirect expenses are not included in the Fund's reported expense ratios.
(c) Ratios include line of credit interest expense which is less than 0.01%.
(d) Annualized.
(e) Total net expenses include the impact of certain fee waivers/expense reimbursements made by the Investment Manager and certain of its affiliates, if applicable.
The accompanying Notes to Financial Statements are an integral part of this statement.
Annual Report 2015
20
COLUMBIA MARSICO GLOBAL FUND
FINANCIAL HIGHLIGHTS (continued)
| | | Year Ended February 28, | | Year Ended
February 29, | | Year Ended
February 28, | |
Class Z | | 2015 | | 2014 | | 2013 | | 2012 | | 2011 | |
Per share data | |
Net asset value, beginning of period | | $ | 14.17 | | | $ | 10.87 | | | $ | 9.76 | | | $ | 10.20 | | | $ | 7.88 | | |
Income from investment operations: | |
Net investment loss | | | (0.02 | ) | | | (0.04 | ) | | | (0.02 | ) | | | (0.02 | ) | | | (0.03 | ) | |
Net realized and unrealized gain (loss) | | | 1.03 | | | | 3.86 | | | | 1.13 | | | | (0.30 | ) | | | 2.43 | | |
Total from investment operations | | | 1.01 | | | | 3.82 | | | | 1.11 | | | | (0.32 | ) | | | 2.40 | | |
Less distributions to shareholders: | |
Net investment income | | | — | | | | — | | | | — | | | | (0.01 | ) | | | (0.08 | ) | |
Net realized gains | | | (1.43 | ) | | | (0.52 | ) | | | — | | | | (0.10 | ) | | | — | | |
Tax return of capital | | | — | | | | — | | | | — | | | | (0.01 | ) | | | — | | |
Total distributions to shareholders | | | (1.43 | ) | | | (0.52 | ) | | | — | | | | (0.12 | ) | | | (0.08 | ) | |
Net asset value, end of period | | $ | 13.75 | | | $ | 14.17 | | | $ | 10.87 | | | $ | 9.76 | | | $ | 10.20 | | |
Total return | | | 7.83 | % | | | 35.32 | % | | | 11.37 | % | | | (3.12 | %) | | | 30.47 | % | |
Ratios to average net assets(a) | |
Total gross expenses | | | 1.44 | %(b) | | | 1.54 | % | | | 1.88 | % | | | 3.32 | % | | | 5.13 | % | |
Total net expenses(c) | | | 1.24 | %(b) | | | 1.26 | % | | | 1.32 | % | | | 1.35 | % | | | 1.35 | %(d) | |
Net investment loss | | | (0.12 | %) | | | (0.29 | %) | | | (0.19 | %) | | | (0.25 | %) | | | (0.33 | %) | |
Supplemental data | |
Net assets, end of period (in thousands) | | $ | 8,874 | | | $ | 13,395 | | | $ | 4,263 | | | $ | 1,438 | | | $ | 1,557 | | |
Portfolio turnover | | | 98 | % | | | 149 | % | | | 98 | % | | | 112 | % | | | 104 | % | |
Notes to Financial Highlights
(a) In addition to the fees and expenses that the Fund bears directly, the Fund indirectly bears a pro rata share of the fees and expenses of any other funds in which it invests. Such indirect expenses are not included in the Fund's reported expense ratios.
(b) Ratios include line of credit interest expense which is less than 0.01%.
(c) Total net expenses include the impact of certain fee waivers/expense reimbursements made by the Investment Manager and certain of its affiliates, if applicable.
(d) The benefits derived from expense reductions had an impact of less than 0.01%.
The accompanying Notes to Financial Statements are an integral part of this statement.
Annual Report 2015
21
COLUMBIA MARSICO GLOBAL FUND
NOTES TO FINANCIAL STATEMENTS
February 28, 2015
Note 1. Organization
Columbia Marsico Global Fund (the Fund), a series of Columbia Funds Series Trust (the Trust), is a diversified fund. The Trust is registered under the Investment Company Act of 1940, as amended (the 1940 Act), as an open-end management investment company organized as a Delaware statutory trust.
Fund Shares
The Trust may issue an unlimited number of shares (without par value). The Fund offers Class A, Class C, Class R, Class R4, Class R5 and Class Z shares. Although all share classes generally have identical voting, dividend and liquidation rights, each share class votes separately when required by the Trust's organizational documents or by law. Different share classes pay different distribution amounts to the extent the expenses of such share classes differ, and distributions in liquidation will be proportional to the net asset value of each share class. Each share class has its own expense structure and sales charges.
Class A shares are subject to a maximum front-end sales charge of 5.75% based on the initial investment amount. Class A shares purchased without an initial sales charge in accounts aggregating $1 million to $50 million at the time of purchase are subject to a contingent deferred sales charge (CDSC) if the shares are sold within 18 months of purchase, charged as follows: 1.00% CDSC if redeemed within 12 months of purchase, and 0.50% CDSC if redeemed more than 12, but less than 18, months after purchase.
Class C shares are subject to a 1.00% CDSC on shares redeemed within one year of purchase.
Class R shares are not subject to sales charges and are generally available only to certain retirement plans and other investors as described in the Fund's prospectus.
Class R4 shares are not subject to sales charges and are generally available only to omnibus retirement plans and certain investors as described in the Fund's prospectus.
Class R5 shares are not subject to sales charges and are generally available only to investors purchasing through authorized investment professionals and omnibus retirement plans.
Class Z shares are not subject to sales charges and are available only to eligible investors, which are subject to different investment minimums as described in the Fund's prospectus.
Note 2. Summary of Significant Accounting Policies
Basis of Preparation
The Fund is an investment company that applies the accounting and reporting guidance in the Financial Accounting Standards Board (FASB) Accounting Standards Codification Topic 946, Financial Services — Investment Companies (ASC 946). The financial statements are prepared in accordance with U.S. generally accepted accounting principles (GAAP) which requires management to make certain estimates and assumptions that affect the reported amounts of assets and liabilities, the disclosure of contingent assets and liabilities at the date of the financial statements and the reported amounts of income and expenses during the reporting period. Actual results could differ from those estimates.
The following is a summary of significant accounting policies followed by the Fund in the preparation of its financial statements.
Security Valuation
All equity securities are valued at the close of business of the New York Stock Exchange (NYSE). Equity securities are valued at the last quoted sales price on the principal exchange or market on which they trade, except for securities traded on the NASDAQ Stock Market, which are valued at the NASDAQ official close price. Unlisted securities or listed securities for which there were no sales during the day are valued at the mean of the latest quoted bid and ask prices on such exchanges or markets.
Foreign equity securities are valued based on quotations from the principal market in which such securities are traded. If any foreign security prices are not readily available as a result of limited share activity, the securities are valued at the mean of the latest quoted bid and ask prices on such exchanges or markets. Foreign currency exchange rates are generally determined at 4:00 p.m. Eastern (U.S.) time. Many securities markets and exchanges outside the U.S. close prior to the close of the NYSE; therefore, the closing prices for securities in such markets or on such exchanges may not fully reflect events that occur after such close but before the close of the NYSE. In those situations, foreign securities will be fair valued pursuant to a policy adopted by the Board of Trustees (the Board), including, if available, utilizing a third party pricing service to determine these fair values. The third party pricing service takes into account multiple factors, including, but not limited to, movements in the U.S. securities markets,
Annual Report 2015
22
COLUMBIA MARSICO GLOBAL FUND
NOTES TO FINANCIAL STATEMENTS (continued)
February 28, 2015
certain depositary receipts, futures contracts and foreign exchange rates that have occurred subsequent to the close of the foreign exchange or market, to determine a good faith estimate that reasonably reflects the current market conditions as of the close of the NYSE. The fair value of a security is likely to be different from the quoted or published price, if available.
Investments in open-end investment companies, including money market funds, are valued at their net asset value.
Investments for which market quotations are not readily available, or that have quotations which management believes are not reliable, are valued at fair value as determined in good faith under procedures established by and under the general supervision of the Board. If a security or class of securities (such as foreign securities) is valued at fair value, such value is likely to be different from the quoted or published price for the security.
The determination of fair value often requires significant judgment. To determine fair value, management may use assumptions including but not limited to future cash flows and estimated risk premiums. Multiple inputs from various sources may be used to determine fair value.
Foreign Currency Transactions and Translations
The values of all assets and liabilities denominated in foreign currencies are generally translated into U.S. dollars at exchange rates determined at the close of the NYSE. Net realized and unrealized gains (losses) on foreign currency transactions and translations include gains (losses) arising from the fluctuation in exchange rates between trade and settlement dates on securities transactions, gains (losses) arising from the disposition of foreign currency and currency gains (losses) between the accrual and payment dates on dividends, interest income and foreign withholding taxes.
For financial statement purposes, the Fund does not distinguish that portion of gains (losses) on investments which is due to changes in foreign exchange rates from that which is due to changes in market prices of the investments. Such fluctuations are included with the net realized and unrealized gains (losses) on investments in the Statement of Operations.
Security Transactions
Security transactions are accounted for on the trade date. Cost is determined and gains (losses) are based upon the specific identification method for both financial statement and federal income tax purposes.
Income Recognition
Corporate actions and dividend income are generally recorded net of any non-reclaimable tax withholdings, on the ex-dividend date or upon receipt of ex-dividend notification in the case of certain foreign securities.
Awards from class action litigation are recorded as a reduction of cost basis if the Fund still owns the applicable securities on the payment date. If the Fund no longer owns the applicable securities, the proceeds are recorded as realized gains.
Expenses
General expenses of the Trust are allocated to the Fund and other funds of the Trust based upon relative net assets or other expense allocation methodologies determined by the nature of the expense. Expenses directly attributable to the Fund are charged to the Fund. Expenses directly attributable to a specific class of shares are charged to that share class.
Determination of Class Net Asset Value
All income, expenses (other than class-specific expenses, which are charged to that share class, as shown in the Statement of Operations) and realized and unrealized gains (losses) are allocated to each class of the Fund on a daily basis, based on the relative net assets of each class, for purposes of determining the net asset value of each class.
Federal Income Tax Status
The Fund intends to qualify each year as a regulated investment company under Subchapter M of the Internal Revenue Code, as amended, and will distribute substantially all of its taxable income (including net short-term capital gains), if any, for its tax year, and as such will not be subject to federal income taxes. In addition, the Fund intends to distribute in each calendar year substantially all of its net investment income, capital gains and certain other amounts, if any, such that the Fund should not be subject to federal excise tax. Therefore, no federal income or excise tax provision is recorded.
Foreign Taxes
The Fund may be subject to foreign taxes on income, gains on investments or currency repatriation, a portion of which may be recoverable. The Fund will accrue such taxes and recoveries, as applicable, based upon its current interpretation of tax rules and regulations that exist in the markets in which it invests.
Annual Report 2015
23
COLUMBIA MARSICO GLOBAL FUND
NOTES TO FINANCIAL STATEMENTS (continued)
February 28, 2015
Realized gains in certain countries may be subject to foreign taxes at the Fund level, based on statutory rates. The Fund accrues for such foreign taxes on realized and unrealized gains at the appropriate rate for each jurisdiction, as applicable. The amount, if any, is disclosed as a liability on the Statement of Assets and Liabilities.
Distributions to Shareholders
Distributions from net investment income, if any, are declared and paid semi-annually. Net realized capital gains, if any, are distributed at least annually. Income distributions and capital gain distributions are determined in accordance with federal income tax regulations, which may differ from GAAP.
Guarantees and Indemnifications
Under the Trust's organizational documents and, in some cases, by contract, its officers and trustees are indemnified against certain liabilities arising out of the performance of their duties to the Trust or its funds. In addition, certain of the Fund's contracts with its service providers contain general indemnification clauses. The Fund's maximum exposure under these arrangements is unknown since the amount of any future claims that may be made against the Fund cannot be determined, and the Fund has no historical basis for predicting the likelihood of any such claims.
Note 3. Fees and Compensation Paid to Affiliates
Investment Management Fees
Under an Investment Management Services Agreement, Columbia Management Investment Advisers, LLC (the Investment Manager), a wholly-owned subsidiary of Ameriprise Financial, Inc. (Ameriprise Financial), is responsible for the ultimate oversight of investments made by the Fund. The Fund's subadviser (see Subadvisory Agreement below) has the primary responsibility for the day-to-day portfolio management of the Fund. The investment management fee is an annual fee that is equal to a percentage of the Fund's average daily net assets that declines from 0.79% to 0.62% as the Fund's net assets increase. The effective investment management fee rate for the year ended February 28, 2015 was 0.79% of the Fund's average daily net assets.
Subadvisory Agreement
The Investment Manager has entered into a Subadvisory Agreement with Marsico Capital Management, LLC (Marsico) to serve as the subadviser to the Fund. The
Investment Manager compensates Marsico to manage the investment of the Fund's assets.
Administration Fees
Under an Administrative Services Agreement, the Investment Manager also serves as the Fund Administrator. The Fund pays the Fund Administrator an annual fee for administration and accounting services equal to a percentage of the Fund's average daily net assets that declines from 0.08% to 0.05% as the Fund's net assets increase. The effective administration fee rate for the year ended February 28, 2015 was 0.08% of the Fund's average daily net assets.
Other Expenses
Other expenses are for, among other things, miscellaneous expenses of the Fund or the Board, including payments to a company providing limited administrative services to the Fund and the Board. That company's expenses include boardroom and office expense, employee compensation, employee health and retirement benefits, and certain other expenses. For the year ended February 28, 2015, other expenses paid by the Fund to this company were $1,196.
Compensation of Board Members
Board members are compensated for their services to the Fund as disclosed in the Statement of Operations. Under a Deferred Compensation Plan (the Plan), the Board members who are not "interested persons" of the Fund, as defined under the 1940 Act, may elect to defer payment of up to 100% of their compensation. Deferred amounts are treated as though equivalent dollar amounts had been invested in shares of certain funds managed by the Investment Manager. The Fund's liability for these amounts is adjusted for market value changes and remains in the Fund until distributed in accordance with the Plan.
Transfer Agent Fees
Under a Transfer and Dividend Disbursing Agent Agreement, Columbia Management Investment Services Corp. (the Transfer Agent), an affiliate of the Investment Manager and a wholly-owned subsidiary of Ameriprise Financial, is responsible for providing transfer agency services to the Fund. The Transfer Agent has contracted with Boston Financial Data Services (BFDS) to serve as sub-transfer agent.
Effective November 1, 2014, the Transfer Agent receives a monthly transfer agency fee based on the number or the average value of accounts, depending on the type of
Annual Report 2015
24
COLUMBIA MARSICO GLOBAL FUND
NOTES TO FINANCIAL STATEMENTS (continued)
February 28, 2015
account. Prior to November 1, 2014, the Transfer Agent received a monthly account-based service fee based on the number of open accounts. In addition, the Transfer Agent also receives sub-transfer agency fees based on a percentage of the average aggregate value of the Fund's shares maintained in omnibus accounts (other than omnibus accounts for which American Enterprise Investment Services Inc. is the broker of record or accounts where the beneficial shareholder is a customer of Ameriprise Financial Services, Inc., for which the Transfer Agent receives a per account fee). The Transfer Agent pays the fees of BFDS for services as sub-transfer agent and is not entitled to reimbursement for such fees from the Fund (with the exception of out-of-pocket fees).
The Transfer Agent also receives compensation from the Fund for various shareholder services and reimbursements for certain out-of-pocket fees. Total transfer agent fees for Class R5 shares are subject to an annual limitation of not more than 0.05% of the average daily net assets attributable to Class R5 shares.
For the year ended February 28, 2015, the Fund's effective transfer agent fee rates as a percentage of average daily net assets of each class were as follows:
Class A | | | 0.17 | % | |
Class C | | | 0.17 | | |
Class R | | | 0.16 | | |
Class R4 | | | 0.17 | | |
Class R5 | | | 0.05 | | |
Class Z | | | 0.17 | | |
An annual minimum account balance fee of $20 may apply to certain accounts with a value below the applicable share class's initial minimum investment requirements to reduce the impact of small accounts on transfer agent fees. These minimum account balance fees are remitted to the Fund and recorded as part of expense reductions in the Statement of Operations. For the year ended February 28, 2015, no minimum account balance fees were charged by the Fund.
Distribution and Service Fees
The Fund has an agreement with Columbia Management Investment Distributors, Inc. (the Distributor), an affiliate of the Investment Manager and a wholly-owned subsidiary of Ameriprise Financial, for distribution and shareholder services. The Board has approved, and the Fund has adopted, distribution and shareholder service plans (the Plans) applicable to certain share classes, which set the distribution and service fees for the Fund. These fees are calculated daily and are intended to
compensate the Distributor and/or eligible selling and/or servicing agents for selling shares of the Fund and providing services to investors.
Under the Plans, the Fund pays a monthly combined distribution and service fee to the Distributor at the maximum annual rate of 0.25% of the average daily net assets attributable to Class A shares of the Fund. Also under the Plans, the Fund pays a monthly service fee at the maximum annual rate of 0.25% of the average daily net assets attributable to Class C shares of the Fund and the payment of a monthly distribution fee at the maximum annual rate of 0.75% and 0.50% of the average daily net assets attributable to Class C and Class R shares, respectively.
Sales Charges
Sales charges, including front-end charges and CDSCs, received by the Distributor for distributing Fund shares were $152,737 for Class A and $1,131 for Class C shares for the year ended February 28, 2015.
Expenses Waived/Reimbursed by the Investment Manager and its Affiliates
The Investment Manager and certain of its affiliates have contractually agreed to waive fees and/or reimburse expenses (excluding certain fees and expenses described below) for the periods disclosed below, unless sooner terminated at the sole discretion of the Board, so that the Fund's net operating expenses, after giving effect to fees waived/expenses reimbursed and any balance credits and/or overdraft charges from the Fund's custodian, do not exceed the following annual rates as a percentage of the class' average daily net assets:
| | | July 1, 2014
through
June 30, 2015 | | Prior to
July 1, 2014 | |
Class A | | | 1.64 | % | | | 1.50 | % | |
Class C | | | 2.39 | | | | 2.25 | | |
Class R | | | 1.89 | | | | 1.75 | | |
Class R4 | | | 1.39 | | | | 1.25 | | |
Class R5 | | | 1.33 | | | | 1.20 | | |
Class Z | | | 1.39 | | | | 1.25 | | |
In addition, effective July 1, 2014, the Fund's expense ratio is subject to a voluntary expense reimbursement arrangement pursuant to which fees are waived and/or expenses reimbursed (excluding certain fees and expenses described below), so that the Fund's net operating expenses, after giving effect to fees waived/expenses reimbursed and any balance credits
Annual Report 2015
25
COLUMBIA MARSICO GLOBAL FUND
NOTES TO FINANCIAL STATEMENTS (continued)
February 28, 2015
and/or overdraft charges from the Fund's custodian, do not exceed the annual rates of 1.49% for Class A, 2.24% for Class C, 1.74% for Class R, 1.24% for Class R4, 1.18% for Class R5 and 1.24% for Class Z. This arrangement may be revised or discontinued at any time.
Under the agreement governing these fee waivers and/or expense reimbursement arrangements, the following fees and expenses are excluded from the waiver/reimbursement commitment, and therefore will be paid by the Fund, if applicable: taxes (including foreign transaction taxes), expenses associated with investments in affiliated and non-affiliated pooled investment vehicles (including mutual funds and exchange-traded funds), transaction costs and brokerage commissions, costs related to any securities lending program, dividend expenses associated with securities sold short, inverse floater program fees and expenses, transaction charges and interest on borrowed money, interest, extraordinary expenses and any other expenses the exclusion of which is specifically approved by the Board. This agreement may be modified or amended only with approval from all parties. Any fees waived and/or expenses reimbursed under the expense reimbursement arrangements described above are not recoverable by the Investment Manager or its affiliates in future periods.
Note 4. Federal Tax Information
The timing and character of income and capital gain distributions are determined in accordance with income tax regulations, which may differ from GAAP because of temporary or permanent book to tax differences.
At February 28, 2015, these differences are primarily due to differing treatment for deferral/reversal of wash sale losses, Trustees' deferred compensation, foreign currency transactions, net operating loss reclassification and late-year ordinary losses. To the extent these differences are permanent, reclassifications are made among the components of the Fund's net assets in the Statement of Assets and Liabilities. Temporary differences do not require reclassifications. In the Statement of Assets and Liabilities the following reclassifications were made:
Excess of distributions over net investment income | | $ | 132,180 | | |
Accumulated net realized loss | | | 1,828 | | |
Paid-in capital | | | (134,008 | ) | |
Net investment income (loss) and net realized gains (losses), as disclosed in the Statement of Operations, and net assets were not affected by this reclassification.
The tax character of distributions paid during the years indicated was as follows:
Year Ended February 28, | | 2015 | | 2014 | |
Ordinary income | | $ | 1,608,339 | | | $ | 765,372 | | |
Long-term capital gains | | | 3,647,693 | | | | 678,044 | | |
Total | | | 5,256,032 | | | | 1,443,416 | | |
Short-term capital gain distributions, if any, are considered ordinary income distributions for tax purposes.
At February 28, 2015, the components of distributable earnings on a tax basis were as follows:
Undistributed long-term capital gains | | | 22,331 | | |
Net unrealized appreciation | | | 8,037,340 | | |
At February 28, 2015, the cost of investments for federal income tax purposes was $45,452,993 and the aggregate gross unrealized appreciation and depreciation based on that cost was:
Unrealized appreciation | | $ | 8,551,981 | | |
Unrealized depreciation | | | (514,641 | ) | |
Net unrealized appreciation | | | 8,037,340 | | |
Under current tax rules, regulated investment companies can elect to treat certain late-year ordinary losses incurred and post-October capital losses (capital losses realized after October 31) as arising on the first day of the following taxable year. As of February 28, 2015, the Fund will elect to treat late-year ordinary losses of $93,754 as arising on March 1, 2015.
Management of the Fund has concluded that there are no significant uncertain tax positions in the Fund that would require recognition in the financial statements. However, management's conclusion may be subject to review and adjustment at a later date based on factors including, but not limited to, new tax laws, regulations, and administrative interpretations (including relevant court decisions). Generally, the Fund's federal tax returns for the prior three fiscal years remain subject to examination by the Internal Revenue Service.
Note 5. Portfolio Information
The cost of purchases and proceeds from sales of securities, excluding short-term investments and derivatives, if any, aggregated to $45,571,450 and $50,314,633, respectively, for the year ended February 28, 2015. The amount of purchase and sale activity impacts the portfolio turnover rate reported in the Financial Highlights.
Annual Report 2015
26
COLUMBIA MARSICO GLOBAL FUND
NOTES TO FINANCIAL STATEMENTS (continued)
February 28, 2015
Note 6. Affiliated Money Market Fund
The Fund invests in Columbia Short-Term Cash Fund, an affiliated money market fund established for the exclusive use by the Fund and other affiliated funds. The income earned by the Fund from such investments is included as Dividends — affiliated issuers in the Statement of Operations. As an investing fund, the Fund indirectly bears its proportionate share of the expenses of Columbia Short-Term Cash Fund.
Note 7. Shareholder Concentration
At February 28, 2015, two unaffiliated shareholders of record owned 25.1% of the outstanding shares of the Fund in one or more accounts. The Fund has no knowledge about whether any portion of those shares was owned beneficially. Affiliated shareholders of record owned 39.4% of the outstanding shares of the Fund in one or more accounts. Subscription and redemption activity by concentrated accounts may have a significant effect on the operations of the Fund.
Note 8. Line of Credit
The Fund has entered into a revolving credit facility with a syndicate of banks led by JPMorgan Chase Bank, N.A. (JPMorgan) whereby the Fund may borrow for the temporary funding of shareholder redemptions or for other temporary or emergency purposes. Pursuant to a December 9, 2014 amendment, the credit facility agreement, which is a collective agreement between the Fund and certain other funds managed by the Investment Manager, severally and not jointly, permits collective borrowings up to $550 million. Interest is charged to each participating fund based on its borrowings at a rate equal to the higher of (i) the overnight federal funds rate plus 1.00% or (ii) the one-month LIBOR rate plus 1.00%. Each borrowing under the credit facility matures no later than 60 days after the date of borrowing. The Fund also pays a commitment fee equal to its pro rata share of the amount of the credit facility at a rate of 0.075% per annum. The commitment fee is included in other expenses in the Statement of Operations. Prior to the December 9, 2014 amendment, the credit facility agreement permitted borrowings up to $500 million under the same terms and interest rates as described above.
For the year ended February 28, 2015, the average daily loan balance outstanding on days when borrowing existed was $3,100,000 at a weighted average interest rate of 1.15%. Interest expense incurred by the Fund is
recorded as line of credit interest expense in the Statement of Operations.
Note 9. Significant Risks
Consumer Discretionary Sector Risk
Sector risk occurs when a fund invests a significant portion of its assets in securities of companies conducting business in a related group of industries within an economic sector. Companies in the same economic sector may be similarly affected by economic, regulatory, political or market events or conditions, making a fund more vulnerable to unfavorable developments in that economic sector than funds that invest more broadly. The Fund may be more susceptible to the particular risks that may affect companies in the consumer discretionary sector than if it were invested in a wider variety of companies in unrelated sectors.
Foreign Securities and Emerging Market Countries Risk
Investing in foreign securities may include certain risks and considerations not typically associated with investing in U.S. securities, such as fluctuating currency values and changing local and regional economic, political and social conditions, which may result in greater market volatility. In addition, certain foreign securities may not be as liquid as U.S. securities. Investing in emerging markets may accentuate these risks. These countries are also more likely to experience high levels of inflation, deflation or currency devaluation which could hurt their economies and securities markets.
Health Care Sector Risk
Sector risk occurs when a fund invests a significant portion of its assets in securities of companies conducting business in a related group of industries within an economic sector. Companies in the same economic sector may be similarly affected by economic, regulatory, political or market events or conditions, making a fund more vulnerable to unfavorable developments in that economic sector than funds that invest more broadly. The Fund may be more susceptible to the particular risks that may affect companies in the health care sector than if it were invested in a wider variety of companies in unrelated sectors.
Information Technology Sector Risk
Sector risk occurs when a fund invests a significant portion of its assets in securities of companies conducting business in a related group of industries within an economic sector. Companies in the same
Annual Report 2015
27
COLUMBIA MARSICO GLOBAL FUND
NOTES TO FINANCIAL STATEMENTS (continued)
February 28, 2015
economic sector may be similarly affected by economic, regulatory, political or market events or conditions, making a fund more vulnerable to unfavorable developments in that economic sector than funds that invest more broadly. The Fund may be more susceptible to the particular risks that may affect companies in the information technology sector than if it were invested in a wider variety of companies in unrelated sectors.
Note 10. Subsequent Events
Management has evaluated the events and transactions that have occurred through the date the financial statements were issued and noted no items requiring adjustment of the financial statements or additional disclosure.
Note 11. Information Regarding Pending and Settled Legal Proceedings
In December 2005, without admitting or denying the allegations, American Express Financial Corporation (AEFC, which is now known as Ameriprise Financial, Inc. (Ameriprise Financial)) entered into settlement agreements with the Securities and Exchange Commission (SEC) and Minnesota Department of Commerce (MDOC) related to market timing activities. As a result, AEFC was censured and ordered to cease and desist from committing or causing any violations of certain provisions of the Investment Advisers Act of 1940, the Investment Company Act of 1940, and various Minnesota laws. AEFC agreed to pay disgorgement of $10 million and civil money penalties of $7 million. AEFC also agreed to retain an independent distribution consultant to assist in developing a plan for distribution of all disgorgement and civil penalties ordered by the SEC in accordance with various undertakings detailed at www.sec.gov/litigation/admin/ia-2451.pdf. Ameriprise Financial and its affiliates have cooperated with the SEC and the MDOC in these legal proceedings, and have made regular reports to the Funds' Boards of Trustees.
Ameriprise Financial and certain of its affiliates have historically been involved in a number of legal, arbitration and regulatory proceedings, including routine litigation, class actions, and governmental actions, concerning matters arising in connection with the conduct of their business activities. Ameriprise Financial believes that the Funds are not currently the subject of, and that neither Ameriprise Financial nor any of its affiliates are the subject of, any pending legal, arbitration or regulatory proceedings that are likely to have a material adverse effect on the Funds or the ability of Ameriprise Financial
or its affiliates to perform under their contracts with the Funds. Ameriprise Financial is required to make quarterly (10-Q), annual (10-K) and, as necessary, 8-K filings with the Securities and Exchange Commission on legal and regulatory matters that relate to Ameriprise Financial and its affiliates. Copies of these filings may be obtained by accessing the SEC website at www.sec.gov.
There can be no assurance that these matters, or the adverse publicity associated with them, will not result in increased fund redemptions, reduced sale of fund shares or other adverse consequences to the Funds. Further, although we believe proceedings are not likely to have a material adverse effect on the Funds or the ability of Ameriprise Financial or its affiliates to perform under their contracts with the Funds, these proceedings are subject to uncertainties and, as such, we are unable to estimate the possible loss or range of loss that may result. An adverse outcome in one or more of these proceedings could result in adverse judgments, settlements, fines, penalties or other relief that could have a material adverse effect on the consolidated financial condition or results of operations of Ameriprise Financial.
Annual Report 2015
28
COLUMBIA MARSICO GLOBAL FUND
REPORT OF INDEPENDENT REGISTERED PUBLIC ACCOUNTING FIRM
To the Trustees of Columbia Funds Series Trust and the Shareholders of
Columbia Marsico Global Fund
In our opinion, the accompanying statement of assets and liabilities, including the portfolio of investments, and the related statements of operations and of changes in net assets and the financial highlights present fairly, in all material respects, the financial position of Columbia Marsico Global Fund (the "Fund", a series of Columbia Funds Series Trust) at February 28, 2015, and the results of its operations, the changes in its net assets and the financial highlights for each of the periods indicated, in conformity with accounting principles generally accepted in the United States of America. These financial statements and financial highlights (hereafter referred to as "financial statements") are the responsibility of the Fund's management; our responsibility is to express an opinion on these financial statements based on our audits. We conducted our audits of these financial statements in accordance with the standards of the Public Company Accounting Oversight Board (United States). Those standards require that we plan and perform the audit to obtain reasonable assurance about whether the financial statements are free of material misstatement. An audit includes examining, on a test basis, evidence supporting the amounts and disclosures in the financial statements, assessing the accounting principles used and significant estimates made by management, and evaluating the overall financial statement presentation. We believe that our audits, which included confirmation of securities at February 28, 2015 by correspondence with the custodian, brokers and transfer agent, and the application of alternative auditing procedures where such confirmations had not been received, provide a reasonable basis for our opinion.
PricewaterhouseCoopers LLP
Minneapolis, Minnesota
April 21, 2015
Annual Report 2015
29
COLUMBIA MARSICO GLOBAL FUND
FEDERAL INCOME TAX INFORMATION
(Unaudited)
The Fund hereby designates the following tax attributes for the fiscal year ended February 28, 2015. Shareholders will be notified in early 2016 of the amounts for use in preparing 2015 income tax returns.
Tax Designations:
| Qualified Dividend Income | | | 30.49 | % | |
| Dividends Received Deduction | | | 12.87 | % | |
Capital Gain Dividend | | $ | 1,606,332 | | |
Qualified Dividend Income. For taxable, non-corporate shareholders, the percentage of ordinary income distributed during the fiscal year that represents qualified dividend income subject to reduced tax rates.
Dividends Received Deduction. The percentage of ordinary income distributed during the fiscal year that qualifies for the corporate dividends received deduction.
Capital Gain Dividend. The Fund designates as a capital gain dividend the amount reflected above, or if subsequently determined to be different, the net capital gain of such fiscal period.
Annual Report 2015
30
COLUMBIA MARSICO GLOBAL FUND
Shareholders elect the Board that oversees the Funds' operations. The Board appoints officers who are responsible for day-to-day business decisions based on policies set by the Board. The following table provides basic biographical information about the Funds' Board members, including their principal occupations during the past five years, although specific titles for individuals may have varied over the period. Under current Board policy, members may serve through the end of the calendar year in which he or she reaches either the mandatory retirement age established by the Board or the fifteenth anniversary of the first Board meeting they attended as a member of the Board.
Independent Trustees
Name,
Address,
Year of Birth | | Position Held With
Funds and Length of
Service | | Principal Occupation(s)
During Past Five Years
and Other Relevant
Professional Experience | | Number of
Funds in the
Fund Family
Overseen by
Board Member | | Other Present or Past
Directorships/
Trusteeships
(Within Past 5 Years) | |
Kathleen Blatz
901 S. Marquette Ave.
Minneapolis, MN 55402
1954 | | Board member since 1/06 for RiverSource Funds and since 6/11 for Nations Funds | | Attorney; specializing in arbitration and mediation; Chief Justice, Minnesota Supreme Court, 1998-2006; Associate Justice, Minnesota Supreme Court, 1996-1998; Fourth Judicial District Court Judge, Hennepin Country, 1994-1996; Attorney in private practice and public service, 1984-1993; State Representative, Minnesota House of Representatives, 1979-1993, which included service on the Tax and Financial Institutions and Insurance Committees | | | 127 | | | Trustee, BlueCross BlueShield of Minnesota (Chair of the Business Development Committee) since 2009; Chair of the Robina Foundation since August 2013 | |
Edward J. Boudreau, Jr.
901 S. Marquette Ave.
Minneapolis, MN 55402
1944 | | Board member since 6/11 for RiverSource Funds and since 1/05 for Nations Funds | | Managing Director, E.J. Boudreau & Associates (consulting) since 2000; FINRA Industry Arbitrator, 2002-present; Chairman and Chief Executive Officer, John Hancock Funds (asset management), Chairman and Interested Trustee for open-end and closed-end funds offered by John Hancock, 1989-2000; John Hancock Life Insurance Company, including SVP and Treasurer and SVP Information Technology, 1968-1988 | | | 125 | | | Former Trustee, BofA Funds Series Trust (11 funds), 2005-2011; Trustee, Boston Museum of Science (Chair of Finance Committee), 1985-2013 | |
Pamela G. Carlton
901 S. Marquette Ave.
Minneapolis, MN 55402
1954 | | Board member since 7/07 for RiverSource Funds and since 6/11 for Nations Funds | | President, Springboard — Partners in Cross Cultural Leadership (consulting company) since 2003; Managing Director of US Equity Research, JP Morgan Chase, 1999-2003; Director of US Equity Research, Chase Asset Management, 1996-1999; Co-Director Latin America Research, 1993-1996, COO Global Research, 1992-1996, Co-Director of US Research, 1991-1992, Investment Banker, Morgan Stanley, 1982-1991 | | | 127 | | | None | |
Annual Report 2015
31
COLUMBIA MARSICO GLOBAL FUND
TRUSTEES AND OFFICERS (continued)
Independent Trustees (continued)
Name,
Address,
Year of Birth | | Position Held With
Funds and Length of
Service | | Principal Occupation(s)
During Past Five Years
and Other Relevant
Professional Experience | | Number of
Funds in the
Fund Family
Overseen by
Board Member | | Other Present or Past
Directorships/
Trusteeships
(Within Past 5 Years) | |
William P. Carmichael
901 S. Marquette Ave.
Minneapolis, MN 55402
1943 | | Chair of the Board since 1/14, Board member since 6/11 for RiverSource Funds and since 2003 for Nations Funds | | Retired; Co-founder, The Succession Fund (provides exit strategies to owners of privately held companies) 1998-2007; Adjunct Professor of Finances, Kelley School of Business, Indiana University, 1993-2007; Senior Vice President, Sara Lee Corporation, 1991-1993; Senior Vice President and Chief Financial Officer, Beatrice Foods Company, 1984-1990; Vice President, Esmark, Inc, 1973-1984.; Associate, Price Waterhouse, 1968-1972 | | | 127 | | | Director, Cobra Electronics Corporation (electronic equipment manufacturer), 1994-August 2014; The Finish Line (athletic shoes and apparel) since July 2003; Director, International Textile Corp. since 2012; former Director, McMoRan Exploration Company (oil and gas exploration and development) 2010-2013; former Trustee, BofA Funds Series Trust (11 funds) 2009-2011; Director, Spectrum Brands, Inc. (consumer products), 2002-2009; Director, Simmons Company (bedding), 2004-2010 | |
Patricia M. Flynn
901 S. Marquette Ave.
Minneapolis, MN 55402
1950 | | Board member since 11/04 for RiverSource Funds and since 6/11 for Nations Funds | | Trustee Professor of Economics and Management, Bentley University since 1976 (also teaches and conducts research on corporate governance); Dean, McCallum Graduate School of Business, Bentley University, 1992-2002 | | | 127 | | | Trustee, MA Taxpayers Foundation since 1997; Board of Governors, Innovation Institute, MA Technology Collaborative since 2010 | |
William A. Hawkins
901 S. Marquette Ave.
Minneapolis, MN 55402
1942 | | Board member since 6/11 for RiverSource Funds and since 1/05 for Nations Funds | | Managing Director, Overton Partners (financial consulting), since August 2010; President and Chief Executive Officer, California General Bank, N.A., January 2008-August 2010; Operation Hope, COO, 2004-2007; IndyMac Bancorp, President, CBG, 1999-2003; American General Bank, President, 1997-1999; Griffin Financial Services, CEO, 1981-1997; The Griffin Funds, CEO, 1992-1998 | | | 125 | | | Trustee, BofA Funds Series Trust (11 funds) | |
R. Glenn Hilliard
901 S. Marquette Ave.
Minneapolis, MN 55402
1943 | | Board member since 6/11 for RiverSource Funds and since 1/05 for Nations Funds | | Chairman and Chief Executive Officer, Hilliard Group LLC (investing and consulting) since April 2003; Non-Executive Director & Chairman, CNO Financial Group, Inc. (insurance), September 2003-May 2011 | | | 125 | | | Chairman, BofA Funds Series Trust (11 funds); former Director, CNO Financial Group, Inc. (insurance) 2003-2011 | |
Annual Report 2015
32
COLUMBIA MARSICO GLOBAL FUND
TRUSTEES AND OFFICERS (continued)
Independent Trustees (continued)
Name,
Address,
Year of Birth | | Position Held With
Funds and Length of
Service | | Principal Occupation(s)
During Past Five Years
and Other Relevant
Professional Experience | | Number of
Funds in the
Fund Family
Overseen by
Board Member | | Other Present or Past
Directorships/
Trusteeships
(Within Past 5 Years) | |
Catherine James Paglia
901 S. Marquette Ave.
Minneapolis, MN 55402
1952 | | Board member since 11/04 for RiverSource Funds and since 6/11 for Nations Funds | | Director, Enterprise Asset Management, Inc. (private real estate and asset management company) since September 1998; Managing Director and Partner, Interlaken Capital, Inc., 1989-1997; Managing Director, Morgan Stanley, 1982-1989; Vice President, Investment Banking, 1980-1982, Associate, Investment Banking, 1976-1980, Dean Witter Reynolds, Inc. | | | 127 | | | Director, Valmont Industries, Inc. (irrigation systems manufacturer) since 2012; Trustee, Carleton College (on the Investment Committee); Trustee, Carnegie Endowment for International Peace (on the Investment Committee) | |
Leroy C. Richie
901 S. Marquette Ave.
Minneapolis, MN 55402
1941 | | Board member since 2000 for Seligman Funds, since 11/08 for RiverSource Funds and since 6/11 for Nations Funds | | Counsel, Lewis & Munday, P.C. (law firm) since 2004; Vice President and General Counsel, Automotive Legal Affairs, Chrysler Corporation, 1993-1997 | | | 127 | | | Lead Outside Director, Digital Ally, Inc. (digital imaging) since September 2005; Director, Infinity, Inc. (oil and gas exploration and production) since 1994; Director, OGE Energy Corp. (energy and energy services) since November 2007-2014 | |
Minor M. Shaw
901 S. Marquette Ave.
Minneapolis, MN 55402
1947 | | Board member since 6/11 for RiverSource Funds and since 2003 for Nations Funds | | President, Micco LLC (private investments) since 2011; President, Micco Corp. (family investment business) 1998-2011 | | | 125 | | | Director, Piedmont Natural Gas; Director, BlueCross BlueShield of South Carolina since April 2008; Chair of the Duke Endowment; Director, National Association of Corporate Directors, Carolinas Chapter, since 2013; Chair of Greenville-Spartanburg Airport Commission; former Trustee, BofA Funds Series Trust (11 funds), 2003-2011 | |
Alison Taunton-Rigby
901 S. Marquette Ave.
Minneapolis, MN 55402
1944 | | Board member since 11/02 for RiverSource Funds and since 6/11 for Nations Funds | | Managing Director, Forester Biotech (consulting) since 2001; Chief Executive Officer and Director, RiboNovix, Inc., (biotechnology) 2003-2010; President and Chief Executive Officer of CMT Inc., 2001-2003; Aquila Biopharmaceuticals Inc., 1996-2000; Cambridge Biotech Corporation, 1995-1996, Mitotix Inc., 1993-1994 | | | 127 | | | Director, Healthways, Inc. (health and well-being solutions) since 2005; Director, ICI Mutual Insurance Company, RRG since 2011; Director, Abt Associates (government contractor) since 2001; Director, Boston Children's Hospital since 2002 | |
Annual Report 2015
33
COLUMBIA MARSICO GLOBAL FUND
TRUSTEES AND OFFICERS (continued)
Interested Trustee Not Affiliated with Investment Manager*
Name,
Address,
Year of Birth | | Position Held With
Funds and Length of
Service | | Principal Occupation
During Past Five Years | | Number of
Funds in the
Fund Family
Overseen by
Board Member | | Other Present or Past
Directorships/
Trusteeships
(Within Past 5 Years) | |
Anthony M. Santomero
901 S. Marquette Ave.
Minneapolis, MN 55402
1946 | | Board member since 6/11 for RiverSource Funds and since 1/08 for Nations Funds | | Richard K. Mellon Professor Emeritus of Finance, The Wharton School, University of Pennsylvania, since 2002; Senior Advisor, McKinsey & Company (consulting), 2006-2008; President, Federal Reserve Bank of Philadelphia, 2000-2006, Professor of Finance, The Wharton School, University of Pennsylvania, 1972-2002 | | | 125 | | | Director, Renaissance Reinsurance Ltd. since May 2008; Trustee, Penn Mutual Life Insurance Company since March 2008; Director, Citigroup Inc. since 2009; Director, Citibank, N.A. since 2009; former Trustee, BofA Funds Series Trust (11 funds), 2008-2011 | |
* Dr. Santomero is not an affiliated person of the Investment Manager or Ameriprise Financial. However, he is currently deemed by the Funds to be an "interested person" (as defined in the 1940 Act) of the Funds because he serves as a Director of Citigroup Inc. and Citibank, N.A., companies that may directly or through subsidiaries and affiliates engage from time-to-time in brokerage execution, principal transactions and lending relationships with the Funds or accounts advised/managed by the Investment Manager.
Annual Report 2015
34
COLUMBIA MARSICO GLOBAL FUND
TRUSTEES AND OFFICERS (continued)
Interested Trustee Affiliated with Investment Manager*
Name,
Address,
Year of Birth | | Position Held With
Funds and Length of
Service | | Principal Occupation
During Past Five Years | | Number of
Funds in the
Fund Family
Overseen by
Board Member | | Other Present or Past
Directorships/
Trusteeships
(Within Past 5 Years) | |
William F. Truscott
53600 Ameriprise
Financial Center
Minneapolis, MN 55474
1960 | | Board member since 11/01 for RiverSource Funds and since 6/11 for Nations Funds; Senior Vice President since 2002 for RiverSource Funds and since 5/10 for Nations Funds | | Chairman of the Board and President, Columbia Management Investment Advisers, LLC since May 2010 and February 2012, respectively (previously President and Chief Investment Officer, 2001-April 2010); Chief Executive Officer, Global Asset Management, Ameriprise Financial, Inc. since September 2012 (previously Chief Executive Officer, U.S. Asset Management & President, Annuities, May 2010-September 2012 and President — U.S. Asset Management and Chief Investment Officer, 2005-April 2010); Director and Chief Executive Officer, Columbia Management Investment Distributors, Inc. since May 2010 and February 2012, respectively (previously Chairman of the Board and Chief Executive Officer, 2006-April 2010); Chairman of the Board and Chief Executive Officer, RiverSource Distributors, Inc. since 2006; Director, Threadneedle Asset Management Holdings, SARL since 2014; President and Chief Executive Officer, Ameriprise Certificate Company, 2006-August 2012 | | | 186 | | | Former Director, Ameriprise Certificate Company, 2006-January 2013 | |
* Interested person (as defined under the 1940 Act) by reason of being an officer, director, security holder and/or employee of the Investment Manager or Ameriprise Financial.
The Statement of Additional Information has additional information about the Fund's Board members and is available, without charge, upon request by calling 800.345.6611; contacting your financial intermediary or visiting columbiathreadneedle.com/us.
Annual Report 2015
35
COLUMBIA MARSICO GLOBAL FUND
TRUSTEES AND OFFICERS (continued)
The Board has appointed officers who are responsible for day-to-day business decisions based on policies it has established. The officers serve at the pleasure of the Board. In addition to Mr. Truscott, who is Senior Vice President, the Funds' other officers are:
Fund Officers
Name,
Address and
Year of Birth | | Position and Year
First Appointed to
Position for any Fund
in the Columbia
Funds Complex or a
Predecessor Thereof | | Principal Occupation(s) During Past Five Years | |
Christopher O. Petersen
5228 Ameriprise
Financial Center
Minneapolis, MN 55474
Born 1970 | | President and Principal Executive Officer (2015) | | Vice President and Lead Chief Counsel, Ameriprise Financial, Inc. since January 2015 (previously, Vice President and Chief Counsel January 2010-December 2014; and Vice President and Group Counsel or Counsel 2004-January 2010); officer of Columbia Funds and affiliated funds since 2007. | |
Michael G. Clarke
225 Franklin Street
Boston, MA 02110
Born 1969 | | Treasurer (2011) and Chief Financial Officer (2009) | | Vice President — Mutual Fund Administration, Columbia Management Investment Advisers, LLC, since May 2010; Managing Director of Fund Administration, Columbia Management Advisors, LLC, September 2004-April 2010; senior officer of Columbia Funds and affiliated funds since 2002. | |
Paul B. Goucher
100 Park Avenue
New York, NY 10017
Born 1968 | | Senior Vice President (2011), Chief Legal Officer (2015) and Assistant Secretary (2008) | | Vice President and Lead Chief Counsel, Ameriprise Financial, Inc. since November 2008 and January 2013, respectively (previously Chief Counsel, January 2010-January 2013 and Group Counsel, November 2008-January 2010). | |
Thomas P. McGuire
225 Franklin Street
Boston, MA 02110
Born 1972 | | Vice President and Chief Compliance Officer (2012) | | Vice President — Asset Management Compliance, Ameriprise Financial, Inc., since May 2010; Chief Compliance Officer, Ameriprise Certificate Company since September 2010; Compliance Executive, Bank of America, 2005-April 2010. | |
Colin Moore
225 Franklin Street
Boston, MA 02110
Born 1958 | | Senior Vice President (2010) | | Executive Vice President and Global Chief Investment Officer, Ameriprise Financial, Inc., since July 2013; Director and Global Chief Investment Officer, Columbia Management Investment Advisers, LLC since May 2010; Manager, Managing Director and Chief Investment Officer, Columbia Management Advisors, LLC, 2007-April 2010. | |
Michael E. DeFao
225 Franklin Street
Boston, MA 02110
Born 1968 | | Vice President (2011) and Assistant Secretary (2010) | | Vice President and Chief Counsel, Ameriprise Financial, Inc. since May 2010; Associate General Counsel, Bank of America, 2005-April 2010. | |
Joseph F. DiMaria
225 Franklin Street
Boston, MA 02110
Born 1968 | | Vice President (2011), Assistant Treasurer (2012) and Chief Accounting Officer (2008) | | Vice President — Mutual Fund Treasurer, Columbia Management Investment Advisers, LLC since May 2010; Director of Fund Administration, Columbia Management Advisors, LLC, 2006-April 2010. | |
Amy Johnson
5228 Ameriprise
Financial Center
Minneapolis, MN 55474
Born 1965 | | Vice President (2006) | | Managing Director and Chief Operating Officer, Columbia Management Investment Advisers, LLC since May 2010 (previously Chief Administrative Officer, 2009-April 2010, and Vice President — Asset Management and Trust Company Services, 2006-2009). | |
Lyn Kephart-Strong
5228 Ameriprise
Financial Center
Minneapolis, MN 55474
Born 1960 | | Vice President (2015) | | President, Columbia Management Investment Services Corp. since October 2014; Vice President & Resolution Officer, Ameriprise Trust Company since August 2009; President, RiverSource Service Corporation 2004-2010. | |
Ryan C. Larrenaga
225 Franklin Street
Boston, MA 02110
Born 1970 | | Vice President and Secretary (2015) | | Vice President and Group Counsel, Ameriprise Financial, Inc. since August 2011 (previously, Counsel from May 2010 to August 2011); Assistant General Counsel, Bank of America, 2005-April 2010; officer of Columbia Funds and affiliated funds since 2005. | |
Annual Report 2015
36
COLUMBIA MARSICO GLOBAL FUND
IMPORTANT INFORMATION ABOUT THIS REPORT
Each fund mails one shareholder report to each shareholder address. If you would like more than one report, please call shareholder services at 800.345.6611 and additional reports will be sent to you.
The policy of the Board is to vote the proxies of the companies in which each fund holds investments consistent with the procedures as stated in the Statement of Additional Information (SAI). You may obtain a copy of the SAI without charge by calling 800.345.6611; contacting your financial intermediary; visiting columbiathreadneedle.com/us; or searching the website of the Securities and Exchange Commission (SEC) at sec.gov. Information regarding how each fund voted proxies relating to portfolio securities is filed with the SEC by August 31st for the most recent 12-month period ending June 30th of that year, and is available without charge by visiting columbiathreadneedle.com/us; or searching the website of the SEC at sec.gov.
Each fund files a complete schedule of portfolio holdings with the SEC for the first and third quarters of each fiscal year on Form N-Q. Each fund's Form N-Q is available on the SEC's website at sec.gov and may be reviewed and copied at the SEC's Public Reference Room in Washington, D.C. Information on the operation of the Public Reference Room may be obtained by calling 800.SEC.0330. Each fund's complete schedule of portfolio holdings, as filed on Form N-Q, can also be obtained without charge, upon request, by calling 800.345.6611.
Annual Report 2015
37
Columbia Marsico Global Fund
P.O. Box 8081
Boston, MA 02266-8081

This information is for use with concurrent or prior delivery of a fund prospectus. Please read and consider the investment objectives, risks, charges and expenses for any fund carefully before investing. For a prospectus and summary prospectus, which contains this and other important information about the Fund, go to columbiathreadneedle.com/us. The Fund is distributed by Columbia Management Investment Distributors, Inc., member FINRA, and managed by Columbia Management Investment Advisers, LLC.
Columbia Threadneedle Investments (Columbia Threadneedle) is the global brand name of the Columbia and Threadneedle group of companies.
All rights reserved. Columbia Management Investment Distributors, Inc., 225 Franklin Street, Boston, MA 02110-2804
© 2015 Columbia Management Investment Advisers, LLC.
columbiathreadneedle.com/us
ANN187_02_E01_(04/15)

ANNUAL REPORT
February 28, 2015

COLUMBIA MARSICO GROWTH FUND

ABOUT COLUMBIA THREADNEEDLE INVESTMENTS
Columbia Threadneedle Investments is a leading global asset management group that provides a broad range of actively managed investment strategies and solutions for individual, institutional and corporate clients around the world.
With more than 2,000 people, including over 450 investment professionals based in North America, Europe and Asia, we manage $506 billion* of assets across developed and emerging market equities, fixed income, asset allocation solutions and alternatives. We are the 11th largest manager of long-term mutual fund assets in the U.S.** and the 5th largest manager of retail funds in the U.K.***
Our priority is the investment success of our clients. We aim to deliver the investment outcomes they expect through an investment approach that is team-based, performance-driven and risk-aware. Our culture is dynamic and interactive. By sharing our insights across asset classes and geographies, we generate richer perspectives on global, regional and local investment landscapes. The ability to exchange and debate investment ideas in a collaborative environment enriches our teams' investment processes. More importantly, it results in better informed investment decisions for our clients.
Columbia funds are distributed by Columbia Management Investment Distributors, Inc., member FINRA, and managed by Columbia Management Investment Advisers, LLC.
Columbia Threadneedle Investments (Columbia Threadneedle) is the global brand name of the Columbia and Threadneedle group of companies.
* In U.S. dollars as of December 31, 2014. Source: Ameriprise Q4 Earnings Release. Includes all assets managed by entities in the Columbia and Threadneedle groups of companies. Contact us for more current data.
** Source: ICI as of December 31, 2014 for Columbia Management Investment Advisers, LLC.
*** Source: Investment Association as of December 2014 for Threadneedle Asset Management Limited.
© 2015 Columbia Management Investment Advisers, LLC. All rights reserved.
Not part of the shareholder report
Get the market insight you need from our investment experts
Connect with Columbia Threadneedle Investments
Investor insight
Find economic and market commentary, investment videos, white papers, mutual fund commentary and more at columbiathreadneedle.com/us.
Columbia Threadneedle Investor Newsletter (e-newsletter)
Read our award-winning* shareholder newsletter. Our quarterly newsletter is available online and provides timely and relevant content about economic trends, fund news, service enhancements and changes. Sign up to receive the newsletter electronically at columbiathreadneedle.com/
us/newsletter.
Investment videos
Get analysis of current events and trends that may affect your investments. Visit our online video library to watch and discover what our thought leaders are saying about the financial markets and economy.
Social media
We offer you multiple ways to access our market commentary and investment insights.
n Perspectives blog at columbiathreadneedle.com/us
Read timely posts by our investment team, including our chief investment officer, chief economist and portfolio managers.
n twitter.com/CTinvest_US
Follow us on Twitter for quick, up-to-the-minute comments on market news and more.
n youtube.com/CTinvestUS
View our commentaries on the economy, markets and current investment opportunities.
n linkedin.com/company/columbia-threadneedle-investments-us
Connect with us on LinkedIn for updates from our thought leaders.
*Columbia Threadneedle Investor Newsletter was awarded top honors in the Mutual Fund Education Alliance STAR Awards competition for excellence in mutual fund marketing and communications in 2011, 2012 and 2013. Materials in the competition were evaluated on educational value, message comprehension, effective design and objectives.
Not part of the shareholder report
Stay informed
Become a subscriber to receive the latest investment publications and mutual fund commentaries
Subscribe to Columbia Threadneedle Investments
Email subscription center
Subscribe to the latest information from Columbia Threadneedle. Visit our email subscription center at columbiathreadneedle.com/us/subscribe to register for economic and market commentary, product and service updates, white papers and more.
n Columbia Threadneedle Investor Newsletter
Quarterly newsletter featuring the latest macro- and micro-economic trends, investment themes, products, service changes and other items of interest to our investors
n Investment Strategy Outlook
Quarterly publication featuring the Columbia Threadneedle Asset Allocation Team's perspective on global economic investment conditions and markets
n MarketTrack
Quarterly publication featuring more than 40 charts and graphs that highlight the current state of the economy and the markets; includes straightforward insight on current investment opportunities
n White papers
Frequent articles that delve deep into a variety of investment topics
n Mutual fund updates
Quarterly portfolio manager commentary and fund fact sheets available for Columbia funds. (Not all funds have a commentary.)
Register your information online at columbiathreadneedle.com/us/subscribe and select the publications you would like to receive. Update your subscriptions at any time by accessing the email subscription center.
CT-MK (03/15) 5383/1125800

Dear Shareholder,
In a world that is changing faster than ever before, investors want asset managers who offer a global perspective while generating strong and sustainable returns. To that end, Columbia Management, in conjunction with its U.K.-based affiliate, Threadneedle Investments, has rebranded to Columbia Threadneedle Investments. The new global brand represents the combined capabilities, resources and reach of the global group, offering investors access to the best of both firms.
With a presence in 18 countries and more than 450 investment professionals*, our collective perspective and world view as Columbia Threadneedle Investments gives us deeper insight into what might affect the real-life financial outcomes clients are seeking. Putting our views into a global context enables us to build richer perspectives and create the right solutions, and provides us with enhanced capabilities to deliver consistent investment performance, which may ultimately lead to better investor outcomes.
As a result of the rebrand, you will begin to see our new logo and colors reflected in printed materials, such as this shareholder report, as well as on our new website — columbiathreadneedle.com/us. We encourage you to visit us online and view a new video on the "About Us" tab that speaks to the strength of the firm.
While we are introducing a new brand, in many ways, the investment company you know well has not changed. The following remain in effect:
n Fund and strategy names
n Established investment teams, philosophies and processes
n Account services, features, servicing phone numbers and mailing addresses
n Columbia Management Investment Distributors as distributor and Columbia Management Investment Advisers as investment adviser
We recognize that the money we manage represents the hard work and savings of people like you, and that everyone has different ambitions and different definitions of success. Investors have varying goals — funding their children's education, enjoying their retirement, putting money aside for unexpected events, and more. Whatever your ambitions, we believe our wide range of investment products and solutions can help give you confidence that you will reach your goals.
The world is constantly changing, but our priority remains the same: to help you secure your finances, meet your goals and achieve success. Thank you for your continued investment with us. Our service representatives are available at 800.345.6611 to help with any questions.
Sincerely,

Christopher O. Petersen
President, Columbia Funds
Investors should consider the investment objectives, risks, charges and expenses of a mutual fund carefully before investing. For a free prospectus and summary prospectus, which contains this and other important information about a fund, visit columbiathreadneedle.com/us. The prospectus should be read carefully before investing.
* Source: Ameriprise as of December 1, 2014
Columbia Funds are distributed by Columbia Management Investment Distributors, Inc., member FINRA, and managed by Columbia Management Investment Advisers, LLC.
© 2015 Columbia Management Investment Advisers, LLC. All rights reserved.
COLUMBIA MARSICO GROWTH FUND
Fund Investment Manager
Columbia Management Investment
Advisers, LLC
225 Franklin Street
Boston, MA 02110
Fund Distributor
Columbia Management Investment
Distributors, Inc.
225 Franklin Street
Boston, MA 02110
Fund Transfer Agent
Columbia Management Investment
Services Corp.
P.O. Box 8081
Boston, MA 02266-8081
For more information about any of the funds, please visit columbiathreadneedle.com/us or call 800.345.6611. Customer Service Representatives are available to answer your questions Monday through Friday from 8 a.m. to 7 p.m. Eastern time.
The views expressed in this report reflect the current views of the respective parties. These views are not guarantees of future performance and involve certain risks, uncertainties and assumptions that are difficult to predict, so actual outcomes and results may differ significantly from the views expressed. These views are subject to change at any time based upon economic, market or other conditions and the respective parties disclaim any responsibility to update such views. These views may not be relied on as investment advice and, because investment decisions for a Columbia fund are based on numerous factors, may not be relied on as an indication of trading intent on behalf of any particular Columbia fund. References to specific securities should not be construed as a recommendation or investment advice.
Performance Overview | | | 3 | | |
Manager Discussion of Fund Performance | | | 5 | | |
Understanding Your Fund's Expenses | | | 8 | | |
Portfolio of Investments | | | 9 | | |
Statement of Assets and Liabilities | | | 13 | | |
Statement of Operations | | | 15 | | |
Statement of Changes in Net Assets | | | 16 | | |
Financial Highlights | | | 19 | | |
Notes to Financial Statements | | | 28 | | |
Report of Independent Registered
Public Accounting Firm | | | 35 | | |
Federal Income Tax Information | | | 36 | | |
Trustees and Officers | | | 37 | | |
Important Information About This Report | | | 43 | | |
COLUMBIA MARSICO GROWTH FUND
Performance Summary
n Columbia Marsico Growth Fund (the Fund) Class A shares returned 9.11% excluding sales charges for the 12-month period that ended February 28, 2015.
n The Fund underperformed its benchmark, the S&P 500 Index, which returned 15.51% during the same time period.
n Stock selection and an overweight relative to the benchmark to the consumer discretionary sector, as well as stock selection in technology, energy and financials detracted from performance.
Average Annual Total Returns (%) (for period ended February 28, 2015)
| | | Inception | | 1 Year | | 5 Years | | 10 Years | |
Class A | | 12/31/97 | | | | | | | | | | | | | |
Excluding sales charges | | | | | | | 9.11 | | | | 15.46 | | | | 7.14 | | |
Including sales charges | | | | | | | 2.86 | | | | 14.10 | | | | 6.51 | | |
Class B | | 12/31/97 | | | | | | | | | | | | | |
Excluding sales charges | | | | | | | 8.26 | | | | 14.59 | | | | 6.34 | | |
Including sales charges | | | | | | | 3.55 | | | | 14.36 | | | | 6.34 | | |
Class C | | 12/31/97 | | | | | | | | | | | | | |
Excluding sales charges | | | | | | | 8.30 | | | | 14.60 | | | | 6.34 | | |
Including sales charges | | | | | | | 7.35 | | | | 14.60 | | | | 6.34 | | |
Class I* | | 09/27/10 | | | 9.60 | | | | 15.94 | | | | 7.37 | | |
Class R* | | 01/23/06 | | | 8.81 | | | | 15.16 | | | | 6.86 | | |
Class R4* | | 11/08/12 | | | 9.39 | | | | 15.59 | | | | 7.21 | | |
Class R5* | | 11/08/12 | | | 9.51 | | | | 15.66 | | | | 7.24 | | |
Class W* | | 09/27/10 | | | 9.14 | | | | 15.48 | | | | 7.15 | | |
Class Z | | 12/31/97 | | | 9.39 | | | | 15.74 | | | | 7.41 | | |
S&P 500 Index | | | | | | | 15.51 | | | | 16.18 | | | | 7.99 | | |
Returns for Class A are shown with and without the maximum initial sales charge of 5.75%. Returns for Class B are shown with and without the applicable contingent deferred sales charge (CDSC) of 5.00% in the first year, declining to 1.00% in the sixth year and eliminated thereafter. Returns for Class C are shown with and without the 1.00% CDSC for the first year only. The Fund's other classes are not subject to sales charges and have limited eligibility. Please see the Fund's prospectus for details. Performance for different share classes will vary based on differences in sales charges and fees associated with each class. All results shown assume reinvestment of distributions during the period. Returns do not reflect the deduction of taxes that a shareholder may pay on Fund distributions or on the redemption of Fund shares. Performance results reflect the effect of any fee waivers or reimbursements of Fund expenses by Columbia Management Investment Advisers, LLC and/or any of its affiliates. Absent these fee waivers or expense reimbursement arrangements, performance results would have been lower.
The performance information shown represents past performance and is not a guarantee of future results. The investment return and principal value of your investment will fluctuate so that your shares, when redeemed, may be worth more or less than their original cost. Current performance may be lower or higher than the performance information shown. You may obtain performance information current to the most recent month-end by contacting your financial intermediary, visiting columbiathreadneedle.com/us or calling 800.345.6611.
*The returns shown for periods prior to the share class inception date (including returns for the Life of the Fund, if shown, which are since Fund inception) include the returns of the Fund's oldest share class. Since the Fund launched more than one class of shares at its inception, Class A shares were used. These returns are adjusted to reflect any higher class-related operating expenses of the newer share classes, as applicable. Please visit columbiathreadneedle.com/us/investment-products/mutual-funds/appended-performance for more information.
The S&P 500 Index, an unmanaged index, measures the performance of 500 widely held, large-capitalization U.S. stocks and is frequently used as a general measure of market performance.
Indices are not available for investment, are not professionally managed and do not reflect sales charges, fees, brokerage commissions, taxes or other expenses of investing. Securities in the Fund may not match those in an index.
Annual Report 2015
3
COLUMBIA MARSICO GROWTH FUND
PERFORMANCE OVERVIEW (continued)
Performance of a Hypothetical $10,000 Investment (March 1, 2005 – February 28, 2015)

The chart above shows the change in value of a hypothetical $10,000 investment in Class A shares of Columbia Marsico Growth Fund during the stated time period, and does not reflect the deduction of taxes that a shareholder may pay on Fund distributions or on the redemption of Fund shares.
Annual Report 2015
4
COLUMBIA MARSICO GROWTH FUND
MANAGER DISCUSSION OF FUND PERFORMANCE
For the 12-month period that ended February 28, 2015, the Fund's Class A shares returned 9.11% excluding sales charges. The Fund underperformed its benchmark, the S&P 500 Index, which returned 15.51% for the same time period. Stock selection and an overweight relative to the benchmark to the consumer discretionary sector, as well as stock selection in technology, energy and financials detracted from performance. While stock selection in the industrials, consumer staples, materials and healthcare sectors contributed positively to results.
Stocks Rose as Investors Monitored Fed Policy and Oil Prices
U.S. stocks generally registered solid gains during the period ended February 28, 2015. These gains occurred even as investors grappled with concerns about U.S. Federal Reserve (Fed) policy, slower growth in emerging and many developed markets and the implications of lower oil prices. Crude oil prices fell sharply during the period and ended 2014 at their lowest levels since 2009. The decline stemmed in part from slowing growth in demand, stagnating economic growth in Europe and technological advances such as more-efficient motor vehicles. Increased supply was also a primary reason for falling oil prices, as fracking technologies drove petroleum supplies sharply higher in the U.S., while other countries maintained or increased production. By February 2015, dramatic declines in oil prices gave way to relative stability as prices oscillated between $48 and $54 a barrel.
The continued advance of the U.S. dollar through the period reflected impressive gains in U.S. labor markets as well as commitments by foreign central banks to extend easier monetary policy in Europe, China and Japan. Though certainly not blistering, U.S. economic strength at the end of the period could be seen in upward revisions to previous increases, which took the three-month average increase in jobs to a powerful 330,000. Strong job gains, low inflation and falling oil prices translated to hefty increases in consumer spending near the end of the period, including a 4.2% gain in the fourth quarter of 2014. This strong growth was accompanied by a remarkably benign core inflation backdrop. In the U.S. and around the globe, inflation was in sharp retreat by the end of the period, reflecting both the direct effects of falling energy costs and the echo effects of lower prices for other goods and services. The prospects for firming Fed policy continue to be debated and remain unresolved.
Positions in Consumer Discretionary and Energy Hindered Performance
Stock selection and an overweight relative to the benchmark in the consumer discretionary sector and stock selection in the energy sector were the biggest detractors from Fund performance. Wynn Resorts, for example, was the largest individual detractor during the period. A slowing economy in China and the Chinese government's efforts to crack down on corruption resulted in disappointing results from Wynn's VIP business in the Macau market. Priceline, meanwhile, was hurt by a slowdown in bookings caused by the continued shift toward booking on mobile devices.
Portfolio Management
Marsico Capital Management, LLC
Thomas Marsico
Coralie Witter, CFA
Kevin Boone*
*Effective January 30, 2015, Mr. Boone was named a Portfolio Manager of the Fund.
Morningstar Style BoxTM

The Morningstar Style BoxTM is based on a fund's portfolio holdings. For equity funds, the vertical axis shows the market capitalization of the stocks owned, and the horizontal axis shows investment style (value, blend, or growth). Information shown is based on the most recent data provided by Morningstar.
© 2015 Morningstar, Inc. All rights reserved. The Morningstar information contained herein: (1) is proprietary to Morningstar and/or its content providers; (2) may not be copied or distributed; and (3) is not warranted to be accurate, complete or timely. Neither Morningstar nor its content providers are responsible for any damages or losses arising from any use of this information.
Annual Report 2015
5
COLUMBIA MARSICO GROWTH FUND
MANAGER DISCUSSION OF FUND PERFORMANCE (continued)
Top Ten Holdings (%)
(at February 28, 2015) | |
Apple, Inc. | | | 5.4 | | |
Facebook, Inc., Class A | | | 5.2 | | |
Union Pacific Corp. | | | 4.7 | | |
Biogen Idec, Inc. | | | 4.6 | | |
Gilead Sciences, Inc. | | | 4.6 | | |
Visa, Inc., Class A | | | 4.5 | | |
Canadian Pacific Railway Ltd. | | | 4.4 | | |
Walt Disney Co. (The) | | | 4.2 | | |
Sherwin-Williams Co. (The) | | | 3.7 | | |
HCA Holdings, Inc. | | | 3.6 | | |
Percentages indicated are based upon total investments (excluding Money Market Funds).
For further detail about these holdings, please refer to the section entitled "Portfolio of Investments."
Fund holdings are as of the date given, are subject to change at any time, and are not recommendations to buy or sell any security.
Portfolio Breakdown (%)
(at February 28, 2015) | |
Common Stocks | | | 100.0 | | |
Consumer Discretionary | | | 20.7 | | |
Consumer Staples | | | 3.0 | | |
Energy | | | 0.6 | | |
Financials | | | 2.2 | | |
Health Care | | | 25.4 | | |
Industrials | | | 15.3 | | |
Information Technology | | | 26.0 | | |
Materials | | | 6.8 | | |
Money Market Funds | | | 0.0 | (a) | |
Total | | | 100.0 | | |
Percentages indicated are based upon total investments. The Fund's portfolio composition is subject to change.
(a) Rounds to zero.
Antero Resources also underperformed in part because of a decline in commodity prices for crude oil and natural gas.
Stock selection in the industrials, consumer staples, materials and healthcare sectors aided results, as industrials was the strongest performing sector, specifically in the capital goods industry group. Among individual stocks, the Fund benefited from its position in Sherwin-Williams as shares of the largest U.S. paint retailer rose as a result of acquisitions and higher sales volumes at its stores. Celgene, a world leader in hematology, oncology and inflammation research, also contributed. The company has diversified away from being a single-product story to a multi-product story with one of the strongest product pipelines in pharmaceuticals and biotechnology, which has provided the company with an improved long-term earnings outlook. The Fund also benefited from its position in Union Pacific. We believe that increasingly tight transport markets, including truck and rail, should lead to an acceleration in pricing and earnings growth. This scenario has played out over the past year with accelerating volumes and improved pricing, which helped drive earnings growth by more than 20%.
Portfolio Activity
We re-initiated a position in Apple following a period of consolidation for the company. We believe that the company shares characteristics of both an offensive and defensive growth investment, and we do not think Apple shares reflect upcoming hardware, software and services innovation. We expect market share gains for the iPhone with the release of larger screen sizes to power a re-acceleration in growth. Likewise, we see Apple's ecosystem expanding with the inclusion of new platforms like Apple Pay, Apple Watch and other high-margin services such as the company's HomeKit home automation platform and the HealthKit fitness and health platform.
We established a position in Hospital Corporation of America (HCA), a leading provider of hospital and healthcare services, based on our belief that the Affordable Care Act should have a positive impact on HCA's business as nonpayment rates from uninsured patients decline and enrollment in exchanges and Medicaid increase. We also added Nike to the portfolio. We believe the company has a leading global brand that will benefit from a trend toward "athleisure" apparel. Nike's scale is a critical component to their ability to win big endorsements, despite being a 40-year-old brand. Nike can leverage its $30 billion revenue base to maintain and win endorsements over the competition.
Texas Instruments was sold during the period when it was replaced by Apple. CBS Corporation was sold as the company faced continued pressure on its core business, which created a less attractive valuation. We sold Citigroup after the company failed the 2014 Fed stress test, and we lost confidence in its management. We now want to see what additional steps are being taken by Citigroup to address regulatory and compliance issues.
Annual Report 2015
6
COLUMBIA MARSICO GROWTH FUND
MANAGER DISCUSSION OF FUND PERFORMANCE (continued)
Looking Ahead
Two top-of-mind items for many investors at the end of 2014 were declining oil prices (and their commensurate effects) and central bank policies. On balance, lower oil prices improve U.S. prospects for growth and low inflation. We believe oil prices may slide further, but will eventually settle and perhaps climb again in the future, as low prices should ease fracking activity and tighten supply. We will continue to monitor the economic effects and geopolitical consequences of potentially extended and deeper reductions in oil prices. Also, while central banks of other countries focus on efforts to stimulate their economies, the Fed may confront a much better than recently expected pace of economic expansion.
As always, we continue to favor companies that we believe are gaining market share in large and growing markets. The Fund emphasizes investments in businesses with strong recurring revenues, strong free cash flow generation, pricing power and responsible capital allocation. In this lower growth environment, share buybacks and dividends may be material contributors to total returns.
Investment Risks
Market risk may affect a single issuer, sector of the economy, industry or the market as a whole. Growth securities, at times, may not perform as well as value securities or the stock market in general and may be out of favor with investors. Foreign investments subject the fund to risks, including political, economic, market, social and others within a particular country, as well as to currency instabilities and less stringent financial and accounting standards generally applicable to U.S. issuers. Risks are enhanced for emerging market issuers. Investments in a limited number of companies or sectors, subject the Fund to greater risk of loss. See the Fund's prospectus for more information on these and other risks.
Annual Report 2015
7
COLUMBIA MARSICO GROWTH FUND
UNDERSTANDING YOUR FUND'S EXPENSES
(Unaudited)
As an investor, you incur two types of costs. There are transaction costs, which generally include sales charges on purchases and may include redemption fees. There are also ongoing costs, which generally include management fees, distribution and/or service fees, and other fund expenses. The following information is intended to help you understand your ongoing costs (in dollars) of investing in the Fund and to help you compare these costs with the ongoing costs of investing in other mutual funds.
Analyzing Your Fund's Expenses
To illustrate these ongoing costs, we have provided examples and calculated the expenses paid by investors in each share class of the Fund during the period. The actual and hypothetical information in the table is based on an initial investment of $1,000 at the beginning of the period indicated and held for the entire period. Expense information is calculated two ways and each method provides you with different information. The amount listed in the "Actual" column is calculated using the Fund's actual operating expenses and total return for the period. You may use the Actual information, together with the amount invested, to estimate the expenses that you paid over the period. Simply divide your account value by $1,000 (for example, an $8,600 account value divided by $1,000 = 8.6), then multiply the results by the expenses paid during the period under the "Actual" column. The amount listed in the "Hypothetical" column assumes a 5% annual rate of return before expenses (which is not the Fund's actual return) and then applies the Fund's actual expense ratio for the period to the hypothetical return. You should not use the hypothetical account values and expenses to estimate either your actual account balance at the end of the period or the expenses you paid during the period. See "Compare With Other Funds" below for details on how to use the hypothetical data.
Compare With Other Funds
Since all mutual funds are required to include the same hypothetical calculations about expenses in shareholder reports, you can use this information to compare the ongoing cost of investing in the Fund with other funds. To do so, compare the hypothetical example with the 5% hypothetical examples that appear in the shareholder reports of other funds. As you compare hypothetical examples of other funds, it is important to note that hypothetical examples are meant to highlight the ongoing costs of investing in a fund only and do not reflect any transaction costs, such as sales charges, or redemption or exchange fees. Therefore, the hypothetical calculations are useful in comparing ongoing costs only, and will not help you determine the relative total costs of owning different funds. If transaction costs were included in these calculations, your costs would be higher.
September 1, 2014 – February 28, 2015
| | | Account Value at the Beginning
of the Period ($) | | Account Value at the End of the
Period ($) | | Expenses Paid During the
Period ($) | | Fund's Annualized
Expense Ratio (%) | |
| | | Actual | | Hypothetical | | Actual | | Hypothetical | | Actual | | Hypothetical | | Actual | |
Class A | | | 1,000.00 | | | | 1,000.00 | | | | 1,043.40 | | | | 1,019.05 | | | | 6.01 | | | | 5.94 | | | | 1.18 | | |
Class B | | | 1,000.00 | | | | 1,000.00 | | | | 1,039.10 | | | | 1,015.31 | | | | 9.81 | | | | 9.70 | | | | 1.93 | | |
Class C | | | 1,000.00 | | | | 1,000.00 | | | | 1,039.50 | | | | 1,015.31 | | | | 9.81 | | | | 9.70 | | | | 1.93 | | |
Class I | | | 1,000.00 | | | | 1,000.00 | | | | 1,045.40 | | | | 1,021.29 | | | | 3.72 | | | | 3.68 | | | | 0.73 | | |
Class R | | | 1,000.00 | | | | 1,000.00 | | | | 1,041.70 | | | | 1,017.80 | | | | 7.28 | | | | 7.19 | | | | 1.43 | | |
Class R4 | | | 1,000.00 | | | | 1,000.00 | | | | 1,044.40 | | | | 1,020.29 | | | | 4.74 | | | | 4.68 | | | | 0.93 | | |
Class R5 | | | 1,000.00 | | | | 1,000.00 | | | | 1,045.20 | | | | 1,021.04 | | | | 3.98 | | | | 3.93 | | | | 0.78 | | |
Class W | | | 1,000.00 | | | | 1,000.00 | | | | 1,043.40 | | | | 1,019.40 | | | | 5.65 | | | | 5.59 | | | | 1.11 | | |
Class Z | | | 1,000.00 | | | | 1,000.00 | | | | 1,044.40 | | | | 1,020.29 | | | | 4.74 | | | | 4.68 | | | | 0.93 | | |
Expenses paid during the period are equal to the annualized expense ratio for each class as indicated above, multiplied by the average account value over the period and then multiplied by the number of days in the Fund's most recent fiscal half year and divided by 365.
Expenses do not include fees and expenses incurred indirectly by the Fund from its investment in underlying funds, including affiliated and non-affiliated pooled investment vehicles, such as mutual funds and exchange-traded funds.
Annual Report 2015
8
COLUMBIA MARSICO GROWTH FUND
PORTFOLIO OF INVESTMENTS
February 28, 2015
(Percentages represent value of investments compared to net assets)
Common Stocks 99.4%
Issuer | | Shares | | Value ($) | |
CONSUMER DISCRETIONARY 20.7% | |
Automobiles 1.8% | |
Tesla Motors, Inc.(a) | | | 142,633 | | | | 29,002,994 | | |
Hotels, Restaurants & Leisure 7.0% | |
Chipotle Mexican Grill, Inc.(a) | | | 11,877 | | | | 7,897,849 | | |
Starbucks Corp. | | | 404,859 | | | | 37,848,244 | | |
Starwood Hotels & Resorts Worldwide, Inc. | | | 439,217 | | | | 35,282,301 | | |
Wynn Resorts Ltd. | | | 231,810 | | | | 33,032,925 | | |
Total | | | | | 114,061,319 | | |
Media 6.5% | |
Comcast Corp., Class A | | | 629,681 | | | | 37,390,458 | | |
Walt Disney Co. (The) | | | 660,259 | | | | 68,719,757 | | |
Total | | | | | 106,110,215 | | |
Multiline Retail 2.0% | |
Dollar Tree, Inc.(a) | | | 419,873 | | | | 33,455,481 | | |
Textiles, Apparel & Luxury Goods 3.4% | |
Nike, Inc., Class B | | | 573,345 | | | | 55,683,266 | | |
Total Consumer Discretionary | | | | | 338,313,275 | | |
CONSUMER STAPLES 3.0% | |
Beverages 0.5% | |
Constellation Brands, Inc., Class A(a) | | | 74,288 | | | | 8,522,319 | | |
Food & Staples Retailing 2.5% | |
CVS Health Corp. | | | 388,417 | | | | 40,344,874 | | |
Total Consumer Staples | | | | | 48,867,193 | | |
ENERGY 0.5% | |
Oil, Gas & Consumable Fuels 0.5% | |
Antero Resources Corp.(a) | | | 227,584 | | | | 8,978,189 | | |
Total Energy | | | | | 8,978,189 | | |
FINANCIALS 2.2% | |
Capital Markets 2.2% | |
Charles Schwab Corp. (The) | | | 1,232,996 | | | | 36,176,102 | | |
Total Financials | | | | | 36,176,102 | | |
HEALTH CARE 25.2% | |
Biotechnology 12.1% | |
Biogen Idec, Inc.(a) | | | 181,971 | | | | 74,533,502 | | |
Celgene Corp.(a) | | | 401,187 | | | | 48,756,256 | | |
Gilead Sciences, Inc.(a) | | | 717,653 | | | | 74,298,615 | | |
Total | | | | | 197,588,373 | | |
Common Stocks (continued)
Issuer | | Shares | | Value ($) | |
Health Care Providers & Services 6.4% | |
HCA Holdings, Inc.(a) | | | 826,233 | | | | 59,108,709 | | |
UnitedHealth Group, Inc. | | | 399,196 | | | | 45,360,641 | | |
Total | | | | | 104,469,350 | | |
Pharmaceuticals 6.7% | |
Actavis PLC(a) | | | 189,662 | | | | 55,259,920 | | |
Merck & Co., Inc. | | | 451,183 | | | | 26,412,253 | | |
Pacira Pharmaceuticals, Inc.(a) | | | 215,452 | | | | 24,727,426 | | |
Valeant Pharmaceuticals
International, Inc.(a) | | | 22,253 | | | | 4,394,523 | | |
Total | | | | | 110,794,122 | | |
Total Health Care | | | | | 412,851,845 | | |
INDUSTRIALS 15.2% | |
Aerospace & Defense 4.2% | |
Boeing Co. (The) | | | 229,702 | | | | 34,650,547 | | |
Lockheed Martin Corp. | | | 167,286 | | | | 33,465,564 | | |
Total | | | | | 68,116,111 | | |
Airlines 1.9% | |
Delta Air Lines, Inc. | | | 710,173 | | | | 31,616,902 | | |
Road & Rail 9.1% | |
Canadian Pacific Railway Ltd. | | | 383,205 | | | | 71,896,922 | | |
Union Pacific Corp. | | | 636,603 | | | | 76,557,877 | | |
Total | | | | | 148,454,799 | | |
Total Industrials | | | | | 248,187,812 | | |
INFORMATION TECHNOLOGY 25.8% | |
Internet Software & Services 9.7% | |
Alibaba Group Holding Ltd., ADR(a) | | | 466,350 | | | | 39,695,712 | | |
Facebook, Inc., Class A(a) | | | 1,077,033 | | | | 85,053,296 | | |
LinkedIn Corp., Class A(a) | | | 78,373 | | | | 20,941,266 | | |
Tencent Holdings Ltd. | | | 710,400 | | | | 12,394,881 | | |
Total | | | | | 158,085,155 | | |
IT Services 6.0% | |
FleetCor Technologies, Inc.(a) | | | 162,287 | | | | 24,899,694 | | |
Visa, Inc., Class A | | | 268,905 | | | | 72,956,616 | | |
Total | | | | | 97,856,310 | | |
Semiconductors & Semiconductor Equipment 3.2% | |
ARM Holdings PLC | | | 1,121,063 | | | | 20,059,438 | | |
| ASML Holding NV | | | 306,035 | | | | 32,953,849 | | |
Total | | | | | 53,013,287 | | |
The accompanying Notes to Financial Statements are an integral part of this statement.
Annual Report 2015
9
COLUMBIA MARSICO GROWTH FUND
PORTFOLIO OF INVESTMENTS (continued)
February 28, 2015
Common Stocks (continued)
Issuer | | Shares | | Value ($) | |
Software 1.6% | |
Electronic Arts, Inc.(a) | | | 215,828 | | | | 12,341,045 | | |
salesforce.com, Inc.(a) | | | 195,865 | | | | 13,589,114 | | |
Total | | | | | 25,930,159 | | |
Technology Hardware, Storage & Peripherals 5.3% | |
Apple, Inc. | | | 680,904 | | | | 87,468,928 | | |
Total Information Technology | | | | | 422,353,839 | | |
MATERIALS 6.8% | |
Chemicals 6.8% | |
Monsanto Co. | | | 422,952 | | | | 50,936,109 | | |
Sherwin-Williams Co. (The) | | | 209,189 | | | | 59,660,703 | | |
Total | | | | | 110,596,812 | | |
Total Materials | | | | | 110,596,812 | | |
Total Common Stocks
(Cost: $1,089,344,877) | | | | | 1,626,325,067 | | |
Money Market Funds —%
| | | Shares | | Value ($) | |
Columbia Short-Term Cash Fund,
0.118%(b)(c) | | | 20,601 | | | | 20,601 | | |
Total Money Market Funds
(Cost: $20,601) | | | | | 20,601 | | |
Total Investments
(Cost: $1,089,365,478) | | | | | 1,626,345,668 | | |
Other Assets & Liabilities, Net | | | | | 10,113,977 | | |
Net Assets | | | | | 1,636,459,645 | | |
Notes to Portfolio of Investments
(a) Non-income producing.
(b) The rate shown is the seven-day current annualized yield at February 28, 2015.
(c) As defined in the Investment Company Act of 1940, an affiliated company is one in which the Fund owns 5% or more of the company's outstanding voting securities, or a company which is under common ownership or control with the Fund. Holdings and transactions in these affiliated companies during the year ended February 28, 2015, are as follows:
Issuer | | Beginning
Cost ($) | | Purchase
Cost ($) | | Proceeds
From Sales ($) | | Ending
Cost ($) | | Dividends —
Affiliated
Issuers ($) | | Value ($) | |
Columbia Short-Term Cash Fund | | | 38,194,829 | | | | 902,008,624 | | | | (940,182,852 | ) | | | 20,601 | | | | 50,707 | | | | 20,601 | | |
Abbreviation Legend
ADR American Depositary Receipt
Fair Value Measurements
Generally accepted accounting principles (GAAP) require disclosure regarding the inputs and valuation techniques used to measure fair value and any changes in valuation inputs or techniques. In addition, investments shall be disclosed by major category.
The Fund categorizes its fair value measurements according to a three-level hierarchy that maximizes the use of observable inputs and minimizes the use of unobservable inputs by prioritizing that the most observable input be used when available. Observable inputs are those that market participants would use in pricing an investment based on market data obtained from sources independent of the reporting entity. Unobservable inputs are those that reflect the Fund's assumptions about the information market participants would use in pricing an investment. An investment's level within the fair value hierarchy is based on the lowest level of any input that is deemed significant to the asset or liability's fair value measurement. The input levels are not necessarily an indication of the risk or liquidity associated with investments at that level. For example, certain U.S. government securities are generally high quality and liquid, however, they are reflected as Level 2 because the inputs used to determine fair value may not always be quoted prices in an active market.
The accompanying Notes to Financial Statements are an integral part of this statement.
Annual Report 2015
10
COLUMBIA MARSICO GROWTH FUND
PORTFOLIO OF INVESTMENTS (continued)
February 28, 2015
Fair Value Measurements (continued)
Fair value inputs are summarized in the three broad levels listed below:
> Level 1 — Valuations based on quoted prices for investments in active markets that the Fund has the ability to access at the measurement date (including NAV for open-end mutual funds). Valuation adjustments are not applied to Level 1 investments.
> Level 2 — Valuations based on other significant observable inputs (including quoted prices for similar securities, interest rates, prepayment speeds, credit risks, etc.).
> Level 3 — Valuations based on significant unobservable inputs (including the Fund's own assumptions and judgment in determining the fair value of investments).
Inputs that are used in determining fair value of an investment may include price information, credit data, volatility statistics, and other factors. These inputs can be either observable or unobservable. The availability of observable inputs can vary between investments, and is affected by various factors such as the type of investment, and the volume and level of activity for that investment or similar investments in the marketplace. The inputs will be considered by the Investment Manager, along with any other relevant factors in the calculation of an investment's fair value. The Fund uses prices and inputs that are current as of the measurement date, which may include periods of market dislocations. During these periods, the availability of prices and inputs may be reduced for many investments. This condition could cause an investment to be reclassified between the various levels within the hierarchy.
Foreign equity securities actively traded in markets where there is a significant delay in the local close relative to the New York Stock Exchange (NYSE) are classified as Level 2. The values of these securities may include an adjustment to reflect the impact of significant market movements following the close of local trading, as described in Note 2 to the financial statements — Security Valuation.
Investments falling into the Level 3 category are primarily supported by quoted prices from brokers and dealers participating in the market for those investments. However, these may be classified as Level 3 investments due to lack of market transparency and corroboration to support these quoted prices. Additionally, valuation models may be used as the pricing source for any remaining investments classified as Level 3. These models may rely on one or more significant unobservable inputs and/or significant assumptions by the Investment Manager. Inputs used in valuations may include, but are not limited to, financial statement analysis, capital account balances, discount rates and estimated cash flows, and comparable company data.
Under the direction of the Fund's Board of Trustees (the Board), the Investment Manager's Valuation Committee (the Committee) is responsible for overseeing the valuation procedures approved by the Board. The Committee consists of voting and non-voting members from various groups within the Investment Manager's organization, including operations and accounting, trading and investments, compliance, risk management and legal.
The Committee meets at least monthly to review and approve valuation matters, which may include a description of specific valuation determinations, data regarding pricing information received from approved pricing vendors and brokers and the results of Board-approved valuation control policies and procedures (the Policies). The Policies address, among other things, instances when market quotations are or are not readily available, including recommendations of third party pricing vendors and a determination of appropriate pricing methodologies; events that require specific valuation determinations and assessment of fair value techniques; securities with a potential for stale pricing, including those that are illiquid, restricted, or in default; and the effectiveness of third party pricing vendors, including periodic reviews of vendors. The Committee meets more frequently, as needed, to discuss additional valuation matters, which may include the need to review back-testing results, review time-sensitive information or approve related valuation actions. The Committee reports to the Board, with members of the Committee meeting with the Board at each of its regularly scheduled meetings to discuss valuation matters and actions during the period, similar to those described earlier.
For investments categorized as Level 3, the Committee monitors information similar to that described above, which may include: (i) data specific to the issuer or comparable issuers, (ii) general market or specific sector news and (iii) quoted prices and specific or similar security transactions. The Committee considers this data and any changes from prior periods in order to assess the reasonableness of observable and unobservable inputs, any assumptions or internal models used to value those securities and changes in fair value. This data is also used to corroborate, when available, information received from approved pricing vendors and brokers. Various factors impact the frequency of monitoring this information (which may occur as often as daily). However, the Committee may determine that changes to inputs, assumptions and models are not required as a result of the monitoring procedures performed.
The accompanying Notes to Financial Statements are an integral part of this statement.
Annual Report 2015
11
COLUMBIA MARSICO GROWTH FUND
PORTFOLIO OF INVESTMENTS (continued)
February 28, 2015
Fair Value Measurements (continued)
The following table is a summary of the inputs used to value the Fund's investments at February 28, 2015:
Description | | Level 1
Quoted Prices in Active
Markets for Identical
Assets ($) | | Level 2
Other Significant
Observable Inputs ($) | | Level 3
Significant
Unobservable Inputs ($) | | Total ($) | |
Equity Securities | |
Common Stocks | |
Consumer Discretionary | | | 338,313,275 | | | | — | | | | — | | | | 338,313,275 | | |
Consumer Staples | | | 48,867,193 | | | | — | | | | — | | | | 48,867,193 | | |
Energy | | | 8,978,189 | | | | — | | | | — | | | | 8,978,189 | | |
Financials | | | 36,176,102 | | | | — | | | | — | | | | 36,176,102 | | |
Health Care | | | 412,851,845 | | | | — | | | | — | | | | 412,851,845 | | |
Industrials | | | 248,187,812 | | | | — | | | | — | | | | 248,187,812 | | |
Information Technology | | | 389,899,520 | | | | 32,454,319 | | | | — | | | | 422,353,839 | | |
Materials | | | 110,596,812 | | | | — | | | | — | | | | 110,596,812 | | |
Total Equity Securities | | | 1,593,870,748 | | | | 32,454,319 | | | | — | | | | 1,626,325,067 | | |
Mutual Funds | |
Money Market Funds | | | 20,601 | | | | — | | | | — | | | | 20,601 | | |
Total | | | 1,593,891,349 | | | | 32,454,319 | | | | — | | | | 1,626,345,668 | | |
See the Portfolio of Investments for all investment classifications not indicated in the table.
The Fund's assets assigned to the Level 2 input category are generally valued using the market approach, in which a security's value is determined through reference to prices and information from market transactions for similar or identical assets. These assets include certain foreign securities for which a third party statistical pricing service may be employed for purposes of fair market valuation. The model utilized by such third party statistical pricing service takes into account a security's correlation to available market data including, but not limited to, intraday index, ADR, and ETF movements.
There were no transfers of financial assets between levels during the period.
The accompanying Notes to Financial Statements are an integral part of this statement.
Annual Report 2015
12
COLUMBIA MARSICO GROWTH FUND
STATEMENT OF ASSETS AND LIABILITIES
February 28, 2015
Assets | |
Investments, at value | |
Unaffiliated issuers (identified cost $1,089,344,877) | | $ | 1,626,325,067 | | |
Affiliated issuers (identified cost $20,601) | | | 20,601 | | |
Total investments (identified cost $1,089,365,478) | | | 1,626,345,668 | | |
Receivable for: | |
Investments sold | | | 23,787,756 | | |
Capital shares sold | | | 666,693 | | |
Dividends | | | 1,305,265 | | |
Prepaid expenses | | | 4,004 | | |
Total assets | | | 1,652,109,386 | | |
Liabilities | |
Payable for: | |
Investments purchased | | | 9,633,472 | | |
Capital shares purchased | | | 1,948,199 | | |
Collateral and deposits | | | 3,000,000 | | |
Investment management fees | | | 29,659 | | |
Distribution and/or service fees | | | 11,603 | | |
Transfer agent fees | | | 688,092 | | |
Administration fees | | | 2,465 | | |
Compensation of board members | | | 231,356 | | |
Other expenses | | | 104,895 | | |
Total liabilities | | | 15,649,741 | | |
Net assets applicable to outstanding capital stock | | $ | 1,636,459,645 | | |
Represented by | |
Paid-in capital | | $ | 943,703,217 | | |
Excess of distributions over net investment income | | | (229,307 | ) | |
Accumulated net realized gain | | | 156,005,359 | | |
Unrealized appreciation (depreciation) on: | |
Investments | | | 536,980,190 | | |
Foreign currency translations | | | 186 | | |
Total — representing net assets applicable to outstanding capital stock | | $ | 1,636,459,645 | | |
The accompanying Notes to Financial Statements are an integral part of this statement.
Annual Report 2015
13
COLUMBIA MARSICO GROWTH FUND
STATEMENT OF ASSETS AND LIABILITIES (continued)
February 28, 2015
Class A | |
Net assets | | $ | 431,633,232 | | |
Shares outstanding | | | 17,490,592 | | |
Net asset value per share | | $ | 24.68 | | |
Maximum offering price per share(a) | | $ | 26.19 | | |
Class B | |
Net assets | | $ | 4,640,797 | | |
Shares outstanding | | | 218,678 | | |
Net asset value per share | | $ | 21.22 | | |
Class C | |
Net assets | | $ | 295,583,456 | | |
Shares outstanding | | | 13,899,735 | | |
Net asset value per share | | $ | 21.27 | | |
Class I | |
Net assets | | $ | 2,476 | | |
Shares outstanding | | | 97 | | |
Net asset value per share(b) | | $ | 25.43 | | |
Class R | |
Net assets | | $ | 23,699,813 | | |
Shares outstanding | | | 980,405 | | |
Net asset value per share | | $ | 24.17 | | |
Class R4 | |
Net assets | | $ | 27,591,018 | | |
Shares outstanding | | | 1,069,550 | | |
Net asset value per share | | $ | 25.80 | | |
Class R5 | |
Net assets | | $ | 4,921,636 | | |
Shares outstanding | | | 190,727 | | |
Net asset value per share | | $ | 25.80 | | |
Class W | |
Net assets | | $ | 2,537 | | |
Shares outstanding | | | 103 | | |
Net asset value per share(b) | | $ | 24.69 | | |
Class Z | |
Net assets | | $ | 848,384,680 | | |
Shares outstanding | | | 33,466,482 | | |
Net asset value per share | | $ | 25.35 | | |
(a) The maximum offering price per share is calculated by dividing the net asset value per share by 1.0 minus the maximum sales charge of 5.75%.
(b) Net asset value per share rounds to this amount due to fractional shares outstanding.
The accompanying Notes to Financial Statements are an integral part of this statement.
Annual Report 2015
14
COLUMBIA MARSICO GROWTH FUND
STATEMENT OF OPERATIONS
Year Ended February 28, 2015
Net investment income | |
Income: | |
Dividends — unaffiliated issuers | | $ | 20,232,817 | | |
Dividends — affiliated issuers | | | 50,707 | | |
Interest | | | 8 | | |
Foreign taxes withheld | | | (196,547 | ) | |
Total income | | | 20,086,985 | | |
Expenses: | |
Investment management fees | | | 12,189,153 | | |
Distribution and/or service fees | |
Class A | | | 1,309,539 | | |
Class B | | | 71,675 | | |
Class C | | | 2,953,928 | | |
Class R | | | 112,657 | | |
Class W | | | 7 | | |
Transfer agent fees | |
Class A | | | 1,028,743 | | |
Class B | | | 14,066 | | |
Class C | | | 582,142 | | |
Class R | | | 44,451 | | |
Class R4 | | | 52,175 | | |
Class R5 | | | 1,942 | | |
Class W | | | 4 | | |
Class Z | | | 1,986,910 | | |
Administration fees | | | 1,019,361 | | |
Compensation of board members | | | 52,680 | | |
Custodian fees | | | 19,032 | | |
Printing and postage fees | | | 193,266 | | |
Registration fees | | | 125,967 | | |
Professional fees | | | 46,914 | | |
Line of credit interest expense | | | 11,719 | | |
Other | | | 31,945 | | |
Total expenses | | | 21,848,276 | | |
Expense reductions | | | (1,674 | ) | |
Total net expenses | | | 21,846,602 | | |
Net investment loss | | | (1,759,617 | ) | |
Realized and unrealized gain (loss) — net | |
Net realized gain (loss) on: | |
Investments | | | 311,807,332 | | |
Foreign currency translations | | | 24,175 | | |
Net realized gain | | | 311,831,507 | | |
Net change in unrealized appreciation (depreciation) on: | |
Investments | | | (155,838,890 | ) | |
Foreign currency translations | | | 3,723 | | |
Net change in unrealized depreciation | | | (155,835,167 | ) | |
Net realized and unrealized gain | | | 155,996,340 | | |
Net increase in net assets resulting from operations | | $ | 154,236,723 | | |
The accompanying Notes to Financial Statements are an integral part of this statement.
Annual Report 2015
15
COLUMBIA MARSICO GROWTH FUND
STATEMENT OF CHANGES IN NET ASSETS
| | | Year Ended
February 28,
2015 | | Year Ended
February 28,
2014 | |
Operations | |
Net investment loss | | $ | (1,759,617 | ) | | $ | (3,483,929 | ) | |
Net realized gain | | | 311,831,507 | | | | 364,722,936 | | |
Net change in unrealized appreciation (depreciation) | | | (155,835,167 | ) | | | 226,193,528 | | |
Net increase in net assets resulting from operations | | | 154,236,723 | | | | 587,432,535 | | |
Distributions to shareholders | |
Net investment income | |
Class I | | | — | | | | (1 | ) | |
Class R4 | | | — | | | | (754 | ) | |
Class R5 | | | — | | | | (152 | ) | |
Class Z | | | — | | | | (6,430 | ) | |
Net realized gains | |
Class A | | | (59,446,481 | ) | | | (117,357,888 | ) | |
Class B | | | (856,422 | ) | | | (2,688,621 | ) | |
Class C | | | (39,610,075 | ) | | | (61,094,202 | ) | |
Class I | | | (318 | ) | | | (715 | ) | |
Class R | | | (2,833,023 | ) | | | (4,038,218 | ) | |
Class R4 | | | (3,258,966 | ) | | | (4,531,753 | ) | |
Class R5 | | | (531,605 | ) | | | (347,600 | ) | |
Class W | | | (327 | ) | | | (713 | ) | |
Class Z | | | (111,607,180 | ) | | | (198,141,956 | ) | |
Total distributions to shareholders | | | (218,144,397 | ) | | | (388,209,003 | ) | |
Decrease in net assets from capital stock activity | | | (425,886,658 | ) | | | (219,144,107 | ) | |
Total decrease in net assets | | | (489,794,332 | ) | | | (19,920,575 | ) | |
Net assets at beginning of year | | | 2,126,253,977 | | | | 2,146,174,552 | | |
Net assets at end of year | | $ | 1,636,459,645 | | | $ | 2,126,253,977 | | |
Excess of distributions over net investment income | | $ | (229,307 | ) | | $ | (207,096 | ) | |
The accompanying Notes to Financial Statements are an integral part of this statement.
Annual Report 2015
16
COLUMBIA MARSICO GROWTH FUND
STATEMENT OF CHANGES IN NET ASSETS (continued)
| | | Year Ended February 28, 2015 | | Year Ended February 28, 2014 | |
| | | Shares | | Dollars ($) | | Shares | | Dollars ($) | |
Capital stock activity | |
Class A shares | |
Subscriptions(a) | | | 2,745,485 | | | | 68,040,942 | | | | 3,453,087 | | | | 86,957,138 | | |
Distributions reinvested | | | 1,922,587 | | | | 46,709,309 | | | | 4,104,050 | | | | 97,441,772 | | |
Redemptions | | | (12,670,417 | ) | | | (321,341,633 | ) | | | (7,133,863 | ) | | | (180,509,550 | ) | |
Net increase (decrease) | | | (8,002,345 | ) | | | (206,591,382 | ) | | | 423,274 | | | | 3,889,360 | | |
Class B shares | |
Subscriptions | | | 19,730 | | | | 418,438 | | | | 55,060 | | | | 1,164,752 | | |
Distributions reinvested | | | 23,539 | | | | 494,255 | | | | 69,420 | | | | 1,454,522 | | |
Redemptions(a) | | | (297,475 | ) | | | (6,394,233 | ) | | | (526,550 | ) | | | (11,897,152 | ) | |
Net decrease | | | (254,206 | ) | | | (5,481,540 | ) | | | (402,070 | ) | | | (9,277,878 | ) | |
Class C shares | |
Subscriptions | | | 1,286,356 | | | | 27,259,461 | | | | 1,880,870 | | | | 40,551,362 | | |
Distributions reinvested | | | 988,355 | | | | 20,751,106 | | | | 1,499,439 | | | | 31,447,842 | | |
Redemptions | | | (2,384,191 | ) | | | (51,508,491 | ) | | | (2,316,415 | ) | | | (52,440,802 | ) | |
Net increase (decrease) | | | (109,480 | ) | | | (3,497,924 | ) | | | 1,063,894 | | | | 19,558,402 | | |
Class I shares | |
Redemptions | | | (40 | ) | | | (1,000 | ) | | | — | | | | — | | |
Net increase (decrease) | | | (40 | ) | | | (1,000 | ) | | | — | | | | — | | |
Class R shares | |
Subscriptions | | | 181,188 | | | | 4,444,414 | | | | 186,467 | | | | 4,656,438 | | |
Distributions reinvested | | | 111,209 | | | | 2,643,325 | | | | 161,886 | | | | 3,778,784 | | |
Redemptions | | | (195,809 | ) | | | (4,768,450 | ) | | | (300,721 | ) | | | (7,516,597 | ) | |
Net increase | | | 96,588 | | | | 2,319,289 | | | | 47,632 | | | | 918,625 | | |
Class R4 shares | |
Subscriptions | | | 168,369 | | | | 4,413,563 | | | | 1,036,213 | | | | 26,303,276 | | |
Distributions reinvested | | | 128,632 | | | | 3,255,753 | | | | 183,929 | | | | 4,531,923 | | |
Redemptions | | | (215,478 | ) | | | (5,586,759 | ) | | | (234,801 | ) | | | (6,170,621 | ) | |
Net increase | | | 81,523 | | | | 2,082,557 | | | | 985,341 | | | | 24,664,578 | | |
Class R5 shares | |
Subscriptions | | | 154,062 | | | | 3,967,730 | | | | 103,194 | | | | 2,714,441 | | |
Distributions reinvested | | | 21,004 | | | | 531,288 | | | | 14,086 | | | | 347,163 | | |
Redemptions | | | (88,392 | ) | | | (2,261,019 | ) | | | (13,340 | ) | | | (333,645 | ) | |
Net increase | | | 86,674 | | | | 2,237,999 | | | | 103,940 | | | | 2,727,959 | | |
Class W shares | |
Redemptions | | | (36 | ) | | | (900 | ) | | | — | | | | — | | |
Net increase (decrease) | | | (36 | ) | | | (900 | ) | | | — | | | | — | | |
The accompanying Notes to Financial Statements are an integral part of this statement.
Annual Report 2015
17
COLUMBIA MARSICO GROWTH FUND
STATEMENT OF CHANGES IN NET ASSETS (continued)
| | | Year Ended February 28, 2015 | | Year Ended February 28, 2014 | |
| | | Shares | | Dollars ($) | | Shares | | Dollars ($) | |
Capital stock activity (continued) | |
Class Z shares | |
Subscriptions | | | 11,602,560 | | | | 302,594,839 | | | | 10,596,355 | | | | 275,531,162 | | |
Distributions reinvested | | | 3,862,420 | | | | 96,163,976 | | | | 6,750,386 | | | | 163,830,515 | | |
Redemptions | | | (23,689,528 | ) | | | (615,712,572 | ) | | | (26,955,709 | ) | | | (700,986,830 | ) | |
Net decrease | | | (8,224,548 | ) | | | (216,953,757 | ) | | | (9,608,968 | ) | | | (261,625,153 | ) | |
Total net decrease | | | (16,325,870 | ) | | | (425,886,658 | ) | | | (7,386,957 | ) | | | (219,144,107 | ) | |
(a) Includes conversions of Class B shares to Class A shares, if any.
The accompanying Notes to Financial Statements are an integral part of this statement.
Annual Report 2015
18
COLUMBIA MARSICO GROWTH FUND
The following tables are intended to help you understand the Fund's financial performance. Certain information reflects financial results for a single share of a class held for the periods shown. Per share net investment income (loss) amounts are calculated based on average shares outstanding during the period. Total return assumes reinvestment of all dividends and distributions, if any. Total return does not reflect payment of sales charges, if any. Total return and portfolio turnover are not annualized for periods of less than one year. The portfolio turnover rate is calculated without regard to purchase and sales transactions of short-term instruments and certain derivatives, if any. If such transactions were included, the Fund's portfolio turnover rate may be higher.
| | | Year Ended February 28, | | Year Ended
February 29, | | Year Ended
February 28, | |
Class A | | 2015 | | 2014 | | 2013 | | 2012 | | 2011 | |
Per share data | |
Net asset value, beginning of period | | $ | 25.65 | | | $ | 23.69 | | | $ | 22.25 | | | $ | 21.19 | | | $ | 16.75 | | |
Income from investment operations: | |
Net investment income (loss) | | | (0.02 | ) | | | (0.05 | ) | | | 0.05 | | | | 0.02 | | | | (0.01 | ) | |
Net realized and unrealized gain | | | 2.22 | | | | 7.14 | | | | 1.45 | | | | 1.04 | | | | 4.45 | | |
Total from investment operations | | | 2.20 | | | | 7.09 | | | | 1.50 | | | | 1.06 | | | | 4.44 | | |
Less distributions to shareholders: | |
Net investment income | | | — | | | | — | | | | (0.06 | ) | | | — | | | | — | | |
Net realized gains | | | (3.17 | ) | | | (5.13 | ) | | | — | | | | — | | | | — | | |
Total distributions to shareholders | | | (3.17 | ) | | | (5.13 | ) | | | (0.06 | ) | | | — | | | | — | | |
Proceeds from regulatory settlements | | | — | | | | — | | | | — | | | | — | | | | 0.00 | (a) | |
Net asset value, end of period | | $ | 24.68 | | | $ | 25.65 | | | $ | 23.69 | | | $ | 22.25 | | | $ | 21.19 | | |
Total return | | | 9.11 | % | | | 32.56 | % | | | 6.78 | % | | | 5.00 | % | | | 26.51 | % | |
Ratios to average net assets(b) | |
Total gross expenses | | | 1.17 | %(c) | | | 1.18 | %(c) | | | 1.36 | % | | | 1.33 | %(c) | | | 1.30 | %(c) | |
Total net expenses(d) | | | 1.17 | %(c)(e) | | | 1.18 | %(c)(e) | | | 1.26 | %(e) | | | 1.28 | %(c)(e) | | | 1.30 | %(c)(e) | |
Net investment income (loss) | | | (0.10 | %) | | | (0.20 | %) | | | 0.24 | % | | | 0.08 | % | | | (0.05 | %) | |
Supplemental data | |
Net assets, end of period (in thousands) | | $ | 431,633 | | | $ | 653,959 | | | $ | 593,794 | | | $ | 728,788 | | | $ | 1,021,724 | | |
Portfolio turnover | | | 69 | % | | | 97 | % | | | 90 | % | | | 65 | % | | | 67 | % | |
Notes to Financial Highlights
(a) Rounds to zero.
(b) In addition to the fees and expenses that the Fund bears directly, the Fund indirectly bears a pro rata share of the fees and expenses of any other funds in which it invests. Such indirect expenses are not included in the Fund's reported expense ratios.
(c) Ratios include line of credit interest expense which is less than 0.01%.
(d) Total net expenses include the impact of certain fee waivers/expense reimbursements made by the Investment Manager and certain of its affiliates, if applicable.
(e) The benefits derived from expense reductions had an impact of less than 0.01%.
The accompanying Notes to Financial Statements are an integral part of this statement.
Annual Report 2015
19
COLUMBIA MARSICO GROWTH FUND
FINANCIAL HIGHLIGHTS (continued)
| | | Year Ended February 28, | | Year Ended
February 29, | | Year Ended
February 28, | |
Class B | | 2015 | | 2014 | | 2013 | | 2012 | | 2011 | |
Per share data | |
Net asset value, beginning of period | | $ | 22.50 | | | $ | 21.33 | | | $ | 20.13 | | | $ | 19.31 | | | $ | 15.38 | | |
Income from investment operations: | |
Net investment loss | | | (0.18 | ) | | | (0.21 | ) | | | (0.10 | ) | | | (0.13 | ) | | | (0.13 | ) | |
Net realized and unrealized gain | | | 1.92 | | | | 6.35 | | | | 1.30 | | | | 0.95 | | | | 4.06 | | |
Total from investment operations | | | 1.74 | | | | 6.14 | | | | 1.20 | | | | 0.82 | | | | 3.93 | | |
Less distributions to shareholders: | |
Net realized gains | | | (3.02 | ) | | | (4.97 | ) | | | — | | | | — | | | | — | | |
Total distributions to shareholders | | | (3.02 | ) | | | (4.97 | ) | | | — | | | | — | | | | — | | |
Proceeds from regulatory settlements | | | — | | | | — | | | | — | | | | — | | | | 0.00 | (a) | |
Net asset value, end of period | | $ | 21.22 | | | $ | 22.50 | | | $ | 21.33 | | | $ | 20.13 | | | $ | 19.31 | | |
Total return | | | 8.26 | % | | | 31.58 | % | | | 5.96 | % | | | 4.25 | % | | | 25.55 | % | |
Ratios to average net assets(b) | |
Total gross expenses | | | 1.92 | %(c) | | | 1.92 | %(c) | | | 2.10 | % | | | 2.09 | %(c) | | | 2.05 | %(c) | |
Total net expenses(d) | | | 1.92 | %(c)(e) | | | 1.92 | %(c)(e) | | | 2.01 | %(e) | | | 2.03 | %(c)(e) | | | 2.05 | %(c)(e) | |
Net investment loss | | | (0.85 | %) | | | (0.93 | %) | | | (0.52 | %) | | | (0.68 | %) | | | (0.78 | %) | |
Supplemental data | |
Net assets, end of period (in thousands) | | $ | 4,641 | | | $ | 10,639 | | | $ | 18,659 | | | $ | 27,041 | | | $ | 41,675 | | |
Portfolio turnover | | | 69 | % | | | 97 | % | | | 90 | % | | | 65 | % | | | 67 | % | |
Notes to Financial Highlights
(a) Rounds to zero.
(b) In addition to the fees and expenses that the Fund bears directly, the Fund indirectly bears a pro rata share of the fees and expenses of any other funds in which it invests. Such indirect expenses are not included in the Fund's reported expense ratios.
(c) Ratios include line of credit interest expense which is less than 0.01%.
(d) Total net expenses include the impact of certain fee waivers/expense reimbursements made by the Investment Manager and certain of its affiliates, if applicable.
(e) The benefits derived from expense reductions had an impact of less than 0.01%.
The accompanying Notes to Financial Statements are an integral part of this statement.
Annual Report 2015
20
COLUMBIA MARSICO GROWTH FUND
FINANCIAL HIGHLIGHTS (continued)
| | | Year Ended February 28, | | Year Ended
February 29, | | Year Ended
February 28, | |
Class C | | 2015 | | 2014 | | 2013 | | 2012 | | 2011 | |
Per share data | |
Net asset value, beginning of period | | $ | 22.54 | | | $ | 21.35 | | | $ | 20.15 | | | $ | 19.34 | | | $ | 15.40 | | |
Income from investment operations: | |
Net investment loss | | | (0.18 | ) | | | (0.22 | ) | | | (0.10 | ) | | | (0.13 | ) | | | (0.13 | ) | |
Net realized and unrealized gain | | | 1.93 | | | | 6.38 | | | | 1.30 | | | | 0.94 | | | | 4.07 | | |
Total from investment operations | | | 1.75 | | | | 6.16 | | | | 1.20 | | | | 0.81 | | | | 3.94 | | |
Less distributions to shareholders: | |
Net realized gains | | | (3.02 | ) | | | (4.97 | ) | | | — | | | | — | | | | — | | |
Total distributions to shareholders | | | (3.02 | ) | | | (4.97 | ) | | | — | | | | — | | | | — | | |
Proceeds from regulatory settlements | | | — | | | | — | | | | — | | | | — | | | | 0.00 | (a) | |
Net asset value, end of period | | $ | 21.27 | | | $ | 22.54 | | | $ | 21.35 | | | $ | 20.15 | | | $ | 19.34 | | |
Total return | | | 8.30 | % | | | 31.64 | % | | | 5.96 | % | | | 4.19 | % | | | 25.58 | % | |
Ratios to average net assets(b) | |
Total gross expenses | | | 1.92 | %(c) | | | 1.93 | %(c) | | | 2.10 | % | | | 2.09 | %(c) | | | 2.05 | %(c) | |
Total net expenses(d) | | | 1.92 | %(c)(e) | | | 1.93 | %(c)(e) | | | 2.01 | %(e) | | | 2.03 | %(c)(e) | | | 2.05 | %(c)(e) | |
Net investment loss | | | (0.84 | %) | | | (0.95 | %) | | | (0.51 | %) | | | (0.67 | %) | | | (0.78 | %) | |
Supplemental data | |
Net assets, end of period (in thousands) | | $ | 295,583 | | | $ | 315,734 | | | $ | 276,437 | | | $ | 330,213 | | | $ | 390,384 | | |
Portfolio turnover | | | 69 | % | | | 97 | % | | | 90 | % | | | 65 | % | | | 67 | % | |
Notes to Financial Highlights
(a) Rounds to zero.
(b) In addition to the fees and expenses that the Fund bears directly, the Fund indirectly bears a pro rata share of the fees and expenses of any other funds in which it invests. Such indirect expenses are not included in the Fund's reported expense ratios.
(c) Ratios include line of credit interest expense which is less than 0.01%.
(d) Total net expenses include the impact of certain fee waivers/expense reimbursements made by the Investment Manager and certain of its affiliates, if applicable.
(e) The benefits derived from expense reductions had an impact of less than 0.01%.
The accompanying Notes to Financial Statements are an integral part of this statement.
Annual Report 2015
21
COLUMBIA MARSICO GROWTH FUND
FINANCIAL HIGHLIGHTS (continued)
| | | Year Ended February 28, | | Year Ended
February 29, | | Year Ended
February 28, | |
Class I | | 2015 | | 2014 | | 2013 | | 2012 | | 2011(a) | |
Per share data | |
Net asset value, beginning of period | | $ | 26.31 | | | $ | 24.17 | | | $ | 22.77 | | | $ | 21.55 | | | $ | 18.29 | | |
Income from investment operations: | |
Net investment income | | | 0.09 | | | | 0.07 | | | | 0.15 | | | | 0.13 | | | | 0.01 | | |
Net realized and unrealized gain | | | 2.29 | | | | 7.31 | | | | 1.47 | | | | 1.09 | | | | 3.29 | | |
Total from investment operations | | | 2.38 | | | | 7.38 | | | | 1.62 | | | | 1.22 | | | | 3.30 | | |
Less distributions to shareholders: | |
Net investment income | | | — | | | | (0.01 | ) | | | (0.22 | ) | | | — | | | | (0.04 | ) | |
Net realized gains | | | (3.26 | ) | | | (5.23 | ) | | | — | | | | — | | | | — | | |
Total distributions to shareholders | | | (3.26 | ) | | | (5.24 | ) | | | (0.22 | ) | | | — | | | | (0.04 | ) | |
Net asset value, end of period | | $ | 25.43 | | | $ | 26.31 | | | $ | 24.17 | | | $ | 22.77 | | | $ | 21.55 | | |
Total return | | | 9.60 | % | | | 33.18 | % | | | 7.20 | % | | | 5.66 | % | | | 18.05 | % | |
Ratios to average net assets(b) | |
Total gross expenses | | | 0.73 | %(c) | | | 0.70 | %(c) | | | 0.87 | % | | | 0.89 | %(c) | | | 0.88 | %(c)(d) | |
Total net expenses(e) | | | 0.73 | %(c) | | | 0.70 | %(c) | | | 0.87 | % | | | 0.88 | %(c)(f) | | | 0.88 | %(c)(d)(f) | |
Net investment income | | | 0.35 | % | | | 0.28 | % | | | 0.65 | % | | | 0.64 | % | | | 0.06 | %(d) | |
Supplemental data | |
Net assets, end of period (in thousands) | | $ | 2 | | | $ | 4 | | | $ | 3 | | | $ | 3 | | | $ | 11,201 | | |
Portfolio turnover | | | 69 | % | | | 97 | % | | | 90 | % | | | 65 | % | | | 67 | % | |
Notes to Financial Highlights
(a) Based on operations from September 27, 2010 (commencement of operations) through the stated period end.
(b) In addition to the fees and expenses that the Fund bears directly, the Fund indirectly bears a pro rata share of the fees and expenses of any other funds in which it invests. Such indirect expenses are not included in the Fund's reported expense ratios.
(c) Ratios include line of credit interest expense which is less than 0.01%.
(d) Annualized.
(e) Total net expenses include the impact of certain fee waivers/expense reimbursements made by the Investment Manager and certain of its affiliates, if applicable.
(f) The benefits derived from expense reductions had an impact of less than 0.01%.
The accompanying Notes to Financial Statements are an integral part of this statement.
Annual Report 2015
22
COLUMBIA MARSICO GROWTH FUND
FINANCIAL HIGHLIGHTS (continued)
| | | Year Ended February 28, | | Year Ended
February 29, | | Year Ended
February 28, | |
Class R | | 2015 | | 2014 | | 2013 | | 2012 | | 2011 | |
Per share data | |
Net asset value, beginning of period | | $ | 25.20 | | | $ | 23.36 | | | $ | 21.94 | | | $ | 20.94 | | | $ | 16.60 | | |
Income from investment operations: | |
Net investment income (loss) | | | (0.08 | ) | | | (0.11 | ) | | | (0.00 | )(a) | | | (0.03 | ) | | | (0.05 | ) | |
Net realized and unrealized gain | | | 2.17 | | | | 7.02 | | | | 1.43 | | | | 1.03 | | | | 4.39 | | |
Total from investment operations | | | 2.09 | | | | 6.91 | | | | 1.43 | | | | 1.00 | | | | 4.34 | | |
Less distributions to shareholders: | |
Net investment income | | | — | | | | — | | | | (0.01 | ) | | | — | | | | — | | |
Net realized gains | | | (3.12 | ) | | | (5.07 | ) | | | — | | | | — | | | | — | | |
Total distributions to shareholders | | | (3.12 | ) | | | (5.07 | ) | | | (0.01 | ) | | | — | | | | — | | |
Proceeds from regulatory settlements | | | — | | | | — | | | | — | | | | — | | | | 0.00 | (a) | |
Net asset value, end of period | | $ | 24.17 | | | $ | 25.20 | | | $ | 23.36 | | | $ | 21.94 | | | $ | 20.94 | | |
Total return | | | 8.81 | % | | | 32.24 | % | | | 6.50 | % | | | 4.78 | % | | | 26.14 | % | |
Ratios to average net assets(b) | |
Total gross expenses | | | 1.42 | %(c) | | | 1.43 | %(c) | | | 1.61 | % | | | 1.58 | %(c) | | | 1.55 | %(c) | |
Total net expenses(d) | | | 1.42 | %(c)(e) | | | 1.43 | %(c)(e) | | | 1.51 | %(e) | | | 1.53 | %(c)(e) | | | 1.55 | %(c)(e) | |
Net investment income (loss) | | | (0.34 | %) | | | (0.45 | %) | | | (0.00 | %)(a) | | | (0.16 | %) | | | (0.27 | %) | |
Supplemental data | |
Net assets, end of period (in thousands) | | $ | 23,700 | | | $ | 22,273 | | | $ | 19,530 | | | $ | 21,166 | | | $ | 20,548 | | |
Portfolio turnover | | | 69 | % | | | 97 | % | | | 90 | % | | | 65 | % | | | 67 | % | |
Notes to Financial Highlights
(a) Rounds to zero.
(b) In addition to the fees and expenses that the Fund bears directly, the Fund indirectly bears a pro rata share of the fees and expenses of any other funds in which it invests. Such indirect expenses are not included in the Fund's reported expense ratios.
(c) Ratios include line of credit interest expense which is less than 0.01%.
(d) Total net expenses include the impact of certain fee waivers/expense reimbursements made by the Investment Manager and certain of its affiliates, if applicable.
(e) The benefits derived from expense reductions had an impact of less than 0.01%.
The accompanying Notes to Financial Statements are an integral part of this statement.
Annual Report 2015
23
COLUMBIA MARSICO GROWTH FUND
FINANCIAL HIGHLIGHTS (continued)
| | | Year Ended February 28, | |
Class R4 | | 2015 | | 2014 | | 2013(a) | |
Per share data | |
Net asset value, beginning of period | | $ | 26.66 | | | $ | 24.44 | | | $ | 22.14 | | |
Income from investment operations: | |
Net investment income | | | 0.04 | | | | 0.02 | | | | 0.08 | | |
Net realized and unrealized gain | | | 2.32 | | | | 7.38 | | | | 2.32 | | |
Total from investment operations | | | 2.36 | | | | 7.40 | | | | 2.40 | | |
Less distributions to shareholders: | |
Net investment income | | | — | | | | (0.00 | )(b) | | | (0.10 | ) | |
Net realized gains | | | (3.22 | ) | | | (5.18 | ) | | | — | | |
Total distributions to shareholders | | | (3.22 | ) | | | (5.18 | ) | | | (0.10 | ) | |
Net asset value, end of period | | $ | 25.80 | | | $ | 26.66 | | | $ | 24.44 | | |
Total return | | | 9.39 | % | | | 32.88 | % | | | 10.89 | % | |
Ratios to average net assets(c) | |
Total gross expenses | | | 0.92 | %(d) | | | 0.93 | %(d) | | | 1.01 | %(e) | |
Total net expenses(f) | | | 0.92 | %(d)(g) | | | 0.93 | %(d)(g) | | | 1.00 | %(e) | |
Net investment income | | | 0.16 | % | | | 0.07 | % | | | 1.11 | %(e) | |
Supplemental data | |
Net assets, end of period (in thousands) | | $ | 27,591 | | | $ | 26,343 | | | $ | 66 | | |
Portfolio turnover | | | 69 | % | | | 97 | % | | | 90 | % | |
Notes to Financial Highlights
(a) Based on operations from November 8, 2012 (commencement of operations) through the stated period end.
(b) Rounds to zero.
(c) In addition to the fees and expenses that the Fund bears directly, the Fund indirectly bears a pro rata share of the fees and expenses of any other funds in which it invests. Such indirect expenses are not included in the Fund's reported expense ratios.
(d) Ratios include line of credit interest expense which is less than 0.01%.
(e) Annualized.
(f) Total net expenses include the impact of certain fee waivers/expense reimbursements made by the Investment Manager and certain of its affiliates, if applicable.
(g) The benefits derived from expense reductions had an impact of less than 0.01%.
The accompanying Notes to Financial Statements are an integral part of this statement.
Annual Report 2015
24
COLUMBIA MARSICO GROWTH FUND
FINANCIAL HIGHLIGHTS (continued)
| | | Year Ended February 28, | |
Class R5 | | 2015 | | 2014 | | 2013(a) | |
Per share data | |
Net asset value, beginning of period | | $ | 26.66 | | | $ | 24.43 | | | $ | 22.14 | | |
Income from investment operations: | |
Net investment income | | | 0.08 | | | | 0.05 | | | | 0.09 | | |
Net realized and unrealized gain | | | 2.31 | | | | 7.40 | | | | 2.32 | | |
Total from investment operations | | | 2.39 | | | | 7.45 | | | | 2.41 | | |
Less distributions to shareholders: | |
Net investment income | | | — | | | | (0.01 | ) | | | (0.12 | ) | |
Net realized gains | | | (3.25 | ) | | | (5.21 | ) | | | — | | |
Total distributions to shareholders | | | (3.25 | ) | | | (5.22 | ) | | | (0.12 | ) | |
Net asset value, end of period | | $ | 25.80 | | | $ | 26.66 | | | $ | 24.43 | | |
Total return | | | 9.51 | % | | | 33.12 | % | | | 10.92 | % | |
Ratios to average net assets(b) | |
Total gross expenses | | | 0.78 | %(c) | | | 0.77 | %(c) | | | 0.89 | %(d) | |
Total net expenses(e) | | | 0.78 | %(c) | | | 0.77 | %(c) | | | 0.89 | %(d) | |
Net investment income | | | 0.31 | % | | | 0.18 | % | | | 1.22 | %(d) | |
Supplemental data | |
Net assets, end of period (in thousands) | | $ | 4,922 | | | $ | 2,774 | | | $ | 3 | | |
Portfolio turnover | | | 69 | % | | | 97 | % | | | 90 | % | |
Notes to Financial Highlights
(a) Based on operations from November 8, 2012 (commencement of operations) through the stated period end.
(b) In addition to the fees and expenses that the Fund bears directly, the Fund indirectly bears a pro rata share of the fees and expenses of any other funds in which it invests. Such indirect expenses are not included in the Fund's reported expense ratios.
(c) Ratios include line of credit interest expense which is less than 0.01%.
(d) Annualized.
(e) Total net expenses include the impact of certain fee waivers/expense reimbursements made by the Investment Manager and certain of its affiliates, if applicable.
The accompanying Notes to Financial Statements are an integral part of this statement.
Annual Report 2015
25
COLUMBIA MARSICO GROWTH FUND
FINANCIAL HIGHLIGHTS (continued)
| | | Year Ended February 28, | | Year Ended
February 29, | | Year Ended
February 28, | |
Class W | | 2015 | | 2014 | | 2013 | | 2012 | | 2011(a) | |
Per share data | |
Net asset value, beginning of period | | $ | 25.66 | | | $ | 23.69 | | | $ | 22.26 | | | $ | 21.20 | | | $ | 17.98 | | |
Income from investment operations: | |
Net investment income (loss) | | | (0.01 | ) | | | (0.04 | ) | | | 0.06 | | | | 0.02 | | | | 0.01 | | |
Net realized and unrealized gain | | | 2.22 | | | | 7.14 | | | | 1.44 | | | | 1.04 | | | | 3.21 | | |
Total from investment operations | | | 2.21 | | | | 7.10 | | | | 1.50 | | | | 1.06 | | | | 3.22 | | |
Less distributions to shareholders: | |
Net investment income | | | — | | | | — | | | | (0.07 | ) | | | — | | | | — | | |
Net realized gains | | | (3.18 | ) | | | (5.13 | ) | | | — | | | | — | | | | — | | |
Total distributions to shareholders | | | (3.18 | ) | | | (5.13 | ) | | | (0.07 | ) | | | — | | | | — | | |
Net asset value, end of period | | $ | 24.69 | | | $ | 25.66 | | | $ | 23.69 | | | $ | 22.26 | | | $ | 21.20 | | |
Total return | | | 9.14 | % | | | 32.63 | % | | | 6.76 | % | | | 5.00 | % | | | 17.91 | % | |
Ratios to average net assets(b) | |
Total gross expenses | | | 1.12 | %(c) | | | 1.15 | %(c) | | | 1.35 | % | | | 1.29 | %(c) | | | 1.28 | %(c)(d) | |
Total net expenses(e) | | | 1.12 | %(c)(f) | | | 1.15 | %(c)(f) | | | 1.26 | % | | | 1.26 | %(c)(f) | | | 1.28 | %(c)(d)(f) | |
Net investment income (loss) | | | (0.04 | %) | | | (0.17 | %) | | | 0.25 | % | | | 0.11 | % | | | 0.17 | %(d) | |
Supplemental data | |
Net assets, end of period (in thousands) | | $ | 3 | | | $ | 4 | | | $ | 3 | | | $ | 3 | | | $ | 3 | | |
Portfolio turnover | | | 69 | % | | | 97 | % | | | 90 | % | | | 65 | % | | | 67 | % | |
Notes to Financial Highlights
(a) Based on operations from September 27, 2010 (commencement of operations) through the stated period end.
(b) In addition to the fees and expenses that the Fund bears directly, the Fund indirectly bears a pro rata share of the fees and expenses of any other funds in which it invests. Such indirect expenses are not included in the Fund's reported expense ratios.
(c) Ratios include line of credit interest expense which is less than 0.01%.
(d) Annualized.
(e) Total net expenses include the impact of certain fee waivers/expense reimbursements made by the Investment Manager and certain of its affiliates, if applicable.
(f) The benefits derived from expense reductions had an impact of less than 0.01%.
The accompanying Notes to Financial Statements are an integral part of this statement.
Annual Report 2015
26
COLUMBIA MARSICO GROWTH FUND
FINANCIAL HIGHLIGHTS (continued)
| | | Year Ended February 28, | | Year Ended
February 29, | | Year Ended
February 28, | |
Class Z | | 2015 | | 2014 | | 2013 | | 2012 | | 2011 | |
Per share data | |
Net asset value, beginning of period | | $ | 26.25 | | | $ | 24.13 | | | $ | 22.71 | | | $ | 21.57 | | | $ | 17.02 | | |
Income from investment operations: | |
Net investment income | | | 0.03 | | | | 0.02 | | | | 0.10 | | | | 0.07 | | | | 0.04 | | |
Net realized and unrealized gain | | | 2.29 | | | | 7.28 | | | | 1.48 | | | | 1.07 | | | | 4.52 | | |
Total from investment operations | | | 2.32 | | | | 7.30 | | | | 1.58 | | | | 1.14 | | | | 4.56 | | |
Less distributions to shareholders: | |
Net investment income | | | — | | | | (0.00 | )(a) | | | (0.16 | ) | | | — | | | | (0.01 | ) | |
Net realized gains | | | (3.22 | ) | | | (5.18 | ) | | | — | | | | — | | | | — | | |
Total distributions to shareholders | | | (3.22 | ) | | | (5.18 | ) | | | (0.16 | ) | | | — | | | | (0.01 | ) | |
Proceeds from regulatory settlements | | | — | | | | — | | | | — | | | | — | | | | 0.00 | (a) | |
Net asset value, end of period | | $ | 25.35 | | | $ | 26.25 | | | $ | 24.13 | | | $ | 22.71 | | | $ | 21.57 | | |
Total return | | | 9.39 | % | | | 32.89 | % | | | 7.02 | % | | | 5.29 | % | | | 26.81 | % | |
Ratios to average net assets(b) | |
Total gross expenses | | | 0.92 | %(c) | | | 0.92 | %(c) | | | 1.10 | % | | | 1.08 | %(c) | | | 1.05 | %(c) | |
Total net expenses(d) | | | 0.92 | %(c)(e) | | | 0.92 | %(c)(e) | | | 1.02 | %(e) | | | 1.03 | %(c)(e) | | | 1.05 | %(c)(e) | |
Net investment income | | | 0.13 | % | | | 0.07 | % | | | 0.43 | % | | | 0.34 | % | | | 0.24 | % | |
Supplemental data | |
Net assets, end of period (in thousands) | | $ | 848,385 | | | $ | 1,094,525 | | | $ | 1,237,679 | | | $ | 2,108,304 | | | $ | 2,063,751 | | |
Portfolio turnover | | | 69 | % | | | 97 | % | | | 90 | % | | | 65 | % | | | 67 | % | |
Notes to Financial Highlights
(a) Rounds to zero.
(b) In addition to the fees and expenses that the Fund bears directly, the Fund indirectly bears a pro rata share of the fees and expenses of any other funds in which it invests. Such indirect expenses are not included in the Fund's reported expense ratios.
(c) Ratios include line of credit interest expense which is less than 0.01%.
(d) Total net expenses include the impact of certain fee waivers/expense reimbursements made by the Investment Manager and certain of its affiliates, if applicable.
(e) The benefits derived from expense reductions had an impact of less than 0.01%.
The accompanying Notes to Financial Statements are an integral part of this statement.
Annual Report 2015
27
COLUMBIA MARSICO GROWTH FUND
NOTES TO FINANCIAL STATEMENTS
February 28, 2015
Note 1. Organization
Columbia Marsico Growth Fund (the Fund), a series of Columbia Funds Series Trust (the Trust), is a diversified fund. The Trust is registered under the Investment Company Act of 1940, as amended (the 1940 Act), as an open-end management investment company organized as a Delaware statutory trust.
Fund Shares
The Trust may issue an unlimited number of shares (without par value). The Fund offers Class A, Class B, Class C, Class I, Class R, Class R4, Class R5, Class W and Class Z shares. Although all share classes generally have identical voting, dividend and liquidation rights, each share class votes separately when required by the Trust's organizational documents or by law. Different share classes pay different distribution amounts to the extent the expenses of such share classes differ, and distributions in liquidation will be proportional to the net asset value of each share class. Each share class has its own expense structure and sales charges.
Class A shares are subject to a maximum front-end sales charge of 5.75% based on the initial investment amount. Class A shares purchased without an initial sales charge in accounts aggregating $1 million to $50 million at the time of purchase are subject to a contingent deferred sales charge (CDSC) if the shares are sold within 18 months of purchase, charged as follows: 1.00% CDSC if redeemed within 12 months of purchase, and 0.50% CDSC if redeemed more than 12, but less than 18, months after purchase.
Class B shares may be subject to a maximum CDSC of 5.00% based upon the holding period after purchase. Class B shares will generally convert to Class A shares eight years after purchase. The Fund no longer accepts investments by new or existing investors in the Fund's Class B shares, except in connection with the reinvestment of any dividend and/or capital gain distributions in Class B shares of the Fund and exchanges by existing Class B shareholders of certain other funds within the Columbia Family of Funds.
Class C shares are subject to a 1.00% CDSC on shares redeemed within one year of purchase.
Class I shares are not subject to sales charges and are available only to the Columbia Family of Funds.
Class R shares are not subject to sales charges and are generally available only to certain retirement plans and other investors as described in the Fund's prospectus.
Class R4 shares are not subject to sales charges and are generally available only to omnibus retirement plans and certain investors as described in the Fund's prospectus.
Class R5 shares are not subject to sales charges and are generally available only to investors purchasing through authorized investment professionals and omnibus retirement plans.
Class W shares are not subject to sales charges and are available only to investors purchasing through authorized investment programs managed by investment professionals, including discretionary managed account programs.
Class Z shares are not subject to sales charges and are available only to eligible investors, which are subject to different investment minimums as described in the Fund's prospectus.
Note 2. Summary of Significant Accounting Policies
Basis of Preparation
The Fund is an investment company that applies the accounting and reporting guidance in the Financial Accounting Standards Board (FASB) Accounting Standards Codification Topic 946, Financial Services — Investment Companies (ASC 946). The financial statements are prepared in accordance with U.S. generally accepted accounting principles (GAAP), which requires management to make certain estimates and assumptions that affect the reported amounts of assets and liabilities, the disclosure of contingent assets and liabilities at the date of the financial statements and the reported amounts of income and expenses during the reporting period. Actual results could differ from those estimates.
The following is a summary of significant accounting policies followed by the Fund in the preparation of its financial statements.
Security Valuation
All equity securities are valued at the close of business of the New York Stock Exchange (NYSE). Equity securities are valued at the last quoted sales price on the principal exchange or market on which they trade, except for securities traded on the NASDAQ Stock Market, which are valued at the NASDAQ official close price. Unlisted securities or listed securities for which there were no sales during the day are valued at the mean of the latest quoted bid and ask prices on such exchanges or markets.
Annual Report 2015
28
COLUMBIA MARSICO GROWTH FUND
NOTES TO FINANCIAL STATEMENTS (continued)
February 28, 2015
Foreign equity securities are valued based on quotations from the principal market in which such securities are traded. If any foreign security prices are not readily available as a result of limited share activity, the securities are valued at the mean of the latest quoted bid and ask prices on such exchanges or markets. Foreign currency exchange rates are generally determined at 4:00 p.m. Eastern (U.S.) time. Many securities markets and exchanges outside the U.S. close prior to the close of the NYSE; therefore, the closing prices for securities in such markets or on such exchanges may not fully reflect events that occur after such close but before the close of the NYSE. In those situations, foreign securities will be fair valued pursuant to a policy adopted by the Board of Trustees (the Board), including, if available, utilizing a third party pricing service to determine these fair values. The third party pricing service takes into account multiple factors, including, but not limited to, movements in the U.S. securities markets, certain depositary receipts, futures contracts and foreign exchange rates that have occurred subsequent to the close of the foreign exchange or market, to determine a good faith estimate that reasonably reflects the current market conditions as of the close of the NYSE. The fair value of a security is likely to be different from the quoted or published price, if available.
Investments in open-end investment companies, including money market funds, are valued at their net asset value.
Investments for which market quotations are not readily available, or that have quotations which management believes are not reliable, are valued at fair value as determined in good faith under procedures established by and under the general supervision of the Board. If a security or class of securities (such as foreign securities) is valued at fair value, such value is likely to be different from the quoted or published price for the security.
The determination of fair value often requires significant judgment. To determine fair value, management may use assumptions including but not limited to future cash flows and estimated risk premiums. Multiple inputs from various sources may be used to determine fair value.
Foreign Currency Transactions and Translations
The values of all assets and liabilities denominated in foreign currencies are generally translated into U.S. dollars at exchange rates determined at the close of the NYSE. Net realized and unrealized gains (losses) on foreign currency transactions and translations include gains (losses) arising from the fluctuation in exchange rates between trade and settlement dates on securities
transactions, gains (losses) arising from the disposition of foreign currency and currency gains (losses) between the accrual and payment dates on dividends, interest income and foreign withholding taxes.
For financial statement purposes, the Fund does not distinguish that portion of gains (losses) on investments which is due to changes in foreign exchange rates from that which is due to changes in market prices of the investments. Such fluctuations are included with the net realized and unrealized gains (losses) on investments in the Statement of Operations.
Security Transactions
Security transactions are accounted for on the trade date. Cost is determined and gains (losses) are based upon the specific identification method for both financial statement and federal income tax purposes.
Income Recognition
Corporate actions and dividend income are generally recorded net of any non-reclaimable tax withholdings, on the ex-dividend date or upon receipt of ex-dividend notification in the case of certain foreign securities.
The Fund may receive distributions from holdings in business development companies (BDCs), exchange-traded funds (ETFs), other regulated investment companies (RICs), and real estate investment trusts (REITs), which report information on the character of their distributions annually. These distributions are allocated to dividend income, capital gain and return of capital based on actual information reported. To the extent actual information has not yet been reported by the REITs, estimates for return of capital are made by the Fund's management. Return of capital is recorded as a reduction of the cost basis of securities held. If the Fund no longer owns the applicable securities, return of capital is recorded as a realized gain. Management's estimates are subsequently adjusted when the actual character of the distributions is disclosed by the REITs, which could result in a proportionate change in return of capital to shareholders. No estimates are made for the BDCs, ETFs, and RICs.
Awards from class action litigation are recorded as a reduction of cost basis if the Fund still owns the applicable securities on the payment date. If the Fund no longer owns the applicable securities, the proceeds are recorded as realized gains.
Expenses
General expenses of the Trust are allocated to the Fund and other funds of the Trust based upon relative net
Annual Report 2015
29
COLUMBIA MARSICO GROWTH FUND
NOTES TO FINANCIAL STATEMENTS (continued)
February 28, 2015
assets or other expense allocation methodologies determined by the nature of the expense. Expenses directly attributable to the Fund are charged to the Fund. Expenses directly attributable to a specific class of shares are charged to that share class.
Determination of Class Net Asset Value
All income, expenses (other than class-specific expenses, which are charged to that share class, as shown in the Statement of Operations) and realized and unrealized gains (losses) are allocated to each class of the Fund on a daily basis, based on the relative net assets of each class, for purposes of determining the net asset value of each class.
Federal Income Tax Status
The Fund intends to qualify each year as a regulated investment company under Subchapter M of the Internal Revenue Code, as amended, and will distribute substantially all of its taxable income (including net short-term capital gains), if any, for its tax year, and as such will not be subject to federal income taxes. In addition, the Fund intends to distribute in each calendar year substantially all of its net investment income, capital gains and certain other amounts, if any, such that the Fund should not be subject to federal excise tax. Therefore, no federal income or excise tax provision is recorded.
Foreign Taxes
The Fund may be subject to foreign taxes on income, gains on investments or currency repatriation, a portion of which may be recoverable. The Fund will accrue such taxes and recoveries, as applicable, based upon its current interpretation of tax rules and regulations that exist in the markets in which it invests.
Realized gains in certain countries may be subject to foreign taxes at the Fund level, based on statutory rates. The Fund accrues for such foreign taxes on realized and unrealized gains at the appropriate rate for each jurisdiction, as applicable. The amount, if any, is disclosed as a liability on the Statement of Assets and Liabilities.
Distributions to Shareholders
Distributions from net investment income, if any, are declared and paid semi-annually. Net realized capital gains, if any, are distributed at least annually. Income distributions and capital gain distributions are determined in accordance with federal income tax regulations, which may differ from GAAP.
Guarantees and Indemnifications
Under the Trust's organizational documents and, in some cases, by contract, its officers and trustees are indemnified against certain liabilities arising out of the performance of their duties to the Trust or its funds. In addition, certain of the Fund's contracts with its service providers contain general indemnification clauses. The Fund's maximum exposure under these arrangements is unknown since the amount of any future claims that may be made against the Fund cannot be determined, and the Fund has no historical basis for predicting the likelihood of any such claims.
Note 3. Fees and Compensation Paid to Affiliates
Investment Management Fees
Under an Investment Management Services Agreement, Columbia Management Investment Advisers, LLC (the Investment Manager), a wholly-owned subsidiary of Ameriprise Financial, Inc. (Ameriprise Financial), is responsible for the ultimate oversight of investments made by the Fund. The Fund's subadviser (see Subadvisory Agreement below) has the primary responsibility for the day-to-day portfolio management of the Fund. The investment management fee is an annual fee that is equal to a percentage of the Fund's average daily net assets that declines from 0.71% to 0.54% as the Fund's net assets increase. The effective investment management fee rate for the year ended February 28, 2015 was 0.65% of the Fund's average daily net assets.
Subadvisory Agreement
The Investment Manager has entered into a Subadvisory Agreement with Marsico Capital Management, LLC (Marsico) to serve as the subadviser to the Fund. The Investment Manager compensates Marsico to manage the investment of the Fund's assets.
Administration Fees
Under an Administrative Services Agreement, the Investment Manager also serves as the Fund Administrator. The Fund pays the Fund Administrator an annual fee for administration and accounting services equal to a percentage of the Fund's average daily net assets that declines from 0.06% to 0.03% as the Fund's net assets increase. The effective administration fee rate for the year ended February 28, 2015 was 0.05% of the Fund's average daily net assets.
Annual Report 2015
30
COLUMBIA MARSICO GROWTH FUND
NOTES TO FINANCIAL STATEMENTS (continued)
February 28, 2015
Other Expenses
Other expenses are for, among other things, miscellaneous expenses of the Fund or the Board, including payments to a company providing limited administrative services to the Fund and the Board. That company's expenses include boardroom and office expense, employee compensation, employee health and retirement benefits, and certain other expenses. For the year ended February 28, 2015, other expenses paid by the Fund to this company were $3,955.
Compensation of Board Members
Board members are compensated for their services to the Fund as disclosed in the Statement of Operations. Under a Deferred Compensation Plan (the Plan), the Board members who are not "interested persons" of the Fund, as defined under the 1940 Act, may elect to defer payment of up to 100% of their compensation. Deferred amounts are treated as though equivalent dollar amounts had been invested in shares of certain funds managed by the Investment Manager. The Fund's liability for these amounts is adjusted for market value changes and remains in the Fund until distributed in accordance with the Plan.
Transfer Agent Fees
Under a Transfer and Dividend Disbursing Agent Agreement, Columbia Management Investment Services Corp. (the Transfer Agent), an affiliate of the Investment Manager and a wholly-owned subsidiary of Ameriprise Financial, is responsible for providing transfer agency services to the Fund. The Transfer Agent has contracted with Boston Financial Data Services (BFDS) to serve as sub-transfer agent.
Effective November 1, 2014, the Transfer Agent receives a monthly transfer agency fee based on the number or the average value of accounts, depending on the type of account. Prior to November 1, 2014, the Transfer Agent received a monthly account-based service fee based on the number of open accounts. In addition, the Transfer Agent also receives sub-transfer agency fees based on a percentage of the average aggregate value of the Fund's shares maintained in omnibus accounts (other than omnibus accounts for which American Enterprise Investment Services Inc. is the broker of record or accounts where the beneficial shareholder is a customer of Ameriprise Financial Services, Inc., for which the Transfer Agent receives a per account fee). The Transfer Agent pays the fees of BFDS for services as sub-transfer agent and is not entitled to reimbursement for such fees from the Fund (with the exception of out-of-pocket fees).
The Transfer Agent also receives compensation from the Fund for various shareholder services and reimbursements for certain out-of-pocket fees. Class I shares do not pay transfer agency fees. Total transfer agent fees for Class R5 shares are subject to an annual limitation of not more than 0.05% of the average daily net assets attributable to Class R5 shares.
For the year ended February 28, 2015, the Fund's effective transfer agent fee rates as a percentage of average daily net assets of each class were as follows:
Class A | | | 0.20 | % | |
Class B | | | 0.20 | | |
Class C | | | 0.20 | | |
Class R | | | 0.20 | | |
Class R4 | | | 0.20 | | |
Class R5 | | | 0.05 | | |
Class W | | | 0.15 | | |
Class Z | | | 0.20 | | |
An annual minimum account balance fee of $20 may apply to certain accounts with a value below the applicable share class's initial minimum investment requirements to reduce the impact of small accounts on transfer agent fees. These minimum account balance fees are remitted to the Fund and recorded as part of expense reductions in the Statement of Operations. For the year ended February 28, 2015, these minimum account balance fees reduced total expenses of the Fund by $1,674.
Distribution and Service Fees
The Fund has an agreement with Columbia Management Investment Distributors, Inc. (the Distributor), an affiliate of the Investment Manager and a wholly-owned subsidiary of Ameriprise Financial, for distribution and shareholder services. The Board has approved, and the Fund has adopted, distribution and shareholder service plans (the Plans) applicable to certain share classes, which set the distribution and service fees for the Fund. These fees are calculated daily and are intended to compensate the Distributor and/or eligible selling and/or servicing agents for selling shares of the Fund and providing services to investors.
Under the Plans, the Fund pays a monthly combined distribution and service fee to the Distributor at the maximum annual rate of 0.25% of the average daily net assets attributable to Class A shares of the Fund. Also under the Plans, the Fund pays a monthly service fee at the maximum annual rate of 0.25% of the average daily net assets attributable to Class B, Class C and Class W shares of the Fund and the payment of a monthly
Annual Report 2015
31
COLUMBIA MARSICO GROWTH FUND
NOTES TO FINANCIAL STATEMENTS (continued)
February 28, 2015
distribution fee at the maximum annual rates of 0.75%, 0.75%, 0.50% and 0.25% of the average daily net assets attributable to Class B, Class C, Class R and Class W shares, respectively.
Although the Fund may pay a distribution fee up to 0.25% of the Fund's average daily net assets attributable to Class W shares and a service fee of up to 0.25% of the Fund's average daily net assets attributable to Class W shares, the aggregate fee shall not exceed 0.25% of the Fund's average daily net assets attributable to Class W shares.
Sales Charges
Sales charges, including front-end charges and CDSCs, received by the Distributor for distributing Fund shares were $163,135 for Class A, $2,528 for Class B and $9,059 for Class C shares for the year ended February 28, 2015.
Expenses Waived/Reimbursed by the Investment Manager and its Affiliates
The Fund's expense ratio is subject to an expense reimbursement arrangement pursuant to which fees will be waived and/or expenses reimbursed (excluding certain fees and expenses described below), so that the Fund's net operating expenses, after giving effect to fees waived/expenses reimbursed and any balance credits and/or overdraft charges from the Fund's custodian, do not exceed the annual rates of:
| | | Voluntary
Expense Cap
Effective
July 1, 2014 | | Contractual
Expense Cap
Prior to
July 1, 2014 | |
Class A | | | 1.22 | % | | | 1.24 | % | |
Class B | | | 1.97 | | | | 1.99 | | |
Class C | | | 1.97 | | | | 1.99 | | |
Class I | | | 0.83 | | | | 0.84 | | |
Class R | | | 1.47 | | | | 1.49 | | |
Class R4 | | | 0.97 | | | | 0.99 | | |
Class R5 | | | 0.88 | | | | 0.89 | | |
Class W | | | 1.22 | | | | 1.24 | | |
Class Z | | | 0.97 | | | | 0.99 | | |
The voluntary expense cap arrangement may be revised or discontinued at any time. Under the arrangements, the following fees and expenses are excluded from the waiver/reimbursement commitment, and therefore will be paid by the Fund, if applicable: taxes (including foreign transaction taxes), expenses associated with investments in affiliated and non-affiliated pooled investment vehicles (including mutual funds and exchange-traded funds), transaction costs and brokerage
commissions, costs related to any securities lending program, dividend expenses associated with securities sold short, inverse floater program fees and expenses, transaction charges and interest on borrowed money, interest and extraordinary expenses. Any fees waived and/or expenses reimbursed under the expense reimbursement arrangements described above are not recoverable by the Investment Manager or its affiliates in future periods.
Note 4. Federal Tax Information
The timing and character of income and capital gain distributions are determined in accordance with income tax regulations, which may differ from GAAP because of temporary or permanent book to tax differences.
At February 28, 2015, these differences are primarily due to differing treatment for deferral/reversal of wash sale losses, Trustees' deferred compensation, foreign currency transactions and net operating loss reclassification. To the extent these differences are permanent, reclassifications are made among the components of the Fund's net assets in the Statement of Assets and Liabilities. Temporary differences do not require reclassifications. In the Statement of Assets and Liabilities the following reclassifications were made:
Excess of distributions over net investment income | | $ | 1,737,406 | | |
Accumulated net realized gain | | | (1,737,406 | ) | |
Net investment income (loss) and net realized gains (losses), as disclosed in the Statement of Operations, and net assets were not affected by this reclassification.
The tax character of distributions paid during the years indicated was as follows:
Year Ended February 28, | | 2015 | | 2014 | |
Ordinary income | | $ | 15,000,020 | | | $ | 97,664,446 | | |
Long-term capital gains | | | 203,144,377 | | | | 290,544,557 | | |
Total | | $ | 218,144,397 | | | $ | 388,209,003 | | |
Short-term capital gain distributions, if any, are considered ordinary income distributions for tax purposes.
At February 28, 2015, the components of distributable earnings on a tax basis were as follows:
Undistributed ordinary income | | $ | 9,338,807 | | |
Undistributed long-term capital gains | | | 146,791,044 | | |
Net unrealized appreciation | | | 536,855,698 | | |
At February 28, 2015, the cost of investments for federal income tax purposes was $1,089,489,970 and the
Annual Report 2015
32
COLUMBIA MARSICO GROWTH FUND
NOTES TO FINANCIAL STATEMENTS (continued)
February 28, 2015
aggregate gross unrealized appreciation and depreciation based on that cost was:
Unrealized appreciation | | $ | 549,218,338 | | |
Unrealized depreciation | | | (12,362,640 | ) | |
Net unrealized appreciation | | $ | 536,855,698 | | |
Management of the Fund has concluded that there are no significant uncertain tax positions in the Fund that would require recognition in the financial statements. However, management's conclusion may be subject to review and adjustment at a later date based on factors including, but not limited to, new tax laws, regulations, and administrative interpretations (including relevant court decisions). Generally, the Fund's federal tax returns for the prior three fiscal years remain subject to examination by the Internal Revenue Service.
Note 5. Portfolio Information
The cost of purchases and proceeds from sales of securities, excluding short-term investments and derivatives, if any, aggregated to $1,270,177,912 and $1,901,592,879, respectively, for the year ended February 28, 2015. The amount of purchase and sale activity impacts the portfolio turnover rate reported in the Financial Highlights.
Note 6. Affiliated Money Market Fund
The Fund invests in Columbia Short-Term Cash Fund, an affiliated money market fund established for the exclusive use by the Fund and other affiliated funds. The income earned by the Fund from such investments is included as Dividends — affiliated issuers in the Statement of Operations. As an investing fund, the Fund indirectly bears its proportionate share of the expenses of Columbia Short-Term Cash Fund.
Note 7. Shareholder Concentration
At February 28, 2015, three unaffiliated shareholders of record owned 54.5% of the outstanding shares of the Fund in one or more accounts. The Fund has no knowledge about whether any portion of those shares was owned beneficially. Subscription and redemption activity by concentrated accounts may have a significant effect on the operations of the Fund.
Note 8. Line of Credit
The Fund has entered into a revolving credit facility with a syndicate of banks led by JPMorgan Chase Bank, N.A. (JPMorgan) whereby the Fund may borrow for the temporary funding of shareholder redemptions or for other temporary or emergency purposes. Pursuant to a December 9, 2014 amendment, the credit facility
agreement, which is a collective agreement between the Fund and certain other funds managed by the Investment Manager, severally and not jointly, permits collective borrowings up to $550 million. Interest is charged to each participating fund based on its borrowings at a rate equal to the higher of (i) the overnight federal funds rate plus 1.00% or (ii) the one-month LIBOR rate plus 1.00%. Each borrowing under the credit facility matures no later than 60 days after the date of borrowing. The Fund also pays a commitment fee equal to its pro rata share of the amount of the credit facility at a rate of 0.075% per annum. The commitment fee is included in other expenses in the Statement of Operations. Prior to the December 9, 2014 amendment, the credit facility agreement permitted borrowings up to $500 million under the same terms and interest rates as described above.
For the year ended February 28, 2015, the average daily loan balance outstanding on days when borrowing existed was $ 40,900,000 at a weighted average interest rate of 1.16%. Interest expense incurred by the Fund is recorded as line of credit interest expense in the Statement of Operations.
Note 9. Significant Risks
Consumer Discretionary Sector Risk
Sector risk occurs when a fund invests a significant portion of its assets in securities of companies conducting business in a related group of industries within an economic sector. Companies in the same economic sector may be similarly affected by economic, regulatory, political or market events or conditions, making a fund more vulnerable to unfavorable developments in that economic sector than funds that invest more broadly. The Fund may be more susceptible to the particular risks that may affect companies in the consumer discretionary sector than if it were invested in a wider variety of companies in unrelated sectors.
Health Care Sector Risk
Sector risk occurs when a fund invests a significant portion of its assets in securities of companies conducting business in a related group of industries within an economic sector. Companies in the same economic sector may be similarly affected by economic, regulatory, political or market events or conditions, making a fund more vulnerable to unfavorable developments in that economic sector than funds that invest more broadly. The Fund may be more susceptible to the particular risks that may affect companies in the health care sector than if it were invested in a wider variety of companies in unrelated sectors.
Annual Report 2015
33
COLUMBIA MARSICO GROWTH FUND
NOTES TO FINANCIAL STATEMENTS (continued)
February 28, 2015
Information Technology Sector Risk
Sector risk occurs when a fund invests a significant portion of its assets in securities of companies conducting business in a related group of industries within an economic sector. Companies in the same economic sector may be similarly affected by economic, regulatory, political or market events or conditions, making a fund more vulnerable to unfavorable developments in that economic sector than funds that invest more broadly. The Fund may be more susceptible to the particular risks that may affect companies in the information technology sector than if it were invested in a wider variety of companies in unrelated sectors.
Note 10. Subsequent Events
Management has evaluated the events and transactions that have occurred through the date the financial statements were issued and noted no items requiring adjustment of the financial statements or additional disclosure.
Note 11. Information Regarding Pending and Settled Legal Proceedings
In December 2005, without admitting or denying the allegations, American Express Financial Corporation (AEFC, which is now known as Ameriprise Financial, Inc. (Ameriprise Financial)) entered into settlement agreements with the Securities and Exchange Commission (SEC) and Minnesota Department of Commerce (MDOC) related to market timing activities. As a result, AEFC was censured and ordered to cease and desist from committing or causing any violations of certain provisions of the Investment Advisers Act of 1940, the Investment Company Act of 1940, and various Minnesota laws. AEFC agreed to pay disgorgement of $10 million and civil money penalties of $7 million. AEFC also agreed to retain an independent distribution consultant to assist in developing a plan for distribution of all disgorgement and civil penalties ordered by the SEC in accordance with various undertakings detailed at www.sec.gov/litigation/admin/ia-2451.pdf. Ameriprise Financial and its affiliates have cooperated with the SEC and the MDOC in these legal proceedings, and have made regular reports to the Funds' Boards of Trustees.
Ameriprise Financial and certain of its affiliates have historically been involved in a number of legal, arbitration and regulatory proceedings, including routine litigation, class actions, and governmental actions, concerning matters arising in connection with the conduct of their business activities. Ameriprise Financial believes that the Funds are not currently the subject of, and that
neither Ameriprise Financial nor any of its affiliates are the subject of, any pending legal, arbitration or regulatory proceedings that are likely to have a material adverse effect on the Funds or the ability of Ameriprise Financial or its affiliates to perform under their contracts with the Funds. Ameriprise Financial is required to make quarterly (10-Q), annual (10-K) and, as necessary, 8-K filings with the Securities and Exchange Commission on legal and regulatory matters that relate to Ameriprise Financial and its affiliates. Copies of these filings may be obtained by accessing the SEC website at www.sec.gov.
There can be no assurance that these matters, or the adverse publicity associated with them, will not result in increased fund redemptions, reduced sale of fund shares or other adverse consequences to the Funds. Further, although we believe proceedings are not likely to have a material adverse effect on the Funds or the ability of Ameriprise Financial or its affiliates to perform under their contracts with the Funds, these proceedings are subject to uncertainties and, as such, we are unable to estimate the possible loss or range of loss that may result. An adverse outcome in one or more of these proceedings could result in adverse judgments, settlements, fines, penalties or other relief that could have a material adverse effect on the consolidated financial condition or results of operations of Ameriprise Financial.
Annual Report 2015
34
COLUMBIA MARSICO GROWTH FUND
REPORT OF INDEPENDENT REGISTERED PUBLIC ACCOUNTING FIRM
To the Trustees of Columbia Funds Series Trust and the Shareholders of
Columbia Marsico Growth Fund
In our opinion, the accompanying statement of assets and liabilities, including the portfolio of investments, and the related statements of operations and of changes in net assets and the financial highlights present fairly, in all material respects, the financial position of Columbia Marsico Growth Fund (the "Fund", a series of Columbia Funds Series Trust) at February 28, 2015, and the results of its operations, the changes in its net assets and the financial highlights for each of the periods indicated, in conformity with accounting principles generally accepted in the United States of America. These financial statements and financial highlights (hereafter referred to as "financial statements") are the responsibility of the Fund's management; our responsibility is to express an opinion on these financial statements based on our audits. We conducted our audits of these financial statements in accordance with the standards of the Public Company Accounting Oversight Board (United States). Those standards require that we plan and perform the audit to obtain reasonable assurance about whether the financial statements are free of material misstatement. An audit includes examining, on a test basis, evidence supporting the amounts and disclosures in the financial statements, assessing the accounting principles used and significant estimates made by management, and evaluating the overall financial statement presentation. We believe that our audits, which included confirmation of securities at February 28, 2015 by correspondence with the custodian, brokers and transfer agent, provide a reasonable basis for our opinion.
PricewaterhouseCoopers LLP
Minneapolis, Minnesota
April 21, 2015
Annual Report 2015
35
COLUMBIA MARSICO GROWTH FUND
FEDERAL INCOME TAX INFORMATION
(Unaudited)
The Fund hereby designates the following tax attributes for the fiscal year ended February 28, 2015. Shareholders will be notified in early 2016 of the amounts for use in preparing 2015 income tax returns.
Tax Designations:
| Qualified Dividend Income | | | 79.37 | % | |
| Dividends Received Deduction | | | 72.33 | % | |
Capital Gain Dividend | | $ | 300,103,003 | | |
Qualified Dividend Income. For taxable, non-corporate shareholders, the percentage of ordinary income distributed during the fiscal year that represents qualified dividend income subject to reduced tax rates.
Dividends Received Deduction. The percentage of ordinary income distributed during the fiscal year that qualifies for the corporate dividends received deduction.
Capital Gain Dividend. The Fund designates as a capital gain dividend the amount reflected above, or if subsequently determined to be different, the net capital gain of such fiscal period.
Annual Report 2015
36
COLUMBIA MARSICO GROWTH FUND
Shareholders elect the Board that oversees the Funds' operations. The Board appoints officers who are responsible for day-to-day business decisions based on policies set by the Board. The following table provides basic biographical information about the Funds' Board members, including their principal occupations during the past five years, although specific titles for individuals may have varied over the period. Under current Board policy, members may serve through the end of the calendar year in which he or she reaches either the mandatory retirement age established by the Board or the fifteenth anniversary of the first Board meeting they attended as a member of the Board.
Independent Trustees
Name,
Address,
Year of Birth | | Position Held With
Funds and Length of
Service | | Principal Occupation(s)
During Past Five Years
and Other Relevant
Professional Experience | | Number of
Funds in the
Fund Family
Overseen by
Board Member | | Other Present or Past
Directorships/
Trusteeships
(Within Past 5 Years) | |
Kathleen Blatz
901 S. Marquette Ave.
Minneapolis, MN 55402
1954 | | Board member since 1/06 for RiverSource Funds and since 6/11 for Nations Funds | | Attorney; specializing in arbitration and mediation; Chief Justice, Minnesota Supreme Court, 1998-2006; Associate Justice, Minnesota Supreme Court, 1996-1998; Fourth Judicial District Court Judge, Hennepin Country, 1994-1996; Attorney in private practice and public service, 1984-1993; State Representative, Minnesota House of Representatives, 1979-1993, which included service on the Tax and Financial Institutions and Insurance Committees | | | 127 | | | Trustee, BlueCross BlueShield of Minnesota (Chair of the Business Development Committee) since 2009; Chair of the Robina Foundation since August 2013 | |
Edward J. Boudreau, Jr.
901 S. Marquette Ave.
Minneapolis, MN 55402
1944 | | Board member since 6/11 for RiverSource Funds and since 1/05 for Nations Funds | | Managing Director, E.J. Boudreau & Associates (consulting) since 2000; FINRA Industry Arbitrator, 2002-present; Chairman and Chief Executive Officer, John Hancock Funds (asset management), Chairman and Interested Trustee for open-end and closed-end funds offered by John Hancock, 1989-2000; John Hancock Life Insurance Company, including SVP and Treasurer and SVP Information Technology, 1968-1988 | | | 125 | | | Former Trustee, BofA Funds Series Trust (11 funds), 2005-2011; Trustee, Boston Museum of Science (Chair of Finance Committee), 1985-2013 | |
Pamela G. Carlton
901 S. Marquette Ave.
Minneapolis, MN 55402
1954 | | Board member since 7/07 for RiverSource Funds and since 6/11 for Nations Funds | | President, Springboard — Partners in Cross Cultural Leadership (consulting company) since 2003; Managing Director of US Equity Research, JP Morgan Chase, 1999-2003; Director of US Equity Research, Chase Asset Management, 1996-1999; Co-Director Latin America Research, 1993-1996, COO Global Research, 1992-1996, Co-Director of US Research, 1991-1992, Investment Banker, Morgan Stanley, 1982-1991 | | | 127 | | | None | |
Annual Report 2015
37
COLUMBIA MARSICO GROWTH FUND
TRUSTEES AND OFFICERS (continued)
Independent Trustees (continued)
Name,
Address,
Year of Birth | | Position Held With
Funds and Length of
Service | | Principal Occupation(s)
During Past Five Years
and Other Relevant
Professional Experience | | Number of
Funds in the
Fund Family
Overseen by
Board Member | | Other Present or Past
Directorships/
Trusteeships
(Within Past 5 Years) | |
William P. Carmichael
901 S. Marquette Ave.
Minneapolis, MN 55402
1943 | | Chair of the Board since 1/14, Board member since 6/11 for RiverSource Funds and since 2003 for Nations Funds | | Retired; Co-founder, The Succession Fund (provides exit strategies to owners of privately held companies) 1998-2007; Adjunct Professor of Finances, Kelley School of Business, Indiana University, 1993-2007; Senior Vice President, Sara Lee Corporation, 1991-1993; Senior Vice President and Chief Financial Officer, Beatrice Foods Company, 1984-1990; Vice President, Esmark, Inc, 1973-1984.; Associate, Price Waterhouse, 1968-1972 | | | 127 | | | Director, Cobra Electronics Corporation (electronic equipment manufacturer), 1994-August 2014; The Finish Line (athletic shoes and apparel) since July 2003; Director, International Textile Corp. since 2012; former Director, McMoRan Exploration Company (oil and gas exploration and development) 2010-2013; former Trustee, BofA Funds Series Trust (11 funds) 2009-2011; Director, Spectrum Brands, Inc. (consumer products), 2002-2009; Director, Simmons Company (bedding), 2004-2010 | |
Patricia M. Flynn
901 S. Marquette Ave.
Minneapolis, MN 55402
1950 | | Board member since 11/04 for RiverSource Funds and since 6/11 for Nations Funds | | Trustee Professor of Economics and Management, Bentley University since 1976 (also teaches and conducts research on corporate governance); Dean, McCallum Graduate School of Business, Bentley University, 1992-2002 | | | 127 | | | Trustee, MA Taxpayers Foundation since 1997; Board of Governors, Innovation Institute, MA Technology Collaborative since 2010 | |
William A. Hawkins
901 S. Marquette Ave.
Minneapolis, MN 55402
1942 | | Board member since 6/11 for RiverSource Funds and since 1/05 for Nations Funds | | Managing Director, Overton Partners (financial consulting), since August 2010; President and Chief Executive Officer, California General Bank, N.A., January 2008-August 2010; Operation Hope, COO, 2004-2007; IndyMac Bancorp, President, CBG, 1999-2003; American General Bank, President, 1997-1999; Griffin Financial Services, CEO, 1981-1997; The Griffin Funds, CEO, 1992-1998 | | | 125 | | | Trustee, BofA Funds Series Trust (11 funds) | |
R. Glenn Hilliard
901 S. Marquette Ave.
Minneapolis, MN 55402
1943 | | Board member since 6/11 for RiverSource Funds and since 1/05 for Nations Funds | | Chairman and Chief Executive Officer, Hilliard Group LLC (investing and consulting) since April 2003; Non-Executive Director & Chairman, CNO Financial Group, Inc. (insurance), September 2003-May 2011 | | | 125 | | | Chairman, BofA Funds Series Trust (11 funds); former Director, CNO Financial Group, Inc. (insurance) 2003-2011 | |
Annual Report 2015
38
COLUMBIA MARSICO GROWTH FUND
TRUSTEES AND OFFICERS (continued)
Independent Trustees (continued)
Name,
Address,
Year of Birth | | Position Held With
Funds and Length of
Service | | Principal Occupation(s)
During Past Five Years
and Other Relevant
Professional Experience | | Number of
Funds in the
Fund Family
Overseen by
Board Member | | Other Present or Past
Directorships/
Trusteeships
(Within Past 5 Years) | |
Catherine James Paglia
901 S. Marquette Ave.
Minneapolis, MN 55402
1952 | | Board member since 11/04 for RiverSource Funds and since 6/11 for Nations Funds | | Director, Enterprise Asset Management, Inc. (private real estate and asset management company) since September 1998; Managing Director and Partner, Interlaken Capital, Inc., 1989-1997; Managing Director, Morgan Stanley, 1982-1989; Vice President, Investment Banking, 1980-1982, Associate, Investment Banking, 1976-1980, Dean Witter Reynolds, Inc. | | | 127 | | | Director, Valmont Industries, Inc. (irrigation systems manufacturer) since 2012; Trustee, Carleton College (on the Investment Committee); Trustee, Carnegie Endowment for International Peace (on the Investment Committee) | |
Leroy C. Richie
901 S. Marquette Ave.
Minneapolis, MN 55402
1941 | | Board member since 2000 for Seligman Funds, since 11/08 for RiverSource Funds and since 6/11 for Nations Funds | | Counsel, Lewis & Munday, P.C. (law firm) since 2004; Vice President and General Counsel, Automotive Legal Affairs, Chrysler Corporation, 1993-1997 | | | 127 | | | Lead Outside Director, Digital Ally, Inc. (digital imaging) since September 2005; Director, Infinity, Inc. (oil and gas exploration and production) since 1994; Director, OGE Energy Corp. (energy and energy services) since November 2007-2014 | |
Minor M. Shaw
901 S. Marquette Ave.
Minneapolis, MN 55402
1947 | | Board member since 6/11 for RiverSource Funds and since 2003 for Nations Funds | | President, Micco LLC (private investments) since 2011; President, Micco Corp. (family investment business) 1998-2011 | | | 125 | | | Director, Piedmont Natural Gas; Director, BlueCross BlueShield of South Carolina since April 2008; Chair of the Duke Endowment; Director, National Association of Corporate Directors, Carolinas Chapter, since 2013; Chair of Greenville-Spartanburg Airport Commission; former Trustee, BofA Funds Series Trust (11 funds), 2003-2011 | |
Alison Taunton-Rigby
901 S. Marquette Ave.
Minneapolis, MN 55402
1944 | | Board member since 11/02 for RiverSource Funds and since 6/11 for Nations Funds | | Managing Director, Forester Biotech (consulting) since 2001; Chief Executive Officer and Director, RiboNovix, Inc., (biotechnology) 2003-2010; President and Chief Executive Officer of CMT Inc., 2001-2003; Aquila Biopharmaceuticals Inc., 1996-2000; Cambridge Biotech Corporation, 1995-1996, Mitotix Inc., 1993-1994 | | | 127 | | | Director, Healthways, Inc. (health and well-being solutions) since 2005; Director, ICI Mutual Insurance Company, RRG since 2011; Director, Abt Associates (government contractor) since 2001; Director, Boston Children's Hospital since 2002 | |
Annual Report 2015
39
COLUMBIA MARSICO GROWTH FUND
TRUSTEES AND OFFICERS (continued)
Interested Trustee Not Affiliated with Investment Manager*
Name,
Address,
Year of Birth | | Position Held With
Funds and Length of
Service | | Principal Occupation
During Past Five Years | | Number of
Funds in the
Fund Family
Overseen by
Board Member | | Other Present or Past
Directorships/
Trusteeships
(Within Past 5 Years) | |
Anthony M. Santomero
901 S. Marquette Ave.
Minneapolis, MN 55402
1946 | | Board member since 6/11 for RiverSource Funds and since 1/08 for Nations Funds | | Richard K. Mellon Professor Emeritus of Finance, The Wharton School, University of Pennsylvania, since 2002; Senior Advisor, McKinsey & Company (consulting), 2006-2008; President, Federal Reserve Bank of Philadelphia, 2000-2006, Professor of Finance, The Wharton School, University of Pennsylvania, 1972-2002 | | | 125 | | | Director, Renaissance Reinsurance Ltd. since May 2008; Trustee, Penn Mutual Life Insurance Company since March 2008; Director, Citigroup Inc. since 2009; Director, Citibank, N.A. since 2009; former Trustee, BofA Funds Series Trust (11 funds), 2008-2011 | |
* Dr. Santomero is not an affiliated person of the Investment Manager or Ameriprise Financial. However, he is currently deemed by the Funds to be an "interested person" (as defined in the 1940 Act) of the Funds because he serves as a Director of Citigroup Inc. and Citibank, N.A., companies that may directly or through subsidiaries and affiliates engage from time-to-time in brokerage execution, principal transactions and lending relationships with the Funds or accounts advised/managed by the Investment Manager.
Annual Report 2015
40
COLUMBIA MARSICO GROWTH FUND
TRUSTEES AND OFFICERS (continued)
Interested Trustee Affiliated with Investment Manager*
Name,
Address,
Year of Birth | | Position Held With
Funds and Length of
Service | | Principal Occupation
During Past Five Years | | Number of
Funds in the
Fund Family
Overseen by
Board Member | | Other Present or Past
Directorships/
Trusteeships
(Within Past 5 Years) | |
William F. Truscott
53600 Ameriprise
Financial Center
Minneapolis, MN 55474
1960 | | Board member since 11/01 for RiverSource Funds and since 6/11 for Nations Funds; Senior Vice President since 2002 for RiverSource Funds and since 5/10 for Nations Funds | | Chairman of the Board and President, Columbia Management Investment Advisers, LLC since May 2010 and February 2012, respectively (previously President and Chief Investment Officer, 2001-April 2010); Chief Executive Officer, Global Asset Management, Ameriprise Financial, Inc. since September 2012 (previously Chief Executive Officer, U.S. Asset Management & President, Annuities, May 2010-September 2012 and President — U.S. Asset Management and Chief Investment Officer, 2005-April 2010); Director and Chief Executive Officer, Columbia Management Investment Distributors, Inc. since May 2010 and February 2012, respectively (previously Chairman of the Board and Chief Executive Officer, 2006-April 2010); Chairman of the Board and Chief Executive Officer, RiverSource Distributors, Inc. since 2006; Director, Threadneedle Asset Management Holdings, SARL since 2014; President and Chief Executive Officer, Ameriprise Certificate Company, 2006-August 2012 | | | 186 | | | Former Director, Ameriprise Certificate Company, 2006-January 2013 | |
* Interested person (as defined under the 1940 Act) by reason of being an officer, director, security holder and/or employee of the Investment Manager or Ameriprise Financial.
The Statement of Additional Information has additional information about the Fund's Board members and is available, without charge, upon request by calling 800.345.6611; contacting your financial intermediary or visiting columbiathreadneedle.com/us.
Annual Report 2015
41
COLUMBIA MARSICO GROWTH FUND
TRUSTEES AND OFFICERS (continued)
The Board has appointed officers who are responsible for day-to-day business decisions based on policies it has established. The officers serve at the pleasure of the Board. In addition to Mr. Truscott, who is Senior Vice President, the Funds' other officers are:
Fund Officers
Name,
Address and
Year of Birth | | Position and Year
First Appointed to
Position for any Fund
in the Columbia
Funds Complex or a
Predecessor Thereof | | Principal Occupation(s) During Past Five Years | |
Christopher O. Petersen
5228 Ameriprise
Financial Center
Minneapolis, MN 55474
Born 1970 | | President and Principal Executive Officer (2015) | | Vice President and Lead Chief Counsel, Ameriprise Financial, Inc. since January 2015 (previously, Vice President and Chief Counsel January 2010-December 2014; and Vice President and Group Counsel or Counsel 2004-January 2010); officer of Columbia Funds and affiliated funds since 2007. | |
Michael G. Clarke
225 Franklin Street
Boston, MA 02110
Born 1969 | | Treasurer (2011) and Chief Financial Officer (2009) | | Vice President — Mutual Fund Administration, Columbia Management Investment Advisers, LLC, since May 2010; Managing Director of Fund Administration, Columbia Management Advisors, LLC, September 2004-April 2010; senior officer of Columbia Funds and affiliated funds since 2002. | |
Paul B. Goucher
100 Park Avenue
New York, NY 10017
Born 1968 | | Senior Vice President (2011), Chief Legal Officer (2015) and Assistant Secretary (2008) | | Vice President and Lead Chief Counsel, Ameriprise Financial, Inc. since November 2008 and January 2013, respectively (previously Chief Counsel, January 2010-January 2013 and Group Counsel, November 2008-January 2010). | |
Thomas P. McGuire
225 Franklin Street
Boston, MA 02110
Born 1972 | | Vice President and Chief Compliance Officer (2012) | | Vice President — Asset Management Compliance, Ameriprise Financial, Inc., since May 2010; Chief Compliance Officer, Ameriprise Certificate Company since September 2010; Compliance Executive, Bank of America, 2005-April 2010. | |
Colin Moore
225 Franklin Street
Boston, MA 02110
Born 1958 | | Senior Vice President (2010) | | Executive Vice President and Global Chief Investment Officer, Ameriprise Financial, Inc., since July 2013; Director and Global Chief Investment Officer, Columbia Management Investment Advisers, LLC since May 2010; Manager, Managing Director and Chief Investment Officer, Columbia Management Advisors, LLC, 2007-April 2010. | |
Michael E. DeFao
225 Franklin Street
Boston, MA 02110
Born 1968 | | Vice President (2011) and Assistant Secretary (2010) | | Vice President and Chief Counsel, Ameriprise Financial, Inc. since May 2010; Associate General Counsel, Bank of America, 2005-April 2010. | |
Joseph F. DiMaria
225 Franklin Street
Boston, MA 02110
Born 1968 | | Vice President (2011), Assistant Treasurer (2012) and Chief Accounting Officer (2008) | | Vice President — Mutual Fund Treasurer, Columbia Management Investment Advisers, LLC since May 2010; Director of Fund Administration, Columbia Management Advisors, LLC, 2006-April 2010. | |
Amy Johnson
5228 Ameriprise
Financial Center
Minneapolis, MN 55474
Born 1965 | | Vice President (2006) | | Managing Director and Chief Operating Officer, Columbia Management Investment Advisers, LLC since May 2010 (previously Chief Administrative Officer, 2009-April 2010, and Vice President — Asset Management and Trust Company Services, 2006-2009). | |
Lyn Kephart-Strong
5228 Ameriprise
Financial Center
Minneapolis, MN 55474
Born 1960 | | Vice President (2015) | | President, Columbia Management Investment Services Corp. since October 2014; Vice President & Resolution Officer, Ameriprise Trust Company since August 2009; President, RiverSource Service Corporation 2004-2010. | |
Ryan C. Larrenaga
225 Franklin Street
Boston, MA 02110
Born 1970 | | Vice President and Secretary (2015) | | Vice President and Group Counsel, Ameriprise Financial, Inc. since August 2011 (previously, Counsel from May 2010 to August 2011); Assistant General Counsel, Bank of America, 2005-April 2010; officer of Columbia Funds and affiliated funds since 2005. | |
Annual Report 2015
42
COLUMBIA MARSICO GROWTH FUND
IMPORTANT INFORMATION ABOUT THIS REPORT
Each fund mails one shareholder report to each shareholder address. If you would like more than one report, please call shareholder services at 800.345.6611 and additional reports will be sent to you.
The policy of the Board is to vote the proxies of the companies in which each fund holds investments consistent with the procedures as stated in the Statement of Additional Information (SAI). You may obtain a copy of the SAI without charge by calling 800.345.6611; contacting your financial intermediary; visiting columbiathreadneedle.com/us; or searching the website of the Securities and Exchange Commission (SEC) at sec.gov. Information regarding how each fund voted proxies relating to portfolio securities is filed with the SEC by August 31st for the most recent 12-month period ending June 30th of that year, and is available without charge by visiting columbiathreadneedle.com/us; or searching the website of the SEC at sec.gov.
Each fund files a complete schedule of portfolio holdings with the SEC for the first and third quarters of each fiscal year on Form N-Q. Each fund's Form N-Q is available on the SEC's website at sec.gov and may be reviewed and copied at the SEC's Public Reference Room in Washington, D.C. Information on the operation of the Public Reference Room may be obtained by calling 800.SEC.0330. Each fund's complete schedule of portfolio holdings, as filed on Form N-Q, can also be obtained without charge, upon request, by calling 800.345.6611.
Annual Report 2015
43
Columbia Marsico Growth Fund
P.O. Box 8081
Boston, MA 02266-8081

This information is for use with concurrent or prior delivery of a fund prospectus. Please read and consider the investment objectives, risks, charges and expenses for any fund carefully before investing. For a prospectus and summary prospectus, which contains this and other important information about the Fund, go to columbiathreadneedle.com/us. The Fund is distributed by Columbia Management Investment Distributors, Inc., member FINRA, and managed by Columbia Management Investment Advisers, LLC.
Columbia Threadneedle Investments (Columbia Threadneedle) is the global brand name of the Columbia and Threadneedle group of companies.
All rights reserved. Columbia Management Investment Distributors, Inc., 225 Franklin Street, Boston, MA 02110-2804
© 2015 Columbia Management Investment Advisers, LLC.
columbiathreadneedle.com/us
ANN188_02_E01_(04/15)

ANNUAL REPORT
February 28, 2015

COLUMBIA MULTI-ADVISOR INTERNATIONAL EQUITY FUND
(to be renamed Columbia Select International Equity Fund, effective May 1, 2015)

ABOUT COLUMBIA THREADNEEDLE INVESTMENTS
Columbia Threadneedle Investments is a leading global asset management group that provides a broad range of actively managed investment strategies and solutions for individual, institutional and corporate clients around the world.
With more than 2,000 people, including over 450 investment professionals based in North America, Europe and Asia, we manage $506 billion* of assets across developed and emerging market equities, fixed income, asset allocation solutions and alternatives. We are the 11th largest manager of long-term mutual fund assets in the U.S.** and the 5th largest manager of retail funds in the U.K.***
Our priority is the investment success of our clients. We aim to deliver the investment outcomes they expect through an investment approach that is team-based, performance-driven and risk-aware. Our culture is dynamic and interactive. By sharing our insights across asset classes and geographies, we generate richer perspectives on global, regional and local investment landscapes. The ability to exchange and debate investment ideas in a collaborative environment enriches our teams' investment processes. More importantly, it results in better informed investment decisions for our clients.
Columbia funds are distributed by Columbia Management Investment Distributors, Inc., member FINRA, and managed by Columbia Management Investment Advisers, LLC.
Columbia Threadneedle Investments (Columbia Threadneedle) is the global brand name of the Columbia and Threadneedle group of companies.
* In U.S. dollars as of December 31, 2014. Source: Ameriprise Q4 Earnings Release. Includes all assets managed by entities in the Columbia and Threadneedle groups of companies. Contact us for more current data.
** Source: ICI as of December 31, 2014 for Columbia Management Investment Advisers, LLC.
*** Source: Investment Association as of December 2014 for Threadneedle Asset Management Limited.
© 2015 Columbia Management Investment Advisers, LLC. All rights reserved.
Not part of the shareholder report
Get the market insight you need from our investment experts
Connect with Columbia Threadneedle Investments
Investor insight
Find economic and market commentary, investment videos, white papers, mutual fund commentary and more at columbiathreadneedle.com/us.
Columbia Threadneedle Investor Newsletter (e-newsletter)
Read our award-winning* shareholder newsletter. Our quarterly newsletter is available online and provides timely and relevant content about economic trends, fund news, service enhancements and changes. Sign up to receive the newsletter electronically at columbiathreadneedle.com/
us/newsletter.
Investment videos
Get analysis of current events and trends that may affect your investments. Visit our online video library to watch and discover what our thought leaders are saying about the financial markets and economy.
Social media
We offer you multiple ways to access our market commentary and investment insights.
n Perspectives blog at columbiathreadneedle.com/us
Read timely posts by our investment team, including our chief investment officer, chief economist and portfolio managers.
n twitter.com/CTinvest_US
Follow us on Twitter for quick, up-to-the-minute comments on market news and more.
n youtube.com/CTinvestUS
View our commentaries on the economy, markets and current investment opportunities.
n linkedin.com/company/columbia-threadneedle-investments-us
Connect with us on LinkedIn for updates from our thought leaders.
*Columbia Threadneedle Investor Newsletter was awarded top honors in the Mutual Fund Education Alliance STAR Awards competition for excellence in mutual fund marketing and communications in 2011, 2012 and 2013. Materials in the competition were evaluated on educational value, message comprehension, effective design and objectives.
Not part of the shareholder report
Stay informed
Become a subscriber to receive the latest investment publications and mutual fund commentaries
Subscribe to Columbia Threadneedle Investments
Email subscription center
Subscribe to the latest information from Columbia Threadneedle. Visit our email subscription center at columbiathreadneedle.com/us/subscribe to register for economic and market commentary, product and service updates, white papers and more.
n Columbia Threadneedle Investor Newsletter
Quarterly newsletter featuring the latest macro- and micro-economic trends, investment themes, products, service changes and other items of interest to our investors
n Investment Strategy Outlook
Quarterly publication featuring the Columbia Threadneedle Asset Allocation Team's perspective on global economic investment conditions and markets
n MarketTrack
Quarterly publication featuring more than 40 charts and graphs that highlight the current state of the economy and the markets; includes straightforward insight on current investment opportunities
n White papers
Frequent articles that delve deep into a variety of investment topics
n Mutual fund updates
Quarterly portfolio manager commentary and fund fact sheets available for Columbia funds. (Not all funds have a commentary.)
Register your information online at columbiathreadneedle.com/us/subscribe and select the publications you would like to receive. Update your subscriptions at any time by accessing the email subscription center.
CT-MK (03/15) 5383/1125800
 Dear Shareholder,
In a world that is changing faster than ever before, investors want asset managers who offer a global perspective while generating strong and sustainable returns. To that end, Columbia Management, in conjunction with its U.K.-based affiliate, Threadneedle Investments, has rebranded to Columbia Threadneedle Investments. The new global brand represents the combined capabilities, resources and reach of the global group, offering investors access to the best of both firms.
With a presence in 18 countries and more than 450 investment professionals*, our collective perspective and world view as Columbia Threadneedle Investments gives us deeper insight into what might affect the real-life financial outcomes clients are seeking. Putting our views into a global context enables us to build richer perspectives and create the right solutions, and provides us with enhanced capabilities to deliver consistent investment performance, which may ultimately lead to better investor outcomes.
As a result of the rebrand, you will begin to see our new logo and colors reflected in printed materials, such as this shareholder report, as well as on our new website — columbiathreadneedle.com/us. We encourage you to visit us online and view a new video on the "About Us" tab that speaks to the strength of the firm.
While we are introducing a new brand, in many ways, the investment company you know well has not changed. The following remain in effect:
n Fund and strategy names
n Established investment teams, philosophies and processes
n Account services, features, servicing phone numbers and mailing addresses
n Columbia Management Investment Distributors as distributor and Columbia Management Investment Advisers as investment adviser
We recognize that the money we manage represents the hard work and savings of people like you, and that everyone has different ambitions and different definitions of success. Investors have varying goals — funding their children's education, enjoying their retirement, putting money aside for unexpected events, and more. Whatever your ambitions, we believe our wide range of investment products and solutions can help give you confidence that you will reach your goals.
The world is constantly changing, but our priority remains the same: to help you secure your finances, meet your goals and achieve success. Thank you for your continued investment with us. Our service representatives are available at 800.345.6611 to help with any questions.
Sincerely,

Christopher O. Petersen
President, Columbia Funds
Investors should consider the investment objectives, risks, charges and expenses of a mutual fund carefully before investing. For a free prospectus and summary prospectus, which contains this and other important information about a fund, visit columbiathreadneedle.com/us. The prospectus should be read carefully before investing.
* Source: Ameriprise as of December 1, 2014
Columbia Funds are distributed by Columbia Management Investment Distributors, Inc., member FINRA, and managed by Columbia Management Investment Advisers, LLC.
© 2015 Columbia Management Investment Advisers, LLC. All rights reserved.
COLUMBIA MULTI-ADVISOR INTERNATIONAL EQUITY FUND
Fund Investment Manager
Columbia Management Investment
Advisers, LLC
225 Franklin Street
Boston, MA 02110
Fund Distributor
Columbia Management Investment
Distributors, Inc.
225 Franklin Street
Boston, MA 02110
Fund Transfer Agent
Columbia Management Investment
Services Corp.
P.O. Box 8081
Boston, MA 02266-8081
For more information about any of the funds, please visit columbiathreadneedle.com/us or call 800.345.6611. Customer Service Representatives are available to answer your questions Monday through Friday from 8 a.m. to 7 p.m. Eastern time.
The views expressed in this report reflect the current views of the respective parties. These views are not guarantees of future performance and involve certain risks, uncertainties and assumptions that are difficult to predict, so actual outcomes and results may differ significantly from the views expressed. These views are subject to change at any time based upon economic, market or other conditions and the respective parties disclaim any responsibility to update such views. These views may not be relied on as investment advice and, because investment decisions for a Columbia fund are based on numerous factors, may not be relied on as an indication of trading intent on behalf of any particular Columbia fund. References to specific securities should not be construed as a recommendation or investment advice.
Performance Overview | | | 3 | | |
Manager Discussion of Fund Performance | | | 5 | | |
Understanding Your Fund's Expenses | | | 9 | | |
Portfolio of Investments | | | 10 | | |
Statement of Assets and Liabilities | | | 18 | | |
Statement of Operations | | | 21 | | |
Statement of Changes in Net Assets | | | 22 | | |
Financial Highlights | | | 25 | | |
Notes to Financial Statements | | | 36 | | |
Report of Independent Registered
Public Accounting Firm | | | 47 | | |
Federal Income Tax Information | | | 48 | | |
Trustees and Officers | | | 49 | | |
Important Information About This Report | | | 55 | | |
COLUMBIA MULTI-ADVISOR INTERNATIONAL EQUITY FUND
Performance Summary
n Columbia Multi-Advisor International Equity Fund (the Fund) Class A shares returned -1.37% excluding sales charges for the 12-month period that ended February 28, 2015.
n The Fund underperformed its benchmark, the MSCI EAFE Index (Net), which returned -0.03% for the same time period.
n The Fund's underlying investment segments produced mixed results relative to their respective benchmarks. Exposure to Japan and the Pacific/Asia region, including emerging markets, helped relative performance but was offset by overall exposure to Europe.
Average Annual Total Returns (%) (for period ended February 28, 2015)
| | | Inception | | 1 Year | | 5 Years | | 10 Years | |
Class A | | 06/03/92 | | | | | | | | | | | | | |
Excluding sales charges | | | | | | | -1.37 | | | | 6.18 | | | | 3.59 | | |
Including sales charges | | | | | | | -7.06 | | | | 4.93 | | | | 2.98 | | |
Class B | | 06/07/93 | | | | | | | | | | | | | |
Excluding sales charges | | | | | | | -2.16 | | | | 5.38 | | | | 2.81 | | |
Including sales charges | | | | | | | -7.05 | | | | 5.05 | | | | 2.81 | | |
Class C | | 06/17/92 | | | | | | | | | | | | | |
Excluding sales charges | | | | | | | -2.11 | | | | 5.38 | | | | 2.82 | | |
Including sales charges | | | | | | | -3.09 | | | | 5.38 | | | | 2.82 | | |
Class I* | | 09/27/10 | | | -0.85 | | | | 6.67 | | | | 3.96 | | |
Class K* | | 03/07/11 | | | -1.13 | | | | 6.37 | | | | 3.76 | | |
Class R* | | 01/23/06 | | | -1.59 | | | | 5.93 | | | | 3.34 | | |
Class R4* | | 11/08/12 | | | -1.13 | | | | 6.45 | | | | 3.85 | | |
Class R5* | | 11/08/12 | | | -0.91 | | | | 6.53 | | | | 3.89 | | |
Class W* | | 09/27/10 | | | -1.30 | | | | 6.20 | | | | 3.62 | | |
Class Y* | | 03/07/11 | | | -0.85 | | | | 6.64 | | | | 3.94 | | |
Class Z | | 12/02/91 | | | -1.06 | | | | 6.46 | | | | 3.86 | | |
MSCI EAFE Index (Net) | | | | | | | -0.03 | | | | 7.78 | | | | 4.84 | | |
Returns for Class A are shown with and without the maximum initial sales charge of 5.75%. Returns for Class B are shown with and without the applicable contingent deferred sales charge (CDSC) of 5.00% in the first year, declining to 1.00% in the sixth year and eliminated thereafter. Returns for Class C are shown with and without the 1.00% CDSC for the first year only. The Fund's other classes are not subject to sales charges and have limited eligibility. Please see the Fund's prospectus for details. Performance for different share classes will vary based on differences in sales charges and fees associated with each class. All results shown assume reinvestment of distributions during the period. Returns do not reflect the deduction of taxes that a shareholder may pay on Fund distributions or on the redemption of Fund shares. Performance results reflect the effect of any fee waivers or reimbursements of Fund expenses by Columbia Management Investment Advisers, LLC and/or any of its affiliates. Absent these fee waivers or expense reimbursement arrangements, performance results would have been lower.
The performance information shown represents past performance and is not a guarantee of future results. The investment return and principal value of your investment will fluctuate so that your shares, when redeemed, may be worth more or less than their original cost. Current performance may be lower or higher than the performance information shown. You may obtain performance information current to the most recent month-end by contacting your financial intermediary, visiting columbiathreadneedle.com/us or calling 800.345.6611.
*The returns shown for periods prior to the share class inception date (including returns for the Life of the Fund, if shown, which are since Fund inception) include the returns of the Fund's oldest share class. These returns are adjusted to reflect any higher class-related operating expenses of the newer share classes, as applicable. Please visit columbiathreadneedle.com/us/investment-products/mutual-funds/appended-performance for more information.
The MSCI EAFE Index (Net) is a free float-adjusted market capitalization index that is designed to measure the equity market performance of developed markets, excluding the U.S. and Canada. The index is compiled from a composite of securities markets of Europe, Australasia and the Far East and is widely recognized by investors in foreign markets as the measurement index for portfolios of non-North American securities.
Indices are not available for investment, are not professionally managed and do not reflect sales charges, fees, brokerage commissions, taxes (except the MSCI EAFE Index (Net), which reflects reinvested dividends net of withholding taxes) or other expenses of investing. Securities in the Fund may not match those in an index.
Annual Report 2015
3
COLUMBIA MULTI-ADVISOR INTERNATIONAL EQUITY FUND
PERFORMANCE OVERVIEW (continued)
Performance of a Hypothetical $10,000 Investment (March 1, 2005 – February 28, 2015)
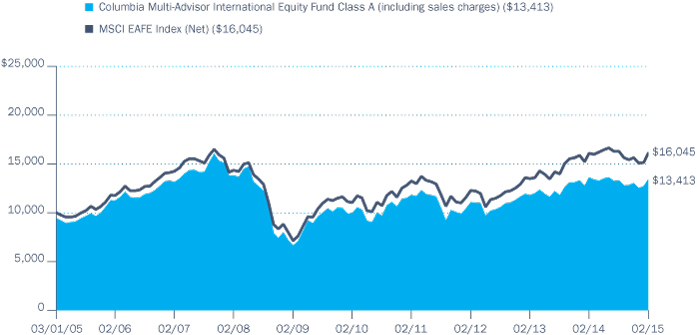
The chart above shows the change in value of a hypothetical $10,000 investment in Class A shares of Columbia Multi-Advisor International Equity Fund during the stated time period, and does not reflect the deduction of taxes that a shareholder may pay on Fund distributions or on the redemption of Fund shares.
Annual Report 2015
4
COLUMBIA MULTI-ADVISOR INTERNATIONAL EQUITY FUND
MANAGER DISCUSSION OF FUND PERFORMANCE
Effective on or about May 1, 2015, the Fund's name will change to Columbia Select International Equity Fund.
For the 12-month period that ended February 28, 2015, the Fund's Class A shares returned -1.37% excluding sales charges. The Fund underperformed its benchmark, the MSCI EAFE Index (Net), which returned -0.03% over the same time period. In a year of generally lackluster performance from markets in the developed world, the Fund's four underlying equity portfolios produced mixed results, both in terms of absolute returns and returns relative to their respective benchmarks. Exposure to Japan and the Pacific/Asia region, including emerging markets, helped the Fund's performance but was offset by overall exposure to Europe.
A Mixed Year for Stock Markets Outside of the United States
For the period ended February 28, 2015, economic growth was lackluster in England, Europe and Japan and below expectations in many emerging markets. Eurozone economies were so weak that the European Central Bank (ECB) introduced new stimulus to stoke both inflation and growth. Combined with geopolitical uncertainties, a rising U.S. dollar and lower oil prices, low growth generally weighed on equity markets outside the United States and was reflected by modest to negative equity returns in many parts of the world. However, some markets — both developed and emerging — actually benefited from the strong U.S. dollar and declining oil prices, producing solid and even stellar returns as measured by the performance of their respective MSCI indexes. For example, Greece's stock market declined by more than 50% over the 12-month period (measured in U.S. dollars), developed equity markets in Europe generally declined by mid to single digits and emerging markets such as Russia, Poland and Brazil declined in the 10-20% range. By contrast, the stock markets of India, the Philippines, Thailand and China, where economic growth slowed in line with expectations, produced double-digit gains (in U.S. dollars) for the period. With a return of more than 35%, India was a noteworthy outperformer, as was Japan, which returned just under 9%.
Mixed Performance from Fund Equity Segments
The Fund is managed through four sub-portfolios to take advantage of opportunities across different regions, investment styles and market segments. The portion of the portfolio managed by Threadneedle International Limited focuses on European equities. Of the remaining three segments, one focuses on emerging markets, a second on Japan and a third on the Pacific/Asia region, excluding Japan.
During the period, the Fund's Japan, Pacific/Asia and emerging markets segments produced positive returns, but only the Japan segment outperformed its benchmark. The Fund's European segment posted a modest negative return, but it held up better than its benchmark. However, overall negative results from Europe offset the favorable contributions from other segments.
Portfolio Management
Columbia Management Investment Advisers, LLC
Colin Moore, AIIMR
Fred Copper, CFA
Threadneedle International Limited
Daniel Ison
Effective March 13, 2015, Simon Haines, William Davies and David Dudding will replace Messrs. Moore, Copper and Ison as Portfolio Managers of the Fund.
Morningstar Style BoxTM
The Morningstar Style BoxTM is based on a fund's portfolio holdings. For equity funds, the vertical axis shows the market capitalization of the stocks owned, and the horizontal axis shows investment style (value, blend, or growth). Information shown is based on the most recent data provided by Morningstar.
© 2015 Morningstar, Inc. All rights reserved. The Morningstar information contained herein: (1) is proprietary to Morningstar and/or its content providers; (2) may not be copied or distributed; and (3) is not warranted to be accurate, complete or timely. Neither Morningstar nor its content providers are responsible for any damages or losses arising from any use of this information.
Annual Report 2015
5
COLUMBIA MULTI-ADVISOR INTERNATIONAL EQUITY FUND
MANAGER DISCUSSION OF FUND PERFORMANCE (continued)
Top Ten Holdings (%)
(at February 28, 2015) | |
Bayer AG, Registered Shares
(Germany) | | | 2.7 | | |
ING Groep NV-CVA (Netherlands) | | | 2.1 | | |
Novo Nordisk A/S, Class B
(Denmark) | | | 2.0 | | |
Novartis AG, Registered Shares
(Switzerland) | | | 2.0 | | |
ASML Holding NV (Netherlands) | | | 1.8 | | |
Prudential PLC (United Kingdom) | | | 1.7 | | |
BT Group PLC (United Kingdom) | | | 1.6 | | |
Unilever PLC (United Kingdom) | | | 1.5 | | |
UBS AG (Switzerland) | | | 1.5 | | |
Reed Elsevier NV (Netherlands) | | | 1.4 | | |
Percentages indicated are based upon total investments (excluding Money Market Funds).
For further detail about these holdings, please refer to the section entitled "Portfolio of Investments."
Fund holdings are as of the date given, are subject to change at any time, and are not recommendations to buy or sell any security.
Portfolio Breakdown (%)
(at February 28, 2015) | |
Common Stocks | | | 96.6 | | |
Consumer Discretionary | | | 16.8 | | |
Consumer Staples | | | 7.1 | | |
Energy | | | 1.8 | | |
Financials | | | 24.9 | | |
Health Care | | | 13.2 | | |
Industrials | | | 15.0 | | |
Information Technology | | | 6.8 | | |
Materials | | | 5.7 | | |
Telecommunication Services | | | 4.4 | | |
Utilities | | | 0.9 | | |
Exchange-Traded Funds | | | 1.0 | | |
Money Market Funds | | | 1.7 | | |
Preferred Stocks | | | 0.7 | | |
Consumer Discretionary | | | 0.7 | | |
Total | | | 100.0 | | |
Percentages indicated are based upon total investments. The Fund's portfolio composition is subject to change.
Looking Ahead
Our outlook for markets going forward balances a mix of optimism with a dose of uncertainty. On the plus side, U.S. economic growth currently remains strong enough to help prop up exports for the rest of the world, and monetary policy continues to be extremely accommodative in Japan and Europe, with the prospect for further monetary easing in China. The ECB has completed its in-depth analysis of the banking sector, broadcasting a positive outcome regarding the financial soundness of the sector, which could signal the end of constrained lending practices. In addition, the ECB began buying sovereign debt early in 2014, kicking off a 19-month stimulus plan designed to reignite eurozone economies. Falling oil prices are a drag for the large energy producers of the world, but for most of the developed world, it represents a windfall in terms of lower costs.
Offsetting these positive factors, the U.S. Federal Reserve has ended its program of monthly bond buying, known as quantitative easing (QE). As a result, the world will need to adjust to the prospect of tighter monetary conditions in the United States. The end of QE, in conjunction with smaller trade and fiscal deficits, means there are fewer U.S. dollars going overseas. U.S. dollars have been a key source of funding for many countries, and the risk of default has historically risen in such an environment. At the end of the period, the possibility of Greece defaulting on its debt remained a major risk. Finally, while lower oil prices are a boon for most of the developed world, the magnitude and the speed of the selloff could easily trigger financial distress in the companies and governments that rely on those revenues.
Annual Report 2015
6
COLUMBIA MULTI-ADVISOR INTERNATIONAL EQUITY FUND
MANAGER DISCUSSION OF FUND PERFORMANCE (continued)
Country Breakdown (%)
(at February 28, 2015) | |
Australia | | | 5.5 | | |
Belgium | | | 2.6 | | |
China | | | 1.2 | | |
Denmark | | | 3.1 | | |
Finland | | | 0.9 | | |
France | | | 8.7 | | |
Germany | | | 8.8 | | |
Hong Kong | | | 2.3 | | |
Ireland | | | 2.0 | | |
Italy | | | 1.3 | | |
Japan | | | 20.9 | | |
Malta | | | 0.0 | (a) | |
Netherlands | | | 6.2 | | |
Norway | | | 0.7 | | |
Papua New Guinea | | | 0.2 | | |
Singapore | | | 1.9 | | |
Spain | | | 2.8 | | |
Sweden | | | 2.0 | | |
Switzerland | | | 7.0 | | |
Taiwan | | | 0.2 | | |
United Kingdom | | | 20.0 | | |
United States(b) | | | 1.7 | | |
Total | | | 100.0 | | |
Country Breakdown is based primarily on issuer's place of organization/incorporation. Percentages indicated are based upon total investments. The Fund's portfolio composition is subject to change.
(a) Rounds to zero.
(b) Includes investments in Money Market Funds.
Annual Report 2015
7
COLUMBIA MULTI-ADVISOR INTERNATIONAL EQUITY FUND
MANAGER DISCUSSION OF FUND PERFORMANCE (continued)
Investment Risks
Market risk may affect a single issuer, sector of the economy, industry or the market as a whole. Growth securities, at times, may not perform as well as value securities or the stock market in general and may be out of favor with investors. Value securities may be unprofitable if the market fails to recognize their intrinsic worth or the portfolio manager misgauged that worth. International investing involves certain risks and volatility due to potential political, economic or currency instabilities and different financial and accounting standards. Risks are enhanced for emerging market issuers. Investing in derivatives is a specialized activity that involves special risks that subject the Fund to significant loss potential, including when used as leverage, and may result in greater fluctuation in Fund value. The Fund is managed by multiple advisers independently of one another, which may result in contradicting trades (i.e., with no net benefit to the Fund), while increasing transaction costs. The value of the Fund's portfolio may be more volatile due to concentrated investments in similar industries, sectors or geographical regions. Investments in a limited number of companies subject the Fund to greater risk of loss. See the Fund's prospectus for more information on these and other risks.
Annual Report 2015
8
COLUMBIA MULTI-ADVISOR INTERNATIONAL EQUITY FUND
UNDERSTANDING YOUR FUND'S EXPENSES
(Unaudited)
As an investor, you incur two types of costs. There are transaction costs, which generally include sales charges on purchases and may include redemption fees. There are also ongoing costs, which generally include management fees, distribution and/or service fees, and other fund expenses. The following information is intended to help you understand your ongoing costs (in dollars) of investing in the Fund and to help you compare these costs with the ongoing costs of investing in other mutual funds.
Analyzing Your Fund's Expenses
To illustrate these ongoing costs, we have provided examples and calculated the expenses paid by investors in each share class of the Fund during the period. The actual and hypothetical information in the table is based on an initial investment of $1,000 at the beginning of the period indicated and held for the entire period. Expense information is calculated two ways and each method provides you with different information. The amount listed in the "Actual" column is calculated using the Fund's actual operating expenses and total return for the period. You may use the Actual information, together with the amount invested, to estimate the expenses that you paid over the period. Simply divide your account value by $1,000 (for example, an $8,600 account value divided by $1,000 = 8.6), then multiply the results by the expenses paid during the period under the "Actual" column. The amount listed in the "Hypothetical" column assumes a 5% annual rate of return before expenses (which is not the Fund's actual return) and then applies the Fund's actual expense ratio for the period to the hypothetical return. You should not use the hypothetical account values and expenses to estimate either your actual account balance at the end of the period or the expenses you paid during the period. See "Compare With Other Funds" below for details on how to use the hypothetical data.
Compare With Other Funds
Since all mutual funds are required to include the same hypothetical calculations about expenses in shareholder reports, you can use this information to compare the ongoing cost of investing in the Fund with other funds. To do so, compare the hypothetical example with the 5% hypothetical examples that appear in the shareholder reports of other funds. As you compare hypothetical examples of other funds, it is important to note that hypothetical examples are meant to highlight the ongoing costs of investing in a fund only and do not reflect any transaction costs, such as sales charges, or redemption or exchange fees. Therefore, the hypothetical calculations are useful in comparing ongoing costs only, and will not help you determine the relative total costs of owning different funds. If transaction costs were included in these calculations, your costs would be higher.
September 1, 2014 – February 28, 2015
| | | Account Value at the Beginning
of the Period ($) | | Account Value at the End of the
Period ($) | | Expenses Paid During the
Period ($) | | Fund's Annualized
Expense Ratio (%) | |
| | | Actual | | Hypothetical | | Actual | | Hypothetical | | Actual | | Hypothetical | | Actual | |
Class A | | | 1,000.00 | | | | 1,000.00 | | | | 1,009.60 | | | | 1,017.50 | | | | 7.47 | | | | 7.49 | | | | 1.49 | | |
Class B | | | 1,000.00 | | | | 1,000.00 | | | | 1,005.80 | | | | 1,013.76 | | | | 11.20 | | | | 11.25 | | | | 2.24 | | |
Class C | | | 1,000.00 | | | | 1,000.00 | | | | 1,005.80 | | | | 1,013.76 | | | | 11.20 | | | | 11.25 | | | | 2.24 | | |
Class I | | | 1,000.00 | | | | 1,000.00 | | | | 1,012.30 | | | | 1,020.24 | | | | 4.72 | | | | 4.73 | | | | 0.94 | | |
Class K | | | 1,000.00 | | | | 1,000.00 | | | | 1,011.60 | | | | 1,018.65 | | | | 6.32 | | | | 6.34 | | | | 1.26 | | |
Class R | | | 1,000.00 | | | | 1,000.00 | | | | 1,008.90 | | | | 1,016.26 | | | | 8.71 | | | | 8.75 | | | | 1.74 | | |
Class R4 | | | 1,000.00 | | | | 1,000.00 | | | | 1,010.80 | | | | 1,018.75 | | | | 6.22 | | | | 6.24 | | | | 1.24 | | |
Class R5 | | | 1,000.00 | | | | 1,000.00 | | | | 1,012.20 | | | | 1,019.95 | | | | 5.02 | | | | 5.04 | | | | 1.00 | | |
Class W | | | 1,000.00 | | | | 1,000.00 | | | | 1,010.30 | | | | 1,017.50 | | | | 7.47 | | | | 7.49 | | | | 1.49 | | |
Class Y | | | 1,000.00 | | | | 1,000.00 | | | | 1,012.30 | | | | 1,020.14 | | | | 4.82 | | | | 4.84 | | | | 0.96 | | |
Class Z | | | 1,000.00 | | | | 1,000.00 | | | | 1,010.90 | | | | 1,018.75 | | | | 6.22 | | | | 6.24 | | | | 1.24 | | |
Expenses paid during the period are equal to the annualized expense ratio for each class as indicated above, multiplied by the average account value over the period and then multiplied by the number of days in the Fund's most recent fiscal half year and divided by 365.
Expenses do not include fees and expenses incurred indirectly by the Fund from its investment in underlying funds, including affiliated and non-affiliated pooled investment vehicles, such as mutual funds and exchange-traded funds.
Had Columbia Management Investment Advisers, LLC and/or certain of its affiliates not waived/reimbursed certain fees and expenses, account value at the end of the period would have been reduced.
Annual Report 2015
9
COLUMBIA MULTI-ADVISOR INTERNATIONAL EQUITY FUND
PORTFOLIO OF INVESTMENTS
February 28, 2015
(Percentages represent value of investments compared to net assets)
Common Stocks 97.1%
Issuer | | Shares | | Value ($) | |
AUSTRALIA 5.5% | |
Amcor Ltd. | | | 111,243 | | | | 1,185,937 | | |
AMP Ltd. | | | 102,298 | | | | 534,610 | | |
Australia and New Zealand Banking
Group Ltd. | | | 139,637 | | | | 3,852,267 | | |
BHP Billiton Ltd. | | | 126,997 | | | | 3,335,314 | | |
BlueScope Steel Ltd. | | | 168,000 | | | | 631,378 | | |
carsales.com Ltd. | | | 101,000 | | | | 790,003 | | |
Commonwealth Bank of Australia | | | 61,745 | | | | 4,429,482 | | |
Computershare Ltd. | | | 91,000 | | | | 893,189 | | |
Crown Resorts Ltd. | | | 36,491 | | | | 435,816 | | |
CSL Ltd. | | | 13,746 | | | | 989,795 | | |
Dick Smith Holdings Ltd. | | | 871,000 | | | | 1,475,499 | | |
Lend Lease Group | | | 56,068 | | | | 758,739 | | |
Macquarie Group Ltd. | | | 41,205 | | | | 2,341,919 | | |
National Australia Bank Ltd. | | | 41,902 | | | | 1,239,765 | | |
QBE Insurance Group Ltd. | | | 295,379 | | | | 2,991,557 | | |
Scentre Group | | | 386,343 | | | | 1,163,866 | | |
Slater & Gordon Ltd. | | | 223,170 | | | | 1,304,738 | | |
Suncorp Group Ltd. | | | 63,000 | | | | 687,799 | | |
Treasury Wine Estates Ltd. | | | 196,255 | | | | 830,905 | | |
Wesfarmers Ltd. | | | 19,860 | | | | 679,654 | | |
Westfield Corp. | | | 117,756 | | | | 901,803 | | |
Westpac Banking Corp. | | | 174,059 | | | | 5,177,438 | | |
Woolworths Ltd. | | | 49,508 | | | | 1,184,835 | | |
Total | | | | | 37,816,308 | | |
BELGIUM 2.6% | |
Anheuser-Busch InBev NV | | | 74,778 | | | | 9,514,454 | | |
KBC Groep NV(a) | | | 74,317 | | | | 4,509,176 | | |
UCB SA | | | 54,112 | | | | 4,138,869 | | |
Total | | | | | 18,162,499 | | |
CHINA 1.3% | |
Baidu, Inc., ADR(a) | | | 5,777 | | | | 1,177,064 | | |
Beijing Urban Construction Design &
Development Group Co., Ltd. Class H(a) | | | 2,460,000 | | | | 1,360,058 | | |
Bitauto Holdings Ltd., ADR(a) | | | 13,000 | | | | 824,850 | | |
China Gas Holdings Ltd. | | | 1,138,000 | | | | 1,768,335 | | |
China Milk Products Group Ltd.(a)(b)(c) | | | 7,426,000 | | | | 5 | | |
Industrial & Commercial Bank of
China Ltd., Class H | | | 1,400,000 | | | | 1,023,038 | | |
Common Stocks (continued)
Issuer | | Shares | | Value ($) | |
Ping An Insurance Group Co. of
China Ltd., Class H | | | 100,000 | | | | 1,111,481 | | |
Sinotrans Ltd., Class H | | | 1,543,000 | | | | 1,020,903 | | |
Total | | | | | 8,285,734 | | |
DENMARK 3.1% | |
Novo Nordisk A/S, Class B | | | 281,091 | | | | 13,476,215 | | |
Pandora A/S | | | 88,463 | | | | 8,072,362 | | |
Total | | | | | 21,548,577 | | |
FINLAND 0.9% | |
KONE OYJ, Class B | | | 68,340 | | | | 3,149,277 | | |
Nokia OYJ | | | 408,839 | | | | 3,287,219 | | |
Total | | | | | 6,436,496 | | |
FRANCE 8.8% | |
Airbus Group NV | | | 87,839 | | | | 5,438,731 | | |
Essilor International SA | | | 35,624 | | | | 4,163,904 | | |
Groupe Eurotunnel SE | | | 500,201 | | | | 6,840,145 | | |
Iliad SA | | | 27,542 | | | | 7,151,985 | | |
L'Oreal SA | | | 49,336 | | | | 8,957,735 | | |
Legrand SA | | | 144,092 | | | | 7,965,561 | | |
Publicis Groupe SA | | | 101,911 | | | | 8,310,351 | | |
Schneider Electric SE | | | 91,115 | | | | 7,339,243 | | |
Vivendi SA | | | 181,555 | | | | 4,432,135 | | |
Total | | | | | 60,599,790 | | |
GERMANY 8.1% | |
Bayer AG, Registered Shares | | | 123,833 | | | | 18,298,873 | | |
Bayerische Motoren Werke AG | | | 60,054 | | | | 7,593,988 | | |
Brenntag AG | | | 119,903 | | | | 7,010,773 | | |
Continental AG | | | 36,903 | | | | 8,808,502 | | |
Deutsche Post AG | | | 149,253 | | | | 5,082,467 | | |
ProSiebenSat.1 Media AG, Registered
Shares | | | 116,270 | | | | 5,711,265 | | |
TUI AG | | | 205,981 | | | | 3,729,540 | | |
Total | | | | | 56,235,408 | | |
HONG KONG 2.3% | |
AIA Group Ltd. | | | 677,000 | | | | 3,981,429 | | |
BOC Hong Kong Holdings Ltd. | | | 438,000 | | | | 1,543,987 | | |
Cheung Kong Holdings Ltd. | | | 196,000 | | | | 3,879,589 | | |
Global Brands Group Holding Ltd.(a) | | | 7,800,000 | | | | 1,337,729 | | |
Hong Kong Exchanges and Clearing Ltd. | | | 38,000 | | | | 877,594 | | |
The accompanying Notes to Financial Statements are an integral part of this statement.
Annual Report 2015
10
COLUMBIA MULTI-ADVISOR INTERNATIONAL EQUITY FUND
PORTFOLIO OF INVESTMENTS (continued)
February 28, 2015
Common Stocks (continued)
Issuer | | Shares | | Value ($) | |
Hutchison Whampoa Ltd. | | | 108,000 | | | | 1,478,842 | | |
Sands China Ltd. | | | 168,400 | | | | 767,447 | | |
Wharf Holdings Ltd. (The) | | | 241,000 | | | | 1,756,959 | | |
Wynn Macau Ltd. | | | 198,000 | | | | 518,577 | | |
Total | | | | | 16,142,153 | | |
IRELAND 2.0% | |
Bank of Ireland(a) | | | 11,833,066 | | | | 4,502,210 | | |
CRH PLC | | | 325,107 | | | | 9,185,076 | | |
Total | | | | | 13,687,286 | | |
ITALY 1.3% | |
Intesa Sanpaolo SpA | | | 2,773,944 | | | | 9,262,880 | | |
JAPAN 19.9% | |
Alps Electric Co., Ltd. | | | 180,700 | | | | 4,065,141 | | |
Aozora Bank Ltd. | | | 954,000 | | | | 3,439,065 | | |
Astellas Pharma, Inc. | | | 411,700 | | | | 6,549,265 | | |
Central Japan Railway Co. | | | 33,500 | | | | 6,233,307 | | |
Chugoku Marine Paints Ltd. | | | 172,000 | | | | 1,470,211 | | |
COMSYS Holdings Corp. | | | 258,900 | | | | 3,132,843 | | |
CYBERDYNE, Inc.(a) | | | 28,200 | | | | 699,414 | | |
Daiichikosho Co., Ltd. | | | 148,900 | | | | 4,692,290 | | |
Daikin Industries Ltd. | | | 45,900 | | | | 2,994,151 | | |
Fuji Heavy Industries Ltd. | | | 172,300 | | | | 5,873,982 | | |
Hoshizaki Electric Co., Ltd. | | | 63,700 | | | | 3,773,494 | | |
Hoya Corp. | | | 123,700 | | | | 4,994,060 | | |
Invincible Investment Corp. | | | 4,276 | | | | 1,911,371 | | |
KDDI Corp. | | | 103,200 | | | | 7,162,227 | | |
Kenedix Retail REIT Corp.(a) | | | 137 | | | | 313,339 | | |
Keyence Corp. | | | 9,500 | | | | 4,858,316 | | |
M3, Inc. | | | 171,000 | | | | 3,798,447 | | |
Mitsubishi UFJ Financial Group, Inc. | | | 596,400 | | | | 3,884,326 | | |
Mitsui Fudosan Co., Ltd. | | | 50,000 | | | | 1,373,980 | | |
Nakanishi, Inc. | | | 81,200 | | | | 3,120,807 | | |
Nidec Corp. | | | 50,200 | | | | 3,390,380 | | |
Nihon M&A Center, Inc. | | | 111,000 | | | | 3,661,033 | | |
Nishi-Nippon City Bank Ltd. (The) | | | 621,000 | | | | 1,990,526 | | |
Omron Corp. | | | 100,100 | | | | 4,427,254 | | |
ORIX Corp. | | | 403,480 | | | | 5,737,193 | | |
PeptiDream, Inc.(a) | | | 13,500 | | | | 1,106,216 | | |
Raito Kogyo Co., Ltd. | | | 203,300 | | | | 1,732,026 | | |
Common Stocks (continued)
Issuer | | Shares | | Value ($) | |
San-A Co., Ltd. | | | 126,700 | | | | 4,420,355 | | |
Seiko Epson Corp. | | | 47,200 | | | | 1,737,197 | | |
Shinmaywa Industries Ltd. | | | 344,000 | | | | 3,735,001 | | |
SoftBank Corp. | | | 19,600 | | | | 1,210,508 | | |
Sumitomo Mitsui Financial Group, Inc. | | | 86,400 | | | | 3,442,485 | | |
Sysmex Corp. | | | 38,400 | | | | 2,064,250 | | |
Tanseisha Co., Ltd. | | | 243,000 | | | | 1,633,581 | | |
Temp Holdings Co., Ltd. | | | 68,800 | | | | 2,312,578 | | |
Tokai Tokyo Financial Holdings, Inc. | | | 496,000 | | | | 3,643,723 | | |
Tokyo Gas Co., Ltd. | | | 690,000 | | | | 4,203,873 | | |
Toyo Tire & Rubber Co., Ltd. | | | 199,900 | | | | 4,525,103 | | |
Toyota Motor Corp. | | | 120,600 | | | | 8,151,863 | | |
Total | | | | | 137,465,181 | | |
MALTA —% | |
BGP Holdings PLC(a)(b)(c) | | | 2,232,232 | | | | 3 | | |
NETHERLANDS 6.2% | |
Akzo Nobel NV | | | 91,847 | | | | 6,824,685 | | |
| ASML Holding NV | | | 111,924 | | | | 12,100,264 | | |
ING Groep NV-CVA(a) | | | 938,880 | | | | 14,031,481 | | |
Reed Elsevier NV | | | 393,957 | | | | 9,787,040 | | |
Total | | | | | 42,743,470 | | |
NORWAY 0.8% | |
DNB ASA | | | 318,329 | | | | 5,182,259 | | |
PAPUA NEW GUINEA 0.2% | |
Oil Search Ltd. | | | 184,317 | | | | 1,171,304 | | |
SINGAPORE 1.9% | |
CapitaLand Ltd. | | | 252,000 | | | | 663,458 | | |
DBS Group Holdings Ltd. | | | 168,000 | | | | 2,408,921 | | |
Frasers Centrepoint Ltd. | | | 1,002,000 | | | | 1,321,238 | | |
Global Logistic Properties Ltd. | | | 1,263,000 | | | | 2,398,601 | | |
Great Eastern Holdings Ltd. | | | 76,000 | | | | 1,393,441 | | |
Keppel DC REIT(a) | | | 1,000,000 | | | | 763,107 | | |
Oversea-Chinese Banking Corp., Ltd. | | | 288,000 | | | | 2,212,077 | | |
United Overseas Bank Ltd. | | | 68,000 | | | | 1,150,150 | | |
UOL Group Ltd. | | | 132,000 | | | | 759,423 | | |
Total | | | | | 13,070,416 | | |
SPAIN 2.9% | |
Amadeus IT Holding SA, Class A | | | 156,738 | | | | 6,463,405 | | |
The accompanying Notes to Financial Statements are an integral part of this statement.
Annual Report 2015
11
COLUMBIA MULTI-ADVISOR INTERNATIONAL EQUITY FUND
PORTFOLIO OF INVESTMENTS (continued)
February 28, 2015
Common Stocks (continued)
Issuer | | Shares | | Value ($) | |
Ferrovial SA | | | 325,136 | | | | 6,891,196 | | |
Inditex SA | | | 203,854 | | | | 6,406,830 | | |
Total | | | | | 19,761,431 | | |
SWEDEN 2.0% | |
Nordea Bank AB | | | 488,169 | | | | 6,587,383 | | |
Svenska Handelsbanken AB, Class A | | | 147,267 | | | | 7,418,992 | | |
Total | | | | | 14,006,375 | | |
SWITZERLAND 7.0% | |
Cie Financiere Richemont SA, Class A,
Registered Shares | | | 51,290 | | | | 4,519,180 | | |
Nestlé SA, Registered Shares | | | 114,233 | | | | 8,914,811 | | |
Novartis AG, Registered Shares | | | 131,536 | | | | 13,445,411 | | |
Roche Holding AG, Genusschein Shares | | | 31,206 | | | | 8,471,299 | | |
Sika AG | | | 854 | | | | 3,017,016 | | |
UBS AG | | | 577,803 | | | | 10,151,781 | | |
Total | | | | | 48,519,498 | | |
TAIWAN 0.2% | |
Largan Precision Co., Ltd. | | | 10,000 | | | | 850,078 | | |
Radiant Opto-Electronics Corp. | | | 238,000 | | | | 780,689 | | |
Total | | | | | 1,630,767 | | |
UNITED KINGDOM 20.1% | |
Ashtead Group PLC | | | 445,163 | | | | 8,178,456 | | |
AstraZeneca PLC | | | 79,585 | | | | 5,491,557 | | |
BG Group PLC | | | 391,758 | | | | 5,794,136 | | |
British American Tobacco PLC | | | 81,410 | | | | 4,753,403 | | |
BT Group PLC | | | 1,505,607 | | | | 10,592,439 | | |
Burberry Group PLC | | | 171,885 | | | | 4,967,629 | | |
IMI PLC | | | 187,397 | | | | 3,995,413 | | |
InterContinental Hotels Group PLC | | | 155,822 | | | | 6,374,997 | | |
Johnson Matthey PLC | | | 114,395 | | | | 6,020,594 | | |
Legal & General Group PLC | | | 2,078,347 | | | | 8,968,198 | | |
London Stock Exchange Group PLC | | | 112,537 | | | | 4,308,760 | | |
Pearson PLC | | | 252,493 | | | | 5,535,323 | | |
Persimmon PLC | | | 291,314 | | | | 7,933,508 | | |
Common Stocks (continued)
Issuer | | Shares | | Value ($) | |
Prudential PLC | | | 459,883 | | | | 11,569,299 | | |
Rio Tinto PLC | | | 156,497 | | | | 7,712,128 | | |
Royal Dutch Shell PLC, Class A | | | 168,768 | | | | 5,518,504 | | |
Schroders PLC | | | 61,749 | | | | 2,931,436 | | |
Smith & Nephew PLC | | | 330,525 | | | | 6,051,936 | | |
St. James's Place PLC | | | 419,511 | | | | 6,139,839 | | |
Unilever PLC | | | 232,519 | | | | 10,288,213 | | |
Wolseley PLC | | | 91,815 | | | | 5,628,839 | | |
Total | | | | | 138,754,607 | | |
Total Common Stocks
(Cost: $555,004,143) | | | | | 670,482,442 | | |
Preferred Stocks 0.7% | |
GERMANY 0.7% | |
Volkswagen AG | | | 18,359 | | | | 4,632,816 | | |
Total Preferred Stocks
(Cost: $4,623,050) | | | | | 4,632,816 | | |
Exchange-Traded Funds 1.0% | |
JAPAN 1.0% | |
| | | Shares | | Value ($) | |
WisdomTree Japan Hedged Equity Fund | | | 133,570 | | | | 7,195,416 | | |
Total Exchange-Traded Funds
(Cost: $6,875,988) | | | | | 7,195,416 | | |
Money Market Funds 1.7% | |
Columbia Short-Term Cash Fund,
0.118%(d)(e) | | | 11,700,610 | | | | 11,700,610 | | |
Total Money Market Funds
(Cost: $11,700,610) | | | | | 11,700,610 | | |
Total Investments
(Cost: $578,203,791) | | | | | 694,011,284 | | |
Other Assets & Liabilities, Net | | | | | (3,336,259 | ) | |
Net Assets | | | | | 690,675,025 | | |
The accompanying Notes to Financial Statements are an integral part of this statement.
Annual Report 2015
12
COLUMBIA MULTI-ADVISOR INTERNATIONAL EQUITY FUND
PORTFOLIO OF INVESTMENTS (continued)
February 28, 2015
Investments in Derivatives
Forward Foreign Currency Exchange Contracts Open at February 28, 2015
Counterparty | | Exchange Date | | Currency to
be Delivered | | Currency to
be Received | | Unrealized
Appreciation ($) | | Unrealized
Depreciation ($) | |
Barclays Capital
| | 3/31/2015
| | | 4,288,000
CAD | | | | 3,447,297
USD | | | | 18,631
| | | | —
| | |
Barclays Capital
| | 3/31/2015
| | | 47,201,000
DKK | | | | 7,196,751
USD | | | | 110,050
| | | | —
| | |
Barclays Capital
| | 3/31/2015
| | | 13,840,000
EUR | | | | 15,668,040
USD | | | | 174,706
| | | | —
| | |
Barclays Capital
| | 3/31/2015
| | | 7,809,000
GBP | | | | 11,868,783
USD | | | | —
| | | | (184,438
| ) | |
Barclays Capital
| | 3/31/2015
| | | 10,433,000
NOK | | | | 1,380,962
USD | | | | 21,200
| | | | —
| | |
Barclays Capital
| | 3/31/2015
| | | 8,177,868
USD | | | | 10,574,000
AUD | | | | 69,262
| | | | —
| | |
Barclays Capital
| | 3/31/2015
| | | 15,131,043
USD | | | | 13,942,000
CHF | | | | —
| | | | (487,899
| ) | |
Barclays Capital
| | 3/31/2015
| | | 3,761,358
USD | | | | 14,708,000
ILS | | | | —
| | | | (68,821
| ) | |
Barclays Capital
| | 3/31/2015
| | | 8,163,867
USD | | | | 981,438,000
JPY | | | | 43,844
| | | | —
| | |
Barclays Capital
| | 3/31/2015
| | | 2,068,427
USD | | | | 2,751,000
NZD | | | | 5,932
| | | | —
| | |
Barclays Capital
| | 3/31/2015
| | | 11,032,382
USD | | | | 91,487,000
SEK | | | | —
| | | | (55,280
| ) | |
Total | | | | | | | | | 443,625 | | | | (796,438 | ) | |
Futures Contracts Outstanding at February 28, 2015
At February 28, 2015, cash totaling $158,400 was pledged as collateral to cover initial margin requirements on open futures contracts.
Long Futures Contracts Outstanding
Contract Description | | Number of
Contracts | | Trading
Currency | | Notional
Market
Value ($) | | Expiration
Date | | Unrealized
Appreciation ($) | | Unrealized
Depreciation ($) | |
EMINI MSCI EAFE INDEX | | | 48 | | | USD | | | | | 4,500,720 | | | 03/2015 | | | 320,772 | | | | — | | |
Notes to Portfolio of Investments
(a) Non-income producing.
(b) Identifies securities considered by the Investment Manager to be illiquid as to their marketability. The aggregate value of such securities at February 28, 2015 was $8, which represents less than 0.01% of net assets. Information concerning such security holdings at February 28, 2015 is as follows:
Security Description | | Acquisition Dates | | Cost ($) | |
BGP Holdings PLC | | 02/04/2009 - 05/14/2009 | | | — | | |
China Milk Products Group Ltd. | | 09/11/2006 - 07/02/2009 | | | 4,479,619 | | |
(c) Represents fair value as determined in good faith under procedures approved by the Board of Trustees. At February 28, 2015, the value of these securities amounted to $8, which represents less than 0.01% of net assets.
The accompanying Notes to Financial Statements are an integral part of this statement.
Annual Report 2015
13
COLUMBIA MULTI-ADVISOR INTERNATIONAL EQUITY FUND
PORTFOLIO OF INVESTMENTS (continued)
February 28, 2015
Notes to Portfolio of Investments (continued)
(d) The rate shown is the seven-day current annualized yield at February 28, 2015.
(e) As defined in the Investment Company Act of 1940, an affiliated company is one in which the Fund owns 5% or more of the company's outstanding voting securities, or a company which is under common ownership or control with the Fund. Holdings and transactions in these affiliated companies during the year ended February 28, 2015, are as follows:
Issuer | | Beginning
Cost ($) | | Purchase
Cost ($) | | Proceeds
From Sales ($) | | Ending
Cost ($) | | Dividends —
Affiliated
Issuers ($) | | Value ($) | |
Columbia Short-Term Cash Fund | | | 12,324,034 | | | | 300,848,350 | | | | (301,471,774 | ) | | | 11,700,610 | | | | 14,543 | | | | 11,700,610 | | |
Abbreviation Legend
ADR American Depositary Receipt
Currency Legend
AUD Australian Dollar
CAD Canadian Dollar
CHF Swiss Franc
DKK Danish Krone
EUR Euro
GBP British Pound
ILS Israeli Shekel
JPY Japanese Yen
NOK Norwegian Krone
NZD New Zealand Dollar
SEK Swedish Krona
USD US Dollar
Fair Value Measurements
Generally accepted accounting principles (GAAP) require disclosure regarding the inputs and valuation techniques used to measure fair value and any changes in valuation inputs or techniques. In addition, investments shall be disclosed by major category.
The Fund categorizes its fair value measurements according to a three-level hierarchy that maximizes the use of observable inputs and minimizes the use of unobservable inputs by prioritizing that the most observable input be used when available. Observable inputs are those that market participants would use in pricing an investment based on market data obtained from sources independent of the reporting entity. Unobservable inputs are those that reflect the Fund's assumptions about the information market participants would use in pricing an investment. An investment's level within the fair value hierarchy is based on the lowest level of any input that is deemed significant to the asset or liability's fair value measurement. The input levels are not necessarily an indication of the risk or liquidity associated with investments at that level. For example, certain U.S. government securities are generally high quality and liquid, however, they are reflected as Level 2 because the inputs used to determine fair value may not always be quoted prices in an active market.
Fair value inputs are summarized in the three broad levels listed below:
> Level 1 — Valuations based on quoted prices for investments in active markets that the Fund has the ability to access at the measurement date (including NAV for open-end mutual funds). Valuation adjustments are not applied to Level 1 investments.
> Level 2 — Valuations based on other significant observable inputs (including quoted prices for similar securities, interest rates, prepayment speeds, credit risks, etc.).
> Level 3 — Valuations based on significant unobservable inputs (including the Fund's own assumptions and judgment in determining the fair value of investments).
The accompanying Notes to Financial Statements are an integral part of this statement.
Annual Report 2015
14
COLUMBIA MULTI-ADVISOR INTERNATIONAL EQUITY FUND
PORTFOLIO OF INVESTMENTS (continued)
February 28, 2015
Fair Value Measurements (continued)
Inputs that are used in determining fair value of an investment may include price information, credit data, volatility statistics, and other factors. These inputs can be either observable or unobservable. The availability of observable inputs can vary between investments, and is affected by various factors such as the type of investment, and the volume and level of activity for that investment or similar investments in the marketplace. The inputs will be considered by the Investment Manager, along with any other relevant factors in the calculation of an investment's fair value. The Fund uses prices and inputs that are current as of the measurement date, which may include periods of market dislocations. During these periods, the availability of prices and inputs may be reduced for many investments. This condition could cause an investment to be reclassified between the various levels within the hierarchy.
Foreign equity securities actively traded in markets where there is a significant delay in the local close relative to the New York Stock Exchange (NYSE) are classified as Level 2. The values of these securities may include an adjustment to reflect the impact of significant market movements following the close of local trading, as described in Note 2 to the financial statements — Security Valuation.
Investments falling into the Level 3 category are primarily supported by quoted prices from brokers and dealers participating in the market for those investments. However, these may be classified as Level 3 investments due to lack of market transparency and corroboration to support these quoted prices. Additionally, valuation models may be used as the pricing source for any remaining investments classified as Level 3. These models may rely on one or more significant unobservable inputs and/or significant assumptions by the Investment Manager. Inputs used in valuations may include, but are not limited to, financial statement analysis, capital account balances, discount rates and estimated cash flows, and comparable company data.
Under the direction of the Fund's Board of Trustees (the Board), the Investment Manager's Valuation Committee (the Committee) is responsible for overseeing the valuation procedures approved by the Board. The Committee consists of voting and non-voting members from various groups within the Investment Manager's organization, including operations and accounting, trading and investments, compliance, risk management and legal.
The Committee meets at least monthly to review and approve valuation matters, which may include a description of specific valuation determinations, data regarding pricing information received from approved pricing vendors and brokers and the results of Board-approved valuation control policies and procedures (the Policies). The Policies address, among other things, instances when market quotations are or are not readily available, including recommendations of third party pricing vendors and a determination of appropriate pricing methodologies; events that require specific valuation determinations and assessment of fair value techniques; securities with a potential for stale pricing, including those that are illiquid, restricted, or in default; and the effectiveness of third party pricing vendors, including periodic reviews of vendors. The Committee meets more frequently, as needed, to discuss additional valuation matters, which may include the need to review back-testing results, review time-sensitive information or approve related valuation actions. The Committee reports to the Board, with members of the Committee meeting with the Board at each of its regularly scheduled meetings to discuss valuation matters and actions during the period, similar to those described earlier.
For investments categorized as Level 3, the Committee monitors information similar to that described above, which may include: (i) data specific to the issuer or comparable issuers, (ii) general market or specific sector news and (iii) quoted prices and specific or similar security transactions. The Committee considers this data and any changes from prior periods in order to assess the reasonableness of observable and unobservable inputs, any assumptions or internal models used to value those securities and changes in fair value. This data is also used to corroborate, when available, information received from approved pricing vendors and brokers. Various factors impact the frequency of monitoring this information (which may occur as often as daily). However, the Committee may determine that changes to inputs, assumptions and models are not required as a result of the monitoring procedures performed.
The accompanying Notes to Financial Statements are an integral part of this statement.
Annual Report 2015
15
COLUMBIA MULTI-ADVISOR INTERNATIONAL EQUITY FUND
PORTFOLIO OF INVESTMENTS (continued)
February 28, 2015
Fair Value Measurements (continued)
The following table is a summary of the inputs used to value the Fund's investments at February 28, 2015:
Description | | Level 1
Quoted Prices in Active
Markets for Identical
Assets ($) | | Level 2
Other Significant
Observable Inputs ($) | | Level 3
Significant
Unobservable Inputs ($) | | Total ($) | |
Equity Securities | |
Common Stocks | |
Consumer Discretionary | | | — | | | | 116,833,557 | | | | — | | | | 116,833,557 | | |
Consumer Staples | | | — | | | | 49,544,364 | | | | 5 | | | | 49,544,369 | | |
Energy | | | — | | | | 12,483,945 | | | | — | | | | 12,483,945 | | |
Financials | | | — | | | | 172,623,442 | | | | 3 | | | | 172,623,445 | | |
Health Care | | | — | | | | 91,866,258 | | | | — | | | | 91,866,258 | | |
Industrials | | | — | | | | 103,978,298 | | | | — | | | | 103,978,298 | | |
Information Technology | | | 2,001,913 | | | | 45,246,816 | | | | — | | | | 47,248,729 | | |
Materials | | | — | | | | 39,382,339 | | | | — | | | | 39,382,339 | | |
Telecommunication Services | | | — | | | | 30,549,294 | | | | — | | | | 30,549,294 | | |
Utilities | | | — | | | | 5,972,208 | | | | — | | | | 5,972,208 | | |
Preferred Stocks | |
Consumer Discretionary | | | — | | | | 4,632,816 | | | | — | | | | 4,632,816 | | |
Exchange-Traded Funds | | | 7,195,416 | | | | — | | | | — | | | | 7,195,416 | | |
Total Equity Securities | | | 9,197,329 | | | | 673,113,337 | | | | 8 | | | | 682,310,674 | | |
Mutual Funds | |
Money Market Funds | | | 11,700,610 | | | | — | | | | — | | | | 11,700,610 | | |
Total Mutual Funds | | | 11,700,610 | | | | — | | | | — | | | | 11,700,610 | | |
Investments in Securities | | | 20,897,939 | | | | 673,113,337 | | | | 8 | | | | 694,011,284 | | |
Derivatives | |
Assets | |
Forward Foreign Currency Exchange
Contracts | | | — | | | | 443,625 | | | | — | | | | 443,625 | | |
Futures Contracts | | | 320,772 | | | | — | | | | — | | | | 320,772 | | |
Liabilities | |
Forward Foreign Currency Exchange
Contracts | | | — | | | | (796,438 | ) | | | — | | | | (796,438 | ) | |
Total | | | 21,218,711 | | | | 672,760,524 | | | | 8 | | | | 693,979,243 | | |
See the Portfolio of Investments for all investment classifications not indicated in the table.
The Fund's assets assigned to the Level 2 input category are generally valued using the market approach, in which a security's value is determined through reference to prices and information from market transactions for similar or identical assets. These assets include certain foreign securities for which a third party statistical pricing service may be employed for purposes of fair market valuation. The model utilized by such third party statistical pricing service takes into account a security's correlation to available market data including, but not limited to, intraday index, ADR, and ETF movements.
There were no transfers of financial assets between levels during the period.
Derivative instruments are valued at unrealized appreciation (depreciation).
The accompanying Notes to Financial Statements are an integral part of this statement.
Annual Report 2015
16
COLUMBIA MULTI-ADVISOR INTERNATIONAL EQUITY FUND
PORTFOLIO OF INVESTMENTS (continued)
February 28, 2015
Fair Value Measurements (continued)
The Fund does not hold any significant investments with unobservable inputs which are categorized as Level 3.
The Fund's assets assigned to the Level 3 category are valued utilizing the valuation technique deemed the most appropriate in the circumstances. Certain common stocks classified as Level 3 securities are valued using the market approach. To determine fair value for these securities, management considered various factors which may have included, but were not limited to, the halt price of the security, the movement in observed market prices for other securities from the issuer, the movement in certain foreign or domestic market indices, and the position of the security within the respective company's capital structure. Significant increases (decreases) to any of these inputs would result in a significantly lower (higher) fair value measurement.
The accompanying Notes to Financial Statements are an integral part of this statement.
Annual Report 2015
17
COLUMBIA MULTI-ADVISOR INTERNATIONAL EQUITY FUND
STATEMENT OF ASSETS AND LIABILITIES
February 28, 2015
Assets | |
Investments, at value | |
Unaffiliated issuers (identified cost $566,503,181) | | $ | 682,310,674 | | |
Affiliated issuers (identified cost $11,700,610) | | | 11,700,610 | | |
Total investments (identified cost $578,203,791) | | | 694,011,284 | | |
Foreign currency (identified cost $6,134) | | | 6,042 | | |
Margin deposits | | | 158,400 | | |
Unrealized appreciation on forward foreign currency exchange contracts | | | 443,625 | | |
Receivable for: | |
Investments sold | | | 182,029 | | |
Capital shares sold | | | 258,784 | | |
Dividends | | | 934,246 | | |
Reclaims | | | 1,347,238 | | |
Prepaid expenses | | | 1,990 | | |
Trustees' deferred compensation plan | | | 97,130 | | |
Total assets | | | 697,440,768 | | |
Liabilities | |
Disbursements in excess of cash | | | 79,432 | | |
Unrealized depreciation on forward foreign currency exchange contracts | | | 796,438 | | |
Payable for: | |
Investments purchased | | | 4,450,927 | | |
Capital shares purchased | | | 909,937 | | |
Variation margin | | | 3,600 | | |
Investment management fees | | | 14,693 | | |
Distribution and/or service fees | | | 3,674 | | |
Transfer agent fees | | | 112,313 | | |
Administration fees | | | 1,486 | | |
Plan administration fees | | | 20 | | |
Compensation of board members | | | 172,660 | | |
Other expenses | | | 122,648 | | |
Trustees' deferred compensation plan | | | 97,130 | | |
Other liabilities | | | 785 | | |
Total liabilities | | | 6,765,743 | | |
Net assets applicable to outstanding capital stock | | $ | 690,675,025 | | |
The accompanying Notes to Financial Statements are an integral part of this statement.
Annual Report 2015
18
COLUMBIA MULTI-ADVISOR INTERNATIONAL EQUITY FUND
STATEMENT OF ASSETS AND LIABILITIES (continued)
February 28, 2015
Represented by | |
Paid-in capital | | $ | 1,368,261,562 | | |
Excess of distributions over net investment income | | | (3,529,736 | ) | |
Accumulated net realized loss | | | (789,699,971 | ) | |
Unrealized appreciation (depreciation) on: | |
Investments | | | 115,807,493 | | |
Foreign currency translations | | | (132,282 | ) | |
Forward foreign currency exchange contracts | | | (352,813 | ) | |
Futures contracts | | | 320,772 | | |
Total — representing net assets applicable to outstanding capital stock | | $ | 690,675,025 | | |
Class A | |
Net assets | | $ | 274,992,591 | | |
Shares outstanding | | | 20,082,130 | | |
Net asset value per share | | $ | 13.69 | | |
Maximum offering price per share(a) | | $ | 14.53 | | |
Class B | |
Net assets | | $ | 2,296,002 | | |
Shares outstanding | | | 187,678 | | |
Net asset value per share | | $ | 12.23 | | |
Class C | |
Net assets | | $ | 11,042,321 | | |
Shares outstanding | | | 913,773 | | |
Net asset value per share | | $ | 12.08 | | |
Class I | |
Net assets | | $ | 2,756 | | |
Shares outstanding | | | 196 | | |
Net asset value per share(b) | | $ | 14.03 | | |
Class K | |
Net assets | | $ | 102,799 | | |
Shares outstanding | | | 7,372 | | |
Net asset value per share(b) | | $ | 13.95 | | |
Class R | |
Net assets | | $ | 1,563,445 | | |
Shares outstanding | | | 114,766 | | |
Net asset value per share | | $ | 13.62 | | |
Class R4 | |
Net assets | | $ | 2,522 | | |
Shares outstanding | | | 180 | | |
Net asset value per share(b) | | $ | 14.04 | | |
The accompanying Notes to Financial Statements are an integral part of this statement.
Annual Report 2015
19
COLUMBIA MULTI-ADVISOR INTERNATIONAL EQUITY FUND
STATEMENT OF ASSETS AND LIABILITIES (continued)
February 28, 2015
Class R5 | |
Net assets | | $ | 59,467 | | |
Shares outstanding | | | 4,222 | | |
Net asset value per share(b) | | $ | 14.08 | | |
Class W | |
Net assets | | $ | 205,714,784 | | |
Shares outstanding | | | 15,019,158 | | |
Net asset value per share | | $ | 13.70 | | |
Class Y | |
Net assets | | $ | 15,568,394 | | |
Shares outstanding | | | 1,108,509 | | |
Net asset value per share | | $ | 14.04 | | |
Class Z | |
Net assets | | $ | 179,329,944 | | |
Shares outstanding | | | 12,848,118 | | |
Net asset value per share | | $ | 13.96 | | |
(a) The maximum offering price per share is calculated by dividing the net asset value per share by 1.0 minus the maximum sales charge of 5.75%.
(b) Net asset value per share rounds to this amount due to fractional shares outstanding.
The accompanying Notes to Financial Statements are an integral part of this statement.
Annual Report 2015
20
COLUMBIA MULTI-ADVISOR INTERNATIONAL EQUITY FUND
STATEMENT OF OPERATIONS
Year Ended February 28, 2015
Net investment income | |
Income: | |
Dividends — unaffiliated issuers | | $ | 16,321,735 | | |
Dividends — affiliated issuers | | | 14,543 | | |
Interest | | | 7,885 | | |
Foreign taxes withheld | | | (1,410,634 | ) | |
Total income | | | 14,933,529 | | |
Expenses: | |
Investment management fees | | | 4,803,237 | | |
Distribution and/or service fees | |
Class A | | | 714,511 | | |
Class B | | | 31,351 | | |
Class C | | | 112,490 | | |
Class R | | | 7,400 | | |
Class W | | | 248,567 | | |
Transfer agent fees | |
Class A | | | 808,530 | | |
Class B | | | 8,833 | | |
Class C | | | 31,816 | | |
Class K | | | 50 | | |
Class R | | | 4,184 | | |
Class R4 | | | 10 | | |
Class R5 | | | 19 | | |
Class W | | | 287,186 | | |
Class Z | | | 560,312 | | |
Administration fees | | | 485,890 | | |
Plan administration fees | |
Class K | | | 251 | | |
Compensation of board members | | | 30,963 | | |
Custodian fees | | | 131,925 | | |
Printing and postage fees | | | 147,823 | | |
Registration fees | | | 123,641 | | |
Professional fees | | | 114,946 | | |
Other | | | 19,962 | | |
Total expenses | | | 8,673,897 | | |
Fees waived or expenses reimbursed by Investment Manager and its affiliates | | | (69,562 | ) | |
Expense reductions | | | (20,202 | ) | |
Total net expenses | | | 8,584,133 | | |
Net investment income | | | 6,349,396 | | |
Realized and unrealized gain (loss) — net | |
Net realized gain (loss) on: | |
Investments | | | 57,198,995 | | |
Foreign currency translations | | | (596,216 | ) | |
Forward foreign currency exchange contracts | | | (2,597,131 | ) | |
Futures contracts | | | 182,154 | | |
Net realized gain | | | 54,187,802 | | |
Net change in unrealized appreciation (depreciation) on: | |
Investments | | | (64,665,935 | ) | |
Foreign currency translations | | | (158,556 | ) | |
Forward foreign currency exchange contracts | | | (1,446,309 | ) | |
Futures contracts | | | (271,742 | ) | |
Net change in unrealized depreciation | | | (66,542,542 | ) | |
Net realized and unrealized loss | | | (12,354,740 | ) | |
Net decrease in net assets from operations | | $ | (6,005,344 | ) | |
The accompanying Notes to Financial Statements are an integral part of this statement.
Annual Report 2015
21
COLUMBIA MULTI-ADVISOR INTERNATIONAL EQUITY FUND
STATEMENT OF CHANGES IN NET ASSETS
| | | Year Ended
February 28,
2015 | | Year Ended
February 28,
2014 | |
Operations | |
Net investment income | | $ | 6,349,396 | | | $ | 11,257,721 | | |
Net realized gain | | | 54,187,802 | | | | 125,104,946 | | |
Net change in unrealized depreciation | | | (66,542,542 | ) | | | (13,137,027 | ) | |
Net increase (decrease) in net assets resulting from operations | | | (6,005,344 | ) | | | 123,225,640 | | |
Decrease in net assets from capital stock activity | | | (58,818,743 | ) | | | (313,880,792 | ) | |
Proceeds from regulatory settlements (Note 6) | | | 633,636 | | | | — | | |
Total decrease in net assets | | | (64,190,451 | ) | | | (190,655,152 | ) | |
Net assets at beginning of year | | | 754,865,476 | | | | 945,520,628 | | |
Net assets at end of year | | $ | 690,675,025 | | | $ | 754,865,476 | | |
Excess of distributions over net investment income | | $ | (3,529,736 | ) | | $ | (11,596,514 | ) | |
The accompanying Notes to Financial Statements are an integral part of this statement.
Annual Report 2015
22
COLUMBIA MULTI-ADVISOR INTERNATIONAL EQUITY FUND
STATEMENT OF CHANGES IN NET ASSETS (continued)
| | | Year Ended February 28, 2015 | | Year Ended February 28, 2014 | |
| | | Shares | | Dollars ($) | | Shares | | Dollars ($) | |
Capital stock activity | |
Class A shares | |
Subscriptions(a) | | | 586,691 | | | | 7,782,084 | | | | 646,077 | | | | 8,234,862 | | |
Redemptions | | | (3,327,729 | ) | | | (44,322,491 | ) | | | (3,875,355 | ) | | | (49,195,352 | ) | |
Net decrease | | | (2,741,038 | ) | | | (36,540,407 | ) | | | (3,229,278 | ) | | | (40,960,490 | ) | |
Class B shares | |
Subscriptions | | | 2,838 | | | | 34,474 | | | | 6,253 | | | | 75,199 | | |
Redemptions(a) | | | (156,096 | ) | | | (1,846,235 | ) | | | (267,444 | ) | | | (3,061,752 | ) | |
Net decrease | | | (153,258 | ) | | | (1,811,761 | ) | | | (261,191 | ) | | | (2,986,553 | ) | |
Class C shares | |
Subscriptions | | | 65,342 | | | | 760,338 | | | | 57,315 | | | | 653,865 | | |
Redemptions | | | (169,333 | ) | | | (2,010,481 | ) | | | (211,168 | ) | | | (2,392,940 | ) | |
Net decrease | | | (103,991 | ) | | | (1,250,143 | ) | | | (153,853 | ) | | | (1,739,075 | ) | |
Class I shares | |
Subscriptions | | | — | | | | — | | | | 614,977 | | | | 7,738,494 | | |
Redemptions | | | (1,134 | ) | | | (15,898 | ) | | | (2,598,019 | ) | | | (32,648,086 | ) | |
Net decrease | | | (1,134 | ) | | | (15,898 | ) | | | (1,983,042 | ) | | | (24,909,592 | ) | |
Class K shares | |
Redemptions | | | (507 | ) | | | (7,101 | ) | | | (2,116 | ) | | | (27,822 | ) | |
Net decrease | | | (507 | ) | | | (7,101 | ) | | | (2,116 | ) | | | (27,822 | ) | |
Class R shares | |
Subscriptions | | | 40,197 | | | | 528,291 | | | | 24,953 | | | | 317,832 | | |
Redemptions | | | (43,395 | ) | | | (585,626 | ) | | | (46,260 | ) | | | (610,494 | ) | |
Net decrease | | | (3,198 | ) | | | (57,335 | ) | | | (21,307 | ) | | | (292,662 | ) | |
Class R4 shares | |
Subscriptions | | | — | | | | — | | | | 250 | | | | 3,400 | | |
Redemptions | | | (285 | ) | | | (4,033 | ) | | | — | | | | — | | |
Net increase (decrease) | | | (285 | ) | | | (4,033 | ) | | | 250 | | | | 3,400 | | |
Class R5 shares | |
Subscriptions | | | 6,031 | | | | 81,262 | | | | 793 | | | | 10,824 | | |
Redemptions | | | (2,817 | ) | | | (37,545 | ) | | | — | | | | — | | |
Net increase | | | 3,214 | | | | 43,717 | | | | 793 | | | | 10,824 | | |
Class W shares | |
Subscriptions | | | 11,495,335 | | | | 150,023,731 | | | | 8,591,377 | | | | 109,329,950 | | |
Redemptions | | | (8,468,053 | ) | | | (115,361,849 | ) | | | (19,068,106 | ) | | | (248,569,885 | ) | |
Net increase (decrease) | | | 3,027,282 | | | | 34,661,882 | | | | (10,476,729 | ) | | | (139,239,935 | ) | |
Class Y shares | |
Redemptions | | | (21 | ) | | | (300 | ) | | | (119,142 | ) | | | (1,500,000 | ) | |
Net decrease | | | (21 | ) | | | (300 | ) | | | (119,142 | ) | | | (1,500,000 | ) | |
The accompanying Notes to Financial Statements are an integral part of this statement.
Annual Report 2015
23
COLUMBIA MULTI-ADVISOR INTERNATIONAL EQUITY FUND
STATEMENT OF CHANGES IN NET ASSETS (continued)
| | | Year Ended February 28, 2015 | | Year Ended February 28, 2014 | |
| | | Shares | | Dollars ($) | | Shares | | Dollars ($) | |
Capital stock activity (continued) | |
Class Z shares | |
Subscriptions | | | 145,230 | | | | 1,972,107 | | | | 375,335 | | | | 4,867,671 | | |
Redemptions | | | (4,106,022 | ) | | | (55,809,471 | ) | | | (8,328,636 | ) | | | (107,106,558 | ) | |
Net decrease | | | (3,960,792 | ) | | | (53,837,364 | ) | | | (7,953,301 | ) | | | (102,238,887 | ) | |
Total net decrease | | | (3,933,728 | ) | | | (58,818,743 | ) | | | (24,198,916 | ) | | | (313,880,792 | ) | |
(a) Includes conversions of Class B shares to Class A shares, if any.
The accompanying Notes to Financial Statements are an integral part of this statement.
Annual Report 2015
24
COLUMBIA MULTI-ADVISOR INTERNATIONAL EQUITY FUND
The following tables are intended to help you understand the Fund's financial performance. Certain information reflects financial results for a single share of a class held for the periods shown. Per share net investment income (loss) amounts are calculated based on average shares outstanding during the period. Total return assumes reinvestment of all dividends and distributions, if any. Total return does not reflect payment of sales charges, if any. Total return and portfolio turnover are not annualized for periods of less than one year. The portfolio turnover rate is calculated without regard to purchase and sales transactions of short-term instruments and certain derivatives, if any. If such transactions were included, the Fund's portfolio turnover rate may be higher.
| | | Year Ended February 28, | | Year Ended
February 29, | | Year Ended
February 28, | |
Class A | | 2015 | | 2014 | | 2013 | | 2012 | | 2011 | |
Per share data | |
Net asset value, beginning of period | | $ | 13.88 | | | $ | 12.02 | | | $ | 11.68 | | | $ | 12.46 | | | $ | 10.68 | | |
Income from investment operations: | |
Net investment income | | | 0.12 | | | | 0.15 | | | | 0.17 | | | | 0.14 | | | | 0.14 | | |
Net realized and unrealized gain (loss) | | | (0.32 | ) | | | 1.71 | | | | 0.56 | | | | (0.94 | ) | | | 1.85 | | |
Total from investment operations | | | (0.20 | ) | | | 1.86 | | | | 0.73 | | | | (0.80 | ) | | | 1.99 | | |
Less distributions to shareholders: | |
Net investment income | | | — | | | | — | | | | (0.39 | ) | | | — | | | | (0.21 | ) | |
Total distributions to shareholders | | | — | | | | — | | | | (0.39 | ) | | | — | | | | (0.21 | ) | |
Proceeds from regulatory settlements | | | 0.01 | | | | — | | | | — | | | | 0.02 | | | | 0.00 | (a) | |
Net asset value, end of period | | $ | 13.69 | | | $ | 13.88 | | | $ | 12.02 | | | $ | 11.68 | | | $ | 12.46 | | |
Total return | | | (1.37 | %)(b) | | | 15.47 | % | | | 6.41 | % | | | (6.26 | %)(c) | | | 18.80 | % | |
Ratios to average net assets(d) | |
Total gross expenses | | | 1.49 | % | | | 1.42 | %(e) | | | 1.39 | %(e) | | | 1.36 | % | | | 1.33 | %(e) | |
Total net expenses(f) | | | 1.47 | %(g) | | | 1.42 | %(e)(g) | | | 1.38 | %(e)(g) | | | 1.32 | %(g) | | | 1.33 | %(e)(g) | |
Net investment income | | | 0.94 | % | | | 1.20 | % | | | 1.46 | % | | | 1.20 | % | | | 1.27 | % | |
Supplemental data | |
Net assets, end of period (in thousands) | | $ | 274,993 | | | $ | 316,823 | | | $ | 313,239 | | | $ | 356,708 | | | $ | 24,668 | | |
Portfolio turnover | | | 96 | % | | | 125 | % | | | 100 | % | | | 112 | % | | | 92 | % | |
Notes to Financial Highlights
(a) Rounds to zero.
(b) The Fund received proceeds from regulatory settlements. Had the Fund not received these proceeds, the total return would have been lower by 0.10%.
(c) The Fund received proceeds from regulatory settlements. Had the Fund not received these proceeds, the total return would have been lower by 0.19%.
(d) In addition to the fees and expenses that the Fund bears directly, the Fund indirectly bears a pro rata share of the fees and expenses of any other funds in which it invests. Such indirect expenses are not included in the Fund's reported expense ratios.
(e) Ratios include line of credit interest expense which is less than 0.01%.
(f) Total net expenses include the impact of certain fee waivers/expense reimbursements made by the Investment Manager and certain of its affiliates, if applicable.
(g) The benefits derived from expense reductions had an impact of less than 0.01%.
The accompanying Notes to Financial Statements are an integral part of this statement.
Annual Report 2015
25
COLUMBIA MULTI-ADVISOR INTERNATIONAL EQUITY FUND
FINANCIAL HIGHLIGHTS (continued)
| | | Year Ended February 28, | | Year Ended
February 29, | | Year Ended
February 28, | |
Class B | | 2015 | | 2014 | | 2013 | | 2012 | | 2011 | |
Per share data | |
Net asset value, beginning of period | | $ | 12.50 | | | $ | 10.90 | | | $ | 10.55 | | | $ | 11.34 | | | $ | 9.75 | | |
Income from investment operations: | |
Net investment income | | | 0.04 | | | | 0.06 | | | | 0.09 | | | | 0.06 | | | | 0.07 | | |
Net realized and unrealized gain (loss) | | | (0.32 | ) | | | 1.54 | | | | 0.49 | | | | (0.87 | ) | | | 1.66 | | |
Total from investment operations | | | (0.28 | ) | | | 1.60 | | | | 0.58 | | | | (0.81 | ) | | | 1.73 | | |
Less distributions to shareholders: | |
Net investment income | | | — | | | | — | | | | (0.23 | ) | | | — | | | | (0.14 | ) | |
Total distributions to shareholders | | | — | | | | — | | | | (0.23 | ) | | | — | | | | (0.14 | ) | |
Proceeds from regulatory settlements | | | 0.01 | | | | — | | | | — | | | | 0.02 | | | | 0.00 | (a) | |
Net asset value, end of period | | $ | 12.23 | | | $ | 12.50 | | | $ | 10.90 | | | $ | 10.55 | | | $ | 11.34 | | |
Total return | | | (2.16 | %)(b) | | | 14.68 | % | | | 5.59 | % | | | (6.97 | %)(c) | | | 17.88 | % | |
Ratios to average net assets(d) | |
Total gross expenses | | | 2.24 | % | | | 2.17 | %(e) | | | 2.13 | %(e) | | | 2.11 | % | | | 2.08 | %(e) | |
Total net expenses(f) | | | 2.22 | %(g) | | | 2.17 | %(e)(g) | | | 2.12 | %(e)(g) | | | 2.06 | %(g) | | | 2.08 | %(e)(g) | |
Net investment income | | | 0.33 | % | | | 0.52 | % | | | 0.91 | % | | | 0.62 | % | | | 0.70 | % | |
Supplemental data | |
Net assets, end of period (in thousands) | | $ | 2,296 | | | $ | 4,260 | | | $ | 6,566 | | | $ | 11,838 | | | $ | 784 | | |
Portfolio turnover | | | 96 | % | | | 125 | % | | | 100 | % | | | 112 | % | | | 92 | % | |
Notes to Financial Highlights
(a) Rounds to zero.
(b) The Fund received proceeds from regulatory settlements. Had the Fund not received these proceeds, the total return would have been lower by 0.10%.
(c) The Fund received proceeds from regulatory settlements. Had the Fund not received these proceeds, the total return would have been lower by 0.20%.
(d) In addition to the fees and expenses that the Fund bears directly, the Fund indirectly bears a pro rata share of the fees and expenses of any other funds in which it invests. Such indirect expenses are not included in the Fund's reported expense ratios.
(e) Ratios include line of credit interest expense which is less than 0.01%.
(f) Total net expenses include the impact of certain fee waivers/expense reimbursements made by the Investment Manager and certain of its affiliates, if applicable.
(g) The benefits derived from expense reductions had an impact of less than 0.01%.
The accompanying Notes to Financial Statements are an integral part of this statement.
Annual Report 2015
26
COLUMBIA MULTI-ADVISOR INTERNATIONAL EQUITY FUND
FINANCIAL HIGHLIGHTS (continued)
| | | Year Ended February 28, | | Year Ended
February 29, | | Year Ended
February 28, | |
Class C | | 2015 | | 2014 | | 2013 | | 2012 | | 2011 | |
Per share data | |
Net asset value, beginning of period | | $ | 12.34 | | | $ | 10.77 | | | $ | 10.42 | | | $ | 11.20 | | | $ | 9.63 | | |
Income from investment operations: | |
Net investment income | | | 0.02 | | | | 0.05 | | | | 0.07 | | | | 0.05 | | | | 0.07 | | |
Net realized and unrealized gain (loss) | | | (0.29 | ) | | | 1.52 | | | | 0.51 | | | | (0.85 | ) | | | 1.64 | | |
Total from investment operations | | | (0.27 | ) | | | 1.57 | | | | 0.58 | | | | (0.80 | ) | | | 1.71 | | |
Less distributions to shareholders: | |
Net investment income | | | — | | | | — | | | | (0.23 | ) | | | — | | | | (0.14 | ) | |
Total distributions to shareholders | | | — | | | | — | | | | (0.23 | ) | | | — | | | | (0.14 | ) | |
Proceeds from regulatory settlements | | | 0.01 | | | | — | | | | — | | | | 0.02 | | | | 0.00 | (a) | |
Net asset value, end of period | | $ | 12.08 | | | $ | 12.34 | | | $ | 10.77 | | | $ | 10.42 | | | $ | 11.20 | | |
Total return | | | (2.11 | %)(b) | | | 14.58 | % | | | 5.64 | % | | | (6.96 | %)(c) | | | 17.89 | % | |
Ratios to average net assets(d) | |
Total gross expenses | | | 2.24 | % | | | 2.17 | %(e) | | | 2.14 | %(e) | | | 2.10 | % | | | 2.08 | %(e) | |
Total net expenses(f) | | | 2.22 | %(g) | | | 2.17 | %(e)(g) | | | 2.13 | %(e)(g) | | | 2.07 | %(g) | | | 2.08 | %(e)(g) | |
Net investment income | | | 0.19 | % | | | 0.45 | % | | | 0.72 | % | | | 0.48 | % | | | 0.72 | % | |
Supplemental data | |
Net assets, end of period (in thousands) | | $ | 11,042 | | | $ | 12,562 | | | $ | 12,619 | | | $ | 15,058 | | | $ | 1,272 | | |
Portfolio turnover | | | 96 | % | | | 125 | % | | | 100 | % | | | 112 | % | | | 92 | % | |
Notes to Financial Highlights
(a) Rounds to zero.
(b) The Fund received proceeds from regulatory settlements. Had the Fund not received these proceeds, the total return would have been lower by 0.10%.
(c) The Fund received proceeds from regulatory settlements. Had the Fund not received these proceeds, the total return would have been lower by 0.19%.
(d) In addition to the fees and expenses that the Fund bears directly, the Fund indirectly bears a pro rata share of the fees and expenses of any other funds in which it invests. Such indirect expenses are not included in the Fund's reported expense ratios.
(e) Ratios include line of credit interest expense which is less than 0.01%.
(f) Total net expenses include the impact of certain fee waivers/expense reimbursements made by the Investment Manager and certain of its affiliates, if applicable.
(g) The benefits derived from expense reductions had an impact of less than 0.01%.
The accompanying Notes to Financial Statements are an integral part of this statement.
Annual Report 2015
27
COLUMBIA MULTI-ADVISOR INTERNATIONAL EQUITY FUND
FINANCIAL HIGHLIGHTS (continued)
| | | Year Ended February 28, | | Year Ended
February 29, | | Year Ended
February 28, | |
Class I | | 2015 | | 2014 | | 2013 | | 2012 | | 2011(a) | |
Per share data | |
Net asset value, beginning of period | | $ | 14.15 | | | $ | 12.20 | | | $ | 11.89 | | | $ | 12.62 | | | $ | 11.64 | | |
Income from investment operations: | |
Net investment income | | | 0.27 | | | | 0.30 | | | | 0.22 | | | | 0.22 | | | | 0.02 | | |
Net realized and unrealized gain (loss) | | | (0.40 | ) | | | 1.65 | | | | 0.58 | | | | (0.97 | ) | | | 1.21 | | |
Total from investment operations | | | (0.13 | ) | | | 1.95 | | | | 0.80 | | | | (0.75 | ) | | | 1.23 | | |
Less distributions to shareholders: | |
Net investment income | | | — | | | | — | | | | (0.49 | ) | | | — | | | | (0.25 | ) | |
Total distributions to shareholders | | | — | | | | — | | | | (0.49 | ) | | | — | | | | (0.25 | ) | |
Proceeds from regulatory settlements | | | 0.01 | | | | — | | | | — | | | | 0.02 | | | | 0.00 | (b) | |
Net asset value, end of period | | $ | 14.03 | | | $ | 14.15 | | | $ | 12.20 | | | $ | 11.89 | | | $ | 12.62 | | |
Total return | | | (0.85 | %)(c) | | | 15.98 | % | | | 6.96 | % | | | (5.78 | %)(d) | | | 10.69 | % | |
Ratios to average net assets(e) | |
Total gross expenses | | | 0.95 | % | | | 0.93 | %(f) | | | 0.93 | %(f) | | | 0.84 | % | | | 0.95 | %(f)(g) | |
Total net expenses(h) | | | 0.95 | % | | | 0.93 | %(f) | | | 0.93 | %(f) | | | 0.84 | % | | | 0.95 | %(f)(g)(i) | |
Net investment income | | | 1.98 | % | | | 2.38 | % | | | 1.90 | % | | | 1.87 | % | | | 0.32 | %(g) | |
Supplemental data | |
Net assets, end of period (in thousands) | | $ | 3 | | | $ | 19 | | | $ | 24,204 | | | $ | 78,467 | | | $ | 47,056 | | |
Portfolio turnover | | | 96 | % | | | 125 | % | | | 100 | % | | | 112 | % | | | 92 | % | |
Notes to Financial Highlights
(a) Based on operations from September 27, 2010 (commencement of operations) through the stated period end.
(b) Rounds to zero.
(c) The Fund received proceeds from regulatory settlements. Had the Fund not received these proceeds, the total return would have been lower by 0.10%.
(d) The Fund received proceeds from regulatory settlements. Had the Fund not received these proceeds, the total return would have been lower by 0.19%.
(e) In addition to the fees and expenses that the Fund bears directly, the Fund indirectly bears a pro rata share of the fees and expenses of any other funds in which it invests. Such indirect expenses are not included in the Fund's reported expense ratios.
(f) Ratios include line of credit interest expense which is less than 0.01%.
(g) Annualized.
(h) Total net expenses include the impact of certain fee waivers/expense reimbursements made by the Investment Manager and certain of its affiliates, if applicable.
(i) The benefits derived from expense reductions had an impact of less than 0.01%.
The accompanying Notes to Financial Statements are an integral part of this statement.
Annual Report 2015
28
COLUMBIA MULTI-ADVISOR INTERNATIONAL EQUITY FUND
FINANCIAL HIGHLIGHTS (continued)
| | | Year Ended February 28, | | Year Ended
February 29, | |
Class K | | 2015 | | 2014 | | 2013 | | 2012(a) | |
Per share data | |
Net asset value, beginning of period | | $ | 14.11 | | | $ | 12.20 | | | $ | 11.85 | | | $ | 12.54 | | |
Income from investment operations: | |
Net investment income | | | 0.15 | | | | 0.17 | | | | 0.18 | | | | 0.15 | | |
Net realized and unrealized gain (loss) | | | (0.32 | ) | | | 1.74 | | | | 0.58 | | | | (0.86 | ) | |
Total from investment operations | | | (0.17 | ) | | | 1.91 | | | | 0.76 | | | | (0.71 | ) | |
Less distributions to shareholders: | |
Net investment income | | | — | | | | — | | | | (0.41 | ) | | | — | | |
Total distributions to shareholders | | | — | | | | — | | | | (0.41 | ) | | | — | | |
Proceeds from regulatory settlements | | | 0.01 | | | | — | | | | — | | | | 0.02 | | |
Net asset value, end of period | | $ | 13.95 | | | $ | 14.11 | | | $ | 12.20 | | | $ | 11.85 | | |
Total return | | | (1.13 | %)(b) | | | 15.66 | % | | | 6.64 | % | | | (5.50 | %)(c) | |
Ratios to average net assets(d) | |
Total gross expenses | | | 1.25 | % | | | 1.24 | %(e) | | | 1.24 | %(e) | | | 1.21 | %(f) | |
Total net expenses(g) | | | 1.25 | % | | | 1.24 | %(e) | | | 1.24 | %(e) | | | 1.21 | %(f) | |
Net investment income | | | 1.12 | % | | | 1.32 | % | | | 1.61 | % | | | 1.33 | %(f) | |
Supplemental data | |
Net assets, end of period (in thousands) | | $ | 103 | | | $ | 111 | | | $ | 122 | | | $ | 135 | | |
Portfolio turnover | | | 96 | % | | | 125 | % | | | 100 | % | | | 112 | % | |
Notes to Financial Highlights
(a) Based on operations from March 7, 2011 (commencement of operations) through the stated period end.
(b) The Fund received proceeds from regulatory settlements. Had the Fund not received these proceeds, the total return would have been lower by 0.10%.
(c) The Fund received proceeds from regulatory settlements. Had the Fund not received these proceeds, the total return would have been lower by 0.19%.
(d) In addition to the fees and expenses that the Fund bears directly, the Fund indirectly bears a pro rata share of the fees and expenses of any other funds in which it invests. Such indirect expenses are not included in the Fund's reported expense ratios.
(e) Ratios include line of credit interest expense which is less than 0.01%.
(f) Annualized.
(g) Total net expenses include the impact of certain fee waivers/expense reimbursements made by the Investment Manager and certain of its affiliates, if applicable.
The accompanying Notes to Financial Statements are an integral part of this statement.
Annual Report 2015
29
COLUMBIA MULTI-ADVISOR INTERNATIONAL EQUITY FUND
FINANCIAL HIGHLIGHTS (continued)
| | | Year Ended February 28, | | Year Ended
February 29, | | Year Ended
February 28, | |
Class R | | 2015 | | 2014 | | 2013 | | 2012 | | 2011 | |
Per share data | |
Net asset value, beginning of period | | $ | 13.84 | | | $ | 12.01 | | | $ | 11.64 | | | $ | 12.45 | | | $ | 10.68 | | |
Income from investment operations: | |
Net investment income | | | 0.10 | | | | 0.11 | | | | 0.14 | | | | 0.11 | | | | 0.13 | | |
Net realized and unrealized gain (loss) | | | (0.33 | ) | | | 1.72 | | | | 0.57 | | | | (0.94 | ) | | | 1.83 | | |
Total from investment operations | | | (0.23 | ) | | | 1.83 | | | | 0.71 | | | | (0.83 | ) | | | 1.96 | | |
Less distributions to shareholders: | |
Net investment income | | | — | | | | — | | | | (0.34 | ) | | | — | | | | (0.19 | ) | |
Total distributions to shareholders | | | — | | | | — | | | | (0.34 | ) | | | — | | | | (0.19 | ) | |
Proceeds from regulatory settlements | | | 0.01 | | | | — | | | | — | | | | 0.02 | | | | 0.00 | (a) | |
Net asset value, end of period | | $ | 13.62 | | | $ | 13.84 | | | $ | 12.01 | | | $ | 11.64 | | | $ | 12.45 | | |
Total return | | | (1.59 | %)(b) | | | 15.24 | % | | | 6.20 | % | | | (6.51 | %)(c) | | | 18.47 | % | |
Ratios to average net assets(d) | |
Total gross expenses | | | 1.74 | % | | | 1.67 | %(e) | | | 1.64 | %(e) | | | 1.62 | % | | | 1.58 | %(e) | |
Total net expenses(f) | | | 1.72 | %(g) | | | 1.67 | %(e)(g) | | | 1.63 | %(e)(g) | | | 1.57 | %(g) | | | 1.58 | %(e)(g) | |
Net investment income | | | 0.72 | % | | | 0.87 | % | | | 1.22 | % | | | 0.98 | % | | | 1.13 | % | |
Supplemental data | |
Net assets, end of period (in thousands) | | $ | 1,563 | | | $ | 1,632 | | | $ | 1,673 | | | $ | 1,899 | | | $ | 287 | | |
Portfolio turnover | | | 96 | % | | | 125 | % | | | 100 | % | | | 112 | % | | | 92 | % | |
Notes to Financial Highlights
(a) Rounds to zero.
(b) The Fund received proceeds from regulatory settlements. Had the Fund not received these proceeds, the total return would have been lower by 0.10%.
(c) The Fund received proceeds from regulatory settlements. Had the Fund not received these proceeds, the total return would have been lower by 0.19%.
(d) In addition to the fees and expenses that the Fund bears directly, the Fund indirectly bears a pro rata share of the fees and expenses of any other funds in which it invests. Such indirect expenses are not included in the Fund's reported expense ratios.
(e) Ratios include line of credit interest expense which is less than 0.01%.
(f) Total net expenses include the impact of certain fee waivers/expense reimbursements made by the Investment Manager and certain of its affiliates, if applicable.
(g) The benefits derived from expense reductions had an impact of less than 0.01%.
The accompanying Notes to Financial Statements are an integral part of this statement.
Annual Report 2015
30
COLUMBIA MULTI-ADVISOR INTERNATIONAL EQUITY FUND
FINANCIAL HIGHLIGHTS (continued)
| | | Year Ended February 28, | |
Class R4 | | 2015 | | 2014 | | 2013(a) | |
Per share data | |
Net asset value, beginning of period | | $ | 14.20 | | | $ | 12.27 | | | $ | 11.62 | | |
Income from investment operations: | |
Net investment income | | | 0.24 | | | | 0.18 | | | | 0.02 | | |
Net realized and unrealized gain (loss) | | | (0.41 | ) | | | 1.75 | | | | 0.92 | | |
Total from investment operations | | | (0.17 | ) | | | 1.93 | | | | 0.94 | | |
Less distributions to shareholders: | |
Net investment income | | | — | | | | — | | | | (0.29 | ) | |
Total distributions to shareholders | | | — | | | | — | | | | (0.29 | ) | |
Proceeds from regulatory settlements | | | 0.01 | | | | — | | | | — | | |
Net asset value, end of period | | $ | 14.04 | | | $ | 14.20 | | | $ | 12.27 | | |
Total return | | | (1.13 | %)(b) | | | 15.73 | % | | | 8.17 | % | |
Ratios to average net assets(c) | |
Total gross expenses | | | 1.25 | % | | | 1.19 | %(d) | | | 1.25 | %(e) | |
Total net expenses(f) | | | 1.21 | %(g) | | | 1.19 | %(d)(h) | | | 1.25 | %(e) | |
Net investment income | | | 1.77 | % | | | 1.35 | % | | | 0.55 | %(e) | |
Supplemental data | |
Net assets, end of period (in thousands) | | $ | 3 | | | $ | 7 | | | $ | 3 | | |
Portfolio turnover | | | 96 | % | | | 125 | % | | | 100 | % | |
Notes to Financial Highlights
(a) Based on operations from November 8, 2012 (commencement of operations) through the stated period end.
(b) The Fund received proceeds from regulatory settlements. Had the Fund not received these proceeds, the total return would have been lower by 0.10%.
(c) In addition to the fees and expenses that the Fund bears directly, the Fund indirectly bears a pro rata share of the fees and expenses of any other funds in which it invests. Such indirect expenses are not included in the Fund's reported expense ratios.
(d) Ratios include line of credit interest expense which is less than 0.01%.
(e) Annualized.
(f) Total net expenses include the impact of certain fee waivers/expense reimbursements made by the Investment Manager and certain of its affiliates, if applicable.
(g) The benefits derived from expense reductions had an impact of 0.01%.
(h) The benefits derived from expense reductions had an impact of less than 0.01%.
The accompanying Notes to Financial Statements are an integral part of this statement.
Annual Report 2015
31
COLUMBIA MULTI-ADVISOR INTERNATIONAL EQUITY FUND
FINANCIAL HIGHLIGHTS (continued)
| | | Year Ended February 28, | |
Class R5 | | 2015 | | 2014 | | 2013(a) | |
Per share data | |
Net asset value, beginning of period | | $ | 14.21 | | | $ | 12.26 | | | $ | 11.62 | | |
Income from investment operations: | |
Net investment income | | | 0.12 | | | | 0.32 | | | | 0.03 | | |
Net realized and unrealized gain (loss) | | | (0.26 | ) | | | 1.63 | | | | 0.92 | | |
Total from investment operations | | | (0.14 | ) | | | 1.95 | | | | 0.95 | | |
Less distributions to shareholders: | |
Net investment income | | | — | | | | — | | | | (0.31 | ) | |
Total distributions to shareholders | | | — | | | | — | | | | (0.31 | ) | |
Proceeds from regulatory settlements | | | 0.01 | | | | — | | | | — | | |
Net asset value, end of period | | $ | 14.08 | | | $ | 14.21 | | | $ | 12.26 | | |
Total return | | | (0.91 | %)(b) | | | 15.91 | % | | | 8.20 | % | |
Ratios to average net assets(c) | |
Total gross expenses | | | 1.01 | % | | | 1.04 | %(d) | | | 1.05 | %(e) | |
Total net expenses(f) | | | 1.01 | % | | | 1.04 | %(d) | | | 1.05 | %(e) | |
Net investment income | | | 0.86 | % | | | 2.45 | % | | | 0.75 | %(e) | |
Supplemental data | |
Net assets, end of period (in thousands) | | $ | 59 | | | $ | 14 | | | $ | 3 | | |
Portfolio turnover | | | 96 | % | | | 125 | % | | | 100 | % | |
Notes to Financial Highlights
(a) Based on operations from November 8, 2012 (commencement of operations) through the stated period end.
(b) The Fund received proceeds from regulatory settlements. Had the Fund not received these proceeds, the total return would have been lower by 0.10%.
(c) In addition to the fees and expenses that the Fund bears directly, the Fund indirectly bears a pro rata share of the fees and expenses of any other funds in which it invests. Such indirect expenses are not included in the Fund's reported expense ratios.
(d) Ratios include line of credit interest expense which is less than 0.01%.
(e) Annualized.
(f) Total net expenses include the impact of certain fee waivers/expense reimbursements made by the Investment Manager and certain of its affiliates, if applicable.
The accompanying Notes to Financial Statements are an integral part of this statement.
Annual Report 2015
32
COLUMBIA MULTI-ADVISOR INTERNATIONAL EQUITY FUND
FINANCIAL HIGHLIGHTS (continued)
| | | Year Ended February 28, | | Year Ended
February 29, | | Year Ended
February 28, | |
Class W | | 2015 | | 2014 | | 2013 | | 2012 | | 2011(a) | |
Per share data | |
Net asset value, beginning of period | | $ | 13.88 | | | $ | 12.02 | | | $ | 11.68 | | | $ | 12.46 | | | $ | 11.48 | | |
Income from investment operations: | |
Net investment income | | | 0.13 | | | | 0.13 | | | | 0.16 | | | | 0.12 | | | | 0.02 | | |
Net realized and unrealized gain (loss) | | | (0.32 | ) | | | 1.73 | | | | 0.57 | | | | (0.92 | ) | | | 1.17 | | |
Total from investment operations | | | (0.19 | ) | | | 1.86 | | | | 0.73 | | | | (0.80 | ) | | | 1.19 | | |
Less distributions to shareholders: | |
Net investment income | | | — | | | | — | | | | (0.39 | ) | | | — | | | | (0.21 | ) | |
Total distributions to shareholders | | | — | | | | — | | | | (0.39 | ) | | | — | | | | (0.21 | ) | |
Proceeds from regulatory settlements | | | 0.01 | | | | — | | | | — | | | | 0.02 | | | | 0.00 | (b) | |
Net asset value, end of period | | $ | 13.70 | | | $ | 13.88 | | | $ | 12.02 | | | $ | 11.68 | | | $ | 12.46 | | |
Total return | | | (1.30 | %)(c) | | | 15.47 | % | | | 6.40 | % | | | (6.26 | %)(d) | | | 10.52 | % | |
Ratios to average net assets(e) | |
Total gross expenses | | | 1.48 | % | | | 1.41 | %(f) | | | 1.40 | %(f) | | | 1.38 | % | | | 1.30 | %(f)(g) | |
Total net expenses(h) | | | 1.47 | %(i) | | | 1.41 | %(f)(i) | | | 1.39 | %(f)(i) | | | 1.33 | %(i) | | | 1.30 | %(f)(g)(i) | |
Net investment income | | | 0.98 | % | | | 1.05 | % | | | 1.42 | % | | | 1.06 | % | | | 0.33 | %(g) | |
Supplemental data | |
Net assets, end of period (in thousands) | | $ | 205,715 | | | $ | 166,486 | | | $ | 270,144 | | | $ | 232,777 | | | $ | 3 | | |
Portfolio turnover | | | 96 | % | | | 125 | % | | | 100 | % | | | 112 | % | | | 92 | % | |
Notes to Financial Highlights
(a) Based on operations from September 27, 2010 (commencement of operations) through the stated period end.
(b) Rounds to zero.
(c) The Fund received proceeds from regulatory settlements. Had the Fund not received these proceeds, the total return would have been lower by 0.10%.
(d) The Fund received proceeds from regulatory settlements. Had the Fund not received these proceeds, the total return would have been lower by 0.19%.
(e) In addition to the fees and expenses that the Fund bears directly, the Fund indirectly bears a pro rata share of the fees and expenses of any other funds in which it invests. Such indirect expenses are not included in the Fund's reported expense ratios.
(f) Ratios include line of credit interest expense which is less than 0.01%.
(g) Annualized.
(h) Total net expenses include the impact of certain fee waivers/expense reimbursements made by the Investment Manager and certain of its affiliates, if applicable.
(i) The benefits derived from expense reductions had an impact of less than 0.01%.
The accompanying Notes to Financial Statements are an integral part of this statement.
Annual Report 2015
33
COLUMBIA MULTI-ADVISOR INTERNATIONAL EQUITY FUND
FINANCIAL HIGHLIGHTS (continued)
| | | Year Ended February 28, | | Year Ended
February 29, | |
Class Y | | 2015 | | 2014 | | 2013 | | 2012(a) | |
Per share data | |
Net asset value, beginning of period | | $ | 14.16 | | | $ | 12.21 | | | $ | 11.89 | | | $ | 12.55 | | |
Income from investment operations: | |
Net investment income | | | 0.19 | | | | 0.22 | | | | 0.21 | | | | 0.18 | | |
Net realized and unrealized gain (loss) | | | (0.32 | ) | | | 1.73 | | | | 0.59 | | | | (0.86 | ) | |
Total from investment operations | | | (0.13 | ) | | | 1.95 | | | | 0.80 | | | | (0.68 | ) | |
Less distributions to shareholders: | |
Net investment income | | | — | | | | — | | | | (0.48 | ) | | | — | | |
Total distributions to shareholders | | | — | | | | — | | | | (0.48 | ) | | | — | | |
Proceeds from regulatory settlements | | | 0.01 | | | | — | | | | — | | | | 0.02 | | |
Net asset value, end of period | | $ | 14.04 | | | $ | 14.16 | | | $ | 12.21 | | | $ | 11.89 | | |
Total return | | | (0.85 | %)(b) | | | 15.97 | % | | | 6.98 | % | | | (5.26 | %)(c) | |
Ratios to average net assets(d) | |
Total gross expenses | | | 0.96 | % | | | 0.94 | %(e) | | | 0.95 | %(e) | | | 0.88 | %(f) | |
Total net expenses(g) | | | 0.96 | % | | | 0.94 | %(e) | | | 0.95 | %(e) | | | 0.88 | %(f) | |
Net investment income | | | 1.41 | % | | | 1.67 | % | | | 1.79 | % | | | 1.64 | %(f) | |
Supplemental data | |
Net assets, end of period (in thousands) | | $ | 15,568 | | | $ | 15,701 | | | $ | 14,990 | | | $ | 12,780 | | |
Portfolio turnover | | | 96 | % | | | 125 | % | | | 100 | % | | | 112 | % | |
Notes to Financial Highlights
(a) Based on operations from March 7, 2011 (commencement of operations) through the stated period end.
(b) The Fund received proceeds from regulatory settlements. Had the Fund not received these proceeds, the total return would have been lower by 0.10%.
(c) The Fund received proceeds from regulatory settlements. Had the Fund not received these proceeds, the total return would have been lower by 0.19%.
(d) In addition to the fees and expenses that the Fund bears directly, the Fund indirectly bears a pro rata share of the fees and expenses of any other funds in which it invests. Such indirect expenses are not included in the Fund's reported expense ratios.
(e) Ratios include line of credit interest expense which is less than 0.01%.
(f) Annualized.
(g) Total net expenses include the impact of certain fee waivers/expense reimbursements made by the Investment Manager and certain of its affiliates, if applicable.
The accompanying Notes to Financial Statements are an integral part of this statement.
Annual Report 2015
34
COLUMBIA MULTI-ADVISOR INTERNATIONAL EQUITY FUND
FINANCIAL HIGHLIGHTS (continued)
| | | Year Ended February 28, | | Year Ended
February 29, | | Year Ended
February 28, | |
Class Z | | 2015 | | 2014 | | 2013 | | 2012 | | 2011 | |
Per share data | |
Net asset value, beginning of period | | $ | 14.11 | | | $ | 12.19 | | | $ | 11.86 | | | $ | 12.62 | | | $ | 10.81 | | |
Income from investment operations: | |
Net investment income | | | 0.17 | | | | 0.19 | | | | 0.23 | | | | 0.18 | | | | 0.18 | | |
Net realized and unrealized gain (loss) | | | (0.33 | ) | | | 1.73 | | | | 0.54 | | | | (0.96 | ) | | | 1.87 | | |
Total from investment operations | | | (0.16 | ) | | | 1.92 | | | | 0.77 | | | | (0.78 | ) | | | 2.05 | | |
Less distributions to shareholders: | |
Net investment income | | | — | | | | — | | | | (0.44 | ) | | | — | | | | (0.24 | ) | |
Total distributions to shareholders | | | — | | | | — | | | | (0.44 | ) | | | — | | | | (0.24 | ) | |
Proceeds from regulatory settlements | | | 0.01 | | | | — | | | | — | | | | 0.02 | | | | 0.00 | (a) | |
Net asset value, end of period | | $ | 13.96 | | | $ | 14.11 | | | $ | 12.19 | | | $ | 11.86 | | | $ | 12.62 | | |
Total return | | | (1.06 | %)(b) | | | 15.75 | % | | | 6.72 | % | | | (6.02 | %)(c) | | | 19.08 | % | |
Ratios to average net assets(d) | |
Total gross expenses | | | 1.24 | % | | | 1.17 | %(e) | | | 1.13 | %(e) | | | 1.11 | % | | | 1.08 | %(e) | |
Total net expenses(f) | | | 1.22 | %(g) | | | 1.17 | %(e)(g) | | | 1.12 | %(e)(g) | | | 1.08 | %(g) | | | 1.08 | %(e)(g) | |
Net investment income | | | 1.23 | % | | | 1.50 | % | | | 2.00 | % | | | 1.53 | % | | | 1.58 | % | |
Supplemental data | |
Net assets, end of period (in thousands) | | $ | 179,330 | | | $ | 237,249 | | | $ | 301,958 | | | $ | 1,093,867 | | | $ | 1,177,541 | | |
Portfolio turnover | | | 96 | % | | | 125 | % | | | 100 | % | | | 112 | % | | | 92 | % | |
Notes to Financial Highlights
(a) Rounds to zero.
(b) The Fund received proceeds from regulatory settlements. Had the Fund not received these proceeds, the total return would have been lower by 0.10%.
(c) The Fund received proceeds from regulatory settlements. Had the Fund not received these proceeds, the total return would have been lower by 0.19%.
(d) In addition to the fees and expenses that the Fund bears directly, the Fund indirectly bears a pro rata share of the fees and expenses of any other funds in which it invests. Such indirect expenses are not included in the Fund's reported expense ratios.
(e) Ratios include line of credit interest expense which is less than 0.01%.
(f) Total net expenses include the impact of certain fee waivers/expense reimbursements made by the Investment Manager and certain of its affiliates, if applicable.
(g) The benefits derived from expense reductions had an impact of less than 0.01%.
The accompanying Notes to Financial Statements are an integral part of this statement.
Annual Report 2015
35
COLUMBIA MULTI-ADVISOR INTERNATIONAL EQUITY FUND
NOTES TO FINANCIAL STATEMENTS
February 28, 2015
Note 1. Organization
Columbia Multi-Advisor International Equity Fund (the Fund), a series of Columbia Funds Series Trust (the Trust), is a diversified fund. The Trust is registered under the Investment Company Act of 1940, as amended (the 1940 Act), as an open-end management investment company organized as a Delaware statutory trust.
On January 28, 2015, the Board of Trustees (the Board) voted to change the Fund's name from Columbia Multi-Advisor International Equity Fund to Columbia Select International Equity Fund effective on or about May 1, 2015.
Fund Shares
The Trust may issue an unlimited number of shares (without par value). The Fund offers Class A, Class B, Class C, Class I, Class K, Class R, Class R4, Class R5, Class W, Class Y and Class Z shares. Although all share classes generally have identical voting, dividend and liquidation rights, each share class votes separately when required by the Trust's organizational documents or by law. Different share classes pay different distribution amounts to the extent the expenses of such share classes differ, and distributions in liquidation will be proportional to the net asset value of each share class. Each share class has its own expense structure and sales charges.
Class A shares are subject to a maximum front-end sales charge of 5.75% based on the initial investment amount. Class A shares purchased without an initial sales charge in accounts aggregating $1 million to $50 million at the time of purchase are subject to a contingent deferred sales charge (CDSC) if the shares are sold within 18 months of purchase, charged as follows: 1.00% CDSC if redeemed within 12 months of purchase, and 0.50% CDSC if redeemed more than 12, but less than 18, months after purchase.
Class B shares may be subject to a maximum CDSC of 5.00% based upon the holding period after purchase. Class B shares will generally convert to Class A shares eight years after purchase. The Fund no longer accepts investments by new or existing investors in the Fund's Class B shares, except in connection with the reinvestment of any dividend and/or capital gain distributions in Class B shares of the Fund and exchanges by existing Class B shareholders of certain other funds within the Columbia Family of Funds.
Class C shares are subject to a 1.00% CDSC on shares redeemed within one year of purchase.
Class I shares are not subject to sales charges and are available only to the Columbia Family of Funds.
Class K shares are not subject to sales charges, however this share class is closed to new investors.
Class R shares are not subject to sales charges and are generally available only to certain retirement plans and other investors as described in the Fund's prospectus.
Class R4 shares are not subject to sales charges and are generally available only to omnibus retirement plans and certain investors as described in the Fund's prospectus.
Class R5 shares are not subject to sales charges and are generally available only to investors purchasing through authorized investment professionals and omnibus retirement plans.
Class W shares are not subject to sales charges and are available only to investors purchasing through authorized investment programs managed by investment professionals, including discretionary managed account programs.
Class Y shares are not subject to sales charges and are generally available only to certain retirement plans as described in the Fund's prospectus.
Class Z shares are not subject to sales charges and are available only to eligible investors, which are subject to different investment minimums as described in the Fund's prospectus.
Note 2. Summary of Significant Accounting Policies
Basis of Preparation
The Fund is an investment company that applies the accounting and reporting guidance in the Financial Accounting Standards Board (FASB) Accounting Standards Codification Topic 946, Financial Services — Investment Companies (ASC 946). The financial statements are prepared in accordance with U.S. generally accepted accounting principles (GAAP) which requires management to make certain estimates and assumptions that affect the reported amounts of assets and liabilities, the disclosure of contingent assets and liabilities at the date of the financial statements and the reported amounts of income and expenses during the reporting period. Actual results could differ from those estimates.
Annual Report 2015
36
COLUMBIA MULTI-ADVISOR INTERNATIONAL EQUITY FUND
NOTES TO FINANCIAL STATEMENTS (continued)
February 28, 2015
The following is a summary of significant accounting policies followed by the Fund in the preparation of its financial statements.
Security Valuation
All equity securities and exchange-traded funds (ETFs) are valued at the close of business of the New York Stock Exchange (NYSE). Equity securities and ETFs are valued at the last quoted sales price on the principal exchange or market on which they trade, except for securities traded on the NASDAQ Stock Market, which are valued at the NASDAQ official close price. Unlisted securities or listed securities for which there were no sales during the day are valued at the mean of the latest quoted bid and ask prices on such exchanges or markets.
Foreign equity securities are valued based on quotations from the principal market in which such securities are traded. If any foreign security prices are not readily available as a result of limited share activity, the securities are valued at the mean of the latest quoted bid and ask prices on such exchanges or markets. Foreign currency exchange rates are generally determined at 4:00 p.m. Eastern (U.S.) time. Many securities markets and exchanges outside the U.S. close prior to the close of the NYSE; therefore, the closing prices for securities in such markets or on such exchanges may not fully reflect events that occur after such close but before the close of the NYSE. In those situations, foreign securities will be fair valued pursuant to a policy adopted by the Board, including, if available, utilizing a third party pricing service to determine these fair values. The third party pricing service takes into account multiple factors, including, but not limited to, movements in the U.S. securities markets, certain depositary receipts, futures contracts and foreign exchange rates that have occurred subsequent to the close of the foreign exchange or market, to determine a good faith estimate that reasonably reflects the current market conditions as of the close of the NYSE. The fair value of a security is likely to be different from the quoted or published price, if available.
Investments in open-end investment companies, including money market funds, are valued at their net asset value.
Forward foreign currency exchange contracts are marked-to-market based upon foreign currency exchange rates provided by a pricing service.
Futures and options on futures contracts are valued based upon the settlement price established each day by the board of trade or exchange on which they are traded.
Investments for which market quotations are not readily available, or that have quotations which management believes are not reliable, are valued at fair value as determined in good faith under procedures established by and under the general supervision of the Board. If a security or class of securities (such as foreign securities) is valued at fair value, such value is likely to be different from the quoted or published price for the security.
The determination of fair value often requires significant judgment. To determine fair value, management may use assumptions including but not limited to future cash flows and estimated risk premiums. Multiple inputs from various sources may be used to determine fair value.
Foreign Currency Transactions and Translations
The values of all assets and liabilities denominated in foreign currencies are generally translated into U.S. dollars at exchange rates determined at the close of the NYSE. Net realized and unrealized gains (losses) on foreign currency transactions and translations include gains (losses) arising from the fluctuation in exchange rates between trade and settlement dates on securities transactions, gains (losses) arising from the disposition of foreign currency and currency gains (losses) between the accrual and payment dates on dividends, interest income and foreign withholding taxes.
For financial statement purposes, the Fund does not distinguish that portion of gains (losses) on investments which is due to changes in foreign exchange rates from that which is due to changes in market prices of the investments. Such fluctuations are included with the net realized and unrealized gains (losses) on investments in the Statement of Operations.
Derivative Instruments
The Fund invests in certain derivative instruments, as detailed below, to meet its investment objectives. Derivatives are instruments whose values depend on, or are derived from, in whole or in part, the value of one or more other assets, such as securities, currencies, commodities or indices. Derivative instruments may be used to increase investment flexibility (including to maintain cash reserves while maintaining exposure to certain other assets), for risk management (hedging) purposes, to facilitate trading, to reduce transaction costs and to pursue higher investment returns. The Fund may also use derivative instruments to mitigate certain
Annual Report 2015
37
COLUMBIA MULTI-ADVISOR INTERNATIONAL EQUITY FUND
NOTES TO FINANCIAL STATEMENTS (continued)
February 28, 2015
investment risks, such as foreign currency exchange rate risk, interest rate risk and credit risk. Derivatives may involve various risks, including the potential inability of the counterparty to fulfill its obligation under the terms of the contract, the potential for an illiquid secondary market (making it difficult for the Fund to sell, including at favorable prices) and the potential for market movements which may expose the Fund to gains or losses in excess of the amount shown in the Statement of Assets and Liabilities. The notional amounts of derivative instruments, if applicable, are not recorded in the financial statements.
A derivative instrument may suffer a marked-to-market loss if the value of the contract decreases due to an unfavorable change in the market rates or values of the underlying instrument. Losses can also occur if the counterparty does not perform under the contract. The Fund's risk of loss from counterparty credit risk on over-the-counter derivatives is generally limited to the aggregate unrealized gain netted against any collateral held by the Fund and the amount of any variation margin held by the counterparty. With exchange-traded or centrally cleared derivatives, there is reduced counterparty credit risk to the Fund since the exchange's clearinghouse, as counterparty to such instruments, guarantees against a possible default. The clearinghouse stands between the buyer and the seller of the contract; therefore, the counterparty credit risk is failure of the clearinghouse. However, credit risk still exists in exchange-traded or centrally cleared derivatives with respect to initial and variation margin that is held in a broker's customer account. While brokers are required to segregate customer margin from their own assets, in the event that a broker becomes insolvent or goes into bankruptcy and at that time there is a shortfall in the aggregate amount of margin held by the broker for all its clients, U.S. bankruptcy laws will typically allocate that shortfall on a pro-rata basis across all the broker's customers (including the Fund), potentially resulting in losses to the Fund.
In order to better define its contractual rights and to secure rights that will help the Fund mitigate its counterparty risk, the Fund may enter into an International Swaps and Derivatives Association, Inc. Master Agreement (ISDA Master Agreement) or similar agreement with its derivative contract counterparties. An ISDA Master Agreement is an agreement between the Fund and a counterparty that governs over-the-counter derivatives and forward foreign currency exchange contracts and typically contains, among other things,
collateral posting terms and netting provisions in the event of a default and/or termination event. Under an ISDA Master Agreement, the Fund may, under certain circumstances, offset with the counterparty certain derivative instrument's payables and/or receivables with collateral held and/or posted and create one single net payment. The provisions of the ISDA Master Agreement typically permit a single net payment in the event of default (close-out netting) including the bankruptcy or insolvency of the counterparty. Note, however, that bankruptcy or insolvency laws of a particular jurisdiction may impose restrictions on or prohibitions against the right of offset in bankruptcy, insolvency or other events.
Collateral (margin) requirements differ by type of derivative. Margin requirements are established by the exchange or clearinghouse for exchange-traded and centrally cleared derivatives. Brokers can ask for margin in excess of the minimum in certain circumstances. Collateral terms are contract specific for over-the-counter derivatives. For over-the-counter derivatives traded under an ISDA Master Agreement, the collateral requirements are typically calculated by netting the marked-to-market amount for each transaction under such agreement and comparing that amount to the value of any variation margin currently pledged by the Fund and/or the counterparty. Generally, the amount of collateral due from or to a party has to exceed a minimum transfer amount threshold (e.g., $500,000) before a transfer has to be made. To the extent amounts due to the Fund from its counterparties are not fully collateralized, contractually or otherwise, the Fund bears the risk of loss from counterparty nonperformance. The Fund attempts to mitigate counterparty risk by only entering into agreements with counterparties that it believes have the financial resources to honor their obligations and by monitoring the financial stability of those counterparties.
Certain ISDA Master Agreements allow counterparties to over-the-counter derivatives to terminate derivative contracts prior to maturity in the event the Fund's net assets decline by a stated percentage over a specified time period or if the Fund fails to meet the terms of the ISDA Master Agreement, which would cause the Fund to accelerate payment of any net liability owed to the counterparty. The Fund also has termination rights if the counterparty fails to meet the terms of the ISDA Master Agreement. In addition to considering counterparty credit risk, the Fund would consider terminating the derivative contracts based on whether termination would result in a net liability owed from the counterparty.
Annual Report 2015
38
COLUMBIA MULTI-ADVISOR INTERNATIONAL EQUITY FUND
NOTES TO FINANCIAL STATEMENTS (continued)
February 28, 2015
For financial reporting purposes, the Fund does not offset derivative assets and derivative liabilities that are subject to netting arrangements in the Statement of Assets and Liabilities.
Forward Foreign Currency Exchange Contracts
Forward foreign currency exchange contracts are over-the-counter agreements between two parties to buy and sell a currency at a set price on a future date. The Fund utilized forward foreign currency exchange contracts to hedge the currency exposure associated with some or all of the Fund's securities, to shift investment exposure from one currency to another and to shift U.S. dollar exposure to achieve a representative weighted mix of major currencies in its benchmark and/or to recover an underweight country exposure in its portfolio. These instruments may be used for other purposes in future periods.
The values of forward foreign currency exchange contracts fluctuate daily with changes in foreign currency exchange rates. Changes in the value of these contracts are recorded as unrealized appreciation or depreciation until the contract is exercised or has expired. The Fund will realize a gain or loss when the forward foreign currency exchange contract is closed or expires.
The use of forward foreign currency exchange contracts does not eliminate fluctuations in the prices of the Fund's portfolio securities. The risks of forward foreign currency exchange contracts include movement in the values of the foreign currencies relative to the U.S. dollar (or other foreign currencies) and the possibility that counterparties will not complete their contractual obligations, which may be in excess of the amount reflected, if any, in the Statement of Assets and Liabilities.
Futures Contracts
Futures contracts are exchange traded and represent commitments for the future purchase or sale of an asset at a specified price on a specified date. The Fund bought and sold futures contracts to manage exposure to the securities market and maintain appropriate equity market exposure while keeping sufficient cash to accommodate daily redemptions. These instruments may be used for other purposes in future periods. Upon entering into futures contracts, the Fund bears risks that it may not achieve the anticipated benefits of the futures contracts and may realize a loss. Additional risks include counterparty credit risk, the possibility of an illiquid market, and that a change in the value of the contract or option may not correlate with changes in the value of the underlying asset.
Upon entering into a futures contract, the Fund pledges cash or securities with the broker in an amount sufficient to meet the initial margin requirement. The initial margin deposit must be maintained at an established level over the life of the contract. Cash deposited as initial margin is recorded in the Statement of Assets and Liabilities as margin deposits. Securities deposited as initial margin are designated in the Portfolio of Investments. Subsequent payments (variation margin) are made or received by the Fund each day. The variation margin payments are equal to the daily change in the contract value and are recorded as variation margin receivable or payable and are offset in unrealized gains or losses. The Fund recognizes a realized gain or loss when the contract is closed or expires. Futures contracts involve, to varying degrees, risk of loss in excess of the variation margin disclosed in the Statement of Assets and Liabilities.
Offsetting of Derivative Assets and Derivative Liabilities
The following tables present the Fund's gross and net amount of assets and liabilities available for offset under netting arrangements as well as any related collateral received or pledged by the Fund as of February 28, 2015:
| | | | | | | | | Gross Amounts Not Offset in
the Statement of Assets and Liabilities | |
| |
| | | Gross
Amounts of
Recognized
Assets ($) | | Gross Amounts
Offset in the
Statement of
Assets and
Liabilities ($) | | Net Amounts of
Assets
Presented in the
Statement of
Assets and
Liabilities ($) | | Financial
Instruments ($)(a) | | Cash
Collateral
Received ($) | | Securities
Collateral
Received ($) | | Net
Amount ($)(b) | |
Asset Derivatives: | |
Forward Foreign Currency
Exchange Contracts | | | 443,625 | | | | — | | | | 443,625 | | | | 443,625 | | | | — | | | | — | | | | — | | |
Annual Report 2015
39
COLUMBIA MULTI-ADVISOR INTERNATIONAL EQUITY FUND
NOTES TO FINANCIAL STATEMENTS (continued)
February 28, 2015
| | | | | | | | | Gross Amounts Not Offset in
the Statement of Assets and Liabilities | |
| |
| | | Gross
Amounts of
Recognized
Liabilities ($) | | Gross Amounts
Offset in the
Statement of
Assets and
Liabilities ($) | | Net Amounts of
Liabilities
Presented in the
Statement of
Assets and
Liabilities ($) | | Financial
Instruments ($)(c) | | Cash
Collateral
Pledged ($) | | Securities
Collateral
Pledged ($) | | Net
Amount ($)(d) | |
Liability Derivatives: | |
Forward Foreign Currency
Exchange Contracts | | | 796,438 | | | | — | | | | 796,438 | | | | 443,625 | | | | — | | | | — | | | | 352,813 | | |
(a) Represents the amount of assets that could be offset by liabilities with the same counterparty under master netting or similar agreements that management elects not to offset on the Statement of Assets and Liabilities.
(b) Represents the net amount due from counterparties in the event of default.
(c) Represents the amount of liabilities that could be offset by assets with the same counterparty under master netting or similar agreements that management elects not to offset on the Statement of Assets and Liabilities.
(d) Represents the net amount due to counterparties in the event of default.
Effects of Derivative Transactions in the Financial Statements
The following tables are intended to provide additional information about the effect of derivatives on the financial statements of the Fund, including: the fair value of derivatives by risk category and the location of those fair values in the Statement of Assets and Liabilities; and the impact of derivative transactions over the period in the Statement of Operations, including realized gains or losses and unrealized gains or losses. The derivative schedules following the Portfolio of Investments present additional information regarding derivative instruments outstanding at the end of the period, if any.
The following table is a summary of the fair value of derivative instruments (not considered to be hedging instruments for accounting disclosure purposes) at February 28, 2015:
Asset Derivatives | |
Risk Exposure
Category | | Statement of Assets and
Liabilities Location | | Fair Value ($) | |
Equity risk
| | Net assets — unrealized
appreciation on futures
contracts | | | 320,772
| * | |
Foreign exchange
risk | | Unrealized appreciation on
forward foreign currency
exchange contracts | | | 443,625 | | |
Total | | | | | 764,397 | | |
Liability Derivatives | |
Risk Exposure
Category | | Statement of Assets and
Liabilities Location | | Fair Value ($) | |
Foreign exchange
risk
| | Unrealized depreciation on
forward foreign currency
exchange contracts | | | 796,438
| | |
*Includes cumulative appreciation (depreciation) as reported in the tables following the Portfolio of Investments. Only the current day's variation margin is reported in receivables or payables in the Statement of Assets and Liabilities.
The following table indicates the effect of derivative instruments (not considered to be hedging instruments for accounting disclosure purposes) in the Statement of Operations for the year ended February 28, 2015:
Amount of Realized Gain (Loss) on Derivatives Recognized in Income | |
Risk Exposure
Category | | Forward Foreign
Currency Exchange
Contracts ($) | | Futures
Contracts ($) | | Total ($) | |
Equity risk | | | — | | | | 182,154 | | | | 182,154 | | |
Foreign exchange
risk | | | (2,597,131 | ) | | | — | | | | (2,597,131 | ) | |
Total | | | (2,597,131 | ) | | | 182,154 | | | | (2,414,977 | ) | |
Change in Unrealized Appreciation (Depreciation) on Derivatives
Recognized in Income | |
Risk Exposure
Category | | Forward Foreign
Currency Exchange
Contracts ($) | | Futures
Contracts ($) | | Total ($) | |
Equity risk | | | — | | | | (271,742 | ) | | | (271,742 | ) | |
Foreign exchange
risk | | | (1,446,309 | ) | | | — | | | | (1,446,309 | ) | |
Total | | | (1,446,309 | ) | | | (271,742 | ) | | | (1,718,051 | ) | |
Annual Report 2015
40
COLUMBIA MULTI-ADVISOR INTERNATIONAL EQUITY FUND
NOTES TO FINANCIAL STATEMENTS (continued)
February 28, 2015
The following table is a summary of the average outstanding volume by derivative instrument for the year ended February 28, 2015:
Derivative Instrument | | Average Notional Amounts ($)* | |
Futures contracts — Long | | | 7,374,531 | | |
Derivative Instrument | | Average Unrealized
Appreciation ($)* | | Average Unrealized
Depreciation ($)* | |
Forward foreign currency
exchange contracts | | | 366,224 | | | | (656,922 | ) | |
*Based on the ending quarterly outstanding amounts for the year ended February 28, 2015.
Security Transactions
Security transactions are accounted for on the trade date. Cost is determined and gains (losses) are based upon the specific identification method for both financial statement and federal income tax purposes.
Income Recognition
Corporate actions and dividend income are generally recorded net of any non-reclaimable tax withholdings, on the ex-dividend date or upon receipt of ex-dividend notification in the case of certain foreign securities.
Awards from class action litigation are recorded as a reduction of cost basis if the Fund still owns the applicable securities on the payment date. If the Fund no longer owns the applicable securities, the proceeds are recorded as realized gains.
Expenses
General expenses of the Trust are allocated to the Fund and other funds of the Trust based upon relative net assets or other expense allocation methodologies determined by the nature of the expense. Expenses directly attributable to the Fund are charged to the Fund. Expenses directly attributable to a specific class of shares are charged to that share class.
Determination of Class Net Asset Value
All income, expenses (other than class-specific expenses, which are charged to that share class, as shown in the Statement of Operations) and realized and unrealized gains (losses) are allocated to each class of the Fund on a daily basis, based on the relative net assets of each class, for purposes of determining the net asset value of each class.
Federal Income Tax Status
The Fund intends to qualify each year as a regulated investment company under Subchapter M of the Internal
Revenue Code, as amended, and will distribute substantially all of its taxable income (including net short-term capital gains), if any, for its tax year, and as such will not be subject to federal income taxes. In addition, the Fund intends to distribute in each calendar year substantially all of its net investment income, capital gains and certain other amounts, if any, such that the Fund should not be subject to federal excise tax. Therefore, no federal income or excise tax provision is recorded.
Foreign Taxes
The Fund may be subject to foreign taxes on income, gains on investments or currency repatriation, a portion of which may be recoverable. The Fund will accrue such taxes and recoveries, as applicable, based upon its current interpretation of tax rules and regulations that exist in the markets in which it invests.
Realized gains in certain countries may be subject to foreign taxes at the Fund level, based on statutory rates. The Fund accrues for such foreign taxes on realized and unrealized gains at the appropriate rate for each jurisdiction, as applicable. The amount, if any, is disclosed as a liability on the Statement of Assets and Liabilities.
Distributions to Shareholders
Distributions from net investment income, if any, are declared and paid semi-annually. Net realized capital gains, if any, are distributed at least annually. Income distributions and capital gain distributions are determined in accordance with federal income tax regulations, which may differ from GAAP.
Guarantees and Indemnifications
Under the Trust's organizational documents and, in some cases, by contract, its officers and trustees are indemnified against certain liabilities arising out of the performance of their duties to the Trust or its funds. In addition, certain of the Fund's contracts with its service providers contain general indemnification clauses. The Fund's maximum exposure under these arrangements is unknown since the amount of any future claims that may be made against the Fund cannot be determined, and the Fund has no historical basis for predicting the likelihood of any such claims.
Annual Report 2015
41
COLUMBIA MULTI-ADVISOR INTERNATIONAL EQUITY FUND
NOTES TO FINANCIAL STATEMENTS (continued)
February 28, 2015
Note 3. Fees and Compensation Paid to Affiliates
Investment Management Fees
Under an Investment Management Services Agreement, Columbia Management Investment Advisers, LLC (the Investment Manager), a wholly-owned subsidiary of Ameriprise Financial, Inc. (Ameriprise Financial), is responsible for the ultimate oversight of investments made by the Fund. The Fund's subadviser (see Subadvisory Agreement below) has the primary responsibility for the day-to-day portfolio management of the Fund. The investment management fee is an annual fee that is equal to a percentage of the Fund's average daily net assets that declines from 0.79% to 0.62% as the Fund's net assets increase. The effective investment management fee rate for the year ended February 28, 2015 was 0.78% of the Fund's average daily net assets.
Subadvisory Agreement
The Investment Manager has entered into a Subadvisory Agreement with Threadneedle International Limited (Threadneedle), an affiliate of the Investment Manager and wholly-owned subsidiary of Ameriprise Financial, to serve as the subadviser to the Fund. The Investment Manager compensates Threadneedle to manage the investment of the Fund's assets.
Administration Fees
Under an Administrative Services Agreement, the Investment Manager also serves as the Fund Administrator. The Fund pays the Fund Administrator an annual fee for administration and accounting services equal to a percentage of the Fund's average daily net assets that declines from 0.08% to 0.05% as the Fund's net assets increase. The effective administration fee rate for the year ended February 28, 2015 was 0.08% of the Fund's average daily net assets.
Other Expenses
Other expenses are for, among other things, miscellaneous expenses of the Fund or the Board, including payments to a company providing limited administrative services to the Fund and the Board. That company's expenses include boardroom and office expense, employee compensation, employee health and retirement benefits, and certain other expenses. For the year ended February 28, 2015, other expenses paid by the Fund to this company were $2,036.
Compensation of Board Members
Board members are compensated for their services to the Fund as disclosed in the Statement of Operations. Under a Deferred Compensation Plan (the Plan), the Board members who are not "interested persons" of the Fund, as defined under the 1940 Act, may elect to defer payment of up to 100% of their compensation. Deferred amounts are treated as though equivalent dollar amounts had been invested in shares of certain funds managed by the Investment Manager. The Fund's liability for these amounts is adjusted for market value changes and remains in the Fund until distributed in accordance with the Plan.
Transfer Agent Fees
Under a Transfer and Dividend Disbursing Agent Agreement, Columbia Management Investment Services Corp. (the Transfer Agent), an affiliate of the Investment Manager and a wholly-owned subsidiary of Ameriprise Financial, is responsible for providing transfer agency services to the Fund. The Transfer Agent has contracted with Boston Financial Data Services (BFDS) to serve as sub-transfer agent.
Effective November 1, 2014, the Transfer Agent receives a monthly transfer agency fee based on the number or the average value of accounts, depending on the type of account. Prior to November 1, 2014, the Transfer Agent received a monthly account-based service fee based on the number of open accounts. In addition, the Transfer Agent also receives sub-transfer agency fees based on a percentage of the average aggregate value of the Fund's shares maintained in omnibus accounts (other than omnibus accounts for which American Enterprise Investment Services Inc. is the broker of record or accounts where the beneficial shareholder is a customer of Ameriprise Financial Services, Inc., for which the Transfer Agent receives a per account fee). The Transfer Agent pays the fees of BFDS for services as sub-transfer agent and is not entitled to reimbursement for such fees from the Fund (with the exception of out-of-pocket fees).
The Transfer Agent also receives compensation from the Fund for various shareholder services and reimbursements for certain out-of-pocket fees. Total transfer agent fees for Class K and Class R5 shares are subject to an annual limitation of not more than 0.05% of the average daily net assets attributable to each share class. Class I and Class Y shares do not pay transfer agency fees.
Annual Report 2015
42
COLUMBIA MULTI-ADVISOR INTERNATIONAL EQUITY FUND
NOTES TO FINANCIAL STATEMENTS (continued)
February 28, 2015
For the year ended February 28, 2015, the Fund's effective transfer agent fee rates as a percentage of average daily net assets of each class were as follows:
Class A | | | 0.28 | % | |
Class B | | | 0.28 | | |
Class C | | | 0.28 | | |
Class K | | | 0.05 | | |
Class R | | | 0.28 | | |
Class R4 | | | 0.28 | | |
Class R5 | | | 0.05 | | |
Class W | | | 0.29 | | |
Class Z | | | 0.28 | | |
An annual minimum account balance fee of $20 may apply to certain accounts with a value below the applicable share class's initial minimum investment requirements to reduce the impact of small accounts on transfer agent fees. These minimum account balance fees are remitted to the Fund and recorded as part of expense reductions in the Statement of Operations. For the year ended February 28, 2015, these minimum account balance fees reduced total expenses of the Fund by $20,202.
Plan Administration Fees
Under a Plan Administration Services Agreement with the Transfer Agent, the Fund pays an annual fee at a rate of 0.25% of the Fund's average daily net assets attributable to Class K shares for the provision of various administrative, recordkeeping, communication and educational services.
Distribution and Service Fees
The Fund has an agreement with Columbia Management Investment Distributors, Inc. (the Distributor), an affiliate of the Investment Manager and a wholly-owned subsidiary of Ameriprise Financial, for distribution and shareholder services. The Board has approved, and the Fund has adopted, distribution and shareholder service plans (the Plans) applicable to certain share classes, which set the distribution and service fees for the Fund. These fees are calculated daily and are intended to compensate the Distributor and/or eligible selling and/or servicing agents for selling shares of the Fund and providing services to investors.
Under the Plans, the Fund pays a monthly combined distribution and service fee to the Distributor at the maximum annual rate of 0.25% of the average daily net assets attributable to Class A shares of the Fund. Also under the Plans, the Fund pays a monthly service fee at
the maximum annual rate of 0.25% of the average daily net assets attributable to Class B, Class C and Class W shares of the Fund and the payment of a monthly distribution fee at the maximum annual rates of 0.75%, 0.75%, 0.50% and 0.25% of the average daily net assets attributable to Class B, Class C, Class R and Class W shares, respectively.
Although the Fund may pay a distribution fee up to 0.25% of the Fund's average daily net assets attributable to Class W shares and a service fee of up to 0.25% of the Fund's average daily net assets attributable to Class W shares, the aggregate fee shall not exceed 0.25% of the Fund's average daily net assets attributable to Class W shares.
Sales Charges
Sales charges, including front-end charges and CDSCs, received by the Distributor for distributing Fund shares were $76,145 for Class A, $742 for Class B and $249 for Class C shares for the year ended February 28, 2015.
Expenses Waived/Reimbursed by the Investment Manager and its Affiliates
The Fund's expense ratio is subject to an expense reimbursement arrangement pursuant to which fees will be waived and/or expenses reimbursed (excluding certain fees and expenses described below), so that the Fund's net operating expenses, after giving effect to fees waived/expenses reimbursed and any balance credits and/or overdraft charges from the Fund's custodian, do not exceed the annual rates of:
| | | Voluntary
Expense Cap
Effective
July 1, 2014 | | Contractual
Expense Cap
Prior to
July 1, 2014 | |
Class A | | | 1.49 | % | | | 1.44 | % | |
Class B | | | 2.24 | | | | 2.19 | | |
Class C | | | 2.24 | | | | 2.19 | | |
Class I | | | 1.05 | | | | 1.01 | | |
Class K | | | 1.35 | | | | 1.31 | | |
Class R | | | 1.74 | | | | 1.69 | | |
Class R4 | | | 1.24 | | | | 1.19 | | |
Class R5 | | | 1.10 | | | | 1.06 | | |
Class W | | | 1.49 | | | | 1.44 | | |
Class Y | | | 1.05 | | | | 1.01 | | |
Class Z | | | 1.24 | | | | 1.19 | | |
The voluntary expense cap arrangement may be revised or discontinued at any time. Under the arrangements, the
Annual Report 2015
43
COLUMBIA MULTI-ADVISOR INTERNATIONAL EQUITY FUND
NOTES TO FINANCIAL STATEMENTS (continued)
February 28, 2015
following fees and expenses are excluded from the waiver/reimbursement commitment, and therefore will be paid by the Fund, if applicable: taxes (including foreign transaction taxes), expenses associated with investments in affiliated and non-affiliated pooled investment vehicles (including mutual funds and exchange-traded funds), transaction costs and brokerage commissions, costs related to any securities lending program, dividend expenses associated with securities sold short, inverse floater program fees and expenses, transaction charges and interest on borrowed money, interest and extraordinary expenses. Any fees waived and/or expenses reimbursed under the expense reimbursement arrangements described above are not recoverable by the Investment Manager or its affiliates in future periods.
Note 4. Federal Tax Information
The timing and character of income and capital gain distributions are determined in accordance with income tax regulations, which may differ from GAAP because of temporary or permanent book to tax differences.
At February 28, 2015, these differences are primarily due to differing treatment for capital loss carryforwards, deferral/reversal of wash sale losses, Trustees' deferred compensation, foreign currency transactions, net operating loss reclassification, passive foreign investment company (PFIC) holdings, late-year ordinary losses and derivative investments. To the extent these differences are permanent, reclassifications are made among the components of the Fund's net assets in the Statement of Assets and Liabilities. Temporary differences do not require reclassifications. In the Statement of Assets and Liabilities the following reclassifications were made:
Excess of distributions over net investment income | | $ | 1,717,382 | | |
Accumulated net realized loss | | | (476,222 | ) | |
Paid-in capital | | | (1,241,160 | ) | |
Net investment income (loss) and net realized gains (losses), as disclosed in the Statement of Operations, and net assets were not affected by this reclassification.
For the years ended February 28, 2015 and 2014, there were no distributions.
At February 28, 2015, the components of distributable earnings on a tax basis were as follows:
Capital loss carryforwards | | $ | (782,662,697 | ) | |
Net unrealized appreciation | | | 107,226,147 | | |
At February 28, 2015, the cost of investments for federal income tax purposes was $586,785,137 and the aggregate gross unrealized appreciation and depreciation based on that cost was:
Unrealized appreciation | | $ | 120,989,413 | | |
Unrealized depreciation | | | (13,763,266 | ) | |
Net unrealized appreciation | | $ | 107,226,147 | | |
The following capital loss carryforwards, determined at February 28, 2015, may be available to reduce taxable income arising from future net realized gains on investments, if any, to the extent permitted by the Internal Revenue Code:
Year of Expiration | | Amount ($) | |
2017 | | | 229,141,617 | | |
2018 | | | 553,521,080 | | |
Total | | | 782,662,697 | | |
For the year ended February 28, 2015, $52,117,601 of capital loss carryforward was utilized.
Under current tax rules, regulated investment companies can elect to treat certain late-year ordinary losses incurred as arising on the first day of the following taxable year. As of February 28, 2015, the Fund will elect to treat late-year ordinary losses of $1,859,015 as arising on March 1, 2015.
Management of the Fund has concluded that there are no significant uncertain tax positions in the Fund that would require recognition in the financial statements. However, management's conclusion may be subject to review and adjustment at a later date based on factors including, but not limited to, new tax laws, regulations, and administrative interpretations (including relevant court decisions). Generally, the Fund's federal tax returns for the prior three fiscal years remain subject to examination by the Internal Revenue Service.
Note 5. Portfolio Information
The cost of purchases and proceeds from sales of securities, excluding short-term investments and derivatives, if any, aggregated to $580,623,052 and $621,638,728, respectively, for the year ended February 28, 2015. The amount of purchase and sale activity impacts the portfolio turnover rate reported in the Financial Highlights.
Note 6. Regulatory Settlements
During the year ended February 28, 2015, the Fund received $633,636 as a result of a regulatory settlement proceeding brought by the Securities and Exchange
Annual Report 2015
44
COLUMBIA MULTI-ADVISOR INTERNATIONAL EQUITY FUND
NOTES TO FINANCIAL STATEMENTS (continued)
February 28, 2015
Commission against an unaffiliated third party relating to market timing and/or late trading of mutual funds. This amount represented the Fund's portion of the proceeds from the settlement (neither the Fund nor the Investment Manager were a party to the proceeding). The payments have been included in Proceeds from regulatory settlements in the Statement of Changes in Net Assets.
Note 7. Affiliated Money Market Fund
The Fund invests in Columbia Short-Term Cash Fund, an affiliated money market fund established for the exclusive use by the Fund and other affiliated funds. The income earned by the Fund from such investments is included as Dividends — affiliated issuers in the Statement of Operations. As an investing fund, the Fund indirectly bears its proportionate share of the expenses of Columbia Short-Term Cash Fund.
Note 8. Shareholder Concentration
At February 28, 2015, one unaffiliated shareholders of record owned 19.1% of the outstanding shares of the Fund in one or more accounts. The Fund has no knowledge about whether any portion of those shares was owned beneficially. Affiliated shareholders of record owned 53.8% of the outstanding shares of the Fund in one or more accounts. Subscription and redemption activity by concentrated accounts may have a significant effect on the operations of the Fund.
Note 9. Line of Credit
The Fund has entered into a revolving credit facility with a syndicate of banks led by JPMorgan Chase Bank, N.A. (JPMorgan) whereby the Fund may borrow for the temporary funding of shareholder redemptions or for other temporary or emergency purposes. Pursuant to a December 9, 2014 amendment, the credit facility agreement, which is a collective agreement between the Fund and certain other funds managed by the Investment Manager, severally and not jointly, permits collective borrowings up to $550 million. Interest is charged to each participating fund based on its borrowings at a rate equal to the higher of (i) the overnight federal funds rate plus 1.00% or (ii) the one-month LIBOR rate plus 1.00%. Each borrowing under the credit facility matures no later than 60 days after the date of borrowing. The Fund also pays a commitment fee equal to its pro rata share of the amount of the credit facility at a rate of 0.075% per annum. The commitment fee is included in other expenses in the Statement of Operations. Prior to the December 9, 2014 amendment, the credit facility agreement permitted borrowings up to $500 million
under the same terms and interest rates as described above.
The Fund had no borrowings during the year ended February 28, 2015.
Note 10. Significant Risks
Financial Sector Risk
Sector risk occurs when a fund invests a significant portion of its assets in securities of companies conducting business in a related group of industries within an economic sector. Companies in the same economic sector may be similarly affected by economic, regulatory, political or market events or conditions, making a fund more vulnerable to unfavorable developments in that economic sector than funds that invest more broadly. The Fund may be more susceptible to the particular risks that may affect companies in the financial sector than if it were invested in a wider variety of companies in unrelated sectors.
Foreign Securities and Emerging Market Countries Risk
Investing in foreign securities may include certain risks and considerations not typically associated with investing in U.S. securities, such as fluctuating currency values and changing local and regional economic, political and social conditions, which may result in greater market volatility. In addition, certain foreign securities may not be as liquid as U.S. securities. Investing in emerging markets may accentuate these risks. These countries are also more likely to experience high levels of inflation, deflation or currency devaluation which could hurt their economies and securities markets.
Note 11. Subsequent Events
Management has evaluated the events and transactions that have occurred through the date the financial statements were issued and noted no items requiring adjustment of the financial statements or additional disclosure.
Note 12. Information Regarding Pending and Settled Legal Proceedings
In December 2005, without admitting or denying the allegations, American Express Financial Corporation (AEFC, which is now known as Ameriprise Financial, Inc. (Ameriprise Financial)) entered into settlement agreements with the Securities and Exchange Commission (SEC) and Minnesota Department of Commerce (MDOC) related to market timing activities. As
Annual Report 2015
45
COLUMBIA MULTI-ADVISOR INTERNATIONAL EQUITY FUND
NOTES TO FINANCIAL STATEMENTS (continued)
February 28, 2015
a result, AEFC was censured and ordered to cease and desist from committing or causing any violations of certain provisions of the Investment Advisers Act of 1940, the Investment Company Act of 1940, and various Minnesota laws. AEFC agreed to pay disgorgement of $10 million and civil money penalties of $7 million. AEFC also agreed to retain an independent distribution consultant to assist in developing a plan for distribution of all disgorgement and civil penalties ordered by the SEC in accordance with various undertakings detailed at www.sec.gov/litigation/admin/ia-2451.pdf. Ameriprise Financial and its affiliates have cooperated with the SEC and the MDOC in these legal proceedings, and have made regular reports to the Funds' Boards of Trustees.
Ameriprise Financial and certain of its affiliates have historically been involved in a number of legal, arbitration and regulatory proceedings, including routine litigation, class actions, and governmental actions, concerning matters arising in connection with the conduct of their business activities. Ameriprise Financial believes that the Funds are not currently the subject of, and that neither Ameriprise Financial nor any of its affiliates are the subject of, any pending legal, arbitration or regulatory proceedings that are likely to have a material adverse effect on the Funds or the ability of Ameriprise Financial or its affiliates to perform under their contracts with the Funds. Ameriprise Financial is required to make quarterly (10-Q), annual (10-K) and, as necessary, 8-K filings with the Securities and Exchange Commission on legal and regulatory matters that relate to Ameriprise Financial and its affiliates. Copies of these filings may be obtained by accessing the SEC website at www.sec.gov.
There can be no assurance that these matters, or the adverse publicity associated with them, will not result in increased fund redemptions, reduced sale of fund shares or other adverse consequences to the Funds. Further, although we believe proceedings are not likely to have a material adverse effect on the Funds or the ability of Ameriprise Financial or its affiliates to perform under their contracts with the Funds, these proceedings are subject to uncertainties and, as such, we are unable to estimate the possible loss or range of loss that may result. An adverse outcome in one or more of these proceedings could result in adverse judgments, settlements, fines, penalties or other relief that could have a material adverse effect on the consolidated financial condition or results of operations of Ameriprise Financial.
Annual Report 2015
46
COLUMBIA MULTI-ADVISOR INTERNATIONAL EQUITY FUND
REPORT OF INDEPENDENT REGISTERED PUBLIC ACCOUNTING FIRM
To the Trustees of Columbia Funds Series Trust and the Shareholders of
Columbia Multi-Advisor International Equity Fund
In our opinion, the accompanying statement of assets and liabilities, including the portfolio of investments, and the related statements of operations and of changes in net assets and the financial highlights present fairly, in all material respects, the financial position of Columbia Multi-Advisor International Equity Fund (the "Fund", a series of Columbia Funds Series Trust) at February 28, 2015, and the results of its operations, the changes in its net assets and the financial highlights for each of the periods indicated, in conformity with accounting principles generally accepted in the United States of America. These financial statements and financial highlights (hereafter referred to as "financial statements") are the responsibility of the Fund's management; our responsibility is to express an opinion on these financial statements based on our audits. We conducted our audits of these financial statements in accordance with the standards of the Public Company Accounting Oversight Board (United States). Those standards require that we plan and perform the audit to obtain reasonable assurance about whether the financial statements are free of material misstatement. An audit includes examining, on a test basis, evidence supporting the amounts and disclosures in the financial statements, assessing the accounting principles used and significant estimates made by management, and evaluating the overall financial statement presentation. We believe that our audits, which included confirmation of securities at February 28, 2015 by correspondence with the custodian, brokers and transfer agent, and the application of alternative auditing procedures where such confirmations had not been received, provide a reasonable basis for our opinion.
PricewaterhouseCoopers LLP
Minneapolis, Minnesota
April 21, 2015
Annual Report 2015
47
COLUMBIA MULTI-ADVISOR INTERNATIONAL EQUITY FUND
FEDERAL INCOME TAX INFORMATION
(Unaudited)
The Fund hereby designates the following tax attributes for the fiscal year ended February 28, 2015. Shareholders will be notified in early 2016 of the amounts for use in preparing 2015 income tax returns.
Tax Designations:
Foreign Taxes Paid | | $ | 1,278,869 | | |
Foreign Taxes Paid Per Share | | $ | 0.03 | | |
Foreign Taxes. The Fund makes the election to pass through to shareholders the foreign taxes paid. Eligible shareholders may claim a foreign tax credit. These taxes, and the corresponding foreign source income, are provided.
Annual Report 2015
48
COLUMBIA MULTI-ADVISOR INTERNATIONAL EQUITY FUND
Shareholders elect the Board that oversees the Funds' operations. The Board appoints officers who are responsible for day-to-day business decisions based on policies set by the Board. The following table provides basic biographical information about the Funds' Board members, including their principal occupations during the past five years, although specific titles for individuals may have varied over the period. Under current Board policy, members may serve through the end of the calendar year in which he or she reaches either the mandatory retirement age established by the Board or the fifteenth anniversary of the first Board meeting they attended as a member of the Board.
Independent Trustees
Name,
Address,
Year of Birth | | Position Held With
Funds and Length of
Service | | Principal Occupation(s)
During Past Five Years
and Other Relevant
Professional Experience | | Number of
Funds in the
Fund Family
Overseen by
Board Member | | Other Present or Past
Directorships/
Trusteeships
(Within Past 5 Years) | |
Kathleen Blatz
901 S. Marquette Ave.
Minneapolis, MN 55402
1954 | | Board member since 1/06 for RiverSource Funds and since 6/11 for Nations Funds | | Attorney; specializing in arbitration and mediation; Chief Justice, Minnesota Supreme Court, 1998-2006; Associate Justice, Minnesota Supreme Court, 1996-1998; Fourth Judicial District Court Judge, Hennepin Country, 1994-1996; Attorney in private practice and public service, 1984-1993; State Representative, Minnesota House of Representatives, 1979-1993, which included service on the Tax and Financial Institutions and Insurance Committees | | | 127 | | | Trustee, BlueCross BlueShield of Minnesota (Chair of the Business Development Committee) since 2009; Chair of the Robina Foundation since August 2013 | |
Edward J. Boudreau, Jr.
901 S. Marquette Ave.
Minneapolis, MN 55402
1944 | | Board member since 6/11 for RiverSource Funds and since 1/05 for Nations Funds | | Managing Director, E.J. Boudreau & Associates (consulting) since 2000; FINRA Industry Arbitrator, 2002-present; Chairman and Chief Executive Officer, John Hancock Funds (asset management), Chairman and Interested Trustee for open-end and closed-end funds offered by John Hancock, 1989-2000; John Hancock Life Insurance Company, including SVP and Treasurer and SVP Information Technology, 1968-1988 | | | 125 | | | Former Trustee, BofA Funds Series Trust (11 funds), 2005-2011; Trustee, Boston Museum of Science (Chair of Finance Committee), 1985-2013 | |
Pamela G. Carlton
901 S. Marquette Ave.
Minneapolis, MN 55402
1954 | | Board member since 7/07 for RiverSource Funds and since 6/11 for Nations Funds | | President, Springboard — Partners in Cross Cultural Leadership (consulting company) since 2003; Managing Director of US Equity Research, JP Morgan Chase, 1999-2003; Director of US Equity Research, Chase Asset Management, 1996-1999; Co-Director Latin America Research, 1993-1996, COO Global Research, 1992-1996, Co-Director of US Research, 1991-1992, Investment Banker, Morgan Stanley, 1982-1991 | | | 127 | | | None | |
Annual Report 2015
49
COLUMBIA MULTI-ADVISOR INTERNATIONAL EQUITY FUND
TRUSTEES AND OFFICERS (continued)
Independent Trustees (continued)
Name,
Address,
Year of Birth | | Position Held With
Funds and Length of
Service | | Principal Occupation(s)
During Past Five Years
and Other Relevant
Professional Experience | | Number of
Funds in the
Fund Family
Overseen by
Board Member | | Other Present or Past
Directorships/
Trusteeships
(Within Past 5 Years) | |
William P. Carmichael
901 S. Marquette Ave.
Minneapolis, MN 55402
1943 | | Chair of the Board since 1/14, Board member since 6/11 for RiverSource Funds and since 2003 for Nations Funds | | Retired; Co-founder, The Succession Fund (provides exit strategies to owners of privately held companies) 1998-2007; Adjunct Professor of Finances, Kelley School of Business, Indiana University, 1993-2007; Senior Vice President, Sara Lee Corporation, 1991-1993; Senior Vice President and Chief Financial Officer, Beatrice Foods Company, 1984-1990; Vice President, Esmark, Inc, 1973-1984.; Associate, Price Waterhouse, 1968-1972 | | | 127 | | | Director, Cobra Electronics Corporation (electronic equipment manufacturer), 1994-August 2014; The Finish Line (athletic shoes and apparel) since July 2003; Director, International Textile Corp. since 2012; former Director, McMoRan Exploration Company (oil and gas exploration and development) 2010-2013; former Trustee, BofA Funds Series Trust (11 funds) 2009-2011; Director, Spectrum Brands, Inc. (consumer products), 2002-2009; Director, Simmons Company (bedding), 2004-2010 | |
Patricia M. Flynn
901 S. Marquette Ave.
Minneapolis, MN 55402
1950 | | Board member since 11/04 for RiverSource Funds and since 6/11 for Nations Funds | | Trustee Professor of Economics and Management, Bentley University since 1976 (also teaches and conducts research on corporate governance); Dean, McCallum Graduate School of Business, Bentley University, 1992-2002 | | | 127 | | | Trustee, MA Taxpayers Foundation since 1997; Board of Governors, Innovation Institute, MA Technology Collaborative since 2010 | |
William A. Hawkins
901 S. Marquette Ave.
Minneapolis, MN 55402
1942 | | Board member since 6/11 for RiverSource Funds and since 1/05 for Nations Funds | | Managing Director, Overton Partners (financial consulting), since August 2010; President and Chief Executive Officer, California General Bank, N.A., January 2008-August 2010; Operation Hope, COO, 2004-2007; IndyMac Bancorp, President, CBG, 1999-2003; American General Bank, President, 1997-1999; Griffin Financial Services, CEO, 1981-1997; The Griffin Funds, CEO, 1992-1998 | | | 125 | | | Trustee, BofA Funds Series Trust (11 funds) | |
R. Glenn Hilliard
901 S. Marquette Ave.
Minneapolis, MN 55402
1943 | | Board member since 6/11 for RiverSource Funds and since 1/05 for Nations Funds | | Chairman and Chief Executive Officer, Hilliard Group LLC (investing and consulting) since April 2003; Non-Executive Director & Chairman, CNO Financial Group, Inc. (insurance), September 2003-May 2011 | | | 125 | | | Chairman, BofA Funds Series Trust (11 funds); former Director, CNO Financial Group, Inc. (insurance) 2003-2011 | |
Annual Report 2015
50
COLUMBIA MULTI-ADVISOR INTERNATIONAL EQUITY FUND
TRUSTEES AND OFFICERS (continued)
Independent Trustees (continued)
Name,
Address,
Year of Birth | | Position Held With
Funds and Length of
Service | | Principal Occupation(s)
During Past Five Years
and Other Relevant
Professional Experience | | Number of
Funds in the
Fund Family
Overseen by
Board Member | | Other Present or Past
Directorships/
Trusteeships
(Within Past 5 Years) | |
Catherine James Paglia
901 S. Marquette Ave.
Minneapolis, MN 55402
1952 | | Board member since 11/04 for RiverSource Funds and since 6/11 for Nations Funds | | Director, Enterprise Asset Management, Inc. (private real estate and asset management company) since September 1998; Managing Director and Partner, Interlaken Capital, Inc., 1989-1997; Managing Director, Morgan Stanley, 1982-1989; Vice President, Investment Banking, 1980-1982, Associate, Investment Banking, 1976-1980, Dean Witter Reynolds, Inc. | | | 127 | | | Director, Valmont Industries, Inc. (irrigation systems manufacturer) since 2012; Trustee, Carleton College (on the Investment Committee); Trustee, Carnegie Endowment for International Peace (on the Investment Committee) | |
Leroy C. Richie
901 S. Marquette Ave.
Minneapolis, MN 55402
1941 | | Board member since 2000 for Seligman Funds, since 11/08 for RiverSource Funds and since 6/11 for Nations Funds | | Counsel, Lewis & Munday, P.C. (law firm) since 2004; Vice President and General Counsel, Automotive Legal Affairs, Chrysler Corporation, 1993-1997 | | | 127 | | | Lead Outside Director, Digital Ally, Inc. (digital imaging) since September 2005; Director, Infinity, Inc. (oil and gas exploration and production) since 1994; Director, OGE Energy Corp. (energy and energy services) since November 2007-2014 | |
Minor M. Shaw
901 S. Marquette Ave.
Minneapolis, MN 55402
1947 | | Board member since 6/11 for RiverSource Funds and since 2003 for Nations Funds | | President, Micco LLC (private investments) since 2011; President, Micco Corp. (family investment business) 1998-2011 | | | 125 | | | Director, Piedmont Natural Gas; Director, BlueCross BlueShield of South Carolina since April 2008; Chair of the Duke Endowment; Director, National Association of Corporate Directors, Carolinas Chapter, since 2013; Chair of Greenville-Spartanburg Airport Commission; former Trustee, BofA Funds Series Trust (11 funds), 2003-2011 | |
Alison Taunton-Rigby
901 S. Marquette Ave.
Minneapolis, MN 55402
1944 | | Board member since 11/02 for RiverSource Funds and since 6/11 for Nations Funds | | Managing Director, Forester Biotech (consulting) since 2001; Chief Executive Officer and Director, RiboNovix, Inc., (biotechnology) 2003-2010; President and Chief Executive Officer of CMT Inc., 2001-2003; Aquila Biopharmaceuticals Inc., 1996-2000; Cambridge Biotech Corporation, 1995-1996, Mitotix Inc., 1993-1994 | | | 127 | | | Director, Healthways, Inc. (health and well-being solutions) since 2005; Director, ICI Mutual Insurance Company, RRG since 2011; Director, Abt Associates (government contractor) since 2001; Director, Boston Children's Hospital since 2002 | |
Annual Report 2015
51
COLUMBIA MULTI-ADVISOR INTERNATIONAL EQUITY FUND
TRUSTEES AND OFFICERS (continued)
Interested Trustee Not Affiliated with Investment Manager*
Name,
Address,
Year of Birth | | Position Held With
Funds and Length of
Service | | Principal Occupation
During Past Five Years | | Number of
Funds in the
Fund Family
Overseen by
Board Member | | Other Present or Past
Directorships/
Trusteeships
(Within Past 5 Years) | |
Anthony M. Santomero
901 S. Marquette Ave.
Minneapolis, MN 55402
1946 | | Board member since 6/11 for RiverSource Funds and since 1/08 for Nations Funds | | Richard K. Mellon Professor Emeritus of Finance, The Wharton School, University of Pennsylvania, since 2002; Senior Advisor, McKinsey & Company (consulting), 2006-2008; President, Federal Reserve Bank of Philadelphia, 2000-2006, Professor of Finance, The Wharton School, University of Pennsylvania, 1972-2002 | | | 125 | | | Director, Renaissance Reinsurance Ltd. since May 2008; Trustee, Penn Mutual Life Insurance Company since March 2008; Director, Citigroup Inc. since 2009; Director, Citibank, N.A. since 2009; former Trustee, BofA Funds Series Trust (11 funds), 2008-2011 | |
* Dr. Santomero is not an affiliated person of the Investment Manager or Ameriprise Financial. However, he is currently deemed by the Funds to be an "interested person" (as defined in the 1940 Act) of the Funds because he serves as a Director of Citigroup Inc. and Citibank, N.A., companies that may directly or through subsidiaries and affiliates engage from time-to-time in brokerage execution, principal transactions and lending relationships with the Funds or accounts advised/managed by the Investment Manager.
Annual Report 2015
52
COLUMBIA MULTI-ADVISOR INTERNATIONAL EQUITY FUND
TRUSTEES AND OFFICERS (continued)
Interested Trustee Affiliated with Investment Manager*
Name,
Address,
Year of Birth | | Position Held With
Funds and Length of
Service | | Principal Occupation
During Past Five Years | | Number of
Funds in the
Fund Family
Overseen by
Board Member | | Other Present or Past
Directorships/
Trusteeships
(Within Past 5 Years) | |
William F. Truscott
53600 Ameriprise
Financial Center
Minneapolis, MN 55474
1960 | | Board member since 11/01 for RiverSource Funds and since 6/11 for Nations Funds; Senior Vice President since 2002 for RiverSource Funds and since 5/10 for Nations Funds | | Chairman of the Board and President, Columbia Management Investment Advisers, LLC since May 2010 and February 2012, respectively (previously President and Chief Investment Officer, 2001-April 2010); Chief Executive Officer, Global Asset Management, Ameriprise Financial, Inc. since September 2012 (previously Chief Executive Officer, U.S. Asset Management & President, Annuities, May 2010-September 2012 and President — U.S. Asset Management and Chief Investment Officer, 2005-April 2010); Director and Chief Executive Officer, Columbia Management Investment Distributors, Inc. since May 2010 and February 2012, respectively (previously Chairman of the Board and Chief Executive Officer, 2006-April 2010); Chairman of the Board and Chief Executive Officer, RiverSource Distributors, Inc. since 2006; Director, Threadneedle Asset Management Holdings, SARL since 2014; President and Chief Executive Officer, Ameriprise Certificate Company, 2006-August 2012 | | | 186 | | | Former Director, Ameriprise Certificate Company, 2006-January 2013 | |
* Interested person (as defined under the 1940 Act) by reason of being an officer, director, security holder and/or employee of the Investment Manager or Ameriprise Financial.
The Statement of Additional Information has additional information about the Fund's Board members and is available, without charge, upon request by calling 800.345.6611; contacting your financial intermediary or visiting columbiathreadneedle.com/us.
Annual Report 2015
53
COLUMBIA MULTI-ADVISOR INTERNATIONAL EQUITY FUND
TRUSTEES AND OFFICERS (continued)
The Board has appointed officers who are responsible for day-to-day business decisions based on policies it has established. The officers serve at the pleasure of the Board. In addition to Mr. Truscott, who is Senior Vice President, the Funds' other officers are:
Fund Officers
Name,
Address and
Year of Birth | | Position and Year
First Appointed to
Position for any Fund
in the Columbia
Funds Complex or a
Predecessor Thereof | | Principal Occupation(s) During Past Five Years | |
Christopher O. Petersen
5228 Ameriprise
Financial Center
Minneapolis, MN 55474
Born 1970 | | President and Principal Executive Officer (2015) | | Vice President and Lead Chief Counsel, Ameriprise Financial, Inc. since January 2015 (previously, Vice President and Chief Counsel January 2010-December 2014; and Vice President and Group Counsel or Counsel 2004-January 2010); officer of Columbia Funds and affiliated funds since 2007. | |
Michael G. Clarke
225 Franklin Street
Boston, MA 02110
Born 1969 | | Treasurer (2011) and Chief Financial Officer (2009) | | Vice President — Mutual Fund Administration, Columbia Management Investment Advisers, LLC, since May 2010; Managing Director of Fund Administration, Columbia Management Advisors, LLC, September 2004-April 2010; senior officer of Columbia Funds and affiliated funds since 2002. | |
Paul B. Goucher
100 Park Avenue
New York, NY 10017
Born 1968 | | Senior Vice President (2011), Chief Legal Officer (2015) and Assistant Secretary (2008) | | Vice President and Lead Chief Counsel, Ameriprise Financial, Inc. since November 2008 and January 2013, respectively (previously Chief Counsel, January 2010-January 2013 and Group Counsel, November 2008-January 2010). | |
Thomas P. McGuire
225 Franklin Street
Boston, MA 02110
Born 1972 | | Vice President and Chief Compliance Officer (2012) | | Vice President — Asset Management Compliance, Ameriprise Financial, Inc., since May 2010; Chief Compliance Officer, Ameriprise Certificate Company since September 2010; Compliance Executive, Bank of America, 2005-April 2010. | |
Colin Moore
225 Franklin Street
Boston, MA 02110
Born 1958 | | Senior Vice President (2010) | | Executive Vice President and Global Chief Investment Officer, Ameriprise Financial, Inc., since July 2013; Director and Global Chief Investment Officer, Columbia Management Investment Advisers, LLC since May 2010; Manager, Managing Director and Chief Investment Officer, Columbia Management Advisors, LLC, 2007-April 2010. | |
Michael E. DeFao
225 Franklin Street
Boston, MA 02110
Born 1968 | | Vice President (2011) and Assistant Secretary (2010) | | Vice President and Chief Counsel, Ameriprise Financial, Inc. since May 2010; Associate General Counsel, Bank of America, 2005-April 2010. | |
Joseph F. DiMaria
225 Franklin Street
Boston, MA 02110
Born 1968 | | Vice President (2011), Assistant Treasurer (2012) and Chief Accounting Officer (2008) | | Vice President — Mutual Fund Treasurer, Columbia Management Investment Advisers, LLC since May 2010; Director of Fund Administration, Columbia Management Advisors, LLC, 2006-April 2010. | |
Amy Johnson
5228 Ameriprise
Financial Center
Minneapolis, MN 55474
Born 1965 | | Vice President (2006) | | Managing Director and Chief Operating Officer, Columbia Management Investment Advisers, LLC since May 2010 (previously Chief Administrative Officer, 2009-April 2010, and Vice President — Asset Management and Trust Company Services, 2006-2009). | |
Lyn Kephart-Strong
5228 Ameriprise
Financial Center
Minneapolis, MN 55474
Born 1960 | | Vice President (2015) | | President, Columbia Management Investment Services Corp. since October 2014; Vice President & Resolution Officer, Ameriprise Trust Company since August 2009; President, RiverSource Service Corporation 2004-2010. | |
Ryan C. Larrenaga
225 Franklin Street
Boston, MA 02110
Born 1970 | | Vice President and Secretary (2015) | | Vice President and Group Counsel, Ameriprise Financial, Inc. since August 2011 (previously, Counsel from May 2010 to August 2011); Assistant General Counsel, Bank of America, 2005-April 2010; officer of Columbia Funds and affiliated funds since 2005. | |
Annual Report 2015
54
COLUMBIA MULTI-ADVISOR INTERNATIONAL EQUITY FUND
IMPORTANT INFORMATION ABOUT THIS REPORT
Each fund mails one shareholder report to each shareholder address. If you would like more than one report, please call shareholder services at 800.345.6611 and additional reports will be sent to you.
The policy of the Board is to vote the proxies of the companies in which each fund holds investments consistent with the procedures as stated in the Statement of Additional Information (SAI). You may obtain a copy of the SAI without charge by calling 800.345.6611; contacting your financial intermediary; visiting columbiathreadneedle.com/us; or searching the website of the Securities and Exchange Commission (SEC) at sec.gov. Information regarding how each fund voted proxies relating to portfolio securities is filed with the SEC by August 31st for the most recent 12-month period ending June 30th of that year, and is available without charge by visiting columbiathreadneedle.com/us; or searching the website of the SEC at sec.gov.
Each fund files a complete schedule of portfolio holdings with the SEC for the first and third quarters of each fiscal year on Form N-Q. Each fund's Form N-Q is available on the SEC's website at sec.gov and may be reviewed and copied at the SEC's Public Reference Room in Washington, D.C. Information on the operation of the Public Reference Room may be obtained by calling 800.SEC.0330. Each fund's complete schedule of portfolio holdings, as filed on Form N-Q, can also be obtained without charge, upon request, by calling 800.345.6611.
Annual Report 2015
55
Columbia Multi-Advisor International Equity Fund
P.O. Box 8081
Boston, MA 02266-8081

This information is for use with concurrent or prior delivery of a fund prospectus. Please read and consider the investment objectives, risks, charges and expenses for any fund carefully before investing. For a prospectus and summary prospectus, which contains this and other important information about the Fund, go to columbiathreadneedle.com/us. The Fund is distributed by Columbia Management Investment Distributors, Inc., member FINRA, and managed by Columbia Management Investment Advisers, LLC.
Columbia Threadneedle Investments (Columbia Threadneedle) is the global brand name of the Columbia and Threadneedle group of companies.
All rights reserved. Columbia Management Investment Distributors, Inc., 225 Franklin Street, Boston, MA 02110-2804
© 2015 Columbia Management Investment Advisers, LLC.
columbiathreadneedle.com/us
ANN201_02_E01_(04/15)

ANNUAL REPORT
February 28, 2015

COLUMBIA OVERSEAS VALUE FUND

ABOUT COLUMBIA THREADNEEDLE INVESTMENTS
Columbia Threadneedle Investments is a leading global asset management group that provides a broad range of actively managed investment strategies and solutions for individual, institutional and corporate clients around the world.
With more than 2,000 people, including over 450 investment professionals based in North America, Europe and Asia, we manage $506 billion* of assets across developed and emerging market equities, fixed income, asset allocation solutions and alternatives. We are the 11th largest manager of long-term mutual fund assets in the U.S.** and the 5th largest manager of retail funds in the U.K.***
Our priority is the investment success of our clients. We aim to deliver the investment outcomes they expect through an investment approach that is team-based, performance-driven and risk-aware. Our culture is dynamic and interactive. By sharing our insights across asset classes and geographies, we generate richer perspectives on global, regional and local investment landscapes. The ability to exchange and debate investment ideas in a collaborative environment enriches our teams' investment processes. More importantly, it results in better informed investment decisions for our clients.
Columbia funds are distributed by Columbia Management Investment Distributors, Inc., member FINRA, and managed by Columbia Management Investment Advisers, LLC.
Columbia Threadneedle Investments (Columbia Threadneedle) is the global brand name of the Columbia and Threadneedle group of companies.
* In U.S. dollars as of December 31, 2014. Source: Ameriprise Q4 Earnings Release. Includes all assets managed by entities in the Columbia and Threadneedle groups of companies. Contact us for more current data.
** Source: ICI as of December 31, 2014 for Columbia Management Investment Advisers, LLC.
*** Source: Investment Association as of December 2014 for Threadneedle Asset Management Limited.
© 2015 Columbia Management Investment Advisers, LLC. All rights reserved.
Not part of the shareholder report
Get the market insight you need from our investment experts
Connect with Columbia Threadneedle Investments
Investor insight
Find economic and market commentary, investment videos, white papers, mutual fund commentary and more at columbiathreadneedle.com/us.
Columbia Threadneedle Investor Newsletter (e-newsletter)
Read our award-winning* shareholder newsletter. Our quarterly newsletter is available online and provides timely and relevant content about economic trends, fund news, service enhancements and changes. Sign up to receive the newsletter electronically at columbiathreadneedle.com/
us/newsletter.
Investment videos
Get analysis of current events and trends that may affect your investments. Visit our online video library to watch and discover what our thought leaders are saying about the financial markets and economy.
Social media
We offer you multiple ways to access our market commentary and investment insights.
n Perspectives blog at columbiathreadneedle.com/us
Read timely posts by our investment team, including our chief investment officer, chief economist and portfolio managers.
n twitter.com/CTinvest_US
Follow us on Twitter for quick, up-to-the-minute comments on market news and more.
n youtube.com/CTinvestUS
View our commentaries on the economy, markets and current investment opportunities.
n linkedin.com/company/columbia-threadneedle-investments-us
Connect with us on LinkedIn for updates from our thought leaders.
*Columbia Threadneedle Investor Newsletter was awarded top honors in the Mutual Fund Education Alliance STAR Awards competition for excellence in mutual fund marketing and communications in 2011, 2012 and 2013. Materials in the competition were evaluated on educational value, message comprehension, effective design and objectives.
Not part of the shareholder report
Stay informed
Become a subscriber to receive the latest investment publications and mutual fund commentaries
Subscribe to Columbia Threadneedle Investments
Email subscription center
Subscribe to the latest information from Columbia Threadneedle. Visit our email subscription center at columbiathreadneedle.com/us/subscribe to register for economic and market commentary, product and service updates, white papers and more.
n Columbia Threadneedle Investor Newsletter
Quarterly newsletter featuring the latest macro- and micro-economic trends, investment themes, products, service changes and other items of interest to our investors
n Investment Strategy Outlook
Quarterly publication featuring the Columbia Threadneedle Asset Allocation Team's perspective on global economic investment conditions and markets
n MarketTrack
Quarterly publication featuring more than 40 charts and graphs that highlight the current state of the economy and the markets; includes straightforward insight on current investment opportunities
n White papers
Frequent articles that delve deep into a variety of investment topics
n Mutual fund updates
Quarterly portfolio manager commentary and fund fact sheets available for Columbia funds. (Not all funds have a commentary.)
Register your information online at columbiathreadneedle.com/us/subscribe and select the publications you would like to receive. Update your subscriptions at any time by accessing the email subscription center.
CT-MK (03/15) 5383/1125800
 Dear Shareholder,
In a world that is changing faster than ever before, investors want asset managers who offer a global perspective while generating strong and sustainable returns. To that end, Columbia Management, in conjunction with its U.K.-based affiliate, Threadneedle Investments, has rebranded to Columbia Threadneedle Investments. The new global brand represents the combined capabilities, resources and reach of the global group, offering investors access to the best of both firms.
With a presence in 18 countries and more than 450 investment professionals*, our collective perspective and world view as Columbia Threadneedle Investments gives us deeper insight into what might affect the real-life financial outcomes clients are seeking. Putting our views into a global context enables us to build richer perspectives and create the right solutions, and provides us with enhanced capabilities to deliver consistent investment performance, which may ultimately lead to better investor outcomes.
As a result of the rebrand, you will begin to see our new logo and colors reflected in printed materials, such as this shareholder report, as well as on our new website — columbiathreadneedle.com/us. We encourage you to visit us online and view a new video on the "About Us" tab that speaks to the strength of the firm.
While we are introducing a new brand, in many ways, the investment company you know well has not changed. The following remain in effect:
n Fund and strategy names
n Established investment teams, philosophies and processes
n Account services, features, servicing phone numbers and mailing addresses
n Columbia Management Investment Distributors as distributor and Columbia Management Investment Advisers as investment adviser
We recognize that the money we manage represents the hard work and savings of people like you, and that everyone has different ambitions and different definitions of success. Investors have varying goals — funding their children's education, enjoying their retirement, putting money aside for unexpected events, and more. Whatever your ambitions, we believe our wide range of investment products and solutions can help give you confidence that you will reach your goals.
The world is constantly changing, but our priority remains the same: to help you secure your finances, meet your goals and achieve success. Thank you for your continued investment with us. Our service representatives are available at 800.345.6611 to help with any questions.
Sincerely,

Christopher O. Petersen
President, Columbia Funds
Investors should consider the investment objectives, risks, charges and expenses of a mutual fund carefully before investing. For a free prospectus and summary prospectus, which contains this and other important information about a fund, visit columbiathreadneedle.com/us. The prospectus should be read carefully before investing.
* Source: Ameriprise as of December 1, 2014
Columbia Funds are distributed by Columbia Management Investment Distributors, Inc., member FINRA, and managed by Columbia Management Investment Advisers, LLC.
© 2015 Columbia Management Investment Advisers, LLC. All rights reserved.
COLUMBIA OVERSEAS VALUE FUND
Fund Investment Manager
Columbia Management Investment
Advisers, LLC
225 Franklin Street
Boston, MA 02110
Fund Distributor
Columbia Management Investment
Distributors, Inc.
225 Franklin Street
Boston, MA 02110
Fund Transfer Agent
Columbia Management Investment
Services Corp.
P.O. Box 8081
Boston, MA 02266-8081
For more information about any of the funds, please visit columbiathreadneedle.com/us or call 800.345.6611. Customer Service Representatives are available to answer your questions Monday through Friday from 8 a.m. to 7 p.m. Eastern time.
The views expressed in this report reflect the current views of the respective parties. These views are not guarantees of future performance and involve certain risks, uncertainties and assumptions that are difficult to predict, so actual outcomes and results may differ significantly from the views expressed. These views are subject to change at any time based upon economic, market or other conditions and the respective parties disclaim any responsibility to update such views. These views may not be relied on as investment advice and, because investment decisions for a Columbia fund are based on numerous factors, may not be relied on as an indication of trading intent on behalf of any particular Columbia fund. References to specific securities should not be construed as a recommendation or investment advice.
Performance Overview | | | 3 | | |
Manager Discussion of Fund Performance | | | 5 | | |
Understanding Your Fund's Expenses | | | 8 | | |
Portfolio of Investments | | | 9 | | |
Statement of Assets and Liabilities | | | 15 | | |
Statement of Operations | | | 17 | | |
Statement of Changes in Net Assets | | | 18 | | |
Financial Highlights | | | 20 | | |
Notes to Financial Statements | | | 27 | | |
Report of Independent Registered
Public Accounting Firm | | | 39 | | |
Federal Income Tax Information | | | 40 | | |
Trustees and Officers | | | 41 | | |
Important Information About This Report | | | 47 | | |
COLUMBIA OVERSEAS VALUE FUND
Performance Summary
n Columbia Overseas Value Fund (the Fund) Class A shares returned -2.92% excluding sales charges for the 12-month period that ended February 28, 2015.
n The Fund underperformed its benchmark, the MSCI EAFE Value Index (Net), which returned -1.58% for the same period.
n The Fund's tilt toward growth at the beginning of the period generally accounted for its shortfall relative to the benchmark.
Average Annual Total Returns (%) (for period ended February 28, 2015)
| | | Inception | | 1 Year | | 5 Years | | Life | |
Class A* | | 02/28/13 | | | | | | | |
Excluding sales charges | | | | | -2.92 | | | | 6.77 | | | | 0.57 | | |
Including sales charges | | | | | -8.49 | | | | 5.50 | | | | -0.29 | | |
Class B* | | 02/28/13 | | | | | | | |
Excluding sales charges | | | | | -3.60 | | | | 5.98 | | | | -0.19 | | |
Including sales charges | | | | | -8.30 | | | | 5.66 | | | | -0.19 | | |
Class C* | | 02/28/13 | | | | | | | |
Excluding sales charges | | | | | -3.60 | | | | 5.98 | | | | -0.19 | | |
Including sales charges | | | | | -4.54 | | | | 5.98 | | | | -0.19 | | |
Class I* | | 03/31/11 | | | -2.43 | | | | 7.35 | | | | 1.12 | | |
Class K* | | 02/28/13 | | | -2.73 | | | | 6.81 | | | | 0.57 | | |
Class W* | | 03/31/11 | | | -2.93 | | | | 7.01 | | | | 0.86 | | |
Class Z | | 03/31/08 | | | -2.56 | | | | 7.24 | | | | 1.04 | | |
MSCI EAFE Value Index (Net) | | | | | -1.58 | | | | 6.93 | | | | 1.29 | | |
Returns for Class A are shown with and without the maximum initial sales charge of 5.75%. Returns for Class B are shown with and without the applicable contingent deferred sales charge (CDSC) of 5.00% in the first year, declining to 1.00% in the sixth year and eliminated thereafter. Returns for Class C are shown with and without the 1.00% CDSC for the first year only. The Fund's other classes are not subject to sales charges and have limited eligibility. Please see the Fund's prospectus for details. Performance for different share classes will vary based on differences in sales charges and fees associated with each class. All results shown assume reinvestment of distributions during the period. Returns do not reflect the deduction of taxes that a shareholder may pay on Fund distributions or on the redemption of Fund shares. Performance results reflect the effect of any fee waivers or reimbursements of Fund expenses by Columbia Management Investment Advisers, LLC and/or any of its affiliates. Absent these fee waivers or expense reimbursement arrangements, performance results would have been lower.
The performance information shown represents past performance and is not a guarantee of future results. The investment return and principal value of your investment will fluctuate so that your shares, when redeemed, may be worth more or less than their original cost. Current performance may be lower or higher than the performance information shown. You may obtain performance information current to the most recent month-end by contacting your financial intermediary, visiting columbiathreadneedle.com/us or calling 800.345.6611.
*The returns shown for periods prior to the share class inception date (including returns for the Life of the Fund, if shown, which are since Fund inception) include the returns of the Fund's oldest share class. These returns are adjusted to reflect any higher class-related operating expenses of the newer share classes, as applicable. Please visit columbiathreadneedle.com/us/investment-products/mutual-funds/appended-performance for more information.
The MSCI EAFE Value Index (Net) is a subset of the MSCI EAFE Index (Net), and constituents of the index include securities from Europe, Australasia and the Far East. The index generally represents approximately 50% of the free float-adjusted market capitalization of the MSCI EAFE Index (Net), and consists of those securities classified by MSCI Inc. as most representing the value style, such as, higher book value-to-price ratios, higher forward earnings-to-price ratios, higher dividend yields and lower forecasted growth rates than securities representing the growth style.
Indices are not available for investment, are not professionally managed and do not reflect sales charges, fees, brokerage commissions, taxes (except the MSCI EAFE Value Index (Net), which reflects reinvested dividends net of withholding taxes) or other expenses of investing. Securities in the Fund may not match those in an index.
Annual Report 2015
3
COLUMBIA OVERSEAS VALUE FUND
PERFORMANCE OVERVIEW (continued)
Performance of a Hypothetical $10,000 Investment (March 31, 2008 – February 28, 2015)
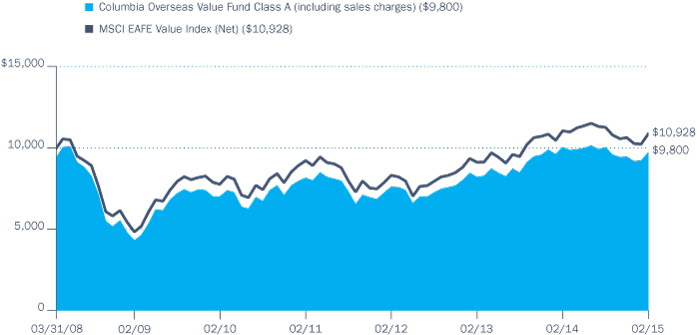
The chart above shows the change in value of a hypothetical $10,000 investment in Class A shares of Columbia Overseas Value Fund during the stated time period, and does not reflect the deduction of taxes that a shareholder may pay on Fund distributions or on the redemption of Fund shares.
Annual Report 2015
4
COLUMBIA OVERSEAS VALUE FUND
MANAGER DISCUSSION OF FUND PERFORMANCE
At February 28, 2015, approximately 41% of the Fund's shares were owned in the aggregate by affiliated funds-of-funds managed by Columbia Management Investment Advisers, LLC (the Investment Manager). As a result of asset allocation decisions by the Investment Manager, it is possible that the Fund may experience relatively large purchases or redemptions from affiliated funds-of-funds. The Investment Manager seeks to minimize the impact of these transactions by structuring them over a reasonable period of time. The Fund may experience increased expenses as it buys and sells securities as a result of purchases or redemptions by affiliated funds-of-funds.
For the 12-month period that ended February 28, 2015, the Fund's Class A shares returned -2.92% excluding sales charges. The Fund underperformed its benchmark, the MSCI EAFE Value Index (Net), which returned -1.58% for the same period. The Fund's tilt toward growth at the beginning of the period generally accounted for its shortfall relative to the benchmark.
Global Stock Market Returns Trimmed by Rising U.S. Dollar
The stock markets of developed economies rose nicely over the 12-month period ended February 28, 2015. The benchmark gained 15.00% when measured in local currencies. However, when measured in U.S. dollars — the return most significant to U.S. investors — the results were slightly negative for the period as the dollar rose against major currencies. Despite any number of concerns that could have rattled markets, such as civil war in the Ukraine and continued unrest in the Middle East, all countries and sectors in the benchmark were positive performers for the year, when measured in local currencies. Energy was the notable exception, as the sector was weighed down by as much as a 60% drop in the price of oil.
Contributors and Detractors
The Fund's tilt toward growth at the beginning of the period generally accounted for its modest shortfall relative to the benchmark. We expected global growth to continue its previous steady pace of recovery. However, growth came in well below expectations early in the 12-month period, inflation collapsed and interest rates, in turn, fell sharply. Against this backdrop, the Fund was underexposed to some of the slower growth, higher yielding sectors, such as telecommunication services and utilities, which were the big beneficiaries as investors scrambled for yield.
Yet, there were bright spots that bolstered returns. An out-of-benchmark position in biotechnology yielded several solid performers for the period. We have observed that many major global pharmaceutical companies have propped up earnings by cutting research and development expenditures, which can help in the near term but puts the longer-term pipeline of drugs at risk. Ultimately we believe this pipeline will need to be replenished, and the most obvious source would be through acquisitions of biotechnology companies that have experienced key breakthroughs in potentially promising products and therapies. With this in mind, we invested in Puma Biotechnology and Auspex Pharmaceuticals, both of which experienced
Portfolio Management
Fred Copper, CFA
Daisuke Nomoto, CMA (SAAJ)
Morningstar Style BoxTM

The Morningstar Style BoxTM is based on a fund's portfolio holdings. For equity funds, the vertical axis shows the market capitalization of the stocks owned, and the horizontal axis shows investment style (value, blend, or growth). Information shown is based on the most recent data provided by Morningstar.
© 2015 Morningstar, Inc. All rights reserved. The Morningstar information contained herein: (1) is proprietary to Morningstar and/or its content providers; (2) may not be copied or distributed; and (3) is not warranted to be accurate, complete or timely. Neither Morningstar nor its content providers are responsible for any damages or losses arising from any use of this information.
Top Ten Holdings (%)
(at February 28, 2015) | |
Royal Dutch Shell PLC, Class B
(United Kingdom) | | | 3.9 | | |
HSBC Holdings PLC
(United Kingdom) | | | 2.3 | | |
Allianz SE, Registered Shares
(Germany) | | | 2.2 | | |
ING Groep NV-CVA (Netherlands) | | | 2.1 | | |
BNP Paribas SA (France) | | | 2.1 | | |
AXA SA (France) | | | 2.0 | | |
Koninklijke Ahold NV
(Netherlands) | | | 1.7 | | |
Nordea Bank AB (Sweden) | | | 1.7 | | |
Bezeq Israeli
Telecommunication Corp., Ltd.
(The) (Israel) | | | 1.6 | | |
Smurfit Kappa Group PLC
(Ireland) | | | 1.6 | | |
Percentages indicated are based upon total investments (excluding Money Market Funds).
Annual Report 2015
5
COLUMBIA OVERSEAS VALUE FUND
MANAGER DISCUSSION OF FUND PERFORMANCE (continued)
For further detail about these holdings, please refer to the section entitled "Portfolio of Investments."
Fund holdings are as of the date given, are subject to change at any time, and are not recommendations to buy or sell any security.
Portfolio Breakdown (%)
(at February 28, 2015) | |
Common Stocks | | | 98.5 | | |
Consumer Discretionary | | | 13.3 | | |
Consumer Staples | | | 3.8 | | |
Energy | | | 9.0 | | |
Financials | | | 35.0 | | |
Health Care | | | 8.4 | | |
Industrials | | | 7.9 | | |
Information Technology | | | 7.0 | | |
Materials | | | 4.5 | | |
Telecommunication Services | | | 5.5 | | |
Utilities | | | 4.1 | | |
Exchange-Traded Funds | | | 1.2 | | |
Money Market Funds | | | 0.3 | | |
Total | | | 100.0 | | |
Percentages indicated are based upon total investments. The Fund's portfolio composition is subject to change.
Investment Risks
Market risk may affect a single issuer, sector of the economy, industry or the market as a whole. Value securities may be unprofitable if the market fails to recognize their intrinsic worth or the portfolio manager misgauged that worth. International investing involves certain risks and volatility due to potential political, economic or currency instabilities and different financial and accounting standards. Risks are enhanced for emerging market issuers. Investing in derivatives is a specialized activity that involves special risks that subject the Fund to significant loss potential, including when used as leverage, and may result in greater fluctuation in Fund value. See the Fund's prospectus for more information on these and other risks.
double-digit gains because of recent success from clinical trials of treatments with considerable market potential. Phase 3 trials for Puma Biotechnology's supplemental breast cancer treatment showed a magnitude of benefit greater than the market was expecting. The market potential for this type of treatment is in the billions of dollars. Auspex Pharmaceuticals announced positive top line efficacy and safety results from its Phase 3 program related to the treatment of Huntington's disease.
In addition, the Fund was overweight in consumer discretionary stocks, particularly in Japanese automotive companies. As the Japanese yen weakened, the profits of many of Japan's automakers received a significant boost. Two of the Fund's top performing stocks for the period were Fuji Heavy Industries, maker of Subaru, and Toyo Tire & Rubber Co. Both enjoyed significant gains. An underweight in the lagging materials sector also aided performance.
By contrast, stock selection within the information technology sector detracted from performance. Xchanging, a London based business process outsourcer, was down sharply for the year, as a ramp up in capital spending coincided with a slowdown in some of its key markets, resulting in an unexpected drop in cash flow. In the financial sector, K. Wah International, a Hong Kong-based property developer, weighed on performance as its position in Galaxy Entertainment, a Macau casino operator, suffered due to a crackdown by the Chinese government on the use of Macau casinos as a way for Chinese nationals to move money out of China. We sold K. Wah International. An out-of-benchmark investment in two Korean home shopping channel operators also hurt performance. Hyundai Home Shopping Network and GS Home Shopping fell as consumer spending weakened.
We hedge active currency exposure in the portfolio using currency forward contracts. These contracts had an overall negative impact on Fund results during the period.
Looking Ahead
We are fairly optimistic at this time in our outlook for global stock markets in the year ahead, particularly outside the United States. Japan has embarked on a dramatic program of reform, which has thus far relied primarily on benefits achieved through a weaker yen, but which progressively emphasizes true structural change in the economy. We believe this has the potential to bolster the Japanese stock market. In Europe, the combination of a weaker euro, falling oil prices, a rejuvenated banking sector and aggressive monetary policy all have the potential to contribute to strong performance across the continent. Commodity-exposed areas, such as Australia and many emerging markets, may face tough tests in 2015, as the dramatic fall in many commodity prices puts strains on corporate and government finances.
Against this backdrop, we have maintained the Fund's bias towards more growth-oriented stocks. We have not compromised our requirements for value; however, in an environment of low global economic growth, which we believe we are in, growth is a scarce commodity. As a result, we have actively sought value within areas of the market that are more growth-
Annual Report 2015
6
COLUMBIA OVERSEAS VALUE FUND
MANAGER DISCUSSION OF FUND PERFORMANCE (continued)
focused. Although this approach was a significant impediment to performance early in the prior period, when large, defensive value stocks were in favor, we believe it helped later in the fiscal year; and we believe it has the potential to be an enduring theme in market leadership in the period ahead.
Country Breakdown (%)
(at February 28, 2015) | |
Australia | | | 4.3 | | |
Belgium | | | 1.9 | | |
Denmark | | | 0.7 | | |
France | | | 9.7 | | |
Germany | | | 6.8 | | |
Hong Kong | | | 1.3 | | |
Ireland | | | 2.8 | | |
Israel | | | 1.6 | | |
Italy | | | 4.1 | | |
Japan | | | 22.7 | | |
Netherlands | | | 3.8 | | |
Norway | | | 1.8 | | |
Portugal | | | 0.0 | (a) | |
Singapore | | | 1.6 | | |
South Korea | | | 2.1 | | |
Spain | | | 3.8 | | |
Sweden | | | 2.6 | | |
Switzerland | | | 3.9 | | |
Taiwan | | | 1.1 | | |
United Kingdom | | | 18.7 | | |
United States(b) | | | 4.7 | | |
Total | | | 100.0 | | |
Country Breakdown is based primarily on issuer's place of organization/incorporation. Percentages indicated are based upon total investments. The Fund's portfolio composition is subject to change.
(a) Rounds to zero.
(b) Includes investments in Money Market Funds and Exchange-Traded Funds.
Annual Report 2015
7
COLUMBIA OVERSEAS VALUE FUND
UNDERSTANDING YOUR FUND'S EXPENSES
(Unaudited)
As an investor, you incur two types of costs. There are transaction costs, which generally include sales charges on purchases and may include redemption fees. There are also ongoing costs, which generally include management fees, distribution and/or service fees, and other fund expenses. The following information is intended to help you understand your ongoing costs (in dollars) of investing in the Fund and to help you compare these costs with the ongoing costs of investing in other mutual funds.
Analyzing Your Fund's Expenses
To illustrate these ongoing costs, we have provided examples and calculated the expenses paid by investors in each share class of the Fund during the period. The actual and hypothetical information in the table is based on an initial investment of $1,000 at the beginning of the period indicated and held for the entire period. Expense information is calculated two ways and each method provides you with different information. The amount listed in the "Actual" column is calculated using the Fund's actual operating expenses and total return for the period. You may use the Actual information, together with the amount invested, to estimate the expenses that you paid over the period. Simply divide your account value by $1,000 (for example, an $8,600 account value divided by $1,000 = 8.6), then multiply the results by the expenses paid during the period under the "Actual" column. The amount listed in the "Hypothetical" column assumes a 5% annual rate of return before expenses (which is not the Fund's actual return) and then applies the Fund's actual expense ratio for the period to the hypothetical return. You should not use the hypothetical account values and expenses to estimate either your actual account balance at the end of the period or the expenses you paid during the period. See "Compare With Other Funds" below for details on how to use the hypothetical data.
Compare With Other Funds
Since all mutual funds are required to include the same hypothetical calculations about expenses in shareholder reports, you can use this information to compare the ongoing cost of investing in the Fund with other funds. To do so, compare the hypothetical example with the 5% hypothetical examples that appear in the shareholder reports of other funds. As you compare hypothetical examples of other funds, it is important to note that hypothetical examples are meant to highlight the ongoing costs of investing in a fund only and do not reflect any transaction costs, such as sales charges, or redemption or exchange fees. Therefore, the hypothetical calculations are useful in comparing ongoing costs only, and will not help you determine the relative total costs of owning different funds. If transaction costs were included in these calculations, your costs would be higher.
September 1, 2014 – February 28, 2015
| | | Account Value at the Beginning
of the Period ($) | | Account Value at the End of the
Period ($) | | Expenses Paid During the
Period ($) | | Fund's Annualized
Expense Ratio (%) | |
| | | Actual | | Hypothetical | | Actual | | Hypothetical | | Actual | | Hypothetical | | Actual | |
Class A | | | 1,000.00 | | | | 1,000.00 | | | | 971.40 | | | | 1,017.90 | | | | 6.93 | | | | 7.09 | | | | 1.41 | | |
Class B | | | 1,000.00 | | | | 1,000.00 | | | | 967.90 | | | | 1,014.16 | | | | 10.60 | | | | 10.85 | | | | 2.16 | | |
Class C | | | 1,000.00 | | | | 1,000.00 | | | | 967.90 | | | | 1,014.16 | | | | 10.60 | | | | 10.85 | | | | 2.16 | | |
Class I | | | 1,000.00 | | | | 1,000.00 | | | | 974.60 | | | | 1,020.34 | | | | 4.53 | | | | 4.63 | | | | 0.92 | | |
Class K | | | 1,000.00 | | | | 1,000.00 | | | | 973.10 | | | | 1,018.85 | | | | 6.00 | | | | 6.14 | | | | 1.22 | | |
Class W | | | 1,000.00 | | | | 1,000.00 | | | | 971.40 | | | | 1,017.90 | | | | 6.93 | | | | 7.09 | | | | 1.41 | | |
Class Z | | | 1,000.00 | | | | 1,000.00 | | | | 973.60 | | | | 1,019.15 | | | | 5.71 | | | | 5.84 | | | | 1.16 | | |
Expenses paid during the period are equal to the annualized expense ratio for each class as indicated above, multiplied by the average account value over the period and then multiplied by the number of days in the Fund's most recent fiscal half year and divided by 365.
Expenses do not include fees and expenses incurred indirectly by the Fund from its investment in underlying funds, including affiliated and non-affiliated pooled investment vehicles, such as mutual funds and exchange-traded funds.
Annual Report 2015
8
COLUMBIA OVERSEAS VALUE FUND
PORTFOLIO OF INVESTMENTS
February 28, 2015
(Percentages represent value of investments compared to net assets)
Common Stocks 98.0%
Issuer | | Shares | | Value ($) | |
AUSTRALIA 4.2% | |
Australia and New Zealand Banking
Group Ltd. | | | 330,265 | | | | 9,111,261 | | |
Macquarie Group Ltd. | | | 143,349 | | | | 8,147,356 | | |
National Australia Bank Ltd. | | | 177,176 | | | | 5,242,151 | | |
Westpac Banking Corp. | | | 227,416 | | | | 6,764,558 | | |
Total | | | | | 29,265,326 | | |
BELGIUM 1.9% | |
Delhaize Group SA | | | 45,301 | | | | 4,064,652 | | |
KBC Groep NV(a) | | | 152,257 | | | | 9,238,178 | | |
Total | | | | | 13,302,830 | | |
DENMARK 0.7% | |
Novo Nordisk A/S, Class B | | | 101,561 | | | | 4,869,092 | | |
FRANCE 9.7% | |
AXA SA | | | 546,455 | | | | 13,875,174 | | |
BNP Paribas SA | | | 242,217 | | | | 14,119,149 | | |
Casino Guichard Perrachon SA | | | 73,912 | | | | 6,956,015 | | |
CNP Assurances | | | 401,502 | | | | 6,656,393 | | |
Publicis Groupe SA | | | 110,585 | | | | 9,017,674 | | |
Sanofi | | | 70,885 | | | | 6,956,703 | | |
Total SA | | | 172,199 | | | | 9,294,852 | | |
Total | | | | | 66,875,960 | | |
GERMANY 6.8% | |
Allianz SE, Registered Shares | | | 89,223 | | | | 14,936,814 | | |
BASF SE | | | 53,552 | | | | 5,132,780 | | |
Continental AG | | | 36,781 | | | | 8,779,382 | | |
Duerr AG | | | 47,914 | | | | 5,125,897 | | |
Freenet AG | | | 314,941 | | | | 9,397,673 | | |
Jenoptik AG | | | 251,779 | | | | 3,475,427 | | |
Total | | | | | 46,847,973 | | |
HONG KONG 1.3% | |
Cheung Kong Holdings Ltd. | | | 464,000 | | | | 9,184,334 | | |
IRELAND 2.8% | |
Amarin Corp. PLC, ADR(a) | | | 895,043 | | | | 1,351,515 | | |
Dragon Oil PLC | | | 865,047 | | | | 7,205,041 | | |
Smurfit Kappa Group PLC | | | 390,027 | | | | 10,926,771 | | |
Total | | | | | 19,483,327 | | |
Common Stocks (continued)
Issuer | | Shares | | Value ($) | |
ISRAEL 1.6% | |
Bezeq Israeli Telecommunication Corp.,
Ltd. (The) | | | 6,979,174 | | | | 11,153,801 | | |
ITALY 4.1% | |
Banco Popolare SC(a) | | | 273,070 | | | | 4,210,879 | | |
Enel SpA | | | 1,752,010 | | | | 8,073,698 | | |
ENI SpA | | | 332,724 | | | | 6,210,545 | | |
Esprinet SpA | | | 443,852 | | | | 3,737,612 | | |
Recordati SpA | | | 352,048 | | | | 6,338,806 | | |
Total | | | | | 28,571,540 | | |
JAPAN 22.6% | |
Aozora Bank Ltd. | | | 1,229,000 | | | | 4,430,410 | | |
Central Japan Railway Co. | | | 56,500 | | | | 10,512,891 | | |
COMSYS Holdings Corp. | | | 392,800 | | | | 4,753,111 | | |
CyberAgent, Inc. | | | 85,600 | | | | 4,419,176 | | |
CYBERDYNE, Inc.(a) | | | 50,000 | | | | 1,240,095 | | |
Daiichikosho Co., Ltd. | | | 301,600 | | | | 9,504,329 | | |
Fuji Heavy Industries Ltd. | | | 267,500 | | | | 9,119,501 | | |
Fuyo General Lease Co., Ltd. | | | 135,100 | | | | 4,713,189 | | |
Hoya Corp. | | | 191,400 | | | | 7,727,269 | | |
Hulic REIT, Inc. | | | 2,775 | | | | 4,215,170 | | |
Invincible Investment Corp. | | | 6,867 | | | | 3,069,547 | | |
IT Holdings Corp. | | | 219,500 | | | | 3,859,791 | | |
ITOCHU Corp. | | | 519,100 | | | | 5,813,668 | | |
KDDI Corp. | | | 114,600 | | | | 7,953,403 | | |
Kenedix Retail REIT Corp.(a) | | | 702 | | | | 1,605,577 | | |
Keyence Corp. | | | 8,500 | | | | 4,346,915 | | |
Mazda Motor Corp. | | | 199,500 | | | | 4,276,609 | | |
Mitsubishi UFJ Financial Group, Inc. | | | 1,415,800 | | | | 9,221,041 | | |
Nakanishi, Inc. | | | 133,300 | | | | 5,123,197 | | |
Nihon M&A Center, Inc. | | | 188,300 | | | | 6,210,563 | | |
Nishi-Nippon City Bank Ltd. (The) | | | 1,337,000 | | | | 4,285,560 | | |
ORIX Corp. | | | 346,000 | | | | 4,919,869 | | |
Sumitomo Mitsui Financial Group, Inc. | | | 224,600 | | | | 8,948,867 | | |
Tanseisha Co., Ltd. | | | 483,900 | | | | 3,253,044 | | |
Temp Holdings Co., Ltd. | | | 163,200 | | | | 5,485,651 | | |
Tokai Tokyo Financial Holdings, Inc. | | | 663,000 | | | | 4,870,541 | | |
Toyo Tire & Rubber Co., Ltd. | | | 308,200 | | | | 6,976,671 | | |
The accompanying Notes to Financial Statements are an integral part of this statement.
Annual Report 2015
9
COLUMBIA OVERSEAS VALUE FUND
PORTFOLIO OF INVESTMENTS (continued)
February 28, 2015
Common Stocks (continued)
Issuer | | Shares | | Value ($) | |
Toyota Motor Corp. | | | 80,500 | | | | 5,441,335 | | |
Total | | | | | 156,296,990 | | |
NETHERLANDS 3.7% | |
ING Groep NV-CVA(a) | | | 954,706 | | | | 14,268,000 | | |
Koninklijke Ahold NV | | | 622,120 | | | | 11,671,516 | | |
Total | | | | | 25,939,516 | | |
NORWAY 1.7% | |
Atea ASA | | | 427,530 | | | | 4,824,041 | | |
Kongsberg Automotive ASA(a) | | | 7,851,761 | | | | 5,827,841 | | |
Spectrum ASA | | | 334,620 | | | | 1,440,437 | | |
Total | | | | | 12,092,319 | | |
PORTUGAL —% | |
Banco Espirito Santo SA, Registered
Shares(a)(b) | | | 2,753,345 | | | | 123,245 | | |
SINGAPORE 1.6% | |
DBS Group Holdings Ltd. | | | 762,000 | | | | 10,926,176 | | |
SOUTH KOREA 2.1% | |
GS Home Shopping, Inc. | | | 21,002 | | | | 4,481,147 | | |
Hyundai Home Shopping Network Corp. | | | 51,017 | | | | 6,227,607 | | |
LF Corp. | | | 142,633 | | | | 4,095,750 | | |
Total | | | | | 14,804,504 | | |
SPAIN 3.8% | |
Banco Santander SA | | | 823,672 | | | | 6,021,664 | | |
Endesa SA | | | 500,295 | | | | 10,116,583 | | |
Iberdrola SA | | | 1,473,816 | | | | 10,072,117 | | |
Total | | | | | 26,210,364 | | |
SWEDEN 2.6% | |
Nordea Bank AB | | | 858,278 | | | | 11,581,657 | | |
Saab AB, Class B | | | 244,084 | | | | 6,537,598 | | |
Total | | | | | 18,119,255 | | |
SWITZERLAND 3.9% | |
Autoneum Holding AG | | | 41,470 | | | | 7,738,515 | | |
Baloise Holding AG, Registered Shares | | | 50,566 | | | | 6,577,001 | | |
Nestlé SA, Registered Shares | | | 39,394 | | | | 3,074,331 | | |
Zurich Insurance Group AG | | | 29,460 | | | | 9,418,795 | | |
Total | | | | | 26,808,642 | | |
Common Stocks (continued)
Issuer | | Shares | | Value ($) | |
TAIWAN 1.1% | |
Pegatron Corp. | | | 1,476,000 | | | | 4,038,926 | | |
Wistron NeWeb Corp. | | | 1,511,261 | | | | 3,528,049 | | |
Total | | | | | 7,566,975 | | |
UNITED KINGDOM 18.6% | |
AstraZeneca PLC | | | 129,797 | | | | 8,956,306 | | |
AstraZeneca PLC, ADR | | | 55,596 | | | | 3,830,564 | | |
Aviva PLC | | | 1,044,731 | | | | 8,693,578 | | |
BHP Billiton PLC | | | 247,290 | | | | 6,171,455 | | |
| BP PLC | | | 1,424,658 | | | | 9,854,678 | | |
Close Brothers Group PLC | | | 238,869 | | | | 6,051,649 | | |
Crest Nicholson Holdings PLC | | | 864,642 | | | | 5,901,497 | | |
DCC PLC | | | 117,868 | | | | 7,042,262 | | |
HSBC Holdings PLC | | | 1,789,018 | | | | 15,944,892 | | |
John Wood Group PLC | | | 141,092 | | | | 1,449,625 | | |
KAZ Minerals PLC(a) | | | 1,418,251 | | | | 5,552,744 | | |
Optimal Payments PLC(a) | | | 1,556,365 | | | | 8,926,384 | | |
Royal Dutch Shell PLC, Class B | | | 789,026 | | | | 26,866,042 | | |
Vodafone Group PLC | | | 2,672,823 | | | | 9,259,731 | | |
Xchanging PLC | | | 1,837,718 | | | | 4,085,514 | | |
Total | | | | | 128,586,921 | | |
UNITED STATES 3.2% | |
Alkermes PLC(a) | | | 23,258 | | | | 1,633,874 | | |
Arrowhead Research Corp.(a) | | | 141,058 | | | | 1,062,167 | | |
Auspex Pharmaceuticals, Inc.(a) | | | 15,037 | | | | 1,011,088 | | |
BioMarin Pharmaceutical, Inc.(a) | | | 12,985 | | | | 1,390,304 | | |
Dynavax Technologies Corp.(a) | | | 60,107 | | | | 1,057,883 | | |
Flex Pharma, Inc.(a) | | | 77,962 | | | | 1,355,369 | | |
Incyte Corp.(a) | | | 16,400 | | | | 1,407,940 | | |
Insmed, Inc.(a) | | | 58,075 | | | | 1,076,711 | | |
Novavax, Inc.(a) | | | 109,553 | | | | 1,002,410 | | |
Pharmacyclics, Inc.(a) | | | 5,388 | | | | 1,163,431 | | |
Puma Biotechnology, Inc.(a) | | | 10,521 | | | | 2,241,078 | | |
Receptos, Inc.(a) | | | 8,203 | | | | 1,038,828 | | |
Regulus Therapeutics, Inc.(a) | | | 49,378 | | | | 914,481 | | |
Stillwater Mining Co.(a) | | | 237,516 | | | | 3,443,982 | | |
TESARO, Inc.(a) | | | 20,637 | | | | 1,100,571 | | |
The accompanying Notes to Financial Statements are an integral part of this statement.
Annual Report 2015
10
COLUMBIA OVERSEAS VALUE FUND
PORTFOLIO OF INVESTMENTS (continued)
February 28, 2015
Common Stocks (continued)
Issuer | | Shares | | Value ($) | |
Verastem, Inc.(a) | | | 16,561 | | | | 123,214 | | |
Vertex Pharmaceuticals, Inc.(a) | | | 11,068 | | | | 1,321,851 | | |
Total | | | | | 22,345,182 | | |
Total Common Stocks
(Cost: $640,456,703) | | | | | 679,374,272 | | |
Exchange-Traded Funds 1.1%
| | | Shares | | Value ($) | |
iShares MSCI EAFE ETF | | | 122,345 | | | | 7,960,989 | | |
Total Exchange-Traded Funds
(Cost: $7,682,508) | | | | | 7,960,989 | | |
Money Market Funds 0.3%
| | | Shares | | Value ($) | |
Columbia Short-Term Cash Fund,
0.118%(c)(d) | | | 1,840,282 | | | | 1,840,282 | | |
Total Money Market Funds
(Cost: $1,840,282) | | | | | 1,840,282 | | |
Total Investments
(Cost: $649,979,493) | | | | | 689,175,543 | | |
Other Assets & Liabilities, Net | | | | | 3,969,546 | | |
Net Assets | | | | | 693,145,089 | | |
Investments in Derivatives
Forward Foreign Currency Exchange Contracts Open at February 28, 2015
Counterparty | | Exchange Date | | Currency to
be Delivered | | Currency to
be Received | | Unrealized
Appreciation ($) | | Unrealized
Depreciation ($) | |
Morgan Stanley | | 03/31/2015 | | | 3,459,000
CAD | | | | 2,781,430
USD | | | | 15,629 | | | | — | | |
Morgan Stanley | | 03/31/2015 | | | 9,439,000
CAD | | | | 7,499,662
USD | | | | — | | | | (47,722 | ) | |
Morgan Stanley | | 03/31/2015 | | | 31,879,000
ILS | | | | 8,155,617
USD | | | | 152,192 | | | | — | | |
Morgan Stanley | | 03/31/2015 | | | 484,369,000
JPY | | | | 4,106,495
USD | | | | 55,744 | | | | — | | |
Morgan Stanley | | 03/31/2015 | | | 13,362,543,000
KRW | | | | 12,249,661
USD | | | | 126,828 | | | | — | | |
Morgan Stanley | | 03/31/2015 | | | 2,237,275,000
KRW | | | | 2,013,513
USD | | | | — | | | | (16,199 | ) | |
Morgan Stanley | | 03/31/2015 | | | 25,796,000
NOK | | | | 3,387,058
USD | | | | 24,993 | | | | — | | |
Morgan Stanley | | 03/31/2015 | | | 214,085,000
TWD | | | | 6,801,034
USD | | | | — | | | | (5,760 | ) | |
Morgan Stanley | | 03/31/2015 | | | 18,387,110
USD | | | | 23,795,000
AUD | | | | 171,662 | | | | — | | |
Morgan Stanley | | 03/31/2015 | | | 1,354,252
USD | | | | 8,877,000
DKK | | | | — | | | | (21,470 | ) | |
Morgan Stanley | | 03/31/2015 | | | 30,569,058
USD | | | | 20,157,000
GBP | | | | 543,348 | | | | — | | |
Morgan Stanley | | 03/31/2015 | | | 4,175,200
USD | | | | 2,690,000
GBP | | | | — | | | | (23,175 | ) | |
Morgan Stanley | | 03/31/2015 | | | 2,085,227
USD | | | | 2,774,000
NZD | | | | 6,476 | | | | — | | |
The accompanying Notes to Financial Statements are an integral part of this statement.
Annual Report 2015
11
COLUMBIA OVERSEAS VALUE FUND
PORTFOLIO OF INVESTMENTS (continued)
February 28, 2015
Forward Foreign Currency Exchange Contracts Open at February 28, 2015 (continued)
Counterparty | | Exchange Date | | Currency to
be Delivered | | Currency to
be Received | | Unrealized
Appreciation ($) | | Unrealized
Depreciation ($) | |
Morgan Stanley | | 03/31/2015 | | | 3,426,394
USD | | | | 28,433,000
SEK | | | | — | | | | (14,850 | ) | |
Morgan Stanley | | 03/31/2015 | | | 2,087,078
USD | | | | 2,826,000
SGD | | | | — | | | | (15,128 | ) | |
Total | | | | | | | | | 1,096,872 | | | | (144,304 | ) | |
(a) Non-income producing.
(b) Represents fair value as determined in good faith under procedures approved by the Board of Trustees. At February 28, 2015, the value of these securities amounted to $123,245, which represents 0.02% of net assets.
(c) The rate shown is the seven-day current annualized yield at February 28, 2015.
(d) As defined in the Investment Company Act of 1940, an affiliated company is one in which the Fund owns 5% or more of the company's outstanding voting securities, or a company which is under common ownership or control with the Fund. Holdings and transactions in these affiliated companies during the year ended February 28, 2015, are as follows:
Issuer | | Beginning
Cost ($) | | Purchase
Cost ($) | | Proceeds
From Sales ($) | | Ending
Cost ($) | | Dividends —
Affiliated
Issuers ($) | | Value ($) | |
Columbia Short-Term Cash Fund | | | 1,600,211 | | | | 336,857,540 | | | | (336,617,469 | ) | | | 1,840,282 | | | | 5,396 | | | | 1,840,282 | | |
Abbreviation Legend
ADR American Depositary Receipt
Currency Legend
AUD Australian Dollar
CAD Canadian Dollar
DKK Danish Krone
GBP British Pound
ILS Israeli Shekel
JPY Japanese Yen
KRW Korean Won
NOK Norwegian Krone
NZD New Zealand Dollar
SEK Swedish Krona
SGD Singapore Dollar
TWD Taiwan Dollar
USD US Dollar
Fair Value Measurements
Generally accepted accounting principles (GAAP) require disclosure regarding the inputs and valuation techniques used to measure fair value and any changes in valuation inputs or techniques. In addition, investments shall be disclosed by major category.
The Fund categorizes its fair value measurements according to a three-level hierarchy that maximizes the use of observable inputs and minimizes the use of unobservable inputs by prioritizing that the most observable input be used when available. Observable inputs are those that market participants would use in pricing an investment based on market data obtained from sources independent of the reporting entity. Unobservable inputs are those that reflect the Fund's assumptions about the information market participants would use in pricing an investment. An investment's level within the fair value hierarchy is based on the lowest level of any input that is deemed significant to the
The accompanying Notes to Financial Statements are an integral part of this statement.
Annual Report 2015
12
COLUMBIA OVERSEAS VALUE FUND
PORTFOLIO OF INVESTMENTS (continued)
February 28, 2015
Fair Value Measurements (continued)
asset or liability's fair value measurement. The input levels are not necessarily an indication of the risk or liquidity associated with investments at that level. For example, certain U.S. government securities are generally high quality and liquid, however, they are reflected as Level 2 because the inputs used to determine fair value may not always be quoted prices in an active market.
Fair value inputs are summarized in the three broad levels listed below:
> Level 1 — Valuations based on quoted prices for investments in active markets that the Fund has the ability to access at the measurement date (including NAV for open-end mutual funds). Valuation adjustments are not applied to Level 1 investments.
> Level 2 — Valuations based on other significant observable inputs (including quoted prices for similar securities, interest rates, prepayment speeds, credit risks, etc.).
> Level 3 — Valuations based on significant unobservable inputs (including the Fund's own assumptions and judgment in determining the fair value of investments).
Inputs that are used in determining fair value of an investment may include price information, credit data, volatility statistics, and other factors. These inputs can be either observable or unobservable. The availability of observable inputs can vary between investments, and is affected by various factors such as the type of investment, and the volume and level of activity for that investment or similar investments in the marketplace. The inputs will be considered by the Investment Manager, along with any other relevant factors in the calculation of an investment's fair value. The Fund uses prices and inputs that are current as of the measurement date, which may include periods of market dislocations. During these periods, the availability of prices and inputs may be reduced for many investments. This condition could cause an investment to be reclassified between the various levels within the hierarchy.
Foreign equity securities actively traded in markets where there is a significant delay in the local close relative to the New York Stock Exchange (NYSE) are classified as Level 2. The values of these securities may include an adjustment to reflect the impact of significant market movements following the close of local trading, as described in Note 2 to the financial statements — Security Valuation.
Investments falling into the Level 3 category are primarily supported by quoted prices from brokers and dealers participating in the market for those investments. However, these may be classified as Level 3 investments due to lack of market transparency and corroboration to support these quoted prices. Additionally, valuation models may be used as the pricing source for any remaining investments classified as Level 3. These models may rely on one or more significant unobservable inputs and/or significant assumptions by the Investment Manager. Inputs used in valuations may include, but are not limited to, financial statement analysis, capital account balances, discount rates and estimated cash flows, and comparable company data.
Under the direction of the Fund's Board of Trustees (the Board), the Investment Manager's Valuation Committee (the Committee) is responsible for overseeing the valuation procedures approved by the Board. The Committee consists of voting and non-voting members from various groups within the Investment Manager's organization, including operations and accounting, trading and investments, compliance, risk management and legal.
The Committee meets at least monthly to review and approve valuation matters, which may include a description of specific valuation determinations, data regarding pricing information received from approved pricing vendors and brokers and the results of Board-approved valuation control policies and procedures (the Policies). The Policies address, among other things, instances when market quotations are or are not readily available, including recommendations of third party pricing vendors and a determination of appropriate pricing methodologies; events that require specific valuation determinations and assessment of fair value techniques; securities with a potential for stale pricing, including those that are illiquid, restricted, or in default; and the effectiveness of third party pricing vendors, including periodic reviews of vendors. The Committee meets more frequently, as needed, to discuss additional valuation matters, which may include the need to review back-testing results, review time-sensitive information or approve related valuation actions. The Committee reports to the Board, with members of the Committee meeting with the Board at each of its regularly scheduled meetings to discuss valuation matters and actions during the period, similar to those described earlier.
For investments categorized as Level 3, the Committee monitors information similar to that described above, which may include: (i) data specific to the issuer or comparable issuers, (ii) general market or specific sector news and (iii) quoted prices and specific or similar security transactions. The Committee considers this data and any changes from prior periods in order to assess the reasonableness of observable and unobservable inputs, any assumptions or internal models used to value those securities and changes in fair value. This data is also used to corroborate, when available, information received from approved pricing vendors and brokers. Various factors impact the frequency of monitoring this information (which may occur as often as daily). However, the Committee may determine that changes to inputs, assumptions and models are not required as a result of the monitoring procedures performed.
The accompanying Notes to Financial Statements are an integral part of this statement.
Annual Report 2015
13
COLUMBIA OVERSEAS VALUE FUND
PORTFOLIO OF INVESTMENTS (continued)
February 28, 2015
Fair Value Measurements (continued)
The following table is a summary of the inputs used to value the Fund's investments at February 28, 2015:
Description | | Level 1
Quoted Prices in Active
Markets for Identical
Assets ($) | | Level 2
Other Significant
Observable Inputs ($) | | Level 3
Significant
Unobservable Inputs ($) | | Total ($) | |
Equity Securities | |
Common Stocks | |
Consumer Discretionary | | | — | | | | 91,807,035 | | | | — | | | | 91,807,035 | | |
Consumer Staples | | | — | | | | 25,766,514 | | | | — | | | | 25,766,514 | | |
Energy | | | — | | | | 62,321,220 | | | | — | | | | 62,321,220 | | |
Financials | | | — | | | | 241,249,430 | | | | 123,245 | | | | 241,372,675 | | |
Health Care | | | 24,083,279 | | | | 33,484,199 | | | | — | | | | 57,567,478 | | |
Industrials | | | — | | | | 54,734,686 | | | | — | | | | 54,734,686 | | |
Information Technology | | | — | | | | 48,549,928 | | | | — | | | | 48,549,928 | | |
Materials | | | 3,443,982 | | | | 27,783,749 | | | | — | | | | 31,227,731 | | |
Telecommunication Services | | | — | | | | 37,764,608 | | | | — | | | | 37,764,608 | | |
Utilities | | | — | | | | 28,262,397 | | | | — | | | | 28,262,397 | | |
Exchange-Traded Funds | | | 7,960,989 | | | | — | | | | — | | | | 7,960,989 | | |
Total Equity Securities | | | 35,488,250 | | | | 651,723,766 | | | | 123,245 | | | | 687,335,261 | | |
Mutual Funds | |
Money Market Funds | | | 1,840,282 | | | | — | | | | — | | | | 1,840,282 | | |
Total Mutual Funds | | | 1,840,282 | | | | — | | | | — | | | | 1,840,282 | | |
Investments in Securities | | | 37,328,532 | | | | 651,723,766 | | | | 123,245 | | | | 689,175,543 | | |
Derivatives | |
Assets | |
Forward Foreign Currency
Exchange Contracts | | | — | | | | 1,096,872 | | | | — | | | | 1,096,872 | | |
Liabilities | |
Forward Foreign Currency
Exchange Contracts | | | — | | | | (144,304 | ) | | | — | | | | (144,304 | ) | |
Total | | | 37,328,532 | | | | 652,676,334 | | | | 123,245 | | | | 690,128,111 | | |
See the Portfolio of Investments for all investment classifications not indicated in the table.
The Fund's assets assigned to the Level 2 input category are generally valued using the market approach, in which a security's value is determined through reference to prices and information from market transactions for similar or identical assets. These assets include certain foreign securities for which a third party statistical pricing service may be employed for purposes of fair market valuation. The model utilized by such third party statistical pricing service takes into account a security's correlation to available market data including, but not limited to, intraday index, ADR, and ETF movements.
There were no transfers of financial assets between levels during the period.
Derivative instruments are valued at unrealized appreciation (depreciation).
The Fund's assets assigned to the Level 3 category are valued utilizing the valuation technique deemed the most appropriate in the circumstances. Certain common stocks classified as Level 3 securities are valued using the market approach. To determine fair value for these securities, management considered various factors which may have included, but were not limited to, the halt price of the security, the movement in observed market prices for other securities from the issuer, the movement in certain foreign or domestic market indices, and the position of the security within the respective company's capital structure. Significant increases (decreases) to any of these inputs would result in a significantly lower (higher) fair value measurement.
The accompanying Notes to Financial Statements are an integral part of this statement.
Annual Report 2015
14
COLUMBIA OVERSEAS VALUE FUND
STATEMENT OF ASSETS AND LIABILITIES
February 28, 2015
Assets | |
Investments, at value | |
Unaffiliated issuers (identified cost $648,139,211) | | $ | 687,335,261 | | |
Affiliated issuers (identified cost $1,840,282) | | | 1,840,282 | | |
Total investments (identified cost $649,979,493) | | | 689,175,543 | | |
Unrealized appreciation on forward foreign currency exchange contracts | | | 1,096,872 | | |
Receivable for: | |
Investments sold | | | 10,000,063 | | |
Capital shares sold | | | 238,181 | | |
Dividends | | | 1,338,593 | | |
Reclaims | | | 527,773 | | |
Prepaid expenses | | | 2,457 | | |
Other assets | | | 646 | | |
Total assets | | | 702,380,128 | | |
Liabilities | |
Unrealized depreciation on forward foreign currency exchange contracts | | | 144,304 | | |
Payable for: | |
Investments purchased | | | 7,806,186 | | |
Capital shares purchased | | | 1,020,744 | | |
Investment management fees | | | 14,754 | | |
Distribution and/or service fees | | | 2,983 | | |
Transfer agent fees | | | 58,648 | | |
Administration fees | | | 1,492 | | |
Plan administration fees | | | 33 | | |
Compensation of board members | | | 69,111 | | |
Other expenses | | | 116,784 | | |
Total liabilities | | | 9,235,039 | | |
Net assets applicable to outstanding capital stock | | $ | 693,145,089 | | |
Represented by | |
Paid-in capital | | $ | 1,003,662,537 | | |
Excess of distributions over net investment income | | | (3,439,252 | ) | |
Accumulated net realized loss | | | (347,138,436 | ) | |
Unrealized appreciation (depreciation) on: | |
Investments | | | 39,196,050 | | |
Foreign currency translations | | | (88,378 | ) | |
Forward foreign currency exchange contracts | | | 952,568 | | |
Total — representing net assets applicable to outstanding capital stock | | $ | 693,145,089 | | |
The accompanying Notes to Financial Statements are an integral part of this statement.
Annual Report 2015
15
COLUMBIA OVERSEAS VALUE FUND
STATEMENT OF ASSETS AND LIABILITIES (continued)
February 28, 2015
Class A | |
Net assets | | $ | 188,170,920 | | |
Shares outstanding | | | 21,753,707 | | |
Net asset value per share | | $ | 8.65 | | |
Maximum offering price per share(a) | | $ | 9.18 | | |
Class B | |
Net assets | | $ | 5,201,674 | | |
Shares outstanding | | | 602,080 | | |
Net asset value per share | | $ | 8.64 | | |
Class C | |
Net assets | | $ | 4,597,145 | | |
Shares outstanding | | | 532,134 | | |
Net asset value per share | | $ | 8.64 | | |
Class I | |
Net assets | | $ | 285,957,165 | | |
Shares outstanding | | | 33,062,284 | | |
Net asset value per share | | $ | 8.65 | | |
Class K | |
Net assets | | $ | 171,774 | | |
Shares outstanding | | | 19,857 | | |
Net asset value per share | | $ | 8.65 | | |
Class W | |
Net assets | | $ | 208,706,721 | | |
Shares outstanding | | | 24,146,545 | | |
Net asset value per share | | $ | 8.64 | | |
Class Z | |
Net assets | | $ | 339,690 | | |
Shares outstanding | | | 39,243 | | |
Net asset value per share | | $ | 8.66 | | |
(a) The maximum offering price per share is calculated by dividing the net asset value per share by 1.0 minus the maximum sales charge of 5.75%.
The accompanying Notes to Financial Statements are an integral part of this statement.
Annual Report 2015
16
COLUMBIA OVERSEAS VALUE FUND
STATEMENT OF OPERATIONS
Year Ended February 28, 2015
Net investment income | |
Income: | |
Dividends — unaffiliated issuers | | $ | 30,773,515 | | |
Dividends — affiliated issuers | | | 5,396 | | |
Interest | | | 6,421 | | |
Foreign taxes withheld | | | (2,876,426 | ) | |
Total income | | | 27,908,906 | | |
Expenses: | |
Investment management fees | | | 5,794,788 | | |
Distribution and/or service fees | |
Class A | | | 499,002 | | |
Class B | | | 70,618 | | |
Class C | | | 46,237 | | |
Class W | | | 677,121 | | |
Transfer agent fees | |
Class A | | | 475,510 | | |
Class B | | | 16,803 | | |
Class C | | | 11,022 | | |
Class K | | | 86 | | |
Class W | | | 643,266 | | |
Class Z | | | 920 | | |
Administration fees | | | 585,710 | | |
Plan administration fees | |
Class K | | | 429 | | |
Compensation of board members | | | 27,564 | | |
Custodian fees | | | 162,333 | | |
Printing and postage fees | | | 120,677 | | |
Registration fees | | | 86,810 | | |
Professional fees | | | 62,393 | | |
Other | | | 16,616 | | |
Total expenses | | | 9,297,905 | | |
Expense reductions | | | (20 | ) | |
Total net expenses | | | 9,297,885 | | |
Net investment income | | | 18,611,021 | | |
Realized and unrealized gain (loss) — net | |
Net realized gain (loss) on: | |
Investments | | | (9,442,226 | ) | |
Foreign currency translations | | | (476,643 | ) | |
Forward foreign currency exchange contracts | | | (2,984,575 | ) | |
Futures contracts | | | (274,622 | ) | |
Options contracts written | | | 76,273 | | |
Net realized loss | | | (13,101,793 | ) | |
Net change in unrealized appreciation (depreciation) on: | |
Investments | | | (26,106,916 | ) | |
Foreign currency translations | | | (111,053 | ) | |
Forward foreign currency exchange contracts | | | 433,454 | | |
Foreign capital gains tax | | | 22,804 | | |
Net change in unrealized depreciation | | | (25,761,711 | ) | |
Net realized and unrealized loss | | | (38,863,504 | ) | |
Net decrease in net assets from operations | | $ | (20,252,483 | ) | |
The accompanying Notes to Financial Statements are an integral part of this statement.
Annual Report 2015
17
COLUMBIA OVERSEAS VALUE FUND
STATEMENT OF CHANGES IN NET ASSETS
| | | Year Ended
February 28,
2015 | | Year Ended
February 28,
2014 | |
Operations | |
Net investment income | | $ | 18,611,021 | | | $ | 6,724,175 | | |
Net realized gain (loss) | | | (13,101,793 | ) | | | 3,920,241 | | |
Net change in unrealized appreciation (depreciation) | | | (25,761,711 | ) | | | 50,705,731 | | |
Net increase (decrease) in net assets resulting from operations | | | (20,252,483 | ) | | | 61,350,147 | | |
Distributions to shareholders | |
Net investment income | |
Class A | | | (5,698,627 | ) | | | (3,174,030 | ) | |
Class B | | | (132,919 | ) | | | (92,360 | ) | |
Class C | | | (100,677 | ) | | | (42,930 | ) | |
Class I | | | (9,764,213 | ) | | | (1,329,214 | ) | |
Class K | | | (5,333 | ) | | | (3,424 | ) | |
Class W | | | (7,425,696 | ) | | | (1,894,152 | ) | |
Class Z | | | (18,234 | ) | | | (1,405 | ) | |
Tax return of capital | |
Class A | | | (100,747 | ) | | | — | | |
Class B | | | (3,557 | ) | | | — | | |
Class C | | | (2,345 | ) | | | — | | |
Class I | | | (134,338 | ) | | | — | | |
Class K | | | (87 | ) | | | — | | |
Class W | | | (136,497 | ) | | | — | | |
Class Z | | | (198 | ) | | | — | | |
Total distributions to shareholders | | | (23,523,468 | ) | | | (6,537,515 | ) | |
Increase in net assets from capital stock activity | | | 101,019,321 | | | | 551,882,746 | | |
Total increase in net assets | | | 57,243,370 | | | | 606,695,378 | | |
Net assets at beginning of year | | | 635,901,719 | | | | 29,206,341 | | |
Net assets at end of year | | $ | 693,145,089 | | | $ | 635,901,719 | | |
Undistributed (excess of distributions over) net investment income | | $ | (3,439,252 | ) | | $ | 1,190,436 | | |
The accompanying Notes to Financial Statements are an integral part of this statement.
Annual Report 2015
18
COLUMBIA OVERSEAS VALUE FUND
STATEMENT OF CHANGES IN NET ASSETS (continued)
| | | Year Ended February 28, 2015 | | Year Ended February 28, 2014 | |
| | | Shares | | Dollars ($) | | Shares | | Dollars ($) | |
Capital stock activity | |
Class A shares | |
Subscriptions(a) | | | 1,411,964 | | | | 12,400,765 | | | | 1,324,047 | | | | 11,145,381 | | |
Fund reorganization | | | — | | | | — | | | | 26,646,303 | | | | 209,545,325 | | |
Distributions reinvested | | | 700,883 | | | | 5,738,989 | | | | 361,031 | | | | 3,137,362 | | |
Redemptions | | | (4,189,888 | ) | | | (36,618,448 | ) | | | (4,500,988 | ) | | | (37,329,759 | ) | |
Net increase (decrease) | | | (2,077,041 | ) | | | (18,478,694 | ) | | | 23,830,393 | | | | 186,498,309 | | |
Class B shares | |
Subscriptions | | | 10,775 | | | | 96,521 | | | | 18,581 | | | | 155,880 | | |
Fund reorganization | | | — | | | | — | | | | 1,692,156 | | | | 13,292,374 | | |
Distributions reinvested | | | 16,564 | | | | 135,736 | | | | 10,583 | | | | 91,970 | | |
Redemptions(a) | | | (477,844 | ) | | | (4,152,745 | ) | | | (669,062 | ) | | | (5,528,393 | ) | |
Net increase (decrease) | | | (450,505 | ) | | | (3,920,488 | ) | | | 1,052,258 | | | | 8,011,831 | | |
Class C shares | |
Subscriptions | | | 64,689 | | | | 562,368 | | | | 49,227 | | | | 417,762 | | |
Fund reorganization | | | — | | | | — | | | | 578,148 | | | | 4,540,714 | | |
Distributions reinvested | | | 12,588 | | | | 102,840 | | | | 4,928 | | | | 42,828 | | |
Redemptions | | | (72,751 | ) | | | (635,372 | ) | | | (105,022 | ) | | | (872,101 | ) | |
Net increase | | | 4,526 | | | | 29,836 | | | | 527,281 | | | | 4,129,203 | | |
Class I shares | |
Subscriptions | | | 23,599,773 | | | | 209,476,876 | | | | 8,000,307 | | | | 70,799,661 | | |
Fund reorganization | | | — | | | | — | | | | 1,031 | | | | 8,099 | | |
Distributions reinvested | | | 1,211,428 | | | | 9,898,464 | | | | 153,097 | | | | 1,328,992 | | |
Redemptions | | | (2,480,943 | ) | | | (22,188,673 | ) | | | (888,462 | ) | | | (7,792,682 | ) | |
Net increase | | | 22,330,258 | | | | 197,186,667 | | | | 7,265,973 | | | | 64,344,070 | | |
Class K shares | |
Fund reorganization | | | — | | | | — | | | | 25,842 | | | | 203,141 | | |
Distributions reinvested | | | 652 | | | | 5,340 | | | | 377 | | | | 3,277 | | |
Redemptions | | | (2,230 | ) | | | (20,293 | ) | | | (5,111 | ) | | | (49,292 | ) | |
Net increase (decrease) | | | (1,578 | ) | | | (14,953 | ) | | | 21,108 | | | | 157,126 | | |
Class W shares | |
Subscriptions | | | 4,944,942 | | | | 43,705,233 | | | | 33,965,383 | | | | 300,016,709 | | |
Distributions reinvested | | | 923,496 | | | | 7,562,121 | | | | 217,964 | | | | 1,894,110 | | |
Redemptions | | | (14,729,279 | ) | | | (125,331,403 | ) | | | (1,176,279 | ) | | | (10,496,461 | ) | |
Net increase (decrease) | | | (8,860,841 | ) | | | (74,064,049 | ) | | | 33,007,068 | | | | 291,414,358 | | |
Class Z shares | |
Subscriptions | | | 67,306 | | | | 593,280 | | | | 1,646 | | | | 13,870 | | |
Fund reorganization | | | — | | | | — | | | | 8,336 | | | | 65,598 | | |
Distributions reinvested | | | 1,363 | | | | 11,141 | | | | 128 | | | | 1,109 | | |
Redemptions | | | (38,970 | ) | | | (323,419 | ) | | | (350,354 | ) | | | (2,752,728 | ) | |
Net increase (decrease) | | | 29,699 | | | | 281,002 | | | | (340,244 | ) | | | (2,672,151 | ) | |
Total net increase | | | 10,974,518 | | | | 101,019,321 | | | | 65,363,837 | | | | 551,882,746 | | |
(a) Includes conversions of Class B shares to Class A shares, if any.
The accompanying Notes to Financial Statements are an integral part of this statement.
Annual Report 2015
19
COLUMBIA OVERSEAS VALUE FUND
The following tables are intended to help you understand the Fund's financial performance. Certain information reflects financial results for a single share of a class held for the periods shown. Per share net investment income (loss) amounts are calculated based on average shares outstanding during the period. Total return assumes reinvestment of all dividends and distributions, if any. Total return does not reflect payment of sales charges, if any. Total return and portfolio turnover are not annualized for periods of less than one year. The portfolio turnover rate is calculated without regard to purchase and sales transactions of short-term instruments and certain derivatives, if any. If such transactions were included, the Fund's portfolio turnover rate may be higher.
| | | Year Ended February 28, | |
Class A | | 2015 | | 2014(a) | |
Per share data | |
Net asset value, beginning of period | | $ | 9.20 | | | $ | 7.65 | | |
Income from investment operations: | |
Net investment income | | | 0.20 | | | | 0.19 | | |
Net realized and unrealized gain (loss) | | | (0.49 | ) | | | 1.49 | | |
Total from investment operations | | | (0.29 | ) | | | 1.68 | | |
Less distributions to shareholders: | |
Net investment income | | | (0.26 | ) | | | (0.13 | ) | |
Tax return of capital | | | (0.00 | )(b) | | | — | | |
Total distributions to shareholders | | | (0.26 | ) | | | (0.13 | ) | |
Net asset value, end of period | | $ | 8.65 | | | $ | 9.20 | | |
Total return | | | (2.92 | %) | | | 22.10 | % | |
Ratios to average net assets(c) | |
Total gross expenses | | | 1.40 | % | | | 1.71 | % | |
Total net expenses(d) | | | 1.40 | %(e) | | | 1.41 | %(e) | |
Net investment income | | | 2.32 | % | | | 2.22 | % | |
Supplemental data | |
Net assets, end of period (in thousands) | | $ | 188,171 | | | $ | 219,133 | | |
Portfolio turnover | | | 74 | % | | | 63 | % | |
Notes to Financial Highlights
(a) Based on operations from February 28, 2013 (commencement of operations) through the stated period end.
(b) Rounds to zero.
(c) In addition to the fees and expenses that the Fund bears directly, the Fund indirectly bears a pro rata share of the fees and expenses of any other funds in which it invests. Such indirect expenses are not included in the Fund's reported expense ratios.
(d) Total net expenses include the impact of certain fee waivers/expense reimbursements made by the Investment Manager and certain of its affiliates, if applicable.
(e) The benefits derived from expense reductions had an impact of less than 0.01%.
The accompanying Notes to Financial Statements are an integral part of this statement.
Annual Report 2015
20
COLUMBIA OVERSEAS VALUE FUND
FINANCIAL HIGHLIGHTS (continued)
| | | Year Ended February 28, | |
Class B | | 2015 | | 2014(a) | |
Per share data | |
Net asset value, beginning of period | | $ | 9.18 | | | $ | 7.65 | | |
Income from investment operations: | |
Net investment income | | | 0.15 | | | | 0.14 | | |
Net realized and unrealized gain (loss) | | | (0.49 | ) | | | 1.47 | | |
Total from investment operations | | | (0.34 | ) | | | 1.61 | | |
Less distributions to shareholders: | |
Net investment income | | | (0.20 | ) | | | (0.08 | ) | |
Tax return of capital | | | (0.00 | )(b) | | | — | | |
Total distributions to shareholders | | | (0.20 | ) | | | (0.08 | ) | |
Net asset value, end of period | | $ | 8.64 | | | $ | 9.18 | | |
Total return | | | (3.60 | %) | | | 21.13 | % | |
Ratios to average net assets(c) | |
Total gross expenses | | | 2.15 | % | | | 2.47 | % | |
Total net expenses(d) | | | 2.15 | %(e) | | | 2.16 | %(e) | |
Net investment income | | | 1.74 | % | | | 1.66 | % | |
Supplemental data | |
Net assets, end of period (in thousands) | | $ | 5,202 | | | $ | 9,662 | | |
Portfolio turnover | | | 74 | % | | | 63 | % | |
Notes to Financial Highlights
(a) Based on operations from February 28, 2013 (commencement of operations) through the stated period end.
(b) Rounds to zero.
(c) In addition to the fees and expenses that the Fund bears directly, the Fund indirectly bears a pro rata share of the fees and expenses of any other funds in which it invests. Such indirect expenses are not included in the Fund's reported expense ratios.
(d) Total net expenses include the impact of certain fee waivers/expense reimbursements made by the Investment Manager and certain of its affiliates, if applicable.
(e) The benefits derived from expense reductions had an impact of less than 0.01%.
The accompanying Notes to Financial Statements are an integral part of this statement.
Annual Report 2015
21
COLUMBIA OVERSEAS VALUE FUND
FINANCIAL HIGHLIGHTS (continued)
| | | Year Ended February 28, | |
Class C | | 2015 | | 2014(a) | |
Per share data | |
Net asset value, beginning of period | | $ | 9.18 | | | $ | 7.65 | | |
Income from investment operations: | |
Net investment income | | | 0.13 | | | | 0.12 | | |
Net realized and unrealized gain (loss) | | | (0.47 | ) | | | 1.49 | | |
Total from investment operations | | | (0.34 | ) | | | 1.61 | | |
Less distributions to shareholders: | |
Net investment income | | | (0.20 | ) | | | (0.08 | ) | |
Tax return of capital | | | (0.00 | )(b) | | | — | | |
Total distributions to shareholders | | | (0.20 | ) | | | (0.08 | ) | |
Net asset value, end of period | | $ | 8.64 | | | $ | 9.18 | | |
Total return | | | (3.60 | %) | | | 21.13 | % | |
Ratios to average net assets(c) | |
Total gross expenses | | | 2.16 | % | | | 2.46 | % | |
Total net expenses(d) | | | 2.16 | %(e) | | | 2.16 | %(e) | |
Net investment income | | | 1.54 | % | | | 1.46 | % | |
Supplemental data | |
Net assets, end of period (in thousands) | | $ | 4,597 | | | $ | 4,843 | | |
Portfolio turnover | | | 74 | % | | | 63 | % | |
Notes to Financial Highlights
(a) Based on operations from February 28, 2013 (commencement of operations) through the stated period end.
(b) Rounds to zero.
(c) In addition to the fees and expenses that the Fund bears directly, the Fund indirectly bears a pro rata share of the fees and expenses of any other funds in which it invests. Such indirect expenses are not included in the Fund's reported expense ratios.
(d) Total net expenses include the impact of certain fee waivers/expense reimbursements made by the Investment Manager and certain of its affiliates, if applicable.
(e) The benefits derived from expense reductions had an impact of less than 0.01%.
The accompanying Notes to Financial Statements are an integral part of this statement.
Annual Report 2015
22
COLUMBIA OVERSEAS VALUE FUND
FINANCIAL HIGHLIGHTS (continued)
| | | Year Ended February 28, | | Year Ended
February 29, | |
Class I | | 2015 | | 2014 | | 2013 | | 2012(a) | |
Per share data | |
Net asset value, beginning of period | | $ | 9.20 | | | $ | 7.65 | | | $ | 7.22 | | | $ | 7.87 | | |
Income from investment operations: | |
Net investment income | | | 0.24 | | | | 0.20 | | | | 0.20 | | | | 0.22 | | |
Net realized and unrealized gain (loss) | | | (0.48 | ) | | | 1.51 | | | | 0.40 | | | | (0.62 | ) | |
Total from investment operations | | | (0.24 | ) | | | 1.71 | | | | 0.60 | | | | (0.40 | ) | |
Less distributions to shareholders: | |
Net investment income | | | (0.31 | ) | | | (0.16 | ) | | | (0.17 | ) | | | (0.25 | ) | |
Tax return of capital | | | (0.00 | )(b) | | | — | | | | — | | | | — | | |
Total distributions to shareholders | | | (0.31 | ) | | | (0.16 | ) | | | (0.17 | ) | | | (0.25 | ) | |
Net asset value, end of period | | $ | 8.65 | | | $ | 9.20 | | | $ | 7.65 | | | $ | 7.22 | | |
Total return | | | (2.43 | %) | | | 22.55 | % | | | 8.49 | % | | | (4.55 | %) | |
Ratios to average net assets(c) | |
Total gross expenses | | | 0.92 | % | | | 1.04 | % | | | 1.33 | % | | | 1.76 | %(d) | |
Total net expenses(e) | | | 0.92 | % | | | 0.98 | % | | | 1.07 | % | | | 0.84 | %(d) | |
Net investment income | | | 2.73 | % | | | 2.36 | % | | | 2.78 | % | | | 3.37 | %(d) | |
Supplemental data | |
Net assets, end of period (in thousands) | | $ | 285,957 | | | $ | 98,706 | | | $ | 26,514 | | | $ | 28,376 | | |
Portfolio turnover | | | 74 | % | | | 63 | % | | | 46 | % | | | 96 | % | |
Notes to Financial Highlights
(a) Based on operations from March 31, 2011 (commencement of operations) through the stated period end.
(b) Rounds to zero.
(c) In addition to the fees and expenses that the Fund bears directly, the Fund indirectly bears a pro rata share of the fees and expenses of any other funds in which it invests. Such indirect expenses are not included in the Fund's reported expense ratios.
(d) Annualized.
(e) Total net expenses include the impact of certain fee waivers/expense reimbursements made by the Investment Manager and certain of its affiliates, if applicable.
The accompanying Notes to Financial Statements are an integral part of this statement.
Annual Report 2015
23
COLUMBIA OVERSEAS VALUE FUND
FINANCIAL HIGHLIGHTS (continued)
| | | Year Ended February 28, | |
Class K | | 2015 | | 2014(a) | |
Per share data | |
Net asset value, beginning of period | | $ | 9.20 | | | $ | 7.65 | | |
Income from investment operations: | |
Net investment income | | | 0.22 | | | | 0.20 | | |
Net realized and unrealized gain (loss) | | | (0.49 | ) | | | 1.49 | | |
Total from investment operations | | | (0.27 | ) | | | 1.69 | | |
Less distributions to shareholders: | |
Net investment income | | | (0.28 | ) | | | (0.14 | ) | |
Tax return of capital | | | (0.00 | )(b) | | | — | | |
Total distributions to shareholders | | | (0.28 | ) | | | (0.14 | ) | |
Net asset value, end of period | | $ | 8.65 | | | $ | 9.20 | | |
Total return | | | (2.73 | %) | | | 22.25 | % | |
Ratios to average net assets(c) | |
Total gross expenses | | | 1.22 | % | | | 1.33 | % | |
Total net expenses(d) | | | 1.22 | % | | | 1.26 | % | |
Net investment income | | | 2.49 | % | | | 2.39 | % | |
Supplemental data | |
Net assets, end of period (in thousands) | | $ | 172 | | | $ | 197 | | |
Portfolio turnover | | | 74 | % | | | 63 | % | |
Notes to Financial Highlights
(a) Based on operations from February 28, 2013 (commencement of operations) through the stated period end.
(b) Rounds to zero.
(c) In addition to the fees and expenses that the Fund bears directly, the Fund indirectly bears a pro rata share of the fees and expenses of any other funds in which it invests. Such indirect expenses are not included in the Fund's reported expense ratios.
(d) Total net expenses include the impact of certain fee waivers/expense reimbursements made by the Investment Manager and certain of its affiliates, if applicable.
The accompanying Notes to Financial Statements are an integral part of this statement.
Annual Report 2015
24
COLUMBIA OVERSEAS VALUE FUND
FINANCIAL HIGHLIGHTS (continued)
| | | Year Ended February 28, | | Year Ended
February 29, | |
Class W | | 2015 | | 2014 | | 2013 | | 2012(a) | |
Per share data | |
Net asset value, beginning of period | | $ | 9.19 | | | $ | 7.65 | | | $ | 7.22 | | | $ | 7.87 | | |
Income from investment operations: | |
Net investment income | | | 0.21 | | | | 0.19 | | | | 0.17 | | | | 0.22 | | |
Net realized and unrealized gain (loss) | | | (0.50 | ) | | | 1.48 | | | | 0.42 | | | | (0.64 | ) | |
Total from investment operations | | | (0.29 | ) | | | 1.67 | | | | 0.59 | | | | (0.42 | ) | |
Less distributions to shareholders: | |
Net investment income | | | (0.26 | ) | | | (0.13 | ) | | | (0.16 | ) | | | (0.23 | ) | |
Tax return of capital | | | (0.00 | )(b) | | | — | | | | — | | | | — | | |
Total distributions to shareholders | | | (0.26 | ) | | | (0.13 | ) | | | (0.16 | ) | | | (0.23 | ) | |
Net asset value, end of period | | $ | 8.64 | | | $ | 9.19 | | | $ | 7.65 | | | $ | 7.22 | | |
Total return | | | (2.93 | %) | | | 21.97 | % | | | 8.24 | % | | | (4.81 | %) | |
Ratios to average net assets(c) | |
Total gross expenses | | | 1.40 | % | | | 1.63 | % | | | 1.58 | % | | | 2.09 | %(d) | |
Total net expenses(e) | | | 1.40 | %(f) | | | 1.41 | %(f) | | | 1.33 | % | | | 1.12 | %(d) | |
Net investment income | | | 2.41 | % | | | 2.21 | % | | | 2.46 | % | | | 3.24 | %(d) | |
Supplemental data | |
Net assets, end of period (in thousands) | | $ | 208,707 | | | $ | 303,273 | | | $ | 2 | | | $ | 2 | | |
Portfolio turnover | | | 74 | % | | | 63 | % | | | 46 | % | | | 96 | % | |
Notes to Financial Highlights
(a) Based on operations from March 31, 2011 (commencement of operations) through the stated period end.
(b) Rounds to zero.
(c) In addition to the fees and expenses that the Fund bears directly, the Fund indirectly bears a pro rata share of the fees and expenses of any other funds in which it invests. Such indirect expenses are not included in the Fund's reported expense ratios.
(d) Annualized.
(e) Total net expenses include the impact of certain fee waivers/expense reimbursements made by the Investment Manager and certain of its affiliates, if applicable.
(f) The benefits derived from expense reductions had an impact of less than 0.01%.
The accompanying Notes to Financial Statements are an integral part of this statement.
Annual Report 2015
25
COLUMBIA OVERSEAS VALUE FUND
FINANCIAL HIGHLIGHTS (continued)
| | | Year Ended February 28, | | Year Ended
February 29, | | Year Ended
February 28, | |
Class Z | | 2015 | | 2014 | | 2013 | | 2012 | | 2011 | |
Per share data | |
Net asset value, beginning of period | | $ | 9.20 | | | $ | 7.66 | | | $ | 7.23 | | | $ | 8.00 | | | $ | 6.98 | | |
Income from investment operations: | |
Net investment income | | | 0.23 | | | | 0.40 | | | | 0.19 | | | | 0.32 | | | | 0.16 | | |
Net realized and unrealized gain (loss) | | | (0.48 | ) | | | 1.29 | | | | 0.41 | | | | (0.85 | ) | | | 1.01 | | |
Total from investment operations | | | (0.25 | ) | | | 1.69 | | | | 0.60 | | | | (0.53 | ) | | | 1.17 | | |
Less distributions to shareholders: | |
Net investment income | | | (0.29 | ) | | | (0.15 | ) | | | (0.17 | ) | | | (0.24 | ) | | | (0.15 | ) | |
Tax return of capital | | | (0.00 | )(a) | | | — | | | | — | | | | — | | | | — | | |
Total distributions to shareholders | | | (0.29 | ) | | | (0.15 | ) | | | (0.17 | ) | | | (0.24 | ) | | | (0.15 | ) | |
Net asset value, end of period | | $ | 8.66 | | | $ | 9.20 | | | $ | 7.66 | | | $ | 7.23 | | | $ | 8.00 | | |
Total return | | | (2.56 | %) | | | 22.19 | % | | | 8.45 | % | | | (6.17 | %) | | | 17.06 | % | |
Ratios to average net assets(b) | |
Total gross expenses | | | 1.16 | % | | | 1.52 | % | | | 1.32 | % | | | 1.87 | % | | | 3.65 | % | |
Total net expenses(c) | | | 1.16 | %(d) | | | 1.21 | %(d) | | | 1.07 | % | | | 0.98 | % | | | 1.15 | %(d) | |
Net investment income | | | 2.64 | % | | | 4.97 | % | | | 2.72 | % | | | 3.80 | % | | | 2.18 | % | |
Supplemental data | |
Net assets, end of period (in thousands) | | $ | 340 | | | $ | 88 | | | $ | 2,680 | | | $ | 2,521 | | | $ | 8,690 | | |
Portfolio turnover | | | 74 | % | | | 63 | % | | | 46 | % | | | 96 | % | | | 48 | % | |
Notes to Financial Highlights
(a) Rounds to zero.
(b) In addition to the fees and expenses that the Fund bears directly, the Fund indirectly bears a pro rata share of the fees and expenses of any other funds in which it invests. Such indirect expenses are not included in the Fund's reported expense ratios.
(c) Total net expenses include the impact of certain fee waivers/expense reimbursements made by the Investment Manager and certain of its affiliates, if applicable.
(d) The benefits derived from expense reductions had an impact of less than 0.01%.
The accompanying Notes to Financial Statements are an integral part of this statement.
Annual Report 2015
26
COLUMBIA OVERSEAS VALUE FUND
NOTES TO FINANCIAL STATEMENTS
February 28, 2015
Note 1. Organization
Columbia Overseas Value Fund (the Fund), a series of Columbia Funds Series Trust (the Trust), is a diversified fund. The Trust is registered under the Investment Company Act of 1940, as amended (the 1940 Act), as an open-end management investment company organized as a Delaware statutory trust.
Fund Shares
The Trust may issue an unlimited number of shares (without par value). The Fund offers Class A, Class B, Class C, Class I, Class K, Class W and Class Z shares. Although all share classes generally have identical voting, dividend and liquidation rights, each share class votes separately when required by the Trust's organizational documents or by law. Different share classes pay different distribution amounts to the extent the expenses of such share classes differ, and distributions in liquidation will be proportional to the net asset value of each share class. Each share class has its own expense structure and sales charges.
Class A shares are subject to a maximum front-end sales charge of 5.75% based on the initial investment amount. Class A shares purchased without an initial sales charge in accounts aggregating $1 million to $50 million at the time of purchase are subject to a contingent deferred sales charge (CDSC) if the shares are sold within 18 months of purchase, charged as follows: 1.00% CDSC if redeemed within 12 months of purchase, and 0.50% CDSC if redeemed more than 12, but less than 18, months after purchase.
Class B shares may be subject to a maximum CDSC of 5.00% based upon the holding period after purchase. Class B shares will generally convert to Class A shares eight years after purchase. The Fund no longer accepts investments by new or existing investors in the Fund's Class B shares, except in connection with the reinvestment of any dividend and/or capital gain distributions in Class B shares of the Fund and exchanges by existing Class B shareholders of certain other funds within the Columbia Family of Funds.
Class C shares are subject to a 1.00% CDSC on shares redeemed within one year of purchase.
Class I shares are not subject to sales charges and are available only to the Columbia Family of Funds.
Class K shares are not subject to sales charges, however this share class is closed to new investors.
Class W shares are not subject to sales charges and are available only to investors purchasing through authorized investment programs managed by investment professionals, including discretionary managed account programs.
Class Z shares are not subject to sales charges and are available only to eligible investors, which are subject to different investment minimums as described in the Fund's prospectus.
Note 2. Summary of Significant Accounting Policies
Basis of Preparation
The Fund is an investment company that applies the accounting and reporting guidance in the Financial Accounting Standards Board (FASB) Accounting Standards Codification Topic 946, Financial Services — Investment Companies (ASC 946). The financial statements are prepared in accordance with U.S. generally accepted accounting principles (GAAP) which requires management to make certain estimates and assumptions that affect the reported amounts of assets and liabilities, the disclosure of contingent assets and liabilities at the date of the financial statements and the reported amounts of income and expenses during the reporting period. Actual results could differ from those estimates.
The following is a summary of significant accounting policies followed by the Fund in the preparation of its financial statements.
Security Valuation
All equity securities and exchange-traded funds (ETFs) are valued at the close of business of the New York Stock Exchange (NYSE). Equity securities and ETFs are valued at the last quoted sales price on the principal exchange or market on which they trade, except for securities traded on the NASDAQ Stock Market, which are valued at the NASDAQ official close price. Unlisted securities or listed securities for which there were no sales during the day are valued at the mean of the latest quoted bid and ask prices on such exchanges or markets.
Foreign equity securities are valued based on quotations from the principal market in which such securities are traded. If any foreign security prices are not readily available as a result of limited share activity, the securities are valued at the mean of the latest quoted bid and ask prices on such exchanges or markets.
Annual Report 2015
27
COLUMBIA OVERSEAS VALUE FUND
NOTES TO FINANCIAL STATEMENTS (continued)
February 28, 2015
Foreign currency exchange rates are generally determined at 4:00 p.m. Eastern (U.S.) time. Many securities markets and exchanges outside the U.S. close prior to the close of the NYSE; therefore, the closing prices for securities in such markets or on such exchanges may not fully reflect events that occur after such close but before the close of the NYSE. In those situations, foreign securities will be fair valued pursuant to a policy adopted by the Board of Trustees (the Board), including, if available, utilizing a third party pricing service to determine these fair values. The third party pricing service takes into account multiple factors, including, but not limited to, movements in the U.S. securities markets, certain depositary receipts, futures contracts and foreign exchange rates that have occurred subsequent to the close of the foreign exchange or market, to determine a good faith estimate that reasonably reflects the current market conditions as of the close of the NYSE. The fair value of a security is likely to be different from the quoted or published price, if available.
Investments in open-end investment companies, including money market funds, are valued at their net asset value.
Forward foreign currency exchange contracts are marked-to-market based upon foreign currency exchange rates provided by a pricing service.
Futures and options on futures contracts are valued based upon the settlement price established each day by the board of trade or exchange on which they are traded.
Option contracts are valued at the mean of the latest quoted bid and asked prices on their primary exchanges. Option contracts, including over-the-counter option contracts, with no readily available market value are valued using quotations obtained from independent brokers as of the close of the NYSE.
Investments for which market quotations are not readily available, or that have quotations which management believes are not reliable, are valued at fair value as determined in good faith under procedures established by and under the general supervision of the Board. If a security or class of securities (such as foreign securities) is valued at fair value, such value is likely to be different from the quoted or published price for the security.
The determination of fair value often requires significant judgment. To determine fair value, management may use assumptions including but not limited to future cash flows and estimated risk premiums. Multiple inputs from various sources may be used to determine fair value.
Foreign Currency Transactions and Translations
The values of all assets and liabilities denominated in foreign currencies are generally translated into U.S. dollars at exchange rates determined at the close of the NYSE. Net realized and unrealized gains (losses) on foreign currency transactions and translations include gains (losses) arising from the fluctuation in exchange rates between trade and settlement dates on securities transactions, gains (losses) arising from the disposition of foreign currency and currency gains (losses) between the accrual and payment dates on dividends, interest income and foreign withholding taxes.
For financial statement purposes, the Fund does not distinguish that portion of gains (losses) on investments which is due to changes in foreign exchange rates from that which is due to changes in market prices of the investments. Such fluctuations are included with the net realized and unrealized gains (losses) on investments in the Statement of Operations.
Derivative Instruments
The Fund invests in certain derivative instruments, as detailed below, to meet its investment objectives. Derivatives are instruments whose values depend on, or are derived from, in whole or in part, the value of one or more other assets, such as securities, currencies, commodities or indices. Derivative instruments may be used to increase investment flexibility (including to maintain cash reserves while maintaining exposure to certain other assets), for risk management (hedging) purposes, to facilitate trading, to reduce transaction costs and to pursue higher investment returns. The Fund may also use derivative instruments to mitigate certain investment risks, such as foreign currency exchange rate risk, interest rate risk and credit risk. Derivatives may involve various risks, including the potential inability of the counterparty to fulfill its obligation under the terms of the contract, the potential for an illiquid secondary market (making it difficult for the Fund to sell, including at favorable prices) and the potential for market movements which may expose the Fund to gains or losses in excess of the amount shown in the Statement of Assets and Liabilities. The notional amounts of derivative instruments, if applicable, are not recorded in the financial statements.
A derivative instrument may suffer a marked-to-market loss if the value of the contract decreases due to an unfavorable change in the market rates or values of the underlying instrument. Losses can also occur if the counterparty does not perform under the contract. The
Annual Report 2015
28
COLUMBIA OVERSEAS VALUE FUND
NOTES TO FINANCIAL STATEMENTS (continued)
February 28, 2015
Fund's risk of loss from counterparty credit risk on over-the-counter derivatives is generally limited to the aggregate unrealized gain netted against any collateral held by the Fund and the amount of any variation margin held by the counterparty. With exchange-traded or centrally cleared derivatives, there is reduced counterparty credit risk to the Fund since the exchange's clearinghouse, as counterparty to such instruments, guarantees against a possible default. The clearinghouse stands between the buyer and the seller of the contract; therefore, the counterparty credit risk is failure of the clearinghouse. However, credit risk still exists in exchange-traded or centrally cleared derivatives with respect to initial and variation margin that is held in a broker's customer account. While brokers are required to segregate customer margin from their own assets, in the event that a broker becomes insolvent or goes into bankruptcy and at that time there is a shortfall in the aggregate amount of margin held by the broker for all its clients, U.S. bankruptcy laws will typically allocate that shortfall on a pro-rata basis across all the broker's customers (including the Fund), potentially resulting in losses to the Fund.
In order to better define its contractual rights and to secure rights that will help the Fund mitigate its counterparty risk, the Fund may enter into an International Swaps and Derivatives Association, Inc. Master Agreement (ISDA Master Agreement) or similar agreement with its derivative contract counterparties. An ISDA Master Agreement is an agreement between the Fund and a counterparty that governs over-the-counter derivatives and forward foreign currency exchange contracts and typically contains, among other things, collateral posting terms and netting provisions in the event of a default and/or termination event. Under an ISDA Master Agreement, the Fund may, under certain circumstances, offset with the counterparty certain derivative instrument's payables and/or receivables with collateral held and/or posted and create one single net payment. The provisions of the ISDA Master Agreement typically permit a single net payment in the event of default (close-out netting) including the bankruptcy or insolvency of the counterparty. Note, however, that bankruptcy or insolvency laws of a particular jurisdiction may impose restrictions on or prohibitions against the right of offset in bankruptcy, insolvency or other events.
Collateral (margin) requirements differ by type of derivative. Margin requirements are established by the exchange or clearinghouse for exchange-traded and centrally cleared derivatives. Brokers can ask for margin
in excess of the minimum in certain circumstances. Collateral terms are contract specific for over-the-counter derivatives. For over-the-counter derivatives traded under an ISDA Master Agreement, the collateral requirements are typically calculated by netting the marked-to-market amount for each transaction under such agreement and comparing that amount to the value of any variation margin currently pledged by the Fund and/or the counterparty. Generally, the amount of collateral due from or to a party has to exceed a minimum transfer amount threshold (e.g., $500,000) before a transfer has to be made. To the extent amounts due to the Fund from its counterparties are not fully collateralized, contractually or otherwise, the Fund bears the risk of loss from counterparty nonperformance. The Fund attempts to mitigate counterparty risk by only entering into agreements with counterparties that it believes have the financial resources to honor their obligations and by monitoring the financial stability of those counterparties.
Certain ISDA Master Agreements allow counterparties to over-the-counter derivatives to terminate derivative contracts prior to maturity in the event the Fund's net assets decline by a stated percentage over a specified time period or if the Fund fails to meet the terms of the ISDA Master Agreement, which would cause the Fund to accelerate payment of any net liability owed to the counterparty. The Fund also has termination rights if the counterparty fails to meet the terms of the ISDA Master Agreement. In addition to considering counterparty credit risk, the Fund would consider terminating the derivative contracts based on whether termination would result in a net liability owed from the counterparty.
For financial reporting purposes, the Fund does not offset derivative assets and derivative liabilities that are subject to netting arrangements in the Statement of Assets and Liabilities.
Forward Foreign Currency Exchange Contracts
Forward foreign currency exchange contracts are over-the-counter agreements between two parties to buy and sell a currency at a set price on a future date. The Fund utilized forward foreign currency exchange contracts to hedge the currency exposure associated with some or all of the Fund's securities, to shift investment exposure from one currency to another, to shift U.S. dollar exposure to achieve a representative weighted mix of major currencies in its benchmark, and/or to recover an underweight country exposure in its portfolio. These instruments may be used for other purposes in future periods.
Annual Report 2015
29
COLUMBIA OVERSEAS VALUE FUND
NOTES TO FINANCIAL STATEMENTS (continued)
February 28, 2015
The values of forward foreign currency exchange contracts fluctuate daily with changes in foreign currency exchange rates. Changes in the value of these contracts are recorded as unrealized appreciation or depreciation until the contract is exercised or has expired. The Fund will realize a gain or loss when the forward foreign currency exchange contract is closed or expires.
The use of forward foreign currency exchange contracts does not eliminate fluctuations in the prices of the Fund's portfolio securities. The risks of forward foreign currency exchange contracts include movement in the values of the foreign currencies relative to the U.S. dollar (or other foreign currencies) and the possibility that counterparties will not complete their contractual obligations, which may be in excess of the amount reflected, if any, in the Statement of Assets and Liabilities.
Futures Contracts
Futures contracts are exchange traded and represent commitments for the future purchase or sale of an asset at a specified price on a specified date. The Fund bought and sold futures contracts to manage exposure to the securities market and to maintain appropriate equity market exposure while keeping sufficient cash to accommodate daily redemptions. These instruments may be used for other purposes in future periods. Upon entering into futures contracts, the Fund bears risks that it may not achieve the anticipated benefits of the futures contracts and may realize a loss. Additional risks include counterparty credit risk, the possibility of an illiquid market, and that a change in the value of the contract or option may not correlate with changes in the value of the underlying asset.
Upon entering into a futures contract, the Fund pledges cash or securities with the broker in an amount sufficient to meet the initial margin requirement. The initial margin deposit must be maintained at an established level over the life of the contract. Cash deposited as initial margin is recorded in the Statement of Assets and Liabilities as margin deposits. Securities deposited as initial margin are designated in the Portfolio of Investments. Subsequent payments (variation margin) are made or received by the Fund each day. The variation margin payments are equal to the daily change in the contract value and are recorded as variation margin receivable or payable and are offset in unrealized gains or losses. The Fund recognizes a realized gain or loss when the contract is closed or expires. Futures contracts involve, to varying degrees, risk of loss in excess of the variation margin disclosed in the Statement of Assets and Liabilities.
Options Contracts
Options are contracts which entitle the holder to purchase or sell securities or other identified assets at a specified price, or in the case of index option contracts, to receive or pay the difference between the index value and the strike price of the index option contract. Option contracts can be either exchange-traded or over-the-counter. The Fund purchased and wrote option contracts to decrease the Fund's exposure to equity risk and to increase return on investments and facilitate buying and selling of securities for investments. These instruments may be used for other purposes in future periods. Completion of transactions for option contracts traded in the over-the-counter market depends upon the performance of the other party. Cash collateral may be collected or posted by the Fund to secure certain over-the-counter option contract trades. Cash collateral held or posted by the Fund for such option contract trades must be returned to the counterparty or the Fund upon closure, exercise or expiration of the contract.
Options contracts purchased are recorded as investments. When the Fund writes an options contract, the premium received is recorded as an asset and an amount equivalent to the premium is recorded as a liability in the Statement of Assets and Liabilities and is subsequently adjusted to reflect the current fair value of the option written. Changes in the fair value of the written option are recorded as unrealized appreciation or depreciation until the contract is exercised or has expired. The Fund will realize a gain or loss when the option contract is closed or expires. When option contracts are exercised, the proceeds on sales for a written call or purchased put option contract, or the purchase cost for a written put or purchased call option contract, is adjusted by the amount of premium received or paid.
For over-the-counter options purchased, the Fund bears the risk of loss of the amount of the premiums paid plus the positive change in market values net of any collateral held by the Fund should the counterparty fail to perform under the contracts. Option contracts written by the Fund do not typically give rise to counterparty credit risk, as options written generally obligate the Fund and not the counterparty to perform. The risk in writing a call option contract is that the Fund gives up the opportunity for profit if the market price of the security increases above the strike price and the option contract is exercised. The risk in writing a put option contract is that the Fund may incur a loss if the market price of the security decreases below the strike price and the option contract is
Annual Report 2015
30
COLUMBIA OVERSEAS VALUE FUND
NOTES TO FINANCIAL STATEMENTS (continued)
February 28, 2015
exercised. Exercise of a written option could result in the Fund purchasing or selling a security or foreign currency when it otherwise would not, or at a price different from the current market value. In purchasing and writing options, the Fund bears the risk of an unfavorable change in the value of the underlying instrument or the risk that the Fund may not be able to enter into a closing transaction due to an illiquid market.
Contracts and premiums associated with options contracts written for the year ended February 28, 2015 are as follows:
| | | Calls | |
| | | Contracts | | Premiums ($) | |
Balance at February 28, 2014 | | | — | | | | — | | |
Opened | | | 3,105 | | | | 130,356 | | |
Expired | | | (466 | ) | | | (76,273 | ) | |
Exercised | | | (2,639 | ) | | | (54,083 | ) | |
Balance at February 28, 2015 | | | — | | | | — | | |
Offsetting of Derivative Assets and Derivative Liabilities
The following tables present the Fund's gross and net amount of assets and liabilities available for offset under netting arrangements as well as any related collateral received or pledged by the Fund as of February 28, 2015:
| | | | | | | | Gross Amounts Not Offset in
the Statement of Assets and Liabilities | | | |
| | Gross
Amounts of
Recognized
Assets ($) | | Gross Amounts
Offset in the
Statement of
Assets and
Liabilities ($) | | Net Amounts of
Assets
Presented in the
Statement of
Assets and
Liabilities ($) | | Financial
Instruments ($)(a) | | Cash
Collateral
Received ($) | | Securities
Collateral
Received ($) | | Net
Amount ($)(b) | |
Asset Derivatives: | |
Forward Foreign Currency
Exchange Contracts | | | 1,096,872 | | | | — | | | | 1,096,872 | | | | 144,304 | | | | — | | | | — | | | | 952,568 | | |
| | | | | | | | Gross Amounts Not Offset in
the Statement of Assets and Liabilities | | | |
| | Gross
Amounts of
Recognized
Liabilities ($) | | Gross Amounts
Offset in the
Statement of
Assets and
Liabilities ($) | | Net Amounts of
Liabilities
Presented in the
Statement of
Assets and
Liabilities ($) | | Financial
Instruments ($)(c) | | Cash
Collateral
Pledged ($) | | Securities
Collateral
Pledged ($) | | Net
Amount($)(d) | |
Liability Derivatives: | |
Forward Foreign Currency
Exchange Contracts | | | 144,304 | | | | — | | | | 144,304 | | | | 144,304 | | | | — | | | | — | | | | — | | |
(a) Represents the amount of assets that could be offset by liabilities with the same counterparty under master netting or similar agreements that management elects not to offset on the Statement of Assets and Liabilities.
(b) Represents the net amount due from counterparties in the event of default.
(c) Represents the amount of liabilities that could be offset by assets with the same counterparty under master netting or similar agreements that management elects not to offset on the Statement of Assets and Liabilities.
(d) Represents the net amount due to counterparties in the event of default.
Effects of Derivative Transactions in the Financial Statements
The following tables are intended to provide additional information about the effect of derivatives on the financial statements of the Fund, including: the fair value of derivatives by risk category and the location of those fair values in the Statement of Assets and Liabilities;
and the impact of derivative transactions over the period in the Statement of Operations, including realized gains or losses and unrealized gains or losses. The derivative schedules following the Portfolio of Investments present additional information regarding derivative instruments outstanding at the end of the period, if any.
Annual Report 2015
31
COLUMBIA OVERSEAS VALUE FUND
NOTES TO FINANCIAL STATEMENTS (continued)
February 28, 2015
The following table is a summary of the fair value of derivative instruments (not considered to be hedging instruments for accounting disclosure purposes) at February 28, 2015:
Asset Derivatives | |
Risk Exposure
Category | | Statement of Assets and
Liabilities Location | | Fair Value ($) | |
Foreign exchange
risk
| | Unrealized appreciation on
forward foreign currency
exchange contracts | | | 1,096,872
| | |
Liability Derivatives | |
Risk Exposure
Category | | Statement of Assets and
Liabilities Location | | Fair Value ($) | |
Foreign exchange risk
| | Unrealized depreciation on
forward foreign currency
exchange contracts | | | 144,304
| | |
The following table indicates the effect of derivative instruments (not considered to be hedging instruments for accounting disclosure purposes) in the Statement of Operations for the year ended February 28, 2015:
Amount of Realized Gain (Loss) on Derivatives Recognized in Income | |
| Risk Exposure Category | | Forward Foreign
Currency Exchange
Contracts ($) | | Futures Contracts ($) | | Options Contracts
Written and
Purchased ($) | | Total ($) | |
Equity risk | | | — | | | | (274,622 | ) | | | 76,273 | | | | (198,349 | ) | |
Foreign exchange risk | | | (2,984,575 | ) | | | — | | | | — | | | | (2,984,575 | ) | |
Total | | | (2,984,575 | ) | | | (274,622 | ) | | | 76,273 | | | | (3,182,924 | ) | |
Change in Unrealized Appreciation (Depreciation) on Derivatives Recognized in Income | |
| Risk Exposure Category | | Forward Foreign
Currency Exchange
Contracts ($) | | | | | | | |
Foreign exchange risk | | | 433,454 | | | | | | | | |
The following table is a summary of the average outstanding volume by derivative instrument for the year ended February 28 , 2015:
Derivative Instrument | | Average Notional Amounts ($)* | |
Futures contracts — Long | | | 150,923 | | |
Derivative Instrument | | Average Market Value ($)* | |
Options contracts — Written | | | (12,630 | ) | |
Derivative Instrument | | Average
Unrealized
Appreciation ($)** | | Average
Unrealized
Depreciation ($)** | |
Forward foreign currency
exchange contracts | | | 881,167 | | | | (1,016,571 | ) | |
*Based on the daily outstanding amounts for the year ended February 28, 2015.
**Based on the ending quarterly outstanding amounts for the year ended February 28, 2015.
Security Transactions
Security transactions are accounted for on the trade date. Cost is determined and gains (losses) are based upon the specific identification method for both financial statement and federal income tax purposes.
Income Recognition
Corporate actions and dividend income are generally recorded net of any non-reclaimable tax withholdings, on the ex-dividend date or upon receipt of ex-dividend notification in the case of certain foreign securities.
The Fund may receive distributions from holdings in business development companies (BDCs), ETFs, other regulated investment companies (RICs), and real estate investment trusts (REITs), which report information on the character of their distributions annually. These distributions are allocated to dividend income, capital gain and return of capital based on actual information reported. To the extent actual information has not yet been reported by the REITs, estimates for return of capital are made by the Fund's management. Return of capital is recorded as a reduction of the cost basis of securities held. If the Fund no longer owns the applicable securities, return of capital is recorded as a realized gain. Management's estimates are subsequently adjusted when the actual character of the distributions is disclosed by the REITs, which could result in a proportionate change in return of capital to shareholders. No estimates are made for the BDCs, ETFs, and RICs.
Annual Report 2015
32
COLUMBIA OVERSEAS VALUE FUND
NOTES TO FINANCIAL STATEMENTS (continued)
February 28, 2015
Awards from class action litigation are recorded as a reduction of cost basis if the Fund still owns the applicable securities on the payment date. If the Fund no longer owns the applicable securities, the proceeds are recorded as realized gains.
Expenses
General expenses of the Trust are allocated to the Fund and other funds of the Trust based upon relative net assets or other expense allocation methodologies determined by the nature of the expense. Expenses directly attributable to the Fund are charged to the Fund. Expenses directly attributable to a specific class of shares are charged to that share class.
Determination of Class Net Asset Value
All income, expenses (other than class-specific expenses, which are charged to that share class, as shown in the Statement of Operations) and realized and unrealized gains (losses) are allocated to each class of the Fund on a daily basis, based on the relative net assets of each class, for purposes of determining the net asset value of each class.
Federal Income Tax Status
The Fund intends to qualify each year as a regulated investment company under Subchapter M of the Internal Revenue Code, as amended, and will distribute substantially all of its taxable income (including net short-term capital gains), if any, for its tax year, and as such will not be subject to federal income taxes. In addition, the Fund intends to distribute in each calendar year substantially all of its net investment income, capital gains and certain other amounts, if any, such that the Fund should not be subject to federal excise tax. Therefore, no federal income or excise tax provision is recorded.
Foreign Taxes
The Fund may be subject to foreign taxes on income, gains on investments or currency repatriation, a portion of which may be recoverable. The Fund will accrue such taxes and recoveries, as applicable, based upon its current interpretation of tax rules and regulations that exist in the markets in which it invests.
Realized gains in certain countries may be subject to foreign taxes at the Fund level, based on statutory rates. The Fund accrues for such foreign taxes on realized and unrealized gains at the appropriate rate for each jurisdiction, as applicable. The amount, if any, is
disclosed as a liability on the Statement of Assets and Liabilities.
Distributions to Shareholders
Distributions from net investment income, if any, are declared and paid semi-annually. Net realized capital gains, if any, are distributed at least annually. Income distributions and capital gain distributions are determined in accordance with federal income tax regulations, which may differ from GAAP.
Guarantees and Indemnifications
Under the Trust's organizational documents and, in some cases, by contract, its officers and trustees are indemnified against certain liabilities arising out of the performance of their duties to the Trust or its funds. In addition, certain of the Fund's contracts with its service providers contain general indemnification clauses. The Fund's maximum exposure under these arrangements is unknown since the amount of any future claims that may be made against the Fund cannot be determined, and the Fund has no historical basis for predicting the likelihood of any such claims.
Note 3. Fees and Compensation Paid to Affiliates
Investment Management Fees
Under an Investment Management Services Agreement, Columbia Management Investment Advisers, LLC (the Investment Manager), a wholly-owned subsidiary of Ameriprise Financial, Inc. (Ameriprise Financial), determines which securities will be purchased, held or sold. The investment management fee is an annual fee that is equal to a percentage of the Fund's average daily net assets that declines from 0.79% to 0.62% as the Fund's net assets increase. The effective investment management fee rate for the year ended February 28, 2015 was 0.78% of the Fund's average daily net assets.
Administration Fees
Under an Administrative Services Agreement, the Investment Manager also serves as the Fund Administrator. The Fund pays the Fund Administrator an annual fee for administration and accounting services equal to a percentage of the Fund's average daily net assets that declines from 0.08% to 0.05% as the Fund's net assets increase. The effective administration fee rate for the year ended February 28, 2015 was 0.08% of the Fund's average daily net assets.
Annual Report 2015
33
COLUMBIA OVERSEAS VALUE FUND
NOTES TO FINANCIAL STATEMENTS (continued)
February 28, 2015
Other Expenses
Other expenses are for, among other things, miscellaneous expenses of the Fund or the Board, including payments to a company providing limited administrative services to the Fund and the Board. That company's expenses include boardroom and office expense, employee compensation, employee health and retirement benefits, and certain other expenses. For the year ended February 28, 2015, other expenses paid by the Fund to this company were $2,217.
Compensation of Board Members
Board members are compensated for their services to the Fund as disclosed in the Statement of Operations. Under a Deferred Compensation Plan (the Plan), the Board members who are not "interested persons" of the Fund, as defined under the 1940 Act, may elect to defer payment of up to 100% of their compensation. Deferred amounts are treated as though equivalent dollar amounts had been invested in shares of certain funds managed by the Investment Manager. The Fund's liability for these amounts is adjusted for market value changes and remains in the Fund until distributed in accordance with the Plan.
Transfer Agent Fees
Under a Transfer and Dividend Disbursing Agent Agreement, Columbia Management Investment Services Corp. (the Transfer Agent), an affiliate of the Investment Manager and a wholly-owned subsidiary of Ameriprise Financial, is responsible for providing transfer agency services to the Fund. The Transfer Agent has contracted with Boston Financial Data Services (BFDS) to serve as sub-transfer agent.
Effective November 1, 2014, the Transfer Agent receives a monthly transfer agency fee based on the number or the average value of accounts, depending on the type of account. Prior to November 1, 2014, the Transfer Agent received a monthly account-based service fee based on the number of open accounts. In addition, the Transfer Agent also receives sub-transfer agency fees based on a percentage of the average aggregate value of the Fund's shares maintained in omnibus accounts (other than omnibus accounts for which American Enterprise Investment Services Inc. is the broker of record or accounts where the beneficial shareholder is a customer of Ameriprise Financial Services, Inc., for which the Transfer Agent receives a per account fee). The Transfer Agent pays the fees of BFDS for services as sub-transfer
agent and is not entitled to reimbursement for such fees from the Fund (with the exception of out-of-pocket fees).
The Transfer Agent also receives compensation from the Fund for various shareholder services and reimbursements for certain out-of-pocket fees. Class I shares do not pay transfer agency fees. Total transfer agent fees for Class K shares are subject to an annual limitation of not more than 0.05% of the average daily net assets attributable to Class K shares.
For the year ended February 28, 2015, the Fund's effective transfer agent fee rates as a percentage of average daily net assets of each class were as follows:
Class A | | | 0.24 | % | |
Class B | | | 0.24 | | |
Class C | | | 0.24 | | |
Class K | | | 0.05 | | |
Class W | | | 0.24 | | |
Class Z | | | 0.24 | | |
An annual minimum account balance fee of $20 may apply to certain accounts with a value below the applicable share class's initial minimum investment requirements to reduce the impact of small accounts on transfer agent fees. These minimum account balance fees are remitted to the Fund and recorded as part of expense reductions in the Statement of Operations. For the year ended February 28, 2015, these minimum account balance fees reduced total expenses of the Fund by $20.
Plan Administration Fees
Under a Plan Administration Services Agreement with the Transfer Agent, the Fund pays an annual fee at a rate of 0.25% of the Fund's average daily net assets attributable to Class K shares for the provision of various administrative, recordkeeping, communication and educational services.
Distribution and Service Fees
The Fund has an agreement with Columbia Management Investment Distributors, Inc. (the Distributor), an affiliate of the Investment Manager and a wholly-owned subsidiary of Ameriprise Financial, for distribution and shareholder services. The Board has approved, and the Fund has adopted, distribution and shareholder service plans (the Plans) applicable to certain share classes, which set the distribution and service fees for the Fund. These fees are calculated daily and are intended to compensate the Distributor and/or eligible selling and/or
Annual Report 2015
34
COLUMBIA OVERSEAS VALUE FUND
NOTES TO FINANCIAL STATEMENTS (continued)
February 28, 2015
servicing agents for selling shares of the Fund and providing services to investors.
Under the Plans, the Fund pays a monthly combined distribution and service fee to the Distributor at the maximum annual rate of 0.25% of the average daily net assets attributable to Class A shares of the Fund. Also under the Plans, the Fund pays a monthly service fee at the maximum annual rate of 0.25% of the average daily net assets attributable to Class B, Class C and Class W shares of the Fund and the payment of a monthly distribution fee at the maximum annual rates of 0.75%, 0.75% and 0.25% of the average daily net assets attributable to Class B, Class C and Class W shares, respectively.
Although the Fund may pay a distribution fee up to 0.25% of the Fund's average daily net assets attributable to Class W shares and a service fee of up to 0.25% of the Fund's average daily net assets attributable to Class W shares, the aggregate fee shall not exceed 0.25% of the Fund's average daily net assets attributable to Class W shares.
Sales Charges
Sales charges, including front-end charges and CDSCs, received by the Distributor for distributing Fund shares were $114,996 for Class A, $1,739 for Class B, and $140 for Class C for the year ended February 28, 2015.
Expenses Waived/Reimbursed by the Investment Manager and its Affiliates
The Investment Manager and certain of its affiliates have contractually agreed to waive fees and/or reimburse expenses (excluding certain fees and expenses described below) for the periods disclosed below, unless sooner terminated at the sole discretion of the Board, so that the Fund's net operating expenses, after giving effect to fees waived/expenses reimbursed and any balance credits and/or overdraft charges from the Fund's custodian, do not exceed the following annual rates as a percentage of the class' average daily net assets:
| | | July 1, 2014
through
June 30, 2015 | | Prior to
July 1, 2014 | |
Class A | | | 1.55 | % | | | 1.41 | % | |
Class B | | | 2.30 | | | | 2.16 | | |
Class C | | | 2.30 | | | | 2.16 | | |
Class I | | | 1.12 | | | | 0.96 | | |
Class K | | | 1.42 | | | | 1.26 | | |
Class W | | | 1.55 | | | | 1.41 | | |
Class Z | | | 1.30 | | | | 1.16 | | |
In addition, effective July 1, 2014, the Fund's expense ratio is subject to a voluntary expense reimbursement arrangement pursuant to which fees are waived and/or expenses reimbursed (excluding certain fees and expenses described below), so that the Fund's net operating expenses, after giving effect to fees waived/expenses reimbursed and any balance credits and/or overdraft charges from the Fund's custodian, do not exceed the annual rates of 1.49% for Class A, 2.24% for Class B, 2.24% for Class C, 1.06% for Class I, 1.36% for Class K, 1.49% for Class W and 1.24% for Class Z. This arrangement may be revised or discontinued at any time.
Under the agreement governing these fee waivers and/or expense reimbursement arrangements, the following fees and expenses are excluded from the waiver/reimbursement commitment, and therefore will be paid by the Fund, if applicable: taxes (including foreign transaction taxes), expenses associated with investments in affiliated and non-affiliated pooled investment vehicles (including mutual funds and exchange-traded funds), transaction costs and brokerage commissions, costs related to any securities lending program, dividend expenses associated with securities sold short, inverse floater program fees and expenses, transaction charges and interest on borrowed money, interest, extraordinary expenses and any other expenses the exclusion of which is specifically approved by the Board. This agreement may be modified or amended only with approval from all parties. Any fees waived and/or expenses reimbursed under the expense reimbursement arrangements described above are not recoverable by the Investment Manager or its affiliates in future periods.
Note 4. Federal Tax Information
The timing and character of income and capital gain distributions are determined in accordance with income tax regulations, which may differ from GAAP because of temporary or permanent book to tax differences.
At February 28, 2015, these differences are primarily due to differing treatment for capital loss carryforwards, deferral/reversal of wash sale losses, Trustees' deferred compensation, foreign capital gains tax, foreign currency transactions, passive foreign investment company (PFIC) holdings, late-year ordinary losses, derivative investments and distributions in excess. To the extent these differences are permanent, reclassifications are made among the components of the Fund's net assets in the Statement of Assets and Liabilities. Temporary differences do not require reclassifications. In the
Annual Report 2015
35
COLUMBIA OVERSEAS VALUE FUND
NOTES TO FINANCIAL STATEMENTS (continued)
February 28, 2015
Statement of Assets and Liabilities the following reclassifications were made:
Excess of distributions over net investment income | | $ | (95,010 | ) | |
Accumulated net realized loss | | | 380,947 | | |
Paid-in capital | | | (285,937 | ) | |
Net investment income (loss) and net realized gains (losses), as disclosed in the Statement of Operations, and net assets were not affected by this reclassification.
The tax character of distributions paid during the years indicated was as follows:
Year Ended February 28, | | 2015 | | 2014 | |
Ordinary income | | $ | 23,145,699 | | | $ | 6,537,515 | | |
Tax return of capital | | | 377,769 | | | | — | | |
Total | | | 23,523,468 | | | | 6,537,515 | | |
Short-term capital gain distributions, if any, are considered ordinary income distributions for tax purposes.
At February 28, 2015, the components of distributable earnings on a tax basis were as follows:
Capital loss carryforwards | | $ | (342,547,025 | ) | |
Net unrealized appreciation | | | 32,577,416 | | |
At February 28, 2015, the cost of investments for federal income tax purposes was $656,598,127 and the aggregate gross unrealized appreciation and depreciation based on that cost was:
Unrealized appreciation | | $ | 61,258,390 | | |
Unrealized depreciation | | | (28,680,974 | ) | |
Net unrealized appreciation | | | 32,577,416 | | |
The following capital loss carryforwards, determined at February 28, 2015, may be available to reduce taxable income arising from future net realized gains on investments, if any, to the extent permitted by the Internal Revenue Code:
Year of Expiration | | Amount ($) | |
2017 | | | 321,237,467 | | |
2018 | | | 3,000,399 | | |
No expiration — short-term | | | 18,309,159 | | |
Total | | | 342,547,025 | | |
Capital loss carryforwards with no expiration are required to be utilized prior to any capital losses which carry an expiration date. As a result of this ordering rule, capital loss carryforwards which carry an expiration date may be more likely to expire unused.
Under current tax rules, regulated investment companies can elect to treat certain late-year ordinary losses incurred and post-October capital losses (capital losses realized after October 31) as arising on the first day of the following taxable year. As of February 28, 2015, the Fund will elect to treat late-year ordinary losses of $349,102 as arising on March 1, 2015.
Management of the Fund has concluded that there are no significant uncertain tax positions in the Fund that would require recognition in the financial statements. However, management's conclusion may be subject to review and adjustment at a later date based on factors including, but not limited to, new tax laws, regulations, and administrative interpretations (including relevant court decisions). Generally, the Fund's federal tax returns for the prior three fiscal years remain subject to examination by the Internal Revenue Service.
Note 5. Portfolio Information
The cost of purchases and proceeds from sales of securities, excluding short-term investments and derivatives, if any, aggregated to $645,455,026 and $553,098,754, respectively, for the year ended February 28, 2015. The amount of purchase and sale activity impacts the portfolio turnover rate reported in the Financial Highlights.
Note 6. Affiliated Money Market Fund
The Fund invests in Columbia Short-Term Cash Fund, an affiliated money market fund established for the exclusive use by the Fund and other affiliated funds. The income earned by the Fund from such investments is included as Dividends — affiliated issuers in the Statement of Operations. As an investing fund, the Fund indirectly bears its proportionate share of the expenses of Columbia Short-Term Cash Fund.
Note 7. Shareholder Concentration
At February 28, 2015, affiliated shareholders of record owned 98.4% of the outstanding shares of the Fund in one or more accounts. Subscription and redemption activity by concentrated accounts may have a significant effect on the operations of the Fund.
Note 8. Line of Credit
The Fund has entered into a revolving credit facility with a syndicate of banks led by JPMorgan Chase Bank, N.A. (JPMorgan) whereby the Fund may borrow for the temporary funding of shareholder redemptions or for other temporary or emergency purposes. Pursuant to a
Annual Report 2015
36
COLUMBIA OVERSEAS VALUE FUND
NOTES TO FINANCIAL STATEMENTS (continued)
February 28, 2015
December 9, 2014 amendment, the credit facility agreement, which is a collective agreement between the Fund and certain other funds managed by the Investment Manager, severally and not jointly, permits collective borrowings up to $550 million. Interest is charged to each participating fund based on its borrowings at a rate equal to the higher of (i) the overnight federal funds rate plus 1.00% or (ii) the one-month LIBOR rate plus 1.00%. Each borrowing under the credit facility matures no later than 60 days after the date of borrowing. The Fund also pays a commitment fee equal to its pro rata share of the amount of the credit facility at a rate of 0.075% per annum. The commitment fee is included in other expenses in the Statement of Operations. Prior to the December 9, 2014 amendment, the credit facility agreement permitted borrowings up to $500 million under the same terms and interest rates as described above.
The Fund had no borrowings during the year ended February 28, 2015.
Note 9. Fund Reorganization
At the close of business on March 15, 2013, the Fund acquired the assets and assumed the identified liabilities of Columbia Multi-Advisor International Value Fund, a series of Columbia Funds Series Trust II (the acquired fund). The reorganization was completed after shareholders of the acquired fund approved a plan of reorganization on February 27, 2013. The purpose of the transaction was to combine two funds managed by the Investment Manager with comparable investment objectives and strategies.
The aggregate net assets of the Fund immediately before the acquisition were $30,016,215 and the combined net assets immediately after the acquisition were $257,671,466.
The reorganization was accomplished by a tax-free exchange of 40,021,347 shares of the acquired fund valued at $227,655,251 (including $12,260,969 of unrealized appreciation).
In exchange for the acquired fund's shares, the Fund issued the following number of shares:
| | | Shares | |
Class A | | | 26,646,303 | | |
Class B | | | 1,692,156 | | |
Class C | | | 578,148 | | |
Class I | | | 1,031 | | |
Class K | | | 25,842 | | |
Class Z | | | 8,336 | | |
For financial reporting purposes, net assets received and shares issued by the Fund were recorded at fair value; however, the acquired fund's cost of investments was carried forward.
The financial statements reflect the operations of the Fund for the period prior to the reorganization and the combined fund for the period subsequent to the reorganization. Because the combined investment portfolios have been managed as a single integrated portfolio since the reorganization was completed, it is not practicable to separate the amounts of revenue and earnings of the acquired fund that have been included in the combined Fund's Statement of Operations since the reorganization was completed.
Assuming the reorganization had been completed on March 1, 2013, the Fund's pro-forma net investment income, net gain on investments, net change in unrealized appreciation and net increase in net assets from operations for the year ended February 28, 2014 would have been approximately $6.9 million, $17.2 million, $41.5 million and $65.6 million, respectively.
Note 10. Significant Risks
Financial Sector Risk
Sector risk occurs when a fund invests a significant portion of its assets in securities of companies conducting business in a related group of industries within an economic sector. Companies in the same economic sector may be similarly affected by economic, regulatory, political or market events or conditions, making a fund more vulnerable to unfavorable developments in that economic sector than funds that invest more broadly. The Fund may be more susceptible to the particular risks that may affect companies in the financial sector than if it were invested in a wider variety of companies in unrelated sectors.
Foreign Securities and Emerging Market Countries Risk
Investing in foreign securities may include certain risks and considerations not typically associated with investing in U.S. securities, such as fluctuating currency values and changing local and regional economic, political and social conditions, which may result in greater market volatility. In addition, certain foreign securities may not be as liquid as U.S. securities. Investing in emerging markets may accentuate these risks. These countries are also more likely to experience high levels of inflation, deflation or currency devaluation which could hurt their economies and securities markets.
Annual Report 2015
37
COLUMBIA OVERSEAS VALUE FUND
NOTES TO FINANCIAL STATEMENTS (continued)
February 28, 2015
Note 11. Subsequent Events
Management has evaluated the events and transactions that have occurred through the date the financial statements were issued and noted no items requiring adjustment of the financial statements or additional disclosure.
Note 12. Information Regarding Pending and Settled Legal Proceedings
In December 2005, without admitting or denying the allegations, American Express Financial Corporation (AEFC, which is now known as Ameriprise Financial, Inc. (Ameriprise Financial)) entered into settlement agreements with the Securities and Exchange Commission (SEC) and Minnesota Department of Commerce (MDOC) related to market timing activities. As a result, AEFC was censured and ordered to cease and desist from committing or causing any violations of certain provisions of the Investment Advisers Act of 1940, the Investment Company Act of 1940, and various Minnesota laws. AEFC agreed to pay disgorgement of $10 million and civil money penalties of $7 million. AEFC also agreed to retain an independent distribution consultant to assist in developing a plan for distribution of all disgorgement and civil penalties ordered by the SEC in accordance with various undertakings detailed at www.sec.gov/litigation/admin/ia-2451.pdf. Ameriprise Financial and its affiliates have cooperated with the SEC and the MDOC in these legal proceedings, and have made regular reports to the Funds' Boards of Trustees.
Ameriprise Financial and certain of its affiliates have historically been involved in a number of legal, arbitration and regulatory proceedings, including routine litigation, class actions, and governmental actions, concerning matters arising in connection with the conduct of their business activities. Ameriprise Financial believes that the Funds are not currently the subject of, and that neither Ameriprise Financial nor any of its affiliates are the subject of, any pending legal, arbitration or regulatory proceedings that are likely to have a material adverse effect on the Funds or the ability of Ameriprise Financial or its affiliates to perform under their contracts with the Funds. Ameriprise Financial is required to make quarterly (10-Q), annual (10-K) and, as necessary, 8-K filings with the Securities and Exchange Commission on legal and regulatory matters that relate to Ameriprise Financial and its affiliates. Copies of these filings may be obtained by accessing the SEC website at www.sec.gov.
There can be no assurance that these matters, or the adverse publicity associated with them, will not result in increased fund redemptions, reduced sale of fund shares or other adverse consequences to the Funds. Further, although we believe proceedings are not likely to have a material adverse effect on the Funds or the ability of Ameriprise Financial or its affiliates to perform under their contracts with the Funds, these proceedings are subject to uncertainties and, as such, we are unable to estimate the possible loss or range of loss that may result. An adverse outcome in one or more of these proceedings could result in adverse judgments, settlements, fines, penalties or other relief that could have a material adverse effect on the consolidated financial condition or results of operations of Ameriprise Financial.
Annual Report 2015
38
COLUMBIA OVERSEAS VALUE FUND
REPORT OF INDEPENDENT REGISTERED PUBLIC ACCOUNTING FIRM
To the Trustees of Columbia Funds Series Trust and the Shareholders of
Columbia Overseas Value Fund
In our opinion, the accompanying statement of assets and liabilities, including the portfolio of investments, and the related statements of operations and of changes in net assets and the financial highlights present fairly, in all material respects, the financial position of Columbia Overseas Value Fund (the "Fund", a series of Columbia Funds Series Trust) at February 28, 2015, and the results of its operations, the changes in its net assets and the financial highlights for each of the periods indicated, in conformity with accounting principles generally accepted in the United States of America. These financial statements and financial highlights (hereafter referred to as "financial statements") are the responsibility of the Fund's management; our responsibility is to express an opinion on these financial statements based on our audits. We conducted our audits of these financial statements in accordance with the standards of the Public Company Accounting Oversight Board (United States). Those standards require that we plan and perform the audit to obtain reasonable assurance about whether the financial statements are free of material misstatement. An audit includes examining, on a test basis, evidence supporting the amounts and disclosures in the financial statements, assessing the accounting principles used and significant estimates made by management, and evaluating the overall financial statement presentation. We believe that our audits, which included confirmation of securities at February 28, 2015 by correspondence with the custodian, brokers and transfer agent, and the application of alternative auditing procedures where such confirmations had not been received, provide a reasonable basis for our opinion.
PricewaterhouseCoopers LLP
Minneapolis, Minnesota
April 21, 2015
Annual Report 2015
39
COLUMBIA OVERSEAS VALUE FUND
FEDERAL INCOME TAX INFORMATION
(Unaudited)
The Fund hereby designates the following tax attributes for the fiscal year ended February 28, 2015. Shareholders will be notified in early 2016 of the amounts for use in preparing 2015 income tax returns.
Tax Designations:
| Qualified Dividend Income | | | 100 | % | |
| Dividends Received Deduction | | | 0.50 | % | |
Foreign Taxes Paid | | $ | 2,496,625 | | |
Foreign Taxes Paid Per Share | | $ | 0.03 | | |
Foreign Source Income | | $ | 30,342,615 | | |
Foreign Source Income Per Share | | $ | 0.38 | | |
Qualified Dividend Income. For taxable, non-corporate shareholders, the percentage of ordinary income distributed during the fiscal year that represents qualified dividend income subject to reduced tax rates.
Dividends Received Deduction. The percentage of ordinary income distributed during the fiscal year that qualifies for the corporate dividends received deduction.
Foreign Taxes. The Fund makes the election to pass through to shareholders the foreign taxes paid. Eligible shareholders may claim a foreign tax credit. These taxes, and the corresponding foreign source income, are provided.
Annual Report 2015
40
COLUMBIA OVERSEAS VALUE FUND
Shareholders elect the Board that oversees the Funds' operations. The Board appoints officers who are responsible for day-to-day business decisions based on policies set by the Board. The following table provides basic biographical information about the Funds' Board members, including their principal occupations during the past five years, although specific titles for individuals may have varied over the period. Under current Board policy, members may serve through the end of the calendar year in which he or she reaches either the mandatory retirement age established by the Board or the fifteenth anniversary of the first Board meeting they attended as a member of the Board.
Independent Trustees
Name,
Address,
Year of Birth | | Position Held With
Funds and Length of
Service | | Principal Occupation(s)
During Past Five Years
and Other Relevant
Professional Experience | | Number of
Funds in the
Fund Family
Overseen by
Board Member | | Other Present or Past
Directorships/
Trusteeships
(Within Past 5 Years) | |
Kathleen Blatz
901 S. Marquette Ave.
Minneapolis, MN 55402
1954 | | Board member since 1/06 for RiverSource Funds and since 6/11 for Nations Funds | | Attorney; specializing in arbitration and mediation; Chief Justice, Minnesota Supreme Court, 1998-2006; Associate Justice, Minnesota Supreme Court, 1996-1998; Fourth Judicial District Court Judge, Hennepin Country, 1994-1996; Attorney in private practice and public service, 1984-1993; State Representative, Minnesota House of Representatives, 1979-1993, which included service on the Tax and Financial Institutions and Insurance Committees | | | 127 | | | Trustee, BlueCross BlueShield of Minnesota (Chair of the Business Development Committee) since 2009; Chair of the Robina Foundation since August 2013 | |
Edward J. Boudreau, Jr.
901 S. Marquette Ave.
Minneapolis, MN 55402
1944 | | Board member since 6/11 for RiverSource Funds and since 1/05 for Nations Funds | | Managing Director, E.J. Boudreau & Associates (consulting) since 2000; FINRA Industry Arbitrator, 2002-present; Chairman and Chief Executive Officer, John Hancock Funds (asset management), Chairman and Interested Trustee for open-end and closed-end funds offered by John Hancock, 1989-2000; John Hancock Life Insurance Company, including SVP and Treasurer and SVP Information Technology, 1968-1988 | | | 125 | | | Former Trustee, BofA Funds Series Trust (11 funds), 2005-2011; Trustee, Boston Museum of Science (Chair of Finance Committee), 1985-2013 | |
Pamela G. Carlton
901 S. Marquette Ave.
Minneapolis, MN 55402
1954 | | Board member since 7/07 for RiverSource Funds and since 6/11 for Nations Funds | | President, Springboard — Partners in Cross Cultural Leadership (consulting company) since 2003; Managing Director of US Equity Research, JP Morgan Chase, 1999-2003; Director of US Equity Research, Chase Asset Management, 1996-1999; Co-Director Latin America Research, 1993-1996, COO Global Research, 1992-1996, Co-Director of US Research, 1991-1992, Investment Banker, Morgan Stanley, 1982-1991 | | | 127 | | | None | |
Annual Report 2015
41
COLUMBIA OVERSEAS VALUE FUND
TRUSTEES AND OFFICERS (continued)
Independent Trustees (continued)
Name,
Address,
Year of Birth | | Position Held With
Funds and Length of
Service | | Principal Occupation(s)
During Past Five Years
and Other Relevant
Professional Experience | | Number of
Funds in the
Fund Family
Overseen by
Board Member | | Other Present or Past
Directorships/
Trusteeships
(Within Past 5 Years) | |
William P. Carmichael
901 S. Marquette Ave.
Minneapolis, MN 55402
1943 | | Chair of the Board since 1/14, Board member since 6/11 for RiverSource Funds and since 2003 for Nations Funds | | Retired; Co-founder, The Succession Fund (provides exit strategies to owners of privately held companies) 1998-2007; Adjunct Professor of Finances, Kelley School of Business, Indiana University, 1993-2007; Senior Vice President, Sara Lee Corporation, 1991-1993; Senior Vice President and Chief Financial Officer, Beatrice Foods Company, 1984-1990; Vice President, Esmark, Inc, 1973-1984.; Associate, Price Waterhouse, 1968-1972 | | | 127 | | | Director, Cobra Electronics Corporation (electronic equipment manufacturer), 1994-August 2014; The Finish Line (athletic shoes and apparel) since July 2003; Director, International Textile Corp. since 2012; former Director, McMoRan Exploration Company (oil and gas exploration and development) 2010-2013; former Trustee, BofA Funds Series Trust (11 funds) 2009-2011; Director, Spectrum Brands, Inc. (consumer products), 2002-2009; Director, Simmons Company (bedding), 2004-2010 | |
Patricia M. Flynn
901 S. Marquette Ave.
Minneapolis, MN 55402
1950 | | Board member since 11/04 for RiverSource Funds and since 6/11 for Nations Funds | | Trustee Professor of Economics and Management, Bentley University since 1976 (also teaches and conducts research on corporate governance); Dean, McCallum Graduate School of Business, Bentley University, 1992-2002 | | | 127 | | | Trustee, MA Taxpayers Foundation since 1997; Board of Governors, Innovation Institute, MA Technology Collaborative since 2010 | |
William A. Hawkins
901 S. Marquette Ave.
Minneapolis, MN 55402
1942 | | Board member since 6/11 for RiverSource Funds and since 1/05 for Nations Funds | | Managing Director, Overton Partners (financial consulting), since August 2010; President and Chief Executive Officer, California General Bank, N.A., January 2008-August 2010; Operation Hope, COO, 2004-2007; IndyMac Bancorp, President, CBG, 1999-2003; American General Bank, President, 1997-1999; Griffin Financial Services, CEO, 1981-1997; The Griffin Funds, CEO, 1992-1998 | | | 125 | | | Trustee, BofA Funds Series Trust (11 funds) | |
R. Glenn Hilliard
901 S. Marquette Ave.
Minneapolis, MN 55402
1943 | | Board member since 6/11 for RiverSource Funds and since 1/05 for Nations Funds | | Chairman and Chief Executive Officer, Hilliard Group LLC (investing and consulting) since April 2003; Non-Executive Director & Chairman, CNO Financial Group, Inc. (insurance), September 2003-May 2011 | | | 125 | | | Chairman, BofA Funds Series Trust (11 funds); former Director, CNO Financial Group, Inc. (insurance) 2003-2011 | |
Annual Report 2015
42
COLUMBIA OVERSEAS VALUE FUND
TRUSTEES AND OFFICERS (continued)
Independent Trustees (continued)
Name,
Address,
Year of Birth | | Position Held With
Funds and Length of
Service | | Principal Occupation(s)
During Past Five Years
and Other Relevant
Professional Experience | | Number of
Funds in the
Fund Family
Overseen by
Board Member | | Other Present or Past
Directorships/
Trusteeships
(Within Past 5 Years) | |
Catherine James Paglia
901 S. Marquette Ave.
Minneapolis, MN 55402
1952 | | Board member since 11/04 for RiverSource Funds and since 6/11 for Nations Funds | | Director, Enterprise Asset Management, Inc. (private real estate and asset management company) since September 1998; Managing Director and Partner, Interlaken Capital, Inc., 1989-1997; Managing Director, Morgan Stanley, 1982-1989; Vice President, Investment Banking, 1980-1982, Associate, Investment Banking, 1976-1980, Dean Witter Reynolds, Inc. | | | 127 | | | Director, Valmont Industries, Inc. (irrigation systems manufacturer) since 2012; Trustee, Carleton College (on the Investment Committee); Trustee, Carnegie Endowment for International Peace (on the Investment Committee) | |
Leroy C. Richie
901 S. Marquette Ave.
Minneapolis, MN 55402
1941 | | Board member since 2000 for Seligman Funds, since 11/08 for RiverSource Funds and since 6/11 for Nations Funds | | Counsel, Lewis & Munday, P.C. (law firm) since 2004; Vice President and General Counsel, Automotive Legal Affairs, Chrysler Corporation, 1993-1997 | | | 127 | | | Lead Outside Director, Digital Ally, Inc. (digital imaging) since September 2005; Director, Infinity, Inc. (oil and gas exploration and production) since 1994; Director, OGE Energy Corp. (energy and energy services) since November 2007-2014 | |
Minor M. Shaw
901 S. Marquette Ave.
Minneapolis, MN 55402
1947 | | Board member since 6/11 for RiverSource Funds and since 2003 for Nations Funds | | President, Micco LLC (private investments) since 2011; President, Micco Corp. (family investment business) 1998-2011 | | | 125 | | | Director, Piedmont Natural Gas; Director, BlueCross BlueShield of South Carolina since April 2008; Chair of the Duke Endowment; Director, National Association of Corporate Directors, Carolinas Chapter, since 2013; Chair of Greenville-Spartanburg Airport Commission; former Trustee, BofA Funds Series Trust (11 funds), 2003-2011 | |
Alison Taunton-Rigby
901 S. Marquette Ave.
Minneapolis, MN 55402
1944 | | Board member since 11/02 for RiverSource Funds and since 6/11 for Nations Funds | | Managing Director, Forester Biotech (consulting) since 2001; Chief Executive Officer and Director, RiboNovix, Inc., (biotechnology) 2003-2010; President and Chief Executive Officer of CMT Inc., 2001-2003; Aquila Biopharmaceuticals Inc., 1996-2000; Cambridge Biotech Corporation, 1995-1996, Mitotix Inc., 1993-1994 | | | 127 | | | Director, Healthways, Inc. (health and well-being solutions) since 2005; Director, ICI Mutual Insurance Company, RRG since 2011; Director, Abt Associates (government contractor) since 2001; Director, Boston Children's Hospital since 2002 | |
Annual Report 2015
43
COLUMBIA OVERSEAS VALUE FUND
TRUSTEES AND OFFICERS (continued)
Interested Trustee Not Affiliated with Investment Manager*
Name,
Address,
Year of Birth | | Position Held With
Funds and Length of
Service | | Principal Occupation
During Past Five Years | | Number of
Funds in the
Fund Family
Overseen by
Board Member | | Other Present or Past
Directorships/
Trusteeships
(Within Past 5 Years) | |
Anthony M. Santomero
901 S. Marquette Ave.
Minneapolis, MN 55402
1946 | | Board member since 6/11 for RiverSource Funds and since 1/08 for Nations Funds | | Richard K. Mellon Professor Emeritus of Finance, The Wharton School, University of Pennsylvania, since 2002; Senior Advisor, McKinsey & Company (consulting), 2006-2008; President, Federal Reserve Bank of Philadelphia, 2000-2006, Professor of Finance, The Wharton School, University of Pennsylvania, 1972-2002 | | | 125 | | | Director, Renaissance Reinsurance Ltd. since May 2008; Trustee, Penn Mutual Life Insurance Company since March 2008; Director, Citigroup Inc. since 2009; Director, Citibank, N.A. since 2009; former Trustee, BofA Funds Series Trust (11 funds), 2008-2011 | |
* Dr. Santomero is not an affiliated person of the Investment Manager or Ameriprise Financial. However, he is currently deemed by the Funds to be an "interested person" (as defined in the 1940 Act) of the Funds because he serves as a Director of Citigroup Inc. and Citibank, N.A., companies that may directly or through subsidiaries and affiliates engage from time-to-time in brokerage execution, principal transactions and lending relationships with the Funds or accounts advised/managed by the Investment Manager.
Annual Report 2015
44
COLUMBIA OVERSEAS VALUE FUND
TRUSTEES AND OFFICERS (continued)
Interested Trustee Affiliated with Investment Manager*
Name,
Address,
Year of Birth | | Position Held With
Funds and Length of
Service | | Principal Occupation
During Past Five Years | | Number of
Funds in the
Fund Family
Overseen by
Board Member | | Other Present or Past
Directorships/
Trusteeships
(Within Past 5 Years) | |
William F. Truscott
53600 Ameriprise
Financial Center
Minneapolis, MN 55474
1960 | | Board member since 11/01 for RiverSource Funds and since 6/11 for Nations Funds; Senior Vice President since 2002 for RiverSource Funds and since 5/10 for Nations Funds | | Chairman of the Board and President, Columbia Management Investment Advisers, LLC since May 2010 and February 2012, respectively (previously President and Chief Investment Officer, 2001-April 2010); Chief Executive Officer, Global Asset Management, Ameriprise Financial, Inc. since September 2012 (previously Chief Executive Officer, U.S. Asset Management & President, Annuities, May 2010-September 2012 and President — U.S. Asset Management and Chief Investment Officer, 2005-April 2010); Director and Chief Executive Officer, Columbia Management Investment Distributors, Inc. since May 2010 and February 2012, respectively (previously Chairman of the Board and Chief Executive Officer, 2006-April 2010); Chairman of the Board and Chief Executive Officer, RiverSource Distributors, Inc. since 2006; Director, Threadneedle Asset Management Holdings, SARL since 2014; President and Chief Executive Officer, Ameriprise Certificate Company, 2006-August 2012 | | | 186 | | | Former Director, Ameriprise Certificate Company, 2006-January 2013 | |
* Interested person (as defined under the 1940 Act) by reason of being an officer, director, security holder and/or employee of the Investment Manager or Ameriprise Financial.
The Statement of Additional Information has additional information about the Fund's Board members and is available, without charge, upon request by calling 800.345.6611; contacting your financial intermediary or visiting columbiathreadneedle.com/us.
Annual Report 2015
45
COLUMBIA OVERSEAS VALUE FUND
TRUSTEES AND OFFICERS (continued)
The Board has appointed officers who are responsible for day-to-day business decisions based on policies it has established. The officers serve at the pleasure of the Board. In addition to Mr. Truscott, who is Senior Vice President, the Funds' other officers are:
Fund Officers
Name,
Address and
Year of Birth | | Position and Year
First Appointed to
Position for any Fund
in the Columbia
Funds Complex or a
Predecessor Thereof | | Principal Occupation(s) During Past Five Years | |
Christopher O. Petersen
5228 Ameriprise
Financial Center
Minneapolis, MN 55474
Born 1970 | | President and Principal Executive Officer (2015) | | Vice President and Lead Chief Counsel, Ameriprise Financial, Inc. since January 2015 (previously, Vice President and Chief Counsel January 2010-December 2014; and Vice President and Group Counsel or Counsel 2004-January 2010); officer of Columbia Funds and affiliated funds since 2007. | |
Michael G. Clarke
225 Franklin Street
Boston, MA 02110
Born 1969 | | Treasurer (2011) and Chief Financial Officer (2009) | | Vice President — Mutual Fund Administration, Columbia Management Investment Advisers, LLC, since May 2010; Managing Director of Fund Administration, Columbia Management Advisors, LLC, September 2004-April 2010; senior officer of Columbia Funds and affiliated funds since 2002. | |
Paul B. Goucher
100 Park Avenue
New York, NY 10017
Born 1968 | | Senior Vice President (2011), Chief Legal Officer (2015) and Assistant Secretary (2008) | | Vice President and Lead Chief Counsel, Ameriprise Financial, Inc. since November 2008 and January 2013, respectively (previously Chief Counsel, January 2010-January 2013 and Group Counsel, November 2008-January 2010). | |
Thomas P. McGuire
225 Franklin Street
Boston, MA 02110
Born 1972 | | Vice President and Chief Compliance Officer (2012) | | Vice President — Asset Management Compliance, Ameriprise Financial, Inc., since May 2010; Chief Compliance Officer, Ameriprise Certificate Company since September 2010; Compliance Executive, Bank of America, 2005-April 2010. | |
Colin Moore
225 Franklin Street
Boston, MA 02110
Born 1958 | | Senior Vice President (2010) | | Executive Vice President and Global Chief Investment Officer, Ameriprise Financial, Inc., since July 2013; Director and Global Chief Investment Officer, Columbia Management Investment Advisers, LLC since May 2010; Manager, Managing Director and Chief Investment Officer, Columbia Management Advisors, LLC, 2007-April 2010. | |
Michael E. DeFao
225 Franklin Street
Boston, MA 02110
Born 1968 | | Vice President (2011) and Assistant Secretary (2010) | | Vice President and Chief Counsel, Ameriprise Financial, Inc. since May 2010; Associate General Counsel, Bank of America, 2005-April 2010. | |
Joseph F. DiMaria
225 Franklin Street
Boston, MA 02110
Born 1968 | | Vice President (2011), Assistant Treasurer (2012) and Chief Accounting Officer (2008) | | Vice President — Mutual Fund Treasurer, Columbia Management Investment Advisers, LLC since May 2010; Director of Fund Administration, Columbia Management Advisors, LLC, 2006-April 2010. | |
Amy Johnson
5228 Ameriprise
Financial Center
Minneapolis, MN 55474
Born 1965 | | Vice President (2006) | | Managing Director and Chief Operating Officer, Columbia Management Investment Advisers, LLC since May 2010 (previously Chief Administrative Officer, 2009-April 2010, and Vice President — Asset Management and Trust Company Services, 2006-2009). | |
Lyn Kephart-Strong
5228 Ameriprise
Financial Center
Minneapolis, MN 55474
Born 1960 | | Vice President (2015) | | President, Columbia Management Investment Services Corp. since October 2014; Vice President & Resolution Officer, Ameriprise Trust Company since August 2009; President, RiverSource Service Corporation 2004-2010. | |
Ryan C. Larrenaga
225 Franklin Street
Boston, MA 02110
Born 1970 | | Vice President and Secretary (2015) | | Vice President and Group Counsel, Ameriprise Financial, Inc. since August 2011 (previously, Counsel from May 2010 to August 2011); Assistant General Counsel, Bank of America, 2005-April 2010; officer of Columbia Funds and affiliated funds since 2005. | |
Annual Report 2015
46
COLUMBIA OVERSEAS VALUE FUND
IMPORTANT INFORMATION ABOUT THIS REPORT
Each fund mails one shareholder report to each shareholder address. If you would like more than one report, please call shareholder services at 800.345.6611 and additional reports will be sent to you.
The policy of the Board is to vote the proxies of the companies in which each fund holds investments consistent with the procedures as stated in the Statement of Additional Information (SAI). You may obtain a copy of the SAI without charge by calling 800.345.6611; contacting your financial intermediary; visiting columbiathreadneedle.com/us; or searching the website of the Securities and Exchange Commission (SEC) at sec.gov. Information regarding how each fund voted proxies relating to portfolio securities is filed with the SEC by August 31st for the most recent 12-month period ending June 30th of that year, and is available without charge by visiting columbiathreadneedle.com/us; or searching the website of the SEC at sec.gov.
Each fund files a complete schedule of portfolio holdings with the SEC for the first and third quarters of each fiscal year on Form N-Q. Each fund's Form N-Q is available on the SEC's website at sec.gov and may be reviewed and copied at the SEC's Public Reference Room in Washington, D.C. Information on the operation of the Public Reference Room may be obtained by calling 800.SEC.0330. Each fund's complete schedule of portfolio holdings, as filed on Form N-Q, can also be obtained without charge, upon request, by calling 800.345.6611.
Annual Report 2015
47
Columbia Overseas Value Fund
P.O. Box 8081
Boston, MA 02266-8081

This information is for use with concurrent or prior delivery of a fund prospectus. Please read and consider the investment objectives, risks, charges and expenses for any fund carefully before investing. For a prospectus and summary prospectus, which contains this and other important information about the Fund, go to columbiathreadneedle.com/us. The Fund is distributed by Columbia Management Investment Distributors, Inc., member FINRA, and managed by Columbia Management Investment Advisers, LLC.
Columbia Threadneedle Investments (Columbia Threadneedle) is the global brand name of the Columbia and Threadneedle group of companies.
All rights reserved. Columbia Management Investment Distributors, Inc., 225 Franklin Street, Boston, MA 02110-2804
© 2015 Columbia Management Investment Advisers, LLC.
columbiathreadneedle.com/us
ANN208_02_E01_(04/15)

ANNUAL REPORT
February 28, 2015

COLUMBIA SELECT LARGE CAP EQUITY FUND

ABOUT COLUMBIA THREADNEEDLE INVESTMENTS
Columbia Threadneedle Investments is a leading global asset management group that provides a broad range of actively managed investment strategies and solutions for individual, institutional and corporate clients around the world.
With more than 2,000 people, including over 450 investment professionals based in North America, Europe and Asia, we manage $506 billion* of assets across developed and emerging market equities, fixed income, asset allocation solutions and alternatives. We are the 11th largest manager of long-term mutual fund assets in the U.S.** and the 5th largest manager of retail funds in the U.K.***
Our priority is the investment success of our clients. We aim to deliver the investment outcomes they expect through an investment approach that is team-based, performance-driven and risk-aware. Our culture is dynamic and interactive. By sharing our insights across asset classes and geographies, we generate richer perspectives on global, regional and local investment landscapes. The ability to exchange and debate investment ideas in a collaborative environment enriches our teams' investment processes. More importantly, it results in better informed investment decisions for our clients.
Columbia funds are distributed by Columbia Management Investment Distributors, Inc., member FINRA, and managed by Columbia Management Investment Advisers, LLC.
Columbia Threadneedle Investments (Columbia Threadneedle) is the global brand name of the Columbia and Threadneedle group of companies.
* In U.S. dollars as of December 31, 2014. Source: Ameriprise Q4 Earnings Release. Includes all assets managed by entities in the Columbia and Threadneedle groups of companies. Contact us for more current data.
** Source: ICI as of December 31, 2014 for Columbia Management Investment Advisers, LLC.
*** Source: Investment Association as of December 2014 for Threadneedle Asset Management Limited.
© 2015 Columbia Management Investment Advisers, LLC. All rights reserved.
Not part of the shareholder report
Get the market insight you need from our investment experts
Connect with Columbia Threadneedle Investments
Investor insight
Find economic and market commentary, investment videos, white papers, mutual fund commentary and more at columbiathreadneedle.com/us.
Columbia Threadneedle Investor Newsletter (e-newsletter)
Read our award-winning* shareholder newsletter. Our quarterly newsletter is available online and provides timely and relevant content about economic trends, fund news, service enhancements and changes. Sign up to receive the newsletter electronically at columbiathreadneedle.com/
us/newsletter.
Investment videos
Get analysis of current events and trends that may affect your investments. Visit our online video library to watch and discover what our thought leaders are saying about the financial markets and economy.
Social media
We offer you multiple ways to access our market commentary and investment insights.
n Perspectives blog at columbiathreadneedle.com/us
Read timely posts by our investment team, including our chief investment officer, chief economist and portfolio managers.
n twitter.com/CTinvest_US
Follow us on Twitter for quick, up-to-the-minute comments on market news and more.
n youtube.com/CTinvestUS
View our commentaries on the economy, markets and current investment opportunities.
n linkedin.com/company/columbia-threadneedle-investments-us
Connect with us on LinkedIn for updates from our thought leaders.
*Columbia Threadneedle Investor Newsletter was awarded top honors in the Mutual Fund Education Alliance STAR Awards competition for excellence in mutual fund marketing and communications in 2011, 2012 and 2013. Materials in the competition were evaluated on educational value, message comprehension, effective design and objectives.
Not part of the shareholder report
Stay informed
Become a subscriber to receive the latest investment publications and mutual fund commentaries
Subscribe to Columbia Threadneedle Investments
Email subscription center
Subscribe to the latest information from Columbia Threadneedle. Visit our email subscription center at columbiathreadneedle.com/us/subscribe to register for economic and market commentary, product and service updates, white papers and more.
n Columbia Threadneedle Investor Newsletter
Quarterly newsletter featuring the latest macro- and micro-economic trends, investment themes, products, service changes and other items of interest to our investors
n Investment Strategy Outlook
Quarterly publication featuring the Columbia Threadneedle Asset Allocation Team's perspective on global economic investment conditions and markets
n MarketTrack
Quarterly publication featuring more than 40 charts and graphs that highlight the current state of the economy and the markets; includes straightforward insight on current investment opportunities
n White papers
Frequent articles that delve deep into a variety of investment topics
n Mutual fund updates
Quarterly portfolio manager commentary and fund fact sheets available for Columbia funds. (Not all funds have a commentary.)
Register your information online at columbiathreadneedle.com/us/subscribe and select the publications you would like to receive. Update your subscriptions at any time by accessing the email subscription center.
CT-MK (03/15) 5383/1125800
 Dear Shareholder,
In a world that is changing faster than ever before, investors want asset managers who offer a global perspective while generating strong and sustainable returns. To that end, Columbia Management, in conjunction with its U.K.-based affiliate, Threadneedle Investments, has rebranded to Columbia Threadneedle Investments. The new global brand represents the combined capabilities, resources and reach of the global group, offering investors access to the best of both firms.
With a presence in 18 countries and more than 450 investment professionals*, our collective perspective and world view as Columbia Threadneedle Investments gives us deeper insight into what might affect the real-life financial outcomes clients are seeking. Putting our views into a global context enables us to build richer perspectives and create the right solutions, and provides us with enhanced capabilities to deliver consistent investment performance, which may ultimately lead to better investor outcomes.
As a result of the rebrand, you will begin to see our new logo and colors reflected in printed materials, such as this shareholder report, as well as on our new website — columbiathreadneedle.com/us. We encourage you to visit us online and view a new video on the "About Us" tab that speaks to the strength of the firm.
While we are introducing a new brand, in many ways, the investment company you know well has not changed. The following remain in effect:
n Fund and strategy names
n Established investment teams, philosophies and processes
n Account services, features, servicing phone numbers and mailing addresses
n Columbia Management Investment Distributors as distributor and Columbia Management Investment Advisers as investment adviser
We recognize that the money we manage represents the hard work and savings of people like you, and that everyone has different ambitions and different definitions of success. Investors have varying goals — funding their children's education, enjoying their retirement, putting money aside for unexpected events, and more. Whatever your ambitions, we believe our wide range of investment products and solutions can help give you confidence that you will reach your goals.
The world is constantly changing, but our priority remains the same: to help you secure your finances, meet your goals and achieve success. Thank you for your continued investment with us. Our service representatives are available at 800.345.6611 to help with any questions.
Sincerely,

Christopher O. Petersen
President, Columbia Funds
Investors should consider the investment objectives, risks, charges and expenses of a mutual fund carefully before investing. For a free prospectus and summary prospectus, which contains this and other important information about a fund, visit columbiathreadneedle.com/us. The prospectus should be read carefully before investing.
* Source: Ameriprise as of December 1, 2014
Columbia Funds are distributed by Columbia Management Investment Distributors, Inc., member FINRA, and managed by Columbia Management Investment Advisers, LLC.
© 2015 Columbia Management Investment Advisers, LLC. All rights reserved.
COLUMBIA SELECT LARGE CAP EQUITY FUND
Fund Investment Manager
Columbia Management Investment
Advisers, LLC
225 Franklin Street
Boston, MA 02110
Fund Distributor
Columbia Management Investment
Distributors, Inc.
225 Franklin Street
Boston, MA 02110
Fund Transfer Agent
Columbia Management Investment
Services Corp.
P.O. Box 8081
Boston, MA 02266-8081
For more information about any of the funds, please visit columbiathreadneedle.com/us or call 800.345.6611. Customer Service Representatives are available to answer your questions Monday through Friday from 8 a.m. to 7 p.m. Eastern time.
The views expressed in this report reflect the current views of the respective parties. These views are not guarantees of future performance and involve certain risks, uncertainties and assumptions that are difficult to predict, so actual outcomes and results may differ significantly from the views expressed. These views are subject to change at any time based upon economic, market or other conditions and the respective parties disclaim any responsibility to update such views. These views may not be relied on as investment advice and, because investment decisions for a Columbia fund are based on numerous factors, may not be relied on as an indication of trading intent on behalf of any particular Columbia fund. References to specific securities should not be construed as a recommendation or investment advice.
Performance Overview | | | 3 | | |
Manager Discussion of Fund Performance | | | 5 | | |
Understanding Your Fund's Expenses | | | 7 | | |
Portfolio of Investments | | | 8 | | |
Statement of Assets and Liabilities | | | 12 | | |
Statement of Operations | | | 14 | | |
Statement of Changes in Net Assets | | | 15 | | |
Financial Highlights | | | 17 | | |
Notes to Financial Statements | | | 24 | | |
Report of Independent Registered
Public Accounting Firm | | | 31 | | |
Federal Income Tax Information | | | 32 | | |
Trustees and Officers | | | 33 | | |
Important Information About This Report | | | 39 | | |
COLUMBIA SELECT LARGE CAP EQUITY FUND
Performance Summary
n Columbia Select Large Cap Equity Fund (the Fund) Class A shares returned 14.26% excluding sales charges for the 12-month period that ended February 28, 2015.
n The Fund underperformed its benchmark, the S&P 500 Index, which returned 15.51% for the same period.
n Strong stock selection within the healthcare, industrials and consumer staples sectors aided performance. Disappointing results from materials and financials accounted for the modest shortfall relative to the benchmark.
Average Annual Total Returns (%) (for period ended February 28, 2015)
| | | Inception | | 1 Year | | 5 Years | | 10 Years | |
Class A | | 08/02/99 | | | | | | | | | | | | | |
Excluding sales charges | | | | | | | 14.26 | | | | 14.70 | | | | 7.64 | | |
Including sales charges | | | | | | | 7.68 | | | | 13.35 | | | | 7.01 | | |
Class B | | 08/02/99 | | | | | | | | | | | | | |
Excluding sales charges | | | | | | | 13.38 | | | | 13.84 | | | | 6.83 | | |
Including sales charges | | | | | | | 8.52 | | | | 13.60 | | | | 6.83 | | |
Class C | | 08/02/99 | | | | | | | | | | | | | |
Excluding sales charges | | | | | | | 13.38 | | | | 13.83 | | | | 6.82 | | |
Including sales charges | | | | | | | 12.41 | | | | 13.83 | | | | 6.82 | | |
Class I* | | 09/27/10 | | | 14.68 | | | | 15.14 | | | | 7.98 | | |
Class R5* | | 11/08/12 | | | 14.67 | | | | 15.03 | | | | 7.93 | | |
Class W* | | 09/27/10 | | | 14.29 | | | | 14.73 | | | | 7.68 | | |
Class Z | | 10/02/98 | | | 14.54 | | | | 14.97 | | | | 7.90 | | |
S&P 500 Index | | | | | | | 15.51 | | | | 16.18 | | | | 7.99 | | |
Returns for Class A are shown with and without the maximum initial sales charge of 5.75%. Returns for Class B are shown with and without the applicable contingent deferred sales charge (CDSC) of 5.00% in the first year, declining to 1.00% in the sixth year and eliminated thereafter. Returns for Class C are shown with and without the 1.00% CDSC for the first year only. The Fund's other classes are not subject to sales charges and have limited eligibility. Please see the Fund's prospectus for details. Performance for different share classes will vary based on differences in sales charges and fees associated with each class. All results shown assume reinvestment of distributions during the period. Returns do not reflect the deduction of taxes that a shareholder may pay on Fund distributions or on the redemption of Fund shares. Performance results reflect the effect of any fee waivers or reimbursements of Fund expenses by Columbia Management Investment Advisers, LLC and/or any of its affiliates. Absent these fee waivers or expense reimbursement arrangements, performance results would have been lower.
The performance information shown represents past performance and is not a guarantee of future results. The investment return and principal value of your investment will fluctuate so that your shares, when redeemed, may be worth more or less than their original cost. Current performance may be lower or higher than the performance information shown. You may obtain performance information current to the most recent month-end by contacting your financial intermediary, visiting columbiathreadneedle.com/us or calling 800.345.6611.
*The returns shown for periods prior to the share class inception date (including returns for the Life of the Fund, if shown, which are since Fund inception) include the returns of the Fund's oldest share class. These returns are adjusted to reflect any higher class-related operating expenses of the newer share classes, as applicable. Please visit columbiathreadneedle.com/us/investment-products/mutual-funds/appended-performance for more information.
The S&P 500 Index, an unmanaged index, measures the performance of 500 widely held, large-capitalization U.S. stocks and is frequently used as a general measure of market performance.
Indices are not available for investment, are not professionally managed and do not reflect sales charges, fees, brokerage commissions, taxes or other expenses of investing. Securities in the Fund may not match those in an index.
Annual Report 2015
3
COLUMBIA SELECT LARGE CAP EQUITY FUND
PERFORMANCE OVERVIEW (continued)
Performance of a Hypothetical $10,000 Investment (March 1, 2005 – February 28, 2015)
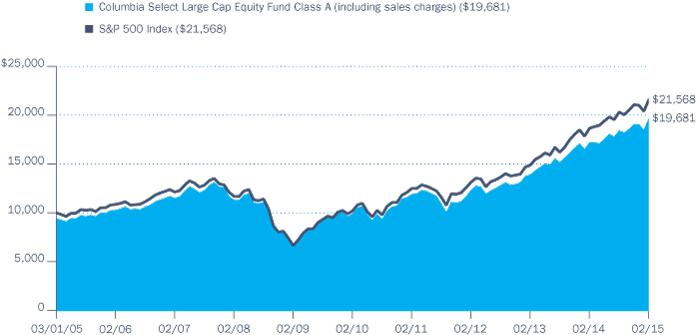
The chart above shows the change in value of a hypothetical $10,000 investment in Class A shares of Columbia Select Large Cap Equity Fund during the stated time period, and does not reflect the deduction of taxes that a shareholder may pay on Fund distributions or on the redemption of Fund shares.
Annual Report 2015
4
COLUMBIA SELECT LARGE CAP EQUITY FUND
MANAGER DISCUSSION OF FUND PERFORMANCE
For the 12-month period that ended February 28, 2015, the Fund's Class A shares returned 14.26% excluding sales charges. The Fund underperformed its benchmark, the S&P 500 Index, which returned 15.51%. Strong stock selection within the healthcare, industrials and consumer staples sectors aided performance. Disappointing results within materials and financials accounted for the Fund's modest shortfall relative to the benchmark.
Stocks Climbed as U.S. Economy Strengthened
After a cold and difficult winter brought many parts of the United States to a standstill early in 2014, the pace of U.S. economic growth picked up and good news appeared in most sectors. The labor market added 267,000 new jobs monthly, on average, during the 12-month period ended February 28, 2015. Solid new job growth drove the unemployment rate down to 5.5%, and prospects for higher wages generally buoyed consumer confidence during the period. Manufacturing activity remained solid, as capacity utilization rose to a post-recovery high. However, another stormy winter in the Northeast and Midwest nipped growth early in 2015. Manufacturing activity and consumer confidence slipped as harsh weather weighed on short-term expectations. The housing market's recovery was restrained by both periods of bad weather, tighter borrowing standards, rising prices and higher mortgage rates.
Investors responded favorably to the generally good economic news. However, concerns about increased global tensions, uncertainty about the Federal Reserve's (the Fed's) next move and sinking oil prices resulted in bouts of volatility that became more pronounced as the period wore on. The Fed spent 2014 winding down its monthly bond purchases, ending its program of quantitative easing in October, and suggested that it would raise short-term interest rates sometime in 2015. However, the timing of that move remained unclear, especially as some weaker data appeared in the final months of the period. In this environment, interest rates dropped sharply. The yield on the 10-year U.S. Treasury bond, which started the period at 2.6%, dropped to 2.0%, having traded even lower in the final months of the period. Large-cap stocks were the strongest equity market performers, outperforming small- and mid-cap stocks by a solid margin.
Contributors and Detractors
Stock selection in the healthcare, industrials and consumer staples sectors aided the Fund's performance in a year that was favorable for the equity markets all around. Within healthcare, shares of Ireland-based medical device and supplies company Covidien rose significantly after being purchased by Medtronic. Vertex Pharmaceuticals' steep gain was fueled by positive Phase 3 test results for the company's new cystic fibrosis regimen that, if approved by the U.S. Food and Drug Administration, could represent a multibillion dollar opportunity for the company. In the industrials sector, the declining cost of oil had a significant positive impact on airlines in that it lowered operating costs and also put more dollars in consumer wallets for consumer spending. Both factors gave a boost to the Fund's position in Delta Airlines. In the consumer staples sector, CVS and Kroger were strong performers. CVS
Portfolio Management
Peter Santoro, CFA
Melda Mergen, CFA, CAIA*
*Effective October 31, 2014, Melda Mergen was added as a Portfolio Manager to the Fund.
Morningstar Style BoxTM

The Morningstar Style BoxTM is based on a fund's portfolio holdings. For equity funds, the vertical axis shows the market capitalization of the stocks owned, and the horizontal axis shows investment style (value, blend, or growth). Information shown is based on the most recent data provided by Morningstar.
© 2015 Morningstar, Inc. All rights reserved. The Morningstar information contained herein: (1) is proprietary to Morningstar and/or its content providers; (2) may not be copied or distributed; and (3) is not warranted to be accurate, complete or timely. Neither Morningstar nor its content providers are responsible for any damages or losses arising from any use of this information.
Top Ten Holdings (%)
(at February 28, 2015) | |
Apple, Inc. | | | 4.2 | | |
Medtronic PLC | | | 3.0 | | |
Microsoft Corp. | | | 2.9 | | |
JPMorgan Chase & Co. | | | 2.8 | | |
CVS Health Corp. | | | 2.7 | | |
Citigroup, Inc. | | | 2.7 | | |
Wells Fargo & Co. | | | 2.6 | | |
Berkshire Hathway, Inc., Class B | | | 2.6 | | |
Honeywell International, Inc. | | | 2.5 | | |
Comcast Corp., Class A | | | 2.3 | | |
Percentages indicated are based upon total investments (excluding Money Market Funds).
For further detail about these holdings, please refer to the section entitled "Portfolio of Investments."
Fund holdings are as of the date given, are subject to change at any time, and are not recommendations to buy or sell any security.
Annual Report 2015
5
COLUMBIA SELECT LARGE CAP EQUITY FUND
MANAGER DISCUSSION OF FUND PERFORMANCE (continued)
Portfolio Breakdown (%)
(at February 28, 2015) | |
Common Stocks | | | 96.5 | | |
Consumer Discretionary | | | 13.0 | | |
Consumer Staples | | | 10.3 | | |
Energy | | | 7.6 | | |
Financials | | | 16.1 | | |
Health Care | | | 13.9 | | |
Industrials | | | 10.5 | | |
Information Technology | | | 19.8 | | |
Materials | | | 2.4 | | |
Telecommunication Services | | | 1.0 | | |
Utilities | | | 1.9 | | |
Convertible Preferred Stocks | | | 0.8 | | |
Consumer Staples | | | 0.8 | | |
Money Market Funds | | | 2.7 | | |
Total | | | 100.0 | | |
Percentages indicated are based upon total investments. The Fund's portfolio composition is subject to change.
Investment Risks
Market risk may affect a single issuer, sector of the economy, industry or the market as a whole. Growth securities, at times, may not perform as well as value securities or the stock market in general and may be out of favor with investors. Value securities may be unprofitable if the market fails to recognize their intrinsic worth or the portfolio manager misgauged that worth. Foreign investments subject the Fund to risks, including political, economic, market, social and others within a particular country, as well as to currency instabilities and less stringent financial and accounting standards generally applicable to U.S. issuers. Investments in a limited number of companies or sectors, subject the Fund to greater risk of loss. The Fund may invest significantly in issuers within a particular sector, which may be negatively affected by market, economic or other conditions, making the fund more vulnerable to unfavorable developments in the sector. Investing in derivatives is a specialized activity that involves special risks, which may result in significant losses. See the Fund's prospectus for more information on these and other risks.
has been the beneficiary of two major healthcare trends: the move to generic drugs and the implementation of the Affordable Care Act. The company's vertical integration through Caremark pharmacy benefit manager and its partnership with Cardinal Health has helped it capture a portion of the consumer's healthcare dollar at several different levels, and its margins have been improving throughout the year. Kroger has taken advantage of the consumer trend towards more organic products. Both domestic companies, CVS and Kroger benefited from a stronger U.S. dollar and a better-heeled consumer.
In the materials sector, Freeport McMoRan was hurt by a sharp decline in copper prices. We held on to Freeport because we think the longer-term outlook for copper is favorable. Within financials, the Fund's interest rate sensitivity worked against it. We expected interest rates to rise in 2014 and instead they generally declined. As a result, the Fund's underweight in financials that were sensitive to low interest rates, such as real estate investment trusts, and an overweight in banks that would benefit from rising rates, including J.P Morgan and Bank of Montreal, which also had heavy exposure to energy lending in Canada, detracted from results. A position in Viacom in the consumer discretionary sector was another negative for returns. Larger-than-expected ratings declines in their programming cost Viacom leverage with content distributers.
Looking Ahead
After another strong year in 2014, we are currently looking for opportunities among companies that we believe have the potential to do well in a relatively low growth environment. We are particularly attracted to companies that demonstrate some form of innovation. We also look for companies whose managements have demonstrated their concern for shareholders by re-structuring and streamlining operations and are committed to returning capital in the form of increasing dividend payouts and share buybacks.
Annual Report 2015
6
COLUMBIA SELECT LARGE CAP EQUITY FUND
UNDERSTANDING YOUR FUND'S EXPENSES
(Unaudited)
As an investor, you incur two types of costs. There are transaction costs, which generally include sales charges on purchases and may include redemption fees. There are also ongoing costs, which generally include management fees, distribution and/or service fees, and other fund expenses. The following information is intended to help you understand your ongoing costs (in dollars) of investing in the Fund and to help you compare these costs with the ongoing costs of investing in other mutual funds.
Analyzing Your Fund's Expenses
To illustrate these ongoing costs, we have provided examples and calculated the expenses paid by investors in each share class of the Fund during the period. The actual and hypothetical information in the table is based on an initial investment of $1,000 at the beginning of the period indicated and held for the entire period. Expense information is calculated two ways and each method provides you with different information. The amount listed in the "Actual" column is calculated using the Fund's actual operating expenses and total return for the period. You may use the Actual information, together with the amount invested, to estimate the expenses that you paid over the period. Simply divide your account value by $1,000 (for example, an $8,600 account value divided by $1,000 = 8.6), then multiply the results by the expenses paid during the period under the "Actual" column. The amount listed in the "Hypothetical" column assumes a 5% annual rate of return before expenses (which is not the Fund's actual return) and then applies the Fund's actual expense ratio for the period to the hypothetical return. You should not use the hypothetical account values and expenses to estimate either your actual account balance at the end of the period or the expenses you paid during the period. See "Compare With Other Funds" below for details on how to use the hypothetical data.
Compare With Other Funds
Since all mutual funds are required to include the same hypothetical calculations about expenses in shareholder reports, you can use this information to compare the ongoing cost of investing in the Fund with other funds. To do so, compare the hypothetical example with the 5% hypothetical examples that appear in the shareholder reports of other funds. As you compare hypothetical examples of other funds, it is important to note that hypothetical examples are meant to highlight the ongoing costs of investing in a fund only and do not reflect any transaction costs, such as sales charges, or redemption or exchange fees. Therefore, the hypothetical calculations are useful in comparing ongoing costs only, and will not help you determine the relative total costs of owning different funds. If transaction costs were included in these calculations, your costs would be higher.
September 1, 2014 – February 28, 2015
| | | Account Value at the Beginning
of the Period ($) | | Account Value at the End of the
Period ($) | | Expenses Paid During the
Period ($) | | Fund's Annualized
Expense Ratio (%) | |
| | | Actual | | Hypothetical | | Actual | | Hypothetical | | Actual | | Hypothetical | | Actual | |
Class A | | | 1,000.00 | | | | 1,000.00 | | | | 1,066.60 | | | | 1,019.05 | | | | 6.08 | | | | 5.94 | | | | 1.18 | | |
Class B | | | 1,000.00 | | | | 1,000.00 | | | | 1,062.30 | | | | 1,015.31 | | | | 9.92 | | | | 9.70 | | | | 1.93 | | |
Class C | | | 1,000.00 | | | | 1,000.00 | | | | 1,062.30 | | | | 1,015.31 | | | | 9.92 | | | | 9.70 | | | | 1.93 | | |
Class I | | | 1,000.00 | | | | 1,000.00 | | | | 1,068.70 | | | | 1,020.94 | | | | 4.13 | | | | 4.03 | | | | 0.80 | | |
Class R5 | | | 1,000.00 | | | | 1,000.00 | | | | 1,068.50 | | | | 1,020.69 | | | | 4.38 | | | | 4.28 | | | | 0.85 | | |
Class W | | | 1,000.00 | | | | 1,000.00 | | | | 1,066.80 | | | | 1,019.10 | | | | 6.03 | | | | 5.89 | | | | 1.17 | | |
Class Z | | | 1,000.00 | | | | 1,000.00 | | | | 1,068.40 | | | | 1,020.29 | | | | 4.80 | | | | 4.68 | | | | 0.93 | | |
Expenses paid during the period are equal to the annualized expense ratio for each class as indicated above, multiplied by the average account value over the period and then multiplied by the number of days in the Fund's most recent fiscal half year and divided by 365.
Expenses do not include fees and expenses incurred indirectly by the Fund from its investment in underlying funds, including affiliated and non-affiliated pooled investment vehicles, such as mutual funds and exchange-traded funds.
Had Columbia Management Investment Advisers, LLC and/or certain of its affiliates not waived/reimbursed certain fees and expenses, account value at the end of the period would have been reduced.
Annual Report 2015
7
COLUMBIA SELECT LARGE CAP EQUITY FUND
PORTFOLIO OF INVESTMENTS
February 28, 2015
(Percentages represent value of investments compared to net assets)
Common Stocks 96.2%
Issuer | | Shares | | Value ($) | |
CONSUMER DISCRETIONARY 13.0% | |
Auto Components 1.5% | |
Delphi Automotive PLC | | | 89,540 | | | | 7,059,334 | | |
Media 6.8% | |
Cinemark Holdings, Inc. | | | 130,790 | | | | 5,325,769 | | |
Comcast Corp., Class A | | | 186,510 | | | | 11,074,964 | | |
DISH Network Corp., Class A(a) | | | 69,443 | | | | 5,211,003 | | |
Time Warner, Inc. | | | 82,190 | | | | 6,728,073 | | |
Viacom, Inc., Class B | | | 69,898 | | | | 4,888,666 | | |
Total | | | | | 33,228,475 | | |
Specialty Retail 3.5% | |
Home Depot, Inc. (The) | | | 95,830 | | | | 10,996,492 | | |
TJX Companies, Inc. (The) | | | 87,600 | | | | 6,012,864 | | |
Total | | | | | 17,009,356 | | |
Textiles, Apparel & Luxury Goods 1.2% | |
Hanesbrands, Inc. | | | 47,220 | | | | 6,022,439 | | |
Total Consumer Discretionary | | | | | 63,319,604 | | |
CONSUMER STAPLES 10.2% | |
Beverages 1.3% | |
Coca-Cola Enterprises, Inc. | | | 139,840 | | | | 6,460,608 | | |
Food & Staples Retailing 6.5% | |
CVS Health Corp. | | | 122,500 | | | | 12,724,075 | | |
Kroger Co. (The) | | | 125,850 | | | | 8,954,227 | | |
Wal-Mart Stores, Inc. | | | 117,120 | | | | 9,829,882 | | |
Total | | | | | 31,508,184 | | |
Food Products 0.7% | |
Tyson Foods, Inc., Class A | | | 81,100 | | | | 3,350,241 | | |
Tobacco 1.7% | |
Philip Morris International, Inc. | | | 102,900 | | | | 8,536,584 | | |
Total Consumer Staples | | | | | 49,855,617 | | |
ENERGY 7.6% | |
Energy Equipment & Services 1.5% | |
Schlumberger Ltd. | | | 86,240 | | | | 7,257,958 | | |
Oil, Gas & Consumable Fuels 6.1% | |
Anadarko Petroleum Corp. | | | 56,100 | | | | 4,725,303 | | |
| BP PLC, ADR | | | 118,460 | | | | 4,908,982 | | |
Kinder Morgan, Inc. | | | 137,660 | | | | 5,645,437 | | |
Occidental Petroleum Corp. | | | 104,190 | | | | 8,114,317 | | |
Common Stocks (continued)
Issuer | | Shares | | Value ($) | |
Williams Companies, Inc. (The) | | | 127,790 | | | | 6,266,822 | | |
Total | | | | | 29,660,861 | | |
Total Energy | | | | | 36,918,819 | | |
FINANCIALS 16.1% | |
Banks 7.8% | |
Citigroup, Inc. | | | 242,220 | | | | 12,697,172 | | |
JPMorgan Chase & Co. | | | 214,411 | | | | 13,139,106 | | |
Wells Fargo & Co. | | | 223,500 | | | | 12,245,565 | | |
Total | | | | | 38,081,843 | | |
Capital Markets 4.5% | |
BlackRock, Inc. | | | 20,810 | | | | 7,729,250 | | |
Goldman Sachs Group, Inc. (The) | | | 44,860 | | | | 8,513,980 | | |
T. Rowe Price Group, Inc. | | | 66,590 | | | | 5,500,334 | | |
Total | | | | | 21,743,564 | | |
Diversified Financial Services 2.5% | |
Berkshire Hathaway, Inc., Class B(a) | | | 82,960 | | | | 12,229,134 | | |
Real Estate Investment Trusts (REITs) 1.3% | |
Simon Property Group, Inc. | | | 33,340 | | | | 6,346,602 | | |
Total Financials | | | | | 78,401,143 | | |
HEALTH CARE 13.8% | |
Biotechnology 6.0% | |
BioMarin Pharmaceutical, Inc.(a) | | | 40,760 | | | | 4,364,173 | | |
Bluebird Bio, Inc.(a) | | | 10,730 | | | | 1,022,784 | | |
Celgene Corp.(a) | | | 47,880 | | | | 5,818,857 | | |
Gilead Sciences, Inc.(a) | | | 73,270 | | | | 7,585,643 | | |
Incyte Corp.(a) | | | 28,220 | | | | 2,422,687 | | |
Receptos, Inc.(a) | | | 20,830 | | | | 2,637,911 | | |
Vertex Pharmaceuticals, Inc.(a) | | | 46,612 | | | | 5,566,871 | | |
Total | | | | | 29,418,926 | | |
Health Care Equipment & Supplies 2.9% | |
Medtronic PLC | | | 181,407 | | | | 14,075,369 | | |
Health Care Providers & Services 4.9% | |
Aetna, Inc. | | | 87,590 | | | | 8,719,584 | | |
Laboratory Corp. of America Holdings(a) | | | 50,460 | | | | 6,208,094 | | |
McKesson Corp. | | | 39,280 | | | | 8,983,336 | | |
Total | | | | | 23,911,014 | | |
Total Health Care | | | | | 67,405,309 | | |
The accompanying Notes to Financial Statements are an integral part of this statement.
Annual Report 2015
8
COLUMBIA SELECT LARGE CAP EQUITY FUND
PORTFOLIO OF INVESTMENTS (continued)
February 28, 2015
Common Stocks (continued)
Issuer | | Shares | | Value ($) | |
INDUSTRIALS 10.5% | |
Aerospace & Defense 7.4% | |
Honeywell International, Inc. | | | 114,322 | | | | 11,750,015 | | |
Lockheed Martin Corp. | | | 39,410 | | | | 7,883,971 | | |
Northrop Grumman Corp. | | | 39,320 | | | | 6,515,717 | | |
United Technologies Corp. | | | 80,190 | | | | 9,775,963 | | |
Total | | | | | 35,925,666 | | |
Machinery 0.5% | |
Ingersoll-Rand PLC | | | 35,530 | | | | 2,387,261 | | |
Professional Services 1.3% | |
Dun & Bradstreet Corp. (The) | | | 47,610 | | | | 6,307,373 | | |
Road & Rail 1.3% | |
CSX Corp. | | | 186,970 | | | | 6,414,940 | | |
Total Industrials | | | | | 51,035,240 | | |
INFORMATION TECHNOLOGY 19.7% | |
Internet Software & Services 4.6% | |
Baidu, Inc., ADR(a) | | | 10,790 | | | | 2,198,463 | | |
eBay, Inc.(a) | | | 113,830 | | | | 6,591,895 | | |
Google, Inc., Class A(a) | | | 9,164 | | | | 5,155,941 | | |
Google, Inc., Class C(a) | | | 15,294 | | | | 8,540,170 | | |
Total | | | | | 22,486,469 | | |
IT Services 1.9% | |
MasterCard, Inc., Class A | | | 100,970 | | | | 9,100,426 | | |
Semiconductors & Semiconductor Equipment 1.2% | |
Broadcom Corp., Class A | | | 124,010 | | | | 5,608,972 | | |
Software 6.7% | |
Electronic Arts, Inc.(a) | | | 150,410 | | | | 8,600,444 | | |
Microsoft Corp. | | | 314,940 | | | | 13,810,119 | | |
salesforce.com, Inc.(a) | | | 76,670 | | | | 5,319,365 | | |
VMware, Inc., Class A(a) | | | 58,420 | | | | 4,969,789 | | |
Total | | | | | 32,699,717 | | |
Technology Hardware, Storage & Peripherals 5.3% | |
Apple, Inc. | | | 153,720 | | | | 19,746,871 | | |
EMC Corp. | | | 218,284 | | | | 6,317,139 | | |
Total | | | | | 26,064,010 | | |
Total Information Technology | | | | | 95,959,594 | | |
Common Stocks (continued)
Issuer | | Shares | | Value ($) | |
MATERIALS 2.4% | |
Chemicals 1.2% | |
Eastman Chemical Co. | | | 79,820 | | | | 5,943,397 | | |
Metals & Mining 1.2% | |
Freeport-McMoRan, Inc. | | | 260,520 | | | | 5,635,048 | | |
Total Materials | | | | | 11,578,445 | | |
TELECOMMUNICATION SERVICES 1.0% | |
Diversified Telecommunication Services 1.0% | |
Verizon Communications, Inc. | | | 100,660 | | | | 4,977,637 | | |
Total Telecommunication Services | | | | | 4,977,637 | | |
UTILITIES 1.9% | |
Multi-Utilities 1.9% | |
PG&E Corp. | | | 174,580 | | | | 9,380,184 | | |
Total Utilities | | | | | 9,380,184 | | |
Total Common Stocks
(Cost: $394,790,345) | | | | | 468,831,592 | | |
Convertible Preferred Stocks 0.8%
CONSUMER STAPLES 0.8% | |
Food Products 0.8% | |
Tyson Foods, Inc., 4.750% | | | 71,180 | | | | 3,619,503 | | |
Total Consumer Staples | | | | | 3,619,503 | | |
Total Convertible Preferred Stocks
(Cost: $3,766,988) | | | | | 3,619,503 | | |
Money Market Funds 2.7%
| | | Shares | | Value ($) | |
Columbia Short-Term Cash Fund,
0.118%(b)(c) | | | 13,232,791 | | | | 13,232,791 | | |
Total Money Market Funds
(Cost: $13,232,791) | | | | | 13,232,791 | | |
Total Investments
(Cost: $411,790,124) | | | | | 485,683,886 | | |
Other Assets & Liabilities, Net | | | | | 1,470,074 | | |
Net Assets | | | | | 487,153,960 | | |
The accompanying Notes to Financial Statements are an integral part of this statement.
Annual Report 2015
9
COLUMBIA SELECT LARGE CAP EQUITY FUND
PORTFOLIO OF INVESTMENTS (continued)
February 28, 2015
Notes to Portfolio of Investments
(a) Non-income producing.
(b) The rate shown is the seven-day current annualized yield at February 28, 2015.
(c) As defined in the Investment Company Act of 1940, an affiliated company is one in which the Fund owns 5% or more of the company's outstanding voting securities, or a company which is under common ownership or control with the Fund. Holdings and transactions in these affiliated companies during the year ended February 28, 2015, are as follows:
Issuer | | Beginning
Cost ($) | | Purchase
Cost ($) | | Proceeds
From Sales ($) | | Ending
Cost ($) | | Dividends —
Affiliated
Issuers ($) | | Value ($) | |
Columbia Short-Term Cash Fund | | | 12,685,848 | | | | 175,095,725 | | | | (174,548,782 | ) | | | 13,232,791 | | | | 11,466 | | | | 13,232,791 | | |
Abbreviation Legend
ADR American Depositary Receipt
Fair Value Measurements
Generally accepted accounting principles (GAAP) require disclosure regarding the inputs and valuation techniques used to measure fair value and any changes in valuation inputs or techniques. In addition, investments shall be disclosed by major category.
The Fund categorizes its fair value measurements according to a three-level hierarchy that maximizes the use of observable inputs and minimizes the use of unobservable inputs by prioritizing that the most observable input be used when available. Observable inputs are those that market participants would use in pricing an investment based on market data obtained from sources independent of the reporting entity. Unobservable inputs are those that reflect the Fund's assumptions about the information market participants would use in pricing an investment. An investment's level within the fair value hierarchy is based on the lowest level of any input that is deemed significant to the asset or liability's fair value measurement. The input levels are not necessarily an indication of the risk or liquidity associated with investments at that level. For example, certain U.S. government securities are generally high quality and liquid, however, they are reflected as Level 2 because the inputs used to determine fair value may not always be quoted prices in an active market.
Fair value inputs are summarized in the three broad levels listed below:
> Level 1 — Valuations based on quoted prices for investments in active markets that the Fund has the ability to access at the measurement date (including NAV for open-end mutual funds). Valuation adjustments are not applied to Level 1 investments.
> Level 2 — Valuations based on other significant observable inputs (including quoted prices for similar securities, interest rates, prepayment speeds, credit risks, etc.).
> Level 3 — Valuations based on significant unobservable inputs (including the Fund's own assumptions and judgment in determining the fair value of investments).
Inputs that are used in determining fair value of an investment may include price information, credit data, volatility statistics, and other factors. These inputs can be either observable or unobservable. The availability of observable inputs can vary between investments, and is affected by various factors such as the type of investment, and the volume and level of activity for that investment or similar investments in the marketplace. The inputs will be considered by the Investment Manager, along with any other relevant factors in the calculation of an investment's fair value. The Fund uses prices and inputs that are current as of the measurement date, which may include periods of market dislocations. During these periods, the availability of prices and inputs may be reduced for many investments. This condition could cause an investment to be reclassified between the various levels within the hierarchy.
Investments falling into the Level 3 category are primarily supported by quoted prices from brokers and dealers participating in the market for those investments. However, these may be classified as Level 3 investments due to lack of market transparency and corroboration to support these quoted prices. Additionally, valuation models may be used as the pricing source for any remaining investments classified as Level 3. These models may rely on one or more significant unobservable inputs and/or significant assumptions by the Investment Manager. Inputs used in valuations may include, but are not limited to, financial statement analysis, capital account balances, discount rates and estimated cash flows, and comparable company data.
Under the direction of the Fund's Board of Trustees (the Board), the Investment Manager's Valuation Committee (the Committee) is responsible for overseeing the valuation procedures approved by the Board. The Committee consists of voting and non-voting members from various groups within the Investment Manager's organization, including operations and accounting, trading and investments, compliance, risk management and legal.
The accompanying Notes to Financial Statements are an integral part of this statement.
Annual Report 2015
10
COLUMBIA SELECT LARGE CAP EQUITY FUND
PORTFOLIO OF INVESTMENTS (continued)
February 28, 2015
Fair Value Measurements (continued)
The Committee meets at least monthly to review and approve valuation matters, which may include a description of specific valuation determinations, data regarding pricing information received from approved pricing vendors and brokers and the results of Board-approved valuation control policies and procedures (the Policies). The Policies address, among other things, instances when market quotations are or are not readily available, including recommendations of third party pricing vendors and a determination of appropriate pricing methodologies; events that require specific valuation determinations and assessment of fair value techniques; securities with a potential for stale pricing, including those that are illiquid, restricted, or in default; and the effectiveness of third party pricing vendors, including periodic reviews of vendors. The Committee meets more frequently, as needed, to discuss additional valuation matters, which may include the need to review back-testing results, review time-sensitive information or approve related valuation actions. The Committee reports to the Board, with members of the Committee meeting with the Board at each of its regularly scheduled meetings to discuss valuation matters and actions during the period, similar to those described earlier.
For investments categorized as Level 3, the Committee monitors information similar to that described above, which may include: (i) data specific to the issuer or comparable issuers, (ii) general market or specific sector news and (iii) quoted prices and specific or similar security transactions. The Committee considers this data and any changes from prior periods in order to assess the reasonableness of observable and unobservable inputs, any assumptions or internal models used to value those securities and changes in fair value. This data is also used to corroborate, when available, information received from approved pricing vendors and brokers. Various factors impact the frequency of monitoring this information (which may occur as often as daily). However, the Committee may determine that changes to inputs, assumptions and models are not required as a result of the monitoring procedures performed.
The following table is a summary of the inputs used to value the Fund's investments at February 28, 2015:
Description | | Level 1
Quoted Prices in Active
Markets for Identical
Assets ($) | | Level 2
Other Significant
Observable Inputs ($) | | Level 3
Significant
Unobservable Inputs ($) | | Total ($) | |
Equity Securities | |
Common Stocks | |
Consumer Discretionary | | | 63,319,604 | | | | — | | | | — | | | | 63,319,604 | | |
Consumer Staples | | | 49,855,617 | | | | — | | | | — | | | | 49,855,617 | | |
Energy | | | 36,918,819 | | | | — | | | | — | | | | 36,918,819 | | |
Financials | | | 78,401,143 | | | | — | | | | — | | | | 78,401,143 | | |
Health Care | | | 67,405,309 | | | | — | | | | — | | | | 67,405,309 | | |
Industrials | | | 51,035,240 | | | | — | | | | — | | | | 51,035,240 | | |
Information Technology | | | 95,959,594 | | | | — | | | | — | | | | 95,959,594 | | |
Materials | | | 11,578,445 | | | | — | | | | — | | | | 11,578,445 | | |
Telecommunication Services | | | 4,977,637 | | | | — | | | | — | | | | 4,977,637 | | |
Utilities | | | 9,380,184 | | | | — | | | | — | | | | 9,380,184 | | |
Convertible Preferred Stocks | |
Consumer Staples | | | 3,619,503 | | | | — | | | | — | | | | 3,619,503 | | |
Total Equity Securities | | | 472,451,095 | | | | — | | | | — | | | | 472,451,095 | | |
Mutual Funds | |
Money Market Funds | | | 13,232,791 | | | | — | | | | — | | | | 13,232,791 | | |
Total Mutual Funds | | | 13,232,791 | | | | — | | | | — | | | | 13,232,791 | | |
Total | | | 485,683,886 | | | | — | | | | — | | | | 485,683,886 | | |
See the Portfolio of Investments for all investment classifications not indicated in the table.
There were no transfers of financial assets between levels during the period.
The accompanying Notes to Financial Statements are an integral part of this statement.
Annual Report 2015
11
COLUMBIA SELECT LARGE CAP EQUITY FUND
STATEMENT OF ASSETS AND LIABILITIES
February 28, 2015
Assets | |
Investments, at value | |
Unaffiliated issuers (identified cost $398,557,333) | | $ | 472,451,095 | | |
Affiliated issuers (identified cost $13,232,791) | | | 13,232,791 | | |
Total investments (identified cost $411,790,124) | | | 485,683,886 | | |
Receivable for: | |
Investments sold | | | 15,470,774 | | |
Capital shares sold | | | 3,405 | | |
Dividends | | | 617,891 | | |
Expense reimbursement due from Investment Manager | | | 759 | | |
Prepaid expenses | | | 1,921 | | |
Trustees' deferred compensation plan | | | 11,190 | | |
Total assets | | | 501,789,826 | | |
Liabilities | |
Payable for: | |
Investments purchased | | | 14,175,818 | | |
Capital shares purchased | | | 200,016 | | |
Investment management fees | | | 9,528 | | |
Distribution and/or service fees | | | 1,129 | | |
Transfer agent fees | | | 56,589 | | |
Administration fees | | | 805 | | |
Compensation of board members | | | 138,437 | | |
Other expenses | | | 42,354 | | |
Trustees' deferred compensation plan | | | 11,190 | | |
Total liabilities | | | 14,635,866 | | |
Net assets applicable to outstanding capital stock | | $ | 487,153,960 | | |
Represented by | |
Paid-in capital | | $ | 365,277,277 | | |
Undistributed net investment income | | | 5,364,902 | | |
Accumulated net realized gain | | | 42,618,019 | | |
Unrealized appreciation (depreciation) on: | |
Investments | | | 73,893,762 | | |
Total — representing net assets applicable to outstanding capital stock | | $ | 487,153,960 | | |
The accompanying Notes to Financial Statements are an integral part of this statement.
Annual Report 2015
12
COLUMBIA SELECT LARGE CAP EQUITY FUND
STATEMENT OF ASSETS AND LIABILITIES (continued)
February 28, 2015
Class A | |
Net assets | | $ | 139,310,817 | | |
Shares outstanding | | | 10,831,876 | | |
Net asset value per share | | $ | 12.86 | | |
Maximum offering price per share(a) | | $ | 13.64 | | |
Class B | |
Net assets | | $ | 394,809 | | |
Shares outstanding | | | 32,754 | | |
Net asset value per share | | $ | 12.05 | | |
Class C | |
Net assets | | $ | 5,771,738 | | |
Shares outstanding | | | 479,205 | | |
Net asset value per share | | $ | 12.04 | | |
Class I | |
Net assets | | $ | 131,621,813 | | |
Shares outstanding | | | 10,292,473 | | |
Net asset value per share | | $ | 12.79 | | |
Class R5 | |
Net assets | | $ | 143,007 | | |
Shares outstanding | | | 10,945 | | |
Net asset value per share | | $ | 13.07 | | |
Class W | |
Net assets | | $ | 2,432 | | |
Shares outstanding | | | 189 | | |
Net asset value per share(b) | | $ | 12.86 | | |
Class Z | |
Net assets | | $ | 209,909,344 | | |
Shares outstanding | | | 16,424,049 | | |
Net asset value per share | | $ | 12.78 | | |
(a) The maximum offering price per share is calculated by dividing the net asset value per share by 1.0 minus the maximum sales charge of 5.75%.
(b) Net asset value per share rounds to this amount due to fractional shares outstanding.
The accompanying Notes to Financial Statements are an integral part of this statement.
Annual Report 2015
13
COLUMBIA SELECT LARGE CAP EQUITY FUND
STATEMENT OF OPERATIONS
Year Ended February 28, 2015
Net investment income | |
Income: | |
Dividends — unaffiliated issuers | | $ | 14,747,915 | | |
Dividends — affiliated issuers | | | 11,466 | | |
Interest | | | 5 | | |
Foreign taxes withheld | | | (57,216 | ) | |
Total income | | | 14,702,170 | | |
Expenses: | |
Investment management fees | | | 3,624,989 | | |
Distribution and/or service fees | |
Class A | | | 332,638 | | |
Class B | | | 4,190 | | |
Class C | | | 48,958 | | |
Class W | | | 6 | | |
Transfer agent fees | |
Class A | | | 252,655 | | |
Class B | | | 794 | | |
Class C | | | 9,324 | | |
Class R5 | | | 56 | | |
Class W | | | 4 | | |
Class Z | | | 432,769 | | |
Administration fees | | | 306,109 | | |
Compensation of board members | | | 27,172 | | |
Custodian fees | | | 10,736 | | |
Printing and postage fees | | | 42,511 | | |
Registration fees | | | 81,208 | | |
Professional fees | | | 35,702 | | |
Other | | | 20,012 | | |
Total expenses | | | 5,229,833 | | |
Fees waived or expenses reimbursed by Investment Manager and its affiliates | | | (279,840 | ) | |
Expense reductions | | | (3,291 | ) | |
Total net expenses | | | 4,946,702 | | |
Net investment income | | | 9,755,468 | | |
Realized and unrealized gain (loss) — net | |
Net realized gain (loss) on: | |
Investments | | | 83,744,977 | | |
Foreign currency translations | | | (112 | ) | |
Net realized gain | | | 83,744,865 | | |
Net change in unrealized appreciation (depreciation) on: | |
Investments | | | (25,199,381 | ) | |
Foreign currency translations | | | 511 | | |
Net change in unrealized depreciation | | | (25,198,870 | ) | |
Net realized and unrealized gain | | | 58,545,995 | | |
Net increase in net assets resulting from operations | | $ | 68,301,463 | | |
The accompanying Notes to Financial Statements are an integral part of this statement.
Annual Report 2015
14
COLUMBIA SELECT LARGE CAP EQUITY FUND
STATEMENT OF CHANGES IN NET ASSETS
| | | Year Ended
February 28,
2015 | | Year Ended
February 28,
2014 | |
Operations | |
Net investment income | | $ | 9,755,468 | | | $ | 5,648,307 | | |
Net realized gain | | | 83,744,865 | | | | 133,830,710 | | |
Net change in unrealized depreciation | | | (25,198,870 | ) | | | (12,248,606 | ) | |
Net increase in net assets resulting from operations | | | 68,301,463 | | | | 127,230,411 | | |
Distributions to shareholders | |
Net investment income | |
Class A | | | (1,007,247 | ) | | | (1,096,374 | ) | |
Class B | | | (319 | ) | | | (617 | ) | |
Class C | | | (4,534 | ) | | | (4,346 | ) | |
Class I | | | (1,503,373 | ) | | | (1,717,106 | ) | |
Class R5 | | | (2,007 | ) | | | (32 | ) | |
Class W | | | (19 | ) | | | (28 | ) | |
Class Z | | | (2,231,957 | ) | | | (3,203,717 | ) | |
Net realized gains | |
Class A | | | (18,823,467 | ) | | | (41,518,042 | ) | |
Class B | | | (61,089 | ) | | | (193,521 | ) | |
Class C | | | (763,718 | ) | | | (1,306,620 | ) | |
Class I | | | (19,951,363 | ) | | | (44,307,566 | ) | |
Class R5 | | | (20,851 | ) | | | (885 | ) | |
Class W | | | (359 | ) | | | (1,084 | ) | |
Class Z | | | (32,532,189 | ) | | | (97,795,940 | ) | |
Total distributions to shareholders | | | (76,902,492 | ) | | | (191,145,878 | ) | |
Decrease in net assets from capital stock activity | | | (53,221,887 | ) | | | (13,254,355 | ) | |
Total decrease in net assets | | | (61,822,916 | ) | | | (77,169,822 | ) | |
Net assets at beginning of year | | | 548,976,876 | | | | 626,146,698 | | |
Net assets at end of year | | $ | 487,153,960 | | | $ | 548,976,876 | | |
Undistributed net investment income | | $ | 5,364,902 | | | $ | 359,002 | | |
The accompanying Notes to Financial Statements are an integral part of this statement.
Annual Report 2015
15
COLUMBIA SELECT LARGE CAP EQUITY FUND
STATEMENT OF CHANGES IN NET ASSETS (continued)
| | | Year Ended February 28, 2015 | | Year Ended February 28, 2014 | |
| | | Shares | | Dollars ($) | | Shares | | Dollars ($) | |
Capital stock activity | |
Class A shares | |
Subscriptions(a) | | | 1,552,952 | | | | 19,641,450 | | | | 2,641,852 | | | | 35,080,662 | | |
Distributions reinvested | | | 382,635 | | | | 4,838,784 | | | | 789,155 | | | | 10,346,973 | | |
Redemptions | | | (1,288,515 | ) | | | (16,664,333 | ) | | | (1,162,248 | ) | | | (16,964,059 | ) | |
Net increase | | | 647,072 | | | | 7,815,901 | | | | 2,268,759 | | | | 28,463,576 | | |
Class B shares | |
Subscriptions | | | 5,143 | | | | 61,605 | | | | 12,360 | | | | 170,462 | | |
Distributions reinvested | | | 3,352 | | | | 39,857 | | | | 8,724 | | | | 108,867 | | |
Redemptions(a) | | | (11,828 | ) | | | (144,290 | ) | | | (32,835 | ) | | | (465,763 | ) | |
Net decrease | | | (3,333 | ) | | | (42,828 | ) | | | (11,751 | ) | | | (186,434 | ) | |
Class C shares | |
Subscriptions | | | 118,976 | | | | 1,449,094 | | | | 118,276 | | | | 1,566,061 | | |
Distributions reinvested | | | 47,306 | | | | 561,416 | | | | 79,271 | | | | 989,016 | | |
Redemptions | | | (29,610 | ) | | | (356,496 | ) | | | (89,884 | ) | | | (1,223,360 | ) | |
Net increase | | | 136,672 | | | | 1,654,014 | | | | 107,663 | | | | 1,331,717 | | |
Class I shares | |
Subscriptions | | | 11,943 | | | | 151,296 | | | | 986,643 | | | | 12,618,062 | | |
Distributions reinvested | | | 1,704,373 | | | | 21,454,332 | | | | 3,529,386 | | | | 46,023,546 | | |
Redemptions | | | (3,360,476 | ) | | | (43,470,520 | ) | | | (1,041,665 | ) | | | (15,429,517 | ) | |
Net increase (decrease) | | | (1,644,160 | ) | | | (21,864,892 | ) | | | 3,474,364 | | | | 43,212,091 | | |
Class R5 shares | |
Subscriptions | | | 9,787 | | | | 133,111 | | | | 4,788 | | | | 61,931 | | |
Distributions reinvested | | | 1,760 | | | | 22,474 | | | | — | | | | — | | |
Redemptions | | | (5,563 | ) | | | (72,865 | ) | | | — | | | | — | | |
Net increase | | | 5,984 | | | | 82,720 | | | | 4,788 | | | | 61,931 | | |
Class W shares | |
Redemptions | | | (23 | ) | | | (300 | ) | | | — | | | | — | | |
Net increase (decrease) | | | (23 | ) | | | (300 | ) | | | — | | | | — | | |
Class Z shares | |
Subscriptions | | | 736,523 | | | | 9,333,855 | | | | 1,649,848 | | | | 22,220,429 | | |
Distributions reinvested | | | 1,180,060 | | | | 14,824,535 | | | | 2,497,113 | | | | 32,577,029 | | |
Redemptions | | | (5,070,986 | ) | | | (65,024,892 | ) | | | (9,215,154 | ) | | | (140,934,694 | ) | |
Net decrease | | | (3,154,403 | ) | | | (40,866,502 | ) | | | (5,068,193 | ) | | | (86,137,236 | ) | |
Total net increase (decrease) | | | (4,012,191 | ) | | | (53,221,887 | ) | | | 775,630 | | | | (13,254,355 | ) | |
(a) Includes conversions of Class B shares to Class A shares, if any.
The accompanying Notes to Financial Statements are an integral part of this statement.
Annual Report 2015
16
COLUMBIA SELECT LARGE CAP EQUITY FUND
The following tables are intended to help you understand the Fund's financial performance. Certain information reflects financial results for a single share of a class held for the periods shown. Per share net investment income (loss) amounts are calculated based on average shares outstanding during the period. Total return assumes reinvestment of all dividends and distributions, if any. Total return does not reflect payment of sales charges, if any. Total return and portfolio turnover are not annualized for periods of less than one year. The portfolio turnover rate is calculated without regard to purchase and sales transactions of short-term instruments and certain derivatives, if any. If such transactions were included, the Fund's portfolio turnover rate may be higher.
| | | Year Ended February 28, | | Year Ended
February 29, | | Year Ended
February 28, | |
Class A | | 2015 | | 2014 | | 2013 | | 2012 | | 2011 | |
Per share data | |
Net asset value, beginning of period | | $ | 13.10 | | | $ | 15.21 | | | $ | 14.09 | | | $ | 13.73 | | | $ | 11.48 | | |
Income from investment operations: | |
Net investment income | | | 0.23 | | | | 0.11 | | | | 0.10 | | | | 0.10 | | | | 0.05 | | |
Net realized and unrealized gain | | | 1.53 | | | | 3.03 | | | | 1.66 | | | | 0.36 | | | | 2.26 | | |
Total from investment operations | | | 1.76 | | | | 3.14 | | | | 1.76 | | | | 0.46 | | | | 2.31 | | |
Less distributions to shareholders: | |
Net investment income | | | (0.10 | ) | | | (0.13 | ) | | | (0.13 | ) | | | (0.10 | ) | | | (0.06 | ) | |
Net realized gains | | | (1.90 | ) | | | (5.12 | ) | | | (0.51 | ) | | | — | | | | — | | |
Total distributions to shareholders | | | (2.00 | ) | | | (5.25 | ) | | | (0.64 | ) | | | (0.10 | ) | | | (0.06 | ) | |
Proceeds from regulatory settlements | | | — | | | | — | | | | — | | | | 0.00 | (a) | | | — | | |
Net asset value, end of period | | $ | 12.86 | | | $ | 13.10 | | | $ | 15.21 | | | $ | 14.09 | | | $ | 13.73 | | |
Total return | | | 14.26 | % | | | 23.89 | % | | | 12.83 | % | | | 3.45 | % | | | 20.16 | % | |
Ratios to average net assets(b) | |
Total gross expenses | | | 1.25 | % | | | 1.25 | % | | | 1.23 | % | | | 1.21 | %(c) | | | 1.20 | %(c) | |
Total net expenses(d) | | | 1.18 | %(e) | | | 1.19 | %(e) | | | 1.19 | %(e) | | | 1.16 | %(c)(e) | | | 1.20 | %(c)(e) | |
Net investment income | | | 1.79 | % | | | 0.75 | % | | | 0.70 | % | | | 0.77 | % | | | 0.38 | % | |
Supplemental data | |
Net assets, end of period (in thousands) | | $ | 139,311 | | | $ | 133,450 | | | $ | 120,365 | | | $ | 119,434 | | | $ | 130,039 | | |
Portfolio turnover | | | 150 | % | | | 184 | % | | | 147 | % | | | 197 | % | | | 171 | % | |
Notes to Financial Highlights
(a) Rounds to zero.
(b) In addition to the fees and expenses that the Fund bears directly, the Fund indirectly bears a pro rata share of the fees and expenses of any other funds in which it invests. Such indirect expenses are not included in the Fund's reported expense ratios.
(c) Ratios include line of credit interest expense which is less than 0.01%.
(d) Total net expenses include the impact of certain fee waivers/expense reimbursements made by the Investment Manager and certain of its affiliates, if applicable.
(e) The benefits derived from expense reductions had an impact of less than 0.01%.
The accompanying Notes to Financial Statements are an integral part of this statement.
Annual Report 2015
17
COLUMBIA SELECT LARGE CAP EQUITY FUND
FINANCIAL HIGHLIGHTS (continued)
| | | Year Ended February 28, | | Year Ended
February 29, | | Year Ended
February 28, | |
Class B | | 2015 | | 2014 | | 2013 | | 2012 | | 2011 | |
Per share data | |
Net asset value, beginning of period | | $ | 12.40 | | | $ | 14.64 | | | $ | 13.59 | | | $ | 13.25 | | | $ | 11.11 | | |
Income from investment operations: | |
Net investment income (loss) | | | 0.12 | | | | (0.00 | )(a) | | | (0.01 | ) | | | (0.00 | )(a) | | | (0.04 | ) | |
Net realized and unrealized gain | | | 1.44 | | | | 2.89 | | | | 1.60 | | | | 0.36 | | | | 2.18 | | |
Total from investment operations | | | 1.56 | | | | 2.89 | | | | 1.59 | | | | 0.36 | | | | 2.14 | | |
Less distributions to shareholders: | |
Net investment income | | | (0.01 | ) | | | (0.01 | ) | | | (0.03 | ) | | | (0.02 | ) | | | — | | |
Net realized gains | | | (1.90 | ) | | | (5.12 | ) | | | (0.51 | ) | | | — | | | | — | | |
Total distributions to shareholders | | | (1.91 | ) | | | (5.13 | ) | | | (0.54 | ) | | | (0.02 | ) | | | — | | |
Proceeds from regulatory settlements | | | — | | | | — | | | | — | | | | 0.00 | (a) | | | — | | |
Net asset value, end of period | | $ | 12.05 | | | $ | 12.40 | | | $ | 14.64 | | | $ | 13.59 | | | $ | 13.25 | | |
Total return | | | 13.38 | % | | | 22.99 | % | | | 11.93 | % | | | 2.72 | % | | | 19.26 | % | |
Ratios to average net assets(b) | |
Total gross expenses | | | 2.00 | % | | | 2.00 | % | | | 1.98 | % | | | 1.96 | %(c) | | | 1.95 | %(c) | |
Total net expenses(d) | | | 1.93 | %(e) | | | 1.94 | %(e) | | | 1.94 | %(e) | | | 1.91 | %(c)(e) | | | 1.95 | %(c)(e) | |
Net investment income (loss) | | | 0.96 | % | | | (0.01 | %) | | | (0.05 | %) | | | (0.04 | %) | | | (0.36 | %) | |
Supplemental data | |
Net assets, end of period (in thousands) | | $ | 395 | | | $ | 448 | | | $ | 700 | | | $ | 813 | | | $ | 1,653 | | |
Portfolio turnover | | | 150 | % | | | 184 | % | | | 147 | % | | | 197 | % | | | 171 | % | |
Notes to Financial Highlights
(a) Rounds to zero.
(b) In addition to the fees and expenses that the Fund bears directly, the Fund indirectly bears a pro rata share of the fees and expenses of any other funds in which it invests. Such indirect expenses are not included in the Fund's reported expense ratios.
(c) Ratios include line of credit interest expense which is less than 0.01%.
(d) Total net expenses include the impact of certain fee waivers/expense reimbursements made by the Investment Manager and certain of its affiliates, if applicable.
(e) The benefits derived from expense reductions had an impact of less than 0.01%.
The accompanying Notes to Financial Statements are an integral part of this statement.
Annual Report 2015
18
COLUMBIA SELECT LARGE CAP EQUITY FUND
FINANCIAL HIGHLIGHTS (continued)
| | | Year Ended February 28, | | Year Ended
February 29, | | Year Ended
February 28, | |
Class C | | 2015 | | 2014 | | 2013 | | 2012 | | 2011 | |
Per share data | |
Net asset value, beginning of period | | $ | 12.39 | | | $ | 14.63 | | | $ | 13.58 | | | $ | 13.25 | | | $ | 11.11 | | |
Income from investment operations: | |
Net investment income (loss) | | | 0.14 | | | | 0.00 | (a) | | | (0.01 | ) | | | 0.00 | (a) | | | (0.04 | ) | |
Net realized and unrealized gain | | | 1.42 | | | | 2.89 | | | | 1.60 | | | | 0.35 | | | | 2.18 | | |
Total from investment operations | | | 1.56 | | | | 2.89 | | | | 1.59 | | | | 0.35 | | | | 2.14 | | |
Less distributions to shareholders: | |
Net investment income | | | (0.01 | ) | | | (0.01 | ) | | | (0.03 | ) | | | (0.02 | ) | | | — | | |
Net realized gains | | | (1.90 | ) | | | (5.12 | ) | | | (0.51 | ) | | | — | | | | — | | |
Total distributions to shareholders | | | (1.91 | ) | | | (5.13 | ) | | | (0.54 | ) | | | (0.02 | ) | | | — | | |
Proceeds from regulatory settlements | | | — | | | | — | | | | — | | | | 0.00 | (a) | | | — | | |
Net asset value, end of period | | $ | 12.04 | | | $ | 12.39 | | | $ | 14.63 | | | $ | 13.58 | | | $ | 13.25 | | |
Total return | | | 13.38 | % | | | 23.01 | % | | | 11.94 | % | | | 2.64 | % | | | 19.26 | % | |
Ratios to average net assets(b) | |
Total gross expenses | | | 2.00 | % | | | 2.00 | % | | | 1.98 | % | | | 1.96 | %(c) | | | 1.95 | %(c) | |
Total net expenses(d) | | | 1.93 | %(e) | | | 1.94 | %(e) | | | 1.94 | %(e) | | | 1.91 | %(c)(e) | | | 1.95 | %(c)(e) | |
Net investment income (loss) | | | 1.16 | % | | | 0.01 | % | | | (0.04 | %) | | | 0.02 | % | | | (0.36 | %) | |
Supplemental data | |
Net assets, end of period (in thousands) | | $ | 5,772 | | | $ | 4,245 | | | $ | 3,436 | | | $ | 2,649 | | | $ | 2,612 | | |
Portfolio turnover | | | 150 | % | | | 184 | % | | | 147 | % | | | 197 | % | | | 171 | % | |
Notes to Financial Highlights
(a) Rounds to zero.
(b) In addition to the fees and expenses that the Fund bears directly, the Fund indirectly bears a pro rata share of the fees and expenses of any other funds in which it invests. Such indirect expenses are not included in the Fund's reported expense ratios.
(c) Ratios include line of credit interest expense which is less than 0.01%.
(d) Total net expenses include the impact of certain fee waivers/expense reimbursements made by the Investment Manager and certain of its affiliates, if applicable.
(e) The benefits derived from expense reductions had an impact of less than 0.01%.
The accompanying Notes to Financial Statements are an integral part of this statement.
Annual Report 2015
19
COLUMBIA SELECT LARGE CAP EQUITY FUND
FINANCIAL HIGHLIGHTS (continued)
| | | Year Ended February 28, | | Year Ended
February 29, | | Year Ended
February 28, | |
Class I | | 2015 | | 2014 | | 2013 | | 2012 | | 2011(a) | |
Per share data | |
Net asset value, beginning of period | | $ | 13.04 | | | $ | 15.15 | | | $ | 14.04 | | | $ | 13.69 | | | $ | 11.78 | | |
Income from investment operations: | |
Net investment income | | | 0.26 | | | | 0.17 | | | | 0.16 | | | | 0.15 | | | | 0.04 | | |
Net realized and unrealized gain | | | 1.54 | | | | 3.03 | | | | 1.65 | | | | 0.36 | | | | 1.96 | | |
Total from investment operations | | | 1.80 | | | | 3.20 | | | | 1.81 | | | | 0.51 | | | | 2.00 | | |
Less distributions to shareholders: | |
Net investment income | | | (0.15 | ) | | | (0.19 | ) | | | (0.19 | ) | | | (0.16 | ) | | | (0.09 | ) | |
Net realized gains | | | (1.90 | ) | | | (5.12 | ) | | | (0.51 | ) | | | — | | | | — | | |
Total distributions to shareholders | | | (2.05 | ) | | | (5.31 | ) | | | (0.70 | ) | | | (0.16 | ) | | | (0.09 | ) | |
Proceeds from regulatory settlements | | | — | | | | — | | | | — | | | | 0.00 | (b) | | | — | | |
Net asset value, end of period | | $ | 12.79 | | | $ | 13.04 | | | $ | 15.15 | | | $ | 14.04 | | | $ | 13.69 | | |
Total return | | | 14.68 | % | | | 24.51 | % | | | 13.24 | % | | | 3.82 | % | | | 16.99 | % | |
Ratios to average net assets(c) | |
Total gross expenses | | | 0.81 | % | | | 0.81 | % | | | 0.79 | % | | | 0.76 | %(d) | | | 0.79 | %(d)(e) | |
Total net expenses(f) | | | 0.79 | % | | | 0.79 | % | | | 0.79 | % | | | 0.76 | %(d)(g) | | | 0.79 | %(d)(e)(g) | |
Net investment income | | | 2.03 | % | | | 1.16 | % | | | 1.11 | % | | | 1.18 | % | | | 0.64 | %(e) | |
Supplemental data | |
Net assets, end of period (in thousands) | | $ | 131,622 | | | $ | 155,624 | | | $ | 128,241 | | | $ | 122,828 | | | $ | 135,677 | | |
Portfolio turnover | | | 150 | % | | | 184 | % | | | 147 | % | | | 197 | % | | | 171 | % | |
Notes to Financial Highlights
(a) Based on operations from September 27, 2010 (commencement of operations) through the stated period end.
(b) Rounds to zero.
(c) In addition to the fees and expenses that the Fund bears directly, the Fund indirectly bears a pro rata share of the fees and expenses of any other funds in which it invests. Such indirect expenses are not included in the Fund's reported expense ratios.
(d) Ratios include line of credit interest expense which is less than 0.01%.
(e) Annualized.
(f) Total net expenses include the impact of certain fee waivers/expense reimbursements made by the Investment Manager and certain of its affiliates, if applicable.
(g) The benefits derived from expense reductions had an impact of less than 0.01%.
The accompanying Notes to Financial Statements are an integral part of this statement.
Annual Report 2015
20
COLUMBIA SELECT LARGE CAP EQUITY FUND
FINANCIAL HIGHLIGHTS (continued)
| | | Year Ended February 28, | |
Class R5 | | 2015 | | 2014 | | 2013(a) | |
Per share data | |
Net asset value, beginning of period | | $ | 13.28 | | | $ | 15.35 | | | $ | 14.45 | | |
Income from investment operations: | |
Net investment income | | | 0.39 | | | | 0.23 | | | | 0.06 | | |
Net realized and unrealized gain | | | 1.44 | | | | 3.00 | | | | 1.51 | | |
Total from investment operations | | | 1.83 | | | | 3.23 | | | | 1.57 | | |
Less distributions to shareholders: | |
Net investment income | | | (0.14 | ) | | | (0.18 | ) | | | (0.16 | ) | |
Net realized gains | | | (1.90 | ) | | | (5.12 | ) | | | (0.51 | ) | |
Total distributions to shareholders | | | (2.04 | ) | | | (5.30 | ) | | | (0.67 | ) | |
Net asset value, end of period | | $ | 13.07 | | | $ | 13.28 | | | $ | 15.35 | | |
Total return | | | 14.67 | % | | | 24.40 | % | | | 11.15 | % | |
Ratios to average net assets(b) | |
Total gross expenses | | | 0.86 | % | | | 0.86 | % | | | 0.79 | %(c) | |
Total net expenses(d) | | | 0.85 | % | | | 0.83 | % | | | 0.79 | %(c) | |
Net investment income | | | 2.98 | % | | | 1.77 | % | | | 1.37 | %(c) | |
Supplemental data | |
Net assets, end of period (in thousands) | | $ | 143 | | | $ | 66 | | | $ | 3 | | |
Portfolio turnover | | | 150 | % | | | 184 | % | | | 147 | % | |
Notes to Financial Highlights
(a) Based on operations from November 8, 2012 (commencement of operations) through the stated period end.
(b) In addition to the fees and expenses that the Fund bears directly, the Fund indirectly bears a pro rata share of the fees and expenses of any other funds in which it invests. Such indirect expenses are not included in the Fund's reported expense ratios.
(c) Annualized.
(d) Total net expenses include the impact of certain fee waivers/expense reimbursements made by the Investment Manager and certain of its affiliates, if applicable.
The accompanying Notes to Financial Statements are an integral part of this statement.
Annual Report 2015
21
COLUMBIA SELECT LARGE CAP EQUITY FUND
FINANCIAL HIGHLIGHTS (continued)
| | | Year Ended February 28, | | Year Ended
February 29, | | Year Ended
February 28, | |
Class W | | 2015 | | 2014 | | 2013 | | 2012 | | 2011(a) | |
Per share data | |
Net asset value, beginning of period | | $ | 13.10 | | | $ | 15.20 | | | $ | 14.09 | | | $ | 13.73 | | | $ | 11.80 | | |
Income from investment operations: | |
Net investment income | | | 0.23 | | | | 0.11 | | | | 0.10 | | | | 0.11 | | | | 0.03 | | |
Net realized and unrealized gain | | | 1.53 | | | | 3.04 | | | | 1.66 | | | | 0.36 | | | | 1.95 | | |
Total from investment operations | | | 1.76 | | | | 3.15 | | | | 1.76 | | | | 0.47 | | | | 1.98 | | |
Less distributions to shareholders: | |
Net investment income | | | (0.10 | ) | | | (0.13 | ) | | | (0.14 | ) | | | (0.11 | ) | | | (0.05 | ) | |
Net realized gains | | | (1.90 | ) | | | (5.12 | ) | | | (0.51 | ) | | | — | | | | — | | |
Total distributions to shareholders | | | (2.00 | ) | | | (5.25 | ) | | | (0.65 | ) | | | (0.11 | ) | | | (0.05 | ) | |
Proceeds from regulatory settlements | | | — | | | | — | | | | — | | | | 0.00 | (b) | | | — | | |
Net asset value, end of period | | $ | 12.86 | | | $ | 13.10 | | | $ | 15.20 | | | $ | 14.09 | | | $ | 13.73 | | |
Total return | | | 14.29 | % | | | 24.01 | % | | | 12.78 | % | | | 3.48 | % | | | 16.77 | % | |
Ratios to average net assets(c) | |
Total gross expenses | | | 1.16 | % | | | 1.21 | % | | | 1.20 | % | | | 1.18 | %(d) | | | 1.16 | %(d)(e) | |
Total net expenses(f) | | | 1.16 | %(g) | | | 1.19 | %(g) | | | 1.17 | %(g) | | | 1.14 | %(d)(g) | | | 1.16 | %(d)(e)(g) | |
Net investment income | | | 1.74 | % | | | 0.75 | % | | | 0.72 | % | | | 0.81 | % | | | 0.50 | %(e) | |
Supplemental data | |
Net assets, end of period (in thousands) | | $ | 2 | | | $ | 3 | | | $ | 3 | | | $ | 3 | | | $ | 3 | | |
Portfolio turnover | | | 150 | % | | | 184 | % | | | 147 | % | | | 197 | % | | | 171 | % | |
Notes to Financial Highlights
(a) Based on operations from September 27, 2010 (commencement of operations) through the stated period end.
(b) Rounds to zero.
(c) In addition to the fees and expenses that the Fund bears directly, the Fund indirectly bears a pro rata share of the fees and expenses of any other funds in which it invests. Such indirect expenses are not included in the Fund's reported expense ratios.
(d) Ratios include line of credit interest expense which is less than 0.01%.
(e) Annualized.
(f) Total net expenses include the impact of certain fee waivers/expense reimbursements made by the Investment Manager and certain of its affiliates, if applicable.
(g) The benefits derived from expense reductions had an impact of less than 0.01%.
The accompanying Notes to Financial Statements are an integral part of this statement.
Annual Report 2015
22
COLUMBIA SELECT LARGE CAP EQUITY FUND
FINANCIAL HIGHLIGHTS (continued)
| | | Year Ended February 28, | | Year Ended
February 29, | | Year Ended
February 28, | |
Class Z | | 2015 | | 2014 | | 2013 | | 2012 | | 2011 | |
Per share data | |
Net asset value, beginning of period | | $ | 13.03 | | | $ | 15.15 | | | $ | 14.04 | | | $ | 13.69 | | | $ | 11.45 | | |
Income from investment operations: | |
Net investment income | | | 0.25 | | | | 0.15 | | | | 0.13 | | | | 0.13 | | | | 0.08 | | |
Net realized and unrealized gain | | | 1.53 | | | | 3.02 | | | | 1.66 | | | | 0.36 | | | | 2.25 | | |
Total from investment operations | | | 1.78 | | | | 3.17 | | | | 1.79 | | | | 0.49 | | | | 2.33 | | |
Less distributions to shareholders: | |
Net investment income | | | (0.13 | ) | | | (0.17 | ) | | | (0.17 | ) | | | (0.14 | ) | | | (0.09 | ) | |
Net realized gains | | | (1.90 | ) | | | (5.12 | ) | | | (0.51 | ) | | | — | | | | — | | |
Total distributions to shareholders | | | (2.03 | ) | | | (5.29 | ) | | | (0.68 | ) | | | (0.14 | ) | | | (0.09 | ) | |
Proceeds from regulatory settlements | | | — | | | | — | | | | — | | | | 0.00 | (a) | | | — | | |
Net asset value, end of period | | $ | 12.78 | | | $ | 13.03 | | | $ | 15.15 | | | $ | 14.04 | | | $ | 13.69 | | |
Total return | | | 14.54 | % | | | 24.25 | % | | | 13.08 | % | | | 3.65 | % | | | 20.40 | % | |
Ratios to average net assets(b) | |
Total gross expenses | | | 1.00 | % | | | 1.00 | % | | | 0.98 | % | | | 0.95 | %(c) | | | 0.95 | %(c) | |
Total net expenses(d) | | | 0.93 | %(e) | | | 0.94 | %(e) | | | 0.93 | %(e) | | | 0.91 | %(c)(e) | | | 0.95 | %(c)(e) | |
Net investment income | | | 1.92 | % | | | 1.00 | % | | | 0.90 | % | | | 0.99 | % | | | 0.64 | % | |
Supplemental data | |
Net assets, end of period (in thousands) | | $ | 209,909 | | | $ | 255,142 | | | $ | 373,397 | | | $ | 825,292 | | | $ | 974,320 | | |
Portfolio turnover | | | 150 | % | | | 184 | % | | | 147 | % | | | 197 | % | | | 171 | % | |
Notes to Financial Highlights
(a) Rounds to zero.
(b) In addition to the fees and expenses that the Fund bears directly, the Fund indirectly bears a pro rata share of the fees and expenses of any other funds in which it invests. Such indirect expenses are not included in the Fund's reported expense ratios.
(c) Ratios include line of credit interest expense which is less than 0.01%.
(d) Total net expenses include the impact of certain fee waivers/expense reimbursements made by the Investment Manager and certain of its affiliates, if applicable.
(e) The benefits derived from expense reductions had an impact of less than 0.01%.
The accompanying Notes to Financial Statements are an integral part of this statement.
Annual Report 2015
23
COLUMBIA SELECT LARGE CAP EQUITY FUND
NOTES TO FINANCIAL STATEMENTS
February 28, 2015
Note 1. Organization
Columbia Select Large Cap Equity Fund (the Fund), a series of Columbia Funds Series Trust (the Trust), is a diversified fund. The Trust is registered under the Investment Company Act of 1940, as amended (the 1940 Act), as an open-end management investment company organized as a Delaware statutory trust.
Fund Shares
The Trust may issue an unlimited number of shares (without par value). The Fund offers Class A, Class B, Class C, Class I, Class R5, Class W and Class Z shares. Although all share classes generally have identical voting, dividend and liquidation rights, each share class votes separately when required by the Trust's organizational documents or by law. Different share classes pay different distribution amounts to the extent the expenses of such share classes differ, and distributions in liquidation will be proportional to the net asset value of each share class. Each share class has its own expense structure and sales charges.
Class A shares are subject to a maximum front-end sales charge of 5.75% based on the initial investment amount. Class A shares purchased without an initial sales charge in accounts aggregating $1 million to $50 million at the time of purchase are subject to a contingent deferred sales charge (CDSC) if the shares are sold within 18 months of purchase, charged as follows: 1.00% CDSC if redeemed within 12 months of purchase, and 0.50% CDSC if redeemed more than 12, but less than 18, months after purchase.
Class B shares may be subject to a maximum CDSC of 5.00% based upon the holding period after purchase. Class B shares will generally convert to Class A shares eight years after purchase. The Fund no longer accepts investments by new or existing investors in the Fund's Class B shares, except in connection with the reinvestment of any dividend and/or capital gain distributions in Class B shares of the Fund and exchanges by existing Class B shareholders of certain other funds within the Columbia Family of Funds.
Class C shares are subject to a 1.00% CDSC on shares redeemed within one year of purchase.
Class I shares are not subject to sales charges and are available only to the Columbia Family of Funds.
Class R5 shares are not subject to sales charges and are generally available only to investors purchasing through authorized investment professionals and omnibus retirement plans.
Class W shares are not subject to sales charges and are available only to investors purchasing through authorized investment programs managed by investment professionals, including discretionary managed account programs.
Class Z shares are not subject to sales charges and are available only to eligible investors, which are subject to different investment minimums as described in the Fund's prospectus.
Note 2. Summary of Significant Accounting Policies
Basis of Preparation
The Fund is an investment company that applies the accounting and reporting guidance in the Financial Accounting Standards Board (FASB) Accounting Standards Codification Topic 946, Financial Services — Investment Companies (ASC 946). The financial statements are prepared in accordance with U.S. generally accepted accounting principles (GAAP) which requires management to make certain estimates and assumptions that affect the reported amounts of assets and liabilities, the disclosure of contingent assets and liabilities at the date of the financial statements and the reported amounts of income and expenses during the reporting period. Actual results could differ from those estimates.
The following is a summary of significant accounting policies followed by the Fund in the preparation of its financial statements.
Security Valuation
All equity securities are valued at the close of business of the New York Stock Exchange (NYSE). Equity securities are valued at the last quoted sales price on the principal exchange or market on which they trade, except for securities traded on the NASDAQ Stock Market, which are valued at the NASDAQ official close price. Unlisted securities or listed securities for which there were no sales during the day are valued at the mean of the latest quoted bid and ask prices on such exchanges or markets.
Foreign equity securities are valued based on quotations from the principal market in which such securities are traded. If any foreign security prices are not readily available as a result of limited share activity, the securities are valued at the mean of the latest quoted bid and ask prices on such exchanges or markets. Foreign currency exchange rates are generally
Annual Report 2015
24
COLUMBIA SELECT LARGE CAP EQUITY FUND
NOTES TO FINANCIAL STATEMENTS (continued)
February 28, 2015
determined at 4:00 p.m. Eastern (U.S.) time. Many securities markets and exchanges outside the U.S. close prior to the close of the NYSE; therefore, the closing prices for securities in such markets or on such exchanges may not fully reflect events that occur after such close but before the close of the NYSE. In those situations, foreign securities will be fair valued pursuant to a policy adopted by the Board of Trustees (the Board), including, if available, utilizing a third party pricing service to determine these fair values. The third party pricing service takes into account multiple factors, including, but not limited to, movements in the U.S. securities markets, certain depositary receipts, futures contracts and foreign exchange rates that have occurred subsequent to the close of the foreign exchange or market, to determine a good faith estimate that reasonably reflects the current market conditions as of the close of the NYSE. The fair value of a security is likely to be different from the quoted or published price, if available.
Investments in open-end investment companies, including money market funds, are valued at their net asset value.
Investments for which market quotations are not readily available, or that have quotations which management believes are not reliable, are valued at fair value as determined in good faith under procedures established by and under the general supervision of the Board. If a security or class of securities (such as foreign securities) is valued at fair value, such value is likely to be different from the quoted or published price for the security.
The determination of fair value often requires significant judgment. To determine fair value, management may use assumptions including but not limited to future cash flows and estimated risk premiums. Multiple inputs from various sources may be used to determine fair value.
Foreign Currency Transactions and Translations
The values of all assets and liabilities denominated in foreign currencies are generally translated into U.S. dollars at exchange rates determined at the close of the NYSE. Net realized and unrealized gains (losses) on foreign currency transactions and translations include gains (losses) arising from the fluctuation in exchange rates between trade and settlement dates on securities transactions, gains (losses) arising from the disposition of foreign currency and currency gains (losses) between the accrual and payment dates on dividends, interest income and foreign withholding taxes.
For financial statement purposes, the Fund does not distinguish that portion of gains (losses) on investments
which is due to changes in foreign exchange rates from that which is due to changes in market prices of the investments. Such fluctuations are included with the net realized and unrealized gains (losses) on investments in the Statement of Operations.
Security Transactions
Security transactions are accounted for on the trade date. Cost is determined and gains (losses) are based upon the specific identification method for both financial statement and federal income tax purposes.
Income Recognition
Corporate actions and dividend income are generally recorded net of any non-reclaimable tax withholdings, on the ex-dividend date or upon receipt of ex-dividend notification in the case of certain foreign securities.
The Fund may receive distributions from holdings in business development companies (BDCs), exchange-traded funds (ETFs), other regulated investment companies (RICs), and real estate investment trusts (REITs), which report information on the character of their distributions annually. These distributions are allocated to dividend income, capital gain and return of capital based on actual information reported. To the extent actual information has not yet been reported by the REITs, estimates for return of capital are made by the Fund's management. Return of capital is recorded as a reduction of the cost basis of securities held. If the Fund no longer owns the applicable securities, return of capital is recorded as a realized gain. Management's estimates are subsequently adjusted when the actual character of the distributions is disclosed by the REITs, which could result in a proportionate change in return of capital to shareholders. No estimates are made for the BDCs, ETFs, and RICs.
Awards from class action litigation are recorded as a reduction of cost basis if the Fund still owns the applicable securities on the payment date. If the Fund no longer owns the applicable securities, the proceeds are recorded as realized gains.
Expenses
General expenses of the Trust are allocated to the Fund and other funds of the Trust based upon relative net assets or other expense allocation methodologies determined by the nature of the expense. Expenses directly attributable to the Fund are charged to the Fund. Expenses directly attributable to a specific class of shares are charged to that share class.
Annual Report 2015
25
COLUMBIA SELECT LARGE CAP EQUITY FUND
NOTES TO FINANCIAL STATEMENTS (continued)
February 28, 2015
Determination of Class Net Asset Value
All income, expenses (other than class-specific expenses, which are charged to that share class, as shown in the Statement of Operations) and realized and unrealized gains (losses) are allocated to each class of the Fund on a daily basis, based on the relative net assets of each class, for purposes of determining the net asset value of each class.
Federal Income Tax Status
The Fund intends to qualify each year as a regulated investment company under Subchapter M of the Internal Revenue Code, as amended, and will distribute substantially all of its taxable income (including net short-term capital gains), if any, for its tax year, and as such will not be subject to federal income taxes. In addition, the Fund intends to distribute in each calendar year substantially all of its net investment income, capital gains and certain other amounts, if any, such that the Fund should not be subject to federal excise tax. Therefore, no federal income or excise tax provision is recorded.
Foreign Taxes
The Fund may be subject to foreign taxes on income, gains on investments or currency repatriation, a portion of which may be recoverable. The Fund will accrue such taxes and recoveries, as applicable, based upon its current interpretation of tax rules and regulations that exist in the markets in which it invests.
Realized gains in certain countries may be subject to foreign taxes at the Fund level, based on statutory rates. The Fund accrues for such foreign taxes on realized and unrealized gains at the appropriate rate for each jurisdiction, as applicable. The amount, if any, is disclosed as a liability on the Statement of Assets and Liabilities.
Distributions to Shareholders
Distributions from net investment income, if any, are declared and paid semi-annually. Net realized capital gains, if any, are distributed at least annually. Income distributions and capital gain distributions are determined in accordance with federal income tax regulations, which may differ from GAAP.
Guarantees and Indemnifications
Under the Trust's organizational documents and, in some cases, by contract, its officers and trustees are indemnified against certain liabilities arising out of the performance of their duties to the Trust or its funds. In
addition, certain of the Fund's contracts with its service providers contain general indemnification clauses. The Fund's maximum exposure under these arrangements is unknown since the amount of any future claims that may be made against the Fund cannot be determined, and the Fund has no historical basis for predicting the likelihood of any such claims.
Note 3. Fees and Compensation Paid to Affiliates
Investment Management Fees
Under an Investment Management Services Agreement, Columbia Management Investment Advisers, LLC (the Investment Manager), a wholly-owned subsidiary of Ameriprise Financial, Inc. (Ameriprise Financial), determines which securities will be purchased, held or sold. The investment management fee is an annual fee that is equal to a percentage of the Fund's average daily net assets that declines from 0.71% to 0.54% as the Fund's net assets increase. The effective investment management fee rate for the year ended February 28, 2015 was 0.71% of the Fund's average daily net assets.
Administration Fees
Under an Administrative Services Agreement, the Investment Manager also serves as the Fund Administrator. The Fund pays the Fund Administrator an annual fee for administration and accounting services equal to a percentage of the Fund's average daily net assets that declines from 0.06% to 0.03% as the Fund's net assets increase. The effective administration fee rate for the year ended February 28, 2015 was 0.06% of the Fund's average daily net assets.
Other Expenses
Other expenses are for, among other things, miscellaneous expenses of the Fund or the Board, including payments to a company providing limited administrative services to the Fund and the Board. That company's expenses include boardroom and office expense, employee compensation, employee health and retirement benefits, and certain other expenses. For the year ended February 28, 2015, other expenses paid by the Fund to this company were $1,885.
Compensation of Board Members
Board members are compensated for their services to the Fund as disclosed in the Statement of Operations. Under a Deferred Compensation Plan (the Plan), the Board members who are not "interested persons" of the Fund, as defined under the 1940 Act, may elect to defer
Annual Report 2015
26
COLUMBIA SELECT LARGE CAP EQUITY FUND
NOTES TO FINANCIAL STATEMENTS (continued)
February 28, 2015
payment of up to 100% of their compensation. Deferred amounts are treated as though equivalent dollar amounts had been invested in shares of certain funds managed by the Investment Manager. The Fund's liability for these amounts is adjusted for market value changes and remains in the Fund until distributed in accordance with the Plan.
Transfer Agent Fees
Under a Transfer and Dividend Disbursing Agent Agreement, Columbia Management Investment Services Corp. (the Transfer Agent), an affiliate of the Investment Manager and a wholly-owned subsidiary of Ameriprise Financial, is responsible for providing transfer agency services to the Fund. The Transfer Agent has contracted with Boston Financial Data Services (BFDS) to serve as sub-transfer agent.
Effective November 1, 2014, the Transfer Agent receives a monthly transfer agency fee based on the number or the average value of accounts, depending on the type of account. Prior to November 1, 2014, the Transfer Agent received a monthly account-based service fee based on the number of open accounts. In addition, the Transfer Agent also receives sub-transfer agency fees based on a percentage of the average aggregate value of the Fund's shares maintained in omnibus accounts (other than omnibus accounts for which American Enterprise Investment Services Inc. is the broker of record or accounts where the beneficial shareholder is a customer of Ameriprise Financial Services, Inc., for which the Transfer Agent receives a per account fee). The Transfer Agent pays the fees of BFDS for services as sub-transfer agent and is not entitled to reimbursement for such fees from the Fund (with the exception of out-of-pocket fees).
The Transfer Agent also receives compensation from the Fund for various shareholder services and reimbursements for certain out-of-pocket fees. Class I shares do not pay transfer agency fees. Total transfer agent fees for Class R5 shares are subject to an annual limitation of not more than 0.05% of the average daily net assets attributable to Class R5 shares.
For the year ended February 28, 2015, the Fund's effective transfer agent fee rates as a percentage of average daily net assets of each class were as follows:
Class A | | | 0.19 | % | |
Class B | | | 0.19 | | |
Class C | | | 0.19 | | |
Class R5 | | | 0.05 | | |
Class W | | | 0.15 | | |
Class Z | | | 0.19 | | |
An annual minimum account balance fee of $20 may apply to certain accounts with a value below the applicable share class's initial minimum investment requirements to reduce the impact of small accounts on transfer agent fees. These minimum account balance fees are remitted to the Fund and recorded as part of expense reductions in the Statement of Operations. For the year ended February 28, 2015, these minimum account balance fees reduced total expenses of the Fund by $3,291.
Distribution and Service Fees
The Fund has an agreement with Columbia Management Investment Distributors, Inc. (the Distributor), an affiliate of the Investment Manager and a wholly-owned subsidiary of Ameriprise Financial, for distribution and shareholder services. The Board has approved, and the Fund has adopted, distribution and shareholder service plans (the Plans) applicable to certain share classes, which set the distribution and service fees for the Fund. These fees are calculated daily and are intended to compensate the Distributor and/or eligible selling and/or servicing agents for selling shares of the Fund and providing services to investors.
Under the Plans, the Fund pays a monthly combined distribution and service fee to the Distributor at the maximum annual rate of 0.25% of the average daily net assets attributable to Class A shares of the Fund. Also under the Plans, the Fund pays a monthly service fee at the maximum annual rate of 0.25% of the average daily net assets attributable to Class B, Class C and Class W shares of the Fund and the payment of a monthly distribution fee at the maximum annual rates of 0.75%, 0.75% and 0.25% of the average daily net assets attributable to Class B, Class C and Class W shares, respectively.
Although the Fund may pay a distribution fee up to 0.25% of the Fund's average daily net assets attributable to Class W shares and a service fee of up to 0.25% of the Fund's average daily net assets attributable to Class W shares, the aggregate fee shall not exceed 0.25% of the Fund's average daily net assets attributable to Class W shares.
Sales Charges
Sales charges, including front-end charges and CDSCs, received by the Distributor for distributing Fund shares were $35,447 for Class A, $56 for Class B and $334 for Class C shares for the year ended February 28, 2015.
Annual Report 2015
27
COLUMBIA SELECT LARGE CAP EQUITY FUND
NOTES TO FINANCIAL STATEMENTS (continued)
February 28, 2015
Expenses Waived/Reimbursed by the Investment Manager and its Affiliates
The Fund's expense ratio is subject to an expense reimbursement arrangement pursuant to which fees will be waived and/or expenses reimbursed (excluding certain fees and expenses described below), so that the Fund's net operating expenses, after giving effect to fees waived/expenses reimbursed and any balance credits and/or overdraft charges from the Fund's custodian, do not exceed the annual rates of:
| | | Voluntary
Expense Cap
Effective
July 1, 2014 | | Contractual
Expense Cap
Prior to
July 1, 2014 | |
Class A | | | 1.18 | % | | | 1.18 | % | |
Class B | | | 1.93 | | | | 1.93 | | |
Class C | | | 1.93 | | | | 1.93 | | |
Class I | | | 0.80 | | | | 0.78 | | |
Class R5 | | | 0.85 | | | | 0.83 | | |
Class W | | | 1.18 | | | | 1.18 | | |
Class Z | | | 0.93 | | | | 0.93 | | |
The voluntary expense cap arrangement may be revised or discontinued at any time. Under the arrangements, the following fees and expenses are excluded from the waiver/reimbursement commitment, and therefore will be paid by the Fund, if applicable: taxes (including foreign transaction taxes), expenses associated with investments in affiliated and non-affiliated pooled investment vehicles (including mutual funds and exchange-traded funds), transaction costs and brokerage commissions, costs related to any securities lending program, dividend expenses associated with securities sold short, inverse floater program fees and expenses, transaction charges and interest on borrowed money, interest and extraordinary expenses. Any fees waived and/or expenses reimbursed under the expense reimbursement arrangements described above are not recoverable by the Investment Manager or its affiliates in future periods.
Note 4. Federal Tax Information
The timing and character of income and capital gain distributions are determined in accordance with income tax regulations, which may differ from GAAP because of temporary or permanent book to tax differences.
At February 28, 2015, these differences are primarily due to differing treatment for deferral/reversal of wash sale losses, Trustees' deferred compensation and foreign currency transactions. To the extent these differences are permanent, reclassifications are made
among the components of the Fund's net assets in the Statement of Assets and Liabilities. Temporary differences do not require reclassifications. In the Statement of Assets and Liabilities the following reclassifications were made:
Undistributed net investment income | | $ | (112 | ) | |
Accumulated net realized gain | | | 112 | | |
Net investment income (loss) and net realized gains (losses), as disclosed in the Statement of Operations, and net assets were not affected by this reclassification.
The tax character of distributions paid during the years indicated was as follows:
Year Ended February 28, | | 2015 | | 2014 | |
Ordinary income | | $ | 39,200,579 | | | $ | 60,010,986 | | |
Long-term capital gains | | | 37,701,913 | | | | 131,134,892 | | |
Total | | | 76,902,492 | | | | 191,145,878 | | |
Short-term capital gain distributions, if any, are considered ordinary income distributions for tax purposes.
At February 28, 2015, the components of distributable earnings on a tax basis were as follows:
Undistributed ordinary income | | $ | 22,547,007 | | |
Undistributed long-term capital gains | | | 25,653,313 | | |
Net unrealized appreciation | | | 73,825,025 | | |
At February 28, 2015, the cost of investments for federal income tax purposes was $411,858,861 and the aggregate gross unrealized appreciation and depreciation based on that cost was:
Unrealized appreciation | | $ | 79,404,934 | | |
Unrealized depreciation | | | (5,579,909 | ) | |
Net unrealized appreciation | | | 73,825,025 | | |
Management of the Fund has concluded that there are no significant uncertain tax positions in the Fund that would require recognition in the financial statements. However, management's conclusion may be subject to review and adjustment at a later date based on factors including, but not limited to, new tax laws, regulations, and administrative interpretations (including relevant court decisions). Generally, the Fund's federal tax returns for the prior three fiscal years remain subject to examination by the Internal Revenue Service.
Note 5. Portfolio Information
The cost of purchases and proceeds from sales of securities, excluding short-term investments and derivatives, if any, aggregated to $753,131,313 and
Annual Report 2015
28
COLUMBIA SELECT LARGE CAP EQUITY FUND
NOTES TO FINANCIAL STATEMENTS (continued)
February 28, 2015
$876,716,616, respectively, for the year ended February 28, 2015. The amount of purchase and sale activity impacts the portfolio turnover rate reported in the Financial Highlights.
Note 6. Affiliated Money Market Fund
The Fund invests in Columbia Short-Term Cash Fund, an affiliated money market fund established for the exclusive use by the Fund and other affiliated funds. The income earned by the Fund from such investments is included as Dividends — affiliated issuers in the Statement of Operations. As an investing fund, the Fund indirectly bears its proportionate share of the expenses of Columbia Short-Term Cash Fund.
Note 7. Shareholder Concentration
At February 28, 2015, one unaffiliated shareholder of record owned 44.5% of the outstanding shares of the Fund in one or more accounts. The Fund has no knowledge about whether any portion of those shares was owned beneficially. Affiliated shareholders of record owned 28.7% of the outstanding shares of the Fund in one or more accounts. Subscription and redemption activity by concentrated accounts may have a significant effect on the operations of the Fund.
Note 8. Line of Credit
The Fund has entered into a revolving credit facility with a syndicate of banks led by JPMorgan Chase Bank, N.A. (JPMorgan) whereby the Fund may borrow for the temporary funding of shareholder redemptions or for other temporary or emergency purposes. Pursuant to a December 9, 2014 amendment, the credit facility agreement, which is a collective agreement between the Fund and certain other funds managed by the Investment Manager, severally and not jointly, permits collective borrowings up to $550 million. Interest is charged to each participating fund based on its borrowings at a rate equal to the higher of (i) the overnight federal funds rate plus 1.00% or (ii) the one-month LIBOR rate plus 1.00%. Each borrowing under the credit facility matures no later than 60 days after the date of borrowing. The Fund also pays a commitment fee equal to its pro rata share of the amount of the credit facility at a rate of 0.075% per annum. The commitment fee is included in other expenses in the Statement of Operations. Prior to the December 9, 2014 amendment, the credit facility agreement permitted borrowings up to $500 million under the same terms and interest rates as described above.
The Fund had no borrowings during the year ended February 28, 2015.
Note 9. Subsequent Events
Management has evaluated the events and transactions that have occurred through the date the financial statements were issued and noted no items requiring adjustment of the financial statements or additional disclosure.
Note 10. Information Regarding Pending and Settled Legal Proceedings
In December 2005, without admitting or denying the allegations, American Express Financial Corporation (AEFC, which is now known as Ameriprise Financial, Inc. (Ameriprise Financial)) entered into settlement agreements with the Securities and Exchange Commission (SEC) and Minnesota Department of Commerce (MDOC) related to market timing activities. As a result, AEFC was censured and ordered to cease and desist from committing or causing any violations of certain provisions of the Investment Advisers Act of 1940, the Investment Company Act of 1940, and various Minnesota laws. AEFC agreed to pay disgorgement of $10 million and civil money penalties of $7 million. AEFC also agreed to retain an independent distribution consultant to assist in developing a plan for distribution of all disgorgement and civil penalties ordered by the SEC in accordance with various undertakings detailed at www.sec.gov/litigation/admin/ia-2451.pdf. Ameriprise Financial and its affiliates have cooperated with the SEC and the MDOC in these legal proceedings, and have made regular reports to the Funds' Boards of Trustees.
Ameriprise Financial and certain of its affiliates have historically been involved in a number of legal, arbitration and regulatory proceedings, including routine litigation, class actions, and governmental actions, concerning matters arising in connection with the conduct of their business activities. Ameriprise Financial believes that the Funds are not currently the subject of, and that neither Ameriprise Financial nor any of its affiliates are the subject of, any pending legal, arbitration or regulatory proceedings that are likely to have a material adverse effect on the Funds or the ability of Ameriprise Financial or its affiliates to perform under their contracts with the Funds. Ameriprise Financial is required to make quarterly (10-Q), annual (10-K) and, as necessary, 8-K filings with the Securities and Exchange Commission on legal and regulatory matters that relate to Ameriprise Financial and its affiliates. Copies of these filings may be obtained by accessing the SEC website at www.sec.gov.
Annual Report 2015
29
COLUMBIA SELECT LARGE CAP EQUITY FUND
NOTES TO FINANCIAL STATEMENTS (continued)
February 28, 2015
There can be no assurance that these matters, or the adverse publicity associated with them, will not result in increased fund redemptions, reduced sale of fund shares or other adverse consequences to the Funds. Further, although we believe proceedings are not likely to have a material adverse effect on the Funds or the ability of Ameriprise Financial or its affiliates to perform under their contracts with the Funds, these proceedings are subject to uncertainties and, as such, we are unable to estimate the possible loss or range of loss that may result. An adverse outcome in one or more of these proceedings could result in adverse judgments, settlements, fines, penalties or other relief that could have a material adverse effect on the consolidated financial condition or results of operations of Ameriprise Financial.
Annual Report 2015
30
COLUMBIA SELECT LARGE CAP EQUITY FUND
REPORT OF INDEPENDENT REGISTERED PUBLIC ACCOUNTING FIRM
To the Trustees of Columbia Funds Series Trust and the Shareholders of
Columbia Select Large Cap Equity Fund
In our opinion, the accompanying statement of assets and liabilities, including the portfolio of investments, and the related statements of operations and of changes in net assets and the financial highlights present fairly, in all material respects, the financial position of Columbia Select Large Cap Equity Fund (the "Fund", a series of Columbia Funds Series Trust) at February 28, 2015, and the results of its operations, the changes in its net assets and the financial highlights for each of the periods indicated, in conformity with accounting principles generally accepted in the United States of America. These financial statements and financial highlights (hereafter referred to as "financial statements") are the responsibility of the Fund's management; our responsibility is to express an opinion on these financial statements based on our audits. We conducted our audits of these financial statements in accordance with the standards of the Public Company Accounting Oversight Board (United States). Those standards require that we plan and perform the audit to obtain reasonable assurance about whether the financial statements are free of material misstatement. An audit includes examining, on a test basis, evidence supporting the amounts and disclosures in the financial statements, assessing the accounting principles used and significant estimates made by management, and evaluating the overall financial statement presentation. We believe that our audits, which included confirmation of securities at February 28, 2015 by correspondence with the custodian, brokers and transfer agent, and the application of alternative auditing procedures where such confirmations had not been received, provide a reasonable basis for our opinion.
PricewaterhouseCoopers LLP
Minneapolis, Minnesota
April 21, 2015
Annual Report 2015
31
COLUMBIA SELECT LARGE CAP EQUITY FUND
FEDERAL INCOME TAX INFORMATION
(Unaudited)
The Fund hereby designates the following tax attributes for the fiscal year ended February 28, 2015. Shareholders will be notified in early 2016 of the amounts for use in preparing 2015 income tax returns.
Tax Designations:
| Qualified Dividend Income | | | 24.34 | % | |
| Dividends Received Deduction | | | 23.22 | % | |
| Capital Gain Dividend | | $ | 48,475,100 | | |
Qualified Dividend Income. For taxable, non-corporate shareholders, the percentage of ordinary income distributed during the fiscal year that represents qualified dividend income subject to reduced tax rates.
Dividends Received Deduction. The percentage of ordinary income distributed during the fiscal year that qualifies for the corporate dividends received deduction.
Capital Gain Dividend. The Fund designates as a capital gain dividend the amount reflected above, or if subsequently determined to be different, the net capital gain of such fiscal period.
Annual Report 2015
32
COLUMBIA SELECT LARGE CAP EQUITY FUND
Shareholders elect the Board that oversees the Funds' operations. The Board appoints officers who are responsible for day-to-day business decisions based on policies set by the Board. The following table provides basic biographical information about the Funds' Board members, including their principal occupations during the past five years, although specific titles for individuals may have varied over the period. Under current Board policy, members may serve through the end of the calendar year in which he or she reaches either the mandatory retirement age established by the Board or the fifteenth anniversary of the first Board meeting they attended as a member of the Board.
Independent Trustees
Name,
Address,
Year of Birth | | Position Held With
Funds and Length of
Service | | Principal Occupation(s)
During Past Five Years
and Other Relevant
Professional Experience | | Number of
Funds in the
Fund Family
Overseen by
Board Member | | Other Present or Past
Directorships/
Trusteeships
(Within Past 5 Years) | |
Kathleen Blatz
901 S. Marquette Ave.
Minneapolis, MN 55402
1954 | | Board member since 1/06 for RiverSource Funds and since 6/11 for Nations Funds | | Attorney; specializing in arbitration and mediation; Chief Justice, Minnesota Supreme Court, 1998-2006; Associate Justice, Minnesota Supreme Court, 1996-1998; Fourth Judicial District Court Judge, Hennepin Country, 1994-1996; Attorney in private practice and public service, 1984-1993; State Representative, Minnesota House of Representatives, 1979-1993, which included service on the Tax and Financial Institutions and Insurance Committees | | | 127 | | | Trustee, BlueCross BlueShield of Minnesota (Chair of the Business Development Committee) since 2009; Chair of the Robina Foundation since August 2013 | |
Edward J. Boudreau, Jr.
901 S. Marquette Ave.
Minneapolis, MN 55402
1944 | | Board member since 6/11 for RiverSource Funds and since 1/05 for Nations Funds | | Managing Director, E.J. Boudreau & Associates (consulting) since 2000; FINRA Industry Arbitrator, 2002-present; Chairman and Chief Executive Officer, John Hancock Funds (asset management), Chairman and Interested Trustee for open-end and closed-end funds offered by John Hancock, 1989-2000; John Hancock Life Insurance Company, including SVP and Treasurer and SVP Information Technology, 1968-1988 | | | 125 | | | Former Trustee, BofA Funds Series Trust (11 funds), 2005-2011; Trustee, Boston Museum of Science (Chair of Finance Committee), 1985-2013 | |
Pamela G. Carlton
901 S. Marquette Ave.
Minneapolis, MN 55402
1954 | | Board member since 7/07 for RiverSource Funds and since 6/11 for Nations Funds | | President, Springboard — Partners in Cross Cultural Leadership (consulting company) since 2003; Managing Director of US Equity Research, JP Morgan Chase, 1999-2003; Director of US Equity Research, Chase Asset Management, 1996-1999; Co-Director Latin America Research, 1993-1996, COO Global Research, 1992-1996, Co-Director of US Research, 1991-1992, Investment Banker, Morgan Stanley, 1982-1991 | | | 127 | | | None | |
Annual Report 2015
33
COLUMBIA SELECT LARGE CAP EQUITY FUND
TRUSTEES AND OFFICERS (continued)
Independent Trustees (continued)
Name,
Address,
Year of Birth | | Position Held With
Funds and Length of
Service | | Principal Occupation(s)
During Past Five Years
and Other Relevant
Professional Experience | | Number of
Funds in the
Fund Family
Overseen by
Board Member | | Other Present or Past
Directorships/
Trusteeships
(Within Past 5 Years) | |
William P. Carmichael
901 S. Marquette Ave.
Minneapolis, MN 55402
1943 | | Chair of the Board since 1/14, Board member since 6/11 for RiverSource Funds and since 2003 for Nations Funds | | Retired; Co-founder, The Succession Fund (provides exit strategies to owners of privately held companies) 1998-2007; Adjunct Professor of Finances, Kelley School of Business, Indiana University, 1993-2007; Senior Vice President, Sara Lee Corporation, 1991-1993; Senior Vice President and Chief Financial Officer, Beatrice Foods Company, 1984-1990; Vice President, Esmark, Inc, 1973-1984.; Associate, Price Waterhouse, 1968-1972 | | | 127 | | | Director, Cobra Electronics Corporation (electronic equipment manufacturer), 1994-August 2014; The Finish Line (athletic shoes and apparel) since July 2003; Director, International Textile Corp. since 2012; former Director, McMoRan Exploration Company (oil and gas exploration and development) 2010-2013; former Trustee, BofA Funds Series Trust (11 funds) 2009-2011; Director, Spectrum Brands, Inc. (consumer products), 2002-2009; Director, Simmons Company (bedding), 2004-2010 | |
Patricia M. Flynn
901 S. Marquette Ave.
Minneapolis, MN 55402
1950 | | Board member since 11/04 for RiverSource Funds and since 6/11 for Nations Funds | | Trustee Professor of Economics and Management, Bentley University since 1976 (also teaches and conducts research on corporate governance); Dean, McCallum Graduate School of Business, Bentley University, 1992-2002 | | | 127 | | | Trustee, MA Taxpayers Foundation since 1997; Board of Governors, Innovation Institute, MA Technology Collaborative since 2010 | |
William A. Hawkins
901 S. Marquette Ave.
Minneapolis, MN 55402
1942 | | Board member since 6/11 for RiverSource Funds and since 1/05 for Nations Funds | | Managing Director, Overton Partners (financial consulting), since August 2010; President and Chief Executive Officer, California General Bank, N.A., January 2008-August 2010; Operation Hope, COO, 2004-2007; IndyMac Bancorp, President, CBG, 1999-2003; American General Bank, President, 1997-1999; Griffin Financial Services, CEO, 1981-1997; The Griffin Funds, CEO, 1992-1998 | | | 125 | | | Trustee, BofA Funds Series Trust (11 funds) | |
R. Glenn Hilliard
901 S. Marquette Ave.
Minneapolis, MN 55402
1943 | | Board member since 6/11 for RiverSource Funds and since 1/05 for Nations Funds | | Chairman and Chief Executive Officer, Hilliard Group LLC (investing and consulting) since April 2003; Non-Executive Director & Chairman, CNO Financial Group, Inc. (insurance), September 2003-May 2011 | | | 125 | | | Chairman, BofA Funds Series Trust (11 funds); former Director, CNO Financial Group, Inc. (insurance) 2003-2011 | |
Annual Report 2015
34
COLUMBIA SELECT LARGE CAP EQUITY FUND
TRUSTEES AND OFFICERS (continued)
Independent Trustees (continued)
Name,
Address,
Year of Birth | | Position Held With
Funds and Length of
Service | | Principal Occupation(s)
During Past Five Years
and Other Relevant
Professional Experience | | Number of
Funds in the
Fund Family
Overseen by
Board Member | | Other Present or Past
Directorships/
Trusteeships
(Within Past 5 Years) | |
Catherine James Paglia
901 S. Marquette Ave.
Minneapolis, MN 55402
1952 | | Board member since 11/04 for RiverSource Funds and since 6/11 for Nations Funds | | Director, Enterprise Asset Management, Inc. (private real estate and asset management company) since September 1998; Managing Director and Partner, Interlaken Capital, Inc., 1989-1997; Managing Director, Morgan Stanley, 1982-1989; Vice President, Investment Banking, 1980-1982, Associate, Investment Banking, 1976-1980, Dean Witter Reynolds, Inc. | | | 127 | | | Director, Valmont Industries, Inc. (irrigation systems manufacturer) since 2012; Trustee, Carleton College (on the Investment Committee); Trustee, Carnegie Endowment for International Peace (on the Investment Committee) | |
Leroy C. Richie
901 S. Marquette Ave.
Minneapolis, MN 55402
1941 | | Board member since 2000 for Seligman Funds, since 11/08 for RiverSource Funds and since 6/11 for Nations Funds | | Counsel, Lewis & Munday, P.C. (law firm) since 2004; Vice President and General Counsel, Automotive Legal Affairs, Chrysler Corporation, 1993-1997 | | | 127 | | | Lead Outside Director, Digital Ally, Inc. (digital imaging) since September 2005; Director, Infinity, Inc. (oil and gas exploration and production) since 1994; Director, OGE Energy Corp. (energy and energy services) since November 2007-2014 | |
Minor M. Shaw
901 S. Marquette Ave.
Minneapolis, MN 55402
1947 | | Board member since 6/11 for RiverSource Funds and since 2003 for Nations Funds | | President, Micco LLC (private investments) since 2011; President, Micco Corp. (family investment business) 1998-2011 | | | 125 | | | Director, Piedmont Natural Gas; Director, BlueCross BlueShield of South Carolina since April 2008; Chair of the Duke Endowment; Director, National Association of Corporate Directors, Carolinas Chapter, since 2013; Chair of Greenville-Spartanburg Airport Commission; former Trustee, BofA Funds Series Trust (11 funds), 2003-2011 | |
Alison Taunton-Rigby
901 S. Marquette Ave.
Minneapolis, MN 55402
1944 | | Board member since 11/02 for RiverSource Funds and since 6/11 for Nations Funds | | Managing Director, Forester Biotech (consulting) since 2001; Chief Executive Officer and Director, RiboNovix, Inc., (biotechnology) 2003-2010; President and Chief Executive Officer of CMT Inc., 2001-2003; Aquila Biopharmaceuticals Inc., 1996-2000; Cambridge Biotech Corporation, 1995-1996, Mitotix Inc., 1993-1994 | | | 127 | | | Director, Healthways, Inc. (health and well-being solutions) since 2005; Director, ICI Mutual Insurance Company, RRG since 2011; Director, Abt Associates (government contractor) since 2001; Director, Boston Children's Hospital since 2002 | |
Annual Report 2015
35
COLUMBIA SELECT LARGE CAP EQUITY FUND
TRUSTEES AND OFFICERS (continued)
Interested Trustee Not Affiliated with Investment Manager*
Name,
Address,
Year of Birth | | Position Held With
Funds and Length of
Service | | Principal Occupation
During Past Five Years | | Number of
Funds in the
Fund Family
Overseen by
Board Member | | Other Present or Past
Directorships/
Trusteeships
(Within Past 5 Years) | |
Anthony M. Santomero
901 S. Marquette Ave.
Minneapolis, MN 55402
1946 | | Board member since 6/11 for RiverSource Funds and since 1/08 for Nations Funds | | Richard K. Mellon Professor Emeritus of Finance, The Wharton School, University of Pennsylvania, since 2002; Senior Advisor, McKinsey & Company (consulting), 2006-2008; President, Federal Reserve Bank of Philadelphia, 2000-2006, Professor of Finance, The Wharton School, University of Pennsylvania, 1972-2002 | | | 125 | | | Director, Renaissance Reinsurance Ltd. since May 2008; Trustee, Penn Mutual Life Insurance Company since March 2008; Director, Citigroup Inc. since 2009; Director, Citibank, N.A. since 2009; former Trustee, BofA Funds Series Trust (11 funds), 2008-2011 | |
* Dr. Santomero is not an affiliated person of the Investment Manager or Ameriprise Financial. However, he is currently deemed by the Funds to be an "interested person" (as defined in the 1940 Act) of the Funds because he serves as a Director of Citigroup Inc. and Citibank, N.A., companies that may directly or through subsidiaries and affiliates engage from time-to-time in brokerage execution, principal transactions and lending relationships with the Funds or accounts advised/managed by the Investment Manager.
Annual Report 2015
36
COLUMBIA SELECT LARGE CAP EQUITY FUND
TRUSTEES AND OFFICERS (continued)
Interested Trustee Affiliated with Investment Manager*
Name,
Address,
Year of Birth | | Position Held With
Funds and Length of
Service | | Principal Occupation
During Past Five Years | | Number of
Funds in the
Fund Family
Overseen by
Board Member | | Other Present or Past
Directorships/
Trusteeships
(Within Past 5 Years) | |
William F. Truscott
53600 Ameriprise
Financial Center
Minneapolis, MN 55474
1960 | | Board member since 11/01 for RiverSource Funds and since 6/11 for Nations Funds; Senior Vice President since 2002 for RiverSource Funds and since 5/10 for Nations Funds | | Chairman of the Board and President, Columbia Management Investment Advisers, LLC since May 2010 and February 2012, respectively (previously President and Chief Investment Officer, 2001-April 2010); Chief Executive Officer, Global Asset Management, Ameriprise Financial, Inc. since September 2012 (previously Chief Executive Officer, U.S. Asset Management & President, Annuities, May 2010-September 2012 and President — U.S. Asset Management and Chief Investment Officer, 2005-April 2010); Director and Chief Executive Officer, Columbia Management Investment Distributors, Inc. since May 2010 and February 2012, respectively (previously Chairman of the Board and Chief Executive Officer, 2006-April 2010); Chairman of the Board and Chief Executive Officer, RiverSource Distributors, Inc. since 2006; Director, Threadneedle Asset Management Holdings, SARL since 2014; President and Chief Executive Officer, Ameriprise Certificate Company, 2006-August 2012 | | | 186 | | | Former Director, Ameriprise Certificate Company, 2006-January 2013 | |
* Interested person (as defined under the 1940 Act) by reason of being an officer, director, security holder and/or employee of the Investment Manager or Ameriprise Financial.
The Statement of Additional Information has additional information about the Fund's Board members and is available, without charge, upon request by calling 800.345.6611; contacting your financial intermediary or visiting columbiathreadneedle.com/us.
Annual Report 2015
37
COLUMBIA SELECT LARGE CAP EQUITY FUND
TRUSTEES AND OFFICERS (continued)
The Board has appointed officers who are responsible for day-to-day business decisions based on policies it has established. The officers serve at the pleasure of the Board. In addition to Mr. Truscott, who is Senior Vice President, the Funds' other officers are:
Fund Officers
Name,
Address and
Year of Birth | | Position and Year
First Appointed to
Position for any Fund
in the Columbia
Funds Complex or a
Predecessor Thereof | | Principal Occupation(s) During Past Five Years | |
Christopher O. Petersen
5228 Ameriprise
Financial Center
Minneapolis, MN 55474
Born 1970 | | President and Principal Executive Officer (2015) | | Vice President and Lead Chief Counsel, Ameriprise Financial, Inc. since January 2015 (previously, Vice President and Chief Counsel January 2010-December 2014; and Vice President and Group Counsel or Counsel 2004-January 2010); officer of Columbia Funds and affiliated funds since 2007. | |
Michael G. Clarke
225 Franklin Street
Boston, MA 02110
Born 1969 | | Treasurer (2011) and Chief Financial Officer (2009) | | Vice President — Mutual Fund Administration, Columbia Management Investment Advisers, LLC, since May 2010; Managing Director of Fund Administration, Columbia Management Advisors, LLC, September 2004-April 2010; senior officer of Columbia Funds and affiliated funds since 2002. | |
Paul B. Goucher
100 Park Avenue
New York, NY 10017
Born 1968 | | Senior Vice President (2011), Chief Legal Officer (2015) and Assistant Secretary (2008) | | Vice President and Lead Chief Counsel, Ameriprise Financial, Inc. since November 2008 and January 2013, respectively (previously Chief Counsel, January 2010-January 2013 and Group Counsel, November 2008-January 2010). | |
Thomas P. McGuire
225 Franklin Street
Boston, MA 02110
Born 1972 | | Vice President and Chief Compliance Officer (2012) | | Vice President — Asset Management Compliance, Ameriprise Financial, Inc., since May 2010; Chief Compliance Officer, Ameriprise Certificate Company since September 2010; Compliance Executive, Bank of America, 2005-April 2010. | |
Colin Moore
225 Franklin Street
Boston, MA 02110
Born 1958 | | Senior Vice President (2010) | | Executive Vice President and Global Chief Investment Officer, Ameriprise Financial, Inc., since July 2013; Director and Global Chief Investment Officer, Columbia Management Investment Advisers, LLC since May 2010; Manager, Managing Director and Chief Investment Officer, Columbia Management Advisors, LLC, 2007-April 2010. | |
Michael E. DeFao
225 Franklin Street
Boston, MA 02110
Born 1968 | | Vice President (2011) and Assistant Secretary (2010) | | Vice President and Chief Counsel, Ameriprise Financial, Inc. since May 2010; Associate General Counsel, Bank of America, 2005-April 2010. | |
Joseph F. DiMaria
225 Franklin Street
Boston, MA 02110
Born 1968 | | Vice President (2011), Assistant Treasurer (2012) and Chief Accounting Officer (2008) | | Vice President — Mutual Fund Treasurer, Columbia Management Investment Advisers, LLC since May 2010; Director of Fund Administration, Columbia Management Advisors, LLC, 2006-April 2010. | |
Amy Johnson
5228 Ameriprise
Financial Center
Minneapolis, MN 55474
Born 1965 | | Vice President (2006) | | Managing Director and Chief Operating Officer, Columbia Management Investment Advisers, LLC since May 2010 (previously Chief Administrative Officer, 2009-April 2010, and Vice President — Asset Management and Trust Company Services, 2006-2009). | |
Lyn Kephart-Strong
5228 Ameriprise
Financial Center
Minneapolis, MN 55474
Born 1960 | | Vice President (2015) | | President, Columbia Management Investment Services Corp. since October 2014; Vice President & Resolution Officer, Ameriprise Trust Company since August 2009; President, RiverSource Service Corporation 2004-2010. | |
Ryan C. Larrenaga
225 Franklin Street
Boston, MA 02110
Born 1970 | | Vice President and Secretary (2015) | | Vice President and Group Counsel, Ameriprise Financial, Inc. since August 2011 (previously, Counsel from May 2010 to August 2011); Assistant General Counsel, Bank of America, 2005-April 2010; officer of Columbia Funds and affiliated funds since 2005. | |
Annual Report 2015
38
COLUMBIA SELECT LARGE CAP EQUITY FUND
IMPORTANT INFORMATION ABOUT THIS REPORT
Each fund mails one shareholder report to each shareholder address. If you would like more than one report, please call shareholder services at 800.345.6611 and additional reports will be sent to you.
The policy of the Board is to vote the proxies of the companies in which each fund holds investments consistent with the procedures as stated in the Statement of Additional Information (SAI). You may obtain a copy of the SAI without charge by calling 800.345.6611; contacting your financial intermediary; visiting columbiathreadneedle.com/us; or searching the website of the Securities and Exchange Commission (SEC) at sec.gov. Information regarding how each fund voted proxies relating to portfolio securities is filed with the SEC by August 31st for the most recent 12-month period ending June 30th of that year, and is available without charge by visiting columbiathreadneedle.com/us; or searching the website of the SEC at sec.gov.
Each fund files a complete schedule of portfolio holdings with the SEC for the first and third quarters of each fiscal year on Form N-Q. Each fund's Form N-Q is available on the SEC's website at sec.gov and may be reviewed and copied at the SEC's Public Reference Room in Washington, D.C. Information on the operation of the Public Reference Room may be obtained by calling 800.SEC.0330. Each fund's complete schedule of portfolio holdings, as filed on Form N-Q, can also be obtained without charge, upon request, by calling 800.345.6611.
Annual Report 2015
39
Columbia Select Large Cap Equity Fund
P.O. Box 8081
Boston, MA 02266-8081

This information is for use with concurrent or prior delivery of a fund prospectus. Please read and consider the investment objectives, risks, charges and expenses for any fund carefully before investing. For a prospectus and summary prospectus, which contains this and other important information about the Fund, go to columbiathreadneedle.com/us. The Fund is distributed by Columbia Management Investment Distributors, Inc., member FINRA, and managed by Columbia Management Investment Advisers, LLC.
Columbia Threadneedle Investments (Columbia Threadneedle) is the global brand name of the Columbia and Threadneedle group of companies.
All rights reserved. Columbia Management Investment Distributors, Inc., 225 Franklin Street, Boston, MA 02110-2804
© 2015 Columbia Management Investment Advisers, LLC.
columbiathreadneedle.com/us
ANN172_02_E01_(04/15)

ANNUAL REPORT
February 28, 2015

COLUMBIA SMALL CAP VALUE FUND II

ABOUT COLUMBIA THREADNEEDLE INVESTMENTS
Columbia Threadneedle Investments is a leading global asset management group that provides a broad range of actively managed investment strategies and solutions for individual, institutional and corporate clients around the world.
With more than 2,000 people, including over 450 investment professionals based in North America, Europe and Asia, we manage $506 billion* of assets across developed and emerging market equities, fixed income, asset allocation solutions and alternatives. We are the 11th largest manager of long-term mutual fund assets in the U.S.** and the 5th largest manager of retail funds in the U.K.***
Our priority is the investment success of our clients. We aim to deliver the investment outcomes they expect through an investment approach that is team-based, performance-driven and risk-aware. Our culture is dynamic and interactive. By sharing our insights across asset classes and geographies, we generate richer perspectives on global, regional and local investment landscapes. The ability to exchange and debate investment ideas in a collaborative environment enriches our teams' investment processes. More importantly, it results in better informed investment decisions for our clients.
Columbia funds are distributed by Columbia Management Investment Distributors, Inc., member FINRA, and managed by Columbia Management Investment Advisers, LLC.
Columbia Threadneedle Investments (Columbia Threadneedle) is the global brand name of the Columbia and Threadneedle group of companies.
* In U.S. dollars as of December 31, 2014. Source: Ameriprise Q4 Earnings Release. Includes all assets managed by entities in the Columbia and Threadneedle groups of companies. Contact us for more current data.
** Source: ICI as of December 31, 2014 for Columbia Management Investment Advisers, LLC.
*** Source: Investment Association as of December 2014 for Threadneedle Asset Management Limited.
© 2015 Columbia Management Investment Advisers, LLC. All rights reserved.
Not part of the shareholder report
Get the market insight you need from our investment experts
Connect with Columbia Threadneedle Investments
Investor insight
Find economic and market commentary, investment videos, white papers, mutual fund commentary and more at columbiathreadneedle.com/us.
Columbia Threadneedle Investor Newsletter (e-newsletter)
Read our award-winning* shareholder newsletter. Our quarterly newsletter is available online and provides timely and relevant content about economic trends, fund news, service enhancements and changes. Sign up to receive the newsletter electronically at columbiathreadneedle.com/
us/newsletter.
Investment videos
Get analysis of current events and trends that may affect your investments. Visit our online video library to watch and discover what our thought leaders are saying about the financial markets and economy.
Social media
We offer you multiple ways to access our market commentary and investment insights.
n Perspectives blog at columbiathreadneedle.com/us
Read timely posts by our investment team, including our chief investment officer, chief economist and portfolio managers.
n twitter.com/CTinvest_US
Follow us on Twitter for quick, up-to-the-minute comments on market news and more.
n youtube.com/CTinvestUS
View our commentaries on the economy, markets and current investment opportunities.
n linkedin.com/company/columbia-threadneedle-investments-us
Connect with us on LinkedIn for updates from our thought leaders.
*Columbia Threadneedle Investor Newsletter was awarded top honors in the Mutual Fund Education Alliance STAR Awards competition for excellence in mutual fund marketing and communications in 2011, 2012 and 2013. Materials in the competition were evaluated on educational value, message comprehension, effective design and objectives.
Not part of the shareholder report
Stay informed
Become a subscriber to receive the latest investment publications and mutual fund commentaries
Subscribe to Columbia Threadneedle Investments
Email subscription center
Subscribe to the latest information from Columbia Threadneedle. Visit our email subscription center at columbiathreadneedle.com/us/subscribe to register for economic and market commentary, product and service updates, white papers and more.
n Columbia Threadneedle Investor Newsletter
Quarterly newsletter featuring the latest macro- and micro-economic trends, investment themes, products, service changes and other items of interest to our investors
n Investment Strategy Outlook
Quarterly publication featuring the Columbia Threadneedle Asset Allocation Team's perspective on global economic investment conditions and markets
n MarketTrack
Quarterly publication featuring more than 40 charts and graphs that highlight the current state of the economy and the markets; includes straightforward insight on current investment opportunities
n White papers
Frequent articles that delve deep into a variety of investment topics
n Mutual fund updates
Quarterly portfolio manager commentary and fund fact sheets available for Columbia funds. (Not all funds have a commentary.)
Register your information online at columbiathreadneedle.com/us/subscribe and select the publications you would like to receive. Update your subscriptions at any time by accessing the email subscription center.
CT-MK (03/15) 5383/1125800
 Dear Shareholder,
In a world that is changing faster than ever before, investors want asset managers who offer a global perspective while generating strong and sustainable returns. To that end, Columbia Management, in conjunction with its U.K.-based affiliate, Threadneedle Investments, has rebranded to Columbia Threadneedle Investments. The new global brand represents the combined capabilities, resources and reach of the global group, offering investors access to the best of both firms.
With a presence in 18 countries and more than 450 investment professionals*, our collective perspective and world view as Columbia Threadneedle Investments gives us deeper insight into what might affect the real-life financial outcomes clients are seeking. Putting our views into a global context enables us to build richer perspectives and create the right solutions, and provides us with enhanced capabilities to deliver consistent investment performance, which may ultimately lead to better investor outcomes.
As a result of the rebrand, you will begin to see our new logo and colors reflected in printed materials, such as this shareholder report, as well as on our new website — columbiathreadneedle.com/us. We encourage you to visit us online and view a new video on the "About Us" tab that speaks to the strength of the firm.
While we are introducing a new brand, in many ways, the investment company you know well has not changed. The following remain in effect:
n Fund and strategy names
n Established investment teams, philosophies and processes
n Account services, features, servicing phone numbers and mailing addresses
n Columbia Management Investment Distributors as distributor and Columbia Management Investment Advisers as investment adviser
We recognize that the money we manage represents the hard work and savings of people like you, and that everyone has different ambitions and different definitions of success. Investors have varying goals — funding their children's education, enjoying their retirement, putting money aside for unexpected events, and more. Whatever your ambitions, we believe our wide range of investment products and solutions can help give you confidence that you will reach your goals.
The world is constantly changing, but our priority remains the same: to help you secure your finances, meet your goals and achieve success. Thank you for your continued investment with us. Our service representatives are available at 800.345.6611 to help with any questions.
Sincerely,

Christopher O. Petersen
President, Columbia Funds
Investors should consider the investment objectives, risks, charges and expenses of a mutual fund carefully before investing. For a free prospectus and summary prospectus, which contains this and other important information about a fund, visit columbiathreadneedle.com/us. The prospectus should be read carefully before investing.
* Source: Ameriprise as of December 1, 2014
Columbia Funds are distributed by Columbia Management Investment Distributors, Inc., member FINRA, and managed by Columbia Management Investment Advisers, LLC.
© 2015 Columbia Management Investment Advisers, LLC. All rights reserved.
COLUMBIA SMALL CAP VALUE FUND II
Fund Investment Manager
Columbia Management Investment
Advisers, LLC
225 Franklin Street
Boston, MA 02110
Fund Distributor
Columbia Management Investment
Distributors, Inc.
225 Franklin Street
Boston, MA 02110
Fund Transfer Agent
Columbia Management Investment
Services Corp.
P.O. Box 8081
Boston, MA 02266-8081
For more information about any of the funds, please visit columbiathreadneedle.com/us or call 800.345.6611. Customer Service Representatives are available to answer your questions Monday through Friday from 8 a.m. to 7 p.m. Eastern time.
The views expressed in this report reflect the current views of the respective parties. These views are not guarantees of future performance and involve certain risks, uncertainties and assumptions that are difficult to predict, so actual outcomes and results may differ significantly from the views expressed. These views are subject to change at any time based upon economic, market or other conditions and the respective parties disclaim any responsibility to update such views. These views may not be relied on as investment advice and, because investment decisions for a Columbia fund are based on numerous factors, may not be relied on as an indication of trading intent on behalf of any particular Columbia fund. References to specific securities should not be construed as a recommendation or investment advice.
Performance Overview | | | 3 | | |
Manager Discussion of Fund Performance | | | 5 | | |
Understanding Your Fund's Expenses | | | 7 | | |
Portfolio of Investments | | | 8 | | |
Statement of Assets and Liabilities | | | 13 | | |
Statement of Operations | | | 15 | | |
Statement of Changes in Net Assets | | | 16 | | |
Financial Highlights | | | 19 | | |
Notes to Financial Statements | | | 28 | | |
Report of Independent Registered
Public Accounting Firm | | | 35 | | |
Federal Income Tax Information | | | 36 | | |
Trustees and Officers | | | 37 | | |
Important Information About This Report | | | 43 | | |
COLUMBIA SMALL CAP VALUE FUND II
Performance Summary
n Columbia Small Cap Value Fund II (the Fund) Class A shares returned 4.10% excluding sales charges for the 12-month period that ended February 28, 2015.
n The Fund outperformed its benchmark, the Russell 2000 Value Index, which returned 3.96% for the same time period.
n The Fund's focus on undervalued companies with improving fortunes in the energy and industrials sectors led to strong stock selection in these sectors.
Average Annual Total Returns (%) (for period ended February 28, 2015)
| | | Inception | | 1 Year | | 5 Years | | 10 Years | |
Class A | | 05/01/02 | | | | | | | | | | | | | |
Excluding sales charges | | | | | | | 4.10 | | | | 15.26 | | | | 8.36 | | |
Including sales charges | | | | | | | -1.91 | | | | 13.91 | | | | 7.72 | | |
Class B | | 05/01/02 | | | | | | | | | | | | | |
Excluding sales charges | | | | | | | 3.34 | | | | 14.41 | | | | 7.55 | | |
Including sales charges | | | | | | | -1.33 | | | | 14.17 | | | | 7.55 | | |
Class C | | 05/01/02 | | | | | | | | | | | | | |
Excluding sales charges | | | | | | | 3.34 | | | | 14.42 | | | | 7.56 | | |
Including sales charges | | | | | | | 2.41 | | | | 14.42 | | | | 7.56 | | |
Class I* | | 09/27/10 | | | 4.63 | | | | 15.76 | | | | 8.60 | | |
Class R* | | 01/23/06 | | | 3.86 | | | | 14.98 | | | | 8.08 | | |
Class R4* | | 11/08/12 | | | 4.39 | | | | 15.39 | | | | 8.43 | | |
Class R5* | | 11/08/12 | | | 4.51 | | | | 15.47 | | | | 8.46 | | |
Class Y* | | 11/08/12 | | | 4.53 | | | | 15.49 | | | | 8.48 | | |
Class Z | | 05/01/02 | | | 4.39 | | | | 15.57 | | | | 8.64 | | |
Russell 2000 Value Index | | | | | | | 3.96 | | | | 13.97 | | | | 7.13 | | |
Returns for Class A are shown with and without the maximum initial sales charge of 5.75%. Returns for Class B are shown with and without the applicable contingent deferred sales charge (CDSC) of 5.00% in the first year, declining to 1.00% in the sixth year and eliminated thereafter. Returns for Class C are shown with and without the 1.00% CDSC for the first year only. The Fund's other classes are not subject to sales charges and have limited eligibility. Please see the Fund's prospectus for details. Performance for different share classes will vary based on differences in sales charges and fees associated with each class. All results shown assume reinvestment of distributions during the period. Returns do not reflect the deduction of taxes that a shareholder may pay on Fund distributions or on the redemption of Fund shares. Performance results reflect the effect of any fee waivers or reimbursements of Fund expenses by Columbia Management Investment Advisers, LLC and/or any of its affiliates. Absent these fee waivers or expense reimbursement arrangements, performance results would have been lower.
The performance information shown represents past performance and is not a guarantee of future results. The investment return and principal value of your investment will fluctuate so that your shares, when redeemed, may be worth more or less than their original cost. Current performance may be lower or higher than the performance information shown. You may obtain performance information current to the most recent month-end by contacting your financial intermediary, visiting columbiathreadneedle.com/us or calling 800.345.6611.
*The returns shown for periods prior to the share class inception date (including returns for the Life of the Fund, if shown, which are since Fund inception) include the returns of the Fund's oldest share class. Since the Fund launched more than one share class at its inception, Class A shares were used. These returns are adjusted to reflect any higher class-related operating expenses of the newer share classes, as applicable. Please visit columbiathreadneedle.com/us/investment-products/mutual-funds/appended-performance for more information.
The Russell 2000 Value Index, an unmanaged index, tracks the performance of those Russell 2000 Index companies with lower price-to-book ratios and lower forecasted growth values.
Indices are not available for investment, are not professionally managed and do not reflect sales charges, fees, brokerage commissions, taxes or other expenses of investing. Securities in the Fund may not match those in an index.
Annual Report 2015
3
COLUMBIA SMALL CAP VALUE FUND II
PERFORMANCE OVERVIEW (continued)
Performance of a Hypothetical $10,000 Investment (March 1, 2005 – February 28, 2015)
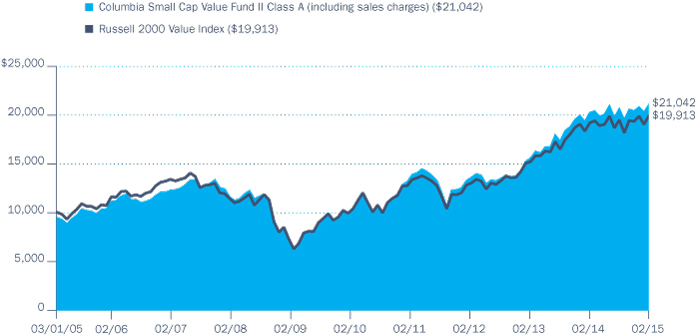
The chart above shows the change in value of a hypothetical $10,000 investment in Class A shares of Columbia Small Cap Value Fund II during the stated time period, and does not reflect the deduction of taxes that a shareholder may pay on Fund distributions or on the redemption of Fund shares.
Annual Report 2015
4
COLUMBIA SMALL CAP VALUE FUND II
MANAGER DISCUSSION OF FUND PERFORMANCE
For the 12-month period that ended February 28, 2015, the Fund's Class A shares returned 4.10% excluding sales charges. The Fund outperformed its benchmark, the Russell 2000 Value Index, which returned 3.96% during the same time period. The Fund's focus on undervalued companies with improving fortunes in the energy and industrials sectors led to strong stock selection in these sectors. Stock selection and sector allocation within financials and consumer staples detracted from relative performance.
Stocks Continued to Climb as U.S. Economy Strengthened
After a cold and difficult winter brought many parts of the United States to a standstill early in 2014, the pace of U.S. economic growth picked up and good news appeared in most sectors. The labor market added 267,000 new jobs monthly, on average, during the 12-month period ended February 28, 2015. Solid new job growth drove the unemployment rate down to 5.5%, and prospects for higher wages generally buoyed consumer confidence during the period. Manufacturing activity remained solid, as capacity utilization rose to a post-recovery high. However, another stormy winter in the Northeast and Midwest nipped growth early in 2015. Manufacturing activity and consumer confidence slipped as harsh weather weighed on short-term expectations. The housing market's recovery was restrained by both periods of bad weather, tighter borrowing standards, rising prices and higher mortgage rates.
Investors responded favorably to the generally good economic news. However, concerns about increased global tensions, uncertainty about the Federal Reserve's (the Fed's) next move and sinking oil prices resulted in bouts of volatility that became more pronounced as the period wore on. The Fed spent 2014 winding down its monthly bond purchases, ending its program of quantitative easing in October, and suggested that it would raise short-term interest rates sometime in 2015. The timing of that move remained unclear, however, especially as some weaker data appeared in the final months of the period. In this environment, interest rates dropped sharply. The yield on the 10-year U.S. Treasury bond, which started the period at 2.6%, dropped to 2.0%, having traded even lower in the final months of the period. Large company stocks were the strongest equity market performers, while small-cap stocks pulled up the rear, the result of the combined impact of declining energy prices, mixed housing data, modest performance from small banks and the expectation of higher volatility after the Fed ended quantitative easing. These headwinds proved sufficient to offset factors that typically boost small-cap performance when the U.S. economy is strong relative to the rest of the world. Within the small-cap segment, growth strongly outperformed value due primarily to outsized results from growth-oriented biotech and pharmaceutical companies and the growth segment's lower exposure to energy (relative to the small-cap value segment), particularly those that supply equipment and services.
Contributors and Detractors
Despite plummeting energy prices, stock selection within the energy sector aided Fund results. A position in Athlon Energy, an exploration and
Portfolio Management
Christian Stadlinger, Ph.D., CFA
Jarl Ginsberg, CFA, CAIA
Morningstar Style BoxTM
The Morningstar Style BoxTM is based on a fund's portfolio holdings. For equity funds, the vertical axis shows the market capitalization of the stocks owned, and the horizontal axis shows investment style (value, blend, or growth). Information shown is based on the most recent data provided by Morningstar.
© 2015 Morningstar, Inc. All rights reserved. The Morningstar information contained herein: (1) is proprietary to Morningstar and/or its content providers; (2) may not be copied or distributed; and (3) is not warranted to be accurate, complete or timely. Neither Morningstar nor its content providers are responsible for any damages or losses arising from any use of this information.
Top Ten Holdings (%)
(at February 28, 2015) | |
VCA, Inc. | | | 1.4 | | |
Western Alliance Bancorp | | | 1.3 | | |
UIL Holdings Corp. | | | 1.3 | | |
American Assets Trust, Inc. | | | 1.3 | | |
Deluxe Corp. | | | 1.3 | | |
Sterling Bancorp | | | 1.2 | | |
PrivateBancorp, Inc. | | | 1.2 | | |
Helen of Troy Ltd. | | | 1.2 | | |
AMERISAFE, Inc. | | | 1.2 | | |
Neenah Paper, Inc. | | | 1.2 | | |
Percentages indicated are based upon total investments (excluding Money Market Funds).
For further detail about these holdings, please refer to the section entitled "Portfolio of Investments."
Fund holdings are as of the date given, are subject to change at any time, and are not recommendations to buy or sell any security.
Annual Report 2015
5
COLUMBIA SMALL CAP VALUE FUND II
MANAGER DISCUSSION OF FUND PERFORMANCE (continued)
Portfolio Breakdown (%)
(at February 28, 2015) | |
Common Stocks | | | 96.0 | | |
Consumer Discretionary | | | 13.6 | | |
Consumer Staples | | | 0.7 | | |
Energy | | | 5.4 | | |
Financials | | | 34.0 | | |
Health Care | | | 8.7 | | |
Industrials | | | 11.0 | | |
Information Technology | | | 9.8 | | |
Materials | | | 7.3 | | |
Utilities | | | 5.5 | | |
Money Market Funds | | | 4.0 | | |
Total | | | 100.0 | | |
Percentages indicated are based upon total investments. The Fund's portfolio composition is subject to change.
Investment Risks
Market risk may affect a single issuer, sector of the economy, industry or the market as a whole. Foreign investments subject the Fund to risks, including political, economic, market, social and others within a particular country, as well as to currency instabilities and less stringent financial and accounting standards generally applicable to U.S. issuers. Investments in small-cap companies involve risks and volatility greater than investments in larger, more established companies. Value securities may be unprofitable if the market fails to recognize their intrinsic worth or the portfolio managers misgauged that worth. The Fund may invest significantly in issuers within a particular sector, which may be negatively affected by market, economic or other conditions, making the Fund more vulnerable to unfavorable developments in the sector. See the Fund's prospectus for more information on these and other risks.
production company, proved beneficial as the stock advanced on evidence of successful exploration in the Permian Basin. The company received another boost on news that it was being acquired by Canadian-based Encana. As such, it was not in the portfolio at the end of the period. Energy holdings including Goodrich Petroleum, Basic Energy Services and Parsley Energy detracted from results. During the period, we reduced the Fund's net exposure to energy on overall declining cash flow expectations due to weakness in oil prices. However, the Fund ended the period with an overweight in energy because we made selective additions to oil and gas stocks based on the merits of individual opportunities rather than a top down strategic call on the industry. In the same regard, we also trimmed exposure to information technology based on our assessment of prospects of individual holdings.
Overall, the Fund did well within the industrials sector, which was a strong contributor to performance for the period. One of the top performers was Alaska Air Group. The company benefited from increased demand for airline seats. In healthcare, stock selection was positive within providers and services. VCA was the Fund's top performance contributor, as the veterinary clinic chain benefited from favorable year-over-year results. Neither VCA nor Alaska Air is included in the benchmark, which further bolstered relative results.
Stock selection and sector allocation within financials and consumer staples detracted from relative performance. Within financials, an underweight in real estate investment trusts (REITs) was a significant detractor as many REITs not held in the portfolio posted strong results. In the consumer staples sector, Nu Skin Enterprises, a personal care company that is not in the benchmark, declined on concerns over sales in China and we exited the name.
At period end, the Fund was overweight relative to the benchmark in materials, healthcare and consumer discretionary stocks and underweight in consumer staples, industrials, utilities and financials, namely in REITs and specialty finance companies.
Looking Ahead
We continue to believe in our focus on small cap value companies with strong underlying earnings prospects and attractively priced shares. We seek those companies in which we believe the valuation gap is likely to shrink in the near term and look for upward inflection points and improving operating performance/metrics. As we do this, three types of opportunities typically come to light:
1. Companies with compressed near term operating fundamentals that we believe are poised to expand within a reasonable timeframe
2. Opportunities in industries that may be out of favor
3. "Out-of-the-limelight" companies we believe have been missed by the Wall Street research community
Going forward, we expect performance to continue to be driven by our bottom-up stock selection process, which also drives sector allocations.
Annual Report 2015
6
COLUMBIA SMALL CAP VALUE FUND II
UNDERSTANDING YOUR FUND'S EXPENSES
(Unaudited)
As an investor, you incur two types of costs. There are transaction costs, which generally include sales charges on purchases and may include redemption fees. There are also ongoing costs, which generally include management fees, distribution and/or service fees, and other fund expenses. The following information is intended to help you understand your ongoing costs (in dollars) of investing in the Fund and to help you compare these costs with the ongoing costs of investing in other mutual funds.
Analyzing Your Fund's Expenses
To illustrate these ongoing costs, we have provided examples and calculated the expenses paid by investors in each share class of the Fund during the period. The actual and hypothetical information in the table is based on an initial investment of $1,000 at the beginning of the period indicated and held for the entire period. Expense information is calculated two ways and each method provides you with different information. The amount listed in the "Actual" column is calculated using the Fund's actual operating expenses and total return for the period. You may use the Actual information, together with the amount invested, to estimate the expenses that you paid over the period. Simply divide your account value by $1,000 (for example, an $8,600 account value divided by $1,000 = 8.6), then multiply the results by the expenses paid during the period under the "Actual" column. The amount listed in the "Hypothetical" column assumes a 5% annual rate of return before expenses (which is not the Fund's actual return) and then applies the Fund's actual expense ratio for the period to the hypothetical return. You should not use the hypothetical account values and expenses to estimate either your actual account balance at the end of the period or the expenses you paid during the period. See "Compare With Other Funds" below for details on how to use the hypothetical data.
Compare With Other Funds
Since all mutual funds are required to include the same hypothetical calculations about expenses in shareholder reports, you can use this information to compare the ongoing cost of investing in the Fund with other funds. To do so, compare the hypothetical example with the 5% hypothetical examples that appear in the shareholder reports of other funds. As you compare hypothetical examples of other funds, it is important to note that hypothetical examples are meant to highlight the ongoing costs of investing in a fund only and do not reflect any transaction costs, such as sales charges, or redemption or exchange fees. Therefore, the hypothetical calculations are useful in comparing ongoing costs only, and will not help you determine the relative total costs of owning different funds. If transaction costs were included in these calculations, your costs would be higher.
September 1, 2014 – February 28, 2015
| | | Account Value at the Beginning
of the Period ($) | | Account Value at the End of the
Period ($) | | Expenses Paid During the
Period ($) | | Fund's Annualized
Expense Ratio (%) | |
| | | Actual | | Hypothetical | | Actual | | Hypothetical | | Actual | | Hypothetical | | Actual | |
Class A | | | 1,000.00 | | | | 1,000.00 | | | | 1,020.20 | | | | 1,018.40 | | | | 6.60 | | | | 6.59 | | | | 1.31 | | |
Class B | | | 1,000.00 | | | | 1,000.00 | | | | 1,016.50 | | | | 1,014.66 | | | | 10.36 | | | | 10.35 | | | | 2.06 | | |
Class C | | | 1,000.00 | | | | 1,000.00 | | | | 1,017.10 | | | | 1,014.66 | | | | 10.36 | | | | 10.35 | | | | 2.06 | | |
Class I | | | 1,000.00 | | | | 1,000.00 | | | | 1,023.40 | | | | 1,020.84 | | | | 4.14 | | | | 4.13 | | | | 0.82 | | |
Class R | | | 1,000.00 | | | | 1,000.00 | | | | 1,019.40 | | | | 1,017.15 | | | | 7.85 | | | | 7.85 | | | | 1.56 | | |
Class R4 | | | 1,000.00 | | | | 1,000.00 | | | | 1,021.90 | | | | 1,019.60 | | | | 5.39 | | | | 5.39 | | | | 1.07 | | |
Class R5 | | | 1,000.00 | | | | 1,000.00 | | | | 1,022.60 | | | | 1,020.44 | | | | 4.54 | | | | 4.53 | | | | 0.90 | | |
Class Y | | | 1,000.00 | | | | 1,000.00 | | | | 1,022.80 | | | | 1,020.69 | | | | 4.29 | | | | 4.28 | | | | 0.85 | | |
Class Z | | | 1,000.00 | | | | 1,000.00 | | | | 1,021.60 | | | | 1,019.65 | | | | 5.34 | | | | 5.34 | | | | 1.06 | | |
Expenses paid during the period are equal to the annualized expense ratio for each class as indicated above, multiplied by the average account value over the period and then multiplied by the number of days in the Fund's most recent fiscal half year and divided by 365.
Expenses do not include fees and expenses incurred indirectly by the Fund from its investment in underlying funds, including affiliated and non-affiliated pooled investment vehicles, such as mutual funds and exchange-traded funds.
Annual Report 2015
7
COLUMBIA SMALL CAP VALUE FUND II
PORTFOLIO OF INVESTMENTS
February 28, 2015
(Percentages represent value of investments compared to net assets)
Common Stocks 95.9%
Issuer | | Shares | | Value ($) | |
CONSUMER DISCRETIONARY 13.6% | |
Auto Components 2.8% | |
American Axle &
Manufacturing Holdings, Inc.(a) | | | 725,000 | | | | 18,067,000 | | |
Tenneco, Inc.(a) | | | 290,000 | | | | 16,889,600 | | |
Tower International, Inc.(a) | | | 465,873 | | | | 12,611,182 | | |
Total | | | | | 47,567,782 | | |
Diversified Consumer Services 1.0% | |
Nord Anglia Education, Inc.(a) | | | 825,000 | | | | 17,663,250 | | |
Hotels, Restaurants & Leisure 3.5% | |
Bloomin' Brands, Inc. | | | 485,000 | | | | 12,493,600 | | |
Dave & Buster's Entertainment, Inc.(a) | | | 290,000 | | | | 9,048,000 | | |
Del Frisco's Restaurant Group, Inc.(a) | | | 300,000 | | | | 6,027,000 | | |
Penn National Gaming, Inc.(a) | | | 523,000 | | | | 8,519,670 | | |
Red Robin Gourmet Burgers, Inc.(a) | | | 130,000 | | | | 10,851,100 | | |
Sonic Corp. | | | 430,000 | | | | 13,669,700 | | |
Total | | | | | 60,609,070 | | |
Household Durables 2.0% | |
Helen of Troy Ltd.(a) | | | 265,000 | | | | 20,304,300 | | |
KB Home | | | 630,011 | | | | 8,788,653 | | |
Ryland Group, Inc. (The) | | | 120,000 | | | | 5,460,000 | | |
Total | | | | | 34,552,953 | | |
Specialty Retail 3.4% | |
American Eagle Outfitters, Inc. | | | 910,000 | | | | 13,622,700 | | |
Children's Place, Inc. (The) | | | 210,000 | | | | 11,967,900 | | |
Christopher & Banks Corp.(a) | | | 595,000 | | | | 2,975,000 | | |
Office Depot, Inc.(a) | | | 830,000 | | | | 7,777,100 | | |
Sonic Automotive, Inc., Class A | | | 400,000 | | | | 9,892,000 | | |
TravelCenters of America LLC(a) | | | 849,118 | | | | 11,590,461 | | |
Total | | | | | 57,825,161 | | |
Textiles, Apparel & Luxury Goods 0.9% | |
Skechers U.S.A., Inc., Class A(a) | | | 240,000 | | | | 16,353,600 | | |
Total Consumer Discretionary | | | | | 234,571,816 | | |
CONSUMER STAPLES 0.8% | |
Food Products 0.8% | |
TreeHouse Foods, Inc.(a) | | | 153,000 | | | | 12,784,680 | | |
Total Consumer Staples | | | | | 12,784,680 | | |
Common Stocks (continued)
Issuer | | Shares | | Value ($) | |
ENERGY 5.4% | |
Energy Equipment & Services 1.5% | |
Helix Energy Solutions Group, Inc.(a) | | | 675,000 | | | | 10,422,000 | | |
Patterson-UTI Energy, Inc. | | | 775,000 | | | | 14,480,875 | | |
Total | | | | | 24,902,875 | | |
Oil, Gas & Consumable Fuels 3.9% | |
Aegean Marine Petroleum Network, Inc. | | | 700,000 | | | | 10,262,000 | | |
Delek U.S. Holdings, Inc. | | | 335,000 | | | | 12,488,800 | | |
Gulfport Energy Corp.(a) | | | 305,000 | | | | 13,972,050 | | |
Matador Resources Co.(a) | | | 440,000 | | | | 9,530,400 | | |
PDC Energy, Inc.(a) | | | 280,000 | | | | 14,470,400 | | |
Teekay Tankers Ltd., Class A | | | 1,150,000 | | | | 6,727,500 | | |
Total | | | | | 67,451,150 | | |
Total Energy | | | | | 92,354,025 | | |
FINANCIALS 34.0% | |
Banks 14.6% | |
Ameris Bancorp | | | 403,000 | | | | 10,546,510 | | |
Bank of the Ozarks, Inc. | | | 244,000 | | | | 8,930,400 | | |
Community Bank System, Inc. | | | 525,000 | | | | 18,648,000 | | |
FirstMerit Corp. | | | 660,000 | | | | 11,979,000 | | |
Hilltop Holdings, Inc.(a) | | | 600,000 | | | | 11,160,000 | | |
Independent Bank Corp. | | | 475,000 | | | | 19,864,500 | | |
PrivateBancorp, Inc. | | | 585,000 | | | | 20,317,050 | | |
Prosperity Bancshares, Inc. | | | 245,000 | | | | 12,673,850 | | |
Renasant Corp. | | | 670,000 | | | | 19,081,600 | | |
Sandy Spring Bancorp, Inc. | | | 575,000 | | | | 14,823,500 | | |
Sterling Bancorp | | | 1,500,000 | | | | 20,580,000 | | |
Umpqua Holdings Corp. | | | 1,020,391 | | | | 16,877,267 | | |
Union Bankshares Corp. | | | 730,000 | | | | 15,965,100 | | |
Western Alliance Bancorp(a) | | | 770,000 | | | | 21,860,300 | | |
Wilshire Bancorp, Inc. | | | 1,352,400 | | | | 12,861,324 | | |
Wintrust Financial Corp. | | | 322,300 | | | | 15,177,107 | | |
Total | | | | | 251,345,508 | | |
Capital Markets 0.6% | |
Medley Capital Corp. | | | 650,000 | | | | 6,149,000 | | |
Triplepoint Venture Growth BDC Corp. | | | 257,353 | | | | 3,826,839 | | |
Total | | | | | 9,975,839 | | |
The accompanying Notes to Financial Statements are an integral part of this statement.
Annual Report 2015
8
COLUMBIA SMALL CAP VALUE FUND II
PORTFOLIO OF INVESTMENTS (continued)
February 28, 2015
Common Stocks (continued)
Issuer | | Shares | | Value ($) | |
Diversified Financial Services 0.6% | |
PHH Corp.(a) | | | 455,000 | | | | 11,047,400 | | |
Insurance 6.5% | |
American Equity Investment
Life Holding Co. | | | 615,000 | | | | 17,521,350 | | |
AMERISAFE, Inc. | | | 480,000 | | | | 19,939,200 | | |
Amtrust Financial Services, Inc. | | | 304,007 | | | | 16,385,977 | | |
Argo Group International Holdings Ltd. | | | 364,630 | | | | 17,469,433 | | |
CNO Financial Group, Inc. | | | 535,000 | | | | 8,699,100 | | |
First American Financial Corp. | | | 390,000 | | | | 13,661,700 | | |
Symetra Financial Corp. | | | 825,000 | | | | 18,628,500 | | |
Total | | | | | 112,305,260 | | |
Real Estate Investment Trusts (REITs) 9.7% | |
American Assets Trust, Inc. | | | 514,950 | | | | 21,123,249 | | |
Brandywine Realty Trust | | | 771,845 | | | | 12,233,744 | | |
Chatham Lodging Trust | | | 312,000 | | | | 9,054,240 | | |
CubeSmart | | | 705,000 | | | | 16,356,000 | | |
First Industrial Realty Trust, Inc. | | | 520,000 | | | | 11,065,600 | | |
Geo Group, Inc. (The) | | | 240,000 | | | | 10,356,000 | | |
Highwoods Properties, Inc. | | | 325,000 | | | | 14,823,250 | | |
Kilroy Realty Corp. | | | 244,000 | | | | 18,048,680 | | |
LaSalle Hotel Properties | | | 435,000 | | | | 16,930,200 | | |
Pennsylvania Real Estate Investment Trust | | | 315,000 | | | | 7,175,700 | | |
QTS Realty Trust Inc., Class A | | | 381,000 | | | | 13,643,610 | | |
RLJ Lodging Trust | | | 490,000 | | | | 15,586,900 | | |
Total | | | | | 166,397,173 | | |
Thrifts & Mortgage Finance 2.0% | |
EverBank Financial Corp. | | | 845,000 | | | | 15,193,100 | | |
MGIC Investment Corp.(a) | | | 810,000 | | | | 7,395,300 | | |
Radian Group, Inc. | | | 800,000 | | | | 12,648,000 | | |
Total | | | | | 35,236,400 | | |
Total Financials | | | | | 586,307,580 | | |
HEALTH CARE 8.7% | |
Health Care Equipment & Supplies 0.8% | |
Globus Medical, Inc., Class A(a) | | | 600,000 | | | | 14,568,000 | | |
Health Care Providers & Services 6.2% | |
Healthways, Inc.(a) | | | 705,032 | | | | 15,778,616 | | |
Kindred Healthcare, Inc. | | | 825,000 | | | | 17,506,500 | | |
LHC Group, Inc.(a) | | | 476,992 | | | | 16,122,330 | | |
Common Stocks (continued)
Issuer | | Shares | | Value ($) | |
LifePoint Hospitals, Inc.(a) | | | 245,000 | | | | 17,630,200 | | |
PharMerica Corp.(a) | | | 700,000 | | | | 17,500,000 | | |
VCA, Inc.(a) | | | 420,000 | | | | 22,377,600 | | |
Total | | | | | 106,915,246 | | |
Health Care Technology 0.6% | |
MedAssets, Inc.(a) | | | 500,000 | | | | 9,605,000 | | |
Pharmaceuticals 1.1% | |
Catalent, Inc.(a) | | | 670,000 | | | | 18,739,900 | | |
Total Health Care | | | | | 149,828,146 | | |
INDUSTRIALS 11.0% | |
Airlines 1.4% | |
Alaska Air Group, Inc. | | | 150,000 | | | | 9,547,500 | | |
JetBlue Airways Corp.(a) | | | 790,000 | | | | 13,580,100 | | |
Total | | | | | 23,127,600 | | |
Commercial Services & Supplies 2.4% | |
Deluxe Corp. | | | 315,000 | | | | 20,963,250 | | |
Steelcase, Inc., Class A | | | 550,000 | | | | 10,296,000 | | |
United Stationers, Inc. | | | 265,000 | | | | 10,703,350 | | |
Total | | | | | 41,962,600 | | |
Construction & Engineering 1.5% | |
EMCOR Group, Inc. | | | 300,000 | | | | 13,209,000 | | |
Tutor Perini Corp.(a) | | | 528,000 | | | | 12,286,560 | | |
Total | | | | | 25,495,560 | | |
Machinery 1.9% | |
Trinity Industries, Inc. | | | 450,000 | | | | 15,129,000 | | |
Wabash National Corp.(a) | | | 1,175,000 | | | | 17,213,750 | | |
Total | | | | | 32,342,750 | | |
Professional Services 1.7% | |
Navigant Consulting, Inc.(a) | | | 273,859 | | | | 3,831,288 | | |
On Assignment, Inc.(a) | | | 433,000 | | | | 16,544,930 | | |
TrueBlue, Inc.(a) | | | 412,192 | | | | 9,484,538 | | |
Total | | | | | 29,860,756 | | |
Road & Rail 1.6% | |
Heartland Express, Inc. | | | 460,000 | | | | 11,578,200 | | |
Swift Transportation Co.(a) | | | 585,000 | | | | 16,543,800 | | |
Total | | | | | 28,122,000 | | |
Trading Companies & Distributors 0.5% | |
Neff Corp. Class A(a)(b) | | | 747,347 | | | | 7,809,776 | | |
Total Industrials | | | | | 188,721,042 | | |
The accompanying Notes to Financial Statements are an integral part of this statement.
Annual Report 2015
9
COLUMBIA SMALL CAP VALUE FUND II
PORTFOLIO OF INVESTMENTS (continued)
February 28, 2015
Common Stocks (continued)
Issuer | | Shares | | Value ($) | |
INFORMATION TECHNOLOGY 9.7% | |
Electronic Equipment, Instruments & Components 0.9% | |
II-VI, Inc.(a) | | | 96,072 | | | | 1,680,299 | | |
Rogers Corp.(a) | | | 175,000 | | | | 13,699,000 | | |
Total | | | | | 15,379,299 | | |
Internet Software & Services 0.9% | |
Endurance International Group
Holdings, Inc.(a) | | | 846,162 | | | | 15,755,536 | | |
IT Services 0.5% | |
Unisys Corp.(a) | | | 350,000 | | | | 7,924,000 | | |
Semiconductors & Semiconductor Equipment 5.9% | |
Fairchild Semiconductor
International, Inc.(a) | | | 775,000 | | | | 13,516,000 | | |
Integrated Device Technology, Inc.(a) | | | 785,000 | | | | 16,202,400 | | |
Integrated Silicon Solution | | | 800,000 | | | | 13,152,000 | | |
IXYS Corp. | | | 1,005,000 | | | | 12,029,850 | | |
Kulicke & Soffa Industries, Inc.(a) | | | 1,165,000 | | | | 18,640,000 | | |
Micrel, Inc. | | | 917,732 | | | | 13,701,739 | | |
SunEdison, Inc.(a) | | | 630,000 | | | | 13,948,200 | | |
Total | | | | | 101,190,189 | | |
Software 0.9% | |
Mentor Graphics Corp. | | | 700,000 | | | | 16,422,000 | | |
Technology Hardware, Storage & Peripherals 0.6% | |
Super Micro Computer, Inc.(a) | | | 282,000 | | | | 11,330,760 | | |
Total Information Technology | | | | | 168,001,784 | | |
MATERIALS 7.2% | |
Chemicals 1.4% | |
Axiall Corp. | | | 315,000 | | | | 14,587,650 | | |
Orion Engineered Carbons SA | | | 601,742 | | | | 9,904,673 | | |
Total | | | | | 24,492,323 | | |
Metals & Mining 2.3% | |
AK Steel Holding Corp.(a) | | | 1,250,000 | | | | 5,525,000 | | |
Carpenter Technology Corp. | | | 180,000 | | | | 7,624,800 | | |
Constellium NV(a) | | | 630,000 | | | | 11,913,300 | | |
Materion Corp. | | | 397,300 | | | | 14,549,126 | | |
Total | | | | | 39,612,226 | | |
Common Stocks (continued)
Issuer | | Shares | | Value ($) | |
Paper & Forest Products 3.5% | |
Boise Cascade Co.(a) | | | 385,000 | | | | 13,709,850 | | |
Clearwater Paper Corp.(a) | | | 211,267 | | | | 12,899,963 | | |
KapStone Paper and Packaging Corp. | | | 410,000 | | | | 14,128,600 | | |
Neenah Paper, Inc. | | | 330,000 | | | | 19,938,600 | | |
Total | | | | | 60,677,013 | | |
Total Materials | | | | | 124,781,562 | | |
UTILITIES 5.5% | |
Electric Utilities 1.2% | |
UIL Holdings Corp. | | | 419,000 | | | | 21,180,450 | | |
Gas Utilities 2.6% | |
New Jersey Resources Corp. | | | 290,000 | | | | 18,148,200 | | |
South Jersey Industries, Inc. | | | 260,615 | | | | 14,771,658 | | |
Southwest Gas Corp. | | | 210,000 | | | | 12,024,600 | | |
Total | | | | | 44,944,458 | | |
Independent Power and Renewable Electricity Producers 0.7% | |
Dynegy, Inc.(a) | | | 280,000 | | | | 7,803,600 | | |
TerraForm Power, Inc., Class A | | | 113,981 | | | | 3,958,560 | | |
Total | | | | | 11,762,160 | | |
Multi-Utilities 1.0% | |
Avista Corp. | | | 515,000 | | | | 17,561,500 | | |
Total Utilities | | | | | 95,448,568 | | |
Total Common Stocks
(Cost: $1,134,596,776) | | | | | 1,652,799,203 | | |
Money Market Funds 3.9%
| | | Shares | | Value ($) | |
Columbia Short-Term Cash Fund,
0.118%(b)(c) | | | 67,987,849 | | | | 67,987,849 | | |
Total Money Market Funds
(Cost: $67,987,849) | | | | | 67,987,849 | | |
Total Investments
(Cost: $1,202,584,625) | | | | | 1,720,787,052 | | |
Other Assets & Liabilities, Net | | | | | 4,221,456 | | |
Net Assets | | | | | 1,725,008,508 | | |
The accompanying Notes to Financial Statements are an integral part of this statement.
Annual Report 2015
10
COLUMBIA SMALL CAP VALUE FUND II
PORTFOLIO OF INVESTMENTS (continued)
February 28, 2015
Notes to Portfolio of Investments
(a) Non-income producing.
(b) As defined in the Investment Company Act of 1940, an affiliated company is one in which the Fund owns 5% or more of the company's outstanding voting securities, or a company which is under common ownership or control with the Fund. Holdings and transactions in these affiliated companies during the year ended February 28, 2015, are as follows:
Issuer | | Beginning
Cost ($) | | Purchase
Cost ($) | | Proceeds
From Sales ($) | | Ending
Cost ($) | | Dividends —
Affiliated
Issuers ($) | | Value ($) | |
Columbia Short-Term Cash Fund | | | 83,929,960 | | | | 462,318,941 | | | | (478,261,052 | ) | | | 67,987,849 | | | | 57,806 | | | | 67,987,849 | | |
Neff Corp. Class A* | | | — | | | | 11,210,205 | | | | — | | | | 11,210,205 | | | | — | | | | 7,809,776 | | |
Total | | | 83,929,960 | | | | 473,529,146 | | | | (478,261,052 | ) | | | 79,198,054 | | | | 57,806 | | | | 75,797,625 | | |
*Issuer was not an affiliate for the entire period ended February 28, 2015.
(c) The rate shown is the seven-day current annualized yield at February 28, 2015.
Fair Value Measurements
Generally accepted accounting principles (GAAP) require disclosure regarding the inputs and valuation techniques used to measure fair value and any changes in valuation inputs or techniques. In addition, investments shall be disclosed by major category.
The Fund categorizes its fair value measurements according to a three-level hierarchy that maximizes the use of observable inputs and minimizes the use of unobservable inputs by prioritizing that the most observable input be used when available. Observable inputs are those that market participants would use in pricing an investment based on market data obtained from sources independent of the reporting entity. Unobservable inputs are those that reflect the Fund's assumptions about the information market participants would use in pricing an investment. An investment's level within the fair value hierarchy is based on the lowest level of any input that is deemed significant to the asset or liability's fair value measurement. The input levels are not necessarily an indication of the risk or liquidity associated with investments at that level. For example, certain U.S. government securities are generally high quality and liquid, however, they are reflected as Level 2 because the inputs used to determine fair value may not always be quoted prices in an active market.
Fair value inputs are summarized in the three broad levels listed below:
> Level 1 — Valuations based on quoted prices for investments in active markets that the Fund has the ability to access at the measurement date (including NAV for open-end mutual funds). Valuation adjustments are not applied to Level 1 investments.
> Level 2 — Valuations based on other significant observable inputs (including quoted prices for similar securities, interest rates, prepayment speeds, credit risks, etc.).
> Level 3 — Valuations based on significant unobservable inputs (including the Fund's own assumptions and judgment in determining the fair value of investments).
Inputs that are used in determining fair value of an investment may include price information, credit data, volatility statistics, and other factors. These inputs can be either observable or unobservable. The availability of observable inputs can vary between investments, and is affected by various factors such as the type of investment, and the volume and level of activity for that investment or similar investments in the marketplace. The inputs will be considered by the Investment Manager, along with any other relevant factors in the calculation of an investment's fair value. The Fund uses prices and inputs that are current as of the measurement date, which may include periods of market dislocations. During these periods, the availability of prices and inputs may be reduced for many investments. This condition could cause an investment to be reclassified between the various levels within the hierarchy.
Investments falling into the Level 3 category are primarily supported by quoted prices from brokers and dealers participating in the market for those investments. However, these may be classified as Level 3 investments due to lack of market transparency and corroboration to support these quoted prices. Additionally, valuation models may be used as the pricing source for any remaining investments classified as Level 3. These models may rely on one or more significant unobservable inputs and/or significant assumptions by the Investment Manager. Inputs used in valuations may include, but are not limited to, financial statement analysis, capital account balances, discount rates and estimated cash flows, and comparable company data.
Under the direction of the Fund's Board of Trustees (the Board), the Investment Manager's Valuation Committee (the Committee) is responsible for overseeing the valuation procedures approved by the Board. The Committee consists of voting and non-voting members from various groups within the Investment Manager's organization, including operations and accounting, trading and investments, compliance, risk management and legal.
The accompanying Notes to Financial Statements are an integral part of this statement.
Annual Report 2015
11
COLUMBIA SMALL CAP VALUE FUND II
PORTFOLIO OF INVESTMENTS (continued)
February 28, 2015
Fair Value Measurements (continued)
The Committee meets at least monthly to review and approve valuation matters, which may include a description of specific valuation determinations, data regarding pricing information received from approved pricing vendors and brokers and the results of Board-approved valuation control policies and procedures (the Policies). The Policies address, among other things, instances when market quotations are or are not readily available, including recommendations of third party pricing vendors and a determination of appropriate pricing methodologies; events that require specific valuation determinations and assessment of fair value techniques; securities with a potential for stale pricing, including those that are illiquid, restricted, or in default; and the effectiveness of third party pricing vendors, including periodic reviews of vendors. The Committee meets more frequently, as needed, to discuss additional valuation matters, which may include the need to review back-testing results, review time-sensitive information or approve related valuation actions. The Committee reports to the Board, with members of the Committee meeting with the Board at each of its regularly scheduled meetings to discuss valuation matters and actions during the period, similar to those described earlier.
For investments categorized as Level 3, the Committee monitors information similar to that described above, which may include: (i) data specific to the issuer or comparable issuers, (ii) general market or specific sector news and (iii) quoted prices and specific or similar security transactions. The Committee considers this data and any changes from prior periods in order to assess the reasonableness of observable and unobservable inputs, any assumptions or internal models used to value those securities and changes in fair value. This data is also used to corroborate, when available, information received from approved pricing vendors and brokers. Various factors impact the frequency of monitoring this information (which may occur as often as daily). However, the Committee may determine that changes to inputs, assumptions and models are not required as a result of the monitoring procedures performed.
The following table is a summary of the inputs used to value the Fund's investments at February 28, 2015:
Description | | Level 1
Quoted Prices in Active
Markets for Identical
Assets ($) | | Level 2
Other Significant
Observable Inputs ($) | | Level 3
Significant
Unobservable Inputs ($) | | Total ($) | |
Equity Securities | |
Common Stocks | |
Consumer Discretionary | | | 234,571,816 | | | | — | | | | — | | | | 234,571,816 | | |
Consumer Staples | | | 12,784,680 | | | | — | | | | — | | | | 12,784,680 | | |
Energy | | | 92,354,025 | | | | — | | | | — | | | | 92,354,025 | | |
Financials | | | 586,307,580 | | | | — | | | | — | | | | 586,307,580 | | |
Health Care | | | 149,828,146 | | | | — | | | | — | | | | 149,828,146 | | |
Industrials | | | 188,721,042 | | | | — | | | | — | | | | 188,721,042 | | |
Information Technology | | | 168,001,784 | | | | — | | | | — | | | | 168,001,784 | | |
Materials | | | 124,781,562 | | | | — | | | | — | | | | 124,781,562 | | |
Utilities | | | 95,448,568 | | | | — | | | | — | | | | 95,448,568 | | |
Total Equity Securities | | | 1,652,799,203 | | | | — | | | | — | | | | 1,652,799,203 | | |
Mutual Funds | |
Money Market Funds | | | 67,987,849 | | | | — | | | | — | | | | 67,987,849 | | |
Total Mutual Funds | | | 67,987,849 | | | | — | | | | — | | | | 67,987,849 | | |
Total | | | 1,720,787,052 | | | | — | | | | — | | | | 1,720,787,052 | | |
See the Portfolio of Investments for all investment classifications not indicated in the table.
There were no transfers of financial assets between levels during the period.
The accompanying Notes to Financial Statements are an integral part of this statement.
Annual Report 2015
12
COLUMBIA SMALL CAP VALUE FUND II
STATEMENT OF ASSETS AND LIABILITIES
February 28, 2015
Assets | |
Investments, at value | |
Unaffiliated issuers (identified cost $1,123,386,571) | | $ | 1,644,989,427 | | |
Affiliated issuers (identified cost $79,198,054) | | | 75,797,625 | | |
Total investments (identified cost $1,202,584,625) | | | 1,720,787,052 | | |
Receivable for: | |
Investments sold | | | 9,198,047 | | |
Capital shares sold | | | 2,013,216 | | |
Dividends | | | 1,217,343 | | |
Prepaid expenses | | | 3,858 | | |
Total assets | | | 1,733,219,516 | | |
Liabilities | |
Payable for: | |
Investments purchased | | | 4,804,851 | | |
Capital shares purchased | | | 2,731,894 | | |
Investment management fees | | | 35,144 | | |
Distribution and/or service fees | | | 2,477 | | |
Transfer agent fees | | | 432,269 | | |
Administration fees | | | 3,535 | | |
Compensation of board members | | | 111,787 | | |
Other expenses | | | 89,051 | | |
Total liabilities | | | 8,211,008 | | |
Net assets applicable to outstanding capital stock | | $ | 1,725,008,508 | | |
Represented by | |
Paid-in capital | | $ | 1,187,758,612 | | |
Excess of distributions over net investment income | | | (893,562 | ) | |
Accumulated net realized gain | | | 19,941,031 | | |
Unrealized appreciation (depreciation) on: | |
Investments — unaffiliated issuers | | | 521,602,856 | | |
Investments — affiliated issuers | | | (3,400,429 | ) | |
Total — representing net assets applicable to outstanding capital stock | | $ | 1,725,008,508 | | |
The accompanying Notes to Financial Statements are an integral part of this statement.
Annual Report 2015
13
COLUMBIA SMALL CAP VALUE FUND II
STATEMENT OF ASSETS AND LIABILITIES (continued)
February 28, 2015
Class A | |
Net assets | | $ | 263,946,353 | | |
Shares outstanding | | | 14,995,001 | | |
Net asset value per share | | $ | 17.60 | | |
Maximum offering price per share(a) | | $ | 18.67 | | |
Class B | |
Net assets | | $ | 1,101,834 | | |
Shares outstanding | | | 67,768 | | |
Net asset value per share | | $ | 16.26 | | |
Class C | |
Net assets | | $ | 14,949,103 | | |
Shares outstanding | | | 920,213 | | |
Net asset value per share | | $ | 16.25 | | |
Class I | |
Net assets | | $ | 2,493 | | |
Shares outstanding | | | 140 | | |
Net asset value per share(b) | | $ | 17.80 | | |
Class R | |
Net assets | | $ | 14,593,898 | | |
Shares outstanding | | | 835,503 | | |
Net asset value per share | | $ | 17.47 | | |
Class R4 | |
Net assets | | $ | 30,000,381 | | |
Shares outstanding | | | 1,659,562 | | |
Net asset value per share | | $ | 18.08 | | |
Class R5 | |
Net assets | | $ | 14,348,527 | | |
Shares outstanding | | | 793,387 | | |
Net asset value per share | | $ | 18.09 | | |
Class Y | |
Net assets | | $ | 112,949,222 | | |
Shares outstanding | | | 6,232,317 | | |
Net asset value per share | | $ | 18.12 | | |
Class Z | |
Net assets | | $ | 1,273,116,697 | | |
Shares outstanding | | | 71,610,323 | | |
Net asset value per share | | $ | 17.78 | | |
(a) The maximum offering price per share is calculated by dividing the net asset value per share by 1.0 minus the maximum sales charge of 5.75%.
(b) Net asset value per share rounds to this amount due to fractional shares outstanding.
The accompanying Notes to Financial Statements are an integral part of this statement.
Annual Report 2015
14
COLUMBIA SMALL CAP VALUE FUND II
STATEMENT OF OPERATIONS
Year Ended February 28, 2015
Net investment income | |
Income: | |
Dividends — unaffiliated issuers | | $ | 24,726,343 | | |
Dividends — affiliated issuers | | | 57,806 | | |
Foreign taxes withheld | | | (92,086 | ) | |
Total income | | | 24,692,063 | | |
Expenses: | |
Investment management fees | | | 13,008,314 | | |
Distribution and/or service fees | |
Class A | | | 695,595 | | |
Class B | | | 14,695 | | |
Class C | | | 157,710 | | |
Class R | | | 78,022 | | |
Transfer agent fees | |
Class A | | | 573,708 | | |
Class B | | | 3,011 | | |
Class C | | | 32,509 | | |
Class R | | | 32,168 | | |
Class R4 | | | 33,319 | | |
Class R5 | | | 6,488 | | |
Class Z | | | 2,748,147 | | |
Administration fees | | | 1,308,311 | | |
Compensation of board members | | | 41,037 | | |
Custodian fees | | | 16,935 | | |
Printing and postage fees | | | 161,766 | | |
Registration fees | | | 182,168 | | |
Professional fees | | | 46,965 | | |
Other | | | 30,010 | | |
Total expenses | | | 19,170,878 | | |
Expense reductions | | | (60 | ) | |
Total net expenses | | | 19,170,818 | | |
Net investment income | | | 5,521,245 | | |
Realized and unrealized gain (loss) — net | |
Net realized gain (loss) on: | |
Investments — unaffiliated | | | 125,520,128 | | |
Net realized gain | | | 125,520,128 | | |
Net change in unrealized appreciation (depreciation) on: | |
Investments — unaffiliated issuers | | | (49,511,878 | ) | |
Investments — affiliated issuers | | | (11,064,798 | ) | |
Net change in unrealized depreciation | | | (60,576,676 | ) | |
Net realized and unrealized gain | | | 64,943,452 | | |
Net increase in net assets resulting from operations | | $ | 70,464,697 | | |
The accompanying Notes to Financial Statements are an integral part of this statement.
Annual Report 2015
15
COLUMBIA SMALL CAP VALUE FUND II
STATEMENT OF CHANGES IN NET ASSETS
| | | Year Ended
February 28,
2015 | | Year Ended
February 28,
2014 | |
Operations | |
Net investment income | | $ | 5,521,245 | | | $ | 6,013,108 | | |
Net realized gain | | | 125,520,128 | | | | 199,561,689 | | |
Net change in unrealized appreciation (depreciation) | | | (60,576,676 | ) | | | 226,989,382 | | |
Net increase in net assets resulting from operations | | | 70,464,697 | | | | 432,564,179 | | |
Distributions to shareholders | |
Net investment income | |
Class A | | | (539,877 | ) | | | (772,853 | ) | |
Class I | | | (15 | ) | | | (137,910 | ) | |
Class R | | | — | | | | (7,309 | ) | |
Class R4 | | | (59,418 | ) | | | (19,625 | ) | |
Class R5 | | | (54,734 | ) | | | (63,189 | ) | |
Class Y | | | (590,262 | ) | | | (159,364 | ) | |
Class Z | | | (5,155,947 | ) | | | (6,696,389 | ) | |
Net realized gains | |
Class A | | | (25,694,119 | ) | | | (30,871,667 | ) | |
Class B | | | (137,539 | ) | | | (230,154 | ) | |
Class C | | | (1,552,055 | ) | | | (1,931,099 | ) | |
Class I | | | (238 | ) | | | (2,250,183 | ) | |
Class R | | | (1,464,482 | ) | | | (1,886,129 | ) | |
Class R4 | | | (1,295,660 | ) | | | (397,295 | ) | |
Class R5 | | | (1,125,155 | ) | | | (951,945 | ) | |
Class Y | | | (9,112,109 | ) | | | (2,319,283 | ) | |
Class Z | | | (120,218,261 | ) | | | (143,847,332 | ) | |
Total distributions to shareholders | | | (166,999,871 | ) | | | (192,541,726 | ) | |
Increase (decrease) in net assets from capital stock activity | | | (11,341,529 | ) | | | 138,145,001 | | |
Total increase (decrease) in net assets | | | (107,876,703 | ) | | | 378,167,454 | | |
Net assets at beginning of year | | | 1,832,885,211 | | | | 1,454,717,757 | | |
Net assets at end of year | | $ | 1,725,008,508 | | | $ | 1,832,885,211 | | |
Excess of distributions over net investment income | | $ | (893,562 | ) | | $ | (187,836 | ) | |
The accompanying Notes to Financial Statements are an integral part of this statement.
Annual Report 2015
16
COLUMBIA SMALL CAP VALUE FUND II
STATEMENT OF CHANGES IN NET ASSETS (continued)
| | | Year Ended February 28, 2015 | | Year Ended February 28, 2014 | |
| | | Shares | | Dollars ($) | | Shares | | Dollars ($) | |
Capital stock activity | |
Class A shares | |
Subscriptions(a) | | | 2,964,697 | | | | 53,088,142 | | | | 3,350,865 | | | | 59,374,596 | | |
Distributions reinvested | | | 1,377,419 | | | | 24,272,637 | | | | 1,669,672 | | | | 29,134,466 | | |
Redemptions | | | (5,451,104 | ) | | | (97,249,654 | ) | | | (4,912,107 | ) | | | (86,857,688 | ) | |
Net increase (decrease) | | | (1,108,988 | ) | | | (19,888,875 | ) | | | 108,430 | | | | 1,651,374 | | |
Class B shares | |
Subscriptions | | | 490 | | | | 8,099 | | | | 1,987 | | | | 33,053 | | |
Distributions reinvested | | | 7,770 | | | | 127,319 | | | | 12,425 | | | | 203,173 | | |
Redemptions(a) | | | (54,010 | ) | | | (900,885 | ) | | | (32,999 | ) | | | (554,894 | ) | |
Net decrease | | | (45,750 | ) | | | (765,467 | ) | | | (18,587 | ) | | | (318,668 | ) | |
Class C shares | |
Subscriptions | | | 28,441 | | | | 465,157 | | | | 40,256 | | | | 665,156 | | |
Distributions reinvested | | | 75,895 | | | | 1,240,581 | | | | 93,176 | | | | 1,524,897 | | |
Redemptions | | | (172,906 | ) | | | (2,878,072 | ) | | | (209,464 | ) | | | (3,463,672 | ) | |
Net decrease | | | (68,570 | ) | | | (1,172,334 | ) | | | (76,032 | ) | | | (1,273,619 | ) | |
Class I shares | |
Subscriptions | | | — | | | | — | | | | 714 | | | | 12,900 | | |
Distributions reinvested | | | — | | | | — | | | | 136,300 | | | | 2,387,632 | | |
Redemptions | | | (73 | ) | | | (1,400 | ) | | | (1,598,905 | ) | | | (28,593,218 | ) | |
Net decrease | | | (73 | ) | | | (1,400 | ) | | | (1,461,891 | ) | | | (26,192,686 | ) | |
Class R shares | |
Subscriptions | | | 178,767 | | | | 3,198,034 | | | | 420,127 | | | | 7,314,617 | | |
Distributions reinvested | | | 81,342 | | | | 1,424,081 | | | | 105,963 | | | | 1,840,003 | | |
Redemptions | | | (375,399 | ) | | | (6,709,725 | ) | | | (540,183 | ) | | | (9,451,987 | ) | |
Net decrease | | | (115,290 | ) | | | (2,087,610 | ) | | | (14,093 | ) | | | (297,367 | ) | |
Class R4 shares | |
Subscriptions | | | 1,225,333 | | | | 21,871,853 | | | | 793,382 | | | | 14,656,637 | | |
Distributions reinvested | | | 75,062 | | | | 1,354,842 | | | | 22,982 | | | | 416,552 | | |
Redemptions | | | (400,370 | ) | | | (7,454,528 | ) | | | (57,000 | ) | | | (1,052,317 | ) | |
Net increase | | | 900,025 | | | | 15,772,167 | | | | 759,364 | | | | 14,020,872 | | |
Class R5 shares | |
Subscriptions | | | 559,707 | | | | 10,173,911 | | | | 910,789 | | | | 16,791,439 | | |
Distributions reinvested | | | 64,823 | | | | 1,179,488 | | | | 55,719 | | | | 1,014,761 | | |
Redemptions | | | (651,459 | ) | | | (11,904,578 | ) | | | (146,365 | ) | | | (2,719,235 | ) | |
Net increase (decrease) | | | (26,929 | ) | | | (551,179 | ) | | | 820,143 | | | | 15,086,965 | | |
The accompanying Notes to Financial Statements are an integral part of this statement.
Annual Report 2015
17
COLUMBIA SMALL CAP VALUE FUND II
STATEMENT OF CHANGES IN NET ASSETS (continued)
| | | Year Ended February 28, 2015 | | Year Ended February 28, 2014 | |
| | | Shares | | Dollars ($) | | Shares | | Dollars ($) | |
Capital stock activity (continued) | |
Class Y shares | |
Subscriptions | | | 5,572,228 | | | | 104,647,166 | | | | 1,469,600 | | | | 26,399,166 | | |
Distributions reinvested | | | 483,734 | | | | 8,734,940 | | | | 136,883 | | | | 2,478,272 | | |
Redemptions | | | (1,287,603 | ) | | | (23,759,971 | ) | | | (142,698 | ) | | | (2,621,939 | ) | |
Net increase | | | 4,768,359 | | | | 89,622,135 | | | | 1,463,785 | | | | 26,255,499 | | |
Class Z shares | |
Subscriptions | | | 14,679,412 | | | | 266,602,507 | | | | 20,042,772 | | | | 357,941,722 | | |
Distributions reinvested | | | 5,745,785 | | | | 102,247,406 | | | | 6,936,755 | | | | 122,130,226 | | |
Redemptions | | | (25,427,789 | ) | | | (461,118,879 | ) | | | (20,784,037 | ) | | | (370,859,317 | ) | |
Net increase (decrease) | | | (5,002,592 | ) | | | (92,268,966 | ) | | | 6,195,490 | | | | 109,212,631 | | |
Total net increase (decrease) | | | (699,808 | ) | | | (11,341,529 | ) | | | 7,776,609 | | | | 138,145,001 | | |
(a) Includes conversions of Class B shares to Class A shares, if any.
The accompanying Notes to Financial Statements are an integral part of this statement.
Annual Report 2015
18
COLUMBIA SMALL CAP VALUE FUND II
The following tables are intended to help you understand the Fund's financial performance. Certain information reflects financial results for a single share of a class held for the periods shown. Per share net investment income (loss) amounts are calculated based on average shares outstanding during the period. Total return assumes reinvestment of all dividends and distributions, if any. Total return does not reflect payment of sales charges, if any. Total return and portfolio turnover are not annualized for periods of less than one year. The portfolio turnover rate is calculated without regard to purchase and sales transactions of short-term instruments and certain derivatives, if any. If such transactions were included, the Fund's portfolio turnover rate may be higher.
| | | Year Ended February 28, | | Year Ended
February 29, | | Year Ended
February 28, | |
Class A | | 2015 | | 2014 | | 2013 | | 2012 | | 2011 | |
Per share data | |
Net asset value, beginning of period | | $ | 18.61 | | | $ | 16.07 | | | $ | 14.44 | | | $ | 14.77 | | | $ | 11.05 | | |
Income from investment operations: | |
Net investment income | | | 0.02 | | | | 0.03 | | | | 0.11 | | | | 0.02 | | | | 0.00 | (a) | |
Net realized and unrealized gain (loss) | | | 0.71 | | | | 4.59 | | | | 1.96 | | | | (0.33 | ) | | | 3.74 | | |
Total from investment operations | | | 0.73 | | | | 4.62 | | | | 2.07 | | | | (0.31 | ) | | | 3.74 | | |
Less distributions to shareholders: | |
Net investment income | | | (0.04 | ) | | | (0.05 | ) | | | (0.12 | ) | | | (0.02 | ) | | | (0.02 | ) | |
Net realized gains | | | (1.70 | ) | | | (2.03 | ) | | | (0.32 | ) | | | — | | | | — | | |
Total distributions to shareholders | | | (1.74 | ) | | | (2.08 | ) | | | (0.44 | ) | | | (0.02 | ) | | | (0.02 | ) | |
Net asset value, end of period | | $ | 17.60 | | | $ | 18.61 | | | $ | 16.07 | | | $ | 14.44 | | | $ | 14.77 | | |
Total return | | | 4.10 | % | | | 29.93 | % | | | 14.70 | % | | | (2.08 | %) | | | 33.89 | % | |
Ratios to average net assets(b) | |
Total gross expenses | | | 1.30 | % | | | 1.29 | % | | | 1.33 | % | | | 1.37 | % | | | 1.36 | % | |
Total net expenses(c) | | | 1.30 | %(d) | | | 1.29 | %(d) | | | 1.31 | %(d) | | | 1.31 | %(d) | | | 1.35 | %(d) | |
Net investment income (loss) | | | 0.11 | % | | | 0.17 | % | | | 0.76 | % | | | 0.15 | % | | | (0.01 | %) | |
Supplemental data | |
Net assets, end of period (in thousands) | | $ | 263,946 | | | $ | 299,725 | | | $ | 257,083 | | | $ | 525,941 | | | $ | 565,730 | | |
Portfolio turnover | | | 38 | % | | | 36 | % | | | 42 | % | | | 41 | % | | | 60 | % | |
Notes to Financial Highlights
(a) Rounds to zero.
(b) In addition to the fees and expenses that the Fund bears directly, the Fund indirectly bears a pro rata share of the fees and expenses of any other funds in which it invests. Such indirect expenses are not included in the Fund's reported expense ratios.
(c) Total net expenses include the impact of certain fee waivers/expense reimbursements made by the Investment Manager and certain of its affiliates, if applicable.
(d) The benefits derived from expense reductions had an impact of less than 0.01%.
The accompanying Notes to Financial Statements are an integral part of this statement.
Annual Report 2015
19
COLUMBIA SMALL CAP VALUE FUND II
FINANCIAL HIGHLIGHTS (continued)
| | | Year Ended February 28, | | Year Ended
February 29, | | Year Ended
February 28, | |
Class B | | 2015 | | 2014 | | 2013 | | 2012 | | 2011 | |
Per share data | |
Net asset value, beginning of period | | $ | 17.41 | | | $ | 15.22 | | | $ | 13.70 | | | $ | 14.10 | | | $ | 10.61 | | |
Income from investment operations: | |
Net investment income (loss) | | | (0.11 | ) | | | (0.10 | ) | | | 0.00 | (a) | | | (0.08 | ) | | | (0.09 | ) | |
Net realized and unrealized gain (loss) | | | 0.66 | | | | 4.32 | | | | 1.87 | | | | (0.32 | ) | | | 3.58 | | |
Total from investment operations | | | 0.55 | | | | 4.22 | | | | 1.87 | | | | (0.40 | ) | | | 3.49 | | |
Less distributions to shareholders: | |
Net investment income | | | — | | | | — | | | | (0.03 | ) | | | — | | | | — | | |
Net realized gains | | | (1.70 | ) | | | (2.03 | ) | | | (0.32 | ) | | | — | | | | — | | |
Total distributions to shareholders | | | (1.70 | ) | | | (2.03 | ) | | | (0.35 | ) | | | — | | | | — | | |
Net asset value, end of period | | $ | 16.26 | | | $ | 17.41 | | | $ | 15.22 | | | $ | 13.70 | | | $ | 14.10 | | |
Total return | | | 3.34 | % | | | 28.91 | % | | | 13.94 | % | | | (2.84 | %) | | | 32.89 | % | |
Ratios to average net assets(b) | |
Total gross expenses | | | 2.04 | % | | | 2.04 | % | | | 2.08 | % | | | 2.10 | % | | | 2.11 | % | |
Total net expenses(c) | | | 2.04 | %(d) | | | 2.04 | %(d) | | | 2.06 | %(d) | | | 2.05 | %(d) | | | 2.10 | %(d) | |
Net investment income (loss) | | | (0.65 | %) | | | (0.57 | %) | | | 0.01 | % | | | (0.62 | %) | | | (0.77 | %) | |
Supplemental data | |
Net assets, end of period (in thousands) | | $ | 1,102 | | | $ | 1,977 | | | $ | 2,010 | | | $ | 2,337 | | | $ | 3,093 | | |
Portfolio turnover | | | 38 | % | | | 36 | % | | | 42 | % | | | 41 | % | | | 60 | % | |
Notes to Financial Highlights
(a) Rounds to zero.
(b) In addition to the fees and expenses that the Fund bears directly, the Fund indirectly bears a pro rata share of the fees and expenses of any other funds in which it invests. Such indirect expenses are not included in the Fund's reported expense ratios.
(c) Total net expenses include the impact of certain fee waivers/expense reimbursements made by the Investment Manager and certain of its affiliates, if applicable.
(d) The benefits derived from expense reductions had an impact of less than 0.01%.
The accompanying Notes to Financial Statements are an integral part of this statement.
Annual Report 2015
20
COLUMBIA SMALL CAP VALUE FUND II
FINANCIAL HIGHLIGHTS (continued)
| | | Year Ended February 28, | | Year Ended
February 29, | | Year Ended
February 28, | |
Class C | | 2015 | | 2014 | | 2013 | | 2012 | | 2011 | |
Per share data | |
Net asset value, beginning of period | | $ | 17.40 | | | $ | 15.20 | | | $ | 13.69 | | | $ | 14.09 | | | $ | 10.60 | | |
Income from investment operations: | |
Net investment income (loss) | | | (0.11 | ) | | | (0.10 | ) | | | (0.00 | )(a) | | | (0.08 | ) | | | (0.09 | ) | |
Net realized and unrealized gain (loss) | | | 0.66 | | | | 4.33 | | | | 1.86 | | | | (0.32 | ) | | | 3.58 | | |
Total from investment operations | | | 0.55 | | | | 4.23 | | | | 1.86 | | | | (0.40 | ) | | | 3.49 | | |
Less distributions to shareholders: | |
Net investment income | | | — | | | | — | | | | (0.03 | ) | | | — | | | | — | | |
Net realized gains | | | (1.70 | ) | | | (2.03 | ) | | | (0.32 | ) | | | — | | | | — | | |
Total distributions to shareholders | | | (1.70 | ) | | | (2.03 | ) | | | (0.35 | ) | | | — | | | | — | | |
Net asset value, end of period | | $ | 16.25 | | | $ | 17.40 | | | $ | 15.20 | | | $ | 13.69 | | | $ | 14.09 | | |
Total return | | | 3.34 | % | | | 29.02 | % | | | 13.87 | % | | | (2.84 | %) | | | 32.92 | % | |
Ratios to average net assets(b) | |
Total gross expenses | | | 2.05 | % | | | 2.04 | % | | | 2.08 | % | | | 2.10 | % | | | 2.11 | % | |
Total net expenses(c) | | | 2.05 | %(d) | | | 2.04 | %(d) | | | 2.06 | %(d) | | | 2.06 | %(d) | | | 2.10 | %(d) | |
Net investment income (loss) | | | (0.64 | %) | | | (0.58 | %) | | | (0.00 | %)(a) | | | (0.62 | %) | | | (0.77 | %) | |
Supplemental data | |
Net assets, end of period (in thousands) | | $ | 14,949 | | | $ | 17,203 | | | $ | 16,190 | | | $ | 18,191 | | | $ | 23,321 | | |
Portfolio turnover | | | 38 | % | | | 36 | % | | | 42 | % | | | 41 | % | | | 60 | % | |
Notes to Financial Highlights
(a) Rounds to zero.
(b) In addition to the fees and expenses that the Fund bears directly, the Fund indirectly bears a pro rata share of the fees and expenses of any other funds in which it invests. Such indirect expenses are not included in the Fund's reported expense ratios.
(c) Total net expenses include the impact of certain fee waivers/expense reimbursements made by the Investment Manager and certain of its affiliates, if applicable.
(d) The benefits derived from expense reductions had an impact of less than 0.01%.
The accompanying Notes to Financial Statements are an integral part of this statement.
Annual Report 2015
21
COLUMBIA SMALL CAP VALUE FUND II
FINANCIAL HIGHLIGHTS (continued)
| | | Year Ended February 28, | | Year Ended
February 29, | | Year Ended
February 28, | |
Class I | | 2015 | | 2014 | | 2013 | | 2012 | | 2011(a) | |
Per share data | |
Net asset value, beginning of period | | $ | 18.78 | | | $ | 16.20 | | | $ | 14.54 | | | $ | 14.87 | | | $ | 11.72 | | |
Income from investment operations: | |
Net investment income (loss) | | | 0.11 | | | | 0.11 | | | | 0.17 | | | | 0.07 | | | | (0.01 | ) | |
Net realized and unrealized gain (loss) | | | 0.72 | | | | 4.63 | | | | 1.99 | | | | (0.32 | ) | | | 3.23 | | |
Total from investment operations | | | 0.83 | | | | 4.74 | | | | 2.16 | | | | (0.25 | ) | | | 3.22 | | |
Less distributions to shareholders: | |
Net investment income | | | (0.11 | ) | | | (0.13 | ) | | | (0.18 | ) | | | (0.08 | ) | | | (0.07 | ) | |
Net realized gains | | | (1.70 | ) | | | (2.03 | ) | | | (0.32 | ) | | | — | | | | — | | |
Total distributions to shareholders | | | (1.81 | ) | | | (2.16 | ) | | | (0.50 | ) | | | (0.08 | ) | | | (0.07 | ) | |
Net asset value, end of period | | $ | 17.80 | | | $ | 18.78 | | | $ | 16.20 | | | $ | 14.54 | | | $ | 14.87 | | |
Total return | | | 4.63 | % | | | 30.48 | % | | | 15.31 | % | | | (1.64 | %) | | | 27.55 | % | |
Ratios to average net assets(b) | |
Total gross expenses | | | 0.83 | % | | | 0.84 | % | | | 0.86 | % | | | 0.87 | % | | | 0.92 | %(c) | |
Total net expenses(d) | | | 0.83 | % | | | 0.84 | % | | | 0.86 | % | | | 0.87 | % | | | 0.92 | %(c)(e) | |
Net investment income (loss) | | | 0.59 | % | | | 0.60 | % | | | 1.18 | % | | | 0.52 | % | | | (0.12 | %)(c) | |
Supplemental data | |
Net assets, end of period (in thousands) | | $ | 2 | | | $ | 4 | | | $ | 23,685 | | | $ | 12,055 | | | $ | 29,390 | | |
Portfolio turnover | | | 38 | % | | | 36 | % | | | 42 | % | | | 41 | % | | | 60 | % | |
Notes to Financial Highlights
(a) Based on operations from September 27, 2010 (commencement of operations) through the stated period end.
(b) In addition to the fees and expenses that the Fund bears directly, the Fund indirectly bears a pro rata share of the fees and expenses of any other funds in which it invests. Such indirect expenses are not included in the Fund's reported expense ratios.
(c) Annualized.
(d) Total net expenses include the impact of certain fee waivers/expense reimbursements made by the Investment Manager and certain of its affiliates, if applicable.
(e) The benefits derived from expense reductions had an impact of less than 0.01%.
The accompanying Notes to Financial Statements are an integral part of this statement.
Annual Report 2015
22
COLUMBIA SMALL CAP VALUE FUND II
FINANCIAL HIGHLIGHTS (continued)
| | | Year Ended February 28, | | Year Ended
February 29, | | Year Ended
February 28, | |
Class R | | 2015 | | 2014 | | 2013 | | 2012 | | 2011 | |
Per share data | |
Net asset value, beginning of period | | $ | 18.49 | | | $ | 15.98 | | | $ | 14.36 | | | $ | 14.71 | | | $ | 11.01 | | |
Income from investment operations: | |
Net investment income (loss) | | | (0.02 | ) | | | (0.01 | ) | | | 0.07 | | | | (0.02 | ) | | | (0.03 | ) | |
Net realized and unrealized gain (loss) | | | 0.70 | | | | 4.56 | | | | 1.96 | | | | (0.33 | ) | | | 3.73 | | |
Total from investment operations | | | 0.68 | | | | 4.55 | | | | 2.03 | | | | (0.35 | ) | | | 3.70 | | |
Less distributions to shareholders: | |
Net investment income | | | — | | | | (0.01 | ) | | | (0.09 | ) | | | — | | | | — | | |
Net realized gains | | | (1.70 | ) | | | (2.03 | ) | | | (0.32 | ) | | | — | | | | — | | |
Total distributions to shareholders | | | (1.70 | ) | | | (2.04 | ) | | | (0.41 | ) | | | — | | | | — | | |
Net asset value, end of period | | $ | 17.47 | | | $ | 18.49 | | | $ | 15.98 | | | $ | 14.36 | | | $ | 14.71 | | |
Total return | | | 3.86 | % | | | 29.61 | % | | | 14.47 | % | | | (2.38 | %) | | | 33.61 | % | |
Ratios to average net assets(a) | |
Total gross expenses | | | 1.55 | % | | | 1.54 | % | | | 1.58 | % | | | 1.60 | % | | | 1.61 | % | |
Total net expenses(b) | | | 1.55 | %(c) | | | 1.54 | %(c) | | | 1.56 | %(c) | | | 1.56 | %(c) | | | 1.60 | %(c) | |
Net investment income (loss) | | | (0.14 | %) | | | (0.08 | %) | | | 0.50 | % | | | (0.12 | %) | | | (0.26 | %) | |
Supplemental data | |
Net assets, end of period (in thousands) | | $ | 14,594 | | | $ | 17,582 | | | $ | 15,421 | | | $ | 20,081 | | | $ | 27,450 | | |
Portfolio turnover | | | 38 | % | | | 36 | % | | | 42 | % | | | 41 | % | | | 60 | % | |
Notes to Financial Highlights
(a) In addition to the fees and expenses that the Fund bears directly, the Fund indirectly bears a pro rata share of the fees and expenses of any other funds in which it invests. Such indirect expenses are not included in the Fund's reported expense ratios.
(b) Total net expenses include the impact of certain fee waivers/expense reimbursements made by the Investment Manager and certain of its affiliates, if applicable.
(c) The benefits derived from expense reductions had an impact of less than 0.01%.
The accompanying Notes to Financial Statements are an integral part of this statement.
Annual Report 2015
23
COLUMBIA SMALL CAP VALUE FUND II
FINANCIAL HIGHLIGHTS (continued)
| | | Year Ended February 28, | |
Class R4 | | 2015 | | 2014 | | 2013(a) | |
Per share data | |
Net asset value, beginning of period | | $ | 19.06 | | | $ | 16.42 | | | $ | 14.41 | | |
Income from investment operations: | |
Net investment income | | | 0.05 | | | | 0.07 | | | | 0.08 | | |
Net realized and unrealized gain | | | 0.75 | | | | 4.69 | | | | 2.40 | | |
Total from investment operations | | | 0.80 | | | | 4.76 | | | | 2.48 | | |
Less distributions to shareholders: | |
Net investment income | | | (0.08 | ) | | | (0.09 | ) | | | (0.15 | ) | |
Net realized gains | | | (1.70 | ) | | | (2.03 | ) | | | (0.32 | ) | |
Total distributions to shareholders | | | (1.78 | ) | | | (2.12 | ) | | | (0.47 | ) | |
Net asset value, end of period | | $ | 18.08 | | | $ | 19.06 | | | $ | 16.42 | | |
Total return | | | 4.39 | % | | | 30.18 | % | | | 17.60 | % | |
Ratios to average net assets(b) | |
Total gross expenses | | | 1.05 | % | | | 1.05 | % | | | 1.11 | %(c) | |
Total net expenses(d) | | | 1.05 | %(e) | | | 1.05 | %(e) | | | 1.06 | %(c) | |
Net investment income | | | 0.28 | % | | | 0.38 | % | | | 1.73 | %(c) | |
Supplemental data | |
Net assets, end of period (in thousands) | | $ | 30,000 | | | $ | 14,479 | | | $ | 3 | | |
Portfolio turnover | | | 38 | % | | | 36 | % | | | 42 | % | |
Notes to Financial Highlights
(a) Based on operations from November 8, 2012 (commencement of operations) through the stated period end.
(b) In addition to the fees and expenses that the Fund bears directly, the Fund indirectly bears a pro rata share of the fees and expenses of any other funds in which it invests. Such indirect expenses are not included in the Fund's reported expense ratios.
(c) Annualized.
(d) Total net expenses include the impact of certain fee waivers/expense reimbursements made by the Investment Manager and certain of its affiliates, if applicable.
(e) The benefits derived from expense reductions had an impact of less than 0.01%.
The accompanying Notes to Financial Statements are an integral part of this statement.
Annual Report 2015
24
COLUMBIA SMALL CAP VALUE FUND II
FINANCIAL HIGHLIGHTS (continued)
| | | Year Ended February 28, | |
Class R5 | | 2015 | | 2014 | | 2013(a) | |
Per share data | |
Net asset value, beginning of period | | $ | 19.07 | | | $ | 16.42 | | | $ | 14.41 | | |
Income from investment operations: | |
Net investment income | | | 0.09 | | | | 0.09 | | | | 0.09 | | |
Net realized and unrealized gain | | | 0.73 | | | | 4.71 | | | | 2.39 | | |
Total from investment operations | | | 0.82 | | | | 4.80 | | | | 2.48 | | |
Less distributions to shareholders: | |
Net investment income | | | (0.10 | ) | | | (0.12 | ) | | | (0.15 | ) | |
Net realized gains | | | (1.70 | ) | | | (2.03 | ) | | | (0.32 | ) | |
Total distributions to shareholders | | | (1.80 | ) | | | (2.15 | ) | | | (0.47 | ) | |
Net asset value, end of period | | $ | 18.09 | | | $ | 19.07 | | | $ | 16.42 | | |
Total return | | | 4.51 | % | | | 30.43 | % | | | 17.63 | % | |
Ratios to average net assets(b) | |
Total gross expenses | | | 0.89 | % | | | 0.89 | % | | | 0.92 | %(c) | |
Total net expenses(d) | | | 0.89 | % | | | 0.89 | % | | | 0.92 | %(c) | |
Net investment income | | | 0.49 | % | | | 0.51 | % | | | 1.87 | %(c) | |
Supplemental data | |
Net assets, end of period (in thousands) | | $ | 14,349 | | | $ | 15,640 | | | $ | 3 | | |
Portfolio turnover | | | 38 | % | | | 36 | % | | | 42 | % | |
Notes to Financial Highlights
(a) Based on operations from November 8, 2012 (commencement of operations) through the stated period end.
(b) In addition to the fees and expenses that the Fund bears directly, the Fund indirectly bears a pro rata share of the fees and expenses of any other funds in which it invests. Such indirect expenses are not included in the Fund's reported expense ratios.
(c) Annualized.
(d) Total net expenses include the impact of certain fee waivers/expense reimbursements made by the Investment Manager and certain of its affiliates, if applicable.
The accompanying Notes to Financial Statements are an integral part of this statement.
Annual Report 2015
25
COLUMBIA SMALL CAP VALUE FUND II
FINANCIAL HIGHLIGHTS (continued)
| | | Year Ended February 28, | |
Class Y | | 2015 | | 2014 | | 2013(a) | |
Per share data | |
Net asset value, beginning of period | | $ | 19.10 | | | $ | 16.44 | | | $ | 14.43 | | |
Income from investment operations: | |
Net investment income | | | 0.10 | | | | 0.10 | | | | 0.09 | | |
Net realized and unrealized gain | | | 0.72 | | | | 4.72 | | | | 2.40 | | |
Total from investment operations | | | 0.82 | | | | 4.82 | | | | 2.49 | | |
Less distributions to shareholders: | |
Net investment income | | | (0.10 | ) | | | (0.13 | ) | | | (0.16 | ) | |
Net realized gains | | | (1.70 | ) | | | (2.03 | ) | | | (0.32 | ) | |
Total distributions to shareholders | | | (1.80 | ) | | | (2.16 | ) | | | (0.48 | ) | |
Net asset value, end of period | | $ | 18.12 | | | $ | 19.10 | | | $ | 16.44 | | |
Total return | | | 4.53 | % | | | 30.52 | % | | | 17.66 | % | |
Ratios to average net assets(b) | |
Total gross expenses | | | 0.85 | % | | | 0.84 | % | | | 0.87 | %(c) | |
Total net expenses(d) | | | 0.85 | % | | | 0.84 | % | | | 0.87 | %(c) | |
Net investment income | | | 0.56 | % | | | 0.53 | % | | | 1.92 | %(c) | |
Supplemental data | |
Net assets, end of period (in thousands) | | $ | 112,949 | | | $ | 27,955 | | | $ | 3 | | |
Portfolio turnover | | | 38 | % | | | 36 | % | | | 42 | % | |
Notes to Financial Highlights
(a) Based on operations from November 8, 2012 (commencement of operations) through the stated period end.
(b) In addition to the fees and expenses that the Fund bears directly, the Fund indirectly bears a pro rata share of the fees and expenses of any other funds in which it invests. Such indirect expenses are not included in the Fund's reported expense ratios.
(c) Annualized.
(d) Total net expenses include the impact of certain fee waivers/expense reimbursements made by the Investment Manager and certain of its affiliates, if applicable.
The accompanying Notes to Financial Statements are an integral part of this statement.
Annual Report 2015
26
COLUMBIA SMALL CAP VALUE FUND II
FINANCIAL HIGHLIGHTS (continued)
| | | Year Ended February 28, | | Year Ended
February 29, | | Year Ended
February 28, | |
Class Z | | 2015 | | 2014 | | 2013 | | 2012 | | 2011 | |
Per share data | |
Net asset value, beginning of period | | $ | 18.77 | | | $ | 16.19 | | | $ | 14.54 | | | $ | 14.87 | | | $ | 11.11 | | |
Income from investment operations: | |
Net investment income | | | 0.06 | | | | 0.07 | | | | 0.15 | | | | 0.05 | | | | 0.03 | | |
Net realized and unrealized gain (loss) | | | 0.72 | | | | 4.64 | | | | 1.97 | | | | (0.33 | ) | | | 3.78 | | |
Total from investment operations | | | 0.78 | | | | 4.71 | | | | 2.12 | | | | (0.28 | ) | | | 3.81 | | |
Less distributions to shareholders: | |
Net investment income | | | (0.07 | ) | | | (0.10 | ) | | | (0.15 | ) | | | (0.05 | ) | | | (0.05 | ) | |
Net realized gains | | | (1.70 | ) | | | (2.03 | ) | | | (0.32 | ) | | | — | | | | — | | |
Total distributions to shareholders | | | (1.77 | ) | | | (2.13 | ) | | | (0.47 | ) | | | (0.05 | ) | | | (0.05 | ) | |
Net asset value, end of period | | $ | 17.78 | | | $ | 18.77 | | | $ | 16.19 | | | $ | 14.54 | | | $ | 14.87 | | |
Total return | | | 4.39 | % | | | 30.26 | % | | | 15.02 | % | | | (1.84 | %) | | | 34.31 | % | |
Ratios to average net assets(a) | |
Total gross expenses | | | 1.05 | % | | | 1.04 | % | | | 1.08 | % | | | 1.11 | % | | | 1.11 | % | |
Total net expenses(b) | | | 1.05 | %(c) | | | 1.04 | %(c) | | | 1.06 | %(c) | | | 1.06 | %(c) | | | 1.10 | %(c) | |
Net investment income | | | 0.36 | % | | | 0.42 | % | | | 1.01 | % | | | 0.40 | % | | | 0.23 | % | |
Supplemental data | |
Net assets, end of period (in thousands) | | $ | 1,273,117 | | | $ | 1,438,322 | | | $ | 1,140,319 | | | $ | 1,230,960 | | | $ | 1,276,673 | | |
Portfolio turnover | | | 38 | % | | | 36 | % | | | 42 | % | | | 41 | % | | | 60 | % | |
Notes to Financial Highlights
(a) In addition to the fees and expenses that the Fund bears directly, the Fund indirectly bears a pro rata share of the fees and expenses of any other funds in which it invests. Such indirect expenses are not included in the Fund's reported expense ratios.
(b) Total net expenses include the impact of certain fee waivers/expense reimbursements made by the Investment Manager and certain of its affiliates, if applicable.
(c) The benefits derived from expense reductions had an impact of less than 0.01%.
The accompanying Notes to Financial Statements are an integral part of this statement.
Annual Report 2015
27
COLUMBIA SMALL CAP VALUE FUND II
NOTES TO FINANCIAL STATEMENTS
February 28, 2015
Note 1. Organization
Columbia Small Cap Value Fund II (the Fund), a series of Columbia Funds Series Trust (the Trust), is a diversified fund. The Trust is registered under the Investment Company Act of 1940, as amended (the 1940 Act), as an open-end management investment company organized as a Delaware statutory trust.
Fund Shares
The Trust may issue an unlimited number of shares (without par value). The Fund offers Class A, Class B, Class C, Class I, Class R, Class R4, Class R5, Class Y and Class Z shares. Although all share classes generally have identical voting, dividend and liquidation rights, each share class votes separately when required by the Trust's organizational documents or by law. Different share classes pay different distribution amounts to the extent the expenses of such share classes differ, and distributions in liquidation will be proportional to the net asset value of each share class. Each share class has its own expense structure and sales charges.
The Fund is closed to new investors and new accounts, subject to certain limited exceptions.
Class A shares are subject to a maximum front-end sales charge of 5.75% based on the initial investment amount. Class A shares purchased without an initial sales charge in accounts aggregating $1 million to $50 million at the time of purchase are subject to a contingent deferred sales charge (CDSC) if the shares are sold within 18 months of purchase, charged as follows: 1.00% CDSC if redeemed within 12 months of purchase, and 0.50% CDSC if redeemed more than 12, but less than 18, months after purchase.
Class B shares may be subject to a maximum CDSC of 5.00% based upon the holding period after purchase. Class B shares will generally convert to Class A shares eight years after purchase. The Fund no longer accepts investments by new or existing investors in the Fund's Class B shares, except in connection with the reinvestment of any dividend and/or capital gain distributions in Class B shares of the Fund and exchanges by existing Class B shareholders of certain other funds within the Columbia Family of Funds.
Class C shares are subject to a 1.00% CDSC on shares redeemed within one year of purchase.
Class I shares are not subject to sales charges and are available only to the Columbia Family of Funds.
Class R shares are not subject to sales charges and are generally available only to certain retirement plans and other investors as described in the Fund's prospectus.
Class R4 shares are not subject to sales charges and are generally available only to omnibus retirement plans and certain investors as described in the Fund's prospectus.
Class R5 shares are not subject to sales charges and are generally available only to investors purchasing through authorized investment professionals and omnibus retirement plans.
Class Y shares are not subject to sales charges and are generally available only to certain retirement plans as described in the Fund's prospectus.
Class Z shares are not subject to sales charges and are available only to eligible investors, which are subject to different investment minimums as described in the Fund's prospectus.
Note 2. Summary of Significant Accounting Policies
Basis of Preparation
The Fund is an investment company that applies the accounting and reporting guidance in the Financial Accounting Standards Board (FASB) Accounting Standards Codification Topic 946, Financial Services — Investment Companies (ASC 946). The financial statements are prepared in accordance with U.S. generally accepted accounting principles (GAAP), which requires management to make certain estimates and assumptions that affect the reported amounts of assets and liabilities, the disclosure of contingent assets and liabilities at the date of the financial statements and the reported amounts of income and expenses during the reporting period. Actual results could differ from those estimates.
The following is a summary of significant accounting policies followed by the Fund in the preparation of its financial statements.
Security Valuation
All equity securities are valued at the close of business of the New York Stock Exchange (NYSE). Equity securities are valued at the last quoted sales price on the principal exchange or market on which they trade, except for securities traded on the NASDAQ Stock Market, which are valued at the NASDAQ official close price. Unlisted securities or listed securities for which there were no
Annual Report 2015
28
COLUMBIA SMALL CAP VALUE FUND II
NOTES TO FINANCIAL STATEMENTS (continued)
February 28, 2015
sales during the day are valued at the mean of the latest quoted bid and ask prices on such exchanges or markets.
Foreign equity securities are valued based on quotations from the principal market in which such securities are traded. If any foreign security prices are not readily available as a result of limited share activity, the securities are valued at the mean of the latest quoted bid and ask prices on such exchanges or markets. Foreign currency exchange rates are generally determined at 4:00 p.m. Eastern (U.S.) time. Many securities markets and exchanges outside the U.S. close prior to the close of the NYSE; therefore, the closing prices for securities in such markets or on such exchanges may not fully reflect events that occur after such close but before the close of the NYSE. In those situations, foreign securities will be fair valued pursuant to a policy adopted by the Board of Trustees (the Board), including, if available, utilizing a third party pricing service to determine these fair values. The third party pricing service takes into account multiple factors, including, but not limited to, movements in the U.S. securities markets, certain depositary receipts, futures contracts and foreign exchange rates that have occurred subsequent to the close of the foreign exchange or market, to determine a good faith estimate that reasonably reflects the current market conditions as of the close of the NYSE. The fair value of a security is likely to be different from the quoted or published price, if available.
Investments in open-end investment companies, including money market funds, are valued at their net asset value.
Investments for which market quotations are not readily available, or that have quotations which management believes are not reliable, are valued at fair value as determined in good faith under procedures established by and under the general supervision of the Board. If a security or class of securities (such as foreign securities) is valued at fair value, such value is likely to be different from the quoted or published price for the security.
The determination of fair value often requires significant judgment. To determine fair value, management may use assumptions including but not limited to future cash flows and estimated risk premiums. Multiple inputs from various sources may be used to determine fair value.
Security Transactions
Security transactions are accounted for on the trade date. Cost is determined and gains (losses) are based
upon the specific identification method for both financial statement and federal income tax purposes.
Income Recognition
Corporate actions and dividend income are generally recorded net of any non-reclaimable tax withholdings, on the ex-dividend date or upon receipt of ex-dividend notification in the case of certain foreign securities.
The Fund may receive distributions from holdings in business development companies (BDCs), exchange-traded funds (ETFs), other regulated investment companies (RICs), and real estate investment trusts (REITs), which report information on the character of their distributions annually. These distributions are allocated to dividend income, capital gain and return of capital based on actual information reported. To the extent actual information has not yet been reported by the REITs, estimates for return of capital are made by the Fund's management. Return of capital is recorded as a reduction of the cost basis of securities held. If the Fund no longer owns the applicable securities, return of capital is recorded as a realized gain. Management's estimates are subsequently adjusted when the actual character of the distributions is disclosed by the REITs, which could result in a proportionate change in return of capital to shareholders. No estimates are made for the BDCs, ETFs, and RICs.
Awards from class action litigation are recorded as a reduction of cost basis if the Fund still owns the applicable securities on the payment date. If the Fund no longer owns the applicable securities, the proceeds are recorded as realized gains.
Expenses
General expenses of the Trust are allocated to the Fund and other funds of the Trust based upon relative net assets or other expense allocation methodologies determined by the nature of the expense. Expenses directly attributable to the Fund are charged to the Fund. Expenses directly attributable to a specific class of shares are charged to that share class.
Determination of Class Net Asset Value
All income, expenses (other than class-specific expenses, which are charged to that share class, as shown in the Statement of Operations) and realized and unrealized gains (losses) are allocated to each class of the Fund on a daily basis, based on the relative net assets of each class, for purposes of determining the net asset value of each class.
Annual Report 2015
29
COLUMBIA SMALL CAP VALUE FUND II
NOTES TO FINANCIAL STATEMENTS (continued)
February 28, 2015
Federal Income Tax Status
The Fund intends to qualify each year as a regulated investment company under Subchapter M of the Internal Revenue Code, as amended, and will distribute substantially all of its taxable income (including net short-term capital gains), if any, for its tax year, and as such will not be subject to federal income taxes. In addition, the Fund intends to distribute in each calendar year substantially all of its net investment income, capital gains and certain other amounts, if any, such that the Fund should not be subject to federal excise tax. Therefore, no federal income or excise tax provision is recorded.
Distributions to Shareholders
Distributions from net investment income, if any, are declared and paid semi-annually. Net realized capital gains, if any, are distributed at least annually. Income distributions and capital gain distributions are determined in accordance with federal income tax regulations, which may differ from GAAP.
Guarantees and Indemnifications
Under the Trust's organizational documents and, in some cases, by contract, its officers and trustees are indemnified against certain liabilities arising out of the performance of their duties to the Trust or its funds. In addition, certain of the Fund's contracts with its service providers contain general indemnification clauses. The Fund's maximum exposure under these arrangements is unknown since the amount of any future claims that may be made against the Fund cannot be determined, and the Fund has no historical basis for predicting the likelihood of any such claims.
Note 3. Fees and Compensation Paid to Affiliates
Investment Management Fees
Under an Investment Management Services Agreement, Columbia Management Investment Advisers, LLC (the Investment Manager), a wholly-owned subsidiary of Ameriprise Financial, Inc. (Ameriprise Financial), determines which securities will be purchased, held or sold. The investment management fee is an annual fee that is equal to a percentage of the Fund's average daily net assets that declines from 0.79% to 0.70% as the Fund's net assets increase. The effective investment
management fee rate for the year ended February 28, 2015 was 0.74% of the Fund's average daily net assets.
Administration Fees
Under an Administrative Services Agreement, the Investment Manager also serves as the Fund Administrator. The Fund pays the Fund Administrator an annual fee for administration and accounting services equal to a percentage of the Fund's average daily net assets that declines from 0.08% to 0.05% as the Fund's net assets increase. The effective administration fee rate for the year ended February 28, 2015 was 0.07% of the Fund's average daily net assets.
Other Expenses
Other expenses are for, among other things, miscellaneous expenses of the Fund or the Board, including payments to a company providing limited administrative services to the Fund and the Board. That company's expenses include boardroom and office expense, employee compensation, employee health and retirement benefits, and certain other expenses. For the year ended February 28, 2015, other expenses paid by the Fund to this company were $3,726.
Compensation of Board Members
Board members are compensated for their services to the Fund as disclosed in the Statement of Operations. Under a Deferred Compensation Plan (the Plan), the Board members who are not "interested persons" of the Fund, as defined under the 1940 Act, may elect to defer payment of up to 100% of their compensation. Deferred amounts are treated as though equivalent dollar amounts had been invested in shares of certain funds managed by the Investment Manager. The Fund's liability for these amounts is adjusted for market value changes and remains in the Fund until distributed in accordance with the Plan.
Transfer Agent Fees
Under a Transfer and Dividend Disbursing Agent Agreement, Columbia Management Investment Services Corp. (the Transfer Agent), an affiliate of the Investment Manager and a wholly-owned subsidiary of Ameriprise Financial, is responsible for providing transfer agency services to the Fund. The Transfer Agent has contracted with Boston Financial Data Services (BFDS) to serve as sub-transfer agent.
Annual Report 2015
30
COLUMBIA SMALL CAP VALUE FUND II
NOTES TO FINANCIAL STATEMENTS (continued)
February 28, 2015
Effective November 1, 2014, the Transfer Agent receives a monthly transfer agency fee based on the number or the average value of accounts, depending on the type of account. Prior to November 1, 2014, the Transfer Agent received a monthly account-based service fee based on the number of open accounts. In addition, the Transfer Agent also receives sub-transfer agency fees based on a percentage of the average aggregate value of the Fund's shares maintained in omnibus accounts (other than omnibus accounts for which American Enterprise Investment Services Inc. is the broker of record or accounts where the beneficial shareholder is a customer of Ameriprise Financial Services, Inc., for which the Transfer Agent receives a per account fee). The Transfer Agent pays the fees of BFDS for services as sub-transfer agent and is not entitled to reimbursement for such fees from the Fund (with the exception of out-of-pocket fees).
The Transfer Agent also receives compensation from the Fund for various shareholder services and reimbursements for certain out-of-pocket fees. Total transfer agent fees for Class R5 shares are subject to an annual limitation of not more than 0.05% of the average daily net assets attributable to Class R5 shares. Class I and Class Y shares do not pay transfer agency fees.
For the year ended February 28, 2015, the Fund's effective transfer agent fee rates as a percentage of average daily net assets of each class were as follows:
Class A | | | 0.21 | % | |
Class B | | | 0.20 | | |
Class C | | | 0.21 | | |
Class R | | | 0.21 | | |
Class R4 | | | 0.21 | | |
Class R5 | | | 0.05 | | |
Class Z | | | 0.21 | | |
An annual minimum account balance fee of $20 may apply to certain accounts with a value below the applicable share class's initial minimum investment requirements to reduce the impact of small accounts on transfer agent fees. These minimum account balance fees are remitted to the Fund and recorded as part of expense reductions in the Statement of Operations. For the year ended February 28, 2015, these minimum account balance fees reduced total expenses of the Fund by $60.
Distribution and Service Fees
The Fund has an agreement with Columbia Management Investment Distributors, Inc. (the Distributor), an affiliate of the Investment Manager and a wholly-owned
subsidiary of Ameriprise Financial, for distribution and shareholder services. The Board has approved, and the Fund has adopted, distribution and shareholder service plans (the Plans) applicable to certain share classes, which set the distribution and service fees for the Fund. These fees are calculated daily and are intended to compensate the Distributor and/or eligible selling and/or servicing agents for selling shares of the Fund and providing services to investors.
Under the Plans, the Fund pays a monthly combined distribution and service fee to the Distributor at the maximum annual rate of 0.25% of the average daily net assets attributable to Class A shares of the Fund. Also under the Plans, the Fund pays a monthly service fee at the maximum annual rate of 0.25% of the average daily net assets attributable to Class B and Class C shares of the Fund and the payment of a monthly distribution fee at the maximum annual rates of 0.75%, 0.75% and 0.50% of the average daily net assets attributable to Class B, Class C and Class R shares, respectively, of the Fund.
Sales Charges
Sales charges, including front-end charges and CDSCs, received by the Distributor for distributing Fund shares were $5,027 for Class A, $6 for Class B and $20 for Class C shares for the year ended February 28, 2015.
Expenses Waived/Reimbursed by the Investment Manager and its Affiliates
The Fund's expense ratio is subject to an expense reimbursement arrangement pursuant to which fees will be waived and/or expenses reimbursed (excluding certain fees and expenses described below), so that the Fund's net operating expenses, after giving effect to fees waived/expenses reimbursed and any balance credits and/or overdraft charges from the Fund's custodian, do not exceed the annual rates of:
| | | Voluntary
Expense Cap
Effective
July 1, 2014 | | Contractual
Expense Cap
Prior to
July 1, 2014 | |
Class A | | | 1.38 | % | | | 1.31 | % | |
Class B | | | 2.13 | | | | 2.06 | | |
Class C | | | 2.13 | | | | 2.06 | | |
Class I | | | 0.98 | | | | 0.98 | | |
Class R | | | 1.63 | | | | 1.56 | | |
Class R4 | | | 1.13 | | | | 1.06 | | |
Class R5 | | | 1.03 | | | | 1.03 | | |
Class Y | | | 0.98 | | | | 0.98 | | |
Class Z | | | 1.13 | | | | 1.06 | | |
Annual Report 2015
31
COLUMBIA SMALL CAP VALUE FUND II
NOTES TO FINANCIAL STATEMENTS (continued)
February 28, 2015
The voluntary expense cap arrangement may be revised or discontinued at any time. Under the arrangements, the following fees and expenses are excluded from the waiver/reimbursement commitment, and therefore will be paid by the Fund, if applicable: taxes (including foreign transaction taxes), expenses associated with investments in affiliated and non-affiliated pooled investment vehicles (including mutual funds and exchange-traded funds), transaction costs and brokerage commissions, costs related to any securities lending program, dividend expenses associated with securities sold short, inverse floater program fees and expenses, transaction charges and interest on borrowed money, interest and extraordinary expenses. Any fees waived and/or expenses reimbursed under the expense reimbursement arrangements described above are not recoverable by the Investment Manager or its affiliates in future periods.
Note 4. Federal Tax Information
The timing and character of income and capital gain distributions are determined in accordance with income tax regulations, which may differ from GAAP because of temporary or permanent book to tax differences.
At February 28, 2015, these differences are primarily due to differing treatment for deferral/reversal of wash sale losses, Trustees' deferred compensation, distribution reclassifications, late-year ordinary losses and re-characterization of distributions for investments. To the extent these differences are permanent, reclassifications are made among the components of the Fund's net assets in the Statement of Assets and Liabilities. Temporary differences do not require reclassifications. In the Statement of Assets and Liabilities the following reclassifications were made:
Excess of distributions over net investment income | | $ | 173,282 | | |
Accumulated net realized gain | | | (173,282 | ) | |
Net investment income (loss) and net realized gains (losses), as disclosed in the Statement of Operations, and net assets were not affected by this reclassification.
The tax character of distributions paid during the years indicated was as follows:
Year Ended February 28, | | 2015 | | 2014 | |
Ordinary income | | $ | 5,639,262 | | | $ | 14,672,433 | | |
Long-term capital gains | | | 161,360,609 | | | | 177,869,293 | | |
Total | | $ | 166,999,871 | | | $ | 192,541,726 | | |
Short-term capital gain distributions, if any, are considered ordinary income distributions for tax purposes.
At February 28, 2015, the components of distributable earnings on a tax basis were as follows:
Undistributed long-term capital gains | | | 21,863,477 | | |
Net unrealized appreciation | | | 516,279,981 | | |
At February 28, 2015, the cost of investments for federal income tax purposes was $1,204,507,071 and the aggregate gross unrealized appreciation and depreciation based on that cost was:
Unrealized appreciation | | $ | 541,512,359 | | |
Unrealized depreciation | | | (25,232,378 | ) | |
Net unrealized appreciation | | | 516,279,981 | | |
Under current tax rules, regulated investment companies can elect to treat certain late-year ordinary losses incurred and post-October capital losses (capital losses realized after October 31) as arising on the first day of the following taxable year. As of February 28, 2015, the Fund will elect to treat late-year ordinary losses of $783,686 and post-October capital losses of $0 as arising on March 1, 2015.
Management of the Fund has concluded that there are no significant uncertain tax positions in the Fund that would require recognition in the financial statements. However, management's conclusion may be subject to review and adjustment at a later date based on factors including, but not limited to, new tax laws, regulations, and administrative interpretations (including relevant court decisions). Generally, the Fund's federal tax returns for the prior three fiscal years remain subject to examination by the Internal Revenue Service.
Note 5. Portfolio Information
The cost of purchases and proceeds from sales of securities, excluding short-term investments and derivatives, if any, aggregated to $653,643,824 and $805,950,860, respectively, for the year ended February 28, 2015. The amount of purchase and sale activity impacts the portfolio turnover rate reported in the Financial Highlights.
Note 6. Affiliated Money Market Fund
The Fund invests in Columbia Short-Term Cash Fund, an affiliated money market fund established for the exclusive use by the Fund and other affiliated funds. The income earned by the Fund from such investments is included as Dividends — affiliated issuers in the
Annual Report 2015
32
COLUMBIA SMALL CAP VALUE FUND II
NOTES TO FINANCIAL STATEMENTS (continued)
February 28, 2015
Statement of Operations. As an investing fund, the Fund indirectly bears its proportionate share of the expenses of Columbia Short-Term Cash Fund.
Note 7. Shareholder Concentration
At February 28, 2015, three unaffiliated shareholders of record owned 53.9% of the outstanding shares of the Fund in one or more accounts. The Fund has no knowledge about whether any portion of those shares was owned beneficially. Subscription and redemption activity by concentrated accounts may have a significant effect on the operations of the Fund.
Note 8. Line of Credit
The Fund has entered into a revolving credit facility with a syndicate of banks led by JPMorgan Chase Bank, N.A. (JPMorgan) whereby the Fund may borrow for the temporary funding of shareholder redemptions or for other temporary or emergency purposes. Pursuant to a December 9, 2014 amendment, the credit facility agreement, which is a collective agreement between the Fund and certain other funds managed by the Investment Manager, severally and not jointly, permits collective borrowings up to $550 million. Interest is charged to each participating fund based on its borrowings at a rate equal to the higher of (i) the overnight federal funds rate plus 1.00% or (ii) the one-month LIBOR rate plus 1.00%. Each borrowing under the credit facility matures no later than 60 days after the date of borrowing. The Fund also pays a commitment fee equal to its pro rata share of the amount of the credit facility at a rate of 0.075% per annum. The commitment fee is included in other expenses in the Statement of Operations. Prior to the December 9, 2014 amendment, the credit facility agreement permitted borrowings up to $500 million under the same terms and interest rates as described above.
The Fund had no borrowings during the year ended February 28, 2015.
Note 9. Significant Risks
Financial Sector Risk
Sector risk occurs when a fund invests a significant portion of its assets in securities of companies conducting business in a related group of industries within an economic sector. Companies in the same economic sector may be similarly affected by economic, regulatory, political or market events or conditions, making a fund more vulnerable to unfavorable developments in that economic sector than funds that
invest more broadly. The Fund may be more susceptible to the particular risks that may affect companies in the financial sector than if it were invested in a wider variety of companies in unrelated sectors.
Note 10. Subsequent Events
Management has evaluated the events and transactions that have occurred through the date the financial statements were issued and noted no items requiring adjustment of the financial statements or additional disclosure.
Note 11. Information Regarding Pending and Settled Legal Proceedings
In December 2005, without admitting or denying the allegations, American Express Financial Corporation (AEFC, which is now known as Ameriprise Financial, Inc. (Ameriprise Financial)) entered into settlement agreements with the Securities and Exchange Commission (SEC) and Minnesota Department of Commerce (MDOC) related to market timing activities. As a result, AEFC was censured and ordered to cease and desist from committing or causing any violations of certain provisions of the Investment Advisers Act of 1940, the Investment Company Act of 1940, and various Minnesota laws. AEFC agreed to pay disgorgement of $10 million and civil money penalties of $7 million. AEFC also agreed to retain an independent distribution consultant to assist in developing a plan for distribution of all disgorgement and civil penalties ordered by the SEC in accordance with various undertakings detailed at www.sec.gov/litigation/admin/ia-2451.pdf. Ameriprise Financial and its affiliates have cooperated with the SEC and the MDOC in these legal proceedings, and have made regular reports to the Funds' Boards of Trustees.
Ameriprise Financial and certain of its affiliates have historically been involved in a number of legal, arbitration and regulatory proceedings, including routine litigation, class actions, and governmental actions, concerning matters arising in connection with the conduct of their business activities. Ameriprise Financial believes that the Funds are not currently the subject of, and that neither Ameriprise Financial nor any of its affiliates are the subject of, any pending legal, arbitration or regulatory proceedings that are likely to have a material adverse effect on the Funds or the ability of Ameriprise Financial or its affiliates to perform under their contracts with the Funds. Ameriprise Financial is required to make quarterly (10-Q), annual (10-K) and, as necessary, 8-K filings with the Securities and Exchange Commission on
Annual Report 2015
33
COLUMBIA SMALL CAP VALUE FUND II
NOTES TO FINANCIAL STATEMENTS (continued)
February 28, 2015
legal and regulatory matters that relate to Ameriprise Financial and its affiliates. Copies of these filings may be obtained by accessing the SEC website at www.sec.gov.
There can be no assurance that these matters, or the adverse publicity associated with them, will not result in increased fund redemptions, reduced sale of fund shares or other adverse consequences to the Funds. Further, although we believe proceedings are not likely to have a material adverse effect on the Funds or the ability of Ameriprise Financial or its affiliates to perform under their contracts with the Funds, these proceedings are subject to uncertainties and, as such, we are unable to estimate the possible loss or range of loss that may result. An adverse outcome in one or more of these proceedings could result in adverse judgments, settlements, fines, penalties or other relief that could have a material adverse effect on the consolidated financial condition or results of operations of Ameriprise Financial.
Annual Report 2015
34
COLUMBIA SMALL CAP VALUE FUND II
REPORT OF INDEPENDENT REGISTERED PUBLIC ACCOUNTING FIRM
To the Trustees of Columbia Funds Series Trust and the Shareholders of
Columbia Small Cap Value Fund II
In our opinion, the accompanying statement of assets and liabilities, including the portfolio of investments, and the related statements of operations and of changes in net assets and the financial highlights present fairly, in all material respects, the financial position of Columbia Small Cap Value Fund II (the "Fund", a series of Columbia Funds Series Trust) at February 28, 2015, and the results of its operations, the changes in its net assets and the financial highlights for each of the periods indicated, in conformity with accounting principles generally accepted in the United States of America. These financial statements and financial highlights (hereafter referred to as "financial statements") are the responsibility of the Fund's management; our responsibility is to express an opinion on these financial statements based on our audits. We conducted our audits of these financial statements in accordance with the standards of the Public Company Accounting Oversight Board (United States). Those standards require that we plan and perform the audit to obtain reasonable assurance about whether the financial statements are free of material misstatement. An audit includes examining, on a test basis, evidence supporting the amounts and disclosures in the financial statements, assessing the accounting principles used and significant estimates made by management, and evaluating the overall financial statement presentation. We believe that our audits, which included confirmation of securities at February 28, 2015 by correspondence with the custodian, brokers and transfer agent, and the application of alternative auditing procedures where such confirmations had not been received, provide a reasonable basis for our opinion.
PricewaterhouseCoopers LLP
Minneapolis, Minnesota
April 21, 2015
Annual Report 2015
35
COLUMBIA SMALL CAP VALUE FUND II
FEDERAL INCOME TAX INFORMATION
(Unaudited)
The Fund hereby designates the following tax attributes for the fiscal year ended February 28, 2015. Shareholders will be notified in early 2016 of the amounts for use in preparing 2015 income tax returns.
Tax Designations:
| Qualified Dividend Income | | | 100.00 | % | |
| Dividends Received Deduction | | | 100.00 | % | |
Capital Gain Dividend | | $ | 130,879,722 | | |
Qualified Dividend Income. For taxable, non-corporate shareholders, the percentage of ordinary income distributed during the fiscal year that represents qualified dividend income subject to reduced tax rates.
Dividends Received Deduction. The percentage of ordinary income distributed during the fiscal year that qualifies for the corporate dividends received deduction.
Capital Gain Dividend. The Fund designates as a capital gain dividend the amount reflected above, or if subsequently determined to be different, the net capital gain of such fiscal period.
Annual Report 2015
36
COLUMBIA SMALL CAP VALUE FUND II
Shareholders elect the Board that oversees the Funds' operations. The Board appoints officers who are responsible for day-to-day business decisions based on policies set by the Board. The following table provides basic biographical information about the Funds' Board members, including their principal occupations during the past five years, although specific titles for individuals may have varied over the period. Under current Board policy, members may serve through the end of the calendar year in which he or she reaches either the mandatory retirement age established by the Board or the fifteenth anniversary of the first Board meeting they attended as a member of the Board.
Independent Trustees
Name,
Address,
Year of Birth | | Position Held With
Funds and Length of
Service | | Principal Occupation(s)
During Past Five Years
and Other Relevant
Professional Experience | | Number of
Funds in the
Fund Family
Overseen by
Board Member | | Other Present or Past
Directorships/
Trusteeships
(Within Past 5 Years) | |
Kathleen Blatz
901 S. Marquette Ave.
Minneapolis, MN 55402
1954 | | Board member since 1/06 for RiverSource Funds and since 6/11 for Nations Funds | | Attorney; specializing in arbitration and mediation; Chief Justice, Minnesota Supreme Court, 1998-2006; Associate Justice, Minnesota Supreme Court, 1996-1998; Fourth Judicial District Court Judge, Hennepin Country, 1994-1996; Attorney in private practice and public service, 1984-1993; State Representative, Minnesota House of Representatives, 1979-1993, which included service on the Tax and Financial Institutions and Insurance Committees | | | 127 | | | Trustee, BlueCross BlueShield of Minnesota (Chair of the Business Development Committee) since 2009; Chair of the Robina Foundation since August 2013 | |
Edward J. Boudreau, Jr.
901 S. Marquette Ave.
Minneapolis, MN 55402
1944 | | Board member since 6/11 for RiverSource Funds and since 1/05 for Nations Funds | | Managing Director, E.J. Boudreau & Associates (consulting) since 2000; FINRA Industry Arbitrator, 2002-present; Chairman and Chief Executive Officer, John Hancock Funds (asset management), Chairman and Interested Trustee for open-end and closed-end funds offered by John Hancock, 1989-2000; John Hancock Life Insurance Company, including SVP and Treasurer and SVP Information Technology, 1968-1988 | | | 125 | | | Former Trustee, BofA Funds Series Trust (11 funds), 2005-2011; Trustee, Boston Museum of Science (Chair of Finance Committee), 1985-2013 | |
Pamela G. Carlton
901 S. Marquette Ave.
Minneapolis, MN 55402
1954 | | Board member since 7/07 for RiverSource Funds and since 6/11 for Nations Funds | | President, Springboard — Partners in Cross Cultural Leadership (consulting company) since 2003; Managing Director of US Equity Research, JP Morgan Chase, 1999-2003; Director of US Equity Research, Chase Asset Management, 1996-1999; Co-Director Latin America Research, 1993-1996, COO Global Research, 1992-1996, Co-Director of US Research, 1991-1992, Investment Banker, Morgan Stanley, 1982-1991 | | | 127 | | | None | |
Annual Report 2015
37
COLUMBIA SMALL CAP VALUE FUND II
TRUSTEES AND OFFICERS (continued)
Independent Trustees (continued)
Name,
Address,
Year of Birth | | Position Held With
Funds and Length of
Service | | Principal Occupation(s)
During Past Five Years
and Other Relevant
Professional Experience | | Number of
Funds in the
Fund Family
Overseen by
Board Member | | Other Present or Past
Directorships/
Trusteeships
(Within Past 5 Years) | |
William P. Carmichael
901 S. Marquette Ave.
Minneapolis, MN 55402
1943 | | Chair of the Board since 1/14, Board member since 6/11 for RiverSource Funds and since 2003 for Nations Funds | | Retired; Co-founder, The Succession Fund (provides exit strategies to owners of privately held companies) 1998-2007; Adjunct Professor of Finances, Kelley School of Business, Indiana University, 1993-2007; Senior Vice President, Sara Lee Corporation, 1991-1993; Senior Vice President and Chief Financial Officer, Beatrice Foods Company, 1984-1990; Vice President, Esmark, Inc, 1973-1984.; Associate, Price Waterhouse, 1968-1972 | | | 127 | | | Director, Cobra Electronics Corporation (electronic equipment manufacturer), 1994-August 2014; The Finish Line (athletic shoes and apparel) since July 2003; Director, International Textile Corp. since 2012; former Director, McMoRan Exploration Company (oil and gas exploration and development) 2010-2013; former Trustee, BofA Funds Series Trust (11 funds) 2009-2011; Director, Spectrum Brands, Inc. (consumer products), 2002-2009; Director, Simmons Company (bedding), 2004-2010 | |
Patricia M. Flynn
901 S. Marquette Ave.
Minneapolis, MN 55402
1950 | | Board member since 11/04 for RiverSource Funds and since 6/11 for Nations Funds | | Trustee Professor of Economics and Management, Bentley University since 1976 (also teaches and conducts research on corporate governance); Dean, McCallum Graduate School of Business, Bentley University, 1992-2002 | | | 127 | | | Trustee, MA Taxpayers Foundation since 1997; Board of Governors, Innovation Institute, MA Technology Collaborative since 2010 | |
William A. Hawkins
901 S. Marquette Ave.
Minneapolis, MN 55402
1942 | | Board member since 6/11 for RiverSource Funds and since 1/05 for Nations Funds | | Managing Director, Overton Partners (financial consulting), since August 2010; President and Chief Executive Officer, California General Bank, N.A., January 2008-August 2010; Operation Hope, COO, 2004-2007; IndyMac Bancorp, President, CBG, 1999-2003; American General Bank, President, 1997-1999; Griffin Financial Services, CEO, 1981-1997; The Griffin Funds, CEO, 1992-1998 | | | 125 | | | Trustee, BofA Funds Series Trust (11 funds) | |
R. Glenn Hilliard
901 S. Marquette Ave.
Minneapolis, MN 55402
1943 | | Board member since 6/11 for RiverSource Funds and since 1/05 for Nations Funds | | Chairman and Chief Executive Officer, Hilliard Group LLC (investing and consulting) since April 2003; Non-Executive Director & Chairman, CNO Financial Group, Inc. (insurance), September 2003-May 2011 | | | 125 | | | Chairman, BofA Funds Series Trust (11 funds); former Director, CNO Financial Group, Inc. (insurance) 2003-2011 | |
Annual Report 2015
38
COLUMBIA SMALL CAP VALUE FUND II
TRUSTEES AND OFFICERS (continued)
Independent Trustees (continued)
Name,
Address,
Year of Birth | | Position Held With
Funds and Length of
Service | | Principal Occupation(s)
During Past Five Years
and Other Relevant
Professional Experience | | Number of
Funds in the
Fund Family
Overseen by
Board Member | | Other Present or Past
Directorships/
Trusteeships
(Within Past 5 Years) | |
Catherine James Paglia
901 S. Marquette Ave.
Minneapolis, MN 55402
1952 | | Board member since 11/04 for RiverSource Funds and since 6/11 for Nations Funds | | Director, Enterprise Asset Management, Inc. (private real estate and asset management company) since September 1998; Managing Director and Partner, Interlaken Capital, Inc., 1989-1997; Managing Director, Morgan Stanley, 1982-1989; Vice President, Investment Banking, 1980-1982, Associate, Investment Banking, 1976-1980, Dean Witter Reynolds, Inc. | | | 127 | | | Director, Valmont Industries, Inc. (irrigation systems manufacturer) since 2012; Trustee, Carleton College (on the Investment Committee); Trustee, Carnegie Endowment for International Peace (on the Investment Committee) | |
Leroy C. Richie
901 S. Marquette Ave.
Minneapolis, MN 55402
1941 | | Board member since 2000 for Seligman Funds, since 11/08 for RiverSource Funds and since 6/11 for Nations Funds | | Counsel, Lewis & Munday, P.C. (law firm) since 2004; Vice President and General Counsel, Automotive Legal Affairs, Chrysler Corporation, 1993-1997 | | | 127 | | | Lead Outside Director, Digital Ally, Inc. (digital imaging) since September 2005; Director, Infinity, Inc. (oil and gas exploration and production) since 1994; Director, OGE Energy Corp. (energy and energy services) since November 2007-2014 | |
Minor M. Shaw
901 S. Marquette Ave.
Minneapolis, MN 55402
1947 | | Board member since 6/11 for RiverSource Funds and since 2003 for Nations Funds | | President, Micco LLC (private investments) since 2011; President, Micco Corp. (family investment business) 1998-2011 | | | 125 | | | Director, Piedmont Natural Gas; Director, BlueCross BlueShield of South Carolina since April 2008; Chair of the Duke Endowment; Director, National Association of Corporate Directors, Carolinas Chapter, since 2013; Chair of Greenville-Spartanburg Airport Commission; former Trustee, BofA Funds Series Trust (11 funds), 2003-2011 | |
Alison Taunton-Rigby
901 S. Marquette Ave.
Minneapolis, MN 55402
1944 | | Board member since 11/02 for RiverSource Funds and since 6/11 for Nations Funds | | Managing Director, Forester Biotech (consulting) since 2001; Chief Executive Officer and Director, RiboNovix, Inc., (biotechnology) 2003-2010; President and Chief Executive Officer of CMT Inc., 2001-2003; Aquila Biopharmaceuticals Inc., 1996-2000; Cambridge Biotech Corporation, 1995-1996, Mitotix Inc., 1993-1994 | | | 127 | | | Director, Healthways, Inc. (health and well-being solutions) since 2005; Director, ICI Mutual Insurance Company, RRG since 2011; Director, Abt Associates (government contractor) since 2001; Director, Boston Children's Hospital since 2002 | |
Annual Report 2015
39
COLUMBIA SMALL CAP VALUE FUND II
TRUSTEES AND OFFICERS (continued)
Interested Trustee Not Affiliated with Investment Manager*
Name,
Address,
Year of Birth | | Position Held With
Funds and Length of
Service | | Principal Occupation
During Past Five Years | | Number of
Funds in the
Fund Family
Overseen by
Board Member | | Other Present or Past
Directorships/
Trusteeships
(Within Past 5 Years) | |
Anthony M. Santomero
901 S. Marquette Ave.
Minneapolis, MN 55402
1946 | | Board member since 6/11 for RiverSource Funds and since 1/08 for Nations Funds | | Richard K. Mellon Professor Emeritus of Finance, The Wharton School, University of Pennsylvania, since 2002; Senior Advisor, McKinsey & Company (consulting), 2006-2008; President, Federal Reserve Bank of Philadelphia, 2000-2006, Professor of Finance, The Wharton School, University of Pennsylvania, 1972-2002 | | | 125 | | | Director, Renaissance Reinsurance Ltd. since May 2008; Trustee, Penn Mutual Life Insurance Company since March 2008; Director, Citigroup Inc. since 2009; Director, Citibank, N.A. since 2009; former Trustee, BofA Funds Series Trust (11 funds), 2008-2011 | |
* Dr. Santomero is not an affiliated person of the Investment Manager or Ameriprise Financial. However, he is currently deemed by the Funds to be an "interested person" (as defined in the 1940 Act) of the Funds because he serves as a Director of Citigroup Inc. and Citibank, N.A., companies that may directly or through subsidiaries and affiliates engage from time-to-time in brokerage execution, principal transactions and lending relationships with the Funds or accounts advised/managed by the Investment Manager.
Annual Report 2015
40
COLUMBIA SMALL CAP VALUE FUND II
TRUSTEES AND OFFICERS (continued)
Interested Trustee Affiliated with Investment Manager*
Name,
Address,
Year of Birth | | Position Held With
Funds and Length of
Service | | Principal Occupation
During Past Five Years | | Number of
Funds in the
Fund Family
Overseen by
Board Member | | Other Present or Past
Directorships/
Trusteeships
(Within Past 5 Years) | |
William F. Truscott
53600 Ameriprise
Financial Center
Minneapolis, MN 55474
1960 | | Board member since 11/01 for RiverSource Funds and since 6/11 for Nations Funds; Senior Vice President since 2002 for RiverSource Funds and since 5/10 for Nations Funds | | Chairman of the Board and President, Columbia Management Investment Advisers, LLC since May 2010 and February 2012, respectively (previously President and Chief Investment Officer, 2001-April 2010); Chief Executive Officer, Global Asset Management, Ameriprise Financial, Inc. since September 2012 (previously Chief Executive Officer, U.S. Asset Management & President, Annuities, May 2010-September 2012 and President — U.S. Asset Management and Chief Investment Officer, 2005-April 2010); Director and Chief Executive Officer, Columbia Management Investment Distributors, Inc. since May 2010 and February 2012, respectively (previously Chairman of the Board and Chief Executive Officer, 2006-April 2010); Chairman of the Board and Chief Executive Officer, RiverSource Distributors, Inc. since 2006; Director, Threadneedle Asset Management Holdings, SARL since 2014; President and Chief Executive Officer, Ameriprise Certificate Company, 2006-August 2012 | | | 186 | | | Former Director, Ameriprise Certificate Company, 2006-January 2013 | |
* Interested person (as defined under the 1940 Act) by reason of being an officer, director, security holder and/or employee of the Investment Manager or Ameriprise Financial.
The Statement of Additional Information has additional information about the Fund's Board members and is available, without charge, upon request by calling 800.345.6611; contacting your financial intermediary or visiting columbiathreadneedle.com/us.
Annual Report 2015
41
COLUMBIA SMALL CAP VALUE FUND II
TRUSTEES AND OFFICERS (continued)
The Board has appointed officers who are responsible for day-to-day business decisions based on policies it has established. The officers serve at the pleasure of the Board. In addition to Mr. Truscott, who is Senior Vice President, the Funds' other officers are:
Fund Officers
Name,
Address and
Year of Birth | | Position and Year
First Appointed to
Position for any Fund
in the Columbia
Funds Complex or a
Predecessor Thereof | | Principal Occupation(s) During Past Five Years | |
Christopher O. Petersen
5228 Ameriprise
Financial Center
Minneapolis, MN 55474
Born 1970 | | President and Principal Executive Officer (2015) | | Vice President and Lead Chief Counsel, Ameriprise Financial, Inc. since January 2015 (previously, Vice President and Chief Counsel January 2010-December 2014; and Vice President and Group Counsel or Counsel 2004-January 2010); officer of Columbia Funds and affiliated funds since 2007. | |
Michael G. Clarke
225 Franklin Street
Boston, MA 02110
Born 1969 | | Treasurer (2011) and Chief Financial Officer (2009) | | Vice President — Mutual Fund Administration, Columbia Management Investment Advisers, LLC, since May 2010; Managing Director of Fund Administration, Columbia Management Advisors, LLC, September 2004-April 2010; senior officer of Columbia Funds and affiliated funds since 2002. | |
Paul B. Goucher
100 Park Avenue
New York, NY 10017
Born 1968 | | Senior Vice President (2011), Chief Legal Officer (2015) and Assistant Secretary (2008) | | Vice President and Lead Chief Counsel, Ameriprise Financial, Inc. since November 2008 and January 2013, respectively (previously Chief Counsel, January 2010-January 2013 and Group Counsel, November 2008-January 2010). | |
Thomas P. McGuire
225 Franklin Street
Boston, MA 02110
Born 1972 | | Vice President and Chief Compliance Officer (2012) | | Vice President — Asset Management Compliance, Ameriprise Financial, Inc., since May 2010; Chief Compliance Officer, Ameriprise Certificate Company since September 2010; Compliance Executive, Bank of America, 2005-April 2010. | |
Colin Moore
225 Franklin Street
Boston, MA 02110
Born 1958 | | Senior Vice President (2010) | | Executive Vice President and Global Chief Investment Officer, Ameriprise Financial, Inc., since July 2013; Director and Global Chief Investment Officer, Columbia Management Investment Advisers, LLC since May 2010; Manager, Managing Director and Chief Investment Officer, Columbia Management Advisors, LLC, 2007-April 2010. | |
Michael E. DeFao
225 Franklin Street
Boston, MA 02110
Born 1968 | | Vice President (2011) and Assistant Secretary (2010) | | Vice President and Chief Counsel, Ameriprise Financial, Inc. since May 2010; Associate General Counsel, Bank of America, 2005-April 2010. | |
Joseph F. DiMaria
225 Franklin Street
Boston, MA 02110
Born 1968 | | Vice President (2011), Assistant Treasurer (2012) and Chief Accounting Officer (2008) | | Vice President — Mutual Fund Treasurer, Columbia Management Investment Advisers, LLC since May 2010; Director of Fund Administration, Columbia Management Advisors, LLC, 2006-April 2010. | |
Amy Johnson
5228 Ameriprise
Financial Center
Minneapolis, MN 55474
Born 1965 | | Vice President (2006) | | Managing Director and Chief Operating Officer, Columbia Management Investment Advisers, LLC since May 2010 (previously Chief Administrative Officer, 2009-April 2010, and Vice President — Asset Management and Trust Company Services, 2006-2009). | |
Lyn Kephart-Strong
5228 Ameriprise
Financial Center
Minneapolis, MN 55474
Born 1960 | | Vice President (2015) | | President, Columbia Management Investment Services Corp. since October 2014; Vice President & Resolution Officer, Ameriprise Trust Company since August 2009; President, RiverSource Service Corporation 2004-2010. | |
Ryan C. Larrenaga
225 Franklin Street
Boston, MA 02110
Born 1970 | | Vice President and Secretary (2015) | | Vice President and Group Counsel, Ameriprise Financial, Inc. since August 2011 (previously, Counsel from May 2010 to August 2011); Assistant General Counsel, Bank of America, 2005-April 2010; officer of Columbia Funds and affiliated funds since 2005. | |
Annual Report 2015
42
COLUMBIA SMALL CAP VALUE FUND II
IMPORTANT INFORMATION ABOUT THIS REPORT
Each fund mails one shareholder report to each shareholder address. If you would like more than one report, please call shareholder services at 800.345.6611 and additional reports will be sent to you.
The policy of the Board is to vote the proxies of the companies in which each fund holds investments consistent with the procedures as stated in the Statement of Additional Information (SAI). You may obtain a copy of the SAI without charge by calling 800.345.6611; contacting your financial intermediary; visiting columbiathreadneedle.com/us; or searching the website of the Securities and Exchange Commission (SEC) at sec.gov. Information regarding how each fund voted proxies relating to portfolio securities is filed with the SEC by August 31st for the most recent 12-month period ending June 30th of that year, and is available without charge by visiting columbiathreadneedle.com/us; or searching the website of the SEC at sec.gov.
Each fund files a complete schedule of portfolio holdings with the SEC for the first and third quarters of each fiscal year on Form N-Q. Each fund's Form N-Q is available on the SEC's website at sec.gov and may be reviewed and copied at the SEC's Public Reference Room in Washington, D.C. Information on the operation of the Public Reference Room may be obtained by calling 800.SEC.0330. Each fund's complete schedule of portfolio holdings, as filed on Form N-Q, can also be obtained without charge, upon request, by calling 800.345.6611.
Annual Report 2015
43
Columbia Small Cap Value Fund II
P.O. Box 8081
Boston, MA 02266-8081

This information is for use with concurrent or prior delivery of a fund prospectus. Please read and consider the investment objectives, risks, charges and expenses for any fund carefully before investing. For a prospectus and summary prospectus, which contains this and other important information about the Fund, go to columbiathreadneedle.com/us. The Fund is distributed by Columbia Management Investment Distributors, Inc., member FINRA, and managed by Columbia Management Investment Advisers, LLC.
Columbia Threadneedle Investments (Columbia Threadneedle) is the global brand name of the Columbia and Threadneedle group of companies.
All rights reserved. Columbia Management Investment Distributors, Inc., 225 Franklin Street, Boston, MA 02110-2804
© 2015 Columbia Management Investment Advisers, LLC.
columbiathreadneedle.com/us
ANN230_02_E01_(04/15)
Item 2. Code of Ethics.
(a) The registrant has adopted a code of ethics that applies to the registrant’s principal executive officer, principal financial officer, principal accounting officer or controller, or persons performing similar functions, regardless of whether these individuals are employed by the registrant or a third party.
(b) During the period covered by this report, there were not any amendments to a provision of the code of ethics adopted in 2(a) above.
(c) During the period covered by this report, there were no waivers, including any implicit waivers, from a provision of the code of ethics described in 2(a) above that relates to one or more of the items set forth in paragraph (b) of this item’s instructions.
Item 3. Audit Committee Financial Expert.
The registrant’s Board of Trustees has determined that Edward J. Boudreau, Pamela G. Carlton, William A. Hawkins and Alison Taunton-Rigby, each of whom are members of the registrant’s Board of Trustees and Audit Committee, each qualify as an audit committee financial expert. Mr. Boudreau, Ms. Carlton, Mr. Hawkins and Ms. Taunton-Rigby are each independent trustees, as defined in paragraph (a)(2) of this item’s instructions.
Item 4. Principal Accountant Fees and Services.
Fee information below is disclosed for the sixteen series of the registrant whose report to stockholders are included in this annual filing. Fiscal year 2014 includes fees for two series that merged away during the period.
(a) Audit Fees. Aggregate Audit Fees billed by the principal accountant for professional services rendered during the fiscal years ended February 28, 2015 and February 28, 2014 are approximately as follows:
2015 | | 2014 | |
$ | 339,000 | | $ | 336,400 | |
| | | | | |
Audit Fees include amounts related to the audit of the registrant’s annual financial statements or services that are normally provided by the accountant in connection with statutory and regulatory filings or engagements for those fiscal years.
(b) Audit-Related Fees. Aggregate Audit-Related Fees billed to the registrant by the principal accountant for professional services rendered during the fiscal years ended February 28, 2015 and February 28, 2014 are approximately as follows:
Audit-Related Fees include amounts for assurance and related services by the principal accountant that are reasonably related to the performance of the audit of the registrant’s financial statements and are not reported in Audit Fees above. In both fiscal years 2015 and 2014, Audit-Related Fees consist of agreed-upon procedures performed for semi-annual shareholder reports. Fiscal year 2014 also includes Audit-Related Fees for agreed-upon procedures related to fund mergers.
During the fiscal years ended February 28, 2015 and February 28, 2014, there were no Audit-Related Fees billed by the registrant’s principal accountant to the registrant’s investment adviser (not including any sub-adviser whose role is primarily portfolio management and is subcontracted with or overseen by another investment adviser) and any entity controlling, controlled by, or under common control with the adviser that provides ongoing services to the registrant for an engagement that related directly to the operations and financial reporting of the registrant.
(c) Tax Fees. Aggregate Tax Fees billed by the principal accountant to the registrant for professional services rendered during the fiscal years ended February 28, 2015 and February 28, 2014 are approximately as follows:
2015 | | 2014 | |
$ | 98,000 | | $ | 124,400 | |
| | | | | |
Tax Fees include amounts for the review of annual tax returns, the review of required shareholder distribution calculations and typically include amounts for professional services by the principal accountant for tax compliance, tax advice and tax planning. In both fiscal years 2015 and 2014, Tax Fees also include agreed-upon procedures related to foreign tax filings. In fiscal year 2014, Tax Fees also include agreed-upon procedures related to fund mergers and the review of final tax returns.
During the fiscal years ended February 28, 2015 and February 28, 2014, there were no Tax Fees billed by the registrant’s principal accountant to the registrant’s investment adviser (not including any sub-adviser whose role is primarily portfolio management and is subcontracted with or overseen by another investment adviser) and any entity controlling, controlled by, or under common control with the adviser that provides ongoing services to the registrant for an engagement that related directly to the operations and financial reporting of the registrant.
(d) All Other Fees. Aggregate All Other Fees billed by the principal accountant to the registrant for professional services rendered during the fiscal years ended February 28, 2015 and February 28, 2014 are approximately as follows:
All Other Fees include amounts for products and services provided by the principal accountant, other than the services reported in paragraphs (a) through (c) above.
Aggregate All Other Fees billed by the registrant’s principal accountant to the registrant’s investment adviser (not including any sub-adviser whose role is primarily portfolio management and is subcontracted with or overseen by another investment adviser) and any entity controlling, controlled by, or under common control with the adviser that provides ongoing services to the registrant for an engagement that related directly to the operations and financial reporting of the registrant during the fiscal years ended February 28, 2015 and February 28, 2014 are approximately as follows:
2015 | | 2014 | |
$ | 440,000 | | $ | 135,000 | |
| | | | | |
In both fiscal years 2015 and 2014, All Other Fees primarily consist of fees billed for internal control examinations of the registrant’s transfer agent and investment advisor.
(e)(1) Audit Committee Pre-Approval Policies and Procedures
The registrant’s Audit Committee is required to pre-approve the engagement of the registrant’s independent auditors to provide audit and non-audit services to the registrant and non-audit services to its investment adviser (excluding any sub-adviser whose role is primarily portfolio management and is sub-contracted or overseen by another investment adviser (the “Adviser”) or any entity controlling, controlled by or under common control with the Adviser that provides ongoing services to the Fund (a “Control Affiliate”) if the engagement relates directly to the operations and financial reporting of the registrant.
The Audit Committee has adopted a Policy for Engagement of Independent Auditors for Audit and Non-Audit Services (the “Policy”). The Policy sets forth the understanding of the Audit Committee regarding the engagement of the registrant’s independent accountants to provide (i) audit and permissible audit-related, tax and other services to the registrant (“Fund Services”); (ii) non-audit services to the registrant’s Adviser and any Control Affiliates, that relates directly to the operations and financial reporting of a Fund (“Fund-related Adviser Services”); and (iii) certain other audit and non-audit services to the registrant’s Adviser and its Control Affiliates. A service will require specific pre-approval by the Audit Committee if it is to be provided by the Fund’s independent auditor; provided, however, that pre-approval of non-audit services to the Fund, the Adviser or Control Affiliates may be waived if certain de minimis requirements set forth in the SEC’s rules are met.
Under the Policy, the Audit Committee may delegate pre-approval authority to any pre-designated member or members who are independent board members. The member(s) to whom such authority is delegated must report, for informational purposes only, any pre-approval decisions to the Audit Committee at its next regular meeting. The Audit Committee’s responsibilities with respect to the pre-approval of services performed by the independent auditor may not be delegated to management.
On an annual basis, at a regularly scheduled Audit Committee meeting, the Fund’s Treasurer or other Fund officer shall submit to the Audit Committee a schedule of the types of Fund Services and Fund-related Adviser Services that are subject to specific pre-approval. This schedule will provide a description of each type of service that is subject to specific pre-approval, along with total projected fees for each service. The pre-approval will generally cover a one-year period. The Audit Committee will review and approve the types of services and the projected fees for the next one-year period and may add to, or subtract from, the list of pre-approved services from time to time, based on subsequent determinations. This specific approval acknowledges that the Audit Committee is in agreement with the specific types of services that the independent auditor will be permitted to perform and the projected fees for each service.
The Fund’s Treasurer or other Fund officer shall report to the Audit Committee at each of its regular meetings regarding all Fund Services or Fund-related Adviser Services provided since the last such report was rendered, including a description of the services, by category, with forecasted fees for the annual reporting period, proposed changes requiring specific pre-approval and a description of services provided by the independent auditor, by category, with actual fees during the current reporting period.
*****
(e)(2) 100% of the services performed for items (b) through (d) above during 2015 and 2014 were pre-approved by the registrant’s Audit Committee.
(f) Not applicable.
(g) The aggregate non-audit fees billed by the registrant’s accountant for services rendered to the registrant, and rendered to the registrant’s investment adviser (not including any sub-adviser whose role is primarily portfolio management and is subcontracted with or overseen by another investment adviser), and any entity controlling, controlled by, or under common control with the adviser that provides ongoing services to the registrant for the fiscal years ended February 28, 2015 and February 28, 2014 are approximately as follows:
2015 | | 2014 | |
$ | 544,400 | | $ | 267,800 | |
| | | | | |
(h) The registrant’s Audit Committee of the Board of Directors has considered whether the provision of non-audit services that were rendered to the registrant’s adviser (not including any sub-adviser whose role is primarily portfolio management and is subcontracted with or overseen by another investment adviser), and any entity controlling, controlled by, or under common control with the investment adviser that provides ongoing services to the registrant that were not pre-approved pursuant to paragraph (c)(7)(ii) of Rule 2-01 of Regulation S-X, is compatible with maintaining the principal accountant’s independence.
Item 5. Audit Committee of Listed Registrants.
Not applicable.
Item 6. Investments
(a) The registrant’s “Schedule I — Investments in securities of unaffiliated issuers” (as set forth in 17 CFR 210.12-12) is included in Item 1 of this Form N-CSR.
(b) Not applicable.
Item 7. Disclosure of Proxy Voting Policies and Procedures for Closed-End Management Investment Companies.
Not applicable.
Item 8. Portfolio Managers of Closed-End Management Investment Companies.
Not applicable.
Item 9. Purchases of Equity Securities by Closed-End Management Investment Company and Affiliated Purchasers.
Not applicable.
Item 10. Submission of Matters to a Vote of Security Holders.
There were no material changes to the procedures by which shareholders may recommend nominees to the registrant’s board of directors.
Item 11. Controls and Procedures.
(a) The registrant’s principal executive officer and principal financial officers, based on their evaluation of the registrant’s disclosure controls and procedures as of a date within 90 days of the filing of this report, have concluded that such controls and procedures are adequately designed to ensure that material information required to be disclosed by the registrant in Form N-CSR is accumulated and communicated to the registrant’s management, including the principal executive officer and principal financial officer, or persons performing similar functions, as appropriate to allow timely decisions regarding required disclosure.
(b) There was no change in the registrant’s internal control over financial reporting that occurred during the registrant’s second fiscal quarter of the period covered by this report that has materially affected, or is reasonably likely to materially affect, the registrant’s internal control over financial reporting.
Item 12. Exhibits.
(a)(1) Code of ethics required to be disclosed under Item 2 of Form N-CSR attached hereto as Exhibit 99.CODE ETH.
(a)(2) Certifications pursuant to Rule 30a-2(a) under the Investment Company Act of 1940 (17 CFR 270.30a-2(a)) attached hereto as Exhibit 99.CERT.
(a)(3) Not applicable.
(b) Certification pursuant to Rule 30a-2(b) under the Investment Company Act of 1940 (17 CFR 270.30a-2(b)) attached hereto as Exhibit 99.906CERT.
SIGNATURES
Pursuant to the requirements of the Securities Exchange Act of 1934 and the Investment Company Act of 1940, the registrant has duly caused this report to be signed on its behalf by the undersigned, thereunto duly authorized.
(registrant) | | Columbia Funds Series Trust | |
| | |
| | |
By (Signature and Title) | /s/ Christopher O. Petersen | |
| Christopher O. Petersen, President and Principal Executive Officer | |
| | |
| | |
Date | | April 21, 2015 | |
| | | | |
Pursuant to the requirements of the Securities Exchange Act of 1934 and the Investment Company Act of 1940, this report has been signed below by the following persons on behalf of the registrant and in the capacities and on the dates indicated.
By (Signature and Title) | /s/ Christopher O. Petersen | |
| Christopher O. Petersen, President and Principal Executive Officer | |
| | |
| | |
Date | | April 21, 2015 | |
| | |
| | |
By (Signature and Title) | /s/ Michael G. Clarke | |
| Michael G. Clarke, Treasurer and Chief Financial Officer | |
| | |
| | |
Date | | April 21, 2015 | |