UNITED STATES
SECURITIES AND EXCHANGE COMMISSION
Washington, D.C. 20549
FORM N-CSR
CERTIFIED SHAREHOLDER REPORT OF REGISTERED
MANAGEMENT INVESTMENT COMPANIES
Investment Company Act file number | 811-09645 |
|
Columbia Funds Series Trust |
(Exact name of registrant as specified in charter) |
|
50606 Ameriprise Financial Center Minneapolis, MN | | 55474 |
(Address of principal executive offices) | | (Zip code) |
|
Ryan Larrenaga c/o Columbia Management Investment Advisers, LLC 225 Franklin Street Boston, MA 02110 |
(Name and address of agent for service) |
|
Registrant’s telephone number, including area code: | (800) 345-6611 | |
|
Date of fiscal year end: | January 31 | |
|
Date of reporting period: | January 31, 2016 | |
| | | | | | | | |
Form N-CSR is to be used by management investment companies to file reports with the Commission not later than 10 days after the transmission to stockholders of any report that is required to be transmitted to stockholders under Rule 30e-1 under the Investment Company Act of 1940 (17 CFR 270.30e-1). The Commission may use the information provided on Form N-CSR in its regulatory, disclosure review, inspection, and policymaking roles.
A registrant is required to disclose the information specified by Form N-CSR, and the Commission will make this information public. A registrant is not required to respond to the collection of information contained in Form N-CSR unless the Form displays a currently valid Office of Management and Budget (“OMB”) control number. Please direct comments concerning the accuracy of the information collection burden estimate and any suggestions for reducing the burden to Secretary, Securities and Exchange Commission, 450 Fifth Street, NW, Washington, DC 20549-0609. The OMB has reviewed this collection of information under the clearance requirements of 44 U.S.C. § 3507.
Item 1. Reports to Stockholders.

ANNUAL REPORT
January 31, 2016

COLUMBIA GLOBAL STRATEGIC EQUITY FUND


ABOUT COLUMBIA THREADNEEDLE INVESTMENTS
Columbia Threadneedle Investments is a leading global asset management group that provides a broad range of actively managed investment strategies and solutions for individual, institutional and corporate clients around the world.
With more than 2,000 people, including over 450 investment professionals based in North America, Europe and Asia, we manage $472 billion* of assets across developed and emerging market equities, fixed income, asset allocation solutions and alternatives. We are the 13th largest manager of long-term mutual fund assets in the U.S.** and the 4th largest manager of retail funds in the U.K.***
Our priority is the investment success of our clients. We aim to deliver the investment outcomes they expect through an investment approach that is team-based, performance-driven and risk-aware. Our culture is dynamic and interactive. By sharing our insights across asset classes and geographies, we generate richer perspectives on global, regional and local investment landscapes. The ability to exchange and debate investment ideas in a collaborative environment enriches our teams' investment processes. More importantly, it results in better informed investment decisions for our clients.
Columbia funds are distributed by Columbia Management Investment Distributors, Inc., member FINRA, and managed by Columbia Management Investment Advisers, LLC.
Columbia Threadneedle Investments (Columbia Threadneedle) is the global brand name of the Columbia and Threadneedle group of companies.
* In U.S. dollars as of December 31, 2015. Source: Ameriprise Q4 Earnings Release. Includes all assets managed by entities in the Columbia and Threadneedle groups of companies. Contact us for more current data.
** Source: ICI as of December 31, 2015 for Columbia Management Investment Advisers, LLC.
*** Source: Investment Association as of September 2015 for Threadneedle Asset Management Limited.
© 2016 Columbia Management Investment Advisers, LLC. All rights reserved.
Not part of the shareholder report
Investment strategies to help meet investor needs
We are committed to helping investors navigate financial challenges to reach their desired outcomes. The possibilities are endless.
Your success is our priority.
 Retire comfortably
 Fund college or higher education
 Leave a legacy

Generate an appropriate stream of income in retirement
Traditional approaches to income may no longer be adequate — and they may no longer provide the diversification benefits they once did. Investors need to rethink how they generate retirement income.
Worried about running out of income? You are not alone.

Navigate a changing interest rate environment
Even in today's challenging interest rate environment, it's still possible to navigate markets and achieve your goals.
Make investment choices designed specifically for this market environment.

Maximize after-tax returns
In an environment where what you keep is more important than what you earn, municipal bonds can help mitigate higher taxes while providing attractive yields compared to other investment options.
You've worked too hard building your wealth to lose it to taxes.

Grow assets to achieve financial goals
Finding growth opportunities in today's complex market environment requires strong research capabilities, creative thinking and a disciplined approach.
Do your investments deliver the portfolio growth you need?

Ease the impact of volatile markets
With increasing concerns about market volatility, investors should consider diversifying their portfolios with non-traditional holdings.
Interested in turning volatility into opportunity?
To find out more, contact your financial professional, call 800.426.3750 or visit columbiathreadneedle.com/us
Not part of the shareholder report
Get the market insight you need from our investment experts and subscribe to our latest publications


Stay informed with Columbia Threadneedle Investments
Investor insight
Find economic and market commentary, investment videos, white papers, mutual fund commentary and more at columbiathreadneedle.com/us.
Subscribe to the latest information from Columbia Threadneedle. Register your information online at columbiathreadneedle.com/us/subscribe and select the publications you would like to receive, including:
n Columbia Threadneedle Investor Newsletter, highlighting the latest macro- and micro-economic trends, investment themes, products, service changes and other items of interest to our investors
n Investment Strategy Outlook, showcasing the Columbia Threadneedle Asset Allocation Team's perspective on global economic investment conditions and markets
n MarketTrack, featuring straightforward insight on current investment opportunities
n White papers that delve deep into a variety of investment topics
n Quarterly portfolio manager commentary and fund fact sheets
Update your subscriptions at any time by accessing the email subscription center.
Social media 
We offer you multiple ways to access our market commentary and investment insights.
n Perspectives blog at columbiathreadneedle.com/us
Read timely posts by our investment team, including our chief investment officer, chief economist and portfolio managers.
n Twitter.com/CTinvest_US
Follow us on Twitter for quick, up-to-the-minute comments on market news and more.
n Youtube.com/CTInvestUS
View our commentaries on the economy, markets and current investment opportunities.
n Linkedin.com/company/Columbia-Threadneedle-Investments-US
Connect with us on LinkedIn for updates from our thought leaders.
Not part of the shareholder report
 Dear Shareholder,
Today's investors are typically focused on outcomes, like living a certain retirement lifestyle, paying for college education or building a legacy. But in today's complex global investment landscape, even simple goals are not easily achieved.
At Columbia Threadneedle Investments, we aspire to help satisfy five core needs of today's investors:
n Generate an appropriate stream of income in retirement
Traditional approaches to generating income may not provide the diversification benefits they once did, and they may actually introduce unwanted risk in today's market. To seek to improve your potential to live comfortably long term, we endeavor to pursue investments that explore less traveled paths to income.
n Navigate a changing interest rate environment
Today's uncertain market environment includes the prospect of a rise in interest rates. Blending traditional investments with non-traditional or alternative products may help protect your wealth during periods of volatility. We can attempt to help strengthen your portfolio with agile products designed to take on the market's ups and downs.
n Maximize after-tax returns
In an environment where what you keep may be more important than what you earn, municipal bonds can help mitigate high tax burdens while providing potentially attractive yields. Our state and federal tax-exempt products are aimed at helping investors manage risk, minimize the fluctuation of capital and grow wealth on a more tax-efficient basis.
n Grow assets to achieve financial goals
We believe that finding and protecting growth comes from a disciplined security selection process designed to create excess return. Our goal is to provide investment solutions built to help you face today's market challenges and grow your assets at each crossroad of your journey.
n Ease the impact of volatile markets
Despite a bull market run that has benefited many investors over the past several years, it's important to remember the lessons of 2008 and the value that a well-diversified portfolio may provide through times of market volatility. We are here to help you hold onto the savings you have worked tirelessly to amass, and to provide you the best opportunity to maintain your standard of living regardless of market conditions.
Find out today how we can help you confidently invest to realize your dreams. Please visit us at blog.columbiathreadneedleus.com/our-best-ideas to learn more about our unique investment solutions.
The world is constantly changing, but our priority remains the same: to help you secure your finances, meet your goals and achieve success. Thank you for your continued investment with us.
Sincerely,

Christopher O. Petersen
President, Columbia Funds
Investors should consider the investment objectives, risks, charges and expenses of a mutual fund carefully before investing. For a free prospectus and summary prospectus, which contains this and other important information about a fund, visit columbiathreadneedle.com/us. The prospectus should be read carefully before investing.
Columbia Funds are distributed by Columbia Management Investment Distributors, Inc., member FINRA, and managed by Columbia Management Investment Advisers, LLC.
© 2016 Columbia Management Investment Advisers, LLC. All rights reserved.
COLUMBIA GLOBAL STRATEGIC EQUITY FUND
Fund Investment Manager
Columbia Management Investment
Advisers, LLC
225 Franklin Street
Boston, MA 02110
Fund Distributor
Columbia Management Investment
Distributors, Inc.
225 Franklin Street
Boston, MA 02110
Fund Transfer Agent
Columbia Management Investment
Services Corp.
P.O. Box 8081
Boston, MA 02266-8081
For more information about any of the funds, please visit columbiathreadneedle.com/us or call 800.345.6611. Customer Service Representatives are available to answer your questions Monday through Friday from 8 a.m. to 7 p.m. Eastern time.
The views expressed in this report reflect the current views of the respective parties. These views are not guarantees of future performance and involve certain risks, uncertainties and assumptions that are difficult to predict, so actual outcomes and results may differ significantly from the views expressed. These views are subject to change at any time based upon economic, market or other conditions and the respective parties disclaim any responsibility to update such views. These views may not be relied on as investment advice and, because investment decisions for a Columbia fund are based on numerous factors, may not be relied on as an indication of trading intent on behalf of any particular Columbia fund. References to specific securities should not be construed as a recommendation or investment advice.
Performance Overview | | | 3 | | |
Manager Discussion of Fund Performance | | | 5 | | |
Understanding Your Fund's Expenses | | | 7 | | |
Portfolio of Investments | | | 8 | | |
Statement of Assets and Liabilities | | | 14 | | |
Statement of Operations | | | 16 | | |
Statement of Changes in Net Assets | | | 17 | | |
Financial Highlights | | | 19 | | |
Notes to Financial Statements | | | 27 | | |
Report of Independent Registered Public Accounting Firm | | | 35 | | |
Federal Income Tax Information | | | 36 | | |
Trustees and Officers | | | 37 | | |
Important Information About This Report | | | 43 | | |
COLUMBIA GLOBAL STRATEGIC EQUITY FUND
Performance Summary
n Columbia Global Strategic Equity Fund (the Fund) Class A shares returned -6.66% excluding sales charges for the 12-month period that ended January 31, 2016.
n While absolute returns disappointed, the Fund outperformed its benchmark, the MSCI ACWI (Net), which returned -6.80% during the period.
n We attribute the Fund's outperformance of its benchmark primarily to positioning, via underlying funds, in information technology and materials, which more than offset positioning in consumer staples, which detracted.
Average Annual Total Returns (%) (for period ended January 31, 2016)
| | | Inception | | 1 Year | | 5 Years | | 10 Years | |
Class A | | 10/15/96 | | | | | | | |
Excluding sales charges | | | | | | | -6.66 | | | | 6.04 | | | | 4.89 | | |
Including sales charges | | | | | | | -12.05 | | | | 4.79 | | | | 4.27 | | |
Class B | | 08/12/97 | | | | | | | |
Excluding sales charges | | | | | | | -7.40 | | | | 5.25 | | | | 4.11 | | |
Including sales charges | | | | | | | -10.99 | | | | 4.94 | | | | 4.11 | | |
Class C | | 10/15/96 | | | | | | | |
Excluding sales charges | | | | | | | -7.38 | | | | 5.26 | | | | 4.11 | | |
Including sales charges | | | | | | | -8.10 | | | | 5.26 | | | | 4.11 | | |
Class K* | | 03/07/11 | | | -6.59 | | | | 6.15 | | | | 4.95 | | |
Class R | | 01/23/06 | | | -6.91 | | | | 5.79 | | | | 4.63 | | |
Class R4* | | 11/08/12 | | | -6.55 | | | | 6.20 | | | | 4.97 | | |
Class R5* | | 11/08/12 | | | -6.32 | | | | 6.32 | | | | 5.03 | | |
Class Z | | 10/15/96 | | | -6.48 | | | | 6.32 | | | | 5.17 | | |
MSCI ACWI (Net) | | | | | | | -6.80 | | | | 4.45 | | | | 3.61 | | |
Returns for Class A are shown with and without the maximum initial sales charge of 5.75%. Returns for Class B are shown with and without the applicable contingent deferred sales charge (CDSC) of 5.00% in the first year, declining to 1.00% in the sixth year and eliminated thereafter. Returns for Class C are shown with and without the 1.00% CDSC for the first year only. The Fund's other classes are not subject to sales charges and have limited eligibility. Please see the Fund's prospectus for details. Performance for different share classes will vary based on differences in sales charges and fees associated with each class. All results shown assume reinvestment of distributions during the period. Returns do not reflect the deduction of taxes that a shareholder may pay on Fund distributions or on the redemption of Fund shares. Performance results reflect the effect of any fee waivers or reimbursements of Fund expenses by Columbia Management Investment Advisers, LLC and/or any of its affiliates. Absent these fee waivers or expense reimbursement arrangements, performance results would have been lower.
The performance information shown represents past performance and is not a guarantee of future results. The investment return and principal value of your investment will fluctuate so that your shares, when redeemed, may be worth more or less than their original cost. Current performance may be lower or higher than the performance information shown. You may obtain performance information current to the most recent month-end by contacting your financial intermediary, visiting columbiathreadneedle.com/us or calling 800.345.6611.
*The returns shown for periods prior to the share class inception date (including returns for the Life of the Fund, if shown, which are since Fund inception) include the returns of the Fund's oldest share class. Since the Fund launched more than one share class at its inception, Class A shares were used. These returns are adjusted to reflect any higher class-related operating expenses of the newer share classes, as applicable. Please visit columbiathreadneedle.com/us/investment-products/mutual-funds/appended-performance for more information.
On June 1, 2015, the MSCI ACWI (Net) (the New Index) replaced the S&P 500 Index (the Former Index) as the Fund's primary benchmark. The Fund's investment manager believes that the New Index provides a more appropriate basis for comparing the Fund's performance. Information on the New Index and the Former Index will be included for a one-year transition period.
The MSCI ACWI (Net) is a free float-adjusted market capitalization weighted index that is designed to measure the equity market performance of developed and emerging markets. The index consists of 45 country indices comprising 24 developed and 21 emerging market country indices.
The S&P 500 Index, an unmanaged index, measures the performance of 500 widely held, large-capitalization U.S. stocks and is frequently used as a general measure of market performance.
Indices are not available for investment, are not professionally managed and do not reflect sales charges, fees, brokerage commissions, taxes (except the MSCI ACWI (Net), which reflects reinvested dividends net of withholding taxes) or other expenses of investing. Securities in the Fund may not match those in an index.
Annual Report 2016
3
COLUMBIA GLOBAL STRATEGIC EQUITY FUND
PERFORMANCE OVERVIEW (continued)
Performance of a Hypothetical $10,000 Investment (February 1, 2006 – January 31, 2016)
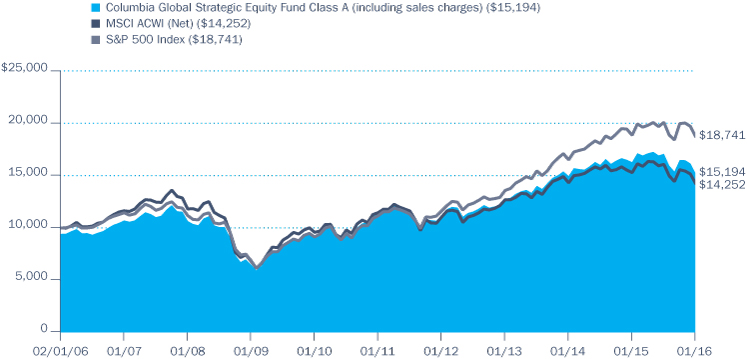
The chart above shows the change in value of a hypothetical $10,000 investment in Class A shares of Columbia Global Strategic Equity Fund during the stated time period, and does not reflect the deduction of taxes that a shareholder may pay on Fund distributions or on the redemption of Fund shares.
Annual Report 2016
4
COLUMBIA GLOBAL STRATEGIC EQUITY FUND
MANAGER DISCUSSION OF FUND PERFORMANCE
For the 12-month period that ended January 31, 2016, the Fund's Class A shares returned -6.66% excluding sales charges. While absolute returns disappointed, the Fund outperformed its benchmark, the MSCI ACWI (Net), which returned -6.80% during the period. We attribute the Fund's outperformance relative to its benchmark primarily to positioning, via underlying funds, in information technology and materials, which more than offset positioning in consumer staples, which detracted.
Global Equities Struggled Amid Low Economic Growth
The 12-month period ended January 31, 2016 was a difficult one for global equity markets. Low interest rates and low economic growth persisted across developed markets. Emerging markets were even harder hit not only by slowing economic growth but also by structural concerns, such as those seen in Greece. Most dramatically, perhaps, amid an imbalance of supply and demand, we saw plummeting commodity prices, which particularly impacted oil-producing nations and businesses. Divergent central bank policy, geopolitical risk, a strong U.S. dollar, a devaluation of China's renminbi and a broad overcapacity of industrial goods around the world further impacted global equity markets during the period.
The broad global equity market, as measured by the benchmark, underperformed the broad U.S. equity market. Within the benchmark, Denmark and Ireland were the best performers for the period, while Greece and Brazil were the biggest laggards. From a sector perspective, consumer staples was the only sector in the benchmark to post a positive absolute return during the period, as consumers benefited from savings at the gas pump. Other consumer-oriented sectors, including consumer discretionary, telecommunication services and health care, also outpaced the broad benchmark during the period. In contrast, materials and energy were the worst performers in the benchmark by a wide margin during the period, driven primarily by lower commodity prices.
Positioning In Information Technology and Materials Supported Relative Results
An overweight position in information technology and an underweight position in materials relative to the benchmark, via positions in underlying funds, contributed positively to the Fund's relative results. An overweighting allocation to Japan was the biggest regional positive contributor. Stock selection also proved effective, as the Fund's Japan sleeve, invested directly in Japanese equities, performed ahead of the relatively strong Japanese equity market. Other positive contributors included positions in underlying funds Columbia Contrarian Core Fund, Columbia Dividend Income Fund and Columbia Global Technology Growth Fund, each of which handily beat its respective underlying benchmark.
The sector that detracted most from relative results was consumer staples, as the Fund was underweight, via positions in underlying funds, the best performer in the benchmark during the period. Further, while the Fund's exposure to U.S. large-cap growth equities, via positions in Columbia Select Large Cap Growth Fund and Columbia Large Cap Growth Fund, performed well through much of the period, the significant sell-off of
Portfolio Management
Mark Burgess
Melda Mergen, CFA, CAIA*
*Effective March 9, 2016, Robert McConnaughey no longer serves as Portfolio Manager of the Fund. Melda Mergen was added as a Co-manager of the Fund.
Morningstar Style BoxTM
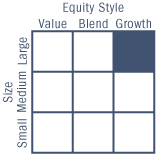
The Morningstar Style BoxTM is based on a fund's portfolio holdings. For equity funds, the vertical axis shows the market capitalization of the stocks owned, and the horizontal axis shows investment style (value, blend, or growth). Information shown is based on the most recent data provided by Morningstar.
© 2016 Morningstar, Inc. All rights reserved. The Morningstar information contained herein: (1) is proprietary to Morningstar and/or its content providers; (2) may not be copied or distributed; and (3) is not warranted to be accurate, complete or timely. Neither Morningstar nor its content providers are responsible for any damages or losses arising from any use of this information.
Portfolio Breakdown (%)
(at January 31, 2016) | |
Common Stocks | | | 10.2 | | |
Equity Funds | | | 83.5 | | |
Exchange-Traded Funds | | | 2.1 | | |
Fixed-Income Funds | | | 3.8 | | |
Money Market Funds | | | 0.4 | | |
Total | | | 100.0 | | |
Percentages indicated are based upon total investments. The Fund's portfolio composition is subject to change.
Annual Report 2016
5
COLUMBIA GLOBAL STRATEGIC EQUITY FUND
MANAGER DISCUSSION OF FUND PERFORMANCE (continued)
Investment Risks
Market risk may affect a single issuer, sector of the economy, industry or the market as a whole. Asset allocation does not assure a profit or protect against loss. The Fund's investment in other funds subjects it to the investment performance (positive or negative), risks and expenses of these underlying funds. ETFs trade like stocks, are subject to investment risk and will fluctuate in market value. Investment products, including shares of mutual funds, are not federally or FDIC-insured, are not deposits or obligations of, or guaranteed by any financial institution. The Fund may invest significantly in issuers within a particular sector, which may be negatively affected by market, economic or other conditions, making the Fund more vulnerable to unfavorable developments in the sector. International investing involves certain risks and volatility due to potential political, economic or currency instabilities and different financial and accounting standards. Investing in derivatives is a specialized activity that involves special risks, which may result in significant losses or limited gains. See the Fund's prospectus for information on these and other risks.
growth assets at year-end 2015 and early 2016 in favor of more value-oriented equities, ultimately dampened relative results for the period overall. Other notable detractors during the period were positions in underlying funds Columbia Convertible Securities Fund and Columbia Global Infrastructure Fund, which each saw surprisingly volatile asset class performance as well as relative underperformance to their respective investment universes.
Portfolio Changes
Changes within the portfolio can be driven by active trading, by directing allocations to select market segments or by market appreciation or depreciation within a given market segment, all via investments in underlying funds. During the period, the most notable changes in the Fund were driven by the change of benchmark index to the MSCI ACWI (Net). The Fund had always included significant global exposures but operated versus a U.S.-centric benchmark. To appropriately reflect this shift, we added significantly to the Fund's international exposures via underlying funds implementing global and international equity strategies.
Annual Report 2016
6
COLUMBIA GLOBAL STRATEGIC EQUITY FUND
UNDERSTANDING YOUR FUND'S EXPENSES
(Unaudited)
As an investor, you incur two types of costs. There are transaction costs, which generally include sales charges on purchases and may include redemption fees. There are also ongoing costs, which generally include management fees, distribution and/or service fees, and other fund expenses. The following information is intended to help you understand your ongoing costs (in dollars) of investing in the Fund and to help you compare these costs with the ongoing costs of investing in other mutual funds.
Analyzing Your Fund's Expenses
To illustrate these ongoing costs, we have provided examples and calculated the expenses paid by investors in each share class of the Fund during the period. The actual and hypothetical information in the table is based on an initial investment of $1,000 at the beginning of the period indicated and held for the entire period. Expense information is calculated two ways and each method provides you with different information. The amount listed in the "Actual" column is calculated using the Fund's actual operating expenses and total return for the period. You may use the Actual information, together with the amount invested, to estimate the expenses that you paid over the period. Simply divide your account value by $1,000 (for example, an $8,600 account value divided by $1,000 = 8.6), then multiply the results by the expenses paid during the period under the "Actual" column. The amount listed in the "Hypothetical" column assumes a 5% annual rate of return before expenses (which is not the Fund's actual return) and then applies the Fund's actual expense ratio for the period to the hypothetical return. You should not use the hypothetical account values and expenses to estimate either your actual account balance at the end of the period or the expenses you paid during the period. See "Compare With Other Funds" below for details on how to use the hypothetical data.
In addition to the ongoing expenses which the Fund bears directly, the Fund's shareholders indirectly bear the Fund's allocable share of the costs and expenses of each underlying fund in which the Fund invests. You can also estimate the effective expenses paid during the period, which includes the indirect fees associated with investing in the underlying funds, by using the amounts listed in the "Effective Expenses Paid During the Period" column.
Compare With Other Funds
Since all mutual funds are required to include the same hypothetical calculations about expenses in shareholder reports, you can use this information to compare the ongoing cost of investing in the Fund with other funds. To do so, compare the hypothetical example with the 5% hypothetical examples that appear in the shareholder reports of other funds. As you compare hypothetical examples of other funds, it is important to note that hypothetical examples are meant to highlight the ongoing costs of investing in a fund only and do not reflect any transaction costs, such as sales charges, or redemption or exchange fees. Therefore, the hypothetical calculations are useful in comparing ongoing costs only, and will not help you determine the relative total costs of owning different funds. If transaction costs were included in these calculations, your costs would be higher.
August 1, 2015 – January 31, 2016
| | | Account Value at
the Beginning of
the Period ($) | | Account Value at
the End of
the Period ($) | | Expenses Paid
During the
Period ($) | | Fund's Annualized
Expense Ratio (%) | | Effective Expenses
Paid During the
Period ($) | | Fund's Effective
Annualized
Expense Ratio (%) | |
| | | Actual | | Hypothetical | | Actual | | Hypothetical | | Actual | | Hypothetical | | Actual | | Actual | | Hypothetical | | Actual | |
Class A | | | 1,000.00 | | | | 1,000.00 | | | | 889.90 | | | | 1,022.34 | | | | 2.45 | | | | 2.62 | | | | 0.52 | | | | 5.98 | | | | 6.40 | | | | 1.27 | | |
Class B | | | 1,000.00 | | | | 1,000.00 | | | | 886.40 | | | | 1,018.60 | | | | 5.97 | | | | 6.39 | | | | 1.27 | | | | 9.50 | | | | 10.17 | | | | 2.02 | | |
Class C | | | 1,000.00 | | | | 1,000.00 | | | | 886.90 | | | | 1,018.60 | | | | 5.97 | | | | 6.39 | | | | 1.27 | | | | 9.50 | | | | 10.17 | | | | 2.02 | | |
Class K | | | 1,000.00 | | | | 1,000.00 | | | | 890.30 | | | | 1,022.84 | | | | 1.98 | | | | 2.12 | | | | 0.42 | | | | 5.51 | | | | 5.90 | | | | 1.17 | | |
Class R | | | 1,000.00 | | | | 1,000.00 | | | | 889.40 | | | | 1,021.09 | | | | 3.63 | | | | 3.88 | | | | 0.77 | | | | 7.16 | | | | 7.66 | | | | 1.52 | | |
Class R4 | | | 1,000.00 | | | | 1,000.00 | | | | 890.80 | | | | 1,023.59 | | | | 1.27 | | | | 1.36 | | | | 0.27 | | | | 4.81 | | | | 5.15 | | | | 1.02 | | |
Class R5 | | | 1,000.00 | | | | 1,000.00 | | | | 891.90 | | | | 1,024.08 | | | | 0.80 | | | | 0.86 | | | | 0.17 | | | | 4.34 | | | | 4.64 | | | | 0.92 | | |
Class Z | | | 1,000.00 | | | | 1,000.00 | | | | 891.50 | | | | 1,023.59 | | | | 1.27 | | | | 1.36 | | | | 0.27 | | | | 4.81 | | | | 5.15 | | | | 1.02 | | |
Expenses paid during the period are equal to the annualized expense ratio for each class as indicated above, multiplied by the average account value over the period and then multiplied by the number of days in the Fund's most recent fiscal half year and divided by 365.
Effective expenses paid during the period and the Fund's effective annualized expense ratio include expenses borne directly to the class plus the Fund's pro rata portion of the ongoing expenses charged by the underlying funds using the expense ratio of each class of the underlying funds as of the underlying fund's most recent shareholder report.
Annual Report 2016
7
COLUMBIA GLOBAL STRATEGIC EQUITY FUND
PORTFOLIO OF INVESTMENTS
January 31, 2016
(Percentages represent value of investments compared to net assets)
Equity Funds 83.4%
| | | Shares | | Value ($) | |
DIVIDEND INCOME 13.1% | |
Columbia Dividend Income Fund,
Class I Shares(a) | | | 1,546,484 | | | | 26,553,134 | | |
Columbia Global Dividend Opportunity
Fund, Class I Shares(a) | | | 3,659,863 | | | | 57,789,240 | | |
Total | | | | | 84,342,374 | | |
INTERNATIONAL 49.9% | |
Columbia Asia Pacific ex-Japan Fund,
Class I Shares(a) | | | 1,545,119 | | | | 13,875,173 | | |
Columbia Emerging Markets Fund,
Class I Shares(a)(b) | | | 2,109,773 | | | | 17,996,366 | | |
Columbia European Equity Fund,
Class I Shares(a) | | | 9,393,015 | | | | 57,297,390 | | |
Columbia Global Energy and Natural
Resources Fund, Class I Shares(a)(b) | | | 1,206,040 | | | | 16,884,557 | | |
Columbia Global Equity Value Fund,
Class I Shares(a) | | | 1,852,643 | | | | 19,045,170 | | |
Columbia Global Infrastructure Fund,
Class I Shares(a) | | | 2,374,594 | | | | 25,693,104 | | |
Columbia Global Technology Growth
Fund, Class I Shares(a)(b) | | | 3,012,176 | | | | 59,068,777 | | |
Columbia International Opportunities
Fund, Class I Shares(a)(b) | | | 2,134,832 | | | | 27,048,320 | | |
Columbia Overseas Value Fund,
Class I Shares(a) | | | 2,425,769 | | | | 18,702,676 | | |
Columbia Select Global Equity Fund,
Class I Shares(a) | | | 6,850,002 | | | | 65,212,022 | | |
Total | | | | | 320,823,555 | | |
U.S. LARGE CAP 16.6% | |
Columbia Contrarian Core Fund,
Class I Shares(a) | | | 1,860,167 | | | | 37,240,531 | | |
Columbia Disciplined Core Fund,
Class I Shares(a) | | | 2,393,964 | | | | 21,617,496 | | |
Columbia Large Cap Growth Fund,
Class I Shares(a)(b) | | | 1,077,990 | | | | 33,881,237 | | |
Columbia Select Large Cap Growth
Fund, Class I Shares(a)(b) | | | 923,460 | | | | 13,574,861 | | |
Total | | | | | 106,314,125 | | |
U.S. SMALL CAP 3.8% | |
Columbia Small Cap Growth Fund I,
Class I Shares(a)(b) | | | 1,590,402 | | | | 24,508,088 | | |
Total Equity Funds
(Cost: $627,618,048) | | | | | 535,988,142 | | |
Fixed-Income Funds 3.8%
| | | Shares | | Value ($) | |
CONVERTIBLE 3.8% | |
Columbia Convertible Securities Fund,
Class I Shares(a) | | | 1,623,781 | | | | 24,600,291 | | |
Total Fixed-Income Funds
(Cost: $24,360,465) | | | | | 24,600,291 | | |
Exchange-Traded Funds 2.1% | |
Financial Select Sector SPDR Fund | | | 623,746 | | | | 13,541,526 | | |
Total Exchange-Traded Funds
(Cost: $15,507,316) | | | | | 13,541,526 | | |
Common Stocks 10.2%
Issuer | | Shares | | Value ($) | |
CONSUMER DISCRETIONARY 2.0% | |
Automobiles 1.2% | |
Fuji Heavy Industries Ltd. | | | 76,300 | | | | 3,122,419 | | |
Mazda Motor Corp. | | | 95,400 | | | | 1,736,063 | | |
Toyota Motor Corp. | | | 47,500 | | | | 2,860,904 | | |
Total | | | | | 7,719,386 | | |
Household Durables 0.2% | |
Sony Corp. | | | 63,400 | | | | 1,471,471 | | |
Leisure Products 0.2% | |
Shimano, Inc. | | | 9,400 | | | | 1,499,534 | | |
Media 0.4% | |
Daiichikosho Co., Ltd. | | | 59,100 | | | | 2,382,394 | | |
Total Consumer Discretionary | | | | | 13,072,785 | | |
CONSUMER STAPLES 0.8% | |
Food & Staples Retailing 0.7% | |
San-A Co., Ltd. | | | 43,700 | | | | 2,016,833 | | |
Tsuruha Holdings, Inc. | | | 26,500 | | | | 2,199,097 | | |
Total | | | | | 4,215,930 | | |
Personal Products 0.1% | |
Kao Corp. | | | 13,300 | | | | 713,749 | | |
Total Consumer Staples | | | | | 4,929,679 | | |
The accompanying Notes to Financial Statements are an integral part of this statement.
Annual Report 2016
8
COLUMBIA GLOBAL STRATEGIC EQUITY FUND
PORTFOLIO OF INVESTMENTS (continued)
January 31, 2016
Common Stocks (continued)
Issuer | | Shares | | Value ($) | |
FINANCIALS 2.2% | |
Banks 0.8% | |
Aozora Bank Ltd. | | | 503,000 | | | | 1,684,804 | | |
Mitsubishi UFJ Financial Group, Inc. | | | 543,500 | | | | 2,787,013 | | |
Sumitomo Mitsui Financial Group, Inc. | | | 28,200 | | | | 946,071 | | |
Total | | | | | 5,417,888 | | |
Capital Markets 0.3% | |
Nihon M&A Center, Inc. | | | 45,700 | | | | 2,163,792 | | |
Diversified Financial Services 0.4% | |
ORIX Corp. | | | 189,100 | | | | 2,674,340 | | |
Insurance 0.2% | |
Tokio Marine Holdings, Inc. | | | 33,000 | | | | 1,180,728 | | |
Real Estate Investment Trusts (REITs) 0.1% | |
Invincible Investment Corp. | | | 1,111 | | | | 681,892 | | |
Real Estate Management & Development 0.4% | |
Relo Holdings, Inc. | | | 19,200 | | | | 2,298,908 | | |
Total Financials | | | | | 14,417,548 | | |
HEALTH CARE 1.6% | |
Biotechnology 0.2% | |
PeptiDream, Inc.(b) | | | 34,400 | | | | 1,116,260 | | |
Health Care Equipment & Supplies 1.0% | |
Asahi Intecc Co., Ltd. | | | 23,900 | | | | 1,101,456 | | |
CYBERDYNE, Inc.(b) | | | 35,000 | | | | 586,113 | | |
Hoya Corp. | | | 64,000 | | | | 2,470,546 | | |
Nakanishi, Inc. | | | 16,000 | | | | 625,104 | | |
Sysmex Corp. | | | 22,200 | | | | 1,429,516 | | |
Total | | | | | 6,212,735 | | |
Health Care Technology 0.2% | |
M3, Inc. | | | 58,200 | | | | 1,334,846 | | |
Pharmaceuticals 0.2% | |
Astellas Pharma, Inc. | | | 96,600 | | | | 1,337,578 | | |
Total Health Care | | | | | 10,001,419 | | |
INDUSTRIALS 2.0% | |
Construction & Engineering 0.3% | |
Raito Kogyo Co., Ltd. | | | 176,200 | | | | 1,541,127 | | |
Common Stocks (continued)
Issuer | | Shares | | Value ($) | |
Machinery 0.5% | |
Hoshizaki Electric Co., Ltd. | | | 16,200 | | | | 1,132,885 | | |
Nihon Trim Co., Ltd. | | | 28,300 | | | | 976,817 | | |
Shinmaywa Industries Ltd. | | | 161,000 | | | | 1,300,466 | | |
Total | | | | | 3,410,168 | | |
Professional Services 0.1% | |
Tanseisha Co., Ltd. | | | 104,200 | | | | 664,872 | | |
Road & Rail 0.4% | |
Central Japan Railway Co. | | | 9,100 | | | | 1,689,084 | | |
Trancom Co., Ltd. | | | 17,300 | | | | 1,033,406 | | |
Total | | | | | 2,722,490 | | |
Trading Companies & Distributors 0.7% | |
ITOCHU Corp. | | | 250,500 | | | | 2,944,109 | | |
MonotaRO Co., Ltd | | | 52,900 | | | | 1,222,897 | | |
Total | | | | | 4,167,006 | | |
Total Industrials | | | | | 12,505,663 | | |
INFORMATION TECHNOLOGY 0.5% | |
Electronic Equipment, Instruments & Components 0.5% | |
Keyence Corp. | | | 4,900 | | | | 2,312,240 | | |
Murata Manufacturing Co., Ltd. | | | 8,000 | | | | 925,343 | | |
Total | | | | | 3,237,583 | | |
Total Information Technology | | | | | 3,237,583 | | |
MATERIALS 0.1% | |
Chemicals 0.1% | |
Nitto Denko Corp. | | | 10,400 | | | | 598,044 | | |
Total Materials | | | | | 598,044 | | |
TELECOMMUNICATION SERVICES 1.0% | |
Diversified Telecommunication Services 0.5% | |
Nippon Telegraph & Telephone Corp. | | | 82,800 | | | | 3,525,013 | | |
Wireless Telecommunication Services 0.5% | |
KDDI Corp. | | | 122,000 | | | | 3,089,358 | | |
Total Telecommunication Services | | | | | 6,614,371 | | |
Total Common Stocks
(Cost: $66,612,066) | | | | | 65,377,092 | | |
The accompanying Notes to Financial Statements are an integral part of this statement.
Annual Report 2016
9
COLUMBIA GLOBAL STRATEGIC EQUITY FUND
PORTFOLIO OF INVESTMENTS (continued)
January 31, 2016
Money Market Funds 0.4%
| | | Shares | | Value ($) | |
Columbia Short-Term Cash Fund,
0.360%(a)(c) | | | 2,603,359 | | | | 2,603,359 | | |
Total Money Market Funds
(Cost: $2,603,359) | | | | | 2,603,359 | | |
Total Investments
(Cost: $736,701,254) | | | | | 642,110,410 | | |
Other Assets & Liabilities, Net | | | | | 607,255 | | |
Net Assets | | | | | 642,717,665 | | |
Notes to Portfolio of Investments
(a) As defined in the Investment Company Act of 1940, an affiliated company is one in which the Fund owns 5% or more of the company's outstanding voting securities, or a company which is under common ownership or control with the Fund. Holdings and transactions in these affiliated companies during the year ended January 31, 2016 are as follows:
Issuer | | Beginning
Cost ($) | | Purchase
Cost ($) | | Proceeds
From
Sales ($) | | Realized
Gain
(Loss) ($) | | Ending
Cost ($) | | Capital Gain
Distributions ($) | | Dividends —
Affiliated
Issuers ($) | | Value ($) | |
Columbia Asia Pacific ex-Japan
Fund, Class I Shares | | | — | | | | 21,949,921 | | | | (1,393,614 | ) | | | (158,667 | ) | | | 20,397,640 | | | | — | | | | 3,515,442 | | | | 13,875,173 | | |
Columbia Contrarian Core Fund,
Class I Shares | | | 58,147,811 | | | | 2,325,356 | | | | (38,336,849 | ) | | | 16,438,805 | | | | 38,575,123 | | | | 1,154,229 | | | | 1,170,567 | | | | 37,240,531 | | |
Columbia Convertible Securities
Fund, Class I Shares | | | 40,390,970 | | | | 3,514,688 | | | | (26,604,769 | ) | | | 7,059,576 | | | | 24,360,465 | | | | 1,839,425 | | | | 1,673,504 | | | | 24,600,291 | | |
Columbia Disciplined Core Fund,
Class I Shares | | | 10,013,902 | | | | 11,690,872 | | | | (4,708,966 | ) | | | 1,948,994 | | | | 18,944,802 | | | | — | | | | 393,185 | | | | 21,617,496 | | |
Columbia Disciplined Growth Fund,
Class I Shares | | | 34,931,708 | | | | 2,646 | | | | (38,859,534 | ) | | | 3,925,180 | | | | — | | | | — | | | | — | | | | — | | |
Columbia Dividend Income Fund,
Class I Shares | | | 71,248,036 | | | | 3,299,532 | | | | (72,155,947 | ) | | | 22,537,108 | | | | 24,928,729 | | | | 1,477,747 | | | | 1,820,595 | | | | 26,553,134 | | |
Columbia Dividend Opportunity
Fund, Class I Shares | | | 56,281,445 | | | | 1,182,473 | | | | (64,973,739 | ) | | | 7,509,821 | | | | — | | | | — | | | | 1,175,202 | | | | — | | |
Columbia Emerging Markets Fund,
Class I Shares | | | 37,956,119 | | | | 6,081,003 | | | | (20,730,666 | ) | | | (2,388,823 | ) | | | 20,917,633 | | | | — | | | | — | | | | 17,996,366 | | |
Columbia European Equity Fund,
Class I Shares | | | — | | | | 73,941,069 | | | | (5,560,281 | ) | | | (192,249 | ) | | | 68,188,539 | | | | 1,847,384 | | | | 946,414 | | | | 57,297,390 | | |
Columbia Flexible Capital Income
Fund, Class I Shares | | | 43,272,274 | | | | 933,960 | | | | (48,849,562 | ) | | | 4,643,328 | | | | — | | | | — | | | | 914,486 | | | | — | | |
Columbia Global Dividend
Opportunity Fund, Class I Shares | | | 60,079,324 | | | | 19,640,189 | | | | (9,506,731 | ) | | | (1,825,543 | ) | | | 68,387,239 | | | | — | | | | 1,941,348 | | | | 57,789,240 | | |
Columbia Global Energy and Natural
Resources Fund, Class I Shares | | | 37,672,603 | | | | 7,806,713 | | | | (15,450,896 | ) | | | (5,983,999 | ) | | | 24,044,421 | | | | — | | | | — | | | | 16,884,557 | | |
Columbia Global Equity Value Fund,
Class I Shares | | | — | | | | 24,228,395 | | | | (1,605,442 | ) | | | (87,517 | ) | | | 22,535,436 | | | | 166,201 | | | | 315,405 | | | | 19,045,170 | | |
Columbia Global Infrastructure
Fund, Class I Shares | | | 41,606,420 | | | | 6,415,329 | | | | (5,194,323 | ) | | | (1,838,532 | ) | | | 40,988,894 | | | | 5,820,790 | | | | 591,953 | | | | 25,693,104 | | |
Columbia Global Technology
Growth Fund, Class I Shares | | | — | | | | 68,832,123 | | | | (6,871,867 | ) | | | 193,050 | | | | 62,153,306 | | | | 1,050,736 | | | | — | | | | 59,068,777 | | |
Columbia International
Opportunities Fund, Class I Shares | | | — | | | | 34,111,809 | | | | (2,838,035 | ) | | | (102,617 | ) | | | 31,171,157 | | | | — | | | | — | | | | 27,048,320 | | |
The accompanying Notes to Financial Statements are an integral part of this statement.
Annual Report 2016
10
COLUMBIA GLOBAL STRATEGIC EQUITY FUND
PORTFOLIO OF INVESTMENTS (continued)
January 31, 2016
Notes to Portfolio of Investments (continued)
Issuer | | Beginning
Cost ($) | | Purchase
Cost ($) | | Proceeds
From
Sales ($) | | Realized
Gain
(Loss) ($) | | Ending
Cost ($) | | Capital Gain
Distributions ($) | | Dividends —
Affiliated
Issuers ($) | | Value ($) | |
Columbia Large Cap Growth Fund,
Class I Shares | | | 18,786,735 | | | | 22,332,298 | | | | (8,304,476 | ) | | | 2,671,158 | | | | 35,485,715 | | | | 3,559,581 | | | | — | | | | 33,881,237 | | |
Columbia Mid Cap Growth Fund,
Class I Shares | | | 50,713,121 | | | | 17,724 | | | | (53,560,620 | ) | | | 2,829,775 | | | | — | | | | — | | | | — | | | | — | | |
Columbia Overseas Value Fund,
Class I Shares | | | — | | | | 48,021,673 | | | | (24,558,672 | ) | | | (1,840,058 | ) | | | 21,622,943 | | | | — | | | | 515,343 | | | | 18,702,676 | | |
Columbia Pacific/Asia Fund,
Class I Shares | | | 12,792,594 | | | | 104,254 | | | | (16,195,078 | ) | | | 3,298,230 | | | | — | | | | 41,554 | | | | 51,874 | | | | — | | |
Columbia Real Estate Equity Fund,
Class I Shares | | | 26,170,810 | | | | 1,301,644 | | | | (29,933,757 | ) | | | 2,461,303 | | | | — | | | | 979,351 | | | | 322,294 | | | | — | | |
Columbia Select Global Equity
Fund, Class I Shares | | | — | | | | 79,577,146 | | | | (9,686,681 | ) | | | (206,266 | ) | | | 69,684,199 | | | | — | | | | — | | | | 65,212,022 | | |
Columbia Select Large Cap Equity
Fund, Class I Shares | | | 26,594,087 | | | | 2,344,635 | | | | (26,259,516 | ) | | | (2,679,206 | ) | | | — | | | | 2,056,864 | | | | 274,901 | | | | — | | |
Columbia Select Large Cap Growth
Fund, Class I Shares | | | 56,635,538 | | | | 5,250,470 | | | | (65,128,427 | ) | | | 19,832,603 | | | | 16,590,184 | | | | 5,200,824 | | | | — | | | | 13,574,861 | | |
Columbia Short-Term Cash Fund | | | — | | | | 85,696,913 | | | | (83,093,554 | ) | | | — | | | | 2,603,359 | | | | — | | | | 2,386 | | | | 2,603,359 | | |
Columbia Small Cap Growth
Fund I, Class I Shares | | | 47,276,556 | | | | 10,441,949 | | | | (13,924,048 | ) | | | (792,369 | ) | | | 43,002,088 | | | | 10,402,467 | | | | — | | | | 24,508,088 | | |
Total | | | 730,570,053 | | | | 541,044,784 | | | | (694,286,050 | ) | | | 77,253,085 | | | | 654,581,872 | | | | 35,597,153 | | | | 15,624,899 | | | | 563,191,792 | | |
(b) Non-income producing investment.
(c) The rate shown is the seven-day current annualized yield at January 31, 2016.
Fair Value Measurements
The Fund categorizes its fair value measurements according to a three-level hierarchy that maximizes the use of observable inputs and minimizes the use of unobservable inputs by prioritizing that the most observable input be used when available. Observable inputs are those that market participants would use in pricing an investment based on market data obtained from sources independent of the reporting entity. Unobservable inputs are those that reflect the Fund's assumptions about the information market participants would use in pricing an investment. An investment's level within the fair value hierarchy is based on the lowest level of any input that is deemed significant to the asset's or liability's fair value measurement. The input levels are not necessarily an indication of the risk or liquidity associated with investments at that level. For example, certain U.S. government securities are generally high quality and liquid, however, they are reflected as Level 2 because the inputs used to determine fair value may not always be quoted prices in an active market.
Fair value inputs are summarized in the three broad levels listed below:
> Level 1 — Valuations based on quoted prices for investments in active markets that the Fund has the ability to access at the measurement date (including NAV for open-end mutual funds). Valuation adjustments are not applied to Level 1 investments.
> Level 2 — Valuations based on other significant observable inputs (including quoted prices for similar securities, interest rates, prepayment speeds, credit risks, etc.).
> Level 3 — Valuations based on significant unobservable inputs (including the Fund's own assumptions and judgment in determining the fair value of investments).
Inputs that are used in determining fair value of an investment may include price information, credit data, volatility statistics, and other factors. These inputs can be either observable or unobservable. The availability of observable inputs can vary between investments, and is affected by various factors such as the type of investment, and the volume and level of activity for that investment or similar investments in the marketplace. The inputs will be considered by the Investment Manager, along with any other relevant factors in the calculation of an investment's fair value. The Fund uses prices and inputs that are current as of the measurement date, which may include periods of market dislocations. During these periods, the availability of prices and inputs may be reduced for many investments. This condition could cause an investment to be reclassified between the various levels within the hierarchy.
The accompanying Notes to Financial Statements are an integral part of this statement.
Annual Report 2016
11
COLUMBIA GLOBAL STRATEGIC EQUITY FUND
PORTFOLIO OF INVESTMENTS (continued)
January 31, 2016
Fair Value Measurements (continued)
Foreign equity securities actively traded in markets where there is a significant delay in the local close relative to the New York Stock Exchange (NYSE) are classified as Level 2. The values of these securities may include an adjustment to reflect the impact of significant market movements following the close of local trading, as described in Note 2 to the financial statements — Security Valuation.
Investments falling into the Level 3 category are primarily supported by quoted prices from brokers and dealers participating in the market for those investments. However, these may be classified as Level 3 investments due to lack of market transparency and corroboration to support these quoted prices. Additionally, valuation models may be used as the pricing source for any remaining investments classified as Level 3. These models may rely on one or more significant unobservable inputs and/or significant assumptions by the Investment Manager. Inputs used in valuations may include, but are not limited to, financial statement analysis, capital account balances, discount rates and estimated cash flows, and comparable company data.
Under the direction of the Fund's Board of Trustees (the Board), the Investment Manager's Valuation Committee (the Committee) is responsible for overseeing the valuation procedures approved by the Board. The Committee consists of voting and non-voting members from various groups within the Investment Manager's organization, including operations and accounting, trading and investments, compliance, risk management and legal.
The Committee meets at least monthly to review and approve valuation matters, which may include a description of specific valuation determinations, data regarding pricing information received from approved pricing vendors and brokers and the results of Board-approved valuation control policies and procedures (the Policies). The Policies address, among other things, instances when market quotations are or are not readily available, including recommendations of third party pricing vendors and a determination of appropriate pricing methodologies; events that require specific valuation determinations and assessment of fair value techniques; securities with a potential for stale pricing, including those that are illiquid, restricted, or in default; and the effectiveness of third party pricing vendors, including periodic reviews of vendors. The Committee meets more frequently, as needed, to discuss additional valuation matters, which may include the need to review back-testing results, review time-sensitive information or approve related valuation actions. The Committee reports to the Board, with members of the Committee meeting with the Board at each of its regularly scheduled meetings to discuss valuation matters and actions during the period, similar to those described earlier.
For investments categorized as Level 3, the Committee monitors information similar to that described above, which may include: (i) data specific to the issuer or comparable issuers, (ii) general market or specific sector news and (iii) quoted prices and specific or similar security transactions. The Committee considers this data and any changes from prior periods in order to assess the reasonableness of observable and unobservable inputs, any assumptions or internal models used to value those securities and changes in fair value. This data is also used to corroborate, when available, information received from approved pricing vendors and brokers. Various factors impact the frequency of monitoring this information (which may occur as often as daily). However, the Committee may determine that changes to inputs, assumptions and models are not required as a result of the monitoring procedures performed.
The accompanying Notes to Financial Statements are an integral part of this statement.
Annual Report 2016
12
COLUMBIA GLOBAL STRATEGIC EQUITY FUND
PORTFOLIO OF INVESTMENTS (continued)
January 31, 2016
Fair Value Measurements (continued)
The following table is a summary of the inputs used to value the Fund's investments at January 31, 2016:
| | | Level 1
Quoted Prices in Active
Markets for Identical
Assets ($) | | Level 2
Other Significant
Observable Inputs ($) | | Level 3
Significant
Unobservable Inputs ($) | | Total ($) | |
Investments | |
Equity Funds | | | 535,988,142 | | | | — | | | | — | | | | 535,988,142 | | |
Fixed-Income Funds | | | 24,600,291 | | | | — | | | | — | | | | 24,600,291 | | |
Exchange-Traded Funds | | | 13,541,526 | | | | — | | | | — | | | | 13,541,526 | | |
Common Stocks | |
Consumer Discretionary | | | — | | | | 13,072,785 | | | | — | | | | 13,072,785 | | |
Consumer Staples | | | — | | | | 4,929,679 | | | | — | | | | 4,929,679 | | |
Financials | | | — | | | | 14,417,548 | | | | — | | | | 14,417,548 | | |
Health Care | | | — | | | | 10,001,419 | | | | — | | | | 10,001,419 | | |
Industrials | | | — | | | | 12,505,663 | | | | — | | | | 12,505,663 | | |
Information Technology | | | — | | | | 3,237,583 | | | | — | | | | 3,237,583 | | |
Materials | | | — | | | | 598,044 | | | | — | | | | 598,044 | | |
Telecommunication Services | | | — | | | | 6,614,371 | | | | — | | | | 6,614,371 | | |
Total Common Stocks | | | — | | | | 65,377,092 | | | | — | | | | 65,377,092 | | |
Money Market Funds | | | — | | | | 2,603,359 | | | | — | | | | 2,603,359 | | |
Total Investments | | | 574,129,959 | | | | 67,980,451 | | | | — | | | | 642,110,410 | | |
See the Portfolio of Investments for all investment classifications not indicated in the table.
The Fund's assets assigned to the Level 2 input category are generally valued using the market approach, in which a security's value is determined through reference to prices and information from market transactions for similar or identical assets and/or fund per share market values which are not considered publicly available. These assets include certain foreign securities for which a third party statistical pricing service may be employed for purposes of fair market valuation. The model utilized by such third party statistical pricing service takes into account a security's correlation to available market data including, but not limited to, intraday index, ADR, and exchange-traded fund movements.
There were no transfers of financial assets between levels during the period.
The accompanying Notes to Financial Statements are an integral part of this statement.
Annual Report 2016
13
COLUMBIA GLOBAL STRATEGIC EQUITY FUND
STATEMENT OF ASSETS AND LIABILITIES
January 31, 2016
Assets | |
Investments, at value | |
Unaffiliated issuers (identified cost $82,119,382) | | $ | 78,918,618 | | |
Affiliated issuers (identified cost $654,581,872) | | | 563,191,792 | | |
Total investments (identified cost $736,701,254) | | | 642,110,410 | | |
Foreign currency (identified cost $347,073) | | | 340,020 | | |
Receivable for: | |
Investments sold | | | 1,415,608 | | |
Capital shares sold | | | 243,462 | | |
Dividends | | | 57,123 | | |
Foreign tax reclaims | | | 24,891 | | |
Prepaid expenses | | | 2,955 | | |
Total assets | | | 644,194,469 | | |
Liabilities | |
Payable for: | |
Investments purchased | | | 432,856 | | |
Capital shares purchased | | | 889,853 | | |
Investment management fees | | | 1,205 | | |
Distribution and/or service fees | | | 5,993 | | |
Transfer agent fees | | | 62,853 | | |
Administration fees | | | 343 | | |
Plan administration fees | | | 1 | | |
Compensation of board members | | | 24,039 | | |
Other expenses | | | 59,661 | | |
Total liabilities | | | 1,476,804 | | |
Net assets applicable to outstanding capital stock | | $ | 642,717,665 | | |
Represented by | |
Paid-in capital | | $ | 723,692,264 | | |
Undistributed net investment income | | | 21,552 | | |
Accumulated net realized gain | | | 13,602,335 | | |
Unrealized appreciation (depreciation) on: | |
Investments — unaffiliated issuers | | | (3,200,764 | ) | |
Investments — affiliated issuers | | | (91,390,080 | ) | |
Foreign currency translations | | | (7,642 | ) | |
Total — representing net assets applicable to outstanding capital stock | | $ | 642,717,665 | | |
The accompanying Notes to Financial Statements are an integral part of this statement.
Annual Report 2016
14
COLUMBIA GLOBAL STRATEGIC EQUITY FUND
STATEMENT OF ASSETS AND LIABILITIES (continued)
January 31, 2016
Class A | |
Net assets | | $ | 522,769,214 | | |
Shares outstanding | | | 46,066,953 | | |
Net asset value per share | | $ | 11.35 | | |
Maximum offering price per share(a) | | $ | 12.04 | | |
Class B | |
Net assets | | $ | 12,278,505 | | |
Shares outstanding | | | 1,232,609 | | |
Net asset value per share | | $ | 9.96 | | |
Class C | |
Net assets | | $ | 80,104,064 | | |
Shares outstanding | | | 8,136,015 | | |
Net asset value per share | | $ | 9.85 | | |
Class K | |
Net assets | | $ | 91,322 | | |
Shares outstanding | | | 7,857 | | |
Net asset value per share | | $ | 11.62 | | |
Class R | |
Net assets | | $ | 2,253,665 | | |
Shares outstanding | | | 201,489 | | |
Net asset value per share | | $ | 11.19 | | |
Class R4 | |
Net assets | | $ | 71,411 | | |
Shares outstanding | | | 6,045 | | |
Net asset value per share | | $ | 11.81 | | |
Class R5 | |
Net assets | | $ | 340,104 | | |
Shares outstanding | | | 28,757 | | |
Net asset value per share | | $ | 11.83 | | |
Class Z | |
Net assets | | $ | 24,809,380 | | |
Shares outstanding | | | 2,131,703 | | |
Net asset value per share | | $ | 11.64 | | |
(a) The maximum offering price per share is calculated by dividing the net asset value per share by 1.0 minus the maximum sales charge of 5.75%.
The accompanying Notes to Financial Statements are an integral part of this statement.
Annual Report 2016
15
COLUMBIA GLOBAL STRATEGIC EQUITY FUND
STATEMENT OF OPERATIONS
Year Ended January 31, 2016
Net investment income | |
Income: | |
Dividends — unaffiliated issuers | | $ | 723,186 | | |
Dividends — affiliated issuers | | | 15,624,899 | | |
Foreign taxes withheld | | | (47,126 | ) | |
Total income | | | 16,300,959 | | |
Expenses: | |
Investment management fees | | | 227,275 | | |
Distribution and/or service fees | |
Class A | | | 1,506,143 | | |
Class B | | | 202,349 | | |
Class C | | | 942,935 | | |
Class R | | | 13,112 | | |
Transfer agent fees | |
Class A | | | 964,664 | | |
Class B | | | 32,583 | | |
Class C | | | 151,024 | | |
Class K | | | 50 | | |
Class R | | | 4,201 | | |
Class R4 | | | 118 | | |
Class R5 | | | 175 | | |
Class Z | | | 67,016 | | |
Administration fees | | | 152,348 | | |
Plan administration fees | |
Class K | | | 249 | | |
Compensation of board members | | | 18,804 | | |
Custodian fees | | | 17,011 | | |
Printing and postage fees | | | 103,322 | | |
Registration fees | | | 108,069 | | |
Audit fees | | | 18,564 | | |
Legal fees | | | 11,313 | | |
Other | | | 20,057 | | |
Total expenses | | | 4,561,382 | | |
Expense reductions | | | (680 | ) | |
Total net expenses | | | 4,560,702 | | |
Net investment income | | | 11,740,257 | | |
Realized and unrealized gain (loss) — net | |
Net realized gain (loss) on: | |
Investments — unaffiliated issuers | | | (1,899,581 | ) | |
Investments — affiliated issuers | | | 77,253,085 | | |
Capital gain distributions from underlying affiliated funds | | | 35,597,153 | | |
Foreign currency translations | | | 58,487 | | |
Net realized gain | | | 111,009,144 | | |
Net change in unrealized appreciation (depreciation) on: | |
Investments — unaffiliated issuers | | | (3,200,764 | ) | |
Investments — affiliated issuers | | | (164,702,526 | ) | |
Foreign currency translations | | | (7,642 | ) | |
Net change in unrealized depreciation | | | (167,910,932 | ) | |
Net realized and unrealized loss | | | (56,901,788 | ) | |
Net decrease in net assets from operations | | $ | (45,161,531 | ) | |
The accompanying Notes to Financial Statements are an integral part of this statement.
Annual Report 2016
16
COLUMBIA GLOBAL STRATEGIC EQUITY FUND
STATEMENT OF CHANGES IN NET ASSETS
| | | Year Ended
January 31,
2016 | | Year Ended
January 31,
2015 | |
Operations | |
Net investment income | | $ | 11,740,257 | | | $ | 8,168,863 | | |
Net realized gain | | | 111,009,144 | | | | 101,307,403 | | |
Net change in unrealized depreciation | | | (167,910,932 | ) | | | (39,982,660 | ) | |
Net increase (decrease) in net assets resulting from operations | | | (45,161,531 | ) | | | 69,493,606 | | |
Distributions to shareholders | |
Net investment income | |
Class A | | | (13,318,216 | ) | | | (13,862,717 | ) | |
Class B | | | (319,406 | ) | | | (538,218 | ) | |
Class C | | | (1,739,569 | ) | | | (1,619,994 | ) | |
Class K | | | (2,283 | ) | | | (2,792 | ) | |
Class R | | | (53,623 | ) | | | (53,003 | ) | |
Class R4 | | | (2,177 | ) | | | (368 | ) | |
Class R5 | | | (8,879 | ) | | | (2,318 | ) | |
Class Z | | | (910,600 | ) | | | (1,303,933 | ) | |
Net realized gains | |
Class A | | | (116,440,092 | ) | | | (17,989,405 | ) | |
Class B | | | (3,762,199 | ) | | | (950,424 | ) | |
Class C | | | (20,400,096 | ) | | | (3,156,769 | ) | |
Class K | | | (19,260 | ) | | | (2,770 | ) | |
Class R | | | (511,499 | ) | | | (77,174 | ) | |
Class R4 | | | (18,379 | ) | | | (302 | ) | |
Class R5 | | | (69,949 | ) | | | (4,229 | ) | |
Class Z | | | (7,218,349 | ) | | | (1,500,258 | ) | |
Total distributions to shareholders | | | (164,794,576 | ) | | | (41,064,674 | ) | |
Increase (decrease) in net assets from capital stock activity | | | 49,111,670 | | | | (28,793,992 | ) | |
Total decrease in net assets | | | (160,844,437 | ) | | | (365,060 | ) | |
Net assets at beginning of year | | | 803,562,102 | | | | 803,927,162 | | |
Net assets at end of year | | $ | 642,717,665 | | | $ | 803,562,102 | | |
Undistributed net investment income | | $ | 21,552 | | | $ | 549,403 | | |
The accompanying Notes to Financial Statements are an integral part of this statement.
Annual Report 2016
17
COLUMBIA GLOBAL STRATEGIC EQUITY FUND
STATEMENT OF CHANGES IN NET ASSETS (continued)
| | | Year Ended January 31, 2016 | | Year Ended January 31, 2015 | |
| | | Shares | | Dollars ($) | | Shares | | Dollars ($) | |
Capital stock activity | |
Class A shares | |
Subscriptions(a) | | | 4,286,880 | | | | 59,866,975 | | | | 3,389,380 | | | | 52,903,887 | | |
Distributions reinvested | | | 7,865,106 | | | | 102,836,354 | | | | 1,605,067 | | | | 25,157,919 | | |
Redemptions | | | (6,629,625 | ) | | | (96,085,087 | ) | | | (5,275,793 | ) | | | (82,891,901 | ) | |
Net increase (decrease) | | | 5,522,361 | | | | 66,618,242 | | | | (281,346 | ) | | | (4,830,095 | ) | |
Class B shares | |
Subscriptions | | | 69,249 | | | | 824,483 | | | | 41,381 | | | | 588,201 | | |
Distributions reinvested | | | 276,665 | | | | 3,245,485 | | | | 78,031 | | | | 1,106,622 | | |
Redemptions(a) | | | (1,158,577 | ) | | | (15,443,704 | ) | | | (1,366,697 | ) | | | (19,292,713 | ) | |
Net decrease | | | (812,663 | ) | | | (11,373,736 | ) | | | (1,247,285 | ) | | | (17,597,890 | ) | |
Class C shares | |
Subscriptions | | | 941,822 | | | | 11,545,927 | | | | 689,063 | | | | 9,699,013 | | |
Distributions reinvested | | | 1,431,675 | | | | 16,346,154 | | | | 246,307 | | | | 3,462,123 | | |
Redemptions | | | (1,370,592 | ) | | | (17,423,012 | ) | | | (1,062,689 | ) | | | (14,991,054 | ) | |
Net increase (decrease) | | | 1,002,905 | | | | 10,469,069 | | | | (127,319 | ) | | | (1,829,918 | ) | |
Class K shares | |
Distributions reinvested | | | 1,571 | | | | 20,967 | | | | 335 | | | | 5,350 | | |
Redemptions | | | — | | | | — | | | | (4,528 | ) | | | (73,306 | ) | |
Net increase (decrease) | | | 1,571 | | | | 20,967 | | | | (4,193 | ) | | | (67,956 | ) | |
Class R shares | |
Subscriptions | | | 46,241 | | | | 653,394 | | | | 50,504 | | | | 760,887 | | |
Distributions reinvested | | | 40,316 | | | | 523,858 | | | | 8,107 | | | | 125,764 | | |
Redemptions | | | (61,623 | ) | | | (882,713 | ) | | | (95,281 | ) | | | (1,460,159 | ) | |
Net increase (decrease) | | | 24,934 | | | | 294,539 | | | | (36,670 | ) | | | (573,508 | ) | |
Class R4 shares | |
Subscriptions | | | 15,401 | | | | 233,617 | | | | 497 | | | | 8,191 | | |
Distributions reinvested | | | 1,585 | | | | 20,033 | | | | 33 | | | | 531 | | |
Redemptions | | | (11,621 | ) | | | (154,423 | ) | | | (824 | ) | | | (13,733 | ) | |
Net increase (decrease) | | | 5,365 | | | | 99,227 | | | | (294 | ) | | | (5,011 | ) | |
Class R5 shares | |
Subscriptions | | | 8,399 | | | | 126,968 | | | | 17,775 | | | | 289,239 | | |
Distributions reinvested | | | 5,816 | | | | 78,304 | | | | 396 | | | | 6,405 | | |
Redemptions | | | (5,420 | ) | | | (76,033 | ) | | | (75 | ) | | | (1,190 | ) | |
Net increase | | | 8,795 | | | | 129,239 | | | | 18,096 | | | | 294,454 | | |
Class Z shares | |
Subscriptions | | | 420,245 | | | | 6,139,485 | | | | 565,792 | | | | 9,077,037 | | |
Distributions reinvested | | | 174,109 | | | | 2,367,369 | | | | 50,980 | | | | 814,969 | | |
Redemptions | | | (1,747,439 | ) | | | (25,652,731 | ) | | | (880,017 | ) | | | (14,076,074 | ) | |
Net decrease | | | (1,153,085 | ) | | | (17,145,877 | ) | | | (263,245 | ) | | | (4,184,068 | ) | |
Total net increase (decrease) | | | 4,600,183 | | | | 49,111,670 | | | | (1,942,256 | ) | | | (28,793,992 | ) | |
(a) Includes conversions of Class B shares to Class A shares, if any.
The accompanying Notes to Financial Statements are an integral part of this statement.
Annual Report 2016
18
COLUMBIA GLOBAL STRATEGIC EQUITY FUND
The following tables are intended to help you understand the Fund's financial performance. Certain information reflects financial results for a single share of a class held for the periods shown. Per share net investment income (loss) amounts are calculated based on average shares outstanding during the period. Total return assumes reinvestment of all dividends and distributions, if any. Total return does not reflect payment of sales charges, if any. Total return and portfolio turnover are not annualized for periods of less than one year. The portfolio turnover rate is calculated without regard to purchase and sales transactions of short-term instruments and certain derivatives, if any. If such transactions were included, the Fund's portfolio turnover rate may be higher.
| | | Year Ended January 31, | | Year Ended
March 31, | |
Class A | | 2016 | | 2015 | | 2014 | | 2013 | | 2012(a) | | 2011 | |
Per share data | |
Net asset value, beginning of period | | $ | 15.35 | | | $ | 14.83 | | | $ | 12.96 | | | $ | 11.59 | | | $ | 12.25 | | | $ | 10.33 | | |
Income from investment operations: | |
Net investment income | | | 0.24 | | | | 0.17 | | | | 0.16 | | | | 0.17 | | | | 0.09 | | | | 0.08 | | |
Net realized and unrealized gain (loss) | | | (1.00 | ) | | | 1.16 | | | | 2.02 | | | | 1.42 | | | | (0.71 | ) | | | 1.91 | | |
Total from investment operations | | | (0.76 | ) | | | 1.33 | | | | 2.18 | | | | 1.59 | | | | (0.62 | ) | | | 1.99 | | |
Less distributions to shareholders: | |
Net investment income | | | (0.33 | ) | | | (0.35 | ) | | | (0.31 | ) | | | (0.22 | ) | | | (0.04 | ) | | | (0.07 | ) | |
Net realized gains | | | (2.91 | ) | | | (0.46 | ) | | | — | | | | — | | | | — | | | | — | | |
Total distributions to shareholders | | | (3.24 | ) | | | (0.81 | ) | | | (0.31 | ) | | | (0.22 | ) | | | (0.04 | ) | | | (0.07 | ) | |
Net asset value, end of period | | $ | 11.35 | | | $ | 15.35 | | | $ | 14.83 | | | $ | 12.96 | | | $ | 11.59 | | | $ | 12.25 | | |
Total return | | | (6.66 | %) | | | 8.88 | % | | | 16.86 | % | | | 13.81 | % | | | (4.98 | %) | | | 19.35 | % | |
Ratios to average net assets(b) | |
Total gross expenses | | | 0.50 | % | | | 0.48 | % | | | 0.50 | % | | | 0.53 | % | | | 0.52 | %(c) | | | 0.51 | % | |
Total net expenses(d) | | | 0.50 | %(e) | | | 0.48 | %(e) | | | 0.50 | %(e) | | | 0.48 | %(e) | | | 0.45 | %(c)(e) | | | 0.51 | % | |
Net investment income | | | 1.66 | % | | | 1.10 | % | | | 1.17 | % | | | 1.38 | % | | | 0.93 | %(c) | | | 0.72 | % | |
Supplemental data | |
Net assets, end of period (in thousands) | | $ | 522,769 | | | $ | 622,508 | | | $ | 605,625 | | | $ | 552,395 | | | $ | 539,370 | | | $ | 201,437 | | |
Portfolio turnover | | | 75 | % | | | 16 | % | | | 18 | % | | | 26 | % | | | 86 | % | | | 36 | % | |
Notes to Financial Highlights
(a) For the period from April 1, 2011 to January 31, 2012. During the period, the Fund's fiscal year end was changed from March 31 to January 31.
(b) In addition to the fees and expenses that the Fund bears directly, the Fund indirectly bears a pro rata share of the fees and expenses of any other funds in which it invests. Such indirect expenses are not included in the Fund's reported expense ratios.
(c) Annualized.
(d) Total net expenses include the impact of certain fee waivers/expense reimbursements made by the Investment Manager and certain of its affiliates, if applicable.
(e) The benefits derived from expense reductions had an impact of less than 0.01%.
The accompanying Notes to Financial Statements are an integral part of this statement.
Annual Report 2016
19
COLUMBIA GLOBAL STRATEGIC EQUITY FUND
FINANCIAL HIGHLIGHTS (continued)
| | | Year Ended January 31, | | Year Ended
March 31, | |
Class B | | 2016 | | 2015 | | 2014 | | 2013 | | 2012(a) | | 2011 | |
Per share data | |
Net asset value, beginning of period | | $ | 13.88 | | | $ | 13.48 | | | $ | 11.79 | | | $ | 10.56 | | | $ | 11.21 | | | $ | 9.48 | | |
Income from investment operations: | |
Net investment income | | | 0.09 | | | | 0.04 | | | | 0.04 | | | | 0.06 | | | | 0.00 | (b) | | | 0.00 | (b) | |
Net realized and unrealized gain (loss) | | | (0.85 | ) | | | 1.05 | | | | 1.86 | | | | 1.30 | | | | (0.63 | ) | | | 1.75 | | |
Total from investment operations | | | (0.76 | ) | | | 1.09 | | | | 1.90 | | | | 1.36 | | | | (0.63 | ) | | | 1.75 | | |
Less distributions to shareholders: | |
Net investment income | | | (0.25 | ) | | | (0.23 | ) | | | (0.21 | ) | | | (0.13 | ) | | | (0.02 | ) | | | (0.02 | ) | |
Net realized gains | | | (2.91 | ) | | | (0.46 | ) | | | — | | | | — | | | | — | | | | — | | |
Total distributions to shareholders | | | (3.16 | ) | | | (0.69 | ) | | | (0.21 | ) | | | (0.13 | ) | | | (0.02 | ) | | | (0.02 | ) | |
Net asset value, end of period | | $ | 9.96 | | | $ | 13.88 | | | $ | 13.48 | | | $ | 11.79 | | | $ | 10.56 | | | $ | 11.21 | | |
Total return | | | (7.40 | %) | | | 8.01 | % | | | 16.09 | % | | | 12.93 | % | | | (5.60 | %) | | | 18.46 | % | |
Ratios to average net assets(c) | |
Total gross expenses | | | 1.24 | % | | | 1.23 | % | | | 1.25 | % | | | 1.28 | % | | | 1.27 | %(d) | | | 1.26 | % | |
Total net expenses(e) | | | 1.24 | %(f) | | | 1.23 | %(f) | | | 1.25 | %(f) | | | 1.23 | %(f) | | | 1.20 | %(d)(f) | | | 1.26 | % | |
Net investment income (loss) | | | 0.70 | % | | | 0.27 | % | | | 0.35 | % | | | 0.55 | % | | | 0.06 | %(d) | | | (0.05 | %) | |
Supplemental data | |
Net assets, end of period (in thousands) | | $ | 12,279 | | | $ | 28,394 | | | $ | 44,368 | | | $ | 59,438 | | | $ | 82,941 | | | $ | 74,403 | | |
Portfolio turnover | | | 75 | % | | | 16 | % | | | 18 | % | | | 26 | % | | | 86 | % | | | 36 | % | |
Notes to Financial Highlights
(a) For the period from April 1, 2011 to January 31, 2012. During the period, the Fund's fiscal year end was changed from March 31 to January 31.
(b) Rounds to zero.
(c) In addition to the fees and expenses that the Fund bears directly, the Fund indirectly bears a pro rata share of the fees and expenses of any other funds in which it invests. Such indirect expenses are not included in the Fund's reported expense ratios.
(d) Annualized.
(e) Total net expenses include the impact of certain fee waivers/expense reimbursements made by the Investment Manager and certain of its affiliates, if applicable.
(f) The benefits derived from expense reductions had an impact of less than 0.01%.
The accompanying Notes to Financial Statements are an integral part of this statement.
Annual Report 2016
20
COLUMBIA GLOBAL STRATEGIC EQUITY FUND
FINANCIAL HIGHLIGHTS (continued)
| | | Year Ended January 31, | | Year Ended
March 31, | |
Class C | | 2016 | | 2015 | | 2014 | | 2013 | | 2012(a) | | 2011 | |
Per share data | |
Net asset value, beginning of period | | $ | 13.76 | | | $ | 13.36 | | | $ | 11.69 | | | $ | 10.47 | | | $ | 11.11 | | | $ | 9.40 | | |
Income from investment operations: | |
Net investment income (loss) | | | 0.12 | | | | 0.05 | | | | 0.05 | | | | 0.07 | | | | 0.00 | (b) | | | (0.00 | )(b) | |
Net realized and unrealized gain (loss) | | | (0.87 | ) | | | 1.04 | | | | 1.83 | | | | 1.28 | | | | (0.62 | ) | | | 1.73 | | |
Total from investment operations | | | (0.75 | ) | | | 1.09 | | | | 1.88 | | | | 1.35 | | | | (0.62 | ) | | | 1.73 | | |
Less distributions to shareholders: | |
Net investment income | | | (0.25 | ) | | | (0.23 | ) | | | (0.21 | ) | | | (0.13 | ) | | | (0.02 | ) | | | (0.02 | ) | |
Net realized gains | | | (2.91 | ) | | | (0.46 | ) | | | — | | | | — | | | | — | | | | — | | |
Total distributions to shareholders | | | (3.16 | ) | | | (0.69 | ) | | | (0.21 | ) | | | (0.13 | ) | | | (0.02 | ) | | | (0.02 | ) | |
Net asset value, end of period | | $ | 9.85 | | | $ | 13.76 | | | $ | 13.36 | | | $ | 11.69 | | | $ | 10.47 | | | $ | 11.11 | | |
Total return | | | (7.38 | %) | | | 8.08 | % | | | 16.06 | % | | | 12.95 | % | | | (5.56 | %) | | | 18.41 | % | |
Ratios to average net assets(c) | |
Total gross expenses | | | 1.25 | % | | | 1.23 | % | | | 1.25 | % | | | 1.28 | % | | | 1.27 | %(d) | | | 1.26 | % | |
Total net expenses(e) | | | 1.25 | %(f) | | | 1.23 | %(f) | | | 1.25 | %(f) | | | 1.23 | %(f) | | | 1.20 | %(d)(f) | | | 1.26 | % | |
Net investment income (loss) | | | 0.90 | % | | | 0.34 | % | | | 0.42 | % | | | 0.62 | % | | | 0.06 | %(d) | | | (0.04 | %) | |
Supplemental data | |
Net assets, end of period (in thousands) | | $ | 80,104 | | | $ | 98,125 | | | $ | 96,989 | | | $ | 89,630 | | | $ | 90,148 | | | $ | 70,437 | | |
Portfolio turnover | | | 75 | % | | | 16 | % | | | 18 | % | | | 26 | % | | | 86 | % | | | 36 | % | |
Notes to Financial Highlights
(a) For the period from April 1, 2011 to January 31, 2012. During the period, the Fund's fiscal year end was changed from March 31 to January 31.
(b) Rounds to zero.
(c) In addition to the fees and expenses that the Fund bears directly, the Fund indirectly bears a pro rata share of the fees and expenses of any other funds in which it invests. Such indirect expenses are not included in the Fund's reported expense ratios.
(d) Annualized.
(e) Total net expenses include the impact of certain fee waivers/expense reimbursements made by the Investment Manager and certain of its affiliates, if applicable.
(f) The benefits derived from expense reductions had an impact of less than 0.01%.
The accompanying Notes to Financial Statements are an integral part of this statement.
Annual Report 2016
21
COLUMBIA GLOBAL STRATEGIC EQUITY FUND
FINANCIAL HIGHLIGHTS (continued)
| | | Year Ended January 31, | | Year Ended
March 31, | |
Class K | | 2016 | | 2015 | | 2014 | | 2013 | | 2012(a) | | 2011(b) | |
Per share data | |
Net asset value, beginning of period | | $ | 15.64 | | | $ | 15.10 | | | $ | 13.19 | | | $ | 11.79 | | | $ | 12.45 | | | $ | 12.27 | | |
Income from investment operations: | |
Net investment income | | | 0.27 | | | | 0.19 | | | | 0.19 | | | | 0.17 | | | | 0.11 | | | | 0.01 | | |
Net realized and unrealized gain (loss) | | | (1.03 | ) | | | 1.18 | | | | 2.05 | | | | 1.46 | | | | (0.72 | ) | | | 0.21 | | |
Total from investment operations | | | (0.76 | ) | | | 1.37 | | | | 2.24 | | | | 1.63 | | | | (0.61 | ) | | | 0.22 | | |
Less distributions to shareholders: | |
Net investment income | | | (0.35 | ) | | | (0.37 | ) | | | (0.33 | ) | | | (0.23 | ) | | | (0.05 | ) | | | (0.04 | ) | |
Net realized gains | | | (2.91 | ) | | | (0.46 | ) | | | — | | | | — | | | | — | | | | — | | |
Total distributions to shareholders | | | (3.26 | ) | | | (0.83 | ) | | | (0.33 | ) | | | (0.23 | ) | | | (0.05 | ) | | | (0.04 | ) | |
Net asset value, end of period | | $ | 11.62 | | | $ | 15.64 | | | $ | 15.10 | | | $ | 13.19 | | | $ | 11.79 | | | $ | 12.45 | | |
Total return | | | (6.59 | %) | | | 8.98 | % | | | 17.04 | % | | | 13.93 | % | | | (4.88 | %) | | | 1.77 | % | |
Ratios to average net assets(c) | |
Total gross expenses | | | 0.39 | % | | | 0.35 | % | | | 0.36 | % | | | 0.38 | % | | | 0.37 | %(d) | | | 0.51 | %(d) | |
Total net expenses(e) | | | 0.39 | % | | | 0.35 | % | | | 0.36 | % | | | 0.38 | % | | | 0.37 | %(d) | | | 0.51 | %(d) | |
Net investment income | | | 1.80 | % | | | 1.18 | % | | | 1.32 | % | | | 1.42 | % | | | 1.15 | %(d) | | | 0.68 | %(d) | |
Supplemental data | |
Net assets, end of period (in thousands) | | $ | 91 | | | $ | 98 | | | $ | 158 | | | $ | 135 | | | $ | 279 | | | $ | 3 | | |
Portfolio turnover | | | 75 | % | | | 16 | % | | | 18 | % | | | 26 | % | | | 86 | % | | | 36 | % | |
Notes to Financial Highlights
(a) For the period from April 1, 2011 to January 31, 2012. During the period, the Fund's fiscal year end was changed from March 31 to January 31.
(b) Based on operations from March 7, 2011 (commencement of operations) through the stated period end.
(c) In addition to the fees and expenses that the Fund bears directly, the Fund indirectly bears a pro rata share of the fees and expenses of any other funds in which it invests. Such indirect expenses are not included in the Fund's reported expense ratios.
(d) Annualized.
(e) Total net expenses include the impact of certain fee waivers/expense reimbursements made by the Investment Manager and certain of its affiliates, if applicable.
The accompanying Notes to Financial Statements are an integral part of this statement.
Annual Report 2016
22
COLUMBIA GLOBAL STRATEGIC EQUITY FUND
FINANCIAL HIGHLIGHTS (continued)
| | | Year Ended January 31, | | Year Ended
March 31, | |
Class R | | 2016 | | 2015 | | 2014 | | 2013 | | 2012(a) | | 2011 | |
Per share data | |
Net asset value, beginning of period | | $ | 15.19 | | | $ | 14.68 | | | $ | 12.83 | | | $ | 11.48 | | | $ | 12.14 | | | $ | 10.25 | | |
Income from investment operations: | |
Net investment income | | | 0.19 | | | | 0.13 | | | | 0.13 | | | | 0.14 | | | | 0.05 | | | | 0.06 | | |
Net realized and unrealized gain (loss) | | | (0.98 | ) | | | 1.15 | | | | 2.00 | | | | 1.40 | | | | (0.68 | ) | | | 1.88 | | |
Total from investment operations | | | (0.79 | ) | | | 1.28 | | | | 2.13 | | | | 1.54 | | | | (0.63 | ) | | | 1.94 | | |
Less distributions to shareholders: | |
Net investment income | | | (0.30 | ) | | | (0.31 | ) | | | (0.28 | ) | | | (0.19 | ) | | | (0.03 | ) | | | (0.05 | ) | |
Net realized gains | | | (2.91 | ) | | | (0.46 | ) | | | — | | | | — | | | | — | | | | — | | |
Total distributions to shareholders | | | (3.21 | ) | | | (0.77 | ) | | | (0.28 | ) | | | (0.19 | ) | | | (0.03 | ) | | | (0.05 | ) | |
Net asset value, end of period | | $ | 11.19 | | | $ | 15.19 | | | $ | 14.68 | | | $ | 12.83 | | | $ | 11.48 | | | $ | 12.14 | | |
Total return | | | (6.91 | %) | | | 8.64 | % | | | 16.59 | % | | | 13.49 | % | | | (5.12 | %) | | | 18.99 | % | |
Ratios to average net assets(b) | |
Total gross expenses | | | 0.75 | % | | | 0.73 | % | | | 0.75 | % | | | 0.78 | % | | | 0.77 | %(c) | | | 0.76 | % | |
Total net expenses(d) | | | 0.75 | %(e) | | | 0.73 | %(e) | | | 0.75 | %(e) | | | 0.73 | %(e) | | | 0.70 | %(c)(e) | | | 0.76 | % | |
Net investment income | | | 1.35 | % | | | 0.81 | % | | | 0.93 | % | | | 1.18 | % | | | 0.54 | %(c) | | | 0.54 | % | |
Supplemental data | |
Net assets, end of period (in thousands) | | $ | 2,254 | | | $ | 2,681 | | | $ | 3,131 | | | $ | 3,312 | | | $ | 3,124 | | | $ | 1,463 | | |
Portfolio turnover | | | 75 | % | | | 16 | % | | | 18 | % | | | 26 | % | | | 86 | % | | | 36 | % | |
Notes to Financial Highlights
(a) For the period from April 1, 2011 to January 31, 2012. During the period, the Fund's fiscal year end was changed from March 31 to January 31.
(b) In addition to the fees and expenses that the Fund bears directly, the Fund indirectly bears a pro rata share of the fees and expenses of any other funds in which it invests. Such indirect expenses are not included in the Fund's reported expense ratios.
(c) Annualized.
(d) Total net expenses include the impact of certain fee waivers/expense reimbursements made by the Investment Manager and certain of its affiliates, if applicable.
(e) The benefits derived from expense reductions had an impact of less than 0.01%.
The accompanying Notes to Financial Statements are an integral part of this statement.
Annual Report 2016
23
COLUMBIA GLOBAL STRATEGIC EQUITY FUND
FINANCIAL HIGHLIGHTS (continued)
| | | Year Ended January 31, | |
Class R4 | | 2016 | | 2015 | | 2014 | | 2013(a) | |
Per share data | |
Net asset value, beginning of period | | $ | 15.85 | | | $ | 15.29 | | | $ | 13.35 | | | $ | 12.29 | | |
Income from investment operations: | |
Net investment income | | | 0.39 | | | | 0.20 | | | | 0.27 | | | | 0.11 | | |
Net realized and unrealized gain (loss) | | | (1.16 | ) | | | 1.21 | | | | 2.02 | | | | 1.05 | | |
Total from investment operations | | | (0.77 | ) | | | 1.41 | | | | 2.29 | | | | 1.16 | | |
Less distributions to shareholders: | |
Net investment income | | | (0.36 | ) | | | (0.39 | ) | | | (0.35 | ) | | | (0.10 | ) | |
Net realized gains | | | (2.91 | ) | | | (0.46 | ) | | | — | | | | — | | |
Total distributions to shareholders | | | (3.27 | ) | | | (0.85 | ) | | | (0.35 | ) | | | (0.10 | ) | |
Net asset value, end of period | | $ | 11.81 | | | $ | 15.85 | | | $ | 15.29 | | | $ | 13.35 | | |
Total return | | | (6.55 | %) | | | 9.15 | % | | | 17.19 | % | | | 9.50 | % | |
Ratios to average net assets(b) | |
Total gross expenses | | | 0.27 | % | | | 0.22 | % | | | 0.24 | % | | | 0.37 | %(c) | |
Total net expenses(d) | | | 0.27 | %(e) | | | 0.22 | %(e) | | | 0.24 | %(e) | | | 0.27 | %(c) | |
Net investment income | | | 2.73 | % | | | 1.23 | % | | | 1.84 | % | | | 3.94 | %(c) | |
Supplemental data | |
Net assets, end of period (in thousands) | | $ | 71 | | | $ | 11 | | | $ | 15 | | | $ | 3 | | |
Portfolio turnover | | | 75 | % | | | 16 | % | | | 18 | % | | | 26 | % | |
Notes to Financial Highlights
(a) Based on operations from November 8, 2012 (commencement of operations) through the stated period end.
(b) In addition to the fees and expenses that the Fund bears directly, the Fund indirectly bears a pro rata share of the fees and expenses of any other funds in which it invests. Such indirect expenses are not included in the Fund's reported expense ratios.
(c) Annualized.
(d) Total net expenses include the impact of certain fee waivers/expense reimbursements made by the Investment Manager and certain of its affiliates, if applicable.
(e) The benefits derived from expense reductions had an impact of less than 0.01%.
The accompanying Notes to Financial Statements are an integral part of this statement.
Annual Report 2016
24
COLUMBIA GLOBAL STRATEGIC EQUITY FUND
FINANCIAL HIGHLIGHTS (continued)
| | | Year Ended January 31, | |
Class R5 | | 2016 | | 2015 | | 2014 | | 2013(a) | |
Per share data | |
Net asset value, beginning of period | | $ | 15.85 | | | $ | 15.29 | | | $ | 13.35 | | | $ | 12.29 | | |
Income from investment operations: | |
Net investment income | | | 0.32 | | | | 0.32 | | | | 0.29 | | | | 0.12 | | |
Net realized and unrealized gain (loss) | | | (1.06 | ) | | | 1.10 | | | | 2.02 | | | | 1.05 | | |
Total from investment operations | | | (0.74 | ) | | | 1.42 | | | | 2.31 | | | | 1.17 | | |
Less distributions to shareholders: | |
Net investment income | | | (0.37 | ) | | | (0.40 | ) | | | (0.37 | ) | | | (0.11 | ) | |
Net realized gains | | | (2.91 | ) | | | (0.46 | ) | | | — | | | | — | | |
Total distributions to shareholders | | | (3.28 | ) | | | (0.86 | ) | | | (0.37 | ) | | | (0.11 | ) | |
Net asset value, end of period | | $ | 11.83 | | | $ | 15.85 | | | $ | 15.29 | | | $ | 13.35 | | |
Total return | | | (6.32 | %) | | | 9.26 | % | | | 17.39 | % | | | 9.54 | % | |
Ratios to average net assets(b) | |
Total gross expenses | | | 0.14 | % | | | 0.10 | % | | | 0.10 | % | | | 0.15 | %(c) | |
Total net expenses(d) | | | 0.14 | % | | | 0.10 | % | | | 0.10 | % | | | 0.15 | %(c) | |
Net investment income | | | 2.15 | % | | | 2.03 | % | | | 1.96 | % | | | 4.08 | %(c) | |
Supplemental data | |
Net assets, end of period (in thousands) | | $ | 340 | | | $ | 316 | | | $ | 29 | | | $ | 3 | | |
Portfolio turnover | | | 75 | % | | | 16 | % | | | 18 | % | | | 26 | % | |
Notes to Financial Highlights
(a) Based on operations from November 8, 2012 (commencement of operations) through the stated period end.
(b) In addition to the fees and expenses that the Fund bears directly, the Fund indirectly bears a pro rata share of the fees and expenses of any other funds in which it invests. Such indirect expenses are not included in the Fund's reported expense ratios.
(c) Annualized.
(d) Total net expenses include the impact of certain fee waivers/expense reimbursements made by the Investment Manager and certain of its affiliates, if applicable.
The accompanying Notes to Financial Statements are an integral part of this statement.
Annual Report 2016
25
COLUMBIA GLOBAL STRATEGIC EQUITY FUND
FINANCIAL HIGHLIGHTS (continued)
| | | Year Ended January 31, | | Year Ended
March 31, | |
Class Z | | 2016 | | 2015 | | 2014 | | 2013 | | 2012(a) | | 2011 | |
Per share data | |
Net asset value, beginning of period | | $ | 15.66 | | | $ | 15.11 | | | $ | 13.20 | | | $ | 11.80 | | | $ | 12.45 | | | $ | 10.49 | | |
Income from investment operations: | |
Net investment income | | | 0.26 | | | | 0.22 | | | | 0.20 | | | | 0.20 | | | | 0.09 | | | | 0.11 | | |
Net realized and unrealized gain (loss) | | | (1.01 | ) | | | 1.18 | | | | 2.05 | | | | 1.45 | | | | (0.68 | ) | | | 1.94 | | |
Total from investment operations | | | (0.75 | ) | | | 1.40 | | | | 2.25 | | | | 1.65 | | | | (0.59 | ) | | | 2.05 | | |
Less distributions to shareholders: | |
Net investment income | | | (0.36 | ) | | | (0.39 | ) | | | (0.34 | ) | | | (0.25 | ) | | | (0.06 | ) | | | (0.09 | ) | |
Net realized gains | | | (2.91 | ) | | | (0.46 | ) | | | — | | | | — | | | | — | | | | — | | |
Total distributions to shareholders | | | (3.27 | ) | | | (0.85 | ) | | | (0.34 | ) | | | (0.25 | ) | | | (0.06 | ) | | | (0.09 | ) | |
Net asset value, end of period | | $ | 11.64 | | | $ | 15.66 | | | $ | 15.11 | | | $ | 13.20 | | | $ | 11.80 | | | $ | 12.45 | | |
Total return | | | (6.48 | %) | | | 9.18 | % | | | 17.14 | % | | | 14.09 | % | | | (4.71 | %) | | | 19.64 | % | |
Ratios to average net assets(b) | |
Total gross expenses | | | 0.24 | % | | | 0.23 | % | | | 0.25 | % | | | 0.28 | % | | | 0.26 | %(c) | | | 0.26 | % | |
Total net expenses(d) | | | 0.24 | %(e) | | | 0.23 | %(e) | | | 0.25 | %(e) | | | 0.23 | %(e) | | | 0.20 | %(c)(e) | | | 0.26 | % | |
Net investment income | | | 1.73 | % | | | 1.40 | % | | | 1.42 | % | | | 1.64 | % | | | 0.96 | %(c) | | | 0.97 | % | |
Supplemental data | |
Net assets, end of period (in thousands) | | $ | 24,809 | | | $ | 51,428 | | | $ | 53,613 | | | $ | 49,653 | | | $ | 47,768 | | | $ | 54,882 | | |
Portfolio turnover | | | 75 | % | | | 16 | % | | | 18 | % | | | 26 | % | | | 86 | % | | | 36 | % | |
Notes to Financial Highlights
(a) For the period from April 1, 2011 to January 31, 2012. During the period, the Fund's fiscal year end was changed from March 31 to January 31.
(b) In addition to the fees and expenses that the Fund bears directly, the Fund indirectly bears a pro rata share of the fees and expenses of any other funds in which it invests. Such indirect expenses are not included in the Fund's reported expense ratios.
(c) Annualized.
(d) Total net expenses include the impact of certain fee waivers/expense reimbursements made by the Investment Manager and certain of its affiliates, if applicable.
(e) The benefits derived from expense reductions had an impact of less than 0.01%.
The accompanying Notes to Financial Statements are an integral part of this statement.
Annual Report 2016
26
COLUMBIA GLOBAL STRATEGIC EQUITY FUND
NOTES TO FINANCIAL STATEMENTS
January 31, 2016
Note 1. Organization
Columbia Global Strategic Equity Fund (formerly known as Columbia LifeGoal® Growth Portfolio) (the Fund), a series of Columbia Funds Series Trust (the Trust), is a diversified fund. The Trust is registered under the Investment Company Act of 1940, as amended (the 1940 Act), as an open-end management investment company organized as a Delaware statutory trust. Effective June 2, 2015, Columbia LifeGoal® Growth Portfolio was renamed Columbia Global Strategic Equity Fund.
The Fund is a "fund-of-funds", investing significantly in affiliated funds managed by Columbia Management Investment Advisers, LLC (the Investment Manager), a wholly-owned subsidiary of Ameriprise Financial, Inc. (Ameriprise Financial), or third-party advised (unaffiliated) funds, including exchange-traded funds (collectively, Underlying Funds).
For information on the Underlying Funds, please refer to the Fund's current prospectus and the prospectuses of the Underlying Funds.
Fund Shares
The Trust may issue an unlimited number of shares (without par value). The Fund offers Class A, Class B, Class C, Class K, Class R, Class R4, Class R5 and Class Z shares. Although all share classes generally have identical voting, dividend and liquidation rights, each share class votes separately when required by the Trust's organizational documents or by law. Different share classes pay different distribution amounts to the extent the expenses of such share classes differ, and distributions in liquidation will be proportional to the net asset value of each share class. Each share class has its own expense and sales charge structure.
Class A shares are subject to a maximum front-end sales charge of 5.75% based on the initial investment amount. Class A shares purchased without an initial sales charge in accounts aggregating $1 million to $50 million at the time of purchase are subject to a contingent deferred sales charge (CDSC) if the shares are sold within 18 months after purchase, charged as follows: 1.00% CDSC if redeemed within 12 months after purchase, and 0.50% CDSC if redeemed more than 12, but less than 18, months after purchase.
Class B shares may be subject to a maximum CDSC of 5.00% based upon the holding period after purchase. Class B shares will generally convert to Class A shares eight years after purchase. The Fund no longer accepts investments by new or existing investors in the Fund's Class B shares, except in connection with the
reinvestment of any dividend and/or capital gain distributions in Class B shares of the Fund and exchanges by existing Class B shareholders of certain other funds within the Columbia Family of Funds.
Class C shares are subject to a 1.00% CDSC on shares redeemed within 12 months after purchase.
Class K shares are not subject to sales charges, however this share class is closed to new investors.
Class R shares are not subject to sales charges and are generally available only to certain retirement plans and other investors as described in the Fund's prospectus.
Class R4 shares are not subject to sales charges and are generally available only to omnibus retirement plans and certain investors as described in the Fund's prospectus.
Class R5 shares are not subject to sales charges and are generally available only to investors purchasing through authorized investment professionals and omnibus retirement plans.
Class Z shares are not subject to sales charges and are available only to eligible investors, which are subject to different investment minimums as described in the Fund's prospectus.
Note 2. Summary of Significant Accounting Policies
Basis of Preparation
The Fund is an investment company that applies the accounting and reporting guidance in the Financial Accounting Standards Board (FASB) Accounting Standards Codification Topic 946, Financial Services — Investment Companies (ASC 946). The financial statements are prepared in accordance with U.S. generally accepted accounting principles (GAAP), which requires management to make certain estimates and assumptions that affect the reported amounts of assets and liabilities, the disclosure of contingent assets and liabilities at the date of the financial statements and the reported amounts of income and expenses during the reporting period. Actual results could differ from those estimates.
The following is a summary of significant accounting policies followed by the Fund in the preparation of its financial statements.
Security Valuation
Investments in the Underlying Funds are valued at the net asset value of the applicable class of the Underlying Fund determined as of the close of the New York Stock Exchange (NYSE) on the valuation date.
Annual Report 2016
27
COLUMBIA GLOBAL STRATEGIC EQUITY FUND
NOTES TO FINANCIAL STATEMENTS (continued)
January 31, 2016
All equity securities and exchange-traded funds are valued at the close of business of the NYSE. Equity securities and exchange-traded funds are valued at the last quoted sales price on the principal exchange or market on which they trade, except for securities traded on the NASDAQ Stock Market, which are valued at the NASDAQ official close price. Unlisted securities or listed securities for which there were no sales during the day are valued at the mean of the latest quoted bid and ask prices on such exchanges or markets.
Foreign equity securities are valued based on the closing price on the foreign exchange in which such securities are primarily traded. If any foreign equity security closing prices are not readily available, the securities are valued at the mean of the latest quoted bid and ask prices on such exchanges or markets. Foreign currency exchange rates are generally determined at 4:00 p.m. Eastern (U.S.) time. Many securities markets and exchanges outside the U.S. close prior to the close of the NYSE; therefore, the closing prices for securities in such markets or on such exchanges may not fully reflect events that occur after such close but before the close of the NYSE. In those situations, foreign securities will be fair valued pursuant to a policy adopted by the Board of Trustees (the Board), including, if available, utilizing a third party pricing service to determine these fair values. The third party pricing service takes into account multiple factors, including, but not limited to, movements in the U.S. securities markets, certain depositary receipts, futures contracts and foreign exchange rates that have occurred subsequent to the close of the foreign exchange or market, to determine a good faith estimate that reasonably reflects the current market conditions as of the close of the NYSE. The fair value of a security is likely to be different from the quoted or published price, if available.
Investments for which market quotations are not readily available, or that have quotations which management believes are not reflective of market value or reliable, are valued at fair value as determined in good faith under procedures approved by and under the general supervision of the Board. If a security or class of securities (such as foreign securities) is valued at fair value, such value is likely to be different from the quoted or published price for the security.
The determination of fair value often requires significant judgment. To determine fair value, management may use assumptions including but not limited to future cash flows and estimated risk premiums. Multiple inputs from various sources may be used to determine fair value.
GAAP requires disclosure regarding the inputs and valuation techniques used to measure fair value and any changes in valuation inputs or techniques. In addition, investments shall be disclosed by major category. This information is disclosed following the Fund's Portfolio of Investments.
Foreign Currency Transactions and Translations
The values of all assets and liabilities denominated in foreign currencies are generally translated into U.S. dollars at exchange rates determined at the close of the NYSE on any given day. Net realized and unrealized gains (losses) on foreign currency transactions and translations include gains (losses) arising from the fluctuation in exchange rates between trade and settlement dates on securities transactions, gains (losses) arising from the disposition of foreign currency and currency gains (losses) between the accrual and payment dates on dividends, interest income and foreign withholding taxes.
For financial statement purposes, the Fund does not distinguish that portion of gains (losses) on investments which is due to changes in foreign exchange rates from that which is due to changes in market prices of the investments. Such fluctuations are included with the net realized and unrealized gains (losses) on investments in the Statement of Operations.
Security Transactions
Security transactions are accounted for on the trade date. Cost is determined and gains (losses) are based upon the specific identification method for both financial statement and federal income tax purposes.
Income Recognition
Income and capital gain distributions from the Underlying Funds, if any, are recorded on the ex-dividend date.
Corporate actions and dividend income are generally recorded net of any non-reclaimable tax withholdings, on the ex-dividend date or upon receipt of ex-dividend notification in the case of certain foreign securities.
The Fund may receive distributions from holdings in equity securities, business development companies (BDCs), exchange-traded funds, other regulated investment companies (RICs), and real estate investment trusts (REITs), which report information on the tax character of their distributions annually. These distributions are allocated to dividend income, capital gain and return of capital based on actual information reported. Return of capital is recorded as a reduction of the cost basis of securities held. If the Fund no longer owns the applicable
Annual Report 2016
28
COLUMBIA GLOBAL STRATEGIC EQUITY FUND
NOTES TO FINANCIAL STATEMENTS (continued)
January 31, 2016
securities, return of capital is recorded as a realized gain. With respect to REITs, to the extent actual information has not yet been reported, estimates for return of capital are made by the Fund's management. Management's estimates are subsequently adjusted when the actual character of the distributions is disclosed by the REITs, which could result in a proportionate change in return of capital to shareholders.
Awards from class action litigation are recorded as a reduction of cost basis if the Fund still owns the applicable securities on the payment date. If the Fund no longer owns the applicable securities, the proceeds are recorded as realized gains.
Expenses
General expenses of the Trust are allocated to the Fund and other funds of the Trust based upon relative net assets or other expense allocation methodologies determined by the nature of the expense. Expenses directly attributable to the Fund are charged to the Fund. Expenses directly attributable to a specific class of shares are charged to that share class.
Determination of Class Net Asset Value
All income, expenses (other than class-specific expenses, which are charged to that share class, as shown in the Statement of Operations) and realized and unrealized gains (losses) are allocated to each class of the Fund on a daily basis, based on the relative net assets of each class, for purposes of determining the net asset value of each class.
Federal Income Tax Status
The Fund intends to qualify each year as a regulated investment company under Subchapter M of the Internal Revenue Code, as amended, and will distribute substantially all of its taxable income (including net short-term capital gains), if any, for its tax year, and as such will not be subject to federal income taxes. In addition, the Fund intends to distribute in each calendar year substantially all of its net investment income, capital gains and certain other amounts, if any, such that the Fund should not be subject to federal excise tax. Therefore, no federal income or excise tax provision is recorded.
Foreign Taxes
The Fund may be subject to foreign taxes on income, gains on investments or currency repatriation, a portion of which may be recoverable. The Fund will accrue such taxes and recoveries, as applicable, based upon its
current interpretation of tax rules and regulations that exist in the markets in which it invests.
Realized gains in certain countries may be subject to foreign taxes at the Fund level, based on statutory rates. The Fund accrues for such foreign taxes on realized and unrealized gains at the appropriate rate for each jurisdiction, as applicable. The amount, if any, is disclosed as a liability on the Statement of Assets and Liabilities.
Distributions to Shareholders
Distributions from net investment income, if any, are declared and paid each calendar quarter. Net realized capital gains, if any, are distributed at least annually. Income distributions and capital gain distributions are determined in accordance with federal income tax regulations, which may differ from GAAP.
Guarantees and Indemnifications
Under the Trust's organizational documents and, in some cases, by contract, its officers and trustees are indemnified against certain liabilities arising out of the performance of their duties to the Trust or its funds. In addition, certain of the Fund's contracts with its service providers contain general indemnification clauses. The Fund's maximum exposure under these arrangements is unknown since the amount of any future claims that may be made against the Fund cannot be determined, and the Fund has no historical basis for predicting the likelihood of any such claims.
Recent Accounting Pronouncement
Fair Value Measurement (Topic 820), Disclosure for Investments in Certain Entities That Calculate Net Asset Value per Share (or Its Equivalent)
In May 2015, FASB issued Accounting Standards Update (ASU) No. 2015-07, Fair Value Measurement (Topic 820), Disclosure for Investments in Certain Entities That Calculate Net Asset Value per Share (or Its Equivalent). ASU No. 2015-07 changes the disclosure requirements for investments for which fair value is measured using the net asset value per share practical expedient. The disclosure requirements are effective for annual periods beginning after December 15, 2015 and interim periods within those fiscal years. At this time, management is evaluating the implications of this guidance and the impact it will have on the financial statement amounts and footnote disclosures, if any.
Annual Report 2016
29
COLUMBIA GLOBAL STRATEGIC EQUITY FUND
NOTES TO FINANCIAL STATEMENTS (continued)
January 31, 2016
Note 3. Fees and Other Transactions with Affiliates
Investment Management Fees and Underlying Fund Fees
Under an Investment Management Services Agreement, the Investment Manager determines which securities will be purchased, held or sold. The investment management fee is an annual fee that is a blend of (i) 0.00% on assets invested in Columbia proprietary funds that pay an investment management fee to the Investment Manager, (ii) 0.10% on assets invested in non-exchange-traded third-party advised mutual funds and (iii) 0.55% on assets invested in all other securities, including other funds advised by the Investment Manager that do not pay an investment management fee, exchange-traded funds, derivatives and individual securities. The effective investment management fee rate for the year ended January 31, 2016 was 0.03% of the Fund's average daily net assets.
In addition to the fees and expenses which the Fund bears directly, the Fund indirectly bears a pro rata share of the fees and expenses of the Underlying Funds in which the Fund invests. Because the Underlying Funds have varied expense and fee levels and the Fund may own different proportions of Underlying Funds at different times, the amount of fees and expenses incurred indirectly by the Fund will vary. These expenses are not reflected in the expenses shown in the Understanding Your Fund's Expenses and in the Statement of Operations and are not included in the ratios to average net assets shown in the Financial Highlights.
Participating Affiliates
The Investment Manager and its investment advisory affiliates (Participating Affiliates) around the world may coordinate in providing services to their clients. Such coordination may include functional leadership of the business (the "Global" business). From time to time the Investment Manager (or any affiliated investment subadviser to the Fund, as the case may be) may engage its Participating Affiliates to provide a variety of services such as investment research, investment monitoring, trading and discretionary investment management (including portfolio management) to certain accounts managed by the Investment Manager, including the Fund. These Participating Affiliates will provide services to the Investment Manager (or any affiliated investment subadviser to the Fund as the case may be) either pursuant to subadvisory agreements, personnel-sharing
agreements or similar inter-company arrangements and the Fund will pay no additional fees and expenses as a result of any such arrangements.
These Participating Affiliates, like the Investment Manager, are direct or indirect subsidiaries of Ameriprise Financial and are registered with appropriate respective regulators in their home jurisdictions and, where required, the Securities and Exchange Commission and the Commodity Futures Trading Commission in the United States.
Pursuant to some of these arrangements, certain employees of these Participating Affiliates may serve as "associated persons" of the Investment Manager and, in this capacity, subject to the oversight and supervision of the Investment Manager and consistent with the investment objectives, policies and limitations set forth in the Fund's prospectus and Statement of Additional Information (SAI), may provide such services to the Fund on behalf of the Investment Manager.
Administration Fees
Under an Administrative Services Agreement, the Investment Manager also serves as the Fund Administrator. The Fund pays the Fund Administrator an annual fee for administration and accounting services equal to 0.02% of the Fund's average daily net assets.
Other Expenses
Other expenses are for, among other things, miscellaneous expenses of the Fund or the Board, including payments to Board Services Corp., a company providing limited administrative services to the Fund and the Board. That company's expenses include boardroom and office expense, employee compensation, employee health and retirement benefits, and certain other expenses. For the year ended January 31, 2016, other expenses paid by the Fund to this company were $2,509.
Compensation of Board Members
Board members, who are not officers or employees of the Investment Manager or Ameriprise Financial, are compensated for their services to the Fund as disclosed in the Statement of Operations. Under a Deferred Compensation Plan (the Plan), these Board members may elect to defer payment of up to 100% of their compensation. Deferred amounts are treated as though equivalent dollar amounts had been invested in shares of certain funds managed by the Investment Manager. The Fund's liability for these amounts is adjusted for market value changes and remains in the Fund until
Annual Report 2016
30
COLUMBIA GLOBAL STRATEGIC EQUITY FUND
NOTES TO FINANCIAL STATEMENTS (continued)
January 31, 2016
distributed in accordance with the Plan. All amounts payable under the Plan constitute a general unsecured obligation of the Fund.
Transfer Agency Fees
Under a Transfer and Dividend Disbursing Agent Agreement, Columbia Management Investment Services Corp. (the Transfer Agent), an affiliate of the Investment Manager and a wholly-owned subsidiary of Ameriprise Financial, is responsible for providing transfer agency services to the Fund. The Transfer Agent has contracted with Boston Financial Data Services (BFDS) to serve as sub-transfer agent.
The Transfer Agent receives a monthly transfer agency fee based on the number or the average value of accounts, depending on the type of account. In addition, the Transfer Agent also receives sub-transfer agency fees based on a percentage of the average aggregate value of the Fund's shares maintained in omnibus accounts (other than omnibus accounts for which American Enterprise Investment Services Inc. is the broker of record or accounts where the beneficial shareholder is a customer of Ameriprise Financial Services, Inc., for which the Transfer Agent receives a per account fee). The Transfer Agent pays the fees of BFDS for services as sub-transfer agent and is not entitled to reimbursement for such fees from the Fund (with the exception of out-of-pocket fees).
The Transfer Agent also receives compensation from the Fund for various shareholder services and reimbursements for certain out-of-pocket fees. Total transfer agency fees for Class K and Class R5 shares are subject to an annual limitation of not more than 0.05% of the average daily net assets attributable to each share class.
For the year ended January 31, 2016, the Fund's effective transfer agency fee rates as a percentage of average daily net assets of each class were as follows:
Class A | | | 0.16 | % | |
Class B | | | 0.16 | | |
Class C | | | 0.16 | | |
Class K | | | 0.05 | | |
Class R | | | 0.16 | | |
Class R4 | | | 0.16 | | |
Class R5 | | | 0.05 | | |
Class Z | | | 0.16 | | |
An annual minimum account balance fee of $20 may apply to certain accounts with a value below the
applicable share class's initial minimum investment requirements to reduce the impact of small accounts on transfer agency fees. These minimum account balance fees are remitted to the Fund and recorded as part of expense reductions in the Statement of Operations. For the year ended January 31, 2016, these minimum account balance fees reduced total expenses of the Fund by $680.
Plan Administration Fees
Under a Plan Administration Services Agreement with the Transfer Agent, the Fund pays an annual fee at a rate of 0.25% of the Fund's average daily net assets attributable to Class K shares for the provision of various administrative, recordkeeping, communication and educational services.
Distribution and Service Fees
The Fund has an agreement with Columbia Management Investment Distributors, Inc. (the Distributor), an affiliate of the Investment Manager and a wholly-owned subsidiary of Ameriprise Financial, for distribution and shareholder services. The Board has approved, and the Fund has adopted, distribution and shareholder service plans (the Plans) applicable to certain share classes, which set the distribution and service fees for the Fund. These fees are calculated daily and are intended to compensate the Distributor and/or eligible selling and/or servicing agents for selling shares of the Fund and providing services to investors.
Under the Plans, the Fund pays a monthly combined distribution and service fee to the Distributor at the maximum annual rate of 0.25% of the average daily net assets attributable to Class A shares of the Fund. Also under the Plans, the Fund pays a monthly service fee at the maximum annual rate of 0.25% of the average daily net assets attributable to Class B and Class C shares of the Fund and a monthly distribution fee at the maximum annual rate of 0.75%, 0.75% and 0.50% of the average daily net assets attributable to Class B, Class C and Class R shares of the Fund, respectively.
Sales Charges
Sales charges, including front-end charges and CDSCs, received by the Distributor for distributing Fund shares were $590,902 for Class A, $2,134 for Class B and $3,134 for Class C shares for the year ended January 31, 2016.
Annual Report 2016
31
COLUMBIA GLOBAL STRATEGIC EQUITY FUND
NOTES TO FINANCIAL STATEMENTS (continued)
January 31, 2016
Expenses Waived/Reimbursed by the Investment Manager and its Affiliates
The Investment Manager and certain of its affiliates have contractually agreed to waive fees and/or reimburse expenses (excluding certain fees and expenses described below), so that the Fund's net operating expenses, after giving effect to fees waived/expenses reimbursed and any balance credits and/or overdraft charges from the Fund's custodian, do not exceed the annual rates of:
| | | Contractual
Expense Cap
July 1, 2015
through
May 31, 2016 | | Voluntary
Expense Cap
Prior to
July 1, 2015 | |
Class A | | | 0.51 | % | | | 0.51 | % | |
Class B | | | 1.26 | | | | 1.26 | | |
Class C | | | 1.26 | | | | 1.26 | | |
Class K | | | 0.43 | | | | 0.43 | | |
Class R | | | 0.76 | | | | 0.76 | | |
Class R4 | | | 0.26 | | | | 0.26 | | |
Class R5 | | | 0.18 | | | | 0.18 | | |
Class Z | | | 0.26 | | | | 0.26 | | |
The contractual agreement may be modified or amended only with approval from all parties. Under the arrangements, the following fees and expenses are excluded from the waiver/reimbursement commitment, and therefore will be paid by the Fund, if applicable: taxes (including foreign transaction taxes), expenses associated with investments in affiliated and non-affiliated pooled investment vehicles (including mutual funds and exchange-traded funds), transaction costs and brokerage commissions, costs related to any securities lending program, dividend and interest expenses associated with securities sold short, inverse floater program fees and expenses, transaction charges and interest on borrowed money, interest and extraordinary expenses. The Fund's investment management fee is also excluded from the waiver/reimbursement commitment and is therefore paid by the Fund. Any fees waived and/or expenses reimbursed under the expense reimbursement arrangements described above are not recoverable by the Investment Manager or its affiliates in future periods.
Note 4. Federal Tax Information
The timing and character of income and capital gain distributions are determined in accordance with income
tax regulations, which may differ from GAAP because of temporary or permanent book to tax differences.
At January 31, 2016, these differences are primarily due to differing treatment for deferral/reversal of wash sale losses, Trustees' deferred compensation, foreign currency transactions, passive foreign investment company (PFIC) holdings and re-characterization of distributions for investments. To the extent these differences are permanent, reclassifications are made among the components of the Fund's net assets in the Statement of Assets and Liabilities. Temporary differences do not require reclassifications. In the Statement of Assets and Liabilities the following reclassifications were made:
Undistributed net investment income | | $ | 4,086,645 | | |
Accumulated net realized gain | | | (4,086,645 | ) | |
Net investment income (loss) and net realized gains (losses), as disclosed in the Statement of Operations, and net assets were not affected by this reclassification.
The tax character of distributions paid during the years indicated was as follows:
Year Ended January 31, | | 2016 | | 2015 | |
Ordinary income | | $ | 16,354,753 | | | $ | 17,383,342 | | |
Long-term capital gains | | | 148,439,823 | | | | 23,681,332 | | |
Total | | $ | 164,794,576 | | | $ | 41,064,674 | | |
Short-term capital gain distributions, if any, are considered ordinary income distributions for tax purposes.
At January 31, 2016, the components of distributable earnings on a tax basis were as follows:
Undistributed ordinary income | | $ | 135,630 | | |
Undistributed long-term capital gains | | | 17,297,889 | | |
Net unrealized depreciation | | | (98,377,060 | ) | |
At January 31, 2016, the cost of investments for federal income tax purposes was $740,487,470 and the aggregate gross unrealized appreciation and depreciation based on that cost was:
Unrealized appreciation | | $ | 7,179,534 | | |
Unrealized depreciation | | | (105,556,594 | ) | |
Net unrealized depreciation | | $ | (98,377,060 | ) | |
Management of the Fund has concluded that there are no significant uncertain tax positions in the Fund that would require recognition in the financial statements. However, management's conclusion may be subject to review and adjustment at a later date based on factors including, but not limited to, new tax laws, regulations,
Annual Report 2016
32
COLUMBIA GLOBAL STRATEGIC EQUITY FUND
NOTES TO FINANCIAL STATEMENTS (continued)
January 31, 2016
and administrative interpretations (including relevant court decisions). Generally, the Fund's federal tax returns for the prior three fiscal years remain subject to examination by the Internal Revenue Service.
Note 5. Portfolio Information
The cost of purchases and proceeds from sales of securities, excluding short-term investments and derivatives, if any, aggregated to $567,015,921 and $638,841,583, respectively, for the year ended January 31, 2016. The amount of purchase and sale activity impacts the portfolio turnover rate reported in the Financial Highlights.
Note 6. Affiliated Money Market Fund
The Fund invests in Columbia Short-Term Cash Fund, an affiliated money market fund established for the exclusive use by the Fund and other affiliated funds. The income earned by the Fund from such investments is included as Dividends — affiliated issuers in the Statement of Operations. As an investing fund, the Fund indirectly bears its proportionate share of the expenses of Columbia Short-Term Cash Fund.
Note 7. Line of Credit
The Fund has access to a revolving credit facility whereby the Fund may borrow for the temporary funding of shareholder redemptions or for other temporary or emergency purposes. Effective December 8, 2015, Citibank, N.A. and HSBC Bank USA, N.A. joined JPMorgan Chase Bank, N.A. (JPMorgan) as lead of a syndicate of banks under the credit facility, which is a collective agreement between the Fund and certain other funds managed by the Investment Manager, severally and not jointly, that permits collective borrowings up to $1 billion. Interest is charged to each participating fund based on its borrowings at a rate equal to the higher of (i) the overnight federal funds rate plus 1.00% or (ii) the one-month LIBOR rate plus 1.00%. Each borrowing under the credit facility matures no later than 60 days after the date of borrowing. The Fund also pays a commitment fee equal to its pro rata share of the amount of the credit facility at a rate of 0.15% per annum. The commitment fee is included in other expenses in the Statement of Operations. Prior to December 8, 2015, JPMorgan was the sole lead bank under the credit facility agreement that permitted borrowings up to $550 million under the same terms and interest rates as described above with the exception of the commitment fee which was charged at a rate of 0.075% per annum.
The Fund had no borrowings during the year ended January 31, 2016.
Note 8. Significant Risks
Shareholder Concentration Risk
At January 31, 2016, one unaffiliated shareholder of record owned 22.4% of the outstanding shares of the Fund in one or more accounts. The Fund has no knowledge about whether any portion of those shares was owned beneficially. Affiliated shareholders of record owned 57.2% of the outstanding shares of the Fund in one or more accounts. Subscription and redemption activity by concentrated accounts may have a significant effect on the operations of the Fund. In the case of a large redemption, the Fund may be forced to sell investments at inopportune times, including its liquid or more liquid positions, resulting in Fund losses and the Fund holding a higher percentage of less liquid or illiquid securities. Large redemptions could result in decreased economies of scale and increased operating expenses for non-redeeming Fund shareholders.
Foreign Securities and Emerging Market Countries Risk
Investing in foreign securities may include certain risks and considerations not typically associated with investing in U.S. securities, such as fluctuating currency values and changing local and regional economic, political and social conditions, which may result in greater market volatility. In addition, certain foreign securities may not be as liquid as U.S. securities. Investing in emerging markets may accentuate these risks. These countries are also more likely to experience high levels of inflation, deflation or currency devaluation which could hurt their economies and securities markets. To the extent that the Fund concentrates its investment exposure to any one or a few specific countries, the Fund will be particularly susceptible to the various conditions, events or other factors impacting those countries and may, therefore, have a greater risk than that of a fund which is more geographically diversified.
Note 9. Subsequent Events
Management has evaluated the events and transactions that have occurred through the date the financial statements were issued and noted no items requiring adjustment of the financial statements or additional disclosure.
Annual Report 2016
33
COLUMBIA GLOBAL STRATEGIC EQUITY FUND
NOTES TO FINANCIAL STATEMENTS (continued)
January 31, 2016
Note 10. Information Regarding Pending and Settled Legal Proceedings
In December 2005, without admitting or denying the allegations, American Express Financial Corporation (AEFC, which is now known as Ameriprise Financial, Inc. (Ameriprise Financial)) entered into settlement agreements with the Securities and Exchange Commission (SEC) and Minnesota Department of Commerce (MDOC) related to market timing activities. As a result, AEFC was censured and ordered to cease and desist from committing or causing any violations of certain provisions of the Investment Advisers Act of 1940, the Investment Company Act of 1940, and various Minnesota laws. AEFC agreed to pay disgorgement of $10 million and civil money penalties of $7 million. AEFC also agreed to retain an independent distribution consultant to assist in developing a plan for distribution of all disgorgement and civil penalties ordered by the SEC in accordance with various undertakings detailed at http://www.sec.gov/litigation/admin/ia-2451.pdf. Ameriprise Financial and its affiliates have cooperated with the SEC and the MDOC in these legal proceedings, and have made regular reports to the Funds' Boards of Trustees.
Ameriprise Financial and certain of its affiliates have historically been involved in a number of legal, arbitration and regulatory proceedings, including routine litigation, class actions, and governmental actions, concerning matters arising in connection with the conduct of their business activities. Ameriprise Financial believes that the Funds are not currently the subject of, and that neither Ameriprise Financial nor any of its affiliates are the subject of, any pending legal, arbitration or regulatory proceedings that are likely to have a material adverse effect on the Funds or the ability of Ameriprise Financial or its affiliates to perform under their contracts with the Funds. Ameriprise Financial is required to make quarterly (10-Q), annual (10-K) and, as necessary, 8-K filings with the SEC on legal and regulatory matters that relate to Ameriprise Financial and its affiliates. Copies of these filings may be obtained by accessing the SEC website at www.sec.gov.
There can be no assurance that these matters, or the adverse publicity associated with them, will not result in increased fund redemptions, reduced sale of fund shares or other adverse consequences to the Funds. Further, although we believe proceedings are not likely to have a material adverse effect on the Funds or the ability of Ameriprise Financial or its affiliates to perform under their contracts with the Funds, these proceedings are subject to uncertainties and, as such, we are unable to estimate
the possible loss or range of loss that may result. An adverse outcome in one or more of these proceedings could result in adverse judgments, settlements, fines, penalties or other relief that could have a material adverse effect on the consolidated financial condition or results of operations of Ameriprise Financial.
Annual Report 2016
34
COLUMBIA GLOBAL STRATEGIC EQUITY FUND
REPORT OF INDEPENDENT REGISTERED PUBLIC ACCOUNTING FIRM
To the Trustees of Columbia Funds Series Trust and the Shareholders of
Columbia Global Strategic Equity Fund (formerly known as Columbia LifeGoal® Growth Portfolio)
In our opinion, the accompanying statement of assets and liabilities, including the portfolio of investments, and the related statements of operations and of changes in net assets and the financial highlights present fairly, in all material respects, the financial position of Columbia Global Strategic Equity Fund (formerly known as Columbia LifeGoal® Growth Portfolio) (the "Fund," a series of Columbia Funds Series Trust) at January 31, 2016, and the results of its operations, the changes in its net assets and the financial highlights for each of the periods indicated, in conformity with accounting principles generally accepted in the United States of America. These financial statements and financial highlights (hereafter referred to as "financial statements") are the responsibility of the Fund's management. Our responsibility is to express an opinion on these financial statements based on our audits. We conducted our audits of these financial statements in accordance with the standards of the Public Company Accounting Oversight Board (United States). Those standards require that we plan and perform the audit to obtain reasonable assurance about whether the financial statements are free of material misstatement. An audit includes examining, on a test basis, evidence supporting the amounts and disclosures in the financial statements, assessing the accounting principles used and significant estimates made by management, and evaluating the overall financial statement presentation. We believe that our audits, which included confirmation of securities at January 31, 2016 by correspondence with the custodian, brokers and transfer agent, and the application of alternative auditing procedures where such confirmations had not been received, provide a reasonable basis for our opinion.
PricewaterhouseCoopers LLP
Minneapolis, MN
March 23, 2016
Annual Report 2016
35
COLUMBIA GLOBAL STRATEGIC EQUITY FUND
FEDERAL INCOME TAX INFORMATION
(Unaudited)
The Fund hereby designates the following tax attributes for the fiscal year ended January 31, 2016. Shareholders will be notified in early 2017 of the amounts for use in preparing 2016 income tax returns.
Tax Designations:
| Qualified Dividend Income | | | 85.14 | % | |
| Dividends Received Deduction | | | 44.64 | % | |
Capital Gain Dividend | | $ | 108,295,622 | | |
Foreign Taxes Paid | | $ | 1,193,314 | | |
Foreign Taxes Paid Per Share | | $ | 0.02 | | |
Foreign Source Income | | $ | 6,660,963 | | |
Foreign Source Income Per Share | | $ | 0.12 | | |
Qualified Dividend Income. For taxable, non-corporate shareholders, the percentage of ordinary income distributed during the fiscal year that represents qualified dividend income subject to reduced tax rates.
Dividends Received Deduction. The percentage of ordinary income distributed during the fiscal year that qualifies for the corporate dividends received deduction.
Capital Gain Dividend. The Fund designates as a capital gain dividend the amount reflected above, or if subsequently determined to be different, the net capital gain of such fiscal period.
Foreign Taxes. The Fund makes the election to pass through to shareholders the foreign taxes paid. Eligible shareholders may claim a foreign tax credit. These taxes, and the corresponding foreign source income, are provided.
Annual Report 2016
36
COLUMBIA GLOBAL STRATEGIC EQUITY FUND
Shareholders elect the Board that oversees the Fund's operations. The Board appoints officers who are responsible for day-to-day business decisions based on policies set by the Board. The following table provides basic biographical information about the Fund's Trustees, including their principal occupations during the past five years, although specific titles for individuals may have varied over the period. Under current Board policy, members generally may serve through the end of the calendar year in which he or she reaches either the mandatory retirement age established by the Board or the fifteenth anniversary of the first Board meeting they attended as a member of the Board.
Trustees
Independent Trustees
Name,
Address,
Year of Birth | | Position Held With
the Funds and Length of
Service | | Principal Occupation(s)
During the Past Five Years
and Other Relevant
Professional Experience | | Number of
Funds in the
Columbia
Funds Complex
Overseen | | Other Directorships
Held by Trustee
During the Past
Five Years | |
Kathleen Blatz
901 S. Marquette Ave.
Minneapolis, MN 55402
1954 | | Trustee since 1/06 for RiverSource Funds and since 6/11 for Nations Funds | | Attorney; specializing in arbitration and mediation; Chief Justice, Minnesota Supreme Court, 1998-2006; Associate Justice, Minnesota Supreme Court, 1996-1998; Fourth Judicial District Court Judge, Hennepin County, 1994-1996; Attorney in private practice and public service, 1984-1993; State Representative, Minnesota House of Representatives, 1979-1993, which included service on the Tax and Financial Institutions and Insurance Committees | | | 124 | | | Trustee, BlueCross BlueShield of Minnesota (Chair of the Business Development Committee) since 2009; Chair of the Robina Foundation since August 2013 | |
Edward J. Boudreau, Jr.
901 S. Marquette Ave.
Minneapolis, MN 55402
1944 | | Trustee since 6/11 for RiverSource Funds and since 1/05 for Nations Funds | | Managing Director, E.J. Boudreau & Associates (consulting) since 2000; FINRA Industry Arbitrator, 2002-present; Chairman and Chief Executive Officer, John Hancock Funds (asset management), Chairman and Interested Trustee for open-end and closed-end funds offered by John Hancock, 1989-2000; John Hancock Life Insurance Company, including SVP and Treasurer and SVP Information Technology, 1968-1988 | | | 122 | | | Former Trustee, Boston Museum of Science (Chair of Finance Committee), 1985-2013; former Trustee, BofA Funds Series Trust (11 funds), 2005-2011 | |
Pamela G. Carlton
901 S. Marquette Ave.
Minneapolis, MN 55402
1954 | | Trustee since 7/07 for RiverSource Funds and since 6/11 for Nations Funds | | President, Springboard-Partners in Cross Cultural Leadership (consulting company) since 2003; Managing Director of US Equity Research, JP Morgan Chase, 1999-2003; Director of US Equity Research, Chase Asset Management, 1996-1999; Co-Director Latin America Research, 1993-1996, COO Global Research, 1992-1996, Co-Director of US Research, 1991-1992, Investment Banker, Morgan Stanley, 1982-1991 | | | 124 | | | Trustee, New York Presbyterian Hospital Board (Executive Committee and Chair of Human Resources Committee) since 1996 | |
Annual Report 2016
37
COLUMBIA GLOBAL STRATEGIC EQUITY FUND
TRUSTEES AND OFFICERS (continued)
Independent Trustees (continued)
Name,
Address,
Year of Birth | | Position Held With
the Funds and Length of
Service | | Principal Occupation(s)
During the Past Five Years
and Other Relevant
Professional Experience | | Number of
Funds in the
Columbia
Funds Complex
Overseen | | Other Directorships
Held by Trustee
During the Past
Five Years | |
William P. Carmichael
901 S. Marquette Ave.
Minneapolis, MN 55402
1943 | | Trustee since 6/11 for RiverSource Funds and since 2003 for Nations Funds; Chair of the Board from 1/14-11/15 | | Retired; Co-founder, The Succession Fund (provides exit strategies to owners of privately held companies), 1998-2007; Adjunct Professor of Finance, Kelley School of Business, Indiana University, 1993-2007; Senior Vice President, Sara Lee Corporation, 1991-1993; Senior Vice President and Chief Financial Officer, Beatrice Foods Company, 1984-1990; Vice President, Esmark, Inc., 1973-1984; Associate, Price Waterhouse, 1968-1972 | | | 124 | | | Director, The Finish Line (athletic shoes and apparel) since July 2003; Director, International Textile Corp. since 2012; Director, hhgregg since May, 2015; former Director, Cobra Electronics Corporation (electronic equipment manufacturer), 1994-August 2014; former Director, Spectrum Brands, Inc. (consumer products), 2002-2009; former Director, Simmons Company (bedding), 2004-2010; former Trustee, BofA Funds Series Trust (11 funds), 2009-2011; former Director, McMoRan Exploration Company (oil and gas exploration and development), 2010-2013 | |
Patricia M. Flynn
901 S. Marquette Ave.
Minneapolis, MN 55402
1950 | | Trustee since 11/04 for RiverSource Funds and since 6/11 for Nations Funds | | Trustee Professor of Economics and Management, Bentley University since 1976 (also teaches and conducts research on corporate governance); Dean, McCallum Graduate School of Business, Bentley University, 1992-2002 | | | 124 | | | Trustee, MA Taxpayers Foundation since 1997; Board of Governors, Innovation Institute, MA Technology Collaborative since 2010 | |
William A. Hawkins
901 S. Marquette Ave.
Minneapolis, MN 55402
1942 | | Chair of the Board since 11/15; Trustee since 6/11 for RiverSource Funds and since 1/05 for Nations Funds | | Managing Director, Overton Partners (financial consulting) since August 2010; President and Chief Executive Officer, California General Bank, N.A., January 2008-August 2010; Operation Hope, COO, 2004-2007; IndyMac Bancorp, President, CBG, 1999-2003; American General Bank, President, 1997-1999; Griffin Financial Services, CEO, 1981-1997; The Griffin Funds, CEO, 1992-1998 | | | 124 | | | Former Trustee, BofA Funds Series Trust (11 funds), 2009-2015 | |
R. Glenn Hilliard
901 S. Marquette Ave.
Minneapolis, MN 55402
1943 | | Trustee since 6/11 for RiverSource Funds and since 1/05 for Nations Funds | | Chairman and Chief Executive Officer, Hilliard Group LLC (investing and consulting) since April 2003; Non-Executive Director & Chairman, CNO Financial Group, Inc. (insurance), 2003-2011; Chair & CEO, ING Americas, 1996-2003 | | | 122 | | | Chairman, BofA Funds Series Trust (11 funds); former Director, CNO Financial Group, Inc. (insurance), 2003-2011 | |
Annual Report 2016
38
COLUMBIA GLOBAL STRATEGIC EQUITY FUND
TRUSTEES AND OFFICERS (continued)
Independent Trustees (continued)
Name,
Address,
Year of Birth | | Position Held With
the Funds and Length of
Service | | Principal Occupation(s)
During the Past Five Years
and Other Relevant
Professional Experience | | Number of
Funds in the
Columbia
Funds Complex
Overseen | | Other Directorships
Held by Trustee
During the Past
Five Years | |
Catherine James Paglia
901 S. Marquette Ave.
Minneapolis, MN 55402
1952 | | Trustee since 11/04 for RiverSource Funds and since 6/11 for Nations Funds | | Director, Enterprise Asset Management, Inc. (private real estate and asset management company) since September 1998; Managing Director and Partner, Interlaken Capital, Inc., 1989-1997; Managing Director, Morgan Stanley, 1982-1989; Vice President, Investment Banking, 1980-1982, Associate, Investment Banking, 1976-1980, Dean Witter Reynolds, Inc. | | | 124 | | | Director, Valmont Industries, Inc. (irrigation systems manufacturer) since 2012; Trustee, Carleton College (on the Investment Committee); Trustee, Carnegie Endowment for International Peace (on the Investment Committee) | |
Leroy C. Richie
901 S. Marquette Ave.
Minneapolis, MN 55402
1941 | | Trustee since 2000 for Seligman Funds, since 11/08 for RiverSource Funds and since 6/11 for Nations Funds | | Counsel, Lewis & Munday, P.C. (law firm) since 2004; Vice President and General Counsel, Automotive Legal Affairs, Chrysler Corporation, 1993-1997 | | | 124 | | | Lead Outside Director, Infinity Resources, Inc. (oil and gas exploration and production) since 1994; Lead Outside Director, Digital Ally, Inc. (digital imaging) since September 2005; Trustee, Marygrove College (Chair of Finance Committee) since 2007; former Director, OGE Energy Corp. (energy and energy services), 2007-2014 | |
Minor M. Shaw
901 S. Marquette Ave.
Minneapolis, MN 55402
1947 | | Trustee since 6/11 for RiverSource Funds and since 2003 for Nations Funds | | President, Micco LLC (private investments) since 2011; President, Micco Corp. (family investment business), 1998-2011 | | | 122 | | | Director, Piedmont Natural Gas; Director, BlueCross BlueShield of South Carolina since April 2008; Chair of the Duke Endowment; Director, National Association of Corporate Directors, Carolinas Chapter since 2013; Chair of Greenville — Spartanburg Airport Commission; former Trustee, BofA Funds Series Trust (11 funds), 2003-2011 | |
Alison Taunton-Rigby
901 S. Marquette Ave.
Minneapolis, MN 55402
1944 | | Trustee since 11/02 for RiverSource Funds and since 6/11 for Nations Funds | | Managing Director, Forester Biotech (consulting), 2001-2003; Chief Executive Officer and Director, RiboNovix, Inc., (biotechnology), 2003-2010; President and Chief Executive Officer of CMT Inc., 2001-2003; Aquila Biopharmaceuticals Inc., 1996-2000; Cambridge Biotech Corporation, 1995-1996; Mitotix Inc., 1993-1994 | | | 124 | | | Director, Abt Associates (government contractor) since 2001; Director, Boston Children's Hospital since 2002; Director, Healthways, Inc. (health and well-being solutions) since 2005; Director, ICI Mutual Insurance Company since 2011 | |
Annual Report 2016
39
COLUMBIA GLOBAL STRATEGIC EQUITY FUND
TRUSTEES AND OFFICERS (continued)
Interested Trustee Not Affiliated with Investment Manager*
Name,
Address,
Year of Birth | | Position Held With
Funds and Length of
Service | | Principal Occupation(s)
During Past Five Years
and Other Relevant
Professional Experience | | Number of
Funds in the
Fund Family
Overseen by
Board Member | | Other Present or Past
Directorships/
Trusteeships
(Within Past 5 Years) | |
Anthony M. Santomero
901 S. Marquette Ave.
Minneapolis, MN 55402
1946 | | Trustee since 6/11 for RiverSource Funds and since 1/08 for Nations Funds | | Richard K. Mellon Professor Emeritus of Finance, The Wharton School, University of Pennsylvania since 2002; Senior Advisor, McKinsey & Company (consulting), 2006-2008; President, Federal Reserve Bank of Philadelphia, 2000-2006; Professor of Finance, The Wharton School, University of Pennsylvania, 1972-2002 | | | 122 | | | Trustee, Penn Mutual Life Insurance Company since March 2008; Director, Renaissance Reinsurance Ltd. since May 2008; Director, Citigroup Inc. since 2009; Director, Citibank, N.A. since 2009; former Trustee, BofA Funds Series Trust (11 funds), 2008-2011 | |
* Dr. Santomero is not an affiliated person of the Investment Manager or Ameriprise Financial. However, he is currently deemed by the Funds to be an "interested person" (as defined in the 1940 Act) of the Funds because he serves as a Director of Citigroup Inc. and Citibank, N.A., companies that may directly or through subsidiaries and affiliates engage from time-to-time in brokerage execution, principal transactions and lending relationships with the Funds or accounts advised/managed by the Investment Manager.
Annual Report 2016
40
COLUMBIA GLOBAL STRATEGIC EQUITY FUND
TRUSTEES AND OFFICERS (continued)
Interested Trustee Affiliated with Investment Manager*
Name,
Address,
Year of Birth | | Position Held With
the Funds and Length of
Service | | Principal Occupation(s)
During Past Five Years
and Other Relevant
Professional Experience | | Number of
Funds in the
Columbia
Funds Complex
Overseen | | Other Directorships
Held by Trustee
During the Past
Five Years | |
William F. Truscott
c/o Columbia Management Investment Advisers, LLC,
225 Franklin St.
Boston, MA 02110
1960 | | Trustee since 11/01 for RiverSource Funds and since 6/11 for Nations Funds; Senior Vice President since 2002 for RiverSource Funds and since 5/10 for Nations Funds | | Chairman of the Board and President, Columbia Management Investment Advisers, LLC since May 2010 and February 2012, respectively (previously President and Chief Investment Officer, 2001-April 2010); Chief Executive Officer, Global Asset Management, Ameriprise Financial, Inc. since September 2012 (previously Chief Executive Officer, U.S. Asset Management & President, Annuities, May 2010-September 2012 and President — U.S. Asset Management and Chief Investment Officer, 2005-April 2010); Director and Chief Executive Officer, Columbia Management Investment Distributors, Inc. since May 2010 and February 2012, respectively (previously Chairman of the Board and Chief Executive Officer, 2006-April 2010); Chairman of the Board and Chief Executive Officer, RiverSource Distributors, Inc. since 2006; Director, Threadneedle Asset Management Holdings, SARL since 2014; President and Chief Executive Officer, Ameriprise Certificate Company, 2006-August 2012. | | | 182 | | | Chairman of the Board, Columbia Management Investment Advisers, LLC since May 2010; Director, Columbia Management Investment Distributors, Inc. since May 2010; Former Director, Ameriprise Certificate Company, 2006-January 2013 | |
* Interested person (as defined under the 1940 Act) by reason of being an officer, director, security holder and/or employee of the Investment Manager or Ameriprise Financial.
The Statement of Additional Information has additional information about the Fund's Board members and is available, without charge, upon request by calling 800.345.6611; contacting your financial intermediary; or visiting columbiathreadneedle.com/us.
Annual Report 2016
41
COLUMBIA GLOBAL STRATEGIC EQUITY FUND
TRUSTEES AND OFFICERS (continued)
The Board has appointed officers who are responsible for day-to-day business decisions based on policies it has established. The officers serve at the pleasure of the Board. The following table provides basic information about the Officers of the Fund, including principal occupations during the past five years, although their specific titles may have varied over the period. In addition to Mr. Truscott, who is Senior Vice President, the Fund's other officers are:
Fund Officers
Name,
Address and
Year of Birth | | Position and Year
First Appointed to
Position for any Fund
in the Columbia
Funds Complex or a
Predecessor Thereof | | Principal Occupation(s) During Past Five Years | |
Christopher O. Petersen
5228 Ameriprise
Financial Center
Minneapolis, MN 55474
Born 1970 | | President and Principal Executive Officer (2015) | | Vice President and Lead Chief Counsel, Ameriprise Financial, Inc. since January 2015 (previously, Vice President and Chief Counsel January 2010-December 2014; and Vice President and Group Counsel or Counsel 2004-January 2010); officer of Columbia Funds and affiliated funds since 2007. | |
Michael G. Clarke
225 Franklin Street
Boston, MA 02110
Born 1969 | | Treasurer (2011), Chief Financial Officer (2009) and Chief Accounting Officer (2015) | | Vice President — Mutual Fund Administration, Columbia Management Investment Advisers, LLC, since May 2010; Managing Director of Fund Administration, Columbia Management Advisors, LLC, September 2004-April 2010; senior officer of Columbia Funds and affiliated funds since 2002. | |
Paul B. Goucher
100 Park Avenue
New York, NY 10017
Born 1968 | | Senior Vice President (2011), Chief Legal Officer (2015) and Assistant Secretary (2008) | | Vice President and Lead Chief Counsel, Ameriprise Financial, Inc. since November 2008 and January 2013, respectively (previously Chief Counsel, January 2010-January 2013 and Group Counsel, November 2008-January 2010). | |
Thomas P. McGuire
225 Franklin Street
Boston, MA 02110
Born 1972 | | Senior Vice President and Chief Compliance Officer (2012) | | Vice President — Asset Management Compliance, Ameriprise Financial, Inc., since May 2010; Chief Compliance Officer, Ameriprise Certificate Company since September 2010; Compliance Executive, Bank of America, 2005-April 2010. | |
Colin Moore
225 Franklin Street
Boston, MA 02110
Born 1958 | | Senior Vice President (2010) | | Executive Vice President and Global Chief Investment Officer, Ameriprise Financial, Inc., since July 2013; Director and Global Chief Investment Officer, Columbia Management Investment Advisers, LLC since May 2010; Manager, Managing Director and Chief Investment Officer, Columbia Management Advisors, LLC, 2007-April 2010. | |
Michael E. DeFao
225 Franklin Street
Boston, MA 02110
Born 1968 | | Vice President (2011) and Assistant Secretary (2010) | | Vice President and Chief Counsel, Ameriprise Financial, Inc. since May 2010; Associate General Counsel, Bank of America, 2005-April 2010. | |
Amy Johnson
5228 Ameriprise
Financial Center
Minneapolis, MN 55474
Born 1965 | | Vice President (2006) | | Managing Director and Chief Operating Officer, Columbia Management Investment Advisers, LLC since May 2010 (previously Chief Administrative Officer, 2009-April 2010, and Vice President — Asset Management and Trust Company Services, 2006-2009). | |
Lyn Kephart-Strong
5228 Ameriprise
Financial Center
Minneapolis, MN 55474
Born 1960 | | Vice President (2015) | | President, Columbia Management Investment Services Corp. since October 2014; Vice President & Resolution Officer, Ameriprise Trust Company since August 2009; President, RiverSource Service Corporation 2004-2010. | |
Ryan C. Larrenaga
225 Franklin Street
Boston, MA 02110
Born 1970 | | Vice President and Secretary (2015) | | Vice President and Group Counsel, Ameriprise Financial, Inc. since August 2011 (previously, Counsel from May 2010 to August 2011); Assistant General Counsel, Bank of America, 2005-April 2010; officer of Columbia Funds and affiliated funds since 2005. | |
Annual Report 2016
42
COLUMBIA GLOBAL STRATEGIC EQUITY FUND
IMPORTANT INFORMATION ABOUT THIS REPORT
Each fund mails one shareholder report to each shareholder address. If you would like more than one report, please call shareholder services at 800.345.6611 and additional reports will be sent to you.
The policy of the Board is to vote the proxies of the companies in which each fund holds investments consistent with the procedures as stated in the Statement of Additional Information (SAI). You may obtain a copy of the SAI without charge by calling 800.345.6611; contacting your financial intermediary; visiting columbiathreadneedle.com/us; or searching the website of the Securities and Exchange Commission (SEC) at sec.gov. Information regarding how each fund voted proxies relating to portfolio securities is filed with the SEC by August 31st for the most recent 12-month period ending June 30th of that year, and is available without charge by visiting columbiathreadneedle.com/us, or searching the website of the SEC at sec.gov.
Each fund files a complete schedule of portfolio holdings with the SEC for the first and third quarters of each fiscal year on Form N-Q. Each fund's Form N-Q is available on the SEC's website at sec.gov and may be reviewed and copied at the SEC's Public Reference Room in Washington, D.C. Information on the operation of the Public Reference Room may be obtained by calling 800.SEC.0330. Each fund's complete schedule of portfolio holdings, as filed on Form N-Q, can also be obtained without charge, upon request, by calling 800.345.6611.
Annual Report 2016
43
Columbia Global Strategic Equity Fund
P.O. Box 8081
Boston, MA 02266-8081

This information is for use with concurrent or prior delivery of a fund prospectus. Please read and consider the investment objectives, risks, charges and expenses for any fund carefully before investing. For a prospectus and summary prospectus, which contains this and other important information about the Fund, go to columbiathreadneedle.com/us. The Fund is distributed by Columbia Management Investment Distributors, Inc., member FINRA, and managed by Columbia Management Investment Advisers, LLC.
Columbia Threadneedle Investments (Columbia Threadneedle) is the global brand name of the Columbia and Threadneedle group of companies.
All rights reserved. Columbia Management Investment Distributors, Inc., 225 Franklin Street, Boston, MA 02110-2804
© 2016 Columbia Management Investment Advisers, LLC.
columbiathreadneedle.com/us
ANN181_01_F01_(03/16)

ANNUAL REPORT
January 31, 2016

COLUMBIA CAPITAL ALLOCATION PORTFOLIOS
Columbia Capital Allocation Conservative Portfolio
Columbia Capital Allocation Moderate Conservative Portfolio
Columbia Capital Allocation Moderate Portfolio
Columbia Capital Allocation Moderate Aggressive Portfolio
Columbia Capital Allocation Aggressive Portfolio

ABOUT COLUMBIA THREADNEEDLE INVESTMENTS
Columbia Threadneedle Investments is a leading global asset management group that provides a broad range of actively managed investment strategies and solutions for individual, institutional and corporate clients around the world.
With more than 2,000 people, including over 450 investment professionals based in North America, Europe and Asia, we manage $472 billion* of assets across developed and emerging market equities, fixed income, asset allocation solutions and alternatives. We are the 13th largest manager of long-term mutual fund assets in the U.S.** and the 4th largest manager of retail funds in the U.K.***
Our priority is the investment success of our clients. We aim to deliver the investment outcomes they expect through an investment approach that is team-based, performance-driven and risk-aware. Our culture is dynamic and interactive. By sharing our insights across asset classes and geographies, we generate richer perspectives on global, regional and local investment landscapes. The ability to exchange and debate investment ideas in a collaborative environment enriches our teams' investment processes. More importantly, it results in better informed investment decisions for our clients.
Columbia funds are distributed by Columbia Management Investment Distributors, Inc., member FINRA, and managed by Columbia Management Investment Advisers, LLC.
Columbia Threadneedle Investments (Columbia Threadneedle) is the global brand name of the Columbia and Threadneedle group of companies.
* In U.S. dollars as of December 31, 2015. Source: Ameriprise Q4 Earnings Release. Includes all assets managed by entities in the Columbia and Threadneedle groups of companies. Contact us for more current data.
** Source: ICI as of December 31, 2015 for Columbia Management Investment Advisers, LLC.
*** Source: Investment Association as of September 2015 for Threadneedle Asset Management Limited.
© 2016 Columbia Management Investment Advisers, LLC. All rights reserved.
Not part of the shareholder report
 Dear Shareholder,
Today's investors are typically focused on outcomes, like living a certain retirement lifestyle, paying for college education or building a legacy. But in today's complex global investment landscape, even simple goals are not easily achieved.
At Columbia Threadneedle Investments, we aspire to help satisfy five core needs of today's investors:
n Generate an appropriate stream of income in retirement
Traditional approaches to generating income may not provide the diversification benefits they once did, and they may actually introduce unwanted risk in today's market. To seek to improve your potential to live comfortably long term, we endeavor to pursue investments that explore less traveled paths to income.
n Navigate a changing interest rate environment
Today's uncertain market environment includes the prospect of a rise in interest rates. Blending traditional investments with non-traditional or alternative products may help protect your wealth during periods of volatility. We can attempt to help strengthen your portfolio with agile products designed to take on the market's ups and downs.
n Maximize after-tax returns
In an environment where what you keep may be more important than what you earn, municipal bonds can help mitigate high tax burdens while providing potentially attractive yields. Our state and federal tax-exempt products are aimed at helping investors manage risk, minimize the fluctuation of capital and grow wealth on a more tax-efficient basis.
n Grow assets to achieve financial goals
We believe that finding and protecting growth comes from a disciplined security selection process designed to create excess return. Our goal is to provide investment solutions built to help you face today's market challenges and grow your assets at each crossroad of your journey.
n Ease the impact of volatile markets
Despite a bull market run that has benefited many investors over the past several years, it's important to remember the lessons of 2008 and the value that a well-diversified portfolio may provide through times of market volatility. We are here to help you hold onto the savings you have worked tirelessly to amass, and to provide you the best opportunity to maintain your standard of living regardless of market conditions.
Find out today how we can help you confidently invest to realize your dreams. Please visit us at blog.columbiathreadneedleus.com/our-best-ideas to learn more about our unique investment solutions.
The world is constantly changing, but our priority remains the same: to help you secure your finances, meet your goals and achieve success. Thank you for your continued investment with us.
Sincerely,

Christopher O. Petersen
President, Columbia Funds
Investors should consider the investment objectives, risks, charges and expenses of a mutual fund carefully before investing. For a free prospectus and summary prospectus, which contains this and other important information about a fund, visit columbiathreadneedle.com/us. The prospectus should be read carefully before investing.
Columbia Funds are distributed by Columbia Management Investment Distributors, Inc., member FINRA, and managed by Columbia Management Investment Advisers, LLC.
© 2016 Columbia Management Investment Advisers, LLC. All rights reserved.
COLUMBIA CAPITAL ALLOCATION PORTFOLIOS
Fund Investment Manager
Columbia Management Investment
Advisers, LLC
225 Franklin Street
Boston, MA 02110
Fund Distributor
Columbia Management Investment
Distributors, Inc.
225 Franklin Street
Boston, MA 02110
Fund Transfer Agent
Columbia Management Investment
Services Corp.
P.O. Box 8081
Boston, MA 02266-8081
For more information about any of the funds, please visit columbiathreadneedle.com/us or call 800.345.6611. Customer Service Representatives are available to answer your questions Monday through Friday from 8 a.m. to 7 p.m. Eastern time.
The views expressed in this report reflect the current views of the respective parties. These views are not guarantees of future performance and involve certain risks, uncertainties and assumptions that are difficult to predict, so actual outcomes and results may differ significantly from the views expressed. These views are subject to change at any time based upon economic, market or other conditions and the respective parties disclaim any responsibility to update such views. These views may not be relied on as investment advice and, because investment decisions for a Columbia fund are based on numerous factors, may not be relied on as an indication of trading intent on behalf of any particular Columbia fund. References to specific securities should not be construed as a recommendation or investment advice.
Columbia Capital Allocation Conservative Portfolio
Columbia Capital Allocation Moderate Conservative Portfolio
Columbia Capital Allocation Moderate Portfolio
Columbia Capital Allocation Moderate Aggressive Portfolio
Columbia Capital Allocation Aggressive Portfolio
Performance Overview | | | 11 | | |
Manager Discussion of Fund Performance | | | 13 | | |
Understanding Your Fund's Expenses | | | 16 | | |
Portfolio of Investments | | | 20 | | |
Statements of Assets and Liabilities | | | 84 | | |
Statements of Operations | | | 90 | | |
Statements of Changes in Net Assets | | | 92 | | |
Financial Highlights | | | 101 | | |
Notes to Financial Statements | | | 147 | | |
Reports of Independent Registered
Public Accounting Firm | | | 169 | | |
Federal Income Tax Information | | | 170 | | |
Trustees and Officers | | | 171 | | |
Important Information About This Report | | | 177 | | |
COLUMBIA CAPITAL ALLOCATION PORTFOLIOS
PERFORMANCE OVERVIEW
Columbia Capital Allocation Conservative Portfolio
Performance Summary
n Columbia Capital Allocation Conservative Portfolio (the Fund) Class A shares returned -2.81% excluding sales charges for the 12-month period that ended January 31, 2016.
n The Fund underperformed its Blended Index, which returned -1.00% for the same time period.
n During the same 12-month period, the Fund's domestic fixed-income market, measured by the Barclays U.S. Aggregate Bond Index, returned -0.16% and the Fund's domestic equity market, measured by the Russell 3000 Index, returned -2.48%.
n We attribute the Fund's relative performance to mixed results from asset class allocation and underlying fund performance.
Average Annual Total Returns (%) (for period ended January 31, 2016)
| | | Inception | | 1 Year | | 5 Years | | 10 Years | |
Class A | | 03/04/04 | | | | | | | |
Excluding sales charges | | | | | | | -2.81 | | | | 3.38 | | | | 3.94 | | |
Including sales charges | | | | | | | -7.39 | | | | 2.38 | | | | 3.43 | | |
Class B | | 03/04/04 | | | | | | | |
Excluding sales charges | | | | | | | -3.55 | | | | 2.62 | | | | 3.16 | | |
Including sales charges | | | | | | | -8.23 | | | | 2.29 | | | | 3.16 | | |
Class C | | 03/04/04 | | | | | | | |
Excluding sales charges | | | | | | | -3.56 | | | | 2.64 | | | | 3.16 | | |
Including sales charges | | | | | | | -4.50 | | | | 2.64 | | | | 3.16 | | |
Class K | | 03/04/04 | | | -2.76 | | | | 3.50 | | | | 4.10 | | |
Class R* | | 09/27/10 | | | -3.05 | | | | 3.14 | | | | 3.72 | | |
Class R4* | | 06/13/13 | | | -2.57 | | | | 3.50 | | | | 4.00 | | |
Class R5* | | 06/13/13 | | | -2.60 | | | | 3.54 | | | | 4.02 | | |
Class Y* | | 06/13/13 | | | -2.37 | | | | 3.59 | | | | 4.04 | | |
Class Z* | | 09/27/10 | | | -2.56 | | | | 3.65 | | | | 4.08 | | |
Blended Index | | | | | | | -1.00 | | | | 4.26 | | | | 4.73 | | |
Barclays U.S. Aggregate Bond Index | | | | | | | -0.16 | | | | 3.51 | | | | 4.66 | | |
Russell 3000 Index | | | | | | | -2.48 | | | | 10.40 | | | | 6.38 | | |
Returns for Class A are shown with and without the maximum initial sales charge of 4.75%. Returns for Class B are shown with and without the applicable contingent deferred sales charge (CDSC) of 5.00% in the first year, declining to 1.00% in the sixth year and eliminated thereafter. Returns for Class C are shown with and without the 1.00% CDSC for the first year only. The Fund's other classes are not subject to sales charges and have limited eligibility. Please see the Fund's prospectus for details. Performance for different share classes will vary based on differences in sales charges and fees associated with each class. All results shown assume reinvestment of distributions during the period. Returns do not reflect the deduction of taxes that a shareholder may pay on Fund distributions or on the redemption of Fund shares. Performance results reflect the effect of any fee waivers or reimbursements of Fund expenses by Columbia Management Investment Advisers, LLC and/or any of its affiliates. Absent these fee waivers or expense reimbursement arrangements, performance results would have been lower.
The performance information shown represents past performance and is not a guarantee of future results. The investment return and principal value of your investment will fluctuate so that your shares, when redeemed, may be worth more or less than their original cost. Current performance may be lower or higher than the performance information shown. You may obtain performance information current to the most recent month-end by contacting your financial intermediary, visiting columbiathreadneedle.com/us or calling 800.345.6611.
*The returns shown for periods prior to the share class inception date (including returns for the Life of the Fund, if shown, which are since Fund inception) include the returns of the Fund's oldest share class. Since the Fund launched more than one share class at its inception, Class A shares were used. These returns are adjusted to reflect any higher class-related operating expenses of the newer share classes, as applicable. Please visit columbiathreadneedle.com/us/investment-products/mutual-funds/appended-performance for more information.
The Blended Index consists of 66% Barclays U.S. Aggregate Bond Index, 15% Russell 3000 Index, 10% Citi Three-Month U.S. Treasury Bill Index, 5% MSCI EAFE Index (Unhedged Net) and 4% Barclays U.S. Corporate High-Yield Index. The Citi Three-Month U.S. Treasury Bill Index, an unmanaged index, is representative of the performance of three-month Treasury bills. The MSCI EAFE Index (Unhedged Net) is a free float-adjusted market capitalization index that is designed to measure the equity market performance of developed markets, excluding the U.S. and Canada. The Barclays U.S. Corporate High-Yield Index is a market value-weighted index, which covers the U.S. non-investment-grade fixed-rate debt market. The index is composed of U.S. dollar-denominated corporate debt in industrial, utility and finance sectors with a minimum $150 million par amount outstanding and a maturity greater than one year.
The Barclays U.S. Aggregate Bond Index is a broad-based benchmark that measures the investment-grade, U.S. dollar-denominated, fixed-rate taxable bond market, including Treasuries, government-related and corporate securities, mortgage-backed securities (agency fixed-rate and hybrid adjustable-rate mortgage passthroughs), asset-backed securities, and commercial mortgage-backed securities.
The Russell 3000 Index, an unmanaged index, measures the performance of the 3,000 largest U.S. companies based on total market capitalization, which represents approximately 98% of the investable U.S. equity market.
Indices are not available for investment, are not professionally managed and do not reflect sales charges, fees, brokerage commissions, taxes (except the MSCI EAFE Index (Unhedged Net), which reflects reinvested dividends net of withholding taxes) or other expenses of investing. Securities in the Fund may not match those in an index.
Annual Report 2016
3
COLUMBIA CAPITAL ALLOCATION PORTFOLIOS
PERFORMANCE OVERVIEW (continued)
Columbia Capital Allocation Conservative Portfolio
Performance of a Hypothetical $10,000 Investment (February 1, 2006 – January 31, 2016)
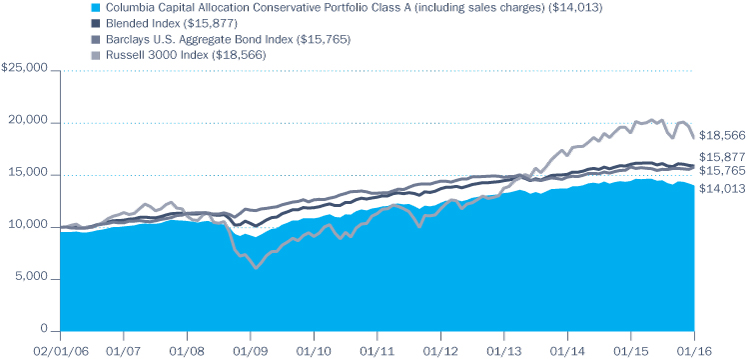
The chart above shows the change in value of a hypothetical $10,000 investment in Class A shares of Columbia Capital Allocation Conservative Portfolio during the stated time period, and does not reflect the deduction of taxes that a shareholder may pay on Fund distributions or on the redemption of Fund shares.
Annual Report 2016
4
COLUMBIA CAPITAL ALLOCATION PORTFOLIOS
PERFORMANCE OVERVIEW
Columbia Capital Allocation Moderate Conservative Portfolio
Performance Summary
n Columbia Capital Allocation Moderate Conservative Portfolio (the Fund) Class A shares returned -2.78% excluding sales charges for the 12-month period that ended January 31, 2016.
n The Fund underperformed its Blended Index, which returned -1.56% for the same time period.
n During the same 12-month period, the Fund's domestic fixed-income market, measured by the Barclays U.S. Aggregate Bond Index, returned -0.16% and the Fund's domestic equity market, measured by the Russell 3000 Index, returned -2.48%.
n We attribute the Fund's relative performance to mixed results from asset class allocation and underlying fund performance.
Average Annual Total Returns (%) (for period ended January 31, 2016)
| | | Inception | | 1 Year | | 5 Years | | 10 Years | |
Class A | | 10/15/96 | | | | | | | |
Excluding sales charges | | | | | | | -2.78 | | | | 4.64 | | | | 4.85 | | |
Including sales charges | | | | | | | -8.37 | | | | 3.41 | | | | 4.22 | | |
Class B | | 08/07/97 | | | | | | | |
Excluding sales charges | | | | | | | -3.53 | | | | 3.83 | | | | 4.05 | | |
Including sales charges | | | | | | | -8.15 | | | | 3.51 | | | | 4.05 | | |
Class C | | 10/15/96 | | | | | | | |
Excluding sales charges | | | | | | | -3.56 | | | | 3.84 | | | | 4.06 | | |
Including sales charges | | | | | | | -4.48 | | | | 3.84 | | | | 4.06 | | |
Class K* | | 02/28/13 | | | -2.65 | | | | 4.68 | | | | 4.87 | | |
Class R | | 01/23/06 | | | -2.93 | | | | 4.38 | | | | 4.60 | | |
Class R4* | | 11/08/12 | | | -2.46 | | | | 4.81 | | | | 4.93 | | |
Class R5* | | 11/08/12 | | | -2.48 | | | | 4.86 | | | | 4.95 | | |
Class Y* | | 06/13/13 | | | -2.38 | | | | 4.87 | | | | 4.96 | | |
Class Z | | 10/15/96 | | | -2.56 | | | | 4.89 | | | | 5.09 | | |
Blended Index | | | | | | | -1.56 | | | | 5.17 | | | | 5.08 | | |
Barclays U.S. Aggregate Bond Index | | | | | | | -0.16 | | | | 3.51 | | | | 4.66 | | |
Russell 3000 Index | | | | | | | -2.48 | | | | 10.40 | | | | 6.38 | | |
Returns for Class A are shown with and without the maximum initial sales charge of 5.75%. Returns for Class B are shown with and without the applicable contingent deferred sales charge (CDSC) of 5.00% in the first year, declining to 1.00% in the sixth year and eliminated thereafter. Returns for Class C are shown with and without the 1.00% CDSC for the first year only. The Fund's other classes are not subject to sales charges and have limited eligibility. Please see the Fund's prospectus for details. Performance for different share classes will vary based on differences in sales charges and fees associated with each class. All results shown assume reinvestment of distributions during the period. Returns do not reflect the deduction of taxes that a shareholder may pay on Fund distributions or on the redemption of Fund shares. Performance results reflect the effect of any fee waivers or reimbursements of Fund expenses by Columbia Management Investment Advisers, LLC and/or any of its affiliates. Absent these fee waivers or expense reimbursement arrangements, performance results would have been lower.
The performance information shown represents past performance and is not a guarantee of future results. The investment return and principal value of your investment will fluctuate so that your shares, when redeemed, may be worth more or less than their original cost. Current performance may be lower or higher than the performance information shown. You may obtain performance information current to the most recent month-end by contacting your financial intermediary, visiting columbiathreadneedle.com/us or calling 800.345.6611.
*The returns shown for periods prior to the share class inception date (including returns for the Life of the Fund, if shown, which are since Fund inception) include the returns of the Fund's oldest share class. Since the Fund launched more than one share class at its inception, Class A shares were used. These returns are adjusted to reflect any higher class-related operating expenses of the newer share classes, as applicable. Please visit columbiathreadneedle.com/us/investment-products/mutual-funds/appended-performance for more information.
The Blended Index consists of 55.5% Barclays U.S. Aggregate Bond Index, 26% Russell 3000 Index, 9% MSCI EAFE Index (Unhedged Net), 5% Citi Three-Month U.S. Treasury Bill Index and 4.5% Barclays U.S. Corporate High-Yield Index. The MSCI EAFE Index (Unhedged Net) is a free float-adjusted market capitalization index that is designed to measure the equity market performance of developed markets, excluding the U.S. and Canada. The Citi Three-Month U.S. Treasury Bill Index, an unmanaged index, is representative of the performance of three-month Treasury bills. The Barclays U.S. Corporate High-Yield Index is a market value-weighted index, which covers the U.S. non-investment-grade fixed-rate debt market. The index is composed of U.S. dollar-denominated corporate debt in industrial, utility and finance sectors with a minimum $150 million par amount outstanding and a maturity greater than one year.
The Barclays U.S. Aggregate Bond Index is a broad-based benchmark that measures the investment-grade, U.S. dollar-denominated, fixed-rate taxable bond market, including Treasuries, government-related and corporate securities, mortgage-backed securities (agency fixed-rate and hybrid adjustable-rate mortgage passthroughs), asset-backed securities, and commercial mortgage-backed securities.
The Russell 3000 Index, an unmanaged index, measures the performance of the 3,000 largest U.S. companies based on total market capitalization, which represents approximately 98% of the investable U.S. equity market.
Indices are not available for investment, are not professionally managed and do not reflect sales charges, fees, brokerage commissions, taxes (except the MSCI EAFE Index (Unhedged Net), which reflects reinvested dividends net of withholding taxes) or other expenses of investing. Securities in the Fund may not match those in an index.
Annual Report 2016
5
COLUMBIA CAPITAL ALLOCATION PORTFOLIOS
PERFORMANCE OVERVIEW (continued)
Columbia Capital Allocation Moderate Conservative Portfolio
Performance of a Hypothetical $10,000 Investment (February 1, 2006 – January 31, 2016)

The chart above shows the change in value of a hypothetical $10,000 investment in Class A shares of Columbia Capital Allocation Moderate Conservative Portfolio during the stated time period, and does not reflect the deduction of taxes that a shareholder may pay on Fund distributions or on the redemption of Fund shares.
Annual Report 2016
6
COLUMBIA CAPITAL ALLOCATION PORTFOLIOS
PERFORMANCE OVERVIEW
Columbia Capital Allocation Moderate Portfolio
Performance Summary
n Columbia Capital Allocation Moderate Portfolio (the Fund) Class A shares returned -2.89% excluding sales charges for the 12-month period that ended January 31, 2016.
n The Fund underperformed its Blended Index, which returned -2.62% for the same time period.
n During the same 12-month period, the Fund's domestic equity market, measured by the Russell 3000 Index, returned -2.48% and the Fund's domestic fixed-income market, measured by the Barclays U.S. Aggregate Bond Index, returned -0.16%.
n We attribute the Fund's relative performance to mixed results from asset class allocation and underlying fund performance.
Average Annual Total Returns (%) (for period ended January 31, 2016)
| | | Inception | | 1 Year | | 5 Years | | 10 Years | |
Class A | | 03/04/04 | | | | | | | |
Excluding sales charges | | | | | | | -2.89 | | | | 5.25 | | | | 4.90 | | |
Including sales charges | | | | | | | -8.46 | | | | 4.02 | | | | 4.29 | | |
Class B | | 03/04/04 | | | | | | | |
Excluding sales charges | | | | | | | -3.56 | | | | 4.47 | | | | 4.12 | | |
Including sales charges | | | | | | | -8.05 | | | | 4.15 | | | | 4.12 | | |
Class C | | 03/04/04 | | | | | | | |
Excluding sales charges | | | | | | | -3.48 | | | | 4.49 | | | | 4.13 | | |
Including sales charges | | | | | | | -4.38 | | | | 4.49 | | | | 4.13 | | |
Class K | | 03/04/04 | | | -2.83 | | | | 5.34 | | | | 5.07 | | |
Class R* | | 09/27/10 | | | -3.06 | | | | 5.01 | | | | 4.65 | | |
Class R4* | | 06/13/13 | | | -2.58 | | | | 5.41 | | | | 4.98 | | |
Class R5* | | 06/13/13 | | | -2.61 | | | | 5.45 | | | | 5.00 | | |
Class Y* | | 06/13/13 | | | -2.42 | | | | 5.49 | | | | 5.02 | | |
Class Z* | | 09/27/10 | | | -2.65 | | | | 5.52 | | | | 5.04 | | |
Blended Index | | | | | | | -2.62 | | | | 5.92 | | | | 5.44 | | |
Russell 3000 Index | | | | | | | -2.48 | | | | 10.40 | | | | 6.38 | | |
Barclays U.S. Aggregate Bond Index | | | | | | | -0.16 | | | | 3.51 | | | | 4.66 | | |
Returns for Class A are shown with and without the maximum initial sales charge of 5.75%. Returns for Class B are shown with and without the applicable contingent deferred sales charge (CDSC) of 5.00% in the first year, declining to 1.00% in the sixth year and eliminated thereafter. Returns for Class C are shown with and without the 1.00% CDSC for the first year only. The Fund's other classes are not subject to sales charges and have limited eligibility. Please see the Fund's prospectus for details. Performance for different share classes will vary based on differences in sales charges and fees associated with each class. All results shown assume reinvestment of distributions during the period. Returns do not reflect the deduction of taxes that a shareholder may pay on Fund distributions or on the redemption of Fund shares. Performance results reflect the effect of any fee waivers or reimbursements of Fund expenses by Columbia Management Investment Advisers, LLC and/or any of its affiliates. Absent these fee waivers or expense reimbursement arrangements, performance results would have been lower.
The performance information shown represents past performance and is not a guarantee of future results. The investment return and principal value of your investment will fluctuate so that your shares, when redeemed, may be worth more or less than their original cost. Current performance may be lower or higher than the performance information shown. You may obtain performance information current to the most recent month-end by contacting your financial intermediary, visiting columbiathreadneedle.com/us or calling 800.345.6611.
*The returns shown for periods prior to the share class inception date (including returns for the Life of the Fund, if shown, which are since Fund inception) include the returns of the Fund's oldest share class. Since the Fund launched more than one share class at its inception, Class A shares were used. These returns are adjusted to reflect any higher class-related operating expenses of the newer share classes, as applicable. Please visit columbiathreadneedle.com/us/investment-products/mutual-funds/appended-performance for more information.
The Blended Index consists of 42.5% Barclays U.S. Aggregate Bond Index, 37% Russell 3000 Index, 11% MSCI EAFE Index (Unhedged Net), 7.5% Barclays U.S. Corporate High-Yield Index and 2% MSCI Emerging Markets Index (Net). The MSCI EAFE Index (Unhedged Net) is a free float-adjusted market capitalization index that is designed to measure the equity market performance of developed markets, excluding the U.S. and Canada. The Barclays U.S. Corporate High-Yield Index is a market value-weighted index, which covers the U.S. non-investment-grade fixed-rate debt market. The index is composed of U.S. dollar-denominated corporate debt in industrial, utility and finance sectors with a minimum $150 million par amount outstanding and a maturity greater than one year. The MSCI Emerging Markets Index (Net) is a free float-adjusted market capitalization index that is designed to measure equity market performance of emerging markets.
The Russell 3000 Index, an unmanaged index, measures the performance of the 3,000 largest U.S. companies based on total market capitalization, which represents approximately 98% of the investable U.S. equity market.
The Barclays U.S. Aggregate Bond Index is a broad-based benchmark that measures the investment-grade, U.S. dollar-denominated, fixed-rate taxable bond market, including Treasuries, government-related and corporate securities, mortgage-backed securities (agency fixed-rate and hybrid adjustable-rate mortgage passthroughs), asset-backed securities, and commercial mortgage-backed securities.
Indices are not available for investment, are not professionally managed and do not reflect sales charges, fees, brokerage commissions, taxes (except the MSCI EAFE Index (Unhedged Net) and the MSCI Emerging Markets Index (Net), which reflect reinvested dividends net of withholding taxes) or other expenses of investing. Securities in the Fund may not match those in an index.
Annual Report 2016
7
COLUMBIA CAPITAL ALLOCATION PORTFOLIOS
PERFORMANCE OVERVIEW (continued)
Columbia Capital Allocation Moderate Portfolio
Performance of a Hypothetical $10,000 Investment (February 1, 2006 – January 31, 2016)
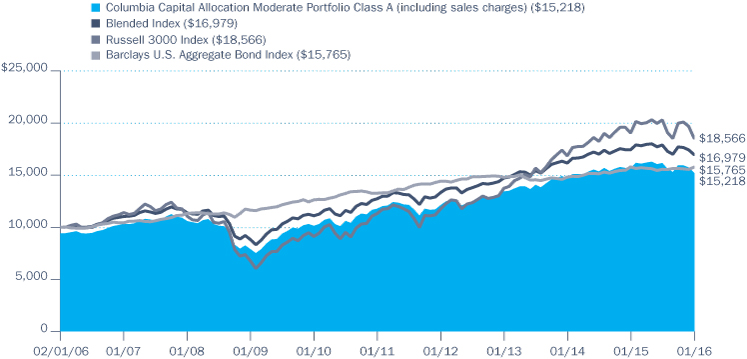
The chart above shows the change in value of a hypothetical $10,000 investment in Class A shares of Columbia Capital Allocation Moderate Portfolio during the stated time period, and does not reflect the deduction of taxes that a shareholder may pay on Fund distributions or on the redemption of Fund shares.
Annual Report 2016
8
COLUMBIA CAPITAL ALLOCATION PORTFOLIOS
PERFORMANCE OVERVIEW
Columbia Capital Allocation Moderate Aggressive Portfolio
Performance Summary
n Columbia Capital Allocation Moderate Aggressive Portfolio (the Fund) Class A shares returned -3.42% excluding sales charges for the 12-month period that ended January 31, 2016.
n The Fund slightly underperformed its Blended Index, which returned -3.38% for the same time period.
n During the same 12-month period, the Fund's domestic equity market, measured by the Russell 3000 Index, returned -2.48% and the Fund's domestic fixed-income market, measured by the Barclays U.S. Aggregate Bond Index, returned -0.16%.
n We attribute the Fund's relative performance to mixed results from asset class allocation and underlying fund performance.
Average Annual Total Returns (%) (for period ended January 31, 2016)
| | | Inception | | 1 Year | | 5 Years | | 10 Years | |
Class A | | 10/15/96 | | | | | | | |
Excluding sales charges | | | | | | | -3.42 | | | | 5.56 | | | | 5.33 | | |
Including sales charges | | | | | | | -8.98 | | | | 4.31 | | | | 4.70 | | |
Class B | | 08/13/97 | | | | | | | |
Excluding sales charges | | | | | | | -4.15 | | | | 4.78 | | | | 4.53 | | |
Including sales charges | | | | | | | -8.62 | | | | 4.45 | | | | 4.53 | | |
Class C | | 10/15/96 | | | | | | | |
Excluding sales charges | | | | | | | -4.08 | | | | 4.78 | | | | 4.54 | | |
Including sales charges | | | | | | | -4.98 | | | | 4.78 | | | | 4.54 | | |
Class K* | | 02/28/13 | | | -3.32 | | | | 5.65 | | | | 5.37 | | |
Class R | | 01/23/06 | | | -3.67 | | | | 5.30 | | | | 5.07 | | |
Class R4* | | 11/08/12 | | | -3.23 | | | | 5.74 | | | | 5.42 | | |
Class R5* | | 11/08/12 | | | -3.05 | | | | 5.82 | | | | 5.46 | | |
Class T* | | 03/07/11 | | | | | | | |
Excluding sales charges | | | | | | | -3.42 | | | | 5.52 | | | | 5.28 | | |
Including sales charges | | | | | | | -8.98 | | | | 4.27 | | | | 4.66 | | |
Class Y* | | 06/13/13 | | | -3.09 | | | | 5.80 | | | | 5.45 | | |
Class Z | | 10/15/96 | | | -3.26 | | | | 5.81 | | | | 5.60 | | |
Blended Index | | | | | | | -3.38 | | | | 6.51 | | | | 5.52 | | |
Russell 3000 Index | | | | | | | -2.48 | | | | 10.40 | | | | 6.38 | | |
Barclays U.S. Aggregate Bond Index | | | | | | | -0.16 | | | | 3.51 | | | | 4.66 | | |
Returns for Class A and Class T are shown with and without the maximum initial sales charge of 5.75%. Returns for Class B are shown with and without the applicable contingent deferred sales charge (CDSC) of 5.00% in the first year, declining to 1.00% in the sixth year and eliminated thereafter. Returns for Class C are shown with and without the 1.00% CDSC for the first year only. The Fund's other classes are not subject to sales charges and have limited eligibility. Please see the Fund's prospectus for details. Performance for different share classes will vary based on differences in sales charges and fees associated with each class. All results shown assume reinvestment of distributions during the period. Returns do not reflect the deduction of taxes that a shareholder may pay on Fund distributions or on the redemption of Fund shares. Performance results reflect the effect of any fee waivers or reimbursements of Fund expenses by Columbia Management Investment Advisers, LLC and/or any of its affiliates. Absent these fee waivers or expense reimbursement arrangements, performance results would have been lower.
The performance information shown represents past performance and is not a guarantee of future results. The investment return and principal value of your investment will fluctuate so that your shares, when redeemed, may be worth more or less than their original cost. Current performance may be lower or higher than the performance information shown. You may obtain performance information current to the most recent month-end by contacting your financial intermediary, visiting columbiathreadneedle.com/us or calling 800.345.6611.
*The returns shown for periods prior to the share class inception date (including returns for the Life of the Fund, if shown, which are since Fund inception) include the returns of the Fund's oldest share class. Since the Fund launched more than one share class at its inception, Class A shares were used. These returns are adjusted to reflect any higher class-related operating expenses of the newer share classes, as applicable. Please visit columbiathreadneedle.com/us/investment-products/mutual-funds/appended-performance for more information.
The Blended Index consists of 49% Russell 3000 Index, 28.5% Barclays U.S. Aggregate Bond Index, 12% MSCI EAFE Index (Unhedged Net), 6.5% Barclays U.S. Corporate High-Yield Index and 4% MSCI Emerging Markets Index (Net).The MSCI EAFE Index (Unhedged Net) is a free float-adjusted market capitalization index that is designed to measure the equity market performance of developed markets, excluding the U.S. and Canada. The Barclays U.S. Corporate High-Yield Index is a market value-weighted index, which covers the U.S. non-investment-grade fixed-rate debt market. The index is composed of U.S. dollar-denominated corporate debt in industrial, utility and finance sectors with a minimum $150 million par amount outstanding and a maturity greater than one year. The MSCI Emerging Markets Index (Net) is a free float-adjusted market capitalization index that is designed to measure equity market performance of emerging markets.
The Russell 3000 Index, an unmanaged index, measures the performance of the 3,000 largest U.S. companies based on total market capitalization, which represents approximately 98% of the investable U.S. equity market.
The Barclays U.S. Aggregate Bond Index is a broad-based benchmark that measures the investment-grade, U.S. dollar-denominated, fixed-rate taxable bond market, including Treasuries, government-related and corporate securities, mortgage-backed securities (agency fixed-rate and hybrid adjustable-rate mortgage passthroughs), asset-backed securities, and commercial mortgage-backed securities.
Indices are not available for investment, are not professionally managed and do not reflect sales charges, fees, brokerage commissions, taxes (except the MSCI EAFE Index (Unhedged Net) and the MSCI Emerging Markets Index (Net), which reflect reinvested dividends net of withholding taxes) or other expenses of investing. Securities in the Fund may not match those in an index.
Annual Report 2016
9
COLUMBIA CAPITAL ALLOCATION PORTFOLIOS
PERFORMANCE OVERVIEW (continued)
Columbia Capital Allocation Moderate Aggressive Portfolio
Performance of a Hypothetical $10,000 Investment (February 1, 2006 – January 31, 2016)
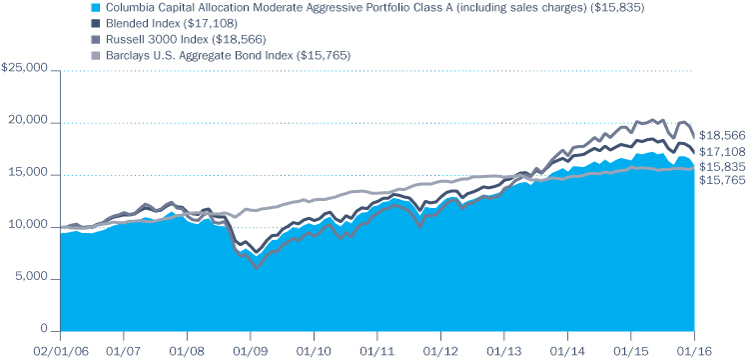
The chart above shows the change in value of a hypothetical $10,000 investment in Class A shares of Columbia Capital Allocation Moderate Aggressive Portfolio during the stated time period, and does not reflect the deduction of taxes that a shareholder may pay on Fund distributions or on the redemption of Fund shares.
Annual Report 2016
10
COLUMBIA CAPITAL ALLOCATION PORTFOLIOS
PERFORMANCE OVERVIEW
Columbia Capital Allocation Aggressive Portfolio
Performance Summary
n Columbia Capital Allocation Aggressive Portfolio (the Fund) Class A shares returned -3.92% excluding sales charges for the 12-month period that ended January 31, 2016.
n The Fund outperformed its Blended Index, which returned -4.20% for the same time period.
n During the same 12-month period, the Fund's domestic equity market, measured by the Russell 3000 Index, returned -2.48% and the Fund's domestic fixed-income market, measured by the Barclays U.S. Aggregate Bond Index, returned -0.16%.
n We attribute the Fund's relative performance to mixed results from asset class allocation and underlying fund performance.
Average Annual Total Returns (%) (for period ended January 31, 2016)
| | | Inception | | 1 Year | | 5 Years | | 10 Years | |
Class A | | 03/04/04 | | | | | | | |
Excluding sales charges | | | | | | | -3.92 | | | | 6.20 | | | | 4.60 | | |
Including sales charges | | | | | | | -9.47 | | | | 4.94 | | | | 3.98 | | |
Class B | | 03/04/04 | | | | | | | |
Excluding sales charges | | | | | | | -4.60 | | | | 5.40 | | | | 3.81 | | |
Including sales charges | | | | | | | -9.02 | | | | 5.08 | | | | 3.81 | | |
Class C | | 03/04/04 | | | | | | | |
Excluding sales charges | | | | | | | -4.60 | | | | 5.41 | | | | 3.81 | | |
Including sales charges | | | | | | | -5.48 | | | | 5.41 | | | | 3.81 | | |
Class K | | 03/04/04 | | | -3.76 | | | | 6.32 | | | | 4.78 | | |
Class R* | | 09/27/10 | | | -4.09 | | | | 5.94 | | | | 4.37 | | |
Class R4* | | 06/13/13 | | | -3.65 | | | | 6.34 | | | | 4.67 | | |
Class R5* | | 06/13/13 | | | -3.58 | | | | 6.40 | | | | 4.70 | | |
Class Y* | | 06/13/13 | | | -3.54 | | | | 6.41 | | | | 4.70 | | |
Class Z* | | 09/27/10 | | | -3.69 | | | | 6.46 | | | | 4.74 | | |
Blended Index | | | | | | | -4.20 | | | | 6.97 | | | | 5.48 | | |
Russell 3000 Index | | | | | | | -2.48 | | | | 10.40 | | | | 6.38 | | |
Barclays U.S. Aggregate Bond Index | | | | | | | -0.16 | | | | 3.51 | | | | 4.66 | | |
Returns for Class A are shown with and without the maximum initial sales charge of 5.75%. Returns for Class B are shown with and without the applicable contingent deferred sales charge (CDSC) of 5.00% in the first year, declining to 1.00% in the sixth year and eliminated thereafter. Returns for Class C are shown with and without the 1.00% CDSC for the first year only. The Fund's other classes are not subject to sales charges and have limited eligibility. Please see the Fund's prospectus for details. Performance for different share classes will vary based on differences in sales charges and fees associated with each class. All results shown assume reinvestment of distributions during the period. Returns do not reflect the deduction of taxes that a shareholder may pay on Fund distributions or on the redemption of Fund shares. Performance results reflect the effect of any fee waivers or reimbursements of Fund expenses by Columbia Management Investment Advisers, LLC and/or any of its affiliates. Absent these fee waivers or expense reimbursement arrangements, performance results would have been lower.
The performance information shown represents past performance and is not a guarantee of future results. The investment return and principal value of your investment will fluctuate so that your shares, when redeemed, may be worth more or less than their original cost. Current performance may be lower or higher than the performance information shown. You may obtain performance information current to the most recent month-end by contacting your financial intermediary, visiting columbiathreadneedle.com/us or calling 800.345.6611.
*The returns shown for periods prior to the share class inception date (including returns for the Life of the Fund, if shown, which are since Fund inception) include the returns of the Fund's oldest share class. Since the Fund launched more than one share class at its inception, Class A shares were used. These returns are adjusted to reflect any higher class-related operating expenses of the newer share classes, as applicable. Please visit columbiathreadneedle.com/us/investment-products/mutual-funds/appended-performance for more information.
The Blended Index consists of 60% Russell 3000 Index, 15% Barclays U.S. Aggregate Bond Index, 14% MSCI EAFE Index (Unhedged Net), 6% MSCI Emerging Markets Index (Net) and 5% Barclays U.S. Corporate High-Yield Index. The MSCI EAFE Index (Unhedged Net) is a free float-adjusted market capitalization index that is designed to measure the equity market performance of developed markets, excluding the U.S. and Canada. The MSCI Emerging Markets Index (Net) is a free float-adjusted market capitalization index that is designed to measure equity market performance of emerging markets. The Barclays U.S. Corporate High-Yield Index is a market value-weighted index, which covers the U.S. non-investment-grade fixed-rate debt market. The index is composed of U.S. dollar-denominated corporate debt in industrial, utility and finance sectors with a minimum $150 million par amount outstanding and a maturity greater than one year.
The Russell 3000 Index, an unmanaged index, measures the performance of the 3,000 largest U.S. companies based on total market capitalization, which represents approximately 98% of the investable U.S. equity market.
The Barclays U.S. Aggregate Bond Index is a broad-based benchmark that measures the investment-grade, U.S. dollar-denominated, fixed-rate taxable bond market, including Treasuries, government-related and corporate securities, mortgage-backed securities (agency fixed-rate and hybrid adjustable-rate mortgage passthroughs), asset-backed securities, and commercial mortgage-backed securities.
Indices are not available for investment, are not professionally managed and do not reflect sales charges, fees, brokerage commissions, taxes (except the MSCI EAFE Index (Unhedged Net) and the MSCI Emerging Markets Index (Net), which reflect reinvested dividends net of withholding taxes) or other expenses of investing. Securities in the Fund may not match those in an index.
Annual Report 2016
11
COLUMBIA CAPITAL ALLOCATION PORTFOLIOS
PERFORMANCE OVERVIEW (continued)
Columbia Capital Allocation Aggressive Portfolio
Performance of a Hypothetical $10,000 Investment (February 1, 2006 – January 31, 2016)
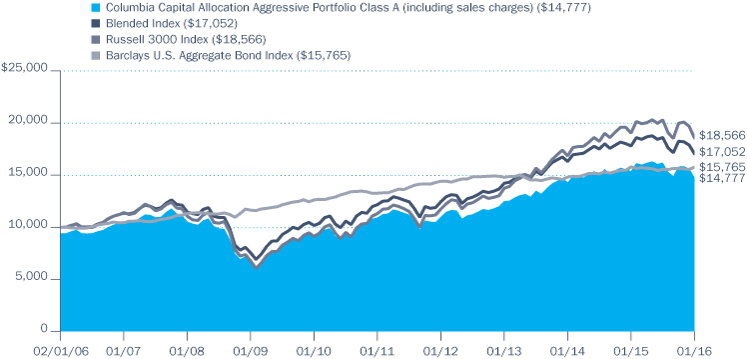
The chart above shows the change in value of a hypothetical $10,000 investment in Class A shares of Columbia Capital Allocation Aggressive Portfolio during the stated time period, and does not reflect the deduction of taxes that a shareholder may pay on Fund distributions or on the redemption of Fund shares.
Annual Report 2016
12
COLUMBIA CAPITAL ALLOCATION PORTFOLIOS
MANAGER DISCUSSION OF FUND PERFORMANCE
All Fund returns listed below are for Class A shares excluding sales charges for the 12-month period that ended January 31, 2016. We attribute the Funds' relative performance to mixed results from asset class allocation and underlying fund performance.
n Columbia Capital Allocation Conservative Portfolio returned -2.81%. The Fund underperformed its Blended Index, which returned -1.00%.
n Columbia Capital Allocation Moderate Conservative Portfolio returned -2.78%. The Fund underperformed its Blended Index, which returned -1.56%.
n Columbia Capital Allocation Moderate Portfolio returned -2.89%. The Fund underperformed its Blended Index, which returned -2.62%.
n Columbia Capital Allocation Moderate Aggressive Portfolio returned -3.42%. The Fund slightly underperformed its Blended Index, which returned -3.38%.
n Columbia Capital Allocation Aggressive Portfolio returned -3.92%. The Fund outperformed its Blended Index, which returned -4.20%.
During the same time frame, the Russell 3000 Index, which measures the domestic equity market, returned -2.48% and the Barclays U.S. Aggregate Bond Index, which measures the domestic fixed-income market, returned -0.16%.
Global Capital Markets Struggled Amid Heightened Caution
Around the world, many investors turned cautious during the period, as lackluster economic growth, contentious geopolitical conflicts and a long-awaited shift in U.S. monetary policy weighed on confidence. Subpar global economic growth persisted for the fourth consecutive year, with China's slowdown heading the list of disappointments. Conflicts in the Middle East and terrorism, both at home and abroad, heightened security fears. Plummeting oil prices and a rising U.S. dollar rounded out the list of mounting pressures. A widening trade deficit negatively impacted U.S. economic growth.
For investors in U.S. large-cap equities, modest gains in the first half of the period were wiped out in the second half of the period. Within the U.S. equity market, large-cap stocks outperformed small-cap stocks. Growth stocks outperformed value stocks for most of the period, however, in the latter months of the period when investors grew increasingly cautious, value outperformed growth. Still, U.S. equities outperformed equities of both developed and emerging markets broadly, as a strong U.S. dollar weighed on returns from overseas investments denominated in U.S. dollars. The U.S. bond market fared better as investors flocked to asset classes perceived as safer, but both the broad U.S. fixed-income market and the broad global fixed-income market still posted negative returns for the period. High-yield corporate bonds were among the weakest performing bond market segments. Emerging market bonds were actually a relative bright spot, posting positive, albeit modest, returns.
Portfolio Management
Jeffrey Knight, CFA
Anwiti Bahuguna, Ph.D.
Marie Schofield, CFA
Beth Vanney, CFA
Toby Nangle
Conservative Portfolio
Portfolio Breakdown (%)
(at January 31, 2016) | |
Alternative Investment Funds | | | 6.3 | | |
Common Stocks | | | 2.6 | | |
Equity Funds | | | 15.0 | | |
Fixed-Income Funds | | | 71.1 | | |
Money Market Funds | | | 5.0 | | |
Total | | | 100.0 | | |
Percentages indicated are based upon total investments. The Fund's portfolio composition is subject to change.
Moderate Conservative Portfolio
Portfolio Breakdown (%)
(at January 31, 2016) | |
Alternative Investment Funds | | | 5.4 | | |
Common Stocks | | | 1.8 | | |
Equity Funds | | | 29.5 | | |
Fixed-Income Funds | | | 59.7 | | |
Money Market Funds | | | 3.6 | | |
Total | | | 100.0 | | |
Percentages indicated are based upon total investments. The Fund's portfolio composition is subject to change.
Moderate Portfolio
Portfolio Breakdown (%)
(at January 31, 2016) | |
Alternative Investment Funds | | | 4.5 | | |
Common Stocks | | | 1.7 | | |
Equity Funds | | | 43.6 | | |
Fixed-Income Funds | | | 45.9 | | |
Money Market Funds | | | 4.3 | | |
Total | | | 100.0 | | |
Percentages indicated are based upon total investments. The Fund's portfolio composition is subject to change.
Annual Report 2016
13
COLUMBIA CAPITAL ALLOCATION PORTFOLIOS
MANAGER DISCUSSION OF FUND PERFORMANCE (continued)
Moderate Aggressive Portfolio
Portfolio Breakdown (%)
(at January 31, 2016) | |
Alternative Investment Funds | | | 4.2 | | |
Common Stocks | | | 1.2 | | |
Equity Funds | | | 56.0 | | |
Fixed-Income Funds | | | 27.7 | | |
Money Market Funds | | | 10.9 | | |
Total | | | 100.0 | | |
Percentages indicated are based upon total investments. The Fund's portfolio composition is subject to change.
Aggressive Portfolio
Portfolio Breakdown (%)
(at January 31, 2016) | |
Alternative Investment Funds | | | 4.1 | | |
Common Stocks | | | 2.4 | | |
Equity Funds | | | 71.3 | | |
Fixed-Income Funds | | | 14.8 | | |
Money Market Funds | | | 7.4 | | |
Total | | | 100.0 | | |
Percentages indicated are based upon total investments. The Fund's portfolio composition is subject to change.
Investment Risks
Market risk may affect a single issuer, sector of the economy, industry or the market as a whole. The Funds' investment in other funds subjects them to the investment performance (positive or negative), risks and expenses of these underlying funds. There are risks associated with fixed-income investments, including credit risk, interest rate risk, and prepayment and extension risk. In general, bond prices rise when interest rates fall and vice versa. This effect is usually more pronounced for longer term securities. Foreign investments subject the Funds to risks, including political, economic, market, social and others within a particular country, as well as to currency instabilities and less stringent financial and accounting standards generally applicable to U.S. issuers. Investing in derivatives is a specialized activity that involves special risks that subject the Funds to significant loss potential, including when used as leverage, and may result in greater fluctuation in Fund value. Asset allocation does not assure a profit or protect against loss. See the Funds' prospectus for more information on these and other risks.
Positioning and Underlying Fund Performance Generated Mixed Results
Overall, asset allocation decisions had a modest effect on relative performance across all five Funds during the period. Having a slight overweight to equities added value, but was virtually offset by an underweight to fixed income in all but the most conservative Fund and by an overweight to fixed income in the most conservative Fund, which detracted. Within equities, a slight underweight to U.S. large-cap and mid-cap equities contributed positively to relative performance. Within fixed income, an overweight to emerging market bonds boosted results. An overweight allocation to absolute return strategies benefited the three most aggressive Funds but detracted in the two most conservative Funds.
Underlying fund performance had a more significant effect on all five Funds' relative results during the period. Strategies focused on international equity markets and high-yield corporate bonds proved especially beneficial to relative returns, despite the negative absolute returns posted. Conversely, performance of underlying funds focused on U.S. large-cap, mid-cap and small-cap equities dampened results as did strategies focused on investment-grade bonds and Treasury inflation-protected securities.
Further, given that almost no asset class or sector that the Funds invested in posted positive absolute returns during the period, having overweight positions in cash in the three most aggressive Funds contributed positively to relative performance, while underweight cash positions in the two most conservative Funds detracted.
Portfolio Changes
Asset class changes within the Funds can be driven by active trading, by directing allocations to select asset classes or by market appreciation or depreciation within a given asset class. During the period, we reduced the Funds' exposure to equities and increased allocations to fixed income. Within fixed income, we remained underweight in U.S. Treasuries, as we still think there are better investment opportunities elsewhere, but we did add moderately to the Funds' weighting, as we believe U.S. Treasuries can serve as stabilizers during periods of heightened risk aversion. We decreased positions in investment-grade bonds in all but the Moderate and Aggressive Portfolios, yet remained overweight in all five Funds, as we believe investment-grade bonds appear attractive from a valuation perspective. We increased already overweight exposures to alternative strategies in the most conservative and the two most aggressive Funds, as there is a strong need, in our view, for diversification going forward. Diversification does not assure a profit or protect against loss.
Derivatives Usage
During the period, the use of derivatives positions on equity indices and currency was implemented via an overlay to the Funds to efficiently allocate capital across the Funds and to allow greater flexibility in establishing exposure to a given market than might otherwise be possible. Futures were used, as we believe they can offer both a liquid
Annual Report 2016
14
COLUMBIA CAPITAL ALLOCATION PORTFOLIOS
MANAGER DISCUSSION OF FUND PERFORMANCE (continued)
and cost efficient means of establishing exposure in a given market and can be used to reduce, or hedge, exposure to risk. Some of the underlying funds also used forward foreign currency exchange contracts and swap contracts during the period to attempt to enhance portfolio return and for hedging purposes as market conditions warranted. Derivative usage had a net positive impact on the performance of the Funds during the period.
Annual Report 2016
15
COLUMBIA CAPITAL ALLOCATION PORTFOLIOS
UNDERSTANDING YOUR FUND'S EXPENSES
(Unaudited)
As an investor, you incur two types of costs. There are transaction costs, which generally include sales charges on purchases and may include redemption fees. There are also ongoing costs, which generally include management fees, distribution and/or service fees, and other fund expenses. The following information is intended to help you understand your ongoing costs (in dollars) of investing in the Fund and to help you compare these costs with the ongoing costs of investing in other mutual funds.
Analyzing Your Fund's Expenses
To illustrate these ongoing costs, we have provided examples and calculated the expenses paid by investors in each share class of the Fund during the period. The actual and hypothetical information in the table is based on an initial investment of $1,000 at the beginning of the period indicated and held for the entire period. Expense information is calculated two ways and each method provides you with different information. The amount listed in the "Actual" column is calculated using the Fund's actual operating expenses and total return for the period. You may use the Actual information, together with the amount invested, to estimate the expenses that you paid over the period. Simply divide your account value by $1,000 (for example, an $8,600 account value divided by $1,000 = 8.6), then multiply the results by the expenses paid during the period under the "Actual" column. The amount listed in the "Hypothetical" column assumes a 5% annual rate of return before expenses (which is not the Fund's actual return) and then applies the Fund's actual expense ratio for the period to the hypothetical return. You should not use the hypothetical account values and expenses to estimate either your actual account balance at the end of the period or the expenses you paid during the period. See "Compare With Other Funds" below for details on how to use the hypothetical data.
In addition to the ongoing expenses which the Fund bears directly, the Fund's shareholders indirectly bear the Fund's allocable share of the costs and expenses of each underlying fund in which the Fund invests. You can also estimate the effective expenses paid during the period, which includes the indirect fees associated with investing in the underlying funds, by using the amounts listed in the "Effective Expenses Paid During the Period" column.
Compare With Other Funds
Since all mutual funds are required to include the same hypothetical calculations about expenses in shareholder reports, you can use this information to compare the ongoing cost of investing in the Fund with other funds. To do so, compare the hypothetical example with the 5% hypothetical examples that appear in the shareholder reports of other funds. As you compare hypothetical examples of other funds, it is important to note that hypothetical examples are meant to highlight the ongoing costs of investing in a fund only and do not reflect any transaction costs, such as sales charges, or redemption or exchange fees. Therefore, the hypothetical calculations are useful in comparing ongoing costs only, and will not help you determine the relative total costs of owning different funds. If transaction costs were included in these calculations, your costs would be higher.
Annual Report 2016
16
COLUMBIA CAPITAL ALLOCATION PORTFOLIOS
UNDERSTANDING YOUR FUND'S EXPENSES (continued)
(Unaudited)
Columbia Capital Allocation Conservative Portfolio
August 1, 2015 – January 31, 2016
| | | Account Value at
the Beginning of
the Period ($) | | Account Value at
the End of
the Period ($) | | Expenses Paid
During the
Period ($) | | Fund's Annualized
Expense Ratio (%) | | Effective Expenses
Paid During the
Period ($) | | Fund's Effective
Annualized
Expense Ratio (%) | |
| | | Actual | | Hypothetical | | Actual | | Hypothetical | | Actual | | Hypothetical | | Actual | | Actual | | Hypothetical | | Actual | |
Class A | | | 1,000.00 | | | | 1,000.00 | | | | 967.20 | | | | 1,022.34 | | | | 2.55 | | | | 2.62 | | | | 0.52 | | | | 5.05 | | | | 5.19 | | | | 1.03 | | |
Class B | | | 1,000.00 | | | | 1,000.00 | | | | 963.40 | | | | 1,018.60 | | | | 6.22 | | | | 6.39 | | | | 1.27 | | | | 8.71 | | | | 8.96 | | | | 1.78 | | |
Class C | | | 1,000.00 | | | | 1,000.00 | | | | 963.30 | | | | 1,018.60 | | | | 6.22 | | | | 6.39 | | | | 1.27 | | | | 8.71 | | | | 8.96 | | | | 1.78 | | |
Class K | | | 1,000.00 | | | | 1,000.00 | | | | 968.30 | | | | 1,022.64 | | | | 2.26 | | | | 2.32 | | | | 0.46 | | | | 4.76 | | | | 4.89 | | | | 0.97 | | |
Class R | | | 1,000.00 | | | | 1,000.00 | | | | 966.00 | | | | 1,021.09 | | | | 3.77 | | | | 3.88 | | | | 0.77 | | | | 6.27 | | | | 6.45 | | | | 1.28 | | |
Class R4 | | | 1,000.00 | | | | 1,000.00 | | | | 968.30 | | | | 1,023.59 | | | | 1.32 | | | | 1.36 | | | | 0.27 | | | | 3.83 | | | | 3.94 | | | | 0.78 | | |
Class R5 | | | 1,000.00 | | | | 1,000.00 | | | | 968.60 | | | | 1,023.88 | | | | 1.03 | | | | 1.06 | | | | 0.21 | | | | 3.53 | | | | 3.63 | | | | 0.72 | | |
Class Y | | | 1,000.00 | | | | 1,000.00 | | | | 969.40 | | | | 1,024.13 | | | | 0.79 | | | | 0.81 | | | | 0.16 | | | | 3.29 | | | | 3.38 | | | | 0.67 | | |
Class Z | | | 1,000.00 | | | | 1,000.00 | | | | 968.50 | | | | 1,023.59 | | | | 1.33 | | | | 1.36 | | | | 0.27 | | | | 3.83 | | | | 3.94 | | | | 0.78 | | |
Expenses paid during the period are equal to the annualized expense ratio for each class as indicated above, multiplied by the average account value over the period and then multiplied by the number of days in the Fund's most recent fiscal half year and divided by 365.
Effective expenses paid during the period and the Fund's effective annualized expense ratio include expenses borne directly to the class plus the Fund's pro rata portion of the ongoing expenses charged by the underlying funds using the expense ratio of each class of the underlying funds as of the underlying fund's most recent shareholder report.
Columbia Capital Allocation Moderate Conservative Portfolio
August 1, 2015 – January 31, 2016
| | | Account Value at
the Beginning of
the Period ($) | | Account Value at
the End of
the Period ($) | | Expenses Paid
During the
Period ($) | | Fund's Annualized
Expense Ratio (%) | | Effective Expenses
Paid During the
Period ($) | | Fund's Effective
Annualized
Expense Ratio (%) | |
| | | Actual | | Hypothetical | | Actual | | Hypothetical | | Actual | | Hypothetical | | Actual | | Actual | | Hypothetical | | Actual | |
Class A | | | 1,000.00 | | | | 1,000.00 | | | | 955.50 | | | | 1,022.54 | | | | 2.34 | | | | 2.42 | | | | 0.48 | | | | 5.12 | | | | 5.29 | | | | 1.05 | | |
Class B | | | 1,000.00 | | | | 1,000.00 | | | | 951.50 | | | | 1,018.80 | | | | 5.98 | | | | 6.19 | | | | 1.23 | | | | 8.76 | | | | 9.06 | | | | 1.80 | | |
Class C | | | 1,000.00 | | | | 1,000.00 | | | | 951.10 | | | | 1,018.85 | | | | 5.93 | | | | 6.14 | | | | 1.22 | | | | 8.71 | | | | 9.01 | | | | 1.79 | | |
Class K | | | 1,000.00 | | | | 1,000.00 | | | | 955.20 | | | | 1,022.94 | | | | 1.95 | | | | 2.02 | | | | 0.40 | | | | 4.73 | | | | 4.89 | | | | 0.97 | | |
Class R | | | 1,000.00 | | | | 1,000.00 | | | | 954.30 | | | | 1,021.34 | | | | 3.51 | | | | 3.63 | | | | 0.72 | | | | 6.29 | | | | 6.50 | | | | 1.29 | | |
Class R4 | | | 1,000.00 | | | | 1,000.00 | | | | 956.40 | | | | 1,023.78 | | | | 1.12 | | | | 1.16 | | | | 0.23 | | | | 3.90 | | | | 4.04 | | | | 0.80 | | |
Class R5 | | | 1,000.00 | | | | 1,000.00 | | | | 956.70 | | | | 1,024.13 | | | | 0.78 | | | | 0.81 | | | | 0.16 | | | | 3.56 | | | | 3.68 | | | | 0.73 | | |
Class Y | | | 1,000.00 | | | | 1,000.00 | | | | 957.30 | | | | 1,024.33 | | | | 0.59 | | | | 0.61 | | | | 0.12 | | | | 3.37 | | | | 3.48 | | | | 0.69 | | |
Class Z | | | 1,000.00 | | | | 1,000.00 | | | | 956.20 | | | | 1,023.78 | | | | 1.12 | | | | 1.16 | | | | 0.23 | | | | 3.90 | | | | 4.04 | | | | 0.80 | | |
Expenses paid during the period are equal to the annualized expense ratio for each class as indicated above, multiplied by the average account value over the period and then multiplied by the number of days in the Fund's most recent fiscal half year and divided by 365.
Effective expenses paid during the period and the Fund's effective annualized expense ratio include expenses borne directly to the class plus the Fund's pro rata portion of the ongoing expenses charged by the underlying funds using the expense ratio of each class of the underlying funds as of the underlying fund's most recent shareholder report.
Annual Report 2016
17
COLUMBIA CAPITAL ALLOCATION PORTFOLIOS
UNDERSTANDING YOUR FUND'S EXPENSES (continued)
(Unaudited)
Columbia Capital Allocation Moderate Portfolio
August 1, 2015 – January 31, 2016
| | | Account Value at
the Beginning of
the Period ($) | | Account Value at
the End of
the Period ($) | | Expenses Paid
During the
Period ($) | | Fund's Annualized
Expense Ratio (%) | | Effective Expenses
Paid During the
Period ($) | | Fund's Effective
Annualized
Expense Ratio (%) | |
| | | Actual | | Hypothetical | | Actual | | Hypothetical | | Actual | | Hypothetical | | Actual | | Actual | | Hypothetical | | Actual | |
Class A | | | 1,000.00 | | | | 1,000.00 | | | | 941.90 | | | | 1,022.69 | | | | 2.18 | | | | 2.27 | | | | 0.45 | | | | 5.23 | | | | 5.45 | | | | 1.08 | | |
Class B | | | 1,000.00 | | | | 1,000.00 | | | | 938.70 | | | | 1,018.95 | | | | 5.80 | | | | 6.04 | | | | 1.20 | | | | 8.85 | | | | 9.21 | | | | 1.83 | | |
Class C | | | 1,000.00 | | | | 1,000.00 | | | | 938.60 | | | | 1,018.95 | | | | 5.80 | | | | 6.04 | | | | 1.20 | | | | 8.84 | | | | 9.21 | | | | 1.83 | | |
Class K | | | 1,000.00 | | | | 1,000.00 | | | | 942.10 | | | | 1,022.94 | | | | 1.94 | | | | 2.02 | | | | 0.40 | | | | 4.99 | | | | 5.19 | | | | 1.03 | | |
Class R | | | 1,000.00 | | | | 1,000.00 | | | | 941.40 | | | | 1,021.44 | | | | 3.39 | | | | 3.53 | | | | 0.70 | | | | 6.44 | | | | 6.70 | | | | 1.33 | | |
Class R4 | | | 1,000.00 | | | | 1,000.00 | | | | 943.40 | | | | 1,023.93 | | | | 0.97 | | | | 1.01 | | | | 0.20 | | | | 4.02 | | | | 4.19 | | | | 0.83 | | |
Class R5 | | | 1,000.00 | | | | 1,000.00 | | | | 942.80 | | | | 1,024.18 | | | | 0.73 | | | | 0.76 | | | | 0.15 | | | | 3.78 | | | | 3.94 | | | | 0.78 | | |
Class Y | | | 1,000.00 | | | | 1,000.00 | | | | 943.50 | | | | 1,024.48 | | | | 0.44 | | | | 0.45 | | | | 0.09 | | | | 3.49 | | | | 3.63 | | | | 0.72 | | |
Class Z | | | 1,000.00 | | | | 1,000.00 | | | | 943.00 | | | | 1,023.93 | | | | 0.97 | | | | 1.01 | | | | 0.20 | | | | 4.02 | | | | 4.19 | | | | 0.83 | | |
Expenses paid during the period are equal to the annualized expense ratio for each class as indicated above, multiplied by the average account value over the period and then multiplied by the number of days in the Fund's most recent fiscal half year and divided by 365.
Effective expenses paid during the period and the Fund's effective annualized expense ratio include expenses borne directly to the class plus the Fund's pro rata portion of the ongoing expenses charged by the underlying funds using the expense ratio of each class of the underlying funds as of the underlying fund's most recent shareholder report.
Columbia Capital Allocation Moderate Aggressive Portfolio
August 1, 2015 – January 31, 2016
| | | Account Value at
the Beginning of
the Period ($) | | Account Value at
the End of
the Period ($) | | Expenses Paid
During the
Period ($) | | Fund's Annualized
Expense Ratio (%) | | Effective Expenses
Paid During the
Period ($) | | Fund's Effective
Annualized
Expense Ratio (%) | |
| | | Actual | | Hypothetical | | Actual | | Hypothetical | | Actual | | Hypothetical | | Actual | | Actual | | Hypothetical | | Actual | |
Class A | | | 1,000.00 | | | | 1,000.00 | | | | 925.80 | | | | 1,022.34 | | | | 2.50 | | | | 2.62 | | | | 0.52 | | | | 5.62 | | | | 5.90 | | | | 1.17 | | |
Class B | | | 1,000.00 | | | | 1,000.00 | | | | 922.50 | | | | 1,018.65 | | | | 6.04 | | | | 6.34 | | | | 1.26 | | | | 9.15 | | | | 9.61 | | | | 1.91 | | |
Class C | | | 1,000.00 | | | | 1,000.00 | | | | 922.90 | | | | 1,018.65 | | | | 6.04 | | | | 6.34 | | | | 1.26 | | | | 9.16 | | | | 9.61 | | | | 1.91 | | |
Class K | | | 1,000.00 | | | | 1,000.00 | | | | 926.20 | | | | 1,022.84 | | | | 2.02 | | | | 2.12 | | | | 0.42 | | | | 5.14 | | | | 5.40 | | | | 1.07 | | |
Class R | | | 1,000.00 | | | | 1,000.00 | | | | 924.50 | | | | 1,021.14 | | | | 3.65 | | | | 3.83 | | | | 0.76 | | | | 6.77 | | | | 7.11 | | | | 1.41 | | |
Class R4 | | | 1,000.00 | | | | 1,000.00 | | | | 926.70 | | | | 1,023.59 | | | | 1.30 | | | | 1.36 | | | | 0.27 | | | | 4.42 | | | | 4.64 | | | | 0.92 | | |
Class R5 | | | 1,000.00 | | | | 1,000.00 | | | | 927.20 | | | | 1,024.08 | | | | 0.82 | | | | 0.86 | | | | 0.17 | | | | 3.94 | | | | 4.14 | | | | 0.82 | | |
Class T | | | 1,000.00 | | | | 1,000.00 | | | | 925.80 | | | | 1,022.34 | | | | 2.50 | | | | 2.62 | | | | 0.52 | | | | 5.62 | | | | 5.90 | | | | 1.17 | | |
Class Y | | | 1,000.00 | | | | 1,000.00 | | | | 927.50 | | | | 1,024.33 | | | | 0.58 | | | | 0.61 | | | | 0.12 | | | | 3.70 | | | | 3.89 | | | | 0.77 | | |
Class Z | | | 1,000.00 | | | | 1,000.00 | | | | 926.90 | | | | 1,023.59 | | | | 1.30 | | | | 1.36 | | | | 0.27 | | | | 4.42 | | | | 4.64 | | | | 0.92 | | |
Expenses paid during the period are equal to the annualized expense ratio for each class as indicated above, multiplied by the average account value over the period and then multiplied by the number of days in the Fund's most recent fiscal half year and divided by 365.
Effective expenses paid during the period and the Fund's effective annualized expense ratio include expenses borne directly to the class plus the Fund's pro rata portion of the ongoing expenses charged by the underlying funds using the expense ratio of each class of the underlying funds as of the underlying fund's most recent shareholder report.
Annual Report 2016
18
COLUMBIA CAPITAL ALLOCATION PORTFOLIOS
UNDERSTANDING YOUR FUND'S EXPENSES (continued)
(Unaudited)
Columbia Capital Allocation Aggressive Portfolio
August 1, 2015 – January 31, 2016
| | | Account Value at
the Beginning of
the Period ($) | | Account Value at
the End of
the Period ($) | | Expenses Paid
During the
Period ($) | | Fund's Annualized
Expense Ratio (%) | | Effective Expenses
Paid During the
Period ($) | | Fund's Effective
Annualized
Expense Ratio (%) | |
| | | Actual | | Hypothetical | | Actual | | Hypothetical | | Actual | | Hypothetical | | Actual | | Actual | | Hypothetical | | Actual | |
Class A | | | 1,000.00 | | | | 1,000.00 | | | | 912.50 | | | | 1,022.39 | | | | 2.43 | | | | 2.57 | | | | 0.51 | | | | 5.77 | | | | 6.10 | | | | 1.21 | | |
Class B | | | 1,000.00 | | | | 1,000.00 | | | | 909.50 | | | | 1,018.70 | | | | 5.95 | | | | 6.29 | | | | 1.25 | | | | 9.28 | | | | 9.81 | | | | 1.95 | | |
Class C | | | 1,000.00 | | | | 1,000.00 | | | | 909.50 | | | | 1,018.65 | | | | 6.00 | | | | 6.34 | | | | 1.26 | | | | 9.33 | | | | 9.86 | | | | 1.96 | | |
Class K | | | 1,000.00 | | | | 1,000.00 | | | | 913.30 | | | | 1,022.79 | | | | 2.05 | | | | 2.17 | | | | 0.43 | | | | 5.39 | | | | 5.70 | | | | 1.13 | | |
Class R | | | 1,000.00 | | | | 1,000.00 | | | | 912.00 | | | | 1,021.14 | | | | 3.62 | | | | 3.83 | | | | 0.76 | | | | 6.96 | | | | 7.36 | | | | 1.46 | | |
Class R4 | | | 1,000.00 | | | | 1,000.00 | | | | 914.10 | | | | 1,023.64 | | | | 1.24 | | | | 1.31 | | | | 0.26 | | | | 4.58 | | | | 4.84 | | | | 0.96 | | |
Class R5 | | | 1,000.00 | | | | 1,000.00 | | | | 914.00 | | | | 1,023.98 | | | | 0.91 | | | | 0.96 | | | | 0.19 | | | | 4.25 | | | | 4.49 | | | | 0.89 | | |
Class Y | | | 1,000.00 | | | | 1,000.00 | | | | 914.20 | | | | 1,024.18 | | | | 0.72 | | | | 0.76 | | | | 0.15 | | | | 4.06 | | | | 4.29 | | | | 0.85 | | |
Class Z | | | 1,000.00 | | | | 1,000.00 | | | | 913.60 | | | | 1,023.64 | | | | 1.24 | | | | 1.31 | | | | 0.26 | | | | 4.58 | | | | 4.84 | | | | 0.96 | | |
Expenses paid during the period are equal to the annualized expense ratio for each class as indicated above, multiplied by the average account value over the period and then multiplied by the number of days in the Fund's most recent fiscal half year and divided by 365.
Effective expenses paid during the period and the Fund's effective annualized expense ratio include expenses borne directly to the class plus the Fund's pro rata portion of the ongoing expenses charged by the underlying funds using the expense ratio of each class of the underlying funds as of the underlying fund's most recent shareholder report.
Annual Report 2016
19
COLUMBIA CAPITAL ALLOCATION PORTFOLIOS
PORTFOLIO OF INVESTMENTS
Columbia Capital Allocation Conservative Portfolio
January 31, 2016
(Percentages represent value of investments compared to net assets)
Equity Funds 15.0%
| | | Shares | | Value ($) | |
INTERNATIONAL 2.8% | |
Columbia European Equity Fund,
Class I Shares(a) | | | 294,010 | | | | 1,793,461 | | |
Columbia Overseas Value Fund,
Class I Shares(a) | | | 739,593 | | | | 5,702,264 | | |
Total | | | | | 7,495,725 | | |
U.S. LARGE CAP 11.7% | |
Columbia Contrarian Core Fund,
Class I Shares(a) | | | 221,163 | | | | 4,427,685 | | |
Columbia Disciplined Core Fund,
Class I Shares(a) | | | 831,078 | | | | 7,504,630 | | |
Columbia Disciplined Growth Fund,
Class I Shares(a) | | | 1,042,013 | | | | 8,106,860 | | |
Columbia Disciplined Value Fund,
Class I Shares(a) | | | 1,001,517 | | | | 8,202,426 | | |
Columbia Select Large Cap Equity Fund,
Class I Shares(a) | | | 274,589 | | | | 2,965,566 | | |
Total | | | | | 31,207,167 | | |
U.S. SMALL CAP 0.5% | |
Columbia Small Cap Core Fund,
Class I Shares(a) | | | 131,196 | | | | 1,445,780 | | |
Total Equity Funds
(Cost: $41,914,232) | | | | | 40,148,672 | | |
Fixed-Income Funds 71.0%
EMERGING MARKETS 1.4% | |
Columbia Emerging Markets Bond Fund,
Class I Shares(a) | | | 379,657 | | | | 3,830,732 | | |
HIGH YIELD 3.4% | |
Columbia Income Opportunities Fund,
Class I Shares(a) | | | 988,644 | | | | 9,065,865 | | |
INFLATION PROTECTED SECURITIES 4.1% | |
Columbia Inflation Protected
Securities Fund, Class I Shares(a)(b) | | | 1,288,534 | | | | 10,939,655 | | |
INVESTMENT GRADE 62.1% | |
Columbia Corporate Income Fund,
Class I Shares(a) | | | 6,041,292 | | | | 56,304,841 | | |
Columbia Limited Duration Credit Fund,
Class I Shares(a) | | | 2,716,155 | | | | 25,124,431 | | |
Columbia Mortgage Opportunities Fund,
Class I Shares(a) | | | 416,313 | | | | 3,946,652 | | |
Fixed-Income Funds (continued)
| | | Shares | | Value ($) | |
Columbia U.S. Government
Mortgage Fund, Class I Shares(a) | | | 8,540,787 | | | | 46,547,287 | | |
Columbia U.S. Treasury Index Fund,
Class I Shares(a) | | | 3,036,748 | | | | 34,254,523 | | |
Total | | | | | 166,177,734 | | |
Total Fixed-Income Funds
(Cost: $202,204,844) | | | | | 190,013,986 | | |
Alternative Investment Funds 6.2%
Columbia Absolute Return Currency
and Income Fund, Class I Shares(a) | | | 41,552 | | | | 448,347 | | |
Columbia Adaptive Alternatives Fund,
Class I Shares(a) | | | 455,212 | | | | 4,269,887 | | |
Columbia Diversified Absolute
Return Fund, Class I Shares(a) | | | 650,038 | | | | 6,220,865 | | |
Columbia Multi-Asset Income Fund,
Class I Shares(a) | | | 645,283 | | | | 5,775,280 | | |
Total Alternative Investment Funds
(Cost: $17,891,888) | | | | | 16,714,379 | | |
Common Stocks 2.6%
Issuer | | Shares | | Value ($) | |
CONSUMER DISCRETIONARY 0.4% | |
Auto Components 0.1% | |
Cie Generale des Etablissements
Michelin | | | 788 | | | | 71,892 | | |
Continental AG | | | 314 | | | | 65,892 | | |
Cooper Tire & Rubber Co. | | | 530 | | | | 19,324 | | |
Dana Holding Corp. | | | 720 | | | | 8,561 | | |
Total | | | | | 165,669 | | |
Automobiles 0.1% | |
Fuji Heavy Industries Ltd. | | | 2,300 | | | | 94,123 | | |
Peugeot SA(b) | | | 5,500 | | | | 81,783 | | |
Total | | | | | 175,906 | | |
Diversified Consumer Services —% | |
Capella Education Co. | | | 110 | | | | 4,830 | | |
Hotels, Restaurants & Leisure 0.1% | |
Cracker Barrel Old Country Store, Inc. | | | 150 | | | | 19,684 | | |
Denny's Corp.(b) | | | 1,470 | | | | 13,774 | | |
Flight Centre Travel Group Ltd. | | | 2,872 | | | | 80,262 | | |
Isle of Capri Casinos, Inc.(b) | | | 380 | | | | 4,811 | | |
The accompanying Notes to Financial Statements are an integral part of this statement.
Annual Report 2016
20
COLUMBIA CAPITAL ALLOCATION PORTFOLIOS
PORTFOLIO OF INVESTMENTS (continued)
Columbia Capital Allocation Conservative Portfolio
January 31, 2016
Common Stocks (continued)
Issuer | | Shares | | Value ($) | |
Jack in the Box, Inc. | | | 260 | | | | 20,186 | | |
Marriott Vacations Worldwide Corp. | | | 270 | | | | 13,335 | | |
Papa John's International, Inc. | | | 10 | | | | 478 | | |
Ruth's Hospitality Group, Inc. | | | 395 | | | | 6,419 | | |
Sands China Ltd. | | | 20,400 | | | | 71,252 | | |
Total | | | | | 230,201 | | |
Household Durables 0.1% | |
Helen of Troy Ltd.(b) | | | 185 | | | | 16,533 | | |
Iida Group Holdings Co., Ltd. | | | 4,300 | | | | 76,656 | | |
Persimmon PLC | | | 2,940 | | | | 85,787 | | |
Zagg, Inc.(b) | | | 250 | | | | 2,305 | | |
Total | | | | | 181,281 | | |
Internet & Catalog Retail —% | |
PetMed Express, Inc. | | | 535 | | | | 9,641 | | |
Leisure Products —% | |
Sturm Ruger & Co., Inc. | | | 308 | | | | 18,126 | | |
Media —% | |
Gray Television, Inc.(b) | | | 430 | | | | 5,655 | | |
Nexstar Broadcasting Group, Inc.,
Class A | | | 330 | | | | 14,919 | | |
WPP PLC | | | 775 | | | | 16,854 | | |
Total | | | | | 37,428 | | |
Multiline Retail —% | |
Marks & Spencer Group PLC | | | 4,684 | | | | 28,441 | | |
Specialty Retail —% | |
American Eagle Outfitters, Inc. | | | 505 | | | | 7,393 | | |
Cato Corp. (The), Class A | | | 406 | | | | 16,374 | | |
Children's Place, Inc. (The) | | | 269 | | | | 17,512 | | |
Guess?, Inc. | | | 345 | | | | 6,396 | | |
Outerwall, Inc. | | | 455 | | | | 15,379 | | |
Total | | | | | 63,054 | | |
Textiles, Apparel & Luxury Goods —% | |
Movado Group, Inc. | | | 590 | | | | 15,163 | | |
Oxford Industries, Inc. | | | 287 | | | | 20,050 | | |
Wolverine World Wide, Inc. | | | 1,000 | | | | 16,910 | | |
Total | | | | | 52,123 | | |
Total Consumer Discretionary | | | | | 966,700 | | |
Common Stocks (continued)
Issuer | | Shares | | Value ($) | |
CONSUMER STAPLES 0.3% | |
Food & Staples Retailing 0.1% | |
Ingles Markets, Inc., Class A | | | 72 | | | | 2,762 | | |
Jeronimo Martins SGPS SA | | | 4,562 | | | | 63,623 | | |
Koninklijke Ahold NV | | | 4,300 | | | | 97,265 | | |
SUPERVALU, Inc.(b) | | | 1,010 | | | | 4,595 | | |
Wesfarmers Ltd. | | | 295 | | | | 8,901 | | |
Total | | | | | 177,146 | | |
Food Products 0.1% | |
Cal-Maine Foods, Inc. | | | 370 | | | | 18,674 | | |
Dean Foods Co. | | | 995 | | | | 19,880 | | |
Nestlé SA, Registered Shares | | | 1,304 | | | | 96,069 | | |
Sanderson Farms, Inc. | | | 241 | | | | 19,574 | | |
WH Group Ltd.(b) | | | 149,000 | | | | 85,320 | | |
Total | | | | | 239,517 | | |
Household Products 0.1% | |
Reckitt Benckiser Group PLC | | | 1,112 | | | | 98,903 | | |
Svenska Cellulosa AB, Class B | | | 2,931 | | | | 86,868 | | |
Total | | | | | 185,771 | | |
Personal Products —% | |
Usana Health Sciences, Inc.(b) | | | 112 | | | | 14,213 | | |
Tobacco —% | |
Japan Tobacco, Inc. | | | 2,600 | | | | 101,826 | | |
Swedish Match AB | | | 149 | | | | 5,300 | | |
Universal Corp. | | | 110 | | | | 6,020 | | |
Total | | | | | 113,146 | | |
Total Consumer Staples | | | | | 729,793 | | |
ENERGY 0.1% | |
Energy Equipment & Services —% | |
Oil States International, Inc.(b) | | | 365 | | | | 10,304 | | |
Oil, Gas & Consumable Fuels 0.1% | |
Alon USA Energy, Inc. | | | 550 | | | | 6,919 | | |
Caltex Australia Ltd. | | | 808 | | | | 21,608 | | |
OMV AG | | | 2,295 | | | | 59,074 | | |
PDC Energy, Inc.(b) | | | 376 | | | | 21,383 | | |
REX American Resources Corp.(b) | | | 334 | | | | 17,846 | | |
Royal Dutch Shell PLC, Class B | | | 6,322 | | | | 137,743 | | |
Western Refining, Inc. | | | 214 | | | | 7,040 | | |
Total | | | | | 271,613 | | |
Total Energy | | | | | 281,917 | | |
The accompanying Notes to Financial Statements are an integral part of this statement.
Annual Report 2016
21
COLUMBIA CAPITAL ALLOCATION PORTFOLIOS
PORTFOLIO OF INVESTMENTS (continued)
Columbia Capital Allocation Conservative Portfolio
January 31, 2016
Common Stocks (continued)
Issuer | | Shares | | Value ($) | |
FINANCIALS 0.6% | |
Banks 0.3% | |
Australia and New Zealand Banking
Group Ltd. | | | 793 | | | | 13,766 | | |
Banc of California, Inc. | | | 920 | | | | 13,892 | | |
Banco Latinoamericano de Comercio
Exterior SA, Class E | | | 525 | | | | 12,243 | | |
BBCN Bancorp, Inc. | | | 585 | | | | 8,892 | | |
Central Pacific Financial Corp. | | | 830 | | | | 17,388 | | |
Credit Agricole SA | | | 6,900 | | | | 68,856 | | |
Customers Bancorp, Inc.(b) | | | 570 | | | | 14,307 | | |
First BanCorp(b) | | | 1,895 | | | | 4,927 | | |
First NBC Bank Holding Co.(b) | | | 495 | | | | 15,538 | | |
Hilltop Holdings, Inc.(b) | | | 155 | | | | 2,475 | | |
HSBC Holdings PLC | | | 18,100 | | | | 127,651 | | |
International Bancshares Corp. | | | 570 | | | | 13,218 | | |
Mitsubishi UFJ Financial Group, Inc. | | | 12,400 | | | | 63,586 | | |
Nordea Bank AB | | | 8,000 | | | | 80,558 | | |
Opus Bank | | | 70 | | | | 2,309 | | |
Societe Generale SA | | | 300 | | | | 11,444 | | |
Sumitomo Mitsui Financial Group, Inc. | | | 2,550 | | | | 85,549 | | |
Westpac Banking Corp. | | | 3,864 | | | | 85,573 | | |
Total | | | | | 642,172 | | |
Capital Markets —% | |
| 3i Group PLC | | | 11,196 | | | | 70,985 | | |
Arlington Asset Investment Corp.,
Class A | | | 1,155 | | | | 12,821 | | |
Cowen Group, Inc., Class A(b) | | | 2,050 | | | | 5,863 | | |
KCG Holdings, Inc., Class A(b) | | | 605 | | | | 6,183 | | |
Total | | | | | 95,852 | | |
Consumer Finance —% | |
Cash America International, Inc. | | | 585 | | | | 17,515 | | |
Nelnet, Inc., Class A | | | 445 | | | | 14,449 | | |
Total | | | | | 31,964 | | |
Diversified Financial Services —% | |
EXOR SpA | | | 1,960 | | | | 63,894 | | |
Insurance 0.2% | |
Ageas | | | 1,865 | | | | 75,739 | | |
Allianz SE, Registered Shares | | | 670 | | | | 108,431 | | |
American Equity Investment Life
Holding Co. | | | 464 | | | | 8,440 | | |
Common Stocks (continued)
Issuer | | Shares | | Value ($) | |
AXA SA | | | 779 | | | | 19,251 | | |
CNP Assurances | | | 2,167 | | | | 28,978 | | |
Employers Holdings, Inc. | | | 220 | | | | 5,480 | | |
Hannover Rueckversicherung AG | | | 84 | | | | 8,841 | | |
HCI Group, Inc. | | | 142 | | | | 4,722 | | |
Heritage Insurance Holdings, Inc. | | | 880 | | | | 17,442 | | |
Maiden Holdings Ltd. | | | 1,205 | | | | 15,424 | | |
Muenchener Rueckversicherungs-
Gesellschaft AG in Muenchen,
Registered Shares | | | 460 | | | | 88,629 | | |
Swiss Re AG | | | 1,000 | | | | 93,086 | | |
Universal Insurance Holdings, Inc. | | | 843 | | | | 15,798 | | |
Total | | | | | 490,261 | | |
Real Estate Investment Trusts (REITs) 0.1% | |
AG Mortgage Investment Trust, Inc. | | | 255 | | | | 2,991 | | |
American Assets Trust, Inc. | | | 175 | | | | 6,543 | | |
Apollo Residential Mortgage, Inc. | | | 455 | | | | 4,937 | | |
Coresite Realty Corp. | | | 302 | | | | 19,370 | | |
Cousins Properties, Inc. | | | 380 | | | | 3,276 | | |
CubeSmart | | | 770 | | | | 24,093 | | |
CyrusOne, Inc. | | | 230 | | | | 8,476 | | |
CYS Investments, Inc. | | | 2,510 | | | | 17,294 | | |
DuPont Fabros Technology, Inc. | | | 597 | | | | 19,802 | | |
Hersha Hospitality Trust | | | 240 | | | | 4,217 | | |
Mack-Cali Realty Corp. | | | 715 | | | | 14,865 | | |
Ryman Hospitality Properties, Inc. | | | 401 | | | | 18,827 | | |
Sovran Self Storage, Inc. | | | 200 | | | | 22,536 | | |
STORE Capital Corp. | | | 715 | | | | 17,725 | | |
Summit Hotel Properties, Inc. | | | 1,420 | | | | 14,413 | | |
Sunstone Hotel Investors, Inc. | | | 1,577 | | | | 18,741 | | |
Total | | | | | 218,106 | | |
Real Estate Management & Development —% | |
New World Development Co., Ltd. | | | 26,000 | | | | 21,284 | | |
Wheelock & Co., Ltd. | | | 18,000 | | | | 68,913 | | |
Total | | | | | 90,197 | | |
Thrifts & Mortgage Finance —% | |
BofI Holding, Inc.(b) | | | 500 | | | | 8,580 | | |
Flagstar Bancorp, Inc.(b) | | | 534 | | | | 9,959 | | |
HomeStreet, Inc.(b) | | | 475 | | | | 9,728 | | |
MGIC Investment Corp.(b) | | | 2,619 | | | | 17,338 | | |
The accompanying Notes to Financial Statements are an integral part of this statement.
Annual Report 2016
22
COLUMBIA CAPITAL ALLOCATION PORTFOLIOS
PORTFOLIO OF INVESTMENTS (continued)
Columbia Capital Allocation Conservative Portfolio
January 31, 2016
Common Stocks (continued)
Issuer | | Shares | | Value ($) | |
Radian Group, Inc. | | | 1,470 | | | | 14,788 | | |
Walker & Dunlop, Inc.(b) | | | 660 | | | | 15,813 | | |
Washington Federal, Inc. | | | 805 | | | | 17,187 | | |
Total | | | | | 93,393 | | |
Total Financials | | | | | 1,725,839 | | |
HEALTH CARE 0.3% | |
Biotechnology —% | |
ACADIA Pharmaceuticals, Inc.(b) | | | 195 | | | | 4,035 | | |
Acorda Therapeutics, Inc.(b) | | | 220 | | | | 8,100 | | |
Alder Biopharmaceuticals, Inc.(b) | | | 215 | | | | 5,199 | | |
AMAG Pharmaceuticals, Inc.(b) | | | 250 | | | | 5,727 | | |
Anacor Pharmaceuticals, Inc.(b) | | | 140 | | | | 10,518 | | |
ARIAD Pharmaceuticals, Inc.(b) | | | 680 | | | | 3,414 | | |
Arrowhead Research Corp.(b) | | | 1,100 | | | | 3,828 | | |
Curis, Inc.(b) | | | 1,386 | | | | 2,273 | | |
Dynavax Technologies Corp.(b) | | | 425 | | | | 10,238 | | |
Infinity Pharmaceuticals, Inc.(b) | | | 875 | | | | 5,434 | | |
Insmed, Inc.(b) | | | 230 | | | | 3,036 | | |
Insys Therapeutics, Inc.(b) | | | 270 | | | | 4,684 | | |
Keryx Biopharmaceuticals, Inc.(b) | | | 1,575 | | | | 5,560 | | |
Neurocrine Biosciences, Inc.(b) | | | 180 | | | | 7,659 | | |
Novavax, Inc.(b) | | | 1,655 | | | | 8,523 | | |
Portola Pharmaceuticals, Inc.(b) | | | 60 | | | | 1,982 | | |
Spark Therapeutics, Inc.(b) | | | 265 | | | | 7,465 | | |
TESARO, Inc.(b) | | | 55 | | | | 1,900 | | |
Ultragenyx Pharmaceutical, Inc.(b) | | | 120 | | | | 6,738 | | |
vTv Therapeutics, Inc., Class A(b) | | | 434 | | | | 3,147 | | |
Total | | | | | 109,460 | | |
Health Care Equipment & Supplies —% | |
Analogic Corp. | | | 209 | | | | 15,480 | | |
LivaNova PLC(b) | | | 344 | | | | 19,257 | | |
Merit Medical Systems, Inc.(b) | | | 1,060 | | | | 17,543 | | |
Orthofix International NV(b) | | | 425 | | | | 16,775 | | |
Total | | | | | 69,055 | | |
Health Care Providers & Services 0.1% | |
Alfresa Holdings Corp. | | | 3,800 | | | | 70,798 | | |
Chemed Corp. | | | 15 | | | | 2,105 | | |
LHC Group, Inc.(b) | | | 115 | | | | 4,361 | | |
Magellan Health, Inc.(b) | | | 302 | | | | 17,214 | | |
Common Stocks (continued)
Issuer | | Shares | | Value ($) | |
Medipal Holdings Corp. | | | 4,900 | | | | 79,476 | | |
Molina Healthcare, Inc.(b) | | | 338 | | | | 18,560 | | |
Owens & Minor, Inc. | | | 65 | | | | 2,252 | | |
PharMerica Corp.(b) | | | 225 | | | | 6,680 | | |
Triple-S Management Corp., Class B(b) | | | 617 | | | | 13,753 | | |
WellCare Health Plans, Inc.(b) | | | 95 | | | | 7,218 | | |
Total | | | | | 222,417 | | |
Life Sciences Tools & Services —% | |
Affymetrix, Inc.(b) | | | 230 | | | | 3,227 | | |
Cambrex Corp.(b) | | | 400 | | | | 13,856 | | |
INC Research Holdings, Inc. Class A(b) | | | 367 | | | | 15,462 | | |
PAREXEL International Corp.(b) | | | 122 | | | | 7,803 | | |
Total | | | | | 40,348 | | |
Pharmaceuticals 0.2% | |
GlaxoSmithKline PLC | | | 5,900 | | | | 121,543 | | |
Novo Nordisk A/S, Class B | | | 182 | | | | 10,168 | | |
Pernix Therapeutics Holdings, Inc.(b) | | | 1,000 | | | | 2,180 | | |
Roche Holding AG, Genusschein Shares | | | 365 | | | | 94,544 | | |
Sanofi | | | 1,379 | | | | 114,678 | | |
Sucampo Pharmaceuticals, Inc.,
Class A(b) | | | 1,000 | | | | 12,650 | | |
Teva Pharmaceutical Industries Ltd. | | | 1,292 | | | | 79,390 | | |
Total | | | | | 435,153 | | |
Total Health Care | | | | | 876,433 | | |
INDUSTRIALS 0.4% | |
Aerospace & Defense —% | |
Cubic Corp. | | | 143 | | | | 5,714 | | |
Moog, Inc., Class A(b) | | | 330 | | | | 15,289 | | |
Total | | | | | 21,003 | | |
Air Freight & Logistics —% | |
Air Transport Services Group, Inc.(b) | | | 1,135 | | | | 11,043 | | |
Royal Mail PLC | | | 12,077 | | | | 79,399 | | |
Total | | | | | 90,442 | | |
Airlines 0.1% | |
Hawaiian Holdings, Inc.(b) | | | 277 | | | | 9,753 | | |
Japan Airlines Co., Ltd. | | | 2,200 | | | | 82,574 | | |
Total | | | | | 92,327 | | |
Building Products —% | |
Continental Building Product(b) | | | 930 | | | | 13,894 | | |
The accompanying Notes to Financial Statements are an integral part of this statement.
Annual Report 2016
23
COLUMBIA CAPITAL ALLOCATION PORTFOLIOS
PORTFOLIO OF INVESTMENTS (continued)
Columbia Capital Allocation Conservative Portfolio
January 31, 2016
Common Stocks (continued)
Issuer | | Shares | | Value ($) | |
Commercial Services & Supplies —% | |
Deluxe Corp. | | | 375 | | | | 20,962 | | |
Interface, Inc. | | | 230 | | | | 3,885 | | |
Quad/Graphics, Inc. | | | 1,200 | | | | 12,096 | | |
West Corp. | | | 235 | | | | 4,256 | | |
Total | | | | | 41,199 | | |
Construction & Engineering 0.1% | |
EMCOR Group, Inc. | | | 439 | | | | 20,062 | | |
Leighton Holdings Ltd. | | | 4,571 | | | | 78,837 | | |
VINCI SA | | | 1,411 | | | | 95,592 | | |
Total | | | | | 194,491 | | |
Electrical Equipment 0.1% | |
EnerSys | | | 318 | | | | 15,401 | | |
General Cable Corp. | | | 1,215 | | | | 14,240 | | |
OSRAM Licht AG | | | 762 | | | | 34,021 | | |
Prysmian SpA | | | 3,734 | | | | 76,827 | | |
Vestas Wind Systems A/S | | | 1,497 | | | | 97,955 | | |
Total | | | | | 238,444 | | |
Machinery —% | |
Barnes Group, Inc. | | | 100 | | | | 3,251 | | |
Global Brass & Copper Holdings, Inc. | | | 395 | | | | 8,180 | | |
Kadant, Inc. | | | 300 | | | | 11,643 | | |
KONE OYJ, Class B | | | 244 | | | | 10,725 | | |
Metso OYJ | | | 260 | | | | 5,365 | | |
Mueller Industries, Inc. | | | 590 | | | | 15,015 | | |
Wabash National Corp.(b) | | | 1,645 | | | | 18,194 | | |
Total | | | | | 72,373 | | |
Marine 0.1% | |
Kuehne & Nagel International AG | | | 600 | | | | 79,410 | | |
Matson, Inc. | | | 475 | | | | 19,195 | | |
Total | | | | | 98,605 | | |
Professional Services —% | |
Insperity, Inc. | | | 21 | | | | 944 | | |
RPX Corp.(b) | | | 1,380 | | | | 15,980 | | |
Total | | | | | 16,924 | | |
Road & Rail —% | |
ArcBest Corp. | | | 462 | | | | 9,485 | | |
Common Stocks (continued)
Issuer | | Shares | | Value ($) | |
Trading Companies & Distributors —% | |
Applied Industrial Technologies, Inc. | | | 219 | | | | 8,418 | | |
ITOCHU Corp. | | | 2,200 | | | | 25,857 | | |
MRC Global, Inc.(b) | | | 765 | | | | 7,688 | | |
Total | | | | | 41,963 | | |
Total Industrials | | | | | 931,150 | | |
INFORMATION TECHNOLOGY 0.2% | |
Communications Equipment —% | |
NETGEAR, Inc.(b) | | | 460 | | | | 17,190 | | |
Plantronics, Inc. | | | 55 | | | | 2,466 | | |
Polycom, Inc.(b) | | | 1,065 | | | | 10,852 | | |
Total | | | | | 30,508 | | |
Electronic Equipment, Instruments & Components —% | |
Benchmark Electronics, Inc.(b) | | | 700 | | | | 14,700 | | |
Checkpoint Systems, Inc. | | | 728 | | | | 4,717 | | |
Coherent, Inc.(b) | | | 44 | | | | 3,400 | | |
Insight Enterprises, Inc.(b) | | | 265 | | | | 6,262 | | |
MTS Systems Corp. | | | 50 | | | | 2,670 | | |
SYNNEX Corp. | | | 225 | | | | 18,889 | | |
Tech Data Corp.(b) | | | 300 | | | | 18,720 | | |
Total | | | | | 69,358 | | |
Internet Software & Services —% | |
DHI Group, Inc.(b) | | | 1,240 | | | | 11,544 | | |
EarthLink Holdings Corp. | | | 2,300 | | | | 13,616 | | |
j2 Global, Inc. | | | 160 | | | | 11,602 | | |
LogMeIn, Inc.(b) | | | 330 | | | | 17,239 | | |
Mixi, Inc. | | | 400 | | | | 12,816 | | |
RetailMeNot, Inc.(b) | | | 1,858 | | | | 16,908 | | |
Web.com Group, Inc.(b) | | | 855 | | | | 16,100 | | |
Total | | | | | 99,825 | | |
IT Services —% | |
Convergys Corp. | | | 67 | | | | 1,638 | | |
CSG Systems International, Inc. | | | 245 | | | | 8,560 | | |
EVERTEC, Inc. | | | 990 | | | | 13,603 | | |
NeuStar, Inc., Class A(b) | | | 785 | | | | 19,295 | | |
Sykes Enterprises, Inc.(b) | | | 526 | | | | 15,486 | | |
Syntel, Inc.(b) | | | 54 | | | | 2,556 | | |
Total | | | | | 61,138 | | |
The accompanying Notes to Financial Statements are an integral part of this statement.
Annual Report 2016
24
COLUMBIA CAPITAL ALLOCATION PORTFOLIOS
PORTFOLIO OF INVESTMENTS (continued)
Columbia Capital Allocation Conservative Portfolio
January 31, 2016
Common Stocks (continued)
Issuer | | Shares | | Value ($) | |
Semiconductors & Semiconductor Equipment 0.1% | |
Amkor Technology, Inc.(b) | | | 2,840 | | | | 17,438 | | |
Cabot Microelectronics Corp.(b) | | | 178 | | | | 7,234 | | |
Cirrus Logic, Inc.(b) | | | 90 | | | | 3,125 | | |
Diodes, Inc.(b) | | | 745 | | | | 14,252 | | |
Entegris, Inc.(b) | | | 200 | | | | 2,332 | | |
Silicon Laboratories, Inc.(b) | | | 95 | | | | 4,332 | | |
STMicroelectronics NV | | | 9,686 | | | | 63,279 | | |
Veeco Instruments, Inc.(b) | | | 160 | | | | 2,982 | | |
Xcerra Corp.(b) | | | 1,500 | | | | 8,220 | | |
Total | | | | | 123,194 | | |
Software —% | |
Aspen Technology, Inc.(b) | | | 570 | | | | 18,491 | | |
AVG Technologies NV(b) | | | 800 | | | | 15,096 | | |
Check Point Software Technologies Ltd.(b) | | | 100 | | | | 7,881 | | |
Gigamon, Inc.(b) | | | 400 | | | | 10,460 | | |
Progress Software Corp.(b) | | | 242 | | | | 6,265 | | |
RealPage, Inc.(b) | | | 445 | | | | 8,584 | | |
VASCO Data Security International, Inc.(b) | | | 430 | | | | 6,665 | | |
Total | | | | | 73,442 | | |
Technology Hardware, Storage & Peripherals 0.1% | |
Canon, Inc. | | | 2,400 | | | | 67,062 | | |
FUJIFILM Holdings Corp. | | | 2,250 | | | | 86,935 | | |
Total | | | | | 153,997 | | |
Total Information Technology | | | | | 611,462 | | |
MATERIALS 0.1% | |
Chemicals 0.1% | |
BASF SE | | | 458 | | | | 30,527 | | |
Chemtura Corp.(b) | | | 715 | | | | 18,762 | | |
Innophos Holdings, Inc. | | | 173 | | | | 4,621 | | |
Innospec, Inc. | | | 365 | | | | 18,195 | | |
Mitsubishi Chemical Holdings Corp. | | | 14,900 | | | | 83,101 | | |
Total | | | | | 155,206 | | |
Construction Materials —% | |
Fletcher Building Ltd. | | | 2,397 | | | | 10,746 | | |
US Concrete, Inc.(b) | | | 175 | | | | 7,959 | | |
Total | | | | | 18,705 | | |
Common Stocks (continued)
Issuer | | Shares | | Value ($) | |
Metals & Mining —% | |
Commercial Metals Co. | | | 567 | | | | 7,893 | | |
Materion Corp. | | | 490 | | | | 12,000 | | |
Rio Tinto PLC | | | 2,800 | | | | 68,661 | | |
Total | | | | | 88,554 | | |
Paper & Forest Products —% | |
UPM-Kymmene OYJ | | | 4,961 | | | | 80,848 | | |
Total Materials | | | | | 343,313 | | |
TELECOMMUNICATION SERVICES 0.1% | |
Diversified Telecommunication Services 0.1% | |
General Communication, Inc., Class A(b) | | | 770 | | | | 13,952 | | |
Nippon Telegraph & Telephone Corp. | | | 2,500 | | | | 106,432 | | |
Telenor ASA | | | 3,175 | | | | 51,791 | | |
Telstra Corp., Ltd. | | | 20,812 | | | | 83,859 | | |
Total | | | | | 256,034 | | |
Wireless Telecommunication Services —% | |
NTT DoCoMo, Inc. | | | 500 | | | | 11,089 | | |
Shenandoah Telecommunications Co. | | | 450 | | | | 10,341 | | |
Total | | | | | 21,430 | | |
Total Telecommunication Services | | | | | 277,464 | | |
UTILITIES 0.1% | |
Electric Utilities 0.1% | |
Chubu Electric Power Co., Inc. | | | 5,200 | | | | 66,786 | | |
Endesa SA | | | 3,282 | | | | 63,537 | | |
IDACORP, Inc. | | | 246 | | | | 17,119 | | |
Tokyo Electric Power Co., Inc.(b) | | | 12,600 | | | | 63,314 | | |
Total | | | | | 210,756 | | |
Gas Utilities —% | |
Chesapeake Utilities Corp. | | | 247 | | | | 15,554 | | |
New Jersey Resources Corp. | | | 467 | | | | 16,448 | | |
Southwest Gas Corp. | | | 338 | | | | 19,884 | | |
WGL Holdings, Inc. | | | 65 | | | | 4,341 | | |
Total | | | | | 56,227 | | |
Water Utilities —% | |
SJW Corp. | | | 340 | | | | 11,084 | | |
Total Utilities | | | | | 278,067 | | |
Total Common Stocks
(Cost: $7,374,840) | | | | | 7,022,138 | | |
The accompanying Notes to Financial Statements are an integral part of this statement.
Annual Report 2016
25
COLUMBIA CAPITAL ALLOCATION PORTFOLIOS
PORTFOLIO OF INVESTMENTS (continued)
Columbia Capital Allocation Conservative Portfolio
January 31, 2016
Money Market Funds 5.0%
| | | Shares | | Value ($) | |
Columbia Short-Term Cash Fund,
0.360%(a)(c) | | | 13,376,044 | | | | 13,376,044 | | |
Total Money Market Funds
(Cost: $13,376,044) | | | | | 13,376,044 | | |
Total Investments
(Cost: $282,761,848) | | | | | 267,275,219 | | |
Other Assets & Liabilities, Net | | | | | 495,057 | | |
Net Assets | | | | | 267,770,276 | | |
At January 31, 2016, cash totaling $486,979 was pledged as collateral.
Investments in Derivatives
Forward Foreign Currency Exchange Contracts Open at January 31, 2016
Counterparty | | Exchange Date | | Currency to
be Delivered | |
| | Currency to
be Received | |
| | Unrealized
Appreciation ($) | | Unrealized
Depreciation ($) | |
Barclays | | 3/3/2016 | | | 51,000 | | | AUD | | | | | 35,617 | | | USD | | | | | — | | | | (428 | ) | |
Barclays | | 3/3/2016 | | | 107,000 | | | DKK | | | | | 15,599 | | | USD | | | | | 55 | | | | — | | |
Barclays | | 3/3/2016 | | | 222,000 | | | ILS | | | | | 56,596 | | | USD | | | | | 506 | | | | — | | |
Barclays | | 3/3/2016 | | | 2,746,000 | | | JPY | | | | | 23,319 | | | USD | | | | | 625 | | | | — | | |
Barclays | | 3/3/2016 | | | 184,000 | | | NOK | | | | | 20,616 | | | USD | | | | | — | | | | (572 | ) | |
Barclays | | 3/3/2016 | | | 220,000 | | | SEK | | | | | 25,801 | | | USD | | | | | 150 | | | | — | | |
Barclays | | 3/3/2016 | | | 109,192 | | | USD | | | | | 109,000 | | | CHF | | | | | — | | | | (2,665 | ) | |
Barclays | | 3/3/2016 | | | 14,152 | | | USD | | | | | 13,000 | | | EUR | | | | | — | | | | (59 | ) | |
Barclays | | 3/3/2016 | | | 138,553 | | | USD | | | | | 95,000 | | | GBP | | | | | — | | | | (3,182 | ) | |
Barclays | | 3/3/2016 | | | 61,970 | | | USD | | | | | 89,000 | | | SGD | | | | | 469 | | | | — | | |
Total | | | | | | | | | | | | | 1,805 | | | | (6,906 | ) | |
Futures Contracts Outstanding at January 31, 2016
Long Futures Contracts Outstanding
Contract Description | | Number of
Contracts | | Trading
Currency | | Notional
Market
Value ($) | | Expiration
Date | | Unrealized
Appreciation ($) | | Unrealized
Depreciation ($) | |
S&P500 EMINI FUT | | | 4 | | | USD | | | | | 386,020 | | | 03/2016 | | | — | | | | (13,640 | ) | |
TOPIX INDX FUTR | | | 7 | | | JPY | | | | | 832,032 | | | 03/2016 | | | — | | | | (89,297 | ) | |
US 10YR NOTE (CBT) | | | 34 | | | USD | | | | | 4,405,656 | | | 03/2016 | | | 117,611 | | | | — | | |
US LONG BOND(CBT) | | | 13 | | | USD | | | | | 2,093,406 | | | 03/2016 | | | 102,758 | | | | — | | |
US ULTRA BOND CBT | | | 29 | | | USD | | | | | 4,819,438 | | | 03/2016 | | | 37,377 | | | | — | | |
US ULTRA BOND CBT | | | 16 | | | USD | | | | | 2,659,000 | | | 03/2016 | | | 143,346 | | | | — | | |
Total | | | | | | | 15,195,552 | | | | | | 401,092 | | | | (102,937 | ) | |
The accompanying Notes to Financial Statements are an integral part of this statement.
Annual Report 2016
26
COLUMBIA CAPITAL ALLOCATION PORTFOLIOS
PORTFOLIO OF INVESTMENTS (continued)
Columbia Capital Allocation Conservative Portfolio
January 31, 2016
Credit Default Swap Contracts Outstanding at January 31, 2016
Buy Protection
Counterparty | | Reference
Entity | | Expiration
Date | | Pay
Fixed
Rate (%) | | Notional
Amount ($) | | Market
Value ($) | | Periodic
Payments
Receivable
(Payable) ($) | | Unrealized
Appreciation ($) | | Unrealized
Depreciation ($) | |
Morgan Stanley*
| | Markit CDX North
America Investment
Grade Index,
Series 25 Version 1 | | 12/20/2020 | | | 1.000 | | | | 8,500,000 | | | | (12,155 | ) | | | (9,444 | ) | | | — | | | | (21,599 | ) | |
*Centrally cleared swap contract
Notes to Portfolio of Investments
(a) As defined in the Investment Company Act of 1940, an affiliated company is one in which the Fund owns 5% or more of the company's outstanding voting securities, or a company which is under common ownership or control with the Fund. Holdings and transactions in these affiliated companies during the year ended January 31, 2016 are as follows:
Issuer | | Beginning
Cost ($) | | Purchase
Cost ($) | | Proceeds
From
Sales ($) | | Realized
Gain
(Loss) ($) | | Ending
Cost ($) | | Capital Gain
Distributions ($) | | Dividends —
Affiliated
Issuers ($) | | Value ($) | |
Columbia Absolute
Return Currency and
Income Fund, Class I
Shares | | | 535,207 | | | | 102,092 | | | | (247,114 | ) | | | 36,082 | | | | 426,267 | | | | 36,632 | | | | 19,748 | | | | 448,347 | | |
Columbia Absolute
Return Emerging
Markets Macro Fund,
Class I Shares | | | 4,760,648 | | | | 18,030 | | | | (4,531,642 | ) | | | (247,036 | ) | | | — | | | | — | | | | — | | | | — | | |
Columbia Absolute
Return Enhanced
Multi-Strategy Fund,
Class I Shares | | | 6,619,879 | | | | 423,811 | | | | (6,901,821 | ) | | | (141,869 | ) | | | — | | | | 411,397 | | | | — | | | | — | | |
Columbia Adaptive
Alternatives Fund,
Class I Shares | | | — | | | | 4,536,456 | | | | — | | | | — | | | | 4,536,456 | | | | — | | | | 36,456 | | | | 4,269,887 | | |
Columbia Contrarian
Core Fund, Class I
Shares | | | 5,249,892 | | | | 450,844 | | | | (2,633,237 | ) | | | 1,056,781 | | | | 4,124,280 | | | | 132,212 | | | | 134,083 | | | | 4,427,685 | | |
Columbia Corporate
Income Fund, Class I
Shares | | | 70,088,420 | | | | 2,795,012 | | | | (11,438,493 | ) | | | (49,015 | ) | | | 61,395,924 | | | | — | | | | 2,263,295 | | | | 56,304,841 | | |
Columbia Disciplined
Core Fund, Class I
Shares | | | 6,457,572 | | | | 374,367 | | | | (1,298,465 | ) | | | 498,156 | | | | 6,031,630 | | | | — | | | | 132,478 | | | | 7,504,630 | | |
Columbia Disciplined
Growth Fund, Class I
Shares | | | 9,322,468 | | | | 1,378,004 | | | | (1,983,586 | ) | | | 222,167 | | | | 8,939,053 | | | | 966,735 | | | | 91,900 | | | | 8,106,860 | | |
Columbia Disciplined
Value Fund, Class I
Shares | | | 9,135,237 | | | | 988,752 | | | | (1,264,143 | ) | | | 98,506 | | | | 8,958,352 | | | | 418,833 | | | | 161,906 | | | | 8,202,426 | | |
Columbia Diversified
Absolute Return Fund,
Class I Shares | | | — | | | | 7,666,871 | | | | (1,161,741 | ) | | | (10,704 | ) | | | 6,494,426 | | | | 39,504 | | | | 24,470 | | | | 6,220,865 | | |
Columbia Emerging
Markets Bond Fund,
Class I Shares | | | 4,838,435 | | | | 366,060 | | | | (775,669 | ) | | | (28,480 | ) | | | 4,400,346 | | | | — | | | | 137,369 | | | | 3,830,732 | | |
The accompanying Notes to Financial Statements are an integral part of this statement.
Annual Report 2016
27
COLUMBIA CAPITAL ALLOCATION PORTFOLIOS
PORTFOLIO OF INVESTMENTS (continued)
Columbia Capital Allocation Conservative Portfolio
January 31, 2016
Notes to Portfolio of Investments (continued)
Issuer | | Beginning
Cost ($) | | Purchase
Cost ($) | | Proceeds
From
Sales ($) | | Realized
Gain
(Loss) ($) | | Ending
Cost ($) | | Capital Gain
Distributions ($) | | Dividends —
Affiliated
Issuers ($) | | Value ($) | |
Columbia European
Equity Fund, Class I
Shares | | | 3,989,100 | | | | 249,830 | | | | (2,708,207 | ) | | | 459,874 | | | | 1,990,597 | | | | 56,676 | | | | 29,035 | | | | 1,793,461 | | |
Columbia Global
Inflation-Linked Bond
Plus Fund, Class I
Shares | | | 1,278,928 | | | | 74,655 | | | | (1,292,378 | ) | | | (61,205 | ) | | | — | | | | — | | | | 44,163 | | | | — | | |
Columbia Income
Opportunities Fund,
Class I Shares | | | 9,761,076 | | | | 1,524,045 | | | | (1,407,272 | ) | | | (45,431 | ) | | | 9,832,418 | | | | 68,310 | | | | 486,738 | | | | 9,065,865 | | |
Columbia Inflation
Protected Securities
Fund, Class I Shares | | | 14,021,505 | | | | 259,393 | | | | (870,683 | ) | | | (76,601 | ) | | | 13,333,614 | | | | — | | | | — | | | | 10,939,655 | | |
Columbia International
Bond Fund, Class I
Shares | | | 796,815 | | | | 6,042 | | | | (772,058 | ) | | | (30,799 | ) | | | — | | | | — | | | | — | | | | — | | |
Columbia Limited
Duration Credit Fund,
Class I Shares | | | 29,379,839 | | | | 891,744 | | | | (3,150,660 | ) | | | 5,890 | | | | 27,126,813 | | | | — | | | | 701,571 | | | | 25,124,431 | | |
Columbia Mortgage
Opportunities Fund,
Class I Shares | | | — | | | | 4,794,163 | | | | (620,217 | ) | | | (2,763 | ) | | | 4,171,183 | | | | 43,002 | | | | 153,693 | | | | 3,946,652 | | |
Columbia Multi-Asset
Income Fund, Class I
Shares | | | — | | | | 6,434,738 | | | | — | | | | — | | | | 6,434,738 | | | | — | | | | 287,738 | | | | 5,775,280 | | |
Columbia Overseas
Value Fund, Class I
Shares | | | 9,085,139 | | | | 543,617 | | | | (3,178,215 | ) | | | (15,170 | ) | | | 6,435,371 | | | | — | | | | 148,966 | | | | 5,702,264 | | |
Columbia Pacific/Asia
Fund, Class I Shares | | | 1,305,130 | | | | 50,147 | | | | (1,446,718 | ) | | | 91,441 | | | | — | | | | 3,675 | | | | 4,587 | | | | — | | |
Columbia Select
Large Cap Equity
Fund, Class I Shares | | | — | | | | 3,384,000 | | | | — | | | | — | | | | 3,384,000 | | | | 166,727 | | | | 44,274 | | | | 2,965,566 | | |
Columbia Short-Term
Cash Fund | | | 37,727,043 | | | | 30,572,603 | | | | (54,923,602 | ) | | | — | | | | 13,376,044 | | | | — | | | | 36,445 | | | | 13,376,044 | | |
Columbia Small Cap
Core Fund, Class I
Shares | | | 1,788,254 | | | | 628,809 | | | | (383,614 | ) | | | 17,500 | | | | 2,050,949 | | | | 506,955 | | | | 2,807 | | | | 1,445,780 | | |
Columbia U.S.
Government Mortgage
Fund, Class I Shares | | | 53,311,801 | | | | 1,890,584 | | | | (7,834,319 | ) | | | (27,303 | ) | | | 47,340,763 | | | | 142,685 | | | | 1,507,056 | | | | 46,547,287 | | |
Columbia U.S.
Treasury Index Fund,
Class I Shares | | | 21,808,729 | | | | 16,942,691 | | | | (3,926,149 | ) | | | (221,487 | ) | | | 34,603,784 | | | | 106,125 | | | | 321,815 | | | | 34,254,523 | | |
Total | | | 301,261,117 | | | | 87,347,360 | | | | (114,750,003 | ) | | | 1,528,534 | | | | 275,387,008 | | | | 3,099,468 | | | | 6,770,593 | | | | 260,253,081 | | |
(b) Non-income producing investment.
(c) The rate shown is the seven-day current annualized yield at January 31, 2016.
The accompanying Notes to Financial Statements are an integral part of this statement.
Annual Report 2016
28
COLUMBIA CAPITAL ALLOCATION PORTFOLIOS
PORTFOLIO OF INVESTMENTS (continued)
Columbia Capital Allocation Conservative Portfolio
January 31, 2016
AUD Australian Dollar
CHF Swiss Franc
DKK Danish Krone
EUR Euro
GBP British Pound
ILS Israeli Shekel
JPY Japanese Yen
NOK Norwegian Krone
SEK Swedish Krona
SGD Singapore Dollar
USD US Dollar
Fair Value Measurements
The Fund categorizes its fair value measurements according to a three-level hierarchy that maximizes the use of observable inputs and minimizes the use of unobservable inputs by prioritizing that the most observable input be used when available. Observable inputs are those that market participants would use in pricing an investment based on market data obtained from sources independent of the reporting entity. Unobservable inputs are those that reflect the Fund's assumptions about the information market participants would use in pricing an investment. An investment's level within the fair value hierarchy is based on the lowest level of any input that is deemed significant to the asset's or liability's fair value measurement. The input levels are not necessarily an indication of the risk or liquidity associated with investments at that level. For example, certain U.S. government securities are generally high quality and liquid, however, they are reflected as Level 2 because the inputs used to determine fair value may not always be quoted prices in an active market.
Fair value inputs are summarized in the three broad levels listed below:
> Level 1 — Valuations based on quoted prices for investments in active markets that the Fund has the ability to access at the measurement date (including NAV for open-end mutual funds). Valuation adjustments are not applied to Level 1 investments.
> Level 2 — Valuations based on other significant observable inputs (including quoted prices for similar securities, interest rates, prepayment speeds, credit risks, etc.).
> Level 3 — Valuations based on significant unobservable inputs (including the Fund's own assumptions and judgment in determining the fair value of investments).
Inputs that are used in determining fair value of an investment may include price information, credit data, volatility statistics, and other factors. These inputs can be either observable or unobservable. The availability of observable inputs can vary between investments, and is affected by various factors such as the type of investment, and the volume and level of activity for that investment or similar investments in the marketplace. The inputs will be considered by the Investment Manager, along with any other relevant factors in the calculation of an investment's fair value. The Fund uses prices and inputs that are current as of the measurement date, which may include periods of market dislocations. During these periods, the availability of prices and inputs may be reduced for many investments. This condition could cause an investment to be reclassified between the various levels within the hierarchy.
Foreign equity securities actively traded in markets where there is a significant delay in the local close relative to the New York Stock Exchange (NYSE) are classified as Level 2. The values of these securities may include an adjustment to reflect the impact of significant market movements following the close of local trading, as described in Note 2 of the Notes to Financial Statements in the most recent shareholder report.
Investments falling into the Level 3 category are primarily supported by quoted prices from brokers and dealers participating in the market for those investments. However, these may be classified as Level 3 investments due to lack of market transparency and corroboration to support these quoted prices. Additionally, valuation models may be used as the pricing source for any remaining investments classified as Level 3. These models may rely on one or more significant unobservable inputs and/or significant assumptions by the Investment Manager. Inputs used in valuations may include, but are not limited to, financial statement analysis, capital account balances, discount rates and estimated cash flows, and comparable company data.
Under the direction of the Fund's Board of Trustees (the Board), the Investment Manager's Valuation Committee (the Committee) is responsible for overseeing the valuation procedures approved by the Board. The Committee consists of voting and non-voting members from various groups within the Investment Manager's organization, including operations and accounting, trading and investments, compliance, risk management and legal.
The Committee meets at least monthly to review and approve valuation matters, which may include a description of specific valuation determinations, data regarding pricing information received from approved pricing vendors and brokers and the results of Board-approved valuation control policies and procedures (the Policies). The Policies address, among other things, instances when market quotations are or are not readily available, including recommendations of third party pricing vendors and a determination of appropriate pricing methodologies;
The accompanying Notes to Financial Statements are an integral part of this statement.
Annual Report 2016
29
COLUMBIA CAPITAL ALLOCATION PORTFOLIOS
PORTFOLIO OF INVESTMENTS (continued)
Columbia Capital Allocation Conservative Portfolio
January 31, 2016
Fair Value Measurements (continued)
events that require specific valuation determinations and assessment of fair value techniques; securities with a potential for stale pricing, including those that are illiquid, restricted, or in default; and the effectiveness of third party pricing vendors, including periodic reviews of vendors. The Committee meets more frequently, as needed, to discuss additional valuation matters, which may include the need to review back-testing results, review time-sensitive information or approve related valuation actions. The Committee reports to the Board, with members of the Committee meeting with the Board at each of its regularly scheduled meetings to discuss valuation matters and actions during the period, similar to those described earlier.
For investments categorized as Level 3, the Committee monitors information similar to that described above, which may include: (i) data specific to the issuer or comparable issuers, (ii) general market or specific sector news and (iii) quoted prices and specific or similar security transactions. The Committee considers this data and any changes from prior periods in order to assess the reasonableness of observable and unobservable inputs, any assumptions or internal models used to value those securities and changes in fair value. This data is also used to corroborate, when available, information received from approved pricing vendors and brokers. Various factors impact the frequency of monitoring this information (which may occur as often as daily). However, the Committee may determine that changes to inputs, assumptions and models are not required as a result of the monitoring procedures performed.
The following table is a summary of the inputs used to value the Fund's investments at January 31, 2016:
| | | Level 1
Quoted Prices in Active
Markets for Identical
Assets ($) | | Level 2
Other Significant
Observable Inputs ($) | | Level 3
Significant
Unobservable Inputs ($) | | Total ($) | |
Investments | |
Equity Funds | | | 40,148,672 | | | | — | | | | — | | | | 40,148,672 | | |
Fixed-Income Funds | | | 190,013,986 | | | | — | | | | — | | | | 190,013,986 | | |
Alternative Investment Funds | | | 16,714,379 | | | | — | | | | — | | | | 16,714,379 | | |
Common Stocks | |
Consumer Discretionary | | | 293,758 | | | | 672,942 | | | | — | | | | 966,700 | | |
Consumer Staples | | | 85,718 | | | | 644,075 | | | | — | | | | 729,793 | | |
Energy | | | 63,492 | | | | 218,425 | | | | — | | | | 281,917 | | |
Financials | | | 540,825 | | | | 1,185,014 | | | | — | | | | 1,725,839 | | |
Health Care | | | 305,836 | | | | 570,597 | | | | — | | | | 876,433 | | |
Industrials | | | 264,588 | | | | 666,562 | | | | — | | | | 931,150 | | |
Information Technology | | | 381,370 | | | | 230,092 | | | | — | | | | 611,462 | | |
Materials | | | 69,430 | | | | 273,883 | | | | — | | | | 343,313 | | |
Telecommunication Services | | | 24,293 | | | | 253,171 | | | | — | | | | 277,464 | | |
Utilities | | | 84,430 | | | | 193,637 | | | | — | | | | 278,067 | | |
Total Common Stocks | | | 2,113,740 | | | | 4,908,398 | | | | — | | | | 7,022,138 | | |
Money Market Funds | | | — | | | | 13,376,044 | | | | — | | | | 13,376,044 | | |
Total Investments | | | 248,990,777 | | | | 18,284,442 | | | | — | | | | 267,275,219 | | |
Derivatives | |
Assets | |
Forward Foreign Currency
Exchange Contracts | | | — | | | | 1,805 | | | | — | | | | 1,805 | | |
Futures Contracts | | | 401,092 | | | | — | | | | — | | | | 401,092 | | |
Liabilities | |
Forward Foreign Currency
Exchange Contracts | | | — | | | | (6,906 | ) | | | — | | | | (6,906 | ) | |
Futures Contracts | | | (102,937 | ) | | | — | | | | — | | | | (102,937 | ) | |
Swap Contracts | | | — | | | | (21,599 | ) | | | — | | | | (21,599 | ) | |
Total | | | 249,288,932 | | | | 18,257,742 | | | | — | | | | 267,546,674 | | |
The accompanying Notes to Financial Statements are an integral part of this statement.
Annual Report 2016
30
COLUMBIA CAPITAL ALLOCATION PORTFOLIOS
PORTFOLIO OF INVESTMENTS (continued)
Columbia Capital Allocation Conservative Portfolio
January 31, 2016
Fair Value Measurements (continued)
See the Portfolio of Investments for all investment classifications not indicated in the table.
The Fund's assets assigned to the Level 2 input category are generally valued using the market approach, in which a security's value is determined through reference to prices and information from market transactions for similar or identical assets and/or fund per share market values which are not considered publicly available. These assets include certain foreign securities for which a third party statistical pricing service may be employed for purposes of fair market valuation. The model utilized by such third party statistical pricing service takes into account a security's correlation to available market data including, but not limited to, intraday index, ADR, and exchange-traded fund movements.
Derivative instruments are valued at unrealized appreciation (depreciation).
Financial assets were transferred from Level 1 to Level 2 as the market for these assets is not considered publicly available. Fund per share market values were obtained using observable market inputs.
The following table shows transfers between Level 1 and Level 2 of the fair value hierarchy:
Transfers In | | Transfers Out | |
| Level 1 ($) | | Level 2 ($) | | Level 1 ($) | | Level 2 ($) | |
| | — | | | | 37,727,043 | | | | 37,727,043 | | | | — | | |
Transfers between Level 1 and Level 2 are determined based on the fair value at the beginning of the period for security positions held throughout the period.
There were no transfers of financial assets between Levels 2 and 3 during the period.
The accompanying Notes to Financial Statements are an integral part of this statement.
Annual Report 2016
31
COLUMBIA CAPITAL ALLOCATION PORTFOLIOS
PORTFOLIO OF INVESTMENTS
Columbia Capital Allocation Moderate Conservative Portfolio
January 31, 2016
(Percentages represent value of investments compared to net assets)
Equity Funds 29.4%
| | | Shares | | Value ($) | |
INTERNATIONAL 7.3% | |
Columbia European Equity Fund,
Class I Shares(a) | | | 3,008,706 | | | | 18,353,108 | | |
Columbia Overseas Value Fund,
Class I Shares(a) | | | 3,215,719 | | | | 24,793,193 | | |
Columbia Pacific/Asia Fund,
Class I Shares(a) | | | 202,080 | | | | 1,774,262 | | |
Total | | | | | 44,920,563 | | |
U.S. LARGE CAP 20.6% | |
Columbia Contrarian Core Fund,
Class I Shares(a) | | | 1,056,395 | | | | 21,149,017 | | |
Columbia Disciplined Core Fund,
Class I Shares(a) | | | 2,655,844 | | | | 23,982,270 | | |
Columbia Disciplined Growth Fund,
Class I Shares(a) | | | 2,609,637 | | | | 20,302,978 | | |
Columbia Disciplined Value Fund,
Class I Shares(a) | | | 4,318,404 | | | | 35,367,730 | | |
Columbia Large Cap Growth Fund,
Class I Shares(a)(b) | | | 449,310 | | | | 14,121,803 | | |
Columbia Select Large Cap Equity Fund,
Class I Shares(a) | | | 1,195,681 | | | | 12,913,359 | | |
Total | | | | | 127,837,157 | | |
U.S. SMALL CAP 1.5% | |
Columbia Small Cap Core Fund,
Class I Shares(a) | | | 853,768 | | | | 9,408,527 | | |
Total Equity Funds
(Cost: $189,841,145) | | | | | 182,166,247 | | |
Fixed-Income Funds 59.6%
EMERGING MARKETS 2.2% | |
Columbia Emerging Markets Bond Fund,
Class I Shares(a) | | | 1,341,809 | | | | 13,538,857 | | |
HIGH YIELD 4.8% | |
Columbia Income Opportunities Fund,
Class I Shares(a) | | | 3,229,875 | | | | 29,617,953 | | |
INFLATION PROTECTED SECURITIES 2.1% | |
Columbia Inflation Protected
Securities Fund, Class I Shares(a)(b) | | | 1,531,056 | | | | 12,998,662 | | |
INVESTMENT GRADE 50.5% | |
Columbia Corporate Income Fund,
Class I Shares(a) | | | 11,565,291 | | | | 107,788,516 | | |
Fixed-Income Funds (continued)
| | | Shares | | Value ($) | |
Columbia Limited Duration Credit Fund,
Class I Shares(a) | | | 4,571,818 | | | | 42,289,317 | | |
Columbia Mortgage Opportunities Fund,
Class I Shares(a) | | | 1,004,089 | | | | 9,518,761 | | |
Columbia U.S. Government
Mortgage Fund, Class I Shares(a) | | | 17,173,866 | | | | 93,597,570 | | |
Columbia U.S. Treasury Index Fund,
Class I Shares(a) | | | 5,324,773 | | | | 60,063,438 | | |
Total | | | | | 313,257,602 | | |
Total Fixed-Income Funds
(Cost: $388,737,729) | | | | | 369,413,074 | | |
Alternative Investment Funds 5.4%
Columbia Absolute Return Currency
and Income Fund, Class I Shares(a) | | | 226,606 | | | | 2,445,081 | | |
Columbia Adaptive Alternatives Fund,
Class I Shares(a) | | | 455,212 | | | | 4,269,887 | | |
Columbia Diversified Absolute
Return Fund, Class I Shares(a) | | | 1,446,713 | | | | 13,845,040 | | |
Columbia Multi-Asset Income Fund,
Class I Shares(a) | | | 1,451,492 | | | | 12,990,856 | | |
Total Alternative Investment Funds
(Cost: $35,783,356) | | | | | 33,550,864 | | |
Common Stocks 1.8%
Issuer | | Shares | | Value ($) | |
CONSUMER DISCRETIONARY 0.2% | |
Auto Components —% | |
Cie Generale des Etablissements
Michelin | | | 1,206 | | | | 110,027 | | |
Continental AG | | | 480 | | | | 100,727 | | |
Cooper Tire & Rubber Co. | | | 885 | | | | 32,267 | | |
Dana Holding Corp. | | | 1,200 | | | | 14,268 | | |
Total | | | | | 257,289 | | |
Automobiles —% | |
Fuji Heavy Industries Ltd. | | | 3,500 | | | | 143,230 | | |
Peugeot SA(b) | | | 8,346 | | | | 124,103 | | |
Total | | | | | 267,333 | | |
Diversified Consumer Services —% | |
Capella Education Co. | | | 175 | | | | 7,684 | | |
Hotels, Restaurants & Leisure 0.1% | |
Cracker Barrel Old Country Store, Inc. | | | 250 | | | | 32,807 | | |
The accompanying Notes to Financial Statements are an integral part of this statement.
Annual Report 2016
32
COLUMBIA CAPITAL ALLOCATION PORTFOLIOS
PORTFOLIO OF INVESTMENTS (continued)
Columbia Capital Allocation Moderate Conservative Portfolio
January 31, 2016
Common Stocks (continued)
Issuer | | Shares | | Value ($) | |
Denny's Corp.(b) | | | 2,420 | | | | 22,675 | | |
Flight Centre Travel Group Ltd. | | | 4,451 | | | | 124,389 | | |
Isle of Capri Casinos, Inc.(b) | | | 625 | | | | 7,913 | | |
Jack in the Box, Inc. | | | 435 | | | | 33,773 | | |
Marriott Vacations Worldwide Corp. | | | 445 | | | | 21,979 | | |
Papa John's International, Inc. | | | 25 | | | | 1,194 | | |
Ruth's Hospitality Group, Inc. | | | 650 | | | | 10,562 | | |
Sands China Ltd. | | | 31,200 | | | | 108,974 | | |
Total | | | | | 364,266 | | |
Household Durables 0.1% | |
Helen of Troy Ltd.(b) | | | 310 | | | | 27,705 | | |
Iida Group Holdings Co., Ltd. | | | 6,500 | | | | 115,875 | | |
Persimmon PLC | | | 4,451 | | | | 129,877 | | |
Zagg, Inc.(b) | | | 400 | | | | 3,688 | | |
Total | | | | | 277,145 | | |
Internet & Catalog Retail —% | |
PetMed Express, Inc. | | | 870 | | | | 15,678 | | |
Leisure Products —% | |
Sturm Ruger & Co., Inc. | | | 512 | | | | 30,131 | | |
Media —% | |
Gray Television, Inc.(b) | | | 720 | | | | 9,468 | | |
Nexstar Broadcasting Group, Inc.,
Class A | | | 545 | | | | 24,640 | | |
WPP PLC | | | 1,187 | | | | 25,814 | | |
Total | | | | | 59,922 | | |
Multiline Retail —% | |
Marks & Spencer Group PLC | | | 7,165 | | | | 43,505 | | |
Specialty Retail —% | |
American Eagle Outfitters, Inc. | | | 840 | | | | 12,297 | | |
Cato Corp. (The), Class A | | | 675 | | | | 27,223 | | |
Children's Place, Inc. (The) | | | 452 | | | | 29,425 | | |
Guess?, Inc. | | | 570 | | | | 10,568 | | |
Outerwall, Inc. | | | 755 | | | | 25,519 | | |
Total | | | | | 105,032 | | |
Textiles, Apparel & Luxury Goods —% | |
Movado Group, Inc. | | | 975 | | | | 25,057 | | |
Oxford Industries, Inc. | | | 480 | | | | 33,533 | | |
Wolverine World Wide, Inc. | | | 1,625 | | | | 27,479 | | |
Total | | | | | 86,069 | | |
Total Consumer Discretionary | | | | | 1,514,054 | | |
Common Stocks (continued)
Issuer | | Shares | | Value ($) | |
CONSUMER STAPLES 0.2% | |
Food & Staples Retailing —% | |
Ingles Markets, Inc., Class A | | | 120 | | | | 4,603 | | |
Jeronimo Martins SGPS SA | | | 6,986 | | | | 97,429 | | |
Koninklijke Ahold NV | | | 6,538 | | | | 147,887 | | |
SUPERVALU, Inc.(b) | | | 1,750 | | | | 7,963 | | |
Wesfarmers Ltd. | | | 451 | | | | 13,608 | | |
Total | | | | | 271,490 | | |
Food Products 0.1% | |
Cal-Maine Foods, Inc. | | | 615 | | | | 31,039 | | |
Dean Foods Co. | | | 1,650 | | | | 32,967 | | |
Nestlé SA, Registered Shares | | | 1,982 | | | | 146,019 | | |
Sanderson Farms, Inc. | | | 401 | | | | 32,569 | | |
WH Group Ltd.(b) | | | 228,000 | | | | 130,557 | | |
Total | | | | | 373,151 | | |
Household Products 0.1% | |
Reckitt Benckiser Group PLC | | | 1,704 | | | | 151,555 | | |
Svenska Cellulosa AB, Class B | | | 4,483 | | | | 132,866 | | |
Total | | | | | 284,421 | | |
Personal Products —% | |
Usana Health Sciences, Inc.(b) | | | 186 | | | | 23,603 | | |
Tobacco —% | |
Japan Tobacco, Inc. | | | 4,000 | | | | 156,655 | | |
Swedish Match AB | | | 228 | | | | 8,111 | | |
Universal Corp. | | | 185 | | | | 10,125 | | |
Total | | | | | 174,891 | | |
Total Consumer Staples | | | | | 1,127,556 | | |
ENERGY 0.1% | |
Energy Equipment & Services —% | |
Oil States International, Inc.(b) | | | 620 | | | | 17,502 | | |
Oil, Gas & Consumable Fuels 0.1% | |
Alon USA Energy, Inc. | | | 900 | | | | 11,322 | | |
Caltex Australia Ltd. | | | 1,236 | | | | 33,054 | | |
OMV AG | | | 3,511 | | | | 90,374 | | |
PDC Energy, Inc.(b) | | | 625 | | | | 35,544 | | |
REX American Resources Corp.(b) | | | 554 | | | | 29,600 | | |
Royal Dutch Shell PLC, Class B | | | 9,671 | | | | 210,711 | | |
Western Refining, Inc. | | | 355 | | | | 11,680 | | |
Total | | | | | 422,285 | | |
Total Energy | | | | | 439,787 | | |
The accompanying Notes to Financial Statements are an integral part of this statement.
Annual Report 2016
33
COLUMBIA CAPITAL ALLOCATION PORTFOLIOS
PORTFOLIO OF INVESTMENTS (continued)
Columbia Capital Allocation Moderate Conservative Portfolio
January 31, 2016
Common Stocks (continued)
Issuer | | Shares | | Value ($) | |
FINANCIALS 0.4% | |
Banks 0.2% | |
Australia and New Zealand Banking
Group Ltd. | | | 1,214 | | | | 21,074 | | |
Banc of California, Inc. | | | 1,525 | | | | 23,028 | | |
Banco Latinoamericano de Comercio
Exterior SA, Class E | | | 870 | | | | 20,288 | | |
BBCN Bancorp, Inc. | | | 970 | | | | 14,744 | | |
Central Pacific Financial Corp. | | | 1,380 | | | | 28,911 | | |
Credit Agricole SA | | | 10,572 | | | | 105,499 | | |
Customers Bancorp, Inc.(b) | | | 935 | | | | 23,469 | | |
First BanCorp(b) | | | 3,175 | | | | 8,255 | | |
First NBC Bank Holding Co.(b) | | | 810 | | | | 25,426 | | |
Hilltop Holdings, Inc.(b) | | | 260 | | | | 4,152 | | |
HSBC Holdings PLC | | | 27,682 | | | | 195,228 | | |
International Bancshares Corp. | | | 960 | | | | 22,262 | | |
Mitsubishi UFJ Financial Group, Inc. | | | 19,000 | | | | 97,430 | | |
Nordea Bank AB | | | 12,241 | | | | 123,263 | | |
Opus Bank | | | 120 | | | | 3,959 | | |
Societe Generale SA | | | 487 | | | | 18,578 | | |
Sumitomo Mitsui Financial Group, Inc. | | | 3,950 | | | | 132,517 | | |
Westpac Banking Corp. | | | 5,917 | | | | 131,039 | | |
Total | | | | | 999,122 | | |
Capital Markets —% | |
| 3i Group PLC | | | 17,110 | | | | 108,482 | | |
Arlington Asset Investment Corp.,
Class A | | | 1,920 | | | | 21,312 | | |
Cowen Group, Inc., Class A(b) | | | 3,400 | | | | 9,724 | | |
KCG Holdings, Inc., Class A(b) | | | 995 | | | | 10,169 | | |
Total | | | | | 149,687 | | |
Consumer Finance —% | |
Cash America International, Inc. | | | 970 | | | | 29,042 | | |
Nelnet, Inc., Class A | | | 750 | | | | 24,352 | | |
Total | | | | | 53,394 | | |
Diversified Financial Services —% | |
EXOR SpA | | | 2,998 | | | | 97,732 | | |
Insurance 0.1% | |
Ageas | | | 2,856 | | | | 115,985 | | |
Allianz SE, Registered Shares | | | 1,043 | | | | 168,795 | | |
American Equity Investment Life
Holding Co. | | | 779 | | | | 14,170 | | |
Common Stocks (continued)
Issuer | | Shares | | Value ($) | |
AXA SA | | | 1,193 | | | | 29,482 | | |
CNP Assurances | | | 3,315 | | | | 44,330 | | |
Employers Holdings, Inc. | | | 370 | | | | 9,216 | | |
Hannover Rueckversicherung AG | | | 129 | | | | 13,577 | | |
HCI Group, Inc. | | | 235 | | | | 7,814 | | |
Heritage Insurance Holdings, Inc. | | | 1,440 | | | | 28,541 | | |
Maiden Holdings Ltd. | | | 2,005 | | | | 25,664 | | |
Muenchener Rueckversicherungs-
Gesellschaft AG in Muenchen,
Registered Shares | | | 709 | | | | 136,604 | | |
Swiss Re AG | | | 1,530 | | | | 142,422 | | |
Universal Insurance Holdings, Inc. | | | 1,401 | | | | 26,255 | | |
Total | | | | | 762,855 | | |
Real Estate Investment Trusts (REITs) 0.1% | |
AG Mortgage Investment Trust, Inc. | | | 420 | | | | 4,927 | | |
American Assets Trust, Inc. | | | 300 | | | | 11,217 | | |
Apollo Residential Mortgage, Inc. | | | 800 | | | | 8,680 | | |
Coresite Realty Corp. | | | 510 | | | | 32,711 | | |
Cousins Properties, Inc. | | | 625 | | | | 5,388 | | |
CubeSmart | | | 1,275 | | | | 39,895 | | |
CyrusOne, Inc. | | | 385 | | | | 14,187 | | |
CYS Investments, Inc. | | | 4,175 | | | | 28,766 | | |
DuPont Fabros Technology, Inc. | | | 995 | | | | 33,004 | | |
Hersha Hospitality Trust | | | 400 | | | | 7,028 | | |
Mack-Cali Realty Corp. | | | 1,190 | | | | 24,740 | | |
Ryman Hospitality Properties, Inc. | | | 665 | | | | 31,222 | | |
Sovran Self Storage, Inc. | | | 333 | | | | 37,522 | | |
STORE Capital Corp. | | | 1,190 | | | | 29,500 | | |
Summit Hotel Properties, Inc. | | | 2,370 | | | | 24,055 | | |
Sunstone Hotel Investors, Inc. | | | 2,624 | | | | 31,174 | | |
Total | | | | | 364,016 | | |
Real Estate Management & Development —% | |
New World Development Co., Ltd. | | | 40,000 | | | | 32,745 | | |
Wheelock & Co., Ltd. | | | 28,000 | | | | 107,197 | | |
Total | | | | | 139,942 | | |
Thrifts & Mortgage Finance —% | |
BofI Holding, Inc.(b) | | | 830 | | | | 14,243 | | |
Flagstar Bancorp, Inc.(b) | | | 890 | | | | 16,598 | | |
HomeStreet, Inc.(b) | | | 795 | | | | 16,282 | | |
MGIC Investment Corp.(b) | | | 4,330 | | | | 28,665 | | |
The accompanying Notes to Financial Statements are an integral part of this statement.
Annual Report 2016
34
COLUMBIA CAPITAL ALLOCATION PORTFOLIOS
PORTFOLIO OF INVESTMENTS (continued)
Columbia Capital Allocation Moderate Conservative Portfolio
January 31, 2016
Common Stocks (continued)
Issuer | | Shares | | Value ($) | |
Radian Group, Inc. | | | 2,380 | | | | 23,943 | | |
Walker & Dunlop, Inc.(b) | | | 1,100 | | | | 26,356 | | |
Washington Federal, Inc. | | | 1,375 | | | | 29,356 | | |
Total | | | | | 155,443 | | |
Total Financials | | | | | 2,722,191 | | |
HEALTH CARE 0.2% | |
Biotechnology —% | |
ACADIA Pharmaceuticals, Inc.(b) | | | 320 | | | | 6,621 | | |
Acorda Therapeutics, Inc.(b) | | | 365 | | | | 13,439 | | |
Alder Biopharmaceuticals, Inc.(b) | | | 365 | | | | 8,826 | | |
AMAG Pharmaceuticals, Inc.(b) | | | 410 | | | | 9,393 | | |
Anacor Pharmaceuticals, Inc.(b) | | | 235 | | | | 17,656 | | |
ARIAD Pharmaceuticals, Inc.(b) | | | 1,120 | | | | 5,622 | | |
Arrowhead Research Corp.(b) | | | 1,900 | | | | 6,612 | | |
Curis, Inc.(b) | | | 2,307 | | | | 3,783 | | |
Dynavax Technologies Corp.(b) | | | 725 | | | | 17,465 | | |
Infinity Pharmaceuticals, Inc.(b) | | | 1,455 | | | | 9,036 | | |
Insmed, Inc.(b) | | | 390 | | | | 5,148 | | |
Insys Therapeutics, Inc.(b) | | | 450 | | | | 7,808 | | |
Keryx Biopharmaceuticals, Inc.(b) | | | 2,620 | | | | 9,249 | | |
Neurocrine Biosciences, Inc.(b) | | | 315 | | | | 13,403 | | |
Novavax, Inc.(b) | | | 2,750 | | | | 14,162 | | |
Portola Pharmaceuticals, Inc.(b) | | | 115 | | | | 3,798 | | |
Spark Therapeutics, Inc.(b) | | | 450 | | | | 12,676 | | |
TESARO, Inc.(b) | | | 90 | | | | 3,109 | | |
Ultragenyx Pharmaceutical, Inc.(b) | | | 200 | | | | 11,230 | | |
vTv Therapeutics, Inc., Class A(b) | | | 723 | | | | 5,242 | | |
Total | | | | | 184,278 | | |
Health Care Equipment & Supplies —% | |
Analogic Corp. | | | 348 | | | | 25,776 | | |
LivaNova PLC(b) | | | 570 | | | | 31,909 | | |
Merit Medical Systems, Inc.(b) | | | 1,720 | | | | 28,466 | | |
Orthofix International NV(b) | | | 705 | | | | 27,826 | | |
Total | | | | | 113,977 | | |
Health Care Providers & Services 0.1% | |
Alfresa Holdings Corp. | | | 5,800 | | | | 108,061 | | |
Chemed Corp. | | | 25 | | | | 3,508 | | |
LHC Group, Inc.(b) | | | 200 | | | | 7,584 | | |
Magellan Health, Inc.(b) | | | 500 | | | | 28,500 | | |
Common Stocks (continued)
Issuer | | Shares | | Value ($) | |
Medipal Holdings Corp. | | | 7,500 | | | | 121,647 | | |
Molina Healthcare, Inc.(b) | | | 556 | | | | 30,530 | | |
Owens & Minor, Inc. | | | 100 | | | | 3,465 | | |
PharMerica Corp.(b) | | | 380 | | | | 11,282 | | |
Triple-S Management Corp., Class B(b) | | | 1,020 | | | | 22,736 | | |
WellCare Health Plans, Inc.(b) | | | 157 | | | | 11,929 | | |
Total | | | | | 349,242 | | |
Life Sciences Tools & Services —% | |
Affymetrix, Inc.(b) | | | 380 | | | | 5,331 | | |
Cambrex Corp.(b) | | | 662 | | | | 22,932 | | |
INC Research Holdings, Inc. Class A(b) | | | 611 | | | | 25,742 | | |
PAREXEL International Corp.(b) | | | 203 | | | | 12,984 | | |
Total | | | | | 66,989 | | |
Pharmaceuticals 0.1% | |
GlaxoSmithKline PLC | | | 9,042 | | | | 186,269 | | |
Novo Nordisk A/S, Class B | | | 279 | | | | 15,587 | | |
Pernix Therapeutics Holdings, Inc.(b) | | | 1,700 | | | | 3,706 | | |
Roche Holding AG, Genusschein Shares | | | 559 | | | | 144,795 | | |
Sanofi | | | 2,110 | | | | 175,469 | | |
Sucampo Pharmaceuticals, Inc.,
Class A(b) | | | 1,700 | | | | 21,505 | | |
Teva Pharmaceutical Industries Ltd. | | | 1,976 | | | | 121,420 | | |
Total | | | | | 668,751 | | |
Total Health Care | | | | | 1,383,237 | | |
INDUSTRIALS 0.2% | |
Aerospace & Defense —% | |
Cubic Corp. | | | 240 | | | | 9,590 | | |
Moog, Inc., Class A(b) | | | 545 | | | | 25,250 | | |
Total | | | | | 34,840 | | |
Air Freight & Logistics —% | |
Air Transport Services Group, Inc.(b) | | | 1,885 | | | | 18,341 | | |
Royal Mail PLC | | | 18,493 | | | | 121,580 | | |
Total | | | | | 139,921 | | |
Airlines —% | |
Hawaiian Holdings, Inc.(b) | | | 460 | | | | 16,197 | | |
Japan Airlines Co., Ltd. | | | 3,400 | | | | 127,613 | | |
Total | | | | | 143,810 | | |
Building Products —% | |
Continental Building Product(b) | | | 1,565 | | | | 23,381 | | |
The accompanying Notes to Financial Statements are an integral part of this statement.
Annual Report 2016
35
COLUMBIA CAPITAL ALLOCATION PORTFOLIOS
PORTFOLIO OF INVESTMENTS (continued)
Columbia Capital Allocation Moderate Conservative Portfolio
January 31, 2016
Common Stocks (continued)
Issuer | | Shares | | Value ($) | |
Commercial Services & Supplies —% | |
Deluxe Corp. | | | 625 | | | | 34,938 | | |
Interface, Inc. | | | 390 | | | | 6,587 | | |
Quad/Graphics, Inc. | | | 2,090 | | | | 21,067 | | |
West Corp. | | | 390 | | | | 7,063 | | |
Total | | | | | 69,655 | | |
Construction & Engineering 0.1% | |
EMCOR Group, Inc. | | | 730 | | | | 33,361 | | |
Leighton Holdings Ltd. | | | 6,999 | | | | 120,714 | | |
VINCI SA | | | 2,159 | | | | 146,266 | | |
Total | | | | | 300,341 | | |
Electrical Equipment 0.1% | |
EnerSys | | | 530 | | | | 25,668 | | |
General Cable Corp. | | | 2,020 | | | | 23,674 | | |
OSRAM Licht AG | | | 1,166 | | | | 52,058 | | |
Prysmian SpA | | | 5,714 | | | | 117,566 | | |
Vestas Wind Systems A/S | | | 2,292 | | | | 149,976 | | |
Total | | | | | 368,942 | | |
Machinery —% | |
Barnes Group, Inc. | | | 150 | | | | 4,877 | | |
Global Brass & Copper Holdings, Inc. | | | 650 | | | | 13,461 | | |
Kadant, Inc. | | | 485 | | | | 18,823 | | |
KONE OYJ, Class B | | | 373 | | | | 16,395 | | |
Metso OYJ | | | 398 | | | | 8,212 | | |
Mueller Industries, Inc. | | | 980 | | | | 24,941 | | |
Wabash National Corp.(b) | | | 2,775 | | | | 30,691 | | |
Total | | | | | 117,400 | | |
Marine —% | |
Kuehne & Nagel International AG | | | 904 | | | | 119,644 | | |
Matson, Inc. | | | 780 | | | | 31,520 | | |
Total | | | | | 151,164 | | |
Professional Services —% | |
Insperity, Inc. | | | 35 | | | | 1,573 | | |
RPX Corp.(b) | | | 2,290 | | | | 26,518 | | |
Total | | | | | 28,091 | | |
Road & Rail —% | |
ArcBest Corp. | | | 770 | | | | 15,808 | | |
Common Stocks (continued)
Issuer | | Shares | | Value ($) | |
Trading Companies & Distributors —% | |
Applied Industrial Technologies, Inc. | | | 365 | | | | 14,031 | | |
ITOCHU Corp. | | | 3,400 | | | | 39,960 | | |
MRC Global, Inc.(b) | | | 1,290 | | | | 12,964 | | |
Total | | | | | 66,955 | | |
Total Industrials | | | | | 1,460,308 | | |
INFORMATION TECHNOLOGY 0.2% | |
Communications Equipment —% | |
NETGEAR, Inc.(b) | | | 765 | | | | 28,588 | | |
Plantronics, Inc. | | | 90 | | | | 4,035 | | |
Polycom, Inc.(b) | | | 1,775 | | | | 18,087 | | |
Total | | | | | 50,710 | | |
Electronic Equipment, Instruments & Components —% | |
Benchmark Electronics, Inc.(b) | | | 1,170 | | | | 24,570 | | |
Checkpoint Systems, Inc. | | | 1,197 | | | | 7,757 | | |
Coherent, Inc.(b) | | | 72 | | | | 5,563 | | |
Insight Enterprises, Inc.(b) | | | 435 | | | | 10,279 | | |
MTS Systems Corp. | | | 80 | | | | 4,272 | | |
SYNNEX Corp. | | | 375 | | | | 31,481 | | |
Tech Data Corp.(b) | | | 500 | | | | 31,200 | | |
Total | | | | | 115,122 | | |
Internet Software & Services —% | |
DHI Group, Inc.(b) | | | 2,035 | | | | 18,946 | | |
EarthLink Holdings Corp. | | | 3,800 | | | | 22,496 | | |
j2 Global, Inc. | | | 266 | | | | 19,287 | | |
LogMeIn, Inc.(b) | | | 550 | | | | 28,732 | | |
Mixi, Inc. | | | 600 | | | | 19,224 | | |
RetailMeNot, Inc.(b) | | | 3,109 | | | | 28,292 | | |
Web.com Group, Inc.(b) | | | 1,425 | | | | 26,833 | | |
Total | | | | | 163,810 | | |
IT Services —% | |
Convergys Corp. | | | 113 | | | | 2,762 | | |
CSG Systems International, Inc. | | | 405 | | | | 14,151 | | |
EVERTEC, Inc. | | | 1,642 | | | | 22,561 | | |
NeuStar, Inc., Class A(b) | | | 1,305 | | | | 32,077 | | |
Sykes Enterprises, Inc.(b) | | | 875 | | | | 25,760 | | |
Syntel, Inc.(b) | | | 90 | | | | 4,260 | | |
Total | | | | | 101,571 | | |
The accompanying Notes to Financial Statements are an integral part of this statement.
Annual Report 2016
36
COLUMBIA CAPITAL ALLOCATION PORTFOLIOS
PORTFOLIO OF INVESTMENTS (continued)
Columbia Capital Allocation Moderate Conservative Portfolio
January 31, 2016
Common Stocks (continued)
Issuer | | Shares | | Value ($) | |
Semiconductors & Semiconductor Equipment 0.1% | |
Amkor Technology, Inc.(b) | | | 4,715 | | | | 28,950 | | |
Cabot Microelectronics Corp.(b) | | | 300 | | | | 12,192 | | |
Cirrus Logic, Inc.(b) | | | 150 | | | | 5,208 | | |
Diodes, Inc.(b) | | | 1,235 | | | | 23,626 | | |
Entegris, Inc.(b) | | | 325 | | | | 3,790 | | |
Silicon Laboratories, Inc.(b) | | | 160 | | | | 7,296 | | |
STMicroelectronics NV | | | 14,816 | | | | 96,794 | | |
Veeco Instruments, Inc.(b) | | | 260 | | | | 4,846 | | |
Xcerra Corp.(b) | | | 2,495 | | | | 13,673 | | |
Total | | | | | 196,375 | | |
Software —% | |
Aspen Technology, Inc.(b) | | | 950 | | | | 30,818 | | |
AVG Technologies NV(b) | | | 1,330 | | | | 25,097 | | |
Check Point Software Technologies Ltd.(b) | | | 200 | | | | 15,762 | | |
Gigamon, Inc.(b) | | | 650 | | | | 16,997 | | |
Progress Software Corp.(b) | | | 405 | | | | 10,485 | | |
RealPage, Inc.(b) | | | 740 | | | | 14,275 | | |
VASCO Data Security International, Inc.(b) | | | 705 | | | | 10,928 | | |
Total | | | | | 124,362 | | |
Technology Hardware, Storage & Peripherals 0.1% | |
Canon, Inc. | | | 3,700 | | | | 103,387 | | |
FUJIFILM Holdings Corp. | | | 3,450 | | | | 133,301 | | |
Total | | | | | 236,688 | | |
Total Information Technology | | | | | 988,638 | | |
MATERIALS 0.1% | |
Chemicals 0.1% | |
BASF SE | | | 696 | | | | 46,391 | | |
Chemtura Corp.(b) | | | 1,190 | | | | 31,226 | | |
Innophos Holdings, Inc. | | | 290 | | | | 7,746 | | |
Innospec, Inc. | | | 605 | | | | 30,159 | | |
Mitsubishi Chemical Holdings Corp. | | | 22,800 | | | | 127,161 | | |
Total | | | | | 242,683 | | |
Construction Materials —% | |
Fletcher Building Ltd. | | | 3,670 | | | | 16,453 | | |
US Concrete, Inc.(b) | | | 300 | | | | 13,644 | | |
Total | | | | | 30,097 | | |
Common Stocks (continued)
Issuer | | Shares | | Value ($) | |
Metals & Mining —% | |
Commercial Metals Co. | | | 935 | | | | 13,015 | | |
Materion Corp. | | | 805 | | | | 19,714 | | |
Rio Tinto PLC | | | 4,312 | | | | 105,738 | | |
Total | | | | | 138,467 | | |
Paper & Forest Products —% | |
UPM-Kymmene OYJ | | | 7,597 | | | | 123,807 | | |
Total Materials | | | | | 535,054 | | |
TELECOMMUNICATION SERVICES 0.1% | |
Diversified Telecommunication Services 0.1% | |
General Communication, Inc., Class A(b) | | | 1,285 | | | | 23,284 | | |
Nippon Telegraph & Telephone Corp. | | | 3,900 | | | | 166,033 | | |
Telenor ASA | | | 4,869 | | | | 79,425 | | |
Telstra Corp., Ltd. | | | 31,855 | | | | 128,355 | | |
Total | | | | | 397,097 | | |
Wireless Telecommunication Services —% | |
NTT DoCoMo, Inc. | | | 800 | | | | 17,743 | | |
Shenandoah Telecommunications Co. | | | 700 | | | | 16,086 | | |
Total | | | | | 33,829 | | |
Total Telecommunication Services | | | | | 430,926 | | |
UTILITIES 0.1% | |
Electric Utilities 0.1% | |
Chubu Electric Power Co., Inc. | | | 7,900 | | | | 101,463 | | |
Endesa SA | | | 5,026 | | | | 97,300 | | |
IDACORP, Inc. | | | 409 | | | | 28,462 | | |
Tokyo Electric Power Co., Inc.(b) | | | 19,300 | | | | 96,981 | | |
Total | | | | | 324,206 | | |
Gas Utilities —% | |
Chesapeake Utilities Corp. | | | 405 | | | | 25,503 | | |
New Jersey Resources Corp. | | | 775 | | | | 27,295 | | |
Southwest Gas Corp. | | | 560 | | | | 32,945 | | |
WGL Holdings, Inc. | | | 109 | | | | 7,280 | | |
Total | | | | | 93,023 | | |
Water Utilities —% | |
SJW Corp. | | | 565 | | | | 18,419 | | |
Total Utilities | | | | | 435,648 | | |
Total Common Stocks
(Cost: $11,771,114) | | | | | 11,037,399 | | |
The accompanying Notes to Financial Statements are an integral part of this statement.
Annual Report 2016
37
COLUMBIA CAPITAL ALLOCATION PORTFOLIOS
PORTFOLIO OF INVESTMENTS (continued)
Columbia Capital Allocation Moderate Conservative Portfolio
January 31, 2016
Money Market Funds 3.6%
| | | Shares | | Value ($) | |
Columbia Short-Term Cash Fund,
0.360%(a)(c) | | | 22,212,738 | | | | 22,212,738 | | |
Total Money Market Funds
(Cost: $22,212,738) | | | | | 22,212,738 | | |
Total Investments
(Cost: $648,346,082) | | | | | 618,380,322 | | |
Other Assets & Liabilities, Net | | | | | 1,373,644 | | |
Net Assets | | | | | 619,753,966 | | |
At January 31, 2016, cash totaling $1,225,951 was pledged as collateral.
Investments in Derivatives
Forward Foreign Currency Exchange Contracts Open at January 31, 2016
Counterparty | | Exchange Date | | Currency to
be Delivered | |
| | Currency to
be Received | |
| | Unrealized
Appreciation ($) | | Unrealized
Depreciation ($) | |
Barclays | | 3/3/2016 | | | 79,000 | | | AUD | | | | | 55,172 | | | USD | | | | | — | | | | (663 | ) | |
Barclays | | 3/3/2016 | | | 163,000 | | | DKK | | | | | 23,763 | | | USD | | | | | 84 | | | | — | | |
Barclays | | 3/3/2016 | | | 339,000 | | | ILS | | | | | 86,424 | | | USD | | | | | 773 | | | | — | | |
Barclays | | 3/3/2016 | | | 4,206,000 | | | JPY | | | | | 35,718 | | | USD | | | | | 958 | | | | — | | |
Barclays | | 3/3/2016 | | | 281,000 | | | NOK | | | | | 31,484 | | | USD | | | | | — | | | | (874 | ) | |
Barclays | | 3/3/2016 | | | 336,000 | | | SEK | | | | | 39,406 | | | USD | | | | | 229 | | | | — | | |
Barclays | | 3/3/2016 | | | 170,299 | | | USD | | | | | 170,000 | | | CHF | | | | | — | | | | (4,155 | ) | |
Barclays | | 3/3/2016 | | | 22,860 | | | USD | | | | | 21,000 | | | EUR | | | | | — | | | | (95 | ) | |
Barclays | | 3/3/2016 | | | 211,475 | | | USD | | | | | 145,000 | | | GBP | | | | | — | | | | (4,858 | ) | |
Barclays | | 3/3/2016 | | | 94,000 | | | USD | | | | | 135,000 | | | SGD | | | | | 711 | | | | — | | |
Total | | | | | | | | | | | | | 2,755 | | | | (10,645 | ) | |
Futures Contracts Outstanding at January 31, 2016
Long Futures Contracts Outstanding
Contract Description | | Number of
Contracts | | Trading
Currency | | Notional
Market
Value ($) | | Expiration
Date | | Unrealized
Appreciation ($) | | Unrealized
Depreciation ($) | |
S&P MID 400 EMINI | | | 20 | | | USD | | | | | 2,629,600 | | | 03/2016 | | | — | | | | (134,149 | ) | |
TOPIX INDX FUTR | | | 30 | | | JPY | | | | | 3,565,853 | | | 03/2016 | | | — | | | | (382,701 | ) | |
US 10YR NOTE (CBT) | | | 141 | | | USD | | | | | 18,270,516 | | | 03/2016 | | | 487,738 | | | | — | | |
US LONG BOND(CBT) | | | 32 | | | USD | | | | | 5,153,000 | | | 03/2016 | | | 252,942 | | | | — | | |
US ULTRA BOND CBT | | | 82 | | | USD | | | | | 13,627,375 | | | 03/2016 | | | 306,701 | | | | — | | |
Total | | | | | | | 43,246,344 | | | | | | 1,047,381 | | | | (516,850 | ) | |
The accompanying Notes to Financial Statements are an integral part of this statement.
Annual Report 2016
38
COLUMBIA CAPITAL ALLOCATION PORTFOLIOS
PORTFOLIO OF INVESTMENTS (continued)
Columbia Capital Allocation Moderate Conservative Portfolio
January 31, 2016
Credit Default Swap Contracts Outstanding at January 31, 2016
Buy Protection
Counterparty | | Reference
Entity | | Expiration
Date | | Pay
Fixed
Rate (%) | | Notional
Amount ($) | | Market
Value ($) | | Periodic
Payments
Receivable
(Payable) ($) | | Unrealized
Appreciation ($) | | Unrealized
Depreciation ($) | |
Morgan Stanley*
| | Markit CDX North
America Investment
Grade Index,
Series 25 | | 12/20/2020 | | | 1.000 | | | | 13,000,000 | | | | (18,590 | ) | | | (14,444 | ) | | | — | | | | (33,034 | ) | |
*Centrally cleared swap contract
Notes to Portfolio of Investments
(a) As defined in the Investment Company Act of 1940, an affiliated company is one in which the Fund owns 5% or more of the company's outstanding voting securities, or a company which is under common ownership or control with the Fund. Holdings and transactions in these affiliated companies during the year ended January 31, 2016 are as follows:
Issuer | | Beginning
Cost ($) | | Purchase
Cost ($) | | Proceeds
From
Sales ($) | | Realized
Gain
(Loss) ($) | | Ending
Cost ($) | | Capital Gain
Distributions ($) | | Dividends —
Affiliated
Issuers ($) | | Value ($) | |
Columbia Absolute
Return Currency and
Income Fund, Class I
Shares | | | 2,405,924 | | | | 376,475 | | | | (544,747 | ) | | | 75,347 | | | | 2,312,999 | | | | 202,711 | | | | 109,278 | | | | 2,445,081 | | |
Columbia Absolute
Return Emerging
Markets Macro Fund,
Class I Shares | | | 11,047,318 | | | | 11,523 | | | | (10,506,731 | ) | | | (552,110 | ) | | | — | | | | — | | | | — | | | | — | | |
Columbia Absolute
Return Enhanced
Multi-Strategy Fund,
Class I Shares | | | 15,378,197 | | | | 983,780 | | | | (15,856,276 | ) | | | (505,701 | ) | | | — | | | | 942,817 | | | | — | | | | — | | |
Columbia Adaptive
Alternatives Fund,
Class I Shares | | | — | | | | 4,536,456 | | | | — | | | | — | | | | 4,536,456 | | | | — | | | | 36,456 | | | | 4,269,887 | | |
Columbia Contrarian
Core Fund, Class I
Shares | | | 23,146,263 | | | | 1,634,385 | | | | (11,306,534 | ) | | | 4,598,411 | | | | 18,072,525 | | | | 632,343 | | | | 641,293 | | | | 21,149,017 | | |
Columbia Corporate
Income Fund, Class I
Shares | | | 137,668,717 | | | | 5,632,585 | | | | (26,080,881 | ) | | | (221,477 | ) | | | 116,998,944 | | | | — | | | | 4,457,850 | | | | 107,788,516 | | |
Columbia Disciplined
Core Fund, Class I
Shares | | | 20,558,502 | | | | 800,570 | | | | (3,325,876 | ) | | | 1,504,273 | | | | 19,537,469 | | | | — | | | | 424,510 | | | | 23,982,270 | | |
Columbia Disciplined
Growth Fund, Class I
Shares | | | 22,245,816 | | | | 2,948,867 | | | | (3,686,805 | ) | | | 701,322 | | | | 22,209,200 | | | | 2,435,322 | | | | 231,508 | | | | 20,302,978 | | |
Columbia Disciplined
Value Fund, Class I
Shares | | | 38,613,588 | | | | 3,083,728 | | | | (2,426,427 | ) | | | 84,957 | | | | 39,355,846 | | | | 1,817,047 | | | | 702,406 | | | | 35,367,730 | | |
Columbia Diversified
Absolute Return Fund,
Class I Shares | | | — | | | | 15,240,850 | | | | (772,757 | ) | | | (8,426 | ) | | | 14,459,667 | | | | 88,083 | | | | 54,561 | | | | 13,845,040 | | |
Columbia Emerging
Markets Bond Fund,
Class I Shares | | | 19,005,223 | | | | 805,901 | | | | (4,359,933 | ) | | | (185,061 | ) | | | 15,266,130 | | | | — | | | | 488,470 | | | | 13,538,857 | | |
The accompanying Notes to Financial Statements are an integral part of this statement.
Annual Report 2016
39
COLUMBIA CAPITAL ALLOCATION PORTFOLIOS
PORTFOLIO OF INVESTMENTS (continued)
Columbia Capital Allocation Moderate Conservative Portfolio
January 31, 2016
Notes to Portfolio of Investments (continued)
Issuer | | Beginning
Cost ($) | | Purchase
Cost ($) | | Proceeds
From
Sales ($) | | Realized
Gain
(Loss) ($) | | Ending
Cost ($) | | Capital Gain
Distributions ($) | | Dividends —
Affiliated
Issuers ($) | | Value ($) | |
Columbia European
Equity Fund, Class I
Shares | | | 21,306,614 | | | | 1,729,928 | | | | (3,622,708 | ) | | | 764,483 | | | | 20,178,317 | | | | 582,840 | | | | 298,589 | | | | 18,353,108 | | |
Columbia Global
Inflation-Linked Bond
Plus Fund, Class I
Shares | | | 1,525,553 | | | | 144,155 | | | | (1,604,980 | ) | | | (64,728 | ) | | | — | | | | — | | | | 51,652 | | | | — | | |
Columbia Income
Opportunities Fund,
Class I Shares | | | 28,438,560 | | | | 5,646,400 | | | | (2,612,397 | ) | | | 98,184 | | | | 31,570,747 | | | | 221,834 | | | | 1,549,063 | | | | 29,617,953 | | |
Columbia Inflation
Protected Securities
Fund, Class I Shares | | | 15,451,697 | | | | 254,039 | | | | (387,880 | ) | | | (63,957 | ) | | | 15,253,899 | | | | — | | | | — | | | | 12,998,662 | | |
Columbia International
Bond Fund, Class I
Shares | | | 3,676,343 | | | | — | | | | (3,513,004 | ) | | | (163,339 | ) | | | — | | | | — | | | | — | | | | — | | |
Columbia Large Cap
Growth Fund, Class I
Shares | | | 12,692,142 | | | | 1,851,223 | | | | (3,422,187 | ) | | | 1,526,732 | | | | 12,647,910 | | | | 1,432,397 | | | | — | | | | 14,121,803 | | |
Columbia Limited
Duration Credit Fund,
Class I Shares | | | 46,438,690 | | | | 1,495,716 | | | | (3,393,197 | ) | | | 47,139 | | | | 44,588,348 | | | | — | | | | 1,157,416 | | | | 42,289,317 | | |
Columbia Mortgage
Opportunities Fund,
Class I Shares | | | — | | | | 11,085,168 | | | | (1,016,705 | ) | | | (8,521 | ) | | | 10,059,942 | | | | 104,649 | | | | 368,343 | | | | 9,518,761 | | |
Columbia Multi-Asset
Income Fund, Class I
Shares | | | — | | | | 14,474,235 | | | | — | | | | — | | | | 14,474,235 | | | | — | | | | 647,235 | | | | 12,990,856 | | |
Columbia Overseas
Value Fund, Class I
Shares | | | 30,566,410 | | | | 1,206,453 | | | | (3,887,831 | ) | | | 41,706 | | | | 27,926,738 | | | | — | | | | 651,969 | | | | 24,793,193 | | |
Columbia Pacific/Asia
Fund, Class I Shares | | | 3,791,988 | | | | 385,985 | | | | (2,508,655 | ) | | | 140,631 | | | | 1,809,949 | | | | 9,180 | | | | 22,700 | | | | 1,774,262 | | |
Columbia Select Large
Cap Equity Fund,
Class I Shares | | | — | | | | 14,657,055 | | | | — | | | | — | | | | 14,657,055 | | | | 660,961 | | | | 184,095 | | | | 12,913,359 | | |
Columbia Short-Term
Cash Fund | | | 81,183,164 | | | | 67,291,237 | | | | (126,261,663 | ) | | | — | | | | 22,212,738 | | | | — | | | | 81,399 | | | | 22,212,738 | | |
Columbia Small Cap
Core Fund, Class I
Shares | | | 10,656,827 | | | | 3,651,584 | | | | (948,813 | ) | | | 86,537 | | | | 13,446,135 | | | | 3,277,724 | | | | 18,148 | | | | 9,408,527 | | |
Columbia U.S.
Government Mortgage
Fund, Class I Shares | | | 102,602,529 | | | | 4,066,382 | | | | (11,392,434 | ) | | | (78,992 | ) | | | 95,197,485 | | | | 282,831 | | | | 2,944,939 | | | | 93,597,570 | | |
Columbia U.S.
Treasury Index Fund,
Class I Shares | | | 11,194,137 | | | | 51,863,239 | | | | (3,095,771 | ) | | | (159,371 | ) | | | 59,802,234 | | | | 177,538 | | | | 293,602 | | | | 60,063,438 | | |
Total | | | 659,594,202 | | | | 215,857,919 | | | | (246,535,192 | ) | | | 7,658,039 | | | | 636,574,968 | | | | 12,868,277 | | | | 15,415,482 | | | | 607,342,923 | | |
(b) Non-income producing investment.
(c) The rate shown is the seven-day current annualized yield at January 31, 2016.
The accompanying Notes to Financial Statements are an integral part of this statement.
Annual Report 2016
40
COLUMBIA CAPITAL ALLOCATION PORTFOLIOS
PORTFOLIO OF INVESTMENTS (continued)
Columbia Capital Allocation Moderate Conservative Portfolio
January 31, 2016
AUD Australian Dollar
CHF Swiss Franc
DKK Danish Krone
EUR Euro
GBP British Pound
ILS Israeli Shekel
JPY Japanese Yen
NOK Norwegian Krone
SEK Swedish Krona
SGD Singapore Dollar
USD US Dollar
Fair Value Measurements
The Fund categorizes its fair value measurements according to a three-level hierarchy that maximizes the use of observable inputs and minimizes the use of unobservable inputs by prioritizing that the most observable input be used when available. Observable inputs are those that market participants would use in pricing an investment based on market data obtained from sources independent of the reporting entity. Unobservable inputs are those that reflect the Fund's assumptions about the information market participants would use in pricing an investment. An investment's level within the fair value hierarchy is based on the lowest level of any input that is deemed significant to the asset's or liability's fair value measurement. The input levels are not necessarily an indication of the risk or liquidity associated with investments at that level. For example, certain U.S. government securities are generally high quality and liquid, however, they are reflected as Level 2 because the inputs used to determine fair value may not always be quoted prices in an active market.
Fair value inputs are summarized in the three broad levels listed below:
> Level 1 — Valuations based on quoted prices for investments in active markets that the Fund has the ability to access at the measurement date (including NAV for open-end mutual funds). Valuation adjustments are not applied to Level 1 investments.
> Level 2 — Valuations based on other significant observable inputs (including quoted prices for similar securities, interest rates, prepayment speeds, credit risks, etc.).
> Level 3 — Valuations based on significant unobservable inputs (including the Fund's own assumptions and judgment in determining the fair value of investments).
Inputs that are used in determining fair value of an investment may include price information, credit data, volatility statistics, and other factors. These inputs can be either observable or unobservable. The availability of observable inputs can vary between investments, and is affected by various factors such as the type of investment, and the volume and level of activity for that investment or similar investments in the marketplace. The inputs will be considered by the Investment Manager, along with any other relevant factors in the calculation of an investment's fair value. The Fund uses prices and inputs that are current as of the measurement date, which may include periods of market dislocations. During these periods, the availability of prices and inputs may be reduced for many investments. This condition could cause an investment to be reclassified between the various levels within the hierarchy.
Foreign equity securities actively traded in markets where there is a significant delay in the local close relative to the New York Stock Exchange (NYSE) are classified as Level 2. The values of these securities may include an adjustment to reflect the impact of significant market movements following the close of local trading, as described in Note 2 of the Notes to Financial Statements in the most recent shareholder report.
Investments falling into the Level 3 category are primarily supported by quoted prices from brokers and dealers participating in the market for those investments. However, these may be classified as Level 3 investments due to lack of market transparency and corroboration to support these quoted prices. Additionally, valuation models may be used as the pricing source for any remaining investments classified as Level 3. These models may rely on one or more significant unobservable inputs and/or significant assumptions by the Investment Manager. Inputs used in valuations may include, but are not limited to, financial statement analysis, capital account balances, discount rates and estimated cash flows, and comparable company data.
Under the direction of the Fund's Board of Trustees (the Board), the Investment Manager's Valuation Committee (the Committee) is responsible for overseeing the valuation procedures approved by the Board. The Committee consists of voting and non-voting members from various groups within the Investment Manager's organization, including operations and accounting, trading and investments, compliance, risk management and legal.
The accompanying Notes to Financial Statements are an integral part of this statement.
Annual Report 2016
41
COLUMBIA CAPITAL ALLOCATION PORTFOLIOS
PORTFOLIO OF INVESTMENTS (continued)
Columbia Capital Allocation Moderate Conservative Portfolio
January 31, 2016
Fair Value Measurements (continued)
The Committee meets at least monthly to review and approve valuation matters, which may include a description of specific valuation determinations, data regarding pricing information received from approved pricing vendors and brokers and the results of Board-approved valuation control policies and procedures (the Policies). The Policies address, among other things, instances when market quotations are or are not readily available, including recommendations of third party pricing vendors and a determination of appropriate pricing methodologies; events that require specific valuation determinations and assessment of fair value techniques; securities with a potential for stale pricing, including those that are illiquid, restricted, or in default; and the effectiveness of third party pricing vendors, including periodic reviews of vendors. The Committee meets more frequently, as needed, to discuss additional valuation matters, which may include the need to review back-testing results, review time-sensitive information or approve related valuation actions. The Committee reports to the Board, with members of the Committee meeting with the Board at each of its regularly scheduled meetings to discuss valuation matters and actions during the period, similar to those described earlier.
For investments categorized as Level 3, the Committee monitors information similar to that described above, which may include: (i) data specific to the issuer or comparable issuers, (ii) general market or specific sector news and (iii) quoted prices and specific or similar security transactions. The Committee considers this data and any changes from prior periods in order to assess the reasonableness of observable and unobservable inputs, any assumptions or internal models used to value those securities and changes in fair value. This data is also used to corroborate, when available, information received from approved pricing vendors and brokers. Various factors impact the frequency of monitoring this information (which may occur as often as daily). However, the Committee may determine that changes to inputs, assumptions and models are not required as a result of the monitoring procedures performed.
The following table is a summary of the inputs used to value the Fund's investments at January 31, 2016:
| | | Level 1
Quoted Prices in Active
Markets for Identical
Assets ($) | | Level 2
Other Significant
Observable Inputs ($) | | Level 3
Significant
Unobservable Inputs ($) | | Total ($) | |
Investments | |
Equity Funds | | | 182,166,247 | | | | — | | | | — | | | | 182,166,247 | | |
Fixed-Income Funds | | | 369,413,074 | | | | — | | | | — | | | | 369,413,074 | | |
Alternative Investment Funds | | | 33,550,864 | | | | — | | | | — | | | | 33,550,864 | | |
Common Stocks | |
Consumer Discretionary | | | 487,533 | | | | 1,026,521 | | | | — | | | | 1,514,054 | | |
Consumer Staples | | | 142,869 | | | | 984,687 | | | | — | | | | 1,127,556 | | |
Energy | | | 105,648 | | | | 334,139 | | | | — | | | | 439,787 | | |
Financials | | | 900,212 | | | | 1,821,979 | | | | — | | | | 2,722,191 | | |
Health Care | | | 509,989 | | | | 873,248 | | | | — | | | | 1,383,237 | | |
Industrials | | | 440,324 | | | | 1,019,984 | | | | — | | | | 1,460,308 | | |
Information Technology | | | 635,932 | | | | 352,706 | | | | — | | | | 988,638 | | |
Materials | | | 115,504 | | | | 419,550 | | | | — | | | | 535,054 | | |
Telecommunication Services | | | 39,370 | | | | 391,556 | | | | — | | | | 430,926 | | |
Utilities | | | 139,904 | | | | 295,744 | | | | — | | | | 435,648 | | |
Total Common Stocks | | | 3,517,285 | | | | 7,520,114 | | | | — | | | | 11,037,399 | | |
Money Market Funds | | | — | | | | 22,212,738 | | | | — | | | | 22,212,738 | | |
Total Investments | | | 588,647,470 | | | | 29,732,852 | | | | — | | | | 618,380,322 | | |
The accompanying Notes to Financial Statements are an integral part of this statement.
Annual Report 2016
42
COLUMBIA CAPITAL ALLOCATION PORTFOLIOS
PORTFOLIO OF INVESTMENTS (continued)
Columbia Capital Allocation Moderate Conservative Portfolio
January 31, 2016
Fair Value Measurements (continued)
| | | Level 1
Quoted Prices in Active
Markets for Identical
Assets ($) | | Level 2
Other Significant
Observable Inputs ($) | | Level 3
Significant
Unobservable Inputs ($) | | Total ($) | |
Derivatives | |
Assets | |
Forward Foreign Currency
Exchange Contracts | | | — | | | | 2,755 | | | | — | | | | 2,755 | | |
Futures Contracts | | | 1,047,381 | | | | — | | | | — | | | | 1,047,381 | | |
Liabilities | |
Forward Foreign Currency
Exchange Contracts | | | — | | | | (10,645 | ) | | | — | | | | (10,645 | ) | |
Futures Contracts | | | (516,850 | ) | | | — | | | | — | | | | (516,850 | ) | |
Swap Contracts | | | — | | | | (33,034 | ) | | | — | | | | (33,034 | ) | |
Total | | | 589,178,001 | | | | 29,691,928 | | | | — | | | | 618,869,929 | | |
See the Portfolio of Investments for all investment classifications not indicated in the table.
The Fund's assets assigned to the Level 2 input category are generally valued using the market approach, in which a security's value is determined through reference to prices and information from market transactions for similar or identical assets and/or fund per share market values which are not considered publicly available. These assets include certain foreign securities for which a third party statistical pricing service may be employed for purposes of fair market valuation. The model utilized by such third party statistical pricing service takes into account a security's correlation to available market data including, but not limited to, intraday index, ADR, and exchange-traded fund movements.
Derivative instruments are valued at unrealized appreciation (depreciation).
Financial assets were transferred from Level 1 to Level 2 as the market for these assets is not considered publicly available. Fund per share market values were obtained using observable market inputs.
The following table shows transfers between Level 1 and Level 2 of the fair value hierarchy:
Transfers In | | Transfers Out | |
| Level 1 ($) | | Level 2 ($) | | Level 1 ($) | | Level 2 ($) | |
| | — | | | | 81,183,164 | | | | 81,183,164 | | | | — | | |
Transfers between Level 1 and Level 2 are determined based on the fair value at the beginning of the period for security positions held throughout the period.
There were no transfers of financial assets between Levels 2 and 3 during the period.
The accompanying Notes to Financial Statements are an integral part of this statement.
Annual Report 2016
43
COLUMBIA CAPITAL ALLOCATION PORTFOLIOS
PORTFOLIO OF INVESTMENTS
Columbia Capital Allocation Moderate Portfolio
January 31, 2016
(Percentages represent value of investments compared to net assets)
Equity Funds 43.5%
| | | Shares | | Value ($) | |
INTERNATIONAL 12.0% | |
Columbia Emerging Markets Fund,
Class I Shares(a)(b) | | | 1,528,192 | | | | 13,035,477 | | |
Columbia European Equity Fund,
Class I Shares(a) | | | 10,372,672 | | | | 63,273,298 | | |
Columbia Overseas Value Fund,
Class I Shares(a) | | | 8,386,559 | | | | 64,660,371 | | |
Columbia Pacific/Asia Fund,
Class I Shares(a) | | | 4,458,755 | | | | 39,147,871 | | |
Total | | | | | 180,117,017 | | |
U.S. LARGE CAP 29.6% | |
Columbia Contrarian Core Fund,
Class I Shares(a) | | | 3,863,495 | | | | 77,347,175 | | |
Columbia Disciplined Core Fund,
Class I Shares(a) | | | 6,793,919 | | | | 61,349,086 | | |
Columbia Disciplined Growth Fund,
Class I Shares(a) | | | 8,129,492 | | | | 63,247,449 | | |
Columbia Disciplined Value Fund,
Class I Shares(a) | | | 11,370,206 | | | | 93,121,987 | | |
Columbia Large Cap Growth Fund,
Class I Shares(a)(b) | | | 674,233 | | | | 21,191,149 | | |
Columbia Select Large Cap
Equity Fund, Class I Shares(a) | | | 5,657,911 | | | | 61,105,436 | | |
Columbia Select Large Cap
Growth Fund, Class I Shares(a)(b) | | | 2,512,162 | | | | 36,928,788 | | |
Columbia Select Large-Cap Value Fund,
Class I Shares(a) | | | 1,602,773 | | | | 31,606,686 | | |
Total | | | | | 445,897,756 | | |
U.S. SMALL CAP 1.9% | |
Columbia Select Smaller-Cap
Value Fund, Class I Shares(a)(b) | | | 272,768 | | | | 4,776,162 | | |
Columbia Small Cap Core Fund,
Class I Shares(a) | | | 1,821,075 | | | | 20,068,247 | | |
Columbia Small Cap Growth Fund I,
Class I Shares(a)(b) | | | 296,947 | | | | 4,575,954 | | |
Total | | | | | 29,420,363 | | |
Total Equity Funds
(Cost: $662,153,037) | | | | | 655,435,136 | | |
Fixed-Income Funds 45.8%
EMERGING MARKETS 1.8% | |
Columbia Emerging Markets Bond Fund,
Class I Shares(a) | | | 2,695,962 | | | | 27,202,257 | | |
Fixed-Income Funds (continued)
| | | Shares | | Value ($) | |
HIGH YIELD 8.1% | |
Columbia High Yield Bond Fund,
Class I Shares(a) | | | 2,770,111 | | | | 7,534,703 | | |
Columbia Income Opportunities Fund,
Class I Shares(a) | | | 12,420,039 | | | | 113,891,762 | | |
Total | | | | | 121,426,465 | | |
INFLATION PROTECTED SECURITIES 1.0% | |
Columbia Inflation Protected
Securities Fund, Class I Shares(a)(b) | | | 1,785,233 | | | | 15,156,629 | | |
INVESTMENT GRADE 34.9% | |
Columbia Corporate Income Fund,
Class I Shares(a) | | | 13,371,007 | | | | 124,617,788 | | |
Columbia Intermediate Bond Fund,
Class I Shares(a) | | | 21,757,049 | | | | 195,595,873 | | |
Columbia Limited Duration Credit Fund,
Class I Shares(a) | | | 3,633,330 | | | | 33,608,303 | | |
Columbia Mortgage Opportunities Fund,
Class I Shares(a) | | | 2,698,992 | | | | 25,586,441 | | |
Columbia U.S. Government
Mortgage Fund, Class I Shares(a) | | | 18,285,464 | | | | 99,655,779 | | |
Columbia U.S. Treasury Index Fund,
Class I Shares(a) | | | 4,201,587 | | | | 47,393,896 | | |
Total | | | | | 526,458,080 | | |
Total Fixed-Income Funds
(Cost: $725,683,634) | | | | | 690,243,431 | | |
Alternative Investment Funds 4.5%
Columbia Absolute Return Currency
and Income Fund, Class I Shares(a) | | | 846,712 | | | | 9,136,023 | | |
Columbia Adaptive Alternatives Fund,
Class I Shares(a) | | | 455,212 | | | | 4,269,887 | | |
Columbia Diversified Absolute
Return Fund, Class I Shares(a) | | | 3,161,367 | | | | 30,254,277 | | |
Columbia Multi-Asset Income Fund,
Class I Shares(a) | | | 2,687,995 | | | | 24,057,558 | | |
Total Alternative Investment Funds
(Cost: $71,516,156) | | | | | 67,717,745 | | |
Common Stocks 1.7%
Issuer | | Shares | | Value ($) | |
CONSUMER DISCRETIONARY 0.2% | |
Auto Components —% | |
Cie Generale des Etablissements Michelin | | | 870 | | | | 79,373 | | |
Cooper Tire & Rubber Co. | | | 4,360 | | | | 158,966 | | |
The accompanying Notes to Financial Statements are an integral part of this statement.
Annual Report 2016
44
COLUMBIA CAPITAL ALLOCATION PORTFOLIOS
PORTFOLIO OF INVESTMENTS (continued)
Columbia Capital Allocation Moderate Portfolio
January 31, 2016
Common Stocks (continued)
Issuer | | Shares | | Value ($) | |
Dana Holding Corp. | | | 5,850 | | | | 69,556 | | |
Magna International, Inc. | | | 2,700 | | | | 93,803 | | |
Total | | | | | 401,698 | | |
Automobiles —% | |
Fuji Heavy Industries Ltd. | | | 3,600 | | | | 147,322 | | |
Peugeot SA(b) | | | 8,618 | | | | 128,148 | | |
Renault SA | | | 241 | | | | 20,450 | | |
Total | | | | | 295,920 | | |
Diversified Consumer Services —% | |
Capella Education Co. | | | 900 | | | | 39,519 | | |
New Oriental Education & Technology
Group, Inc., ADR | | | 1,100 | | | | 34,551 | | |
Total | | | | | 74,070 | | |
Hotels, Restaurants & Leisure 0.1% | |
Cracker Barrel Old Country Store, Inc. | | | 1,240 | | | | 162,725 | | |
Denny's Corp.(b) | | | 11,710 | | | | 109,722 | | |
Flight Centre Travel Group Ltd. | | | 4,841 | | | | 135,288 | | |
Isle of Capri Casinos, Inc.(b) | | | 3,100 | | | | 39,246 | | |
Jack in the Box, Inc. | | | 2,145 | | | | 166,538 | | |
Marriott Vacations Worldwide Corp. | | | 2,200 | | | | 108,658 | | |
Papa John's International, Inc. | | | 100 | | | | 4,775 | | |
Ruth's Hospitality Group, Inc. | | | 3,200 | | | | 52,000 | | |
Total | | | | | 778,952 | | |
Household Durables —% | |
Helen of Troy Ltd.(b) | | | 1,530 | | | | 136,736 | | |
Iida Group Holdings Co., Ltd. | | | 4,500 | | | | 80,221 | | |
Persimmon PLC | | | 4,541 | | | | 132,503 | | |
Zagg, Inc.(b) | | | 2,000 | | | | 18,440 | | |
Total | | | | | 367,900 | | |
Internet & Catalog Retail —% | |
PetMed Express, Inc. | | | 4,520 | | | | 81,450 | | |
Leisure Products —% | |
Sturm Ruger & Co., Inc. | | | 2,520 | | | | 148,302 | | |
Media —% | |
Gray Television, Inc.(b) | | | 3,500 | | | | 46,025 | | |
Nexstar Broadcasting Group, Inc.,
Class A | | | 2,690 | | | | 121,615 | | |
Total | | | | | 167,640 | | |
Multiline Retail —% | |
Marks & Spencer Group PLC | | | 16,335 | | | | 99,185 | | |
Common Stocks (continued)
Issuer | | Shares | | Value ($) | |
Specialty Retail 0.1% | |
American Eagle Outfitters, Inc. | | | 4,150 | | | | 60,756 | | |
Cato Corp. (The), Class A | | | 3,320 | | | | 133,896 | | |
Children's Place, Inc. (The) | | | 2,220 | | | | 144,522 | | |
Guess?, Inc. | | | 2,800 | | | | 51,912 | | |
Outerwall, Inc. | | | 3,735 | | | | 126,243 | | |
Total | | | | | 517,329 | | |
Textiles, Apparel & Luxury Goods —% | |
Movado Group, Inc. | | | 4,800 | | | | 123,360 | | |
Oxford Industries, Inc. | | | 2,350 | | | | 164,171 | | |
Wolverine World Wide, Inc. | | | 8,000 | | | | 135,280 | | |
Total | | | | | 422,811 | | |
Total Consumer Discretionary | | | | | 3,355,257 | | |
CONSUMER STAPLES 0.1% | |
Beverages —% | |
Ambev SA | | | 27,000 | | | | 125,961 | | |
Food & Staples Retailing —% | |
Alimentation Couche-Tard, Inc., Class B | | | 2,300 | | | | 100,117 | | |
Ingles Markets, Inc., Class A | | | 585 | | | | 22,441 | | |
Koninklijke Ahold NV | | | 6,643 | | | | 150,262 | | |
SUPERVALU, Inc.(b) | | | 8,460 | | | | 38,493 | | |
Wal-Mart de Mexico SAB de CV, Class V | | | 52,642 | | | | 132,144 | | |
Total | | | | | 443,457 | | |
Food Products 0.1% | |
Cal-Maine Foods, Inc. | | | 3,025 | | | | 152,672 | | |
Dean Foods Co. | | | 8,150 | | | | 162,837 | | |
JBS SA | | | 9,600 | | | | 25,921 | | |
Sanderson Farms, Inc. | | | 1,975 | | | | 160,410 | | |
WH Group Ltd.(b) | | | 94,000 | | | | 53,826 | | |
Total | | | | | 555,666 | | |
Household Products —% | |
Reckitt Benckiser Group PLC | | | 722 | | | | 64,216 | | |
Svenska Cellulosa AB, Class B | | | 2,525 | | | | 74,835 | | |
Total | | | | | 139,051 | | |
Personal Products —% | |
Usana Health Sciences, Inc.(b) | | | 915 | | | | 116,113 | | |
Tobacco —% | |
Japan Tobacco, Inc. | | | 3,400 | | | | 133,157 | | |
Universal Corp. | | | 910 | | | | 49,804 | | |
Total | | | | | 182,961 | | |
Total Consumer Staples | | | | | 1,563,209 | | |
The accompanying Notes to Financial Statements are an integral part of this statement.
Annual Report 2016
45
COLUMBIA CAPITAL ALLOCATION PORTFOLIOS
PORTFOLIO OF INVESTMENTS (continued)
Columbia Capital Allocation Moderate Portfolio
January 31, 2016
Common Stocks (continued)
Issuer | | Shares | | Value ($) | |
ENERGY 0.1% | |
Energy Equipment & Services —% | |
Oil States International, Inc.(b) | | | 2,960 | | | | 83,561 | | |
Oil, Gas & Consumable Fuels 0.1% | |
Alon USA Energy, Inc. | | | 4,400 | | | | 55,352 | | |
MOL Hungarian Oil and Gas NyRt | | | 400 | | | | 19,449 | | |
OMV AG | | | 1,760 | | | | 45,303 | | |
PDC Energy, Inc.(b) | | | 3,070 | | | | 174,591 | | |
Polski Koncern Naftowy Orlen SA | | | 2,723 | | | | 41,760 | | |
REX American Resources Corp.(b) | | | 2,735 | | | | 146,131 | | |
Royal Dutch Shell PLC, Class B | | | 6,843 | | | | 149,095 | | |
S-Oil Corp. | | | 2,070 | | | | 136,282 | | |
SK Innovation Co., Ltd.(b) | | | 867 | | | | 95,815 | | |
Western Refining, Inc. | | | 1,750 | | | | 57,575 | | |
Total | | | | | 921,353 | | |
Total Energy | | | | | 1,004,914 | | |
FINANCIALS 0.4% | |
Banks 0.1% | |
Abu Dhabi Commercial Bank PJSC | | | 25,271 | | | | 41,831 | | |
Banc of California, Inc. | | | 7,500 | | | | 113,250 | | |
Banco Latinoamericano de Comercio
Exterior SA, Class E | | | 4,290 | | | | 100,043 | | |
Banco Santander Brasil SA | | | 19,495 | | | | 63,606 | | |
Bank of China Ltd., Class H | | | 307,000 | | | | 120,212 | | |
Bank of Communications Co., Ltd.,
Class H | | | 34,000 | | | | 20,787 | | |
Bank of Montreal | | | 900 | | | | 48,325 | | |
BBCN Bancorp, Inc. | | | 4,800 | | | | 72,960 | | |
Canadian Imperial Bank of Commerce | | | 1,900 | | | | 123,746 | | |
Central Pacific Financial Corp. | | | 6,790 | | | | 142,250 | | |
China Merchants Bank Co., Ltd., Class H | | | 19,000 | | | | 36,934 | | |
Credit Agricole SA | | | 10,792 | | | | 107,694 | | |
Customers Bancorp, Inc.(b) | | | 4,605 | | | | 115,586 | | |
Erste Group Bank AG(b) | | | 1,481 | | | | 42,781 | | |
First BanCorp(b) | | | 15,775 | | | | 41,015 | | |
First NBC Bank Holding Co.(b) | | | 3,970 | | | | 124,618 | | |
Hilltop Holdings, Inc.(b) | | | 1,275 | | | | 20,362 | | |
HSBC Holdings PLC | | | 25,277 | | | | 178,267 | | |
International Bancshares Corp. | | | 4,740 | | | | 109,921 | | |
KBC Groep NV | | | 130 | | | | 7,450 | | |
Common Stocks (continued)
Issuer | | Shares | | Value ($) | |
Mitsubishi UFJ Financial Group, Inc. | | | 15,000 | | | | 76,918 | | |
Nordea Bank AB | | | 9,226 | | | | 92,903 | | |
Opus Bank | | | 600 | | | | 19,794 | | |
Societe Generale SA | | | 412 | | | | 15,717 | | |
Sumitomo Mitsui Financial Group, Inc. | | | 3,600 | | | | 120,775 | | |
Woori Finance Holdings Co., Ltd. | | | 7,669 | | | | 56,685 | | |
Total | | | | | 2,014,430 | | |
Capital Markets —% | |
| 3i Group PLC | | | 1,618 | | | | 10,259 | | |
Arlington Asset Investment Corp.,
Class A | | | 9,380 | | | | 104,118 | | |
Cowen Group, Inc., Class A(b) | | | 16,700 | | | | 47,762 | | |
KCG Holdings, Inc., Class A(b) | | | 4,950 | | | | 50,589 | | |
Total | | | | | 212,728 | | |
Consumer Finance —% | |
Cash America International, Inc. | | | 4,750 | | | | 142,215 | | |
Nelnet, Inc., Class A | | | 3,650 | | | | 118,515 | | |
Total | | | | | 260,730 | | |
Diversified Financial Services —% | |
EXOR SpA | | | 2,832 | | | | 92,321 | | |
Insurance 0.1% | |
Ageas | | | 2,708 | | | | 109,974 | | |
Allianz SE, Registered Shares | | | 985 | | | | 159,409 | | |
American Equity Investment Life
Holding Co. | | | 3,794 | | | | 69,013 | | |
Employers Holdings, Inc. | | | 1,815 | | | | 45,212 | | |
HCI Group, Inc. | | | 1,150 | | | | 38,238 | | |
Heritage Insurance Holdings, Inc. | | | 7,060 | | | | 139,929 | | |
Maiden Holdings Ltd. | | | 9,880 | | | | 126,464 | | |
Muenchener Rueckversicherungs-
Gesellschaft AG in Muenchen,
Registered Shares | | | 653 | | | | 125,814 | | |
Power Corp. of Canada | | | 5,600 | | | | 118,764 | | |
Swiss Re AG | | | 1,543 | | | | 143,632 | | |
Universal Insurance Holdings, Inc. | | | 6,872 | | | | 128,781 | | |
Total | | | | | 1,205,230 | | |
Real Estate Investment Trusts (REITs) 0.1% | |
AG Mortgage Investment Trust, Inc. | | | 2,100 | | | | 24,633 | | |
American Assets Trust, Inc. | | | 1,500 | | | | 56,085 | | |
Apollo Residential Mortgage, Inc. | | | 3,800 | | | | 41,230 | | |
Coresite Realty Corp. | | | 2,495 | | | | 160,029 | | |
The accompanying Notes to Financial Statements are an integral part of this statement.
Annual Report 2016
46
COLUMBIA CAPITAL ALLOCATION PORTFOLIOS
PORTFOLIO OF INVESTMENTS (continued)
Columbia Capital Allocation Moderate Portfolio
January 31, 2016
Common Stocks (continued)
Issuer | | Shares | | Value ($) | |
Cousins Properties, Inc. | | | 3,100 | | | | 26,722 | | |
CubeSmart | | | 6,275 | | | | 196,345 | | |
CyrusOne, Inc. | | | 1,890 | | | | 69,647 | | |
CYS Investments, Inc. | | | 20,600 | | | | 141,934 | | |
DuPont Fabros Technology, Inc. | | | 4,900 | | | | 162,533 | | |
Hersha Hospitality Trust | | | 1,950 | | | | 34,262 | | |
Mack-Cali Realty Corp. | | | 5,850 | | | | 121,621 | | |
Ryman Hospitality Properties, Inc. | | | 3,275 | | | | 153,761 | | |
Sovran Self Storage, Inc. | | | 1,640 | | | | 184,795 | | |
STORE Capital Corp. | | | 5,850 | | | | 145,021 | | |
Summit Hotel Properties, Inc. | | | 11,600 | | | | 117,740 | | |
Sunstone Hotel Investors, Inc. | | | 12,935 | | | | 153,666 | | |
Total | | | | | 1,790,024 | | |
Real Estate Management & Development —% | |
Wheelock & Co., Ltd. | | | 6,000 | | | | 22,971 | | |
Thrifts & Mortgage Finance 0.1% | |
BofI Holding, Inc.(b) | | | 4,100 | | | | 70,356 | | |
Flagstar Bancorp, Inc.(b) | | | 4,400 | | | | 82,060 | | |
HomeStreet, Inc.(b) | | | 3,880 | | | | 79,462 | | |
MGIC Investment Corp.(b) | | | 21,300 | | | | 141,006 | | |
Radian Group, Inc. | | | 11,910 | | | | 119,815 | | |
Walker & Dunlop, Inc.(b) | | | 5,400 | | | | 129,384 | | |
Washington Federal, Inc. | | | 6,675 | | | | 142,511 | | |
Total | | | | | 764,594 | | |
Total Financials | | | | | 6,363,028 | | |
HEALTH CARE 0.2% | |
Biotechnology 0.1% | |
ACADIA Pharmaceuticals, Inc.(b) | | | 1,580 | | | | 32,690 | | |
Acorda Therapeutics, Inc.(b) | | | 1,795 | | | | 66,092 | | |
Alder Biopharmaceuticals, Inc.(b) | | | 1,770 | | | | 42,799 | | |
AMAG Pharmaceuticals, Inc.(b) | | | 2,020 | | | | 46,278 | | |
Anacor Pharmaceuticals, Inc.(b) | | | 1,170 | | | | 87,902 | | |
ARIAD Pharmaceuticals, Inc.(b) | | | 5,540 | | | | 27,811 | | |
Arrowhead Research Corp.(b) | | | 9,700 | | | | 33,756 | | |
Curis, Inc.(b) | | | 11,352 | | | | 18,617 | | |
Dynavax Technologies Corp.(b) | | | 3,445 | | | | 82,990 | | |
Infinity Pharmaceuticals, Inc.(b) | | | 7,155 | | | | 44,433 | | |
Insmed, Inc.(b) | | | 1,920 | | | | 25,344 | | |
Insys Therapeutics, Inc.(b) | | | 2,230 | | | | 38,690 | | |
Common Stocks (continued)
Issuer | | Shares | | Value ($) | |
Keryx Biopharmaceuticals, Inc.(b) | | | 12,905 | | | | 45,555 | | |
Neurocrine Biosciences, Inc.(b) | | | 1,550 | | | | 65,952 | | |
Novavax, Inc.(b) | | | 13,325 | | | | 68,624 | | |
Portola Pharmaceuticals, Inc.(b) | | | 525 | | | | 17,341 | | |
Spark Therapeutics, Inc.(b) | | | 2,225 | | | | 62,678 | | |
TESARO, Inc.(b) | | | 445 | | | | 15,370 | | |
Ultragenyx Pharmaceutical, Inc.(b) | | | 980 | | | | 55,027 | | |
vTv Therapeutics, Inc., Class A(b) | | | 3,552 | | | | 25,752 | | |
Total | | | | | 903,701 | | |
Health Care Equipment & Supplies —% | |
Analogic Corp. | | | 1,710 | | | | 126,660 | | |
LivaNova PLC(b) | | | 2,810 | | | | 157,304 | | |
Merit Medical Systems, Inc.(b) | | | 8,475 | | | | 140,261 | | |
Orthofix International NV(b) | | | 3,400 | | | | 134,198 | | |
Total | | | | | 558,423 | | |
Health Care Providers & Services 0.1% | |
Alfresa Holdings Corp. | | | 2,900 | | | | 54,030 | | |
Chemed Corp. | | | 120 | | | | 16,838 | | |
LHC Group, Inc.(b) | | | 1,050 | | | | 39,816 | | |
Magellan Health, Inc.(b) | | | 2,465 | | | | 140,505 | | |
Medipal Holdings Corp. | | | 6,600 | | | | 107,050 | | |
Molina Healthcare, Inc.(b) | | | 2,730 | | | | 149,904 | | |
Owens & Minor, Inc. | | | 575 | | | | 19,924 | | |
PharMerica Corp.(b) | | | 1,850 | | | | 54,927 | | |
Triple-S Management Corp., Class B(b) | | | 5,035 | | | | 112,230 | | |
WellCare Health Plans, Inc.(b) | | | 770 | | | | 58,505 | | |
Total | | | | | 753,729 | | |
Life Sciences Tools & Services —% | |
Affymetrix, Inc.(b) | | | 1,825 | | | | 25,605 | | |
Cambrex Corp.(b) | | | 3,260 | | | | 112,926 | | |
INC Research Holdings, Inc. Class A(b) | | | 3,006 | | | | 126,643 | | |
PAREXEL International Corp.(b) | | | 1,000 | | | | 63,960 | | |
Total | | | | | 329,134 | | |
Pharmaceuticals —% | |
GlaxoSmithKline PLC | | | 1,379 | | | | 28,408 | | |
Novo Nordisk A/S, Class B | | | 2,211 | | | | 123,525 | | |
Pernix Therapeutics Holdings, Inc.(b) | | | 8,600 | | | | 18,748 | | |
Roche Holding AG, Genusschein Shares | | | 786 | | | | 203,593 | | |
Sanofi | | | 1,564 | | | | 130,063 | | |
The accompanying Notes to Financial Statements are an integral part of this statement.
Annual Report 2016
47
COLUMBIA CAPITAL ALLOCATION PORTFOLIOS
PORTFOLIO OF INVESTMENTS (continued)
Columbia Capital Allocation Moderate Portfolio
January 31, 2016
Common Stocks (continued)
Issuer | | Shares | | Value ($) | |
Sucampo Pharmaceuticals, Inc.,
Class A(b) | | | 8,300 | | | | 104,995 | | |
Teva Pharmaceutical Industries Ltd. | | | 1,902 | | | | 116,873 | | |
Total | | | | | 726,205 | | |
Total Health Care | | | | | 3,271,192 | | |
INDUSTRIALS 0.2% | |
Aerospace & Defense —% | |
Cubic Corp. | | | 1,175 | | | | 46,953 | | |
Moog, Inc., Class A(b) | | | 2,690 | | | | 124,628 | | |
Total | | | | | 171,581 | | |
Air Freight & Logistics —% | |
Air Transport Services Group, Inc.(b) | | | 9,295 | | | | 90,440 | | |
Royal Mail PLC | | | 18,749 | | | | 123,263 | | |
Total | | | | | 213,703 | | |
Airlines —% | |
Hawaiian Holdings, Inc.(b) | | | 2,265 | | | | 79,750 | | |
Japan Airlines Co., Ltd. | | | 3,200 | | | | 120,107 | | |
Total | | | | | 199,857 | | |
Building Products —% | |
Continental Building Product(b) | | | 7,810 | | | | 116,681 | | |
Commercial Services & Supplies —% | |
Deluxe Corp. | | | 3,070 | | | | 171,613 | | |
Interface, Inc. | | | 1,900 | | | | 32,091 | | |
Quad/Graphics, Inc. | | | 10,100 | | | | 101,808 | | |
West Corp. | | | 1,900 | | | | 34,409 | | |
Total | | | | | 339,921 | | |
Construction & Engineering —% | |
EMCOR Group, Inc. | | | 3,575 | | | | 163,377 | | |
Leighton Holdings Ltd. | | | 6,556 | | | | 113,073 | | |
VINCI SA | | | 2,130 | | | | 144,302 | | |
Total | | | | | 420,752 | | |
Electrical Equipment 0.1% | |
EnerSys | | | 2,600 | | | | 125,918 | | |
General Cable Corp. | | | 9,950 | | | | 116,614 | | |
OSRAM Licht AG | | | 1,246 | | | | 55,630 | | |
Prysmian SpA | | | 2,402 | | | | 49,421 | | |
Vestas Wind Systems A/S | | | 2,260 | | | | 147,882 | | |
Total | | | | | 495,465 | | |
Common Stocks (continued)
Issuer | | Shares | | Value ($) | |
Machinery 0.1% | |
Barnes Group, Inc. | | | 800 | | | | 26,008 | | |
Global Brass & Copper Holdings, Inc. | | | 3,200 | | | | 66,272 | | |
Kadant, Inc. | | | 2,380 | | | | 92,368 | | |
Mueller Industries, Inc. | | | 4,825 | | | | 122,796 | | |
PT United Tractors Tbk | | | 106,500 | | | | 136,114 | | |
Wabash National Corp.(b) | | | 13,600 | | | | 150,416 | | |
Total | | | | | 593,974 | | |
Marine —% | |
Kuehne & Nagel International AG | | | 204 | | | | 26,999 | | |
Matson, Inc. | | | 3,790 | | | | 153,154 | | |
Total | | | | | 180,153 | | |
Professional Services —% | |
Insperity, Inc. | | | 175 | | | | 7,863 | | |
RPX Corp.(b) | | | 11,260 | | | | 130,391 | | |
Total | | | | | 138,254 | | |
Road & Rail —% | |
ArcBest Corp. | | | 3,770 | | | | 77,398 | | |
Trading Companies & Distributors —% | |
Applied Industrial Technologies, Inc. | | | 1,800 | | | | 69,192 | | |
MRC Global, Inc.(b) | | | 6,300 | | | | 63,315 | | |
Total | | | | | 132,507 | | |
Total Industrials | | | | | 3,080,246 | | |
INFORMATION TECHNOLOGY 0.3% | |
Communications Equipment —% | |
NETGEAR, Inc.(b) | | | 3,750 | | | | 140,137 | | |
Plantronics, Inc. | | | 450 | | | | 20,174 | | |
Polycom, Inc.(b) | | | 8,600 | | | | 87,634 | | |
Total | | | | | 247,945 | | |
Electronic Equipment, Instruments & Components 0.1% | |
Benchmark Electronics, Inc.(b) | | | 5,750 | | | | 120,750 | | |
Checkpoint Systems, Inc. | | | 5,985 | | | | 38,783 | | |
Chimei Innolux Corp. | | | 413,000 | | | | 118,039 | | |
Coherent, Inc.(b) | | | 360 | | | | 27,817 | | |
Delta Electronics Thailand PCL(b) | | | 4,400 | | | | 9,833 | | |
Hon Hai Precision Industry Co., Ltd. | | | 56,000 | | | | 131,746 | | |
Insight Enterprises, Inc.(b) | | | 2,210 | | | | 52,222 | | |
MTS Systems Corp. | | | 400 | | | | 21,360 | | |
SYNNEX Corp. | | | 1,800 | | | | 151,110 | | |
Tech Data Corp.(b) | | | 2,500 | | | | 156,000 | | |
Total | | | | | 827,660 | | |
The accompanying Notes to Financial Statements are an integral part of this statement.
Annual Report 2016
48
COLUMBIA CAPITAL ALLOCATION PORTFOLIOS
PORTFOLIO OF INVESTMENTS (continued)
Columbia Capital Allocation Moderate Portfolio
January 31, 2016
Common Stocks (continued)
Issuer | | Shares | | Value ($) | |
Internet Software & Services 0.1% | |
DHI Group, Inc.(b) | | | 10,020 | | | | 93,286 | | |
EarthLink Holdings Corp. | | | 18,850 | | | | 111,592 | | |
j2 Global, Inc. | | | 1,310 | | | | 94,988 | | |
LogMeIn, Inc.(b) | | | 2,680 | | | | 140,003 | | |
NetEase, Inc., ADR | | | 700 | | | | 109,298 | | |
RetailMeNot, Inc.(b) | | | 15,290 | | | | 139,139 | | |
Web.com Group, Inc.(b) | | | 7,025 | | | | 132,281 | | |
Total | | | | | 820,587 | | |
IT Services 0.1% | |
CGI Group, Inc., Class A(b) | | | 2,400 | | | | 102,860 | | |
Convergys Corp. | | | 574 | | | | 14,028 | | |
CSG Systems International, Inc. | | | 2,000 | | | | 69,880 | | |
EVERTEC, Inc. | | | 8,085 | | | | 111,088 | | |
NeuStar, Inc., Class A(b) | | | 6,430 | | | | 158,049 | | |
Sykes Enterprises, Inc.(b) | | | 4,325 | | | | 127,328 | | |
Syntel, Inc.(b) | | | 450 | | | | 21,303 | | |
Total | | | | | 604,536 | | |
Semiconductors & Semiconductor Equipment —% | |
Amkor Technology, Inc.(b) | | | 23,170 | | | | 142,264 | | |
Cabot Microelectronics Corp.(b) | | | 1,475 | | | | 59,944 | | |
Cirrus Logic, Inc.(b) | | | 725 | | | | 25,172 | | |
Diodes, Inc.(b) | | | 6,050 | | | | 115,737 | | |
Entegris, Inc.(b) | | | 1,600 | | | | 18,656 | | |
Silicon Laboratories, Inc.(b) | | | 775 | | | | 35,340 | | |
Taiwan Semiconductor
Manufacturing Co., Ltd. | | | 16,000 | | | | 68,895 | | |
Veeco Instruments, Inc.(b) | | | 1,300 | | | | 24,232 | | |
Xcerra Corp.(b) | | | 12,280 | | | | 67,294 | | |
Total | | | | | 557,534 | | |
Software —% | |
Aspen Technology, Inc.(b) | | | 4,670 | | | | 151,495 | | |
AVG Technologies NV(b) | | | 6,540 | | | | 123,410 | | |
Check Point Software Technologies Ltd.(b) | | | 100 | | | | 7,881 | | |
Gigamon, Inc.(b) | | | 3,200 | | | | 83,680 | | |
Progress Software Corp.(b) | | | 2,000 | | | | 51,780 | | |
RealPage, Inc.(b) | | | 3,650 | | | | 70,408 | | |
VASCO Data Security International, Inc.(b) | | | 3,550 | | | | 55,025 | | |
Total | | | | | 543,679 | | |
Common Stocks (continued)
Issuer | | Shares | | Value ($) | |
Technology Hardware, Storage & Peripherals —% | |
Asustek Computer, Inc. | | | 2,000 | | | | 16,214 | | |
Foxconn Technology Co., Ltd. | | | 3,000 | | | | 5,812 | | |
FUJIFILM Holdings Corp. | | | 1,700 | | | | 65,684 | | |
Total | | | | | 87,710 | | |
Total Information Technology | | | | | 3,689,651 | | |
MATERIALS 0.1% | |
Chemicals 0.1% | |
Chemtura Corp.(b) | | | 5,850 | | | | 153,504 | | |
Innophos Holdings, Inc. | | | 1,425 | | | | 38,062 | | |
Innospec, Inc. | | | 2,985 | | | | 148,802 | | |
Mitsubishi Chemical Holdings Corp. | | | 19,600 | | | | 109,314 | | |
Total | | | | | 449,682 | | |
Construction Materials —% | |
US Concrete, Inc.(b) | | | 1,500 | | | | 68,220 | | |
Metals & Mining —% | |
Commercial Metals Co. | | | 4,617 | | | | 64,269 | | |
Eregli Demir ve Celik Fabrikalari TAS | | | 71,156 | | | | 74,694 | | |
Materion Corp. | | | 4,090 | | | | 100,164 | | |
Rio Tinto PLC | | | 4,946 | | | | 121,285 | | |
Severstal PAO | | | 6,664 | | | | 54,938 | | |
Total | | | | | 415,350 | | |
Paper & Forest Products —% | |
Stora Enso OYJ, Class R | | | 917 | | | | 7,473 | | |
UPM-Kymmene OYJ | | | 7,287 | | | | 118,755 | | |
Total | | | | | 126,228 | | |
Total Materials | | | | | 1,059,480 | | |
TELECOMMUNICATION SERVICES —% | |
Diversified Telecommunication Services —% | |
China Telecom Corp., Ltd., Class H | | | 126,000 | | | | 59,264 | | |
General Communication, Inc., Class A(b) | | | 6,310 | | | | 114,337 | | |
Nippon Telegraph & Telephone Corp. | | | 3,700 | | | | 157,519 | | |
Telstra Corp., Ltd. | | | 2,464 | | | | 9,928 | | |
Turk Telekomunikasyon AS | | | 14,359 | | | | 26,303 | | |
Total | | | | | 367,351 | | |
Wireless Telecommunication Services —% | |
China Mobile Ltd. | | | 12,500 | | | | 137,302 | | |
Shenandoah Telecommunications Co. | | | 3,400 | | | | 78,132 | | |
Total | | | | | 215,434 | | |
Total Telecommunication Services | | | | | 582,785 | | |
The accompanying Notes to Financial Statements are an integral part of this statement.
Annual Report 2016
49
COLUMBIA CAPITAL ALLOCATION PORTFOLIOS
PORTFOLIO OF INVESTMENTS (continued)
Columbia Capital Allocation Moderate Portfolio
January 31, 2016
Common Stocks (continued)
Issuer | | Shares | | Value ($) | |
UTILITIES 0.1% | |
Electric Utilities —% | |
Chubu Electric Power Co., Inc. | | | 700 | | | | 8,990 | | |
Endesa SA | | | 3,209 | | | | 62,124 | | |
IDACORP, Inc. | | | 2,010 | | | | 139,876 | | |
Korea Electric Power Corp.(b) | | | 2,975 | | | | 130,597 | | |
Tokyo Electric Power Co., Inc.(b) | | | 2,400 | | | | 12,060 | | |
Transmissora Alianca de Energia
Eletrica SA | | | 8,000 | | | | 34,782 | | |
Total | | | | | 388,429 | | |
Gas Utilities 0.1% | |
Chesapeake Utilities Corp. | | | 2,000 | | | | 125,940 | | |
New Jersey Resources Corp. | | | 3,815 | | | | 134,364 | | |
Southwest Gas Corp. | | | 2,750 | | | | 161,783 | | |
WGL Holdings, Inc. | | | 530 | | | | 35,399 | | |
Total | | | | | 457,486 | | |
Multi-Utilities —% | |
RWE AG | | | 576 | | | | 8,068 | | |
Common Stocks (continued)
Issuer | | Shares | | Value ($) | |
Water Utilities —% | |
SJW Corp. | | | 2,770 | | | | 90,302 | | |
Total Utilities | | | | | 944,285 | | |
Total Common Stocks
(Cost: $27,872,052) | | | | | 24,914,047 | | |
Money Market Funds 4.3%
| | | Shares | | Value ($) | |
Columbia Short-Term Cash Fund,
0.360%(a)(c) | | | 64,953,566 | | | | 64,953,566 | | |
Total Money Market Funds
(Cost: $64,953,566) | | | | | 64,953,566 | | |
Total Investments
(Cost: $1,552,178,445) | | | | | 1,503,263,925 | | |
Other Assets & Liabilities, Net | | | | | 3,204,361 | | |
Net Assets | | | | | 1,506,468,286 | | |
At January 31, 2016, cash totaling $2,385,877 was pledged as collateral.
Investments in Derivatives
Forward Foreign Currency Exchange Contracts Open at January 31, 2016
Counterparty | | Exchange Date | | Currency to
be Delivered | |
| | Currency to
be Received | |
| | Unrealized
Appreciation ($) | | Unrealized
Depreciation ($) | |
BNP | | 3/3/2016 | | | 490,000 | | | BRL | | | | | 119,010 | | | USD | | | | | — | | | | (2,441 | ) | |
BNP | | 3/3/2016 | | | 163,000 | | | CAD | | | | | 115,691 | | | USD | | | | | — | | | | (662 | ) | |
BNP | | 3/3/2016 | | | 545,000 | | | CNY | | | | | 81,810 | | | USD | | | | | — | | | | (703 | ) | |
BNP | | 3/3/2016 | | | 1,106,000 | | | DKK | | | | | 161,245 | | | USD | | | | | 575 | | | | — | | |
BNP | | 3/3/2016 | | | 567,634,000 | | | IDR | | | | | 40,130 | | | USD | | | | | — | | | | (1,168 | ) | |
BNP | | 3/3/2016 | | | 346,000 | | | ILS | | | | | 88,225 | | | USD | | | | | 806 | | | | — | | |
BNP | | 3/3/2016 | | | 201,573,000 | | | KRW | | | | | 168,497 | | | USD | | | | | 1,839 | | | | — | | |
BNP | | 3/3/2016 | | | 839,000 | | | MXN | | | | | 47,287 | | | USD | | | | | 1,122 | | | | — | | |
BNP | | 3/3/2016 | | | 70,000 | | | PLN | | | | | 17,447 | | | USD | | | | | 299 | | | | — | | |
BNP | | 3/3/2016 | | | 98,000 | | | TRY | | | | | 31,998 | | | USD | | | | | — | | | | (888 | ) | |
BNP | | 3/3/2016 | | | 1,021,000 | | | TWD | | | | | 30,156 | | | USD | | | | | — | | | | (321 | ) | |
BNP | | 3/3/2016 | | | 3,612,000 | | | TWD | | | | | 107,901 | | | USD | | | | | 81 | | | | — | | |
BNP | | 3/3/2016 | | | 134,083 | | | USD | | | | | 192,000 | | | AUD | | | | | 1,617 | | | | — | | |
BNP | | 3/3/2016 | | | 161,266 | | | USD | | | | | 161,000 | | | CHF | | | | | — | | | | (3,918 | ) | |
BNP | | 3/3/2016 | | | 65,377 | | | USD | | | | | 60,000 | | | EUR | | | | | — | | | | (335 | ) | |
The accompanying Notes to Financial Statements are an integral part of this statement.
Annual Report 2016
50
COLUMBIA CAPITAL ALLOCATION PORTFOLIOS
PORTFOLIO OF INVESTMENTS (continued)
Columbia Capital Allocation Moderate Portfolio
January 31, 2016
Forward Foreign Currency Exchange Contracts Open at January 31, 2016 (continued)
Counterparty | | Exchange Date | | Currency to
be Delivered | |
| | Currency to
be Received | |
| | Unrealized
Appreciation ($) | | Unrealized
Depreciation ($) | |
BNP | | 3/3/2016 | | | 207,087 | | | USD | | | | | 142,000 | | | GBP | | | | | — | | | | (4,744 | ) | |
BNP | | 3/3/2016 | | | 144,113 | | | USD | | | | | 9,670,000 | | | INR | | | | | — | | | | (2,335 | ) | |
BNP | | 3/3/2016 | | | 129,727 | | | USD | | | | | 15,278,000 | | | JPY | | | | | — | | | | (3,466 | ) | |
BNP | | 3/3/2016 | | | 31,364 | | | USD | | | | | 138,000 | | | MYR | | | | | 1,960 | | | | — | | |
BNP | | 3/3/2016 | | | 24,082 | | | USD | | | | | 215,000 | | | NOK | | | | | 676 | | | | — | | |
BNP | | 3/3/2016 | | | 22,851 | | | USD | | | | | 1,103,000 | | | PHP | | | | | 162 | | | | — | | |
BNP | | 3/3/2016 | | | 71,693 | | | USD | | | | | 103,000 | | | SGD | | | | | 568 | | | | — | | |
BNP | | 3/3/2016 | | | 22,880 | | | USD | | | | | 818,000 | | | THB | | | | | — | | | | (8 | ) | |
BNP | | 3/3/2016 | | | 109,800 | | | USD | | | | | 1,784,000 | | | ZAR | | | | | 1,888 | | | | — | | |
Total | | | | | | | | | | | | | 11,593 | | | | (20,989 | ) | |
Futures Contracts Outstanding at January 31, 2016
Long Futures Contracts Outstanding
Contract Description | | Number of
Contracts | | Trading
Currency | | Notional
Market
Value ($) | | Expiration
Date | | Unrealized
Appreciation ($) | | Unrealized
Depreciation ($) | |
S&P MID 400 EMINI | | | 91 | | | USD | | | | | 11,964,680 | | | 03/2016 | | | — | | | | (610,378 | ) | |
S&P500 EMINI FUT | | | 69 | | | USD | | | | | 6,658,845 | | | 03/2016 | | | — | | | | (235,287 | ) | |
TOPIX INDX FUTR | | | 39 | | | JPY | | | | | 4,635,609 | | | 03/2016 | | | — | | | | (497,511 | ) | |
US 10YR NOTE (CBT) | | | 387 | | | USD | | | | | 50,146,734 | | | 03/2016 | | | 1,338,686 | | | | — | | |
US LONG BOND(CBT) | | | 74 | | | USD | | | | | 11,916,312 | | | 03/2016 | | | 584,929 | | | | — | | |
US ULTRA BOND CBT | | | 73 | | | USD | | | | | 12,131,688 | | | 03/2016 | | | 654,017 | | | | — | | |
Total | | | | | | | 97,453,868 | | | | | | 2,577,632 | | | | (1,343,176 | ) | |
Notes to Portfolio of Investments
(a) As defined in the Investment Company Act of 1940, an affiliated company is one in which the Fund owns 5% or more of the company's outstanding voting securities, or a company which is under common ownership or control with the Fund. Holdings and transactions in these affiliated companies during the year ended January 31, 2016 are as follows:
Issuer | | Beginning
Cost ($) | | Purchase
Cost ($) | | Proceeds
From
Sales ($) | | Realized
Gain
(Loss) ($) | | Ending
Cost ($) | | Capital Gain
Distributions ($) | | Dividends —
Affiliated
Issuers ($) | | Value ($) | |
Columbia Absolute
Return Currency and
Income Fund, Class I
Shares | | | 8,778,841 | | | | 1,206,954 | | | | (1,672,231 | ) | | | 256,830 | | | | 8,570,394 | | | | 759,891 | | | | 409,643 | | | | 9,136,023 | | |
Columbia Absolute
Return Emerging
Markets Macro Fund,
Class I Shares | | | 29,342,802 | | | | 876 | | | | (27,842,449 | ) | | | (1,501,229 | ) | | | — | | | | — | | | | — | | | | — | | |
Columbia Absolute
Return Enhanced
Multi-Strategy Fund,
Class I Shares | | | 34,940,036 | | | | 2,149,463 | | | | (36,043,723 | ) | | | (1,045,776 | ) | | | — | | | | 2,149,062 | | | | — | | | | — | | |
The accompanying Notes to Financial Statements are an integral part of this statement.
Annual Report 2016
51
COLUMBIA CAPITAL ALLOCATION PORTFOLIOS
PORTFOLIO OF INVESTMENTS (continued)
Columbia Capital Allocation Moderate Portfolio
January 31, 2016
Notes to Portfolio of Investments (continued)
Issuer | | Beginning
Cost ($) | | Purchase
Cost ($) | | Proceeds
From
Sales ($) | | Realized
Gain
(Loss) ($) | | Ending
Cost ($) | | Capital Gain
Distributions ($) | | Dividends —
Affiliated
Issuers ($) | | Value ($) | |
Columbia Adaptive
Alternatives Fund,
Class I Shares | | | — | | | | 4,536,456 | | | | — | | | | — | | | | 4,536,456 | | | | — | | | | 36,456 | | | | 4,269,887 | | |
Columbia Contrarian
Core Fund, Class I
Shares | | | 101,055,637 | | | | 4,749,251 | | | | (54,718,303 | ) | | | 23,285,467 | | | | 74,372,052 | | | | 2,323,245 | | | | 2,356,131 | | | | 77,347,175 | | |
Columbia Corporate
Income Fund, Class I
Shares | | | 135,769,462 | | | | 4,698,686 | | | | (5,549,603 | ) | | | (70,584 | ) | | | 134,847,961 | | | | — | | | | 4,590,247 | | | | 124,617,788 | | |
Columbia Disciplined
Core Fund, Class I
Shares | | | 43,123,754 | | | | 1,129,943 | | | | (6,609,125 | ) | | | 3,565,415 | | | | 41,209,987 | | | | — | | | | 1,094,717 | | | | 61,349,086 | | |
Columbia Disciplined
Growth Fund, Class I
Shares | | | 67,514,448 | | | | 8,387,259 | | | | (10,168,294 | ) | | | 4,032,077 | | | | 69,765,490 | | | | 7,603,510 | | | | 722,811 | | | | 63,247,449 | | |
Columbia Disciplined
Value Fund, Class I
Shares | | | 102,173,027 | | | | 6,704,677 | | | | (5,382,485 | ) | | | 201,124 | | | | 103,696,343 | | | | 4,786,955 | | | | 1,850,469 | | | | 93,121,987 | | |
Columbia Diversified
Absolute Return Fund,
Class I Shares | | | — | | | | 32,590,018 | | | | (965,764 | ) | | | (19,552 | ) | | | 31,604,702 | | | | 193,529 | | | | 119,876 | | | | 30,254,277 | | |
Columbia Emerging
Markets Bond Fund,
Class I Shares | | | 30,325,054 | | | | 996,894 | | | | (1,157,575 | ) | | | (81,078 | ) | | | 30,083,295 | | | | — | | | | 964,272 | | | | 27,202,257 | | |
Columbia Emerging
Markets Fund, Class I
Shares | | | 15,745,379 | | | | 87,125 | | | | (994,978 | ) | | | 72,387 | | | | 14,909,913 | | | | — | | | | — | | | | 13,035,477 | | |
Columbia European
Equity Fund, Class I
Shares | | | 63,955,328 | | | | 3,162,371 | | | | (8,465,196 | ) | | | 2,257,506 | | | | 60,910,009 | | | | 2,012,850 | | | | 1,031,182 | | | | 63,273,298 | | |
Columbia High Yield
Bond Fund, Class I
Shares | | | — | | | | 8,287,473 | | | | (96,787 | ) | | | (2,530 | ) | | | 8,188,156 | | | | — | | | | 357,950 | | | | 7,534,703 | | |
Columbia Income
Opportunities Fund,
Class I Shares | | | 121,156,484 | | | | 6,948,610 | | | | (8,605,444 | ) | | | 1,721,293 | | | | 121,220,943 | | | | 862,136 | | | | 6,003,959 | | | | 113,891,762 | | |
Columbia Inflation
Protected Securities
Fund, Class I Shares | | | 16,435,941 | | | | 2,459,786 | | | | (1,049,761 | ) | | | (118,351 | ) | | | 17,727,615 | | | | — | | | | — | | | | 15,156,629 | | |
Columbia Intermediate
Bond Fund, Class I
Shares | | | 210,817,422 | | | | 7,180,957 | | | | (16,406,266 | ) | | | 736,296 | | | | 202,328,409 | | | | 2,356,305 | | | | 4,698,960 | | | | 195,595,873 | | |
Columbia Large Cap
Growth Fund, Class I
Shares | | | 16,578,363 | | | | 2,225,182 | | | | (4,266,860 | ) | | | 2,416,769 | | | | 16,953,454 | | | | 2,196,604 | | | | — | | | | 21,191,149 | | |
Columbia Limited
Duration Credit Fund,
Class I Shares | | | 38,196,062 | | | | 960,570 | | | | (2,846,556 | ) | | | (91,575 | ) | | | 36,218,501 | | | | — | | | | 931,319 | | | | 33,608,303 | | |
Columbia Mortgage
Opportunities Fund,
Class I Shares | | | — | | | | 29,131,866 | | | | (2,055,377 | ) | | | (30,596 | ) | | | 27,045,893 | | | | 281,347 | | | | 990,968 | | | | 25,586,441 | | |
Columbia Multi-Asset
Income Fund, Class I
Shares | | | — | | | | 26,804,605 | | | | — | | | | — | | | | 26,804,605 | | | | — | | | | 1,198,604 | | | | 24,057,558 | | |
The accompanying Notes to Financial Statements are an integral part of this statement.
Annual Report 2016
52
COLUMBIA CAPITAL ALLOCATION PORTFOLIOS
PORTFOLIO OF INVESTMENTS (continued)
Columbia Capital Allocation Moderate Portfolio
January 31, 2016
Notes to Portfolio of Investments (continued)
Issuer | | Beginning
Cost ($) | | Purchase
Cost ($) | | Proceeds
From
Sales ($) | | Realized
Gain
(Loss) ($) | | Ending
Cost ($) | | Capital Gain
Distributions ($) | | Dividends —
Affiliated
Issuers ($) | | Value ($) | |
Columbia Overseas
Value Fund, Class I
Shares | | | 80,799,010 | | | | 1,777,541 | | | | (8,254,038 | ) | | | (206,155 | ) | | | 74,116,358 | | | | — | | | | 1,701,495 | | | | 64,660,371 | | |
Columbia Pacific/Asia
Fund, Class I Shares | | | 38,103,709 | | | | 626,511 | | | | (4,417,179 | ) | | | 1,198,678 | | | | 35,511,719 | | | | 115,385 | | | | 394,102 | | | | 39,147,871 | | |
Columbia Select Large
Cap Equity Fund,
Class I Shares | | | 29,632,879 | | | | 48,813,059 | | | | (7,146,019 | ) | | | (844,395 | ) | | | 70,455,524 | | | | 4,180,692 | | | | 1,013,595 | | | | 61,105,436 | | |
Columbia Select Large
Cap Growth Fund,
Class I Shares | | | 33,898,738 | | | | 5,696,349 | | | | (6,797,538 | ) | | | 2,415,943 | | | | 35,213,492 | | | | 5,614,580 | | | | — | | | | 36,928,788 | | |
Columbia Select
Large-Cap Value Fund,
Class I Shares | | | 23,380,096 | | | | 1,612,742 | | | | (1,657,701 | ) | | | 739,650 | | | | 24,074,787 | | | | 945,076 | | | | 608,665 | | | | 31,606,686 | | |
Columbia Select
Smaller-Cap Value
Fund, Class I Shares | | | 6,800,652 | | | | 636,808 | | | | (3,332,723 | ) | | | 995,145 | | | | 5,099,882 | | | | 523,745 | | | | — | | | | 4,776,162 | | |
Columbia Short-Term
Cash Fund | | | 177,683,380 | | | | 149,575,529 | | | | (262,305,343 | ) | | | — | | | | 64,953,566 | | | | — | | | | 181,255 | | | | 64,953,566 | | |
Columbia Small Cap
Core Fund, Class I
Shares | | | 22,763,461 | | | | 7,123,667 | | | | (1,699,818 | ) | | | 177,738 | | | | 28,365,048 | | | | 7,014,747 | | | | 38,839 | | | | 20,068,247 | | |
Columbia Small Cap
Growth Fund I, Class I
Shares | | | — | | | | 7,498,977 | | | | — | | | | — | | | | 7,498,977 | | | | 1,917,977 | | | | — | | | | 4,575,954 | | |
Columbia U.S.
Government Mortgage
Fund, Class I Shares | | | 108,950,506 | | | | 3,492,539 | | | | (10,929,126 | ) | | | (87,581 | ) | | | 101,426,338 | | | | 303,881 | | | | 3,148,289 | | | | 99,655,779 | | |
Columbia U.S. Treasury
Index Fund, Class I
Shares | | | — | | | | 46,596,524 | | | | — | | | | — | | | | 46,596,524 | | | | — | | | | 77,524 | | | | 47,393,896 | | |
Total | | | 1,557,920,471 | | | | 427,849,268 | | | | (501,436,262 | ) | | | 39,972,916 | | | | 1,524,306,393 | | | | 46,141,517 | | | | 34,521,328 | | | | 1,478,349,878 | | |
(b) Non-income producing investment.
(c) The rate shown is the seven-day current annualized yield at January 31, 2016.
Abbreviation Legend
ADR American Depositary Receipt
Currency Legend
AUD Australian Dollar
BRL Brazilian Real
CAD Canadian Dollar
CHF Swiss Franc
CNY China, Yuan Renminbi
DKK Danish Krone
EUR Euro
GBP British Pound
The accompanying Notes to Financial Statements are an integral part of this statement.
Annual Report 2016
53
COLUMBIA CAPITAL ALLOCATION PORTFOLIOS
PORTFOLIO OF INVESTMENTS (continued)
Columbia Capital Allocation Moderate Portfolio
January 31, 2016
Currency Legend (continued)
IDR Indonesian Rupiah
ILS Israeli Shekel
INR Indian Rupee
JPY Japanese Yen
KRW Korean Won
MXN Mexican Peso
MYR Malaysia Ringgits
NOK Norwegian Krone
PHP Philippine Peso
PLN Polish Zloty
SGD Singapore Dollar
THB Thailand Baht
TRY Turkish Lira
TWD Taiwan Dollar
USD US Dollar
ZAR South African Rand
Fair Value Measurements
The Fund categorizes its fair value measurements according to a three-level hierarchy that maximizes the use of observable inputs and minimizes the use of unobservable inputs by prioritizing that the most observable input be used when available. Observable inputs are those that market participants would use in pricing an investment based on market data obtained from sources independent of the reporting entity. Unobservable inputs are those that reflect the Fund's assumptions about the information market participants would use in pricing an investment. An investment's level within the fair value hierarchy is based on the lowest level of any input that is deemed significant to the asset's or liability's fair value measurement. The input levels are not necessarily an indication of the risk or liquidity associated with investments at that level. For example, certain U.S. government securities are generally high quality and liquid, however, they are reflected as Level 2 because the inputs used to determine fair value may not always be quoted prices in an active market.
Fair value inputs are summarized in the three broad levels listed below:
> Level 1 — Valuations based on quoted prices for investments in active markets that the Fund has the ability to access at the measurement date (including NAV for open-end mutual funds). Valuation adjustments are not applied to Level 1 investments.
> Level 2 — Valuations based on other significant observable inputs (including quoted prices for similar securities, interest rates, prepayment speeds, credit risks, etc.).
> Level 3 — Valuations based on significant unobservable inputs (including the Fund's own assumptions and judgment in determining the fair value of investments).
Inputs that are used in determining fair value of an investment may include price information, credit data, volatility statistics, and other factors. These inputs can be either observable or unobservable. The availability of observable inputs can vary between investments, and is affected by various factors such as the type of investment, and the volume and level of activity for that investment or similar investments in the marketplace. The inputs will be considered by the Investment Manager, along with any other relevant factors in the calculation of an investment's fair value. The Fund uses prices and inputs that are current as of the measurement date, which may include periods of market dislocations. During these periods, the availability of prices and inputs may be reduced for many investments. This condition could cause an investment to be reclassified between the various levels within the hierarchy.
Foreign equity securities actively traded in markets where there is a significant delay in the local close relative to the New York Stock Exchange (NYSE) are classified as Level 2. The values of these securities may include an adjustment to reflect the impact of significant market movements following the close of local trading, as described in Note 2 of the Notes to Financial Statements in the most recent shareholder report.
Investments falling into the Level 3 category are primarily supported by quoted prices from brokers and dealers participating in the market for those investments. However, these may be classified as Level 3 investments due to lack of market transparency and corroboration to support these quoted prices. Additionally, valuation models may be used as the pricing source for any remaining investments classified as Level 3. These models may rely on one or more significant unobservable inputs and/or significant assumptions by the Investment Manager. Inputs
The accompanying Notes to Financial Statements are an integral part of this statement.
Annual Report 2016
54
COLUMBIA CAPITAL ALLOCATION PORTFOLIOS
PORTFOLIO OF INVESTMENTS (continued)
Columbia Capital Allocation Moderate Portfolio
January 31, 2016
Fair Value Measurements (continued)
used in valuations may include, but are not limited to, financial statement analysis, capital account balances, discount rates and estimated cash flows, and comparable company data.
Under the direction of the Fund's Board of Trustees (the Board), the Investment Manager's Valuation Committee (the Committee) is responsible for overseeing the valuation procedures approved by the Board. The Committee consists of voting and non-voting members from various groups within the Investment Manager's organization, including operations and accounting, trading and investments, compliance, risk management and legal.
The Committee meets at least monthly to review and approve valuation matters, which may include a description of specific valuation determinations, data regarding pricing information received from approved pricing vendors and brokers and the results of Board-approved valuation control policies and procedures (the Policies). The Policies address, among other things, instances when market quotations are or are not readily available, including recommendations of third party pricing vendors and a determination of appropriate pricing methodologies; events that require specific valuation determinations and assessment of fair value techniques; securities with a potential for stale pricing, including those that are illiquid, restricted, or in default; and the effectiveness of third party pricing vendors, including periodic reviews of vendors. The Committee meets more frequently, as needed, to discuss additional valuation matters, which may include the need to review back-testing results, review time-sensitive information or approve related valuation actions. The Committee reports to the Board, with members of the Committee meeting with the Board at each of its regularly scheduled meetings to discuss valuation matters and actions during the period, similar to those described earlier.
For investments categorized as Level 3, the Committee monitors information similar to that described above, which may include: (i) data specific to the issuer or comparable issuers, (ii) general market or specific sector news and (iii) quoted prices and specific or similar security transactions. The Committee considers this data and any changes from prior periods in order to assess the reasonableness of observable and unobservable inputs, any assumptions or internal models used to value those securities and changes in fair value. This data is also used to corroborate, when available, information received from approved pricing vendors and brokers. Various factors impact the frequency of monitoring this information (which may occur as often as daily). However, the Committee may determine that changes to inputs, assumptions and models are not required as a result of the monitoring procedures performed.
The following table is a summary of the inputs used to value the Fund's investments at January 31, 2016:
| | | Level 1
Quoted Prices in Active
Markets for Identical
Assets ($) | | Level 2
Other Significant
Observable Inputs ($) | | Level 3
Significant
Unobservable Inputs ($) | | Total ($) | |
Investments | |
Equity Funds | | | 655,435,136 | | | | — | | | | — | | | | 655,435,136 | | |
Fixed-Income Funds | | | 690,243,431 | | | | — | | | | — | | | | 690,243,431 | | |
Alternative Investment Funds | | | 67,717,745 | | | | — | | | | — | | | | 67,717,745 | | |
Common Stocks | |
Consumer Discretionary | | | 2,532,767 | | | | 822,490 | | | | — | | | | 3,355,257 | | |
Consumer Staples | | | 1,086,913 | | | | 476,296 | | | | — | | | | 1,563,209 | | |
Energy | | | 517,210 | | | | 487,704 | | | | — | | | | 1,004,914 | | |
Financials | | | 4,779,694 | | | | 1,583,334 | | | | — | | | | 6,363,028 | | |
Health Care | | | 2,507,650 | | | | 763,542 | | | | — | | | | 3,271,192 | | |
Industrials | | | 2,163,455 | | | | 916,791 | | | | — | | | | 3,080,246 | | |
Information Technology | | | 3,273,428 | | | | 416,223 | | | | — | | | | 3,689,651 | | |
Materials | | | 573,021 | | | | 486,459 | | | | — | | | | 1,059,480 | | |
Telecommunication Services | | | 192,469 | | | | 390,316 | | | | — | | | | 582,785 | | |
Utilities | | | 722,446 | | | | 221,839 | | | | — | | | | 944,285 | | |
Total Common Stocks | | | 18,349,053 | | | | 6,564,994 | | | | — | | | | 24,914,047 | | |
Money Market Funds | | | — | | | | 64,953,566 | | | | — | | | | 64,953,566 | | |
Total Investments | | | 1,431,745,365 | | | | 71,518,560 | | | | — | | | | 1,503,263,925 | | |
The accompanying Notes to Financial Statements are an integral part of this statement.
Annual Report 2016
55
COLUMBIA CAPITAL ALLOCATION PORTFOLIOS
PORTFOLIO OF INVESTMENTS (continued)
Columbia Capital Allocation Moderate Portfolio
January 31, 2016
Fair Value Measurements (continued)
| | | Level 1
Quoted Prices in Active
Markets for Identical
Assets ($) | | Level 2
Other Significant
Observable Inputs ($) | | Level 3
Significant
Unobservable Inputs ($) | | Total ($) | |
Derivatives | |
Assets | |
Forward Foreign Currency
Exchange Contracts | | | — | | | | 11,593 | | | | — | | | | 11,593 | | |
Futures Contracts | | | 2,577,632 | | | | — | | | | — | | | | 2,577,632 | | |
Liabilities | |
Forward Foreign Currency
Exchange Contracts | | | — | | | | (20,989 | ) | | | — | | | | (20,989 | ) | |
Futures Contracts | | | (1,343,176 | ) | | | — | | | | — | | | | (1,343,176 | ) | |
Total | | | 1,432,979,821 | | | | 71,509,164 | | | | — | | | | 1,504,488,985 | | |
See the Portfolio of Investments for all investment classifications not indicated in the table.
The Fund's assets assigned to the Level 2 input category are generally valued using the market approach, in which a security's value is determined through reference to prices and information from market transactions for similar or identical assets and/or fund per share market values which are not considered publicly available. These assets include certain foreign securities for which a third party statistical pricing service may be employed for purposes of fair market valuation. The model utilized by such third party statistical pricing service takes into account a security's correlation to available market data including, but not limited to, intraday index, ADR, and exchange-traded fund movements.
Derivative instruments are valued at unrealized appreciation (depreciation).
Financial assets were transferred from Level 1 to Level 2 as the market for these assets is not considered publicly available. Fund per share market values were obtained using observable market inputs.
The following table shows transfers between Level 1 and Level 2 of the fair value hierarchy:
Transfers In | | Transfers Out | |
| Level 1 ($) | | Level 2 ($) | | Level 1 ($) | | Level 2 ($) | |
| | — | | | | 177,683,380 | | | | 177,683,380 | | | | — | | |
Transfers between Level 1 and Level 2 are determined based on the fair value at the beginning of the period for security positions held throughout the period.
There were no transfers of financial assets between Levels 2 and 3 during the period.
The accompanying Notes to Financial Statements are an integral part of this statement.
Annual Report 2016
56
COLUMBIA CAPITAL ALLOCATION PORTFOLIOS
PORTFOLIO OF INVESTMENTS
Columbia Capital Allocation Moderate Aggressive Portfolio
January 31, 2016
(Percentages represent value of investments compared to net assets)
Equity Funds 55.7%
| | | Shares | | Value ($) | |
INTERNATIONAL 15.6% | |
Columbia Emerging Markets Fund,
Class I Shares(a)(b) | | | 6,820,687 | | | | 58,180,457 | | |
Columbia European Equity Fund,
Class I Shares(a) | | | 14,773,787 | | | | 90,120,100 | | |
Columbia Overseas Value Fund,
Class I Shares(a) | | | 13,720,887 | | | | 105,788,041 | | |
Columbia Pacific/Asia Fund,
Class I Shares(a) | | | 8,113,224 | | | | 71,234,107 | | |
Total | | | | | 325,322,705 | | |
U.S. LARGE CAP 38.2% | |
Columbia Contrarian Core Fund,
Class I Shares(a) | | | 6,550,052 | | | | 131,132,044 | | |
Columbia Disciplined Core Fund,
Class I Shares(a) | | | 13,599,425 | | | | 122,802,810 | | |
Columbia Disciplined Growth Fund,
Class I Shares(a) | | | 11,052,283 | | | | 85,986,759 | | |
Columbia Disciplined Value Fund,
Class I Shares(a) | | | 20,187,972 | | | | 165,339,489 | | |
Columbia Large Cap Growth Fund,
Class I Shares(a)(b) | | | 2,014,851 | | | | 63,326,764 | | |
Columbia Select Large Cap Equity
Fund, Class I Shares(a) | | | 8,762,886 | | | | 94,639,175 | | |
Columbia Select Large Cap Growth
Fund, Class I Shares(a)(b) | | | 4,922,157 | | | | 72,355,707 | | |
Columbia Select Large-Cap Value
Fund, Class I Shares(a) | | | 3,249,854 | | | | 64,087,113 | | |
Total | | | | | 799,669,861 | | |
U.S. SMALL CAP 1.9% | |
Columbia Multi-Advisor Small Cap
Value Fund, Class I Shares(a) | | | 2,374,784 | | | | 13,085,061 | | |
Columbia Select Smaller-Cap Value
Fund, Class I Shares(a)(b) | | | 416,654 | | | | 7,295,610 | | |
Columbia Small Cap Core Fund,
Class I Shares(a) | | | 936,359 | | | | 10,318,681 | | |
Columbia Small Cap Growth Fund I,
Class I Shares(a)(b) | | | 615,713 | | | | 9,488,131 | | |
Total | | | | | 40,187,483 | | |
Total Equity Funds
(Cost: $1,173,541,399) | | | | | 1,165,180,049 | | |
Fixed-Income Funds 27.6%
| | | Shares | | Value ($) | |
EMERGING MARKETS 1.3% | |
Columbia Emerging Markets Bond
Fund, Class I Shares(a) | | | 2,650,301 | | | | 26,741,538 | | |
HIGH YIELD 8.7% | |
Columbia High Yield Bond Fund,
Class I Shares(a) | | | 22,409,071 | | | | 60,952,673 | | |
Columbia Income Opportunities
Fund, Class I Shares(a) | | | 13,298,788 | | | | 121,949,882 | | |
Total | | | | | 182,902,555 | | |
INFLATION PROTECTED SECURITIES 0.5% | |
Columbia Inflation Protected
Securities Fund, Class I Shares(a)(b) | | | 1,221,538 | | | | 10,370,861 | | |
INVESTMENT GRADE 17.1% | |
Columbia Corporate Income Fund,
Class I Shares(a) | | | 17,929,057 | | | | 167,098,813 | | |
Columbia Mortgage Opportunities
Fund, Class I Shares(a) | | | 1,981,065 | | | | 18,780,494 | | |
Columbia U.S. Government
Mortgage Fund, Class I Shares(a) | | | 28,038,937 | | | | 152,812,208 | | |
Columbia U.S. Treasury Index Fund,
Class I Shares(a) | | | 1,637,558 | | | | 18,471,652 | | |
Total | | | | | 357,163,167 | | |
Total Fixed-Income Funds
(Cost: $611,376,992) | | | | | 577,178,121 | | |
Alternative Investment Funds 4.2%
Columbia Absolute Return Currency
and Income Fund, Class I Shares(a) | | | 1,180,421 | | | | 12,736,745 | | |
Columbia Adaptive Alternatives
Fund, Class I Shares(a) | | | 455,212 | | | | 4,269,887 | | |
Columbia Diversified Absolute
Return Fund, Class I Shares(a) | | | 3,841,332 | | | | 36,761,547 | | |
Columbia Multi-Asset Income Fund,
Class I Shares(a) | | | 3,771,025 | | | | 33,750,671 | | |
Total Alternative Investment Funds
(Cost: $92,570,109) | | | | | 87,518,850 | | |
The accompanying Notes to Financial Statements are an integral part of this statement.
Annual Report 2016
57
COLUMBIA CAPITAL ALLOCATION PORTFOLIOS
PORTFOLIO OF INVESTMENTS (continued)
Columbia Capital Allocation Moderate Aggressive Portfolio
January 31, 2016
Common Stocks 1.2%
Issuer | | Shares | | Value ($) | |
CONSUMER DISCRETIONARY 0.2% | |
Auto Components —% | |
Cie Generale des Etablissements
Michelin | | | 607 | | | | 55,378 | | |
Cooper Tire & Rubber Co. | | | 4,825 | | | | 175,919 | | |
Dana Holding Corp. | | | 6,500 | | | | 77,285 | | |
Magna International, Inc. | | | 1,900 | | | | 66,010 | | |
Total | | | | | 374,592 | | |
Automobiles —% | |
Fuji Heavy Industries Ltd. | | | 2,500 | | | | 102,307 | | |
Peugeot SA(b) | | | 6,014 | | | | 89,427 | | |
Renault SA | | | 168 | | | | 14,255 | | |
Total | | | | | 205,989 | | |
Diversified Consumer Services —% | |
Capella Education Co. | | | 1,000 | | | | 43,910 | | |
New Oriental Education & Technology
Group, Inc., ADR | | | 800 | | | | 25,128 | | |
Total | | | | | 69,038 | | |
Hotels, Restaurants & Leisure 0.1% | |
Cracker Barrel Old Country Store, Inc. | | | 1,370 | | | | 179,785 | | |
Denny's Corp.(b) | | | 13,070 | | | | 122,466 | | |
Flight Centre Travel Group Ltd. | | | 3,380 | | | | 94,458 | | |
Isle of Capri Casinos, Inc.(b) | | | 3,400 | | | | 43,044 | | |
Jack in the Box, Inc. | | | 2,380 | | | | 184,783 | | |
Marriott Vacations Worldwide Corp. | | | 2,440 | | | | 120,512 | | |
Papa John's International, Inc. | | | 100 | | | | 4,775 | | |
Ruth's Hospitality Group, Inc. | | | 3,630 | | | | 58,988 | | |
Total | | | | | 808,811 | | |
Household Durables —% | |
Helen of Troy Ltd.(b) | | | 1,700 | | | | 151,929 | | |
Iida Group Holdings Co., Ltd. | | | 3,200 | | | | 57,046 | | |
Persimmon PLC | | | 3,170 | | | | 92,498 | | |
Zagg, Inc.(b) | | | 2,200 | | | | 20,284 | | |
Total | | | | | 321,757 | | |
Internet & Catalog Retail —% | |
PetMed Express, Inc. | | | 4,980 | | | | 89,740 | | |
Leisure Products —% | |
Sturm Ruger & Co., Inc. | | | 2,800 | | | | 164,780 | | |
Common Stocks (continued)
Issuer | | Shares | | Value ($) | |
Media —% | |
Gray Television, Inc.(b) | | | 3,900 | | | | 51,285 | | |
Nexstar Broadcasting Group, Inc.,
Class A | | | 3,070 | | | | 138,795 | | |
Total | | | | | 190,080 | | |
Multiline Retail —% | |
Marks & Spencer Group PLC | | | 11,400 | | | | 69,220 | | |
Specialty Retail 0.1% | |
American Eagle Outfitters, Inc. | | | 4,600 | | | | 67,344 | | |
Cato Corp. (The), Class A | | | 3,695 | | | | 149,019 | | |
Children's Place, Inc. (The) | | | 2,465 | | | | 160,472 | | |
Guess?, Inc. | | | 3,150 | | | | 58,401 | | |
Outerwall, Inc. | | | 4,135 | | | | 139,763 | | |
Total | | | | | 574,999 | | |
Textiles, Apparel & Luxury Goods —% | |
Movado Group, Inc. | | | 5,350 | | | | 137,495 | | |
Oxford Industries, Inc. | | | 2,610 | | | | 182,335 | | |
Wolverine World Wide, Inc. | | | 8,850 | | | | 149,653 | | |
Total | | | | | 469,483 | | |
Total Consumer Discretionary | | | | | 3,338,489 | | |
CONSUMER STAPLES 0.1% | |
Beverages —% | |
Ambev SA | | | 18,800 | | | | 87,706 | | |
Food & Staples Retailing —% | |
Alimentation Couche-Tard, Inc., Class B | | | 1,600 | | | | 69,647 | | |
Ingles Markets, Inc., Class A | | | 650 | | | | 24,934 | | |
Koninklijke Ahold NV | | | 4,637 | | | | 104,887 | | |
SUPERVALU, Inc.(b) | | | 9,430 | | | | 42,907 | | |
Wal-Mart de Mexico SAB de CV,
Class V | | | 36,739 | | | | 92,223 | | |
Total | | | | | 334,598 | | |
Food Products 0.1% | |
Cal-Maine Foods, Inc. | | | 3,340 | | | | 168,570 | | |
China Milk Products Group Ltd.(b)(c)(d)(e) | | | 322,000 | | | | — | | |
Dean Foods Co. | | | 9,050 | | | | 180,819 | | |
JBS SA | | | 6,700 | | | | 18,091 | | |
Sanderson Farms, Inc. | | | 2,180 | | | | 177,060 | | |
WH Group Ltd.(b) | | | 65,500 | | | | 37,506 | | |
Total | | | | | 582,046 | | |
The accompanying Notes to Financial Statements are an integral part of this statement.
Annual Report 2016
58
COLUMBIA CAPITAL ALLOCATION PORTFOLIOS
PORTFOLIO OF INVESTMENTS (continued)
Columbia Capital Allocation Moderate Aggressive Portfolio
January 31, 2016
Common Stocks (continued)
Issuer | | Shares | | Value ($) | |
Household Products —% | |
Reckitt Benckiser Group PLC | | | 504 | | | | 44,826 | | |
Svenska Cellulosa AB, Class B | | | 1,762 | | | | 52,222 | | |
Total | | | | | 97,048 | | |
Personal Products —% | |
Usana Health Sciences, Inc.(b) | | | 1,020 | | | | 129,438 | | |
Tobacco —% | |
Japan Tobacco, Inc. | | | 2,400 | | | | 93,993 | | |
Universal Corp. | | | 1,000 | | | | 54,730 | | |
Total | | | | | 148,723 | | |
Total Consumer Staples | | | | | 1,379,559 | | |
ENERGY —% | |
Energy Equipment & Services —% | |
Oil States International, Inc.(b) | | | 3,340 | | | | 94,288 | | |
Oil, Gas & Consumable Fuels —% | |
Alon USA Energy, Inc. | | | 4,900 | | | | 61,642 | | |
MOL Hungarian Oil and Gas NyRt | | | 279 | | | | 13,565 | | |
OMV AG | | | 1,228 | | | | 31,609 | | |
PDC Energy, Inc.(b) | | | 3,415 | | | | 194,211 | | |
Polski Koncern Naftowy Orlen SA | | | 1,900 | | | | 29,139 | | |
REX American Resources Corp.(b) | | | 3,042 | | | | 162,534 | | |
Royal Dutch Shell PLC, Class B | | | 4,774 | | | | 104,016 | | |
S-Oil Corp. | | | 1,440 | | | | 94,805 | | |
SK Innovation Co., Ltd. | | | 605 | | | | 66,861 | | |
Western Refining, Inc. | | | 1,950 | | | | 64,155 | | |
Total | | | | | 822,537 | | |
Total Energy | | | | | 916,825 | | |
FINANCIALS 0.3% | |
Banks 0.1% | |
Abu Dhabi Commercial Bank PJSC | | | 17,630 | | | | 29,183 | | |
Banc of California, Inc. | | | 8,400 | | | | 126,840 | | |
Banco Latinoamericano de Comercio
Exterior SA, Class E | | | 4,750 | | | | 110,770 | | |
Banco Santander Brasil SA | | | 13,600 | | | | 44,372 | | |
Bank of China Ltd., Class H | | | 214,000 | | | | 83,796 | | |
Bank of Communications Co., Ltd.,
Class H | | | 24,000 | | | | 14,673 | | |
Bank of Montreal | | | 600 | | | | 32,216 | | |
BBCN Bancorp, Inc. | | | 5,350 | | | | 81,320 | | |
Common Stocks (continued)
Issuer | | Shares | | Value ($) | |
Canadian Imperial Bank of Commerce | | | 1,300 | | | | 84,668 | | |
Central Pacific Financial Corp. | | | 7,540 | | | | 157,963 | | |
China Merchants Bank Co., Ltd.,
Class H | | | 13,000 | | | | 25,270 | | |
Credit Agricole SA | | | 7,532 | | | | 75,162 | | |
Customers Bancorp, Inc.(b) | | | 5,155 | | | | 129,391 | | |
Erste Group Bank AG(b) | | | 1,033 | | | | 29,840 | | |
First BanCorp(b) | | | 17,475 | | | | 45,435 | | |
First NBC Bank Holding Co.(b) | | | 4,405 | | | | 138,273 | | |
Hilltop Holdings, Inc.(b) | | | 1,450 | | | | 23,157 | | |
HSBC Holdings PLC | | | 17,641 | | | | 124,414 | | |
International Bancshares Corp. | | | 5,290 | | | | 122,675 | | |
KBC Groep NV | | | 91 | | | | 5,215 | | |
Mitsubishi UFJ Financial Group, Inc. | | | 10,500 | | | | 53,843 | | |
Nordea Bank AB | | | 6,470 | | | | 65,151 | | |
Opus Bank | | | 650 | | | | 21,444 | | |
Societe Generale SA | | | 288 | | | | 10,987 | | |
Sumitomo Mitsui Financial Group, Inc. | | | 2,500 | | | | 83,872 | | |
Woori Finance Holdings Co., Ltd. | | | 5,352 | | | | 39,559 | | |
Total | | | | | 1,759,489 | | |
Capital Markets —% | |
| 3i Group PLC | | | 1,129 | | | | 7,158 | | |
Arlington Asset Investment Corp.,
Class A | | | 10,450 | | | | 115,995 | | |
Cowen Group, Inc., Class A(b) | | | 18,500 | | | | 52,910 | | |
KCG Holdings, Inc., Class A(b) | | | 5,500 | | | | 56,210 | | |
Total | | | | | 232,273 | | |
Consumer Finance —% | |
Cash America International, Inc. | | | 5,300 | | | | 158,682 | | |
Nelnet, Inc., Class A | | | 4,000 | | | | 129,880 | | |
Total | | | | | 288,562 | | |
Diversified Financial Services —% | |
EXOR SpA | | | 1,976 | | | | 64,416 | | |
Insurance 0.1% | |
Ageas | | | 1,889 | | | | 76,714 | | |
Allianz SE, Registered Shares | | | 687 | | | | 111,182 | | |
American Equity Investment Life
Holding Co. | | | 4,233 | | | | 76,998 | | |
Employers Holdings, Inc. | | | 2,020 | | | | 50,318 | | |
HCI Group, Inc. | | | 1,275 | | | | 42,394 | | |
Heritage Insurance Holdings, Inc. | | | 8,120 | | | | 160,939 | | |
The accompanying Notes to Financial Statements are an integral part of this statement.
Annual Report 2016
59
COLUMBIA CAPITAL ALLOCATION PORTFOLIOS
PORTFOLIO OF INVESTMENTS (continued)
Columbia Capital Allocation Moderate Aggressive Portfolio
January 31, 2016
Common Stocks (continued)
Issuer | | Shares | | Value ($) | |
Maiden Holdings Ltd. | | | 10,960 | | | | 140,288 | | |
Muenchener Rueckversicherungs-
Gesellschaft AG in Muenchen,
Registered Shares | | | 456 | | | | 87,858 | | |
Power Corp. of Canada | | | 3,900 | | | | 82,710 | | |
Swiss Re AG | | | 1,077 | | | | 100,254 | | |
Universal Insurance Holdings, Inc. | | | 7,653 | | | | 143,417 | | |
Total | | | | | 1,073,072 | | |
Real Estate Investment Trusts (REITs) 0.1% | |
AG Mortgage Investment Trust, Inc. | | | 2,250 | | | | 26,393 | | |
American Assets Trust, Inc. | | | 1,600 | | | | 59,824 | | |
Apollo Residential Mortgage, Inc. | | | 4,200 | | | | 45,570 | | |
Coresite Realty Corp. | | | 2,765 | | | | 177,347 | | |
Cousins Properties, Inc. | | | 3,500 | | | | 30,170 | | |
CubeSmart | | | 6,975 | | | | 218,248 | | |
CyrusOne, Inc. | | | 2,110 | | | | 77,753 | | |
CYS Investments, Inc. | | | 22,800 | | | | 157,092 | | |
DuPont Fabros Technology, Inc. | | | 5,425 | | | | 179,947 | | |
Hersha Hospitality Trust | | | 2,200 | | | | 38,654 | | |
Mack-Cali Realty Corp. | | | 6,500 | | | | 135,135 | | |
Ryman Hospitality Properties, Inc. | | | 3,650 | | | | 171,367 | | |
Sovran Self Storage, Inc. | | | 1,820 | | | | 205,078 | | |
STORE Capital Corp. | | | 6,500 | | | | 161,135 | | |
Summit Hotel Properties, Inc. | | | 12,900 | | | | 130,935 | | |
Sunstone Hotel Investors, Inc. | | | 14,327 | | | | 170,202 | | |
Total | | | | | 1,984,850 | | |
Real Estate Management & Development —% | |
Wheelock & Co., Ltd. | | | 4,000 | | | | 15,314 | | |
Thrifts & Mortgage Finance —% | |
BofI Holding, Inc.(b) | | | 4,500 | | | | 77,220 | | |
Flagstar Bancorp, Inc.(b) | | | 4,850 | | | | 90,453 | | |
HomeStreet, Inc.(b) | | | 4,340 | | | | 88,883 | | |
MGIC Investment Corp.(b) | | | 23,690 | | | | 156,828 | | |
Radian Group, Inc. | | | 13,240 | | | | 133,194 | | |
Walker & Dunlop, Inc.(b) | | | 5,990 | | | | 143,520 | | |
Washington Federal, Inc. | | | 7,400 | | | | 157,990 | | |
Total | | | | | 848,088 | | |
Total Financials | | | | | 6,266,064 | | |
Common Stocks (continued)
Issuer | | Shares | | Value ($) | |
HEALTH CARE 0.2% | |
Biotechnology 0.1% | |
ACADIA Pharmaceuticals, Inc.(b) | | | 1,760 | | | | 36,414 | | |
Acorda Therapeutics, Inc.(b) | | | 1,995 | | | | 73,456 | | |
Alder Biopharmaceuticals, Inc.(b) | | | 1,970 | | | | 47,635 | | |
AMAG Pharmaceuticals, Inc.(b) | | | 2,250 | | | | 51,548 | | |
Anacor Pharmaceuticals, Inc.(b) | | | 1,290 | | | | 96,918 | | |
ARIAD Pharmaceuticals, Inc.(b) | | | 6,050 | | | | 30,371 | | |
Arrowhead Research Corp.(b) | | | 10,700 | | | | 37,236 | | |
Curis, Inc.(b) | | | 12,595 | | | | 20,656 | | |
Dynavax Technologies Corp.(b) | | | 3,945 | | | | 95,035 | | |
Infinity Pharmaceuticals, Inc.(b) | | | 7,945 | | | | 49,338 | | |
Insmed, Inc.(b) | | | 2,120 | | | | 27,984 | | |
Insys Therapeutics, Inc.(b) | | | 2,450 | | | | 42,508 | | |
Keryx Biopharmaceuticals, Inc.(b) | | | 14,330 | | | | 50,585 | | |
Neurocrine Biosciences, Inc.(b) | | | 1,670 | | | | 71,058 | | |
Novavax, Inc.(b) | | | 14,820 | | | | 76,323 | | |
Portola Pharmaceuticals, Inc.(b) | | | 590 | | | | 19,488 | | |
Spark Therapeutics, Inc.(b) | | | 2,485 | | | | 70,002 | | |
TESARO, Inc.(b) | | | 495 | | | | 17,097 | | |
Ultragenyx Pharmaceutical, Inc.(b) | | | 1,070 | | | | 60,080 | | |
vTv Therapeutics, Inc., Class A(b) | | | 3,947 | | | | 28,616 | | |
Total | | | | | 1,002,348 | | |
Health Care Equipment & Supplies —% | |
Analogic Corp. | | | 1,900 | | | | 140,733 | | |
LivaNova PLC(b) | | | 3,125 | | | | 174,937 | | |
Merit Medical Systems, Inc.(b) | | | 9,470 | | | | 156,729 | | |
Orthofix International NV(b) | | | 3,800 | | | | 149,986 | | |
Total | | | | | 622,385 | | |
Health Care Providers & Services 0.1% | |
Alfresa Holdings Corp. | | | 2,000 | | | | 37,262 | | |
Chemed Corp. | | | 135 | | | | 18,943 | | |
LHC Group, Inc.(b) | | | 1,130 | | | | 42,850 | | |
Magellan Health, Inc.(b) | | | 2,750 | | | | 156,750 | | |
Medipal Holdings Corp. | | | 4,600 | | | | 74,611 | | |
Molina Healthcare, Inc.(b) | | | 3,031 | | | | 166,432 | | |
Owens & Minor, Inc. | | | 650 | | | | 22,522 | | |
PharMerica Corp.(b) | | | 2,075 | | | | 61,607 | | |
The accompanying Notes to Financial Statements are an integral part of this statement.
Annual Report 2016
60
COLUMBIA CAPITAL ALLOCATION PORTFOLIOS
PORTFOLIO OF INVESTMENTS (continued)
Columbia Capital Allocation Moderate Aggressive Portfolio
January 31, 2016
Common Stocks (continued)
Issuer | | Shares | | Value ($) | |
Triple-S Management Corp., Class B(b) | | | 5,570 | | | | 124,155 | | |
WellCare Health Plans, Inc.(b) | | | 860 | | | | 65,343 | | |
Total | | | | | 770,475 | | |
Life Sciences Tools & Services —% | |
Affymetrix, Inc.(b) | | | 2,055 | | | | 28,832 | | |
Cambrex Corp.(b) | | | 3,610 | | | | 125,050 | | |
INC Research Holdings, Inc. Class A(b) | | | 3,331 | | | | 140,335 | | |
PAREXEL International Corp.(b) | | | 1,110 | | | | 70,996 | | |
Total | | | | | 365,213 | | |
Pharmaceuticals —% | |
GlaxoSmithKline PLC | | | 962 | | | | 19,818 | | |
Novo Nordisk A/S, Class B | | | 1,563 | | | | 87,322 | | |
Pernix Therapeutics Holdings, Inc.(b) | | | 9,500 | | | | 20,710 | | |
Roche Holding AG, Genusschein
Shares | | | 549 | | | | 142,204 | | |
Sanofi | | | 1,091 | | | | 90,728 | | |
Sucampo Pharmaceuticals, Inc.,
Class A(b) | | | 9,300 | | | | 117,645 | | |
Teva Pharmaceutical Industries Ltd. | | | 1,327 | | | | 81,541 | | |
Total | | | | | 559,968 | | |
Total Health Care | | | | | 3,320,389 | | |
INDUSTRIALS 0.1% | |
Aerospace & Defense —% | |
Cubic Corp. | | | 1,300 | | | | 51,948 | | |
Moog, Inc., Class A(b) | | | 3,000 | | | | 138,990 | | |
Total | | | | | 190,938 | | |
Air Freight & Logistics —% | |
Air Transport Services Group, Inc.(b) | | | 10,345 | | | | 100,657 | | |
Royal Mail PLC | | | 13,080 | | | | 85,992 | | |
Total | | | | | 186,649 | | |
Airlines —% | |
Hawaiian Holdings, Inc.(b) | | | 2,525 | | | | 88,905 | | |
Japan Airlines Co., Ltd. | | | 2,200 | | | | 82,574 | | |
Total | | | | | 171,479 | | |
Building Products —% | |
Continental Building Product(b) | | | 8,600 | | | | 128,484 | | |
Commercial Services & Supplies —% | |
Deluxe Corp. | | | 3,400 | | | | 190,060 | | |
Interface, Inc. | | | 2,150 | | | | 36,314 | | |
Common Stocks (continued)
Issuer | | Shares | | Value ($) | |
Quad/Graphics, Inc. | | | 11,200 | | | | 112,896 | | |
West Corp. | | | 2,150 | | | | 38,936 | | |
Total | | | | | 378,206 | | |
Construction & Engineering —% | |
EMCOR Group, Inc. | | | 3,975 | | | | 181,658 | | |
Leighton Holdings Ltd. | | | 4,574 | | | | 78,889 | | |
VINCI SA | | | 1,486 | | | | 100,672 | | |
Total | | | | | 361,219 | | |
Electrical Equipment —% | |
EnerSys | | | 2,875 | | | | 139,236 | | |
General Cable Corp. | | | 11,000 | | | | 128,920 | | |
OSRAM Licht AG | | | 869 | | | | 38,798 | | |
Prysmian SpA | | | 1,676 | | | | 34,484 | | |
Vestas Wind Systems A/S | | | 1,577 | | | | 103,190 | | |
Total | | | | | 444,628 | | |
Machinery 0.1% | |
Barnes Group, Inc. | | | 900 | | | | 29,259 | | |
Global Brass & Copper Holdings, Inc. | | | 3,550 | | | | 73,521 | | |
Kadant, Inc. | | | 2,590 | | | | 100,518 | | |
Mueller Industries, Inc. | | | 5,350 | | | | 136,157 | | |
PT United Tractors Tbk | | | 74,300 | | | | 94,960 | | |
Wabash National Corp.(b) | | | 15,000 | | | | 165,900 | | |
Total | | | | | 600,315 | | |
Marine —% | |
Kuehne & Nagel International AG | | | 142 | | | | 18,793 | | |
Matson, Inc. | | | 4,180 | | | | 168,914 | | |
Total | | | | | 187,707 | | |
Professional Services —% | |
Insperity, Inc. | | | 200 | | | | 8,986 | | |
RPX Corp.(b) | | | 12,470 | | | | 144,403 | | |
Total | | | | | 153,389 | | |
Road & Rail —% | |
ArcBest Corp. | | | 4,190 | | | | 86,021 | | |
Trading Companies & Distributors —% | |
Applied Industrial Technologies, Inc. | | | 1,995 | | | | 76,688 | | |
MRC Global, Inc.(b) | | | 7,000 | | | | 70,350 | | |
Total | | | | | 147,038 | | |
Total Industrials | | | | | 3,036,073 | | |
The accompanying Notes to Financial Statements are an integral part of this statement.
Annual Report 2016
61
COLUMBIA CAPITAL ALLOCATION PORTFOLIOS
PORTFOLIO OF INVESTMENTS (continued)
Columbia Capital Allocation Moderate Aggressive Portfolio
January 31, 2016
Common Stocks (continued)
Issuer | | Shares | | Value ($) | |
INFORMATION TECHNOLOGY 0.2% | |
Communications Equipment —% | |
NETGEAR, Inc.(b) | | | 4,175 | | | | 156,020 | | |
Plantronics, Inc. | | | 500 | | | | 22,415 | | |
Polycom, Inc.(b) | | | 9,500 | | | | 96,805 | | |
Total | | | | | 275,240 | | |
Electronic Equipment, Instruments & Components 0.1% | |
Benchmark Electronics, Inc.(b) | | | 6,400 | | | | 134,400 | | |
Checkpoint Systems, Inc. | | | 6,544 | | | | 42,405 | | |
Chimei Innolux Corp. | | | 288,000 | | | | 82,313 | | |
Coherent, Inc.(b) | | | 400 | | | | 30,908 | | |
Delta Electronics Thailand PCL(b) | | | 3,100 | | | | 6,927 | | |
Hon Hai Precision Industry Co., Ltd. | | | 39,000 | | | | 91,752 | | |
Insight Enterprises, Inc.(b) | | | 2,460 | | | | 58,130 | | |
MTS Systems Corp. | | | 450 | | | | 24,030 | | |
SYNNEX Corp. | | | 2,050 | | | | 172,097 | | |
Tech Data Corp.(b) | | | 2,700 | | | | 168,480 | | |
Total | | | | | 811,442 | | |
Internet Software & Services 0.1% | |
DHI Group, Inc.(b) | | | 11,190 | | | | 104,179 | | |
EarthLink Holdings Corp. | | | 20,950 | | | | 124,024 | | |
j2 Global, Inc. | | | 1,450 | | | | 105,140 | | |
LogMeIn, Inc.(b) | | | 2,965 | | | | 154,892 | | |
NetEase, Inc., ADR | | | 500 | | | | 78,070 | | |
RetailMeNot, Inc.(b) | | | 16,985 | | | | 154,563 | | |
Web.com Group, Inc.(b) | | | 7,775 | | | | 146,403 | | |
Total | | | | | 867,271 | | |
IT Services —% | |
CGI Group, Inc., Class A(b) | | | 1,700 | | | | 72,859 | | |
Convergys Corp. | | | 615 | | | | 15,030 | | |
CSG Systems International, Inc. | | | 2,200 | | | | 76,868 | | |
EVERTEC, Inc. | | | 8,973 | | | | 123,289 | | |
NeuStar, Inc., Class A(b) | | | 7,100 | | | | 174,518 | | |
Sykes Enterprises, Inc.(b) | | | 4,775 | | | | 140,576 | | |
Syntel, Inc.(b) | | | 500 | | | | 23,670 | | |
Total | | | | | 626,810 | | |
Semiconductors & Semiconductor Equipment —% | |
Amkor Technology, Inc.(b) | | | 25,720 | | | | 157,921 | | |
Cabot Microelectronics Corp.(b) | | | 1,625 | | | | 66,040 | | |
Common Stocks (continued)
Issuer | | Shares | | Value ($) | |
Cirrus Logic, Inc.(b) | | | 825 | | | | 28,644 | | |
Diodes, Inc.(b) | | | 6,750 | | | | 129,127 | | |
Entegris, Inc.(b) | | | 1,800 | | | | 20,988 | | |
Silicon Laboratories, Inc.(b) | | | 875 | | | | 39,900 | | |
Taiwan Semiconductor Manufacturing
Co., Ltd. | | | 11,000 | | | | 47,365 | | |
Veeco Instruments, Inc.(b) | | | 1,400 | | | | 26,096 | | |
Xcerra Corp.(b) | | | 13,620 | | | | 74,638 | | |
Total | | | | | 590,719 | | |
Software —% | |
Aspen Technology, Inc.(b) | | | 5,180 | | | | 168,039 | | |
AVG Technologies NV(b) | | | 7,260 | | | | 136,996 | | |
Check Point Software Technologies Ltd.(b) | | | 100 | | | | 7,881 | | |
Gigamon, Inc.(b) | | | 3,600 | | | | 94,140 | | |
Progress Software Corp.(b) | | | 2,210 | | | | 57,217 | | |
RealPage, Inc.(b) | | | 4,050 | | | | 78,125 | | |
VASCO Data Security International, Inc.(b) | | | 3,900 | | | | 60,450 | | |
Total | | | | | 602,848 | | |
Technology Hardware, Storage & Peripherals —% | |
Asustek Computer, Inc. | | | 2,000 | | | | 16,214 | | |
Foxconn Technology Co., Ltd. | | | 2,000 | | | | 3,874 | | |
FUJIFILM Holdings Corp. | | | 1,200 | | | | 46,366 | | |
Total | | | | | 66,454 | | |
Total Information Technology | | | | | 3,840,784 | | |
MATERIALS 0.1% | |
Chemicals 0.1% | |
Chemtura Corp.(b) | | | 6,510 | | | | 170,823 | | |
Innophos Holdings, Inc. | | | 1,575 | | | | 42,068 | | |
Innospec, Inc. | | | 3,305 | | | | 164,754 | | |
Mitsubishi Chemical Holdings Corp. | | | 13,700 | | | | 76,408 | | |
Total | | | | | 454,053 | | |
Construction Materials —% | |
US Concrete, Inc.(b) | | | 1,600 | | | | 72,768 | | |
Metals & Mining —% | |
Commercial Metals Co. | | | 5,119 | | | | 71,256 | | |
Eregli Demir ve Celik Fabrikalari TAS | | | 49,640 | | | | 52,108 | | |
Materion Corp. | | | 4,540 | | | | 111,185 | | |
The accompanying Notes to Financial Statements are an integral part of this statement.
Annual Report 2016
62
COLUMBIA CAPITAL ALLOCATION PORTFOLIOS
PORTFOLIO OF INVESTMENTS (continued)
Columbia Capital Allocation Moderate Aggressive Portfolio
January 31, 2016
Common Stocks (continued)
Issuer | | Shares | | Value ($) | |
Rio Tinto PLC | | | 3,451 | | | | 84,625 | | |
Severstal PAO | | | 4,649 | | | | 38,326 | | |
Total | | | | | 357,500 | | |
Paper & Forest Products —% | |
Stora Enso OYJ, Class R | | | 640 | | | | 5,216 | | |
UPM-Kymmene OYJ | | | 5,077 | | | | 82,739 | | |
Total | | | | | 87,955 | | |
Total Materials | | | | | 972,276 | | |
TELECOMMUNICATION SERVICES —% | |
Diversified Telecommunication Services —% | |
China Telecom Corp., Ltd., Class H | | | 88,000 | | | | 41,390 | | |
General Communication, Inc., Class A(b) | | | 7,040 | | | | 127,565 | | |
Nippon Telegraph & Telephone Corp. | | | 2,600 | | | | 110,689 | | |
Telstra Corp., Ltd. | | | 1,719 | | | | 6,926 | | |
Turk Telekomunikasyon AS | | | 10,021 | | | | 18,357 | | |
Total | | | | | 304,927 | | |
Wireless Telecommunication Services —% | |
China Mobile Ltd. | | | 9,000 | | | | 98,858 | | |
Shenandoah Telecommunications Co. | | | 3,800 | | | | 87,324 | | |
Total | | | | | 186,182 | | |
Total Telecommunication Services | | | | | 491,109 | | |
UTILITIES —% | |
Electric Utilities —% | |
Chubu Electric Power Co., Inc. | | | 500 | | | | 6,422 | | |
Endesa SA | | | 2,240 | | | | 43,365 | | |
IDACORP, Inc. | | | 2,230 | | | | 155,186 | | |
Korea Electric Power Corp. | | | 2,076 | | | | 91,133 | | |
Tokyo Electric Power Co., Inc.(b) | | | 1,700 | | | | 8,542 | | |
Transmissora Alianca de Energia
Eletrica SA | | | 5,600 | | | | 24,347 | | |
Total | | | | | 328,995 | | |
Common Stocks (continued)
Issuer | | Shares | | Value ($) | |
Gas Utilities —% | |
Chesapeake Utilities Corp. | | | 2,225 | | | | 140,108 | | |
New Jersey Resources Corp. | | | 4,235 | | | | 149,157 | | |
Southwest Gas Corp. | | | 3,050 | | | | 179,431 | | |
WGL Holdings, Inc. | | | 590 | | | | 39,406 | | |
Total | | | | | 508,102 | | |
Multi-Utilities —% | |
RWE AG | | | 402 | | | | 5,631 | | |
Water Utilities —% | |
SJW Corp. | | | 3,080 | | | | 100,408 | | |
Total Utilities | | | | | 943,136 | | |
Total Common Stocks
(Cost: $27,938,736) | | | | | 24,504,704 | | |
Money Market Funds 10.9%
| | | Shares | | Value ($) | |
Columbia Short-Term Cash Fund,
0.360%(a)(f) | | | 227,930,997 | | | | 227,930,997 | | |
Total Money Market Funds
(Cost: $227,930,997) | | | | | 227,930,997 | | |
Total Investments
(Cost: $2,133,358,233) | | | | | 2,082,312,721 | | |
Other Assets & Liabilities, Net | | | | | 9,033,738 | | |
Net Assets | | | | | 2,091,346,459 | | |
The accompanying Notes to Financial Statements are an integral part of this statement.
Annual Report 2016
63
COLUMBIA CAPITAL ALLOCATION PORTFOLIOS
PORTFOLIO OF INVESTMENTS (continued)
Columbia Capital Allocation Moderate Aggressive Portfolio
January 31, 2016
At January 31, 2016, cash totaling $5,921,700 was pledged as collateral.
Investments in Derivatives
Forward Foreign Currency Exchange Contracts Open at January 31, 2016
Counterparty | | Exchange Date | | Currency to
be Delivered | |
| | Currency to
be Received | |
| | Unrealized
Appreciation ($) | | Unrealized
Depreciation ($) | |
Citigroup | | 3/3/2016 | | | 342,000 | | | BRL | | | | | 83,034 | | | USD | | | | | — | | | | (1,734 | ) | |
Citigroup | | 3/3/2016 | | | 110,000 | | | CAD | | | | | 78,067 | | | USD | | | | | — | | | | (454 | ) | |
Citigroup | | 3/3/2016 | | | 399,000 | | | CNY | | | | | 59,843 | | | USD | | | | | — | | | | (566 | ) | |
Citigroup | | 3/3/2016 | | | 772,000 | | | DKK | | | | | 112,540 | | | USD | | | | | 390 | | | | — | | |
Citigroup | | 3/3/2016 | | | 395,979,000 | | | IDR | | | | | 28,020 | | | USD | | | | | — | | | | (789 | ) | |
Citigroup | | 3/3/2016 | | | 241,000 | | | ILS | | | | | 61,433 | | | USD | | | | | 542 | | | | — | | |
Citigroup | | 3/3/2016 | | | 140,617,000 | | | KRW | | | | | 116,874 | | | USD | | | | | 614 | | | | — | | |
Citigroup | | 3/3/2016 | | | 585,000 | | | MXN | | | | | 32,990 | | | USD | | | | | 801 | | | | — | | |
Citigroup | | 3/3/2016 | | | 49,000 | | | PLN | | | | | 12,221 | | | USD | | | | | 218 | | | | — | | |
Citigroup | | 3/3/2016 | | | 68,000 | | | TRY | | | | | 22,204 | | | USD | | | | | — | | | | (615 | ) | |
Citigroup | | 3/3/2016 | | | 3,326,000 | | | TWD | | | | | 99,058 | | | USD | | | | | — | | | | (226 | ) | |
Citigroup | | 3/3/2016 | | | 93,726 | | | USD | | | | | 134,000 | | | AUD | | | | | 981 | | | | — | | |
Citigroup | | 3/3/2016 | | | 112,139 | | | USD | | | | | 112,000 | | | CHF | | | | | — | | | | (2,680 | ) | |
Citigroup | | 3/3/2016 | | | 47,939 | | | USD | | | | | 44,000 | | | EUR | | | | | — | | | | (241 | ) | |
Citigroup | | 3/3/2016 | | | 144,379 | | | USD | | | | | 99,000 | | | GBP | | | | | — | | | | (3,309 | ) | |
Citigroup | | 3/3/2016 | | | 100,151 | | | USD | | | | | 6,746,000 | | | INR | | | | | — | | | | (1,243 | ) | |
Citigroup | | 3/3/2016 | | | 90,346 | | | USD | | | | | 10,657,000 | | | JPY | | | | | — | | | | (2,273 | ) | |
Citigroup | | 3/3/2016 | | | 21,768 | | | USD | | | | | 96,000 | | | MYR | | | | | 1,415 | | | | — | | |
Citigroup | | 3/3/2016 | | | 16,807 | | | USD | | | | | 150,000 | | | NOK | | | | | 466 | | | | — | | |
Citigroup | | 3/3/2016 | | | 15,936 | | | USD | | | | | 770,000 | | | PHP | | | | | 129 | | | | — | | |
Citigroup | | 3/3/2016 | | | 50,083 | | | USD | | | | | 72,000 | | | SGD | | | | | 430 | | | | — | | |
Citigroup | | 3/3/2016 | | | 15,972 | | | USD | | | | | 571,000 | | | THB | | | | | — | | | | (5 | ) | |
Citigroup | | 3/3/2016 | | | 76,702 | | | USD | | | | | 1,245,000 | | | ZAR | | | | | 1,242 | | | | — | | |
Total | | | | | | | | | | | | | 7,228 | | | | (14,135 | ) | |
Futures Contracts Outstanding at January 31, 2016
Contract Description | | Number of
Contracts | | Trading
Currency | | Notional
Market
Value ($) | | Expiration
Date | | Unrealized
Appreciation ($) | | Unrealized
Depreciation ($) | |
Russell 2000 Mini | | | 225 | | | USD | | | | | 23,206,500 | | | 03/2016 | | | — | | | | (1,942,315 | ) | |
S&P MID 400 EMINI | | | 174 | | | USD | | | | | 22,877,520 | | | 03/2016 | | | — | | | | (1,167,096 | ) | |
S&P500 EMINI FUT | | | 529 | | | USD | | | | | 51,051,145 | | | 03/2016 | | | — | | | | (1,803,869 | ) | |
US 10YR NOTE (CBT) | | | 386 | | | USD | | | | | 50,017,156 | | | 03/2016 | | | 1,335,227 | | | | — | | |
US LONG BOND(CBT) | | | 65 | | | USD | | | | | 10,467,031 | | | 03/2016 | | | 513,789 | | | | — | | |
US ULTRA BOND CBT | | | 68 | | | USD | | | | | 11,300,750 | | | 03/2016 | | | 609,222 | | | | — | | |
Total | | | | | | | 168,920,102 | | | | | | 2,458,238 | | | | (4,913,280 | ) | |
The accompanying Notes to Financial Statements are an integral part of this statement.
Annual Report 2016
64
COLUMBIA CAPITAL ALLOCATION PORTFOLIOS
PORTFOLIO OF INVESTMENTS (continued)
Columbia Capital Allocation Moderate Aggressive Portfolio
January 31, 2016
Notes to Portfolio of Investments
(a) As defined in the Investment Company Act of 1940, an affiliated company is one in which the Fund owns 5% or more of the company's outstanding voting securities, or a company which is under common ownership or control with the Fund. Holdings and transactions in these affiliated companies during the year ended January 31, 2016 are as follows:
Issuer | | Beginning
Cost ($) | | Purchase
Cost ($) | | Proceeds
From
Sales ($) | | Realized
Gain
(Loss) ($) | | Ending
Cost ($) | | Capital Gain
Distributions ($) | | Dividends —
Affiliated
Issuers ($) | | Value ($) | |
Columbia Absolute
Return Currency
and Income Fund,
Class I Shares | | | 12,674,212 | | | | 1,705,928 | | | | (2,707,498 | ) | | | 356,239 | | | | 12,028,881 | | | | 1,079,865 | | | | 582,134 | | | | 12,736,745 | | |
Columbia Absolute
Return Emerging
Markets Macro Fund,
Class I Shares | | | 24,038,585 | | | | 66 | | | | (22,852,035 | ) | | | (1,186,616 | ) | | | — | | | | — | | | | — | | | | — | | |
Columbia Absolute
Return Enhanced
Multi-Strategy Fund,
Class I Shares | | | 19,426,328 | | | | 1,190,627 | | | | (19,989,223 | ) | | | (627,732 | ) | | | — | | | | 1,190,621 | | | | — | | | | — | | |
Columbia Adaptive
Alternatives Fund,
Class I Shares | | | — | | | | 4,536,456 | | | | — | | | | — | | | | 4,536,456 | | | | — | | | | 36,456 | | | | 4,269,887 | | |
Columbia Contrarian
Core Fund, Class I
Shares | | | 156,957,016 | | | | 8,009,025 | | | | (66,249,434 | ) | | | 22,794,652 | | | | 121,511,259 | | | | 3,936,420 | | | | 3,992,140 | | | | 131,132,044 | | |
Columbia Corporate
Income Fund, Class I
Shares | | | 182,451,896 | | | | 6,728,274 | | | | (8,599,033 | ) | | | (377,370 | ) | | | 180,203,767 | | | | — | | | | 6,191,375 | | | | 167,098,813 | | |
Columbia Disciplined
Core Fund, Class I
Shares | | | 91,004,253 | | | | 2,279,840 | | | | (11,708,996 | ) | | | 4,862,109 | | | | 86,437,206 | | | | — | | | | 2,191,019 | | | | 122,802,810 | | |
Columbia Disciplined
Growth Fund, Class I
Shares | | | 97,761,238 | | | | 11,394,714 | | | | (13,388,088 | ) | | | 1,687,788 | | | | 97,455,652 | | | | 10,345,543 | | | | 983,476 | | | | 85,986,759 | | |
Columbia Disciplined
Value Fund, Class I
Shares | | | 179,875,887 | | | | 11,958,702 | | | | (7,029,417 | ) | | | 146,847 | | | | 184,952,019 | | | | 8,511,064 | | | | 3,290,079 | | | | 165,339,489 | | |
Columbia Diversified
Absolute Return Fund,
Class I Shares | | | — | | | | 40,786,898 | | | | (2,322,481 | ) | | | (64,183 | ) | | | 38,400,234 | | | | 237,070 | | | | 146,846 | | | | 36,761,547 | | |
Columbia Emerging
Markets Bond Fund,
Class I Shares | | | 30,708,946 | | | | 1,106,463 | | | | (1,682,412 | ) | | | (128,617 | ) | | | 30,004,380 | | | | — | | | | 953,749 | | | | 26,741,538 | | |
Columbia Emerging
Markets Fund, Class I
Shares | | | 59,676,295 | | | | 13,263,672 | | | | (6,222,062 | ) | | | (271,828 | ) | | | 66,446,077 | | | | — | | | | — | | | | 58,180,457 | | |
Columbia European
Equity Fund, Class I
Shares | | | 104,226,262 | | | | 4,633,462 | | | | (15,917,416 | ) | | | 3,822,146 | | | | 96,764,454 | | | | 2,860,706 | | | | 1,465,539 | | | | 90,120,100 | | |
Columbia High Yield
Bond Fund, Class I
Shares | | | 22,852,644 | | | | 46,750,683 | | | | (3,413,763 | ) | | | 17,821 | | | | 66,207,385 | | | | — | | | | 3,279,553 | | | | 60,952,673 | | |
Columbia Income
Opportunities Fund,
Class I Shares | | | 131,034,808 | | | | 7,722,647 | | | | (9,409,184 | ) | | | 405,879 | | | | 129,754,150 | | | | 926,468 | | | | 6,478,396 | | | | 121,949,882 | | |
Columbia Inflation
Protected Securities
Fund, Class I Shares | | | 8,766,016 | | | | 3,421,550 | | | | (946,714 | ) | | | (35,858 | ) | | | 11,204,994 | | | | — | | | | — | | | | 10,370,861 | | |
The accompanying Notes to Financial Statements are an integral part of this statement.
Annual Report 2016
65
COLUMBIA CAPITAL ALLOCATION PORTFOLIOS
PORTFOLIO OF INVESTMENTS (continued)
Columbia Capital Allocation Moderate Aggressive Portfolio
January 31, 2016
Notes to Portfolio of Investments (continued)
Issuer | | Beginning
Cost ($) | | Purchase
Cost ($) | | Proceeds
From
Sales ($) | | Realized
Gain
(Loss) ($) | | Ending
Cost ($) | | Capital Gain
Distributions ($) | | Dividends —
Affiliated
Issuers ($) | | Value ($) | |
Columbia International
Bond Fund, Class I
Shares | | | 21,408,707 | | | | 12 | | | | (20,460,659 | ) | | | (948,060 | ) | | | — | | | | — | | | | — | | | | — | | |
Columbia Large Cap
Growth Fund, Class I
Shares | | | 50,390,756 | | | | 6,533,290 | | | | (11,650,170 | ) | | | 6,970,196 | | | | 52,244,072 | | | | 6,480,885 | | | | — | | | | 63,326,764 | | |
Columbia Mortgage
Opportunities Fund,
Class I Shares | | | 20,980,286 | | | | 1,078,789 | | | | (2,244,952 | ) | | | (20,960 | ) | | | 19,793,163 | | | | 209,339 | | | | 809,986 | | | | 18,780,494 | | |
Columbia Multi-Advisor
Small Cap Value Fund,
Class I Shares | | | 10,313,360 | | | | 1,430,933 | | | | (727,316 | ) | | | 427,452 | | | | 11,444,429 | | | | 1,273,485 | | | | 90,274 | | | | 13,085,061 | | |
Columbia Multi-Asset
Income Fund, Class I
Shares | | | — | | | | 37,604,538 | | | | — | | | | — | | | | 37,604,538 | | | | — | | | | 1,681,538 | | | | 33,750,671 | | |
Columbia Overseas
Value Fund, Class I
Shares | | | 128,278,620 | | | | 2,973,603 | | | | (12,730,465 | ) | | | 1,471,301 | | | | 119,993,059 | | | | — | | | | 2,814,827 | | | | 105,788,041 | | |
Columbia Pacific/Asia
Fund, Class I Shares | | | 68,275,679 | | | | 1,196,181 | | | | (6,626,186 | ) | | | 1,770,547 | | | | 64,616,221 | | | | 209,232 | | | | 716,491 | | | | 71,234,107 | | |
Columbia Select Large
Cap Equity Fund,
Class I Shares | | | 50,300,368 | | | | 66,274,142 | | | | (7,273,898 | ) | | | (978,721 | ) | | | 108,321,891 | | | | 6,211,132 | | | | 1,546,268 | | | | 94,639,175 | | |
Columbia Select Large
Cap Growth Fund,
Class I Shares | | | 68,754,909 | | | | 11,186,363 | | | | (12,527,760 | ) | | | 3,554,372 | | | | 70,967,884 | | | | 11,108,942 | | | | — | | | | 72,355,707 | | |
Columbia Select
Large-Cap Value Fund,
Class I Shares | | | 51,591,866 | | | | 3,249,660 | | | | (1,996,438 | ) | | | 858,807 | | | | 53,703,895 | | | | 1,918,504 | | | | 1,235,589 | | | | 64,087,113 | | |
Columbia Select
Smaller-Cap Value
Fund, Class I Shares | | | 8,607,895 | | | | 842,037 | | | | (964,055 | ) | | | 214,763 | | | | 8,700,640 | | | | 798,719 | | | | — | | | | 7,295,610 | | |
Columbia Short-Term
Cash Fund | | | 338,213,798 | | | | 219,643,973 | | | | (329,926,774 | ) | | | — | | | | 227,930,997 | | | | — | | | | 403,864 | | | | 227,930,997 | | |
Columbia Small Cap
Core Fund, Class I
Shares | | | 11,508,308 | | | | 3,665,840 | | | | (660,330 | ) | | | 57,597 | | | | 14,571,415 | | | | 3,601,205 | | | | 19,939 | | | | 10,318,681 | | |
Columbia Small Cap
Growth Fund I, Class I
Shares | | | 13,576,154 | | | | 4,031,992 | | | | (2,351,525 | ) | | | 154,605 | | | | 15,411,226 | | | | 3,957,960 | | | | — | | | | 9,488,131 | | |
Columbia U.S.
Government Mortgage
Fund, Class I Shares | | | 167,893,644 | | | | 5,691,087 | | | | (17,846,419 | ) | | | (60,959 | ) | | | 155,677,353 | | | | 469,054 | | | | 4,876,642 | | | | 152,812,208 | | |
Columbia U.S.
Treasury Index Fund,
Class I Shares | | | 20,028,037 | | | | 444,425 | | | | (1,857,594 | ) | | | (83,068 | ) | | | 18,531,800 | | | | 97,084 | | | | 283,419 | | | | 18,471,652 | | |
Total | | | 2,151,576,773 | | | | 531,335,872 | | | | (622,282,297 | ) | | | 44,789,149 | | | | 2,105,419,497 | | | | 65,423,299 | | | | 44,069,599 | | | | 2,057,808,017 | | |
(b) Non-income producing investment.
The accompanying Notes to Financial Statements are an integral part of this statement.
Annual Report 2016
66
COLUMBIA CAPITAL ALLOCATION PORTFOLIOS
PORTFOLIO OF INVESTMENTS (continued)
Columbia Capital Allocation Moderate Aggressive Portfolio
January 31, 2016
Notes to Portfolio of Investments (continued)
(c) Identifies securities considered by the Investment Manager to be illiquid and may be difficult to sell. The aggregate value of such securities at January 31, 2016 was $0, which represents less than 0.01% of net assets. Information concerning such security holdings at January 31, 2016 is as follows:
Security Description | | Acquisition Date | | Cost ($) | |
China Milk Products Group Ltd. | | 11/17/2010 | | | 172,880 | | |
(d) Negligible market value.
(e) Represents fair value as determined in good faith under procedures approved by the Board of Trustees. At January 31, 2016, the value of these securities amounted to $0, which represents less than 0.01% of net assets.
(f) The rate shown is the seven-day current annualized yield at January 31, 2016.
Abbreviation Legend
ADR American Depositary Receipt
Currency Legend
AUD Australian Dollar
BRL Brazilian Real
CAD Canadian Dollar
CHF Swiss Franc
CNY China, Yuan Renminbi
DKK Danish Krone
EUR Euro
GBP British Pound
IDR Indonesian Rupiah
ILS Israeli Shekel
INR Indian Rupee
JPY Japanese Yen
KRW Korean Won
MXN Mexican Peso
MYR Malaysia Ringgits
NOK Norwegian Krone
PHP Philippine Peso
PLN Polish Zloty
SGD Singapore Dollar
THB Thailand Baht
TRY Turkish Lira
TWD Taiwan Dollar
USD US Dollar
ZAR South African Rand
The accompanying Notes to Financial Statements are an integral part of this statement.
Annual Report 2016
67
COLUMBIA CAPITAL ALLOCATION PORTFOLIOS
PORTFOLIO OF INVESTMENTS (continued)
Columbia Capital Allocation Moderate Aggressive Portfolio
January 31, 2016
The Fund categorizes its fair value measurements according to a three-level hierarchy that maximizes the use of observable inputs and minimizes the use of unobservable inputs by prioritizing that the most observable input be used when available. Observable inputs are those that market participants would use in pricing an investment based on market data obtained from sources independent of the reporting entity. Unobservable inputs are those that reflect the Fund's assumptions about the information market participants would use in pricing an investment. An investment's level within the fair value hierarchy is based on the lowest level of any input that is deemed significant to the asset's or liability's fair value measurement. The input levels are not necessarily an indication of the risk or liquidity associated with investments at that level. For example, certain U.S. government securities are generally high quality and liquid, however, they are reflected as Level 2 because the inputs used to determine fair value may not always be quoted prices in an active market.
Fair value inputs are summarized in the three broad levels listed below:
> Level 1 — Valuations based on quoted prices for investments in active markets that the Fund has the ability to access at the measurement date (including NAV for open-end mutual funds). Valuation adjustments are not applied to Level 1 investments.
> Level 2 — Valuations based on other significant observable inputs (including quoted prices for similar securities, interest rates, prepayment speeds, credit risks, etc.).
> Level 3 — Valuations based on significant unobservable inputs (including the Fund's own assumptions and judgment in determining the fair value of investments).
Inputs that are used in determining fair value of an investment may include price information, credit data, volatility statistics, and other factors. These inputs can be either observable or unobservable. The availability of observable inputs can vary between investments, and is affected by various factors such as the type of investment, and the volume and level of activity for that investment or similar investments in the marketplace. The inputs will be considered by the Investment Manager, along with any other relevant factors in the calculation of an investment's fair value. The Fund uses prices and inputs that are current as of the measurement date, which may include periods of market dislocations. During these periods, the availability of prices and inputs may be reduced for many investments. This condition could cause an investment to be reclassified between the various levels within the hierarchy.
Foreign equity securities actively traded in markets where there is a significant delay in the local close relative to the New York Stock Exchange (NYSE) are classified as Level 2. The values of these securities may include an adjustment to reflect the impact of significant market movements following the close of local trading, as described in Note 2 of the Notes to Financial Statements in the most recent shareholder report.
Investments falling into the Level 3 category are primarily supported by quoted prices from brokers and dealers participating in the market for those investments. However, these may be classified as Level 3 investments due to lack of market transparency and corroboration to support these quoted prices. Additionally, valuation models may be used as the pricing source for any remaining investments classified as Level 3. These models may rely on one or more significant unobservable inputs and/or significant assumptions by the Investment Manager. Inputs used in valuations may include, but are not limited to, financial statement analysis, capital account balances, discount rates and estimated cash flows, and comparable company data.
Under the direction of the Fund's Board of Trustees (the Board), the Investment Manager's Valuation Committee (the Committee) is responsible for overseeing the valuation procedures approved by the Board. The Committee consists of voting and non-voting members from various groups within the Investment Manager's organization, including operations and accounting, trading and investments, compliance, risk management and legal.
The Committee meets at least monthly to review and approve valuation matters, which may include a description of specific valuation determinations, data regarding pricing information received from approved pricing vendors and brokers and the results of Board-approved valuation control policies and procedures (the Policies). The Policies address, among other things, instances when market quotations are or are not readily available, including recommendations of third party pricing vendors and a determination of appropriate pricing methodologies; events that require specific valuation determinations and assessment of fair value techniques; securities with a potential for stale pricing, including those that are illiquid, restricted, or in default; and the effectiveness of third party pricing vendors, including periodic reviews of vendors. The Committee meets more frequently, as needed, to discuss additional valuation matters, which may include the need to review back-testing results, review time-sensitive information or approve related valuation actions. The Committee reports to the Board, with members of the Committee meeting with the Board at each of its regularly scheduled meetings to discuss valuation matters and actions during the period, similar to those described earlier.
For investments categorized as Level 3, the Committee monitors information similar to that described above, which may include: (i) data specific to the issuer or comparable issuers, (ii) general market or specific sector news and (iii) quoted prices and specific or similar security transactions. The Committee considers this data and any changes from prior periods in order to assess the reasonableness of observable and unobservable inputs, any assumptions or internal models used to value those securities and changes in fair value. This data is also used to corroborate, when available, information received from approved pricing vendors and brokers. Various factors impact the frequency of monitoring this information (which may occur as often as daily). However, the Committee may determine that changes to inputs, assumptions and models are not required as a result of the monitoring procedures performed.
The accompanying Notes to Financial Statements are an integral part of this statement.
Annual Report 2016
68
COLUMBIA CAPITAL ALLOCATION PORTFOLIOS
PORTFOLIO OF INVESTMENTS (continued)
Columbia Capital Allocation Moderate Aggressive Portfolio
January 31, 2016
Fair Value Measurements (continued)
The following table is a summary of the inputs used to value the Fund's investments at January 31, 2016:
| | | Level 1
Quoted Prices in Active
Markets for Identical
Assets ($) | |
Level 2
Other Significant
Observable Inputs ($) | |
Level 3
Significant
Unobservable Inputs ($) | |
Total ($) | |
Investments | |
Equity Funds | | | 1,165,180,049 | | | | — | | | | — | | | | 1,165,180,049 | | |
Fixed-Income Funds | | | 577,178,121 | | | | — | | | | — | | | | 577,178,121 | | |
Alternative Investment Funds | | | 87,518,850 | | | | — | | | | — | | | | 87,518,850 | | |
Common Stocks | |
Consumer Discretionary | | | 2,763,900 | | | | 574,589 | | | | — | | | | 3,338,489 | | |
Consumer Staples | | | 1,046,125 | | | | 333,434 | | | | 0 | (a) | | | 1,379,559 | | |
Energy | | | 576,830 | | | | 339,995 | | | | — | | | | 916,825 | | |
Financials | | | 5,162,203 | | | | 1,103,861 | | | | — | | | | 6,266,064 | | |
Health Care | | | 2,786,903 | | | | 533,486 | | | | — | | | | 3,320,389 | | |
Industrials | | | 2,397,721 | | | | 638,352 | | | | — | | | | 3,036,073 | | |
Information Technology | | | 3,545,973 | | | | 294,811 | | | | — | | | | 3,840,784 | | |
Materials | | | 632,854 | | | | 339,422 | | | | — | | | | 972,276 | | |
Telecommunication Services | | | 214,889 | | | | 276,220 | | | | — | | | | 491,109 | | |
Utilities | | | 788,043 | | | | 155,093 | | | | — | | | | 943,136 | | |
Total Common Stocks | | | 19,915,441 | | | | 4,589,263 | | | | 0 | (a) | | | 24,504,704 | | |
Money Market Funds | | | — | | | | 227,930,997 | | | | — | | | | 227,930,997 | | |
Total Investments | | | 1,849,792,461 | | | | 232,520,260 | | | | 0 | (a) | | | 2,082,312,721 | | |
Derivatives | |
Assets | |
Forward Foreign Currency
Exchange Contracts | | | — | | | | 7,228 | | | | — | | | | 7,228 | | |
Futures Contracts | | | 2,458,238 | | | | — | | | | — | | | | 2,458,238 | | |
Liabilities | |
Forward Foreign Currency
Exchange Contracts | | | — | | | | (14,135 | ) | | | — | | | | (14,135 | ) | |
Futures Contracts | | | (4,913,280 | ) | | | — | | | | — | | | | (4,913,280 | ) | |
Total | | | 1,847,337,419 | | | | 232,513,353 | | | | 0 | (a) | | | 2,079,850,772 | | |
(a) Rounds to zero
See the Portfolio of Investments for all investment classifications not indicated in the table.
The Fund's assets assigned to the Level 2 input category are generally valued using the market approach, in which a security's value is determined through reference to prices and information from market transactions for similar or identical assets and/or fund per share market values which are not considered publicly available. These assets include certain foreign securities for which a third party statistical pricing service may be employed for purposes of fair market valuation. The model utilized by such third party statistical pricing service takes into account a security's correlation to available market data including, but not limited to, intraday index, ADR, and exchange-traded fund movements.
Derivative instruments are valued at unrealized appreciation (depreciation).
The accompanying Notes to Financial Statements are an integral part of this statement.
Annual Report 2016
69
COLUMBIA CAPITAL ALLOCATION PORTFOLIOS
PORTFOLIO OF INVESTMENTS (continued)
Columbia Capital Allocation Moderate Aggressive Portfolio
January 31, 2016
Fair Value Measurements (continued)
Financial assets were transferred from Level 1 to Level 2 as the market for these assets is not considered publicly available. Fund per share market values were obtained using observable market inputs.
The following table shows transfers between Level 1 and Level 2 of the fair value hierarchy:
Transfers In | | Transfers Out | |
| Level 1 ($) | | Level 2 ($) | | Level 1 ($) | | Level 2 ($) | |
| | — | | | | 338,213,798 | | | | 338,213,798 | | | | — | | |
Transfers between Level 1 and Level 2 are determined based on the fair value at the beginning of the period for security positions held throughout the period.
The Fund does not hold any significant investments (greater than one percent of net assets) categorized as Level 3.
The Fund's assets assigned to the Level 3 category are valued utilizing the valuation technique deemed the most appropriate in the circumstances. Certain common stock classified as Level 3 securities are valued using the market approach. To determine fair value for these securities, management considered various factors which may have included, but were not limited to, the halt price of the security, the movement in observed market prices for other securities from the issuer, the movement in certain foreign or domestic market indices, and the position of the security within the respective company's capital structure. Significant increases (decreases) to any of these inputs would result in a significantly lower (higher) fair value measurement.
There were no transfers of financial assets between Levels 2 and 3 during the period.
The accompanying Notes to Financial Statements are an integral part of this statement.
Annual Report 2016
70
COLUMBIA CAPITAL ALLOCATION PORTFOLIOS
PORTFOLIO OF INVESTMENTS
Columbia Capital Allocation Aggressive Portfolio
January 31, 2016
(Percentages represent value of investments compared to net assets)
Equity Funds 71.1%
| | | Shares | | Value ($) | |
INTERNATIONAL 19.0% | |
Columbia Emerging Markets Fund,
Class I Shares(a)(b) | | | 3,465,613 | | | | 29,561,681 | | |
Columbia European Equity Fund,
Class I Shares(a) | | | 4,582,981 | | | | 27,956,188 | | |
Columbia Overseas Value Fund,
Class I Shares(a) | | | 4,647,726 | | | | 35,833,965 | | |
Columbia Pacific/Asia Fund, Class I
Shares(a) | | | 3,061,777 | | | | 26,882,402 | | |
Total | | | | | 120,234,236 | | |
U.S. LARGE CAP 48.6% | |
Columbia Contrarian Core Fund,
Class I Shares(a) | | | 2,604,980 | | | | 52,151,693 | | |
Columbia Disciplined Core Fund,
Class I Shares(a) | | | 4,206,752 | | | | 37,986,973 | | |
Columbia Disciplined Growth Fund,
Class I Shares(a) | | | 5,372,336 | | | | 41,796,774 | | |
Columbia Disciplined Value Fund,
Class I Shares(a) | | | 7,534,590 | | | | 61,708,289 | | |
Columbia Large Cap Growth Fund,
Class I Shares(a)(b) | | | 607,855 | | | | 19,104,900 | | |
Columbia Select Large Cap Equity
Fund, Class I Shares(a) | | | 4,096,043 | | | | 44,237,262 | | |
Columbia Select Large Cap Growth
Fund, Class I Shares(a)(b) | | | 1,889,926 | | | | 27,781,906 | | |
Columbia Select Large-Cap Value
Fund, Class I Shares(a) | | | 1,176,170 | | | | 23,194,074 | | |
Total | | | | | 307,961,871 | | |
U.S. SMALL CAP 3.5% | |
Columbia Multi-Advisor Small Cap
Value Fund, Class I Shares(a) | | | 1,076,972 | | | | 5,934,117 | | |
Columbia Select Smaller-Cap Value
Fund, Class I Shares(a)(b) | | | 252,247 | | | | 4,416,840 | | |
Columbia Small Cap Core Fund,
Class I Shares(a) | | | 860,055 | | | | 9,477,811 | | |
Columbia Small Cap Growth Fund I,
Class I Shares(a)(b) | | | 168,715 | | | | 2,599,891 | | |
Total | | | | | 22,428,659 | | |
Total Equity Funds
(Cost: $456,057,663) | | | | | 450,624,766 | | |
Fixed-Income Funds 14.8%
| | | Shares | | Value ($) | |
EMERGING MARKETS 0.5% | |
Columbia Emerging Markets Bond
Fund, Class I Shares(a) | | | 321,005 | | | | 3,238,938 | | |
HIGH YIELD 7.0% | |
Columbia High Yield Bond Fund,
Class I Shares(a) | | | 8,467,828 | | | | 23,032,492 | | |
Columbia Income Opportunities
Fund, Class I Shares(a) | | | 2,304,472 | | | | 21,132,007 | | |
Total | | | | | 44,164,499 | | |
INVESTMENT GRADE 7.3% | |
Columbia Corporate Income Fund,
Class I Shares(a) | | | 2,769,544 | | | | 25,812,151 | | |
Columbia Mortgage Opportunities
Fund, Class I Shares(a) | | | 406,485 | | | | 3,853,483 | | |
Columbia U.S. Government
Mortgage Fund, Class I Shares(a) | | | 3,042,073 | | | | 16,579,297 | | |
Total | | | | | 46,244,931 | | |
Total Fixed-Income Funds
(Cost: $99,284,013) | | | | | 93,648,368 | | |
Alternative Investment Funds 4.1%
Columbia Absolute Return Currency
and Income Fund, Class I Shares(a) | | | 189,149 | | | | 2,040,917 | | |
Columbia Adaptive Alternatives Fund,
Class I Shares(a) | | | 455,212 | | | | 4,269,887 | | |
Columbia Diversified Absolute
Return Fund, Class I Shares(a) | | | 1,021,514 | | | | 9,775,890 | | |
Columbia Multi-Asset Income Fund,
Class I Shares(a) | | | 1,098,776 | | | | 9,834,042 | | |
Total Alternative Investment Funds
(Cost: $27,594,306) | | | | | 25,920,736 | | |
Common Stocks 2.3%
Issuer | | Shares | | Value ($) | |
CONSUMER DISCRETIONARY 0.3% | |
Auto Components 0.1% | |
Cie Generale des Etablissements
Michelin | | | 719 | | | | 65,597 | | |
Cooper Tire & Rubber Co. | | | 2,150 | | | | 78,389 | | |
Dana Holding Corp. | | | 2,910 | | | | 34,600 | | |
Magna International, Inc. | | | 2,300 | | | | 79,906 | | |
Total | | | | | 258,492 | | |
The accompanying Notes to Financial Statements are an integral part of this statement.
Annual Report 2016
71
COLUMBIA CAPITAL ALLOCATION PORTFOLIOS
PORTFOLIO OF INVESTMENTS (continued)
Columbia Capital Allocation Aggressive Portfolio
January 31, 2016
Common Stocks (continued)
Issuer | | Shares | | Value ($) | |
Automobiles —% | |
Fuji Heavy Industries Ltd. | | | 3,000 | | | | 122,769 | | |
Peugeot SA(b) | | | 7,120 | | | | 105,872 | | |
Renault SA | | | 199 | | | | 16,886 | | |
Total | | | | | 245,527 | | |
Diversified Consumer Services —% | |
Capella Education Co. | | | 450 | | | | 19,760 | | |
New Oriental Education & Technology
Group, Inc., ADR | | | 900 | | | | 28,269 | | |
Total | | | | | 48,029 | | |
Hotels, Restaurants & Leisure 0.1% | |
Cracker Barrel Old Country Store, Inc. | | | 610 | | | | 80,050 | | |
Denny's Corp.(b) | | | 5,775 | | | | 54,112 | | |
Flight Centre Travel Group Ltd. | | | 4,001 | | | | 111,813 | | |
Isle of Capri Casinos, Inc.(b) | | | 1,550 | | | | 19,623 | | |
Jack in the Box, Inc. | | | 1,055 | | | | 81,910 | | |
Marriott Vacations Worldwide Corp. | | | 1,085 | | | | 53,588 | | |
Papa John's International, Inc. | | | 50 | | | | 2,388 | | |
Ruth's Hospitality Group, Inc. | | | 1,585 | | | | 25,756 | | |
Total | | | | | 429,240 | | |
Household Durables —% | |
Helen of Troy Ltd.(b) | | | 755 | | | | 67,474 | | |
Iida Group Holdings Co., Ltd. | | | 3,700 | | | | 65,960 | | |
Persimmon PLC | | | 3,753 | | | | 109,510 | | |
Zagg, Inc.(b) | | | 950 | | | | 8,759 | | |
Total | | | | | 251,703 | | |
Internet & Catalog Retail —% | |
PetMed Express, Inc. | | | 2,245 | | | | 40,455 | | |
Leisure Products —% | |
Sturm Ruger & Co., Inc. | | | 1,245 | | | | 73,268 | | |
Media —% | |
Gray Television, Inc.(b) | | | 1,725 | | | | 22,684 | | |
Nexstar Broadcasting Group, Inc.,
Class A | | | 1,330 | | | | 60,129 | | |
Total | | | | | 82,813 | | |
Multiline Retail —% | |
Marks & Spencer Group PLC | | | 13,481 | | | | 81,856 | | |
Specialty Retail 0.1% | |
American Eagle Outfitters, Inc. | | | 2,050 | | | | 30,012 | | |
Cato Corp. (The), Class A | | | 1,645 | | | | 66,343 | | |
Common Stocks (continued)
Issuer | | Shares | | Value ($) | |
Children's Place, Inc. (The) | | | 1,105 | | | | 71,935 | | |
Guess?, Inc. | | | 1,400 | | | | 25,956 | | |
Outerwall, Inc. | | | 1,840 | | | | 62,192 | | |
Total | | | | | 256,438 | | |
Textiles, Apparel & Luxury Goods —% | |
Movado Group, Inc. | | | 2,375 | | | | 61,037 | | |
Oxford Industries, Inc. | | | 1,160 | | | | 81,038 | | |
Wolverine World Wide, Inc. | | | 3,925 | | | | 66,372 | | |
Total | | | | | 208,447 | | |
Total Consumer Discretionary | | | | | 1,976,268 | | |
CONSUMER STAPLES 0.1% | |
Beverages —% | |
Ambev SA | | | 22,300 | | | | 104,035 | | |
Food & Staples Retailing 0.1% | |
Alimentation Couche-Tard, Inc.,
Class B | | | 1,900 | | | | 82,706 | | |
Ingles Markets, Inc., Class A | | | 290 | | | | 11,124 | | |
Koninklijke Ahold NV | | | 5,489 | | | | 124,159 | | |
SUPERVALU, Inc.(b) | | | 4,210 | | | | 19,156 | | |
Wal-Mart de Mexico SAB de CV,
Class V | | | 43,504 | | | | 109,205 | | |
Total | | | | | 346,350 | | |
Food Products —% | |
Cal-Maine Foods, Inc. | | | 1,490 | | | | 75,200 | | |
Dean Foods Co. | | | 4,025 | | | | 80,419 | | |
JBS SA | | | 7,900 | | | | 21,331 | | |
Sanderson Farms, Inc. | | | 975 | | | | 79,190 | | |
WH Group Ltd.(b) | | | 77,500 | | | | 44,378 | | |
Total | | | | | 300,518 | | |
Household Products —% | |
Reckitt Benckiser Group PLC | | | 597 | | | | 53,098 | | |
Svenska Cellulosa AB, Class B | | | 2,086 | | | | 61,824 | | |
Total | | | | | 114,922 | | |
Personal Products —% | |
Usana Health Sciences, Inc.(b) | | | 450 | | | | 57,105 | | |
Tobacco —% | |
Japan Tobacco, Inc. | | | 2,800 | | | | 109,658 | | |
Universal Corp. | | | 440 | | | | 24,081 | | |
Total | | | | | 133,739 | | |
Total Consumer Staples | | | | | 1,056,669 | | |
The accompanying Notes to Financial Statements are an integral part of this statement.
Annual Report 2016
72
COLUMBIA CAPITAL ALLOCATION PORTFOLIOS
PORTFOLIO OF INVESTMENTS (continued)
Columbia Capital Allocation Aggressive Portfolio
January 31, 2016
Common Stocks (continued)
Issuer | | Shares | | Value ($) | |
ENERGY 0.1% | |
Energy Equipment & Services —% | |
Oil States International, Inc.(b) | | | 1,465 | | | | 41,357 | | |
Oil, Gas & Consumable Fuels 0.1% | |
Alon USA Energy, Inc. | | | 2,175 | | | | 27,362 | | |
MOL Hungarian Oil and Gas NyRt | | | 331 | | | | 16,094 | | |
OMV AG | | | 1,454 | | | | 37,426 | | |
PDC Energy, Inc.(b) | | | 1,515 | | | | 86,158 | | |
Polski Koncern Naftowy Orlen SA | | | 2,250 | | | | 34,506 | | |
REX American Resources Corp.(b) | | | 1,349 | | | | 72,077 | | |
Royal Dutch Shell PLC, Class B | | | 5,653 | | | | 123,167 | | |
S-Oil Corp. | | | 1,719 | | | | 113,174 | | |
SK Innovation Co., Ltd.(b) | | | 716 | | | | 79,128 | | |
Western Refining, Inc. | | | 860 | | | | 28,294 | | |
Total | | | | | 617,386 | | |
Total Energy | | | | | 658,743 | | |
FINANCIALS 0.6% | |
Banks 0.2% | |
Abu Dhabi Commercial Bank PJSC | | | 20,876 | | | | 34,556 | | |
Banc of California, Inc. | | | 3,725 | | | | 56,248 | | |
Banco Latinoamericano de Comercio
Exterior SA, Class E | | | 2,110 | | | | 49,205 | | |
Banco Santander Brasil SA | | | 16,104 | | | | 52,542 | | |
Bank of China Ltd., Class H | | | 254,000 | | | | 99,459 | | |
Bank of Communications Co., Ltd.,
Class H | | | 28,000 | | | | 17,119 | | |
Bank of Montreal | | | 700 | | | | 37,586 | | |
BBCN Bancorp, Inc. | | | 2,375 | | | | 36,100 | | |
Canadian Imperial Bank of Commerce | | | 1,600 | | | | 104,207 | | |
Central Pacific Financial Corp. | | | 3,355 | | | | 70,287 | | |
China Merchants Bank Co., Ltd.,
Class H | | | 15,500 | | | | 30,130 | | |
Credit Agricole SA | | | 8,917 | | | | 88,983 | | |
Customers Bancorp, Inc.(b) | | | 2,305 | | | | 57,856 | | |
Erste Group Bank AG(b) | | | 1,223 | | | | 35,328 | | |
First BanCorp(b) | | | 7,800 | | | | 20,280 | | |
First NBC Bank Holding Co.(b) | | | 1,960 | | | | 61,525 | | |
Hilltop Holdings, Inc.(b) | | | 625 | | | | 9,981 | | |
HSBC Holdings PLC | | | 20,885 | | | | 147,292 | | |
International Bancshares Corp. | | | 2,295 | | | | 53,221 | | |
Common Stocks (continued)
Issuer | | Shares | | Value ($) | |
KBC Groep NV | | | 108 | | | | 6,189 | | |
Mitsubishi UFJ Financial Group, Inc. | | | 12,400 | | | | 63,586 | | |
Nordea Bank AB | | | 7,619 | | | | 76,721 | | |
Opus Bank | | | 290 | | | | 9,567 | | |
Societe Generale SA | | | 336 | | | | 12,818 | | |
Sumitomo Mitsui Financial Group, Inc. | | | 3,000 | | | | 100,646 | | |
Woori Finance Holdings Co., Ltd. | | | 6,327 | | | | 46,766 | | |
Total | | | | | 1,378,198 | | |
Capital Markets —% | |
| 3i Group PLC | | | 1,337 | | | | 8,477 | | |
Arlington Asset Investment Corp.,
Class A | | | 4,680 | | | | 51,948 | | |
Cowen Group, Inc., Class A(b) | | | 8,300 | | | | 23,738 | | |
KCG Holdings, Inc., Class A(b) | | | 2,450 | | | | 25,039 | | |
Total | | | | | 109,202 | | |
Consumer Finance —% | |
Cash America International, Inc. | | | 2,350 | | | | 70,359 | | |
Nelnet, Inc., Class A | | | 1,805 | | | | 58,608 | | |
Total | | | | | 128,967 | | |
Diversified Financial Services —% | |
EXOR SpA | | | 2,339 | | | | 76,249 | | |
Insurance 0.1% | |
Ageas | | | 2,237 | | | | 90,847 | | |
Allianz SE, Registered Shares | | | 814 | | | | 131,735 | | |
American Equity Investment Life
Holding Co. | | | 1,877 | | | | 34,143 | | |
Employers Holdings, Inc. | | | 895 | | | | 22,294 | | |
HCI Group, Inc. | | | 570 | | | | 18,952 | | |
Heritage Insurance Holdings, Inc. | | | 3,495 | | | | 69,271 | | |
Maiden Holdings Ltd. | | | 4,875 | | | | 62,400 | | |
Muenchener Rueckversicherungs-
Gesellschaft AG in Muenchen,
Registered Shares | | | 539 | | | | 103,850 | | |
Power Corp. of Canada | | | 4,600 | | | | 97,556 | | |
Swiss Re AG | | | 1,275 | | | | 118,685 | | |
Universal Insurance Holdings, Inc. | | | 3,411 | | | | 63,922 | | |
Total | | | | | 813,655 | | |
Real Estate Investment Trusts (REITs) 0.2% | |
AG Mortgage Investment Trust, Inc. | | | 1,025 | | | | 12,023 | | |
American Assets Trust, Inc. | | | 700 | | | | 26,173 | | |
Apollo Residential Mortgage, Inc. | | | 1,900 | | | | 20,615 | | |
The accompanying Notes to Financial Statements are an integral part of this statement.
Annual Report 2016
73
COLUMBIA CAPITAL ALLOCATION PORTFOLIOS
PORTFOLIO OF INVESTMENTS (continued)
Columbia Capital Allocation Aggressive Portfolio
January 31, 2016
Common Stocks (continued)
Issuer | | Shares | | Value ($) | |
Coresite Realty Corp. | | | 1,240 | | | | 79,534 | | |
Cousins Properties, Inc. | | | 1,550 | | | | 13,361 | | |
CubeSmart | | | 3,100 | | | | 96,999 | | |
CyrusOne, Inc. | | | 920 | | | | 33,902 | | |
CYS Investments, Inc. | | | 10,150 | | | | 69,933 | | |
DuPont Fabros Technology, Inc. | | | 2,420 | | | | 80,271 | | |
Hersha Hospitality Trust | | | 975 | | | | 17,131 | | |
Mack-Cali Realty Corp. | | | 2,875 | | | | 59,771 | | |
Ryman Hospitality Properties, Inc. | | | 1,620 | | | | 76,059 | | |
Sovran Self Storage, Inc. | | | 810 | | | | 91,271 | | |
STORE Capital Corp. | | | 2,875 | | | | 71,271 | | |
Summit Hotel Properties, Inc. | | | 5,750 | | | | 58,363 | | |
Sunstone Hotel Investors, Inc. | | | 6,413 | | | | 76,190 | | |
Total | | | | | 882,867 | | |
Real Estate Management & Development —% | |
Wheelock & Co., Ltd. | | | 5,000 | | | | 19,142 | | |
Thrifts & Mortgage Finance 0.1% | |
BofI Holding, Inc.(b) | | | 2,000 | | | | 34,320 | | |
Flagstar Bancorp, Inc.(b) | | | 2,150 | | | | 40,098 | | |
HomeStreet, Inc.(b) | | | 1,925 | | | | 39,424 | | |
MGIC Investment Corp.(b) | | | 10,585 | | | | 70,073 | | |
Radian Group, Inc. | | | 5,935 | | | | 59,706 | | |
Walker & Dunlop, Inc.(b) | | | 2,670 | | | | 63,973 | | |
Washington Federal, Inc. | | | 3,275 | | | | 69,921 | | |
Total | | | | | 377,515 | | |
Total Financials | | | | | 3,785,795 | | |
HEALTH CARE 0.3% | |
Biotechnology 0.1% | |
ACADIA Pharmaceuticals, Inc.(b) | | | 780 | | | | 16,138 | | |
Acorda Therapeutics, Inc.(b) | | | 885 | | | | 32,586 | | |
Alder Biopharmaceuticals, Inc.(b) | | | 875 | | | | 21,158 | | |
AMAG Pharmaceuticals, Inc.(b) | | | 1,010 | | | | 23,139 | | |
Anacor Pharmaceuticals, Inc.(b) | | | 580 | | | | 43,575 | | |
ARIAD Pharmaceuticals, Inc.(b) | | | 2,710 | | | | 13,604 | | |
Arrowhead Research Corp.(b) | | | 4,800 | | | | 16,704 | | |
Curis, Inc.(b) | | | 5,603 | | | | 9,189 | | |
Dynavax Technologies Corp.(b) | | | 1,700 | | | | 40,953 | | |
Infinity Pharmaceuticals, Inc.(b) | | | 3,535 | | | | 21,952 | | |
Common Stocks (continued)
Issuer | | Shares | | Value ($) | |
Insmed, Inc.(b) | | | 900 | | | | 11,880 | | |
Insys Therapeutics, Inc.(b) | | | 1,160 | | | | 20,126 | | |
Keryx Biopharmaceuticals, Inc.(b) | | | 6,355 | | | | 22,433 | | |
Neurocrine Biosciences, Inc.(b) | | | 750 | | | | 31,913 | | |
Novavax, Inc.(b) | | | 6,525 | | | | 33,604 | | |
Portola Pharmaceuticals, Inc.(b) | | | 235 | | | | 7,762 | | |
Spark Therapeutics, Inc.(b) | | | 1,085 | | | | 30,564 | | |
TESARO, Inc.(b) | | | 220 | | | | 7,599 | | |
Ultragenyx Pharmaceutical, Inc.(b) | | | 490 | | | | 27,514 | | |
vTv Therapeutics, Inc., Class A(b) | | | 1,777 | | | | 12,883 | | |
Total | | | | | 445,276 | | |
Health Care Equipment & Supplies —% | |
Analogic Corp. | | | 845 | | | | 62,589 | | |
LivaNova PLC(b) | | | 1,390 | | | | 77,812 | | |
Merit Medical Systems, Inc.(b) | | | 4,175 | | | | 69,097 | | |
Orthofix International NV(b) | | | 1,700 | | | | 67,099 | | |
Total | | | | | 276,597 | | |
Health Care Providers & Services 0.1% | |
Alfresa Holdings Corp. | | | 2,400 | | | | 44,715 | | |
Chemed Corp. | | | 60 | | | | 8,419 | | |
LHC Group, Inc.(b) | | | 470 | | | | 17,822 | | |
Magellan Health, Inc.(b) | | | 1,220 | | | | 69,540 | | |
Medipal Holdings Corp. | | | 5,400 | | | | 87,586 | | |
Molina Healthcare, Inc.(b) | | | 1,360 | | | | 74,678 | | |
Owens & Minor, Inc. | | | 300 | | | | 10,395 | | |
PharMerica Corp.(b) | | | 915 | | | | 27,166 | | |
Triple-S Management Corp., Class B(b) | | | 2,470 | | | | 55,056 | | |
WellCare Health Plans, Inc.(b) | | | 380 | | | | 28,873 | | |
Total | | | | | 424,250 | | |
Life Sciences Tools & Services —% | |
Affymetrix, Inc.(b) | | | 690 | | | | 9,681 | | |
Cambrex Corp.(b) | | | 1,605 | | | | 55,597 | | |
INC Research Holdings, Inc. Class A(b) | | | 1,490 | | | | 62,774 | | |
PAREXEL International Corp.(b) | | | 495 | | | | 31,660 | | |
Total | | | | | 159,712 | | |
Pharmaceuticals 0.1% | |
GlaxoSmithKline PLC | | | 1,134 | | | | 23,361 | | |
Novo Nordisk A/S, Class B | | | 1,872 | | | | 104,586 | | |
Pernix Therapeutics Holdings, Inc.(b) | | | 4,200 | | | | 9,156 | | |
The accompanying Notes to Financial Statements are an integral part of this statement.
Annual Report 2016
74
COLUMBIA CAPITAL ALLOCATION PORTFOLIOS
PORTFOLIO OF INVESTMENTS (continued)
Columbia Capital Allocation Aggressive Portfolio
January 31, 2016
Common Stocks (continued)
Issuer | | Shares | | Value ($) | |
Roche Holding AG, Genusschein
Shares | | | 649 | | | | 168,107 | | |
Sanofi | | | 1,292 | | | | 107,443 | | |
Sucampo Pharmaceuticals, Inc.,
Class A(b) | | | 4,100 | | | | 51,865 | | |
Teva Pharmaceutical Industries Ltd. | | | 1,571 | | | | 96,533 | | |
Total | | | | | 561,051 | | |
Total Health Care | | | | | 1,866,886 | | |
INDUSTRIALS 0.3% | |
Aerospace & Defense —% | |
Cubic Corp. | | | 580 | | | | 23,177 | | |
Moog, Inc., Class A(b) | | | 1,350 | | | | 62,545 | | |
Total | | | | | 85,722 | | |
Air Freight & Logistics —% | |
Air Transport Services Group, Inc.(b) | | | 4,580 | | | | 44,563 | | |
Royal Mail PLC | | | 15,488 | | | | 101,824 | | |
Total | | | | | 146,387 | | |
Airlines —% | |
Hawaiian Holdings, Inc.(b) | | | 1,120 | | | | 39,435 | | |
Japan Airlines Co., Ltd. | | | 2,600 | | | | 97,587 | | |
Total | | | | | 137,022 | | |
Building Products —% | |
Continental Building Product(b) | | | 3,860 | | | | 57,668 | | |
Commercial Services & Supplies —% | |
Deluxe Corp. | | | 1,550 | | | | 86,645 | | |
Interface, Inc. | | | 950 | | | | 16,046 | | |
Quad/Graphics, Inc. | | | 5,000 | | | | 50,400 | | |
West Corp. | | | 950 | | | | 17,204 | | |
Total | | | | | 170,295 | | |
Construction & Engineering 0.1% | |
EMCOR Group, Inc. | | | 1,770 | | | | 80,889 | | |
Leighton Holdings Ltd. | | | 5,416 | | | | 93,411 | | |
VINCI SA | | | 1,759 | | | | 119,168 | | |
Total | | | | | 293,468 | | |
Electrical Equipment 0.1% | |
EnerSys | | | 1,280 | | | | 61,991 | | |
General Cable Corp. | | | 4,900 | | | | 57,428 | | |
OSRAM Licht AG | | | 1,029 | | | | 45,941 | | |
Common Stocks (continued)
Issuer | | Shares | | Value ($) | |
Prysmian SpA | | | 1,984 | | | | 40,821 | | |
Vestas Wind Systems A/S | | | 1,867 | | | | 122,166 | | |
Total | | | | | 328,347 | | |
Machinery 0.1% | |
Barnes Group, Inc. | | | 400 | | | | 13,004 | | |
Global Brass & Copper Holdings, Inc. | | | 1,575 | | | | 32,618 | | |
Kadant, Inc. | | | 1,195 | | | | 46,378 | | |
Mueller Industries, Inc. | | | 2,385 | | | | 60,698 | | |
PT United Tractors Tbk | | | 88,000 | | | | 112,470 | | |
Wabash National Corp.(b) | | | 6,700 | | | | 74,102 | | |
Total | | | | | 339,270 | | |
Marine —% | |
Kuehne & Nagel International AG | | | 168 | | | | 22,235 | | |
Matson, Inc. | | | 1,915 | | | | 77,385 | | |
Total | | | | | 99,620 | | |
Professional Services —% | |
Insperity, Inc. | | | 90 | | | | 4,044 | | |
RPX Corp.(b) | | | 5,570 | | | | 64,500 | | |
Total | | | | | 68,544 | | |
Road & Rail —% | |
ArcBest Corp. | | | 1,880 | | | | 38,596 | | |
Trading Companies & Distributors —% | |
Applied Industrial Technologies, Inc. | | | 880 | | | | 33,827 | | |
MRC Global, Inc.(b) | | | 3,125 | | | | 31,407 | | |
Total | | | | | 65,234 | | |
Total Industrials | | | | | 1,830,173 | | |
INFORMATION TECHNOLOGY 0.3% | |
Communications Equipment —% | |
NETGEAR, Inc.(b) | | | 1,855 | | | | 69,321 | | |
Plantronics, Inc. | | | 225 | | | | 10,087 | | |
Polycom, Inc.(b) | | | 4,200 | | | | 42,798 | | |
Total | | | | | 122,206 | | |
Electronic Equipment, Instruments & Components 0.1% | |
Benchmark Electronics, Inc.(b) | | | 2,825 | | | | 59,325 | | |
Checkpoint Systems, Inc. | | | 2,943 | | | | 19,071 | | |
Chimei Innolux Corp. | | | 341,000 | | | | 97,461 | | |
Coherent, Inc.(b) | | | 175 | | | | 13,522 | | |
Delta Electronics Thailand PCL(b) | | | 3,700 | | | | 8,268 | | |
Hon Hai Precision Industry Co., Ltd. | | | 46,000 | | | | 108,220 | | |
The accompanying Notes to Financial Statements are an integral part of this statement.
Annual Report 2016
75
COLUMBIA CAPITAL ALLOCATION PORTFOLIOS
PORTFOLIO OF INVESTMENTS (continued)
Columbia Capital Allocation Aggressive Portfolio
January 31, 2016
Common Stocks (continued)
Issuer | | Shares | | Value ($) | |
Insight Enterprises, Inc.(b) | | | 1,090 | | | | 25,757 | | |
MTS Systems Corp. | | | 200 | | | | 10,680 | | |
SYNNEX Corp. | | | 900 | | | | 75,555 | | |
Tech Data Corp.(b) | | | 1,200 | | | | 74,880 | | |
Total | | | | | 492,739 | | |
Internet Software & Services 0.1% | |
DHI Group, Inc.(b) | | | 4,985 | | | | 46,410 | | |
EarthLink Holdings Corp. | | | 9,350 | | | | 55,352 | | |
j2 Global, Inc. | | | 645 | | | | 46,769 | | |
LogMeIn, Inc.(b) | | | 1,325 | | | | 69,218 | | |
NetEase, Inc., ADR | | | 600 | | | | 93,684 | | |
RetailMeNot, Inc.(b) | | | 7,572 | | | | 68,905 | | |
Web.com Group, Inc.(b) | | | 3,450 | | | | 64,964 | | |
Total | | | | | 445,302 | | |
IT Services 0.1% | |
CGI Group, Inc., Class A(b) | | | 2,000 | | | | 85,716 | | |
Convergys Corp. | | | 289 | | | | 7,063 | | |
CSG Systems International, Inc. | | | 980 | | | | 34,241 | | |
EVERTEC, Inc. | | | 3,990 | | | | 54,823 | | |
NeuStar, Inc., Class A(b) | | | 3,155 | | | | 77,550 | | |
Sykes Enterprises, Inc.(b) | | | 2,130 | | | | 62,707 | | |
Syntel, Inc.(b) | | | 220 | | | | 10,415 | | |
Total | | | | | 332,515 | | |
Semiconductors & Semiconductor Equipment —% | |
Amkor Technology, Inc.(b) | | | 11,390 | | | | 69,935 | | |
Cabot Microelectronics Corp.(b) | | | 735 | | | | 29,870 | | |
Cirrus Logic, Inc.(b) | | | 360 | | | | 12,499 | | |
Diodes, Inc.(b) | | | 2,990 | | | | 57,199 | | |
Entegris, Inc.(b) | | | 800 | | | | 9,328 | | |
Silicon Laboratories, Inc.(b) | | | 380 | | | | 17,328 | | |
Taiwan Semiconductor Manufacturing
Co., Ltd. | | | 13,000 | | | | 55,977 | | |
Veeco Instruments, Inc.(b) | | | 625 | | | | 11,650 | | |
Xcerra Corp.(b) | | | 6,060 | | | | 33,209 | | |
Total | | | | | 296,995 | | |
Software —% | |
Aspen Technology, Inc.(b) | | | 2,305 | | | | 74,774 | | |
AVG Technologies NV(b) | | | 3,230 | | | | 60,950 | | |
Check Point Software Technologies Ltd.(b) | | | 100 | | | | 7,881 | | |
Common Stocks (continued)
Issuer | | Shares | | Value ($) | |
Gigamon, Inc.(b) | | | 1,600 | | | | 41,840 | | |
Progress Software Corp.(b) | | | 975 | | | | 25,243 | | |
RealPage, Inc.(b) | | | 1,800 | | | | 34,722 | | |
VASCO Data Security International, Inc.(b) | | | 1,750 | | | | 27,125 | | |
Total | | | | | 272,535 | | |
Technology Hardware, Storage & Peripherals —% | |
Asustek Computer, Inc. | | | 2,000 | | | | 16,214 | | |
Foxconn Technology Co., Ltd. | | | 2,000 | | | | 3,874 | | |
FUJIFILM Holdings Corp. | | | 1,400 | | | | 54,093 | | |
Total | | | | | 74,181 | | |
Total Information Technology | | | | | 2,036,473 | | |
MATERIALS 0.1% | |
Chemicals —% | |
Chemtura Corp.(b) | | | 2,895 | | | | 75,965 | | |
Innophos Holdings, Inc. | | | 700 | | | | 18,697 | | |
Innospec, Inc. | | | 1,470 | | | | 73,280 | | |
Mitsubishi Chemical Holdings Corp. | | | 16,200 | | | | 90,351 | | |
Total | | | | | 258,293 | | |
Construction Materials —% | |
US Concrete, Inc.(b) | | | 700 | | | | 31,836 | | |
Metals & Mining 0.1% | |
Commercial Metals Co. | | | 2,283 | | | | 31,779 | | |
Eregli Demir ve Celik Fabrikalari TAS | | | 58,779 | | | | 61,702 | | |
Materion Corp. | | | 2,020 | | | | 49,470 | | |
Rio Tinto PLC | | | 4,086 | | | | 100,196 | | |
Severstal PAO | | | 5,505 | | | | 45,383 | | |
Total | | | | | 288,530 | | |
Paper & Forest Products —% | |
Stora Enso OYJ, Class R | | | 758 | | | | 6,177 | | |
UPM-Kymmene OYJ | | | 5,982 | | | | 97,488 | | |
Total | | | | | 103,665 | | |
Total Materials | | | | | 682,324 | | |
TELECOMMUNICATION SERVICES 0.1% | |
Diversified Telecommunication Services 0.1% | |
China Telecom Corp., Ltd., Class H | | | 104,000 | | | | 48,916 | | |
General Communication, Inc., Class A(b) | | | 3,115 | | | | 56,444 | | |
Nippon Telegraph & Telephone Corp. | | | 3,000 | | | | 127,718 | | |
Telstra Corp., Ltd. | | | 2,035 | | | | 8,199 | | |
The accompanying Notes to Financial Statements are an integral part of this statement.
Annual Report 2016
76
COLUMBIA CAPITAL ALLOCATION PORTFOLIOS
PORTFOLIO OF INVESTMENTS (continued)
Columbia Capital Allocation Aggressive Portfolio
January 31, 2016
Common Stocks (continued)
Issuer | | Shares | | Value ($) | |
Turk Telekomunikasyon AS | | | 11,867 | | | | 21,738 | | |
Total | | | | | 263,015 | | |
Wireless Telecommunication Services —% | |
China Mobile Ltd. | | | 10,500 | | | | 115,334 | | |
Shenandoah Telecommunications Co. | | | 1,800 | | | | 41,364 | | |
Total | | | | | 156,698 | | |
Total Telecommunication Services | | | | | 419,713 | | |
UTILITIES 0.1% | |
Electric Utilities 0.1% | |
Chubu Electric Power Co., Inc. | | | 600 | | | | 7,706 | | |
Endesa SA | | | 2,652 | | | | 51,341 | | |
IDACORP, Inc. | | | 990 | | | | 68,894 | | |
Korea Electric Power Corp.(b) | | | 2,458 | | | | 107,902 | | |
Tokyo Electric Power Co., Inc.(b) | | | 2,000 | | | | 10,050 | | |
Transmissora Alianca de Energia
Eletrica SA | | | 6,600 | | | | 28,695 | | |
Total | | | | | 274,588 | | |
Gas Utilities —% | |
Chesapeake Utilities Corp. | | | 985 | | | | 62,025 | | |
New Jersey Resources Corp. | | | 1,885 | | | | 66,390 | | |
Southwest Gas Corp. | | | 1,360 | | | | 80,009 | | |
WGL Holdings, Inc. | | | 265 | | | | 17,699 | | |
Total | | | | | 226,123 | | |
Common Stocks (continued)
Issuer | | Shares | | Value ($) | |
Multi-Utilities —% | |
RWE AG | | | 476 | | | | 6,668 | | |
Water Utilities —% | |
SJW Corp. | | | 1,370 | | | | 44,662 | | |
Total Utilities | | | | | 552,041 | | |
Total Common Stocks
(Cost: $16,350,612) | | | | | 14,865,085 | | |
Money Market Funds 7.4%
| | | Shares | | Value ($) | |
Columbia Short-Term Cash Fund,
0.360%(a)(c) | | | 46,742,052 | | | | 46,742,052 | | |
Total Money Market Funds
(Cost: $46,742,052) | | | | | 46,742,052 | | |
Total Investments
(Cost: $646,028,646) | | | | | 631,801,007 | | |
Other Assets & Liabilities, Net | | | | | 1,713,138 | | |
Net Assets | | | | | 633,514,145 | | |
At January 31, 2016, cash totaling $1,249,800 was pledged as collateral.
Investments in Derivatives
Forward Foreign Currency Exchange Contracts Open at January 31, 2016
Counterparty | | Exchange Date | | Currency to
be Delivered | |
| | Currency to
be Received | |
| | Unrealized
Appreciation ($) | | Unrealized
Depreciation ($) | |
JPMorgan | | 3/3/2016 | | | 405,000 | | | BRL | | | | | 98,325 | | | USD | | | | | — | | | | (2,058 | ) | |
JPMorgan | | 3/3/2016 | | | 139,000 | | | CAD | | | | | 98,658 | | | USD | | | | | — | | | | (564 | ) | |
JPMorgan | | 3/3/2016 | | | 472,000 | | | CNY | | | | | 70,672 | | | USD | | | | | — | | | | (789 | ) | |
JPMorgan | | 3/3/2016 | | | 914,000 | | | DKK | | | | | 133,284 | | | USD | | | | | 506 | | | | — | | |
JPMorgan | | 3/3/2016 | | | 468,806,000 | | | IDR | | | | | 33,040 | | | USD | | | | | — | | | | (1,067 | ) | |
JPMorgan | | 3/3/2016 | | | 286,000 | | | ILS | | | | | 72,910 | | | USD | | | | | 650 | | | | — | | |
JPMorgan | | 3/3/2016 | | | 166,478,000 | | | KRW | | | | | 138,512 | | | USD | | | | | 870 | | | | — | | |
JPMorgan | | 3/3/2016 | | | 693,000 | | | MXN | | | | | 39,057 | | | USD | | | | | 925 | | | | — | | |
The accompanying Notes to Financial Statements are an integral part of this statement.
Annual Report 2016
77
COLUMBIA CAPITAL ALLOCATION PORTFOLIOS
PORTFOLIO OF INVESTMENTS (continued)
Columbia Capital Allocation Aggressive Portfolio
January 31, 2016
Forward Foreign Currency Exchange Contracts Open at January 31, 2016 (continued)
Counterparty | | Exchange Date | | Currency to
be Delivered | |
| | Currency to
be Received | |
| | Unrealized
Appreciation ($) | | Unrealized
Depreciation ($) | |
JPMorgan | | 3/3/2016 | | | 58,000 | | | PLN | | | | | 14,457 | | | USD | | | | | 249 | | | | — | | |
JPMorgan | | 3/3/2016 | | | 81,000 | | | TRY | | | | | 26,452 | | | USD | | | | | — | | | | (730 | ) | |
JPMorgan | | 3/3/2016 | | | 3,827,000 | | | TWD | | | | | 113,812 | | | USD | | | | | — | | | | (427 | ) | |
JPMorgan | | 3/3/2016 | | | 111,024 | | | USD | | | | | 159,000 | | | AUD | | | | | 1,353 | | | | — | | |
JPMorgan | | 3/3/2016 | | | 133,244 | | | USD | | | | | 133,000 | | | CHF | | | | | — | | | | (3,261 | ) | |
JPMorgan | | 3/3/2016 | | | 56,662 | | | USD | | | | | 52,000 | | | EUR | | | | | — | | | | (292 | ) | |
JPMorgan | | 3/3/2016 | | | 170,652 | | | USD | | | | | 117,000 | | | GBP | | | | | — | | | | (3,933 | ) | |
JPMorgan | | 3/3/2016 | | | 118,628 | | | USD | | | | | 7,987,000 | | | INR | | | | | — | | | | (1,525 | ) | |
JPMorgan | | 3/3/2016 | | | 110,484 | | | USD | | | | | 13,008,000 | | | JPY | | | | | — | | | | (2,983 | ) | |
JPMorgan | | 3/3/2016 | | | 25,648 | | | USD | | | | | 113,000 | | | MYR | | | | | 1,641 | | | | — | | |
JPMorgan | | 3/3/2016 | | | 19,831 | | | USD | | | | | 177,000 | | | NOK | | | | | 551 | | | | — | | |
JPMorgan | | 3/3/2016 | | | 18,858 | | | USD | | | | | 911,000 | | | PHP | | | | | 149 | | | | — | | |
JPMorgan | | 3/3/2016 | | | 59,158 | | | USD | | | | | 85,000 | | | SGD | | | | | 475 | | | | — | | |
JPMorgan | | 3/3/2016 | | | 18,862 | | | USD | | | | | 675,000 | | | THB | | | | | 13 | | | | — | | |
JPMorgan | | 3/3/2016 | | | 90,699 | | | USD | | | | | 1,474,000 | | | ZAR | | | | | 1,582 | | | | — | | |
Total | | | | | | | | | | | | | 8,964 | | | | (17,629 | ) | |
Futures Contracts Outstanding at January 31, 2016
Long Futures Contracts Outstanding
Contract Description | | Number of
Contracts | | Trading
Currency | | Notional
Market
Value ($) | | Expiration
Date | | Unrealized
Appreciation ($) | | Unrealized
Depreciation ($) | |
S&P MID 400 EMINI | | | 48 | | | USD | | | | | 6,311,040 | | | 03/2016 | | | — | | | | (321,958 | ) | |
S&P500 EMINI FUT | | | 146 | | | USD | | | | | 14,089,730 | | | 03/2016 | | | — | | | | (497,854 | ) | |
US 10YR NOTE (CBT) | | | 116 | | | USD | | | | | 15,031,063 | | | 03/2016 | | | 401,260 | | | | — | | |
US LONG BOND(CBT) | | | 25 | | | USD | | | | | 4,025,781 | | | 03/2016 | | | 197,611 | | | | — | | |
Total | | | | | | | 39,457,614 | | | | | | 598,871 | | | | (819,812 | ) | |
Notes to Portfolio of Investments
(a) As defined in the Investment Company Act of 1940, an affiliated company is one in which the Fund owns 5% or more of the company's outstanding voting securities, or a company which is under common ownership or control with the Fund. Holdings and transactions in these affiliated companies during the year ended January 31, 2016 are as follows:
Issuer | | Beginning
Cost ($) | | Purchase
Cost ($) | | Proceeds
From
Sales ($) | | Realized
Gain
(Loss) ($) | | Ending
Cost ($) | | Capital Gain
Distributions ($) | | Dividends —
Affiliated
Issuers ($) | | Value ($) | |
Columbia Absolute Return
Currency and Income Fund,
Class I Shares | | | 1,902,588 | | | | 330,640 | | | | (390,055 | ) | | | 48,438 | | | | 1,891,611 | | | | 174,780 | | | | 94,220 | | | | 2,040,917 | | |
Columbia Absolute Return
Emerging Markets Macro
Fund, Class I Shares | | | 6,937,261 | | | | 47,408 | | | | (6,605,319 | ) | | | (379,350 | ) | | | — | | | | — | | | | — | | | | — | | |
Columbia Adaptive
Alternatives Fund, Class I
Shares | | | — | | | | 4,536,456 | | | | — | | | | — | | | | 4,536,456 | | | | — | | | | 36,456 | | | | 4,269,887 | | |
The accompanying Notes to Financial Statements are an integral part of this statement.
Annual Report 2016
78
COLUMBIA CAPITAL ALLOCATION PORTFOLIOS
PORTFOLIO OF INVESTMENTS (continued)
Columbia Capital Allocation Aggressive Portfolio
January 31, 2016
Notes to Portfolio of Investments (continued)
Issuer | | Beginning
Cost ($) | | Purchase
Cost ($) | | Proceeds
From
Sales ($) | | Realized
Gain
(Loss) ($) | | Ending
Cost ($) | | Capital Gain
Distributions ($) | | Dividends —
Affiliated
Issuers ($) | | Value ($) | |
Columbia Commodity
Strategy Fund, Class I
Shares | | | 2,268,615 | | | | 344,799 | | | | (1,835,397 | ) | | | (778,017 | ) | | | — | | | | — | | | | — | | | | — | | |
Columbia Contrarian Core
Fund, Class I Shares | | | 56,012,736 | | | | 3,226,717 | | | | (21,484,295 | ) | | | 10,591,552 | | | | 48,346,710 | | | | 1,565,312 | | | | 1,587,469 | | | | 52,151,693 | | |
Columbia Corporate
Income Fund, Class I
Shares | | | 26,567,008 | | | | 2,332,216 | | | | (866,113 | ) | | | (29,289 | ) | | | 28,003,822 | | | | — | | | | 925,253 | | | | 25,812,151 | | |
Columbia Disciplined Core
Fund, Class I Shares | | | 23,643,554 | | | | 899,169 | | | | (966,018 | ) | | | 523,237 | | | | 24,099,942 | | | | — | | | | 672,307 | | | | 37,986,973 | | |
Columbia Disciplined
Growth Fund, Class I
Shares | | | 39,024,463 | | | | 10,351,274 | | | | (2,668,825 | ) | | | 1,009,867 | | | | 47,716,779 | | | | 5,040,134 | | | | 479,129 | | | | 41,796,774 | | |
Columbia Disciplined Value
Fund, Class I Shares | | | 63,468,892 | | | | 6,234,323 | | | | (271,246 | ) | | | (1,053 | ) | | | 69,430,916 | | | | 3,152,523 | | | | 1,218,655 | | | | 61,708,289 | | |
Columbia Diversified
Absolute Return Fund,
Class I Shares | | | — | | | | 10,711,908 | | | | (492,388 | ) | | | (10,236 | ) | | | 10,209,284 | | | | 62,660 | | | | 38,813 | | | | 9,775,890 | | |
Columbia Emerging
Markets Bond Fund, Class I
Shares | | | 3,378,691 | | | | 266,358 | | | | (73,409 | ) | | | (6,498 | ) | | | 3,565,142 | | | | — | | | | 112,320 | | | | 3,238,938 | | |
Columbia Emerging
Markets Fund, Class I
Shares | | | 29,053,969 | | | | 5,470,193 | | | | (805,547 | ) | | | 122,387 | | | | 33,841,002 | | | | — | | | | — | | | | 29,561,681 | | |
Columbia European Equity
Fund, Class I Shares | | | 32,209,543 | | | | 2,384,011 | | | | (8,350,730 | ) | | | 1,744,622 | | | | 27,987,446 | | | | 880,004 | | | | 450,826 | | | | 27,956,188 | | |
Columbia High Yield Bond
Fund, Class I Shares | | | 10,182,994 | | | | 15,145,533 | | | | (610,709 | ) | | | (42,727 | ) | | | 24,675,091 | | | | — | | | | 872,603 | | | | 23,032,492 | | |
Columbia Income
Opportunities Fund, Class I
Shares | | | 20,922,072 | | | | 1,881,887 | | | | (672,854 | ) | | | 51,802 | | | | 22,182,907 | | | | 158,309 | | | | 1,084,810 | | | | 21,132,007 | | |
Columbia Large Cap
Growth Fund, Class I
Shares | | | 12,038,342 | | | | 2,047,042 | | | | (1,936,972 | ) | | | 1,090,859 | | | | 13,239,271 | | | | 1,952,899 | | | | — | | | | 19,104,900 | | |
Columbia Mortgage
Opportunities Fund,
Class I Shares | | | 3,990,218 | | | | 317,629 | | | | (241,846 | ) | | | (3,354 | ) | | | 4,062,647 | | | | 42,363 | | | | 160,112 | | | | 3,853,483 | | |
Columbia Multi-Advisor
Small Cap Value Fund,
Class I Shares | | | 4,661,455 | | | | 998,925 | | | | (98,441 | ) | | | 58,393 | | | | 5,620,332 | | | | 566,646 | | | | 40,168 | | | | 5,934,117 | | |
Columbia Multi-Asset
Income Fund, Class I
Shares | | | — | | | | 10,956,955 | | | | — | | | | — | | | | 10,956,955 | | | | — | | | | 489,955 | | | | 9,834,042 | | |
Columbia Overseas Value
Fund, Class I Shares | | | 44,821,676 | | | | 1,558,726 | | | | (5,310,953 | ) | | | (71,424 | ) | | | 40,998,025 | | | | — | | | | 937,480 | | | | 35,833,965 | | |
Columbia Pacific/Asia
Fund, Class I Shares | | | 24,754,397 | | | | 1,219,321 | | | | (1,573,252 | ) | | | 401,629 | | | | 24,802,095 | | | | 76,482 | | | | 266,802 | | | | 26,882,402 | | |
Columbia Select Large Cap
Equity Fund, Class I Shares | | | 31,121,651 | | | | 22,168,328 | | | | (1,339,883 | ) | | | (167,752 | ) | | | 51,782,344 | | | | 3,090,609 | | | | 743,149 | | | | 44,237,262 | | |
Columbia Select Large Cap
Growth Fund, Class I
Shares | | | 23,740,336 | | | | 4,746,623 | | | | (2,324,291 | ) | | | 798,971 | | | | 26,961,639 | | | | 4,169,023 | | | | — | | | | 27,781,906 | | |
The accompanying Notes to Financial Statements are an integral part of this statement.
Annual Report 2016
79
COLUMBIA CAPITAL ALLOCATION PORTFOLIOS
PORTFOLIO OF INVESTMENTS (continued)
Columbia Capital Allocation Aggressive Portfolio
January 31, 2016
Notes to Portfolio of Investments (continued)
Issuer | | Beginning
Cost ($) | | Purchase
Cost ($) | | Proceeds
From
Sales ($) | | Realized
Gain
(Loss) ($) | | Ending
Cost ($) | | Capital Gain
Distributions ($) | | Dividends —
Affiliated
Issuers ($) | | Value ($) | |
Columbia Select Large-Cap
Value Fund, Class I Shares | | | 17,142,772 | | | | 2,107,334 | | | | (104,919 | ) | | | 45,237 | | | | 19,190,424 | | | | 687,556 | | | | 442,812 | | | | 23,194,074 | | |
Columbia Select
Smaller-Cap Value Fund,
Class I Shares | | | 4,106,564 | | | | 720,437 | | | | (311,548 | ) | | | 70,989 | | | | 4,586,442 | | | | 474,920 | | | | — | | | | 4,416,840 | | |
Columbia Short-Term
Cash Fund | | | 90,301,754 | | | | 65,050,698 | | | | (108,610,400 | ) | | | — | | | | 46,742,052 | | | | — | | | | 94,435 | | | | 46,742,052 | | |
Columbia Small Cap Core
Fund, Class I Shares | | | 9,688,963 | | | | 3,805,539 | | | | (179,192 | ) | | | 19,607 | | | | 13,334,917 | | | | 3,248,353 | | | | 17,986 | | | | 9,477,811 | | |
Columbia Small Cap
Growth Fund I, Class I
Shares | | | 3,280,485 | | | | 1,184,535 | | | | (341,287 | ) | | | (4,354 | ) | | | 4,119,379 | | | | 1,071,462 | | | | — | | | | 2,599,891 | | |
Columbia U.S. Government
Mortgage Fund, Class I
Shares | | | 16,692,905 | | | | 1,122,037 | | | | (1,015,785 | ) | | | (4,753 | ) | | | 16,794,404 | | | | 49,671 | | | | 504,081 | | | | 16,579,297 | | |
Total | | | 601,913,904 | | | | 182,167,021 | | | | (169,481,674 | ) | | | 15,078,783 | | | | 629,678,034 | | | | 26,463,706 | | | | 11,269,841 | | | | 616,935,922 | | |
(b) Non-income producing investment.
(c) The rate shown is the seven-day current annualized yield at January 31, 2016.
Abbreviation Legend
ADR American Depositary Receipt
Currency Legend
AUD Australian Dollar
BRL Brazilian Real
CAD Canadian Dollar
CHF Swiss Franc
CNY China, Yuan Renminbi
DKK Danish Krone
EUR Euro
GBP British Pound
IDR Indonesian Rupiah
ILS Israeli Shekel
INR Indian Rupee
JPY Japanese Yen
KRW Korean Won
MXN Mexican Peso
MYR Malaysia Ringgits
NOK Norwegian Krone
PHP Philippine Peso
PLN Polish Zloty
SGD Singapore Dollar
THB Thailand Baht
The accompanying Notes to Financial Statements are an integral part of this statement.
Annual Report 2016
80
COLUMBIA CAPITAL ALLOCATION PORTFOLIOS
PORTFOLIO OF INVESTMENTS (continued)
Columbia Capital Allocation Aggressive Portfolio
January 31, 2016
Currency Legend (continued)
TRY Turkish Lira
TWD Taiwan Dollar
USD US Dollar
ZAR South African Rand
Fair Value Measurements
The Fund categorizes its fair value measurements according to a three-level hierarchy that maximizes the use of observable inputs and minimizes the use of unobservable inputs by prioritizing that the most observable input be used when available. Observable inputs are those that market participants would use in pricing an investment based on market data obtained from sources independent of the reporting entity. Unobservable inputs are those that reflect the Fund's assumptions about the information market participants would use in pricing an investment. An investment's level within the fair value hierarchy is based on the lowest level of any input that is deemed significant to the asset's or liability's fair value measurement. The input levels are not necessarily an indication of the risk or liquidity associated with investments at that level. For example, certain U.S. government securities are generally high quality and liquid, however, they are reflected as Level 2 because the inputs used to determine fair value may not always be quoted prices in an active market.
Fair value inputs are summarized in the three broad levels listed below:
> Level 1 — Valuations based on quoted prices for investments in active markets that the Fund has the ability to access at the measurement date (including NAV for open-end mutual funds). Valuation adjustments are not applied to Level 1 investments.
> Level 2 — Valuations based on other significant observable inputs (including quoted prices for similar securities, interest rates, prepayment speeds, credit risks, etc.).
> Level 3 — Valuations based on significant unobservable inputs (including the Fund's own assumptions and judgment in determining the fair value of investments).
Inputs that are used in determining fair value of an investment may include price information, credit data, volatility statistics, and other factors. These inputs can be either observable or unobservable. The availability of observable inputs can vary between investments, and is affected by various factors such as the type of investment, and the volume and level of activity for that investment or similar investments in the marketplace. The inputs will be considered by the Investment Manager, along with any other relevant factors in the calculation of an investment's fair value. The Fund uses prices and inputs that are current as of the measurement date, which may include periods of market dislocations. During these periods, the availability of prices and inputs may be reduced for many investments. This condition could cause an investment to be reclassified between the various levels within the hierarchy.
Foreign equity securities actively traded in markets where there is a significant delay in the local close relative to the New York Stock Exchange (NYSE) are classified as Level 2. The values of these securities may include an adjustment to reflect the impact of significant market movements following the close of local trading, as described in Note 2 of the Notes to Financial Statements in the most recent shareholder report.
Investments falling into the Level 3 category are primarily supported by quoted prices from brokers and dealers participating in the market for those investments. However, these may be classified as Level 3 investments due to lack of market transparency and corroboration to support these quoted prices. Additionally, valuation models may be used as the pricing source for any remaining investments classified as Level 3. These models may rely on one or more significant unobservable inputs and/or significant assumptions by the Investment Manager. Inputs used in valuations may include, but are not limited to, financial statement analysis, capital account balances, discount rates and estimated cash flows, and comparable company data.
Under the direction of the Fund's Board of Trustees (the Board), the Investment Manager's Valuation Committee (the Committee) is responsible for overseeing the valuation procedures approved by the Board. The Committee consists of voting and non-voting members from various groups within the Investment Manager's organization, including operations and accounting, trading and investments, compliance, risk management and legal.
The Committee meets at least monthly to review and approve valuation matters, which may include a description of specific valuation determinations, data regarding pricing information received from approved pricing vendors and brokers and the results of Board-approved valuation control policies and procedures (the Policies). The Policies address, among other things, instances when market quotations are or are not readily available, including recommendations of third party pricing vendors and a determination of appropriate pricing methodologies; events that require specific valuation determinations and assessment of fair value techniques; securities with a potential for stale pricing, including those that are illiquid, restricted, or in default; and the effectiveness of third party pricing vendors, including periodic reviews of vendors. The Committee meets more frequently, as needed, to discuss additional valuation matters, which may include the need to review back-testing results, review time-sensitive information or approve related valuation actions. The Committee reports to the Board, with members of the Committee meeting with the Board at each of its regularly scheduled meetings to discuss valuation matters and actions during the period, similar to those described earlier.
The accompanying Notes to Financial Statements are an integral part of this statement.
Annual Report 2016
81
COLUMBIA CAPITAL ALLOCATION PORTFOLIOS
PORTFOLIO OF INVESTMENTS (continued)
Columbia Capital Allocation Aggressive Portfolio
January 31, 2016
Fair Value Measurements (continued)
For investments categorized as Level 3, the Committee monitors information similar to that described above, which may include: (i) data specific to the issuer or comparable issuers, (ii) general market or specific sector news and (iii) quoted prices and specific or similar security transactions. The Committee considers this data and any changes from prior periods in order to assess the reasonableness of observable and unobservable inputs, any assumptions or internal models used to value those securities and changes in fair value. This data is also used to corroborate, when available, information received from approved pricing vendors and brokers. Various factors impact the frequency of monitoring this information (which may occur as often as daily). However, the Committee may determine that changes to inputs, assumptions and models are not required as a result of the monitoring procedures performed.
The following table is a summary of the inputs used to value the Fund's investments at January 31, 2016:
| | | Level 1
Quoted Prices in Active
Markets for Identical
Assets ($) | |
Level 2
Other Significant
Observable Inputs ($) | |
Level 3
Significant
Unobservable Inputs ($) | |
Total ($) | |
Investments | |
Equity Funds | | | 450,624,766 | | | | — | | | | — | | | | 450,624,766 | | |
Fixed-Income Funds | | | 93,648,368 | | | | — | | | | — | | | | 93,648,368 | | |
Alternative Investment Funds | | | 25,920,736 | | | | — | | | | — | | | | 25,920,736 | | |
Common Stocks | |
Consumer Discretionary | | | 1,296,005 | | | | 680,263 | | | | — | | | | 1,976,268 | | |
Consumer Staples | | | 663,552 | | | | 393,117 | | | | — | | | | 1,056,669 | | |
Energy | | | 255,248 | | | | 403,495 | | | | — | | | | 658,743 | | |
Financials | | | 2,477,217 | | | | 1,308,578 | | | | — | | | | 3,785,795 | | |
Health Care | | | 1,234,555 | | | | 632,331 | | | | — | | | | 1,866,886 | | |
Industrials | | | 1,074,550 | | | | 755,623 | | | | — | | | | 1,830,173 | | |
Information Technology | | | 1,692,366 | | | | 344,107 | | | | — | | | | 2,036,473 | | |
Materials | | | 281,027 | | | | 401,297 | | | | — | | | | 682,324 | | |
Telecommunication Services | | | 97,808 | | | | 321,905 | | | | — | | | | 419,713 | | |
Utilities | | | 368,374 | | | | 183,667 | | | | — | | | | 552,041 | | |
Total Common Stocks | | | 9,440,702 | | | | 5,424,383 | | | | — | | | | 14,865,085 | | |
Money Market Funds | | | — | | | | 46,742,052 | | | | — | | | | 46,742,052 | | |
Total Investments | | | 579,634,572 | | | | 52,166,435 | | | | — | | | | 631,801,007 | | |
Derivatives | |
Assets | |
Forward Foreign Currency
Exchange Contracts | | | — | | | | 8,964 | | | | — | | | | 8,964 | | |
Futures Contracts | | | 598,871 | | | | — | | | | — | | | | 598,871 | | |
Liabilities | |
Forward Foreign Currency
Exchange Contracts | | | — | | | | (17,629 | ) | | | — | | | | (17,629 | ) | |
Futures Contracts | | | (819,812 | ) | | | — | | | | — | | | | (819,812 | ) | |
Total | | | 579,413,631 | | | | 52,157,770 | | | | — | | | | 631,571,401 | | |
See the Portfolio of Investments for all investment classifications not indicated in the table.
The Fund's assets assigned to the Level 2 input category are generally valued using the market approach, in which a security's value is determined through reference to prices and information from market transactions for similar or identical assets and/or fund per share market values which are not considered publicly available. These assets include certain foreign securities for which a third party statistical pricing
The accompanying Notes to Financial Statements are an integral part of this statement.
Annual Report 2016
82
COLUMBIA CAPITAL ALLOCATION PORTFOLIOS
PORTFOLIO OF INVESTMENTS (continued)
Columbia Capital Allocation Aggressive Portfolio
January 31, 2016
Fair Value Measurements (continued)
service may be employed for purposes of fair market valuation. The model utilized by such third party statistical pricing service takes into account a security's correlation to available market data including, but not limited to, intraday index, ADR, and exchange-traded fund movements.
Derivative instruments are valued at unrealized appreciation (depreciation).
Financial assets were transferred from Level 1 to Level 2 as the market for these assets is not considered publicly available. Fund per share market values were obtained using observable market inputs.
The following table shows transfers between Level 1 and Level 2 of the fair value hierarchy:
Transfers In | | Transfers Out | |
| Level 1 ($) | | Level 2 ($) | | Level 1 ($) | | Level 2 ($) | |
| | — | | | | 90,301,754 | | | | 90,301,754 | | | | — | | |
Transfers between Level 1 and Level 2 are determined based on the fair value at the beginning of the period for security positions held throughout the period.
There were no transfers of financial assets between Levels 2 and 3 during the period.
The accompanying Notes to Financial Statements are an integral part of this statement.
Annual Report 2016
83
COLUMBIA CAPITAL ALLOCATION PORTFOLIOS
STATEMENT OF ASSETS AND LIABILITIES
January 31, 2016
| | | Columbia
Capital
Allocation
Conservative
Portfolio | | Columbia
Capital
Allocation
Moderate
Conservative
Portfolio | | Columbia
Capital
Allocation
Moderate
Portfolio | |
Assets | |
Investments, at value | |
Unaffiliated issuers (identified cost $7,374,840, $11,771,114,
$27,872,052) | | $ | 7,022,138 | | | $ | 11,037,399 | | | $ | 24,914,047 | | |
Affiliated issuers (identified cost $275,387,008, $636,574,968,
$1,524,306,393) | | | 260,253,081 | | | | 607,342,923 | | | | 1,478,349,878 | | |
Total investments (identified cost $282,761,848, $648,346,082,
$1,552,178,445) | | | 267,275,219 | | | | 618,380,322 | | | | 1,503,263,925 | | |
Cash | | | 1,930 | | | | 3,207 | | | | 15,807 | | |
Margin deposits | | | 486,979 | | | | 1,225,951 | | | | 2,385,877 | | |
Unrealized appreciation on forward foreign currency exchange contracts | | | 1,805 | | | | 2,755 | | | | 11,593 | | |
Receivable for: | |
Investments sold | | | 58,596 | | | | 52,069 | | | | 644,702 | | |
Capital shares sold | | | 248,652 | | | | 454,819 | | | | 1,089,477 | | |
Dividends | | | 441,317 | | | | 888,405 | | | | 1,779,967 | | |
Foreign tax reclaims | | | 553 | | | | 796 | | | | 551 | | |
Variation margin | | | 110,430 | | | | 394,851 | | | | 1,098,572 | | |
Prepaid expenses | | | 2,020 | | | | 2,713 | | | | 4,516 | | |
Total assets | | | 268,627,501 | | | | 621,405,888 | | | | 1,510,294,987 | | |
Liabilities | |
Unrealized depreciation on forward foreign currency exchange contracts | | | 6,906 | | | | 10,645 | | | | 20,989 | | |
Payable for: | |
Investments purchased | | | 434,688 | | | | 877,727 | | | | 1,752,571 | | |
Capital shares purchased | | | 267,029 | | | | 614,250 | | | | 1,797,105 | | |
Variation margin | | | 5,827 | | | | 8,912 | | | | — | | |
Investment management fees | | | 309 | | | | 521 | | | | 1,391 | | |
Distribution and/or service fees | | | 2,755 | | | | 5,943 | | | | 14,232 | | |
Transfer agent fees | | | 19,757 | | | | 45,266 | | | | 90,370 | | |
Administration fees | | | 145 | | | | 336 | | | | 814 | | |
Plan administration fees | | | 1 | | | | — | | | | 2 | | |
Compensation of board members | | | 76,132 | | | | 27,506 | | | | 33,616 | | |
Other expenses | | | 43,676 | | | | 60,816 | | | | 115,611 | | |
Total liabilities | | | 857,225 | | | | 1,651,922 | | | | 3,826,701 | | |
Net assets applicable to outstanding capital stock | | $ | 267,770,276 | | | $ | 619,753,966 | | | $ | 1,506,468,286 | | |
The accompanying Notes to Financial Statements are an integral part of this statement.
Annual Report 2016
84
COLUMBIA CAPITAL ALLOCATION PORTFOLIOS
STATEMENT OF ASSETS AND LIABILITIES (continued)
January 31, 2016
| | | Columbia
Capital
Allocation
Conservative
Portfolio | | Columbia
Capital
Allocation
Moderate
Conservative
Portfolio | | Columbia
Capital
Allocation
Moderate
Portfolio | |
Represented by | |
Paid-in capital | | $ | 281,233,467 | | | $ | 639,402,256 | | | $ | 1,524,283,819 | | |
Undistributed net investment income | | | 482,258 | | | | 860,363 | | | | 2,207,343 | | |
Accumulated net realized gain | | | 1,270,812 | | | | 8,972,093 | | | | 27,671,762 | | |
Unrealized appreciation (depreciation) on: | |
Investments — unaffiliated issuers | | | (352,702 | ) | | | (733,715 | ) | | | (2,958,005 | ) | |
Investments — affiliated issuers | | | (15,133,927 | ) | | | (29,232,045 | ) | | | (45,956,515 | ) | |
Foreign currency translations | | | (1,087 | ) | | | (4,593 | ) | | | (5,178 | ) | |
Forward foreign currency exchange contracts | | | (5,101 | ) | | | (7,890 | ) | | | (9,396 | ) | |
Futures contracts | | | 298,155 | | | | 530,531 | | | | 1,234,456 | | |
Swap contracts | | | (21,599 | ) | | | (33,034 | ) | | | — | | |
Total — representing net assets applicable to outstanding capital stock | | $ | 267,770,276 | | | $ | 619,753,966 | | | $ | 1,506,468,286 | | |
Class A | |
Net assets | | $ | 216,422,768 | | | $ | 495,849,417 | | | $ | 1,295,481,967 | | |
Shares outstanding | | | 22,895,078 | | | | 48,906,317 | | | | 125,234,541 | | |
Net asset value per share | | $ | 9.45 | | | $ | 10.14 | | | $ | 10.34 | | |
Maximum offering price per share(a) | | $ | 9.92 | | | $ | 10.76 | | | $ | 10.97 | | |
Class B | |
Net assets | | $ | 3,364,093 | | | $ | 7,911,631 | | | $ | 23,990,857 | | |
Shares outstanding | | | 357,039 | | | | 784,787 | | | | 2,331,483 | | |
Net asset value per share | | $ | 9.42 | | | $ | 10.08 | | | $ | 10.29 | | |
Class C | |
Net assets | | $ | 43,719,328 | | | $ | 85,096,856 | | | $ | 178,547,718 | | |
Shares outstanding | | | 4,650,668 | | | | 8,506,114 | | | | 17,392,615 | | |
Net asset value per share | | $ | 9.40 | | | $ | 10.00 | | | $ | 10.27 | | |
Class K | |
Net assets | | $ | 94,079 | | | $ | 2,764 | | | $ | 290,895 | | |
Shares outstanding | | | 10,054 | | | | 277 | | | | 28,153 | | |
Net asset value per share | | $ | 9.36 | | | $ | 9.99 | (b) | | $ | 10.33 | | |
Class R | |
Net assets | | $ | 490,358 | | | $ | 5,007,452 | | | $ | 1,341,656 | | |
Shares outstanding | | | 51,897 | | | | 493,037 | | | | 130,040 | | |
Net asset value per share | | $ | 9.45 | | | $ | 10.16 | | | $ | 10.32 | | |
Class R4 | |
Net assets | | $ | 145,179 | | | $ | 1,082,080 | | | $ | 201,786 | | |
Shares outstanding | | | 15,456 | | | | 107,607 | | | | 19,715 | | |
Net asset value per share | | $ | 9.39 | | | $ | 10.06 | | | $ | 10.24 | | |
The accompanying Notes to Financial Statements are an integral part of this statement.
Annual Report 2016
85
COLUMBIA CAPITAL ALLOCATION PORTFOLIOS
STATEMENT OF ASSETS AND LIABILITIES (continued)
January 31, 2016
| | | Columbia
Capital
Allocation
Conservative
Portfolio | | Columbia
Capital
Allocation
Moderate
Conservative
Portfolio | | Columbia
Capital
Allocation
Moderate
Portfolio | |
Class R5 | |
Net assets | | $ | 321,723 | | | $ | 685,650 | | | $ | 3,802,609 | | |
Shares outstanding | | | 34,247 | | | | 68,239 | | | | 371,678 | | |
Net asset value per share | | $ | 9.39 | | | $ | 10.05 | | | $ | 10.23 | | |
Class Y | |
Net assets | | $ | 166,343 | | | $ | 9,703 | | | $ | 368,272 | | |
Shares outstanding | | | 17,718 | | | | 977 | | | | 35,985 | | |
Net asset value per share | | $ | 9.39 | | | $ | 9.94 | (b) | | $ | 10.23 | | |
Class Z | |
Net assets | | $ | 3,046,405 | | | $ | 24,108,413 | | | $ | 2,442,526 | | |
Shares outstanding | | | 322,364 | | | | 2,407,962 | | | | 236,406 | | |
Net asset value per share | | $ | 9.45 | | | $ | 10.01 | | | $ | 10.33 | | |
(a) The maximum offering price per share is calculated by dividing the net asset value per share by 1.0 minus the maximum sales charge of 4.75% for Columbia Capital Allocation Conservative Portfolio and dividing the net asset value by 1.0 minus the maximum sales charge of 5.75% for Columbia Capital Allocation Moderate Conservative Portfolio and Columbia Capital Allocation Moderate Portfolio.
(b) Net asset value per share rounds to this amount due to fractional shares outstanding.
The accompanying Notes to Financial Statements are an integral part of this statement.
Annual Report 2016
86
COLUMBIA CAPITAL ALLOCATION PORTFOLIOS
STATEMENT OF ASSETS AND LIABILITIES (continued)
January 31, 2016
| | | Columbia
Capital
Allocation
Moderate
Aggressive
Portfolio | | Columbia
Capital
Allocation
Aggressive
Portfolio | |
Assets | |
Investments, at value | |
Unaffiliated issuers (identified cost $27,938,736, $16,350,612) | | $ | 24,504,704 | | | $ | 14,865,085 | | |
Affiliated issuers (identified cost $2,105,419,497, $629,678,034) | | | 2,057,808,017 | | | | 616,935,922 | | |
Total investments (identified cost $2,133,358,233, $646,028,646) | | | 2,082,312,721 | | | | 631,801,007 | | |
Cash | | | 16,600 | | | | 7,837 | | |
Foreign currency (identified cost $1,698, $—) | | | 1,697 | | | | — | | |
Margin deposits | | | 5,921,700 | | | | 1,249,800 | | |
Unrealized appreciation on forward foreign currency exchange contracts | | | 7,228 | | | | 8,964 | | |
Receivable for: | |
Investments sold | | | 614,341 | | | | 124,496 | | |
Capital shares sold | | | 1,143,540 | | | | 500,354 | | |
Dividends | | | 1,847,227 | | | | 343,936 | | |
Foreign tax reclaims | | | 490 | | | | 452 | | |
Variation margin | | | 3,226,523 | | | | 672,436 | | |
Prepaid expenses | | | 5,772 | | | | 2,753 | | |
Trustees' deferred compensation plan | | | 101,905 | | | | — | | |
Total assets | | | 2,095,199,744 | | | | 634,712,035 | | |
Liabilities | |
Unrealized depreciation on forward foreign currency exchange contracts | | | 14,135 | | | | 17,629 | | |
Payable for: | |
Investments purchased | | | 1,778,192 | | | | 323,813 | | |
Capital shares purchased | | | 1,465,934 | | | | 712,209 | | |
Investment management fees | | | 3,880 | | | | 940 | | |
Distribution and/or service fees | | | 18,077 | | | | 5,811 | | |
Transfer agent fees | | | 174,276 | | | | 40,446 | | |
Administration fees | | | 1,125 | | | | 340 | | |
Plan administration fees | | | 1 | | | | — | | |
Compensation of board members | | | 143,459 | | | | 22,350 | | |
Other expenses | | | 152,301 | | | | 74,352 | | |
Trustees' deferred compensation plan | | | 101,905 | | | | — | | |
Total liabilities | | | 3,853,285 | | | | 1,197,890 | | |
Net assets applicable to outstanding capital stock | | $ | 2,091,346,459 | | | $ | 633,514,145 | | |
The accompanying Notes to Financial Statements are an integral part of this statement.
Annual Report 2016
87
COLUMBIA CAPITAL ALLOCATION PORTFOLIOS
STATEMENT OF ASSETS AND LIABILITIES (continued)
January 31, 2016
| | | Columbia
Capital
Allocation
Moderate
Aggressive
Portfolio | | Columbia
Capital
Allocation
Aggressive
Portfolio | |
Represented by | |
Paid-in capital | | $ | 2,101,235,191 | | | $ | 634,757,441 | | |
Undistributed (excess of distributions over) net investment income | | | (235,873 | ) | | | (11,821 | ) | |
Accumulated net realized gain | | | 43,854,609 | | | | 13,225,777 | | |
Unrealized appreciation (depreciation) on: | |
Investments — unaffiliated issuers | | | (3,434,032 | ) | | | (1,485,527 | ) | |
Investments — affiliated issuers | | | (47,611,480 | ) | | | (12,742,112 | ) | |
Foreign currency translations | | | (7 | ) | | | (7 | ) | |
Forward foreign currency exchange contracts | | | (6,907 | ) | | | (8,665 | ) | |
Futures contracts | | | (2,455,042 | ) | | | (220,941 | ) | |
Total — representing net assets applicable to outstanding capital stock | | $ | 2,091,346,459 | | | $ | 633,514,145 | | |
Class A | |
Net assets | | $ | 1,646,275,620 | | | $ | 549,678,307 | | |
Shares outstanding | | | 147,606,249 | | | | 49,603,191 | | |
Net asset value per share | | $ | 11.15 | | | $ | 11.08 | | |
Maximum offering price per share(a) | | $ | 11.83 | | | $ | 11.76 | | |
Class B | |
Net assets | | $ | 31,227,824 | | | $ | 11,969,846 | | |
Shares outstanding | | | 2,833,955 | | | | 1,081,493 | | |
Net asset value per share | | $ | 11.02 | | | $ | 11.07 | | |
Class C | |
Net assets | | $ | 206,181,056 | | | $ | 66,937,876 | | |
Shares outstanding | | | 18,399,796 | | | | 6,157,202 | | |
Net asset value per share | | $ | 11.21 | | | $ | 10.87 | | |
Class K | |
Net assets | | $ | 90,112 | | | $ | 56,523 | | |
Shares outstanding | | | 8,104 | | | | 5,089 | | |
Net asset value per share | | $ | 11.12 | | | $ | 11.11 | | |
Class R | |
Net assets | | $ | 3,555,554 | | | $ | 1,028,935 | | |
Shares outstanding | | | 319,215 | | | | 93,442 | | |
Net asset value per share | | $ | 11.14 | | | $ | 11.01 | | |
Class R4 | |
Net assets | | $ | 1,119,063 | | | $ | 778,974 | | |
Shares outstanding | | | 99,609 | | | | 71,536 | | |
Net asset value per share | | $ | 11.23 | | | $ | 10.89 | | |
The accompanying Notes to Financial Statements are an integral part of this statement.
Annual Report 2016
88
COLUMBIA CAPITAL ALLOCATION PORTFOLIOS
STATEMENT OF ASSETS AND LIABILITIES (continued)
January 31, 2016
| | | Columbia
Capital
Allocation
Moderate
Aggressive
Portfolio | | Columbia
Capital
Allocation
Aggressive
Portfolio | |
Class R5 | |
Net assets | | $ | 3,536,865 | | | $ | 1,041,175 | | |
Shares outstanding | | | 314,971 | | | | 95,674 | | |
Net asset value per share | | $ | 11.23 | | | $ | 10.88 | | |
Class T | |
Net assets | | $ | 85,134,751 | | | $ | — | | |
Shares outstanding | | | 7,633,083 | | | | — | | |
Net asset value per share | | $ | 11.15 | | | $ | — | | |
Maximum offering price per share(a) | | $ | 11.83 | | | $ | — | | |
Class Y | |
Net assets | | $ | 379,388 | | | $ | 213,532 | | |
Shares outstanding | | | 34,458 | | | | 19,637 | | |
Net asset value per share | | $ | 11.01 | | | $ | 10.87 | | |
Class Z | |
Net assets | | $ | 113,846,226 | | | $ | 1,808,977 | | |
Shares outstanding | | | 10,224,289 | | | | 163,932 | | |
Net asset value per share | | $ | 11.13 | | | $ | 11.03 | | |
(a) The maximum offering price per share is calculated by dividing the net asset value per share by 1.0 minus the maximum sales charge of 5.75%.
The accompanying Notes to Financial Statements are an integral part of this statement.
Annual Report 2016
89
COLUMBIA CAPITAL ALLOCATION PORTFOLIOS
STATEMENT OF OPERATIONS
Year Ended January 31, 2016
| | | Columbia
Capital
Allocation
Conservative
Portfolio | | Columbia
Capital
Allocation
Moderate
Conservative
Portfolio | | Columbia
Capital
Allocation
Moderate
Portfolio | |
Net investment income | |
Income: | |
Dividends — unaffiliated issuers | | $ | 53,728 | | | $ | 78,506 | | | $ | 264,836 | | |
Dividends — affiliated issuers | | | 6,770,593 | | | | 15,415,482 | | | | 34,521,328 | | |
Interest | | | 16 | | | | 782 | | | | 860 | | |
Foreign taxes withheld | | | (2,040 | ) | | | (3,180 | ) | | | (3,183 | ) | |
Total income | | | 6,822,297 | | | | 15,491,590 | | | | 34,783,841 | | |
Expenses: | |
Investment management fees | | | 154,823 | | | | 347,094 | | | | 793,979 | | |
Distribution and/or service fees | |
Class A | | | 583,760 | | | | 1,322,522 | | | | 3,505,364 | | |
Class B | | | 55,694 | | | | 123,800 | | | | 360,960 | | |
Class C | | | 470,775 | | | | 895,492 | | | | 1,838,731 | | |
Class R | | | 1,962 | | | | 17,352 | | | | 7,659 | | |
Transfer agent fees | |
Class A | | | 274,232 | | | | 617,074 | | | | 1,523,779 | | |
Class B | | | 6,611 | | | | 14,553 | | | | 39,595 | | |
Class C | | | 55,272 | | | | 104,400 | | | | 199,574 | | |
Class K | | | 48 | | | | 2 | | | | 150 | | |
Class R | | | 454 | | | | 3,994 | | | | 1,665 | | |
Class R4 | | | 188 | | | | 1,206 | | | | 117 | | |
Class R5 | | | 62 | | | | 153 | | | | 406 | | |
Class Z | | | 3,727 | | | | 30,212 | | | | 2,775 | | |
Administration fees | | | 58,025 | | | | 132,333 | | | | 325,491 | | |
Plan administration fees | |
Class K | | | 240 | | | | 8 | | | | 749 | | |
Compensation of board members | | | 12,853 | | | | 17,376 | | | | 29,262 | | |
Custodian fees | | | 32,893 | | | | 34,028 | | | | 32,048 | | |
Printing and postage fees | | | 40,890 | | | | 76,477 | | | | 215,579 | | |
Registration fees | | | 111,350 | | | | 111,841 | | | | 142,922 | | |
Audit fees | | | 16,963 | | | | 16,464 | | | | 16,460 | | |
Legal fees | | | 7,850 | | | | 10,485 | | | | 17,372 | | |
Other | | | 17,929 | | | | 19,683 | | | | 34,832 | | |
Total expenses | | | 1,906,601 | | | | 3,896,549 | | | | 9,089,469 | | |
Expense reductions | | | (20 | ) | | | (140 | ) | | | (80 | ) | |
Total net expenses | | | 1,906,581 | | | | 3,896,409 | | | | 9,089,389 | | |
Net investment income | | | 4,915,716 | | | | 11,595,181 | | | | 25,694,452 | | |
Realized and unrealized gain (loss) — net | |
Net realized gain (loss) on: | |
Investments — unaffiliated issuers | | | (120,861 | ) | | | (217,939 | ) | | | (1,283,010 | ) | |
Investments — affiliated issuers | | | 1,528,534 | | | | 7,658,039 | | | | 39,972,916 | | |
Capital gain distributions from underlying affiliated funds | | | 3,099,468 | | | | 12,868,277 | | | | 46,141,517 | | |
Foreign currency translations | | | (22,166 | ) | | | (60,425 | ) | | | (107,744 | ) | |
Forward foreign currency exchange contracts | | | (9,680 | ) | | | (13,923 | ) | | | (1,757 | ) | |
Futures contracts | | | 579,920 | | | | 1,986,963 | | | | 5,260,170 | | |
Swap contracts | | | 14,994 | | | | 21,545 | | | | 39,271 | | |
Net realized gain | | | 5,070,209 | | | | 22,242,537 | | | | 90,021,363 | | |
Net change in unrealized appreciation (depreciation) on: | |
Investments — unaffiliated issuers | | | (352,702 | ) | | | (733,715 | ) | | | (2,958,005 | ) | |
Investments — affiliated issuers | | | (18,108,604 | ) | | | (50,840,055 | ) | | | (155,873,376 | ) | |
Foreign currency translations | | | 2,740 | | | | 34,289 | | | | 37,995 | | |
Forward foreign currency exchange contracts | | | (5,101 | ) | | | (7,890 | ) | | | (9,396 | ) | |
Futures contracts | | | 300,010 | | | | (128,321 | ) | | | (324,450 | ) | |
Swap contracts | | | (21,599 | ) | | | (33,034 | ) | | | — | | |
Net change in unrealized depreciation | | | (18,185,256 | ) | | | (51,708,726 | ) | | | (159,127,232 | ) | |
Net realized and unrealized loss | | | (13,115,047 | ) | | | (29,466,189 | ) | | | (69,105,869 | ) | |
Net decrease in net assets from operations | | $ | (8,199,331 | ) | | $ | (17,871,008 | ) | | $ | (43,411,417 | ) | |
The accompanying Notes to Financial Statements are an integral part of this statement.
Annual Report 2016
90
COLUMBIA CAPITAL ALLOCATION PORTFOLIOS
STATEMENT OF OPERATIONS (continued)
Year Ended January 31, 2016
| | | Columbia
Capital
Allocation
Moderate
Aggressive
Portfolio | | Columbia
Capital
Allocation
Aggressive
Portfolio | |
Net investment income | |
Income: | |
Dividends — unaffiliated issuers | | $ | 276,108 | | | $ | 142,944 | | |
Dividends — affiliated issuers | | | 44,069,599 | | | | 11,269,841 | | |
Interest | | | 1,864 | | | | 7 | | |
Foreign taxes withheld | | | (2,219 | ) | | | (2,288 | ) | |
Total income | | | 44,345,352 | | | | 11,410,504 | | |
Expenses: | |
Investment management fees | | | 1,571,091 | | | | 401,992 | | |
Distribution and/or service fees | |
Class A | | | 4,488,482 | | | | 1,468,437 | | |
Class B | | | 464,085 | | | | 172,808 | | |
Class C | | | 2,168,021 | | | | 680,297 | | |
Class R | | | 20,864 | | | | 4,478 | | |
Class T | | | 237,020 | | | | — | | |
Transfer agent fees | |
Class A | | | 2,761,917 | | | | 737,802 | | |
Class B | | | 71,726 | | | | 21,821 | | |
Class C | | | 333,346 | | | | 85,379 | | |
Class K | | | 48 | | | | 29 | | |
Class R | | | 6,416 | | | | 1,124 | | |
Class R4 | | | 1,796 | | | | 982 | | |
Class R5 | | | 743 | | | | 254 | | |
Class T | | | 145,883 | | | | — | | |
Class Z | | | 194,028 | | | | 2,074 | | |
Administration fees | | | 457,297 | | | | 135,323 | | |
Plan administration fees | |
Class K | | | 241 | | | | 147 | | |
Compensation of board members | | | 37,436 | | | | 17,537 | | |
Custodian fees | | | 44,690 | | | | 31,552 | | |
Printing and postage fees | | | 297,651 | | | | 111,709 | | |
Registration fees | | | 139,387 | | | | 126,374 | | |
Audit fees | | | 20,064 | | | | 18,260 | | |
Legal fees | | | 22,083 | | | | 10,604 | | |
Other | | | 40,558 | | | | 23,027 | | |
Total expenses | | | 13,524,873 | | | | 4,052,010 | | |
Expense reductions | | | (10,788 | ) | | | (180 | ) | |
Total net expenses | | | 13,514,085 | | | | 4,051,830 | | |
Net investment income | | | 30,831,267 | | | | 7,358,674 | | |
Realized and unrealized gain (loss) — net | |
Net realized gain (loss) on: | |
Investments — unaffiliated issuers | | | (1,255,655 | ) | | | (630,418 | ) | |
Investments — affiliated issuers | | | 44,789,149 | | | | 15,078,783 | | |
Capital gain distributions from underlying affiliated funds | | | 65,423,299 | | | | 26,463,706 | | |
Foreign currency translations | | | 43,829 | | | | (7,773 | ) | |
Forward foreign currency exchange contracts | | | (1,136 | ) | | | (1,089 | ) | |
Futures contracts | | | 8,263,683 | | | | 2,908,659 | | |
Swap contracts | | | 19,938 | | | | 10,875 | | |
Net realized gain | | | 117,283,107 | | | | 43,822,743 | | |
Net change in unrealized appreciation (depreciation) on: | |
Investments — unaffiliated issuers | | | (3,261,152 | ) | | | (1,485,527 | ) | |
Investments — affiliated issuers | | | (212,591,305 | ) | | | (74,733,347 | ) | |
Foreign currency translations | | | 2,112 | | | | 621 | | |
Forward foreign currency exchange contracts | | | (6,907 | ) | | | (8,665 | ) | |
Futures contracts | | | (4,466,171 | ) | | | (719,759 | ) | |
Net change in unrealized depreciation | | | (220,323,423 | ) | | | (76,946,677 | ) | |
Net realized and unrealized loss | | | (103,040,316 | ) | | | (33,123,934 | ) | |
Net decrease in net assets from operations | | $ | (72,209,049 | ) | | $ | (25,765,260 | ) | |
The accompanying Notes to Financial Statements are an integral part of this statement.
Annual Report 2016
91
COLUMBIA CAPITAL ALLOCATION PORTFOLIOS
STATEMENT OF CHANGES IN NET ASSETS
| | | Columbia Capital Allocation
Conservative Portfolio | | Columbia Capital Allocation
Moderate Conservative Portfolio | |
| | | Year Ended
January 31,
2016 | | Year Ended
January 31,
2015 | | Year Ended
January 31,
2016 | | Year Ended
January 31,
2015 | |
Operations | |
Net investment income | | $ | 4,915,716 | | | $ | 4,884,142 | | | $ | 11,595,181 | | | $ | 11,031,975 | | |
Net realized gain | | | 5,070,209 | | | | 9,970,600 | | | | 22,242,537 | | | | 32,208,591 | | |
Net change in unrealized appreciation (depreciation) | | | (18,185,256 | ) | | | 1,153,821 | | | | (51,708,726 | ) | | | (1,904,201 | ) | |
Net increase (decrease) in net assets resulting from operations | | | (8,199,331 | ) | | | 16,008,563 | | | | (17,871,008 | ) | | | 41,336,365 | | |
Distributions to shareholders | |
Net investment income | |
Class A | | | (4,448,036 | ) | | | (4,678,256 | ) | | | (10,811,068 | ) | | | (11,069,734 | ) | |
Class B | | | (57,097 | ) | | | (102,358 | ) | | | (138,567 | ) | | | (252,795 | ) | |
Class C | | | (547,575 | ) | | | (534,918 | ) | | | (1,186,601 | ) | | | (1,145,791 | ) | |
Class K | | | (1,945 | ) | | | (1,900 | ) | | | (66 | ) | | | (110 | ) | |
Class R | | | (7,103 | ) | | | (3,179 | ) | | | (74,076 | ) | | | (38,385 | ) | |
Class R4 | | | (3,344 | ) | | | (1,859 | ) | | | (24,707 | ) | | | (17,563 | ) | |
Class R5 | | | (4,091 | ) | | | (54 | ) | | | (10,527 | ) | | | (3,855 | ) | |
Class Y | | | (1,638 | ) | | | (55 | ) | | | (188 | ) | | | (84 | ) | |
Class Z | | | (66,888 | ) | | | (68,020 | ) | | | (602,055 | ) | | | (598,245 | ) | |
Net realized gains | |
Class A | | | (4,217,753 | ) | | | (13,788,348 | ) | | | (15,881,079 | ) | | | (40,886,882 | ) | |
Class B | | | (84,291 | ) | | | (522,244 | ) | | | (329,065 | ) | | | (1,568,580 | ) | |
Class C | | | (858,561 | ) | | | (2,614,805 | ) | | | (2,747,116 | ) | | | (6,706,213 | ) | |
Class K | | | (1,788 | ) | | | (5,265 | ) | | | (93 | ) | | | (250 | ) | |
Class R | | | (8,908 | ) | | | (10,594 | ) | | | (117,251 | ) | | | (159,791 | ) | |
Class R4 | | | (3,054 | ) | | | (3,616 | ) | | | (31,447 | ) | | | (54,567 | ) | |
Class R5 | | | (3,797 | ) | | | (137 | ) | | | (12,668 | ) | | | (11,651 | ) | |
Class Y | | | (1,675 | ) | | | (137 | ) | | | (258 | ) | | | (226 | ) | |
Class Z | | | (54,705 | ) | | | (181,112 | ) | | | (790,424 | ) | | | (1,994,601 | ) | |
Total distributions to shareholders | | | (10,372,249 | ) | | | (22,516,857 | ) | | | (32,757,256 | ) | | | (64,509,323 | ) | |
Increase (decrease) in net assets from capital stock activity | | | (18,116,381 | ) | | | (15,261,332 | ) | | | (12,096,589 | ) | | | 11,455,155 | | |
Total increase (decrease) in net assets | | | (36,687,961 | ) | | | (21,769,626 | ) | | | (62,724,853 | ) | | | (11,717,803 | ) | |
Net assets at beginning of year | | | 304,458,237 | | | | 326,227,863 | | | | 682,478,819 | | | | 694,196,622 | | |
Net assets at end of year | | $ | 267,770,276 | | | $ | 304,458,237 | | | $ | 619,753,966 | | | $ | 682,478,819 | | |
Undistributed net investment income | | $ | 482,258 | | | $ | 242,223 | | | $ | 860,363 | | | $ | 736,696 | | |
The accompanying Notes to Financial Statements are an integral part of this statement.
Annual Report 2016
92
COLUMBIA CAPITAL ALLOCATION PORTFOLIOS
STATEMENT OF CHANGES IN NET ASSETS (continued)
| | | Columbia Capital Allocation
Moderate Portfolio | | Columbia Capital Allocation
Moderate Aggressive Portfolio | |
| | | Year Ended
January 31,
2016 | | Year Ended
January 31,
2015 | | Year Ended
January 31,
2016 | | Year Ended
January 31,
2015 | |
Operations | |
Net investment income | | $ | 25,694,452 | | | $ | 23,547,452 | | | $ | 30,831,267 | | | $ | 27,083,878 | | |
Net realized gain | | | 90,021,363 | | | | 113,856,823 | | | | 117,283,107 | | | | 194,214,422 | | |
Net change in unrealized appreciation (depreciation) | | | (159,127,232 | ) | | | (28,096,334 | ) | | | (220,323,423 | ) | | | (59,935,306 | ) | |
Net increase (decrease) in net assets resulting
from operations | | | (43,411,417 | ) | | | 109,307,941 | | | | (72,209,049 | ) | | | 161,362,994 | | |
Distributions to shareholders | |
Net investment income | |
Class A | | | (27,562,443 | ) | | | (28,758,842 | ) | | | (31,928,009 | ) | | | (34,516,560 | ) | |
Class B | | | (366,818 | ) | | | (648,567 | ) | | | (403,740 | ) | | | (824,921 | ) | |
Class C | | | (2,312,461 | ) | | | (2,229,702 | ) | | | (2,383,812 | ) | | | (2,619,905 | ) | |
Class K | | | (6,180 | ) | | | (6,121 | ) | | | (1,839 | ) | | | (1,977 | ) | |
Class R | | | (25,036 | ) | | | (26,729 | ) | | | (61,435 | ) | | | (81,372 | ) | |
Class R4 | | | (3,442 | ) | | | (470 | ) | | | (24,085 | ) | | | (14,448 | ) | |
Class R5 | | | (49,239 | ) | | | (1,103 | ) | | | (57,960 | ) | | | (14,202 | ) | |
Class T | | | — | | | | — | | | | (1,678,969 | ) | | | (1,847,218 | ) | |
Class Y | | | (5,079 | ) | | | (63 | ) | | | (5,799 | ) | | | (58 | ) | |
Class Z | | | (57,266 | ) | | | (70,355 | ) | | | (2,545,167 | ) | | | (2,775,192 | ) | |
Net realized gains | |
Class A | | | (77,452,249 | ) | | | (126,283,047 | ) | | | (100,812,247 | ) | | | (169,563,640 | ) | |
Class B | | | (1,745,165 | ) | | | (4,982,956 | ) | | | (2,379,517 | ) | | | (6,697,170 | ) | |
Class C | | | (10,404,243 | ) | | | (15,421,095 | ) | | | (12,245,374 | ) | | | (19,458,283 | ) | |
Class K | | | (16,894 | ) | | | (24,386 | ) | | | (5,407 | ) | | | (8,980 | ) | |
Class R | | | (84,727 | ) | | | (132,155 | ) | | | (230,256 | ) | | | (454,217 | ) | |
Class R4 | | | (6,698 | ) | | | (1,275 | ) | | | (65,357 | ) | | | (46,911 | ) | |
Class R5 | | | (110,284 | ) | | | (2,921 | ) | | | (130,866 | ) | | | (58,047 | ) | |
Class T | | | — | | | | — | | | | (5,315,962 | ) | | | (9,299,777 | ) | |
Class Y | | | (11,037 | ) | | | (225 | ) | | | (11,157 | ) | | | (230 | ) | |
Class Z | | | (139,513 | ) | | | (278,188 | ) | | | (7,066,677 | ) | | | (11,996,520 | ) | |
Total distributions to shareholders | | | (120,358,774 | ) | | | (178,868,200 | ) | | | (167,353,635 | ) | | | (260,279,628 | ) | |
Increase (decrease) in net assets from capital stock activity | | | (705,114 | ) | | | 75,905,360 | | | | 9,089,709 | | | | 88,664,254 | | |
Total increase (decrease) in net assets | | | (164,475,305 | ) | | | 6,345,101 | | | | (230,472,975 | ) | | | (10,252,380 | ) | |
Net assets at beginning of year | | | 1,670,943,591 | | | | 1,664,598,490 | | | | 2,321,819,434 | | | | 2,332,071,814 | | |
Net assets at end of year | | $ | 1,506,468,286 | | | $ | 1,670,943,591 | | | $ | 2,091,346,459 | | | $ | 2,321,819,434 | | |
Undistributed (excess of distributions over)
net investment income | | $ | 2,207,343 | | | $ | 907,701 | | | $ | (235,873 | ) | | $ | 931,029 | | |
The accompanying Notes to Financial Statements are an integral part of this statement.
Annual Report 2016
93
COLUMBIA CAPITAL ALLOCATION PORTFOLIOS
STATEMENT OF CHANGES IN NET ASSETS (continued)
| | | Columbia Capital Allocation
Aggressive Portfolio | |
| | | Year Ended
January 31,
2016 | | Year Ended
January 31,
2015 | |
Operations | |
Net investment income | | $ | 7,358,674 | | | $ | 5,490,272 | | |
Net realized gain | | | 43,822,743 | | | | 68,322,682 | | |
Net change in unrealized appreciation (depreciation) | | | (76,946,677 | ) | | | (27,002,909 | ) | |
Net increase (decrease) in net assets resulting from operations | | | (25,765,260 | ) | | | 46,810,045 | | |
Distributions to shareholders | |
Net investment income | |
Class A | | | (9,360,758 | ) | | | (12,809,041 | ) | |
Class B | | | (120,732 | ) | | | (359,699 | ) | |
Class C | | | (640,020 | ) | | | (902,180 | ) | |
Class K | | | (994 | ) | | | (1,956 | ) | |
Class R | | | (15,063 | ) | | | (17,686 | ) | |
Class R4 | | | (22,722 | ) | | | (9,909 | ) | |
Class R5 | | | (21,607 | ) | | | (9,276 | ) | |
Class Y | | | (4,922 | ) | | | (69 | ) | |
Class Z | | | (34,270 | ) | | | (33,396 | ) | |
Net realized gains | |
Class A | | | (39,256,522 | ) | | | (41,325,025 | ) | |
Class B | | | (1,044,471 | ) | | | (1,746,156 | ) | |
Class C | | | (4,701,579 | ) | | | (4,383,783 | ) | |
Class K | | | (3,849 | ) | | | (6,379 | ) | |
Class R | | | (65,849 | ) | | | (64,168 | ) | |
Class R4 | | | (54,834 | ) | | | (26,545 | ) | |
Class R5 | | | (46,277 | ) | | | (25,694 | ) | |
Class Y | | | (7,475 | ) | | | (189 | ) | |
Class Z | | | (117,323 | ) | | | (95,212 | ) | |
Total distributions to shareholders | | | (55,519,267 | ) | | | (61,816,363 | ) | |
Increase (decrease) in net assets from capital stock activity | | | 49,105,387 | | | | 42,200,788 | | |
Total increase (decrease) in net assets | | | (32,179,140 | ) | | | 27,194,470 | | |
Net assets at beginning of year | | | 665,693,285 | | | | 638,498,815 | | |
Net assets at end of year | | $ | 633,514,145 | | | $ | 665,693,285 | | |
Excess of distributions over net investment income | | $ | (11,821 | ) | | $ | (9,501 | ) | |
The accompanying Notes to Financial Statements are an integral part of this statement.
Annual Report 2016
94
COLUMBIA CAPITAL ALLOCATION PORTFOLIOS
STATEMENT OF CHANGES IN NET ASSETS (continued)
| | | Columbia Capital Allocation
Conservative Portfolio | | Columbia Capital Allocation
Moderate Conservative Portfolio | |
| | | Year Ended
January 31, 2016 | | Year Ended
January 31, 2015 | | Year Ended
January 31, 2016 | | Year Ended
January 31, 2015 | |
| | | Shares | | Dollars ($) | | Shares | | Dollars ($) | | Shares | | Dollars ($) | | Shares | | Dollars ($) | |
Capital stock activity | |
Class A shares | |
Subscriptions(a) | | | 2,526,066 | | | | 25,121,440 | | | | 2,621,777 | | | | 27,140,318 | | | | 5,576,851 | | | | 60,564,594 | | | | 5,541,896 | | | | 63,029,176 | | |
Distributions reinvested | | | 843,495 | | | | 8,241,451 | | | | 1,725,455 | | | | 17,624,946 | | | | 2,300,914 | | | | 24,473,485 | | | | 4,244,327 | | | | 47,459,752 | | |
Redemptions | | | (4,741,051 | ) | | | (47,178,086 | ) | | | (5,556,640 | ) | | | (57,682,238 | ) | | | (8,689,832 | ) | | | (94,438,223 | ) | | | (8,770,781 | ) | | | (100,034,271 | ) | |
Net increase (decrease) | | | (1,371,490 | ) | | | (13,815,195 | ) | | | (1,209,408 | ) | | | (12,916,974 | ) | | | (812,067 | ) | | | (9,400,144 | ) | | | 1,015,442 | | | | 10,454,657 | | |
Class B shares | |
Subscriptions | | | 16,958 | | | | 170,969 | | | | 38,446 | | | | 395,003 | | | | 33,232 | | | | 359,669 | | | | 92,475 | | | | 1,046,557 | | |
Distributions reinvested | | | 13,764 | | | | 134,536 | | | | 58,706 | | | | 598,857 | | | | 39,619 | | | | 420,807 | | | | 146,052 | | | | 1,627,147 | | |
Redemptions(a) | | | (443,974 | ) | | | (4,416,213 | ) | | | (535,351 | ) | | | (5,532,938 | ) | | | (852,725 | ) | | | (9,261,357 | ) | | | (1,077,387 | ) | | | (12,199,564 | ) | |
Net decrease | | | (413,252 | ) | | | (4,110,708 | ) | | | (438,199 | ) | | | (4,539,078 | ) | | | (779,874 | ) | | | (8,480,881 | ) | | | (838,860 | ) | | | (9,525,860 | ) | |
Class C shares | |
Subscriptions | | | 917,744 | | | | 9,088,962 | | | | 928,139 | | | | 9,555,122 | | | | 1,530,067 | | | | 16,400,103 | | | | 1,621,177 | | | | 18,239,558 | | |
Distributions reinvested | | | 139,171 | | | | 1,351,229 | | | | 298,654 | | | | 3,036,129 | | | | 344,213 | | | | 3,610,210 | | | | 645,039 | | | | 7,123,139 | | |
Redemptions | | | (1,172,463 | ) | | | (11,568,458 | ) | | | (1,073,515 | ) | | | (11,082,639 | ) | | | (1,692,662 | ) | | | (18,082,443 | ) | | | (1,575,771 | ) | | | (17,728,564 | ) | |
Net increase (decrease) | | | (115,548 | ) | | | (1,128,267 | ) | | | 153,278 | | | | 1,508,612 | | | | 181,618 | | | | 1,927,870 | | | | 690,445 | | | | 7,634,133 | | |
Class K shares | |
Subscriptions | | | 62 | | | | 605 | | | | 52 | | | | 537 | | | | — | | | | — | | | | 17 | | | | 189 | | |
Distributions reinvested | | | 376 | | | | 3,638 | | | | 686 | | | | 6,944 | | | | 3 | | | | 26 | | | | 5 | | | | 61 | | |
Redemptions | | | (19 | ) | | | (182 | ) | | | (755 | ) | | | (7,849 | ) | | | (19 | ) | | | (199 | ) | | | (4,746 | ) | | | (54,329 | ) | |
Net increase (decrease) | | | 419 | | | | 4,061 | | | | (17 | ) | | | (368 | ) | | | (16 | ) | | | (173 | ) | | | (4,724 | ) | | | (54,079 | ) | |
Class R shares | |
Subscriptions | | | 31,147 | | | | 315,995 | | | | 4,621 | | | | 47,946 | | | | 360,874 | | | | 3,845,506 | | | | 65,432 | | | | 740,588 | | |
Distributions reinvested | | | 1,611 | | | | 15,675 | | | | 1,332 | | | | 13,591 | | | | 14,946 | | | | 157,524 | | | | 13,337 | | | | 149,354 | | |
Redemptions | | | (1,238 | ) | | | (12,407 | ) | | | (2,938 | ) | | | (30,795 | ) | | | (85,630 | ) | | | (910,701 | ) | | | (72,943 | ) | | | (834,372 | ) | |
Net increase (decrease) | | | 31,520 | | | | 319,263 | | | | 3,015 | | | | 30,742 | | | | 290,190 | | | | 3,092,329 | | | | 5,826 | | | | 55,570 | | |
Class R4 shares | |
Subscriptions | | | 6,500 | | | | 64,994 | | | | 16,804 | | | | 172,489 | | | | 43,013 | | | | 459,448 | | | | 90,075 | | | | 1,023,566 | | |
Distributions reinvested | | | 648 | | | | 6,303 | | | | 528 | | | | 5,285 | | | | 5,320 | | | | 56,026 | | | | 6,503 | | | | 71,883 | | |
Redemptions | | | (7,196 | ) | | | (71,028 | ) | | | (2,065 | ) | | | (20,819 | ) | | | (29,409 | ) | | | (315,011 | ) | | | (8,116 | ) | | | (89,475 | ) | |
Net increase (decrease) | | | (48 | ) | | | 269 | | | | 15,267 | | | | 156,955 | | | | 18,924 | | | | 200,463 | | | | 88,462 | | | | 1,005,974 | | |
Class R5 shares | |
Subscriptions | | | 34,554 | | | | 338,277 | | | | 5,813 | | | | 58,066 | | | | 54,090 | | | | 572,346 | | | | 13,248 | | | | 150,449 | | |
Distributions reinvested | | | 815 | | | | 7,792 | | | | — | | | | — | | | | 2,218 | | | | 23,065 | | | | 1,381 | | | | 15,256 | | |
Redemptions | | | (7,172 | ) | | | (69,298 | ) | | | — | | | | — | | | | (7,985 | ) | | | (82,485 | ) | | | (1,240 | ) | | | (13,979 | ) | |
Net increase | | | 28,197 | | | | 276,771 | | | | 5,813 | | | | 58,066 | | | | 48,323 | | | | 512,926 | | | | 13,389 | | | | 151,726 | | |
Class Y shares | |
Subscriptions | | | 17,151 | | | | 165,939 | | | | — | | | | — | | | | 962 | | | | 10,320 | | | | 166 | | | | 1,851 | | |
Distributions reinvested | | | 339 | | | | 3,213 | | | | — | | | | — | | | | 30 | | | | 315 | | | | 5 | | | | 58 | | |
Redemptions | | | (9 | ) | | | (88 | ) | | | — | | | | — | | | | (366 | ) | | | (3,908 | ) | | | (41 | ) | | | (452 | ) | |
Net increase | | | 17,481 | | | | 169,064 | | | | — | | | | — | | | | 626 | | | | 6,727 | | | | 130 | | | | 1,457 | | |
The accompanying Notes to Financial Statements are an integral part of this statement.
Annual Report 2016
95
COLUMBIA CAPITAL ALLOCATION PORTFOLIOS
STATEMENT OF CHANGES IN NET ASSETS (continued)
| | | Columbia Capital Allocation
Conservative Portfolio | | Columbia Capital Allocation
Moderate Conservative Portfolio | |
| | | Year Ended
January 31, 2016 | | Year Ended
January 31, 2015 | | Year Ended
January 31, 2016 | | Year Ended
January 31, 2015 | |
| | | Shares | | Dollars ($) | | Shares | | Dollars ($) | | Shares | | Dollars ($) | | Shares | | Dollars ($) | |
Capital stock activity (continued) | |
Class Z shares | |
Subscriptions | | | 213,994 | | | | 2,096,292 | | | | 159,935 | | | | 1,672,487 | | | | 470,076 | | | | 5,022,976 | | | | 713,743 | | | | 7,988,759 | | |
Distributions reinvested | | | 9,674 | | | | 94,396 | | | | 19,198 | | | | 196,142 | | | | 58,675 | | | | 616,172 | | | | 96,806 | | | | 1,068,999 | | |
Redemptions | | | (204,935 | ) | | | (2,022,327 | ) | | | (138,649 | ) | | | (1,427,916 | ) | | | (525,729 | ) | | | (5,594,854 | ) | | | (654,233 | ) | | | (7,326,181 | ) | |
Net increase | | | 18,733 | | | | 168,361 | | | | 40,484 | | | | 440,713 | | | | 3,022 | | | | 44,294 | | | | 156,316 | | | | 1,731,577 | | |
Total net increase (decrease) | | | (1,803,988 | ) | | | (18,116,381 | ) | | | (1,429,767 | ) | | | (15,261,332 | ) | | | (1,049,254 | ) | | | (12,096,589 | ) | | | 1,126,426 | | | | 11,455,155 | | |
(a) Includes conversions of Class B shares to Class A shares, if any.
The accompanying Notes to Financial Statements are an integral part of this statement.
Annual Report 2016
96
COLUMBIA CAPITAL ALLOCATION PORTFOLIOS
STATEMENT OF CHANGES IN NET ASSETS (continued)
| | | Columbia Capital Allocation
Moderate Portfolio | | Columbia Capital Allocation
Moderate Aggressive Portfolio | |
| | | Year Ended
January 31, 2016 | | Year Ended
January 31, 2015 | | Year Ended
January 31, 2016 | | Year Ended
January 31, 2015 | |
| | | Shares | | Dollars ($) | | Shares | | Dollars ($) | | Shares | | Dollars ($) | | Shares | | Dollars ($) | |
Capital stock activity | |
Class A shares | |
Subscriptions(a) | | | 10,333,555 | | | | 117,917,557 | | | | 12,947,125 | | | | 156,209,088 | | | | 11,604,996 | | | | 143,928,857 | | | | 12,890,460 | | | | 168,780,106 | | |
Distributions reinvested | | | 9,395,199 | | | | 103,690,280 | | | | 12,992,838 | | | | 153,064,805 | | | | 9,395,759 | | | | 113,615,323 | | | | 13,509,586 | | | | 173,522,840 | | |
Redemptions | | | (19,550,249 | ) | | | (222,999,413 | ) | | | (19,719,911 | ) | | | (237,538,126 | ) | | | (19,147,608 | ) | | | (237,749,912 | ) | | | (19,449,855 | ) | | | (255,169,724 | ) | |
Net increase (decrease) | | | 178,505 | | | | (1,391,576 | ) | | | 6,220,052 | | | | 71,735,767 | | | | 1,853,147 | | | | 19,794,268 | | | | 6,950,191 | | | | 87,133,222 | | |
Class B shares | |
Subscriptions | | | 56,625 | | | | 645,503 | | | | 167,118 | | | | 2,007,411 | | | | 70,638 | | | | 862,866 | | | | 209,854 | | | | 2,707,214 | | |
Distributions reinvested | | | 190,624 | | | | 2,102,322 | | | | 477,608 | | | | 5,606,845 | | | | 198,084 | | | | 2,378,909 | | | | 487,292 | | | | 6,205,799 | | |
Redemptions(a) | | | (2,096,547 | ) | | | (23,986,672 | ) | | | (2,448,067 | ) | | | (29,299,200 | ) | | | (2,440,858 | ) | | | (30,260,236 | ) | | | (2,901,317 | ) | | | (37,705,712 | ) | |
Net decrease | | | (1,849,298 | ) | | | (21,238,847 | ) | | | (1,803,341 | ) | | | (21,684,944 | ) | | | (2,172,136 | ) | | | (27,018,461 | ) | | | (2,204,171 | ) | | | (28,792,699 | ) | |
Class C shares | |
Subscriptions | | | 3,249,915 | | | | 36,695,291 | | | | 3,260,986 | | | | 39,051,679 | | | | 2,871,075 | | | | 35,637,176 | | | | 2,858,744 | | | | 37,738,722 | | |
Distributions reinvested | | | 1,153,671 | | | | 12,625,304 | | | | 1,498,025 | | | | 17,515,321 | | | | 1,006,697 | | | | 12,223,008 | | | | 1,398,343 | | | | 18,053,716 | | |
Redemptions | | | (2,792,354 | ) | | | (31,606,349 | ) | | | (2,598,610 | ) | | | (31,062,362 | ) | | | (2,513,149 | ) | | | (31,310,351 | ) | | | (2,430,791 | ) | | | (32,107,001 | ) | |
Net increase | | | 1,611,232 | | | | 17,714,246 | | | | 2,160,401 | | | | 25,504,638 | | | | 1,364,623 | | | | 16,549,833 | | | | 1,826,296 | | | | 23,685,437 | | |
Class K shares | |
Subscriptions | | | 1,780 | | | | 20,150 | | | | 1,899 | | | | 22,946 | | | | 45 | | | | 581 | | | | 456 | | | | 5,992 | | |
Distributions reinvested | | | 2,077 | | | | 22,887 | | | | 2,567 | | | | 30,203 | | | | 586 | | | | 7,058 | | | | 830 | | | | 10,629 | | |
Redemptions | | | (1,142 | ) | | | (12,932 | ) | | | (8,930 | ) | | | (110,339 | ) | | | (440 | ) | | | (5,714 | ) | | | (1,432 | ) | | | (19,118 | ) | |
Net increase (decrease) | | | 2,715 | | | | 30,105 | | | | (4,464 | ) | | | (57,190 | ) | | | 191 | | | | 1,925 | | | | (146 | ) | | | (2,497 | ) | |
Class R shares | |
Subscriptions | | | 39,494 | | | | 452,709 | | | | 45,969 | | | | 554,037 | | | | 117,899 | | | | 1,460,199 | | | | 106,419 | | | | 1,398,886 | | |
Distributions reinvested | | | 9,850 | | | | 108,793 | | | | 13,527 | | | | 158,879 | | | | 23,993 | | | | 290,150 | | | | 41,780 | | | | 535,584 | | |
Redemptions | | | (59,708 | ) | | | (670,748 | ) | | | (14,901 | ) | | | (178,125 | ) | | | (165,990 | ) | | | (2,026,526 | ) | | | (139,518 | ) | | | (1,793,685 | ) | |
Net increase (decrease) | | | (10,364 | ) | | | (109,246 | ) | | | 44,595 | | | | 534,791 | | | | (24,098 | ) | | | (276,177 | ) | | | 8,681 | | | | 140,785 | | |
Class R4 shares | |
Subscriptions | | | 16,349 | | | | 182,991 | | | | 2,412 | | | | 28,623 | | | | 22,127 | | | | 277,972 | | | | 79,609 | | | | 1,064,857 | | |
Distributions reinvested | | | 936 | | | | 9,952 | | | | 127 | | | | 1,461 | | | | 7,345 | | | | 89,265 | | | | 4,805 | | | | 61,080 | | |
Redemptions | | | (91 | ) | | | (1,000 | ) | | | (230 | ) | | | (2,725 | ) | | | (13,921 | ) | | | (169,625 | ) | | | (909 | ) | | | (11,835 | ) | |
Net increase | | | 17,194 | | | | 191,943 | | | | 2,309 | | | | 27,359 | | | | 15,551 | | | | 197,612 | | | | 83,505 | | | | 1,114,102 | | |
Class R5 shares | |
Subscriptions | | | 360,086 | | | | 3,972,903 | | | | 6,536 | | | | 76,537 | | | | 268,249 | | | | 3,318,687 | | | | 3,520 | | | | 46,661 | | |
Distributions reinvested | | | 15,097 | | | | 159,332 | | | | 326 | | | | 3,737 | | | | 15,836 | | | | 188,647 | | | | 5,571 | | | | 71,967 | | |
Redemptions | | | (10,312 | ) | | | (113,121 | ) | | | (267 | ) | | | (3,000 | ) | | | (20,784 | ) | | | (246,098 | ) | | | (1,524 | ) | | | (19,728 | ) | |
Net increase | | | 364,871 | | | | 4,019,114 | | | | 6,595 | | | | 77,274 | | | | 263,301 | | | | 3,261,236 | | | | 7,567 | | | | 98,900 | | |
Class T shares | |
Subscriptions | | | — | | | | — | | | | — | | | | — | | | | 55,836 | | | | 693,652 | | | | 51,867 | | | | 676,876 | | |
Distributions reinvested | | | — | | | | — | | | | — | | | | — | | | | 454,646 | | | | 5,499,006 | | | | 669,576 | | | | 8,601,109 | | |
Redemptions | | | — | | | | — | | | | — | | | | — | | | | (698,845 | ) | | | (8,669,705 | ) | | | (726,050 | ) | | | (9,535,902 | ) | |
Net decrease | | | — | | | | — | | | | — | | | | — | | | | (188,363 | ) | | | (2,477,047 | ) | | | (4,607 | ) | | | (257,917 | ) | |
The accompanying Notes to Financial Statements are an integral part of this statement.
Annual Report 2016
97
COLUMBIA CAPITAL ALLOCATION PORTFOLIOS
STATEMENT OF CHANGES IN NET ASSETS (continued)
| | | Columbia Capital Allocation
Moderate Portfolio | | Columbia Capital Allocation
Moderate Aggressive Portfolio | |
| | | Year Ended
January 31, 2016 | | Year Ended
January 31, 2015 | | Year Ended
January 31, 2016 | | Year Ended
January 31, 2015 | |
| | | Shares | | Dollars ($) | | Shares | | Dollars ($) | | Shares | | Dollars ($) | | Shares | | Dollars ($) | |
Capital stock activity (continued) | |
Class Y shares | |
Subscriptions | | | 35,546 | | | | 389,318 | | | | — | | | | — | | | | 41,904 | | | | 498,953 | | | | 1 | | | | 10 | | |
Distributions reinvested | | | 1,511 | | | | 15,923 | | | | — | | | | — | | | | 1,461 | | | | 16,773 | | | | — | | | | — | | |
Redemptions | | | (1,284 | ) | | | (13,155 | ) | | | — | | | | — | | | | (9,094 | ) | | | (106,618 | ) | | | (16 | ) | | | (210 | ) | |
Net increase (decrease) | | | 35,773 | | | | 392,086 | | | | — | | | | — | | | | 34,271 | | | | 409,108 | | | | (15 | ) | | | (200 | ) | |
Class Z shares | |
Subscriptions | | | 142,637 | | | | 1,615,688 | | | | 121,993 | | | | 1,471,293 | | | | 1,257,040 | | | | 15,423,589 | | | | 1,315,174 | | | | 17,147,355 | | |
Distributions reinvested | | | 12,420 | | | | 136,931 | | | | 24,054 | | | | 283,239 | | | | 490,413 | | | | 5,921,054 | | | | 699,684 | | | | 8,970,274 | | |
Redemptions | | | (178,853 | ) | | | (2,065,558 | ) | | | (165,444 | ) | | | (1,986,867 | ) | | | (1,840,996 | ) | | | (22,697,231 | ) | | | (1,568,691 | ) | | | (20,572,508 | ) | |
Net increase (decrease) | | | (23,796 | ) | | | (312,939 | ) | | | (19,397 | ) | | | (232,335 | ) | | | (93,543 | ) | | | (1,352,588 | ) | | | 446,167 | | | | 5,545,121 | | |
Total net increase (decrease) | | | 326,832 | | | | (705,114 | ) | | | 6,606,750 | | | | 75,905,360 | | | | 1,052,944 | | | | 9,089,709 | | | | 7,113,468 | | | | 88,664,254 | | |
(a) Includes conversions of Class B shares to Class A shares, if any.
The accompanying Notes to Financial Statements are an integral part of this statement.
Annual Report 2016
98
COLUMBIA CAPITAL ALLOCATION PORTFOLIOS
STATEMENT OF CHANGES IN NET ASSETS (continued)
| | | Columbia Capital Allocation Aggressive Portfolio | |
| | | Year Ended January 31, 2016 | | Year Ended January 31, 2015 | |
| | | Shares | | Dollars ($) | | Shares | | Dollars ($) | |
Capital stock activity | |
Class A shares | |
Subscriptions(a) | | | 4,794,249 | | | | 60,144,147 | | | | 4,456,735 | | | | 58,954,134 | | |
Distributions reinvested | | | 3,959,049 | | | | 48,186,327 | | | | 4,161,553 | | | | 53,807,701 | | |
Redemptions | | | (5,250,361 | ) | | | (66,074,788 | ) | | | (5,746,418 | ) | | | (76,231,760 | ) | |
Net increase | | | 3,502,937 | | | | 42,255,686 | | | | 2,871,870 | | | | 36,530,075 | | |
Class B shares | |
Subscriptions | | | 33,216 | | | | 406,259 | | | | 46,579 | | | | 616,874 | | |
Distributions reinvested | | | 94,616 | | | | 1,159,885 | | | | 161,578 | | | | 2,092,473 | | |
Redemptions(a) | | | (806,208 | ) | | | (10,206,926 | ) | | | (904,483 | ) | | | (11,901,859 | ) | |
Net decrease | | | (678,376 | ) | | | (8,640,782 | ) | | | (696,326 | ) | | | (9,192,512 | ) | |
Class C shares | |
Subscriptions | | | 1,449,242 | | | | 17,781,114 | | | | 1,310,072 | | | | 17,020,272 | | |
Distributions reinvested | | | 441,119 | | | | 5,279,382 | | | | 410,360 | | | | 5,215,821 | | |
Redemptions | | | (805,578 | ) | | | (9,874,715 | ) | | | (663,516 | ) | | | (8,632,474 | ) | |
Net increase | | | 1,084,783 | | | | 13,185,781 | | | | 1,056,916 | | | | 13,603,619 | | |
Class K shares | |
Subscriptions | | | 570 | | | | 7,178 | | | | 521 | | | | 6,953 | | |
Distributions reinvested | | | 380 | | | | 4,628 | | | | 618 | | | | 8,075 | | |
Redemptions | | | (1,313 | ) | | | (16,991 | ) | | | (7,540 | ) | | | (101,407 | ) | |
Net decrease | | | (363 | ) | | | (5,185 | ) | | | (6,401 | ) | | | (86,379 | ) | |
Class R shares | |
Subscriptions | | | 37,493 | | | | 458,163 | | | | 19,059 | | | | 251,376 | | |
Distributions reinvested | | | 5,776 | | | | 69,997 | | | | 6,367 | | | | 81,855 | | |
Redemptions | | | (23,015 | ) | | | (279,771 | ) | | | (2,734 | ) | | | (35,753 | ) | |
Net increase | | | 20,254 | | | | 248,389 | | | | 22,692 | | | | 297,478 | | |
Class R4 shares | |
Subscriptions | | | 75,164 | | | | 927,695 | | | | 36,616 | | | | 490,394 | | |
Distributions reinvested | | | 6,592 | | | | 77,345 | | | | 2,877 | | | | 36,200 | | |
Redemptions | | | (50,509 | ) | | | (577,499 | ) | | | (1,235 | ) | | | (16,046 | ) | |
Net increase | | | 31,247 | | | | 427,541 | | | | 38,258 | | | | 510,548 | | |
Class R5 shares | |
Subscriptions | | | 73,667 | | | | 901,567 | | | | 10,369 | | | | 135,788 | | |
Distributions reinvested | | | 5,797 | | | | 67,672 | | | | 2,730 | | | | 34,714 | | |
Redemptions | | | (14,685 | ) | | | (177,904 | ) | | | (12,685 | ) | | | (167,643 | ) | |
Net increase | | | 64,779 | | | | 791,335 | | | | 414 | | | | 2,859 | | |
The accompanying Notes to Financial Statements are an integral part of this statement.
Annual Report 2016
99
COLUMBIA CAPITAL ALLOCATION PORTFOLIOS
STATEMENT OF CHANGES IN NET ASSETS (continued)
| | | Columbia Capital Allocation Aggressive Portfolio | |
| | | Year Ended January 31, 2016 | | Year Ended January 31, 2015 | |
| | | Shares | | Dollars ($) | | Shares | | Dollars ($) | |
Capital stock activity (continued) | |
Class Y shares | |
Subscriptions | | | 20,732 | | | | 247,809 | | | | — | | | | — | | |
Distributions reinvested | | | 1,064 | | | | 12,182 | | | | — | | | | — | | |
Redemptions | | | (2,355 | ) | | | (25,801 | ) | | | (16 | ) | | | (200 | ) | |
Net increase (decrease) | | | 19,441 | | | | 234,190 | | | | (16 | ) | | | (200 | ) | |
Class Z shares | |
Subscriptions | | | 64,561 | | | | 808,452 | | | | 66,669 | | | | 888,250 | | |
Distributions reinvested | | | 11,894 | | | | 143,726 | | | | 9,435 | | | | 121,213 | | |
Redemptions | | | (27,280 | ) | | | (343,746 | ) | | | (35,808 | ) | | | (474,163 | ) | |
Net increase | | | 49,175 | | | | 608,432 | | | | 40,296 | | | | 535,300 | | |
Total net increase | | | 4,093,877 | | | | 49,105,387 | | | | 3,327,703 | | | | 42,200,788 | | |
(a) Includes conversions of Class B shares to Class A shares, if any.
The accompanying Notes to Financial Statements are an integral part of this statement.
Annual Report 2016
100
COLUMBIA CAPITAL ALLOCATION PORTFOLIOS
FINANCIAL HIGHLIGHTS
Columbia Capital Allocation Conservative Portfolio
The following tables are intended to help you understand the Fund's financial performance. Certain information reflects financial results for a single share of a class held for the periods shown. Per share net investment income (loss) amounts are calculated based on average shares outstanding during the period. Total return assumes reinvestment of all dividends and distributions, if any. Total return does not reflect payment of sales charges, if any. Total return and portfolio turnover are not annualized for periods of less than one year. The portfolio turnover rate is calculated without regard to purchase and sales transactions of short-term instruments and certain derivatives, if any. If such transactions were included, the Fund's portfolio turnover rate may be higher.
| | | Year Ended January 31, | |
Class A | | 2016 | | 2015 | | 2014 | | 2013 | | 2012 | |
Per share data | |
Net asset value, beginning of period | | $ | 10.10 | | | $ | 10.34 | | | $ | 10.63 | | | $ | 10.32 | | | $ | 10.44 | | |
Income from investment operations: | |
Net investment income | | | 0.18 | | | | 0.18 | | | | 0.20 | | | | 0.24 | | | | 0.25 | | |
Net realized and unrealized gain (loss) | | | (0.46 | ) | | | 0.35 | | | | 0.14 | | | | 0.54 | | | | 0.14 | | |
Total from investment operations | | | (0.28 | ) | | | 0.53 | | | | 0.34 | | | | 0.78 | | | | 0.39 | | |
Less distributions to shareholders: | |
Net investment income | | | (0.19 | ) | | | (0.19 | ) | | | (0.27 | ) | | | (0.35 | ) | | | (0.25 | ) | |
Net realized gains | | | (0.18 | ) | | | (0.58 | ) | | | (0.36 | ) | | | (0.12 | ) | | | (0.26 | ) | |
Total distributions to shareholders | | | (0.37 | ) | | | (0.77 | ) | | | (0.63 | ) | | | (0.47 | ) | | | (0.51 | ) | |
Net asset value, end of period | | $ | 9.45 | | | $ | 10.10 | | | $ | 10.34 | | | $ | 10.63 | | | $ | 10.32 | | |
Total return | | | (2.81 | %) | | | 5.24 | % | | | 3.28 | % | | | 7.62 | % | | | 3.90 | % | |
Ratios to average net assets(a) | |
Total gross expenses | | | 0.52 | % | | | 0.55 | % | | | 0.50 | % | | | 0.48 | % | | | 0.49 | % | |
Total net expenses(b) | | | 0.52 | %(c) | | | 0.55 | %(c) | | | 0.50 | %(c) | | | 0.48 | %(c) | | | 0.49 | %(c) | |
Net investment income | | | 1.83 | % | | | 1.69 | % | | | 1.91 | % | | | 2.28 | % | | | 2.35 | % | |
Supplemental data | |
Net assets, end of period (in thousands) | | $ | 216,423 | | | $ | 245,212 | | | $ | 263,334 | | | $ | 282,382 | | | $ | 251,178 | | |
Portfolio turnover | | | 24 | % | | | 12 | % | | | 22 | % | | | 19 | % | | | 88 | % | |
Notes to Financial Highlights
(a) In addition to the fees and expenses that the Fund bears directly, the Fund indirectly bears a pro rata share of the fees and expenses of any other funds in which it invests. Such indirect expenses are not included in the Fund's reported expense ratios.
(b) Total net expenses include the impact of certain fee waivers/expense reimbursements made by the Investment Manager and certain of its affiliates, if applicable.
(c) The benefits derived from expense reductions had an impact of less than 0.01%.
The accompanying Notes to Financial Statements are an integral part of this statement.
Annual Report 2016
101
COLUMBIA CAPITAL ALLOCATION PORTFOLIOS
FINANCIAL HIGHLIGHTS (continued)
Columbia Capital Allocation Conservative Portfolio
| | | Year Ended January 31, | |
Class B | | 2016 | | 2015 | | 2014 | | 2013 | | 2012 | |
Per share data | |
Net asset value, beginning of period | | $ | 10.07 | | | $ | 10.31 | | | $ | 10.60 | | | $ | 10.29 | | | $ | 10.40 | | |
Income from investment operations: | |
Net investment income | | | 0.10 | | | | 0.09 | | | | 0.11 | | | | 0.15 | | | | 0.16 | | |
Net realized and unrealized gain (loss) | | | (0.45 | ) | | | 0.37 | | | | 0.15 | | | | 0.54 | | | | 0.16 | | |
Total from investment operations | | | (0.35 | ) | | | 0.46 | | | | 0.26 | | | | 0.69 | | | | 0.32 | | |
Less distributions to shareholders: | |
Net investment income | | | (0.12 | ) | | | (0.12 | ) | | | (0.19 | ) | | | (0.26 | ) | | | (0.17 | ) | |
Net realized gains | | | (0.18 | ) | | | (0.58 | ) | | | (0.36 | ) | | | (0.12 | ) | | | (0.26 | ) | |
Total distributions to shareholders | | | (0.30 | ) | | | (0.70 | ) | | | (0.55 | ) | | | (0.38 | ) | | | (0.43 | ) | |
Net asset value, end of period | | $ | 9.42 | | | $ | 10.07 | | | $ | 10.31 | | | $ | 10.60 | | | $ | 10.29 | | |
Total return | | | (3.55 | %) | | | 4.46 | % | | | 2.51 | % | | | 6.79 | % | | | 3.19 | % | |
Ratios to average net assets(a) | |
Total gross expenses | | | 1.27 | % | | | 1.30 | % | | | 1.25 | % | | | 1.23 | % | | | 1.24 | % | |
Total net expenses(b) | | | 1.27 | %(c) | | | 1.30 | %(c) | | | 1.25 | %(c) | | | 1.23 | %(c) | | | 1.24 | %(c) | |
Net investment income | | | 0.98 | % | | | 0.90 | % | | | 1.07 | % | | | 1.47 | % | | | 1.56 | % | |
Supplemental data | |
Net assets, end of period (in thousands) | | $ | 3,364 | | | $ | 7,759 | | | $ | 12,454 | | | $ | 19,598 | | | $ | 24,717 | | |
Portfolio turnover | | | 24 | % | | | 12 | % | | | 22 | % | | | 19 | % | | | 88 | % | |
Notes to Financial Highlights
(a) In addition to the fees and expenses that the Fund bears directly, the Fund indirectly bears a pro rata share of the fees and expenses of any other funds in which it invests. Such indirect expenses are not included in the Fund's reported expense ratios.
(b) Total net expenses include the impact of certain fee waivers/expense reimbursements made by the Investment Manager and certain of its affiliates, if applicable.
(c) The benefits derived from expense reductions had an impact of less than 0.01%.
The accompanying Notes to Financial Statements are an integral part of this statement.
Annual Report 2016
102
COLUMBIA CAPITAL ALLOCATION PORTFOLIOS
FINANCIAL HIGHLIGHTS (continued)
Columbia Capital Allocation Conservative Portfolio
| | | Year Ended January 31, | |
Class C | | 2016 | | 2015 | | 2014 | | 2013 | | 2012 | |
Per share data | |
Net asset value, beginning of period | | $ | 10.05 | | | $ | 10.28 | | | $ | 10.58 | | | $ | 10.28 | | | $ | 10.39 | | |
Income from investment operations: | |
Net investment income | | | 0.11 | | | | 0.10 | | | | 0.12 | | | | 0.16 | | | | 0.17 | | |
Net realized and unrealized gain (loss) | | | (0.46 | ) | | | 0.37 | | | | 0.13 | | | | 0.53 | | | | 0.16 | | |
Total from investment operations | | | (0.35 | ) | | | 0.47 | | | | 0.25 | | | | 0.69 | | | | 0.33 | | |
Less distributions to shareholders: | |
Net investment income | | | (0.12 | ) | | | (0.12 | ) | | | (0.19 | ) | | | (0.27 | ) | | | (0.18 | ) | |
Net realized gains | | | (0.18 | ) | | | (0.58 | ) | | | (0.36 | ) | | | (0.12 | ) | | | (0.26 | ) | |
Total distributions to shareholders | | | (0.30 | ) | | | (0.70 | ) | | | (0.55 | ) | | | (0.39 | ) | | | (0.44 | ) | |
Net asset value, end of period | | $ | 9.40 | | | $ | 10.05 | | | $ | 10.28 | | | $ | 10.58 | | | $ | 10.28 | | |
Total return | | | (3.56 | %) | | | 4.57 | % | | | 2.43 | % | | | 6.75 | % | | | 3.28 | % | |
Ratios to average net assets(a) | |
Total gross expenses | | | 1.27 | % | | | 1.30 | % | | | 1.26 | % | | | 1.23 | % | | | 1.24 | % | |
Total net expenses(b) | | | 1.27 | %(c) | | | 1.30 | %(c) | | | 1.26 | %(c) | | | 1.23 | %(c) | | | 1.24 | %(c) | |
Net investment income | | | 1.08 | % | | | 0.95 | % | | | 1.18 | % | | | 1.54 | % | | | 1.62 | % | |
Supplemental data | |
Net assets, end of period (in thousands) | | $ | 43,719 | | | $ | 47,899 | | | $ | 47,435 | | | $ | 45,368 | | | $ | 36,637 | | |
Portfolio turnover | | | 24 | % | | | 12 | % | | | 22 | % | | | 19 | % | | | 88 | % | |
Notes to Financial Highlights
(a) In addition to the fees and expenses that the Fund bears directly, the Fund indirectly bears a pro rata share of the fees and expenses of any other funds in which it invests. Such indirect expenses are not included in the Fund's reported expense ratios.
(b) Total net expenses include the impact of certain fee waivers/expense reimbursements made by the Investment Manager and certain of its affiliates, if applicable.
(c) The benefits derived from expense reductions had an impact of less than 0.01%.
The accompanying Notes to Financial Statements are an integral part of this statement.
Annual Report 2016
103
COLUMBIA CAPITAL ALLOCATION PORTFOLIOS
FINANCIAL HIGHLIGHTS (continued)
Columbia Capital Allocation Conservative Portfolio
| | | Year Ended January 31, | |
Class K | | 2016 | | 2015 | | 2014 | | 2013 | | 2012 | |
Per share data | |
Net asset value, beginning of period | | $ | 10.01 | | | $ | 10.24 | | | $ | 10.54 | | | $ | 10.25 | | | $ | 10.35 | | |
Income from investment operations: | |
Net investment income | | | 0.19 | | | | 0.18 | | | | 0.23 | | | | 0.24 | | | | 0.25 | | |
Net realized and unrealized gain (loss) | | | (0.46 | ) | | | 0.37 | | | | 0.12 | | | | 0.53 | | | | 0.16 | | |
Total from investment operations | | | (0.27 | ) | | | 0.55 | | | | 0.35 | | | | 0.77 | | | | 0.41 | | |
Less distributions to shareholders: | |
Net investment income | | | (0.20 | ) | | | (0.20 | ) | | | (0.29 | ) | | | (0.36 | ) | | | (0.25 | ) | |
Net realized gains | | | (0.18 | ) | | | (0.58 | ) | | | (0.36 | ) | | | (0.12 | ) | | | (0.26 | ) | |
Total distributions to shareholders | | | (0.38 | ) | | | (0.78 | ) | | | (0.65 | ) | | | (0.48 | ) | | | (0.51 | ) | |
Net asset value, end of period | | $ | 9.36 | | | $ | 10.01 | | | $ | 10.24 | | | $ | 10.54 | | | $ | 10.25 | | |
Total return | | | (2.76 | %) | | | 5.48 | % | | | 3.35 | % | | | 7.62 | % | | | 4.14 | % | |
Ratios to average net assets(a) | |
Total gross expenses | | | 0.46 | % | | | 0.47 | % | | | 0.41 | % | | | 0.39 | % | | | 0.41 | % | |
Total net expenses(b) | | | 0.46 | % | | | 0.47 | % | | | 0.41 | % | | | 0.39 | % | | | 0.39 | % | |
Net investment income | | | 1.91 | % | | | 1.79 | % | | | 2.16 | % | | | 2.27 | % | | | 2.43 | % | |
Supplemental data | |
Net assets, end of period (in thousands) | | $ | 94 | | | $ | 96 | | | $ | 99 | | | $ | 12 | | | $ | 79 | | |
Portfolio turnover | | | 24 | % | | | 12 | % | | | 22 | % | | | 19 | % | | | 88 | % | |
Notes to Financial Highlights
(a) In addition to the fees and expenses that the Fund bears directly, the Fund indirectly bears a pro rata share of the fees and expenses of any other funds in which it invests. Such indirect expenses are not included in the Fund's reported expense ratios.
(b) Total net expenses include the impact of certain fee waivers/expense reimbursements made by the Investment Manager and certain of its affiliates, if applicable.
The accompanying Notes to Financial Statements are an integral part of this statement.
Annual Report 2016
104
COLUMBIA CAPITAL ALLOCATION PORTFOLIOS
FINANCIAL HIGHLIGHTS (continued)
Columbia Capital Allocation Conservative Portfolio
| | | Year Ended January 31, | |
Class R | | 2016 | | 2015 | | 2014 | | 2013 | | 2012 | |
Per share data | |
Net asset value, beginning of period | | $ | 10.10 | | | $ | 10.33 | | | $ | 10.63 | | | $ | 10.32 | | | $ | 10.44 | | |
Income from investment operations: | |
Net investment income | | | 0.17 | | | | 0.15 | | | | 0.20 | | | | 0.25 | | | | 0.22 | | |
Net realized and unrealized gain (loss) | | | (0.47 | ) | | | 0.37 | | | | 0.11 | | | | 0.50 | | | | 0.15 | | |
Total from investment operations | | | (0.30 | ) | | | 0.52 | | | | 0.31 | | | | 0.75 | | | | 0.37 | | |
Less distributions to shareholders: | |
Net investment income | | | (0.17 | ) | | | (0.17 | ) | | | (0.25 | ) | | | (0.32 | ) | | | (0.23 | ) | |
Net realized gains | | | (0.18 | ) | | | (0.58 | ) | | | (0.36 | ) | | | (0.12 | ) | | | (0.26 | ) | |
Total distributions to shareholders | | | (0.35 | ) | | | (0.75 | ) | | | (0.61 | ) | | | (0.44 | ) | | | (0.49 | ) | |
Net asset value, end of period | | $ | 9.45 | | | $ | 10.10 | | | $ | 10.33 | | | $ | 10.63 | | | $ | 10.32 | | |
Total return | | | (3.05 | %) | | | 5.07 | % | | | 2.94 | % | | | 7.39 | % | | | 3.66 | % | |
Ratios to average net assets(a) | |
Total gross expenses | | | 0.77 | % | | | 0.80 | % | | | 0.76 | % | | | 0.72 | % | | | 0.75 | % | |
Total net expenses(b) | | | 0.77 | %(c) | | | 0.80 | %(c) | | | 0.76 | %(c) | | | 0.72 | % | | | 0.75 | % | |
Net investment income | | | 1.72 | % | | | 1.46 | % | | | 1.91 | % | | | 2.36 | % | | | 2.07 | % | |
Supplemental data | |
Net assets, end of period (in thousands) | | $ | 490 | | | $ | 206 | | | $ | 179 | | | $ | 114 | | | $ | 3 | | |
Portfolio turnover | | | 24 | % | | | 12 | % | | | 22 | % | | | 19 | % | | | 88 | % | |
Notes to Financial Highlights
(a) In addition to the fees and expenses that the Fund bears directly, the Fund indirectly bears a pro rata share of the fees and expenses of any other funds in which it invests. Such indirect expenses are not included in the Fund's reported expense ratios.
(b) Total net expenses include the impact of certain fee waivers/expense reimbursements made by the Investment Manager and certain of its affiliates, if applicable.
(c) The benefits derived from expense reductions had an impact of less than 0.01%.
The accompanying Notes to Financial Statements are an integral part of this statement.
Annual Report 2016
105
COLUMBIA CAPITAL ALLOCATION PORTFOLIOS
FINANCIAL HIGHLIGHTS (continued)
Columbia Capital Allocation Conservative Portfolio
| | | Year Ended January 31, | |
Class R4 | | 2016 | | 2015 | | 2014(a) | |
Per share data | |
Net asset value, beginning of period | | $ | 10.04 | | | $ | 10.29 | | | $ | 10.53 | | |
Income from investment operations: | |
Net investment income | | | 0.20 | | | | 0.25 | | | | 0.18 | | |
Net realized and unrealized gain (loss) | | | (0.45 | ) | | | 0.30 | | | | 0.09 | | |
Total from investment operations | | | (0.25 | ) | | | 0.55 | | | | 0.27 | | |
Less distributions to shareholders: | |
Net investment income | | | (0.22 | ) | | | (0.22 | ) | | | (0.26 | ) | |
Net realized gains | | | (0.18 | ) | | | (0.58 | ) | | | (0.25 | ) | |
Total distributions to shareholders | | | (0.40 | ) | | | (0.80 | ) | | | (0.51 | ) | |
Net asset value, end of period | | $ | 9.39 | | | $ | 10.04 | | | $ | 10.29 | | |
Total return | | | (2.57 | %) | | | 5.41 | % | | | 2.56 | % | |
Ratios to average net assets(b) | |
Total gross expenses | | | 0.27 | % | | | 0.31 | % | | | 0.23 | %(c) | |
Total net expenses(d) | | | 0.27 | %(e) | | | 0.31 | %(e) | | | 0.23 | %(c)(e) | |
Net investment income | | | 2.06 | % | | | 2.44 | % | | | 2.67 | %(c) | |
Supplemental data | |
Net assets, end of period (in thousands) | | $ | 145 | | | $ | 156 | | | $ | 2 | | |
Portfolio turnover | | | 24 | % | | | 12 | % | | | 22 | % | |
Notes to Financial Highlights
(a) Based on operations from June 13, 2013 (commencement of operations) through the stated period end.
(b) In addition to the fees and expenses that the Fund bears directly, the Fund indirectly bears a pro rata share of the fees and expenses of the underlying funds in which the Fund invests. Such indirect expenses are not included in the Fund's reported expense ratios.
(c) Annualized.
(d) Total net expenses include the impact of certain fee waivers/expense reimbursements made by the Investment Manager and certain of its affiliates, if applicable.
(e) The benefits derived from expense reductions had an impact of less than 0.01%.
The accompanying Notes to Financial Statements are an integral part of this statement.
Annual Report 2016
106
COLUMBIA CAPITAL ALLOCATION PORTFOLIOS
FINANCIAL HIGHLIGHTS (continued)
Columbia Capital Allocation Conservative Portfolio
| | | Year Ended January 31, | |
Class R5 | | 2016 | | 2015 | | 2014(a) | |
Per share data | |
Net asset value, beginning of period | | $ | 10.05 | | | $ | 10.29 | | | $ | 10.53 | | |
Income from investment operations: | |
Net investment income | | | 0.25 | | | | 0.17 | | | | 0.18 | | |
Net realized and unrealized gain (loss) | | | (0.50 | ) | | | 0.40 | | | | 0.09 | | |
Total from investment operations | | | (0.25 | ) | | | 0.57 | | | | 0.27 | | |
Less distributions to shareholders: | |
Net investment income | | | (0.23 | ) | | | (0.23 | ) | | | (0.26 | ) | |
Net realized gains | | | (0.18 | ) | | | (0.58 | ) | | | (0.25 | ) | |
Total distributions to shareholders | | | (0.41 | ) | | | (0.81 | ) | | | (0.51 | ) | |
Net asset value, end of period | | $ | 9.39 | | | $ | 10.05 | | | $ | 10.29 | | |
Total return | | | (2.60 | %) | | | 5.60 | % | | | 2.64 | % | |
Ratios to average net assets(b) | |
Total gross expenses | | | 0.21 | % | | | 0.25 | % | | | 0.12 | %(c) | |
Total net expenses(d) | | | 0.21 | % | | | 0.25 | % | | | 0.12 | %(c) | |
Net investment income | | | 2.66 | % | | | 1.80 | % | | | 2.78 | %(c) | |
Supplemental data | |
Net assets, end of period (in thousands) | | $ | 322 | | | $ | 61 | | | $ | 2 | | |
Portfolio turnover | | | 24 | % | | | 12 | % | | | 22 | % | |
Notes to Financial Highlights
(a) Based on operations from June 13, 2013 (commencement of operations) through the stated period end.
(b) In addition to the fees and expenses that the Fund bears directly, the Fund indirectly bears a pro rata share of the fees and expenses of the underlying funds in which the Fund invests. Such indirect expenses are not included in the Fund's reported expense ratios.
(c) Annualized.
(d) Total net expenses include the impact of certain fee waivers/expense reimbursements made by the Investment Manager and certain of its affiliates, if applicable.
The accompanying Notes to Financial Statements are an integral part of this statement.
Annual Report 2016
107
COLUMBIA CAPITAL ALLOCATION PORTFOLIOS
FINANCIAL HIGHLIGHTS (continued)
Columbia Capital Allocation Conservative Portfolio
| | | Year Ended January 31, | |
Class Y | | 2016 | | 2015 | | 2014(a) | |
Per share data | |
Net asset value, beginning of period | | $ | 10.04 | | | $ | 10.29 | | | $ | 10.53 | | |
Income from investment operations: | |
Net investment income | | | 0.20 | | | | 0.20 | | | | 0.19 | | |
Net realized and unrealized gain (loss) | | | (0.43 | ) | | | 0.36 | | | | 0.09 | | |
Total from investment operations | | | (0.23 | ) | | | 0.56 | | | | 0.28 | | |
Less distributions to shareholders: | |
Net investment income | | | (0.24 | ) | | | (0.23 | ) | | | (0.27 | ) | |
Net realized gains | | | (0.18 | ) | | | (0.58 | ) | | | (0.25 | ) | |
Total distributions to shareholders | | | (0.42 | ) | | | (0.81 | ) | | | (0.52 | ) | |
Net asset value, end of period | | $ | 9.39 | | | $ | 10.04 | | | $ | 10.29 | | |
Total return | | | (2.37 | %) | | | 5.55 | % | | | 2.68 | % | |
Ratios to average net assets(b) | |
Total gross expenses | | | 0.15 | % | | | 0.17 | % | | | 0.07 | %(c) | |
Total net expenses(d) | | | 0.15 | % | | | 0.17 | % | | | 0.07 | %(c) | |
Net investment income | | | 2.13 | % | | | 2.08 | % | | | 2.83 | %(c) | |
Supplemental data | |
Net assets, end of period (in thousands) | | $ | 166 | | | $ | 2 | | | $ | 2 | | |
Portfolio turnover | | | 24 | % | | | 12 | % | | | 22 | % | |
Notes to Financial Highlights
(a) Based on operations from June 13, 2013 (commencement of operations) through the stated period end.
(b) In addition to the fees and expenses that the Fund bears directly, the Fund indirectly bears a pro rata share of the fees and expenses of the underlying funds in which the Fund invests. Such indirect expenses are not included in the Fund's reported expense ratios.
(c) Annualized.
(d) Total net expenses include the impact of certain fee waivers/expense reimbursements made by the Investment Manager and certain of its affiliates, if applicable.
The accompanying Notes to Financial Statements are an integral part of this statement.
Annual Report 2016
108
COLUMBIA CAPITAL ALLOCATION PORTFOLIOS
FINANCIAL HIGHLIGHTS (continued)
Columbia Capital Allocation Conservative Portfolio
| | | Year Ended January 31, | |
Class Z | | 2016 | | 2015 | | 2014 | | 2013 | | 2012 | |
Per share data | |
Net asset value, beginning of period | | $ | 10.10 | | | $ | 10.33 | | | $ | 10.63 | | | $ | 10.32 | | | $ | 10.44 | | |
Income from investment operations: | |
Net investment income | | | 0.21 | | | | 0.20 | | | | 0.24 | | | | 0.30 | | | | 0.28 | | |
Net realized and unrealized gain (loss) | | | (0.46 | ) | | | 0.37 | | | | 0.12 | | | | 0.51 | | | | 0.14 | | |
Total from investment operations | | | (0.25 | ) | | | 0.57 | | | | 0.36 | | | | 0.81 | | | | 0.42 | | |
Less distributions to shareholders: | |
Net investment income | | | (0.22 | ) | | | (0.22 | ) | | | (0.30 | ) | | | (0.38 | ) | | | (0.28 | ) | |
Net realized gains | | | (0.18 | ) | | | (0.58 | ) | | | (0.36 | ) | | | (0.12 | ) | | | (0.26 | ) | |
Total distributions to shareholders | | | (0.40 | ) | | | (0.80 | ) | | | (0.66 | ) | | | (0.50 | ) | | | (0.54 | ) | |
Net asset value, end of period | | $ | 9.45 | | | $ | 10.10 | | | $ | 10.33 | | | $ | 10.63 | | | $ | 10.32 | | |
Total return | | | (2.56 | %) | | | 5.60 | % | | | 3.42 | % | | | 7.91 | % | | | 4.19 | % | |
Ratios to average net assets(a) | |
Total gross expenses | | | 0.27 | % | | | 0.30 | % | | | 0.26 | % | | | 0.22 | % | | | 0.24 | % | |
Total net expenses(b) | | | 0.27 | %(c) | | | 0.30 | %(c) | | | 0.26 | %(c) | | | 0.22 | %(c) | | | 0.24 | %(c) | |
Net investment income | | | 2.09 | % | | | 1.96 | % | | | 2.26 | % | | | 2.80 | % | | | 2.71 | % | |
Supplemental data | |
Net assets, end of period (in thousands) | | $ | 3,046 | | | $ | 3,067 | | | $ | 2,719 | | | $ | 700 | | | $ | 52 | | |
Portfolio turnover | | | 24 | % | | | 12 | % | | | 22 | % | | | 19 | % | | | 88 | % | |
Notes to Financial Highlights
(a) In addition to the fees and expenses that the Fund bears directly, the Fund indirectly bears a pro rata share of the fees and expenses of any other funds in which it invests. Such indirect expenses are not included in the Fund's reported expense ratios.
(b) Total net expenses include the impact of certain fee waivers/expense reimbursements made by the Investment Manager and certain of its affiliates, if applicable.
(c) The benefits derived from expense reductions had an impact of less than 0.01%.
The accompanying Notes to Financial Statements are an integral part of this statement.
Annual Report 2016
109
COLUMBIA CAPITAL ALLOCATION PORTFOLIOS
FINANCIAL HIGHLIGHTS
Columbia Capital Allocation Moderate Conservative Portfolio
| | | Year Ended January 31, | | Year Ended
March 31, | |
Class A | | 2016 | | 2015 | | 2014 | | 2013 | | 2012(a) | | 2011 | |
Per share data | |
Net asset value, beginning of period | | $ | 10.98 | | | $ | 11.37 | | | $ | 11.33 | | | $ | 10.96 | | | $ | 10.89 | | | $ | 10.04 | | |
Income from investment operations: | |
Net investment income | | | 0.20 | | | | 0.19 | | | | 0.25 | | | | 0.25 | | | | 0.21 | | | | 0.26 | | |
Net realized and unrealized gain (loss) | | | (0.49 | ) | | | 0.51 | | | | 0.44 | | | | 0.71 | | | | 0.07 | | | | 0.85 | | |
Total from investment operations | | | (0.29 | ) | | | 0.70 | | | | 0.69 | | | | 0.96 | | | | 0.28 | | | | 1.11 | | |
Less distributions to shareholders: | |
Net investment income | | | (0.22 | ) | | | (0.23 | ) | | | (0.33 | ) | | | (0.32 | ) | | | (0.21 | ) | | | (0.26 | ) | |
Net realized gains | | | (0.33 | ) | | | (0.86 | ) | | | (0.32 | ) | | | (0.27 | ) | | | — | | | | — | | |
Total distributions to shareholders | | | (0.55 | ) | | | (1.09 | ) | | | (0.65 | ) | | | (0.59 | ) | | | (0.21 | ) | | | (0.26 | ) | |
Net asset value, end of period | | $ | 10.14 | | | $ | 10.98 | | | $ | 11.37 | | | $ | 11.33 | | | $ | 10.96 | | | $ | 10.89 | | |
Total return | | | (2.78 | %) | | | 6.23 | % | | | 6.18 | % | | | 8.94 | % | | | 2.63 | % | | | 11.21 | % | |
Ratios to average net assets(b) | |
Total gross expenses | | | 0.48 | % | | | 0.51 | % | | | 0.47 | % | | | 0.70 | % | | | 0.64 | %(c)(d) | | | 0.50 | % | |
Total net expenses(e) | | | 0.48 | %(f) | | | 0.51 | %(f) | | | 0.47 | %(f) | | | 0.57 | %(f) | | | 0.57 | %(c)(d)(f) | | | 0.50 | % | |
Net investment income | | | 1.86 | % | | | 1.70 | % | | | 2.15 | % | | | 2.19 | % | | | 2.37 | %(c) | | | 2.52 | % | |
Supplemental data | |
Net assets, end of period (in thousands) | | $ | 495,849 | | | $ | 545,696 | | | $ | 553,593 | | | $ | 71,321 | | | $ | 68,452 | | | $ | 63,807 | | |
Portfolio turnover | | | 21 | % | | | 14 | % | | | 30 | % | | | 38 | % | | | 55 | % | | | 87 | % | |
Notes to Financial Highlights
(a) For the period from April 1, 2011 to January 31, 2012. During the period, the Fund's fiscal year end was changed from March 31 to January 31.
(b) In addition to the fees and expenses that the Fund bears directly, the Fund indirectly bears a pro rata share of the fees and expenses of any other funds in which it invests. Such indirect expenses are not included in the Fund's reported expense ratios.
(c) Annualized.
(d) Ratios include line of credit interest expense which is less than 0.01%.
(e) Total net expenses include the impact of certain fee waivers/expense reimbursements made by the Investment Manager and certain of its affiliates, if applicable.
(f) The benefits derived from expense reductions had an impact of less than 0.01%.
The accompanying Notes to Financial Statements are an integral part of this statement.
Annual Report 2016
110
COLUMBIA CAPITAL ALLOCATION PORTFOLIOS
FINANCIAL HIGHLIGHTS (continued)
Columbia Capital Allocation Moderate Conservative Portfolio
| | | Year Ended January 31, | | Year Ended
March 31, | |
Class B | | 2016 | | 2015 | | 2014 | | 2013 | | 2012(a) | | 2011 | |
Per share data | |
Net asset value, beginning of period | | $ | 10.92 | | | $ | 11.31 | | | $ | 11.28 | | | $ | 10.91 | | | $ | 10.85 | | | $ | 10.00 | | |
Income from investment operations: | |
Net investment income | | | 0.11 | | | | 0.10 | | | | 0.15 | | | | 0.15 | | | | 0.14 | | | | 0.18 | | |
Net realized and unrealized gain (loss) | | | (0.48 | ) | | | 0.51 | | | | 0.45 | | | | 0.73 | | | | 0.07 | | | | 0.85 | | |
Total from investment operations | | | (0.37 | ) | | | 0.61 | | | | 0.60 | | | | 0.88 | | | | 0.21 | | | | 1.03 | | |
Less distributions to shareholders: | |
Net investment income | | | (0.14 | ) | | | (0.14 | ) | | | (0.25 | ) | | | (0.24 | ) | | | (0.15 | ) | | | (0.18 | ) | |
Net realized gains | | | (0.33 | ) | | | (0.86 | ) | | | (0.32 | ) | | | (0.27 | ) | | | — | | | | — | | |
Total distributions to shareholders | | | (0.47 | ) | | | (1.00 | ) | | | (0.57 | ) | | | (0.51 | ) | | | (0.15 | ) | | | (0.18 | ) | |
Net asset value, end of period | | $ | 10.08 | | | $ | 10.92 | | | $ | 11.31 | | | $ | 11.28 | | | $ | 10.91 | | | $ | 10.85 | | |
Total return | | | (3.53 | %) | | | 5.46 | % | | | 5.32 | % | | | 8.17 | % | | | 1.96 | % | | | 10.43 | % | |
Ratios to average net assets(b) | |
Total gross expenses | | | 1.23 | % | | | 1.26 | % | | | 1.22 | % | | | 1.44 | % | | | 1.39 | %(c)(d) | | | 1.25 | % | |
Total net expenses(e) | | | 1.23 | %(f) | | | 1.26 | %(f) | | | 1.22 | %(f) | | | 1.32 | %(f) | | | 1.31 | %(d)(f)(c) | | | 1.25 | % | |
Net investment income | | | 0.98 | % | | | 0.88 | % | | | 1.30 | % | | | 1.36 | % | | | 1.58 | %(c) | | | 1.75 | % | |
Supplemental data | |
Net assets, end of period (in thousands) | | $ | 7,912 | | | $ | 17,080 | | | $ | 27,184 | | | $ | 8,335 | | | $ | 14,587 | | | $ | 26,181 | | |
Portfolio turnover | | | 21 | % | | | 14 | % | | | 30 | % | | | 38 | % | | | 55 | % | | | 87 | % | |
Notes to Financial Highlights
(a) For the period from April 1, 2011 to January 31, 2012. During the period, the Fund's fiscal year end was changed from March 31 to January 31.
(b) In addition to the fees and expenses that the Fund bears directly, the Fund indirectly bears a pro rata share of the fees and expenses of any other funds in which it invests. Such indirect expenses are not included in the Fund's reported expense ratios.
(c) Annualized.
(d) Ratios include line of credit interest expense which is less than 0.01%.
(e) Total net expenses include the impact of certain fee waivers/expense reimbursements made by the Investment Manager and certain of its affiliates, if applicable.
(f) The benefits derived from expense reductions had an impact of less than 0.01%.
The accompanying Notes to Financial Statements are an integral part of this statement.
Annual Report 2016
111
COLUMBIA CAPITAL ALLOCATION PORTFOLIOS
FINANCIAL HIGHLIGHTS (continued)
Columbia Capital Allocation Moderate Conservative Portfolio
| | | Year Ended January 31, | | Year Ended
March 31, | |
Class C | | 2016 | | 2015 | | 2014 | | 2013 | | 2012(a) | | 2011 | |
Per share data | |
Net asset value, beginning of period | | $ | 10.84 | | | $ | 11.23 | | | $ | 11.20 | | | $ | 10.84 | | | $ | 10.78 | | | $ | 9.94 | | |
Income from investment operations: | |
Net investment income | | | 0.12 | | | | 0.11 | | | | 0.16 | | | | 0.16 | | | | 0.14 | | | | 0.18 | | |
Net realized and unrealized gain (loss) | | | (0.49 | ) | | | 0.50 | | | | 0.44 | | | | 0.71 | | | | 0.07 | | | | 0.84 | | |
Total from investment operations | | | (0.37 | ) | | | 0.61 | | | | 0.60 | | | | 0.87 | | | | 0.21 | | | | 1.02 | | |
Less distributions to shareholders: | |
Net investment income | | | (0.14 | ) | | | (0.14 | ) | | | (0.25 | ) | | | (0.24 | ) | | | (0.15 | ) | | | (0.18 | ) | |
Net realized gains | | | (0.33 | ) | | | (0.86 | ) | | | (0.32 | ) | | | (0.27 | ) | | | — | | | | — | | |
Total distributions to shareholders | | | (0.47 | ) | | | (1.00 | ) | | | (0.57 | ) | | | (0.51 | ) | | | (0.15 | ) | | | (0.18 | ) | |
Net asset value, end of period | | $ | 10.00 | | | $ | 10.84 | | | $ | 11.23 | | | $ | 11.20 | | | $ | 10.84 | | | $ | 10.78 | | |
Total return | | | (3.56 | %) | | | 5.50 | % | | | 5.35 | % | | | 8.13 | % | | | 1.97 | % | | | 10.39 | % | |
Ratios to average net assets(b) | |
Total gross expenses | | | 1.23 | % | | | 1.26 | % | | | 1.23 | % | | | 1.45 | % | | | 1.39 | %(c)(d) | | | 1.25 | % | |
Total net expenses(e) | | | 1.23 | %(f) | | | 1.26 | %(f) | | | 1.23 | %(f) | | | 1.32 | %(f) | | | 1.32 | %(c)(d)(f) | | | 1.25 | % | |
Net investment income | | | 1.12 | % | | | 0.96 | % | | | 1.38 | % | | | 1.44 | % | | | 1.61 | %(c) | | | 1.77 | % | |
Supplemental data | |
Net assets, end of period (in thousands) | | $ | 85,097 | | | $ | 90,199 | | | $ | 85,756 | | | $ | 23,470 | | | $ | 24,156 | | | $ | 23,651 | | |
Portfolio turnover | | | 21 | % | | | 14 | % | | | 30 | % | | | 38 | % | | | 55 | % | | | 87 | % | |
Notes to Financial Highlights
(a) For the period from April 1, 2011 to January 31, 2012. During the period, the Fund's fiscal year end was changed from March 31 to January 31.
(b) In addition to the fees and expenses that the Fund bears directly, the Fund indirectly bears a pro rata share of the fees and expenses of any other funds in which it invests. Such indirect expenses are not included in the Fund's reported expense ratios.
(c) Annualized.
(d) Ratios include line of credit interest expense which is less than 0.01%.
(e) Total net expenses include the impact of certain fee waivers/expense reimbursements made by the Investment Manager and certain of its affiliates, if applicable.
(f) The benefits derived from expense reductions had an impact of less than 0.01%.
The accompanying Notes to Financial Statements are an integral part of this statement.
Annual Report 2016
112
COLUMBIA CAPITAL ALLOCATION PORTFOLIOS
FINANCIAL HIGHLIGHTS (continued)
Columbia Capital Allocation Moderate Conservative Portfolio
| | | Year Ended January 31, | |
Class K | | 2016 | | 2015 | | 2014(a) | |
Per share data | |
Net asset value, beginning of period | | $ | 10.82 | | | $ | 11.22 | | | $ | 11.25 | | |
Income from investment operations: | |
Net investment income | | | 0.21 | | | | 0.18 | | | | 0.32 | | |
Net realized and unrealized gain (loss) | | | (0.48 | ) | | | 0.52 | | | | 0.32 | | |
Total from investment operations | | | (0.27 | ) | | | 0.70 | | | | 0.64 | | |
Less distributions to shareholders: | |
Net investment income | | | (0.23 | ) | | | (0.24 | ) | | | (0.35 | ) | |
Net realized gains | | | (0.33 | ) | | | (0.86 | ) | | | (0.32 | ) | |
Total distributions to shareholders | | | (0.56 | ) | | | (1.10 | ) | | | (0.67 | ) | |
Net asset value, end of period | | $ | 9.99 | | | $ | 10.82 | | | $ | 11.22 | | |
Total return | | | (2.65 | %) | | | 6.31 | % | | | 5.72 | % | |
Ratios to average net assets(b) | |
Total gross expenses | | | 0.41 | % | | | 0.41 | % | | | 0.38 | %(c) | |
Total net expenses(d) | | | 0.41 | % | | | 0.41 | % | | | 0.38 | %(c) | |
Net investment income | | | 1.92 | % | | | 1.53 | % | | | 3.10 | %(c) | |
Supplemental data | |
Net assets, end of period (in thousands) | | $ | 3 | | | $ | 3 | | | $ | 56 | | |
Portfolio turnover | | | 21 | % | | | 14 | % | | | 30 | % | |
Notes to Financial Highlights
(a) Based on operations from February 28, 2013 (commencement of operations) through the stated period end.
(b) In addition to the fees and expenses that the Fund bears directly, the Fund indirectly bears a pro rata share of the fees and expenses of the underlying funds in which the Fund invests. Such indirect expenses are not included in the Fund's reported expense ratios.
(c)�� Annualized.
(d) Total net expenses include the impact of certain fee waivers/expense reimbursements made by the Investment Manager and certain of its affiliates, if applicable.
The accompanying Notes to Financial Statements are an integral part of this statement.
Annual Report 2016
113
COLUMBIA CAPITAL ALLOCATION PORTFOLIOS
FINANCIAL HIGHLIGHTS (continued)
Columbia Capital Allocation Moderate Conservative Portfolio
| | | Year Ended January 31, | | Year Ended
March 31, | |
Class R | | 2016 | | 2015 | | 2014 | | 2013 | | 2012(a) | | 2011 | |
Per share data | |
Net asset value, beginning of period | | $ | 10.99 | | | $ | 11.38 | | | $ | 11.34 | | | $ | 10.96 | | | $ | 10.90 | | | $ | 10.04 | | |
Income from investment operations: | |
Net investment income | | | 0.21 | | | | 0.17 | | | | 0.21 | | | | 0.23 | | | | 0.18 | | | | 0.23 | | |
Net realized and unrealized gain (loss) | | | (0.52 | ) | | | 0.50 | | | | 0.45 | | | | 0.72 | | | | 0.07 | | | | 0.86 | | |
Total from investment operations | | | (0.31 | ) | | | 0.67 | | | | 0.66 | | | | 0.95 | | | | 0.25 | | | | 1.09 | | |
Less distributions to shareholders: | |
Net investment income | | | (0.19 | ) | | | (0.20 | ) | | | (0.30 | ) | | | (0.30 | ) | | | (0.19 | ) | | | (0.23 | ) | |
Net realized gains | | | (0.33 | ) | | | (0.86 | ) | | | (0.32 | ) | | | (0.27 | ) | | | — | | | | — | | |
Total distributions to shareholders | | | (0.52 | ) | | | (1.06 | ) | | | (0.62 | ) | | | (0.57 | ) | | | (0.19 | ) | | | (0.23 | ) | |
Net asset value, end of period | | $ | 10.16 | | | $ | 10.99 | | | $ | 11.38 | | | $ | 11.34 | | | $ | 10.96 | | | $ | 10.90 | | |
Total return | | | (2.93 | %) | | | 5.95 | % | | | 5.87 | % | | | 8.76 | % | | | 2.34 | % | | | 11.03 | % | |
Ratios to average net assets(b) | |
Total gross expenses | | | 0.73 | % | | | 0.76 | % | | | 0.74 | % | | | 0.96 | % | | | 0.89 | %(c)(d) | | | 0.75 | % | |
Total net expenses(e) | | | 0.73 | %(f) | | | 0.76 | %(f) | | | 0.74 | %(f) | | | 0.81 | %(f) | | | 0.82 | %(c)(d)(f) | | | 0.75 | % | |
Net investment income | | | 1.92 | % | | | 1.46 | % | | | 1.85 | % | | | 2.04 | % | | | 2.03 | %(c) | | | 2.28 | % | |
Supplemental data | |
Net assets, end of period (in thousands) | | $ | 5,007 | | | $ | 2,230 | | | $ | 2,243 | | | $ | 2,148 | | | $ | 1,102 | | | $ | 428 | | |
Portfolio turnover | | | 21 | % | | | 14 | % | | | 30 | % | | | 38 | % | | | 55 | % | | | 87 | % | |
Notes to Financial Highlights
(a) For the period from April 1, 2011 to January 31, 2012. During the period, the Fund's fiscal year end was changed from March 31 to January 31.
(b) In addition to the fees and expenses that the Fund bears directly, the Fund indirectly bears a pro rata share of the fees and expenses of any other funds in which it invests. Such indirect expenses are not included in the Fund's reported expense ratios.
(c) Annualized.
(d) Ratios include line of credit interest expense which is less than 0.01%.
(e) Total net expenses include the impact of certain fee waivers/expense reimbursements made by the Investment Manager and certain of its affiliates, if applicable.
(f) The benefits derived from expense reductions had an impact of less than 0.01%.
The accompanying Notes to Financial Statements are an integral part of this statement.
Annual Report 2016
114
COLUMBIA CAPITAL ALLOCATION PORTFOLIOS
FINANCIAL HIGHLIGHTS (continued)
Columbia Capital Allocation Moderate Conservative Portfolio
| | | Year Ended January 31, | |
Class R4 | | 2016 | | 2015 | | 2014 | | 2013(a) | |
Per share data | |
Net asset value, beginning of period | | $ | 10.89 | | | $ | 11.29 | | | $ | 11.25 | | | $ | 11.30 | | |
Income from investment operations: | |
Net investment income | | | 0.23 | | | | 0.24 | | | | 0.27 | | | | 0.09 | | |
Net realized and unrealized gain (loss) | | | (0.48 | ) | | | 0.48 | | | | 0.46 | | | | 0.26 | | |
Total from investment operations | | | (0.25 | ) | | | 0.72 | | | | 0.73 | | | | 0.35 | | |
Less distributions to shareholders: | |
Net investment income | | | (0.25 | ) | | | (0.26 | ) | | | (0.37 | ) | | | (0.17 | ) | |
Net realized gains | | | (0.33 | ) | | | (0.86 | ) | | | (0.32 | ) | | | (0.23 | ) | |
Total distributions to shareholders | | | (0.58 | ) | | | (1.12 | ) | | | (0.69 | ) | | | (0.40 | ) | |
Net asset value, end of period | | $ | 10.06 | | | $ | 10.89 | | | $ | 11.29 | | | $ | 11.25 | | |
Total return | | | (2.46 | %) | | | 6.44 | % | | | 6.52 | % | | | 3.11 | % | |
Ratios to average net assets(b) | |
Total gross expenses | | | 0.23 | % | | | 0.26 | % | | | 0.19 | % | | | 0.51 | %(c) | |
Total net expenses(d) | | | 0.23 | %(e) | | | 0.26 | %(e) | | | 0.19 | %(e) | | | 0.37 | %(c) | |
Net investment income | | | 2.15 | % | | | 2.19 | % | | | 2.36 | % | | | 3.68 | %(c) | |
Supplemental data | |
Net assets, end of period (in thousands) | | $ | 1,082 | | | $ | 966 | | | $ | 2 | | | $ | 2 | | |
Portfolio turnover | | | 21 | % | | | 14 | % | | | 30 | % | | | 38 | % | |
Notes to Financial Highlights
(a) Based on operations from November 8, 2012 (commencement of operations) through the stated period end.
(b) In addition to the fees and expenses that the Fund bears directly, the Fund indirectly bears a pro rata share of the fees and expenses of any other funds in which it invests. Such indirect expenses are not included in the Fund's reported expense ratios.
(c) Annualized.
(d) Total net expenses include the impact of certain fee waivers/expense reimbursements made by the Investment Manager and certain of its affiliates, if applicable.
(e) The benefits derived from expense reductions had an impact of less than 0.01%.
The accompanying Notes to Financial Statements are an integral part of this statement.
Annual Report 2016
115
COLUMBIA CAPITAL ALLOCATION PORTFOLIOS
FINANCIAL HIGHLIGHTS (continued)
Columbia Capital Allocation Moderate Conservative Portfolio
| | | Year Ended January 31, | |
Class R5 | | 2016 | | 2015 | | 2014 | | 2013(a) | |
Per share data | |
Net asset value, beginning of period | | $ | 10.89 | | | $ | 11.28 | | | $ | 11.25 | | | $ | 11.30 | | |
Income from investment operations: | |
Net investment income | | | 0.30 | | | | 0.26 | | | | 0.38 | | | | 0.10 | | |
Net realized and unrealized gain (loss) | | | (0.55 | ) | | | 0.48 | | | | 0.35 | | | | 0.25 | | |
Total from investment operations | | | (0.25 | ) | | | 0.74 | | | | 0.73 | | | | 0.35 | | |
Less distributions to shareholders: | |
Net investment income | | | (0.26 | ) | | | (0.27 | ) | | | (0.38 | ) | | | (0.17 | ) | |
Net realized gains | | | (0.33 | ) | | | (0.86 | ) | | | (0.32 | ) | | | (0.23 | ) | |
Total distributions to shareholders | | | (0.59 | ) | | | (1.13 | ) | | | (0.70 | ) | | | (0.40 | ) | |
Net asset value, end of period | | $ | 10.05 | | | $ | 10.89 | | | $ | 11.28 | | | $ | 11.25 | | |
Total return | | | (2.48 | %) | | | 6.63 | % | | | 6.53 | % | | | 3.13 | % | |
Ratios to average net assets(b) | |
Total gross expenses | | | 0.16 | % | | | 0.18 | % | | | 0.13 | % | | | 0.41 | %(c) | |
Total net expenses(d) | | | 0.16 | % | | | 0.18 | % | | | 0.13 | % | | | 0.29 | %(c) | |
Net investment income | | | 2.89 | % | | | 2.33 | % | | | 3.35 | % | | | 3.77 | %(c) | |
Supplemental data | |
Net assets, end of period (in thousands) | | $ | 686 | | | $ | 217 | | | $ | 74 | | | $ | 2 | | |
Portfolio turnover | | | 21 | % | | | 14 | % | | | 30 | % | | | 38 | % | |
Notes to Financial Highlights
(a) Based on operations from November 8, 2012 (commencement of operations) through the stated period end.
(b) In addition to the fees and expenses that the Fund bears directly, the Fund indirectly bears a pro rata share of the fees and expenses of any other funds in which it invests. Such indirect expenses are not included in the Fund's reported expense ratios.
(c) Annualized.
(d) Total net expenses include the impact of certain fee waivers/expense reimbursements made by the Investment Manager and certain of its affiliates, if applicable.
The accompanying Notes to Financial Statements are an integral part of this statement.
Annual Report 2016
116
COLUMBIA CAPITAL ALLOCATION PORTFOLIOS
FINANCIAL HIGHLIGHTS (continued)
Columbia Capital Allocation Moderate Conservative Portfolio
| | | Year Ended January 31, | |
Class Y | | 2016 | | 2015 | | 2014(a) | |
Per share data | |
Net asset value, beginning of period | | $ | 10.77 | | | $ | 11.18 | | | $ | 11.32 | | |
Income from investment operations: | |
Net investment income | | | 0.26 | | | | 0.25 | | | | 0.22 | | |
Net realized and unrealized gain (loss) | | | (0.50 | ) | | | 0.48 | | | | 0.28 | | |
Total from investment operations | | | (0.24 | ) | | | 0.73 | | | | 0.50 | | |
Less distributions to shareholders: | |
Net investment income | | | (0.26 | ) | | | (0.28 | ) | | | (0.32 | ) | |
Net realized gains | | | (0.33 | ) | | | (0.86 | ) | | | (0.32 | ) | |
Total distributions to shareholders | | | (0.59 | ) | | | (1.14 | ) | | | (0.64 | ) | |
Net asset value, end of period | | $ | 9.94 | | | $ | 10.77 | | | $ | 11.18 | | |
Total return | | | (2.38 | %) | | | 6.66 | % | | | 4.51 | % | |
Ratios to average net assets(b) | |
Total gross expenses | | | 0.12 | % | | | 0.09 | % | | | 0.08 | %(c) | |
Total net expenses(d) | | | 0.12 | % | | | 0.09 | % | | | 0.08 | %(c) | |
Net investment income | | | 2.48 | % | | | 2.24 | % | | | 3.02 | %(c) | |
Supplemental data | |
Net assets, end of period (in thousands) | | $ | 10 | | | $ | 4 | | | $ | 2 | | |
Portfolio turnover | | | 21 | % | | | 14 | % | | | 30 | % | |
Notes to Financial Highlights
(a) Based on operations from June 13, 2013 (commencement of operations) through the stated period end.
(b) In addition to the fees and expenses that the Fund bears directly, the Fund indirectly bears a pro rata share of the fees and expenses of the underlying funds in which the Fund invests. Such indirect expenses are not included in the Fund's reported expense ratios.
(c) Annualized.
(d) Total net expenses include the impact of certain fee waivers/expense reimbursements made by the Investment Manager and certain of its affiliates, if applicable.
The accompanying Notes to Financial Statements are an integral part of this statement.
Annual Report 2016
117
COLUMBIA CAPITAL ALLOCATION PORTFOLIOS
FINANCIAL HIGHLIGHTS (continued)
Columbia Capital Allocation Moderate Conservative Portfolio
| | | Year Ended January 31, | | Year Ended
March 31, | |
Class Z | | 2016 | | 2015 | | 2014 | | 2013 | | 2012(a) | | 2011 | |
Per share data | |
Net asset value, beginning of period | | $ | 10.85 | | | $ | 11.25 | | | $ | 11.21 | | | $ | 10.85 | | | $ | 10.78 | | | $ | 9.94 | | |
Income from investment operations: | |
Net investment income | | | 0.23 | | | | 0.22 | | | | 0.28 | | | | 0.27 | | | | 0.23 | | | | 0.28 | | |
Net realized and unrealized gain (loss) | | | (0.49 | ) | | | 0.50 | | | | 0.44 | | | | 0.71 | | | | 0.07 | | | | 0.84 | | |
Total from investment operations | | | (0.26 | ) | | | 0.72 | | | | 0.72 | | | | 0.98 | | | | 0.30 | | | | 1.12 | | |
Less distributions to shareholders: | |
Net investment income | | | (0.25 | ) | | | (0.26 | ) | | | (0.36 | ) | | | (0.35 | ) | | | (0.23 | ) | | | (0.28 | ) | |
Net realized gains | | | (0.33 | ) | | | (0.86 | ) | | | (0.32 | ) | | | (0.27 | ) | | | — | | | | — | | |
Total distributions to shareholders | | | (0.58 | ) | | | (1.12 | ) | | | (0.68 | ) | | | (0.62 | ) | | | (0.23 | ) | | | (0.28 | ) | |
Net asset value, end of period | | $ | 10.01 | | | $ | 10.85 | | | $ | 11.25 | | | $ | 11.21 | | | $ | 10.85 | | | $ | 10.78 | | |
Total return | | | (2.56 | %) | | | 6.47 | % | | | 6.49 | % | | | 9.22 | % | | | 2.85 | % | | | 11.49 | % | |
Ratios to average net assets(b) | |
Total gross expenses | | | 0.23 | % | | | 0.26 | % | | | 0.24 | % | | | 0.45 | % | | | 0.39 | %(c)(d) | | | 0.25 | % | |
Total net expenses(e) | | | 0.23 | %(f) | | | 0.26 | %(f) | | | 0.24 | %(f) | | | 0.32 | %(f) | | | 0.32 | %(c)(d)(f) | | | 0.25 | % | |
Net investment income | | | 2.11 | % | | | 1.97 | % | | | 2.46 | % | | | 2.45 | % | | | 2.61 | %(c) | | | 2.77 | % | |
Supplemental data | |
Net assets, end of period (in thousands) | | $ | 24,108 | | | $ | 26,084 | | | $ | 25,287 | | | $ | 20,710 | | | $ | 21,157 | | | $ | 21,839 | | |
Portfolio turnover | | | 21 | % | | | 14 | % | | | 30 | % | | | 38 | % | | | 55 | % | | | 87 | % | |
Notes to Financial Highlights
(a) For the period from April 1, 2011 to January 31, 2012. During the period, the Fund's fiscal year end was changed from March 31 to January 31.
(b) In addition to the fees and expenses that the Fund bears directly, the Fund indirectly bears a pro rata share of the fees and expenses of any other funds in which it invests. Such indirect expenses are not included in the Fund's reported expense ratios.
(c) Annualized.
(d) Ratios include line of credit interest expense which is less than 0.01%.
(e) Total net expenses include the impact of certain fee waivers/expense reimbursements made by the Investment Manager and certain of its affiliates, if applicable.
(f) The benefits derived from expense reductions had an impact of less than 0.01%.
The accompanying Notes to Financial Statements are an integral part of this statement.
Annual Report 2016
118
COLUMBIA CAPITAL ALLOCATION PORTFOLIOS
FINANCIAL HIGHLIGHTS
Columbia Capital Allocation Moderate Portfolio
| | | Year Ended January 31, | |
Class A | | 2016 | | 2015 | | 2014 | | 2013 | | 2012 | �� |
Per share data | |
Net asset value, beginning of period | | $ | 11.50 | | | $ | 12.00 | | | $ | 11.61 | | | $ | 10.75 | | | $ | 10.71 | | |
Income from investment operations: | |
Net investment income | | | 0.19 | | | | 0.18 | | | | 0.20 | | | | 0.22 | | | | 0.23 | | |
Net realized and unrealized gain (loss) | | | (0.49 | ) | | | 0.63 | | | | 0.86 | | | | 0.93 | | | | 0.06 | | |
Total from investment operations | | | (0.30 | ) | | | 0.81 | | | | 1.06 | | | | 1.15 | | | | 0.29 | | |
Less distributions to shareholders: | |
Net investment income | | | (0.22 | ) | | | (0.24 | ) | | | (0.31 | ) | | | (0.29 | ) | | | (0.25 | ) | |
Net realized gains | | | (0.64 | ) | | | (1.07 | ) | | | (0.36 | ) | | | — | | | | — | | |
Total distributions to shareholders | | | (0.86 | ) | | | (1.31 | ) | | | (0.67 | ) | | | (0.29 | ) | | | (0.25 | ) | |
Net asset value, end of period | | $ | 10.34 | | | $ | 11.50 | | | $ | 12.00 | | | $ | 11.61 | | | $ | 10.75 | | |
Total return | | | (2.89 | %) | | | 6.77 | % | | | 9.26 | % | | | 10.87 | % | | | 2.84 | % | |
Ratios to average net assets(a) | |
Total gross expenses | | | 0.46 | % | | | 0.48 | % | | | 0.46 | % | | | 0.46 | % | | | 0.43 | % | |
Total net expenses(b) | | | 0.46 | %(c) | | | 0.48 | %(c) | | | 0.46 | %(c) | | | 0.46 | %(c) | | | 0.43 | %(c) | |
Net investment income | | | 1.68 | % | | | 1.49 | % | | | 1.64 | % | | | 1.98 | % | | | 2.11 | % | |
Supplemental data | |
Net assets, end of period (in thousands) | | $ | 1,295,482 | | | $ | 1,437,972 | | | $ | 1,425,904 | | | $ | 1,331,311 | | | $ | 1,215,462 | | |
Portfolio turnover | | | 17 | % | | | 16 | % | | | 23 | % | | | 23 | % | | | 58 | % | |
Notes to Financial Highlights
(a) In addition to the fees and expenses that the Fund bears directly, the Fund indirectly bears a pro rata share of the fees and expenses of the underlying funds in which the Fund invests. Such indirect expenses are not included in the Fund's reported expense ratios.
(b) Total net expenses include the impact of certain fee waivers/expense reimbursements made by the Investment Manager and certain of its affiliates, if applicable.
(c) The benefits derived from expense reductions had an impact of less than 0.01%.
The accompanying Notes to Financial Statements are an integral part of this statement.
Annual Report 2016
119
COLUMBIA CAPITAL ALLOCATION PORTFOLIOS
FINANCIAL HIGHLIGHTS (continued)
Columbia Capital Allocation Moderate Portfolio
| | | Year Ended January 31, | |
Class B | | 2016 | | 2015 | | 2014 | | 2013 | | 2012 | |
Per share data | |
Net asset value, beginning of period | | $ | 11.44 | | | $ | 11.94 | | | $ | 11.55 | | | $ | 10.70 | | | $ | 10.66 | | |
Income from investment operations: | |
Net investment income | | | 0.09 | | | | 0.08 | | | | 0.10 | | | | 0.13 | | | | 0.14 | | |
Net realized and unrealized gain (loss) | | | (0.46 | ) | | | 0.64 | | | | 0.87 | | | | 0.93 | | | | 0.07 | | |
Total from investment operations | | | (0.37 | ) | | | 0.72 | | | | 0.97 | | | | 1.06 | | | | 0.21 | | |
Less distributions to shareholders: | |
Net investment income | | | (0.14 | ) | | | (0.15 | ) | | | (0.22 | ) | | | (0.21 | ) | | | (0.17 | ) | |
Net realized gains | | | (0.64 | ) | | | (1.07 | ) | | | (0.36 | ) | | | — | | | | — | | |
Total distributions to shareholders | | | (0.78 | ) | | | (1.22 | ) | | | (0.58 | ) | | | (0.21 | ) | | | (0.17 | ) | |
Net asset value, end of period | | $ | 10.29 | | | $ | 11.44 | | | $ | 11.94 | | | $ | 11.55 | | | $ | 10.70 | | |
Total return | | | (3.56 | %) | | | 6.00 | % | | | 8.47 | % | | | 9.99 | % | | | 2.03 | % | |
Ratios to average net assets(a) | |
Total gross expenses | | | 1.21 | % | | | 1.23 | % | | | 1.21 | % | | | 1.20 | % | | | 1.18 | % | |
Total net expenses(b) | | | 1.21 | %(c) | | | 1.23 | %(c) | | | 1.21 | %(c) | | | 1.20 | %(c) | | | 1.18 | %(c) | |
Net investment income | | | 0.80 | % | | | 0.66 | % | | | 0.81 | % | | | 1.17 | % | | | 1.32 | % | |
Supplemental data | |
Net assets, end of period (in thousands) | | $ | 23,991 | | | $ | 47,829 | | | $ | 71,473 | | | $ | 94,225 | | | $ | 117,235 | | |
Portfolio turnover | | | 17 | % | | | 16 | % | | | 23 | % | | | 23 | % | | | 58 | % | |
Notes to Financial Highlights
(a) In addition to the fees and expenses that the Fund bears directly, the Fund indirectly bears a pro rata share of the fees and expenses of the underlying funds in which the Fund invests. Such indirect expenses are not included in the Fund's reported expense ratios.
(b) Total net expenses include the impact of certain fee waivers/expense reimbursements made by the Investment Manager and certain of its affiliates, if applicable.
(c) The benefits derived from expense reductions had an impact of less than 0.01%.
The accompanying Notes to Financial Statements are an integral part of this statement.
Annual Report 2016
120
COLUMBIA CAPITAL ALLOCATION PORTFOLIOS
FINANCIAL HIGHLIGHTS (continued)
Columbia Capital Allocation Moderate Portfolio
| | | Year Ended January 31, | |
Class C | | 2016 | | 2015 | | 2014 | | 2013 | | 2012 | |
Per share data | |
Net asset value, beginning of period | | $ | 11.41 | | | $ | 11.92 | | | $ | 11.53 | | | $ | 10.69 | | | $ | 10.65 | | |
Income from investment operations: | |
Net investment income | | | 0.11 | | | | 0.09 | | | | 0.11 | | | | 0.14 | | | | 0.15 | | |
Net realized and unrealized gain (loss) | | | (0.47 | ) | | | 0.62 | | | | 0.86 | | | | 0.91 | | | | 0.07 | | |
Total from investment operations | | | (0.36 | ) | | | 0.71 | | | | 0.97 | | | | 1.05 | | | | 0.22 | | |
Less distributions to shareholders: | |
Net investment income | | | (0.14 | ) | | | (0.15 | ) | | | (0.22 | ) | | | (0.21 | ) | | | (0.18 | ) | |
Net realized gains | | | (0.64 | ) | | | (1.07 | ) | | | (0.36 | ) | | | — | | | | — | | |
Total distributions to shareholders | | | (0.78 | ) | | | (1.22 | ) | | | (0.58 | ) | | | (0.21 | ) | | | (0.18 | ) | |
Net asset value, end of period | | $ | 10.27 | | | $ | 11.41 | | | $ | 11.92 | | | $ | 11.53 | | | $ | 10.69 | | |
Total return | | | (3.48 | %) | | | 5.92 | % | | | 8.51 | % | | | 9.95 | % | | | 2.10 | % | |
Ratios to average net assets(a) | |
Total gross expenses | | | 1.21 | % | | | 1.23 | % | | | 1.21 | % | | | 1.21 | % | | | 1.18 | % | |
Total net expenses(b) | | | 1.21 | %(c) | | | 1.23 | %(c) | | | 1.21 | %(c) | | | 1.21 | %(c) | | | 1.18 | %(c) | |
Net investment income | | | 0.95 | % | | | 0.77 | % | | | 0.92 | % | | | 1.25 | % | | | 1.38 | % | |
Supplemental data | |
Net assets, end of period (in thousands) | | $ | 178,548 | | | $ | 180,143 | | | $ | 162,357 | | | $ | 132,770 | | | $ | 107,827 | | |
Portfolio turnover | | | 17 | % | | | 16 | % | | | 23 | % | | | 23 | % | | | 58 | % | |
Notes to Financial Highlights
(a) In addition to the fees and expenses that the Fund bears directly, the Fund indirectly bears a pro rata share of the fees and expenses of the underlying funds in which the Fund invests. Such indirect expenses are not included in the Fund's reported expense ratios.
(b) Total net expenses include the impact of certain fee waivers/expense reimbursements made by the Investment Manager and certain of its affiliates, if applicable.
(c) The benefits derived from expense reductions had an impact of less than 0.01%.
The accompanying Notes to Financial Statements are an integral part of this statement.
Annual Report 2016
121
COLUMBIA CAPITAL ALLOCATION PORTFOLIOS
FINANCIAL HIGHLIGHTS (continued)
Columbia Capital Allocation Moderate Portfolio
| | | Year Ended January 31, | |
Class K | | 2016 | | 2015 | | 2014 | | 2013 | | 2012 | |
Per share data | |
Net asset value, beginning of period | | $ | 11.49 | | | $ | 11.99 | | | $ | 11.60 | | | $ | 10.74 | | | $ | 10.70 | | |
Income from investment operations: | |
Net investment income | | | 0.20 | | | | 0.19 | | | | 0.21 | | | | 0.21 | | | | 0.23 | | |
Net realized and unrealized gain (loss) | | | (0.49 | ) | | | 0.63 | | | | 0.86 | | | | 0.95 | | | | 0.08 | | |
Total from investment operations | | | (0.29 | ) | | | 0.82 | | | | 1.07 | | | | 1.16 | | | | 0.31 | | |
Less distributions to shareholders: | |
Net investment income | | | (0.23 | ) | | | (0.25 | ) | | | (0.32 | ) | | | (0.30 | ) | | | (0.27 | ) | |
Net realized gains | | | (0.64 | ) | | | (1.07 | ) | | | (0.36 | ) | | | — | | | | — | | |
Total distributions to shareholders | | | (0.87 | ) | | | (1.32 | ) | | | (0.68 | ) | | | (0.30 | ) | | | (0.27 | ) | |
Net asset value, end of period | | $ | 10.33 | | | $ | 11.49 | | | $ | 11.99 | | | $ | 11.60 | | | $ | 10.74 | | |
Total return | | | (2.83 | %) | | | 6.88 | % | | | 9.39 | % | | | 10.94 | % | | | 2.94 | % | |
Ratios to average net assets(a) | |
Total gross expenses | | | 0.40 | % | | | 0.40 | % | | | 0.36 | % | | | 0.34 | % | | | 0.34 | % | |
Total net expenses(b) | | | 0.40 | % | | | 0.40 | % | | | 0.36 | % | | | 0.34 | % | | | 0.34 | % | |
Net investment income | | | 1.76 | % | | | 1.55 | % | | | 1.77 | % | | | 1.93 | % | | | 2.18 | % | |
Supplemental data | |
Net assets, end of period (in thousands) | | $ | 291 | | | $ | 292 | | | $ | 359 | | | $ | 298 | | | $ | 748 | | |
Portfolio turnover | | | 17 | % | | | 16 | % | | | 23 | % | | | 23 | % | | | 58 | % | |
Notes to Financial Highlights
(a) In addition to the fees and expenses that the Fund bears directly, the Fund indirectly bears a pro rata share of the fees and expenses of the underlying funds in which the Fund invests. Such indirect expenses are not included in the Fund's reported expense ratios.
(b) Total net expenses include the impact of certain fee waivers/expense reimbursements made by the Investment Manager and certain of its affiliates, if applicable.
The accompanying Notes to Financial Statements are an integral part of this statement.
Annual Report 2016
122
COLUMBIA CAPITAL ALLOCATION PORTFOLIOS
FINANCIAL HIGHLIGHTS (continued)
Columbia Capital Allocation Moderate Portfolio
| | | Year Ended January 31, | |
Class R | | 2016 | | 2015 | | 2014 | | 2013 | | 2012 | |
Per share data | |
Net asset value, beginning of period | | $ | 11.47 | | | $ | 11.97 | | | $ | 11.58 | | | $ | 10.74 | | | $ | 10.70 | | |
Income from investment operations: | |
Net investment income | | | 0.16 | | | | 0.15 | | | | 0.23 | | | | 0.18 | | | | 0.30 | | |
Net realized and unrealized gain (loss) | | | (0.47 | ) | | | 0.63 | | | | 0.80 | | | | 0.93 | | | | (0.02 | ) | |
Total from investment operations | | | (0.31 | ) | | | 0.78 | | | | 1.03 | | | | 1.11 | | | | 0.28 | | |
Less distributions to shareholders: | |
Net investment income | | | (0.20 | ) | | | (0.21 | ) | | | (0.28 | ) | | | (0.27 | ) | | | (0.24 | ) | |
Net realized gains | | | (0.64 | ) | | | (1.07 | ) | | | (0.36 | ) | | | — | | | | — | | |
Total distributions to shareholders | | | (0.84 | ) | | | (1.28 | ) | | | (0.64 | ) | | | (0.27 | ) | | | (0.24 | ) | |
Net asset value, end of period | | $ | 10.32 | | | $ | 11.47 | | | $ | 11.97 | | | $ | 11.58 | | | $ | 10.74 | | |
Total return | | | (3.06 | %) | | | 6.52 | % | | | 9.02 | % | | | 10.46 | % | | | 2.66 | % | |
Ratios to average net assets(a) | |
Total gross expenses | | | 0.71 | % | | | 0.73 | % | | | 0.72 | % | | | 0.70 | % | | | 0.71 | % | |
Total net expenses(b) | | | 0.71 | %(c) | | | 0.73 | %(c) | | | 0.72 | %(c) | | | 0.70 | %(c) | | | 0.71 | % | |
Net investment income | | | 1.37 | % | | | 1.29 | % | | | 1.92 | % | | | 1.67 | % | | | 2.93 | % | |
Supplemental data | |
Net assets, end of period (in thousands) | | $ | 1,342 | | | $ | 1,610 | | | $ | 1,147 | | | $ | 138 | | | $ | 60 | | |
Portfolio turnover | | | 17 | % | | | 16 | % | | | 23 | % | | | 23 | % | | | 58 | % | |
Notes to Financial Highlights
(a) In addition to the fees and expenses that the Fund bears directly, the Fund indirectly bears a pro rata share of the fees and expenses of the underlying funds in which the Fund invests. Such indirect expenses are not included in the Fund's reported expense ratios.
(b) Total net expenses include the impact of certain fee waivers/expense reimbursements made by the Investment Manager and certain of its affiliates, if applicable.
(c) The benefits derived from expense reductions had an impact of less than 0.01%.
The accompanying Notes to Financial Statements are an integral part of this statement.
Annual Report 2016
123
COLUMBIA CAPITAL ALLOCATION PORTFOLIOS
FINANCIAL HIGHLIGHTS (continued)
Columbia Capital Allocation Moderate Portfolio
| | | Year Ended January 31, | |
Class R4 | | 2016 | | 2015 | | 2014(a) | |
Per share data | |
Net asset value, beginning of period | | $ | 11.39 | | | $ | 11.90 | | | $ | 11.82 | | |
Income from investment operations: | |
Net investment income | | | 0.28 | | | | 0.26 | | | | 0.18 | | |
Net realized and unrealized gain (loss) | | | (0.54 | ) | | | 0.57 | | | | 0.53 | | |
Total from investment operations | | | (0.26 | ) | | | 0.83 | | | | 0.71 | | |
Less distributions to shareholders: | |
Net investment income | | | (0.25 | ) | | | (0.27 | ) | | | (0.27 | ) | |
Net realized gains | | | (0.64 | ) | | | (1.07 | ) | | | (0.36 | ) | |
Total distributions to shareholders | | | (0.89 | ) | | | (1.34 | ) | | | (0.63 | ) | |
Net asset value, end of period | | $ | 10.24 | | | $ | 11.39 | | | $ | 11.90 | | |
Total return | | | (2.58 | %) | | | 7.06 | % | | | 6.11 | % | |
Ratios to average net assets(b) | |
Total gross expenses | | | 0.21 | % | | | 0.23 | % | | | 0.21 | %(c) | |
Total net expenses(d) | | | 0.21 | %(e) | | | 0.23 | %(e) | | | 0.21 | %(c)(e) | |
Net investment income | | | 2.61 | % | | | 2.22 | % | | | 2.36 | %(c) | |
Supplemental data | |
Net assets, end of period (in thousands) | | $ | 202 | | | $ | 29 | | | $ | 3 | | |
Portfolio turnover | | | 17 | % | | | 16 | % | | | 23 | % | |
Notes to Financial Highlights
(a) Based on operations from June 13, 2013 (commencement of operations) through the stated period end.
(b) In addition to the fees and expenses that the Fund bears directly, the Fund indirectly bears a pro rata share of the fees and expenses of the underlying funds in which the Fund invests. Such indirect expenses are not included in the Fund's reported expense ratios.
(c) Annualized.
(d) Total net expenses include the impact of certain fee waivers/expense reimbursements made by the Investment Manager and certain of its affiliates, if applicable.
(e) The benefits derived from expense reductions had an impact of less than 0.01%.
The accompanying Notes to Financial Statements are an integral part of this statement.
Annual Report 2016
124
COLUMBIA CAPITAL ALLOCATION PORTFOLIOS
FINANCIAL HIGHLIGHTS (continued)
Columbia Capital Allocation Moderate Portfolio
| | | Year Ended January 31, | |
Class R5 | | 2016 | | 2015 | | 2014(a) | |
Per share data | |
Net asset value, beginning of period | | $ | 11.39 | | | $ | 11.90 | | | $ | 11.82 | | |
Income from investment operations: | |
Net investment income | | | 0.51 | | | | 0.39 | | | | 0.19 | | |
Net realized and unrealized gain (loss) | | | (0.77 | ) | | | 0.46 | | | | 0.53 | | |
Total from investment operations | | | (0.26 | ) | | | 0.85 | | | | 0.72 | | |
Less distributions to shareholders: | |
Net investment income | | | (0.26 | ) | | | (0.29 | ) | | | (0.28 | ) | |
Net realized gains | | | (0.64 | ) | | | (1.07 | ) | | | (0.36 | ) | |
Total distributions to shareholders | | | (0.90 | ) | | | (1.36 | ) | | | (0.64 | ) | |
Net asset value, end of period | | $ | 10.23 | | | $ | 11.39 | | | $ | 11.90 | | |
Total return | | | (2.61 | %) | | | 7.21 | % | | | 6.21 | % | |
Ratios to average net assets(b) | |
Total gross expenses | | | 0.15 | % | | | 0.16 | % | | | 0.11 | %(c) | |
Total net expenses(d) | | | 0.15 | % | | | 0.16 | % | | | 0.11 | %(c) | |
Net investment income | | | 4.80 | % | | | 3.39 | % | | | 2.51 | %(c) | |
Supplemental data | |
Net assets, end of period (in thousands) | | $ | 3,803 | | | $ | 78 | | | $ | 3 | | |
Portfolio turnover | | | 17 | % | | | 16 | % | | | 23 | % | |
Notes to Financial Highlights
(a) Based on operations from June 13, 2013 (commencement of operations) through the stated period end.
(b) In addition to the fees and expenses that the Fund bears directly, the Fund indirectly bears a pro rata share of the fees and expenses of the underlying funds in which the Fund invests. Such indirect expenses are not included in the Fund's reported expense ratios.
(c) Annualized.
(d) Total net expenses include the impact of certain fee waivers/expense reimbursements made by the Investment Manager and certain of its affiliates, if applicable.
The accompanying Notes to Financial Statements are an integral part of this statement.
Annual Report 2016
125
COLUMBIA CAPITAL ALLOCATION PORTFOLIOS
FINANCIAL HIGHLIGHTS (continued)
Columbia Capital Allocation Moderate Portfolio
| | | Year Ended January 31, | |
Class Y | | 2016 | | 2015 | | 2014(a) | |
Per share data | |
Net asset value, beginning of period | | $ | 11.38 | | | $ | 11.90 | | | $ | 11.82 | | |
Income from investment operations: | |
Net investment income | | | 0.16 | | | | 0.23 | | | | 0.19 | | |
Net realized and unrealized gain (loss) | | | (0.40 | ) | | | 0.61 | | | | 0.54 | | |
Total from investment operations | | | (0.24 | ) | | | 0.84 | | | | 0.73 | | |
Less distributions to shareholders: | |
Net investment income | | | (0.27 | ) | | | (0.29 | ) | | | (0.29 | ) | |
Net realized gains | | | (0.64 | ) | | | (1.07 | ) | | | (0.36 | ) | |
Total distributions to shareholders | | | (0.91 | ) | | | (1.36 | ) | | | (0.65 | ) | |
Net asset value, end of period | | $ | 10.23 | | | $ | 11.38 | | | $ | 11.90 | | |
Total return | | | (2.42 | %) | | | 7.16 | % | | | 6.25 | % | |
Ratios to average net assets(b) | |
Total gross expenses | | | 0.09 | % | | | 0.06 | % | | | 0.07 | %(c) | |
Total net expenses(d) | | | 0.09 | % | | | 0.06 | % | | | 0.07 | %(c) | |
Net investment income | | | 1.59 | % | | | 1.92 | % | | | 2.56 | %(c) | |
Supplemental data | |
Net assets, end of period (in thousands) | | $ | 368 | | | $ | 2 | | | $ | 3 | | |
Portfolio turnover | | | 17 | % | | | 16 | % | | | 23 | % | |
Notes to Financial Highlights
(a) Based on operations from June 13, 2013 (commencement of operations) through the stated period end.
(b) In addition to the fees and expenses that the Fund bears directly, the Fund indirectly bears a pro rata share of the fees and expenses of the underlying funds in which the Fund invests. Such indirect expenses are not included in the Fund's reported expense ratios.
(c) Annualized.
(d) Total net expenses include the impact of certain fee waivers/expense reimbursements made by the Investment Manager and certain of its affiliates, if applicable.
The accompanying Notes to Financial Statements are an integral part of this statement.
Annual Report 2016
126
COLUMBIA CAPITAL ALLOCATION PORTFOLIOS
FINANCIAL HIGHLIGHTS (continued)
Columbia Capital Allocation Moderate Portfolio
| | | Year Ended January 31, | |
Class Z | | 2016 | | 2015 | | 2014 | | 2013 | | 2012 | |
Per share data | |
Net asset value, beginning of period | | $ | 11.49 | | | $ | 11.99 | | | $ | 11.59 | | | $ | 10.75 | | | $ | 10.71 | | |
Income from investment operations: | |
Net investment income | | | 0.22 | | | | 0.21 | | | | 0.23 | | | | 0.28 | | | | 0.26 | | |
Net realized and unrealized gain (loss) | | | (0.49 | ) | | | 0.63 | | | | 0.87 | | | | 0.88 | | | | 0.07 | | |
Total from investment operations | | | (0.27 | ) | | | 0.84 | | | | 1.10 | | | | 1.16 | | | | 0.33 | | |
Less distributions to shareholders: | |
Net investment income | | | (0.25 | ) | | | (0.27 | ) | | | (0.34 | ) | | | (0.32 | ) | | | (0.29 | ) | |
Net realized gains | | | (0.64 | ) | | | (1.07 | ) | | | (0.36 | ) | | | — | | | | — | | |
Total distributions to shareholders | | | (0.89 | ) | | | (1.34 | ) | | | (0.70 | ) | | | (0.32 | ) | | | (0.29 | ) | |
Net asset value, end of period | | $ | 10.33 | | | $ | 11.49 | | | $ | 11.99 | | | $ | 11.59 | | | $ | 10.75 | | |
Total return | | | (2.65 | %) | | | 7.05 | % | | | 9.65 | % | | | 10.98 | % | | | 3.15 | % | |
Ratios to average net assets(a) | |
Total gross expenses | | | 0.21 | % | | | 0.23 | % | | | 0.21 | % | | | 0.22 | % | | | 0.19 | % | |
Total net expenses(b) | | | 0.21 | %(c) | | | 0.23 | %(c) | | | 0.21 | %(c) | | | 0.22 | %(c) | | | 0.19 | %(c) | |
Net investment income | | | 1.92 | % | | | 1.77 | % | | | 1.90 | % | | | 2.54 | % | | | 2.49 | % | |
Supplemental data | |
Net assets, end of period (in thousands) | | $ | 2,443 | | | $ | 2,989 | | | $ | 3,352 | | | $ | 2,544 | | | $ | 836 | | |
Portfolio turnover | | | 17 | % | | | 16 | % | | | 23 | % | | | 23 | % | | | 58 | % | |
Notes to Financial Highlights
(a) In addition to the fees and expenses that the Fund bears directly, the Fund indirectly bears a pro rata share of the fees and expenses of the underlying funds in which the Fund invests. Such indirect expenses are not included in the Fund's reported expense ratios.
(b) Total net expenses include the impact of certain fee waivers/expense reimbursements made by the Investment Manager and certain of its affiliates, if applicable.
(c) The benefits derived from expense reductions had an impact of less than 0.01%.
The accompanying Notes to Financial Statements are an integral part of this statement.
Annual Report 2016
127
COLUMBIA CAPITAL ALLOCATION PORTFOLIOS
FINANCIAL HIGHLIGHTS
Columbia Capital Allocation Moderate Aggressive Portfolio
| | | Year Ended January 31, | | Year Ended
March 31, | |
Class A | | 2016 | | 2015 | | 2014 | | 2013 | | 2012(a) | | 2011 | |
Per share data | |
Net asset value, beginning of period | | $ | 12.45 | | | $ | 13.01 | | | $ | 12.04 | | | $ | 11.30 | | | $ | 11.61 | | | $ | 10.23 | | |
Income from investment operations: | |
Net investment income | | | 0.18 | | | | 0.16 | | | | 0.18 | | | | 0.18 | | | | 0.15 | | | | 0.19 | | |
Net realized and unrealized gain (loss) | | | (0.55 | ) | | | 0.76 | | | | 1.21 | | | | 1.07 | | | | (0.30 | ) | | | 1.37 | | |
Total from investment operations | | | (0.37 | ) | | | 0.92 | | | | 1.39 | | | | 1.25 | | | | (0.15 | ) | | | 1.56 | | |
Less distributions to shareholders: | |
Net investment income | | | (0.22 | ) | | | (0.25 | ) | | | (0.25 | ) | | | (0.22 | ) | | | (0.14 | ) | | | (0.18 | ) | |
Net realized gains | | | (0.71 | ) | | | (1.23 | ) | | | (0.17 | ) | | | (0.29 | ) | | | (0.02 | ) | | | — | | |
Total distributions to shareholders | | | (0.93 | ) | | | (1.48 | ) | | | (0.42 | ) | | | (0.51 | ) | | | (0.16 | ) | | | (0.18 | ) | |
Proceeds from regulatory settlements | | | — | | | | — | | | | — | | | | — | | | | 0.00 | (b) | | | — | | |
Net asset value, end of period | | $ | 11.15 | | | $ | 12.45 | | | $ | 13.01 | | | $ | 12.04 | | | $ | 11.30 | | | $ | 11.61 | | |
Total return | | | (3.42 | %) | | | 7.03 | % | | | 11.67 | % | | | 11.28 | % | | | (1.20 | %) | | | 15.48 | % | |
Ratios to average net assets(c) | |
Total gross expenses | | | 0.52 | % | | | 0.52 | % | | | 0.50 | % | | | 0.53 | % | | | 0.51 | %(d)(e) | | | 0.50 | %(e) | |
Total net expenses(f) | | | 0.52 | %(g) | | | 0.52 | %(g) | | | 0.50 | %(g) | | | 0.53 | %(g) | | | 0.51 | %(d)(e)(g) | | | 0.50 | %(e) | |
Net investment income | | | 1.42 | % | | | 1.22 | % | | | 1.38 | % | | | 1.51 | % | | | 1.60 | %(d) | | | 1.75 | % | |
Supplemental data | |
Net assets, end of period (in thousands) | | $ | 1,646,276 | | | $ | 1,815,185 | | | $ | 1,805,239 | | | $ | 679,109 | | | $ | 665,859 | | | $ | 291,758 | | |
Portfolio turnover | | | 16 | % | | | 20 | % | | | 22 | % | | | 34 | % | | | 42 | % | | | 68 | % | |
Notes to Financial Highlights
(a) For the period from April 1, 2011 to January 31, 2012. During the period, the Fund's fiscal year end was changed from March 31 to January 31.
(b) Rounds to zero.
(c) In addition to the fees and expenses that the Fund bears directly, the Fund indirectly bears a pro rata share of the fees and expenses of any other funds in which it invests. Such indirect expenses are not included in the Fund's reported expense ratios.
(d) Annualized.
(e) Ratios include line of credit interest expense which is less than 0.01%.
(f) Total net expenses include the impact of certain fee waivers/expense reimbursements made by the Investment Manager and certain of its affiliates, if applicable.
(g) The benefits derived from expense reductions had an impact of less than 0.01%.
The accompanying Notes to Financial Statements are an integral part of this statement.
Annual Report 2016
128
COLUMBIA CAPITAL ALLOCATION PORTFOLIOS
FINANCIAL HIGHLIGHTS (continued)
Columbia Capital Allocation Moderate Aggressive Portfolio
| | | Year Ended January 31, | | Year Ended
March 31, | |
Class B | | 2016 | | 2015 | | 2014 | | 2013 | | 2012(a) | | 2011 | |
Per share data | |
Net asset value, beginning of period | | $ | 12.32 | | | $ | 12.89 | | | $ | 11.94 | | | $ | 11.21 | | | $ | 11.53 | | | $ | 10.16 | | |
Income from investment operations: | |
Net investment income | | | 0.06 | | | | 0.05 | | | | 0.07 | | | | 0.07 | | | | 0.07 | | | | 0.10 | | |
Net realized and unrealized gain (loss) | | | (0.52 | ) | | | 0.77 | | | | 1.21 | | | | 1.08 | | | | (0.29 | ) | | | 1.37 | | |
Total from investment operations | | | (0.46 | ) | | | 0.82 | | | | 1.28 | | | | 1.15 | | | | (0.22 | ) | | | 1.47 | | |
Less distributions to shareholders: | |
Net investment income | | | (0.13 | ) | | | (0.16 | ) | | | (0.16 | ) | | | (0.13 | ) | | | (0.08 | ) | | | (0.10 | ) | |
Net realized gains | | | (0.71 | ) | | | (1.23 | ) | | | (0.17 | ) | | | (0.29 | ) | | | (0.02 | ) | | | — | | |
Total distributions to shareholders | | | (0.84 | ) | | | (1.39 | ) | | | (0.33 | ) | | | (0.42 | ) | | | (0.10 | ) | | | (0.10 | ) | |
Proceeds from regulatory settlements | | | — | | | | — | | | | — | | | | — | | | | 0.00 | (b) | | | — | | |
Net asset value, end of period | | $ | 11.02 | | | $ | 12.32 | | | $ | 12.89 | | | $ | 11.94 | | | $ | 11.21 | | | $ | 11.53 | | |
Total return | | | (4.15 | %) | | | 6.32 | % | | | 10.78 | % | | | 10.45 | % | | | (1.87 | %) | | | 14.63 | % | |
Ratios to average net assets(c) | |
Total gross expenses | | | 1.27 | % | | | 1.27 | % | | | 1.25 | % | | | 1.27 | % | | | 1.26 | %(d)(e) | | | 1.25 | %(e) | |
Total net expenses(f) | | | 1.27 | %(g) | | | 1.27 | %(g) | | | 1.25 | %(g) | | | 1.27 | %(g) | | | 1.26 | %(d)(e)(g) | | | 1.25 | %(e) | |
Net investment income | | | 0.53 | % | | | 0.37 | % | | | 0.53 | % | | | 0.65 | % | | | 0.75 | %(d) | | | 0.99 | % | |
Supplemental data | |
Net assets, end of period (in thousands) | | $ | 31,228 | | | $ | 61,673 | | | $ | 92,956 | | | $ | 53,009 | | | $ | 85,005 | | | $ | 133,770 | | |
Portfolio turnover | | | 16 | % | | | 20 | % | | | 22 | % | | | 34 | % | | | 42 | % | | | 68 | % | |
Notes to Financial Highlights
(a) For the period from April 1, 2011 to January 31, 2012. During the period, the Fund's fiscal year end was changed from March 31 to January 31.
(b) Rounds to zero.
(c) In addition to the fees and expenses that the Fund bears directly, the Fund indirectly bears a pro rata share of the fees and expenses of any other funds in which it invests. Such indirect expenses are not included in the Fund's reported expense ratios.
(d) Annualized.
(e) Ratios include line of credit interest expense which is less than 0.01%.
(f) Total net expenses include the impact of certain fee waivers/expense reimbursements made by the Investment Manager and certain of its affiliates, if applicable.
(g) The benefits derived from expense reductions had an impact of less than 0.01%.
The accompanying Notes to Financial Statements are an integral part of this statement.
Annual Report 2016
129
COLUMBIA CAPITAL ALLOCATION PORTFOLIOS
FINANCIAL HIGHLIGHTS (continued)
Columbia Capital Allocation Moderate Aggressive Portfolio
| | | Year Ended January 31, | | Year Ended
March 31, | |
Class C | | 2016 | | 2015 | | 2014 | | 2013 | | 2012(a) | | 2011 | |
Per share data | |
Net asset value, beginning of period | | $ | 12.51 | | | $ | 13.07 | | | $ | 12.11 | | | $ | 11.36 | | | $ | 11.68 | | | $ | 10.29 | | |
Income from investment operations: | |
Net investment income | | | 0.09 | | | | 0.06 | | | | 0.08 | | | | 0.09 | | | | 0.08 | | | | 0.11 | | |
Net realized and unrealized gain (loss) | | | (0.55 | ) | | | 0.77 | | | | 1.21 | | | | 1.08 | | | | (0.30 | ) | | | 1.38 | | |
Total from investment operations | | | (0.46 | ) | | | 0.83 | | | | 1.29 | | | | 1.17 | | | | (0.22 | ) | | | 1.49 | | |
Less distributions to shareholders: | |
Net investment income | | | (0.13 | ) | | | (0.16 | ) | | | (0.16 | ) | | | (0.13 | ) | | | (0.08 | ) | | | (0.10 | ) | |
Net realized gains | | | (0.71 | ) | | | (1.23 | ) | | | (0.17 | ) | | | (0.29 | ) | | | (0.02 | ) | | | — | | |
Total distributions to shareholders | | | (0.84 | ) | | | (1.39 | ) | | | (0.33 | ) | | | (0.42 | ) | | | (0.10 | ) | | | (0.10 | ) | |
Proceeds from regulatory settlements | | | — | | | | — | | | | — | | | | — | | | | 0.00 | (b) | | | — | | |
Net asset value, end of period | | $ | 11.21 | | | $ | 12.51 | | | $ | 13.07 | | | $ | 12.11 | | | $ | 11.36 | | | $ | 11.68 | | |
Total return | | | (4.08 | %) | | | 6.30 | % | | | 10.71 | % | | | 10.49 | % | | | (1.85 | %) | | | 14.64 | % | |
Ratios to average net assets(c) | |
Total gross expenses | | | 1.27 | % | | | 1.27 | % | | | 1.25 | % | | | 1.28 | % | | | 1.26 | %(d)(e) | | | 1.25 | %(e) | |
Total net expenses(f) | | | 1.27 | %(g) | | | 1.27 | %(g) | | | 1.25 | %(g) | | | 1.28 | %(g) | | | 1.26 | %(d)(e)(g) | | | 1.25 | %(e) | |
Net investment income | | | 0.69 | % | | | 0.49 | % | | | 0.63 | % | | | 0.75 | % | | | 0.81 | %(d) | | | 1.00 | % | |
Supplemental data | |
Net assets, end of period (in thousands) | | $ | 206,181 | | | $ | 213,166 | | | $ | 198,837 | | | $ | 84,349 | | | $ | 86,321 | | | $ | 91,556 | | |
Portfolio turnover | | | 16 | % | | | 20 | % | | | 22 | % | | | 34 | % | | | 42 | % | | | 68 | % | |
Notes to Financial Highlights
(a) For the period from April 1, 2011 to January 31, 2012 During the period, the Fund's fiscal year end was changed from March 31 to January 31.
(b) Rounds to zero.
(c) In addition to the fees and expenses that the Fund bears directly, the Fund indirectly bears a pro rata share of the fees and expenses of the underlying funds in which the Fund invests. Such indirect expenses are not included in the Fund's reported expense ratios.
(d) Annualized.
(e) Ratios include line of credit interest expense which is less than 0.01%.
(f) Total net expenses include the impact of certain fee waivers/expense reimbursements made by the Investment Manager and certain of its affiliates, if applicable.
(g) The benefits derived from expense reductions had an impact of less than 0.01%.
The accompanying Notes to Financial Statements are an integral part of this statement.
Annual Report 2016
130
COLUMBIA CAPITAL ALLOCATION PORTFOLIOS
FINANCIAL HIGHLIGHTS (continued)
Columbia Capital Allocation Moderate Aggressive Portfolio
| | | Year Ended January 31, | |
Class K | | 2016 | | 2015 | | 2014(a) | |
Per share data | |
Net asset value, beginning of period | | $ | 12.42 | | | $ | 12.98 | | | $ | 12.07 | | |
Income from investment operations: | |
Net investment income | | | 0.19 | | | | 0.18 | | | | 0.18 | | |
Net realized and unrealized gain (loss) | | | (0.55 | ) | | | 0.75 | | | | 1.17 | | |
Total from investment operations | | | (0.36 | ) | | | 0.93 | | | | 1.35 | | |
Less distributions to shareholders: | |
Net investment income | | | (0.23 | ) | | | (0.26 | ) | | | (0.27 | ) | |
Net realized gains | | | (0.71 | ) | | | (1.23 | ) | | | (0.17 | ) | |
Total distributions to shareholders | | | (0.94 | ) | | | (1.49 | ) | | | (0.44 | ) | |
Net asset value, end of period | | $ | 11.12 | | | $ | 12.42 | | | $ | 12.98 | | |
Total return | | | (3.32 | %) | | | 7.17 | % | | | 11.31 | % | |
Ratios to average net assets(b) | |
Total gross expenses | | | 0.41 | % | | | 0.41 | % | | | 0.38 | %(c) | |
Total net expenses(d) | | | 0.41 | % | | | 0.41 | % | | | 0.38 | %(c) | |
Net investment income | | | 1.53 | % | | | 1.34 | % | | | 1.57 | %(c) | |
Supplemental data | |
Net assets, end of period (in thousands) | | $ | 90 | | | $ | 98 | | | $ | 105 | | |
Portfolio turnover | | | 16 | % | | | 20 | % | | | 22 | % | |
Notes to Financial Highlights
(a) Based on operations from February 28, 2013 (commencement of operations) through the stated period end.
(b) In addition to the fees and expenses that the Fund bears directly, the Fund indirectly bears a pro rata share of the fees and expenses of the underlying funds in which the Fund invests. Such indirect expenses are not included in the Fund's reported expense ratios.
(c) Annualized.
(d) Total net expenses include the impact of certain fee waivers/expense reimbursements made by the Investment Manager and certain of its affiliates, if applicable.
The accompanying Notes to Financial Statements are an integral part of this statement.
Annual Report 2016
131
COLUMBIA CAPITAL ALLOCATION PORTFOLIOS
FINANCIAL HIGHLIGHTS (continued)
Columbia Capital Allocation Moderate Aggressive Portfolio
| | | Year Ended January 31, | | Year Ended
March 31, | |
Class R | | 2016 | | 2015 | | 2014 | | 2013 | | 2012(a) | | 2011 | |
Per share data | |
Net asset value, beginning of period | | $ | 12.44 | | | $ | 12.99 | | | $ | 12.03 | | | $ | 11.29 | | | $ | 11.60 | | | $ | 10.22 | | |
Income from investment operations: | |
Net investment income | �� | | 0.14 | | | | 0.13 | | | | 0.13 | | | | 0.15 | | | | 0.13 | | | | 0.16 | | |
Net realized and unrealized gain (loss) | | | (0.54 | ) | | | 0.76 | | | | 1.22 | | | | 1.07 | | | | (0.30 | ) | | | 1.38 | | |
Total from investment operations | | | (0.40 | ) | | | 0.89 | | | | 1.35 | | | | 1.22 | | | | (0.17 | ) | | | 1.54 | | |
Less distributions to shareholders: | |
Net investment income | | | (0.19 | ) | | | (0.21 | ) | | | (0.22 | ) | | | (0.19 | ) | | | (0.12 | ) | | | (0.16 | ) | |
Net realized gains | | | (0.71 | ) | | | (1.23 | ) | | | (0.17 | ) | | | (0.29 | ) | | | (0.02 | ) | | | — | | |
Total distributions to shareholders | | | (0.90 | ) | | | (1.44 | ) | | | (0.39 | ) | | | (0.48 | ) | | | (0.14 | ) | | | (0.16 | ) | |
Proceeds from regulatory settlements | | | — | | | | — | | | | — | | | | — | | | | 0.00 | (b) | | | — | | |
Net asset value, end of period | | $ | 11.14 | | | $ | 12.44 | | | $ | 12.99 | | | $ | 12.03 | | | $ | 11.29 | | | $ | 11.60 | | |
Total return | | | (3.67 | %) | | | 6.86 | % | | | 11.31 | % | | | 11.01 | % | | | (1.39 | %) | | | 15.21 | % | |
Ratios to average net assets(c) | |
Total gross expenses | | | 0.77 | % | | | 0.77 | % | | | 0.75 | % | | | 0.78 | % | | | 0.77 | %(d)(e) | | | 0.75 | %(e) | |
Total net expenses(f) | | | 0.77 | %(g) | | | 0.77 | %(g) | | | 0.75 | %(g) | | | 0.78 | %(g) | | | 0.77 | %(d)(e)(g) | | | 0.75 | %(e) | |
Net investment income | | | 1.11 | % | | | 1.01 | % | | | 1.02 | % | | | 1.26 | % | | | 1.40 | %(d) | | | 1.54 | % | |
Supplemental data | |
Net assets, end of period (in thousands) | | $ | 3,556 | | | $ | 4,270 | | | $ | 4,347 | | | $ | 4,664 | | | $ | 3,908 | | | $ | 1,517 | | |
Portfolio turnover | | | 16 | % | | | 20 | % | | | 22 | % | | | 34 | % | | | 42 | % | | | 68 | % | |
Notes to Financial Highlights
(a) For the period from April 1, 2011 to January 31, 2012. During the period, the Fund's fiscal year end was changed from March 31 to January 31.
(b) Rounds to zero.
(c) In addition to the fees and expenses that the Fund bears directly, the Fund indirectly bears a pro rata share of the fees and expenses of the underlying funds in which the Fund invests. Such indirect expenses are not included in the Fund's reported expense ratios.
(d) Annualized.
(e) Ratios include line of credit interest expense which is less than 0.01%.
(f) Total net expenses include the impact of certain fee waivers/expense reimbursements made by the Investment Manager and certain of its affiliates, if applicable.
(g) The benefits derived from expense reductions had an impact of less than 0.01%.
The accompanying Notes to Financial Statements are an integral part of this statement.
Annual Report 2016
132
COLUMBIA CAPITAL ALLOCATION PORTFOLIOS
FINANCIAL HIGHLIGHTS (continued)
Columbia Capital Allocation Moderate Aggressive Portfolio
| | | Year Ended January 31, | |
Class R4 | | 2016 | | 2015 | | 2014 | | 2013(a) | |
Per share data | |
Net asset value, beginning of period | | $ | 12.54 | | | $ | 13.08 | | | $ | 12.11 | | | $ | 11.71 | | |
Income from investment operations: | |
Net investment income | | | 0.21 | | | | 0.53 | | | | 0.18 | | | | 0.11 | | |
Net realized and unrealized gain (loss) | | | (0.56 | ) | | | 0.44 | | | | 1.25 | | | | 0.65 | | |
Total from investment operations | | | (0.35 | ) | | | 0.97 | | | | 1.43 | | | | 0.76 | | |
Less distributions to shareholders: | |
Net investment income | | | (0.25 | ) | | | (0.28 | ) | | | (0.29 | ) | | | (0.14 | ) | |
Net realized gains | | | (0.71 | ) | | | (1.23 | ) | | | (0.17 | ) | | | (0.22 | ) | |
Total distributions to shareholders | | | (0.96 | ) | | | (1.51 | ) | | | (0.46 | ) | | | (0.36 | ) | |
Net asset value, end of period | | $ | 11.23 | | | $ | 12.54 | | | $ | 13.08 | | | $ | 12.11 | | |
Total return | | | (3.23 | %) | | | 7.41 | % | | | 11.95 | % | | | 6.60 | % | |
Ratios to average net assets(b) | |
Total gross expenses | | | 0.27 | % | | | 0.29 | % | | | 0.22 | % | | | 0.24 | %(c) | |
Total net expenses(d) | | | 0.27 | %(e) | | | 0.29 | %(e) | | | 0.22 | %(e) | | | 0.24 | %(c) | |
Net investment income | | | 1.72 | % | | | 4.16 | % | | | 1.39 | % | | | 3.98 | %(c) | |
Supplemental data | |
Net assets, end of period (in thousands) | | $ | 1,119 | | | $ | 1,054 | | | $ | 7 | | | $ | 3 | | |
Portfolio turnover | | | 16 | % | | | 20 | % | | | 22 | % | | | 34 | % | |
Notes to Financial Highlights
(a) Based on operations from November 8, 2012 (commencement of operations) through the stated period end.
(b) In addition to the fees and expenses that the Fund bears directly, the Fund indirectly bears a pro rata share of the fees and expenses of the underlying funds in which the Fund invests. Such indirect expenses are not included in the Fund's reported expense ratios.
(c) Annualized.
(d) Total net expenses include the impact of certain fee waivers/expense reimbursements made by the Investment Manager and certain of its affiliates, if applicable.
(e) The benefits derived from expense reductions had an impact of less than 0.01%.
The accompanying Notes to Financial Statements are an integral part of this statement.
Annual Report 2016
133
COLUMBIA CAPITAL ALLOCATION PORTFOLIOS
FINANCIAL HIGHLIGHTS (continued)
Columbia Capital Allocation Moderate Aggressive Portfolio
| | | Year Ended January 31, | |
Class R5 | | 2016 | | 2015 | | 2014 | | 2013(a) | |
Per share data | |
Net asset value, beginning of period | | $ | 12.53 | | | $ | 13.08 | | | $ | 12.11 | | | $ | 11.71 | | |
Income from investment operations: | |
Net investment income | | | 0.38 | | | | 0.21 | | | | 0.33 | | | | 0.11 | | |
Net realized and unrealized gain (loss) | | | (0.71 | ) | | | 0.77 | | | | 1.12 | | | | 0.66 | | |
Total from investment operations | | | (0.33 | ) | | | 0.98 | | | | 1.45 | | | | 0.77 | | |
Less distributions to shareholders: | |
Net investment income | | | (0.26 | ) | | | (0.30 | ) | | | (0.31 | ) | | | (0.15 | ) | |
Net realized gains | | | (0.71 | ) | | | (1.23 | ) | | | (0.17 | ) | | | (0.22 | ) | |
Total distributions to shareholders | | | (0.97 | ) | | | (1.53 | ) | | | (0.48 | ) | | | (0.37 | ) | |
Net asset value, end of period | | $ | 11.23 | | | $ | 12.53 | | | $ | 13.08 | | | $ | 12.11 | | |
Total return | | | (3.05 | %) | | | 7.46 | % | | | 12.07 | % | | | 6.64 | % | |
Ratios to average net assets(b) | |
Total gross expenses | | | 0.17 | % | | | 0.16 | % | | | 0.18 | % | | | 0.12 | %(c) | |
Total net expenses(d) | | | 0.17 | % | | | 0.16 | % | | | 0.18 | % | | | 0.12 | %(c) | |
Net investment income | | | 3.15 | % | | | 1.62 | % | | | 2.56 | % | | | 4.10 | %(c) | |
Supplemental data | |
Net assets, end of period (in thousands) | | $ | 3,537 | | | $ | 648 | | | $ | 577 | | | $ | 3 | | |
Portfolio turnover | | | 16 | % | | | 20 | % | | | 22 | % | | | 34 | % | |
Notes to Financial Highlights
(a) Based on operations from November 8, 2012 (commencement of operations) through the stated period end.
(b) In addition to the fees and expenses that the Fund bears directly, the Fund indirectly bears a pro rata share of the fees and expenses of the underlying funds in which the Fund invests. Such indirect expenses are not included in the Fund's reported expense ratios.
(c) Annualized.
(d) Total net expenses include the impact of certain fee waivers/expense reimbursements made by the Investment Manager and certain of its affiliates, if applicable.
The accompanying Notes to Financial Statements are an integral part of this statement.
Annual Report 2016
134
COLUMBIA CAPITAL ALLOCATION PORTFOLIOS
FINANCIAL HIGHLIGHTS (continued)
Columbia Capital Allocation Moderate Aggressive Portfolio
| | | Year Ended January 31, | | Year Ended
March 31, | |
Class T | | 2016 | | 2015 | | 2014 | | 2013 | | 2012(a) | | 2011(b) | |
Per share data | |
Net asset value, beginning of period | | $ | 12.45 | | | $ | 13.00 | | | $ | 12.04 | | | $ | 11.30 | | | $ | 11.61 | | | $ | 11.49 | | |
Income from investment operations: | |
Net investment income | | | 0.18 | | | | 0.16 | | | | 0.16 | | | | 0.17 | | | | 0.15 | | | | 0.02 | | |
Net realized and unrealized gain (loss) | | | (0.55 | ) | | | 0.76 | | | | 1.22 | | | | 1.07 | | | | (0.30 | ) | | | 0.13 | | |
Total from investment operations | | | (0.37 | ) | | | 0.92 | | | | 1.38 | | | | 1.24 | | | | (0.15 | ) | | | 0.15 | | |
Less distributions to shareholders: | |
Net investment income | | | (0.22 | ) | | | (0.24 | ) | | | (0.25 | ) | | | (0.21 | ) | | | (0.14 | ) | | | (0.03 | ) | |
Net realized gains | | | (0.71 | ) | | | (1.23 | ) | | | (0.17 | ) | | | (0.29 | ) | | | (0.02 | ) | | | — | | |
Total distributions to shareholders | | | (0.93 | ) | | | (1.47 | ) | | | (0.42 | ) | | | (0.50 | ) | | | (0.16 | ) | | | (0.03 | ) | |
Proceeds from regulatory settlements | | | — | | | | — | | | | — | | | | — | | | | 0.00 | (c) | | | — | | |
Net asset value, end of period | | $ | 11.15 | | | $ | 12.45 | | | $ | 13.00 | | | $ | 12.04 | | | $ | 11.30 | | | $ | 11.61 | | |
Total return | | | (3.42 | %) | | | 7.07 | % | | | 11.52 | % | | | 11.23 | % | | | (1.23 | %) | | | 1.28 | % | |
Ratios to average net assets(d) | |
Total gross expenses | | | 0.52 | % | | | 0.56 | % | | | 0.55 | % | | | 0.58 | % | | | 0.56 | %(e)(f) | | | 0.55 | %(e) | |
Total net expenses(g) | | | 0.52 | %(h) | | | 0.54 | %(h) | | | 0.55 | %(h) | | | 0.58 | %(h) | | | 0.56 | %(e)(f)(h) | | | 0.55 | %(e) | |
Net investment income | | | 1.42 | % | | | 1.20 | % | | | 1.24 | % | | | 1.46 | % | | | 1.58 | %(e) | | | 2.26 | %(e) | |
Supplemental data | |
Net assets, end of period (in thousands) | | $ | 85,135 | | | $ | 97,408 | | | $ | 101,766 | | | $ | 100,955 | | | $ | 102,913 | | | $ | 3 | | |
Portfolio turnover | | | 16 | % | | | 20 | % | | | 22 | % | | | 34 | % | | | 42 | % | | | 68 | % | |
Notes to Financial Highlights
(a) For the period from April 1, 2011 to January 31, 2012. During the period, the Fund's fiscal year end was changed from March 31 to January 31.
(b) Based on operations from March 7, 2011 (commencement of operations) through the stated period end.
(c) Rounds to zero.
(d) In addition to the fees and expenses that the Fund bears directly, the Fund indirectly bears a pro rata share of the fees and expenses of the underlying funds in which the Fund invests. Such indirect expenses are not included in the Fund's reported expense ratios.
(e) Annualized.
(f) Ratios include line of credit interest expense which is less than 0.01%.
(g) Total net expenses include the impact of certain fee waivers/expense reimbursements made by the Investment Manager and certain of its affiliates, if applicable.
(h) The benefits derived from expense reductions had an impact of less than 0.01%.
The accompanying Notes to Financial Statements are an integral part of this statement.
Annual Report 2016
135
COLUMBIA CAPITAL ALLOCATION PORTFOLIOS
FINANCIAL HIGHLIGHTS (continued)
Columbia Capital Allocation Moderate Aggressive Portfolio
| | | Year Ended January 31, | |
Class Y | | 2016 | | 2015 | | 2014(a) | |
Per share data | |
Net asset value, beginning of period | | $ | 12.31 | | | $ | 12.87 | | | $ | 12.35 | | |
Income from investment operations: | |
Net investment income | | | 0.13 | | | | 0.21 | | | | 0.18 | | |
Net realized and unrealized gain (loss) | | | (0.45 | ) | | | 0.76 | | | | 0.78 | | |
Total from investment operations | | | (0.32 | ) | | | 0.97 | | | | 0.96 | | |
Less distributions to shareholders: | |
Net investment income | | | (0.27 | ) | | | (0.30 | ) | | | (0.27 | ) | |
Net realized gains | | | (0.71 | ) | | | (1.23 | ) | | | (0.17 | ) | |
Total distributions to shareholders | | | (0.98 | ) | | | (1.53 | ) | | | (0.44 | ) | |
Net asset value, end of period | | $ | 11.01 | | | $ | 12.31 | | | $ | 12.87 | | |
Total return | | | (3.09 | %) | | | 7.58 | % | | | 7.88 | % | |
Ratios to average net assets(b) | |
Total gross expenses | | | 0.12 | % | | | 0.09 | % | | | 0.07 | %(c) | |
Total net expenses(d) | | | 0.12 | % | | | 0.09 | % | | | 0.07 | %(c) | |
Net investment income | | | 1.16 | % | | | 1.64 | % | | | 2.22 | %(c) | |
Supplemental data | |
Net assets, end of period (in thousands) | | $ | 379 | | | $ | 2 | | | $ | 3 | | |
Portfolio turnover | | | 16 | % | | | 20 | % | | | 22 | % | |
Notes to Financial Highlights
(a) Based on operations from June 13, 2013 (commencement of operations) through the stated period end.
(b) In addition to the fees and expenses that the Fund bears directly, the Fund indirectly bears a pro rata share of the fees and expenses of the underlying funds in which the Fund invests. Such indirect expenses are not included in the Fund's reported expense ratios.
(c) Annualized.
(d) Total net expenses include the impact of certain fee waivers/expense reimbursements made by the Investment Manager and certain of its affiliates, if applicable.
The accompanying Notes to Financial Statements are an integral part of this statement.
Annual Report 2016
136
COLUMBIA CAPITAL ALLOCATION PORTFOLIOS
FINANCIAL HIGHLIGHTS (continued)
Columbia Capital Allocation Moderate Aggressive Portfolio
| | | Year Ended January 31, | | Year Ended
March 31, | |
Class Z | | 2016 | | 2015 | | 2014 | | 2013 | | 2012(a) | | 2011 | |
Per share data | |
Net asset value, beginning of period | | $ | 12.44 | | | $ | 12.99 | | | $ | 12.03 | | | $ | 11.29 | | | $ | 11.60 | | | $ | 10.21 | | |
Income from investment operations: | |
Net investment income | | | 0.21 | | | | 0.19 | | | | 0.19 | | | | 0.20 | | | | 0.17 | | | | 0.21 | | |
Net realized and unrealized gain (loss) | | | (0.56 | ) | | | 0.77 | | | | 1.23 | | | | 1.08 | | | | (0.30 | ) | | | 1.39 | | |
Total from investment operations | | | (0.35 | ) | | | 0.96 | | | | 1.42 | | | | 1.28 | | | | (0.13 | ) | | | 1.60 | | |
Less distributions to shareholders: | |
Net investment income | | | (0.25 | ) | | | (0.28 | ) | | | (0.29 | ) | | | (0.25 | ) | | | (0.16 | ) | | | (0.21 | ) | |
Net realized gains | | | (0.71 | ) | | | (1.23 | ) | | | (0.17 | ) | | | (0.29 | ) | | | (0.02 | ) | | | — | | |
Total distributions to shareholders | | | (0.96 | ) | | | (1.51 | ) | | | (0.46 | ) | | | (0.54 | ) | | | (0.18 | ) | | | (0.21 | ) | |
Proceeds from regulatory settlements | | | — | | | | — | | | | — | | | | — | | | | 0.00 | (b) | | | — | | |
Net asset value, end of period | | $ | 11.13 | | | $ | 12.44 | | | $ | 12.99 | | | $ | 12.03 | | | $ | 11.29 | | | $ | 11.60 | | |
Total return | | | (3.26 | %) | | | 7.40 | % | | | 11.87 | % | | | 11.57 | % | | | (1.00 | %) | | | 15.89 | % | |
Ratios to average net assets(c) | |
Total gross expenses | | | 0.27 | % | | | 0.27 | % | | | 0.25 | % | | | 0.28 | % | | | 0.26 | %(d)(e) | | | 0.25 | %(e) | |
Total net expenses(f) | | | 0.27 | %(g) | | | 0.27 | %(g) | | | 0.25 | %(g) | | | 0.28 | %(g) | | | 0.26 | %(d)(e)(g) | | | 0.25 | %(e) | |
Net investment income | | | 1.67 | % | | | 1.47 | % | | | 1.49 | % | | | 1.72 | % | | | 1.86 | %(d) | | | 2.03 | % | |
Supplemental data | |
Net assets, end of period (in thousands) | | $ | 113,846 | | | $ | 128,314 | | | $ | 128,234 | | | $ | 147,433 | | | $ | 146,805 | | | $ | 56,805 | | |
Portfolio turnover | | | 16 | % | | | 20 | % | | | 22 | % | | | 34 | % | | | 42 | % | | | 68 | % | |
Notes to Financial Highlights
(a) For the period from April 1, 2011 to January 31, 2012. During the period, the Fund's fiscal year end was changed from March 31 to January 31.
(b) Rounds to zero.
(c) In addition to the fees and expenses that the Fund bears directly, the Fund indirectly bears a pro rata share of the fees and expenses of any other funds in which it invests. Such indirect expenses are not included in the Fund's reported expense ratios.
(d) Annualized.
(e) Ratios include line of credit interest expense which is less than 0.01%.
(f) Total net expenses include the impact of certain fee waivers/expense reimbursements made by the Investment Manager and certain of its affiliates, if applicable.
(g) The benefits derived from expense reductions had an impact of less than 0.01%.
The accompanying Notes to Financial Statements are an integral part of this statement.
Annual Report 2016
137
COLUMBIA CAPITAL ALLOCATION PORTFOLIOS
FINANCIAL HIGHLIGHTS
Columbia Capital Allocation Aggressive Portfolio
| | | Year Ended January 31, | |
Class A | | 2016 | | 2015 | | 2014 | | 2013 | | 2012 | |
Per share data | |
Net asset value, beginning of period | | $ | 12.54 | | | $ | 12.82 | | | $ | 11.41 | | | $ | 10.19 | | | $ | 10.28 | | |
Income from investment operations: | |
Net investment income | | | 0.15 | | | | 0.12 | | | | 0.12 | | | | 0.13 | | | | 0.12 | | |
Net realized and unrealized gain (loss) | | | (0.57 | ) | | | 0.86 | | | | 1.53 | | | | 1.25 | | | | (0.07 | ) | |
Total from investment operations | | | (0.42 | ) | | | 0.98 | | | | 1.65 | | | | 1.38 | | | | 0.05 | | |
Less distributions to shareholders: | |
Net investment income | | | (0.19 | ) | | | (0.30 | ) | | | (0.24 | ) | | | (0.16 | ) | | | (0.14 | ) | |
Net realized gains | | | (0.85 | ) | | | (0.96 | ) | | | — | | | | — | | | | — | | |
Total distributions to shareholders | | | (1.04 | ) | | | (1.26 | ) | | | (0.24 | ) | | | (0.16 | ) | | | (0.14 | ) | |
Net asset value, end of period | | $ | 11.08 | | | $ | 12.54 | | | $ | 12.82 | | | $ | 11.41 | | | $ | 10.19 | | |
Total return | | | (3.92 | %) | | | 7.50 | % | | | 14.41 | % | | | 13.63 | % | | | 0.60 | % | |
Ratios to average net assets(a) | |
Total gross expenses | | | 0.51 | % | | | 0.54 | % | | | 0.52 | % | | | 0.52 | % | | | 0.49 | % | |
Total net expenses(b) | | | 0.51 | %(c) | | | 0.54 | %(c) | | | 0.52 | %(c) | | | 0.51 | %(c) | | | 0.49 | %(c) | |
Net investment income | | | 1.18 | % | | | 0.92 | % | | | 0.98 | % | | | 1.25 | % | | | 1.18 | % | |
Supplemental data | |
Net assets, end of period (in thousands) | | $ | 549,678 | | | $ | 577,868 | | | $ | 554,189 | | | $ | 495,722 | | | $ | 472,855 | | |
Portfolio turnover | | | 12 | % | | | 27 | % | | | 29 | % | | | 21 | % | | | 83 | % | |
Notes to Financial Highlights
(a) In addition to the fees and expenses that the Fund bears directly, the Fund indirectly bears a pro rata share of the fees and expenses of the underlying funds in which the Fund invests. Such indirect expenses are not included in the Fund's reported expense ratios.
(b) Total net expenses include the impact of certain fee waivers/expense reimbursements made by the Investment Manager and certain of its affiliates, if applicable.
(c) The benefits derived from expense reductions had an impact of less than 0.01%.
The accompanying Notes to Financial Statements are an integral part of this statement.
Annual Report 2016
138
COLUMBIA CAPITAL ALLOCATION PORTFOLIOS
FINANCIAL HIGHLIGHTS (continued)
Columbia Capital Allocation Aggressive Portfolio
| | | Year Ended January 31, | |
Class B | | 2016 | | 2015 | | 2014 | | 2013 | | 2012 | |
Per share data | |
Net asset value, beginning of period | | $ | 12.53 | | | $ | 12.81 | | | $ | 11.41 | | | $ | 10.17 | | | $ | 10.24 | | |
Income from investment operations: | |
Net investment income | | | 0.03 | | | | 0.01 | | | | 0.02 | | | | 0.04 | | | | 0.04 | | |
Net realized and unrealized gain (loss) | | | (0.53 | ) | | | 0.87 | | | | 1.53 | | | | 1.26 | | | | (0.07 | ) | |
Total from investment operations | | | (0.50 | ) | | | 0.88 | | | | 1.55 | | | | 1.30 | | | | (0.03 | ) | |
Less distributions to shareholders: | |
Net investment income | | | (0.11 | ) | | | (0.20 | ) | | | (0.15 | ) | | | (0.06 | ) | | | (0.04 | ) | |
Net realized gains | | | (0.85 | ) | | | (0.96 | ) | | | — | | | | — | | | | — | | |
Total distributions to shareholders | | | (0.96 | ) | | | (1.16 | ) | | | (0.15 | ) | | | (0.06 | ) | | | (0.04 | ) | |
Net asset value, end of period | | $ | 11.07 | | | $ | 12.53 | | | $ | 12.81 | | | $ | 11.41 | | | $ | 10.17 | | |
Total return | | | (4.60 | %) | | | 6.72 | % | | | 13.54 | % | | | 12.80 | % | | | (0.22 | %) | |
Ratios to average net assets(a) | |
Total gross expenses | | | 1.25 | % | | | 1.28 | % | | | 1.27 | % | | | 1.26 | % | | | 1.24 | % | |
Total net expenses(b) | | | 1.25 | %(c) | | | 1.28 | %(c) | | | 1.27 | %(c) | | | 1.26 | %(c) | | | 1.24 | %(c) | |
Net investment income | | | 0.26 | % | | | 0.04 | % | | | 0.14 | % | | | 0.41 | % | | | 0.38 | % | |
Supplemental data | |
Net assets, end of period (in thousands) | | $ | 11,970 | | | $ | 22,043 | | | $ | 31,473 | | | $ | 39,020 | | | $ | 49,003 | | |
Portfolio turnover | | | 12 | % | | | 27 | % | | | 29 | % | | | 21 | % | | | 83 | % | |
Notes to Financial Highlights
(a) In addition to the fees and expenses that the Fund bears directly, the Fund indirectly bears a pro rata share of the fees and expenses of the underlying funds in which the Fund invests. Such indirect expenses are not included in the Fund's reported expense ratios.
(b) Total net expenses include the impact of certain fee waivers/expense reimbursements made by the Investment Manager and certain of its affiliates, if applicable.
(c) The benefits derived from expense reductions had an impact of less than 0.01%.
The accompanying Notes to Financial Statements are an integral part of this statement.
Annual Report 2016
139
COLUMBIA CAPITAL ALLOCATION PORTFOLIOS
FINANCIAL HIGHLIGHTS (continued)
Columbia Capital Allocation Aggressive Portfolio
| | | Year Ended January 31, | |
Class C | | 2016 | | 2015 | | 2014 | | 2013 | | 2012 | |
Per share data | |
Net asset value, beginning of period | | $ | 12.32 | | | $ | 12.62 | | | $ | 11.24 | | | $ | 10.04 | | | $ | 10.14 | | |
Income from investment operations: | |
Net investment income | | | 0.06 | | | | 0.03 | | | | 0.03 | | | | 0.05 | | | | 0.04 | | |
Net realized and unrealized gain (loss) | | | (0.55 | ) | | | 0.83 | | | | 1.50 | | | | 1.24 | | | | (0.07 | ) | |
Total from investment operations | | | (0.49 | ) | | | 0.86 | | | | 1.53 | | | | 1.29 | | | | (0.03 | ) | |
Less distributions to shareholders: | |
Net investment income | | | (0.11 | ) | | | (0.20 | ) | | | (0.15 | ) | | | (0.09 | ) | | | (0.07 | ) | |
Net realized gains | | | (0.85 | ) | | | (0.96 | ) | | | — | | | | — | | | | — | | |
Total distributions to shareholders | | | (0.96 | ) | | | (1.16 | ) | | | (0.15 | ) | | | (0.09 | ) | | | (0.07 | ) | |
Net asset value, end of period | | $ | 10.87 | | | $ | 12.32 | | | $ | 12.62 | | | $ | 11.24 | | | $ | 10.04 | | |
Total return | | | (4.60 | %) | | | 6.66 | % | | | 13.56 | % | | | 12.86 | % | | | (0.23 | %) | |
Ratios to average net assets(a) | |
Total gross expenses | | | 1.25 | % | | | 1.29 | % | | | 1.27 | % | | | 1.27 | % | | | 1.24 | % | |
Total net expenses(b) | | | 1.25 | %(c) | | | 1.29 | %(c) | | | 1.27 | %(c) | | | 1.26 | %(c) | | | 1.24 | %(c) | |
Net investment income | | | 0.46 | % | | | 0.22 | % | | | 0.27 | % | | | 0.52 | % | | | 0.44 | % | |
Supplemental data | |
Net assets, end of period (in thousands) | | $ | 66,938 | | | $ | 62,488 | | | $ | 50,676 | | | $ | 38,461 | | | $ | 33,266 | | |
Portfolio turnover | | | 12 | % | | | 27 | % | | | 29 | % | | | 21 | % | | | 83 | % | |
Notes to Financial Highlights
(a) In addition to the fees and expenses that the Fund bears directly, the Fund indirectly bears a pro rata share of the fees and expenses of the underlying funds in which the Fund invests. Such indirect expenses are not included in the Fund's reported expense ratios.
(b) Total net expenses include the impact of certain fee waivers/expense reimbursements made by the Investment Manager and certain of its affiliates, if applicable.
(c) The benefits derived from expense reductions had an impact of less than 0.01%.
The accompanying Notes to Financial Statements are an integral part of this statement.
Annual Report 2016
140
COLUMBIA CAPITAL ALLOCATION PORTFOLIOS
FINANCIAL HIGHLIGHTS (continued)
Columbia Capital Allocation Aggressive Portfolio
| | | Year Ended January 31, | |
Class K | | 2016 | | 2015 | | 2014 | | 2013 | | 2012 | |
Per share data | |
Net asset value, beginning of period | | $ | 12.56 | | | $ | 12.84 | | | $ | 11.43 | | | $ | 10.20 | | | $ | 10.30 | | |
Income from investment operations: | |
Net investment income | | | 0.16 | | | | 0.10 | | | | 0.14 | | | | 0.15 | | | | 0.13 | | |
Net realized and unrealized gain (loss) | | | (0.56 | ) | | | 0.89 | | | | 1.52 | | | | 1.25 | | | | (0.07 | ) | |
Total from investment operations | | | (0.40 | ) | | | 0.99 | | | | 1.66 | | | | 1.40 | | | | 0.06 | | |
Less distributions to shareholders: | |
Net investment income | | | (0.20 | ) | | | (0.31 | ) | | | (0.25 | ) | | | (0.17 | ) | | | (0.16 | ) | |
Net realized gains | | | (0.85 | ) | | | (0.96 | ) | | | — | | | | — | | | | — | | |
Total distributions to shareholders | | | (1.05 | ) | | | (1.27 | ) | | | (0.25 | ) | | | (0.17 | ) | | | (0.16 | ) | |
Net asset value, end of period | | $ | 11.11 | | | $ | 12.56 | | | $ | 12.84 | | | $ | 11.43 | | | $ | 10.20 | | |
Total return | | | (3.76 | %) | | | 7.60 | % | | | 14.52 | % | | | 13.84 | % | | | 0.64 | % | |
Ratios to average net assets(a) | |
Total gross expenses | | | 0.43 | % | | | 0.43 | % | | | 0.40 | % | | | 0.37 | % | | | 0.35 | % | |
Total net expenses(b) | | | 0.43 | % | | | 0.43 | % | | | 0.40 | % | | | 0.37 | % | | | 0.35 | % | |
Net investment income | | | 1.25 | % | | | 0.72 | % | | | 1.13 | % | | | 1.37 | % | | | 1.30 | % | |
Supplemental data | |
Net assets, end of period (in thousands) | | $ | 57 | | | $ | 68 | | | $ | 152 | | | $ | 126 | | | $ | 451 | | |
Portfolio turnover | | | 12 | % | | | 27 | % | | | 29 | % | | | 21 | % | | | 83 | % | |
Notes to Financial Highlights
(a) In addition to the fees and expenses that the Fund bears directly, the Fund indirectly bears a pro rata share of the fees and expenses of the underlying funds in which the Fund invests. Such indirect expenses are not included in the Fund's reported expense ratios.
(b) Total net expenses include the impact of certain fee waivers/expense reimbursements made by the Investment Manager and certain of its affiliates, if applicable.
The accompanying Notes to Financial Statements are an integral part of this statement.
Annual Report 2016
141
COLUMBIA CAPITAL ALLOCATION PORTFOLIOS
FINANCIAL HIGHLIGHTS (continued)
Columbia Capital Allocation Aggressive Portfolio
| | | Year Ended January 31, | |
Class R | | 2016 | | 2015 | | 2014 | | 2013 | | 2012 | |
Per share data | |
Net asset value, beginning of period | | $ | 12.46 | | | $ | 12.75 | | | $ | 11.35 | | | $ | 10.16 | | | $ | 10.25 | | |
Income from investment operations: | |
Net investment income | | | 0.12 | | | | 0.10 | | | | 0.14 | | | | 0.11 | | | | 0.10 | | |
Net realized and unrealized gain (loss) | | | (0.56 | ) | | | 0.83 | | | | 1.47 | | | | 1.24 | | | | (0.07 | ) | |
Total from investment operations | | | (0.44 | ) | | | 0.93 | | | | 1.61 | | | | 1.35 | | | | 0.03 | | |
Less distributions to shareholders: | |
Net investment income | | | (0.16 | ) | | | (0.26 | ) | | | (0.21 | ) | | | (0.16 | ) | | | (0.12 | ) | |
Net realized gains | | | (0.85 | ) | | | (0.96 | ) | | | — | | | | — | | | | — | | |
Total distributions to shareholders | | | (1.01 | ) | | | (1.22 | ) | | | (0.21 | ) | | | (0.16 | ) | | | (0.12 | ) | |
Net asset value, end of period | | $ | 11.01 | | | $ | 12.46 | | | $ | 12.75 | | | $ | 11.35 | | | $ | 10.16 | | |
Total return | | | (4.09 | %) | | | 7.19 | % | | | 14.13 | % | | | 13.38 | % | | | 0.33 | % | |
Ratios to average net assets(a) | |
Total gross expenses | | | 0.76 | % | | | 0.79 | % | | | 0.78 | % | | | 0.79 | % | | | 0.70 | % | |
Total net expenses(b) | | | 0.76 | %(c) | | | 0.79 | %(c) | | | 0.78 | %(c) | | | 0.76 | %(c) | | | 0.70 | % | |
Net investment income | | | 0.97 | % | | | 0.72 | % | | | 1.12 | % | | | 1.03 | % | | | 0.98 | % | |
Supplemental data | |
Net assets, end of period (in thousands) | | $ | 1,029 | | | $ | 912 | | | $ | 644 | | | $ | 182 | | | $ | 3 | | |
Portfolio turnover | | | 12 | % | | | 27 | % | | | 29 | % | | | 21 | % | | | 83 | % | |
Notes to Financial Highlights
(a) In addition to the fees and expenses that the Fund bears directly, the Fund indirectly bears a pro rata share of the fees and expenses of the underlying funds in which the Fund invests. Such indirect expenses are not included in the Fund's reported expense ratios.
(b) Total net expenses include the impact of certain fee waivers/expense reimbursements made by the Investment Manager and certain of its affiliates, if applicable.
(c) The benefits derived from expense reductions had an impact of less than 0.01%.
The accompanying Notes to Financial Statements are an integral part of this statement.
Annual Report 2016
142
COLUMBIA CAPITAL ALLOCATION PORTFOLIOS
FINANCIAL HIGHLIGHTS (continued)
Columbia Capital Allocation Aggressive Portfolio
| | | Year Ended January 31, | |
Class R4 | | 2016 | | 2015 | | 2014(a) | |
Per share data | |
Net asset value, beginning of period | | $ | 12.34 | | | $ | 12.63 | | | $ | 11.82 | | |
Income from investment operations: | |
Net investment income | | | 0.24 | | | | 0.54 | | | | 0.20 | | |
Net realized and unrealized gain (loss) | | | (0.61 | ) | | | 0.46 | | | | 0.88 | | |
Total from investment operations | | | (0.37 | ) | | | 1.00 | | | | 1.08 | | |
Less distributions to shareholders: | |
Net investment income | | | (0.23 | ) | | | (0.33 | ) | | | (0.27 | ) | |
Net realized gains | | | (0.85 | ) | | | (0.96 | ) | | | — | | |
Total distributions to shareholders | | | (1.08 | ) | | | (1.29 | ) | | | (0.27 | ) | |
Net asset value, end of period | | $ | 10.89 | | | $ | 12.34 | | | $ | 12.63 | | |
Total return | | | (3.65 | %) | | | 7.78 | % | | | 9.08 | % | |
Ratios to average net assets(b) | |
Total gross expenses | | | 0.26 | % | | | 0.28 | % | | | 0.29 | %(c) | |
Total net expenses(d) | | | 0.26 | %(e) | | | 0.28 | %(e) | | | 0.29 | %(c)(e) | |
Net investment income | | | 1.97 | % | | | 4.28 | % | | | 2.54 | %(c) | |
Supplemental data | |
Net assets, end of period (in thousands) | | $ | 779 | | | $ | 497 | | | $ | 26 | | |
Portfolio turnover | | | 12 | % | | | 27 | % | | | 29 | % | |
Notes to Financial Highlights
(a) Based on operations from June 13, 2013 (commencement of operations) through the stated period end.
(b) In addition to the fees and expenses that the Fund bears directly, the Fund indirectly bears a pro rata share of the fees and expenses of the underlying funds in which the Fund invests. Such indirect expenses are not included in the Fund's reported expense ratios.
(c) Annualized.
(d) Total net expenses include the impact of certain fee waivers/expense reimbursements made by the Investment Manager and certain of its affiliates, if applicable.
(e) The benefits derived from expense reductions had an impact of less than 0.01%.
The accompanying Notes to Financial Statements are an integral part of this statement.
Annual Report 2016
143
COLUMBIA CAPITAL ALLOCATION PORTFOLIOS
FINANCIAL HIGHLIGHTS (continued)
Columbia Capital Allocation Aggressive Portfolio
| | | Year Ended January 31, | |
Class R5 | | 2016 | | 2015 | | 2014(a) | |
Per share data | |
Net asset value, beginning of period | | $ | 12.33 | | | $ | 12.63 | | | $ | 11.82 | | |
Income from investment operations: | |
Net investment income | | | 0.31 | | | | 0.16 | | | | 0.04 | | |
Net realized and unrealized gain (loss) | | | (0.68 | ) | | | 0.85 | | | | 1.06 | | |
Total from investment operations | | | (0.37 | ) | | | 1.01 | | | | 1.10 | | |
Less distributions to shareholders: | |
Net investment income | | | (0.23 | ) | | | (0.35 | ) | | | (0.29 | ) | |
Net realized gains | | | (0.85 | ) | | | (0.96 | ) | | | — | | |
Total distributions to shareholders | | | (1.08 | ) | | | (1.31 | ) | | | (0.29 | ) | |
Net asset value, end of period | | $ | 10.88 | | | $ | 12.33 | | | $ | 12.63 | | |
Total return | | | (3.58 | %) | | | 7.83 | % | | | 9.27 | % | |
Ratios to average net assets(b) | |
Total gross expenses | | | 0.18 | % | | | 0.18 | % | | | 0.19 | %(c) | |
Total net expenses(d) | | | 0.18 | % | | | 0.18 | % | | | 0.19 | %(c) | |
Net investment income | | | 2.61 | % | | | 1.22 | % | | | 0.47 | %(c) | |
Supplemental data | |
Net assets, end of period (in thousands) | | $ | 1,041 | | | $ | 381 | | | $ | 385 | | |
Portfolio turnover | | | 12 | % | | | 27 | % | | | 29 | % | |
Notes to Financial Highlights
(a) Based on operations from June 13, 2013 (commencement of operations) through the stated period end.
(b) In addition to the fees and expenses that the Fund bears directly, the Fund indirectly bears a pro rata share of the fees and expenses of the underlying funds in which the Fund invests. Such indirect expenses are not included in the Fund's reported expense ratios.
(c) Annualized.
(d) Total net expenses include the impact of certain fee waivers/expense reimbursements made by the Investment Manager and certain of its affiliates, if applicable.
The accompanying Notes to Financial Statements are an integral part of this statement.
Annual Report 2016
144
COLUMBIA CAPITAL ALLOCATION PORTFOLIOS
FINANCIAL HIGHLIGHTS (continued)
Columbia Capital Allocation Aggressive Portfolio
| | | Year Ended January 31, | |
Class Y | | 2016 | | 2015 | | 2014(a) | |
Per share data | |
Net asset value, beginning of period | | $ | 12.32 | | | $ | 12.62 | | | $ | 11.82 | | |
Income from investment operations: | |
Net investment income | | | 0.08 | | | | 0.17 | | | | 0.15 | | |
Net realized and unrealized gain (loss) | | | (0.44 | ) | | | 0.84 | | | | 0.95 | | |
Total from investment operations | | | (0.36 | ) | | | 1.01 | | | | 1.10 | | |
Less distributions to shareholders: | |
Net investment income | | | (0.24 | ) | | | (0.35 | ) | | | (0.30 | ) | |
Net realized gains | | | (0.85 | ) | | | (0.96 | ) | | | — | | |
Total distributions to shareholders | | | (1.09 | ) | | | (1.31 | ) | | | (0.30 | ) | |
Net asset value, end of period | | $ | 10.87 | | | $ | 12.32 | | | $ | 12.62 | | |
Total return | | | (3.54 | %) | | | 7.88 | % | | | 9.23 | % | |
Ratios to average net assets(b) | |
Total gross expenses | | | 0.15 | % | | | 0.14 | % | | | 0.06 | %(c) | |
Total net expenses(d) | | | 0.15 | % | | | 0.14 | % | | | 0.06 | %(c) | |
Net investment income | | | 0.69 | % | | | 1.30 | % | | | 1.95 | %(c) | |
Supplemental data | |
Net assets, end of period (in thousands) | | $ | 214 | | | $ | 2 | | | $ | 3 | | |
Portfolio turnover | | | 12 | % | | | 27 | % | | | 29 | % | |
Notes to Financial Highlights
(a) Based on operations from June 13, 2013 (commencement of operations) through the stated period end.
(b) In addition to the fees and expenses that the Fund bears directly, the Fund indirectly bears a pro rata share of the fees and expenses of the underlying funds in which the Fund invests. Such indirect expenses are not included in the Fund's reported expense ratios.
(c) Annualized.
(d) Total net expenses include the impact of certain fee waivers/expense reimbursements made by the Investment Manager and certain of its affiliates, if applicable.
The accompanying Notes to Financial Statements are an integral part of this statement.
Annual Report 2016
145
COLUMBIA CAPITAL ALLOCATION PORTFOLIOS
FINANCIAL HIGHLIGHTS (continued)
Columbia Capital Allocation Aggressive Portfolio
| | | Year Ended January 31, | |
Class Z | | 2016 | | 2015 | | 2014 | | 2013 | | 2012 | |
Per share data | |
Net asset value, beginning of period | | $ | 12.49 | | | $ | 12.78 | | | $ | 11.36 | | | $ | 10.16 | | | $ | 10.26 | | |
Income from investment operations: | |
Net investment income | | | 0.19 | | | | 0.17 | | | | 0.19 | | | | 0.21 | | | | 0.14 | | |
Net realized and unrealized gain (loss) | | | (0.58 | ) | | | 0.83 | | | | 1.50 | | | | 1.19 | | | | (0.07 | ) | |
Total from investment operations | | | (0.39 | ) | | | 1.00 | | | | 1.69 | | | | 1.40 | | | | 0.07 | | |
Less distributions to shareholders: | |
Net investment income | | | (0.22 | ) | | | (0.33 | ) | | | (0.27 | ) | | | (0.20 | ) | | | (0.17 | ) | |
Net realized gains | | | (0.85 | ) | | | (0.96 | ) | | | — | | | | — | | | | — | | |
Total distributions to shareholders | | | (1.07 | ) | | | (1.29 | ) | | | (0.27 | ) | | | (0.20 | ) | | | (0.17 | ) | |
Net asset value, end of period | | $ | 11.03 | | | $ | 12.49 | | | $ | 12.78 | | | $ | 11.36 | �� | | $ | 10.16 | | |
Total return | | | (3.69 | %) | | | 7.70 | % | | | 14.82 | % | | | 13.87 | % | | | 0.83 | % | |
Ratios to average net assets(a) | |
Total gross expenses | | | 0.26 | % | | | 0.29 | % | | | 0.28 | % | | | 0.28 | % | | | 0.24 | % | |
Total net expenses(b) | | | 0.26 | %(c) | | | 0.29 | %(c) | | | 0.28 | %(c) | | | 0.26 | %(c) | | | 0.24 | %(c) | |
Net investment income | | | 1.55 | % | | | 1.30 | % | | | 1.51 | % | | | 2.00 | % | | | 1.40 | % | |
Supplemental data | |
Net assets, end of period (in thousands) | | $ | 1,809 | | | $ | 1,433 | | | $ | 951 | | | $ | 413 | | | $ | 168 | | |
Portfolio turnover | | | 12 | % | | | 27 | % | | | 29 | % | | | 21 | % | | | 83 | % | |
Notes to Financial Highlights
(a) In addition to the fees and expenses that the Fund bears directly, the Fund indirectly bears a pro rata share of the fees and expenses of the underlying funds in which the Fund invests. Such indirect expenses are not included in the Fund's reported expense ratios.
(b) Total net expenses include the impact of certain fee waivers/expense reimbursements made by the Investment Manager and certain of its affiliates, if applicable.
(c) The benefits derived from expense reductions had an impact of less than 0.01%.
The accompanying Notes to Financial Statements are an integral part of this statement.
Annual Report 2016
146
COLUMBIA CAPITAL ALLOCATION PORTFOLIOS
NOTES TO FINANCIAL STATEMENTS
January 31, 2016
Note 1. Organization
Columbia Funds Series Trust and Columbia Funds Series Trust II, (each a Trust, and collectively, the Trusts) are registered under the Investment Company Act of 1940, as amended (the 1940 Act), as open-end management investment companies. Columbia Funds Series Trust is organized as a Delaware statutory trust and Columbia Funds Series Trust II is organized as a Massachusetts business trust.
Information presented in these financial statements pertains to the following series of the Trusts (each, a Fund and collectively, the Funds): Columbia Capital Allocation Moderate Conservative Portfolio and Columbia Capital Allocation Moderate Aggressive Portfolio, each a series of Columbia Funds Series Trust, and Columbia Capital Allocation Conservative Portfolio, Columbia Capital Allocation Moderate Portfolio and Columbia Capital Allocation Aggressive Portfolio, each a series of Columbia Funds Series Trust II. Each Fund currently operates as a diversified fund.
Each Fund is a "fund-of-funds", investing significantly in affiliated funds managed by Columbia Management Investment Advisers, LLC (the Investment Manager), a wholly-owned subsidiary of Ameriprise Financial, Inc. (Ameriprise Financial), or third-party advised (unaffiliated) funds, including exchange-traded funds (collectively, Underlying Funds).
For information on the Underlying Funds, please refer to the Fund's current prospectus and the prospectuses of the Underlying Funds.
Fund Shares
Each Trust may issue an unlimited number of shares (without par value) that can be allocated among the separate series as designated by the Board of Trustees (the Board).
Columbia Capital Allocation Conservative Portfolio, Columbia Capital Allocation Moderate Conservative Portfolio, Columbia Capital Allocation Moderate Portfolio and Columbia Capital Allocation Aggressive Portfolio each offers Class A, Class B, Class C, Class K, Class R, Class R4, Class R5, Class Y and Class Z shares. Columbia Capital Allocation Moderate Aggressive Portfolio offers Class A, Class B, Class C, Class K, Class R, Class R4, Class R5, Class T, Class Y and Class Z shares. Although all share classes generally have identical voting, dividend and liquidation rights, each share class votes separately when required by the Trust's organizational documents or by law. Different
share classes pay different distribution amounts to the extent the expenses of such share classes differ, and distributions in liquidation will be proportional to the net asset value of each share class. Each share class has its own expense and sales charge structure.
Class A shares are subject to a maximum front-end sales charge of 4.75% for Columbia Capital Allocation Conservative Portfolio. Class A shares of Columbia Capital Allocation Moderate Conservative Portfolio, Columbia Capital Allocation Moderate Portfolio, Columbia Capital Allocation Moderate Aggressive Portfolio and Columbia Capital Allocation Aggressive Portfolio are subject to a maximum front-end sales charge of 5.75% based on the initial investment amount. Class A shares purchased without an initial sales charge in accounts aggregating $1 million to $50 million at the time of purchase are subject to a contingent deferred sales charge (CDSC) if the shares are sold within 18 months after purchase, charged as follows: 1.00% CDSC if redeemed within 12 months after purchase, and 0.50% CDSC if redeemed more than 12, but less than 18, months after purchase.
Class B shares may be subject to a maximum CDSC of 5.00% based upon the holding period after purchase. Class B shares will generally convert to Class A shares eight years after purchase. Each Fund no longer accepts investments by new or existing investors in the Fund's Class B shares, except in connection with the reinvestment of any dividend and/or capital gain distributions in Class B shares of the Fund and exchanges by existing Class B shareholders of certain other funds within the Columbia Family of Funds.
Class C shares are subject to a 1.00% CDSC on shares redeemed within 12 months after purchase.
Class K shares are not subject to sales charges, however this share class is closed to new investors.
Class R shares are not subject to sales charges and are generally available only to certain retirement plans and other investors as described in the Fund's prospectus.
Class R4 shares are not subject to sales charges and are generally available only to omnibus retirement plans and certain investors as described in the Fund's prospectus.
Class R5 shares are not subject to sales charges and are generally available only to investors purchasing through authorized investment professionals and omnibus retirement plans.
Annual Report 2016
147
COLUMBIA CAPITAL ALLOCATION PORTFOLIOS
NOTES TO FINANCIAL STATEMENTS (continued)
January 31, 2016
Class T shares are subject to a maximum front-end sales charge of 5.75% based on the investment amount. Class T shares purchased without an initial sales charge in accounts aggregating $1 million to $50 million at the time of purchase are subject to a CDSC if the shares are sold within 18 months after purchase, charged as follows: 1.00% CDSC if redeemed within 12 months after purchase, and 0.50% CDSC if redeemed more than 12, but less than 18, months after purchase. Class T shares are available only to investors who received (and who have continuously held) Class T shares in connection with previous fund reorganizations.
Class Y shares are not subject to sales charges and are generally available only to certain retirement plans as described in the Fund's prospectus.
Class Z shares are not subject to sales charges and are available only to eligible investors, which are subject to different investment minimums as described in the Fund's prospectus.
Note 2. Summary of Significant Accounting Policies
Basis of Preparation
Each Fund is an investment company that applies the accounting and reporting guidance in the Financial Accounting Standards Board (FASB) Accounting Standards Codification Topic 946, Financial Services — Investment Companies (ASC 946). The financial statements are prepared in accordance with U.S. generally accepted accounting principles (GAAP), which requires management to make certain estimates and assumptions that affect the reported amounts of assets and liabilities, the disclosure of contingent assets and liabilities at the date of the financial statements and the reported amounts of income and expenses during the reporting period. Actual results could differ from those estimates.
The following is a summary of significant accounting policies followed by the Funds in the preparation of their financial statements.
Security Valuation
All equity securities are valued at the close of business of the New York Stock Exchange (NYSE). Equity securities are valued at the last quoted sales price on the principal exchange or market on which they trade, except for securities traded on the NASDAQ Stock Market, which are valued at the NASDAQ official close price. Unlisted securities or listed securities for which there were no
sales during the day are valued at the mean of the latest quoted bid and ask prices on such exchanges or markets.
Investments in the Underlying Funds are valued at the net asset value of the applicable class of the Underlying Fund determined as of the close of the NYSE on the valuation date.
Futures and options on futures contracts are valued based upon the settlement price at the close of regular trading on their principal exchanges or, in the absence of transactions, at the mean of the latest quoted bid and ask prices.
Swap transactions are valued through an independent pricing service or broker, or if neither is available, through an internal model based upon observable inputs.
Investments for which market quotations are not readily available, or that have quotations which management believes are not reflective of market value or reliable, are valued at fair value as determined in good faith under procedures approved by and under the general supervision of the Board. If a security or class of securities (such as foreign securities) is valued at fair value, such value is likely to be different from the quoted or published price for the security.
The determination of fair value often requires significant judgment. To determine fair value, management may use assumptions including but not limited to future cash flows and estimated risk premiums. Multiple inputs from various sources may be used to determine fair value.
GAAP requires disclosure regarding the inputs and valuation techniques used to measure fair value and any changes in valuation inputs or techniques. In addition, investments shall be disclosed by major category. This information is disclosed following the Funds' Portfolio of Investments.
Foreign Currency Transactions and Translations
The values of all assets and liabilities denominated in foreign currencies are generally translated into U.S. dollars at exchange rates determined at the close of the NYSE on any given day. Net realized and unrealized gains (losses) on foreign currency transactions and translations include gains (losses) arising from the fluctuation in exchange rates between trade and settlement dates on securities transactions, gains (losses) arising from the disposition of foreign currency and currency gains (losses) between the accrual and payment dates on dividends, interest income and foreign withholding taxes.
Annual Report 2016
148
COLUMBIA CAPITAL ALLOCATION PORTFOLIOS
NOTES TO FINANCIAL STATEMENTS (continued)
January 31, 2016
For financial statement purposes, the Funds do not distinguish that portion of gains (losses) on investments which is due to changes in foreign exchange rates from that which is due to changes in market prices of the investments. Such fluctuations are included with the net realized and unrealized gains (losses) on investments in the Statement of Operations.
Derivative Instruments
Each Fund may invest in certain derivative instruments, as detailed below, to meet its investment objectives. Derivatives are instruments whose values depend on, or are derived from, in whole or in part, the value of one or more securities, currencies, commodities, indices, or other assets or instruments. Derivatives may be used to increase investment flexibility (including to maintain cash reserves while maintaining desired exposure to certain assets), for risk management (hedging) purposes, to facilitate trading, to reduce transaction costs and to pursue higher investment returns. The Fund may also use derivative instruments to mitigate certain investment risks, such as foreign currency exchange rate risk, interest rate risk and credit risk. Derivatives may involve various risks, including the potential inability of the counterparty to fulfill its obligation under the terms of the contract, the potential for an illiquid secondary market (making it difficult for the Fund to sell, including at favorable prices) and the potential for market movements which may expose the Fund to gains or losses in excess of the amount shown in the Statement of Assets and Liabilities. The notional amounts of derivative instruments, if applicable, are not recorded in the financial statements.
A derivative instrument may suffer a marked-to-market loss if the value of the contract decreases due to an unfavorable change in the market rates or values of the underlying instrument. Losses can also occur if the counterparty does not perform under the contract. The Fund's risk of loss from counterparty credit risk on over-the-counter derivatives is generally limited to the aggregate unrealized gain netted against any collateral held by the Fund and the amount of any variation margin held by the counterparty. With exchange-traded or centrally cleared derivatives, there is reduced counterparty credit risk to the Fund since the exchange's clearinghouse, as counterparty to such instruments, guarantees against a possible default. The clearinghouse stands between the buyer and the seller of the contract; therefore, the counterparty credit risk is failure of the clearinghouse. However, credit risk still exists in
exchange-traded or centrally cleared derivatives with respect to initial and variation margin that is held in a broker's customer account. While brokers are required to segregate customer margin from their own assets, in the event that a broker becomes insolvent or goes into bankruptcy and at that time there is a shortfall in the aggregate amount of margin held by the broker for all its clients, U.S. bankruptcy laws will typically allocate that shortfall on a pro-rata basis across all the broker's customers (including the Fund), potentially resulting in losses to the Fund.
In order to better define its contractual rights and to secure rights that will help the Fund mitigate its counterparty risk, the Fund may enter into an International Swaps and Derivatives Association, Inc. Master Agreement (ISDA Master Agreement) or similar agreement with its derivatives contract counterparties. An ISDA Master Agreement is an agreement between the Fund and a counterparty that governs over-the-counter derivatives and forward foreign currency exchange contracts and typically contains, among other things, collateral posting terms and netting provisions in the event of a default and/or termination event. Under an ISDA Master Agreement, the Fund may, under certain circumstances, offset with the counterparty certain derivative instrument's payables and/or receivables with collateral held and/or posted and create one single net payment. The provisions of the ISDA Master Agreement typically permit a single net payment in the event of default (close-out netting) including the bankruptcy or insolvency of the counterparty. Note, however, that bankruptcy or insolvency laws of a particular jurisdiction may impose restrictions on or prohibitions against the right of offset in bankruptcy, insolvency or other events.
Collateral (margin) requirements differ by type of derivative. Margin requirements are established by the exchange or clearinghouse for exchange-traded and centrally cleared derivatives. Brokers can ask for margin in excess of the minimum in certain circumstances. Collateral terms are contract specific for over-the-counter derivatives. For over-the-counter derivatives traded under an ISDA Master Agreement, the collateral requirements are typically calculated by netting the marked-to-market amount for each transaction under such agreement and comparing that amount to the value of any variation margin currently pledged by the Fund and/or the counterparty. Generally, the amount of collateral due from or to a party has to exceed a minimum transfer amount threshold (e.g., $500,000) before a transfer has to be made. To the extent amounts due to the Fund from its
Annual Report 2016
149
COLUMBIA CAPITAL ALLOCATION PORTFOLIOS
NOTES TO FINANCIAL STATEMENTS (continued)
January 31, 2016
counterparties are not fully collateralized, contractually or otherwise, the Fund bears the risk of loss from counterparty nonperformance. The Fund attempts to mitigate counterparty risk by only entering into agreements with counterparties that it believes have the financial resources to honor their obligations and by monitoring the financial stability of those counterparties.
Certain ISDA Master Agreements allow counterparties to over-the-counter derivatives transactions to terminate derivatives contracts prior to maturity in the event the Fund's net asset value declines by a stated percentage over a specified time period or if the Fund fails to meet certain terms of the ISDA Master Agreement, which would cause the Fund to accelerate payment of any net liability owed to the counterparty. The Fund also has termination rights if the counterparty fails to meet certain terms of the ISDA Master Agreement. In addition to considering counterparty credit risk, the Fund would consider terminating the derivatives contracts based on whether termination would result in a net liability owed from the counterparty.
For financial reporting purposes, the Fund does not offset derivative assets and derivative liabilities that are subject to netting arrangements in the Statement of Assets and Liabilities.
Forward Foreign Currency Exchange Contracts
Forward foreign currency exchange contracts are over-the-counter agreements between two parties to buy and sell a currency at a set price on a future date. The Funds utilized forward foreign currency exchange to hedge the currency exposure associated with some or all of the Fund's securities, to shift investment exposure from one currency to another and to shift U.S. dollar exposure to achieve a representative weighted mix of major currencies in its benchmark and/or to recover an underweight country exposure in its portfolio. These instruments may be used for other purposes in future periods.
The values of forward foreign currency exchange contracts fluctuate daily with changes in foreign currency exchange rates. Changes in the value of these contracts are recorded as unrealized appreciation or depreciation until the contract is exercised or has expired. The Funds will realize a gain or loss when the forward foreign currency exchange contract is closed or expires.
The use of forward foreign currency exchange contracts does not eliminate fluctuations in the prices of the Fund's portfolio securities. The risks of forward foreign currency exchange contracts include movement in the values of the foreign currencies relative to the U.S. dollar (or other foreign currencies) and the possibility that counterparties will not complete their contractual obligations, which may be in excess of the amount reflected, if any, in the Statement of Assets and Liabilities.
Futures Contracts
Futures contracts are exchange traded and represent commitments for the future purchase or sale of an asset at a specified price on a specified date. The Funds bought and sold futures contracts to produce incremental earnings, to manage the duration and yield curve exposure of the Fund versus the benchmark, to manage exposure to movements in interest rates and to manage exposure to the securities market. These instruments may be used for other purposes in future periods. Upon entering into futures contracts, the Fund bears risks that it may not achieve the anticipated benefits of the futures contracts and may realize a loss. Additional risks include counterparty credit risk, the possibility of an illiquid market, and that a change in the value of the contract or option may not correlate with changes in the value of the underlying asset.
Upon entering into a futures contract, the Fund pledges cash or securities with the broker in an amount sufficient to meet the initial margin requirement. The initial margin deposit must be maintained at an established level over the life of the contract. Cash deposited as initial margin is recorded in the Statement of Assets and Liabilities as margin deposits. Securities deposited as initial margin are designated in the Portfolio of Investments. Subsequent payments (variation margin) are made or received by the Fund each day. The variation margin payments are equal to the daily change in the contract value and are recorded as variation margin receivable or payable and are offset in unrealized gains or losses. The Fund recognizes a realized gain or loss when the contract is closed or expires. Futures contracts involve, to varying degrees, risk of loss in excess of the variation margin disclosed in the Statement of Assets and Liabilities.
Annual Report 2016
150
COLUMBIA CAPITAL ALLOCATION PORTFOLIOS
NOTES TO FINANCIAL STATEMENTS (continued)
January 31, 2016
Swap Contracts
Swap contracts are negotiated in the over-the-counter market and may be entered into as a bilateral contract or centrally cleared (centrally cleared swap contract). In a centrally cleared swap contract, immediately following execution of the swap contract with a broker, the swap contract is novated to a central counterparty (the CCP) and the CCP becomes the Fund's counterparty to the centrally cleared swap contract. The Fund is required to deposit initial margin with the broker in the form of cash or securities in an amount that varies depending on the size and risk profile of the particular swap contract. Securities deposited as initial margin are designated in the Portfolio of Investments and cash deposited is recorded in the Statement of Assets and Liabilities as margin deposits. Unlike a bilateral swap contract, for centrally cleared swap contracts, the Fund has minimal credit exposure to the counterparty because the CCP stands between the Fund and the counterparty. Swap contracts are marked-to-market daily and changes in value are recorded as unrealized appreciation (depreciation). The daily change in valuation of centrally cleared swap contracts, if any, is recorded as a receivable or payable for variation margin in the Statement of Assets and Liabilities.
Credit Default Swap Contracts
The Funds entered into credit default swap contracts to manage credit risk exposure and increase or decrease its credit exposure to an index.
These instruments may be used for other purposes in future periods. Credit default swap contracts are agreements in which one party pays fixed periodic payments to a counterparty in consideration for a guarantee from the counterparty to make a specific payment should a specified credit event(s) take place. Although specified credit events are contract specific, credit events are generally defined as bankruptcy, failure to pay, restructuring, obligation acceleration, obligation default, or repudiation/moratorium.
As the purchaser of a credit default swap contract, the Fund purchases protection by paying a periodic interest rate on the notional amount to the counterparty. The interest amount is accrued daily as a component of unrealized appreciation (depreciation) and is recorded as
a realized loss upon payment. If a credit event as specified in the contract occurs, the Fund may have the option either to deliver the reference obligation to the seller in exchange for a cash payment of its par amount, or to receive a net cash settlement equal to the par amount less an agreed-upon value of the reference obligation as of the date of the credit event. The difference between the value of the obligation or cash delivered and the notional amount received will be recorded as a realized gain (loss).
Any premium paid or received by the Fund upon entering into a credit default swap contract is recorded as an asset or liability, respectively, and amortized daily as a component of realized gain (loss) in the Statement of Operations. Credit default swap contracts are valued daily, and the change in value is recorded as unrealized appreciation (depreciation) until the termination of the swap, at which time a realized gain (loss) is recorded.
Credit default swap contracts can involve greater risks than if a fund had invested in the reference obligation directly since, in addition to general market risks, credit default swaps are subject to counterparty credit risk, leverage risk, hedging risk, correlation risk and liquidity risk. The Fund will enter into credit default swap transactions only with counterparties that meet certain standards of creditworthiness, as determined by the Investment Manager.
Effects of Derivative Transactions in the Financial Statements
The following tables are intended to provide additional information about the effect of derivatives on the financial statements of the Fund, including: the fair value of derivatives by risk category and the location of those fair values in the Statement of Assets and Liabilities; and the impact of derivative transactions over the period in the Statement of Operations, including realized and unrealized gains (losses). The derivative instrument schedules following the Portfolio of Investments present additional information regarding derivative instruments outstanding at the end of the period, if any.
Columbia Capital Allocation Conservative Portfolio
The following table is a summary of the fair value of derivative instruments (not considered to be hedging
Annual Report 2016
151
COLUMBIA CAPITAL ALLOCATION PORTFOLIOS
NOTES TO FINANCIAL STATEMENTS (continued)
January 31, 2016
instruments for accounting disclosure purposes) at January 31, 2016:
Asset Derivatives | |
Risk Exposure
Category | | Statement of Assets and
Liabilities Location | | Fair Value ($) | |
Foreign exchange
risk
| | Unrealized appreciation on
forward foreign currency
exchange contracts | | | 1,805
| | |
Interest rate risk
| | Net assets — unrealized
appreciation on futures
contracts | | | 401,092
| * | |
Total | | | | | 402,897 | | |
Liability Derivatives | |
Risk Exposure
Category | | Statement of Assets and
Liabilities Location | | Fair Value ($) | |
Credit risk
| | Net assets — unrealized
depreciation on swap
contracts | | | 21,599
| * | |
Equity risk
| | Net assets — unrealized
depreciation on futures
contracts | | | 102,937
| * | |
Foreign exchange
risk
| | Unrealized depreciation on
forward foreign currency
exchange contracts | | | 6,906
| | |
Total | | | | | 131,442 | | |
*Includes cumulative appreciation (depreciation) as reported in the tables following the Portfolio of Investments. Only the current day's variation margin is reported in receivables or payables in the Statement of Assets and Liabilities.
The following table indicates the effect of derivative instruments (not considered to be hedging instruments for accounting disclosure purposes) in the Statement of Operations for the year ended January 31, 2016:
Amount of Realized Gain (Loss) on Derivatives Recognized in Income | |
Risk Exposure Category | | Forward Foreign
Currency Exchange
Contracts ($) | | Futures
Contracts ($) | | Swap
Contracts ($) | | Total ($) | |
Credit risk | | | — | | | | — | | | | 14,994 | | | | 14,994 | | |
Equity risk | | | — | | | | 941,965 | | | | — | | | | 941,965 | | |
Foreign exchange risk | | | (9,680 | ) | | | — | | | | — | | | | (9,680 | ) | |
Interest rate risk | | | — | | | | (362,045 | ) | | | — | | | | (362,045 | ) | |
Total | | | (9,680 | ) | | | 579,920 | | | | 14,994 | | | | 585,234 | | |
Change in Unrealized Appreciation (Depreciation) on Derivatives Recognized in Income | |
Risk Exposure Category | | Forward Foreign
Currency Exchange
Contracts ($) | | Futures
Contracts ($) | | Swap
Contracts ($) | | Total ($) | |
Credit risk | | | — | | | | — | | | | (21,599 | ) | | | (21,599 | ) | |
Equity risk | | | — | | | | (101,082 | ) | | | — | | | | (101,082 | ) | |
Foreign exchange risk | | | (5,101 | ) | | | — | | | | — | | | | (5,101 | ) | |
Interest rate risk | | | — | | | | 401,092 | | | | — | | | | 401,092 | | |
Total | | | (5,101 | ) | | | 300,010 | | | | (21,599 | ) | | | 273,310 | | |
The following table provides a summary of the average outstanding volume by derivative instrument for the year ended January 31, 2016:
Derivative Instrument | | Average Notional
Amounts ($) | |
Futures contracts — Long | | | 15,696,640 | * | |
Credit default swap contracts — buy protection | | | 46,575 | ** | |
Credit default swap contracts — sell protection | | | 719,178 | ** | |
Derivative Instrument | | Average Unrealized
Appreciation ($)* | | Average Unrealized
Depreciation ($)* | |
Forward foreign currency
exchange contracts | | | 1,552 | | | | (2,810) | | |
*Based on the ending quarterly outstanding amounts for the year ended January 31, 2016.
**Based on the ending daily outstanding amounts for the year ended January 31, 2016.
Annual Report 2016
152
COLUMBIA CAPITAL ALLOCATION PORTFOLIOS
NOTES TO FINANCIAL STATEMENTS (continued)
January 31, 2016
Columbia Capital Allocation Moderate Conservative Portfolio
The following table is a summary of the fair value of derivative instruments (not considered to be hedging instruments for accounting disclosure purposes) at January 31, 2016:
Asset Derivatives | |
Risk Exposure
Category | | Statement of Assets and
Liabilities Location | | Fair Value ($) | |
Foreign exchange
risk
| | Unrealized appreciation on
forward foreign currency
exchange contracts | | | 2,755
| | |
Interest rate risk
| | Net assets — unrealized
appreciation on futures
contracts | | | 1,047,381
| * | |
Total | | | | | 1,050,136 | | |
Liability Derivatives | |
Risk Exposure
Category | | Statement of Assets and
Liabilities Location | | Fair Value ($) | |
Credit risk
| | Net assets — unrealized
depreciation on swap
contracts | | | 33,034
| * | |
Equity risk
| | Net assets — unrealized
depreciation on futures
contracts | | | 516,850
| * | |
Foreign exchange
risk
| | Unrealized depreciation on
forward foreign currency
exchange contracts | | | 10,645
| | |
Total | | | | | 560,529 | | |
*Includes cumulative appreciation (depreciation) as reported in the tables following the Portfolio of Investments. Only the current day's variation margin is reported in receivables or payables in the Statement of Assets and Liabilities.
The following table indicates the effect of derivative instruments (not considered to be hedging instruments for accounting disclosure purposes) in the Statement of Operations for the year ended January 31, 2016:
Amount of Realized Gain (Loss) on Derivatives Recognized in Income | |
Risk Exposure Category | | Forward Foreign
Currency Exchange
Contracts ($) | | Futures
Contracts ($) | | Swap
Contracts ($) | | Total ($) | |
Credit risk | | | — | | | | — | | | | 21,545 | | | | 21,545 | | |
Equity risk | | | — | | | | 2,800,778 | | | | — | | | | 2,800,778 | | |
Foreign exchange risk | | | (13,923 | ) | | | — | | | | — | | | | (13,923 | ) | |
Interest rate risk | | | — | | | | (813,815 | ) | | | — | | | | (813,815 | ) | |
Total | | | (13,923 | ) | | | 1,986,963 | | | | 21,545 | | | | 1,994,585 | | |
Change in Unrealized Appreciation (Depreciation) on Derivatives Recognized in Income | |
Risk Exposure Category | | Forward Foreign
Currency Exchange
Contracts ($) | | Futures
Contracts ($) | | Swap
Contracts ($) | | Total ($) | |
Credit risk | | | — | | | | — | | | | (33,034 | ) | | | (33,034 | ) | |
Equity risk | | | — | | | | (806,064 | ) | | | — | | | | (806,064 | ) | |
Foreign exchange risk | | | (7,890 | ) | | | — | | | | — | | | | (7,890 | ) | |
Interest rate risk | | | — | | | | 677,743 | | | | — | | | | 677,743 | | |
Total | | | (7,890 | ) | | | (128,321 | ) | | | (33,034 | ) | | | (169,245 | ) | |
The following table provides a summary of the average outstanding volume by derivative instrument for the year ended January 31, 2016:
Derivative Instrument | | Average Notional
Amounts ($) | |
Futures contracts — Long | | | 51,773,604 | * | |
Credit default swap contracts — buy protection | | | 71,233 | ** | |
Credit default swap contracts — sell protection | | | 899,315 | ** | |
Derivative Instrument | | Average Unrealized
Appreciation ($)* | | Average Unrealized
Depreciation ($)* | |
Forward foreign currency
exchange contracts | | | 1,922 | | | | (3,866) | | |
*Based on the ending quarterly outstanding amounts for the year ended January 31, 2016.
**Based on the ending daily outstanding amounts for the year ended January 31, 2016.
Annual Report 2016
153
COLUMBIA CAPITAL ALLOCATION PORTFOLIOS
NOTES TO FINANCIAL STATEMENTS (continued)
January 31, 2016
Columbia Capital Allocation Moderate Portfolio
The following table is a summary of the fair value of derivative instruments (not considered to be hedging instruments for accounting disclosure purposes) at January 31, 2016:
Asset Derivatives | |
Risk Exposure
Category | | Statement of Assets and
Liabilities Location | | Fair Value ($) | |
Foreign exchange
risk
| | Unrealized appreciation on
forward foreign currency
exchange contracts | | | 11,593
| | |
Interest rate risk
| | Net assets — unrealized
appreciation on futures
contracts | | | 2,577,632
| | |
Total | | | | | 2,589,225 | | |
Liability Derivatives | |
Risk Exposure
Category | | Statement of Assets and
Liabilities Location | | Fair Value ($) | |
Equity risk
| | Net assets — unrealized
depreciation on futures
contracts | | | 1,343,176
| * | |
Foreign exchange
risk
| | Unrealized depreciation on
forward foreign currency
exchange contracts | | | 20,989
| | |
Total | | | | | 1,364,165 | | |
*Includes cumulative appreciation (depreciation) as reported in the tables following the Portfolio of Investments. Only the current day's variation margin is reported in receivables or payables in the Statement of Assets and Liabilities.
The following table indicates the effect of derivative instruments (not considered to be hedging instruments for accounting disclosure purposes) in the Statement of Operations for the year ended January 31, 2016:
Amount of Realized Gain (Loss) on Derivatives Recognized in Income | |
Risk Exposure Category | | Forward Foreign
Currency Exchange
Contracts ($) | | Futures
Contracts ($) | | Swap
Contracts ($) | | Total ($) | |
Credit risk | | | — | | | | — | | | | 39,271 | | | | 39,271 | | |
Equity risk | | | — | | | | 6,389,422 | | | | — | | | | 6,389,422 | | |
Foreign exchange risk | | | (1,757 | ) | | | — | | | | — | | | | (1,757 | ) | |
Interest rate risk | | | — | | | | (1,129,252 | ) | | | — | | | | (1,129,252 | ) | |
Total | | | (1,757 | ) | | | 5,260,170 | | | | 39,271 | | | | 5,297,684 | | |
Change in Unrealized Appreciation (Depreciation) on Derivatives Recognized in Income | |
Risk Exposure Category | | Forward Foreign
Currency Exchange
Contracts ($) | | Futures
Contracts ($) | | Swap
Contracts ($) | | Total ($) | |
Equity risk | | | — | | | | (2,004,333 | ) | | | — | | | | (2,004,333 | ) | |
Foreign exchange risk | | | (9,396 | ) | | | — | | | | — | | | | (9,396 | ) | |
Interest rate risk | | | — | | | | 1,679,883 | | | | — | | | | 1,679,883 | | |
Total | | | (9,396 | ) | | | (324,450 | ) | | | — | | | | (333,846 | ) | |
The following table provides a summary of the average outstanding volume by derivative instrument for the year ended January 31, 2016:
Derivative Instrument | | Average Notional
Amounts ($)* | |
Futures contracts — Long | | | 116,101,616 | | |
Credit default swap contracts — sell protection | | | 4,062,500 | | |
Derivative Instrument | | Average Unrealized
Appreciation ($)* | | Average Unrealized
Depreciation ($)* | |
Forward foreign currency
exchange contracts | | | 6,955 | | | | (9,993) | | |
*Based on the ending quarterly outstanding amounts for the year ended January 31, 2016.
Annual Report 2016
154
COLUMBIA CAPITAL ALLOCATION PORTFOLIOS
NOTES TO FINANCIAL STATEMENTS (continued)
January 31, 2016
Columbia Capital Allocation Moderate Aggressive Portfolio
The following table is a summary of the fair value of derivative instruments (not considered to be hedging instruments for accounting disclosure purposes) at January 31 2016:
Asset Derivatives | |
Risk Exposure
Category | | Statement of Assets and
Liabilities Location | | Fair Value ($) | |
Foreign exchange
risk
| | Unrealized appreciation on
forward foreign currency
exchange contracts | | | 7,228
| | |
Interest rate risk
| | Net assets — unrealized
appreciation on futures
contracts | | | 2,458,238
| * | |
Total | | | | | 2,465,466 | | |
Liability Derivatives | |
Risk Exposure
Category | | Statement of Assets and
Liabilities Location | | Fair Value ($) | |
Equity risk
| | Net assets — unrealized
depreciation on futures
contracts | | | 4,913,280
| * | |
Foreign exchange
risk
| | Unrealized depreciation on
forward foreign currency
exchange contracts | | | 14,135
| | |
Total | | | | | 4,927,415 | | |
*Includes cumulative appreciation (depreciation) as reported in the tables following the Portfolio of Investments. Only the current day's variation margin is reported in receivables or payables in the Statement of Assets and Liabilities.
The following table indicates the effect of derivative instruments (not considered to be hedging instruments for accounting disclosure purposes) in the Statement of Operations for the year ended January 31, 2016:
Amount of Realized Gain (Loss) on Derivatives Recognized in Income | |
Risk Exposure Category | | Forward Foreign
Currency Exchange
Contracts ($) | | Futures
Contracts ($) | | Swap
Contracts ($) | | Total ($) | |
Credit risk | | | — | | | | — | | | | 19,938 | | | | 19,938 | | |
Equity risk | | | — | | | | 10,364,347 | | | | — | | | | 10,364,347 | | |
Foreign exchange risk | | | (1,136 | ) | | | — | | | | — | | | | (1,136 | ) | |
Interest rate risk | | | — | | | | (2,100,664 | ) | | | — | | | | (2,100,664 | ) | |
Total | | | (1,136 | ) | | | 8,263,683 | | | | 19,938 | | | | 8,282,485 | | |
Change in Unrealized Appreciation (Depreciation) on Derivatives Recognized in Income | |
Risk Exposure Category | | Forward Foreign
Currency Exchange
Contracts ($) | | Futures
Contracts ($) | | Swap
Contracts ($) | | Total ($) | |
Equity risk | | | — | | | | (6,732,311 | ) | | | — | | | | (6,732,311 | ) | |
Foreign exchange risk | | | (6,907 | ) | | | — | | | | — | | | | (6,907 | ) | |
Interest rate risk | | | — | | | | 2,266,140 | | | | — | | | | 2,266,140 | | |
Total | | | (6,907 | ) | | | (4,466,171 | ) | | | — | | | | (4,473,078 | ) | |
The following table provides a summary of the average outstanding volume by derivative instrument for the year ended January 31, 2016:
Derivative Instrument | | Average Notional
Amounts ($)* | |
Futures contracts — Long | | | 203,716,027 | | |
Credit default swap contracts — sell protection | | | 2,062,500 | | |
Derivative Instrument | | Average Unrealized
Appreciation ($)* | | Average Unrealized
Depreciation ($)* | |
Forward foreign currency
exchange contracts | | | 4,617 | | | | (6,996) | | |
*Based on the ending quarterly outstanding amounts for the year ended January 31, 2016.
Annual Report 2016
155
COLUMBIA CAPITAL ALLOCATION PORTFOLIOS
NOTES TO FINANCIAL STATEMENTS (continued)
January 31, 2016
Columbia Capital Allocation Aggressive Portfolio
The following table is a summary of the fair value of derivative instruments (not considered to be hedging instruments for accounting disclosure purposes) at January 31, 2016:
Asset Derivatives | |
Risk Exposure
Category | | Statement of Assets and
Liabilities Location | | Fair Value ($) | |
Foreign exchange
risk
| | Unrealized appreciation on
forward foreign currency
exchange contracts | | | 8,964
| | |
Interest rate risk
| | Net assets — unrealized
appreciation on futures
contracts | | | 598,871
| * | |
Total | | | | | 607,835 | | |
Liability Derivatives | |
Risk Exposure
Category | | Statement of Assets and
Liabilities Location | | Fair Value ($) | |
Equity risk
| | Net assets — unrealized
depreciation on futures
contracts | | | 819,812
| * | |
Foreign exchange
risk
| | Unrealized depreciation on
forward foreign currency
exchange contracts | | | 17,629
| | |
Total | | | | | 837,441 | | |
*Includes cumulative appreciation (depreciation) as reported in the tables following the Portfolio of Investments. Only the current day's variation margin is reported in receivables or payables in the Statement of Assets and Liabilities.
The following table indicates the effect of derivative instruments (not considered to be hedging instruments for accounting disclosure purposes) in the Statement of Operations for the year ended January 31, 2016:
Amount of Realized Gain (Loss) on Derivatives Recognized in Income | |
Risk Exposure Category | | Forward Foreign
Currency Exchange
Contracts ($) | | Futures
Contracts ($) | | Swap
Contracts ($) | | Total ($) | |
Credit risk | | | — | | | | — | | | | 10,875 | | | | 10,875 | | |
Equity risk | | | — | | | | 3,344,204 | | | | — | | | | 3,344,204 | | |
Foreign exchange risk | | | (1,089 | ) | | | — | | | | — | | | | (1,089 | ) | |
Interest rate risk | | | — | | | | (435,545 | ) | | | — | | | | (435,545 | ) | |
Total | | | (1,089 | ) | | | 2,908,659 | | | | 10,875 | | | | 2,918,445 | | |
Change in Unrealized Appreciation (Depreciation) on Derivatives Recognized in Income | |
Risk Exposure Category | | Forward Foreign
Currency Exchange
Contracts ($) | | Futures
Contracts ($) | | Swap
Contracts ($) | | Total ($) | |
Equity risk | | | — | | | | (1,318,630 | ) | | | — | | | | (1,318,630 | ) | |
Foreign exchange risk | | | (8,665 | ) | | | — | | | | — | | | | (8,665 | ) | |
Interest rate risk | | | — | | | | 598,871 | | | | — | | | | 598,871 | | |
Total | | | (8,665 | ) | | | (719,759 | ) | | | — | | | | (728,424 | ) | |
The following table provides a summary of the average outstanding volume by derivative instrument for the year ended January 31, 2016:
Derivative Instrument | | Average Notional
Amounts ($)* | |
Futures contracts — Long | | | 48,074,932 | | |
Futures contracts — Short | | | 77,969 | | |
Credit default swap contracts — sell protection | | | 1,125,000 | | |
Derivative Instrument | | Average Unrealized
Appreciation ($)* | | Average Unrealized
Depreciation ($)* | |
Forward foreign currency
exchange contracts | | | 5,625 | | | | (8,595) | | |
*Based on the ending quarterly outstanding amounts for the year ended January 31, 2016.
Annual Report 2016
156
COLUMBIA CAPITAL ALLOCATION PORTFOLIOS
NOTES TO FINANCIAL STATEMENTS (continued)
January 31, 2016
Offsetting of Assets and Liabilities
The following table presents the Fund's gross and net amount of assets and liabilities available for offset under netting arrangements as well as any related collateral received or pledged by the Fund as of January 31, 2016:
Columbia Capital Allocation Conservative Portfolio
| | Barclays ($) | | Morgan
Stanley ($) | | Total ($) | |
Assets | |
Forward foreign currency exchange contracts | | | 1,805 | | | | — | | | | 1,805 | | |
Total Assets | | | 1,805 | | | | — | | | | 1,805 | | |
Liabilities | |
Centrally cleared credit default swap contracts(a) | | | — | | | | 5,827 | | | | 5,827 | | |
Forward foreign currency exchange contracts | | | 6,906 | | | | — | | | | 6,906 | | |
Total Liabilities | | | 6,906 | | | | 5,827 | | | | 12,733 | | |
Total Financial and Derivative Net Assets | | | (5,101 | ) | | | (5,827 | ) | | | (10,928 | ) | |
Total collateral received (pledged)(b) | | | — | | | | (5,827 | ) | | | (5,827 | ) | |
Net Amount(c) | | | (5,101 | ) | | | — | | | | (5,101 | ) | |
(a) Centrally cleared swaps are included within payable/receivable for variation margin on the Statement of Assets and Liabilities.
(b) In some instances, the actual collateral received and/or pledged may be more than the amount shown due to overcollateralization.
(c) Represents the net amount due from/(to) counterparties in the event of default.
Columbia Capital Allocation Moderate Conservative Portfolio
| | Barclays ($) | | Morgan
Stanley ($) | | Total ($) | |
Assets | |
Forward foreign currency exchange contracts | | | 2,755 | | | | — | | | | 2,755 | | |
Total Assets | | | 2,755 | | | | — | | | | 2,755 | | |
Liabilities | |
Centrally cleared credit default swap contracts(a) | | | | | | | 8,912 | | | | 8,912 | | |
Forward foreign currency exchange contracts | | | 10,645 | | | | — | | | | 10,645 | | |
Total Liabilities | | | 10,645 | | | | 8,912 | | | | 19,557 | | |
Total Financial and Derivative Net Assets | | | (7,890 | ) | | | (8,912 | ) | | | (16,802 | ) | |
Total collateral received (pledged)(b) | | | — | | | | (8,912 | ) | | | (8,912 | ) | |
Net Amount(c) | | | (7,890 | ) | | | — | | | | (7,890 | ) | |
(a) Centrally cleared swaps are included within payable/receivable for variation margin on the Statement of Assets and Liabilities.
(b) In some instances, the actual collateral received and/or pledged may be more than the amount shown due to overcollateralization.
(c) Represents the net amount due from/(to) counterparties in the event of default.
Annual Report 2016
157
COLUMBIA CAPITAL ALLOCATION PORTFOLIOS
NOTES TO FINANCIAL STATEMENTS (continued)
January 31, 2016
Columbia Capital Allocation Moderate Portfolio
| | BNP ($) | |
Assets | |
Forward foreign currency exchange contracts | | | 11,593 | | |
Total Assets | | | 11,593 | | |
Liabilities | |
Forward foreign currency exchange contracts | | | 20,989 | | |
Total Liabilities | | | 20,989 | | |
Total Financial and Derivative Net Assets | | | (9,396 | ) | |
Total collateral received (pledged)(a) | | | — | | |
Net Amount(b) | | | (9,396 | ) | |
(a) In some instances, the actual collateral received and/or pledged may be more than the amount shown due to overcollateralization.
(b) Represents the net amount due from/(to) counterparties in the event of default.
Columbia Capital Allocation Moderate Aggressive Portfolio
| | Citigroup ($) | |
Assets | |
Forward foreign currency exchange contracts | | | 7,228 | | |
Total Assets | | | 7,228 | | |
Liabilities | |
Forward foreign currency exchange contracts | | | 14,135 | | |
Total Liabilities | | | 14,135 | | |
Total Financial and Derivative Net Assets | | | (6,907 | ) | |
Total collateral received (pledged)(a) | | | — | | |
Net Amount(b) | | | (6,907 | ) | |
(a) In some instances, the actual collateral received and/or pledged may be more than the amount shown due to overcollateralization.
(b) Represents the net amount due from/(to) counterparties in the event of default.
Columbia Capital Allocation Aggressive Portfolio
| | JPMorgan ($) | |
Assets | |
Forward foreign currency exchange contracts | | | 8,964 | | |
Total Assets | | | 8,964 | | |
Liabilities | |
Forward foreign currency exchange contracts | | | 17,629 | | |
Total Liabilities | | | 17,629 | | |
Total Financial and Derivative Net Assets | | | (8,665 | ) | |
Total collateral received (pledged)(a) | | | — | | |
Net Amount(b) | | | (8,665 | ) | |
(a) In some instances, the actual collateral received and/or pledged may be more than the amount shown due to overcollateralization.
(b) Represents the net amount due from/(to) counterparties in the event of default.
Security Transactions
Security transactions are accounted for on the trade date. Cost is determined and gains (losses) are based upon the specific identification method for both financial statement and federal income tax purposes.
Annual Report 2016
158
COLUMBIA CAPITAL ALLOCATION PORTFOLIOS
NOTES TO FINANCIAL STATEMENTS (continued)
January 31, 2016
Income Recognition
Income and capital gain distributions from the Underlying Funds, if any, are recorded on the ex-dividend date.
Corporate actions and dividend income are generally recorded net of any non-reclaimable tax withholdings, on the ex-dividend date or upon receipt of ex-dividend notification in the case of certain foreign securities.
The Funds may receive distributions from holdings in equity securities, business development companies (BDCs), exchange-traded funds, other regulated investment companies (RICs), and real estate investment trusts (REITs), which report information on the tax character of their distributions annually. These distributions are allocated to dividend income, capital gain and return of capital based on actual information reported. Return of capital is recorded as a reduction of the cost basis of securities held. If the Fund no longer owns the applicable securities, return of capital is recorded as a realized gain. With respect to REITs, to the extent actual information has not yet been reported, estimates for return of capital are made by the Fund's management. Management's estimates are subsequently adjusted when the actual character of the distributions is disclosed by the REITs, which could result in a proportionate change in return of capital to shareholders.
Awards from class action litigation are recorded as a reduction of cost basis if the Fund still owns the applicable securities on the payment date. If the Fund no longer owns the applicable securities, the proceeds are recorded as realized gains.
Expenses
General expenses of the Trusts are allocated to the Funds and other funds and other funds of the Trusts based upon relative net assets or other expense allocation methodologies determined by the nature of the expense. Expenses directly attributable to a Fund are charged to that Fund. Expenses directly attributable to a specific class of shares are charged to that share class.
Determination of Class Net Asset Value
All income, expenses (other than class-specific expenses which are charged directly to that share class, as shown in the Statement of Operations) and realized and unrealized gains (losses) are allocated to each class of a Fund on a daily basis, based on the relative net assets of each class, for purposes of determining the net asset value of each class.
Federal Income Tax Status
For federal income tax purposes, each Fund is treated as a separate entity. The Funds intend to qualify each year as separate regulated investment companies under Subchapter M of the Internal Revenue Code, as amended, and will distribute substantially all of their taxable income for their tax year, and as such will not be subject to federal income taxes. In addition, the Funds intend to distribute in each calendar year substantially all of their net investment income, capital gains and certain other amounts, if any, such that the Funds should not be subject to federal excise tax. Therefore, no federal income or excise tax provisions are recorded.
Foreign Taxes
Each Fund may be subject to foreign taxes on income, gains on investments or currency repatriation, a portion of which may be recoverable. The Fund will accrue such taxes and recoveries, as applicable, based upon its current interpretation of tax rules and regulations that exist in the markets in which it invests.
Realized gains in certain countries may be subject to foreign taxes at the Fund level, based on statutory rates. The Fund accrues for such foreign taxes on realized and unrealized gains at the appropriate rate for each jurisdiction, as applicable. The amount, if any, is disclosed as a liability on the Statement of Assets and Liabilities.
Distributions to Shareholders
Distributions from net investment income, if any, are declared and paid quarterly for Columbia Capital Allocation Conservative Portfolio, Columbia Capital Allocation Moderate Conservative Portfolio, Columbia Capital Allocation Moderate Portfolio and Columbia Capital Allocation Moderate Aggressive Portfolio. Distributions from net investment income, if any, are declared and paid annually for Columbia Capital Allocation Aggressive Portfolio. Net realized capital gains, if any, are distributed along with the income dividend. Income distributions and capital gain distributions are determined in accordance with federal income tax regulations, which may differ from GAAP.
Guarantees and Indemnifications
Under the Trusts' organizational documents and, in some cases, by contract, their officers and trustees are indemnified against certain liabilities arising out of the performance of their duties to the Trust or its funds. In addition, certain of the Funds' contracts with their service providers contain general indemnification
Annual Report 2016
159
COLUMBIA CAPITAL ALLOCATION PORTFOLIOS
NOTES TO FINANCIAL STATEMENTS (continued)
January 31, 2016
clauses. The Funds' maximum exposure under these arrangements is unknown since the amount of any future claims that may be made against the Funds cannot be determined, and the Funds have no historical basis for predicting the likelihood of any such claims.
Recent Accounting Pronouncement
Fair Value Measurement (Topic 820), Disclosure for Investments in Certain Entities That Calculate Net Asset Value per Share (or Its Equivalent)
In May 2015, FASB issued Accounting Standards Update (ASU) No. 2015-07, Fair Value Measurement (Topic 820), Disclosure for Investments in Certain Entities That Calculate Net Asset Value per Share (or Its Equivalent). ASU No. 2015-07 changes the disclosure requirements for investments for which fair value is measured using the net asset value per share practical expedient. The disclosure requirements are effective for annual periods beginning after December 15, 2015 and interim periods within those fiscal years. At this time, management is evaluating the implications of this guidance and the impact it will have on the financial statement amounts and footnote disclosures, if any.
Note 3. Fees and Other Transactions with Affiliates
Investment Management Fees and Underlying Fund Fees
Under an Investment Management Services Agreement, the Investment Manager determines which securities will be purchased, held or sold. The investment management fee for the Funds is an annual fee that is a blend of (i) 0.00% on assets invested in Columbia proprietary funds that pay an investment management fee to the Investment Manager, (ii) 0.10% on assets invested in non-exchange-traded third-party advised mutual funds and (iii) 0.55% on assets invested in all other securities, including other funds advised by the Investment Manager that do not pay an investment management fee, exchange-traded funds, derivatives and individual securities.
The effective investment management fee rates, net of any waivers, based on each Fund's average daily net assets for the year ended January 31, 2016 were as follows:
Columbia Capital Allocation Conservative Portfolio | | | 0.05 | % | |
Columbia Capital Allocation Moderate Conservative Portfolio | | | 0.05 | | |
Columbia Capital Allocation Moderate Portfolio | | | 0.05 | | |
Columbia Capital Allocation Moderate Aggressive Portfolio | | | 0.07 | | |
Columbia Capital Allocation Aggressive Portfolio | | | 0.06 | | |
In addition to the fees and expenses which the Funds bear directly, the Funds indirectly bear a pro rata share of the fees and expenses of the Underlying Funds in which the Funds invest. Because the Underlying Funds have varied expense and fee levels and the Funds may own different proportions of Underlying Funds at different times, the amount of fees and expenses incurred indirectly by the Funds will vary. These expenses are not reflected in the expenses shown in Statement of Operations and are not included in the ratios to average net assets shown in the Financial Highlights.
Participating Affiliates
The Investment Manager and its investment advisory affiliates (Participating Affiliates) around the world may coordinate in providing services to their clients. Such coordination may include functional leadership of the business (the "Global" business). From time to time the Investment Manager (or any affiliated investment subadviser to the Fund, as the case may be) may engage its Participating Affiliates to provide a variety of services such as investment research, investment monitoring, trading and discretionary investment management (including portfolio management) to certain accounts managed by the Investment Manager, including the Fund. These Participating Affiliates will provide services to the Investment Manager (or any affiliated investment subadviser to the Fund as the case may be) either pursuant to subadvisory agreements, personnel-sharing agreements or similar inter-company arrangements and the Fund will pay no additional fees and expenses as a result of any such arrangements.
These Participating Affiliates, like the Investment Manager, are direct or indirect subsidiaries of Ameriprise Financial and are registered with appropriate respective regulators in their home jurisdictions and, where required, the Securities and Exchange Commission and the Commodity Futures Trading Commission in the United States.
Administration Fees
Under an Administrative Services Agreement, the Investment Manager also serves as the Fund Administrator. Each Fund pays the Fund Administrator an annual fee for administration and accounting services equal to 0.02% of each Fund's average daily net assets.
Other Expenses
Other expenses are for, among other things, miscellaneous expenses of the Fund or the Board, including payments to Board Services Corp., a company providing limited
Annual Report 2016
160
COLUMBIA CAPITAL ALLOCATION PORTFOLIOS
NOTES TO FINANCIAL STATEMENTS (continued)
January 31, 2016
administrative services to the Fund and the Board. That company's expenses include boardroom and office expense, employee compensation, employee health and retirement benefits and certain other expenses. For the year ended January 31, 2016, other expenses paid by the Fund to this company were as follows:
Fund | | Amount ($) | |
Columbia Capital Allocation Conservative Portfolio | | | 1,738 | | |
Columbia Capital Allocation Moderate Conservative Portfolio | | | 2,344 | | |
Columbia Capital Allocation Moderate Portfolio | | | 3,919 | | |
Columbia Capital Allocation Moderate Aggressive Portfolio | | | 4,994 | | |
Columbia Capital Allocation Aggressive Portfolio | | | 2,368 | | |
Compensation of Board Members
Board members, who are not officers or employees of the Investment Manager or Ameriprise Financial, are compensated for their services to the Funds as disclosed in the Statement of Operations. Under a Deferred Compensation Plan (the Plan), these Board members may elect to defer payment of up to 100% of their compensation. Deferred amounts are treated as though equivalent dollar amounts had been invested in shares of certain funds managed by the Investment Manager. Each Fund's liability for these amounts is adjusted for market value changes and remains in the Funds until distributed in accordance with the Plan. All amounts payable under the Plan constitute a general unsecured obligation of the Funds.
Transactions with Affiliates
For the year ended January 31, 2016, the Funds engaged in purchase and/or sale transactions with affiliates and/or accounts that have a common investment manager (or affiliated investment managers), common directors/trustees, and/or common officers. Those purchase and sale transactions complied with provisions of Rule 17a-7 under the 1940 Act and for each Fund aggregated to:
Fund | | Purchases ($) | | Sales ($) | | Realized gain
from sale
transactions ($) | |
Columbia Capital Allocation Conservative Portfolio | | | 0 | | | | 149,624 | | | | 10,088 | | |
Columbia Capital Allocation Moderate Conservative Portfolio | | | 1,901 | | | | 253,489 | | | | 16,586 | | |
Columbia Capital Allocation Moderate Portfolio | | | 0 | | | | 1,204,947 | | | | 75,489 | | |
Columbia Capital Allocation Moderate Aggressive Portfolio | | | 0 | | | | 1,353,663 | | | | 91,428 | | |
Columbia Capital Allocation Aggressive Portfolio | | | 0 | | | | 583,159 | | | | 38,743 | | |
Transfer Agency Fees
Under a Transfer and Dividend Disbursing Agent Agreement, Columbia Management Investment Services Corp. (the Transfer Agent), an affiliate of the Investment Manager and a wholly-owned subsidiary of Ameriprise Financial, is responsible for providing transfer agency services to the Fund. The Transfer Agent has contracted with Boston Financial Data Services (BFDS) to serve as sub-transfer agent.
The Transfer Agent receives a monthly transfer agency fee based on the number or the average value of accounts, depending on the type of account. In addition, the Transfer Agent also receives sub-transfer agency fees based on a percentage of the average aggregate value of the Fund's shares maintained in omnibus accounts (other than omnibus accounts for which American Enterprise Investment Services Inc. is the broker of record or accounts where the beneficial shareholder is a customer of Ameriprise Financial Services, Inc., for which the
Transfer Agent receives a per account fee). The Transfer Agent pays the fees of BFDS for services as sub-transfer agent and is not entitled to reimbursement for such fees from the Fund (with the exception of out-of-pocket fees).
The Transfer Agent also receives compensation from the Fund for various shareholder services and reimbursements for certain out-of-pocket fees. Total transfer agency fees for Class K and Class R5 shares are subject to an annual limitation of not more than 0.05% of the average daily net assets attributable to each share class. Class Y shares do not pay transfer agency fees.
Annual Report 2016
161
COLUMBIA CAPITAL ALLOCATION PORTFOLIOS
NOTES TO FINANCIAL STATEMENTS (continued)
January 31, 2016
For the year ended January 31, 2016, the Funds' effective transfer agency fee rates as a percentage of average daily net assets of each class were as follows:
Fund | | Class A
(%) | | Class B
(%) | | Class C
(%) | | Class K
(%) | | Class R
(%) | | Class R4
(%) | | Class R5
(%) | | Class T
(%) | | Class Z
(%) | |
Columbia
Capital
Allocation
Conservative
Portfolio | | | 0.12 | | | | 0.12 | | | | 0.12 | | | | 0.05 | | | | 0.12 | | | | 0.12 | | | | 0.05 | | | | — | | | | 0.12 | | |
Columbia
Capital
Allocation
Moderate
Conservative
Portfolio | | | 0.12 | | | | 0.12 | | | | 0.12 | | | | 0.05 | | | | 0.12 | | | | 0.12 | | | | 0.05 | | | | — | | | | 0.12 | | |
Columbia
Capital
Allocation
Moderate
Portfolio | | | 0.11 | | | | 0.11 | | | | 0.11 | | | | 0.05 | | | | 0.11 | | | | 0.11 | | | | 0.05 | | | | — | | | | 0.11 | | |
Columbia
Capital
Allocation
Moderate
Aggressive
Portfolio | | | 0.15 | | | | 0.15 | | | | 0.15 | | | | 0.05 | | | | 0.15 | | | | 0.15 | | | | 0.05 | | | | 0.15 | | | | 0.15 | | |
Columbia
Capital
Allocation
Aggressive
Portfolio | | | 0.13 | | | | 0.13 | | | | 0.13 | | | | 0.05 | | | | 0.13 | | | | 0.12 | | | | 0.05 | | | | — | | | | 0.13 | | |
An annual minimum account balance fee of $20 may apply to certain accounts with a value below the applicable share class's initial minimum investment requirements to reduce the impact of small accounts on transfer agency fees. These minimum account balance fees are remitted to the Fund and recorded as part of expense reductions in the Statement of Operations.
For the year ended January 31, 2016, these minimum account balance fees reduced total expenses as follows:
Fund | | Amount ($) | |
Columbia Capital Allocation Conservative Portfolio | | | 20 | | |
Columbia Capital Allocation Moderate Conservative Portfolio | | | 140 | | |
Columbia Capital Allocation Moderate Portfolio | | | 80 | | |
Columbia Capital Allocation Moderate Aggressive Portfolio | | | 10,788 | | |
Columbia Capital Allocation Aggressive Portfolio | | | 180 | | |
Plan Administration Fees
Under a Plan Administration Services Agreement with the Transfer Agent, each Fund pays an annual fee at a rate of 0.25% of the Fund's average daily net assets attributable to Class K shares for the provision of various
administrative, recordkeeping, communication and educational services.
Distribution and Service Fees
The Funds have an agreement with Columbia Management Investment Distributors, Inc. (the Distributor), an affiliate of the Investment Manager and a wholly-owned subsidiary of Ameriprise Financial, for distribution and shareholder services. The Board has approved and the Fund has adopted, distribution and shareholder service plans (the Plans) applicable to certain share classes, which set the distribution and service fees for the Fund. These fees are calculated daily and are intended to compensate the Distributor and/or eligible selling and/or servicing agents for selling shares of the Funds and providing services to investors.
Under the Plans, each Fund pays a monthly fee to the Distributor at the annual rates of up to 0.25% of each Fund's average daily net assets attributable to Class A shares, up to 1.00% of each Fund's average daily net assets attributable to Class B and Class C shares and up to 0.50% of each Fund's average daily net assets attributable to Class R shares (of which up to 0.25% may be used for shareholder services for Columbia Capital Allocation Conservative Portfolio, Columbia Capital Allocation Moderate Portfolio and Columbia Capital Allocation Aggressive Portfolio).
For Class B and Class C shares of the Funds, of 1.00% fee, up to 0.75% is reimbursed for distribution expenses.
The amount of distribution expenses incurred by the Distributor and not yet reimbursed (unreimbursed expense) for each Fund was approximately as follows:
Fund | | Class B ($) | | Class C ($) | |
Columbia Capital Allocation
Conservative Portfolio | | | 1,594,000 | | | | 246,000 | | |
Columbia Capital Allocation
Moderate Conservative Portfolio | | | 2,726,000 | | | | 414,000 | | |
Columbia Capital Allocation
Moderate Portfolio | | | 5,109,000 | | | | 1,594,000 | | |
Columbia Capital Allocation
Moderate Aggressive Portfolio | | | 4,543,000 | | | | 1,177,000 | | |
Columbia Capital Allocation
Aggressive Portfolio | | | 1,360,000 | | | | 299,000 | | |
These amounts are based on the most recent information available as of September 30, 2015, and may be recovered from future payments under the distribution plan or CDSCs. To the extent the unreimbursed expense has been fully recovered, the distribution fee is reduced.
Annual Report 2016
162
COLUMBIA CAPITAL ALLOCATION PORTFOLIOS
NOTES TO FINANCIAL STATEMENTS (continued)
January 31, 2016
Shareholder Services Fees
Columbia Capital Allocation Moderate Aggressive Portfolio has adopted a shareholder services plan that permits it to pay for certain services provided to Class T shareholders by their selling and/or servicing agents. The Fund may pay shareholder servicing fees up to an aggregate annual rate of 0.50% of the Fund's average daily net assets attributable to Class T shares (comprised of up to 0.25% for shareholder liaison services and up to 0.25% for administrative support services). These fees are contractually limited to an aggregate annual rate of not more than 0.25% of the Fund's average daily net assets attributable to Class T shares. The effective shareholder services fee rate for the year ended January 31, 2016 was 0.25 of the Fund's average daily net assets attributable to Class T shares.
Sales Charges
Sales charges, including front-end and CDSCs, received by the Distributor for distributing each Fund's shares for the year ended January 31, 2016, are as follows:
Fund | | Class A
($) | | Class B
($) | | Class C
($) | | Class T
($) | |
Columbia Capital
Allocation Conservative
Portfolio | | | 232,631 | | | | 1.098 | | | | 2,946 | | | | — | | |
Columbia Capital
Allocation Moderate
Conservative Portfolio | | | 563,692 | | | | 1,188 | | | | 6,616 | | | | — | | |
Columbia Capital
Allocation Moderate
Portfolio | | | 2,020,872 | | | | 5,189 | | | | 17,995 | | | | — | | |
Columbia Capital
Allocation Moderate
Aggressive Portfolio | | | 2,409,967 | | | | 5,834 | | | | 16,337 | | | | 13,722 | | |
Columbia Capital
Allocation Aggressive
Portfolio | | | 1,219,905 | | | | 2,534 | | | | 8,787 | | | | — | | |
Expenses Waived/Reimbursed by the Investment Manager and its Affiliates
The Investment Manager and certain of its affiliates have contractually agreed to waive fees and/or reimburse expenses (excluding certain fees and expenses described below), so that each Fund's net operating expenses, after giving effect to fees waived/expenses reimbursed and any balance credits and/or overdraft
charges from the Fund's custodian, do not exceed the annual rates of:
| | | Contractual Expense Cap
July 1, 2015
Through
May 31, 2016 | |
Fund | | Class A
(%) | | Class B
(%) | | Class C
(%) | | Class K
(%) | | Class R
(%) | | Class R4
(%) | | Class R5
(%) | | Class T
(%) | | Class Y
(%) | | Class Z
(%) | |
Columbia
Capital
Allocation
Conservative
Portfolio | | | 0.51 | | | | 1.26 | | | | 1.26 | | | | 0.46 | | | | 0.76 | | | | 0.26 | | | | 0.21 | | | | N/A | | | | 0.16 | | | | 0.26 | | |
Columbia
Capital
Allocation
Moderate
Conservative
Portfolio | | | 0.51 | | | | 1.26 | | | | 1.26 | | | | 0.46 | | | | 0.76 | | | | 0.26 | | | | 0.21 | | | | N/A | | | | 0.16 | | | | 0.26 | | |
Columbia
Capital
Allocation
Moderate
Portfolio | | | 0.51 | | | | 1.26 | | | | 1.26 | | | | 0.46 | | | | 0.76 | | | | 0.26 | | | | 0.21 | | | | N/A | | | | 0.16 | | | | 0.26 | | |
Columbia
Capital
Allocation
Moderate
Aggressive
Portfolio | | | 0.51 | | | | 1.26 | | | | 1.26 | | | | 0.46 | | | | 0.76 | | | | 0.26 | | | | 0.21 | | | | 0.51 | | | | 0.16 | | | | 0.26 | | |
Columbia
Capital
Allocation
Aggressive
Portfolio | | | 0.51 | | | | 1.26 | | | | 1.26 | | | | 0.46 | | | | 0.76 | | | | 0.26 | | | | 0.21 | | | | N/A | | | | 0.16 | | | | 0.26 | | |
| | Voluntary Expense Cap
June 1, 2015
Through
June 30, 2015 | |
Fund | | Class A
(%) | | Class B
(%) | | Class C
(%) | | Class K
(%) | | Class R
(%) | | Class R4
(%) | | Class R5
(%) | | Class T
(%) | | Class Y
(%) | | Class Z
(%) | |
Columbia
Capital
Allocation
Conservative
Portfolio | | | 0.51 | | | | 1.26 | | | | 1.26 | | | | 0.46 | | | | 0.76 | | | | 0.26 | | | | 0.21 | | | | N/A | | | | 0.16 | | | | 0.26 | | |
Columbia
Capital
Allocation
Moderate
Conservative
Portfolio | | | 0.51 | | | | 1.26 | | | | 1.26 | | | | 0.46 | | | | 0.76 | | | | 0.26 | | | | 0.21 | | | | N/A | | | | 0.16 | | | | 0.26 | | |
Columbia
Capital
Allocation
Moderate
Portfolio | | | 0.51 | | | | 1.26 | | | | 1.26 | | | | 0.46 | | | | 0.76 | | | | 0.26 | | | | 0.21 | | | | N/A | | | | 0.16 | | | | 0.26 | | |
Columbia
Capital
Allocation
Moderate
Aggressive
Portfolio | | | 0.51 | | | | 1.26 | | | | 1.26 | | | | 0.46 | | | | 0.76 | | | | 0.26 | | | | 0.21 | | | | 0.51 | | | | 0.16 | | | | 0.26 | | |
Columbia
Capital
Allocation
Aggressive
Portfolio | | | 0.51 | | | | 1.26 | | | | 1.26 | | | | 0.46 | | | | 0.76 | | | | 0.26 | | | | 0.21 | | | | N/A | | | | 0.16 | | | | 0.26 | | |
Annual Report 2016
163
COLUMBIA CAPITAL ALLOCATION PORTFOLIOS
NOTES TO FINANCIAL STATEMENTS (continued)
January 31, 2016
| | Voluntary Expense Cap
Prior to
June 1, 2015 | |
| Fund | | Class A
(%) | | Class B
(%) | | Class C
(%) | | Class K
(%) | | Class R
(%) | | Class R4
(%) | | Class R5
(%) | | Class T
(%) | | Class Y
(%) | | Class Z
(%) | |
Columbia
Capital
Allocation
Conservative
Portfolio | | | 0.51 | | | | 1.26 | | | | 1.26 | | | | 0.45 | | | | 0.76 | | | | 0.26 | | | | 0.20 | | | | N/A | | | | 0.15 | | | | 0.26 | | |
Columbia
Capital
Allocation
Moderate
Conservative
Portfolio | | | 0.51 | | | | 1.26 | | | | 1.26 | | | | 0.45 | | | | 0.76 | | | | 0.26 | | | | 0.20 | | | | N/A | | | | 0.15 | | | | 0.26 | | |
Columbia
Capital
Allocation
Moderate
Portfolio | | | 0.51 | | | | 1.26 | | | | 1.26 | | | | 0.45 | | | | 0.76 | | | | 0.26 | | | | 0.20 | | | | N/A | | | | 0.15 | | | | 0.26 | | |
Columbia
Capital
Allocation
Moderate
Aggressive
Portfolio | | | 0.51 | | | | 1.26 | | | | 1.26 | | | | 0.45 | | | | 0.76 | | | | 0.26 | | | | 0.20 | | | | 0.51 | | | | 0.15 | | | | 0.26 | | |
Columbia
Capital
Allocation
Aggressive
Portfolio | | | 0.51 | | | | 1.26 | | | | 1.26 | | | | 0.45 | | | | 0.76 | | | | 0.26 | | | | 0.20 | | | | N/A | | | | 0.15 | | | | 0.26 | | |
The contractual agreement may be modified or amended only with approval from all parties. Under the arrangements, the following fees and expenses are excluded from the waiver/reimbursement commitment, and therefore will be paid by the Fund, if applicable: taxes (including foreign transaction taxes), expenses associated with investments in affiliated and non-affiliated pooled investment vehicles (including mutual funds and exchange-traded funds), transaction costs and brokerage commissions, costs related to any securities lending program, dividend and interest expenses associated with securities sold short, inverse floater program fees and expenses, transaction charges and interest on borrowed money, interest and extraordinary expenses. Each Fund's investment management fee is also excluded from the waiver/reimbursement commitment and is therefore paid by the Funds. Any fees waived and/or expenses reimbursed under the expense reimbursement arrangements described above are not recoverable by the Investment Manager or its affiliates in future periods.
Note 4. Federal Tax Information
The timing and character of income and capital gain distributions are determined in accordance with income tax regulations, which may differ from GAAP because of temporary or permanent book to tax differences.
At January 31, 2016, these differences are primarily due to differing treatments for deferral/reversal of wash sale losses, Trustees' deferred compensation, distribution reclassifications, foreign currency transactions, post-October capital losses, re-characterization of distributions for investments and derivative investments. To the extent these differences are permanent, reclassifications are made among the components of the applicable Fund's net assets in the Statement of Assets and Liabilities. Temporary differences do not require reclassifications. In the Statement of Assets and Liabilities the following reclassifications were made:
| Fund | | Undistributed
(Excess of
Distributions
Over) Net
Investment
Income ($) | | Accumulated
Net Realized
Gain (Loss) ($) | | Paid-in Capital
Increase
(Decrease) ($) | |
Columbia Capital Allocation Conservative Portfolio | | | 462,036 | | | | (462,036 | ) | | | — | | |
Columbia Capital Allocation Moderate Conservative Portfolio | | | 1,376,341 | | | | (1,376,341 | ) | | | — | | |
Columbia Capital Allocation Moderate Portfolio | | | 5,993,154 | | | | (5,993,153 | ) | | | (1 | ) | |
Columbia Capital Allocation Moderate Aggressive Portfolio | | | 7,092,646 | | | | (7,092,646 | ) | | | — | | |
Columbia Capital Allocation Aggressive Portfolio | | | 2,860,094 | | | | (2,860,096 | ) | | | 2 | | |
Net investment income (loss) and net realized gains (losses), as disclosed in the Statement of Operations, and net assets were not affected by these reclassifications.
Annual Report 2016
164
COLUMBIA CAPITAL ALLOCATION PORTFOLIOS
NOTES TO FINANCIAL STATEMENTS (continued)
January 31, 2016
The tax character of distributions paid during the years indicated was as follows:
| | Year Ended January 31, 2016 | | Year Ended January 31, 2015 | |
| Fund | | Ordinary
Income ($) | | Long-term
Capital Gains ($) | | Total ($) | | Ordinary
Income ($) | | Long-term
Capital Gains ($) | | Total ($) | |
Columbia Capital Allocation Conservative
Portfolio | | | 5,511,697 | | | | 4,860,552 | | | | 10,372,249 | | | | 6,182,132 | | | | 16,334,725 | | | | 22,516,857 | | |
Columbia Capital Allocation Moderate
Conservative Portfolio | | | 14,425,969 | | | | 18,331,287 | | | | 32,757,256 | | | | 15,263,292 | | | | 49,246,031 | | | | 64,509,323 | | |
Columbia Capital Allocation Moderate
Portfolio | | | 33,388,988 | | | | 86,969,786 | | | | 120,358,774 | | | | 35,250,039 | | | | 143,618,161 | | | | 178,868,200 | | |
Columbia Capital Allocation Moderate
Aggressive Portfolio | | | 44,229,587 | | | | 123,124,048 | | | | 167,353,635 | | | | 46,134,442 | | | | 214,145,186 | | | | 260,279,628 | | |
Columbia Capital Allocation Aggressive
Portfolio | | | 11,902,853 | | | | 43,616,414 | | | | 55,519,267 | | | | 15,101,868 | | | | 46,714,495 | | | | 61,816,363 | | |
Short-term capital gain distributions, if any, are considered ordinary income distributions for tax purposes.
At January 31, 2016, the components of distributable earnings on a tax basis were as follows:
| Fund | | Undistributed
Ordinary Income ($) | | Undistributed
Long-term
Capital Gains ($) | | Net Unrealized
Appreciation
(Depreciation) ($) | |
Columbia Capital Allocation Conservative Portfolio | | | 753,538 | | | | 2,156,875 | | | | (16,186,435 | ) | |
Columbia Capital Allocation Moderate Conservative Portfolio | | | 1,579,709 | | | | 11,459,797 | | | | (32,241,327 | ) | |
Columbia Capital Allocation Moderate Portfolio | | | 2,678,485 | | | | 35,649,693 | | | | (55,610,224 | ) | |
Columbia Capital Allocation Moderate Aggressive Portfolio | | | — | | | | 49,575,049 | | | | (58,028,275 | ) | |
Columbia Capital Allocation Aggressive Portfolio | | | — | | | | 19,026,664 | | | | (20,061,334 | ) | |
At January 31, 2016, the cost of investments for federal income tax purposes along with the aggregate gross unrealized appreciation and depreciation based on that cost was:
| Fund | | Tax Cost ($) | | Gross
Unrealized
Appreciation ($) | | Gross
Unrealized
Depreciation ($) | | Net Appreciation
(Depreciation) ($) | |
Columbia Capital Allocation Conservative Portfolio | | | 283,461,654 | | | | 2,102,561 | | | | (18,288,996 | ) | | | (16,186,435 | ) | |
Columbia Capital Allocation Moderate Conservative Portfolio | | | 650,621,649 | | | | 9,735,725 | | | | (41,977,052 | ) | | | (32,241,327 | ) | |
Columbia Capital Allocation Moderate Portfolio | | | 1,558,874,149 | | | | 45,116,638 | | | | (100,726,862 | ) | | | (55,610,224 | ) | |
Columbia Capital Allocation Moderate Aggressive Portfolio | | | 2,140,340,996 | | | | 78,649,639 | | | | (136,677,914 | ) | | | (58,028,275 | ) | |
Columbia Capital Allocation Aggressive Portfolio | | | 651,862,341 | | | | 31,458,909 | | | | (51,520,243 | ) | | | (20,061,334 | ) | |
For the year ended January 31, 2016, the amount of capital loss carryforward utilized, expired unused and permanently lost were as follows:
Fund | | Utilized ($) | |
Columbia Capital Allocation Moderate Aggressive Portfolio | | | 388,505 | | |
Columbia Capital Allocation Aggressive Portfolio | | | 7,841 | | |
Annual Report 2016
165
COLUMBIA CAPITAL ALLOCATION PORTFOLIOS
NOTES TO FINANCIAL STATEMENTS (continued)
January 31, 2016
Under current tax rules, regulated investment companies can elect to treat certain late-year ordinary losses incurred and post-October capital losses (capital losses realized after October 31) as arising on the first day of the following taxable year. As of January 31, 2016, the Funds will elect to treat the following late-year ordinary losses and post-October capital losses as arising on February 1, 2016:
| Fund | | Post-October
Capital
Losses ($) | |
Columbia Capital Allocation Moderate Aggressive Portfolio | | | 1,192,719 | | |
Columbia Capital Allocation Aggressive Portfolio | | | 188,131 | | |
Management of the Funds has concluded that there are no significant uncertain tax positions in the Funds that would require recognition in the financial statements. However, management's conclusion may be subject to review and adjustment at a later date based on factors including, but not limited to, new tax laws, regulations, and administrative interpretations (including relevant court decisions). Generally, the Funds' federal tax returns for the prior three fiscal years remain subject to examination by the Internal Revenue Service.
Note 5. Portfolio Information
For the year ended January 31, 2016, the cost of purchases and proceeds from sales of investments in the Underlying Funds, excluding investments in money market funds and derivatives, if any, for each Fund aggregated to:
| | | Other Investment Securities | |
Fund | | Purchases ($) | | Proceeds ($) | |
Columbia Capital Allocation Conservative Portfolio | | | 67,531,922 | | | | 63,086,990 | | |
Columbia Capital Allocation Moderate Conservative Portfolio | | | 165,635,297 | | | | 125,349,878 | | |
Columbia Capital Allocation Moderate Portfolio | | | 326,972,463 | | | | 258,658,837 | | |
Columbia Capital Allocation Moderate Aggressive Portfolio | | | 361,907,387 | | | | 313,530,276 | | |
Columbia Capital Allocation Aggressive Portfolio | | | 144,232,189 | | | | 70,998,228 | | |
The amount of purchase and sale activity impacts the portfolio turnover rate reported in the Financial Highlights.
Note 6. Affiliated Money Market Fund
Each Fund may invest in Columbia Short-Term Cash Fund, an affiliated money market fund established for the exclusive use by each Fund and other affiliated Funds. The income earned by the Funds from such investments is included as Dividends — affiliated issuers in the Statement of Operations. As an investing fund, each Fund indirectly bears its proportionate share of the expenses of Columbia Short-Term Cash Fund.
Note 7. Line of Credit
Each Fund has access to a revolving credit facility whereby the Funds may borrow for the temporary funding of shareholder redemptions or for other temporary or emergency purposes. Effective December 8, 2015, Citibank, N.A. and HSBC Bank USA, N.A. joined JPMorgan Chase bank, N.A. (JPMorgan) as lead of a syndicate of banks under the credit facility, which is a collective agreement between the Funds and certain other funds
managed by the Investment Manager, severally and not jointly, that permits collective borrowings up to $1 billion. Interest is charged to each participating fund based on its borrowings at a rate equal to the higher of (i) the overnight federal funds rate plus 1.00% or (ii) the one-month LIBOR rate plus 1.00%. Each borrowing under the credit facility matures no later than 60 days after the date of borrowing. Each Fund also pays a commitment fee equal to its pro rata share of the amount of the credit facility at a rate of 0.15% per annum. The commitment fee is included in other expenses in the Statement of Operations. Prior to December 8, 2015, JPMorgan was the sole lead bank under the credit facility agreement that permitted borrowings up to $550 million under the same terms and interest rates as described above with the exception of the commitment fee which was charged at a rate of 0.075% per annum.
No Fund had borrowings during the year ended January 31, 2016.
Annual Report 2016
166
COLUMBIA CAPITAL ALLOCATION PORTFOLIOS
NOTES TO FINANCIAL STATEMENTS (continued)
January 31, 2016
Note 8. Significant Risks
Shareholder Concentration Risk
At January 31, 2016, certain shareholder accounts owned more than 10% of the outstanding shares of one or more of the Funds. For unaffiliated shareholder accounts, the Funds have no knowledge about whether any portion of those shares were owned beneficially. Subscription and redemption activity of these accounts
may have a significant effect on the operations of the Funds. In the case of a large redemption, the Fund may be forced to sell investments at inopportune times, including its liquid or more liquid positions, resulting in Fund losses and the Fund holding a higher percentage of less liquid or illiquid securities. Large redemptions could result in decreased economies of scale and increased operating expenses for non-redeeming Fund shareholders.
The number of accounts and aggregate percentages of shares outstanding held therein were as follows:
Fund | | Number of
Unaffiliated
Accounts | | Percentage of
Shares
Outstanding
Held —
Unaffiliated (%) | | Percentage of
Shares
Outstanding
Held —
Affiliated (%) | |
Columbia Capital Allocation Conservative Portfolio | | | — | | | | — | | | | 84.4 | | |
Columbia Capital Allocation Moderate Conservative Portfolio | | | — | | | | — | | | | 79.5 | | |
Columbia Capital Allocation Moderate Portfolio | | | — | | | | — | | | | 94.1 | | |
Columbia Capital Allocation Moderate Aggressive Portfolio | | | 1 | | | | 14.9 | | | | 57.4 | | |
Columbia Capital Allocation Aggressive Portfolio | | | — | | | | — | | | | 91.6 | | |
Note 9. Subsequent Events
Management has evaluated the events and transactions that have occurred through the date the financial statements were issued and noted no items requiring adjustment of the financial statements or additional disclosure.
Note 10. Information Regarding Pending and Settled Legal Proceedings
In December 2005, without admitting or denying the allegations, American Express Financial Corporation (AEFC, which is now known as Ameriprise Financial, Inc. (Ameriprise Financial)) entered into settlement agreements with the Securities and Exchange Commission (SEC) and Minnesota Department of Commerce (MDOC) related to market timing activities. As a result, AEFC was censured and ordered to cease and desist from committing or causing any violations of certain provisions of the Investment Advisers Act of 1940, the Investment Company Act of 1940, and various Minnesota laws. AEFC agreed to pay disgorgement of $10 million and civil money penalties of $7 million. AEFC also agreed to retain an independent distribution consultant to assist in developing a plan for distribution
of all disgorgement and civil penalties ordered by the SEC in accordance with various undertakings detailed at http://www.sec.gov/litigation/admin/ia-2451.pdf. Ameriprise Financial and its affiliates have cooperated with the SEC and the MDOC in these legal proceedings, and have made regular reports to the Funds' Boards of Trustees.
Ameriprise Financial and certain of its affiliates have historically been involved in a number of legal, arbitration and regulatory proceedings, including routine litigation, class actions, and governmental actions, concerning matters arising in connection with the conduct of their business activities. Ameriprise Financial believes that the Funds are not currently the subject of, and that neither Ameriprise Financial nor any of its affiliates are the subject of, any pending legal, arbitration or regulatory proceedings that are likely to have a material adverse effect on the Funds or the ability of Ameriprise Financial or its affiliates to perform under their contracts with the Funds. Ameriprise Financial is required to make quarterly (10-Q), annual (10-K) and, as necessary, 8-K filings with the SEC on legal and regulatory matters that relate to Ameriprise Financial and its affiliates. Copies of these filings may be obtained by accessing the SEC website at www.sec.gov.
Annual Report 2016
167
COLUMBIA CAPITAL ALLOCATION PORTFOLIOS
NOTES TO FINANCIAL STATEMENTS (continued)
January 31, 2016
There can be no assurance that these matters, or the adverse publicity associated with them, will not result in increased fund redemptions, reduced sale of fund shares or other adverse consequences to the Funds. Further, although we believe proceedings are not likely to have a material adverse effect on the Funds or the ability of Ameriprise Financial or its affiliates to perform under their contracts with the Funds, these proceedings are subject to uncertainties and, as such, we are unable to estimate the possible loss or range of loss that may result. An adverse outcome in one or more of these proceedings could result in adverse judgments, settlements, fines, penalties or other relief that could have a material adverse effect on the consolidated financial condition or results of operations of Ameriprise Financial.
Annual Report 2016
168
COLUMBIA CAPITAL ALLOCATION PORTFOLIOS
REPORT OF INDEPENDENT REGISTERED PUBLIC ACCOUNTING FIRM
To the Trustees of Columbia Funds Variable Series Trust and the Shareholders of
Columbia Capital Allocation Moderate Conservative Portfolio and
Columbia Capital Allocation Moderate Aggressive Portfolio
In our opinion, the accompanying statement of assets and liabilities, including the portfolio of investments, and the related statements of operations and of changes in net assets and the financial highlights present fairly, in all material respects, the financial position of Columbia Capital Allocation Moderate Conservative Portfolio and Columbia Capital Allocation Moderate Aggressive Portfolio (the "Funds," constituting part of Columbia Funds Variable Series Trust) at January 31, 2016, the results of each of their operations, the changes in each of their net assets and the financial highlights for each of the period indicated, in conformity with accounting principles generally accepted in the United States of America. These financial statements and financial highlights (hereafter referred to as "financial statements") are the responsibility of the Funds' management. Our responsibility is to express an opinion on these financial statements based on our audits. We conducted our audits of these financial statements in accordance with the standards of the Public Company Accounting Oversight Board (United States). Those standards require that we plan and perform the audit to obtain reasonable assurance about whether the financial statements are free of material misstatement. An audit includes examining, on a test basis, evidence supporting the amounts and disclosures in the financial statements, assessing the accounting principles used and significant estimates made by management, and evaluating the overall financial statement presentation. We believe that our audits, which included confirmation of securities at January 31, 2016 by correspondence with the custodian, brokers and transfer agent, and the application of alternative auditing procedures where such confirmations had not been received, provide a reasonable basis for our opinion.
PricewaterhouseCoopers LLP
Minneapolis, MN
March 23, 2016
To the Trustees of Columbia Funds Variable Series Trust II and the Shareholders of
Columbia Capital Allocation Conservative Portfolio, Columbia Capital Allocation Moderate Portfolio and Columbia Capital Allocation Aggressive Portfolio
In our opinion, the accompanying statement of assets and liabilities, including the portfolio of investments, and the related statements of operations and of changes in net assets and the financial highlights present fairly, in all material respects, the financial position of Columbia Capital Allocation Conservative Portfolio, Columbia Capital Allocation Moderate Portfolio and Columbia Capital Allocation Aggressive Portfolio (the "Funds," constituting part of Columbia Funds Variable Series Trust II) at January 31, 2016, the results of each of their operations for the year ended, the changes in each of their net assets for each of the two years in the period then ended and the financial highlights for each of the four years in the period then ended, in conformity with accounting principles generally accepted in the United States of America. These financial statements and financial highlights (hereafter referred to as "financial statements") are the responsibility of the Funds' management. Our responsibility is to express an opinion on these financial statements based on our audits. We conducted our audits of these financial statements in accordance with the standards of the Public Company Accounting Oversight Board (United States). Those standards require that we plan and perform the audit to obtain reasonable assurance about whether the financial statements are free of material misstatement. An audit includes examining, on a test basis, evidence supporting the amounts and disclosures in the financial statements, assessing the accounting principles used and significant estimates made by management, and evaluating the overall financial statement presentation. We believe that our audits, which included confirmation of securities at January 31, 2016 by correspondence with the custodian, brokers and transfer agent, and the application of alternative auditing procedures where such confirmations had not been received, provide a reasonable basis for our opinion. The financial highlights for the Funds for the periods ended on January 31, 2012 were audited by another independent registered public accounting firm whose report dated March 26, 2012 expressed an unqualified opinion on those financial highlights.
PricewaterhouseCoopers LLP
Minneapolis, MN
March 23, 2016
Annual Report 2016
169
COLUMBIA CAPITAL ALLOCATION PORTFOLIOS
FEDERAL INCOME TAX INFORMATION
(Unaudited)
The Funds hereby designate the following tax attributes in the fiscal year ended January 31, 2016. Shareholders will be notified in early 2017 of the amounts for use in preparing 2016 income tax returns.
| | Qualified
Dividend
Income (%) | | Dividends
Received
Deduction (%) | | Capital Gain
Dividend ($) | | Foreign
Taxes Paid ($) | | Foreign
Taxes Paid
Per Share ($) | | Foreign
Source
Income ($) | | Foreign
Source
Income
Per Share ($) | |
Columbia Capital Allocation
Conservative Portfolio | | | 6.45 | | | | 7.67 | | | | 4,971,840 | | | | 24,514 | | | | 0.00 | | | | 339,559 | | | | 0.01 | | |
Columbia Capital Allocation
Moderate Conservative
Portfolio | | | 26.35 | | | | 18.80 | | | | 20,327,881 | | | | 126,811 | | | | 0.00 | | | | 1,483,300 | | | | 0.02 | | |
Columbia Capital Allocation
Moderate Portfolio | | | 37.97 | | | | 27.93 | | | | 82,462,570 | | | | 479,337 | | | | 0.00 | | | | 4,045,949 | | | | 0.03 | | |
Columbia Capital Allocation
Moderate Aggressive Portfolio | | | 48.29 | | | | 36.63 | | | | 106,708,627 | | | | 924,070 | | | | 0.00 | | | | 5,837,312 | | | | 0.03 | | |
Columbia Capital Allocation
Aggressive Portfolio | | | 67.66 | | | | 53.10 | | | | 39,640,733 | | | | 350,311 | | | | 0.01 | | | | 1,749,293 | | | | 0.03 | | |
Qualified Dividend Income. For taxable, non-corporate shareholders, the percentage of ordinary income distributed during the fiscal year that represents qualified dividend income subject to reduced tax rates.
Dividends Received Deduction. The percentage of ordinary income distributed during the fiscal year that qualifies for the corporate dividends received deduction.
Capital Gain Dividend. The Fund designates as a capital gain dividend the amount reflected above, or if subsequently determined to be different, the net capital gain of such fiscal period.
Foreign Taxes. The Fund makes the election to pass through to shareholders the foreign taxes paid. Eligible shareholders may claim a foreign tax credit. These taxes, and the corresponding foreign source income, are provided.
Annual Report 2016
170
COLUMBIA CAPITAL ALLOCATION PORTFOLIOS
Shareholders elect the Board that oversees the Fund's operations. The Board appoints officers who are responsible for day-to-day business decisions based on policies set by the Board. The following table provides basic biographical information about the Fund's Trustees, including their principal occupations during the past five years, although specific titles for individuals may have varied over the period. Under current Board policy, members generally may serve through the end of the calendar year in which he or she reaches either the mandatory retirement age established by the Board or the fifteenth anniversary of the first Board meeting they attended as a member of the Board.
Trustees
Independent Trustees
Name,
Address,
Year of Birth | | Position Held With
the Funds and Length of
Service | | Principal Occupation(s)
During the Past Five Years
and Other Relevant
Professional Experience | | Number of
Funds in the
Columbia
Funds Complex
Overseen | | Other Directorships
Held by Trustee
During the Past
Five Years | |
Kathleen Blatz
901 S. Marquette Ave.
Minneapolis, MN 55402
1954 | | Trustee since 1/06 for RiverSource Funds and since 6/11 for Nations Funds | | Attorney; specializing in arbitration and mediation; Chief Justice, Minnesota Supreme Court, 1998-2006; Associate Justice, Minnesota Supreme Court, 1996-1998; Fourth Judicial District Court Judge, Hennepin County, 1994-1996; Attorney in private practice and public service, 1984-1993; State Representative, Minnesota House of Representatives, 1979-1993, which included service on the Tax and Financial Institutions and Insurance Committees | | | 124 | | | Trustee, BlueCross BlueShield of Minnesota (Chair of the Business Development Committee) since 2009; Chair of the Robina Foundation since August 2013 | |
Edward J. Boudreau, Jr.
901 S. Marquette Ave.
Minneapolis, MN 55402
1944 | | Trustee since 6/11 for RiverSource Funds and since 1/05 for Nations Funds | | Managing Director, E.J. Boudreau & Associates (consulting) since 2000; FINRA Industry Arbitrator, 2002-present; Chairman and Chief Executive Officer, John Hancock Funds (asset management), Chairman and Interested Trustee for open-end and closed-end funds offered by John Hancock, 1989-2000; John Hancock Life Insurance Company, including SVP and Treasurer and SVP Information Technology, 1968-1988 | | | 122 | | | Former Trustee, Boston Museum of Science (Chair of Finance Committee), 1985-2013; former Trustee, BofA Funds Series Trust (11 funds), 2005-2011 | |
Pamela G. Carlton
901 S. Marquette Ave.
Minneapolis, MN 55402
1954 | | Trustee since 7/07 for RiverSource Funds and since 6/11 for Nations Funds | | President, Springboard-Partners in Cross Cultural Leadership (consulting company) since 2003; Managing Director of US Equity Research, JP Morgan Chase, 1999-2003; Director of US Equity Research, Chase Asset Management, 1996-1999; Co-Director Latin America Research, 1993-1996, COO Global Research, 1992-1996, Co-Director of US Research, 1991-1992, Investment Banker, Morgan Stanley, 1982-1991 | | | 124 | | | Trustee, New York Presbyterian Hospital Board (Executive Committee and Chair of Human Resources Committee) since 1996 | |
Annual Report 2016
171
COLUMBIA CAPITAL ALLOCATION PORTFOLIOS
TRUSTEES AND OFFICERS (continued)
Independent Trustees (continued)
Name,
Address,
Year of Birth | | Position Held With
the Funds and Length of
Service | | Principal Occupation(s)
During the Past Five Years
and Other Relevant
Professional Experience | | Number of
Funds in the
Columbia
Funds Complex
Overseen | | Other Directorships
Held by Trustee
During the Past
Five Years | |
William P. Carmichael
901 S. Marquette Ave.
Minneapolis, MN 55402
1943 | | Trustee since 6/11 for RiverSource Funds and since 2003 for Nations Funds; Chair of the Board from 1/14-11/15 | | Retired; Co-founder, The Succession Fund (provides exit strategies to owners of privately held companies), 1998-2007; Adjunct Professor of Finance, Kelley School of Business, Indiana University, 1993-2007; Senior Vice President, Sara Lee Corporation, 1991-1993; Senior Vice President and Chief Financial Officer, Beatrice Foods Company, 1984-1990; Vice President, Esmark, Inc., 1973-1984; Associate, Price Waterhouse, 1968-1972 | | | 124 | | | Director, The Finish Line (athletic shoes and apparel) since July 2003; Director, International Textile Corp. since 2012; Director, hhgregg since May, 2015; former Director, Cobra Electronics Corporation (electronic equipment manufacturer), 1994-August 2014; former Director, Spectrum Brands, Inc. (consumer products), 2002-2009; former Director, Simmons Company (bedding), 2004-2010; former Trustee, BofA Funds Series Trust (11 funds), 2009-2011; former Director, McMoRan Exploration Company (oil and gas exploration and development), 2010-2013 | |
Patricia M. Flynn
901 S. Marquette Ave.
Minneapolis, MN 55402
1950 | | Trustee since 11/04 for RiverSource Funds and since 6/11 for Nations Funds | | Trustee Professor of Economics and Management, Bentley University since 1976 (also teaches and conducts research on corporate governance); Dean, McCallum Graduate School of Business, Bentley University, 1992-2002 | | | 124 | | | Trustee, MA Taxpayers Foundation since 1997; Board of Governors, Innovation Institute, MA Technology Collaborative since 2010 | |
William A. Hawkins
901 S. Marquette Ave.
Minneapolis, MN 55402
1942 | | Chair of the Board since 11/15; Trustee since 6/11 for RiverSource Funds and since 1/05 for Nations Funds | | Managing Director, Overton Partners (financial consulting) since August 2010; President and Chief Executive Officer, California General Bank, N.A., January 2008-August 2010; Operation Hope, COO, 2004-2007; IndyMac Bancorp, President, CBG, 1999-2003; American General Bank, President, 1997-1999; Griffin Financial Services, CEO, 1981-1997; The Griffin Funds, CEO, 1992-1998 | | | 124 | | | Former Trustee, BofA Funds Series Trust (11 funds), 2009-2015 | |
R. Glenn Hilliard
901 S. Marquette Ave.
Minneapolis, MN 55402
1943 | | Trustee since 6/11 for RiverSource Funds and since 1/05 for Nations Funds | | Chairman and Chief Executive Officer, Hilliard Group LLC (investing and consulting) since April 2003; Non-Executive Director & Chairman, CNO Financial Group, Inc. (insurance), 2003-2011; Chair & CEO, ING Americas, 1996-2003 | | | 122 | | | Chairman, BofA Funds Series Trust (11 funds); former Director, CNO Financial Group, Inc. (insurance), 2003-2011 | |
Annual Report 2016
172
COLUMBIA CAPITAL ALLOCATION PORTFOLIOS
TRUSTEES AND OFFICERS (continued)
Independent Trustees (continued)
Name,
Address,
Year of Birth | | Position Held With
the Funds and Length of
Service | | Principal Occupation(s)
During the Past Five Years
and Other Relevant
Professional Experience | | Number of
Funds in the
Columbia
Funds Complex
Overseen | | Other Directorships
Held by Trustee
During the Past
Five Years | |
Catherine James Paglia
901 S. Marquette Ave.
Minneapolis, MN 55402
1952 | | Trustee since 11/04 for RiverSource Funds and since 6/11 for Nations Funds | | Director, Enterprise Asset Management, Inc. (private real estate and asset management company) since September 1998; Managing Director and Partner, Interlaken Capital, Inc., 1989-1997; Managing Director, Morgan Stanley, 1982-1989; Vice President, Investment Banking, 1980-1982, Associate, Investment Banking, 1976-1980, Dean Witter Reynolds, Inc. | | | 124 | | | Director, Valmont Industries, Inc. (irrigation systems manufacturer) since 2012; Trustee, Carleton College (on the Investment Committee); Trustee, Carnegie Endowment for International Peace (on the Investment Committee) | |
Leroy C. Richie
901 S. Marquette Ave.
Minneapolis, MN 55402
1941 | | Trustee since 2000 for Seligman Funds, since 11/08 for RiverSource Funds and since 6/11 for Nations Funds | | Counsel, Lewis & Munday, P.C. (law firm) since 2004; Vice President and General Counsel, Automotive Legal Affairs, Chrysler Corporation, 1993-1997 | | | 124 | | | Lead Outside Director, Infinity Resources, Inc. (oil and gas exploration and production) since 1994; Lead Outside Director, Digital Ally, Inc. (digital imaging) since September 2005; Trustee, Marygrove College (Chair of Finance Committee) since 2007; former Director, OGE Energy Corp. (energy and energy services), 2007-2014 | |
Minor M. Shaw
901 S. Marquette Ave.
Minneapolis, MN 55402
1947 | | Trustee since 6/11 for RiverSource Funds and since 2003 for Nations Funds | | President, Micco LLC (private investments) since 2011; President, Micco Corp. (family investment business), 1998-2011 | | | 122 | | | Director, Piedmont Natural Gas; Director, BlueCross BlueShield of South Carolina since April 2008; Chair of the Duke Endowment; Director, National Association of Corporate Directors, Carolinas Chapter since 2013; Chair of Greenville — Spartanburg Airport Commission; former Trustee, BofA Funds Series Trust (11 funds), 2003-2011 | |
Alison Taunton-Rigby
901 S. Marquette Ave.
Minneapolis, MN 55402
1944 | | Trustee since 11/02 for RiverSource Funds and since 6/11 for Nations Funds | | Managing Director, Forester Biotech (consulting), 2001-2003; Chief Executive Officer and Director, RiboNovix, Inc., (biotechnology), 2003-2010; President and Chief Executive Officer of CMT Inc., 2001-2003; Aquila Biopharmaceuticals Inc., 1996-2000; Cambridge Biotech Corporation, 1995-1996; Mitotix Inc., 1993-1994 | | | 124 | | | Director, Abt Associates (government contractor) since 2001; Director, Boston Children's Hospital since 2002; Director, Healthways, Inc. (health and well-being solutions) since 2005; Director, ICI Mutual Insurance Company since 2011 | |
Annual Report 2016
173
COLUMBIA CAPITAL ALLOCATION PORTFOLIOS
TRUSTEES AND OFFICERS (continued)
Interested Trustee Not Affiliated with Investment Manager*
Name,
Address,
Year of Birth | | Position Held With
Funds and Length of
Service | | Principal Occupation(s)
During Past Five Years
and Other Relevant
Professional Experience | | Number of
Funds in the
Fund Family
Overseen by
Board Member | | Other Present or Past
Directorships/
Trusteeships
(Within Past 5 Years) | |
Anthony M. Santomero
901 S. Marquette Ave.
Minneapolis, MN 55402
1946 | | Trustee since 6/11 for RiverSource Funds and since 1/08 for Nations Funds | | Richard K. Mellon Professor Emeritus of Finance, The Wharton School, University of Pennsylvania since 2002; Senior Advisor, McKinsey & Company (consulting), 2006-2008; President, Federal Reserve Bank of Philadelphia, 2000-2006; Professor of Finance, The Wharton School, University of Pennsylvania, 1972-2002 | | | 122 | | | Trustee, Penn Mutual Life Insurance Company since March 2008; Director, Renaissance Reinsurance Ltd. since May 2008; Director, Citigroup Inc. since 2009; Director, Citibank, N.A. since 2009; former Trustee, BofA Funds Series Trust (11 funds), 2008-2011 | |
* Dr. Santomero is not an affiliated person of the Investment Manager or Ameriprise Financial. However, he is currently deemed by the Funds to be an "interested person" (as defined in the 1940 Act) of the Funds because he serves as a Director of Citigroup Inc. and Citibank, N.A., companies that may directly or through subsidiaries and affiliates engage from time-to-time in brokerage execution, principal transactions and lending relationships with the Funds or accounts advised/managed by the Investment Manager.
Annual Report 2016
174
COLUMBIA CAPITAL ALLOCATION PORTFOLIOS
TRUSTEES AND OFFICERS (continued)
Interested Trustee Affiliated with Investment Manager*
Name,
Address,
Year of Birth | | Position Held With
the Funds and Length of
Service | | Principal Occupation(s)
During Past Five Years
and Other Relevant
Professional Experience | | Number of
Funds in the
Columbia
Funds Complex
Overseen | | Other Directorships
Held by Trustee
During the Past
Five Years | |
William F. Truscott
c/o Columbia Management Investment Advisers, LLC,
225 Franklin St.
Boston, MA 02110
1960 | | Trustee since 11/01 for RiverSource Funds and since 6/11 for Nations Funds; Senior Vice President since 2002 for RiverSource Funds and since 5/10 for Nations Funds | | Chairman of the Board and President, Columbia Management Investment Advisers, LLC since May 2010 and February 2012, respectively (previously President and Chief Investment Officer, 2001-April 2010); Chief Executive Officer, Global Asset Management, Ameriprise Financial, Inc. since September 2012 (previously Chief Executive Officer, U.S. Asset Management & President, Annuities, May 2010-September 2012 and President — U.S. Asset Management and Chief Investment Officer, 2005-April 2010); Director and Chief Executive Officer, Columbia Management Investment Distributors, Inc. since May 2010 and February 2012, respectively (previously Chairman of the Board and Chief Executive Officer, 2006-April 2010); Chairman of the Board and Chief Executive Officer, RiverSource Distributors, Inc. since 2006; Director, Threadneedle Asset Management Holdings, SARL since 2014; President and Chief Executive Officer, Ameriprise Certificate Company, 2006-August 2012. | | | 182 | | | Chairman of the Board, Columbia Management Investment Advisers, LLC since May 2010; Director, Columbia Management Investment Distributors, Inc. since May 2010; Former Director, Ameriprise Certificate Company, 2006-January 2013 | |
* Interested person (as defined under the 1940 Act) by reason of being an officer, director, security holder and/or employee of the Investment Manager or Ameriprise Financial.
The Statement of Additional Information has additional information about the Fund's Board members and is available, without charge, upon request by calling 800.345.6611; contacting your financial intermediary; or visiting columbiathreadneedle.com/us.
Annual Report 2016
175
COLUMBIA CAPITAL ALLOCATION PORTFOLIOS
TRUSTEES AND OFFICERS (continued)
The Board has appointed officers who are responsible for day-to-day business decisions based on policies it has established. The officers serve at the pleasure of the Board. The following table provides basic information about the Officers of the Fund, including principal occupations during the past five years, although their specific titles may have varied over the period. In addition to Mr. Truscott, who is Senior Vice President, the Fund's other officers are:
Fund Officers
Name,
Address and
Year of Birth | | Position and Year
First Appointed to
Position for any Fund
in the Columbia
Funds Complex or a
Predecessor Thereof | | Principal Occupation(s) During Past Five Years | |
Christopher O. Petersen
5228 Ameriprise
Financial Center
Minneapolis, MN 55474
Born 1970 | | President and Principal Executive Officer (2015) | | Vice President and Lead Chief Counsel, Ameriprise Financial, Inc. since January 2015 (previously, Vice President and Chief Counsel January 2010-December 2014; and Vice President and Group Counsel or Counsel 2004-January 2010); officer of Columbia Funds and affiliated funds since 2007. | |
Michael G. Clarke
225 Franklin Street
Boston, MA 02110
Born 1969 | | Treasurer (2011), Chief Financial Officer (2009) and Chief Accounting Officer (2015) | | Vice President — Mutual Fund Administration, Columbia Management Investment Advisers, LLC, since May 2010; Managing Director of Fund Administration, Columbia Management Advisors, LLC, September 2004-April 2010; senior officer of Columbia Funds and affiliated funds since 2002. | |
Paul B. Goucher
100 Park Avenue
New York, NY 10017
Born 1968 | | Senior Vice President (2011), Chief Legal Officer (2015) and Assistant Secretary (2008) | | Vice President and Lead Chief Counsel, Ameriprise Financial, Inc. since November 2008 and January 2013, respectively (previously Chief Counsel, January 2010-January 2013 and Group Counsel, November 2008-January 2010). | |
Thomas P. McGuire
225 Franklin Street
Boston, MA 02110
Born 1972 | | Senior Vice President and Chief Compliance Officer (2012) | | Vice President — Asset Management Compliance, Ameriprise Financial, Inc., since May 2010; Chief Compliance Officer, Ameriprise Certificate Company since September 2010; Compliance Executive, Bank of America, 2005-April 2010. | |
Colin Moore
225 Franklin Street
Boston, MA 02110
Born 1958 | | Senior Vice President (2010) | | Executive Vice President and Global Chief Investment Officer, Ameriprise Financial, Inc., since July 2013; Director and Global Chief Investment Officer, Columbia Management Investment Advisers, LLC since May 2010; Manager, Managing Director and Chief Investment Officer, Columbia Management Advisors, LLC, 2007-April 2010. | |
Michael E. DeFao
225 Franklin Street
Boston, MA 02110
Born 1968 | | Vice President (2011) and Assistant Secretary (2010) | | Vice President and Chief Counsel, Ameriprise Financial, Inc. since May 2010; Associate General Counsel, Bank of America, 2005-April 2010. | |
Amy Johnson
5228 Ameriprise
Financial Center
Minneapolis, MN 55474
Born 1965 | | Vice President (2006) | | Managing Director and Chief Operating Officer, Columbia Management Investment Advisers, LLC since May 2010 (previously Chief Administrative Officer, 2009-April 2010, and Vice President — Asset Management and Trust Company Services, 2006-2009). | |
Lyn Kephart-Strong
5228 Ameriprise
Financial Center
Minneapolis, MN 55474
Born 1960 | | Vice President (2015) | | President, Columbia Management Investment Services Corp. since October 2014; Vice President & Resolution Officer, Ameriprise Trust Company since August 2009; President, RiverSource Service Corporation 2004-2010. | |
Ryan C. Larrenaga
225 Franklin Street
Boston, MA 02110
Born 1970 | | Vice President and Secretary (2015) | | Vice President and Group Counsel, Ameriprise Financial, Inc. since August 2011 (previously, Counsel from May 2010 to August 2011); Assistant General Counsel, Bank of America, 2005-April 2010; officer of Columbia Funds and affiliated funds since 2005. | |
Annual Report 2016
176
COLUMBIA CAPITAL ALLOCATION PORTFOLIOS
IMPORTANT INFORMATION ABOUT THIS REPORT
Each fund mails one shareholder report to each shareholder address. If you would like more than one report, please call shareholder services at 800.345.6611 and additional reports will be sent to you.
The policy of the Board is to vote the proxies of the companies in which each fund holds investments consistent with the procedures as stated in the Statement of Additional Information (SAI). You may obtain a copy of the SAI without charge by calling 800.345.6611; contacting your financial intermediary; visiting columbiathreadneedle.com/us; or searching the website of the Securities and Exchange Commission (SEC) at sec.gov. Information regarding how each fund voted proxies relating to portfolio securities is filed with the SEC by August 31st for the most recent 12-month period ending June 30th of that year, and is available without charge by visiting columbiathreadneedle.com/us, or searching the website of the SEC at sec.gov.
Each fund files a complete schedule of portfolio holdings with the SEC for the first and third quarters of each fiscal year on Form N-Q. Each fund's Form N-Q is available on the SEC's website at sec.gov and may be reviewed and copied at the SEC's Public Reference Room in Washington, D.C. Information on the operation of the Public Reference Room may be obtained by calling 800.SEC.0330. Each fund's complete schedule of portfolio holdings, as filed on Form N-Q, can also be obtained without charge, upon request, by calling 800.345.6611.
Annual Report 2016
177
Columbia Capital Allocation Portfolios
P.O. Box 8081
Boston, MA 02266-8081

This information is for use with concurrent or prior delivery of a fund prospectus. Please read and consider the investment objectives, risks, charges and expenses for any fund carefully before investing. For a prospectus and summary prospectus, which contains this and other important information about the Fund, go to columbiathreadneedle.com/us. The Fund is distributed by Columbia Management Investment Distributors, Inc., member FINRA, and managed by Columbia Management Investment Advisers, LLC.
Columbia Threadneedle Investments (Columbia Threadneedle) is the global brand name of the Columbia and Threadneedle group of companies.
All rights reserved. Columbia Management Investment Distributors, Inc., 225 Franklin Street, Boston, MA 02110-2804
© 2016 Columbia Management Investment Advisers, LLC.
columbiathreadneedle.com/us
ANN124_01_F01_(03/16)
Item 2. Code of Ethics.
(a) The registrant has adopted a code of ethics that applies to the registrant’s principal executive officer, principal financial officer, principal accounting officer or controller, or persons performing similar functions, regardless of whether these individuals are employed by the registrant or a third party.
(b) During the period covered by this report, there were not any amendments to a provision of the code of ethics adopted in 2(a) above.
(c) During the period covered by this report, there were no waivers, including any implicit waivers, from a provision of the code of ethics described in 2(a) above that relates to one or more of the items set forth in paragraph (b) of this item’s instructions.
Item 3. Audit Committee Financial Expert.
The registrant’s Board of Trustees has determined that Edward J. Boudreau, Pamela G. Carlton, William P. Carmichael and Alison Taunton-Rigby, each of whom are members of the registrant’s Board of Trustees and Audit Committee, each qualify as an audit committee financial expert. Mr. Boudreau, Ms. Carlton, Mr. Carmichael and Ms. Taunton-Rigby are each independent trustees, as defined in paragraph (a)(2) of this item’s instructions.
Item 4. Principal Accountant Fees and Services.
Fee information below is disclosed for the three series of the registrant whose report to stockholders are included in this annual filing. Both fiscal years also include fees from a fund that liquidated during the period.
(a) Audit Fees. Aggregate Audit Fees billed by the principal accountant for professional services rendered during the fiscal years ended January 31, 2016 and January 31, 2015 are approximately as follows:
2016 | | 2015 | |
$ | 43,300 | | $ | 58,400 | |
| | | | | |
Audit Fees include amounts related to the audit of the registrant’s annual financial statements or services that are normally provided by the accountant in connection with statutory and regulatory filings or engagements for those fiscal years.
(b) Audit-Related Fees. Aggregate Audit-Related Fees billed to the registrant by the principal accountant for professional services rendered during the fiscal years ended January 31, 2016 and January 31, 2015 are approximately as follows:
Audit-Related Fees include amounts for assurance and related services by the principal accountant that are reasonably related to the performance of the audit of the registrant’s financial statements and are not reported in Audit Fees above. In both fiscal years 2016 and 2015, Audit-Related Fees consist of agreed-upon procedures performed for semi-annual shareholder reports.
During the fiscal years ended January 31, 2016 and January 31, 2015, there were no Audit-Related Fees billed by the registrant’s principal accountant to the registrant’s investment adviser (not including any sub-adviser whose role is primarily portfolio management and is subcontracted with or overseen by another investment adviser) and any entity controlling, controlled by, or under common control with the adviser that provides ongoing services to the registrant for an engagement that related directly to the operations and financial reporting of the registrant.
(c) Tax Fees. Aggregate Tax Fees billed by the principal accountant to the registrant for professional services rendered during the fiscal years ended January 31, 2016 and January 31, 2015 are approximately as follows:
2016 | | 2015 | |
$ | 25,400 | | $ | 18,900 | |
| | | | | |
Tax Fees include amounts for the review of annual tax returns, the review of required shareholder distribution calculations and typically include amounts for professional services by the principal accountant for tax compliance, tax advice and tax planning. Fiscal year 2016 also includes Tax Fees for agreed-upon procedures related to a fund liquidation and a final tax return.
During the fiscal years ended January 31, 2016 and January 31, 2015, there were no Tax Fees billed by the registrant’s principal accountant to the registrant’s investment adviser (not including any sub-adviser whose role is primarily portfolio management and is subcontracted with or overseen by another investment adviser) and any entity controlling, controlled by, or under common control with the adviser that provides ongoing services to the registrant for an engagement that related directly to the operations and financial reporting of the registrant.
(d) All Other Fees. Aggregate All Other Fees billed by the principal accountant to the registrant for professional services rendered during the fiscal years ended January 31, 2016 and January 31, 2015 are approximately as follows:
All Other Fees include amounts for products and services provided by the principal accountant, other than the services reported in paragraphs (a) through (c) above.
Aggregate All Other Fees billed by the registrant’s principal accountant to the registrant’s investment adviser (not including any sub-adviser whose role is primarily portfolio management and is subcontracted with or overseen by another investment adviser) and any entity controlling, controlled by, or under common control with the adviser that provides ongoing services to the registrant for an engagement that related directly to the operations and financial reporting of the registrant during the fiscal years ended January 31, 2016 and January 31, 2015 are approximately as follows:
2016 | | 2015 | |
$ | 110,000 | | $ | 440,000 | |
| | | | | |
In fiscal years 2016 and 2015, All Other Fees primarily consists of fees billed for internal control examinations of the registrant’s transfer agent and investment adviser.
(e)(1) Audit Committee Pre-Approval Policies and Procedures
The registrant’s Audit Committee is required to pre-approve the engagement of the registrant’s independent auditors to provide audit and non-audit services to the registrant and non-audit services to its investment adviser (excluding any sub-adviser whose role is primarily portfolio management and is sub-contracted or overseen by another investment adviser (the “Adviser”) or any entity controlling, controlled by or under common control with the Adviser that provides ongoing services to the Fund (a “Control Affiliate”) if the engagement relates directly to the operations and financial reporting of the registrant.
The Audit Committee has adopted a Policy for Engagement of Independent Auditors for Audit and Non-Audit Services (the “Policy”). The Policy sets forth the understanding of the Audit Committee regarding the engagement of the registrant’s independent accountants to provide (i) audit and permissible audit-related, tax and other services to the registrant (“Fund Services”); (ii) non-audit services to the registrant’s Adviser and any Control Affiliates, that relates directly to the operations and financial reporting of a Fund (“Fund-related Adviser Services”); and (iii) certain other audit and non-audit services to the registrant’s Adviser and its Control Affiliates. A service will require specific pre-approval by the Audit Committee if it is to be provided by the Fund’s independent auditor; provided, however, that pre-approval of non-audit services to the Fund, the Adviser or Control Affiliates may be waived if certain de minimis requirements set forth in the SEC’s rules are met.
Under the Policy, the Audit Committee may delegate pre-approval authority to any pre-designated member or members who are independent board members. The member(s) to whom such authority is delegated must report, for informational purposes only, any pre-approval decisions to the Audit Committee at its next regular meeting. The Audit Committee’s responsibilities with respect to the pre-approval of services performed by the independent auditor may not be delegated to management.
On an annual basis, at a regularly scheduled Audit Committee meeting, the Fund’s Treasurer or other Fund officer shall submit to the Audit Committee a schedule of the types of Fund Services and Fund-related Adviser Services that are subject to specific pre-approval. This schedule will provide a description of each type of service that is subject to specific pre-approval, along with total projected fees for each service. The pre-approval will generally cover a one-year period. The Audit Committee will review and approve the types of services and the projected fees for the next one-year period and may add to, or subtract from, the list of pre-approved services from time to time, based on subsequent determinations. This specific approval acknowledges that the Audit Committee is in agreement with the specific types of services that the independent auditor will be permitted to perform and the projected fees for each service.
The Fund’s Treasurer or other Fund officer shall report to the Audit Committee at each of its regular meetings regarding all Fund Services or Fund-related Adviser Services provided since the last such report was rendered, including a description of the services, by category, with forecasted fees for the annual reporting period, proposed changes requiring specific pre-approval and a description of services provided by the independent auditor, by category, with actual fees during the current reporting period.
*****
(e)(2) 100% of the services performed for items (b) through (d) above during 2016 and 2015 were pre-approved by the registrant’s Audit Committee.
(f) Not applicable.
(g) The aggregate non-audit fees billed by the registrant’s accountant for services rendered to the registrant, and rendered to the registrant’s investment adviser (not including any sub-adviser whose role is primarily portfolio management and is subcontracted with or overseen by another investment adviser), and any entity controlling, controlled by, or under common control with the adviser that provides ongoing services to the registrant for the fiscal years ended January 31, 2016 and January 31, 2015 are approximately as follows:
2016 | | 2015 | |
$ | 136,600 | | $ | 460,500 | |
| | | | | |
(h) The registrant’s Audit Committee of the Board of Directors has considered whether the provision of non-audit services that were rendered to the registrant’s adviser (not including any sub-adviser whose role is primarily portfolio management and is subcontracted with or overseen by another investment adviser), and any entity
controlling, controlled by, or under common control with the investment adviser that provides ongoing services to the registrant that were not pre-approved pursuant to paragraph (c)(7)(ii) of Rule 2-01 of Regulation S-X, is compatible with maintaining the principal accountant’s independence.
Item 5. Audit Committee of Listed Registrants.
Not applicable.
Item 6. Investments
(a) The registrant’s “Schedule I — Investments in securities of unaffiliated issuers” (as set forth in 17 CFR 210.12-12) is included in Item 1 of this Form N-CSR.
(b) Not applicable.
Item 7. Disclosure of Proxy Voting Policies and Procedures for Closed-End Management Investment Companies.
Not applicable.
Item 8. Portfolio Managers of Closed-End Management Investment Companies.
Not applicable.
Item 9. Purchases of Equity Securities by Closed-End Management Investment Company and Affiliated Purchasers.
Not applicable.
Item 10. Submission of Matters to a Vote of Security Holders.
There were no material changes to the procedures by which shareholders may recommend nominees to the registrant’s board of directors.
Item 11. Controls and Procedures.
(a) The registrant’s principal executive officer and principal financial officers, based on their evaluation of the registrant’s disclosure controls and procedures as of a date within 90 days of the filing of this report, have concluded that such controls and procedures are adequately designed to ensure that material information required to be disclosed by the registrant in Form N-CSR is accumulated and communicated to the registrant’s management, including the principal executive officer and principal financial officer, or persons performing similar functions, as appropriate to allow timely decisions regarding required disclosure.
(b) There was no change in the registrant’s internal control over financial reporting that occurred during the registrant’s second fiscal quarter of the period covered by this report that has materially affected, or is reasonably likely to materially affect, the registrant’s internal control over financial reporting.
Item 12. Exhibits.
(a)(1) Code of ethics required to be disclosed under Item 2 of Form N-CSR attached hereto as Exhibit 99.CODE ETH.
(a)(2) Certifications pursuant to Rule 30a-2(a) under the Investment Company Act of 1940 (17 CFR 270.30a-2(a)) attached hereto as Exhibit 99.CERT.
(a)(3) Not applicable.
(b) Certification pursuant to Rule 30a-2(b) under the Investment Company Act of 1940 (17 CFR 270.30a-2(b)) attached hereto as Exhibit 99.906CERT.
SIGNATURES
Pursuant to the requirements of the Securities Exchange Act of 1934 and the Investment Company Act of 1940, the registrant has duly caused this report to be signed on its behalf by the undersigned, thereunto duly authorized.
(registrant) | | Columbia Funds Series Trust | |
| | |
| | |
By (Signature and Title) | | /s/ Christopher O. Petersen | |
| Christopher O. Petersen, President and Principal Executive Officer | |
| | |
| | |
Date | | March 23, 2016 | |
| | | | | |
Pursuant to the requirements of the Securities Exchange Act of 1934 and the Investment Company Act of 1940, this report has been signed below by the following persons on behalf of the registrant and in the capacities and on the dates indicated.
By (Signature and Title) | | /s/ Christopher O. Petersen | |
| Christopher O. Petersen, President and Principal Executive Officer | |
| | |
| | |
Date | | March 23, 2016 | |
| | | |
| | | |
By (Signature and Title) | | /s/ Michael G. Clarke | |
| | Michael G. Clarke, Treasurer and Chief Financial Officer | |
| | |
| | |
Date | | March 23, 2016 | |
| | | | |