UNITED STATES
SECURITIES AND EXCHANGE COMMISSION
Washington, D.C. 20549
FORM N-CSR
CERTIFIED SHAREHOLDER REPORT OF REGISTERED
MANAGEMENT INVESTMENT COMPANIES
Investment Company Act file number | 811-09645 |
|
Columbia Funds Series Trust |
(Exact name of registrant as specified in charter) |
|
50606 Ameriprise Financial Center Minneapolis, MN | | 55474 |
(Address of principal executive offices) | | (Zip code) |
|
Ryan Larrenaga c/o Columbia Management Investment Advisers, LLC 225 Franklin Street Boston, MA 02110 |
(Name and address of agent for service) |
|
Registrant’s telephone number, including area code: | (800) 345-6611 | |
|
Date of fiscal year end: | April 30 | |
|
Date of reporting period: | April 30, 2016 | |
| | | | | | | | |
Form N-CSR is to be used by management investment companies to file reports with the Commission not later than 10 days after the transmission to stockholders of any report that is required to be transmitted to stockholders under Rule 30e-1 under the Investment Company Act of 1940 (17 CFR 270.30e-1). The Commission may use the information provided on Form N-CSR in its regulatory, disclosure review, inspection, and policymaking roles.
A registrant is required to disclose the information specified by Form N-CSR, and the Commission will make this information public. A registrant is not required to respond to the collection of information contained in Form N-CSR unless the Form displays a currently valid Office of Management and Budget (“OMB”) control number. Please direct comments concerning the accuracy of the information collection burden estimate and any suggestions for reducing the burden to Secretary, Securities and Exchange Commission, 450 Fifth Street, NW, Washington, DC 20549-0609. The OMB has reviewed this collection of information under the clearance requirements of 44 U.S.C. § 3507.
Item 1. Reports to Stockholders.

ANNUAL REPORT
April 30, 2016

COLUMBIA AMT-FREE CALIFORNIA INTERMEDIATE MUNI BOND FUND


ABOUT COLUMBIA THREADNEEDLE INVESTMENTS
Columbia Threadneedle Investments is a leading global asset management group that provides a broad range of actively managed investment strategies and solutions for individual, institutional and corporate clients around the world.
With more than 2,000 people, including over 450 investment professionals based in North America, Europe and Asia, we manage $464 billion* of assets across developed and emerging market equities, fixed income, asset allocation solutions and alternatives. We are the 13th largest manager of long-term mutual fund assets in the U.S.** and the 3rd largest manager of retail funds in the U.K.***
Our priority is the investment success of our clients. We aim to deliver the investment outcomes they expect through an investment approach that is team-based, performance-driven and risk-aware. Our culture is dynamic and interactive. By sharing our insights across asset classes and geographies, we generate richer perspectives on global, regional and local investment landscapes. The ability to exchange and debate investment ideas in a collaborative environment enriches our teams' investment processes. More importantly, it results in better informed investment decisions for our clients.
Columbia funds are distributed by Columbia Management Investment Distributors, Inc., member FINRA, and managed by Columbia Management Investment Advisers, LLC.
Columbia Threadneedle Investments (Columbia Threadneedle) is the global brand name of the Columbia and Threadneedle group of companies.
* In U.S. dollars as of March 31, 2016. Source: Ameriprise Q1 Earnings Release. Includes all assets managed by entities in the Columbia and Threadneedle group of companies. Contact us for more current data.
** Source: ICI as of March 31, 2016 for Columbia Management Investment Advisers, LLC.
*** Source: Investment Association as of December 2015 for Threadneedle Asset Management Limited.
© 2016 Columbia Management Investment Advisers, LLC. All rights reserved.
Not part of the shareholder report
Investment strategies to help meet investor needs
We are committed to helping investors navigate financial challenges to reach their desired outcomes. The possibilities are endless.
Your success is our priority.
 Retire comfortably
 Fund college or higher education
 Leave a legacy

Generate an appropriate stream of income in retirement
Traditional approaches to income may no longer be adequate — and they may no longer provide the diversification benefits they once did. Investors need to rethink how they generate retirement income.
Worried about running out of income? You are not alone.

Navigate a changing interest rate environment
Even in today's challenging interest rate environment, it's still possible to navigate markets and achieve your goals.
Make investment choices designed specifically for this market environment.

Maximize after-tax returns
In an environment where what you keep is more important than what you earn, municipal bonds can help mitigate higher taxes while providing attractive yields compared to other investment options.
You've worked too hard building your wealth to lose it to taxes.

Grow assets to achieve financial goals
Finding growth opportunities in today's complex market environment requires strong research capabilities, creative thinking and a disciplined approach.
Do your investments deliver the portfolio growth you need?

Ease the impact of volatile markets
With increasing concerns about market volatility, investors should consider diversifying their portfolios with non-traditional holdings.
Interested in turning volatility into opportunity?
To find out more, contact your financial professional, call 800.426.3750 or visit columbiathreadneedle.com/us
Not part of the shareholder report
 Dear Shareholders,
Volatility comes with the territory for long-term investors. Some investors instinctively want to pull out of the market or sell underperforming investments at the first sign of increased volatility or perhaps even as soon as they perceive it on the horizon. But taking yourself out of the market could mean losing out on potential opportunities, and putting your longer-term investment goals at risk.
Cumulative return is not just about achieving high returns when markets are going up; it's also about remaining invested and minimizing losses during weak or volatile markets so that you can participate on the upside. Developing a deeper understanding of the various risks your portfolio is subject to can help you balance these risks.
Diversification is critical in seeking to achieve that balance. We believe that most portfolios could be more effectively diversified either by introducing holdings with performance profiles unrelated to existing holdings (like alternative products) or by rebalancing existing holdings with an eye toward risk allocation. Over time, distributing risk more evenly may produce a more pronounced diversification benefit and may improve portfolio efficiency. We believe market volatility can create significant opportunities and, in fact, these periods may be some of the very best times to invest.
With this in mind, I thought it important to highlight excerpts from a piece written by Colin Moore, Global Chief Investment Officer, in which he touches on some of these issues emphasizing the importance of a properly constructed portfolio in seeking to effectively manage volatility and to achieve consistency of returns. I encourage you to read the article in its entirety. To access the full article and for other insights on current market, please visit blog.columbiathreadneedleus.com/latest-perspectives.
You need investments that are designed to help you ease the impact of volatile market environments and keep the savings you have worked tirelessly to amass. Columbia Threadneedle Investments provides investment solutions to help you tackle financial challenges and achieve your desired outcome.
Best regards,

Christopher O. Petersen
President, Columbia Funds
Excerpts from:
Taking the scare out of the volatility bogeyman
By Colin Moore, Global Chief Investment Officer
Colin Moore is the global chief investment officer for Columbia Threadneedle Investments. His responsibilities include ensuring that a disciplined investment process is in place across all asset classes, including equity and fixed income. Mr. Moore joined one of the Columbia Threadneedle Investments legacy firms in 2002 as head of equity and was also head of fixed income and liquidity strategies from 2009 – 2010.

n In today's low growth, higher volatility world, the emphasis is shifting from maximization of returns to consistency of returns.
PRESIDENT'S MESSAGE (continued)
n Portfolios should represent the behavioral risk-return tradeoff of investors, remembering that they won't stay invested to realize the return if we get the risk tolerance wrong.
n Holding long-term savings in cash to avoid volatility (the financial equivalent of hiding under the sheets) is detrimental to achieving long-term goals.
According to Wikipedia, "The bogeyman is a common allusion to a mythical creature in many cultures used to control behavior. This monster has no specific appearance, and conceptions about it can vary drastically from household to household within the same community; in many cases he has no set appearance in the mind of an adult or child, but is simply a non-specific embodiment of terror." Different cultures have different names and physical representations for the bogeyman, and investors are no different. We have terrible monsters that we fear may destroy our portfolios, and we call one of the scariest of them volatility.
While the bogeyman is mythical (I hope!), volatility is real and can cause serious damage. To understand why investors have such a hard time coping with volatility, we first need to define three cognitive biases at work in today's investment environment:
1) Recency bias — something that has recently come to the forefront of our attention, regardless of how long established it is, suddenly seems to appear with improbable frequency.
2) Negativity bias — we tend to have a greater recall of unpleasant memories than positive memories.
3) Loss aversion — our dissatisfaction with losing money tends to be greater than our satisfaction with making money.
The level of volatility varies dramatically, and so does investor fear and panic selling — waxing when volatility rises, waning when it falls. Recent studies have pointed to demographics as an important driver of panic selling. The theory is that as people get closer to retirement, the prospects of a large (20% – 30%) loss in financial assets can have a much more pronounced effect on their sense of well-being. Wealth preservation instincts kick in much more quickly than for younger (and typically less wealthy) savers.
The reality is that there is little opportunity for return without volatility. Therefore, the bogeyman effect of holding long-term savings in cash to avoid volatility (the financial equivalent of hiding under the sheets) is detrimental to achieving long-term goals. This effect tends to be more pronounced during the episodic spikes in volatility. The significant spike in volatility in 2008 and 2009 led to significant withdrawals from long-term investment funds over the same period. Less pronounced effects can also be seen when comparing 2001 – 2003 and 2011 – 2012. Conversely, flows picked up when volatility returned to "normal" levels. Investor behavior of this type is consistent with the three behavioral biases.
I believe average volatility will be higher over the next 10 years than the last 10 years and episodic spikes will increase in frequency because sustainable economic growth will be structurally lower and geopolitical risk higher than any time since World War II. Low growth creates uncertainty while loss aversion will make investors fear that we are one economic mishap or geopolitical event away from no growth or recession. The result will be higher volatility on average. Negativity bias will tend to exacerbate "spike" reactions to event-driven geopolitical news, and the volatility bogeyman will appear more often. Assuming the behavioral biases continue, investor returns are likely to be very disappointing regardless of the total return generated by financial markets due to the bogeyman effect.
To mitigate this effect, we need to focus on portfolio construction and an improved understanding of diversification. I accept that equities are likely to offer the highest return over the next 10 years, but they also offer the highest volatility. Many portfolio construction optimization tools use historical average volatility, which is likely to underestimate the volatility investors will face. The bogeyman emerges when individual asset class volatility spikes and cross correlations rise, the combination of which increases overall portfolio volatility far beyond expectation. Diversification is meant to protect investors against volatility, but what's the point of owning lots of investments if the volatility bogeyman has not been properly estimated?
Most importantly, portfolios should be constructed to properly represent the behavioral risk-return tradeoff of investors, remembering that they won't stay invested to realize the return if we get the risk tolerance wrong. In a low growth, higher volatility world, the emphasis is shifting to return consistency rather than return maximization,
PRESIDENT'S MESSAGE (continued)
and investors are best served through investment approaches that appreciate that distinction. Even though it's a permanent feature of financial markets, volatility is less likely to be the bogeyman we all fear if portfolios are constructed with this understanding.
Please visit blog.columbiathreadneedleus.com/latest-perspectives to read the entire article.
Investors should consider the investment objectives, risks, charges and expenses of a mutual fund carefully before investing. For a free prospectus and summary prospectus, which contains this and other important information about a fund, visit columbiathreadneedle.com/us. The prospectus should be read carefully before investing.
The views expressed are as of April 2016, may change as market or other conditions change, and may differ from views expressed by other Columbia Management Investment Advisers, LLC (CMIA) associates or affiliates. Actual investments or investment decisions made by CMIA and its affiliates, whether for its own account or on behalf of clients, will not necessarily reflect the views expressed. This information is not intended to provide investment advice and does not account for individual investor circumstances. Investment decisions should always be made based on an investor's specific financial needs, objectives, goals, time horizon and risk tolerance. Asset classes described may not be suitable for all investors.
Past performance does not guarantee future results, and no forecast should be considered a guarantee either. Since economic and market conditions change frequently, there can be no assurance that the trends described here will continue or that the forecasts are accurate.
Diversification does not guarantee a profit or protect against loss.
Columbia Funds are distributed by Columbia Management Investment Distributors, Inc., member FINRA, and managed by Columbia Management Investment Advisers, LLC.
© 2016 Columbia Management Investment Advisers, LLC. All rights reserved
COLUMBIA AMT-FREE CALIFORNIA INTERMEDIATE MUNI BOND FUND
Performance Overview | | | 2 | | |
Manager Discussion of Fund Performance | | | 4 | | |
Understanding Your Fund's Expenses | | | 6 | | |
Portfolio of Investments | | | 7 | | |
Statement of Assets and Liabilities | | | 19 | | |
Statement of Operations | | | 21 | | |
Statement of Changes in Net Assets | | | 22 | | |
Financial Highlights | | | 24 | | |
Notes to Financial Statements | | | 30 | | |
Report of Independent Registered Public Accounting Firm | | | 37 | | |
Federal Income Tax Information | | | 38 | | |
Trustees and Officers | | | 39 | | |
Important Information About This Report | | | 45 | | |
Fund Investment Manager
Columbia Management Investment
Advisers, LLC
225 Franklin Street
Boston, MA 02110
Fund Distributor
Columbia Management Investment
Distributors, Inc.
225 Franklin Street
Boston, MA 02110
Fund Transfer Agent
Columbia Management Investment
Services Corp.
P.O. Box 8081
Boston, MA 02266-8081
For more information about any of the funds, please visit columbiathreadneedle.com/us or call 800.345.6611. Customer Service Representatives are available to answer your questions Monday through Friday from 8 a.m. to 7 p.m. Eastern time.
The views expressed in this report reflect the current views of the respective parties. These views are not guarantees of future performance and involve certain risks, uncertainties and assumptions that are difficult to predict, so actual outcomes and results may differ significantly from the views expressed. These views are subject to change at any time based upon economic, market or other conditions and the respective parties disclaim any responsibility to update such views. These views may not be relied on as investment advice and, because investment decisions for a Columbia fund are based on numerous factors, may not be relied on as an indication of trading intent on behalf of any particular Columbia fund. References to specific securities should not be construed as a recommendation or investment advice.
COLUMBIA AMT-FREE CALIFORNIA INTERMEDIATE MUNI BOND FUND
Performance Summary
n Columbia AMT-Free California Intermediate Muni Bond Fund (the Fund) Class A shares returned 4.76% excluding sales charges for the 12-month period that ended April 30, 2016. Class Z shares of the Fund returned 5.12% for the same time period.
n During the same time period, the Barclays California 3-15 Year Blend Municipal Bond Index returned 4.79% and the Barclays 3-15 Year Blend Municipal Bond Index returned 4.86%.
n The Fund's investments in longer maturity bonds and lower rated securities within the investment-grade space proved helpful for performance.
Average Annual Total Returns (%) (for period ended April 30, 2016)
| | | Inception | | 1 Year | | 5 Years | | 10 Years | |
Class A | | 09/09/02 | | | | | | | | | | | | | |
Excluding sales charges | | | | | | | 4.76 | | | | 4.84 | | | | 4.50 | | |
Including sales charges | | | | | | | 1.66 | | | | 4.21 | | | | 4.18 | | |
Class B | | 08/29/02 | | | | | | | | | | | | | |
Excluding sales charges | | | | | | | 3.99 | | | | 4.06 | | | | 3.72 | | |
Including sales charges | | | | | | | 0.99 | | | | 4.06 | | | | 3.72 | | |
Class C | | 09/11/02 | | | | | | | | | | | | | |
Excluding sales charges | | | | | | | 4.08 | | | | 4.08 | | | | 3.72 | | |
Including sales charges | | | | | | | 3.08 | | | | 4.08 | | | | 3.72 | | |
Class R4* | | 03/19/13 | | | 5.13 | | | | 5.11 | | | | 4.76 | | |
Class R5* | | 11/08/12 | | | 5.23 | | | | 5.17 | | | | 4.80 | | |
Class Z | | 08/19/02 | | | 5.12 | | | | 5.11 | | | | 4.76 | | |
Barclays California 3-15 Year Blend Municipal Bond Index | | | | | | | 4.79 | | | | 5.14 | | | | 5.11 | | |
Barclays 3-15 Year Blend Municipal Bond Index | | | | | | | 4.86 | | | | 4.61 | | | | 4.89 | | |
Returns for Class A are shown with and without the maximum initial sales charge of 3.00%. Returns for Class B are shown with and without the applicable contingent deferred sales charge (CDSC) of 3.00% in the first year, declining to 1.00% in the fourth year and eliminated thereafter. Returns for Class C are shown with and without the 1.00% CDSC for the first year only. The Fund's other classes are not subject to sales charges and have limited eligibility. Please see the Fund's prospectus for details. Performance for different share classes will vary based on differences in sales charges and fees associated with each class. All results shown assume reinvestment of distributions during the period. Returns do not reflect the deduction of taxes that a shareholder may pay on Fund distributions or on the redemption of Fund shares. Performance results reflect the effect of any fee waivers or reimbursements of Fund expenses by Columbia Management Investment Advisers, LLC and/or any of its affiliates. Absent these fee waivers or expense reimbursement arrangements, performance results would have been lower.
The performance information shown represents past performance and is not a guarantee of future results. The investment return and principal value of your investment will fluctuate so that your shares, when redeemed, may be worth more or less than their original cost. Current performance may be lower or higher than the performance information shown. You may obtain performance information current to the most recent month-end by contacting your financial intermediary, visiting columbiathreadneedle.com/us or calling 800.345.6611.
*The returns shown for periods prior to the share class inception date (including returns for the Life of the Fund, if shown, which are since Fund inception) include the returns of the Fund's oldest share class. These returns are adjusted to reflect any higher class-related operating expenses of the newer share classes, as applicable. Please visit columbiathreadneedle.com/us/investment-products/mutual-funds/
appended-performance for more information.
The Barclays California 3-15 Year Blend Municipal Bond Index tracks investment grade bonds issued from the state of California and its municipalities.
The Barclays 3-15 Year Blend Municipal Bond Index is an unmanaged index that tracks the performance of municipal bonds issued after December 31, 1990, with remaining maturities between 2 and 17 years and at least $7 million in principal amount outstanding.
Indices are not available for investment, are not professionally managed and do not reflect sales charges, fees, brokerage commissions, taxes or other expenses of investing. Securities in the Fund may not match those in an index.
Annual Report 2016
2
COLUMBIA AMT-FREE CALIFORNIA INTERMEDIATE MUNI BOND FUND
PERFORMANCE OVERVIEW (continued)
Performance of a Hypothetical $10,000 Investment (May 1, 2006 – April 30, 2016)
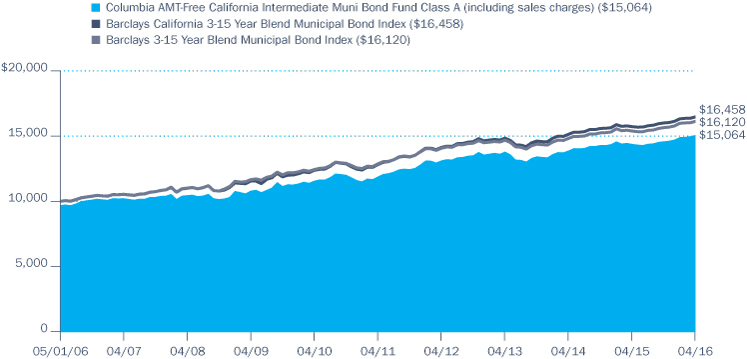
The chart above shows the change in value of a hypothetical $10,000 investment in Class A shares of Columbia AMT-Free California Intermediate Muni Bond Fund during the stated time period, and does not reflect the deduction of taxes that a shareholder may pay on Fund distributions or on the redemption of Fund shares.
Annual Report 2016
3
COLUMBIA AMT-FREE CALIFORNIA INTERMEDIATE MUNI BOND FUND
MANAGER DISCUSSION OF FUND PERFORMANCE
Portfolio Management
Brian McGreevy
Paul Fuchs, CFA
Quality Breakdown (%)
(at April 30, 2016) | |
AAA rating | | | 1.6 | | |
AA rating | | | 44.3 | | |
A rating | | | 35.0 | | |
BBB rating | | | 14.8 | | |
BB rating | | | 1.2 | | |
Not rated | | | 3.1 | | |
Total | | | 100.0 | | |
Percentages indicated are based upon total fixed income investments (excluding Money Market Funds).
Bond ratings apply to the underlying holdings of the Fund and not the Fund itself and are divided into categories ranging from highest to lowest credit quality, determined by using the middle rating of Moody's, S&P and Fitch, after dropping the highest and lowest available ratings. When ratings are available from only two rating agencies, the lower rating is used. When a rating is available from only one rating agency, that rating is used. When a bond is not rated by any rating agency, it is designated as "Not rated." Credit quality ratings assigned by a rating agency are subjective opinions, not statements of fact, and are subject to change, including daily. The ratings assigned by credit rating agencies are but one of the considerations that the Investment Manager and/or Fund's subadviser incorporates into its credit analysis process, along with such other issuer-specific factors as cash flows, capital structure and leverage ratios, ability to de-leverage (repay) through free cash flow, quality of management, market positioning and access to capital, as well as such security-specific factors as the terms of the security (e.g., interest rate and time to maturity) and the amount and type of any collateral.
During the 12-month period that ended April 30, 2016, the Fund's Class A shares returned 4.76% excluding sales charges. Class Z shares of the Fund returned 5.12%. During the same time period, the Barclays California 3-15 Year Blend Municipal Bond Index returned 4.79% and the broader Barclays 3-15 Year Blend Municipal Bond Index returned 4.86%. The Fund's investments in longer maturity bonds and lower rated securities within the investment-grade space proved helpful for performance.
Market Overview
The U.S. municipal bond market produced a positive return and outperformed U.S. Treasuries during the reporting period, thanks in part to a highly favorable balance of supply and demand. Mutual fund cash flows provided a steady source of support for the market, with positive inflows for 30 consecutive weeks as of the close of the period. In the interval from October 2015 through April 2016 alone, inflows into municipal funds totaled over $27 billion. Insurance companies and banks were active buyers, as well. Supply was also strong, but almost half of the new issuance came from refunding deals — rather than new issuance — as issuers sought to take advantage of the cost savings from refinancing older, higher coupon debt. The refinancing activity added an additional layer of demand since many of the refundings were of currently callable bonds issued in 2005 or 2006. As a result, many investors who were taken out of older bonds reinvested the proceeds back into the market.
The strength of state and local finances throughout the United States, with the notable exceptions of New Jersey, Illinois, the City of Chicago, and Puerto Rico, further aided the performance of municipal bonds. Longer term securities generally provided superior returns versus shorter term issues, reflecting the latter category's low nominal yields. Lower quality bonds outpaced their higher quality counterparts, as investors' hearty appetite for risk fueled a continued reach for yield.
A Healthy California Economy Provided Support for the Bond Market
California remained in sound financial condition, with robust job growth and personal income gains that exceeded the national average. The strength in the labor market was fueled in part by the high representation of fast-growing technology companies in the state, particularly in the Bay Area. In addition, California's low dependence on the manufacturing sector made it less vulnerable to the broader slowdown in the world economy. These factors, together with the same favorable balance of supply and demand present nationwide, enabled the Barclays California 3-15 Year Blend Municipal Bond Index to provide competitive returns relative to the broader U.S. municipal bond market.
Contributors and Detractors
At a time in which lower quality bonds outperformed higher quality bonds, the Fund was helped by its overweight positions in the A and BBB credit tiers (the lower rated segments of the investment-grade space). We continued to favor these areas for the additional income that they offer relative to higher grade debt.
Annual Report 2016
4
COLUMBIA AMT-FREE CALIFORNIA INTERMEDIATE MUNI BOND FUND
MANAGER DISCUSSION OF FUND PERFORMANCE (continued)
The Fund further benefited from its holdings in bonds with maturities of eight years and above. Conversely, the Fund's allocation to bonds with maturities of less than two years — where yields were very low — detracted from returns. We kept the portfolio's duration (interest-rate sensitivity) neutral to slightly above that of the benchmark throughout the period, which was moderately helpful to performance given that yields fell.
On a sector basis, we generated strong performance from our holdings in hospital, transportation and special-tax issues. Within the special-tax sector, our positions in tax-allocation bonds benefited from increasing assessed property values in California.
Fund Positioning
The portfolio's duration (interest-rate sensitivity) was roughly in line with the benchmark at the close of the period, which stemmed from our cautious stance with respect to interest rates. The yield curve was steep and attractive in spots, however, and we saw value in bonds with maturities between 10 and 15 years.
We also began to take a more selective strategy with regard to lower rated issues given that yield spreads narrowed to multi-year lows. Additionally, we broadened the universe of opportunities to include slightly higher rated investment-grade issues and bonds with coupons below 5% in an effort to identify relative value. Since these securities continued to trade at premiums, we believe there is some protection from the adverse tax consequences associated with discount bonds.
Investment Risks
Fixed-income securities present issuer default risk. The Fund invests substantially in municipal securities and will be affected by tax, legislative, regulatory, demographic or political changes, as well as changes impacting a state's financial, economic or other conditions. A relatively small number of tax-exempt issuers may necessitate the Fund investing more heavily in a single issuer and, therefore, be more exposed to the risk of loss than a fund that invests more broadly. The value of the Fund's portfolio may be more volatile than a more geographically diversified fund. Prepayment and extension risk exists as a loan, bond or other investment may be called, prepaid or redeemed before maturity and that similar yielding investments may not be available for purchase. A rise in interest rates may result in a price decline of fixed-income instruments held by the Fund, negatively impacting its performance and NAV. Falling rates may result in the fund investing in lower yielding debt instruments, lowering the Fund's income and yield. These risks may be heightened for longer maturity and duration securities. Non-investment-grade (high-yield or junk) securities present greater price volatility and more risk to principal and income than higher rated securities. Market risk may affect a single issuer, sector of the economy, industry or the market as a whole. Federal and state tax rules apply to capital gain distributions and any gains or losses on sales. Income may be subject to state or local taxes. Liquidity risk is associated with the difficulty of selling underlying investments at a desirable time or price. See the Fund's prospectus for information on these and other risks.
Annual Report 2016
5
COLUMBIA AMT-FREE CALIFORNIA INTERMEDIATE MUNI BOND FUND
UNDERSTANDING YOUR FUND'S EXPENSES
(Unaudited)
As an investor, you incur two types of costs. There are transaction costs, which generally include sales charges on purchases and may include redemption fees. There are also ongoing costs, which generally include management fees, distribution and/or service fees, and other fund expenses. The following information is intended to help you understand your ongoing costs (in dollars) of investing in the Fund and to help you compare these costs with the ongoing costs of investing in other mutual funds.
Analyzing Your Fund's Expenses
To illustrate these ongoing costs, we have provided examples and calculated the expenses paid by investors in each share class of the Fund during the period. The actual and hypothetical information in the table is based on an initial investment of $1,000 at the beginning of the period indicated and held for the entire period. Expense information is calculated two ways and each method provides you with different information. The amount listed in the "Actual" column is calculated using the Fund's actual operating expenses and total return for the period. You may use the Actual information, together with the amount invested, to estimate the expenses that you paid over the period. Simply divide your account value by $1,000 (for example, an $8,600 account value divided by $1,000 = 8.6), then multiply the results by the expenses paid during the period under the "Actual" column. The amount listed in the "Hypothetical" column assumes a 5% annual rate of return before expenses (which is not the Fund's actual return) and then applies the Fund's actual expense ratio for the period to the hypothetical return. You should not use the hypothetical account values and expenses to estimate either your actual account balance at the end of the period or the expenses you paid during the period. See "Compare With Other Funds" below for details on how to use the hypothetical data.
Compare With Other Funds
Since all mutual funds are required to include the same hypothetical calculations about expenses in shareholder reports, you can use this information to compare the ongoing cost of investing in the Fund with other funds. To do so, compare the hypothetical example with the 5% hypothetical examples that appear in the shareholder reports of other funds. As you compare hypothetical examples of other funds, it is important to note that hypothetical examples are meant to highlight the ongoing costs of investing in a fund only and do not reflect any transaction costs, such as sales charges, or redemption or exchange fees. Therefore, the hypothetical calculations are useful in comparing ongoing costs only, and will not help you determine the relative total costs of owning different funds. If transaction costs were included in these calculations, your costs would be higher.
November 1, 2015 – April 30, 2016
| | | Account Value at the Beginning
of the Period ($) | | Account Value at the End of the
Period ($) | | Expenses Paid During the
Period ($) | | Fund's Annualized
Expense Ratio (%) | |
| | | Actual | | Hypothetical | | Actual | | Hypothetical | | Actual | | Hypothetical | | Actual | |
Class A | | | 1,000.00 | | | | 1,000.00 | | | | 1,032.90 | | | | 1,021.18 | | | | 3.74 | | | | 3.72 | | | | 0.74 | | |
Class B | | | 1,000.00 | | | | 1,000.00 | | | | 1,030.10 | | | | 1,017.45 | | | | 7.52 | | | | 7.47 | | | | 1.49 | | |
Class C | | | 1,000.00 | | | | 1,000.00 | | | | 1,030.10 | | | | 1,017.45 | | | | 7.52 | | | | 7.47 | | | | 1.49 | | |
Class R4 | | | 1,000.00 | | | | 1,000.00 | | | | 1,034.20 | | | | 1,022.43 | | | | 2.48 | | | | 2.46 | | | | 0.49 | | |
Class R5 | | | 1,000.00 | | | | 1,000.00 | | | | 1,035.80 | | | | 1,022.92 | | | | 1.97 | | | | 1.96 | | | | 0.39 | | |
Class Z | | | 1,000.00 | | | | 1,000.00 | | | | 1,035.20 | | | | 1,022.43 | | | | 2.48 | | | | 2.46 | | | | 0.49 | | |
Expenses paid during the period are equal to the annualized expense ratio for each class as indicated above, multiplied by the average account value over the period and then multiplied by the number of days in the Fund's most recent fiscal half year and divided by 366.
Expenses do not include fees and expenses incurred indirectly by the Fund from its investment in underlying funds, including affiliated and non-affiliated pooled investment vehicles, such as mutual funds and exchange-traded funds.
Had Columbia Management Investment Advisers, LLC and/or certain of its affiliates not waived/reimbursed certain fees and expenses, account value at the end of the period would have been reduced.
Annual Report 2016
6
COLUMBIA AMT-FREE CALIFORNIA INTERMEDIATE MUNI BOND FUND
PORTFOLIO OF INVESTMENTS
April 30, 2016
(Percentages represent value of investments compared to net assets)
Municipal Bonds 92.1%
Issue
Description | | Coupon
Rate | | Principal
Amount ($) | |
Value ($) | |
AIRPORT 4.5% | |
City of Los Angeles Department of Airports
Subordinated Refunding Revenue Bonds
Series 2015C
05/15/29 | | | 5.000 | % | | | 2,410,000 | | | | 2,981,893 | | |
City of San Jose Airport
Refunding Revenue Bonds
Series 2014B
03/01/27 | | | 5.000 | % | | | 2,000,000 | | | | 2,434,900 | | |
Series 2014C
03/01/30 | | | 5.000 | % | | | 2,500,000 | | | | 3,009,400 | | |
Revenue Bonds
Series 2007B (AMBAC)
03/01/22 | | | 5.000 | % | | | 1,000,000 | | | | 1,037,290 | | |
County of Orange Airport
Revenue Bonds
Series 2009A
07/01/25 | | | 5.250 | % | | | 1,500,000 | | | | 1,688,775 | | |
County of Sacramento Airport System
Revenue Bonds
Senior Series 2008A (AGM)
07/01/23 | | | 5.000 | % | | | 1,000,000 | | | | 1,088,670 | | |
San Diego County Regional Airport Authority
Subordinated Revenue Bonds
Series 2010A
07/01/24 | | | 5.000 | % | | | 1,000,000 | | | | 1,159,040 | | |
San Francisco City & County Airport
Commission San Francisco International Airport
Refunding Revenue Bonds
2nd Series 2016A
05/01/26 | | | 5.000 | % | | | 1,975,000 | | | | 2,557,665 | | |
San Francisco City & County Airports
Commission-San Francisco International Airport
Refunding Revenue Bonds
2nd Series 2009C (AGM)
05/01/18 | | | 5.000 | % | | | 1,825,000 | | | | 1,984,596 | | |
Revenue Bonds
Series 2011G
05/01/26 | | | 5.250 | % | | | 2,000,000 | | | | 2,403,340 | | |
Total | | | | | | | 20,345,569 | | |
HEALTH SERVICES 0.3% | |
California Municipal Finance Authority
Refunding Revenue Bonds
Harbor Regional Center Project
Series 2015
11/01/32 | | | 5.000 | % | | | 1,120,000 | | | | 1,319,270 | | |
Municipal Bonds (continued)
Issue
Description | | Coupon
Rate | | Principal
Amount ($) | |
Value ($) | |
HIGHER EDUCATION 3.2% | |
California Educational Facilities Authority
Revenue Bonds
California Lutheran University
Series 2008
10/01/21 | | | 5.250 | % | | | 1,500,000 | | | | 1,629,735 | | |
Chapman University
Series 2015
04/01/26 | | | 5.000 | % | | | 1,000,000 | | | | 1,238,970 | | |
Pitzer College
Series 2009
04/01/19 | | | 5.000 | % | | | 1,610,000 | | | | 1,794,763 | | |
University of Southern California
Series 2009C
10/01/24 | | | 5.250 | % | | | 3,000,000 | | | | 3,929,130 | | |
California Municipal Finance Authority
Refunding Revenue Bonds
Azusa Pacific University
Series 2015B
04/01/25 | | | 5.000 | % | | | 395,000 | | | | 461,143 | | |
04/01/26 | | | 5.000 | % | | | 1,000,000 | | | | 1,154,670 | | |
Revenue Bonds
Biola University
Series 2013
10/01/24 | | | 5.000 | % | | | 505,000 | | | | 598,576 | | |
10/01/28 | | | 5.000 | % | | | 840,000 | | | | 976,492 | | |
California State Public Works Board
Refunding Revenue Bonds
California State University
Series 2006A (NPFGC)
10/01/16 | | | 5.000 | % | | | 1,000,000 | | | | 1,019,020 | | |
California Statewide Communities Development Authority
Revenue Bonds
California Baptist University
Series 2014A
11/01/23 | | | 5.125 | % | | | 715,000 | | | | 783,447 | | |
Lancer Plaza Project
Series 2013
11/01/23 | | | 5.125 | % | | | 840,000 | | | | 902,723 | | |
Total | | | | | | | 14,488,669 | | |
HOSPITAL 8.4% | |
ABAG Finance Authority for Nonprofit Corps.
Revenue Bonds
Sharp Healthcare
Series 2011A
08/01/24 | | | 5.250 | % | | | 2,750,000 | | | | 3,253,305 | | |
California Health Facilities Financing Authority
Refunding Revenue Bonds
Cedars Sinai Medical Center
Series 2015
11/15/28 | | | 5.000 | % | | | 1,000,000 | | | | 1,258,250 | | |
The accompanying Notes to Financial Statements are an integral part of this statement.
Annual Report 2016
7
COLUMBIA AMT-FREE CALIFORNIA INTERMEDIATE MUNI BOND FUND
PORTFOLIO OF INVESTMENTS (continued)
April 30, 2016
Municipal Bonds (continued)
Issue
Description | | Coupon
Rate | | Principal
Amount ($) | |
Value ($) | |
El Camino Hospital
Series 2015A
02/01/27 | | | 5.000 | % | | | 1,500,000 | | | | 1,837,560 | | |
Marshall Medical Center
Series 2015
11/01/23 | | | 5.000 | % | | | 325,000 | | | | 395,034 | | |
Sutter Health Obligation Group
Series 2011D
08/15/26 | | | 5.000 | % | | | 2,250,000 | | | | 2,694,690 | | |
Revenue Bonds
Children's Hospital of Orange County
Series 2009
11/01/21 | | | 6.000 | % | | | 2,000,000 | | | | 2,343,360 | | |
City of Hope Obligation Group
Series 2012A
11/15/21 | | | 5.000 | % | | | 600,000 | | | | 719,538 | | |
Dignity Health
Series 2009A
07/01/29 | | | 6.000 | % | | | 1,250,000 | | | | 1,440,000 | | |
Series 2009E
07/01/25 | | | 5.625 | % | | | 1,500,000 | | | | 1,717,350 | | |
Lucile Salter Packard Children's Hospital
Series 2014
08/15/28 | | | 5.000 | % | | | 300,000 | | | | 367,506 | | |
Providence Health & Services
Series 2014A
10/01/30 | | | 5.000 | % | | | 1,500,000 | | | | 1,816,455 | | |
Sutter Health Obligation Group
Series 2016A
11/15/34 | | | 5.000 | % | | | 2,735,000 | | | | 3,322,724 | | |
California Municipal Finance Authority
Refunding Revenue Bonds
Community Medical Centers
Series 2015A
02/01/27 | | | 5.000 | % | | | 1,200,000 | | | | 1,440,372 | | |
California Statewide Communities Development Authority
Refunding Revenue Bonds
Enloe Medical Center
Series 2015
08/15/30 | | | 5.000 | % | | | 1,000,000 | | | | 1,241,860 | | |
Huntington Memorial Hospital
Series 2014B
07/01/33 | | | 5.000 | % | | | 2,300,000 | | | | 2,663,607 | | |
Revenue Bonds
Henry Mayo Newhall Memorial
Series 2014A (AGM)
10/01/27 | | | 5.000 | % | | | 1,000,000 | | | | 1,190,670 | | |
John Muir Health
Series 2006A
08/15/17 | | | 5.000 | % | | | 3,000,000 | | | | 3,040,050 | | |
Kaiser Permanente
Series 2009A
04/01/19 | | | 5.000 | % | | | 2,000,000 | | | | 2,244,300 | | |
Loma Linda University Medical Center
Series 2014
12/01/34 | | | 5.250 | % | | | 3,000,000 | | | | 3,330,060 | | |
Municipal Bonds (continued)
Issue
Description | | Coupon
Rate | | Principal
Amount ($) | |
Value ($) | |
Sutter Health
Series 2011A
08/15/26 | | | 5.500 | % | | | 1,000,000 | | | | 1,189,980 | | |
Total | | | | | | | 37,506,671 | | |
JOINT POWER AUTHORITY 3.7% | |
M-S-R Public Power Agency
Subordinated Revenue Bonds
Lien
Series 2008L (AGM)
07/01/21 | | | 5.000 | % | | | 2,500,000 | | | | 2,713,175 | | |
Northern California Power Agency
Refunding Revenue Bonds
Hydroelectric Project No. 1
Series 2008C (AGM)
07/01/22 | | | 5.000 | % | | | 3,000,000 | | | | 3,268,050 | | |
Northern California Transmission Agency
Refunding Revenue Bonds
California-Oregon Project
Series 2016
05/01/32 | | | 5.000 | % | | | 1,500,000 | | | | 1,857,105 | | |
Southern California Public Power Authority
Refunding Revenue Bonds
Series 2008A
07/01/22 | | | 5.000 | % | | | 2,000,000 | | | | 2,190,080 | | |
Series 2015C
07/01/26 | | | 5.000 | % | | | 5,000,000 | | | | 6,355,250 | | |
Total | | | | | | | 16,383,660 | | |
LOCAL APPROPRIATION 3.6% | |
City & County of San Francisco
Certificate of Participation
Multiple Capital Improvement Projects
Series 2009B
04/01/24 | | | 5.000 | % | | | 1,495,000 | | | | 1,658,912 | | |
County of Monterey
Certificate of Participation
Refinancing Project
Series 2009 (AGM)
08/01/17 | | | 5.000 | % | | | 1,000,000 | | | | 1,054,320 | | |
Los Angeles County Public Works Financing Authority
Refunding Revenue Bonds
Series 2015B
12/01/25 | | | 5.000 | % | | | 1,750,000 | | | | 2,244,532 | | |
Oakland Joint Powers Financing Authority
Refunding Revenue Bonds
Oakland Administration Buildings
Series 2008B (AGM)
08/01/22 | | | 5.000 | % | | | 2,000,000 | | | | 2,177,020 | | |
The accompanying Notes to Financial Statements are an integral part of this statement.
Annual Report 2016
8
COLUMBIA AMT-FREE CALIFORNIA INTERMEDIATE MUNI BOND FUND
PORTFOLIO OF INVESTMENTS (continued)
April 30, 2016
Municipal Bonds (continued)
Issue
Description | | Coupon
Rate | | Principal
Amount ($) | |
Value ($) | |
Pasadena Public Financing Authority
Revenue Bonds
Rose Bowl Renovation
Series 2010A
03/01/26 | | | 5.000 | % | | | 2,500,000 | | | | 2,882,875 | | |
Pico Rivera Public Financing Authority
Revenue Bonds
Series 2009
09/01/26 | | | 5.250 | % | | | 1,085,000 | | | | 1,215,862 | | |
Riverside Public Financing Authority
Refunding Revenue Bonds
Series 2012A
11/01/27 | | | 5.000 | % | | | 2,145,000 | | | | 2,562,396 | | |
11/01/28 | | | 5.000 | % | | | 1,155,000 | | | | 1,377,407 | | |
Santa Clara County Financing Authority
Refunding Revenue Bonds
Multiple Facilities Projects
Series 2010N
05/15/17 | | | 5.000 | % | | | 1,000,000 | | | | 1,044,730 | | |
Total | | | | | | | 16,218,054 | | |
LOCAL GENERAL OBLIGATION 8.9% | |
City of Los Angeles
Unlimited General Obligation Bonds
Series 2011A
09/01/25 | | | 5.000 | % | | | 3,000,000 | | | | 3,625,200 | | |
Compton Community College District
Unlimited General Obligation Refunding Bonds
Series 2012
07/01/22 | | | 5.000 | % | | | 2,095,000 | | | | 2,470,885 | | |
Compton Unified School District(a)
Unlimited General Obligation Bonds
Election of 2002 - Capital Appreciation
Series 2006C (AMBAC)
06/01/23 | | | 0.000 | % | | | 2,025,000 | | | | 1,735,688 | | |
06/01/24 | | | 0.000 | % | | | 1,925,000 | | | | 1,602,793 | | |
Culver City School Facilities Financing Authority
Revenue Bonds
Unified School District
Series 2005 (AGM)
08/01/23 | | | 5.500 | % | | | 1,490,000 | | | | 1,912,236 | | |
East Side Union High School District
Unlimited General Obligation Refunding Bonds
2012 Crossover
Series 2006 (AGM)
09/01/20 | | | 5.250 | % | | | 1,280,000 | | | | 1,511,181 | | |
Long Beach Community College District
Unlimited General Obligation Bonds
2008 Election
Series 2012B
08/01/23 | | | 5.000 | % | | | 700,000 | | | | 866,901 | | |
Municipal Bonds (continued)
Issue
Description | | Coupon
Rate | | Principal
Amount ($) | |
Value ($) | |
Long Beach Unified School District
Unlimited General Obligation Bonds
Series 2015D-1(a)
08/01/31 | | | 0.000 | % | | | 1,375,000 | | | | 791,560 | | |
Oakland Unified School District/Alameda County
Unlimited General Obligation Bonds
Series 2015A
08/01/25 | | | 5.000 | % | | | 650,000 | | | | 801,132 | | |
Palomar Community College District
Unlimited General Obligation Bonds
Capital Appreciation-Election of 2006
Series 2010B(a)
08/01/22 | | | 0.000 | % | | | 2,140,000 | | | | 1,913,781 | | |
Rancho Santiago Community College District
Unlimited General Obligation Refunding Bonds
Series 2005 (AGM)
09/01/19 | | | 5.250 | % | | | 1,000,000 | | | | 1,146,180 | | |
Rancho Santiago Community College District(a)
Unlimited General Obligation Bonds
Capital Appreciation-Election of 2002
Series 2006C (AGM)
09/01/31 | | | 0.000 | % | | | 3,785,000 | | | | 2,332,885 | | |
Rescue Union School District
Unlimited General Obligation Bonds
Capital Appreciation-Election of 1998
Series 2005 (NPFGC)(a)
09/01/26 | | | 0.000 | % | | | 1,100,000 | | | | 826,276 | | |
Salinas Union High School District
Unlimited General Obligation Bonds
BAN Series 2015(a)
08/01/20 | | | 0.000 | % | | | 3,000,000 | | | | 2,776,920 | | |
San Mateo Foster City School District
Revenue Bonds
Series 2005 (AGM)
08/15/19 | | | 5.500 | % | | | 2,000,000 | | | | 2,301,680 | | |
Saugus Union School District
Unlimited General Obligation Refunding Bonds
Series 2006 (NPFGC)
08/01/21 | | | 5.250 | % | | | 2,375,000 | | | | 2,873,417 | | |
Sierra Kings Health Care District
Unlimited General Obligation Refunding Bonds
Series 2015
08/01/28 | | | 5.000 | % | | | 1,000,000 | | | | 1,177,720 | | |
08/01/32 | | | 5.000 | % | | | 1,500,000 | | | | 1,723,815 | | |
Simi Valley School Financing Authority
Refunding Revenue Bonds
Simi Valley Unified School District
Series 2007
08/01/18 | | | 5.000 | % | | | 1,045,000 | | | | 1,124,138 | | |
The accompanying Notes to Financial Statements are an integral part of this statement.
Annual Report 2016
9
COLUMBIA AMT-FREE CALIFORNIA INTERMEDIATE MUNI BOND FUND
PORTFOLIO OF INVESTMENTS (continued)
April 30, 2016
Municipal Bonds (continued)
Issue
Description | | Coupon
Rate | | Principal
Amount ($) | |
Value ($) | |
West Contra Costa Unified School District
Unlimited General Obligation Refunding Bonds
Series 2011 (AGM)
08/01/23 | | | 5.250 | % | | | 3,000,000 | | | | 3,629,610 | | |
Series 2012
08/01/27 | | | 5.000 | % | | | 2,365,000 | | | | 2,798,126 | | |
Total | | | | | | | 39,942,124 | | |
MULTI-FAMILY 1.7% | |
California Municipal Finance Authority
Revenue Bonds
Bowles Hall Foundation
Series 2015A
06/01/35 | | | 5.000 | % | | | 400,000 | | | | 453,684 | | |
Caritas Affordable Housing
Senior Series 2014
08/15/30 | | | 5.000 | % | | | 1,000,000 | | | | 1,149,810 | | |
California Statewide Communities Development Authority
Refunding Revenue Bonds
CHF Irvine LLC
Series 2016
05/15/32 | | | 5.000 | % | | | 3,225,000 | | | | 3,892,640 | | |
University of California Irvine East Campus Apartments
Series 2012
05/15/19 | | | 5.000 | % | | | 1,000,000 | | | | 1,117,330 | | |
05/15/20 | | | 5.000 | % | | | 750,000 | | | | 859,410 | | |
Total | | | | | | | 7,472,874 | | |
MUNICIPAL POWER 5.4% | |
City of Riverside Electric
Revenue Bonds
Series 2008D (AGM)
10/01/23 | | | 5.000 | % | | | 1,000,000 | | | | 1,099,530 | | |
City of Santa Clara Electric
Refunding Revenue Bonds
Series 2011A
07/01/29 | | | 5.375 | % | | | 1,000,000 | | | | 1,181,740 | | |
City of Vernon Electric System
Unrefunded Revenue Bonds
Series 2009A
08/01/21 | | | 5.125 | % | | | 2,705,000 | | | | 3,016,697 | | |
Imperial Irrigation District Electric System
Refunding Revenue Bonds
Series 2011D
11/01/22 | | | 5.000 | % | | | 2,860,000 | | | | 3,433,373 | | |
11/01/23 | | | 5.000 | % | | | 1,040,000 | | | | 1,243,715 | | |
Unrefunded Revenue Bonds
System
Series 2008A
11/01/21 | | | 5.250 | % | | | 460,000 | | | | 510,191 | | |
Municipal Bonds (continued)
Issue
Description | | Coupon
Rate | | Principal
Amount ($) | |
Value ($) | |
Los Angeles Department of Water & Power
Revenue Bonds
Power System
Series 2009B
07/01/23 | | | 5.250 | % | | | 2,000,000 | | | | 2,283,980 | | |
Series 2014D
07/01/33 | | | 5.000 | % | | | 1,700,000 | | | | 2,081,259 | | |
Subordinated Series 2007A-1 (AMBAC)
07/01/19 | | | 5.000 | % | | | 1,000,000 | | | | 1,053,680 | | |
Redding Joint Powers Financing Authority
Refunding Revenue Bonds
Series 2015A
06/01/31 | | | 5.000 | % | | | 1,045,000 | | | | 1,249,757 | | |
Sacramento Municipal Utility District
Revenue Bonds
Series 2008U (AGM)
08/15/21 | | | 5.000 | % | | | 1,500,000 | | | | 1,649,790 | | |
State of California Department of Water Resources
Subordinated Revenue Bonds
Series 2005G-11
05/01/18 | | | 5.000 | % | | | 2,000,000 | | | | 2,170,700 | | |
Tuolumne Wind Project Authority
Revenue Bonds
Tuolumne Co. Project
Series 2009
01/01/22 | | | 5.000 | % | | | 1,000,000 | | | | 1,107,160 | | |
Turlock Irrigation District
Refunding Revenue Bonds
First Priority
Subordinated Series 2014
01/01/30 | | | 5.000 | % | | | 850,000 | | | | 1,016,566 | | |
01/01/31 | | | 5.000 | % | | | 1,000,000 | | | | 1,187,780 | | |
Total | | | | | | | 24,285,918 | | |
OTHER BOND ISSUE 0.8% | |
City of Long Beach Marina System
Revenue Bonds
Series 2015
05/15/28 | | | 5.000 | % | | | 635,000 | | | | 747,617 | | |
County of San Diego
Refunding Revenue Bonds
Sanford Burnham Prebys Medical Discovery Group
Series 2015
11/01/25 | | | 5.000 | % | | | 350,000 | | | | 434,714 | | |
Long Beach Bond Finance Authority
Refunding Revenue Bonds
Aquarium of the Pacific
Series 2012
11/01/27 | | | 5.000 | % | | | 2,210,000 | | | | 2,596,839 | | |
Total | | | | | | | 3,779,170 | | |
The accompanying Notes to Financial Statements are an integral part of this statement.
Annual Report 2016
10
COLUMBIA AMT-FREE CALIFORNIA INTERMEDIATE MUNI BOND FUND
PORTFOLIO OF INVESTMENTS (continued)
April 30, 2016
Municipal Bonds (continued)
Issue
Description | | Coupon
Rate | | Principal
Amount ($) | |
Value ($) | |
PORTS 1.3% | |
Port of Los Angeles
Revenue Bonds
Series 2009A
08/01/23 | | | 5.250 | % | | | 2,000,000 | | | | 2,292,900 | | |
Port of Oakland
Refunding Revenue Bonds
Intermediate Lien
Series 2007B (NPFGC)
11/01/29 | | | 5.000 | % | | | 1,165,000 | | | | 1,231,184 | | |
San Diego Unified Port District
Refunding Revenue Bonds
Series 2013A
09/01/27 | | | 5.000 | % | | | 1,000,000 | | | | 1,185,540 | | |
09/01/28 | | | 5.000 | % | | | 1,100,000 | | | | 1,290,278 | | |
Total | | | | | | | 5,999,902 | | |
PREP SCHOOL 2.1% | |
California School Finance Authority
Revenue Bonds
KIPP Los Angeles Projects
Series 2014A
07/01/34 | | | 5.000 | % | | | 600,000 | | | | 662,562 | | |
California School Finance Authority(b)
Refunding Revenue Bonds
Aspire Public Schools
Series 2016
08/01/29 | | | 5.000 | % | | | 500,000 | | | | 579,835 | | |
08/01/30 | | | 5.000 | % | | | 750,000 | | | | 866,475 | | |
08/01/31 | | | 5.000 | % | | | 925,000 | | | | 1,063,019 | | |
Revenue Bonds
Alliance College-Ready Public Schools
Series 2015
07/01/30 | | | 5.000 | % | | | 1,700,000 | | | | 1,897,098 | | |
Green Dot Public School Project
Series 2015A
08/01/35 | | | 5.000 | % | | | 1,010,000 | | | | 1,112,889 | | |
KIPP Los Angeles Projects
Series 2015A
07/01/35 | | | 5.000 | % | | | 1,000,000 | | | | 1,113,450 | | |
River Springs Charter School Project
Series 2015
07/01/25 | | | 5.250 | % | | | 2,000,000 | | | | 2,093,200 | | |
Total | | | | | | | 9,388,528 | | |
PREPAID GAS 0.6% | |
M-S-R Energy Authority
Revenue Bonds
Series 2009B
11/01/29 | | | 6.125 | % | | | 2,000,000 | | | | 2,640,020 | | |
Municipal Bonds (continued)
Issue
Description | | Coupon
Rate | | Principal
Amount ($) | |
Value ($) | |
RECREATION 0.4% | |
Del Mar Race Track Authority
Refunding Revenue Bonds
Series 2015
10/01/25 | | | 5.000 | % | | | 1,665,000 | | | | 1,893,904 | | |
REFUNDED / ESCROWED 8.6% | |
California Health Facilities Financing Authority
Prerefunded 07/01/16 Revenue Bonds
Insured California Nevada-Methodist
Series 2006
07/01/26 | | | 5.000 | % | | | 1,000,000 | | | | 1,007,890 | | |
Revenue Bonds
Insured Episcopal Home
Series 2010B Escrowed to Maturity
02/01/19 | | | 5.100 | % | | | 395,000 | | | | 422,765 | | |
California State University
Prerefunded 05/01/19 Revenue Bonds
Systemwide
Series 2009A
11/01/22 | | | 5.250 | % | | | 2,500,000 | | | | 2,831,075 | | |
California Statewide Communities Development Authority
Revenue Bonds
University of California Irvine East Campus Apartments
Series 2008 Escrowed to Maturity
05/15/17 | | | 5.000 | % | | | 1,500,000 | | | | 1,568,535 | | |
City & County of San Francisco
Prerefunded 06/15/20 Unlimited General
Obligation Bonds
Earthquake Safety
Series 2010E
06/15/27 | | | 5.000 | % | | | 3,380,000 | | | | 3,943,784 | | |
City of Los Angeles Wastewater System
Prerefunded 06/01/19 Revenue Bonds
Series 2009A
06/01/25 | | | 5.750 | % | | | 1,110,000 | | | | 1,277,421 | | |
City of Newport Beach
Prerefunded 12/01/21 Revenue Bonds
Hoag Memorial Hospital Presbyterian
Series 2011
12/01/30 | | | 5.875 | % | | | 1,000,000 | | | | 1,256,580 | | |
City of Vernon Electric System
Prerefunded 08/01/19 Revenue Bonds
Series 2009A
08/01/21 | | | 5.125 | % | | | 1,195,000 | | | | 1,303,566 | | |
City of Vista
Prerefunded 05/01/17 Certificate of Participation
Community Projects
Series 2007 (NPFGC)
05/01/21 | | | 4.750 | % | | | 750,000 | | | | 781,237 | | |
The accompanying Notes to Financial Statements are an integral part of this statement.
Annual Report 2016
11
COLUMBIA AMT-FREE CALIFORNIA INTERMEDIATE MUNI BOND FUND
PORTFOLIO OF INVESTMENTS (continued)
April 30, 2016
Municipal Bonds (continued)
Issue
Description | | Coupon
Rate | | Principal
Amount ($) | |
Value ($) | |
Imperial Irrigation District Electric System
Prerefunded 11/01/18 Revenue Bonds
System
Series 2008A
11/01/21 | | | 5.250 | % | | | 2,040,000 | | | | 2,268,154 | | |
Kern County Water Agency Improvement District No. 4
Prerefunded 05/01/18 Certificate of Participation
Series 2008A
05/01/22 | | | 5.000 | % | | | 2,020,000 | | | | 2,193,255 | | |
Los Alamitos Unified School District
Unlimited General Obligation Bonds
School Facilities Improvement
BAN Series 2011 Escrowed to Maturity(a)
09/01/16 | | | 0.000 | % | | | 2,000,000 | | | | 1,996,420 | | |
Los Angeles Unified School District
Prerefunded 07/01/16 Unlimited General Obligation Bonds
Election of 2004
Series 2006G (AMBAC)
07/01/20 | | | 5.000 | % | | | 1,000,000 | | | | 1,007,870 | | |
Sacramento County Sanitation Districts Financing Authority
Prerefunded 06/01/16 Revenue Bonds
Sacramento Regional County Sanitation
Series 2006 (NPFGC)
12/01/17 | | | 5.000 | % | | | 1,000,000 | | | | 1,004,080 | | |
Sacramento Municipal Utility District
Prerefunded 07/01/16 Revenue Bonds
Cosumnes Project
Series 2006 (NPFGC)
07/01/29 | | | 5.125 | % | | | 2,000,000 | | | | 2,016,200 | | |
San Diego Public Facilities Financing Authority Sewer
Prerefunded 05/15/19 Revenue Bonds
Senior Series 2009B
05/15/25 | | | 5.250 | % | | | 1,500,000 | | | | 1,702,065 | | |
San Mateo Joint Powers Financing Authority
Prerefunded 07/15/18 Revenue Bonds
Youth Services Campus
Series 2008A
07/15/20 | | | 5.000 | % | | | 435,000 | | | | 476,134 | | |
07/15/28 | | | 5.250 | % | | | 2,275,000 | | | | 2,502,591 | | |
Southern California Public Power Authority
Prerefunded 07/01/18 Revenue Bonds
Southern Transmission Project
Series 2008
07/01/27 | | | 6.000 | % | | | 1,000,000 | | | | 1,114,510 | | |
State of California
Prerefunded 12/01/16 Unlimited General Obligation Bonds
Various Purpose
Series 2007
12/01/26 | | | 5.000 | % | | | 2,000,000 | | | | 2,052,920 | | |
Unlimited General Obligation Bonds
Series 2009A Escrowed to Maturity
07/01/18 | | | 5.000 | % | | | 2,320,000 | | | | 2,535,714 | | |
Municipal Bonds (continued)
Issue
Description | | Coupon
Rate | | Principal
Amount ($) | |
Value ($) | |
Unrefunded Unlimited General Obligation Bonds
Series 2009A Escrowed to Maturity
07/01/18 | | | 5.000 | % | | | 680,000 | | | | 743,226 | | |
Sulphur Springs Union School District
Prerefunded 09/01/22 Special Tax Bonds
Community Facilities District
Series 2012
09/01/28 | | | 5.000 | % | | | 520,000 | | | | 642,756 | | |
09/01/29 | | | 5.000 | % | | | 585,000 | | | | 723,101 | | |
University of California
Prerefunded 05/15/19 Revenue Bonds
Series 2009O
05/15/20 | | | 5.000 | % | | | 1,000,000 | | | | 1,127,200 | | |
Total | | | | | | | 38,499,049 | | |
RETIREMENT COMMUNITIES 5.1% | |
ABAG Finance Authority for Nonprofit Corps.
Refunding Revenue Bonds
Episcopal Senior Communities
Series 2011
07/01/24 | | | 5.375 | % | | | 2,795,000 | | | | 3,200,023 | | |
Series 2012
07/01/21 | | | 5.000 | % | | | 1,000,000 | | | | 1,142,460 | | |
Revenue Bonds
Odd Fellows Home of California
Series 2012-A
04/01/32 | | | 5.000 | % | | | 4,750,000 | | | | 5,616,305 | | |
California Health Facilities Financing Authority
Refunding Revenue Bonds
Northern California Presbyterian Homes
Series 2015
07/01/28 | | | 5.000 | % | | | 310,000 | | | | 376,135 | | |
07/01/29 | | | 5.000 | % | | | 300,000 | | | | 361,944 | | |
California Statewide Communities Development Authority
Refunding Revenue Bonds
899 Charleston Project
Series 2014A
11/01/19 | | | 5.000 | % | | | 725,000 | | | | 779,912 | | |
American Baptist Homes West
Series 2015
10/01/24 | | | 5.000 | % | | | 2,575,000 | | | | 3,087,064 | | |
10/01/26 | | | 5.000 | % | | | 1,000,000 | | | | 1,195,710 | | |
Episcopal Communities and Services
Series 2012
05/15/27 | | | 5.000 | % | | | 1,520,000 | | | | 1,750,493 | | |
Revenue Bonds
Insured Redwoods Project
Series 2013
11/15/28 | | | 5.000 | % | | | 1,000,000 | | | | 1,216,530 | | |
City of La Verne
Refunding Certificate of Participation
Brethren Hillcrest Homes
Series 2014
05/15/24 | | | 5.000 | % | | | 310,000 | | | | 355,524 | | |
The accompanying Notes to Financial Statements are an integral part of this statement.
Annual Report 2016
12
COLUMBIA AMT-FREE CALIFORNIA INTERMEDIATE MUNI BOND FUND
PORTFOLIO OF INVESTMENTS (continued)
April 30, 2016
Municipal Bonds (continued)
Issue
Description | | Coupon
Rate | | Principal
Amount ($) | |
Value ($) | |
05/15/25 | | | 5.000 | % | | | 530,000 | | | | 603,474 | | |
05/15/26 | | | 5.000 | % | | | 700,000 | | | | 791,854 | | |
05/15/29 | | | 5.000 | % | | | 1,135,000 | | | | 1,265,763 | | |
Los Angeles County Regional Financing Authority
Revenue Bonds
Montecedro, Inc. Project
Series 2014A
11/15/34 | | | 5.000 | % | | | 1,000,000 | | | | 1,167,800 | | |
Total | | | | | | | 22,910,991 | | |
SPECIAL NON PROPERTY TAX 0.8% | |
Virgin Islands Public Finance Authority(c)
Refunding Revenue Bonds
Series 2013B
10/01/24 | | | 5.000 | % | | | 1,740,000 | | | | 1,993,170 | | |
Revenue Bonds
Matching Fund Loan Notes-Senior Lien
Series 2010A
10/01/20 | | | 5.000 | % | | | 1,490,000 | | | | 1,681,286 | | |
Total | | | | | | | 3,674,456 | | |
SPECIAL PROPERTY TAX 14.0% | |
Chino Public Financing Authority
Refunding Special Tax Bonds
Series 2012
09/01/23 | | | 5.000 | % | | | 1,070,000 | | | | 1,246,325 | | |
City of Irvine
Refunding Special Assessment Bonds
Limited Obligation Reassessment District
Series 2015
09/02/25 | | | 5.000 | % | | | 1,300,000 | | | | 1,603,719 | | |
Concord Redevelopment Agency Successor Agency
Refunding Tax Allocation Bonds
Series 2014 (BAM)
03/01/25 | | | 5.000 | % | | | 840,000 | | | | 1,045,817 | | |
County of El Dorado
Refunding Special Tax Bonds
Community Facilities District No. 92-1
Series 2012
09/01/26 | | | 5.000 | % | | | 630,000 | | | | 736,256 | | |
09/01/27 | | | 5.000 | % | | | 805,000 | | | | 934,903 | | |
Emeryville Redevelopment Agency Successor Agency
Refunding Tax Allocation Bonds
Series 2014A (AGM)
09/01/23 | | | 5.000 | % | | | 2,415,000 | | | | 3,002,787 | | |
09/01/26 | | | 5.000 | % | | | 1,000,000 | | | | 1,235,960 | | |
09/01/27 | | | 5.000 | % | | | 1,000,000 | | | | 1,224,170 | | |
09/01/30 | | | 5.000 | % | | | 815,000 | | | | 980,624 | | |
09/01/31 | | | 5.000 | % | | | 590,000 | | | | 705,286 | | |
Municipal Bonds (continued)
Issue
Description | | Coupon
Rate | | Principal
Amount ($) | |
Value ($) | |
Fontana Public Finance Authority
Subordinated Tax Allocation Bonds
Lien-North Fontana Redevelopment
Series 2005A (AMBAC)
10/01/20 | | | 5.000 | % | | | 1,515,000 | | | | 1,520,590 | | |
Garden Grove Agency Community Development Successor Agency
Refunding Tax Allocation Bonds
Garden Grove Community Project
Series 2016 (BAM)
10/01/30 | | | 5.000 | % | | | 1,040,000 | | | | 1,273,605 | | |
10/01/31 | | | 5.000 | % | | | 1,640,000 | | | | 2,001,505 | | |
Glendale Redevelopment Agency Successor Agency
Refunding Tax Allocation Bonds
Central Glendale Redevelopment
Subordinated Series 2013 (AGM)
12/01/21 | | | 5.000 | % | | | 755,000 | | | | 903,977 | | |
Inglewood Redevelopment Agency
Refunding Tax Allocation Bonds
Merged Redevelopment Project
Series 1998A (AMBAC)
05/01/17 | | | 5.250 | % | | | 1,425,000 | | | | 1,463,674 | | |
Irvine Unified School District
Refunding Special Tax Bonds
Series 2015
09/01/30 | | | 5.000 | % | | | 2,065,000 | | | | 2,522,129 | | |
09/01/31 | | | 5.000 | % | | | 2,720,000 | | | | 3,309,152 | | |
Jurupa Public Financing Authority
Refunding Special Tax Bonds
Series 2014A
09/01/29 | | | 5.000 | % | | | 530,000 | | | | 634,596 | | |
09/01/30 | | | 5.000 | % | | | 625,000 | | | | 744,869 | | |
09/01/32 | | | 5.000 | % | | | 625,000 | | | | 738,838 | | |
La Quinta Redevelopment Agency Successor Agency
Refunding Tax Allocation Bonds
Redevelopment Project
Subordinated Series 2013A
09/01/30 | | | 5.000 | % | | | 1,500,000 | | | | 1,740,870 | | |
Long Beach Bond Finance Authority
Tax Allocation Bonds
Industrial Redevelopment Project Areas
Series 2002B (AMBAC)
11/01/19 | | | 5.500 | % | | | 1,070,000 | | | | 1,224,947 | | |
Los Angeles Community Facilities District
Refunding Special Tax Bonds
Playa Vista-Phase 1
Series 2014
09/01/30 | | | 5.000 | % | | | 1,000,000 | | | | 1,165,530 | | |
Los Angeles County Redevelopment Authority
Refunding Tax Allocation Bonds
Los Angeles Bunker Hill Project
Series 2014C (AGM)
12/01/28 | | | 5.000 | % | | | 3,000,000 | | | | 3,652,980 | | |
The accompanying Notes to Financial Statements are an integral part of this statement.
Annual Report 2016
13
COLUMBIA AMT-FREE CALIFORNIA INTERMEDIATE MUNI BOND FUND
PORTFOLIO OF INVESTMENTS (continued)
April 30, 2016
Municipal Bonds (continued)
Issue
Description | | Coupon
Rate | | Principal
Amount ($) | |
Value ($) | |
Oakland Redevelopment Successor Agency
Subordinated Refunding Tax Allocation Bonds
Series 2013
09/01/22 | | | 5.000 | % | | | 2,000,000 | | | | 2,402,520 | | |
Poway Unified School District Public Financing Authority
Special Tax Refunding Bonds
Series 2015B
09/01/26 | | | 5.000 | % | | | 995,000 | | | | 1,211,174 | | |
Poway Unified School District
Special Tax Bonds
Community Facilities District No. 6-4S Ranch
Series 2012
09/01/28 | | | 5.000 | % | | | 1,775,000 | | | | 2,025,381 | | |
09/01/29 | | | 5.000 | % | | | 1,200,000 | | | | 1,365,264 | | |
Rancho Cucamonga Redevelopment Agency Successor Agency
Tax Allocation Bonds
Rancho Redevelopment Project Area
Series 2014
09/01/30 | | | 5.000 | % | | | 700,000 | | | | 838,733 | | |
Series 2014 (AGM)
09/01/27 | | | 5.000 | % | | | 2,200,000 | | | | 2,685,650 | | |
Riverside County Public Financing Authority
Refunding Tax Allocation Bonds
Project Area #1-Desert Communities
Series 2016 (BAM)(d)
10/01/31 | | | 4.000 | % | | | 2,500,000 | | | | 2,766,200 | | |
San Francisco City & County Redevelopment Agency
Refunding Tax Allocation Bonds
Mission Bay North Redevelopment Project
Series 2016
08/01/30 | | | 5.000 | % | | | 275,000 | | | | 340,896 | | |
08/01/31 | | | 5.000 | % | | | 355,000 | | | | 437,729 | | |
Mission Bay South Redevelopment Project
Series 2016
08/01/31 | | | 5.000 | % | | | 670,000 | | | | 817,286 | | |
08/01/32 | | | 5.000 | % | | | 580,000 | | | | 704,578 | | |
Tax Allocation Bonds
Mission Bay South Redevelopment Project
Series 2014A
08/01/29 | | | 5.000 | % | | | 225,000 | | | | 267,023 | | |
08/01/30 | | | 5.000 | % | | | 175,000 | | | | 206,932 | | |
San Francisco Redevelopment Projects
Series 2009B
08/01/18 | | | 5.000 | % | | | 1,255,000 | | | | 1,366,067 | | |
San Mateo Redevelopment Agency Successor Agency
Refunding Tax Allocation Bonds
Series 2015A
08/01/28 | | | 5.000 | % | | | 1,860,000 | | | | 2,251,139 | | |
08/01/29 | | | 5.000 | % | | | 1,000,000 | | | | 1,204,170 | | |
Semitropic Improvement District
Refunding Revenue Bonds
Series 2015A 2nd Lien (AGM)
12/01/23 | | | 5.000 | % | | | 300,000 | | | | 374,514 | | |
12/01/24 | | | 5.000 | % | | | 400,000 | | | | 507,224 | | |
Municipal Bonds (continued)
Issue
Description | | Coupon
Rate | | Principal
Amount ($) | |
Value ($) | |
Sulphur Springs Union School District
Unrefunded Special Tax Bonds
Community Facilities District
Series 2012
09/01/28 | | | 5.000 | % | | | 530,000 | | | | 604,762 | | |
09/01/29 | | | 5.000 | % | | | 595,000 | | | | 676,943 | | |
Tustin Community Facilities District
Refunding Special Tax Bonds
Legacy Villages of Columbus #06-1
Series 2015
09/01/29 | | | 5.000 | % | | | 1,200,000 | | | | 1,434,456 | | |
Tustin Community Redevelopment Agency
Tax Allocation Bonds
MCAS-Tustin Redevelopment Project Area
Series 2010
09/01/25 | | | 5.000 | % | | | 1,250,000 | | | | 1,386,925 | | |
Vista Redevelopment Agency Successor Agency
Tax Allocation Refunding Bonds
Series 2015B1 (AGM)
09/01/24 | | | 5.000 | % | | | 580,000 | | | | 726,665 | | |
09/01/26 | | | 5.000 | % | | | 700,000 | | | | 877,604 | | |
Total | | | | | | | 63,092,944 | | |
STATE APPROPRIATED 5.0% | |
California State Public Works Board
Refunding Revenue Bonds
Various Capital Projects
Series 2012G
11/01/28 | | | 5.000 | % | | | 1,500,000 | | | | 1,814,085 | | |
Revenue Bonds
Department of Corrections and Rehabilitation
Series 2014C
10/01/22 | | | 5.000 | % | | | 1,925,000 | | | | 2,358,818 | | |
Series 2015A
06/01/28 | | | 5.000 | % | | | 1,175,000 | | | | 1,458,328 | | |
Department of General Services
Series 2006A
04/01/28 | | | 5.000 | % | | | 1,000,000 | | | | 1,000,250 | | |
Various Capital Projects
Series 2011A
10/01/20 | | | 5.000 | % | | | 2,000,000 | | | | 2,341,400 | | |
Series 2013I
11/01/28 | | | 5.250 | % | | | 3,000,000 | | | | 3,733,890 | | |
Series 2014E
09/01/30 | | | 5.000 | % | | | 1,500,000 | | | | 1,825,155 | | |
Subordinated Series 2009I-1
11/01/17 | | | 5.000 | % | | | 2,000,000 | | | | 2,129,600 | | |
Subordinated Series 2010A-1
03/01/22 | | | 5.250 | % | | | 2,000,000 | | | | 2,336,760 | | |
Various Correctional Facilities
Series 2014A
09/01/31 | | | 5.000 | % | | | 3,000,000 | | | | 3,641,790 | | |
Total | | | | | | | 22,640,076 | | |
The accompanying Notes to Financial Statements are an integral part of this statement.
Annual Report 2016
14
COLUMBIA AMT-FREE CALIFORNIA INTERMEDIATE MUNI BOND FUND
PORTFOLIO OF INVESTMENTS (continued)
April 30, 2016
Municipal Bonds (continued)
Issue
Description | | Coupon
Rate | | Principal
Amount ($) | |
Value ($) | |
STATE GENERAL OBLIGATION 4.9% | |
State of California
Unlimited General Obligation Bonds
Series 2010
11/01/24 | | | 5.000 | % | | | 5,000,000 | | | | 5,905,600 | | |
Various Purpose
Series 2009
04/01/26 | | | 5.625 | % | | | 2,000,000 | | | | 2,283,780 | | |
10/01/29 | | | 5.250 | % | | | 1,500,000 | | | | 1,716,660 | | |
Series 2011
10/01/19 | | | 5.000 | % | | | 4,000,000 | | | | 4,557,240 | | |
Unlimited General Obligation Refunding Bonds
Series 2007
08/01/18 | | | 5.000 | % | | | 3,750,000 | | | | 3,876,075 | | |
Series 2014
08/01/32 | | | 5.000 | % | | | 3,000,000 | | | | 3,676,560 | | |
Total | | | | | | | 22,015,915 | | |
TOBACCO 1.1% | |
Golden State Tobacco Securitization Corp.
Asset-Backed Refunding Revenue Bonds
Series 2015A
06/01/33 | | | 5.000 | % | | | 4,000,000 | | | | 4,826,520 | | |
TURNPIKE / BRIDGE / TOLL ROAD 1.4% | |
Foothill-Eastern Transportation Corridor Agency
Subordinated Refunding Revenue Bonds
Series 2014B-3
01/15/53 | | | 5.500 | % | | | 3,000,000 | | | | 3,583,170 | | |
Foothill-Eastern Transportation Corridor Agency(a)
Refunding Revenue Bonds
Series 2015
01/15/33 | | | 0.000 | % | | | 5,000,000 | | | | 2,558,450 | | |
Total | | | | | | | 6,141,620 | | |
WATER & SEWER 6.3% | |
City of Fresno Sewer System
Revenue Bonds
Series 2008A
09/01/23 | | | 5.000 | % | | | 1,000,000 | | | | 1,097,610 | | |
City of Los Angeles Wastewater System
Unrefunded Revenue Bonds
Series 2009A
06/01/25 | | | 5.750 | % | | | 890,000 | | | | 1,016,585 | | |
City of Tulare Sewer
Refunding Revenue Bonds
Series 2015 (AGM)
11/15/25 | | | 5.000 | % | | | 700,000 | | | | 892,290 | | |
11/15/26 | | | 5.000 | % | | | 1,000,000 | | | | 1,257,760 | | |
Clovis Public Financing Authority
Revenue Bonds
Series 2007 (AMBAC)
08/01/21 | | | 5.000 | % | | | 1,000,000 | | | | 1,049,260 | | |
Municipal Bonds (continued)
Issue
Description | | Coupon
Rate | | Principal
Amount ($) | |
Value ($) | |
Eastern Municipal Water District
Refunding Revenue Bonds
Series 2016A(e)
07/01/38 | | | 0.500 | % | | | 2,500,000 | | | | 2,500,000 | | |
Irvine Ranch Water District
Refunding Special Assessment Bonds
Series 2016A-2(e)
10/01/37 | | | 0.490 | % | | | 3,000,000 | | | | 3,000,000 | | |
Kern County Water Agency Improvement District No. 4
Refunding Revenue Bonds
Series 2016A (AGM)
05/01/27 | | | 5.000 | % | | | 2,300,000 | | | | 2,870,906 | | |
Los Angeles County Sanitation Districts Financing Authority
Subordinated Refunding Revenue Bonds
Capital Projects — District #14
Series 2015
10/01/24 | | | 5.000 | % | | | 1,050,000 | | | | 1,338,298 | | |
10/01/25 | | | 5.000 | % | | | 1,100,000 | | | | 1,417,559 | | |
Oxnard Financing Authority
Revenue Bonds
Project
Series 2006
06/01/31 | | | 5.000 | % | | | 4,315,000 | | | | 4,330,577 | | |
San Diego Public Facilities Financing Authority Water
Refunding Revenue Bonds
Series 2010A
08/01/24 | | | 5.000 | % | | | 2,000,000 | | | | 2,338,540 | | |
Semitropic Improvement District
Refunding Revenue Bonds
Series 2012A
12/01/23 | | | 5.000 | % | | | 2,850,000 | | | | 3,473,181 | | |
Stockton Public Financing Authority
Refunding Revenue Bonds
Series 2014 (BAM)
09/01/28 | | | 5.000 | % | | | 1,500,000 | | | | 1,793,925 | | |
Total | | | | | | | 28,376,491 | | |
Total Municipal Bonds
(Cost: $381,496,242) | | | | | | | 413,842,395 | | |
Floating Rate Notes 1.7%
Issue
Description | | Effective
Yield | | Principal
Amount ($) | |
Value ($) | |
California Infrastructure & Economic Development Bank(e)(f)
Refunding Revenue Bonds
Los Angeles Museum
VRDN Series 2008 (Wells Fargo Bank)
09/01/37 | | | 0.240 | % | | | 900,000 | | | | 900,000 | | |
VRDN Series 2008A (Wells Fargo Bank)
09/01/37 | | | 0.240 | % | | | 500,000 | | | | 500,000 | | |
The accompanying Notes to Financial Statements are an integral part of this statement.
Annual Report 2016
15
COLUMBIA AMT-FREE CALIFORNIA INTERMEDIATE MUNI BOND FUND
PORTFOLIO OF INVESTMENTS (continued)
April 30, 2016
Floating Rate Notes (continued)
Issue
Description | | Effective
Yield | | Principal
Amount ($) | |
Value ($) | |
California Statewide Communities Development Authority
Revenue Bonds
John Muir Health
VRDN Series 2008C (Wells Fargo Bank)(e)(f)
08/15/27 | | | 0.230 | % | | | 2,480,000 | | | | 2,480,000 | | |
Calleguas-Las Virgenes Public Financing Authority
Refunding Revenue Bonds
Municipal Water District Project
VRDN Series 2008A (Wells Fargo Bank)(e)(f)
07/01/37 | | | 0.380 | % | | | 3,000,000 | | | | 3,000,000 | | |
State of California
Unlimited General Obligation Bonds
VRDN Series 2003A-1 (JPMorgan Chase Bank)(e)(f)
05/01/33 | | | 0.220 | % | | | 865,000 | | | | 865,000 | | |
Total Floating Rate Notes
(Cost: $7,745,000) | | | | | | | 7,745,000 | | |
Municipal Short Term 3.6%
DISPOSAL 0.9% | |
California Municipal Finance Authority
Refunding Revenue Bonds
Republic Services, Inc.
VRDN Series 2010(e)
09/01/21 | | | 0.650 | % | | | 4,000,000 | | | | 4,000,000 | | |
Municipal Short Term (continued)
Issue
Description | | Effective
Yield | | Principal
Amount ($) | |
Value ($) | |
LOCAL APPROPRIATION 0.9% | |
Golden Empire Schools Financing Authority
Refunding Revenue Bonds
Kern High School District Project
Series 2015(e)
05/01/16 | | | 0.610 | % | | | 4,000,000 | | | | 3,999,939 | | |
SPECIAL NON PROPERTY TAX 0.9% | |
County of Riverside
Revenue Notes
Series 2015D
10/12/16 | | | 0.490 | % | | | 4,000,000 | | | | 4,027,160 | | |
WATER & SEWER 0.9% | |
Metropolitan Water District of Southern California
Refunding Revenue Bonds
VRDN Series 2011A-4(e)
07/01/36 | | | 0.790 | % | | | 4,000,000 | | | | 3,996,280 | | |
Total Municipal Short Term
(Cost: $16,030,552) | | | | | | | 16,023,379 | | |
Total Investments
(Cost: $405,271,794) | | | | | | | 437,610,774 | | |
Other Assets & Liabilities, Net | | | | | | | 11,734,786 | | |
Net Assets | | | | | | | 449,345,560 | | |
Notes to Portfolio of Investments
(a) Zero coupon bond.
(b) Represents privately placed and other securities and instruments exempt from SEC registration (collectively, private placements), such as Section 4(a)(2) and Rule 144A eligible securities, which are often sold only to qualified institutional buyers. The Fund may invest in private placements determined to be liquid as well as those determined to be illiquid. Private placements may be determined to be liquid under guidelines established by the Fund's Board of Trustees. At April 30, 2016, the value of these securities amounted to $8,725,966 or 1.94% of net assets.
(c) Municipal obligations include debt obligations issued by or on behalf of territories, possessions, or sovereign nations within the territorial boundaries of the United States. At April 30, 2016, the value of these securities amounted to $3,674,456 or 0.82% of net assets.
(d) Security, or a portion thereof, has been purchased on a when-issued or delayed delivery basis.
(e) Variable rate security.
(f) The Fund is entitled to receive principal and interest from the guarantor after a day or a week's notice or upon maturity. The maturity date disclosed represents the final maturity.
Abbreviation Legend
AGM Assured Guaranty Municipal Corporation
AMBAC Ambac Assurance Corporation
BAM Build America Mutual Assurance Co.
BAN Bond Anticipation Note
NPFGC National Public Finance Guarantee Corporation
VRDN Variable Rate Demand Note
The accompanying Notes to Financial Statements are an integral part of this statement.
Annual Report 2016
16
COLUMBIA AMT-FREE CALIFORNIA INTERMEDIATE MUNI BOND FUND
PORTFOLIO OF INVESTMENTS (continued)
April 30, 2016
Fair Value Measurements
The Fund categorizes its fair value measurements according to a three-level hierarchy that maximizes the use of observable inputs and minimizes the use of unobservable inputs by prioritizing that the most observable input be used when available. Observable inputs are those that market participants would use in pricing an investment based on market data obtained from sources independent of the reporting entity. Unobservable inputs are those that reflect the Fund's assumptions about the information market participants would use in pricing an investment. An investment's level within the fair value hierarchy is based on the lowest level of any input that is deemed significant to the asset's or liability's fair value measurement. The input levels are not necessarily an indication of the risk or liquidity associated with investments at that level. For example, certain U.S. government securities are generally high quality and liquid, however, they are reflected as Level 2 because the inputs used to determine fair value may not always be quoted prices in an active market.
Fair value inputs are summarized in the three broad levels listed below:
> Level 1 — Valuations based on quoted prices for investments in active markets that the Fund has the ability to access at the measurement date (including NAV for open-end mutual funds). Valuation adjustments are not applied to Level 1 investments.
> Level 2 — Valuations based on other significant observable inputs (including quoted prices for similar securities, interest rates, prepayment speeds, credit risks, etc.).
> Level 3 — Valuations based on significant unobservable inputs (including the Fund's own assumptions and judgment in determining the fair value of investments).
Inputs that are used in determining fair value of an investment may include price information, credit data, volatility statistics, and other factors. These inputs can be either observable or unobservable. The availability of observable inputs can vary between investments, and is affected by various factors such as the type of investment, and the volume and level of activity for that investment or similar investments in the marketplace. The inputs will be considered by the Investment Manager, along with any other relevant factors in the calculation of an investment's fair value. The Fund uses prices and inputs that are current as of the measurement date, which may include periods of market dislocations. During these periods, the availability of prices and inputs may be reduced for many investments. This condition could cause an investment to be reclassified between the various levels within the hierarchy.
Investments falling into the Level 3 category are primarily supported by quoted prices from brokers and dealers participating in the market for those investments. However, these may be classified as Level 3 investments due to lack of market transparency and corroboration to support these quoted prices. Additionally, valuation models may be used as the pricing source for any remaining investments classified as Level 3. These models may rely on one or more significant unobservable inputs and/or significant assumptions by the Investment Manager. Inputs used in valuations may include, but are not limited to, financial statement analysis, capital account balances, discount rates and estimated cash flows, and comparable company data.
Under the direction of the Fund's Board of Trustees (the Board), the Investment Manager's Valuation Committee (the Committee) is responsible for overseeing the valuation procedures approved by the Board. The Committee consists of voting and non-voting members from various groups within the Investment Manager's organization, including operations and accounting, trading and investments, compliance, risk management and legal.
The Committee meets at least monthly to review and approve valuation matters, which may include a description of specific valuation determinations, data regarding pricing information received from approved pricing vendors and brokers and the results of Board-approved valuation control policies and procedures (the Policies). The Policies address, among other things, instances when market quotations are or are not readily available, including recommendations of third party pricing vendors and a determination of appropriate pricing methodologies; events that require specific valuation determinations and assessment of fair value techniques; securities with a potential for stale pricing, including those that are illiquid, restricted, or in default; and the effectiveness of third party pricing vendors, including periodic reviews of vendors. The Committee meets more frequently, as needed, to discuss additional valuation matters, which may include the need to review back-testing results, review time-sensitive information or approve related valuation actions. The Committee reports to the Board, with members of the Committee meeting with the Board at each of its regularly scheduled meetings to discuss valuation matters and actions during the period, similar to those described earlier.
For investments categorized as Level 3, the Committee monitors information similar to that described above, which may include: (i) data specific to the issuer or comparable issuers, (ii) general market or specific sector news and (iii) quoted prices and specific or similar security transactions. The Committee considers this data and any changes from prior periods in order to assess the reasonableness of observable and unobservable inputs, any assumptions or internal models used to value those securities and changes in fair value. This data is also used to corroborate, when available, information received from approved pricing vendors and brokers. Various factors impact the frequency of monitoring this information (which may occur as often as daily). However, the Committee may determine that changes to inputs, assumptions and models are not required as a result of the monitoring procedures performed.
The accompanying Notes to Financial Statements are an integral part of this statement.
Annual Report 2016
17
COLUMBIA AMT-FREE CALIFORNIA INTERMEDIATE MUNI BOND FUND
PORTFOLIO OF INVESTMENTS (continued)
April 30, 2016
Fair Value Measurements (continued)
The following table is a summary of the inputs used to value the Fund's investments at April 30, 2016:
| | | Level 1
Quoted Prices in Active
Markets for Identical
Assets ($) | | Level 2
Other Significant
Observable Inputs ($) | | Level 3
Significant
Unobservable Inputs ($) | | Total ($) | |
Investments | |
Municipal Bonds | | | — | | | | 413,842,395 | | | | — | | | | 413,842,395 | | |
Floating Rate Notes | | | — | | | | 7,745,000 | | | | — | | | | 7,745,000 | | |
Municipal Short Term | | | — | | | | 16,023,379 | | | | — | | | | 16,023,379 | | |
Total Investments | | | — | | | | 437,610,774 | | | | — | | | | 437,610,774 | | |
See the Portfolio of Investments for all investment classifications not indicated in the table.
The Fund's assets assigned to the Level 2 input category are generally valued using the market approach, in which a security's value is determined through reference to prices and information from market transactions for similar or identical assets.
There were no transfers of financial assets between levels during the period.
The accompanying Notes to Financial Statements are an integral part of this statement.
Annual Report 2016
18
COLUMBIA AMT-FREE CALIFORNIA INTERMEDIATE MUNI BOND FUND
STATEMENT OF ASSETS AND LIABILITIES
April 30, 2016
Assets | |
Investments, at value | |
(identified cost $405,271,794) | | $ | 437,610,774 | | |
Cash | | | 9,958,019 | | |
Receivable for: | |
Investments sold | | | 35,002 | | |
Capital shares sold | | | 1,285,461 | | |
Interest | | | 4,773,100 | | |
Expense reimbursement due from Investment Manager | | | 2,400 | | |
Prepaid expenses | | | 895 | | |
Other assets | | | 5,394 | | |
Total assets | | | 453,671,045 | | |
Liabilities | |
Payable for: | |
Investments purchased on a delayed delivery basis | | | 2,764,000 | | |
Capital shares purchased | | | 393,480 | | |
Dividend distributions to shareholders | | | 983,067 | | |
Investment management fees | | | 5,724 | | |
Distribution and/or service fees | | | 751 | | |
Transfer agent fees | | | 65,831 | | |
Compensation of board members | | | 79,165 | | |
Other expenses | | | 33,467 | | |
Total liabilities | | | 4,325,485 | | |
Net assets applicable to outstanding capital stock | | $ | 449,345,560 | | |
Represented by | |
Paid-in capital | | $ | 419,967,418 | | |
Excess of distributions over net investment income | | | (85,154 | ) | |
Accumulated net realized loss | | | (2,875,684 | ) | |
Unrealized appreciation (depreciation) on: | |
Investments | | | 32,338,980 | | |
Total — representing net assets applicable to outstanding capital stock | | $ | 449,345,560 | | |
The accompanying Notes to Financial Statements are an integral part of this statement.
Annual Report 2016
19
COLUMBIA AMT-FREE CALIFORNIA INTERMEDIATE MUNI BOND FUND
STATEMENT OF ASSETS AND LIABILITIES (continued)
April 30, 2016
Class A | |
Net assets | | $ | 51,869,242 | | |
Shares outstanding | | | 4,837,556 | | |
Net asset value per share | | $ | 10.72 | | |
Maximum offering price per share(a) | | $ | 11.05 | | |
Class B | |
Net assets | | $ | 10,414 | | |
Shares outstanding | | | 971 | | |
Net asset value per share(b) | | $ | 10.72 | | |
Class C | |
Net assets | | $ | 14,549,418 | | |
Shares outstanding | | | 1,357,783 | | |
Net asset value per share | | $ | 10.72 | | |
Class R4 | |
Net assets | | $ | 1,457,131 | | |
Shares outstanding | | | 136,290 | | |
Net asset value per share | | $ | 10.69 | | |
Class R5 | |
Net assets | | $ | 2,829,342 | | |
Shares outstanding | | | 265,233 | | |
Net asset value per share | | $ | 10.67 | | |
Class Z | |
Net assets | | $ | 378,630,013 | | |
Shares outstanding | | | 35,395,073 | | |
Net asset value per share | | $ | 10.70 | | |
(a) The maximum offering price per share is calculated by dividing the net asset value per share by 1.0 minus the maximum sales charge of 3.00%.
(b) Net asset value per share rounds to this amount due to fractional shares outstanding.
The accompanying Notes to Financial Statements are an integral part of this statement.
Annual Report 2016
20
COLUMBIA AMT-FREE CALIFORNIA INTERMEDIATE MUNI BOND FUND
STATEMENT OF OPERATIONS
Year Ended April 30, 2016
Net investment income | |
Income: | |
Interest | | $ | 13,667,151 | | |
Total income | | | 13,667,151 | | |
Expenses: | |
Investment management fees | | | 1,929,151 | | |
Distribution and/or service fees | |
Class A | | | 119,898 | | |
Class B | | | 102 | | |
Class C | | | 141,919 | | |
Transfer agent fees | |
Class A | | | 94,163 | | |
Class B | | | 19 | | |
Class C | | | 27,870 | | |
Class R4 | | | 2,976 | | |
Class R5 | | | 1,253 | | |
Class Z | | | 679,394 | | |
Compensation of board members | | | 13,449 | | |
Custodian fees | | | 3,851 | | |
Printing and postage fees | | | 23,562 | | |
Registration fees | | | 24,787 | | |
Audit fees | | | 24,308 | | |
Legal fees | | | 9,812 | | |
Other | | | 16,205 | | |
Total expenses | | | 3,112,719 | | |
Fees waived or expenses reimbursed by Investment Manager and its affiliates | | | (837,581 | ) | |
Expense reductions | | | (20 | ) | |
Total net expenses | | | 2,275,118 | | |
Net investment income | | | 11,392,033 | | |
Realized and unrealized gain (loss) — net | |
Net realized gain (loss) on: | |
Investments | | | (495,635 | ) | |
Net realized loss | | | (495,635 | ) | |
Net change in unrealized appreciation (depreciation) on: | |
Investments | | | 9,771,491 | | |
Net change in unrealized appreciation | | | 9,771,491 | | |
Net realized and unrealized gain | | | 9,275,856 | | |
Net increase in net assets resulting from operations | | $ | 20,667,889 | | |
The accompanying Notes to Financial Statements are an integral part of this statement.
Annual Report 2016
21
COLUMBIA AMT-FREE CALIFORNIA INTERMEDIATE MUNI BOND FUND
STATEMENT OF CHANGES IN NET ASSETS
| | | Year Ended
April 30,
2016 | | Year Ended
April 30,
2015 | |
Operations | |
Net investment income | | $ | 11,392,033 | | | $ | 10,000,688 | | |
Net realized loss | | | (495,635 | ) | | | (1,281 | ) | |
Net change in unrealized appreciation | | | 9,771,491 | | | | 1,515,978 | | |
Net increase in net assets resulting from operations | | | 20,667,889 | | | | 11,515,385 | | |
Distributions to shareholders | |
Net investment income | |
Class A | | | (1,239,276 | ) | | | (1,074,583 | ) | |
Class B | | | (188 | ) | | | (421 | ) | |
Class C | | | (260,473 | ) | | | (200,400 | ) | |
Class R4 | | | (43,037 | ) | | | (12,902 | ) | |
Class R5 | | | (73,549 | ) | | | (22,116 | ) | |
Class Z | | | (9,808,850 | ) | | | (8,690,266 | ) | |
Total distributions to shareholders | | | (11,425,373 | ) | | | (10,000,688 | ) | |
Increase in net assets from capital stock activity | | | 48,008,321 | | | | 87,667,644 | | |
Total increase in net assets | | | 57,250,837 | | | | 89,182,341 | | |
Net assets at beginning of year | | | 392,094,723 | | | | 302,912,382 | | |
Net assets at end of year | | $ | 449,345,560 | | | $ | 392,094,723 | | |
Excess of distributions over net investment income | | $ | (85,154 | ) | | $ | (51,814 | ) | |
The accompanying Notes to Financial Statements are an integral part of this statement.
Annual Report 2016
22
COLUMBIA AMT-FREE CALIFORNIA INTERMEDIATE MUNI BOND FUND
STATEMENT OF CHANGES IN NET ASSETS (continued)
| | | Year Ended April 30, 2016 | | Year Ended April 30, 2015 | |
| | | Shares | | Dollars ($) | | Shares | | Dollars ($) | |
Capital stock activity | |
Class A shares | |
Subscriptions(a) | | | 1,760,681 | | | | 18,548,397 | | | | 2,291,743 | | | | 24,199,329 | | |
Distributions reinvested | | | 108,356 | | | | 1,142,708 | | | | 90,286 | | | | 953,387 | | |
Redemptions | | | (1,539,501 | ) | | | (16,170,145 | ) | | | (1,053,451 | ) | | | (11,111,547 | ) | |
Net increase | | | 329,536 | | | | 3,520,960 | | | | 1,328,578 | | | | 14,041,169 | | |
Class B shares | |
Distributions reinvested | | | — | | | | — | | | | 13 | | | | 138 | | |
Redemptions(a) | | | (1 | ) | | | (11 | ) | | | (1,595 | ) | | | (16,945 | ) | |
Net decrease | | | (1 | ) | | | (11 | ) | | | (1,582 | ) | | | (16,807 | ) | |
Class C shares | |
Subscriptions | | | 414,836 | | | | 4,369,494 | | | | 533,207 | | | | 5,625,853 | | |
Distributions reinvested | | | 17,992 | | | | 189,597 | | | | 11,379 | | | | 120,081 | | |
Redemptions | | | (310,920 | ) | | | (3,289,449 | ) | | | (196,967 | ) | | | (2,076,929 | ) | |
Net increase | | | 121,908 | | | | 1,269,642 | | | | 347,619 | | | | 3,669,005 | | |
Class R4 shares | |
Subscriptions | | | 250,266 | | | | 2,610,592 | | | | 49,334 | | | | 517,033 | | |
Distributions reinvested | | | 4,055 | | | | 42,747 | | | | 1,195 | | | | 12,592 | | |
Redemptions | | | (168,599 | ) | | | (1,777,812 | ) | | | (4,937 | ) | | | (51,942 | ) | |
Net increase | | | 85,722 | | | | 875,527 | | | | 45,592 | | | | 477,683 | | |
Class R5 shares | |
Subscriptions | | | 171,807 | | | | 1,797,462 | | | | 133,477 | | | | 1,402,820 | | |
Distributions reinvested | | | 6,974 | | | | 73,249 | | | | 2,074 | | | | 21,798 | | |
Redemptions | | | (80,014 | ) | | | (843,943 | ) | | | (1,943 | ) | | | (20,390 | ) | |
Net increase | | | 98,767 | | | | 1,026,768 | | | | 133,608 | | | | 1,404,228 | | |
Class Z shares | |
Subscriptions | | | 9,935,309 | | | | 104,477,029 | | | | 9,983,716 | | | | 105,228,613 | | |
Distributions reinvested | | | 163,982 | | | | 1,725,626 | | | | 144,640 | | | | 1,523,915 | | |
Redemptions | | | (6,173,525 | ) | | | (64,887,220 | ) | | | (3,672,605 | ) | | | (38,660,162 | ) | |
Net increase | | | 3,925,766 | | | | 41,315,435 | | | | 6,455,751 | | | | 68,092,366 | | |
Total net increase | | | 4,561,698 | | | | 48,008,321 | | | | 8,309,566 | | | | 87,667,644 | | |
(a) Includes conversions of Class B shares to Class A shares, if any.
The accompanying Notes to Financial Statements are an integral part of this statement.
Annual Report 2016
23
COLUMBIA AMT-FREE CALIFORNIA INTERMEDIATE MUNI BOND FUND
The following tables are intended to help you understand the Fund's financial performance. Certain information reflects financial results for a single share of a class held for the periods shown. Per share net investment income (loss) amounts are calculated based on average shares outstanding during the period. Total return assumes reinvestment of all dividends and distributions, if any. Total return does not reflect payment of sales charges, if any. Total return and portfolio turnover are not annualized for periods of less than one year. The portfolio turnover rate is calculated without regard to purchase and sales transactions of short-term instruments and certain derivatives, if any. If such transactions were included, the Fund's portfolio turnover rate may be higher.
| | | Year Ended April 30, | | Year Ended
March 31, | |
Class A | | 2016 | | 2015 | | 2014 | | 2013 | | 2012(a) | | 2012 | |
Per share data | |
Net asset value, beginning of period | | $ | 10.50 | | | $ | 10.42 | | | $ | 10.68 | | | $ | 10.47 | | | $ | 10.37 | | | $ | 9.65 | | |
Income from investment operations: | |
Net investment income | | | 0.27 | | | | 0.29 | | | | 0.32 | | | | 0.32 | | | | 0.03 | | | | 0.32 | | |
Net realized and unrealized gain (loss) | | | 0.22 | | | | 0.08 | | | | (0.26 | ) | | | 0.21 | | | | 0.10 | | | | 0.72 | | |
Total from investment operations | | | 0.49 | | | | 0.37 | | | | 0.06 | | | | 0.53 | | | | 0.13 | | | | 1.04 | | |
Less distributions to shareholders: | |
Net investment income | | | (0.27 | ) | | | (0.29 | ) | | | (0.32 | ) | | | (0.32 | ) | | | (0.03 | ) | | | (0.32 | ) | |
Total distributions to shareholders | | | (0.27 | ) | | | (0.29 | ) | | | (0.32 | ) | | | (0.32 | ) | | | (0.03 | ) | | | (0.32 | ) | |
Net asset value, end of period | | $ | 10.72 | | | $ | 10.50 | | | $ | 10.42 | | | $ | 10.68 | | | $ | 10.47 | | | $ | 10.37 | | |
Total return | | | 4.76 | % | | | 3.60 | % | | | 0.64 | % | | | 5.12 | % | | | 1.22 | % | | | 10.87 | % | |
Ratios to average net assets(b) | |
Total gross expenses | | | 0.94 | % | | | 0.95 | % | | | 0.96 | % | | | 0.96 | % | | | 1.00 | %(c) | | | 1.00 | % | |
Total net expenses(d) | | | 0.74 | %(e) | | | 0.74 | %(e) | | | 0.74 | %(e) | | | 0.73 | %(e) | | | 0.73 | %(c) | | | 0.74 | %(e) | |
Net investment income | | | 2.58 | % | | | 2.76 | % | | | 3.10 | % | | | 3.01 | % | | | 3.11 | %(c) | | | 3.13 | % | |
Supplemental data | |
Net assets, end of period (in thousands) | | $ | 51,869 | | | $ | 47,317 | | | $ | 33,140 | | | $ | 29,398 | | | $ | 20,180 | | | $ | 18,858 | | |
Portfolio turnover | | | 8 | % | | | 6 | % | | | 12 | % | | | 8 | % | | | 0 | % | | | 9 | % | |
Notes to Financial Highlights
(a) For the period from April 1, 2012 to April 30, 2012. During the period, the Fund's fiscal year end was changed from March 31 to April 30.
(b) In addition to the fees and expenses that the Fund bears directly, the Fund indirectly bears a pro rata share of the fees and expenses of any other funds in which it invests. Such indirect expenses are not included in the Fund's reported expense ratios.
(c) Annualized.
(d) Total net expenses include the impact of certain fee waivers/expense reimbursements made by the Investment Manager and certain of its affiliates, if applicable.
(e) The benefits derived from expense reductions had an impact of less than 0.01%.
The accompanying Notes to Financial Statements are an integral part of this statement.
Annual Report 2016
24
COLUMBIA AMT-FREE CALIFORNIA INTERMEDIATE MUNI BOND FUND
FINANCIAL HIGHLIGHTS (continued)
| | | Year Ended April 30, | | Year Ended
March 31, | |
Class B | | 2016 | | 2015 | | 2014 | | 2013 | | 2012(a) | | 2012 | |
Per share data | |
Net asset value, beginning of period | | $ | 10.50 | | | $ | 10.42 | | | $ | 10.68 | | | $ | 10.47 | | | $ | 10.37 | | | $ | 9.64 | | |
Income from investment operations: | |
Net investment income | | | 0.19 | | | | 0.22 | | | | 0.24 | | | | 0.24 | | | | 0.02 | | | | 0.25 | | |
Net realized and unrealized gain (loss) | | | 0.22 | | | | 0.07 | | | | (0.26 | ) | | | 0.21 | | | | 0.10 | | | | 0.71 | | |
Total from investment operations | | | 0.41 | | | | 0.29 | | | | (0.02 | ) | | | 0.45 | | | | 0.12 | | | | 0.96 | | |
Less distributions to shareholders: | |
Net investment income | | | (0.19 | ) | | | (0.21 | ) | | | (0.24 | ) | | | (0.24 | ) | | | (0.02 | ) | | | (0.23 | ) | |
Total distributions to shareholders | | | (0.19 | ) | | | (0.21 | ) | | | (0.24 | ) | | | (0.24 | ) | | | (0.02 | ) | | | (0.23 | ) | |
Net asset value, end of period | | $ | 10.72 | | | $ | 10.50 | | | $ | 10.42 | | | $ | 10.68 | | | $ | 10.47 | | | $ | 10.37 | | |
Total return | | | 3.99 | % | | | 2.82 | % | | | (0.11 | %) | | | 4.34 | % | | | 1.16 | % | | | 10.04 | % | |
Ratios to average net assets(b) | |
Total gross expenses | | | 1.69 | % | | | 1.70 | % | | | 1.71 | % | | | 1.70 | % | | | 1.78 | %(c) | | | 1.96 | % | |
Total net expenses(d) | | | 1.49 | %(e) | | | 1.49 | %(e) | | | 1.49 | %(e) | | | 1.48 | % | | | 1.48 | %(c) | | | 1.56 | %(e) | |
Net investment income | | | 1.83 | % | | | 2.04 | % | | | 2.36 | % | | | 2.26 | % | | | 2.38 | %(c) | | | 2.53 | % | |
Supplemental data | |
Net assets, end of period (in thousands) | | $ | 10 | | | $ | 10 | | | $ | 27 | | | $ | 20 | | | $ | 3 | | | $ | 3 | | |
Portfolio turnover | | | 8 | % | | | 6 | % | | | 12 | % | | | 8 | % | | | 0 | % | | | 9 | % | |
Notes to Financial Highlights
(a) For the period from April 1, 2012 to April 30, 2012. During the period, the Fund's fiscal year end was changed from March 31 to April 30.
(b) In addition to the fees and expenses that the Fund bears directly, the Fund indirectly bears a pro rata share of the fees and expenses of any other funds in which it invests. Such indirect expenses are not included in the Fund's reported expense ratios.
(c) Annualized.
(d) Total net expenses include the impact of certain fee waivers/expense reimbursements made by the Investment Manager and certain of its affiliates, if applicable.
(e) The benefits derived from expense reductions had an impact of less than 0.01%.
The accompanying Notes to Financial Statements are an integral part of this statement.
Annual Report 2016
25
COLUMBIA AMT-FREE CALIFORNIA INTERMEDIATE MUNI BOND FUND
FINANCIAL HIGHLIGHTS (continued)
| | | Year Ended April 30, | | Year Ended
March 31, | |
Class C | | 2016 | | 2015 | | 2014 | | 2013 | | 2012(a) | | 2012 | |
Per share data | |
Net asset value, beginning of period | | $ | 10.49 | | | $ | 10.42 | | | $ | 10.67 | | | $ | 10.47 | | | $ | 10.37 | | | $ | 9.64 | | |
Income from investment operations: | |
Net investment income | | | 0.19 | | | | 0.21 | | | | 0.24 | | | | 0.24 | | | | 0.02 | | | | 0.24 | | |
Net realized and unrealized gain (loss) | | | 0.23 | | | | 0.07 | | | | (0.25 | ) | | | 0.20 | | | | 0.10 | | | | 0.73 | | |
Total from investment operations | | | 0.42 | | | | 0.28 | | | | (0.01 | ) | | | 0.44 | | | | 0.12 | | | | 0.97 | | |
Less distributions to shareholders: | |
Net investment income | | | (0.19 | ) | | | (0.21 | ) | | | (0.24 | ) | | | (0.24 | ) | | | (0.02 | ) | | | (0.24 | ) | |
Total distributions to shareholders | | | (0.19 | ) | | | (0.21 | ) | | | (0.24 | ) | | | (0.24 | ) | | | (0.02 | ) | | | (0.24 | ) | |
Net asset value, end of period | | $ | 10.72 | | | $ | 10.49 | | | $ | 10.42 | | | $ | 10.67 | | | $ | 10.47 | | | $ | 10.37 | | |
Total return | | | 4.08 | % | | | 2.72 | % | | | (0.02 | %) | | | 4.24 | % | | | 1.16 | % | | | 10.15 | % | |
Ratios to average net assets(b) | |
Total gross expenses | | | 1.69 | % | | | 1.70 | % | | | 1.71 | % | | | 1.71 | % | | | 1.75 | %(c) | | | 1.73 | % | |
Total net expenses(d) | | | 1.49 | %(e) | | | 1.49 | %(e) | | | 1.49 | %(e) | | | 1.48 | %(e) | | | 1.48 | %(c) | | | 1.49 | %(e) | |
Net investment income | | | 1.83 | % | | | 2.01 | % | | | 2.35 | % | | | 2.25 | % | | | 2.36 | %(c) | | | 2.38 | % | |
Supplemental data | |
Net assets, end of period (in thousands) | | $ | 14,549 | | | $ | 12,965 | | | $ | 9,253 | | | $ | 8,004 | | | $ | 4,384 | | | $ | 4,223 | | |
Portfolio turnover | | | 8 | % | | | 6 | % | | | 12 | % | | | 8 | % | | | 0 | % | | | 9 | % | |
Notes to Financial Highlights
(a) For the period from April 1, 2012 to April 30, 2012. During the period, the Fund's fiscal year end was changed from March 31 to April 30.
(b) In addition to the fees and expenses that the Fund bears directly, the Fund indirectly bears a pro rata share of the fees and expenses of any other funds in which it invests. Such indirect expenses are not included in the Fund's reported expense ratios.
(c) Annualized.
(d) Total net expenses include the impact of certain fee waivers/expense reimbursements made by the Investment Manager and certain of its affiliates, if applicable.
(e) The benefits derived from expense reductions had an impact of less than 0.01%.
The accompanying Notes to Financial Statements are an integral part of this statement.
Annual Report 2016
26
COLUMBIA AMT-FREE CALIFORNIA INTERMEDIATE MUNI BOND FUND
FINANCIAL HIGHLIGHTS (continued)
| | | Year Ended April 30, | |
Class R4 | | 2016 | | 2015 | | 2014 | | 2013(a) | |
Per share data | |
Net asset value, beginning of period | | $ | 10.46 | | | $ | 10.39 | | | $ | 10.64 | | | $ | 10.54 | | |
Income from investment operations: | |
Net investment income | | | 0.29 | | | | 0.32 | | | | 0.34 | | | | 0.04 | | |
Net realized and unrealized gain (loss) | | | 0.24 | | | | 0.07 | | | | (0.25 | ) | | | 0.10 | | |
Total from investment operations | | | 0.53 | | | | 0.39 | | | | 0.09 | | | | 0.14 | | |
Less distributions to shareholders: | |
Net investment income | | | (0.30 | ) | | | (0.32 | ) | | | (0.34 | ) | | | (0.04 | ) | |
Total distributions to shareholders | | | (0.30 | ) | | | (0.32 | ) | | | (0.34 | ) | | | (0.04 | ) | |
Net asset value, end of period | | $ | 10.69 | | | $ | 10.46 | | | $ | 10.39 | | | $ | 10.64 | | |
Total return | | | 5.13 | % | | | 3.76 | % | | | 0.98 | % | | | 1.32 | % | |
Ratios to average net assets(b) | |
Total gross expenses | | | 0.69 | % | | | 0.70 | % | | | 0.70 | % | | | 0.56 | %(c) | |
Total net expenses(d) | | | 0.49 | %(e) | | | 0.49 | %(e) | | | 0.49 | %(e) | | | 0.44 | %(c) | |
Net investment income | | | 2.81 | % | | | 3.02 | % | | | 3.46 | % | | | 3.27 | %(c) | |
Supplemental data | |
Net assets, end of period (in thousands) | | $ | 1,457 | | | $ | 529 | | | $ | 52 | | | $ | 3 | | |
Portfolio turnover | | | 8 | % | | | 6 | % | | | 12 | % | | | 8 | % | |
Notes to Financial Highlights
(a) Based on operations from March 19, 2013 (commencement of operations) through the stated period end.
(b) In addition to the fees and expenses that the Fund bears directly, the Fund indirectly bears a pro rata share of the fees and expenses of any other funds in which it invests. Such indirect expenses are not included in the Fund's reported expense ratios.
(c) Annualized.
(d) Total net expenses include the impact of certain fee waivers/expense reimbursements made by the Investment Manager and certain of its affiliates, if applicable.
(e) The benefits derived from expense reductions had an impact of less than 0.01%.
The accompanying Notes to Financial Statements are an integral part of this statement.
Annual Report 2016
27
COLUMBIA AMT-FREE CALIFORNIA INTERMEDIATE MUNI BOND FUND
FINANCIAL HIGHLIGHTS (continued)
| | | Year Ended April 30, | |
Class R5 | | 2016 | | 2015 | | 2014 | | 2013(a) | |
Per share data | |
Net asset value, beginning of period | | $ | 10.44 | | | $ | 10.37 | | | $ | 10.63 | | | $ | 10.63 | | |
Income from investment operations: | |
Net investment income | | | 0.31 | | | | 0.32 | | | | 0.35 | | | | 0.16 | | |
Net realized and unrealized gain (loss) | | | 0.23 | | | | 0.08 | | | | (0.26 | ) | | | 0.01 | | |
Total from investment operations | | | 0.54 | | | | 0.40 | | | | 0.09 | | | | 0.17 | | |
Less distributions to shareholders: | |
Net investment income | | | (0.31 | ) | | | (0.33 | ) | | | (0.35 | ) | | | (0.17 | ) | |
Total distributions to shareholders | | | (0.31 | ) | | | (0.33 | ) | | | (0.35 | ) | | | (0.17 | ) | |
Net asset value, end of period | | $ | 10.67 | | | $ | 10.44 | | | $ | 10.37 | | | $ | 10.63 | | |
Total return | | | 5.23 | % | | | 3.85 | % | | | 0.98 | % | | | 1.57 | % | |
Ratios to average net assets(b) | |
Total gross expenses | | | 0.55 | % | | | 0.55 | % | | | 0.58 | % | | | 0.50 | %(c) | |
Total net expenses(d) | | | 0.39 | % | | | 0.40 | % | | | 0.40 | % | | | 0.39 | %(c) | |
Net investment income | | | 2.93 | % | | | 3.09 | % | | | 3.47 | % | | | 3.28 | %(c) | |
Supplemental data | |
Net assets, end of period (in thousands) | | $ | 2,829 | | | $ | 1,738 | | | $ | 341 | | | $ | 3 | | |
Portfolio turnover | | | 8 | % | | | 6 | % | | | 12 | % | | | 8 | % | |
Notes to Financial Highlights
(a) Based on operations from November 8, 2012 (commencement of operations) through the stated period end.
(b) In addition to the fees and expenses that the Fund bears directly, the Fund indirectly bears a pro rata share of the fees and expenses of any other funds in which it invests. Such indirect expenses are not included in the Fund's reported expense ratios.
(c) Annualized.
(d) Total net expenses include the impact of certain fee waivers/expense reimbursements made by the Investment Manager and certain of its affiliates, if applicable.
The accompanying Notes to Financial Statements are an integral part of this statement.
Annual Report 2016
28
COLUMBIA AMT-FREE CALIFORNIA INTERMEDIATE MUNI BOND FUND
FINANCIAL HIGHLIGHTS (continued)
| | | Year Ended April 30, | | Year Ended
March 31, | |
Class Z | | 2016 | | 2015 | | 2014 | | 2013 | | 2012(a) | | 2012 | |
Per share data | |
Net asset value, beginning of period | | $ | 10.47 | | | $ | 10.40 | | | $ | 10.65 | | | $ | 10.45 | | | $ | 10.35 | | | $ | 9.63 | | |
Income from investment operations: | |
Net investment income | | | 0.30 | | | | 0.32 | | | | 0.34 | | | | 0.35 | | | | 0.03 | | | | 0.34 | | |
Net realized and unrealized gain (loss) | | | 0.23 | | | | 0.07 | | | | (0.25 | ) | | | 0.20 | | | | 0.10 | | | | 0.72 | | |
Total from investment operations | | | 0.53 | | | | 0.39 | | | | 0.09 | | | | 0.55 | | | | 0.13 | | | | 1.06 | | |
Less distributions to shareholders: | |
Net investment income | | | (0.30 | ) | | | (0.32 | ) | | | (0.34 | ) | | | (0.35 | ) | | | (0.03 | ) | | | (0.34 | ) | |
Total distributions to shareholders | | | (0.30 | ) | | | (0.32 | ) | | | (0.34 | ) | | | (0.35 | ) | | | (0.03 | ) | | | (0.34 | ) | |
Net asset value, end of period | | $ | 10.70 | | | $ | 10.47 | | | $ | 10.40 | | | $ | 10.65 | | | $ | 10.45 | | | $ | 10.35 | | |
Total return | | | 5.12 | % | | | 3.76 | % | | | 0.98 | % | | | 5.29 | % | | | 1.24 | % | | | 11.16 | % | |
Ratios to average net assets(b) | |
Total gross expenses | | | 0.69 | % | | | 0.70 | % | | | 0.71 | % | | | 0.71 | % | | | 0.75 | %(c) | | | 0.74 | % | |
Total net expenses(d) | | | 0.49 | %(e) | | | 0.49 | %(e) | | | 0.49 | %(e) | | | 0.48 | %(e) | | | 0.48 | %(c) | | | 0.50 | %(e) | |
Net investment income | | | 2.83 | % | | | 3.02 | % | | | 3.35 | % | | | 3.27 | % | | | 3.35 | %(c) | | | 3.39 | % | |
Supplemental data | |
Net assets, end of period (in thousands) | | $ | 378,630 | | | $ | 329,535 | | �� | $ | 260,101 | | | $ | 281,301 | | | $ | 254,981 | | | $ | 252,647 | | |
Portfolio turnover | | | 8 | % | | | 6 | % | | | 12 | % | | | 8 | % | | | 0 | % | | | 9 | % | |
Notes to Financial Highlights
(a) For the period from April 1, 2012 to April 30, 2012. During the period, the Fund's fiscal year end was changed from March 31 to April 30.
(b) In addition to the fees and expenses that the Fund bears directly, the Fund indirectly bears a pro rata share of the fees and expenses of any other funds in which it invests. Such indirect expenses are not included in the Fund's reported expense ratios.
(c) Annualized.
(d) Total net expenses include the impact of certain fee waivers/expense reimbursements made by the Investment Manager and certain of its affiliates, if applicable.
(e) The benefits derived from expense reductions had an impact of less than 0.01%.
The accompanying Notes to Financial Statements are an integral part of this statement.
Annual Report 2016
29
COLUMBIA AMT-FREE CALIFORNIA INTERMEDIATE MUNI BOND FUND
NOTES TO FINANCIAL STATEMENTS
April 30, 2016
Note 1. Organization
Columbia AMT-Free California Intermediate Muni Bond Fund (the Fund), a series of Columbia Funds Series Trust (the Trust), is a diversified fund. The Trust is registered under the Investment Company Act of 1940, as amended (the 1940 Act), as an open-end management investment company organized as a Delaware statutory trust.
Fund Shares
The Trust may issue an unlimited number of shares (without par value). The Fund offers Class A, Class B, Class C, Class R4, Class R5 and Class Z shares. Although all share classes generally have identical voting, dividend and liquidation rights, each share class votes separately when required by the Trust's organizational documents or by law. Different share classes pay different distribution amounts to the extent the expenses of such share classes differ, and distributions in liquidation will be proportional to the net asset value of each share class. Each share class has its own expense and sales charge structure.
Class A shares are subject to a maximum front-end sales charge of 3.00% based on the initial investment amount. In addition, Class A shares purchased on or after February 19, 2015 are subject to a contingent deferred sales charge (CDSC) of 0.75% on certain investments of $500,000 or more if redeemed within 12 months after purchase. Redemptions of Class A shares purchased prior to February 19, 2015, without an initial sales charge in accounts aggregating $1 million to $50 million at the time of purchase, are subject to a CDSC of 1.00% if redeemed within 12 months after purchase, and 0.50% if redeemed more than 12, but less than 18, months after purchase.
Class B shares may be subject to a maximum CDSC of 3.00% based upon the holding period after purchase. Class B shares will generally convert to Class A shares eight years after purchase. The Fund no longer accepts investments by new or existing investors in the Fund's Class B shares, except in connection with the reinvestment of any dividend and/or capital gain distributions in Class B shares of the Fund and exchanges by existing Class B shareholders of certain other funds within the Columbia Family of Funds.
Class C shares are subject to a 1.00% CDSC on shares redeemed within 12 months after purchase.
Class R4 shares are not subject to sales charges and are generally available only to omnibus retirement plans
and certain investors as described in the Fund's prospectus.
Class R5 shares are not subject to sales charges and are generally available only to investors purchasing through authorized investment professionals and omnibus retirement plans.
Class Z shares are not subject to sales charges and are available only to eligible investors, which are subject to different investment minimums as described in the Fund's prospectus.
Note 2. Summary of Significant Accounting Policies
Basis of Preparation
The Fund is an investment company that applies the accounting and reporting guidance in the Financial Accounting Standards Board (FASB) Accounting Standards Codification Topic 946, Financial Services — Investment Companies (ASC 946). The financial statements are prepared in accordance with U.S. generally accepted accounting principles (GAAP), which requires management to make certain estimates and assumptions that affect the reported amounts of assets and liabilities, the disclosure of contingent assets and liabilities at the date of the financial statements and the reported amounts of income and expenses during the reporting period. Actual results could differ from those estimates.
The following is a summary of significant accounting policies followed by the Fund in the preparation of its financial statements.
Security Valuation
Debt securities generally are valued by pricing services approved by the Board of Trustees (the Board) based upon market transactions for normal, institutional-size trading units of similar securities. The services may use various pricing techniques that take into account, as applicable, factors such as yield, quality, coupon rate, maturity, type of issue, trading characteristics and other data, as well as broker quotes. Debt securities for which quotations are not readily available or not believed to be reflective of market value may also be valued based upon a bid quote from an approved independent broker-dealer. Debt securities maturing in 60 days or less are valued primarily at amortized cost value, unless this method results in a valuation that management believes does not approximate market value.
Annual Report 2016
30
COLUMBIA AMT-FREE CALIFORNIA INTERMEDIATE MUNI BOND FUND
NOTES TO FINANCIAL STATEMENTS (continued)
April 30, 2016
Investments for which market quotations are not readily available, or that have quotations which management believes are not reflective of market value or reliable, are valued at fair value as determined in good faith under procedures approved by and under the general supervision of the Board. If a security or class of securities (such as foreign securities) is valued at fair value, such value is likely to be different from the quoted or published price for the security.
The determination of fair value often requires significant judgment. To determine fair value, management may use assumptions including but not limited to future cash flows and estimated risk premiums. Multiple inputs from various sources may be used to determine fair value.
GAAP requires disclosure regarding the inputs and valuation techniques used to measure fair value and any changes in valuation inputs or techniques. In addition, investments shall be disclosed by major category. This information is disclosed following the Fund's Portfolio of Investments.
Delayed Delivery Securities
The Fund may trade securities on other than normal settlement terms, including securities purchased or sold on a "when-issued" basis. This may increase risk to the Fund since the other party to the transaction may fail to deliver, which could cause the Fund to subsequently invest at less advantageous prices. The Fund designates cash or liquid securities in an amount equal to the delayed delivery commitment.
Security Transactions
Security transactions are accounted for on the trade date. Cost is determined and gains (losses) are based upon the specific identification method for both financial statement and federal income tax purposes.
Income Recognition
Interest income is recorded on an accrual basis. Market premiums and discounts, including original issue discounts, are amortized and accreted, respectively, over the expected life of the security on all debt securities, unless otherwise noted.
The Fund may place a debt security on non-accrual status and reduce related interest income when it becomes probable that the interest will not be collected and the amount of uncollectible interest can be reasonably estimated. A defaulted debt security is removed from non-accrual status when the issuer
resumes interest payments or when collectibility of interest is reasonably assured.
Dividend income is recorded on the ex-dividend date.
Expenses
General expenses of the Trust are allocated to the Fund and other funds of the Trust based upon relative net assets or other expense allocation methodologies determined by the nature of the expense. Expenses directly attributable to the Fund are charged to the Fund. Expenses directly attributable to a specific class of shares are charged to that share class.
Determination of Class Net Asset Value
All income, expenses (other than class-specific expenses, which are charged to that share class, as shown in the Statement of Operations) and realized and unrealized gains (losses) are allocated to each class of the Fund on a daily basis, based on the relative net assets of each class, for purposes of determining the net asset value of each class.
Federal Income Tax Status
The Fund intends to qualify each year as a regulated investment company under Subchapter M of the Internal Revenue Code, as amended, and will distribute substantially all of its tax exempt and taxable income (including net short-term capital gains), if any, for its tax year, and as such will not be subject to federal income taxes. In addition, the Fund intends to distribute in each calendar year substantially all of its net investment income, capital gains and certain other amounts, if any, such that the Fund should not be subject to federal excise tax. Therefore, no federal income or excise tax provision is recorded.
Distributions to Shareholders
Distributions from net investment income, if any, are declared daily and paid monthly. Net realized capital gains, if any, are distributed at least annually. Income distributions and capital gain distributions are determined in accordance with federal income tax regulations, which may differ from GAAP.
Guarantees and Indemnifications
Under the Trust's organizational documents and, in some cases, by contract, its officers and trustees are indemnified against certain liabilities arising out of the performance of their duties to the Trust or its funds. In addition, certain of the Fund's contracts with its service
Annual Report 2016
31
COLUMBIA AMT-FREE CALIFORNIA INTERMEDIATE MUNI BOND FUND
NOTES TO FINANCIAL STATEMENTS (continued)
April 30, 2016
providers contain general indemnification clauses. The Fund's maximum exposure under these arrangements is unknown since the amount of any future claims that may be made against the Fund cannot be determined, and the Fund has no historical basis for predicting the likelihood of any such claims.
Note 3. Fees and Other Transactions with Affiliates
Management Fees
Effective September 1, 2015, the Fund entered into a Management Agreement with Columbia Management Investment Advisers, LLC (the Investment Manager), a wholly-owned subsidiary of Ameriprise Financial, Inc. (Ameriprise Financial). Under the Management Agreement, the Investment Manager provides the Fund with investment research and advice, as well as administrative and accounting services. The management services fee is an annual fee that is equal to a percentage of the Fund's average daily net assets that declines from 0.47% to 0.31% as the Fund's net assets increase. The effective management services fee rate for the year ended April 30, 2016 was 0.47% of the Fund's average daily net assets.
Prior to September 1, 2015, the Fund paid the Investment Manager an annual fee for advisory services under an Investment Management Services Agreement and a separate annual fee for administrative and accounting services under an Administrative Services Agreement. For the period from May 1, 2015 through August 31, 2015, the investment advisory services fee paid to the Investment Manager was $529,540, and the administrative services fee paid to the Investment Manager was $90,263.
Other Expenses
Other expenses are for, among other things, miscellaneous expenses of the Fund or the Board, including payments to Board Services Corp., a company providing limited administrative services to the Fund and the Board. That company's expenses include boardroom and office expense, employee compensation, employee health and retirement benefits, and certain other expenses. For the year ended April 30, 2016, other expenses paid by the Fund to this company were $1,604.
Compensation of Board Members
Board members, who are not officers or employees of the Investment Manager or Ameriprise Financial, are compensated for their services to the Fund as disclosed in the Statement of Operations. Under a Deferred Compensation Plan (the Plan), these Board members may elect to defer payment of up to 100% of their compensation. Deferred amounts are treated as though equivalent dollar amounts had been invested in shares of certain funds managed by the Investment Manager. The Fund's liability for these amounts is adjusted for market value changes and remains in the Fund until distributed in accordance with the Plan. All amounts payable under the Plan constitute a general unsecured obligation of the Fund.
Transfer Agency Fees
Under a Transfer and Dividend Disbursing Agent Agreement, Columbia Management Investment Services Corp. (the Transfer Agent), an affiliate of the Investment Manager and a wholly-owned subsidiary of Ameriprise Financial, is responsible for providing transfer agency services to the Fund. The Transfer Agent has contracted with Boston Financial Data Services (BFDS) to serve as sub-transfer agent.
The Transfer Agent receives a monthly transfer agency fee based on the number or the average value of accounts, depending on the type of account. In addition, the Transfer Agent also receives sub-transfer agency fees based on a percentage of the average aggregate value of the Fund's shares maintained in omnibus accounts (other than omnibus accounts for which American Enterprise Investment Services Inc. is the broker of record or accounts where the beneficial shareholder is a customer of Ameriprise Financial Services, Inc., for which the Transfer Agent receives a per account fee). The Transfer Agent pays the fees of BFDS for services as sub-transfer agent and is not entitled to reimbursement for such fees from the Fund (with the exception of out-of-pocket fees).
The Transfer Agent also receives compensation from the Fund for various shareholder services and reimbursements for certain out-of-pocket fees. Total transfer agency fees for Class R5 shares are subject to an annual limitation of not more than 0.05% of the average daily net assets attributable to Class R5 shares.
Annual Report 2016
32
COLUMBIA AMT-FREE CALIFORNIA INTERMEDIATE MUNI BOND FUND
NOTES TO FINANCIAL STATEMENTS (continued)
April 30, 2016
For the year ended April 30, 2016, the Fund's effective transfer agency fee rates as a percentage of average daily net assets of each class were as follows:
Class A | | | 0.20 | % | |
Class B | | | 0.18 | | |
Class C | | | 0.20 | | |
Class R4 | | | 0.20 | | |
Class R5 | | | 0.05 | | |
Class Z | | | 0.20 | | |
An annual minimum account balance fee of $20 may apply to certain accounts with a value below the applicable share class's initial minimum investment requirements to reduce the impact of small accounts on transfer agency fees. These minimum account balance fees are remitted to the Fund and recorded as part of expense reductions in the Statement of Operations. For the year ended April 30, 2016, these minimum account balance fees reduced total expenses of the Fund by $20.
Distribution and Service Fees
The Fund has an agreement with Columbia Management Investment Distributors, Inc. (the Distributor), an affiliate of the Investment Manager and a wholly-owned subsidiary of Ameriprise Financial, for distribution and shareholder services. The Board has approved, and the Fund has adopted, distribution and shareholder service plans (the Plans) applicable to certain share classes, which set the distribution and service fees for the Fund. These fees are calculated daily and are intended to compensate the Distributor and/or eligible selling and/or servicing agents for selling shares of the Fund and providing services to investors.
Under the Plans, the Fund pays a monthly combined distribution and service fee to the Distributor at the maximum annual rate of 0.25% of the average daily net assets attributable to Class A shares of the Fund. Also under the Plans, the Fund pays a monthly service fee at the maximum annual rate of 0.25% of the average daily net assets attributable to Class B and Class C shares of the Fund and a monthly distribution fee at the maximum annual rate of 0.75% of the average daily net assets attributable to Class B and Class C shares of the Fund.
Sales Charges
Sales charges, including front-end charges and CDSCs, received by the Distributor for distributing Fund shares were $24,077 for Class A and $5,440 for Class C shares for the year ended April 30, 2016.
Expenses Waived/Reimbursed by the Investment Manager and its Affiliates
The Investment Manager and certain of its affiliates have contractually agreed to waive fees and/or reimburse expenses (excluding certain fees and expenses described below) for the periods disclosed below, unless sooner terminated at the sole discretion of the Board, so that the Fund's net operating expenses, after giving effect to fees waived/expenses reimbursed and any balance credits and/or overdraft charges from the Fund's custodian, do not exceed the following annual rates as a percentage of the class' average daily net assets:
| | | September 1, 2015
through
August 31, 2016 | | Prior to
September 1, 2015 | |
Class A | | | 0.74 | % | | | 0.74 | % | |
Class B | | | 1.49 | | | | 1.49 | | |
Class C | | | 1.49 | | | | 1.49 | | |
Class R4 | | | 0.49 | | | | 0.49 | | |
Class R5 | | | 0.39 | | | | 0.40 | | |
Class Z | | | 0.49 | | | | 0.49 | | |
Under the agreement governing these fee waivers and/or expense reimbursement arrangements, the following fees and expenses are excluded from the waiver/reimbursement commitment, and therefore will be paid by the Fund, if applicable: taxes (including foreign transaction taxes), expenses associated with investments in affiliated and non-affiliated pooled investment vehicles (including mutual funds and exchange-traded funds), transaction costs and brokerage commissions, costs related to any securities lending program, dividend and interest expenses associated with securities sold short, inverse floater program fees and expenses, transaction charges and interest on borrowed money, interest, extraordinary expenses and any other expenses the exclusion of which is specifically approved by the Board. This agreement may be modified or amended only with approval from the Investment Manager, certain of its affiliates and the Fund. Any fees waived and/or expenses reimbursed under the expense reimbursement arrangements described above are not recoverable by the Investment Manager or its affiliates in future periods.
Note 4. Federal Tax Information
The timing and character of income and capital gain distributions are determined in accordance with income tax regulations, which may differ from GAAP because of temporary or permanent book to tax differences.
Annual Report 2016
33
COLUMBIA AMT-FREE CALIFORNIA INTERMEDIATE MUNI BOND FUND
NOTES TO FINANCIAL STATEMENTS (continued)
April 30, 2016
At April 30, 2016, these differences are primarily due to differing treatment for capital loss carryforwards, Trustees' deferred compensation and distributions. To the extent these differences are permanent, reclassifications are made among the components of the Fund's net assets in the Statement of Assets and Liabilities. Temporary differences do not require reclassifications.
The Fund did not have any permanent differences; therefore, no reclassifications were made to the Statement of Assets and Liabilities.
The tax character of distributions paid during the years indicated was as follows:
Year Ended April 30, | | 2016 | | 2015 | |
Ordinary income | | $ | 19,022 | | | $ | 18,726 | | |
Tax-exempt income | | | 11,406,351 | | | | 9,981,962 | | |
Total | | | 11,425,373 | | | | 10,000,688 | | |
Short-term capital gain distributions, if any, are considered ordinary income distributions for tax purposes.
At April 30, 2016, the components of distributable earnings on a tax basis were as follows:
Undistributed tax-exempt income | | $ | 976,233 | | |
Capital loss carryforwards | | | (2,875,684 | ) | |
Net unrealized appreciation | | | 32,338,981 | | |
At April 30, 2016, the cost of investments for federal income tax purposes was $405,271,794 and the aggregate gross unrealized appreciation and depreciation based on that cost was:
Unrealized appreciation | | $ | 32,347,639 | | |
Unrealized depreciation | | | (8,658 | ) | |
Net unrealized appreciation | | | 32,338,981 | | |
The following capital loss carryforwards, determined at April 30, 2016, may be available to reduce taxable income arising from future net realized gains on investments, if any, to the extent permitted by the Internal Revenue Code:
Year of Expiration | | Amount ($) | |
2017 | | | 10,109 | | |
No expiration — short-term | | | 2,865,575 | | |
Total | | | 2,875,684 | | |
Capital loss carryforwards with no expiration are required to be utilized prior to any capital losses which carry an expiration date. As a result of this ordering rule, capital
loss carryforwards which carry an expiration date may be more likely to expire unused.
Management of the Fund has concluded that there are no significant uncertain tax positions in the Fund that would require recognition in the financial statements. However, management's conclusion may be subject to review and adjustment at a later date based on factors including, but not limited to, new tax laws, regulations, and administrative interpretations (including relevant court decisions). Generally, the Fund's federal tax returns for the prior three fiscal years remain subject to examination by the Internal Revenue Service.
Note 5. Portfolio Information
The cost of purchases and proceeds from sales of securities, excluding short-term investments and derivatives, if any, aggregated to $69,831,382 and $28,659,418, respectively, for the year ended April 30, 2016. The amount of purchase and sale activity impacts the portfolio turnover rate reported in the Financial Highlights.
Note 6. Line of Credit
The Fund has access to a revolving credit facility whereby the Fund may borrow for the temporary funding of shareholder redemptions or for other temporary or emergency purposes. Effective December 8, 2015, Citibank, N.A. and HSBC Bank USA, N.A. joined JPMorgan Chase Bank, N.A. (JPMorgan) as lead of a syndicate of banks under the credit facility, which is a collective agreement between the Fund and certain other funds managed by the Investment Manager, severally and not jointly, that permits collective borrowings up to $1 billion. Interest is charged to each participating fund based on its borrowings at a rate equal to the higher of (i) the overnight federal funds rate plus 1.00% or (ii) the one-month LIBOR rate plus 1.00%. Each borrowing under the credit facility matures no later than 60 days after the date of borrowing. The Fund also pays a commitment fee equal to its pro rata share of the amount of the credit facility at a rate of 0.15% per annum. The commitment fee is included in other expenses in the Statement of Operations. Prior to December 8, 2015, JPMorgan was the sole lead bank under the credit facility agreement that permitted borrowings up to $550 million under the same terms and interest rates as described above with the exception of the commitment fee which was charged at a rate of 0.075% per annum.
The Fund had no borrowings during the year ended April 30, 2016.
Annual Report 2016
34
COLUMBIA AMT-FREE CALIFORNIA INTERMEDIATE MUNI BOND FUND
NOTES TO FINANCIAL STATEMENTS (continued)
April 30, 2016
Note 7. Significant Risks
Shareholder Concentration Risk
At April 30, 2016, one unaffiliated shareholder of record owned 69.1% of the outstanding shares of the Fund in one or more accounts. The Fund has no knowledge about whether any portion of those shares was owned beneficially. Subscription and redemption activity by concentrated accounts may have a significant effect on the operations of the Fund. In the case of a large redemption, the Fund may be forced to sell investments at inopportune times, including its liquid or more liquid positions, resulting in Fund losses and the Fund holding a higher percentage of less liquid or illiquid securities. Large redemptions could result in decreased economies of scale and increased operating expenses for non-redeeming Fund shareholders.
Credit Risk
Credit risk is the risk that the value of debt securities in the Fund's portfolio may decline because the issuer may default and fail to pay interest or repay principal when due. Rating agencies assign credit ratings to debt securities to indicate their credit risk. Lower rated or unrated debt securities held by the Fund may present increased credit risk as compared to higher-rated debt securities.
Interest Rate Risk
Interest rate risk is the risk of losses attributable to changes in interest rates. In general, if prevailing interest rates rise, the values of debt securities tend to fall, and if interest rates fall, the values of debt securities tend to rise. Actions by governments and central banking authorities can result in increases in interest rates. Increasing interest rates may negatively affect the value of debt securities held by the Fund, resulting in a negative impact on the Fund's performance and net asset value per share. In general, the longer the maturity or duration of a debt security, the greater its sensitivity to changes in interest rates.
Liquidity Risk
Liquidity risk is the risk associated with a lack of marketability of investments which may make it difficult to sell the investment at a desirable time or price. Changing regulatory, market or other conditions or environments (for example, the interest rate or credit environments) may adversely affect the liquidity of the Fund's investments. The Fund may have to accept a
lower selling price for the holding, sell other investments, or forego another, more appealing investment opportunity. Generally, the less liquid the market at the time the Fund sells a portfolio investment, the greater the risk of loss or decline of value to the Fund. A less liquid market can lead to an increase in Fund redemptions, which may negatively impact Fund performance and net asset value per share, including, for example, if the Fund is forced to sell securities in a down market.
Geographic Concentration Risk
Because the Fund invests substantially in municipal securities issued by the state identified in the Fund's name and political sub-divisions of that state, the Fund will be particularly affected by adverse tax, legislative, regulatory, demographic or political changes as well as changes impacting the state's financial, economic or other condition and prospects. In addition, because of the relatively small number of issuers of tax-exempt securities in the state, the Fund may invest a higher percentage of assets in a single issuer and, therefore, be more exposed to the risk of loss than a fund that invests more broadly. The value of municipal and other securities owned by the Fund also may be adversely affected by future changes in federal or state income tax laws.
Note 8. Subsequent Events
Management has evaluated the events and transactions that have occurred through the date the financial statements were issued and noted no items requiring adjustment of the financial statements or additional disclosure.
Note 9. Information Regarding Pending and Settled Legal Proceedings
In December 2005, without admitting or denying the allegations, American Express Financial Corporation (AEFC, which is now known as Ameriprise Financial, Inc. (Ameriprise Financial)) entered into settlement agreements with the Securities and Exchange Commission (SEC) and Minnesota Department of Commerce (MDOC) related to market timing activities. As a result, AEFC was censured and ordered to cease and desist from committing or causing any violations of certain provisions of the Investment Advisers Act of 1940, the Investment Company Act of 1940, and various Minnesota laws. AEFC agreed to pay disgorgement of $10 million and civil money penalties of $7 million. AEFC
Annual Report 2016
35
COLUMBIA AMT-FREE CALIFORNIA INTERMEDIATE MUNI BOND FUND
NOTES TO FINANCIAL STATEMENTS (continued)
April 30, 2016
also agreed to retain an independent distribution consultant to assist in developing a plan for distribution of all disgorgement and civil penalties ordered by the SEC in accordance with various undertakings detailed at http://www.sec.gov/litigation/admin/ia-2451.pdf. Ameriprise Financial and its affiliates have cooperated with the SEC and the MDOC in these legal proceedings, and have made regular reports to the Funds' Boards of Trustees.
Ameriprise Financial and certain of its affiliates have historically been involved in a number of legal, arbitration and regulatory proceedings, including routine litigation, class actions, and governmental actions, concerning matters arising in connection with the conduct of their business activities. Ameriprise Financial believes that the Funds are not currently the subject of, and that neither Ameriprise Financial nor any of its affiliates are the subject of, any pending legal, arbitration or regulatory proceedings that are likely to have a material adverse effect on the Funds or the ability of Ameriprise Financial or its affiliates to perform under their contracts with the Funds. Ameriprise Financial is required to make quarterly (10-Q), annual (10-K) and, as necessary, 8-K filings with the SEC on legal and regulatory matters that relate to Ameriprise Financial and its affiliates. Copies of these filings may be obtained by accessing the SEC website at www.sec.gov.
There can be no assurance that these matters, or the adverse publicity associated with them, will not result in increased fund redemptions, reduced sale of fund shares or other adverse consequences to the Funds. Further, although we believe proceedings are not likely to have a material adverse effect on the Funds or the ability of Ameriprise Financial or its affiliates to perform under their contracts with the Funds, these proceedings are subject to uncertainties and, as such, we are unable to estimate the possible loss or range of loss that may result. An adverse outcome in one or more of these proceedings could result in adverse judgments, settlements, fines, penalties or other relief that could have a material adverse effect on the consolidated financial condition or results of operations of Ameriprise Financial.
Annual Report 2016
36
COLUMBIA AMT-FREE CALIFORNIA INTERMEDIATE MUNI BOND FUND
REPORT OF INDEPENDENT REGISTERED PUBLIC ACCOUNTING FIRM
To the Trustees of Columbia Funds Series Trust and the Shareholders of
Columbia AMT-Free California Intermediate Muni Bond Fund
In our opinion, the accompanying statement of assets and liabilities, including the portfolio of investments, and the related statements of operations and of changes in net assets and the financial highlights present fairly, in all material respects, the financial position of Columbia AMT-Free California Intermediate Muni Bond Fund (the "Fund", a series of Columbia Funds Series Trust) at April 30, 2016, and the results of its operations, the changes in its net assets and the financial highlights for each of the periods indicated, in conformity with accounting principles generally accepted in the United States of America. These financial statements and financial highlights (hereafter referred to as "financial statements") are the responsibility of the Fund's management. Our responsibility is to express an opinion on these financial statements based on our audits. We conducted our audits of these financial statements in accordance with the standards of the Public Company Accounting Oversight Board (United States). Those standards require that we plan and perform the audit to obtain reasonable assurance about whether the financial statements are free of material misstatement. An audit includes examining, on a test basis, evidence supporting the amounts and disclosures in the financial statements, assessing the accounting principles used and significant estimates made by management, and evaluating the overall financial statement presentation. We believe that our audits, which included confirmation of securities at April 30, 2016 by correspondence with the custodian and brokers, and the application of alternative auditing procedures where such confirmations had not been received, provide a reasonable basis for our opinion.
PricewaterhouseCoopers LLP
Minneapolis, MN
June 21, 2016
Annual Report 2016
37
COLUMBIA AMT-FREE CALIFORNIA INTERMEDIATE MUNI BOND FUND
FEDERAL INCOME TAX INFORMATION
(Unaudited)
The Fund hereby designates the following tax attributes for the fiscal year ended April 30, 2016. Shareholders will be notified in early 2017 of the amounts for use in preparing 2016 income tax returns.
Tax Designations:
Exempt-Interest Dividends | | | 99.83 | % | |
Exempt-Interest Dividends. The percentage of net investment income distributed during the fiscal year that qualifies as exempt-interest dividends for federal income tax purposes.
Annual Report 2016
38
COLUMBIA AMT-FREE CALIFORNIA INTERMEDIATE MUNI BOND FUND
Shareholders elect the Board that oversees the Fund's operations. The Board appoints officers who are responsible for day-to-day business decisions based on policies set by the Board. The following table provides basic biographical information about the Fund's Trustees, including their principal occupations during the past five years, although specific titles for individuals may have varied over the period. Under current Board policy, members generally may serve through the end of the calendar year in which they reach either the mandatory retirement age established by the Board or the fifteenth anniversary of the first Board meeting they attended as a member of the Board.
Trustees
Independent Trustees
Name,
Address,
Year of Birth | | Position Held With
the Funds and Length of
Service | | Principal Occupation(s)
During the Past Five Years
and Other Relevant
Professional Experience | | Number of
Funds in the
Columbia Funds
Complex
Overseen | | Other Directorships
Held by Trustee During
the Past Five Years | |
Kathleen Blatz
901 S. Marquette Ave.
Minneapolis, MN 55402
1954 | | Trustee since 1/06 for RiverSource Funds and since 6/11 for Nations Funds | | Attorney; specializing in arbitration and mediation; Chief Justice, Minnesota Supreme Court, 1998-2006; Associate Justice, Minnesota Supreme Court, 1996-1998; Fourth Judicial District Court Judge, Hennepin County, 1994-1996; Attorney in private practice and public service, 1984-1993; State Representative, Minnesota House of Representatives, 1979-1993, which included service on the Tax and Financial Institutions and Insurance Committees | | | 120 | | | Trustee, BlueCross BlueShield of Minnesota (Chair of the Business Development Committee) since 2009; Chair of the Robina Foundation since August 2013 | |
Edward J. Boudreau, Jr.
901 S. Marquette Ave. Minneapolis, MN 55402
1944 | | Trustee since 6/11 for RiverSource Funds and since 1/05 for Nations Funds | | Managing Director, E.J. Boudreau & Associates (consulting) since 2000; FINRA Industry Arbitrator, 2002-present; Chairman and Chief Executive Officer, John Hancock Funds (asset management), Chairman and Interested Trustee for open-end and closed-end funds offered by John Hancock, 1989-2000; John Hancock Life Insurance Company, including SVP and Treasurer and SVP Information Technology, 1968-1988 | | | 118 | | | Former Trustee, Boston Museum of Science (Chair of Finance Committee), 1985-2013; former Trustee, BofA Funds Series Trust (11 funds), 2005-2011 | |
Pamela G. Carlton
901 S. Marquette Ave.
Minneapolis, MN 55402
1954 | | Trustee since 7/07 for RiverSource Funds and since 6/11 for Nations Funds | | President, Springboard — Partners in Cross Cultural Leadership (consulting company) since 2003; Managing Director of US Equity Research, JP Morgan Chase, 1999-2003; Director of US Equity Research, Chase Asset Management, 1996-1999; Co-Director Latin America Research, 1993-1996, COO Global Research, 1992-1996, Co-Director of US Research, 1991-1992, Investment Banker, Morgan Stanley, 1982-1991 | | | 120 | | | Trustee, New York Presbyterian Hospital Board (Executive Committee and Chair of Human Resources Committee) since 1996 | |
Annual Report 2016
39
COLUMBIA AMT-FREE CALIFORNIA INTERMEDIATE MUNI BOND FUND
TRUSTEES AND OFFICERS (continued)
Independent Trustees (continued)
Name,
Address,
Year of Birth | | Position Held With
the Funds and Length of
Service | | Principal Occupation(s)
During the Past Five Years
and Other Relevant
Professional Experience | | Number of
Funds in the
Columbia Funds
Complex
Overseen | | Other Directorships
Held by Trustee During
the Past Five Years | |
William P. Carmichael
901 S. Marquette Ave. Minneapolis, MN 55402
1943 | | Trustee since 6/11 for RiverSource Funds and since 2003 for Nations Funds; Chair of the Board from 1/14-11/15 | | Retired; Co-founder, The Succession Fund (provides exit strategies to owners of privately held companies), 1998-2007; Adjunct Professor of Finance, Kelley School of Business, Indiana University, 1993-2007; Senior Vice President, Sara Lee Corporation, 1991-1993; Senior Vice President and Chief Financial Officer, Beatrice Foods Company, 1984-1990; Vice President, Esmark, Inc., 1973-1984; Associate, Price Waterhouse, 1968-1972 | | | 120 | | | Director, The Finish Line (athletic shoes and apparel) since July 2003; Director, International Textile Corp. since 2012; Director, hhgregg since May, 2015; former Director, Cobra Electronics Corporation (electronic equipment manufacturer), 1994-August 2014; former Director, Spectrum Brands, Inc. (consumer products), 2002-2009; former Director, Simmons Company (bedding), 2004-2010; former Trustee, BofA Funds Series Trust (11 funds), 2009-2011; former Director, McMoRan Exploration Company (oil and gas exploration and development), 2010-2013 | |
Patricia M. Flynn
901 S. Marquette Ave. Minneapolis, MN 55402
1950 | | Trustee since 11/04 for RiverSource Funds and since 6/11 for Nations Funds | | Trustee Professor of Economics and Management, Bentley University since 1976 (also teaches and conducts research on corporate governance); Dean, McCallum Graduate School of Business, Bentley University, 1992-2002 | | | 120 | | | Trustee, MA Taxpayers Foundation since 1997; Board of Governors, Innovation Institute, MA Technology Collaborative since 2010 | |
William A. Hawkins
901 S. Marquette Ave.
Minneapolis, MN 55402
1942 | | Chair of the Board since 11/15; Trustee since 6/11 for RiverSource Funds and since 1/05 for Nations Funds | | Managing Director, Overton Partners (financial consulting) since August 2010; President and Chief Executive Officer, California General Bank, N.A., January 2008-August 2010; Operation Hope, COO, 2004-2007; IndyMac Bancorp, President, CBG, 1999-2003; American General Bank, President, 1997-1999; Griffin Financial Services, CEO, 1981-1997; The Griffin Funds, CEO, 1992-1998 | | | 120 | | | Former Trustee, BofA Funds Series Trust (11 funds), 2009-2015 | |
R. Glenn Hilliard
901 S. Marquette Ave. Minneapolis, MN 55402
1943 | | Trustee since 6/11 for RiverSource Funds and since 1/05 for Nations Funds | | Chairman and Chief Executive Officer, Hilliard Group LLC (investing and consulting) since April 2003; Non-Executive Director & Chairman, CNO Financial Group, Inc. (insurance), 2003-2011; Chair & CEO, ING Americas, 1996-2003 | | | 118 | | | Chairman, BofA Funds Series Trust (11 funds); former Director, CNO Financial Group, Inc. (insurance), 2003-2011 | |
Annual Report 2016
40
COLUMBIA AMT-FREE CALIFORNIA INTERMEDIATE MUNI BOND FUND
TRUSTEES AND OFFICERS (continued)
Independent Trustees (continued)
Name,
Address,
Year of Birth | | Position Held With
the Funds and Length of
Service | | Principal Occupation(s)
During the Past Five Years
and Other Relevant
Professional Experience | | Number of
Funds in the
Columbia Funds
Complex
Overseen | | Other Directorships
Held by Trustee During
the Past Five Years | |
Catherine James Paglia
901 S. Marquette Ave.
Minneapolis, MN 55402
1952 | | Trustee since 11/04 for RiverSource Funds and since 6/11 for Nations Funds | | Director, Enterprise Asset Management, Inc. (private real estate and asset management company) since September 1998; Managing Director and Partner, Interlaken Capital, Inc., 1989-1997; Managing Director, Morgan Stanley, 1982-1989; Vice President, Investment Banking, 1980-1982, Associate, Investment Banking, 1976-1980, Dean Witter Reynolds, Inc. | | | 120 | | | Director, Valmont Industries, Inc. (irrigation systems manufacturer) since 2012; Trustee, Carleton College (on the Investment Committee); Trustee, Carnegie Endowment for International Peace (on the Investment Committee) | |
Leroy C. Richie
901 S. Marquette Ave.
Minneapolis, MN 55402
1941 | | Trustee since 2000 for Seligman Funds, since 11/08 for RiverSource Funds and since 6/11 for Nations Funds | | Counsel, Lewis & Munday, P.C. (law firm) since 2004; Vice President and General Counsel, Automotive Legal Affairs, Chrysler Corporation, 1993-1997 | | | 118 | | | Lead Outside Director, Infinity Resources, Inc. (oil and gas exploration and production) since 1994; Lead Outside Director, Digital Ally, Inc. (digital imaging) since September 2005; Trustee, Marygrove College (Chair of Finance Committee) since 2007; former Director, OGE Energy Corp. (energy and energy services), 2007-2014 | |
Minor M. Shaw
901 S. Marquette Ave.
Minneapolis, MN 55402
1947 | | Trustee since 6/11 for RiverSource Funds and since 2003 for Nations Funds | | President, Micco LLC (private investments) since 2011; President, Micco Corp. (family investment business), 1998-2011 | | | 120 | | | Director, Piedmont Natural Gas; Director, BlueCross BlueShield of South Carolina since April 2008; Chair of the Duke Endowment; Director, National Association of Corporate Directors, Carolinas Chapter since 2013; Chair of Greenville — Spartanburg Airport Commission; former Trustee, BofA Funds Series Trust (11 funds), 2003-2011 | |
Alison Taunton-Rigby
901 S. Marquette Ave.
Minneapolis, MN 55402
1944 | | Trustee since 11/02 for RiverSource Funds and since 6/11 for Nations Funds | | Managing Director, Forester Biotech (consulting), 2001-2003; Chief Executive Officer and Director, RiboNovix, Inc., (biotechnology), 2003-2010; President and Chief Executive Officer of CMT Inc., 2001-2003; Aquila Biopharmaceuticals Inc., 1996-2000; Cambridge Biotech Corporation, 1995-1996; Mitotix Inc., 1993-1994 | | | 120 | | | Director, Abt Associates
(government contractor) since 2001; Director, Boston Children's Hospital since 2002; Director, Healthways, Inc. (health and well-being solutions) since 2005; Director, ICI Mutual Insurance Company, since 2011 | |
Annual Report 2016
41
COLUMBIA AMT-FREE CALIFORNIA INTERMEDIATE MUNI BOND FUND
TRUSTEES AND OFFICERS (continued)
Interested Trustee Not Affiliated with Investment Manager*
Name,
Address,
Year of Birth | | Position Held With
Funds and Length of
Service | | Principal Occupation(s)
During Past Five Years
and Other Relevant
Professional Experience | | Number of
Funds in the
Fund Family
Overseen by
Board Member | | Other Present or Past
Directorships/
Trusteeships
(Within Past 5 Years) | |
Anthony M. Santomero
901 S. Marquette Ave.
Minneapolis, MN 55402
1946 | | Trustee since 6/11 for RiverSource Funds and since 1/08 for Nations Funds | | Richard K. Mellon Professor Emeritus of Finance, The Wharton School, University of Pennsylvania since 2002; Senior Advisor, McKinsey & Company (consulting), 2006-2008; President, Federal Reserve Bank of Philadelphia, 2000-2006; Professor of Finance, The Wharton School, University of Pennsylvania, 1972-2002 | | | 118 | | | Trustee, Penn Mutual Life Insurance Company since March 2008; Director, Renaissance Reinsurance Ltd. since May 2008; Director, Citigroup Inc. since 2009; Director, Citibank, N.A. since 2009; former Trustee, BofA Funds Series Trust (11 funds), 2008-2011 | |
* Dr. Santomero is not an affiliated person of the Investment Manager or Ameriprise Financial. However, he is currently deemed by the Funds to be an "interested person" (as defined in the 1940 Act) of the Funds because he serves as a Director of Citigroup Inc. and Citibank, N.A., companies that may directly or through subsidiaries and affiliates engage from time-to-time in brokerage execution, principal transactions and lending relationships with the Funds or accounts advised/managed by the Investment Manager.
Annual Report 2016
42
COLUMBIA AMT-FREE CALIFORNIA INTERMEDIATE MUNI BOND FUND
TRUSTEES AND OFFICERS (continued)
Interested Trustee Affiliated with Investment Manager*
Name,
Address,
Year of Birth | | Position Held With
the Funds and Length of
Service | | Principal Occupation(s)
During Past Five Years
and Other Relevant
Professional Experience | | Number of
Funds in the
Columbia Funds
Complex
Overseen | | Other Directorships
Held by Trustee During
the Past Five Years | |
William F. Truscott
c/o Columbia Management
Investment Advisers, LLC, 225 Franklin St.
Boston, MA 02110
1960 | | Trustee since 11/01 for RiverSource Funds and since 6/11 for Nations Funds; Senior Vice President since 2002 for RiverSource Funds and since 5/10 for Nations Funds | | Chairman of the Board and President, Columbia Management Investment Advisers, LLC since May 2010 and February 2012, respectively (previously President and Chief Investment Officer, 2001-April 2010); Chief Executive Officer, Global Asset Management, Ameriprise Financial, Inc. since September 2012 (previously Chief Executive Officer, U.S. Asset Management & President, Annuities, May 2010-September 2012 and President — U.S. Asset Management and Chief Investment Officer, 2005-April 2010); Director and Chief Executive Officer, Columbia Management Investment Distributors, Inc. since May 2010 and February 2012, respectively (previously Chairman of the Board and Chief Executive Officer, 2006-April 2010); Chairman of the Board and Chief Executive Officer, RiverSource Distributors, Inc. since 2006; Director, Threadneedle Asset Management Holdings, SARL since 2014; President and Chief Executive Officer, Ameriprise Certificate Company, 2006-August 2012. | | | 178 | | | Chairman of the Board, Columbia Management Investment Advisers, LLC since May 2010; Director, Columbia Management Investment Distributors, Inc. since May 2010; Former Director, Ameriprise Certificate Company, 2006-January 2013 | |
* Interested person (as defined under the 1940 Act) by reason of being an officer, director, security holder and/or employee of the Investment Manager or Ameriprise Financial.
The Statement of Additional Information has additional information about the Fund's Board members and is available, without charge, upon request by calling 800.345.6611; contacting your financial intermediary; or visiting columbiathreadneedle.com/us.
Annual Report 2016
43
COLUMBIA AMT-FREE CALIFORNIA INTERMEDIATE MUNI BOND FUND
TRUSTEES AND OFFICERS (continued)
The Board has appointed officers who are responsible for day-to-day business decisions based on policies it has established. The officers serve at the pleasure of the Board. The following table provides basic information about the Officers of the Fund, including principal occupations during the past five years, although their specific titles may have varied over the period. In addition to Mr. Truscott, who is Senior Vice President, the Fund's other officers are:
Fund Officers
Name,
Address and
Year of Birth | | Position and Year
First Appointed to
Position for any Fund
in the Columbia
Funds Complex or a
Predecessor Thereof | |
Principal Occupation(s) During Past Five Years | |
Christopher O. Petersen
5228 Ameriprise
Financial Center
Minneapolis, MN 55474
Born 1970 | | President and Principal Executive Officer (2015) | | Vice President and Lead Chief Counsel, Ameriprise Financial, Inc. since January 2015 (previously, Vice President and Chief Counsel January 2010-December 2014; and Vice President and Group Counsel or Counsel 2004-January 2010); officer of Columbia Funds and affiliated funds since 2007. | |
Michael G. Clarke
225 Franklin Street
Boston, MA 02110
Born 1969 | | Treasurer (2011), Chief Financial Officer (2009) and Chief Accounting Officer (2015) | | Vice President — Mutual Fund Administration, Columbia Management Investment Advisers, LLC, since May 2010; Managing Director of Fund Administration, Columbia Management Advisors, LLC, September 2004-April 2010; senior officer of Columbia Funds and affiliated funds since 2002. | |
Paul B. Goucher
100 Park Avenue
New York, NY 10017
Born 1968 | | Senior Vice President (2011), Chief Legal Officer (2015) and Assistant Secretary (2008) | | Vice President and Lead Chief Counsel, Ameriprise Financial, Inc. since November 2008 and January 2013, respectively (previously Chief Counsel, January 2010-January 2013 and Group Counsel, November 2008-January 2010). | |
Thomas P. McGuire
225 Franklin Street
Boston, MA 02110
Born 1972 | | Senior Vice President and Chief Compliance Officer (2012) | | Vice President — Asset Management Compliance, Ameriprise Financial, Inc., since May 2010; Chief Compliance Officer, Ameriprise Certificate Company since September 2010; Compliance Executive, Bank of America, 2005-April 2010. | |
Colin Moore
225 Franklin Street
Boston, MA 02110
Born 1958 | | Senior Vice President (2010) | | Executive Vice President and Global Chief Investment Officer, Ameriprise Financial, Inc., since July 2013; Director and Global Chief Investment Officer, Columbia Management Investment Advisers, LLC since May 2010; Manager, Managing Director and Chief Investment Officer, Columbia Management Advisors, LLC, 2007-April 2010. | |
Michael E. DeFao
225 Franklin Street
Boston, MA 02110
Born 1968 | | Vice President (2011) and Assistant Secretary (2010) | | Vice President and Chief Counsel, Ameriprise Financial, Inc. since May 2010; Associate General Counsel, Bank of America, 2005-April 2010. | |
Amy Johnson
5228 Ameriprise
Financial Center
Minneapolis, MN 55474
Born 1965 | | Vice President (2006) | | Managing Director and Chief Operating Officer, Columbia Management Investment Advisers, LLC since May 2010 (previously Chief Administrative Officer, 2009-April 2010, and Vice President — Asset Management and Trust Company Services, 2006-2009). | |
Lyn Kephart-Strong
5228 Ameriprise
Financial Center
Minneapolis, MN 55474
Born 1960 | | Vice President (2015) | | President, Columbia Management Investment Services Corp. since October 2014; Vice President & Resolution Officer, Ameriprise Trust Company since August 2009; President, RiverSource Service Corporation 2004-2010. | |
Ryan C. Larrenaga
225 Franklin Street
Boston, MA 02110
Born 1970 | | Vice President and Secretary (2015) | | Vice President and Group Counsel, Ameriprise Financial, Inc. since August 2011 (previously, Counsel from May 2010 to August 2011); Assistant General Counsel, Bank of America, 2005-April 2010; officer of Columbia Funds and affiliated funds since 2005. | |
Annual Report 2016
44
COLUMBIA AMT-FREE CALIFORNIA INTERMEDIATE MUNI BOND FUND
IMPORTANT INFORMATION ABOUT THIS REPORT
Each fund mails one shareholder report to each shareholder address. If you would like more than one report, please call shareholder services at 800.345.6611 and additional reports will be sent to you.
The policy of the Board is to vote the proxies of the companies in which each fund holds investments consistent with the procedures as stated in the Statement of Additional Information (SAI). You may obtain a copy of the SAI without charge by calling 800.345.6611; contacting your financial intermediary; visiting columbiathreadneedle.com/us; or searching the website of the Securities and Exchange Commission (SEC) at sec.gov. Information regarding how each fund voted proxies relating to portfolio securities is filed with the SEC by August 31st for the most recent 12-month period ending June 30th of that year, and is available without charge by visiting columbiathreadneedle.com/us, or searching the website of the SEC at sec.gov.
Each fund files a complete schedule of portfolio holdings with the SEC for the first and third quarters of each fiscal year on Form N-Q. Each fund's Form N-Q is available on the SEC's website at sec.gov and may be reviewed and copied at the SEC's Public Reference Room in Washington, D.C. Information on the operation of the Public Reference Room may be obtained by calling 800.SEC.0330. Each fund's complete schedule of portfolio holdings, as filed on Form N-Q, can also be obtained without charge, upon request, by calling 800.345.6611.
Annual Report 2016
45
Columbia AMT-Free California Intermediate Muni Bond Fund
P.O. Box 8081
Boston, MA 02266-8081

This information is for use with concurrent or prior delivery of a fund prospectus. Please read and consider the investment objectives, risks, charges and expenses for any fund carefully before investing. For a prospectus and summary prospectus, which contains this and other important information about the Fund, go to columbiathreadneedle.com/us. The Fund is distributed by Columbia Management Investment Distributors, Inc., member FINRA, and managed by Columbia Management Investment Advisers, LLC.
Columbia Threadneedle Investments (Columbia Threadneedle) is the global brand name of the Columbia and Threadneedle group of companies.
All rights reserved. Columbia Management Investment Distributors, Inc., 225 Franklin Street, Boston, MA 02110-2804
© 2016 Columbia Management Investment Advisers, LLC.
columbiathreadneedle.com/us
ANN122_04_F01_(06/16)

ANNUAL REPORT
April 30, 2016

COLUMBIA AMT-FREE GEORGIA INTERMEDIATE
MUNI BOND FUND

ABOUT COLUMBIA THREADNEEDLE INVESTMENTS
Columbia Threadneedle Investments is a leading global asset management group that provides a broad range of actively managed investment strategies and solutions for individual, institutional and corporate clients around the world.
With more than 2,000 people, including over 450 investment professionals based in North America, Europe and Asia, we manage $464 billion* of assets across developed and emerging market equities, fixed income, asset allocation solutions and alternatives. We are the 13th largest manager of long-term mutual fund assets in the U.S.** and the 3rd largest manager of retail funds in the U.K.***
Our priority is the investment success of our clients. We aim to deliver the investment outcomes they expect through an investment approach that is team-based, performance-driven and risk-aware. Our culture is dynamic and interactive. By sharing our insights across asset classes and geographies, we generate richer perspectives on global, regional and local investment landscapes. The ability to exchange and debate investment ideas in a collaborative environment enriches our teams' investment processes. More importantly, it results in better informed investment decisions for our clients.
Columbia funds are distributed by Columbia Management Investment Distributors, Inc., member FINRA, and managed by Columbia Management Investment Advisers, LLC.
Columbia Threadneedle Investments (Columbia Threadneedle) is the global brand name of the Columbia and Threadneedle group of companies.
* In U.S. dollars as of March 31, 2016. Source: Ameriprise Q1 Earnings Release. Includes all assets managed by entities in the Columbia and Threadneedle group of companies. Contact us for more current data.
** Source: ICI as of March 31, 2016 for Columbia Management Investment Advisers, LLC.
*** Source: Investment Association as of December 2015 for Threadneedle Asset Management Limited.
© 2016 Columbia Management Investment Advisers, LLC. All rights reserved.
Not part of the shareholder report
Investment strategies to help meet investor needs
We are committed to helping investors navigate financial challenges to reach their desired outcomes. The possibilities are endless.
Your success is our priority.
Retire comfortably
Fund college or higher education
Leave a legacy
Generate an appropriate stream of income in retirement
Traditional approaches to income may no longer be adequate — and they may no longer provide the diversification benefits they once did. Investors need to rethink how they generate retirement income.
Worried about running out of income? You are not alone.
Navigate a changing interest rate environment
Even in today's challenging interest rate environment, it's still possible to navigate markets and achieve your goals.
Make investment choices designed specifically for this market environment.
Maximize after-tax returns
In an environment where what you keep is more important than what you earn, municipal bonds can help mitigate higher taxes while providing attractive yields compared to other investment options.
You've worked too hard building your wealth to lose it to taxes.
Grow assets to achieve financial goals
Finding growth opportunities in today's complex market environment requires strong research capabilities, creative thinking and a disciplined approach.
Do your investments deliver the portfolio growth you need?
Ease the impact of volatile markets
With increasing concerns about market volatility, investors should consider diversifying their portfolios with non-traditional holdings.
Interested in turning volatility into opportunity?
To find out more, contact your financial professional, call 800.426.3750 or visit columbiathreadneedle.com/us
Not part of the shareholder report
 Dear Shareholders,
Volatility comes with the territory for long-term investors. Some investors instinctively want to pull out of the market or sell underperforming investments at the first sign of increased volatility or perhaps even as soon as they perceive it on the horizon. But taking yourself out of the market could mean losing out on potential opportunities, and putting your longer-term investment goals at risk.
Cumulative return is not just about achieving high returns when markets are going up; it's also about remaining invested and minimizing losses during weak or volatile markets so that you can participate on the upside. Developing a deeper understanding of the various risks your portfolio is subject to can help you balance these risks.
Diversification is critical in seeking to achieve that balance. We believe that most portfolios could be more effectively diversified either by introducing holdings with performance profiles unrelated to existing holdings (like alternative products) or by rebalancing existing holdings with an eye toward risk allocation. Over time, distributing risk more evenly may produce a more pronounced diversification benefit and may improve portfolio efficiency. We believe market volatility can create significant opportunities and, in fact, these periods may be some of the very best times to invest.
With this in mind, I thought it important to highlight excerpts from a piece written by Colin Moore, Global Chief Investment Officer, in which he touches on some of these issues emphasizing the importance of a properly constructed portfolio in seeking to effectively manage volatility and to achieve consistency of returns. I encourage you to read the article in its entirety. To access the full article and for other insights on current market, please visit blog.columbiathreadneedleus.com/latest-perspectives.
You need investments that are designed to help you ease the impact of volatile market environments and keep the savings you have worked tirelessly to amass. Columbia Threadneedle Investments provides investment solutions to help you tackle financial challenges and achieve your desired outcome.
Best regards,

Christopher O. Petersen
President, Columbia Funds
Excerpts from:
Taking the scare out of the volatility bogeyman
By Colin Moore, Global Chief Investment Officer
Colin Moore is the global chief investment officer for Columbia Threadneedle Investments. His responsibilities include ensuring that a disciplined investment process is in place across all asset classes, including equity and fixed income. Mr. Moore joined one of the Columbia Threadneedle Investments legacy firms in 2002 as head of equity and was also head of fixed income and liquidity strategies from 2009 – 2010.

n In today's low growth, higher volatility world, the emphasis is shifting from maximization of returns to consistency of returns.
PRESIDENT'S MESSAGE (continued)
n Portfolios should represent the behavioral risk-return tradeoff of investors, remembering that they won't stay invested to realize the return if we get the risk tolerance wrong.
n Holding long-term savings in cash to avoid volatility (the financial equivalent of hiding under the sheets) is detrimental to achieving long-term goals.
According to Wikipedia, "The bogeyman is a common allusion to a mythical creature in many cultures used to control behavior. This monster has no specific appearance, and conceptions about it can vary drastically from household to household within the same community; in many cases he has no set appearance in the mind of an adult or child, but is simply a non-specific embodiment of terror." Different cultures have different names and physical representations for the bogeyman, and investors are no different. We have terrible monsters that we fear may destroy our portfolios, and we call one of the scariest of them volatility.
While the bogeyman is mythical (I hope!), volatility is real and can cause serious damage. To understand why investors have such a hard time coping with volatility, we first need to define three cognitive biases at work in today's investment environment:
1) Recency bias — something that has recently come to the forefront of our attention, regardless of how long established it is, suddenly seems to appear with improbable frequency.
2) Negativity bias — we tend to have a greater recall of unpleasant memories than positive memories.
3) Loss aversion — our dissatisfaction with losing money tends to be greater than our satisfaction with making money.
The level of volatility varies dramatically, and so does investor fear and panic selling — waxing when volatility rises, waning when it falls. Recent studies have pointed to demographics as an important driver of panic selling. The theory is that as people get closer to retirement, the prospects of a large (20% – 30%) loss in financial assets can have a much more pronounced effect on their sense of well-being. Wealth preservation instincts kick in much more quickly than for younger (and typically less wealthy) savers.
The reality is that there is little opportunity for return without volatility. Therefore, the bogeyman effect of holding long-term savings in cash to avoid volatility (the financial equivalent of hiding under the sheets) is detrimental to achieving long-term goals. This effect tends to be more pronounced during the episodic spikes in volatility. The significant spike in volatility in 2008 and 2009 led to significant withdrawals from long-term investment funds over the same period. Less pronounced effects can also be seen when comparing 2001 – 2003 and 2011 – 2012. Conversely, flows picked up when volatility returned to "normal" levels. Investor behavior of this type is consistent with the three behavioral biases.
I believe average volatility will be higher over the next 10 years than the last 10 years and episodic spikes will increase in frequency because sustainable economic growth will be structurally lower and geopolitical risk higher than any time since World War II. Low growth creates uncertainty while loss aversion will make investors fear that we are one economic mishap or geopolitical event away from no growth or recession. The result will be higher volatility on average. Negativity bias will tend to exacerbate "spike" reactions to event-driven geopolitical news, and the volatility bogeyman will appear more often. Assuming the behavioral biases continue, investor returns are likely to be very disappointing regardless of the total return generated by financial markets due to the bogeyman effect.
To mitigate this effect, we need to focus on portfolio construction and an improved understanding of diversification. I accept that equities are likely to offer the highest return over the next 10 years, but they also offer the highest volatility. Many portfolio construction optimization tools use historical average volatility, which is likely to underestimate the volatility investors will face. The bogeyman emerges when individual asset class volatility spikes and cross correlations rise, the combination of which increases overall portfolio volatility far beyond expectation. Diversification is meant to protect investors against volatility, but what's the point of owning lots of investments if the volatility bogeyman has not been properly estimated?
Most importantly, portfolios should be constructed to properly represent the behavioral risk-return tradeoff of investors, remembering that they won't stay invested to realize the return if we get the risk tolerance wrong. In a low growth, higher volatility world, the emphasis is shifting to return consistency rather than return maximization,
PRESIDENT'S MESSAGE (continued)
and investors are best served through investment approaches that appreciate that distinction. Even though it's a permanent feature of financial markets, volatility is less likely to be the bogeyman we all fear if portfolios are constructed with this understanding.
Please visit blog.columbiathreadneedleus.com/latest-perspectives to read the entire article.
Investors should consider the investment objectives, risks, charges and expenses of a mutual fund carefully before investing. For a free prospectus and summary prospectus, which contains this and other important information about a fund, visit columbiathreadneedle.com/us. The prospectus should be read carefully before investing.
The views expressed are as of April 2016, may change as market or other conditions change, and may differ from views expressed by other Columbia Management Investment Advisers, LLC (CMIA) associates or affiliates. Actual investments or investment decisions made by CMIA and its affiliates, whether for its own account or on behalf of clients, will not necessarily reflect the views expressed. This information is not intended to provide investment advice and does not account for individual investor circumstances. Investment decisions should always be made based on an investor's specific financial needs, objectives, goals, time horizon and risk tolerance. Asset classes described may not be suitable for all investors.
Past performance does not guarantee future results, and no forecast should be considered a guarantee either. Since economic and market conditions change frequently, there can be no assurance that the trends described here will continue or that the forecasts are accurate.
Diversification does not guarantee a profit or protect against loss.
Columbia Funds are distributed by Columbia Management Investment Distributors, Inc., member FINRA, and managed by Columbia Management Investment Advisers, LLC.
© 2016 Columbia Management Investment Advisers, LLC. All rights reserved
COLUMBIA AMT-FREE GEORGIA INTERMEDIATE MUNI BOND FUND
Performance Overview | | | 2 | | |
Manager Discussion of Fund Performance | | | 4 | | |
Understanding Your Fund's Expenses | | | 6 | | |
Portfolio of Investments | | | 7 | | |
Statement of Assets and Liabilities | | | 13 | | |
Statement of Operations | | | 15 | | |
Statement of Changes in Net Assets | | | 16 | | |
Financial Highlights | | | 18 | | |
Notes to Financial Statements | | | 23 | | |
Report of Independent Registered Public Accounting Firm | | | 29 | | |
Federal Income Tax Information | | | 30 | | |
Trustees and Officers | | | 31 | | |
Important Information About This Report | | | 37 | | |
Fund Investment Manager
Columbia Management Investment
Advisers, LLC
225 Franklin Street
Boston, MA 02110
Fund Distributor
Columbia Management Investment
Distributors, Inc.
225 Franklin Street
Boston, MA 02110
Fund Transfer Agent
Columbia Management Investment
Services Corp.
P.O. Box 8081
Boston, MA 02266-8081
For more information about any of the funds, please visit columbiathreadneedle.com/us or call 800.345.6611. Customer Service Representatives are available to answer your questions Monday through Friday from 8 a.m. to 7 p.m. Eastern time.
The views expressed in this report reflect the current views of the respective parties. These views are not guarantees of future performance and involve certain risks, uncertainties and assumptions that are difficult to predict, so actual outcomes and results may differ significantly from the views expressed. These views are subject to change at any time based upon economic, market or other conditions and the respective parties disclaim any responsibility to update such views. These views may not be relied on as investment advice and, because investment decisions for a Columbia fund are based on numerous factors, may not be relied on as an indication of trading intent on behalf of any particular Columbia fund. References to specific securities should not be construed as a recommendation or investment advice.
COLUMBIA AMT-FREE GEORGIA INTERMEDIATE MUNI BOND FUND
Performance Summary
n Columbia AMT-Free Georgia Intermediate Muni Bond Fund (the Fund) Class A shares returned 3.78% excluding sales charges for the 12-month period that ended April 30, 2016. Class Z shares of the Fund returned 4.04% for the same time period.
n The Fund underperformed its benchmark, the Barclays 3-15 Year Blend Municipal Bond Index, which returned 4.86% during the 12-month period.
n The Fund's underperformance stemmed largely from its positions in shorter maturity bonds, as well as from its positions in bonds with higher credit ratings.
Average Annual Total Returns (%) (for period ended April 30, 2016)
| | | Inception | | 1 Year | | 5 Years | | 10 Years | |
Class A | | 05/04/92 | | | | | | | | | | | | | |
Excluding sales charges | | | | | | | 3.78 | | | | 3.61 | | | | 3.76 | | |
Including sales charges | | | | | | | 0.70 | | | | 2.98 | | | | 3.45 | | |
Class B | | 06/07/93 | | | | | | | | | | | | | |
Excluding sales charges | | | | | | | 3.10 | | | | 2.85 | | | | 2.99 | | |
Including sales charges | | | | | | | 0.10 | | | | 2.85 | | | | 2.99 | | |
Class C | | 06/17/92 | | | | | | | | | | | | | |
Excluding sales charges | | | | | | | 3.01 | | | | 2.83 | | | | 2.98 | | |
Including sales charges | | | | | | | 2.01 | | | | 2.83 | | | | 2.98 | | |
Class R4* | | 03/19/13 | | | 4.14 | | | | 3.86 | | | | 4.02 | | |
Class Z | | 03/01/92 | | | 4.04 | | | | 3.86 | | | | 4.02 | | |
Barclays 3-15 Year Blend Municipal Bond Index | | | | | | | 4.86 | | | | 4.61 | | | | 4.89 | | |
Returns for Class A are shown with and without the maximum initial sales charge of 3.00%. Returns for Class B are shown with and without the applicable contingent deferred sales charge (CDSC) of 3.00% in the first year, declining to 1.00% in the fourth year and eliminated thereafter. Returns for Class C are shown with and without the 1.00% CDSC for the first year only. The Fund's other classes are not subject to sales charges and have limited eligibility. Please see the Fund's prospectus for details. Performance for different share classes will vary based on differences in sales charges and fees associated with each class. All results shown assume reinvestment of distributions during the period. Returns do not reflect the deduction of taxes that a shareholder may pay on Fund distributions or on the redemption of Fund shares. Performance results reflect the effect of any fee waivers or reimbursements of Fund expenses by Columbia Management Investment Advisers, LLC and/or any of its affiliates. Absent these fee waivers or expense reimbursement arrangements, performance results would have been lower.
The performance information shown represents past performance and is not a guarantee of future results. The investment return and principal value of your investment will fluctuate so that your shares, when redeemed, may be worth more or less than their original cost. Current performance may be lower or higher than the performance information shown. You may obtain performance information current to the most recent month-end by contacting your financial intermediary, visiting columbiathreadneedle.com/us or calling 800.345.6611.
*The returns shown for periods prior to the share class inception date (including returns for the Life of the Fund, if shown, which are since Fund inception) include the returns of the Fund's oldest share class. These returns are adjusted to reflect any higher class-related operating expenses of the newer share classes, as applicable. Please visit columbiathreadneedle.com/us/investment-products/mutual-funds/
appended-performance for more information.
The Barclays 3-15 Year Blend Municipal Bond Index is an unmanaged index that tracks the performance of municipal bonds issued after December 31, 1990, with remaining maturities between 2 and 17 years and at least $7 million in principal amount outstanding.
Indices are not available for investment, are not professionally managed and do not reflect sales charges, fees, brokerage commissions, taxes or other expenses of investing. Securities in the Fund may not match those in an index.
Annual Report 2016
2
COLUMBIA AMT-FREE GEORGIA INTERMEDIATE MUNI BOND FUND
PERFORMANCE OVERVIEW (continued)
Performance of a Hypothetical $10,000 Investment (May 1, 2006 – April 30, 2016)

The chart above shows the change in value of a hypothetical $10,000 investment in Class A shares of Columbia AMT-Free Georgia Intermediate Muni Bond Fund during the stated time period, and does not reflect the deduction of taxes that a shareholder may pay on Fund distributions or on the redemption of Fund shares.
Annual Report 2016
3
COLUMBIA AMT-FREE GEORGIA INTERMEDIATE MUNI BOND FUND
MANAGER DISCUSSION OF FUND PERFORMANCE
Portfolio Management
Brian McGreevy
Quality Breakdown (%)
(at April 30, 2016) | |
AAA rating | | | 9.5 | | |
AA rating | | | 47.9 | | |
A rating | | | 33.6 | | |
BBB rating | | | 3.7 | | |
Not rated | | | 5.3 | | |
Total | | | 100.0 | | |
Percentages indicated are based upon total fixed income investments (excluding Money Market Funds).
Bond ratings apply to the underlying holdings of the Fund and not the Fund itself and are divided into categories ranging from highest to lowest credit quality, determined by using the middle rating of Moody's, S&P and Fitch, after dropping the highest and lowest available ratings. When ratings are available from only two rating agencies, the lower rating is used. When a rating is available from only one rating agency, that rating is used. When a bond is not rated by any rating agency, it is designated as "Not rated." Credit quality ratings assigned by a rating agency are subjective opinions, not statements of fact, and are subject to change, including daily. The ratings assigned by credit rating agencies are but one of the considerations that the Investment Manager and/or Fund's subadviser incorporates into its credit analysis process, along with such other issuer-specific factors as cash flows, capital structure and leverage ratios, ability to de-leverage (repay) through free cash flow, quality of management, market positioning and access to capital, as well as such security-specific factors as the terms of the security (e.g., interest rate and time to maturity) and the amount and type of any collateral.
For the 12-month period that ended April 30, 2016, the Fund's Class A shares returned 3.78% excluding sales charges. Class Z shares of the Fund returned 4.04%. The Fund underperformed its benchmark, the Barclays 3-15 Year Blend Municipal Bond Index, which returned 4.86% for the same time period. The Fund's underperformance stemmed largely from its positions in shorter maturity bonds, as well as from its positions in those with higher credit ratings.
Market Overview
The U.S. municipal bond market produced a positive return and outperformed U.S. Treasuries during the reporting period, thanks in part to a highly favorable balance of supply and demand. Mutual fund cash flows provided a steady source of support for the market, with positive inflows for 30 consecutive weeks as of the close of the period. In the interval from October 2015 through April 2016 alone, inflows into municipal funds totaled over $27 billion. Insurance companies and banks were active buyers, as well. Supply was also strong, but almost half of the new issuance came from refunding deals — rather than new issuance — as issuers sought to take advantage of the cost savings from refinancing older, higher coupon debt. The refinancing activity added an additional layer of demand since many of the refundings were of currently callable bonds issued in 2005 or 2006. As a result, many investors who were taken out of older bonds reinvested the proceeds back into the market.
The strength of state and local finances throughout the United States, with the notable exceptions of New Jersey, Illinois, the City of Chicago, and Puerto Rico, further aided the performance of municipal bonds. Longer term securities generally provided superior returns versus shorter term issues, reflecting the latter category's low nominal yields. Lower quality bonds outpaced their higher quality counterparts, as investors' hearty appetite for risk fueled a continued reach for yield.
Georgia Municipals Underperformed, but the State Economy Remained Robust
Georgia modestly underperformed the broader U.S. municipal market during the period. The primary reason for this shortfall was the combination of the State's higher credit quality and shorter average maturity versus the national benchmark.
Despite its relative underperformance, Georgia continued to display healthy economic fundamentals. Strength in port trade, robust employment trends, favorable demographics, and increasing personal income have provided a firm base for the economy and led to rising tax collection on both the state and local levels. The growth in Georgia's jobs market has exceeded the national average due to the vitality of the private sector, particularly in the construction and port-related industries. While below-average productivity growth remains an obstacle, the overall direction of the state economy has been supportive for the performance of its municipal bond market.
Annual Report 2016
4
COLUMBIA AMT-FREE GEORGIA INTERMEDIATE MUNI BOND FUND
MANAGER DISCUSSION OF FUND PERFORMANCE (continued)
Contributors and Detractors
The Fund's short duration (below-benchmark interest-rate sensitivity) and positions in short-term securities were the leading causes of its underperformance during the period. Specifically, the Fund's heavier exposure to bonds with maturities under three years detracted from performance given that this area generated the smallest returns. However, the Fund's longer maturity holdings aided performance.
The Fund's position in bonds rated AA, which make up just under one half of the total portfolio, performed slightly better than the corresponding benchmark components. The Fund's underweight in lower quality bonds was a drag on results, however, as securities rated BBB delivered the best returns during the period. With that said, some of the Fund's higher quality issues performed well due to their longer maturities versus the comparable index components.
The Fund's overweight position in the pre-refunded sector, which stemmed from the recent refinancing activity in Georgia, detracted from performance since these bonds tend to have short maturities. Positions in local general obligation bonds added value due largely to their above-average duration. On a sector basis, transportation and education bonds generated strong results, while performance from special-tax and housing issues matched the benchmark.
Fund Positioning
We adopted a more cautious approach near the end of the period in response to the tightening of credit spreads, the improvement in municipal yields relative to U.S. Treasuries, and the flattening of the yield curve. Accordingly, we became more selective with respect to lower rated bonds in the investment-grade space. The yield curve was steep and attractive in spots near the end of the period, and we saw value in bonds with maturities between 10 and 15 years. We also identified value in lower coupon issues, such as those in the 4% range (as opposed to the 5% coupons that generally dominate the market). Since these securities continued to trade at premiums, we believe there is some protection from the adverse tax consequences associated with investments in discount bonds. In terms of sectors, we added to water and sewer, electric utility, and hospital issues with maturities longer than ten years due to the value we saw in these areas.
Investment Risks
Fixed-income securities present issuer default risk. The Fund invests substantially in municipal securities and will be affected by tax, legislative, regulatory, demographic or political changes, as well as changes impacting a state's financial, economic or other conditions. A relatively small number of tax-exempt issuers may necessitate the Fund investing more heavily in a single issuer and, therefore, be more exposed to the risk of loss than a fund that invests more broadly. The value of the Fund's portfolio may be more volatile than a more geographically diversified fund. Prepayment and extension risk exists as a loan, bond or other investment may be called, prepaid or redeemed before maturity and that similar yielding investments may not be available for purchase. A rise in interest rates may result in a price decline of fixed-income instruments held by the Fund, negatively impacting its performance and NAV. Falling rates may result in the Fund investing in lower yielding debt instruments, lowering the Fund's income and yield. These risks may be heightened for longer maturity and duration securities. Non-investment-grade (high-yield or junk) securities present greater price volatility and more risk to principal and income than higher rated securities. Market risk may affect a single issuer, sector of the economy, industry or the market as a whole. Federal and state tax rules apply to capital gain distributions and any gains or losses on sales. Income may be subject to state or local taxes. Liquidity risk is associated with the difficulty of selling underlying investments at a desirable time or price. See the Fund's prospectus for information on these and other risks.
Annual Report 2016
5
COLUMBIA AMT-FREE GEORGIA INTERMEDIATE MUNI BOND FUND
UNDERSTANDING YOUR FUND'S EXPENSES
(Unaudited)
As an investor, you incur two types of costs. There are transaction costs, which generally include sales charges on purchases and may include redemption fees. There are also ongoing costs, which generally include management fees, distribution and/or service fees, and other fund expenses. The following information is intended to help you understand your ongoing costs (in dollars) of investing in the Fund and to help you compare these costs with the ongoing costs of investing in other mutual funds.
Analyzing Your Fund's Expenses
To illustrate these ongoing costs, we have provided examples and calculated the expenses paid by investors in each share class of the Fund during the period. The actual and hypothetical information in the table is based on an initial investment of $1,000 at the beginning of the period indicated and held for the entire period. Expense information is calculated two ways and each method provides you with different information. The amount listed in the "Actual" column is calculated using the Fund's actual operating expenses and total return for the period. You may use the Actual information, together with the amount invested, to estimate the expenses that you paid over the period. Simply divide your account value by $1,000 (for example, an $8,600 account value divided by $1,000 = 8.6), then multiply the results by the expenses paid during the period under the "Actual" column. The amount listed in the "Hypothetical" column assumes a 5% annual rate of return before expenses (which is not the Fund's actual return) and then applies the Fund's actual expense ratio for the period to the hypothetical return. You should not use the hypothetical account values and expenses to estimate either your actual account balance at the end of the period or the expenses you paid during the period. See "Compare With Other Funds" below for details on how to use the hypothetical data.
Compare With Other Funds
Since all mutual funds are required to include the same hypothetical calculations about expenses in shareholder reports, you can use this information to compare the ongoing cost of investing in the Fund with other funds. To do so, compare the hypothetical example with the 5% hypothetical examples that appear in the shareholder reports of other funds. As you compare hypothetical examples of other funds, it is important to note that hypothetical examples are meant to highlight the ongoing costs of investing in a fund only and do not reflect any transaction costs, such as sales charges, or redemption or exchange fees. Therefore, the hypothetical calculations are useful in comparing ongoing costs only, and will not help you determine the relative total costs of owning different funds. If transaction costs were included in these calculations, your costs would be higher.
November 1, 2015 – April 30, 2016
| | | Account Value at the Beginning
of the Period ($) | | Account Value at the End of the
Period ($) | | Expenses Paid During the
Period ($) | | Fund's Annualized
Expense Ratio (%) | |
| | | Actual | | Hypothetical | | Actual | | Hypothetical | | Actual | | Hypothetical | | Actual | |
Class A | | | 1,000.00 | | | | 1,000.00 | | | | 1,027.20 | | | | 1,020.84 | | | | 4.08 | | | | 4.07 | | | | 0.81 | | |
Class B | | | 1,000.00 | | | | 1,000.00 | | | | 1,023.30 | | | | 1,017.11 | | | | 7.85 | | | | 7.82 | | | | 1.56 | | |
Class C | | | 1,000.00 | | | | 1,000.00 | | | | 1,022.40 | | | | 1,017.11 | | | | 7.84 | | | | 7.82 | | | | 1.56 | | |
Class R4 | | | 1,000.00 | | | | 1,000.00 | | | | 1,028.50 | | | | 1,022.08 | | | | 2.82 | | | | 2.82 | | | | 0.56 | | |
Class Z | | | 1,000.00 | | | | 1,000.00 | | | | 1,028.40 | | | | 1,022.08 | | | | 2.82 | | | | 2.82 | | | | 0.56 | | |
Expenses paid during the period are equal to the annualized expense ratio for each class as indicated above, multiplied by the average account value over the period and then multiplied by the number of days in the Fund's most recent fiscal half year and divided by 366.
Expenses do not include fees and expenses incurred indirectly by the Fund from its investment in underlying funds, including affiliated and non-affiliated pooled investment vehicles, such as mutual funds and exchange-traded funds.
Had Columbia Management Investment Advisers, LLC and/or certain of its affiliates not waived/reimbursed certain fees and expenses, account value at the end of the period would have been reduced.
Annual Report 2016
6
COLUMBIA AMT-FREE GEORGIA INTERMEDIATE MUNI BOND FUND
PORTFOLIO OF INVESTMENTS
April 30, 2016
(Percentages represent value of investments compared to net assets)
Municipal Bonds 98.5%
Issue
Description | | Coupon
Rate | | Principal
Amount ($) | |
Value ($) | |
AIRPORT 3.7% | |
City of Atlanta Department of Aviation
Refunding Revenue Bonds
General
Series 2010C
01/01/25 | | | 5.000 | % | | | 1,500,000 | | | | 1,725,030 | | |
Revenue Bonds
Series 2012B
01/01/27 | | | 5.000 | % | | | 1,000,000 | | | | 1,174,740 | | |
Total | | | | | | | 2,899,770 | | |
HIGHER EDUCATION 12.8% | |
Athens Housing Authority
Refunding Revenue Bonds
UGAREF East Campus Housing
Series 2011
12/01/25 | | | 5.000 | % | | | 1,000,000 | | | | 1,178,140 | | |
Bleckley County & Dodge County Joint Development Authority
Revenue Bonds
Middle Georgia College
Series 2008
07/01/21 | | | 5.000 | % | | | 750,000 | | | | 806,970 | | |
Bulloch County Development Authority
Refunding Revenue Bonds
Georgia Southern University Housing Foundation
Series 2012 (AGM)
08/01/27 | | | 5.000 | % | | | 500,000 | | | | 589,870 | | |
Revenue Bonds
Georgia Southern University Housing Foundation
Series 2008 (AGM)
07/01/20 | | | 5.250 | % | | | 1,000,000 | | | | 1,092,110 | | |
Carrollton Payroll Development Authority
Refunding Revenue Bonds
Anticipation Certificates - UWG Campus Center
Series 2012 (AGM)
08/01/25 | | | 5.000 | % | | | 800,000 | | | | 956,112 | | |
DeKalb Newton & Gwinnett Counties Joint Development Authority
Revenue Bonds
GGC Foundation LLC Project
Series 2009
07/01/24 | | | 5.500 | % | | | 2,500,000 | | | | 2,786,375 | | |
Fulton County Development Authority
Refunding Revenue Bonds
Spelman College
Series 2015
06/01/32 | | | 5.000 | % | | | 1,000,000 | | | | 1,185,140 | | |
Richmond County Development Authority
Refunding Revenue Bonds
ASU Jaguar Student Housing
Series 2012 (AGM)
02/01/27 | | | 5.000 | % | | | 750,000 | | | | 885,563 | | |
Municipal Bonds (continued)
Issue
Description | | Coupon
Rate | | Principal
Amount ($) | |
Value ($) | |
Georgia Regents University Cancer Center
Series 2014 (AGM)
12/15/32 | | | 5.000 | % | | | 425,000 | | | | 505,533 | | |
Total | | | | | | | 9,985,813 | | |
HOSPITAL 9.3% | |
Carroll City-County Hospital Authority
Refunding Revenue Bonds
Tanner Medical Center, Inc. Project
Series 2016
07/01/30 | | | 4.000 | % | | | 1,000,000 | | | | 1,127,740 | | |
Cedartown Polk County Hospital Authority
Revenue Bonds
Floyd Healthcare Polk Medical Center
RAC Series 2016
07/01/34 | | | 5.000 | % | | | 500,000 | | | | 579,480 | | |
DeKalb Private Hospital Authority
Revenue Bonds
Children's Healthcare
Series 2009
11/15/17 | | | 5.000 | % | | | 320,000 | | | | 340,115 | | |
Fayette County Hospital Authority
Revenue Bonds
Fayette Community Hospital
Series 2009A
06/15/23 | | | 5.250 | % | | | 2,000,000 | | | | 2,238,320 | | |
Floyd County Hospital Authority
Refunding Revenue Bonds
Floyd Medical Center Project
Series 2016
07/01/31 | | | 5.000 | % | | | 595,000 | | | | 728,453 | | |
Gwinnett County Hospital Authority
Revenue Bonds
Gwinnet Hospital System
Series 2007A (AGM)
07/01/23 | | | 5.000 | % | | | 2,000,000 | | | | 2,240,500 | | |
Total | | | | | | | 7,254,608 | | |
JOINT POWER AUTHORITY 5.1% | |
Municipal Electric Authority of Georgia
Refunding Revenue Bonds
Project One
Subordinated Series 2015A
01/01/32 | | | 5.000 | % | | | 1,000,000 | | | | 1,193,800 | | |
Revenue Bonds
Project One
Subordinated Series 2008A
01/01/21 | | | 5.250 | % | | | 1,395,000 | | | | 1,650,941 | | |
Subordinated Series 2008D
01/01/23 | | | 6.000 | % | | | 1,000,000 | | | | 1,113,260 | | |
Total | | | | | | | 3,958,001 | | |
The accompanying Notes to Financial Statements are an integral part of this statement.
Annual Report 2016
7
COLUMBIA AMT-FREE GEORGIA INTERMEDIATE MUNI BOND FUND
PORTFOLIO OF INVESTMENTS (continued)
April 30, 2016
Municipal Bonds (continued)
Issue
Description | | Coupon
Rate | | Principal
Amount ($) | |
Value ($) | |
LOCAL APPROPRIATION 1.4% | |
Fulton County Facilities Corp.
Certificate of Participation
Fulton County Public Purpose Project
Series 2009
11/01/17 | | | 5.000 | % | | | 1,000,000 | | | | 1,059,410 | | |
LOCAL GENERAL OBLIGATION 22.6% | |
Cherokee County Board of Education
Unlimited General Obligation Bonds
Series 2009A
08/01/22 | | | 5.000 | % | | | 1,600,000 | | | | 1,806,864 | | |
Series 2014A
08/01/30 | | | 5.000 | % | | | 1,000,000 | | | | 1,224,670 | | |
City of Atlanta
Unlimited General Obligation Refunding Bonds
Series 2014A
12/01/26 | | | 5.000 | % | | | 500,000 | | | | 628,410 | | |
City of Decatur
Unlimited General Obligation Bonds
Series 2016
08/01/29 | | | 4.000 | % | | | 750,000 | | | | 873,165 | | |
College Park Business & Industrial Development Authority
Refunding Revenue Bonds
Civic Center Project
Series 2005 (AMBAC)
09/01/19 | | | 5.250 | % | | | 500,000 | | | | 508,250 | | |
Columbia County School District
Unlimited General Obligation Bonds
Series 2015
10/01/22 | | | 5.000 | % | | | 1,000,000 | | | | 1,230,890 | | |
County of Columbia
Unlimited General Obligation Bonds
Sales Tax
Series 2015
04/01/22 | | | 5.000 | % | | | 285,000 | | | | 345,417 | | |
County of DeKalb
Refunding Unlimited General Obligation Bonds
Special Transportation - Parks Greenspace
Series 2016
12/01/27 | | | 5.000 | % | | | 750,000 | | | | 966,428 | | |
Forsyth County School District
Unlimited General Obligation Bonds
Series 2014
02/01/28 | | | 5.000 | % | | | 1,000,000 | | | | 1,224,820 | | |
Gwinnett County School District
Unlimited General Obligation Refunding Bonds
Series 2010
02/01/24 | | | 5.000 | % | | | 1,500,000 | | | | 1,903,170 | | |
Municipal Bonds (continued)
Issue
Description | | Coupon
Rate | | Principal
Amount ($) | |
Value ($) | |
Sandy Springs Public Facilities Authority
Revenue Bonds
City Center Project
Series 2015
05/01/28 | | | 5.000 | % | | | 1,000,000 | | | | 1,278,130 | | |
Savannah-Chatham County School District
Unlimited General Obligation Refunding Bonds
Series 2004 (AGM)
08/01/19 | | | 5.250 | % | | | 2,000,000 | | | | 2,278,580 | | |
South Fulton Municipal Regional Water & Sewer Authority
Refunding Revenue Bonds
Series 2014
01/01/31 | | | 5.000 | % | | | 1,000,000 | | | | 1,166,680 | | |
Winder-Barrow Industrial Building Authority
Refunding Revenue Bonds
City of Winder Project
Series 2012 (AGM)
12/01/24 | | | 5.000 | % | | | 1,900,000 | | | | 2,242,722 | | |
Total | | | | | | | 17,678,196 | | |
MULTI-FAMILY 1.4% | |
Cobb County Development Authority
Refunding Revenue Bonds
Kennesaw State University
Junior Subordinated Series 2014
07/15/29 | | | 5.000 | % | | | 980,000 | | | | 1,098,070 | | |
MUNICIPAL POWER 0.3% | |
Guam Power Authority
Refunding Revenue Bonds
Series 2012A (AGM)(a)
10/01/24 | | | 5.000 | % | | | 220,000 | | | | 266,000 | | |
OTHER BOND ISSUE 1.0% | |
Columbus Housing Authority
Revenue Bonds
Eagles Trace Apartments Project
Series 2015
12/01/25 | | | 3.250 | % | | | 750,000 | | | | 756,772 | | |
PREPAID GAS 0.4% | |
Main Street Natural Gas, Inc.
Revenue Bonds
Series 2007A
09/15/19 | | | 5.250 | % | | | 295,000 | | | | 327,506 | | |
REFUNDED / ESCROWED 7.8% | |
Cobb County Development Authority
Prerefunded 07/15/17 Revenue Bonds
KSU Village Real Estate
Series 2007A (AMBAC)
07/15/27 | | | 5.250 | % | | | 2,250,000 | | | | 2,370,285 | | |
The accompanying Notes to Financial Statements are an integral part of this statement.
Annual Report 2016
8
COLUMBIA AMT-FREE GEORGIA INTERMEDIATE MUNI BOND FUND
PORTFOLIO OF INVESTMENTS (continued)
April 30, 2016
Municipal Bonds (continued)
Issue
Description | | Coupon
Rate | | Principal
Amount ($) | |
Value ($) | |
Gwinnett County School District
Prerefunded 02/01/18 Unlimited General Obligation Bonds
Series 2008
02/01/22 | | | 5.000 | % | | | 1,000,000 | | | | 1,074,210 | | |
State of Georgia
Prerefunded 12/01/17 Unlimited General Obligation Bonds
Series 2007G
12/01/20 | | | 5.000 | % | | | 1,000,000 | | | | 1,068,310 | | |
Walton County Water & Sewer Authority
Prerefunded 02/01/18 Revenue Bonds
Hard Labor Creek Project
Series 2008 (AGM)
02/01/25 | | | 5.000 | % | | | 1,495,000 | | | | 1,606,228 | | |
Total | | | | | | | 6,119,033 | | |
SALES TAX 1.2% | |
Metropolitan Atlanta Rapid Transit Authority
Refunding Revenue Bonds
3rd Indenture
Series 2014A
07/01/24 | | | 5.000 | % | | | 750,000 | | | | 935,655 | | |
SINGLE FAMILY 1.3% | |
Georgia Housing & Finance Authority
Revenue Bonds
Series 2014B-1
12/01/29 | | | 3.000 | % | | | 1,000,000 | | | | 1,027,030 | | |
SPECIAL NON PROPERTY TAX 6.0% | |
Cobb-Marietta Coliseum & Exhibit Hall Authority
Refunding Revenue Bonds
Series 2005 (NPFGC)
10/01/19 | | | 5.250 | % | | | 1,500,000 | | | | 1,685,055 | | |
Metropolitan Atlanta Rapid Transit Authority
Refunding Revenue Bonds
Third Indenture
Series 2012A
07/01/30 | | | 5.000 | % | | | 1,500,000 | | | | 1,793,700 | | |
Territory of Guam
Revenue Bonds
Series 2011A(a)
01/01/31 | | | 5.000 | % | | | 300,000 | | | | 337,059 | | |
Virgin Islands Public Finance Authority
Refunding Revenue Bonds
Senior Lien
Series 2009B(a)
10/01/25 | | | 5.000 | % | | | 750,000 | | | | 832,462 | | |
Total | | | | | | | 4,648,276 | | |
Municipal Bonds (continued)
Issue
Description | | Coupon
Rate | | Principal
Amount ($) | |
Value ($) | |
SPECIAL PROPERTY TAX 4.5% | |
Atlanta & Fulton County Recreation Authority
Refunding Revenue Bonds
Park Improvement
Series 2014A
12/01/28 | | | 5.000 | % | | | 525,000 | | | | 643,876 | | |
12/01/33 | | | 5.000 | % | | | 1,000,000 | | | | 1,200,690 | | |
City of Atlanta
Refunding Tax Allocation Bonds
Atlanta Station Project
Series 2007 (AGM)
12/01/20 | | | 5.250 | % | | | 1,545,000 | | | | 1,639,399 | | |
Total | | | | | | | 3,483,965 | | |
STATE GENERAL OBLIGATION 2.9% | |
State of Georgia
Unlimited General Obligation Bonds
Series 2009D
05/01/23 | | | 5.000 | % | | | 2,000,000 | | | | 2,247,280 | | |
TRANSPORTATION 1.4% | |
Georgia State Road & Tollway Authority
Revenue Bonds
Federal Highway Grant
Series 2009A
06/01/21 | | | 5.000 | % | | | 1,000,000 | | | | 1,120,930 | | |
TURNPIKE / BRIDGE / TOLL ROAD 0.8% | |
Georgia State Road & Tollway Authority
Revenue Bonds
I-75 S Express Lanes Project
Series 2014(b)(c)
06/01/24 | | | 0.000 | % | | | 1,000,000 | | | | 638,190 | | |
WATER & SEWER 14.6% | |
Augusta Water & Sewerage
Refunding Revenue Bonds
Series 2007 (AGM)
10/01/21 | | | 5.000 | % | | | 1,000,000 | | | | 1,072,580 | | |
10/01/22 | | | 5.000 | % | | | 2,000,000 | | | | 2,144,560 | | |
Cherokee County Water & Sewer Authority
Refunding Revenue Bonds
Series 2016
08/01/31 | | | 5.000 | % | | | 250,000 | | | | 312,903 | | |
City of Atlanta Water & Wastewater
Refunding Revenue Bonds
Series 2015
11/01/30 | | | 5.000 | % | | | 1,000,000 | | | | 1,225,020 | | |
The accompanying Notes to Financial Statements are an integral part of this statement.
Annual Report 2016
9
COLUMBIA AMT-FREE GEORGIA INTERMEDIATE MUNI BOND FUND
PORTFOLIO OF INVESTMENTS (continued)
April 30, 2016
Municipal Bonds (continued)
Issue
Description | | Coupon
Rate | | Principal
Amount ($) | |
Value ($) | |
City of Columbus Water & Sewerage
Refunding Revenue Bonds
Series 2016
05/01/32 | | | 5.000 | % | | | 350,000 | | | | 436,870 | | |
City of Gainesville Water & Sewerage
Refunding Revenue Bonds
Series 2014
11/15/26 | | | 5.000 | % | | | 1,500,000 | | | | 1,878,405 | | |
County of DeKalb Water & Sewage
Refunding Revenue Bonds
Series 2006B
10/01/21 | | | 5.250 | % | | | 2,000,000 | | | | 2,432,160 | | |
Jackson County Water & Sewer Authority
Revenue Bonds
Series 2006A (XLCA)
09/01/16 | | | 5.000 | % | | | 1,030,000 | | | | 1,042,030 | | |
Municipal Bonds (continued)
Issue
Description | | Coupon
Rate | | Principal
Amount ($) | |
Value ($) | |
Villa Rica Public Facilities Authority
Refunding Revenue Bonds
Water & Sewer Project
Series 2015
03/01/31 | | | 5.000 | % | | | 750,000 | | | | 897,180 | | |
Total | | | | | | | 11,441,708 | | |
Total Municipal Bonds
(Cost: $71,659,854) | | | | | | | 76,946,213 | | |
Total Investments
(Cost: $71,659,854) | | | | | | | 76,946,213 | | |
Other Assets & Liabilities, Net | | | | | | | 1,142,374 | | |
Net Assets | | | | | | | 78,088,587 | | |
Notes to Portfolio of Investments
(a) Municipal obligations include debt obligations issued by or on behalf of territories, possessions, or sovereign nations within the territorial boundaries of the United States. At April 30, 2016, the value of these securities amounted to $1,435,521 or 1.84% of net assets.
(b) Represents privately placed and other securities and instruments exempt from SEC registration (collectively, private placements), such as Section 4(a)(2) and Rule 144A eligible securities, which are often sold only to qualified institutional buyers. The Fund may invest in private placements determined to be liquid as well as those determined to be illiquid. Private placements may be determined to be liquid under guidelines established by the Fund's Board of Trustees. At April 30, 2016, the value of these securities amounted to $638,190 or 0.82% of net assets.
(c) Zero coupon bond.
Abbreviation Legend
AGM Assured Guaranty Municipal Corporation
AMBAC Ambac Assurance Corporation
NPFGC National Public Finance Guarantee Corporation
XLCA XL Capital Assurance
The accompanying Notes to Financial Statements are an integral part of this statement.
Annual Report 2016
10
COLUMBIA AMT-FREE GEORGIA INTERMEDIATE MUNI BOND FUND
PORTFOLIO OF INVESTMENTS (continued)
April 30, 2016
Fair Value Measurements
The Fund categorizes its fair value measurements according to a three-level hierarchy that maximizes the use of observable inputs and minimizes the use of unobservable inputs by prioritizing that the most observable input be used when available. Observable inputs are those that market participants would use in pricing an investment based on market data obtained from sources independent of the reporting entity. Unobservable inputs are those that reflect the Fund's assumptions about the information market participants would use in pricing an investment. An investment's level within the fair value hierarchy is based on the lowest level of any input that is deemed significant to the asset's or liability's fair value measurement. The input levels are not necessarily an indication of the risk or liquidity associated with investments at that level. For example, certain U.S. government securities are generally high quality and liquid, however, they are reflected as Level 2 because the inputs used to determine fair value may not always be quoted prices in an active market.
Fair value inputs are summarized in the three broad levels listed below:
> Level 1 — Valuations based on quoted prices for investments in active markets that the Fund has the ability to access at the measurement date (including NAV for open-end mutual funds). Valuation adjustments are not applied to Level 1 investments.
> Level 2 — Valuations based on other significant observable inputs (including quoted prices for similar securities, interest rates, prepayment speeds, credit risks, etc.).
> Level 3 — Valuations based on significant unobservable inputs (including the Fund's own assumptions and judgment in determining the fair value of investments).
Inputs that are used in determining fair value of an investment may include price information, credit data, volatility statistics, and other factors. These inputs can be either observable or unobservable. The availability of observable inputs can vary between investments, and is affected by various factors such as the type of investment, and the volume and level of activity for that investment or similar investments in the marketplace. The inputs will be considered by the Investment Manager, along with any other relevant factors in the calculation of an investment's fair value. The Fund uses prices and inputs that are current as of the measurement date, which may include periods of market dislocations. During these periods, the availability of prices and inputs may be reduced for many investments. This condition could cause an investment to be reclassified between the various levels within the hierarchy.
Investments falling into the Level 3 category are primarily supported by quoted prices from brokers and dealers participating in the market for those investments. However, these may be classified as Level 3 investments due to lack of market transparency and corroboration to support these quoted prices. Additionally, valuation models may be used as the pricing source for any remaining investments classified as Level 3. These models may rely on one or more significant unobservable inputs and/or significant assumptions by the Investment Manager. Inputs used in valuations may include, but are not limited to, financial statement analysis, capital account balances, discount rates and estimated cash flows, and comparable company data.
Under the direction of the Fund's Board of Trustees (the Board), the Investment Manager's Valuation Committee (the Committee) is responsible for overseeing the valuation procedures approved by the Board. The Committee consists of voting and non-voting members from various groups within the Investment Manager's organization, including operations and accounting, trading and investments, compliance, risk management and legal.
The Committee meets at least monthly to review and approve valuation matters, which may include a description of specific valuation determinations, data regarding pricing information received from approved pricing vendors and brokers and the results of Board-approved valuation control policies and procedures (the Policies). The Policies address, among other things, instances when market quotations are or are not readily available, including recommendations of third party pricing vendors and a determination of appropriate pricing methodologies; events that require specific valuation determinations and assessment of fair value techniques; securities with a potential for stale pricing, including those that are illiquid, restricted, or in default; and the effectiveness of third party pricing vendors, including periodic reviews of vendors. The Committee meets more frequently, as needed, to discuss additional valuation matters, which may include the need to review back-testing results, review time-sensitive information or approve related valuation actions. The Committee reports to the Board, with members of the Committee meeting with the Board at each of its regularly scheduled meetings to discuss valuation matters and actions during the period, similar to those described earlier.
For investments categorized as Level 3, the Committee monitors information similar to that described above, which may include: (i) data specific to the issuer or comparable issuers, (ii) general market or specific sector news and (iii) quoted prices and specific or similar security transactions. The Committee considers this data and any changes from prior periods in order to assess the reasonableness of observable and unobservable inputs, any assumptions or internal models used to value those securities and changes in fair value. This data is also used to corroborate, when available, information received from approved pricing vendors and brokers. Various factors impact the frequency of monitoring this information (which may occur as often as daily). However, the Committee may determine that changes to inputs, assumptions and models are not required as a result of the monitoring procedures performed.
The accompanying Notes to Financial Statements are an integral part of this statement.
Annual Report 2016
11
COLUMBIA AMT-FREE GEORGIA INTERMEDIATE MUNI BOND FUND
PORTFOLIO OF INVESTMENTS (continued)
April 30, 2016
Fair Value Measurements (continued)
The following table is a summary of the inputs used to value the Fund's investments at April 30, 2016:
| | | Level 1
Quoted Prices in Active
Markets for Identical
Assets ($) | | Level 2
Other Significant
Observable Inputs ($) | | Level 3
Significant
Unobservable Inputs ($) | | Total ($) | |
Investments | |
Municipal Bonds | | | — | | | | 76,946,213 | | | | — | | | | 76,946,213 | | |
Total Investments | | | — | | | | 76,946,213 | | | | — | | | | 76,946,213 | | |
See the Portfolio of Investments for all investment classifications not indicated in the table.
The Fund's assets assigned to the Level 2 input category are generally valued using the market approach, in which a security's value is determined through reference to prices and information from market transactions for similar or identical assets.
There were no transfers of financial assets between levels during the period.
The accompanying Notes to Financial Statements are an integral part of this statement.
Annual Report 2016
12
COLUMBIA AMT-FREE GEORGIA INTERMEDIATE MUNI BOND FUND
STATEMENT OF ASSETS AND LIABILITIES
April 30, 2016
Assets | |
Investments, at value | |
(identified cost $71,659,854) | | $ | 76,946,213 | | |
Cash | | | 696,816 | | |
Receivable for: | |
Capital shares sold | | | 69,461 | | |
Interest | | | 966,404 | | |
Expense reimbursement due from Investment Manager | | | 310 | | |
Prepaid expenses | | | 659 | | |
Total assets | | | 78,679,863 | | |
Liabilities | |
Payable for: | |
Capital shares purchased | | | 260,403 | | |
Dividend distributions to shareholders | | | 174,083 | | |
Investment management fees | | | 1,005 | | |
Distribution and/or service fees | | | 279 | | |
Transfer agent fees | | | 13,160 | | |
Compensation of board members | | | 112,159 | | |
Other expenses | | | 30,187 | | |
Total liabilities | | | 591,276 | | |
Net assets applicable to outstanding capital stock | | $ | 78,088,587 | | |
Represented by | |
Paid-in capital | | $ | 72,382,124 | | |
Undistributed net investment income | | | 134,881 | | |
Accumulated net realized gain | | | 285,223 | | |
Unrealized appreciation (depreciation) on: | |
Investments | | | 5,286,359 | | |
Total — representing net assets applicable to outstanding capital stock | | $ | 78,088,587 | | |
The accompanying Notes to Financial Statements are an integral part of this statement.
Annual Report 2016
13
COLUMBIA AMT-FREE GEORGIA INTERMEDIATE MUNI BOND FUND
STATEMENT OF ASSETS AND LIABILITIES (continued)
April 30, 2016
Class A | |
Net assets | | $ | 20,376,670 | | |
Shares outstanding | | | 1,872,621 | | |
Net asset value per share | | $ | 10.88 | | |
Maximum offering price per share(a) | | $ | 11.22 | | |
Class B | |
Net assets | | $ | 151,555 | | |
Shares outstanding | | | 13,920 | | |
Net asset value per share | | $ | 10.89 | | |
Class C | |
Net assets | | $ | 4,995,740 | | |
Shares outstanding | | | 458,964 | | |
Net asset value per share | | $ | 10.88 | | |
Class R4 | |
Net assets | | $ | 249,657 | | |
Shares outstanding | | | 22,975 | | |
Net asset value per share | | $ | 10.87 | | |
Class Z | |
Net assets | | $ | 52,314,965 | | |
Shares outstanding | | | 4,808,108 | | |
Net asset value per share | | $ | 10.88 | | |
(a) The maximum offering price per share is calculated by dividing the net asset value per share by 1.0 minus the maximum sales charge of 3.00%.
The accompanying Notes to Financial Statements are an integral part of this statement.
Annual Report 2016
14
COLUMBIA AMT-FREE GEORGIA INTERMEDIATE MUNI BOND FUND
STATEMENT OF OPERATIONS
Year Ended April 30, 2016
Net investment income | |
Income: | |
Interest | | $ | 2,739,580 | | |
Total income | | | 2,739,580 | | |
Expenses: | |
Investment management fees | | | 363,964 | | |
Distribution and/or service fees | |
Class A | | | 50,377 | | |
Class B | | | 1,513 | | |
Class C | | | 48,777 | | |
Transfer agent fees | |
Class A | | | 40,995 | | |
Class B | | | 309 | | |
Class C | | | 9,890 | | |
Class R4 | | | 437 | | |
Class Z | | | 106,426 | | |
Compensation of board members | | | 8,554 | | |
Custodian fees | | | 1,621 | | |
Printing and postage fees | | | 18,570 | | |
Registration fees | | | 17,580 | | |
Audit fees | | | 27,051 | | |
Legal fees | | | 7,053 | | |
Other | | | 10,956 | | |
Total expenses | | | 714,073 | | |
Fees waived or expenses reimbursed by Investment Manager and its affiliates | | | (180,727 | ) | |
Total net expenses | | | 533,346 | | |
Net investment income | | | 2,206,234 | | |
Realized and unrealized gain (loss) — net | |
Net realized gain (loss) on: | |
Investments | | | 351,587 | | |
Net realized gain | | | 351,587 | | |
Net change in unrealized appreciation (depreciation) on: | |
Investments | | | 424,166 | | |
Net change in unrealized appreciation | | | 424,166 | | |
Net realized and unrealized gain | | | 775,753 | | |
Net increase in net assets resulting from operations | | $ | 2,981,987 | | |
The accompanying Notes to Financial Statements are an integral part of this statement.
Annual Report 2016
15
COLUMBIA AMT-FREE GEORGIA INTERMEDIATE MUNI BOND FUND
STATEMENT OF CHANGES IN NET ASSETS
| | | Year Ended
April 30,
2016 | | Year Ended
April 30,
2015 | |
Operations | |
Net investment income | | $ | 2,206,234 | | | $ | 2,318,098 | | |
Net realized gain | | | 351,587 | | | | 554,673 | | |
Net change in unrealized appreciation (depreciation) | | | 424,166 | | | | (493,546 | ) | |
Net increase in net assets resulting from operations | | | 2,981,987 | | | | 2,379,225 | | |
Distributions to shareholders | |
Net investment income | |
Class A | | | (551,222 | ) | | | (499,941 | ) | |
Class B | | | (3,015 | ) | | | (4,087 | ) | |
Class C | | | (96,802 | ) | | | (84,713 | ) | |
Class R4 | | | (6,445 | ) | | | (4,525 | ) | |
Class Z | | | (1,554,637 | ) | | | (1,724,830 | ) | |
Net realized gains | |
Class A | | | (68,634 | ) | | | (32,634 | ) | |
Class B | | | (498 | ) | | | (381 | ) | |
Class C | | | (17,023 | ) | | | (8,321 | ) | |
Class R4 | | | (623 | ) | | | (341 | ) | |
Class Z | | | (178,493 | ) | | | (110,861 | ) | |
Total distributions to shareholders | | | (2,477,392 | ) | | | (2,470,634 | ) | |
Decrease in net assets from capital stock activity | | | (1,509,052 | ) | | | (266,876 | ) | |
Total decrease in net assets | | | (1,004,457 | ) | | | (358,285 | ) | |
Net assets at beginning of year | | | 79,093,044 | | | | 79,451,329 | | |
Net assets at end of year | | $ | 78,088,587 | | | $ | 79,093,044 | | |
Undistributed net investment income | | $ | 134,881 | | | $ | 140,768 | | |
The accompanying Notes to Financial Statements are an integral part of this statement.
Annual Report 2016
16
COLUMBIA AMT-FREE GEORGIA INTERMEDIATE MUNI BOND FUND
STATEMENT OF CHANGES IN NET ASSETS (continued)
| | | Year Ended April 30, 2016 | | Year Ended April 30, 2015 | |
| | | Shares | | Dollars ($) | | Shares | | Dollars ($) | |
Capital stock activity | |
Class A shares | |
Subscriptions(a) | | | 130,384 | | | | 1,404,666 | | | | 475,068 | | | | 5,176,385 | | |
Distributions reinvested | | | 38,098 | | | | 410,631 | | | | 30,975 | | | | 336,671 | | |
Redemptions | | | (151,849 | ) | | | (1,637,945 | ) | | | (196,429 | ) | | | (2,134,008 | ) | |
Net increase | | | 16,633 | | | | 177,352 | | | | 309,614 | | | | 3,379,048 | | |
Class B shares | |
Subscriptions | | | 1,051 | | | | 11,290 | | | | 115 | | | | 1,250 | | |
Distributions reinvested | | | 189 | | | | 2,036 | | | | 262 | | | | 2,849 | | |
Redemptions(a) | | | (2,418 | ) | | | (25,951 | ) | | | (4,902 | ) | | | (53,170 | ) | |
Net decrease | | | (1,178 | ) | | | (12,625 | ) | | | (4,525 | ) | | | (49,071 | ) | |
Class C shares | |
Subscriptions | | | 108,840 | | | | 1,171,124 | | | | 169,429 | | | | 1,839,972 | | |
Distributions reinvested | | | 8,524 | | | | 91,875 | | | | 7,032 | | | | 76,451 | | |
Redemptions | | | (85,007 | ) | | | (914,610 | ) | | | (73,384 | ) | | | (796,797 | ) | |
Net increase | | | 32,357 | | | | 348,389 | | | | 103,077 | | | | 1,119,626 | | |
Class R4 shares | |
Subscriptions | | | 5,421 | | | | 58,325 | | | | 16,598 | | | | 179,946 | | |
Distributions reinvested | | | 625 | | | | 6,734 | | | | 418 | | | | 4,533 | | |
Redemptions | | | (3,482 | ) | | | (37,466 | ) | | | (23 | ) | | | (247 | ) | |
Net increase | | | 2,564 | | | | 27,593 | | | | 16,993 | | | | 184,232 | | |
Class Z shares | |
Subscriptions | | | 769,419 | | | | 8,308,660 | | | | 736,716 | | | | 7,998,036 | | |
Distributions reinvested | | | 22,919 | | | | 247,056 | | | | 17,225 | | | | 187,236 | | |
Redemptions | | | (983,808 | ) | | | (10,605,477 | ) | | | (1,205,636 | ) | | | (13,085,983 | ) | |
Net decrease | | | (191,470 | ) | | | (2,049,761 | ) | | | (451,695 | ) | | | (4,900,711 | ) | |
Total net decrease | | | (141,094 | ) | | | (1,509,052 | ) | | | (26,536 | ) | | | (266,876 | ) | |
(a) Includes conversions of Class B shares to Class A shares, if any.
The accompanying Notes to Financial Statements are an integral part of this statement.
Annual Report 2016
17
COLUMBIA AMT-FREE GEORGIA INTERMEDIATE MUNI BOND FUND
The following tables are intended to help you understand the Fund's financial performance. Certain information reflects financial results for a single share of a class held for the periods shown. Per share net investment income (loss) amounts are calculated based on average shares outstanding during the period. Total return assumes reinvestment of all dividends and distributions, if any. Total return does not reflect payment of sales charges, if any. Total return and portfolio turnover are not annualized for periods of less than one year. The portfolio turnover rate is calculated without regard to purchase and sales transactions of short-term instruments and certain derivatives, if any. If such transactions were included, the Fund's portfolio turnover rate may be higher.
| | | Year Ended April 30, | | Year Ended
March 31, | |
Class A | | 2016 | | 2015 | | 2014 | | 2013 | | 2012(a) | | 2012 | |
Per share data | |
Net asset value, beginning of period | | $ | 10.81 | | | $ | 10.82 | | | $ | 11.21 | | | $ | 11.18 | | | $ | 11.09 | | | $ | 10.50 | | |
Income from investment operations: | |
Net investment income | | | 0.29 | | | | 0.31 | | | | 0.31 | | | | 0.31 | | | | 0.03 | | | | 0.33 | | |
Net realized and unrealized gain (loss) | | | 0.11 | | | | 0.01 | | | | (0.32 | ) | | | 0.04 | | | | 0.09 | | | | 0.59 | | |
Total from investment operations | | | 0.40 | | | | 0.32 | | | | (0.01 | ) | | | 0.35 | | | | 0.12 | | | | 0.92 | | |
Less distributions to shareholders: | |
Net investment income | | | (0.29 | ) | | | (0.31 | ) | | | (0.31 | ) | | | (0.31 | ) | | | (0.03 | ) | | | (0.33 | ) | |
Net realized gains | | | (0.04 | ) | | | (0.02 | ) | | | (0.07 | ) | | | (0.01 | ) | | | — | | | | — | | |
Total distributions to shareholders | | | (0.33 | ) | | | (0.33 | ) | | | (0.38 | ) | | | (0.32 | ) | | | (0.03 | ) | | | (0.33 | ) | |
Net asset value, end of period | | $ | 10.88 | | | $ | 10.81 | | | $ | 10.82 | | | $ | 11.21 | | | $ | 11.18 | | | $ | 11.09 | | |
Total return | | | 3.78 | % | | | 2.98 | % | | | 0.02 | % | | | 3.16 | % | | | 1.05 | % | | | 8.85 | % | |
Ratios to average net assets(b) | |
Total gross expenses | | | 1.04 | % | | | 1.06 | % | | | 1.07 | % | | | 1.03 | % | | | 1.02 | %(c) | | | 1.04 | % | |
Total net expenses(d) | | | 0.81 | % | | | 0.81 | % | | | 0.81 | % | | | 0.81 | % | | | 0.80 | %(c) | | | 0.80 | %(e) | |
Net investment income | | | 2.73 | % | | | 2.83 | % | | | 2.89 | % | | | 2.77 | % | | | 2.92 | %(c) | | | 2.99 | % | |
Supplemental data | |
Net assets, end of period (in thousands) | | $ | 20,377 | | | $ | 20,060 | | | $ | 16,728 | | | $ | 21,517 | | | $ | 19,861 | | | $ | 19,563 | | |
Portfolio turnover | | | 13 | % | | | 19 | % | | | 5 | % | | | 16 | % | | | 0 | % | | | 11 | % | |
Notes to Financial Highlights
(a) For the period from April 1, 2012 to April 30, 2012. During the period, the Fund's fiscal year end was changed from March 31 to April 30.
(b) In addition to the fees and expenses that the Fund bears directly, the Fund indirectly bears a pro rata share of the fees and expenses of any other funds in which it invests. Such indirect expenses are not included in the Fund's reported expense ratios.
(c) Annualized.
(d) Total net expenses include the impact of certain fee waivers/expense reimbursements made by the Investment Manager and certain of its affiliates, if applicable.
(e) The benefits derived from expense reductions had an impact of less than 0.01%.
The accompanying Notes to Financial Statements are an integral part of this statement.
Annual Report 2016
18
COLUMBIA AMT-FREE GEORGIA INTERMEDIATE MUNI BOND FUND
FINANCIAL HIGHLIGHTS (continued)
| | | Year Ended April 30, | | Year Ended
March 31, | |
Class B | | 2016 | | 2015 | | 2014 | | 2013 | | 2012(a) | | 2012 | |
Per share data | |
Net asset value, beginning of period | | $ | 10.81 | | | $ | 10.82 | | | $ | 11.22 | | | $ | 11.18 | | | $ | 11.10 | | | $ | 10.50 | | |
Income from investment operations: | |
Net investment income | | | 0.21 | | | | 0.23 | | | | 0.23 | | | | 0.23 | | | | 0.02 | | | | 0.24 | | |
Net realized and unrealized gain (loss) | | | 0.12 | | | | 0.01 | | | | (0.33 | ) | | | 0.05 | | | | 0.08 | | | | 0.60 | | |
Total from investment operations | | | 0.33 | | | | 0.24 | | | | (0.10 | ) | | | 0.28 | | | | 0.10 | | | | 0.84 | | |
Less distributions to shareholders: | |
Net investment income | | | (0.21 | ) | | | (0.23 | ) | | | (0.23 | ) | | | (0.23 | ) | | | (0.02 | ) | | | (0.24 | ) | |
Net realized gains | | | (0.04 | ) | | | (0.02 | ) | | | (0.07 | ) | | | (0.01 | ) | | | — | | | | — | | |
Total distributions to shareholders | | | (0.25 | ) | | | (0.25 | ) | | | (0.30 | ) | | | (0.24 | ) | | | (0.02 | ) | | | (0.24 | ) | |
Net asset value, end of period | | $ | 10.89 | | | $ | 10.81 | | | $ | 10.82 | | | $ | 11.22 | | | $ | 11.18 | | | $ | 11.10 | | |
Total return | | | 3.10 | % | | | 2.21 | % | | | (0.82 | %) | | | 2.48 | % | | | 0.90 | % | | | 8.10 | % | |
Ratios to average net assets(b) | |
Total gross expenses | | | 1.80 | % | | | 1.81 | % | | | 1.83 | % | | | 1.78 | % | | | 1.77 | %(c) | | | 1.81 | % | |
Total net expenses(d) | | | 1.56 | % | | | 1.56 | % | | | 1.56 | % | | | 1.56 | % | | | 1.55 | %(c) | | | 1.55 | %(e) | |
Net investment income | | | 1.99 | % | | | 2.09 | % | | | 2.15 | % | | | 2.04 | % | | | 2.17 | %(c) | | | 2.25 | % | |
Supplemental data | |
Net assets, end of period (in thousands) | | $ | 152 | | | $ | 163 | | | $ | 212 | | | $ | 216 | | | $ | 373 | | | $ | 369 | | |
Portfolio turnover | | | 13 | % | | | 19 | % | | | 5 | % | | | 16 | % | | | 0 | % | | | 11 | % | |
Notes to Financial Highlights
(a) For the period from April 1, 2012 to April 30, 2012. During the period, the Fund's fiscal year end was changed from March 31 to April 30.
(b) In addition to the fees and expenses that the Fund bears directly, the Fund indirectly bears a pro rata share of the fees and expenses of any other funds in which it invests. Such indirect expenses are not included in the Fund's reported expense ratios.
(c) Annualized.
(d) Total net expenses include the impact of certain fee waivers/expense reimbursements made by the Investment Manager and certain of its affiliates, if applicable.
(e) The benefits derived from expense reductions had an impact of less than 0.01%.
The accompanying Notes to Financial Statements are an integral part of this statement.
Annual Report 2016
19
COLUMBIA AMT-FREE GEORGIA INTERMEDIATE MUNI BOND FUND
FINANCIAL HIGHLIGHTS (continued)
| | | Year Ended April 30, | | Year Ended
March 31, | |
Class C | | 2016 | | 2015 | | 2014 | | 2013 | | 2012(a) | | 2012 | |
Per share data | |
Net asset value, beginning of period | | $ | 10.81 | | | $ | 10.82 | | | $ | 11.22 | | | $ | 11.18 | | | $ | 11.09 | | | $ | 10.50 | | |
Income from investment operations: | |
Net investment income | | | 0.21 | | | | 0.23 | | | | 0.23 | | | | 0.23 | | | | 0.02 | | | | 0.24 | | |
Net realized and unrealized gain (loss) | | | 0.11 | | | | 0.01 | | | | (0.33 | ) | | | 0.04 | | | | 0.09 | | | | 0.59 | | |
Total from investment operations | | | 0.32 | | | | 0.24 | | | | (0.10 | ) | | | 0.27 | | | | 0.11 | | | | 0.83 | | |
Less distributions to shareholders: | |
Net investment income | | | (0.21 | ) | | | (0.23 | ) | | | (0.23 | ) | | | (0.22 | ) | | | (0.02 | ) | | | (0.24 | ) | |
Net realized gains | | | (0.04 | ) | | | (0.02 | ) | | | (0.07 | ) | | | (0.01 | ) | | | — | | | | — | | |
Total distributions to shareholders | | | (0.25 | ) | | | (0.25 | ) | | | (0.30 | ) | | | (0.23 | ) | | | (0.02 | ) | | | (0.24 | ) | |
Net asset value, end of period | | $ | 10.88 | | | $ | 10.81 | | | $ | 10.82 | | | $ | 11.22 | | | $ | 11.18 | | | $ | 11.09 | | |
Total return | | | 3.01 | % | | | 2.21 | % | | | (0.82 | %) | | | 2.48 | % | | | 0.99 | % | | | 8.00 | % | |
Ratios to average net assets(b) | |
Total gross expenses | | | 1.79 | % | | | 1.81 | % | | | 1.82 | % | | | 1.78 | % | | | 1.77 | %(c) | | | 1.78 | % | |
Total net expenses(d) | | | 1.56 | % | | | 1.56 | % | | | 1.56 | % | | | 1.56 | % | | | 1.55 | %(c) | | | 1.55 | %(e) | |
Net investment income | | | 1.98 | % | | | 2.08 | % | | | 2.14 | % | | | 2.02 | % | | | 2.17 | %(c) | | | 2.23 | % | |
Supplemental data | |
Net assets, end of period (in thousands) | | $ | 4,996 | | | $ | 4,612 | | | $ | 3,501 | | | $ | 4,301 | | | $ | 3,919 | | | $ | 4,066 | | |
Portfolio turnover | | | 13 | % | | | 19 | % | | | 5 | % | | | 16 | % | | | 0 | % | | | 11 | % | |
Notes to Financial Highlights
(a) For the period from April 1, 2012 to April 30, 2012. During the period, the Fund's fiscal year end was changed from March 31 to April 30.
(b) In addition to the fees and expenses that the Fund bears directly, the Fund indirectly bears a pro rata share of the fees and expenses of any other funds in which it invests. Such indirect expenses are not included in the Fund's reported expense ratios.
(c) Annualized.
(d) Total net expenses include the impact of certain fee waivers/expense reimbursements made by the Investment Manager and certain of its affiliates, if applicable.
(e) The benefits derived from expense reductions had an impact of less than 0.01%.
The accompanying Notes to Financial Statements are an integral part of this statement.
Annual Report 2016
20
COLUMBIA AMT-FREE GEORGIA INTERMEDIATE MUNI BOND FUND
FINANCIAL HIGHLIGHTS (continued)
| | | Year Ended April 30, | |
Class R4 | | 2016 | | 2015 | | 2014 | | 2013(a) | |
Per share data | |
Net asset value, beginning of period | | $ | 10.79 | | | $ | 10.80 | | | $ | 11.20 | | | $ | 11.12 | | |
Income from investment operations: | |
Net investment income | | | 0.32 | | | | 0.33 | | | | 0.34 | | | | 0.04 | | |
Net realized and unrealized gain (loss) | | | 0.12 | | | | 0.02 | | | | (0.33 | ) | | | 0.08 | | |
Total from investment operations | | | 0.44 | | | | 0.35 | | | | 0.01 | | | | 0.12 | | |
Less distributions to shareholders: | |
Net investment income | | | (0.32 | ) | | | (0.34 | ) | | | (0.34 | ) | | | (0.04 | ) | |
Net realized gains | | | (0.04 | ) | | | (0.02 | ) | | | (0.07 | ) | | | — | | |
Total distributions to shareholders | | | (0.36 | ) | | | (0.36 | ) | | | (0.41 | ) | | | (0.04 | ) | |
Net asset value, end of period | | $ | 10.87 | | | $ | 10.79 | | | $ | 10.80 | | | $ | 11.20 | | |
Total return | | | 4.14 | % | | | 3.24 | % | | | 0.18 | % | | | 1.07 | % | |
Ratios to average net assets(b) | |
Total gross expenses | | | 0.79 | % | | | 0.81 | % | | | 0.88 | % | | | 0.72 | %(c) | |
Total net expenses(d) | | | 0.56 | % | | | 0.56 | % | | | 0.56 | % | | | 0.53 | %(c) | |
Net investment income | | | 2.98 | % | | | 3.09 | % | | | 3.21 | % | | | 3.12 | %(c) | |
Supplemental data | |
Net assets, end of period (in thousands) | | $ | 250 | | | $ | 220 | | | $ | 37 | | | $ | 3 | | |
Portfolio turnover | | | 13 | % | | | 19 | % | | | 5 | % | | | 16 | % | |
Notes to Financial Highlights
(a) Based on operations from March 19, 2013 (commencement of operations) through the stated period end.
(b) In addition to the fees and expenses that the Fund bears directly, the Fund indirectly bears a pro rata share of the fees and expenses of any other funds in which it invests. Such indirect expenses are not included in the Fund's reported expense ratios.
(c) Annualized.
(d) Total net expenses include the impact of certain fee waivers/expense reimbursements made by the Investment Manager and certain of its affiliates, if applicable.
The accompanying Notes to Financial Statements are an integral part of this statement.
Annual Report 2016
21
COLUMBIA AMT-FREE GEORGIA INTERMEDIATE MUNI BOND FUND
FINANCIAL HIGHLIGHTS (continued)
| | | Year Ended April 30, | | Year Ended
March 31, | |
Class Z | | 2016 | | 2015 | | 2014 | | 2013 | | 2012(a) | | 2012 | |
Per share data | |
Net asset value, beginning of period | | $ | 10.81 | | | $ | 10.82 | | | $ | 11.22 | | | $ | 11.18 | | | $ | 11.09 | | | $ | 10.50 | | |
Income from investment operations: | |
Net investment income | | | 0.32 | | | | 0.34 | | | | 0.34 | | | | 0.34 | | | | 0.03 | | | | 0.35 | | |
Net realized and unrealized gain (loss) | | | 0.11 | | | | 0.01 | | | | (0.33 | ) | | | 0.05 | | | | 0.09 | | | | 0.59 | | |
Total from investment operations | | | 0.43 | | | | 0.35 | | | | 0.01 | | | | 0.39 | | | | 0.12 | | | | 0.94 | | |
Less distributions to shareholders: | |
Net investment income | | | (0.32 | ) | | | (0.34 | ) | | | (0.34 | ) | | | (0.34 | ) | | | (0.03 | ) | | | (0.35 | ) | |
Net realized gains | | | (0.04 | ) | | | (0.02 | ) | | | (0.07 | ) | | | (0.01 | ) | | | — | | | | — | | |
Total distributions to shareholders | | | (0.36 | ) | | | (0.36 | ) | | | (0.41 | ) | | | (0.35 | ) | | | (0.03 | ) | | | (0.35 | ) | |
Net asset value, end of period | | $ | 10.88 | | | $ | 10.81 | | | $ | 10.82 | | | $ | 11.22 | | | $ | 11.18 | | | $ | 11.09 | | |
Total return | | | 4.04 | % | | | 3.24 | % | | | 0.18 | % | | | 3.51 | % | | | 1.07 | % | | | 9.08 | % | |
Ratios to average net assets(b) | |
Total gross expenses | | | 0.79 | % | | | 0.81 | % | | | 0.82 | % | | | 0.78 | % | | | 0.77 | %(c) | | | 0.79 | % | |
Total net expenses(d) | | | 0.56 | % | | | 0.56 | % | | | 0.56 | % | | | 0.56 | % | | | 0.55 | %(c) | | | 0.55 | %(e) | |
Net investment income | | | 2.98 | % | | | 3.09 | % | | | 3.14 | % | | | 3.02 | % | | | 3.17 | %(c) | | | 3.24 | % | |
Supplemental data | |
Net assets, end of period (in thousands) | | $ | 52,315 | | | $ | 54,037 | | | $ | 58,973 | | | $ | 73,154 | | | $ | 79,910 | | | $ | 79,371 | | |
Portfolio turnover | | | 13 | % | | | 19 | % | | | 5 | % | | | 16 | % | | | 0 | % | | | 11 | % | |
Notes to Financial Highlights
(a) For the period from April 1, 2012 to April 30, 2012. During the period, the Fund's fiscal year end was changed from March 31 to April 30.
(b) In addition to the fees and expenses that the Fund bears directly, the Fund indirectly bears a pro rata share of the fees and expenses of any other funds in which it invests. Such indirect expenses are not included in the Fund's reported expense ratios.
(c) Annualized.
(d) Total net expenses include the impact of certain fee waivers/expense reimbursements made by the Investment Manager and certain of its affiliates, if applicable.
(e) The benefits derived from expense reductions had an impact of less than 0.01%.
The accompanying Notes to Financial Statements are an integral part of this statement.
Annual Report 2016
22
COLUMBIA AMT-FREE GEORGIA INTERMEDIATE MUNI BOND FUND
NOTES TO FINANCIAL STATEMENTS
April 30, 2016
Note 1. Organization
Columbia AMT-Free Georgia Intermediate Muni Bond Fund (the Fund), a series of Columbia Funds Series Trust (the Trust), is a diversified fund. The Trust is registered under the Investment Company Act of 1940, as amended (the 1940 Act), as an open-end management investment company organized as a Delaware statutory trust.
Fund Shares
The Trust may issue an unlimited number of shares (without par value). The Fund offers Class A, Class B, Class C, Class R4 and Class Z shares. Although all share classes generally have identical voting, dividend and liquidation rights, each share class votes separately when required by the Trust's organizational documents or by law. Different share classes pay different distribution amounts to the extent the expenses of such share classes differ, and distributions in liquidation will be proportional to the net asset value of each share class. Each share class has its own expense and sales charge structure.
Class A shares are subject to a maximum front-end sales charge of 3.00% based on the initial investment amount. In addition, Class A shares purchased on or after February 19, 2015 are subject to a contingent deferred sales charge (CDSC) of 0.75% on certain investments of $500,000 or more if redeemed within 12 months after purchase. Redemptions of Class A shares purchased prior to February 19, 2015, without an initial sales charge in accounts aggregating $1 million to $50 million at the time of purchase, are subject to a CDSC of 1.00% if redeemed within 12 months after purchase, and 0.50% if redeemed more than 12, but less than 18, months after purchase.
Class B shares may be subject to a maximum CDSC of 3.00% based upon the holding period after purchase. Class B shares will generally convert to Class A shares eight years after purchase. The Fund no longer accepts investments by new or existing investors in the Fund's Class B shares, except in connection with the reinvestment of any dividend and/or capital gain distributions in Class B shares of the Fund and exchanges by existing Class B shareholders of certain other funds within the Columbia Family of Funds.
Class C shares are subject to a 1.00% CDSC on shares redeemed within 12 months after purchase.
Class R4 shares are not subject to sales charges and are generally available only to omnibus retirement plans
and certain investors as described in the Fund's prospectus.
Class Z shares are not subject to sales charges and are available only to eligible investors, which are subject to different investment minimums as described in the Fund's prospectus.
Note 2. Summary of Significant Accounting Policies
Basis of Preparation
The Fund is an investment company that applies the accounting and reporting guidance in the Financial Accounting Standards Board (FASB) Accounting Standards Codification Topic 946, Financial Services — Investment Companies (ASC 946). The financial statements are prepared in accordance with U.S. generally accepted accounting principles (GAAP), which requires management to make certain estimates and assumptions that affect the reported amounts of assets and liabilities, the disclosure of contingent assets and liabilities at the date of the financial statements and the reported amounts of income and expenses during the reporting period. Actual results could differ from those estimates.
The following is a summary of significant accounting policies followed by the Fund in the preparation of its financial statements.
Security Valuation
Debt securities generally are valued by pricing services approved by the Board of Trustees (the Board) based upon market transactions for normal, institutional-size trading units of similar securities. The services may use various pricing techniques that take into account, as applicable, factors such as yield, quality, coupon rate, maturity, type of issue, trading characteristics and other data, as well as broker quotes. Debt securities for which quotations are not readily available or not believed to be reflective of market value may also be valued based upon a bid quote from an approved independent broker-dealer. Debt securities maturing in 60 days or less are valued primarily at amortized cost value, unless this method results in a valuation that management believes does not approximate market value.
Investments for which market quotations are not readily available, or that have quotations which management believes are not reflective of market value or reliable, are valued at fair value as determined in good faith under procedures approved by and under the general
Annual Report 2016
23
COLUMBIA AMT-FREE GEORGIA INTERMEDIATE MUNI BOND FUND
NOTES TO FINANCIAL STATEMENTS (continued)
April 30, 2016
supervision of the Board. If a security or class of securities (such as foreign securities) is valued at fair value, such value is likely to be different from the quoted or published price for the security.
The determination of fair value often requires significant judgment. To determine fair value, management may use assumptions including but not limited to future cash flows and estimated risk premiums. Multiple inputs from various sources may be used to determine fair value.
GAAP requires disclosure regarding the inputs and valuation techniques used to measure fair value and any changes in valuation inputs or techniques. In addition, investments shall be disclosed by major category. This information is disclosed following the Fund's Portfolio of Investments.
Security Transactions
Security transactions are accounted for on the trade date. Cost is determined and gains (losses) are based upon the specific identification method for both financial statement and federal income tax purposes.
Income Recognition
Interest income is recorded on an accrual basis. Market premiums and discounts, including original issue discounts, are amortized and accreted, respectively, over the expected life of the security on all debt securities, unless otherwise noted.
The Fund may place a debt security on non-accrual status and reduce related interest income when it becomes probable that the interest will not be collected and the amount of uncollectible interest can be reasonably estimated. A defaulted debt security is removed from non-accrual status when the issuer resumes interest payments or when collectibility of interest is reasonably assured.
Expenses
General expenses of the Trust are allocated to the Fund and other funds of the Trust based upon relative net assets or other expense allocation methodologies determined by the nature of the expense. Expenses directly attributable to the Fund are charged to the Fund. Expenses directly attributable to a specific class of shares are charged to that share class.
Determination of Class Net Asset Value
All income, expenses (other than class-specific expenses, which are charged to that share class, as shown in the Statement of Operations) and realized and
unrealized gains (losses) are allocated to each class of the Fund on a daily basis, based on the relative net assets of each class, for purposes of determining the net asset value of each class.
Federal Income Tax Status
The Fund intends to qualify each year as a regulated investment company under Subchapter M of the Internal Revenue Code, as amended, and will distribute substantially all of its tax exempt and taxable income (including net short-term capital gains), if any, for its tax year, and as such will not be subject to federal income taxes. In addition, the Fund intends to distribute in each calendar year substantially all of its net investment income, capital gains and certain other amounts, if any, such that the Fund should not be subject to federal excise tax. Therefore, no federal income or excise tax provision is recorded.
Distributions to Shareholders
Distributions from net investment income, if any, are declared daily and paid monthly. Net realized capital gains, if any, are distributed at least annually. Income distributions and capital gain distributions are determined in accordance with federal income tax regulations, which may differ from GAAP.
Guarantees and Indemnifications
Under the Trust's organizational documents and, in some cases, by contract, its officers and trustees are indemnified against certain liabilities arising out of the performance of their duties to the Trust or its funds. In addition, certain of the Fund's contracts with its service providers contain general indemnification clauses. The Fund's maximum exposure under these arrangements is unknown since the amount of any future claims that may be made against the Fund cannot be determined, and the Fund has no historical basis for predicting the likelihood of any such claims.
Note 3. Fees and Other Transactions with Affiliates
Management Fees
Effective September 1, 2015, the Fund entered into a Management Agreement with Columbia Management Investment Advisers, LLC (the Investment Manager), a wholly-owned subsidiary of Ameriprise Financial, Inc. (Ameriprise Financial). Under the Management Agreement, the Investment Manager provides the Fund with investment research and advice, as well as
Annual Report 2016
24
COLUMBIA AMT-FREE GEORGIA INTERMEDIATE MUNI BOND FUND
NOTES TO FINANCIAL STATEMENTS (continued)
April 30, 2016
administrative and accounting services. The management services fee is an annual fee that is equal to a percentage of the Fund's average daily net assets that declines from 0.47% to 0.31% as the Fund's net assets increase. The effective management services fee rate for the year ended April 30, 2016 was 0.47% of the Fund's average daily net assets.
Prior to September 1, 2015, the Fund paid the Investment Manager an annual fee for advisory services under an Investment Management Services Agreement and a separate annual fee for administrative and accounting services under an Administrative Services Agreement. For the period from May 1, 2015 through August 31, 2015, the investment advisory services fee paid to the Investment Manager was $104,676, and the administrative services fee paid to the Investment Manager was $18,318.
Other Expenses
Other expenses are for, among other things, miscellaneous expenses of the Fund or the Board, including payments to Board Services Corp., a company providing limited administrative services to the Fund and the Board. That company's expenses include boardroom and office expense, employee compensation, employee health and retirement benefits, and certain other expenses. For the year ended April 30, 2016, other expenses paid by the Fund to this company were $1,159.
Compensation of Board Members
Board members, who are not officers or employees of the Investment Manager or Ameriprise Financial, are compensated for their services to the Fund as disclosed in the Statement of Operations. Under a Deferred Compensation Plan (the Plan), these Board members may elect to defer payment of up to 100% of their compensation. Deferred amounts are treated as though equivalent dollar amounts had been invested in shares of certain funds managed by the Investment Manager. The Fund's liability for these amounts is adjusted for market value changes and remains in the Fund until distributed in accordance with the Plan. All amounts payable under the Plan constitute a general unsecured obligation of the Fund.
Transfer Agency Fees
Under a Transfer and Dividend Disbursing Agent Agreement, Columbia Management Investment Services Corp. (the Transfer Agent), an affiliate of the Investment Manager and a wholly-owned subsidiary of Ameriprise Financial, is responsible for providing transfer
agency services to the Fund. The Transfer Agent has contracted with Boston Financial Data Services (BFDS) to serve as sub-transfer agent.
The Transfer Agent receives a monthly transfer agency fee based on the number or the average value of accounts, depending on the type of account. In addition, the Transfer Agent also receives sub-transfer agency fees based on a percentage of the average aggregate value of the Fund's shares maintained in omnibus accounts (other than omnibus accounts for which American Enterprise Investment Services Inc. is the broker of record or accounts where the beneficial shareholder is a customer of Ameriprise Financial Services, Inc., for which the Transfer Agent receives a per account fee). The Transfer Agent pays the fees of BFDS for services as sub-transfer agent and is not entitled to reimbursement for such fees from the Fund (with the exception of out-of-pocket fees).
The Transfer Agent also receives compensation from the Fund for various shareholder services and reimbursements for certain out-of-pocket fees.
For the year ended April 30, 2016, the Fund's effective transfer agency fee rates as a percentage of average daily net assets of each class were as follows:
Class A | | | 0.20 | % | |
Class B | | | 0.20 | | |
Class C | | | 0.20 | | |
Class R4 | | | 0.20 | | |
Class Z | | | 0.20 | | |
An annual minimum account balance fee of $20 may apply to certain accounts with a value below the applicable share class's initial minimum investment requirements to reduce the impact of small accounts on transfer agency fees. These minimum account balance fees are remitted to the Fund and recorded as part of expense reductions in the Statement of Operations. For the year ended April 30, 2016, no minimum account balance fees were charged by the Fund.
Distribution and Service Fees
The Fund has an agreement with Columbia Management Investment Distributors, Inc. (the Distributor), an affiliate of the Investment Manager and a wholly-owned subsidiary of Ameriprise Financial, for distribution and shareholder services. The Board has approved, and the Fund has adopted, distribution and shareholder service plans (the Plans) applicable to certain share classes, which set the distribution and service fees for the Fund.
Annual Report 2016
25
COLUMBIA AMT-FREE GEORGIA INTERMEDIATE MUNI BOND FUND
NOTES TO FINANCIAL STATEMENTS (continued)
April 30, 2016
These fees are calculated daily and are intended to compensate the Distributor and/or eligible selling and/or servicing agents for selling shares of the Fund and providing services to investors.
Under the Plans, the Fund pays a monthly combined distribution and service fee to the Distributor at the maximum annual rate of 0.25% of the average daily net assets attributable to Class A shares of the Fund. Also under the Plans, the Fund pays a monthly service fee at the maximum annual rate of 0.25% of the average daily net assets attributable to Class B and Class C shares of the Fund and a monthly distribution fee at the maximum annual rate of 0.75% of the average daily net assets attributable to Class B and Class C shares of the Fund.
Sales Charges
Sales charges, including front-end charges and CDSCs, received by the Distributor for distributing Fund shares were $2,290 for Class A and $1,091 for Class C shares for the year ended April 30, 2016.
Expenses Waived/Reimbursed by the Investment Manager and its Affiliates
The Investment Manager and certain of its affiliates have contractually agreed to waive fees and/or reimburse expenses (excluding certain fees and expenses described below) for the period disclosed below, unless sooner terminated at the sole discretion of the Board, so that the Fund's net operating expenses, after giving effect to fees waived/expenses reimbursed and any balance credits and/or overdraft charges from the Fund's custodian, do not exceed the following annual rates as a percentage of the class' average daily net assets:
| | | Fee Rates Contractual
Through
August 31, 2016 | |
Class A | | | 0.81 | % | |
Class B | | | 1.56 | | |
Class C | | | 1.56 | | |
Class R4 | | | 0.56 | | |
Class Z | | | 0.56 | | |
Under the agreement governing these fee waivers and/or expense reimbursement arrangements, the following fees and expenses are excluded from the waiver/reimbursement commitment, and therefore will be paid by the Fund, if applicable: taxes (including foreign transaction taxes), expenses associated with investments in affiliated and non-affiliated pooled investment vehicles (including mutual funds and exchange-traded funds), transaction costs and brokerage
commissions, costs related to any securities lending program, dividend and interest expenses associated with securities sold short, inverse floater program fees and expenses, transaction charges and interest on borrowed money, interest, extraordinary expenses and any other expenses the exclusion of which is specifically approved by the Board. This agreement may be modified or amended only with approval from the Investment Manager, certain of its affiliates and the Fund. Any fees waived and/or expenses reimbursed under the expense reimbursement arrangements described above are not recoverable by the Investment Manager or its affiliates in future periods.
Note 4. Federal Tax Information
The timing and character of income and capital gain distributions are determined in accordance with income tax regulations, which may differ from GAAP because of temporary or permanent book to tax differences.
At April 30, 2016, these differences are primarily due to differing treatment for Trustees' deferred compensation and distributions. To the extent these differences are permanent, reclassifications are made among the components of the Fund's net assets in the Statement of Assets and Liabilities. Temporary differences do not require reclassifications.
The Fund did not have any permanent differences; therefore, no reclassifications were made to the Statement of Assets and Liabilities.
The tax character of distributions paid during the years indicated was as follows:
Year Ended April 30, | | 2016 | | 2015 | |
Tax-exempt income | | $ | 2,212,121 | | | $ | 2,318,096 | | |
Long-term capital gains | | | 265,271 | | | | 152,538 | | |
Total | | $ | 2,477,392 | | | $ | 2,470,634 | | |
At April 30, 2016, the components of distributable earnings on a tax basis were as follows:
Undistributed tax-exempt income | | $ | 420,525 | | |
Undistributed long-term capital gains | | | 285,223 | | |
Net unrealized appreciation | | | 5,286,359 | | |
At April 30, 2016, the cost of investments for federal income tax purposes was $71,659,854 and the aggregate gross unrealized appreciation and depreciation based on that cost was:
Unrealized appreciation | | $ | 5,287,525 | | |
Unrealized depreciation | | | (1,166 | ) | |
Net unrealized appreciation | | $ | 5,286,359 | | |
Annual Report 2016
26
COLUMBIA AMT-FREE GEORGIA INTERMEDIATE MUNI BOND FUND
NOTES TO FINANCIAL STATEMENTS (continued)
April 30, 2016
Management of the Fund has concluded that there are no significant uncertain tax positions in the Fund that would require recognition in the financial statements. However, management's conclusion may be subject to review and adjustment at a later date based on factors including, but not limited to, new tax laws, regulations, and administrative interpretations (including relevant court decisions). Generally, the Fund's federal tax returns for the prior three fiscal years remain subject to examination by the Internal Revenue Service.
Note 5. Portfolio Information
The cost of purchases and proceeds from sales of securities, excluding short-term investments and derivatives, if any, aggregated to $9,639,074 and $10,543,983, respectively, for the year ended April 30, 2016. The amount of purchase and sale activity impacts the portfolio turnover rate reported in the Financial Highlights.
Note 6. Line of Credit
The Fund has access to a revolving credit facility whereby the Fund may borrow for the temporary funding of shareholder redemptions or for other temporary or emergency purposes. Effective December 8, 2015, Citibank, N.A. and HSBC Bank USA, N.A. joined JPMorgan Chase Bank, N.A. (JPMorgan) as lead of a syndicate of banks under the credit facility, which is a collective agreement between the Fund and certain other funds managed by the Investment Manager, severally and not jointly, that permits collective borrowings up to $1 billion. Interest is charged to each participating fund based on its borrowings at a rate equal to the higher of (i) the overnight federal funds rate plus 1.00% or (ii) the one-month LIBOR rate plus 1.00%. Each borrowing under the credit facility matures no later than 60 days after the date of borrowing. The Fund also pays a commitment fee equal to its pro rata share of the amount of the credit facility at a rate of 0.15% per annum. The commitment fee is included in other expenses in the Statement of Operations. Prior to December 8, 2015, JPMorgan was the sole lead bank under the credit facility agreement that permitted borrowings up to $550 million under the same terms and interest rates as described above with the exception of the commitment fee which was charged at a rate of 0.075% per annum.
The Fund had no borrowings during the year ended April 30, 2016.
Note 7. Significant Risks
Shareholder Concentration Risk
At April 30, 2016, one unaffiliated shareholder of record owned 67.1% of the outstanding shares of the Fund in one or more accounts. The Fund has no knowledge about whether any portion of those shares was owned beneficially. Subscription and redemption activity by concentrated accounts may have a significant effect on the operations of the Fund. In the case of a large redemption, the Fund may be forced to sell investments at inopportune times, including its liquid or more liquid positions, resulting in Fund losses and the Fund holding a higher percentage of less liquid or illiquid securities. Large redemptions could result in decreased economies of scale and increased operating expenses for non-redeeming Fund shareholders.
Credit Risk
Credit risk is the risk that the value of debt securities in the Fund's portfolio may decline because the issuer may default and fail to pay interest or repay principal when due. Rating agencies assign credit ratings to debt securities to indicate their credit risk. Lower rated or unrated debt securities held by the Fund may present increased credit risk as compared to higher-rated debt securities.
Interest Rate Risk
Interest rate risk is the risk of losses attributable to changes in interest rates. In general, if prevailing interest rates rise, the values of debt securities tend to fall, and if interest rates fall, the values of debt securities tend to rise. Actions by governments and central banking authorities can result in increases in interest rates. Increasing interest rates may negatively affect the value of debt securities held by the Fund, resulting in a negative impact on the Fund's performance and net asset value per share. In general, the longer the maturity or duration of a debt security, the greater its sensitivity to changes in interest rates.
Liquidity Risk
Liquidity risk is the risk associated with a lack of marketability of investments which may make it difficult to sell the investment at a desirable time or price. Changing regulatory, market or other conditions or environments (for example, the interest rate or credit environments) may adversely affect the liquidity of the Fund's investments. The Fund may have to accept a lower selling price for the holding, sell other investments,
Annual Report 2016
27
COLUMBIA AMT-FREE GEORGIA INTERMEDIATE MUNI BOND FUND
NOTES TO FINANCIAL STATEMENTS (continued)
April 30, 2016
or forego another, more appealing investment opportunity. Generally, the less liquid the market at the time the Fund sells a portfolio investment, the greater the risk of loss or decline of value to the Fund. A less liquid market can lead to an increase in Fund redemptions, which may negatively impact Fund performance and net asset value per share, including, for example, if the Fund is forced to sell securities in a down market.
Geographic Concentration Risk
Because the Fund invests substantially in municipal securities issued by the state identified in the Fund's name and political sub-divisions of that state, the Fund will be particularly affected by adverse tax, legislative, regulatory, demographic or political changes as well as changes impacting the state's financial, economic or other condition and prospects. In addition, because of the relatively small number of issuers of tax-exempt securities in the state, the Fund may invest a higher percentage of assets in a single issuer and, therefore, be more exposed to the risk of loss than a fund that invests more broadly. The value of municipal and other securities owned by the Fund also may be adversely affected by future changes in federal or state income tax laws.
Note 8. Subsequent Events
Management has evaluated the events and transactions that have occurred through the date the financial statements were issued and noted no items requiring adjustment of the financial statements or additional disclosure.
Note 9. Information Regarding Pending and Settled Legal Proceedings
In December 2005, without admitting or denying the allegations, American Express Financial Corporation (AEFC, which is now known as Ameriprise Financial, Inc. (Ameriprise Financial)) entered into settlement agreements with the Securities and Exchange Commission (SEC) and Minnesota Department of Commerce (MDOC) related to market timing activities. As a result, AEFC was censured and ordered to cease and desist from committing or causing any violations of certain provisions of the Investment Advisers Act of 1940, the Investment Company Act of 1940, and various Minnesota laws. AEFC agreed to pay disgorgement of $10 million and civil money penalties of $7 million. AEFC also agreed to retain an independent distribution consultant to assist in developing a plan for distribution of all disgorgement and civil penalties ordered by the
SEC in accordance with various undertakings detailed at http://www.sec.gov/litigation/admin/ia-2451.pdf. Ameriprise Financial and its affiliates have cooperated with the SEC and the MDOC in these legal proceedings, and have made regular reports to the Funds' Boards of Trustees.
Ameriprise Financial and certain of its affiliates have historically been involved in a number of legal, arbitration and regulatory proceedings, including routine litigation, class actions, and governmental actions, concerning matters arising in connection with the conduct of their business activities. Ameriprise Financial believes that the Funds are not currently the subject of, and that neither Ameriprise Financial nor any of its affiliates are the subject of, any pending legal, arbitration or regulatory proceedings that are likely to have a material adverse effect on the Funds or the ability of Ameriprise Financial or its affiliates to perform under their contracts with the Funds. Ameriprise Financial is required to make quarterly (10-Q), annual (10-K) and, as necessary, 8-K filings with the SEC on legal and regulatory matters that relate to Ameriprise Financial and its affiliates. Copies of these filings may be obtained by accessing the SEC website at www.sec.gov.
There can be no assurance that these matters, or the adverse publicity associated with them, will not result in increased fund redemptions, reduced sale of fund shares or other adverse consequences to the Funds. Further, although we believe proceedings are not likely to have a material adverse effect on the Funds or the ability of Ameriprise Financial or its affiliates to perform under their contracts with the Funds, these proceedings are subject to uncertainties and, as such, we are unable to estimate the possible loss or range of loss that may result. An adverse outcome in one or more of these proceedings could result in adverse judgments, settlements, fines, penalties or other relief that could have a material adverse effect on the consolidated financial condition or results of operations of Ameriprise Financial.
Annual Report 2016
28
COLUMBIA AMT-FREE GEORGIA INTERMEDIATE MUNI BOND FUND
REPORT OF INDEPENDENT REGISTERED PUBLIC ACCOUNTING FIRM
To the Trustees of Columbia Funds Series Trust and the Shareholders of
Columbia AMT-Free Georgia Intermediate Muni Bond Fund
In our opinion, the accompanying statement of assets and liabilities, including the portfolio of investments, and the related statements of operations and of changes in net assets and the financial highlights present fairly, in all material respects, the financial position of Columbia AMT-Free Georgia Intermediate Muni Bond Fund (the "Fund", a series of Columbia Funds Series Trust) at April 30, 2016, and the results of its operations, the changes in its net assets and the financial highlights for each of the periods indicated, in conformity with accounting principles generally accepted in the United States of America. These financial statements and financial highlights (hereafter referred to as "financial statements") are the responsibility of the Fund's management. Our responsibility is to express an opinion on these financial statements based on our audits. We conducted our audits of these financial statements in accordance with the standards of the Public Company Accounting Oversight Board (United States). Those standards require that we plan and perform the audit to obtain reasonable assurance about whether the financial statements are free of material misstatement. An audit includes examining, on a test basis, evidence supporting the amounts and disclosures in the financial statements, assessing the accounting principles used and significant estimates made by management, and evaluating the overall financial statement presentation. We believe that our audits, which included confirmation of securities at April 30, 2016 by correspondence with the custodian, provide a reasonable basis for our opinion.
PricewaterhouseCoopers LLP
Minneapolis, MN
June 21, 2016
Annual Report 2016
29
COLUMBIA AMT-FREE GEORGIA INTERMEDIATE MUNI BOND FUND
FEDERAL INCOME TAX INFORMATION
(Unaudited)
The Fund hereby designates the following tax attributes for the fiscal year ended April 30, 2016. Shareholders will be notified in early 2017 of the amounts for use in preparing 2016 income tax returns.
Tax Designations
Capital Gain Dividend | | $ | 369,166 | | |
Exempt-Interest Dividends | | | 100.00 | % | |
Capital Gain Dividend. The Fund designates as a capital gain dividend the amount reflected above, or if subsequently determined to be different, the net capital gain of such fiscal period.
Exempt-Interest Dividends. The percentage of net investment income distributed during the fiscal year that qualifies as exempt-interest dividends for federal income tax purposes.
Annual Report 2016
30
COLUMBIA AMT-FREE GEORGIA INTERMEDIATE MUNI BOND FUND
Shareholders elect the Board that oversees the Fund's operations. The Board appoints officers who are responsible for day-to-day business decisions based on policies set by the Board. The following table provides basic biographical information about the Fund's Trustees, including their principal occupations during the past five years, although specific titles for individuals may have varied over the period. Under current Board policy, members generally may serve through the end of the calendar year in which they reach either the mandatory retirement age established by the Board or the fifteenth anniversary of the first Board meeting they attended as a member of the Board.
Trustees
Independent Trustees
Name,
Address,
Year of Birth | | Position Held With
the Funds and Length of
Service | | Principal Occupation(s)
During the Past Five Years
and Other Relevant
Professional Experience | | Number of
Funds in the
Columbia Funds
Complex
Overseen | | Other Directorships
Held by Trustee During
the Past Five Years | |
Kathleen Blatz
901 S. Marquette Ave.
Minneapolis, MN 55402
1954 | | Trustee since 1/06 for RiverSource Funds and since 6/11 for Nations Funds | | Attorney; specializing in arbitration and mediation; Chief Justice, Minnesota Supreme Court, 1998-2006; Associate Justice, Minnesota Supreme Court, 1996-1998; Fourth Judicial District Court Judge, Hennepin County, 1994-1996; Attorney in private practice and public service, 1984-1993; State Representative, Minnesota House of Representatives, 1979-1993, which included service on the Tax and Financial Institutions and Insurance Committees | | | 120 | | | Trustee, BlueCross BlueShield of Minnesota (Chair of the Business Development Committee) since 2009; Chair of the Robina Foundation since August 2013 | |
Edward J. Boudreau, Jr.
901 S. Marquette Ave. Minneapolis, MN 55402
1944 | | Trustee since 6/11 for RiverSource Funds and
since 1/05 for Nations Funds | | Managing Director,
E.J. Boudreau & Associates (consulting) since 2000; FINRA Industry Arbitrator, 2002-present; Chairman and Chief Executive Officer, John Hancock Funds (asset management), Chairman and Interested Trustee for open-end and closed-end funds offered by John Hancock, 1989-2000; John Hancock Life Insurance Company, including SVP and Treasurer and SVP Information Technology, 1968-1988 | | | 118 | | | Former Trustee, Boston Museum of Science (Chair of Finance Committee), 1985-2013; former Trustee, BofA Funds Series Trust (11 funds), 2005-2011 | |
Pamela G. Carlton
901 S. Marquette Ave.
Minneapolis, MN 55402
1954 | | Trustee since 7/07 for RiverSource Funds and
since 6/11 for Nations Funds | | President, Springboard — Partners in Cross Cultural Leadership (consulting company) since 2003; Managing Director of US Equity Research,
JP Morgan Chase, 1999-2003; Director of US Equity Research, Chase Asset Management, 1996-1999; Co-Director Latin America Research, 1993-1996, COO Global Research, 1992-1996, Co-Director of US Research, 1991-1992, Investment Banker, Morgan Stanley, 1982-1991 | | | 120 | | | Trustee, New York Presbyterian Hospital Board (Executive Committee and Chair of Human Resources Committee) since 1996 | |
Annual Report 2016
31
COLUMBIA AMT-FREE GEORGIA INTERMEDIATE MUNI BOND FUND
TRUSTEES AND OFFICERS (continued)
Independent Trustees (continued)
Name,
Address,
Year of Birth | | Position Held With
the Funds and Length of
Service | | Principal Occupation(s)
During the Past Five Years
and Other Relevant
Professional Experience | | Number of
Funds in the
Columbia Funds
Complex
Overseen | | Other Directorships
Held by Trustee During
the Past Five Years | |
William P. Carmichael
901 S. Marquette Ave. Minneapolis, MN 55402
1943 | | Trustee since 6/11 for RiverSource Funds and since 2003 for Nations Funds; Chair of the Board from 1/14-11/15 | | Retired; Co-founder, The Succession Fund (provides exit strategies to owners of privately held companies), 1998-2007; Adjunct Professor of Finance, Kelley School of Business, Indiana University, 1993-2007; Senior Vice President, Sara Lee Corporation, 1991-1993; Senior Vice President and Chief Financial Officer, Beatrice Foods Company, 1984-1990; Vice President, Esmark, Inc., 1973-1984; Associate, Price Waterhouse, 1968-1972 | | | 120 | | | Director, The Finish Line (athletic shoes and apparel) since July 2003; Director, International Textile Corp. since 2012; Director, hhgregg since May, 2015; former Director, Cobra Electronics Corporation (electronic equipment manufacturer), 1994-August 2014; former Director, Spectrum Brands, Inc. (consumer products), 2002-2009; former Director, Simmons Company (bedding), 2004-2010; former Trustee, BofA Funds Series Trust (11 funds), 2009-2011; former Director, McMoRan Exploration Company (oil and gas exploration and development), 2010-2013 | |
Patricia M. Flynn
901 S. Marquette Ave. Minneapolis, MN 55402
1950 | | Trustee since 11/04 for RiverSource Funds and
since 6/11 for Nations Funds | | Trustee Professor of Economics and Management, Bentley University since 1976 (also teaches and conducts research on corporate governance); Dean, McCallum Graduate School of Business, Bentley University, 1992-2002 | | | 120 | | | Trustee, MA Taxpayers Foundation since 1997; Board of Governors, Innovation Institute, MA Technology Collaborative since 2010 | |
William A. Hawkins
901 S. Marquette Ave.
Minneapolis, MN 55402
1942 | | Chair of the Board since 11/15; Trustee since 6/11 for RiverSource Funds and
since 1/05 for Nations Funds | | Managing Director, Overton Partners (financial consulting) since August 2010; President and Chief Executive Officer, California General Bank, N.A., January 2008-August 2010; Operation Hope, COO, 2004-2007; IndyMac Bancorp, President, CBG, 1999-2003; American General Bank, President, 1997-1999; Griffin Financial Services, CEO, 1981-1997; The Griffin Funds, CEO, 1992-1998 | | | 120 | | | Former Trustee, BofA Funds Series Trust (11 funds), 2009-2015 | |
R. Glenn Hilliard
901 S. Marquette Ave. Minneapolis, MN 55402
1943 | | Trustee since 6/11 for RiverSource Funds and
since 1/05 for Nations Funds | | Chairman and Chief Executive Officer, Hilliard Group LLC (investing and consulting) since April 2003; Non-Executive Director & Chairman, CNO Financial Group, Inc. (insurance), 2003-2011; Chair & CEO, ING Americas, 1996-2003 | | | 118 | | | Chairman, BofA Funds Series Trust (11 funds); former Director, CNO Financial Group, Inc. (insurance), 2003-2011 | |
Annual Report 2016
32
COLUMBIA AMT-FREE GEORGIA INTERMEDIATE MUNI BOND FUND
TRUSTEES AND OFFICERS (continued)
Independent Trustees (continued)
Name,
Address,
Year of Birth | | Position Held With
the Funds and Length of
Service | | Principal Occupation(s)
During the Past Five Years
and Other Relevant
Professional Experience | | Number of
Funds in the
Columbia Funds
Complex
Overseen | | Other Directorships
Held by Trustee During
the Past Five Years | |
Catherine James Paglia
901 S. Marquette Ave.
Minneapolis, MN 55402
1952 | | Trustee since 11/04 for RiverSource Funds and
since 6/11 for Nations Funds | | Director, Enterprise Asset Management, Inc. (private real estate and asset management company) since September 1998; Managing Director and Partner, Interlaken Capital, Inc., 1989-1997; Managing Director, Morgan Stanley, 1982-1989; Vice President, Investment Banking, 1980-1982, Associate, Investment Banking, 1976-1980, Dean Witter Reynolds, Inc. | | | 120 | | | Director, Valmont Industries, Inc. (irrigation systems manufacturer) since 2012; Trustee, Carleton College (on the Investment Committee); Trustee, Carnegie Endowment for International Peace (on the Investment Committee) | |
Leroy C. Richie
901 S. Marquette Ave.
Minneapolis, MN 55402
1941 | | Trustee since 2000 for Seligman Funds, since 11/08 for RiverSource Funds and since 6/11 for Nations Funds | | Counsel, Lewis & Munday, P.C. (law firm) since 2004; Vice President and General Counsel, Automotive Legal Affairs, Chrysler Corporation, 1993-1997 | | | 118 | | | Lead Outside Director, Infinity Resources, Inc. (oil and gas exploration and production) since 1994; Lead Outside Director, Digital Ally, Inc. (digital imaging) since September 2005; Trustee, Marygrove College (Chair of Finance Committee) since 2007; former Director, OGE Energy Corp. (energy and energy services), 2007-2014 | |
Minor M. Shaw
901 S. Marquette Ave.
Minneapolis, MN 55402
1947 | | Trustee since 6/11 for RiverSource Funds and
since 2003 for Nations Funds | | President, Micco LLC (private investments) since 2011; President, Micco Corp. (family investment business), 1998-2011 | | | 120 | | | Director, Piedmont Natural Gas; Director, BlueCross BlueShield of South Carolina since April 2008; Chair of the Duke Endowment; Director, National Association of Corporate Directors, Carolinas Chapter since 2013; Chair of Greenville — Spartanburg Airport Commission; former Trustee, BofA Funds Series Trust (11 funds), 2003-2011 | |
Alison Taunton-Rigby
901 S. Marquette Ave.
Minneapolis, MN 55402
1944 | | Trustee since 11/02 for RiverSource Funds and
since 6/11 for Nations Funds | | Managing Director, Forester Biotech (consulting), 2001-2003; Chief Executive Officer and Director, RiboNovix, Inc., (biotechnology), 2003-2010; President and Chief Executive Officer of CMT Inc., 2001-2003; Aquila Biopharmaceuticals Inc., 1996-2000; Cambridge Biotech Corporation, 1995-1996; Mitotix Inc., 1993-1994 | | | 120 | | | Director, Abt Associates
(government contractor) since 2001; Director, Boston Children's Hospital since 2002; Director, Healthways, Inc. (health and well-being solutions) since 2005; Director, ICI Mutual Insurance Company, since 2011 | |
Annual Report 2016
33
COLUMBIA AMT-FREE GEORGIA INTERMEDIATE MUNI BOND FUND
TRUSTEES AND OFFICERS (continued)
Interested Trustee Not Affiliated with Investment Manager*
Name,
Address,
Year of Birth | | Position Held With
Funds and Length of
Service | | Principal Occupation(s)
During Past Five Years
and Other Relevant
Professional Experience | | Number of
Funds in the
Fund Family
Overseen by
Board Member | | Other Present or Past
Directorships/
Trusteeships
(Within Past 5 Years) | |
Anthony M. Santomero
901 S. Marquette Ave.
Minneapolis, MN 55402
1946 | | Trustee since 6/11 for RiverSource Funds and
since 1/08 for Nations Funds | | Richard K. Mellon Professor Emeritus of Finance, The Wharton School, University of Pennsylvania since 2002; Senior Advisor, McKinsey & Company (consulting), 2006-2008; President, Federal Reserve Bank of Philadelphia, 2000-2006; Professor of Finance, The Wharton School, University of Pennsylvania, 1972-2002 | | | 118 | | | Trustee, Penn Mutual Life Insurance Company since March 2008; Director, Renaissance Reinsurance Ltd. since May 2008; Director, Citigroup Inc. since 2009; Director, Citibank, N.A. since 2009; former Trustee, BofA Funds Series Trust (11 funds), 2008-2011 | |
* Dr. Santomero is not an affiliated person of the Investment Manager or Ameriprise Financial. However, he is currently deemed by the Funds to be an "interested person" (as defined in the 1940 Act) of the Funds because he serves as a Director of Citigroup Inc. and Citibank, N.A., companies that may directly or through subsidiaries and affiliates engage from time-to-time in brokerage execution, principal transactions and lending relationships with the Funds or accounts advised/managed by the Investment Manager.
Annual Report 2016
34
COLUMBIA AMT-FREE GEORGIA INTERMEDIATE MUNI BOND FUND
TRUSTEES AND OFFICERS (continued)
Interested Trustee Affiliated with Investment Manager*
Name,
Address,
Year of Birth | | Position Held With
the Funds and Length of
Service | | Principal Occupation(s)
During Past Five Years
and Other Relevant
Professional Experience | | Number of
Funds in the
Columbia Funds
Complex
Overseen | | Other Directorships
Held by Trustee During
the Past Five Years | |
William F. Truscott
c/o Columbia Management Investment Advisers, LLC, 225 Franklin St.
Boston, MA 02110
1960 | | Trustee since 11/01 for RiverSource Funds and
since 6/11 for Nations Funds; Senior Vice President since 2002 for RiverSource Funds and since 5/10 for Nations Funds | | Chairman of the Board and President, Columbia Management Investment Advisers, LLC since May 2010 and February 2012, respectively (previously President and Chief Investment Officer, 2001-April 2010); Chief Executive Officer, Global Asset Management, Ameriprise Financial, Inc. since September 2012 (previously Chief Executive Officer, U.S. Asset Management & President, Annuities, May 2010-September 2012 and President — U.S. Asset Management and Chief Investment Officer, 2005-April 2010); Director and Chief Executive Officer, Columbia Management Investment Distributors, Inc. since May 2010 and February 2012, respectively (previously Chairman of the Board and Chief Executive Officer, 2006-April 2010); Chairman of the Board and Chief Executive Officer, RiverSource Distributors, Inc. since 2006; Director, Threadneedle Asset Management Holdings, SARL since 2014; President and Chief Executive Officer, Ameriprise Certificate Company, 2006-August 2012. | | | 178 | | | Chairman of the Board, Columbia Management Investment Advisers, LLC since May 2010; Director, Columbia Management Investment Distributors, Inc. since May 2010; Former Director, Ameriprise Certificate Company, 2006-January 2013 | |
* Interested person (as defined under the 1940 Act) by reason of being an officer, director, security holder and/or employee of the Investment Manager or Ameriprise Financial.
The Statement of Additional Information has additional information about the Fund's Board members and is available, without charge, upon request by calling 800.345.6611; contacting your financial intermediary; or visiting columbiathreadneedle.com/us.
Annual Report 2016
35
COLUMBIA AMT-FREE GEORGIA INTERMEDIATE MUNI BOND FUND
TRUSTEES AND OFFICERS (continued)
The Board has appointed officers who are responsible for day-to-day business decisions based on policies it has established. The officers serve at the pleasure of the Board. The following table provides basic information about the Officers of the Fund, including principal occupations during the past five years, although their specific titles may have varied over the period. In addition to Mr. Truscott, who is Senior Vice President, the Fund's other officers are:
Fund Officers
Name,
Address and
Year of Birth | | Position and Year
First Appointed to
Position for any Fund
in the Columbia
Funds Complex or a
Predecessor Thereof | |
Principal Occupation(s) During Past Five Years | |
Christopher O. Petersen
5228 Ameriprise Financial
Center
Minneapolis, MN 55474
Born 1970 | | President and Principal Executive Officer (2015) | | Vice President and Lead Chief Counsel, Ameriprise Financial, Inc. since January 2015 (previously, Vice President and Chief Counsel January 2010-December 2014; and Vice President and Group Counsel or Counsel 2004-January 2010); officer of Columbia Funds and affiliated funds since 2007. | |
Michael G. Clarke
225 Franklin Street
Boston, MA 02110
Born 1969 | | Treasurer (2011), Chief Financial Officer (2009) and Chief Accounting Officer (2015) | | Vice President — Mutual Fund Administration, Columbia Management Investment Advisers, LLC, since May 2010; Managing Director of Fund Administration, Columbia Management Advisors, LLC, September 2004-April 2010; senior officer of Columbia Funds and affiliated funds since 2002. | |
Paul B. Goucher
100 Park Avenue
New York, NY 10017
Born 1968 | | Senior Vice President (2011), Chief Legal Officer (2015) and Assistant Secretary (2008) | | Vice President and Lead Chief Counsel, Ameriprise Financial, Inc. since November 2008 and January 2013, respectively (previously Chief Counsel, January 2010-January 2013 and Group Counsel, November 2008-January 2010). | |
Thomas P. McGuire
225 Franklin Street
Boston, MA 02110
Born 1972 | | Senior Vice President and Chief Compliance Officer (2012) | | Vice President — Asset Management Compliance, Ameriprise Financial, Inc., since May 2010; Chief Compliance Officer, Ameriprise Certificate Company since September 2010; Compliance Executive, Bank of America, 2005-April 2010. | |
Colin Moore
225 Franklin Street
Boston, MA 02110
Born 1958 | | Senior Vice President (2010) | | Executive Vice President and Global Chief Investment Officer, Ameriprise Financial, Inc., since July 2013; Director and Global Chief Investment Officer, Columbia Management Investment Advisers, LLC since May 2010; Manager, Managing Director and Chief Investment Officer, Columbia Management Advisors, LLC, 2007-April 2010. | |
Michael E. DeFao
225 Franklin Street
Boston, MA 02110
Born 1968 | | Vice President (2011) and Assistant Secretary (2010) | | Vice President and Chief Counsel, Ameriprise Financial, Inc. since May 2010; Associate General Counsel, Bank of America, 2005-April 2010. | |
Amy Johnson
5228 Ameriprise Financial
Center
Minneapolis, MN 55474
Born 1965 | | Vice President (2006) | | Managing Director and Chief Operating Officer, Columbia Management Investment Advisers, LLC since May 2010 (previously Chief Administrative Officer, 2009-April 2010, and Vice President — Asset Management and Trust Company Services, 2006-2009). | |
Lyn Kephart-Strong
5228 Ameriprise Financial Center
Minneapolis, MN 55474
Born 1960 | | Vice President (2015) | | President, Columbia Management Investment Services Corp. since October 2014; Vice President & Resolution Officer, Ameriprise Trust Company since August 2009; President, RiverSource Service Corporation 2004-2010. | |
Ryan C. Larrenaga
225 Franklin Street
Boston, MA 02110
Born 1970 | | Vice President and Secretary (2015) | | Vice President and Group Counsel, Ameriprise Financial, Inc. since August 2011 (previously, Counsel from May 2010 to August 2011); Assistant General Counsel, Bank of America, 2005-April 2010; officer of Columbia Funds and affiliated funds since 2005. | |
Annual Report 2016
36
COLUMBIA AMT-FREE GEORGIA INTERMEDIATE MUNI BOND FUND
IMPORTANT INFORMATION ABOUT THIS REPORT
Each fund mails one shareholder report to each shareholder address. If you would like more than one report, please call shareholder services at 800.345.6611 and additional reports will be sent to you.
The policy of the Board is to vote the proxies of the companies in which each fund holds investments consistent with the procedures as stated in the Statement of Additional Information (SAI). You may obtain a copy of the SAI without charge by calling 800.345.6611; contacting your financial intermediary; visiting columbiathreadneedle.com/us; or searching the website of the Securities and Exchange Commission (SEC) at sec.gov. Information regarding how each fund voted proxies relating to portfolio securities is filed with the SEC by August 31st for the most recent 12-month period ending June 30th of that year, and is available without charge by visiting columbiathreadneedle.com/us, or searching the website of the SEC at sec.gov.
Each fund files a complete schedule of portfolio holdings with the SEC for the first and third quarters of each fiscal year on Form N-Q. Each fund's Form N-Q is available on the SEC's website at sec.gov and may be reviewed and copied at the SEC's Public Reference Room in Washington, D.C. Information on the operation of the Public Reference Room may be obtained by calling 800.SEC.0330. Each fund's complete schedule of portfolio holdings, as filed on Form N-Q, can also be obtained without charge, upon request, by calling 800.345.6611.
Annual Report 2016
37
Columbia AMT-Free Georgia Intermediate Muni Bond Fund
P.O. Box 8081
Boston, MA 02266-8081

This information is for use with concurrent or prior delivery of a fund prospectus. Please read and consider the investment objectives, risks, charges and expenses for any fund carefully before investing. For a prospectus and summary prospectus, which contains this and other important information about the Fund, go to columbiathreadneedle.com/us. The Fund is distributed by Columbia Management Investment Distributors, Inc., member FINRA, and managed by Columbia Management Investment Advisers, LLC.
Columbia Threadneedle Investments (Columbia Threadneedle) is the global brand name of the Columbia and Threadneedle group of companies.
All rights reserved. Columbia Management Investment Distributors, Inc., 225 Franklin Street, Boston, MA 02110-2804
© 2016 Columbia Management Investment Advisers, LLC.
columbiathreadneedle.com/us
ANN152_04_F01_(06/16)

ANNUAL REPORT
April 30, 2016

COLUMBIA AMT-FREE MARYLAND INTERMEDIATE MUNI BOND FUND

ABOUT COLUMBIA THREADNEEDLE INVESTMENTS
Columbia Threadneedle Investments is a leading global asset management group that provides a broad range of actively managed investment strategies and solutions for individual, institutional and corporate clients around the world.
With more than 2,000 people, including over 450 investment professionals based in North America, Europe and Asia, we manage $464 billion* of assets across developed and emerging market equities, fixed income, asset allocation solutions and alternatives. We are the 13th largest manager of long-term mutual fund assets in the U.S.** and the 3rd largest manager of retail funds in the U.K.***
Our priority is the investment success of our clients. We aim to deliver the investment outcomes they expect through an investment approach that is team-based, performance-driven and risk-aware. Our culture is dynamic and interactive. By sharing our insights across asset classes and geographies, we generate richer perspectives on global, regional and local investment landscapes. The ability to exchange and debate investment ideas in a collaborative environment enriches our teams' investment processes. More importantly, it results in better informed investment decisions for our clients.
Columbia funds are distributed by Columbia Management Investment Distributors, Inc., member FINRA, and managed by Columbia Management Investment Advisers, LLC.
Columbia Threadneedle Investments (Columbia Threadneedle) is the global brand name of the Columbia and Threadneedle group of companies.
* In U.S. dollars as of March 31, 2016. Source: Ameriprise Q1 Earnings Release. Includes all assets managed by entities in the Columbia and Threadneedle group of companies. Contact us for more current data.
** Source: ICI as of March 31, 2016 for Columbia Management Investment Advisers, LLC.
*** Source: Investment Association as of December 2015 for Threadneedle Asset Management Limited.
© 2016 Columbia Management Investment Advisers, LLC. All rights reserved.
Not part of the shareholder report
Investment strategies to help meet investor needs
We are committed to helping investors navigate financial challenges to reach their desired outcomes. The possibilities are endless.
Your success is our priority.
Retire comfortably
Fund college or higher education
Leave a legacy
Generate an appropriate stream of income in retirement
Traditional approaches to income may no longer be adequate — and they may no longer provide the diversification benefits they once did. Investors need to rethink how they generate retirement income.
Worried about running out of income? You are not alone.
Navigate a changing interest rate environment
Even in today's challenging interest rate environment, it's still possible to navigate markets and achieve your goals.
Make investment choices designed specifically for this market environment.
Maximize after-tax returns
In an environment where what you keep is more important than what you earn, municipal bonds can help mitigate higher taxes while providing attractive yields compared to other investment options.
You've worked too hard building your wealth to lose it to taxes.
Grow assets to achieve financial goals
Finding growth opportunities in today's complex market environment requires strong research capabilities, creative thinking and a disciplined approach.
Do your investments deliver the portfolio growth you need?
Ease the impact of volatile markets
With increasing concerns about market volatility, investors should consider diversifying their portfolios with non-traditional holdings.
Interested in turning volatility into opportunity?
To find out more, contact your financial professional, call 800.426.3750 or visit columbiathreadneedle.com/us
Not part of the shareholder report
 Dear Shareholders,
Volatility comes with the territory for long-term investors. Some investors instinctively want to pull out of the market or sell underperforming investments at the first sign of increased volatility or perhaps even as soon as they perceive it on the horizon. But taking yourself out of the market could mean losing out on potential opportunities, and putting your longer-term investment goals at risk.
Cumulative return is not just about achieving high returns when markets are going up; it's also about remaining invested and minimizing losses during weak or volatile markets so that you can participate on the upside. Developing a deeper understanding of the various risks your portfolio is subject to can help you balance these risks.
Diversification is critical in seeking to achieve that balance. We believe that most portfolios could be more effectively diversified either by introducing holdings with performance profiles unrelated to existing holdings (like alternative products) or by rebalancing existing holdings with an eye toward risk allocation. Over time, distributing risk more evenly may produce a more pronounced diversification benefit and may improve portfolio efficiency. We believe market volatility can create significant opportunities and, in fact, these periods may be some of the very best times to invest.
With this in mind, I thought it important to highlight excerpts from a piece written by Colin Moore, Global Chief Investment Officer, in which he touches on some of these issues emphasizing the importance of a properly constructed portfolio in seeking to effectively manage volatility and to achieve consistency of returns. I encourage you to read the article in its entirety. To access the full article and for other insights on current market, please visit blog.columbiathreadneedleus.com/latest-perspectives.
You need investments that are designed to help you ease the impact of volatile market environments and keep the savings you have worked tirelessly to amass. Columbia Threadneedle Investments provides investment solutions to help you tackle financial challenges and achieve your desired outcome.
Best regards,

Christopher O. Petersen
President, Columbia Funds
Excerpts from:
Taking the scare out of the volatility bogeyman
By Colin Moore, Global Chief Investment Officer
Colin Moore is the global chief investment officer for Columbia Threadneedle Investments. His responsibilities include ensuring that a disciplined investment process is in place across all asset classes, including equity and fixed income. Mr. Moore joined one of the Columbia Threadneedle Investments legacy firms in 2002 as head of equity and was also head of fixed income and liquidity strategies from 2009 – 2010.

n In today's low growth, higher volatility world, the emphasis is shifting from maximization of returns to consistency of returns.
PRESIDENT'S MESSAGE (continued)
n Portfolios should represent the behavioral risk-return tradeoff of investors, remembering that they won't stay invested to realize the return if we get the risk tolerance wrong.
n Holding long-term savings in cash to avoid volatility (the financial equivalent of hiding under the sheets) is detrimental to achieving long-term goals.
According to Wikipedia, "The bogeyman is a common allusion to a mythical creature in many cultures used to control behavior. This monster has no specific appearance, and conceptions about it can vary drastically from household to household within the same community; in many cases he has no set appearance in the mind of an adult or child, but is simply a non-specific embodiment of terror." Different cultures have different names and physical representations for the bogeyman, and investors are no different. We have terrible monsters that we fear may destroy our portfolios, and we call one of the scariest of them volatility.
While the bogeyman is mythical (I hope!), volatility is real and can cause serious damage. To understand why investors have such a hard time coping with volatility, we first need to define three cognitive biases at work in today's investment environment:
1) Recency bias — something that has recently come to the forefront of our attention, regardless of how long established it is, suddenly seems to appear with improbable frequency.
2) Negativity bias — we tend to have a greater recall of unpleasant memories than positive memories.
3) Loss aversion — our dissatisfaction with losing money tends to be greater than our satisfaction with making money.
The level of volatility varies dramatically, and so does investor fear and panic selling — waxing when volatility rises, waning when it falls. Recent studies have pointed to demographics as an important driver of panic selling. The theory is that as people get closer to retirement, the prospects of a large (20% – 30%) loss in financial assets can have a much more pronounced effect on their sense of well-being. Wealth preservation instincts kick in much more quickly than for younger (and typically less wealthy) savers.
The reality is that there is little opportunity for return without volatility. Therefore, the bogeyman effect of holding long-term savings in cash to avoid volatility (the financial equivalent of hiding under the sheets) is detrimental to achieving long-term goals. This effect tends to be more pronounced during the episodic spikes in volatility. The significant spike in volatility in 2008 and 2009 led to significant withdrawals from long-term investment funds over the same period. Less pronounced effects can also be seen when comparing 2001 – 2003 and 2011 – 2012. Conversely, flows picked up when volatility returned to "normal" levels. Investor behavior of this type is consistent with the three behavioral biases.
I believe average volatility will be higher over the next 10 years than the last 10 years and episodic spikes will increase in frequency because sustainable economic growth will be structurally lower and geopolitical risk higher than any time since World War II. Low growth creates uncertainty while loss aversion will make investors fear that we are one economic mishap or geopolitical event away from no growth or recession. The result will be higher volatility on average. Negativity bias will tend to exacerbate "spike" reactions to event-driven geopolitical news, and the volatility bogeyman will appear more often. Assuming the behavioral biases continue, investor returns are likely to be very disappointing regardless of the total return generated by financial markets due to the bogeyman effect.
To mitigate this effect, we need to focus on portfolio construction and an improved understanding of diversification. I accept that equities are likely to offer the highest return over the next 10 years, but they also offer the highest volatility. Many portfolio construction optimization tools use historical average volatility, which is likely to underestimate the volatility investors will face. The bogeyman emerges when individual asset class volatility spikes and cross correlations rise, the combination of which increases overall portfolio volatility far beyond expectation. Diversification is meant to protect investors against volatility, but what's the point of owning lots of investments if the volatility bogeyman has not been properly estimated?
Most importantly, portfolios should be constructed to properly represent the behavioral risk-return tradeoff of investors, remembering that they won't stay invested to realize the return if we get the risk tolerance wrong. In a low growth, higher volatility world, the emphasis is shifting to return consistency rather than return maximization,
PRESIDENT'S MESSAGE (continued)
and investors are best served through investment approaches that appreciate that distinction. Even though it's a permanent feature of financial markets, volatility is less likely to be the bogeyman we all fear if portfolios are constructed with this understanding.
Please visit blog.columbiathreadneedleus.com/latest-perspectives to read the entire article.
Investors should consider the investment objectives, risks, charges and expenses of a mutual fund carefully before investing. For a free prospectus and summary prospectus, which contains this and other important information about a fund, visit columbiathreadneedle.com/us. The prospectus should be read carefully before investing.
The views expressed are as of April 2016, may change as market or other conditions change, and may differ from views expressed by other Columbia Management Investment Advisers, LLC (CMIA) associates or affiliates. Actual investments or investment decisions made by CMIA and its affiliates, whether for its own account or on behalf of clients, will not necessarily reflect the views expressed. This information is not intended to provide investment advice and does not account for individual investor circumstances. Investment decisions should always be made based on an investor's specific financial needs, objectives, goals, time horizon and risk tolerance. Asset classes described may not be suitable for all investors.
Past performance does not guarantee future results, and no forecast should be considered a guarantee either. Since economic and market conditions change frequently, there can be no assurance that the trends described here will continue or that the forecasts are accurate.
Diversification does not guarantee a profit or protect against loss.
Columbia Funds are distributed by Columbia Management Investment Distributors, Inc., member FINRA, and managed by Columbia Management Investment Advisers, LLC.
© 2016 Columbia Management Investment Advisers, LLC. All rights reserved
COLUMBIA AMT-FREE MARYLAND INTERMEDIATE MUNI BOND FUND
Performance Overview | | | 2 | | |
Manager Discussion of Fund Performance | | | 4 | | |
Understanding Your Fund's Expenses | | | 6 | | |
Portfolio of Investments | | | 7 | | |
Statement of Assets and Liabilities | | | 12 | | |
Statement of Operations | | | 14 | | |
Statement of Changes in Net Assets | | | 15 | | |
Financial Highlights | | | 17 | | |
Notes to Financial Statements | | | 22 | | |
Report of Independent Registered Public Accounting Firm | | | 29 | | |
Federal Income Tax Information | | | 30 | | |
Trustees and Officers | | | 31 | | |
Important Information About This Report | | | 37 | | |
Fund Investment Manager
Columbia Management Investment
Advisers, LLC
225 Franklin Street
Boston, MA 02110
Fund Distributor
Columbia Management Investment
Distributors, Inc.
225 Franklin Street
Boston, MA 02110
Fund Transfer Agent
Columbia Management Investment
Services Corp.
P.O. Box 8081
Boston, MA 02266-8081
For more information about any of the funds, please visit columbiathreadneedle.com/us or call 800.345.6611. Customer Service Representatives are available to answer your questions Monday through Friday from 8 a.m. to 7 p.m. Eastern time.
The views expressed in this report reflect the current views of the respective parties. These views are not guarantees of future performance and involve certain risks, uncertainties and assumptions that are difficult to predict, so actual outcomes and results may differ significantly from the views expressed. These views are subject to change at any time based upon economic, market or other conditions and the respective parties disclaim any responsibility to update such views. These views may not be relied on as investment advice and, because investment decisions for a Columbia fund are based on numerous factors, may not be relied on as an indication of trading intent on behalf of any particular Columbia fund. References to specific securities should not be construed as a recommendation or investment advice.
COLUMBIA AMT-FREE MARYLAND INTERMEDIATE MUNI BOND FUND
Performance Summary
n Columbia AMT-Free Maryland Intermediate Muni Bond Fund (the Fund) Class A shares returned 3.60% excluding sales charges for the 12-month period that ended April 30, 2016. Class Z shares of the Fund returned 3.86% for the same time period.
n The Fund underperformed its benchmark, the Barclays 3-15 Year Blend Municipal Bond Index, which returned 4.86% for the 12-month period.
n The Fund's higher quality bias, which reflects the composition of Maryland's municipal bond market, contributed to its underperformance versus the benchmark, which measures the national municipal bond market.
Average Annual Total Returns (%) (for period ended April 30, 2016)
| | | Inception | | 1 Year | | 5 Years | | 10 Years | |
Class A | | 09/01/90 | | | | | | | | | | | | | |
Excluding sales charges | | | | | | | 3.60 | | | | 3.56 | | | | 3.60 | | |
Including sales charges | | | | | | | 0.54 | | | | 2.93 | | | | 3.28 | | |
Class B | | 06/08/93 | | | | | | | | | | | | | |
Excluding sales charges | | | | | | | 2.83 | | | | 2.79 | | | | 2.84 | | |
Including sales charges | | | | | | | -0.17 | | | | 2.79 | | | | 2.84 | | |
Class C | | 06/17/92 | | | | | | | | | | | | | |
Excluding sales charges | | | | | | | 2.83 | | | | 2.79 | | | | 2.83 | | |
Including sales charges | | | | | | | 1.83 | | | | 2.79 | | | | 2.83 | | |
Class R4* | | 03/19/13 | | | 3.86 | | | | 3.72 | | | | 3.68 | | |
Class Z | | 09/01/90 | | | 3.86 | | | | 3.80 | | | | 3.86 | | |
Barclays 3-15 Year Blend Municipal Bond Index | | | | | | | 4.86 | | | | 4.61 | | | | 4.89 | | |
Returns for Class A are shown with and without the maximum initial sales charge of 3.00%. Returns for Class B are shown with and without the applicable contingent deferred sales charge (CDSC) of 3.00% in the first year, declining to 1.00% in the fourth year and eliminated thereafter. Returns for Class C are shown with and without the 1.00% CDSC for the first year only. The Fund's other classes are not subject to sales charges and have limited eligibility. Please see the Fund's prospectus for details. Performance for different share classes will vary based on differences in sales charges and fees associated with each class. All results shown assume reinvestment of distributions during the period. Returns do not reflect the deduction of taxes that a shareholder may pay on Fund distributions or on the redemption of Fund shares. Performance results reflect the effect of any fee waivers or reimbursements of Fund expenses by Columbia Management Investment Advisers, LLC and/or any of its affiliates. Absent these fee waivers or expense reimbursement arrangements, performance results would have been lower.
The performance information shown represents past performance and is not a guarantee of future results. The investment return and principal value of your investment will fluctuate so that your shares, when redeemed, may be worth more or less than their original cost. Current performance may be lower or higher than the performance information shown. You may obtain performance information current to the most recent month-end by contacting your financial intermediary, visiting columbiathreadneedle.com/us or calling 800.345.6611.
*The returns shown for periods prior to the share class inception date (including returns for the Life of the Fund, if shown, which are since Fund inception) include the returns of the Fund's oldest share class. Since the Fund launched more than one share class at its inception, Class A shares were used. These returns are adjusted to reflect any higher class-related operating expenses of the newer share classes, as applicable. Please visit columbiathreadneedle.com/us/investment-products/mutual-funds/appended-performance for more information.
The Barclays 3-15 Year Blend Municipal Bond Index is an unmanaged index that tracks the performance of municipal bonds issued after December 31, 1990, with remaining maturities between 2 and 17 years and at least $7 million in principal amount outstanding.
Indices are not available for investment, are not professionally managed and do not reflect sales charges, fees, brokerage commissions, taxes or other expenses of investing. Securities in the Fund may not match those in an index.
Annual Report 2016
2
COLUMBIA AMT-FREE MARYLAND INTERMEDIATE MUNI BOND FUND
PERFORMANCE OVERVIEW (continued)
Performance of a Hypothetical $10,000 Investment (May 1, 2006 – April 30, 2016)
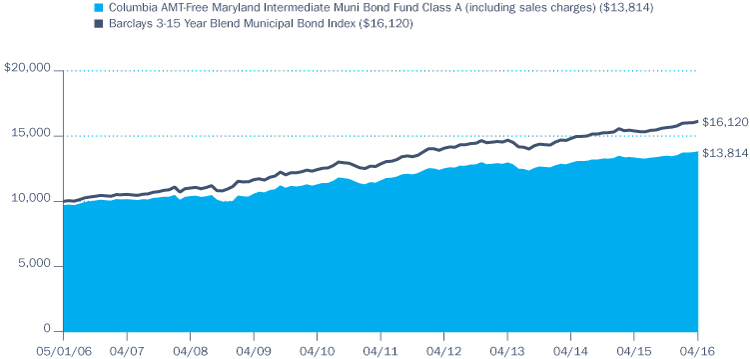
The chart above shows the change in value of a hypothetical $10,000 investment in Class A shares of Columbia AMT-Free Maryland Intermediate Muni Bond Fund during the stated time period, and does not reflect the deduction of taxes that a shareholder may pay on Fund distributions or on the redemption of Fund shares.
Annual Report 2016
3
COLUMBIA AMT-FREE MARYLAND INTERMEDIATE MUNI BOND FUND
MANAGER DISCUSSION OF FUND PERFORMANCE
Portfolio Management
Brian McGreevy
Quality Breakdown (%)
(at April 30, 2016) | |
AAA rating | | | 14.1 | | |
AA rating | | | 40.0 | | |
A rating | | | 31.3 | | |
BBB rating | | | 11.9 | | |
BB rating | | | 0.9 | | |
Not rated | | | 1.8 | | |
Total | | | 100.0 | | |
Percentages indicated are based upon total fixed income investments (excluding Money Market Funds).
Bond ratings apply to the underlying holdings of the Fund and not the Fund itself and are divided into categories ranging from highest to lowest credit quality, determined by using the middle rating of Moody's, S&P and Fitch, after dropping the highest and lowest available ratings. When ratings are available from only two rating agencies, the lower rating is used. When a rating is available from only one rating agency, that rating is used. When a bond is not rated by any rating agency, it is designated as "Not rated." Credit quality ratings assigned by a rating agency are subjective opinions, not statements of fact, and are subject to change, including daily. The ratings assigned by credit rating agencies are but one of the considerations that the Investment Manager and/or Fund's subadviser incorporates into its credit analysis process, along with such other issuer-specific factors as cash flows, capital structure and leverage ratios, ability to de-leverage (repay) through free cash flow, quality of management, market positioning and access to capital, as well as such security-specific factors as the terms of the security (e.g., interest rate and time to maturity) and the amount and type of any collateral.
For the 12-month period that ended April 30, 2016, the Fund's Class A shares returned 3.60% excluding sales charges. Class Z shares of the Fund returned 3.86%. The Fund underperformed its benchmark, the Barclays 3-15 Year Blend Municipal Bond Index, which returned 4.86% for the same time period. The Fund's higher quality bias, which reflects the composition of Maryland's municipal bond market, contributed to its underperformance versus the benchmark, which measures the national municipal bond market.
Market Overview
The U.S. municipal bond market produced a positive return and outperformed U.S. Treasuries during the reporting period, thanks in part to a highly favorable balance of supply and demand. Mutual fund cash flows provided a steady source of support for the market, with positive inflows for 30 consecutive weeks as of the close of the period. In the interval from October 2015 through April 2016 alone, inflows into municipal funds totaled over $27 billion. Insurance companies and banks were active buyers, as well. Supply was also strong, but almost half of the new issuance came from refunding deals — rather than new issuance — as issuers sought to take advantage of the cost savings from refinancing older, higher coupon debt. The refinancing activity added an additional layer of demand since many of the refundings were of currently callable bonds issued in 2005 or 2006. As a result, many investors who were taken out of older bonds reinvested the proceeds back into the market.
The strength of state and local finances throughout the United States, with the notable exceptions of New Jersey, Illinois, the City of Chicago, and Puerto Rico, further aided the performance of municipal bonds. Longer term securities generally provided superior returns versus shorter term issues, reflecting the latter category's low nominal yields. Lower quality bonds outpaced their higher quality counterparts, as investors' hearty appetite for risk fueled a continued reach for yield.
Maryland's Economy Improved, but its Municipal Market Lagged
Maryland remained in recovery mode during the reporting period, with positive economic growth overall. The state economy lagged the broader national growth rate, however, due to relative weakness in the jobs market, above-average taxes, and stagnant employment growth. With that said, the prospect of rising federal spending continued to provide a firm underpinning for the housing and consumer sectors.
Maryland's municipal bond market underperformed due to its higher average credit quality. Maryland's state debt is AAA rated, and many of the large municipalities are rated AA2 or higher. This led to weaker relative performance for Maryland's market at a time in which investors displayed a preference for lower quality issues.
Contributors and Detractors
The Fund's short duration (below-benchmark interest-rate sensitivity) and positions in short-term securities were the leading causes of its underperformance during the period. The Fund held a corresponding
Annual Report 2016
4
COLUMBIA AMT-FREE MARYLAND INTERMEDIATE MUNI BOND FUND
MANAGER DISCUSSION OF FUND PERFORMANCE (continued)
underweight to the longer end of the intermediate range in favor of maturities of six to 12 years, which also detracted. On the plus side, the Fund's allocation to bonds with longer maturities than the benchmark (17 years and above) added to results.
The Fund held an overweight in bonds rated AAA, reflecting the higher quality of Maryland's market. Since lower quality issues experienced meaningful outperformance, this aspect of our positioning was a notable detractor. On the plus side, the Fund benefited from its overweight positioning in the strong-performing BBB tier. The Fund's single-A rated bonds — which carried approximately the same weighting as they did in the benchmark — also outperformed slightly. Positions in pre-refunded and local general obligation securities, both of which are of higher quality and shorter duration than the benchmark, detracted.
On a sector basis, education bonds were the best performing segment in the Fund's portfolio. Housing and hospital bonds also outperformed the benchmark due to their longer maturities, significantly helping the Fund's overall results. The Fund had one position tied to the energy sector, which performed poorly due to the dramatic drop in oil prices.
Fund Positioning
We adopted a more cautious approach near the end of the period in response to the tightening of credit spreads, the improvement in municipal yields relative to U.S. Treasuries, and the flattening of the yield curve. Accordingly, we became more selective with respect to lower rated bonds in the investment-grade space. The yield curve was steep and attractive in spots near the end of the period, and we saw value in bonds with maturities between 10 and 15 years. We also identified value in lower coupon issues, such as those in the 4% range (as opposed to the 5% coupons that generally dominate the market). Since these securities continued to trade at premiums, we believe there is some protection from the adverse tax consequences associated with investments in discount bonds. In terms of sectors, we added to housing, hospital, and general-obligation issues with maturities of 10 to 18 years due to the value we saw in these areas.
Investment Risks
Fixed-income securities present issuer default risk. The Fund invests substantially in municipal securities and will be affected by tax, legislative, regulatory, demographic or political changes, as well as changes impacting a states financial, economic or other conditions. A relatively small number of tax-exempt issuers may necessitate the Fund investing more heavily in a single issuer and, therefore, be more exposed to the risk of loss than a fund that invests more broadly. The value of the Fund's portfolio may be more volatile than a more geographically diversified fund. Prepayment and extension risk exists as a loan, bond or other investment may be called, prepaid or redeemed before maturity and that similar yielding investments may not be available for purchase. A rise in interest rates may result in a price decline of fixed-income instruments held by the Fund, negatively impacting its performance and NAV. Falling rates may result in the Fund investing in lower yielding debt instruments, lowering the Fund's income and yield. These risks may be heightened for longer maturity and duration securities. Non-investment-grade (high-yield or junk) securities present greater price volatility and more risk to principal and income than higher rated securities. Market risk may affect a single issuer, sector of the economy, industry or the market as a whole. Federal and state tax rules apply to capital gain distributions and any gains or losses on sales. Income may be subject to state or local taxes. Liquidity risk is associated with the difficulty of selling underlying investments at a desirable time or price. See the Fund's prospectus for information on these and other risks.
Annual Report 2016
5
COLUMBIA AMT-FREE MARYLAND INTERMEDIATE MUNI BOND FUND
UNDERSTANDING YOUR FUND'S EXPENSES
(Unaudited)
As an investor, you incur two types of costs. There are transaction costs, which generally include sales charges on purchases and may include redemption fees. There are also ongoing costs, which generally include management fees, distribution and/or service fees, and other fund expenses. The following information is intended to help you understand your ongoing costs (in dollars) of investing in the Fund and to help you compare these costs with the ongoing costs of investing in other mutual funds.
Analyzing Your Fund's Expenses
To illustrate these ongoing costs, we have provided examples and calculated the expenses paid by investors in each share class of the Fund during the period. The actual and hypothetical information in the table is based on an initial investment of $1,000 at the beginning of the period indicated and held for the entire period. Expense information is calculated two ways and each method provides you with different information. The amount listed in the "Actual" column is calculated using the Fund's actual operating expenses and total return for the period. You may use the Actual information, together with the amount invested, to estimate the expenses that you paid over the period. Simply divide your account value by $1,000 (for example, an $8,600 account value divided by $1,000 = 8.6), then multiply the results by the expenses paid during the period under the "Actual" column. The amount listed in the "Hypothetical" column assumes a 5% annual rate of return before expenses (which is not the Fund's actual return) and then applies the Fund's actual expense ratio for the period to the hypothetical return. You should not use the hypothetical account values and expenses to estimate either your actual account balance at the end of the period or the expenses you paid during the period. See "Compare With Other Funds" below for details on how to use the hypothetical data.
Compare With Other Funds
Since all mutual funds are required to include the same hypothetical calculations about expenses in shareholder reports, you can use this information to compare the ongoing cost of investing in the Fund with other funds. To do so, compare the hypothetical example with the 5% hypothetical examples that appear in the shareholder reports of other funds. As you compare hypothetical examples of other funds, it is important to note that hypothetical examples are meant to highlight the ongoing costs of investing in a fund only and do not reflect any transaction costs, such as sales charges, or redemption or exchange fees. Therefore, the hypothetical calculations are useful in comparing ongoing costs only, and will not help you determine the relative total costs of owning different funds. If transaction costs were included in these calculations, your costs would be higher.
November 1, 2015 – April 30, 2016
| | | Account Value at the Beginning
of the Period ($) | | Account Value at the End of the
Period ($) | | Expenses Paid During the
Period ($) | | Fund's Annualized
Expense Ratio (%) | |
| | | Actual | | Hypothetical | | Actual | | Hypothetical | | Actual | | Hypothetical | | Actual | |
Class A | | | 1,000.00 | | | | 1,000.00 | | | | 1,025.40 | | | | 1,020.84 | | | | 4.08 | | | | 4.07 | | | | 0.81 | | |
Class B | | | 1,000.00 | | | | 1,000.00 | | | | 1,022.50 | | | | 1,017.11 | | | | 7.84 | | | | 7.82 | | | | 1.56 | | |
Class C | | | 1,000.00 | | | | 1,000.00 | | | | 1,021.60 | | | | 1,017.11 | | | | 7.84 | | | | 7.82 | | | | 1.56 | | |
Class R4 | | | 1,000.00 | | | | 1,000.00 | | | | 1,027.70 | | | | 1,022.08 | | | | 2.82 | | | | 2.82 | | | | 0.56 | | |
Class Z | | | 1,000.00 | | | | 1,000.00 | | | | 1,026.70 | | | | 1,022.08 | | | | 2.82 | | | | 2.82 | | | | 0.56 | | |
Expenses paid during the period are equal to the annualized expense ratio for each class as indicated above, multiplied by the average account value over the period and then multiplied by the number of days in the Fund's most recent fiscal half year and divided by 366.
Expenses do not include fees and expenses incurred indirectly by the Fund from its investment in underlying funds, including affiliated and non-affiliated pooled investment vehicles, such as mutual funds and exchange-traded funds.
Had Columbia Management Investment Advisers, LLC and/or certain of its affiliates not waived/reimbursed certain fees and expenses, account value at the end of the period would have been reduced.
Annual Report 2016
6
COLUMBIA AMT-FREE MARYLAND INTERMEDIATE MUNI BOND FUND
PORTFOLIO OF INVESTMENTS
April 30, 2016
(Percentages represent value of investments compared to net assets)
Municipal Bonds 94.7%
Issue
Description | | Coupon
Rate | | Principal
Amount ($) | | Value ($) | |
DISPOSAL 1.3% | |
Maryland Environmental Service
Revenue Bonds
Mid Shore II Regional Landfill
Series 2011
11/01/24 | | | 5.000 | % | | | 1,030,000 | | | | 1,200,506 | | |
HIGHER EDUCATION 4.6% | |
Maryland Health & Higher Educational Facilities Authority
Revenue Bonds
Maryland Institute College of Art
Series 2012
06/01/29 | | | 5.000 | % | | | 1,000,000 | | | | 1,133,330 | | |
Notre Dame of Maryland University
Series 2012
10/01/32 | | | 5.000 | % | | | 1,000,000 | | | | 1,129,100 | | |
Montgomery County Authority
Refunding Revenue Bonds
Series 2014
05/01/27 | | | 5.000 | % | | | 500,000 | | | | 605,525 | | |
Morgan State University
Refunding Revenue Bonds
Series 2012
07/01/30 | | | 5.000 | % | | | 150,000 | | | | 175,291 | | |
University System of Maryland
Refunding Revenue Bonds
Series 2015A
04/01/24 | | | 5.000 | % | | | 1,000,000 | | | | 1,262,850 | | |
Total | | | | | | | 4,306,096 | | |
HOSPITAL 16.5% | |
Maryland Health & Higher Educational Facilities Authority
Refunding Revenue Bonds
Anne Arundel Health System
Series 2014
07/01/29 | | | 5.000 | % | | | 750,000 | | | | 872,130 | | |
MedStar Health, Inc.
Series 2015
08/15/33 | | | 5.000 | % | | | 500,000 | | | | 583,505 | | |
Mercy Medical Center
Series 2016A
07/01/32 | | | 5.000 | % | | | 600,000 | | | | 714,366 | | |
Meritus Medical Center Issue
Series 2015
07/01/27 | | | 5.000 | % | | | 1,000,000 | | | | 1,179,060 | | |
Peninsula Regional Medical Center
Series 2015
07/01/32 | | | 5.000 | % | | | 1,000,000 | | | | 1,165,230 | | |
07/01/34 | | | 5.000 | % | | | 1,000,000 | | | | 1,157,300 | | |
University of Maryland Medical System
Series 2015
07/01/28 | | | 5.000 | % | | | 500,000 | | | | 603,015 | | |
Municipal Bonds (continued)
Issue
Description | | Coupon
Rate | | Principal
Amount ($) | | Value ($) | |
Western Maryland Health System
Series 2014
07/01/34 | | | 5.250 | % | | | 1,500,000 | | | | 1,741,755 | | |
Revenue Bonds
Carroll Hospital
Series 2012A
07/01/26 | | | 5.000 | % | | | 1,210,000 | | | | 1,390,205 | | |
07/01/27 | | | 5.000 | % | | | 1,000,000 | | | | 1,143,070 | | |
Johns Hopkins Health System
Series 2012
07/01/28 | | | 5.000 | % | | | 1,000,000 | | | | 1,176,530 | | |
Johns Hopkins Health System
Series 2013C
05/15/33 | | | 5.000 | % | | | 1,500,000 | | | | 1,766,250 | | |
MedStar Health
Series 2011
08/15/22 | | | 5.000 | % | | | 1,620,000 | | | | 1,912,977 | | |
Total | | | | | | | 15,405,393 | | |
INVESTOR OWNED 3.1% | |
Maryland Economic Development Corp.
Refunding Revenue Bonds
Potomac
Series 2009
09/01/22 | | | 6.200 | % | | | 2,500,000 | | | | 2,857,275 | | |
LOCAL APPROPRIATION 1.6% | |
Howard County Housing Commission
Revenue Bonds
Roger Carter Recreation Center Project
Series 2011
06/01/26 | | | 5.000 | % | | | 585,000 | | | | 676,950 | | |
Maryland State Transportation Authority
Refunding Revenue Bonds
Metrorail Parking Projects
Series 2014
07/01/23 | | | 4.000 | % | | | 750,000 | | | | 863,723 | | |
Total | | | | | | | 1,540,673 | | |
LOCAL GENERAL OBLIGATION 13.1% | |
City of Baltimore
Unlimited General Obligation Bonds
Consolidated Public Improvement
Series 2008A (AGM)
10/15/22 | | | 5.000 | % | | | 2,000,000 | | | | 2,207,840 | | |
County of Anne Arundel
Limited General Obligation Bonds
Consolidated General Improvement
Series 2015
04/01/27 | | | 5.000 | % | | | 1,500,000 | | | | 1,900,020 | | |
Series 2016
10/01/28 | | | 5.000 | % | | | 765,000 | | | | 964,550 | | |
The accompanying Notes to Financial Statements are an integral part of this statement.
Annual Report 2016
7
COLUMBIA AMT-FREE MARYLAND INTERMEDIATE MUNI BOND FUND
PORTFOLIO OF INVESTMENTS (continued)
April 30, 2016
Municipal Bonds (continued)
Issue
Description | | Coupon
Rate | | Principal
Amount ($) | | Value ($) | |
Limited General Obligation Refunding Bonds
Consolidated General Improvement
Series 2015
04/01/26 | | | 5.000 | % | | | 1,000,000 | | | | 1,277,370 | | |
County of Frederick
Unlimited General Obligation Refunding Bonds
Public Facilities
Series 2006
11/01/18 | | | 5.250 | % | | | 2,005,000 | | | | 2,229,400 | | |
11/01/21 | | | 5.250 | % | | | 2,500,000 | | | | 3,043,775 | | |
County of Prince George's
Limited General Obligation Refunding & Public
Improvement Bonds
Consolidated
Series 2011B
09/15/20 | | | 5.000 | % | | | 500,000 | | | | 587,310 | | |
Total | | | | | | | 12,210,265 | | |
MULTI-FAMILY 7.4% | |
Howard County Housing Commission
Revenue Bonds
General Capital Improvement Program
Series 2015
06/01/32 | | | 4.000 | % | | | 750,000 | | | | 798,810 | | |
Maryland Economic Development Corp.
Refunding Revenue Bonds
Morgan State University Project
Senior Series 2012
07/01/20 | | | 4.000 | % | | | 550,000 | | | | 590,156 | | |
University of Maryland Baltimore County Student Housing
Series 2016 (AGM)
07/01/30 | | | 5.000 | % | | | 725,000 | | | | 883,246 | | |
University of Maryland College Park Student Housing
Series 2016 (AGM)
06/01/30 | | | 5.000 | % | | | 875,000 | | | | 1,069,127 | | |
University of Maryland-Baltimore County Project
Series 2006 (XLCA)
07/01/20 | | | 5.000 | % | | | 600,000 | | | | 604,650 | | |
University of Maryland-College Park Projects
Series 2006 (AGCP)
06/01/19 | | | 5.000 | % | | | 1,000,000 | | | | 1,004,030 | | |
Revenue Bonds
Salisbury University Project
Series 2012
06/01/27 | | | 5.000 | % | | | 1,100,000 | | | | 1,198,560 | | |
Towson University Project
Senior Series 2012
07/01/27 | | | 5.000 | % | | | 700,000 | | | | 801,227 | | |
Total | | | | | | | 6,949,806 | | |
MUNICIPAL POWER 0.3% | |
Guam Power Authority
Refunding Revenue Bonds
Series 2012A (AGM)(a)
10/01/24 | | | 5.000 | % | | | 220,000 | | | | 266,000 | | |
Municipal Bonds (continued)
Issue
Description | | Coupon
Rate | | Principal
Amount ($) | | Value ($) | |
OTHER BOND ISSUE 2.5% | |
County of Montgomery
Revenue Bonds
Department of Liquor Control
Series 2009A
04/01/22 | | | 5.000 | % | | | 2,055,000 | | | | 2,281,091 | | |
Maryland Community Development Administration
Revenue Bonds
Capital Fund Securitization
Series 2003 (AGM)
07/01/21 | | | 4.400 | % | | | 100,000 | | | | 100,253 | | |
Total | | | | | | | 2,381,344 | | |
OTHER INDUSTRIAL DEVELOPMENT BOND 0.8% | |
Maryland Economic Development Corp.
Refunding Revenue Bonds
CNX Marine Terminals, Inc.
Series 2010
09/01/25 | | | 5.750 | % | | | 800,000 | | | | 771,288 | | |
POOL / BOND BANK 1.2% | |
Maryland Water Quality Financing Administration
Revolving Loan Fund
Revenue Bonds
Series 2008A
03/01/23 | | | 5.000 | % | | | 1,000,000 | | | | 1,076,000 | | |
REFUNDED / ESCROWED 7.0% | |
City of Baltimore
Prerefunded 07/01/18 Revenue Bonds
Wastewater Projects
Series 2008A (AGM)
07/01/21 | | | 5.000 | % | | | 1,250,000 | | | | 1,364,813 | | |
Revenue Bonds
Water Project
Series 1994A Escrowed to Maturity (FGIC)
07/01/24 | | | 5.000 | % | | | 1,400,000 | | | | 1,699,278 | | |
Maryland State Transportation Authority
Revenue Bonds
Series 1978 Escrowed to Maturity
07/01/16 | | | 6.800 | % | | | 85,000 | | | | 85,816 | | |
State of Maryland Department of Transportation
Prerefunded 02/15/18 Revenue Bonds
Series 2008
02/15/22 | | | 5.000 | % | | | 3,125,000 | | | | 3,364,187 | | |
Total | | | | | | | 6,514,094 | | |
RETIREMENT COMMUNITIES 5.9% | |
City of Gaithersburg
Refunding Revenue Bonds
Asbury Obligation Group
Series 2009B
01/01/23 | | | 6.000 | % | | | 1,250,000 | | | | 1,409,575 | | |
The accompanying Notes to Financial Statements are an integral part of this statement.
Annual Report 2016
8
COLUMBIA AMT-FREE MARYLAND INTERMEDIATE MUNI BOND FUND
PORTFOLIO OF INVESTMENTS (continued)
April 30, 2016
Municipal Bonds (continued)
Issue
Description | | Coupon
Rate | | Principal
Amount ($) | | Value ($) | |
County of Baltimore
Revenue Bonds
Oak Crest Village, Inc. Facility
Series 2007A
01/01/22 | | | 5.000 | % | | | 1,045,000 | | | | 1,073,205 | | |
01/01/27 | | | 5.000 | % | | | 2,000,000 | | | | 2,047,020 | | |
Maryland Health & Higher Educational Facilities Authority
Revenue Bonds
King Farm Presbyterian Community
Series 2007A
01/01/27 | | | 5.250 | % | | | 1,000,000 | | | | 1,013,750 | | |
Total | | | | | | | 5,543,550 | | |
SINGLE FAMILY 0.7% | |
Maryland Community Development Administration Housing
Revenue Bonds
Series 2016
03/01/36 | | | 3.250 | % | | | 600,000 | | | | 606,546 | | |
SPECIAL NON PROPERTY TAX 3.4% | |
State of Maryland Department of Transportation
Revenue Bonds
3rd Series 2015
12/15/26 | | | 4.000 | % | | | 1,000,000 | | | | 1,167,330 | | |
Series 2009
06/15/21 | | | 4.000 | % | | | 1,495,000 | | | | 1,638,804 | | |
Territory of Guam
Revenue Bonds
Series 2011A(a)
01/01/31 | | | 5.000 | % | | | 350,000 | | | | 393,236 | | |
Total | | | | | | | 3,199,370 | | |
SPECIAL PROPERTY TAX 5.2% | |
Anne Arundel County Consolidated District
Special Tax Refunding Bonds
Villages of Dorchester & Farmington
Series 2013
07/01/23 | | | 5.000 | % | | | 225,000 | | | | 271,141 | | |
07/01/24 | | | 5.000 | % | | | 500,000 | | | | 612,285 | | |
City of Baltimore
Refunding Tax Allocation Bonds
Consolidated Tax Projects
Series 2015
06/15/27 | | | 5.000 | % | | | 520,000 | | | | 604,833 | | |
County of Frederick
Special Tax Bonds
Urbana Community Development Authority
Series 2010A
07/01/25 | | | 5.000 | % | | | 2,500,000 | | | | 2,856,375 | | |
Municipal Bonds (continued)
Issue
Description | | Coupon
Rate | | Principal
Amount ($) | | Value ($) | |
County of Montgomery
Refunding Special Tax Bonds
West Germantown Development District
Series 2014
07/01/25 | | | 4.000 | % | | | 485,000 | | | | 552,890 | | |
Total | | | | | | | 4,897,524 | | |
STATE APPROPRIATED 4.0% | |
Maryland Economic Development Corp.
Refunding Revenue Bonds
Department of Transportation Headquarters
Series 2010
06/01/22 | | | 4.500 | % | | | 2,675,000 | | | | 3,166,397 | | |
New Jersey Transportation Trust Fund Authority
Revenue Bonds
Transportation System
Series 2006A
12/15/19 | | | 5.250 | % | | | 500,000 | | | | 548,505 | | |
Total | | | | | | | 3,714,902 | | |
STATE GENERAL OBLIGATION 4.8% | |
State of Maryland
Unlimited General Obligation Bonds
Series 2015A
03/01/27 | | | 4.000 | % | | | 1,500,000 | | | | 1,726,920 | | |
State & Local Facilities-Capital Improvement
1st Series 2003A
03/01/17 | | | 5.250 | % | | | 1,500,000 | | | | 1,559,175 | | |
Unlimited General Obligation Refunding Bonds
Series 2015B
08/01/24 | | | 4.000 | % | | | 1,000,000 | | | | 1,199,930 | | |
Total | | | | | �� | | 4,486,025 | | |
TRANSPORTATION 3.6% | |
Washington Metropolitan Area Transit Authority
Revenue Bonds
Transit
Series 2009
07/01/23 | | | 5.250 | % | | | 3,000,000 | | | | 3,383,040 | | |
TURNPIKE / BRIDGE / TOLL ROAD 2.4% | |
Maryland State Transportation Authority
Revenue Bonds
Series 2009A
07/01/22 | | | 5.000 | % | | | 2,000,000 | | | | 2,249,840 | | |
WATER & SEWER 5.3% | |
City of Baltimore
Subordinated Revenue Bonds
Series 2014A
07/01/32 | | | 5.000 | % | | | 1,000,000 | | | | 1,201,570 | | |
The accompanying Notes to Financial Statements are an integral part of this statement.
Annual Report 2016
9
COLUMBIA AMT-FREE MARYLAND INTERMEDIATE MUNI BOND FUND
PORTFOLIO OF INVESTMENTS (continued)
April 30, 2016
Municipal Bonds (continued)
Issue
Description | | Coupon
Rate | | Principal
Amount ($) | | Value ($) | |
Maryland Water Quality Financing Administration
Revolving Loan Fund
Revenue Bonds
Series 2008
03/01/21 | | | 5.000 | % | | | 2,500,000 | | | | 2,688,575 | | |
Washington Suburban Sanitary Commission
Unlimited General Obligation Refunding & Public
Improvement Bonds
Series 2009
06/01/21 | | | 4.000 | % | | | 1,000,000 | | | | 1,092,620 | | |
Total | | | | | | | 4,982,765 | | |
Total Municipal Bonds
(Cost: $82,486,043) | | | | | | | 88,542,302 | | |
Total Investments
(Cost: $82,486,043) | | | | | | | 88,542,302 | | |
Other Assets & Liabilities, Net | | | | | | | 4,915,264 | | |
Net Assets | | | | | | | 93,457,566 | | |
Notes to Portfolio of Investments
(a) Municipal obligations include debt obligations issued by or on behalf of territories, possessions, or sovereign nations within the territorial boundaries of the United States. At April 30, 2016, the value of these securities amounted to $659,236 or 0.71% of net assets.
Abbreviation Legend
AGCP Assured Guaranty Corporation
AGM Assured Guaranty Municipal Corporation
FGIC Financial Guaranty Insurance Company
XLCA XL Capital Assurance
Fair Value Measurements
The Fund categorizes its fair value measurements according to a three-level hierarchy that maximizes the use of observable inputs and minimizes the use of unobservable inputs by prioritizing that the most observable input be used when available. Observable inputs are those that market participants would use in pricing an investment based on market data obtained from sources independent of the reporting entity. Unobservable inputs are those that reflect the Fund's assumptions about the information market participants would use in pricing an investment. An investment's level within the fair value hierarchy is based on the lowest level of any input that is deemed significant to the asset's or liability's fair value measurement. The input levels are not necessarily an indication of the risk or liquidity associated with investments at that level. For example, certain U.S. government securities are generally high quality and liquid, however, they are reflected as Level 2 because the inputs used to determine fair value may not always be quoted prices in an active market.
Fair value inputs are summarized in the three broad levels listed below:
> Level 1 — Valuations based on quoted prices for investments in active markets that the Fund has the ability to access at the measurement date (including NAV for open-end mutual funds). Valuation adjustments are not applied to Level 1 investments.
> Level 2 — Valuations based on other significant observable inputs (including quoted prices for similar securities, interest rates, prepayment speeds, credit risks, etc.).
> Level 3 — Valuations based on significant unobservable inputs (including the Fund's own assumptions and judgment in determining the fair value of investments).
The accompanying Notes to Financial Statements are an integral part of this statement.
Annual Report 2016
10
COLUMBIA AMT-FREE MARYLAND INTERMEDIATE MUNI BOND FUND
PORTFOLIO OF INVESTMENTS (continued)
April 30, 2016
Fair Value Measurements (continued)
Inputs that are used in determining fair value of an investment may include price information, credit data, volatility statistics, and other factors. These inputs can be either observable or unobservable. The availability of observable inputs can vary between investments, and is affected by various factors such as the type of investment, and the volume and level of activity for that investment or similar investments in the marketplace. The inputs will be considered by the Investment Manager, along with any other relevant factors in the calculation of an investment's fair value. The Fund uses prices and inputs that are current as of the measurement date, which may include periods of market dislocations. During these periods, the availability of prices and inputs may be reduced for many investments. This condition could cause an investment to be reclassified between the various levels within the hierarchy.
Investments falling into the Level 3 category are primarily supported by quoted prices from brokers and dealers participating in the market for those investments. However, these may be classified as Level 3 investments due to lack of market transparency and corroboration to support these quoted prices. Additionally, valuation models may be used as the pricing source for any remaining investments classified as Level 3. These models may rely on one or more significant unobservable inputs and/or significant assumptions by the Investment Manager. Inputs used in valuations may include, but are not limited to, financial statement analysis, capital account balances, discount rates and estimated cash flows, and comparable company data.
Under the direction of the Fund's Board of Trustees (the Board), the Investment Manager's Valuation Committee (the Committee) is responsible for overseeing the valuation procedures approved by the Board. The Committee consists of voting and non-voting members from various groups within the Investment Manager's organization, including operations and accounting, trading and investments, compliance, risk management and legal.
The Committee meets at least monthly to review and approve valuation matters, which may include a description of specific valuation determinations, data regarding pricing information received from approved pricing vendors and brokers and the results of Board-approved valuation control policies and procedures (the Policies). The Policies address, among other things, instances when market quotations are or are not readily available, including recommendations of third party pricing vendors and a determination of appropriate pricing methodologies; events that require specific valuation determinations and assessment of fair value techniques; securities with a potential for stale pricing, including those that are illiquid, restricted, or in default; and the effectiveness of third party pricing vendors, including periodic reviews of vendors. The Committee meets more frequently, as needed, to discuss additional valuation matters, which may include the need to review back-testing results, review time-sensitive information or approve related valuation actions. The Committee reports to the Board, with members of the Committee meeting with the Board at each of its regularly scheduled meetings to discuss valuation matters and actions during the period, similar to those described earlier.
For investments categorized as Level 3, the Committee monitors information similar to that described above, which may include: (i) data specific to the issuer or comparable issuers, (ii) general market or specific sector news and (iii) quoted prices and specific or similar security transactions. The Committee considers this data and any changes from prior periods in order to assess the reasonableness of observable and unobservable inputs, any assumptions or internal models used to value those securities and changes in fair value. This data is also used to corroborate, when available, information received from approved pricing vendors and brokers. Various factors impact the frequency of monitoring this information (which may occur as often as daily). However, the Committee may determine that changes to inputs, assumptions and models are not required as a result of the monitoring procedures performed.
The following table is a summary of the inputs used to value the Fund's investments at April 30, 2016:
| | | Level 1
Quoted Prices in Active
Markets for Identical
Assets ($) | | Level 2
Other Significant
Observable Inputs ($) | | Level 3
Significant
Unobservable Inputs ($) | | Total ($) | |
Investments | |
Municipal Bonds | | | — | | | | 88,542,302 | | | | — | | | | 88,542,302 | | |
Total Investments | | | — | | | | 88,542,302 | | | | — | | | | 88,542,302 | | |
See the Portfolio of Investments for all investment classifications not indicated in the table.
The Fund's assets assigned to the Level 2 input category are generally valued using the market approach, in which a security's value is determined through reference to prices and information from market transactions for similar or identical assets.
There were no transfers of financial assets between levels during the period.
The accompanying Notes to Financial Statements are an integral part of this statement.
Annual Report 2016
11
COLUMBIA AMT-FREE MARYLAND INTERMEDIATE MUNI BOND FUND
STATEMENT OF ASSETS AND LIABILITIES
April 30, 2016
Assets | |
Investments, at value | |
(identified cost $82,486,043) | | $ | 88,542,302 | | |
Cash | | | 4,211,728 | | |
Receivable for: | |
Capital shares sold | | | 55,114 | | |
Interest | | | 1,096,541 | | |
Expense reimbursement due from Investment Manager | | | 532 | | |
Prepaid expenses | | | 667 | | |
Total assets | | | 93,906,884 | | |
Liabilities | |
Payable for: | |
Capital shares purchased | | | 82,391 | | |
Dividend distributions to shareholders | | | 207,128 | | |
Investment management fees | | | 1,200 | | |
Distribution and/or service fees | | | 198 | | |
Transfer agent fees | | | 14,157 | | |
Compensation of board members | | | 114,269 | | |
Audit fees | | | 24,380 | | |
Other expenses | | | 5,595 | | |
Total liabilities | | | 449,318 | | |
Net assets applicable to outstanding capital stock | | $ | 93,457,566 | | |
Represented by | |
Paid-in capital | | $ | 88,707,141 | | |
Undistributed net investment income | | | 231,514 | | |
Accumulated net realized loss | | | (1,537,348 | ) | |
Unrealized appreciation (depreciation) on: | |
Investments | | | 6,056,259 | | |
Total — representing net assets applicable to outstanding capital stock | | $ | 93,457,566 | | |
The accompanying Notes to Financial Statements are an integral part of this statement.
Annual Report 2016
12
COLUMBIA AMT-FREE MARYLAND INTERMEDIATE MUNI BOND FUND
STATEMENT OF ASSETS AND LIABILITIES (continued)
April 30, 2016
Class A | |
Net assets | | $ | 18,361,689 | | |
Shares outstanding | | | 1,684,072 | | |
Net asset value per share | | $ | 10.90 | | |
Maximum offering price per share(a) | | $ | 11.24 | | |
Class B | |
Net assets | | $ | 43,050 | | |
Shares outstanding | | | 3,945 | | |
Net asset value per share | | $ | 10.91 | | |
Class C | |
Net assets | | $ | 2,637,991 | | |
Shares outstanding | | | 241,923 | | |
Net asset value per share | | $ | 10.90 | | |
Class R4 | |
Net assets | | $ | 10,199 | | |
Shares outstanding | | | 936 | | |
Net asset value per share | | $ | 10.90 | | |
Class Z | |
Net assets | | $ | 72,404,637 | | |
Shares outstanding | | | 6,639,925 | | |
Net asset value per share | | $ | 10.90 | | |
(a) The maximum offering price per share is calculated by dividing the net asset value per share by 1.0 minus the maximum sales charge of 3.00%.
The accompanying Notes to Financial Statements are an integral part of this statement.
Annual Report 2016
13
COLUMBIA AMT-FREE MARYLAND INTERMEDIATE MUNI BOND FUND
STATEMENT OF OPERATIONS
Year Ended April 30, 2016
Net investment income | |
Income: | |
Interest | | $ | 3,126,532 | | |
Total income | | | 3,126,532 | | |
Expenses: | |
Investment management fees | | | 417,244 | | |
Distribution and/or service fees | |
Class A | | | 46,771 | | |
Class B | | | 442 | | |
Class C | | | 26,603 | | |
Transfer agent fees | |
Class A | | | 37,922 | | |
Class B | | | 90 | | |
Class C | | | 5,386 | | |
Class R4 | | | 19 | | |
Class Z | | | 136,275 | | |
Compensation of board members | | | 8,663 | | |
Custodian fees | | | 1,717 | | |
Printing and postage fees | | | 18,379 | | |
Registration fees | | | 29,127 | | |
Audit fees | | | 24,308 | | |
Legal fees | | | 7,146 | | |
Other | | | 11,116 | | |
Total expenses | | | 771,208 | | |
Fees waived or expenses reimbursed by Investment Manager and its affiliates | | | (201,269 | ) | |
Expense reductions | | | (20 | ) | |
Total net expenses | | | 569,919 | | |
Net investment income | | | 2,556,613 | | |
Realized and unrealized gain (loss) — net | |
Net realized gain (loss) on: | |
Investments | | | 398,814 | | |
Net realized gain | | | 398,814 | | |
Net change in unrealized appreciation (depreciation) on: | |
Investments | | | 387,379 | | |
Net change in unrealized appreciation | | | 387,379 | | |
Net realized and unrealized gain | | | 786,193 | | |
Net increase in net assets resulting from operations | | $ | 3,342,806 | | |
The accompanying Notes to Financial Statements are an integral part of this statement.
Annual Report 2016
14
COLUMBIA AMT-FREE MARYLAND INTERMEDIATE MUNI BOND FUND
STATEMENT OF CHANGES IN NET ASSETS
| | | Year Ended
April 30,
2016 | | Year Ended
April 30,
2015 | |
Operations | |
Net investment income | | $ | 2,556,613 | | | $ | 2,695,419 | | |
Net realized gain | | | 398,814 | | | | 387,814 | | |
Net change in unrealized appreciation (depreciation) | | | 387,379 | | | | (373,834 | ) | |
Net increase in net assets resulting from operations | | | 3,342,806 | | | | 2,709,399 | | |
Distributions to shareholders | |
Net investment income | |
Class A | | | (509,670 | ) | | | (590,612 | ) | |
Class B | | | (872 | ) | | | (1,088 | ) | |
Class C | | | (52,436 | ) | | | (59,853 | ) | |
Class R4 | | | (299 | ) | | | (317 | ) | |
Class Z | | | (2,000,211 | ) | | | (2,043,611 | ) | |
Total distributions to shareholders | | | (2,563,488 | ) | | | (2,695,481 | ) | |
Increase in net assets from capital stock activity | | | 1,205,609 | | | | 3,951,978 | | |
Total increase in net assets | | | 1,984,927 | | | | 3,965,896 | | |
Net assets at beginning of year | | | 91,472,639 | | | | 87,506,743 | | |
Net assets at end of year | | $ | 93,457,566 | | | $ | 91,472,639 | | |
Undistributed net investment income | | $ | 231,514 | | | $ | 238,389 | | |
The accompanying Notes to Financial Statements are an integral part of this statement.
Annual Report 2016
15
COLUMBIA AMT-FREE MARYLAND INTERMEDIATE MUNI BOND FUND
STATEMENT OF CHANGES IN NET ASSETS (continued)
| | | Year Ended April 30, 2016 | | Year Ended April 30, 2015 | |
| | | Shares | | Dollars ($) | | Shares | | Dollars ($) | |
Capital stock activity | |
Class A shares | |
Subscriptions(a) | | | 177,165 | | | | 1,913,094 | | | | 171,905 | | | | 1,869,867 | | |
Distributions reinvested | | | 19,394 | | | | 209,164 | | | | 18,908 | | | | 205,688 | | |
Redemptions | | | (418,028 | ) | | | (4,500,332 | ) | | | (227,030 | ) | | | (2,469,501 | ) | |
Net decrease | | | (221,469 | ) | | | (2,378,074 | ) | | | (36,217 | ) | | | (393,946 | ) | |
Class B shares | |
Subscriptions | | | 958 | | | | 10,278 | | | | 37 | | | | 401 | | |
Distributions reinvested | | | 41 | | | | 441 | | | | 61 | | | | 664 | | |
Redemptions(a) | | | (742 | ) | | | (7,941 | ) | | | (4,968 | ) | | | (54,095 | ) | |
Net increase (decrease) | | | 257 | | | | 2,778 | | | | (4,870 | ) | | | (53,030 | ) | |
Class C shares | |
Subscriptions | | | 15,273 | | | | 164,372 | | | | 71,282 | | | | 775,231 | | |
Distributions reinvested | | | 3,810 | | | | 41,089 | | | | 4,191 | | | | 45,591 | | |
Redemptions | | | (35,889 | ) | | | (386,679 | ) | | | (63,582 | ) | | | (693,430 | ) | |
Net increase (decrease) | | | (16,806 | ) | | | (181,218 | ) | | | 11,891 | | | | 127,392 | | |
Class Z shares | |
Subscriptions | | | 1,554,156 | | | | 16,771,673 | | | | 1,253,645 | | | | 13,656,825 | | |
Distributions reinvested | | | 16,949 | | | | 182,824 | | | | 15,889 | | | | 172,841 | | |
Redemptions | | | (1,225,516 | ) | | | (13,192,374 | ) | | | (877,880 | ) | | | (9,558,104 | ) | |
Net increase | | | 345,589 | | | | 3,762,123 | | | | 391,654 | | | | 4,271,562 | | |
Total net increase | | | 107,571 | | | | 1,205,609 | | | | 362,458 | | | | 3,951,978 | | |
(a) Includes conversions of Class B shares to Class A shares, if any.
The accompanying Notes to Financial Statements are an integral part of this statement.
Annual Report 2016
16
COLUMBIA AMT-FREE MARYLAND INTERMEDIATE MUNI BOND FUND
The following tables are intended to help you understand the Fund's financial performance. Certain information reflects financial results for a single share of a class held for the periods shown. Per share net investment income (loss) amounts are calculated based on average shares outstanding during the period. Total return assumes reinvestment of all dividends and distributions, if any. Total return does not reflect payment of sales charges, if any. Total return and portfolio turnover are not annualized for periods of less than one year. The portfolio turnover rate is calculated without regard to purchase and sales transactions of short-term instruments and certain derivatives, if any. If such transactions were included, the Fund's portfolio turnover rate may be higher.
| | | Year Ended April 30, | | Year Ended
March 31, | |
Class A | | 2016 | | 2015 | | 2014 | | 2013 | | 2012(a) | | 2012 | |
Per share data | |
Net asset value, beginning of period | | $ | 10.81 | | | $ | 10.80 | | | $ | 11.14 | | | $ | 11.05 | | | $ | 10.96 | | | $ | 10.41 | | |
Income from investment operations: | |
Net investment income | | | 0.29 | | | | 0.31 | | | | 0.32 | | | | 0.30 | | | | 0.03 | | | | 0.33 | | |
Net realized and unrealized gain (loss) | | | 0.09 | | | | 0.01 | | | | (0.34 | ) | | | 0.09 | | | | 0.09 | | | | 0.55 | | |
Total from investment operations | | | 0.38 | | | | 0.32 | | | | (0.02 | ) | | | 0.39 | | | | 0.12 | | | | 0.88 | | |
Less distributions to shareholders: | |
Net investment income | | | (0.29 | ) | | | (0.31 | ) | | | (0.32 | ) | | | (0.30 | ) | | | (0.03 | ) | | | (0.33 | ) | |
Total distributions to shareholders | | | (0.29 | ) | | | (0.31 | ) | | | (0.32 | ) | | | (0.30 | ) | | | (0.03 | ) | | | (0.33 | ) | |
Net asset value, end of period | | $ | 10.90 | | | $ | 10.81 | | | $ | 10.80 | | | $ | 11.14 | | | $ | 11.05 | | | $ | 10.96 | | |
Total return | | | 3.60 | % | | | 3.00 | % | | | (0.16 | %) | | | 3.58 | % | | | 1.05 | % | | | 8.55 | % | |
Ratios to average net assets(b) | |
Total gross expenses | | | 1.04 | % | | | 1.04 | % | | | 1.05 | % | | | 1.01 | % | | | 1.05 | %(c) | | | 1.03 | % | |
Total net expenses(d) | | | 0.81 | %(e) | | | 0.81 | %(e) | | | 0.81 | %(e) | | | 0.81 | %(e) | | | 0.80 | %(c) | | | 0.80 | %(e) | |
Net investment income | | | 2.72 | % | | | 2.87 | % | | | 2.94 | % | | | 2.72 | % | | | 2.83 | %(c) | | | 3.07 | % | |
Supplemental data | |
Net assets, end of period (in thousands) | | $ | 18,362 | | | $ | 20,593 | | | $ | 20,973 | | | $ | 23,767 | | | $ | 24,781 | | | $ | 24,708 | | |
Portfolio turnover | | | 13 | % | | | 10 | % | | | 2 | % | | | 15 | % | | | 1 | % | | | 7 | % | |
Notes to Financial Highlights
(a) For the period from April 1, 2012 to April 30, 2012. During the period, the Fund's fiscal year end was changed from March 31 to April 30.
(b) In addition to the fees and expenses that the Fund bears directly, the Fund indirectly bears a pro rata share of the fees and expenses of any other funds in which it invests. Such indirect expenses are not included in the Fund's reported expense ratios.
(c) Annualized.
(d) Total net expenses include the impact of certain fee waivers/expense reimbursements made by the Investment Manager and certain of its affiliates, if applicable.
(e) The benefits derived from expense reductions had an impact of less than 0.01%.
The accompanying Notes to Financial Statements are an integral part of this statement.
Annual Report 2016
17
COLUMBIA AMT-FREE MARYLAND INTERMEDIATE MUNI BOND FUND
FINANCIAL HIGHLIGHTS (continued)
| | | Year Ended April 30, | | Year Ended
March 31, | |
Class B | | 2016 | | 2015 | | 2014 | | 2013 | | 2012(a) | | 2012 | |
Per share data | |
Net asset value, beginning of period | | $ | 10.82 | | | $ | 10.81 | | | $ | 11.15 | | | $ | 11.06 | | | $ | 10.97 | | | $ | 10.42 | | |
Income from investment operations: | |
Net investment income | | | 0.21 | | | | 0.23 | | | | 0.23 | | | | 0.22 | | | | 0.02 | | | | 0.25 | | |
Net realized and unrealized gain (loss) | | | 0.09 | | | | 0.01 | | | | (0.34 | ) | | | 0.09 | | | | 0.09 | | | | 0.55 | | |
Total from investment operations | | | 0.30 | | | | 0.24 | | | | (0.11 | ) | | | 0.31 | | | | 0.11 | | | | 0.80 | | |
Less distributions to shareholders: | |
Net investment income | | | (0.21 | ) | | | (0.23 | ) | | | (0.23 | ) | | | (0.22 | ) | | | (0.02 | ) | | | (0.25 | ) | |
Total distributions to shareholders | | | (0.21 | ) | | | (0.23 | ) | | | (0.23 | ) | | | (0.22 | ) | | | (0.02 | ) | | | (0.25 | ) | |
Net asset value, end of period | | $ | 10.91 | | | $ | 10.82 | | | $ | 10.81 | | | $ | 11.15 | | | $ | 11.06 | | | $ | 10.97 | | |
Total return | | | 2.83 | % | | | 2.22 | % | | | (0.90 | %) | | | 2.81 | % | | | 0.99 | % | | | 7.73 | % | |
Ratios to average net assets(b) | |
Total gross expenses | | | 1.79 | % | | | 1.79 | % | | | 1.79 | % | | | 1.75 | % | | | 1.80 | %(c) | | | 1.81 | % | |
Total net expenses(d) | | | 1.56 | %(e) | | | 1.56 | %(e) | | | 1.56 | %(e) | | | 1.56 | %(e) | | | 1.55 | %(c) | | | 1.55 | %(e) | |
Net investment income | | | 1.97 | % | | | 2.13 | % | | | 2.18 | % | | | 1.96 | % | | | 2.08 | %(c) | | | 2.34 | % | |
Supplemental data | |
Net assets, end of period (in thousands) | | $ | 43 | | | $ | 40 | | | $ | 93 | | | $ | 119 | | | $ | 166 | | | $ | 164 | | |
Portfolio turnover | | | 13 | % | | | 10 | % | | | 2 | % | | | 15 | % | | | 1 | % | | | 7 | % | |
Notes to Financial Highlights
(a) For the period from April 1, 2012 to April 30, 2012. During the period, the Fund's fiscal year end was changed from March 31 to April 30.
(b) In addition to the fees and expenses that the Fund bears directly, the Fund indirectly bears a pro rata share of the fees and expenses of any other funds in which it invests. Such indirect expenses are not included in the Fund's reported expense ratios.
(c) Annualized.
(d) Total net expenses include the impact of certain fee waivers/expense reimbursements made by the Investment Manager and certain of its affiliates, if applicable.
(e) The benefits derived from expense reductions had an impact of less than 0.01%.
The accompanying Notes to Financial Statements are an integral part of this statement.
Annual Report 2016
18
COLUMBIA AMT-FREE MARYLAND INTERMEDIATE MUNI BOND FUND
FINANCIAL HIGHLIGHTS (continued)
| | | Year Ended April 30, | | Year Ended
March 31, | |
Class C | | 2016 | | 2015 | | 2014 | | 2013 | | 2012(a) | | 2012 | |
Per share data | |
Net asset value, beginning of period | | $ | 10.81 | | | $ | 10.80 | | | $ | 11.14 | | | $ | 11.05 | | | $ | 10.96 | | | $ | 10.41 | | |
Income from investment operations: | |
Net investment income | | | 0.21 | | | | 0.23 | | | | 0.24 | | | | 0.22 | | | | 0.02 | | | | 0.25 | | |
Net realized and unrealized gain (loss) | | | 0.09 | | | | 0.01 | | | | (0.34 | ) | | | 0.09 | | | | 0.09 | | | | 0.55 | | |
Total from investment operations | | | 0.30 | | | | 0.24 | | | | (0.10 | ) | | | 0.31 | | | | 0.11 | | | | 0.80 | | |
Less distributions to shareholders: | |
Net investment income | | | (0.21 | ) | | | (0.23 | ) | | | (0.24 | ) | | | (0.22 | ) | | | (0.02 | ) | | | (0.25 | ) | |
Total distributions to shareholders | | | (0.21 | ) | | | (0.23 | ) | | | (0.24 | ) | | | (0.22 | ) | | | (0.02 | ) | | | (0.25 | ) | |
Net asset value, end of period | | $ | 10.90 | | | $ | 10.81 | | | $ | 10.80 | | | $ | 11.14 | | | $ | 11.05 | | | $ | 10.96 | | |
Total return | | | 2.83 | % | | | 2.23 | % | | | (0.90 | %) | | | 2.81 | % | | | 0.99 | % | | | 7.74 | % | |
Ratios to average net assets(b) | |
Total gross expenses | | | 1.79 | % | | | 1.79 | % | | | 1.80 | % | | | 1.76 | % | | | 1.80 | %(c) | | | 1.78 | % | |
Total net expenses(d) | | | 1.56 | %(e) | | | 1.56 | %(e) | | | 1.56 | %(e) | | | 1.56 | %(e) | | | 1.55 | %(c) | | | 1.55 | %(e) | |
Net investment income | | | 1.97 | % | | | 2.11 | % | | | 2.19 | % | | | 1.96 | % | | | 2.09 | %(c) | | | 2.33 | % | |
Supplemental data | |
Net assets, end of period (in thousands) | | $ | 2,638 | | | $ | 2,796 | | | $ | 2,666 | | | $ | 2,939 | | | $ | 2,822 | | | $ | 2,838 | | |
Portfolio turnover | | | 13 | % | | | 10 | % | | | 2 | % | | | 15 | % | | | 1 | % | | | 7 | % | |
Notes to Financial Highlights
(a) For the period from April 1, 2012 to April 30, 2012. During the period, the Fund's fiscal year end was changed from March 31 to April 30.
(b) In addition to the fees and expenses that the Fund bears directly, the Fund indirectly bears a pro rata share of the fees and expenses of any other funds in which it invests. Such indirect expenses are not included in the Fund's reported expense ratios.
(c) Annualized.
(d) Total net expenses include the impact of certain fee waivers/expense reimbursements made by the Investment Manager and certain of its affiliates, if applicable.
(e) The benefits derived from expense reductions had an impact of less than 0.01%.
The accompanying Notes to Financial Statements are an integral part of this statement.
Annual Report 2016
19
COLUMBIA AMT-FREE MARYLAND INTERMEDIATE MUNI BOND FUND
FINANCIAL HIGHLIGHTS (continued)
| | | Year Ended April 30, | |
Class R4 | | 2016 | | 2015 | | 2014 | | 2013(a) | |
Per share data | |
Net asset value, beginning of period | | $ | 10.81 | | | $ | 10.80 | | | $ | 11.14 | | | $ | 11.06 | | |
Income from investment operations: | |
Net investment income | | | 0.32 | | | | 0.34 | | | | 0.34 | | | | 0.04 | | |
Net realized and unrealized gain (loss) | | | 0.09 | | | | 0.01 | | | | (0.34 | ) | | | 0.08 | | |
Total from investment operations | | | 0.41 | | | | 0.35 | | | | — | | | | 0.12 | | |
Less distributions to shareholders: | |
Net investment income | | | (0.32 | ) | | | (0.34 | ) | | | (0.34 | ) | | | (0.04 | ) | |
Total distributions to shareholders | | | (0.32 | ) | | | (0.34 | ) | | | (0.34 | ) | | | (0.04 | ) | |
Net asset value, end of period | | $ | 10.90 | | | $ | 10.81 | | | $ | 10.80 | | | $ | 11.14 | | |
Total return | | | 3.86 | % | | | 3.25 | % | | | 0.08 | % | | | 1.06 | % | |
Ratios to average net assets(b) | |
Total gross expenses | | | 0.77 | % | | | 0.78 | % | | | 0.81 | % | | | 0.71 | %(c) | |
Total net expenses(d) | | | 0.56 | %(e) | | | 0.56 | %(e) | | | 0.56 | %(e) | | | 0.55 | %(c) | |
Net investment income | | | 2.97 | % | | | 3.12 | % | | | 3.24 | % | | | 2.97 | %(c) | |
Supplemental data | |
Net assets, end of period (in thousands) | | $ | 10 | | | $ | 10 | | | $ | 10 | | | $ | 3 | | |
Portfolio turnover | | | 13 | % | | | 10 | % | | | 2 | % | | | 15 | % | |
Notes to Financial Highlights
(a) Based on operations from March 19, 2013 (commencement of operations) through the stated period end.
(b) In addition to the fees and expenses that the Fund bears directly, the Fund indirectly bears a pro rata share of the fees and expenses of any other funds in which it invests. Such indirect expenses are not included in the Fund's reported expense ratios.
(c) Annualized.
(d) Total net expenses include the impact of certain fee waivers/expense reimbursements made by the Investment Manager and certain of its affiliates, if applicable.
(e) The benefits derived from expense reductions had an impact of less than 0.01%.
The accompanying Notes to Financial Statements are an integral part of this statement.
Annual Report 2016
20
COLUMBIA AMT-FREE MARYLAND INTERMEDIATE MUNI BOND FUND
FINANCIAL HIGHLIGHTS (continued)
| | | Year Ended April 30, | | Year Ended
March 31, | |
Class Z | | 2016 | | 2015 | | 2014 | | 2013 | | 2012(a) | | 2012 | |
Per share data | |
Net asset value, beginning of period | | $ | 10.81 | | | $ | 10.80 | | | $ | 11.14 | | | $ | 11.05 | | | $ | 10.96 | | | $ | 10.41 | | |
Income from investment operations: | |
Net investment income | | | 0.32 | | | | 0.34 | | | | 0.34 | | | | 0.33 | | | | 0.03 | | | | 0.36 | | |
Net realized and unrealized gain (loss) | | | 0.09 | | | | 0.01 | | | | (0.34 | ) | | | 0.09 | | | | 0.09 | | | | 0.55 | | |
Total from investment operations | | | 0.41 | | | | 0.35 | | | | — | | | | 0.42 | | | | 0.12 | | | | 0.91 | | |
Less distributions to shareholders: | |
Net investment income | | | (0.32 | ) | | | (0.34 | ) | | | (0.34 | ) | | | (0.33 | ) | | | (0.03 | ) | | | (0.36 | ) | |
Total distributions to shareholders | | | (0.32 | ) | | | (0.34 | ) | | | (0.34 | ) | | | (0.33 | ) | | | (0.03 | ) | | | (0.36 | ) | |
Net asset value, end of period | | $ | 10.90 | | | $ | 10.81 | | | $ | 10.80 | | | $ | 11.14 | | | $ | 11.05 | | | $ | 10.96 | | |
Total return | | | 3.86 | % | | | 3.26 | % | | | 0.09 | % | | | 3.84 | % | | | 1.07 | % | | | 8.82 | % | |
Ratios to average net assets(b) | |
Total gross expenses | | | 0.79 | % | | | 0.79 | % | | | 0.79 | % | | | 0.76 | % | | | 0.80 | %(c) | | | 0.77 | % | |
Total net expenses(d) | | | 0.56 | %(e) | | | 0.56 | %(e) | | | 0.56 | %(e) | | | 0.56 | %(e) | | | 0.55 | %(c) | | | 0.55 | %(e) | |
Net investment income | | | 2.97 | % | | | 3.12 | % | | | 3.17 | % | | | 2.96 | % | | | 3.07 | %(c) | | | 3.31 | % | |
Supplemental data | |
Net assets, end of period (in thousands) | | $ | 72,405 | | | $ | 68,033 | | | $ | 63,765 | | | $ | 110,105 | | | $ | 110,126 | | | $ | 109,482 | | |
Portfolio turnover | | | 13 | % | | | 10 | % | | | 2 | % | | | 15 | % | | | 1 | % | | | 7 | % | |
Notes to Financial Highlights
(a) For the period from April 1, 2012 to April 30, 2012. During the period, the Fund's fiscal year end was changed from March 31 to April 30.
(b) In addition to the fees and expenses that the Fund bears directly, the Fund indirectly bears a pro rata share of the fees and expenses of any other funds in which it invests. Such indirect expenses are not included in the Fund's reported expense ratios.
(c) Annualized.
(d) Total net expenses include the impact of certain fee waivers/expense reimbursements made by the Investment Manager and certain of its affiliates, if applicable.
(e) The benefits derived from expense reductions had an impact of less than 0.01%.
The accompanying Notes to Financial Statements are an integral part of this statement.
Annual Report 2016
21
COLUMBIA AMT-FREE MARYLAND INTERMEDIATE MUNI BOND FUND
NOTES TO FINANCIAL STATEMENTS
April 30, 2016
Note 1. Organization
Columbia AMT-Free Maryland Intermediate Muni Bond Fund (the Fund), a series of Columbia Funds Series Trust (the Trust), is a non-diversified fund. The Trust is registered under the Investment Company Act of 1940, as amended (the 1940 Act), as an open-end management investment company organized as a Delaware statutory trust.
Fund Shares
The Trust may issue an unlimited number of shares (without par value). The Fund offers Class A, Class B, Class C, Class R4 and Class Z shares. Although all share classes generally have identical voting, dividend and liquidation rights, each share class votes separately when required by the Trust's organizational documents or by law. Different share classes pay different distribution amounts to the extent the expenses of such share classes differ, and distributions in liquidation will be proportional to the net asset value of each share class. Each share class has its own expense and sales charge structure.
Class A shares are subject to a maximum front-end sales charge of 3.00% based on the initial investment amount. In addition, Class A shares purchased on or after February 19, 2015 are subject to a contingent deferred sales charge (CDSC) of 0.75% on certain investments of $500,000 or more if redeemed within 12 months after purchase. Redemptions of Class A shares purchased prior to February 19, 2015, without an initial sales charge in accounts aggregating $1 million to $50 million at the time of purchase, are subject to a CDSC of 1.00% if redeemed within 12 months after purchase, and 0.50% if redeemed more than 12, but less than 18, months after purchase.
Class B shares may be subject to a maximum CDSC of 3.00% based upon the holding period after purchase. Class B shares will generally convert to Class A shares eight years after purchase. The Fund no longer accepts investments by new or existing investors in the Fund's Class B shares, except in connection with the reinvestment of any dividend and/or capital gain distributions in Class B shares of the Fund and exchanges by existing Class B shareholders of certain other funds within the Columbia Family of Funds.
Class C shares are subject to a 1.00% CDSC on shares redeemed within 12 months after purchase.
Class R4 shares are not subject to sales charges and are generally available only to omnibus retirement plans
and certain investors as described in the Fund's prospectus.
Class Z shares are not subject to sales charges and are available only to eligible investors, which are subject to different investment minimums as described in the Fund's prospectus.
Note 2. Summary of Significant Accounting Policies
Basis of Preparation
The Fund is an investment company that applies the accounting and reporting guidance in the Financial Accounting Standards Board (FASB) Accounting Standards Codification Topic 946, Financial Services — Investment Companies (ASC 946). The financial statements are prepared in accordance with U.S. generally accepted accounting principles (GAAP), which requires management to make certain estimates and assumptions that affect the reported amounts of assets and liabilities, the disclosure of contingent assets and liabilities at the date of the financial statements and the reported amounts of income and expenses during the reporting period. Actual results could differ from those estimates.
The following is a summary of significant accounting policies followed by the Fund in the preparation of its financial statements.
Security Valuation
Debt securities generally are valued by pricing services approved by the Board of Trustees (the Board) based upon market transactions for normal, institutional-size trading units of similar securities. The services may use various pricing techniques that take into account, as applicable, factors such as yield, quality, coupon rate, maturity, type of issue, trading characteristics and other data, as well as broker quotes. Debt securities for which quotations are not readily available or not believed to be reflective of market value may also be valued based upon a bid quote from an approved independent broker-dealer. Debt securities maturing in 60 days or less are valued primarily at amortized cost value, unless this method results in a valuation that management believes does not approximate market value.
Investments for which market quotations are not readily available, or that have quotations which management believes are not reflective of market value or reliable, are valued at fair value as determined in good faith under procedures approved by and under the general
Annual Report 2016
22
COLUMBIA AMT-FREE MARYLAND INTERMEDIATE MUNI BOND FUND
NOTES TO FINANCIAL STATEMENTS (continued)
April 30, 2016
supervision of the Board. If a security or class of securities (such as foreign securities) is valued at fair value, such value is likely to be different from the quoted or published price for the security.
The determination of fair value often requires significant judgment. To determine fair value, management may use assumptions including but not limited to future cash flows and estimated risk premiums. Multiple inputs from various sources may be used to determine fair value.
GAAP requires disclosure regarding the inputs and valuation techniques used to measure fair value and any changes in valuation inputs or techniques. In addition, investments shall be disclosed by major category. This information is disclosed following the Fund's Portfolio of Investments.
Security Transactions
Security transactions are accounted for on the trade date. Cost is determined and gains (losses) are based upon the specific identification method for both financial statement and federal income tax purposes.
Income Recognition
Interest income is recorded on an accrual basis. Market premiums and discounts, including original issue discounts, are amortized and accreted, respectively, over the expected life of the security on all debt securities, unless otherwise noted.
The Fund may place a debt security on non-accrual status and reduce related interest income when it becomes probable that the interest will not be collected and the amount of uncollectible interest can be reasonably estimated. A defaulted debt security is removed from non-accrual status when the issuer resumes interest payments or when collectibility of interest is reasonably assured.
Expenses
General expenses of the Trust are allocated to the Fund and other funds of the Trust based upon relative net assets or other expense allocation methodologies determined by the nature of the expense. Expenses directly attributable to the Fund are charged to the Fund. Expenses directly attributable to a specific class of shares are charged to that share class.
Determination of Class Net Asset Value
All income, expenses (other than class-specific expenses, which are charged to that share class, as shown in the Statement of Operations) and realized and
unrealized gains (losses) are allocated to each class of the Fund on a daily basis, based on the relative net assets of each class, for purposes of determining the net asset value of each class.
Federal Income Tax Status
The Fund intends to qualify each year as a regulated investment company under Subchapter M of the Internal Revenue Code, as amended, and will distribute substantially all of its tax exempt and taxable income (including net short-term capital gains), if any, for its tax year, and as such will not be subject to federal income taxes. In addition, the Fund intends to distribute in each calendar year substantially all of its net investment income, capital gains and certain other amounts, if any, such that the Fund should not be subject to federal excise tax. Therefore, no federal income or excise tax provision is recorded.
Distributions to Shareholders
Distributions from net investment income, if any, are declared daily and paid monthly. Net realized capital gains, if any, are distributed at least annually. Income distributions and capital gain distributions are determined in accordance with federal income tax regulations, which may differ from GAAP.
Guarantees and Indemnifications
Under the Trust's organizational documents and, in some cases, by contract, its officers and trustees are indemnified against certain liabilities arising out of the performance of their duties to the Trust or its funds. In addition, certain of the Fund's contracts with its service providers contain general indemnification clauses. The Fund's maximum exposure under these arrangements is unknown since the amount of any future claims that may be made against the Fund cannot be determined, and the Fund has no historical basis for predicting the likelihood of any such claims.
Note 3. Fees and Other Transactions with Affiliates
Management Fees
Effective September 1, 2015, the Fund entered into a Management Agreement with Columbia Management Investment Advisers, LLC (the Investment Manager), a wholly-owned subsidiary of Ameriprise Financial, Inc. (Ameriprise Financial). Under the Management Agreement, the Investment Manager provides the Fund with investment research and advice, as well as
Annual Report 2016
23
COLUMBIA AMT-FREE MARYLAND INTERMEDIATE MUNI BOND FUND
NOTES TO FINANCIAL STATEMENTS (continued)
April 30, 2016
administrative and accounting services. The management services fee is an annual fee that is equal to a percentage of the Fund's average daily net assets that declines from 0.47% to 0.31% as the Fund's net assets increase. The effective management services fee rate for the year ended April 30, 2016 was 0.47% of the Fund's average daily net assets.
Prior to September 1, 2015, the Fund paid the Investment Manager an annual fee for advisory services under an Investment Management Services Agreement and a separate annual fee for administrative and accounting services under an Administrative Services Agreement. For the period from May 1, 2015 through August 31, 2015, the investment advisory services fee paid to the Investment Manager was $120,101, and the administrative services fee paid to the Investment Manager was $21,018.
Other Expenses
Other expenses are for, among other things, miscellaneous expenses of the Fund or the Board, including payments to Board Services Corp., a company providing limited administrative services to the Fund and the Board. That company's expenses include boardroom and office expense, employee compensation, employee health and retirement benefits, and certain other expenses. For the year ended April 30, 2016, other expenses paid by the Fund to this company were $1,173.
Compensation of Board Members
Board members, who are not officers or employees of the Investment Manager or Ameriprise Financial, are compensated for their services to the Fund as disclosed in the Statement of Operations. Under a Deferred Compensation Plan (the Plan), these Board members may elect to defer payment of up to 100% of their compensation. Deferred amounts are treated as though equivalent dollar amounts had been invested in shares of certain funds managed by the Investment Manager. The Fund's liability for these amounts is adjusted for market value changes and remains in the Fund until distributed in accordance with the Plan. All amounts payable under the Plan constitute a general unsecured obligation of the Fund.
Transfer Agency Fees
Under a Transfer and Dividend Disbursing Agent Agreement, Columbia Management Investment Services Corp. (the Transfer Agent), an affiliate of the Investment Manager and a wholly-owned subsidiary of Ameriprise
Financial, is responsible for providing transfer agency services to the Fund. The Transfer Agent has contracted with Boston Financial Data Services (BFDS) to serve as sub-transfer agent.
The Transfer Agent receives a monthly transfer agency fee based on the number or the average value of accounts, depending on the type of account. In addition, the Transfer Agent also receives sub-transfer agency fees based on a percentage of the average aggregate value of the Fund's shares maintained in omnibus accounts (other than omnibus accounts for which American Enterprise Investment Services Inc. is the broker of record or accounts where the beneficial shareholder is a customer of Ameriprise Financial Services, Inc., for which the Transfer Agent receives a per account fee). The Transfer Agent pays the fees of BFDS for services as sub-transfer agent and is not entitled to reimbursement for such fees from the Fund (with the exception of out-of-pocket fees).
The Transfer Agent also receives compensation from the Fund for various shareholder services and reimbursements for certain out-of-pocket fees.
For the year ended April 30, 2016, the Fund's effective transfer agency fee rates as a percentage of average daily net assets of each class were as follows:
Class A | | | 0.20 | % | |
Class B | | | 0.20 | | |
Class C | | | 0.20 | | |
Class R4 | | | 0.19 | | |
Class Z | | �� | 0.20 | | |
An annual minimum account balance fee of $20 may apply to certain accounts with a value below the applicable share class's initial minimum investment requirements to reduce the impact of small accounts on transfer agency fees. These minimum account balance fees are remitted to the Fund and recorded as part of expense reductions in the Statement of Operations. For the year ended April 30, 2016, these minimum account balance fees reduced total expenses of the Fund by $20.
Distribution and Service Fees
The Fund has an agreement with Columbia Management Investment Distributors, Inc. (the Distributor), an affiliate of the Investment Manager and a wholly-owned subsidiary of Ameriprise Financial, for distribution and shareholder services. The Board has approved, and the Fund has adopted, distribution and shareholder service plans (the Plans) applicable to certain share classes, which set the distribution and service fees for the Fund.
Annual Report 2016
24
COLUMBIA AMT-FREE MARYLAND INTERMEDIATE MUNI BOND FUND
NOTES TO FINANCIAL STATEMENTS (continued)
April 30, 2016
These fees are calculated daily and are intended to compensate the Distributor and/or eligible selling and/or servicing agents for selling shares of the Fund and providing services to investors.
Under the Plans, the Fund pays a monthly combined distribution and service fee to the Distributor at the maximum annual rate of 0.25% of the average daily net assets attributable to Class A shares of the Fund. Also under the Plans, the Fund pays a monthly service fee at the maximum annual rate of 0.25% of the average daily net assets attributable to Class B and Class C shares of the Fund and a monthly distribution fee at the maximum annual rate of 0.75% of the average daily net assets attributable to Class B and Class C shares of the Fund.
Sales Charges
Sales charges, including front-end charges and CDSCs, received by the Distributor for distributing Fund shares were $22,376 for Class A and $445 for Class C shares for the year ended April 30, 2016.
Expenses Waived/Reimbursed by the Investment Manager and its Affiliates
The Investment Manager and certain of its affiliates have contractually agreed to waive fees and/or reimburse expenses (excluding certain fees and expenses described below) for the period disclosed below, unless sooner terminated at the sole discretion of the Board, so that the Fund's net operating expenses, after giving effect to fees waived/expenses reimbursed and any balance credits and/or overdraft charges from the Fund's custodian, do not exceed the following annual rates as a percentage of the class' average daily net assets:
| | | Fee Rates Contractual
through
August 31, 2016 | |
Class A | | | 0.81 | % | |
Class B | | | 1.56 | | |
Class C | | | 1.56 | | |
Class R4 | | | 0.56 | | |
Class Z | | | 0.56 | | |
Under the agreement governing these fee waivers and/or expense reimbursement arrangements, the following fees and expenses are excluded from the waiver/reimbursement commitment, and therefore will be paid by the Fund, if applicable: taxes (including foreign transaction taxes), expenses associated with investments in affiliated and non-affiliated pooled investment vehicles (including mutual funds and
exchange-traded funds), transaction costs and brokerage commissions, costs related to any securities lending program, dividend and interest expenses associated with securities sold short, inverse floater program fees and expenses, transaction charges and interest on borrowed money, interest, extraordinary expenses and any other expenses the exclusion of which is specifically approved by the Board. This agreement may be modified or amended only with approval from the Investment Manager, certain of its affiliates and the Fund. Any fees waived and/or expenses reimbursed under the expense reimbursement arrangements described above are not recoverable by the Investment Manager or its affiliates in future periods.
Note 4. Federal Tax Information
The timing and character of income and capital gain distributions are determined in accordance with income tax regulations, which may differ from GAAP because of temporary or permanent book to tax differences.
At April 30, 2016, these differences are primarily due to differing treatment for capital loss carryforwards, Trustees' deferred compensation and distributions. To the extent these differences are permanent, reclassifications are made among the components of the Fund's net assets in the Statement of Assets and Liabilities. Temporary differences do not require reclassifications.
The Fund did not have any permanent differences; therefore, no reclassifications were made to the Statement of Assets and Liabilities.
The tax character of distributions paid during the years indicated was as follows:
Year Ended April 30, | | 2016 | | 2015 | |
Ordinary income | | $ | 15,072 | | | $ | 13,518 | | |
Tax-exempt income | | | 2,548,416 | | | | 2,681,963 | | |
Total | | | 2,563,488 | | | | 2,695,481 | | |
Short-term capital gain distributions, if any, are considered ordinary income distributions for tax purposes.
At April 30, 2016, the components of distributable earnings on a tax basis were as follows:
Undistributed tax-exempt income | | $ | 552,306 | | |
Capital loss carryforwards | | | (1,537,348 | ) | |
Net unrealized appreciation | | | 6,056,259 | | |
At April 30, 2016, the cost of investments for federal income tax purposes was $82,486,043 and the
Annual Report 2016
25
COLUMBIA AMT-FREE MARYLAND INTERMEDIATE MUNI BOND FUND
NOTES TO FINANCIAL STATEMENTS (continued)
April 30, 2016
aggregate gross unrealized appreciation and depreciation based on that cost was:
Unrealized appreciation | | $ | 6,086,048 | | |
Unrealized depreciation | | | (29,789 | ) | |
Net unrealized appreciation | | $ | 6,056,259 | | |
The following capital loss carryforwards, determined at April 30, 2016, may be available to reduce taxable income arising from future net realized gains on investments, if any, to the extent permitted by the Internal Revenue Code:
Year of Expiration | | Amount ($) | |
2017 | | | 1,537,348 | | |
For the year ended April 30, 2016, $398,814 of capital loss carryforward was utilized.
Management of the Fund has concluded that there are no significant uncertain tax positions in the Fund that would require recognition in the financial statements. However, management's conclusion may be subject to review and adjustment at a later date based on factors including, but not limited to, new tax laws, regulations, and administrative interpretations (including relevant court decisions). Generally, the Fund's federal tax returns for the prior three fiscal years remain subject to examination by the Internal Revenue Service.
Note 5. Portfolio Information
The cost of purchases and proceeds from sales of securities, excluding short-term investments and derivatives, if any, aggregated to $11,247,832 and $12,529,917, respectively, for the year ended April 30, 2016. The amount of purchase and sale activity impacts the portfolio turnover rate reported in the Financial Highlights.
Note 6. Line of Credit
The Fund has access to a revolving credit facility whereby the Fund may borrow for the temporary funding of shareholder redemptions or for other temporary or emergency purposes. Effective December 8, 2015, Citibank, N.A. and HSBC Bank USA, N.A. joined JPMorgan Chase Bank, N.A. (JPMorgan) as lead of a syndicate of banks under the credit facility, which is a collective agreement between the Fund and certain other funds managed by the Investment Manager, severally and not jointly, that permits collective borrowings up to $1 billion. Interest is charged to each participating fund based on its borrowings at a rate equal to the higher of (i) the overnight federal funds rate plus 1.00% or (ii) the
one-month LIBOR rate plus 1.00%. Each borrowing under the credit facility matures no later than 60 days after the date of borrowing. The Fund also pays a commitment fee equal to its pro rata share of the amount of the credit facility at a rate of 0.15% per annum. The commitment fee is included in other expenses in the Statement of Operations. Prior to December 8, 2015, JPMorgan was the sole lead bank under the credit facility agreement that permitted borrowings up to $550 million under the same terms and interest rates as described above with the exception of the commitment fee which was charged at a rate of 0.075% per annum.
The Fund had no borrowings during the year ended April 30, 2016.
Note 7. Significant Risks
Shareholder Concentration Risk
At April 30, 2016, one unaffiliated shareholder of record owned 81.5% of the outstanding shares of the Fund in one or more accounts. The Fund has no knowledge about whether any portion of those shares was owned beneficially. Subscription and redemption activity by concentrated accounts may have a significant effect on the operations of the Fund. In the case of a large redemption, the Fund may be forced to sell investments at inopportune times, including its liquid or more liquid positions, resulting in Fund losses and the Fund holding a higher percentage of less liquid or illiquid securities. Large redemptions could result in decreased economies of scale and increased operating expenses for non-redeeming Fund shareholders.
Credit Risk
Credit risk is the risk that the value of debt securities in the Fund's portfolio may decline because the issuer may default and fail to pay interest or repay principal when due. Rating agencies assign credit ratings to debt securities to indicate their credit risk. Lower rated or unrated debt securities held by the Fund may present increased credit risk as compared to higher-rated debt securities.
Interest Rate Risk
Interest rate risk is the risk of losses attributable to changes in interest rates. In general, if prevailing interest rates rise, the values of debt securities tend to fall, and if interest rates fall, the values of debt securities tend to rise. Actions by governments and central banking authorities can result in increases in interest rates. Increasing interest rates may negatively affect the value of debt securities held by the Fund, resulting in a
Annual Report 2016
26
COLUMBIA AMT-FREE MARYLAND INTERMEDIATE MUNI BOND FUND
NOTES TO FINANCIAL STATEMENTS (continued)
April 30, 2016
negative impact on the Fund's performance and net asset value per share. In general, the longer the maturity or duration of a debt security, the greater its sensitivity to changes in interest rates.
Liquidity Risk
Liquidity risk is the risk associated with a lack of marketability of investments which may make it difficult to sell the investment at a desirable time or price. Changing regulatory, market or other conditions or environments (for example, the interest rate or credit environments) may adversely affect the liquidity of the Fund's investments. The Fund may have to accept a lower selling price for the holding, sell other investments, or forego another, more appealing investment opportunity. Generally, the less liquid the market at the time the Fund sells a portfolio investment, the greater the risk of loss or decline of value to the Fund. A less liquid market can lead to an increase in Fund redemptions, which may negatively impact Fund performance and net asset value per share, including, for example, if the Fund is forced to sell securities in a down market.
Geographic Concentration Risk
Because the Fund invests substantially in municipal securities issued by the state identified in the Fund's name and political sub-divisions of that state, the Fund will be particularly affected by adverse tax, legislative, regulatory, demographic or political changes as well as changes impacting the state's financial, economic or other condition and prospects. In addition, because of the relatively small number of issuers of tax-exempt securities in the state, the Fund may invest a higher percentage of assets in a single issuer and, therefore, be more exposed to the risk of loss than a fund that invests more broadly. The value of municipal and other securities owned by the Fund also may be adversely affected by future changes in federal or state income tax laws.
Non-Diversification Risk
A non-diversified fund is permitted to invest a greater percentage of its total assets in fewer issuers than a diversified fund. The Fund may, therefore, have a greater risk of loss from a few issuers than a similar fund that invests more broadly.
Note 8. Subsequent Events
Management has evaluated the events and transactions that have occurred through the date the financial statements were issued and noted no items requiring
adjustment of the financial statements or additional disclosure.
Note 9. Information Regarding Pending and Settled Legal Proceedings
In December 2005, without admitting or denying the allegations, American Express Financial Corporation (AEFC, which is now known as Ameriprise Financial, Inc. (Ameriprise Financial)) entered into settlement agreements with the Securities and Exchange Commission (SEC) and Minnesota Department of Commerce (MDOC) related to market timing activities. As a result, AEFC was censured and ordered to cease and desist from committing or causing any violations of certain provisions of the Investment Advisers Act of 1940, the Investment Company Act of 1940, and various Minnesota laws. AEFC agreed to pay disgorgement of $10 million and civil money penalties of $7 million. AEFC also agreed to retain an independent distribution consultant to assist in developing a plan for distribution of all disgorgement and civil penalties ordered by the SEC in accordance with various undertakings detailed at http://www.sec.gov/litigation/admin/ia-2451.pdf. Ameriprise Financial and its affiliates have cooperated with the SEC and the MDOC in these legal proceedings, and have made regular reports to the Funds' Boards of Trustees.
Ameriprise Financial and certain of its affiliates have historically been involved in a number of legal, arbitration and regulatory proceedings, including routine litigation, class actions, and governmental actions, concerning matters arising in connection with the conduct of their business activities. Ameriprise Financial believes that the Funds are not currently the subject of, and that neither Ameriprise Financial nor any of its affiliates are the subject of, any pending legal, arbitration or regulatory proceedings that are likely to have a material adverse effect on the Funds or the ability of Ameriprise Financial or its affiliates to perform under their contracts with the Funds. Ameriprise Financial is required to make quarterly (10-Q), annual (10-K) and, as necessary, 8-K filings with the SEC on legal and regulatory matters that relate to Ameriprise Financial and its affiliates. Copies of these filings may be obtained by accessing the SEC website at www.sec.gov.
There can be no assurance that these matters, or the adverse publicity associated with them, will not result in increased fund redemptions, reduced sale of fund shares or other adverse consequences to the Funds. Further, although we believe proceedings are not likely to have a material adverse effect on the Funds or the ability of
Annual Report 2016
27
COLUMBIA AMT-FREE MARYLAND INTERMEDIATE MUNI BOND FUND
NOTES TO FINANCIAL STATEMENTS (continued)
April 30, 2016
Ameriprise Financial or its affiliates to perform under their contracts with the Funds, these proceedings are subject to uncertainties and, as such, we are unable to estimate the possible loss or range of loss that may result. An adverse outcome in one or more of these proceedings could result in adverse judgments, settlements, fines, penalties or other relief that could have a material adverse effect on the consolidated financial condition or results of operations of Ameriprise Financial.
Annual Report 2016
28
COLUMBIA AMT-FREE MARYLAND INTERMEDIATE MUNI BOND FUND
REPORT OF INDEPENDENT REGISTERED PUBLIC ACCOUNTING FIRM
To the Trustees of Columbia Funds Series Trust and the Shareholders of
Columbia AMT-Free Maryland Intermediate Muni Bond Fund
In our opinion, the accompanying statement of assets and liabilities, including the portfolio of investments, and the related statements of operations and of changes in net assets and the financial highlights present fairly, in all material respects, the financial position of Columbia AMT-Free Maryland Intermediate Muni Bond Fund (the "Fund", a series of Columbia Funds Series Trust) at April 30, 2016, and the results of its operations, the changes in its net assets and the financial highlights for each of the periods indicated, in conformity with accounting principles generally accepted in the United States of America. These financial statements and financial highlights (hereafter referred to as "financial statements") are the responsibility of the Fund's management. Our responsibility is to express an opinion on these financial statements based on our audits. We conducted our audits of these financial statements in accordance with the standards of the Public Company Accounting Oversight Board (United States). Those standards require that we plan and perform the audit to obtain reasonable assurance about whether the financial statements are free of material misstatement. An audit includes examining, on a test basis, evidence supporting the amounts and disclosures in the financial statements, assessing the accounting principles used and significant estimates made by management, and evaluating the overall financial statement presentation. We believe that our audits, which included confirmation of securities at April 30, 2016 by correspondence with the custodian, provide a reasonable basis for our opinion.
PricewaterhouseCoopers LLP
Minneapolis, MN
June 21, 2016
Annual Report 2016
29
COLUMBIA AMT-FREE MARYLAND INTERMEDIATE MUNI BOND FUND
FEDERAL INCOME TAX INFORMATION
(Unaudited)
The Fund hereby designates the following tax attributes for the fiscal year ended April 30, 2016. Shareholders will be notified in early 2017 of the amounts for use in preparing 2016 income tax returns.
Tax Designations
Exempt-Interest Dividends | | | 99.41 | % | |
Exempt-Interest Dividends. The percentage of net investment income distributed during the fiscal year that qualifies as exempt-interest dividends for federal income tax purposes.
Annual Report 2016
30
COLUMBIA AMT-FREE MARYLAND INTERMEDIATE MUNI BOND FUND
Shareholders elect the Board that oversees the Fund's operations. The Board appoints officers who are responsible for day-to-day business decisions based on policies set by the Board. The following table provides basic biographical information about the Fund's Trustees, including their principal occupations during the past five years, although specific titles for individuals may have varied over the period. Under current Board policy, members generally may serve through the end of the calendar year in which they reach either the mandatory retirement age established by the Board or the fifteenth anniversary of the first Board meeting they attended as a member of the Board.
Trustees
Independent Trustees
Name,
Address,
Year of Birth | | Position Held With
the Funds and Length of
Service | | Principal Occupation(s)
During the Past Five Years
and Other Relevant
Professional Experience | | Number of
Funds in the
Columbia Funds
Complex
Overseen | | Other Directorships
Held by Trustee During
the Past Five Years | |
Kathleen Blatz
901 S. Marquette Ave.
Minneapolis, MN 55402
1954 | | Trustee since 1/06 for RiverSource Funds and since 6/11 for Nations Funds | | Attorney; specializing in arbitration and mediation; Chief Justice, Minnesota Supreme Court, 1998-2006; Associate Justice, Minnesota Supreme Court, 1996-1998; Fourth Judicial District Court Judge, Hennepin County, 1994-1996; Attorney in private practice and public service, 1984-1993; State Representative, Minnesota House of Representatives, 1979-1993, which included service on the Tax and Financial Institutions and Insurance Committees | | | 120 | | | Trustee, BlueCross BlueShield of Minnesota (Chair of the Business Development Committee) since 2009; Chair of the Robina Foundation since August 2013 | |
Edward J. Boudreau, Jr.
901 S. Marquette Ave. Minneapolis, MN 55402
1944 | | Trustee since 6/11 for RiverSource Funds and since 1/05 for Nations Funds | | Managing Director, E.J. Boudreau & Associates (consulting) since 2000; FINRA Industry Arbitrator, 2002-present; Chairman and Chief Executive Officer, John Hancock Funds (asset management), Chairman and Interested Trustee for open-end and closed-end funds offered by John Hancock, 1989-2000; John Hancock Life Insurance Company, including SVP and Treasurer and SVP Information Technology, 1968-1988 | | | 118 | | | Former Trustee, Boston Museum of Science (Chair of Finance Committee), 1985-2013; former Trustee, BofA Funds Series Trust (11 funds), 2005-2011 | |
Pamela G. Carlton
901 S. Marquette Ave.
Minneapolis, MN 55402
1954 | | Trustee since 7/07 for RiverSource Funds and since 6/11 for Nations Funds | | President, Springboard — Partners in Cross Cultural Leadership (consulting company) since 2003; Managing Director of US Equity Research, JP Morgan Chase, 1999-2003; Director of US Equity Research, Chase Asset Management, 1996-1999; Co-Director Latin America Research, 1993-1996, COO Global Research, 1992-1996, Co-Director of US Research, 1991-1992, Investment Banker, Morgan Stanley, 1982-1991 | | | 120 | | | Trustee, New York Presbyterian Hospital Board (Executive Committee and Chair of Human Resources Committee) since 1996 | |
Annual Report 2016
31
COLUMBIA AMT-FREE MARYLAND INTERMEDIATE MUNI BOND FUND
TRUSTEES AND OFFICERS (continued)
Independent Trustees (continued)
Name,
Address,
Year of Birth | | Position Held With
the Funds and Length of
Service | | Principal Occupation(s)
During the Past Five Years
and Other Relevant
Professional Experience | | Number of
Funds in the
Columbia Funds
Complex
Overseen | | Other Directorships
Held by Trustee During
the Past Five Years | |
William P. Carmichael
901 S. Marquette Ave. Minneapolis, MN 55402
1943 | | Trustee since 6/11 for RiverSource Funds and since 2003 for Nations Funds; Chair of the Board from 1/14-11/15 | | Retired; Co-founder, The Succession Fund (provides exit strategies to owners of privately held companies), 1998-2007; Adjunct Professor of Finance, Kelley School of Business, Indiana University, 1993-2007; Senior Vice President, Sara Lee Corporation, 1991-1993; Senior Vice President and Chief Financial Officer, Beatrice Foods Company, 1984-1990; Vice President, Esmark, Inc., 1973-1984; Associate, Price Waterhouse, 1968-1972 | | | 120 | | | Director, The Finish Line (athletic shoes and apparel) since July 2003; Director, International Textile Corp. since 2012; Director, hhgregg since May, 2015; former Director, Cobra Electronics Corporation (electronic equipment manufacturer), 1994-August 2014; former Director, Spectrum Brands, Inc. (consumer products), 2002-2009; former Director, Simmons Company (bedding), 2004-2010; former Trustee, BofA Funds Series Trust (11 funds), 2009-2011; former Director, McMoRan Exploration Company (oil and gas exploration and development), 2010-2013 | |
Patricia M. Flynn
901 S. Marquette Ave. Minneapolis, MN 55402
1950 | | Trustee since 11/04 for RiverSource Funds and since 6/11 for Nations Funds | | Trustee Professor of Economics and Management, Bentley University since 1976 (also teaches and conducts research on corporate governance); Dean, McCallum Graduate School of Business, Bentley University, 1992-2002 | | | 120 | | | Trustee, MA Taxpayers Foundation since 1997; Board of Governors, Innovation Institute, MA Technology Collaborative since 2010 | |
William A. Hawkins
901 S. Marquette Ave.
Minneapolis, MN 55402
1942 | | Chair of the Board since 11/15; Trustee since 6/11 for RiverSource Funds and since 1/05 for Nations Funds | | Managing Director, Overton Partners (financial consulting) since August 2010; President and Chief Executive Officer, California General Bank, N.A., January 2008-August 2010; Operation Hope, COO, 2004-2007; IndyMac Bancorp, President, CBG, 1999-2003; American General Bank, President, 1997-1999; Griffin Financial Services, CEO, 1981-1997; The Griffin Funds, CEO, 1992-1998 | | | 120 | | | Former Trustee, BofA Funds Series Trust (11 funds), 2009-2015 | |
R. Glenn Hilliard
901 S. Marquette Ave. Minneapolis, MN 55402
1943 | | Trustee since 6/11 for RiverSource Funds and since 1/05 for Nations Funds | | Chairman and Chief Executive Officer, Hilliard Group LLC (investing and consulting) since April 2003; Non-Executive Director & Chairman, CNO Financial Group, Inc. (insurance), 2003-2011; Chair & CEO, ING Americas, 1996-2003 | | | 118 | | | Chairman, BofA Funds Series Trust (11 funds); former Director, CNO Financial Group, Inc. (insurance), 2003-2011 | |
Annual Report 2016
32
COLUMBIA AMT-FREE MARYLAND INTERMEDIATE MUNI BOND FUND
TRUSTEES AND OFFICERS (continued)
Independent Trustees (continued)
Name,
Address,
Year of Birth | | Position Held With
the Funds and Length of
Service | | Principal Occupation(s)
During the Past Five Years
and Other Relevant
Professional Experience | | Number of
Funds in the
Columbia Funds
Complex
Overseen | | Other Directorships
Held by Trustee During
the Past Five Years | |
Catherine James Paglia
901 S. Marquette Ave.
Minneapolis, MN 55402
1952 | | Trustee since 11/04 for RiverSource Funds and since 6/11 for Nations Funds | | Director, Enterprise Asset Management, Inc. (private real estate and asset management company) since September 1998; Managing Director and Partner, Interlaken Capital, Inc., 1989-1997; Managing Director, Morgan Stanley, 1982-1989; Vice President, Investment Banking, 1980-1982, Associate, Investment Banking, 1976-1980, Dean Witter Reynolds, Inc. | | | 120 | | | Director, Valmont Industries, Inc. (irrigation systems manufacturer) since 2012; Trustee, Carleton College (on the Investment Committee); Trustee, Carnegie Endowment for International Peace (on the Investment Committee) | |
Leroy C. Richie
901 S. Marquette Ave.
Minneapolis, MN 55402
1941 | | Trustee since 2000 for Seligman Funds, since 11/08 for RiverSource Funds and since 6/11 for Nations Funds | | Counsel, Lewis & Munday, P.C. (law firm) since 2004; Vice President and General Counsel, Automotive Legal Affairs, Chrysler Corporation, 1993-1997 | | | 118 | | | Lead Outside Director, Infinity Resources, Inc. (oil and gas exploration and production) since 1994; Lead Outside Director, Digital Ally, Inc. (digital imaging) since September 2005; Trustee, Marygrove College (Chair of Finance Committee) since 2007; former Director, OGE Energy Corp. (energy and energy services), 2007-2014 | |
Minor M. Shaw
901 S. Marquette Ave.
Minneapolis, MN 55402
1947 | | Trustee since 6/11 for RiverSource Funds and since 2003 for Nations Funds | | President, Micco LLC (private investments) since 2011; President, Micco Corp. (family investment business), 1998-2011 | | | 120 | | | Director, Piedmont Natural Gas; Director, BlueCross BlueShield of South Carolina since April 2008; Chair of the Duke Endowment; Director, National Association of Corporate Directors, Carolinas Chapter since 2013; Chair of Greenville — Spartanburg Airport Commission; former Trustee, BofA Funds Series Trust (11 funds), 2003-2011 | |
Alison Taunton-Rigby
901 S. Marquette Ave.
Minneapolis, MN 55402
1944 | | Trustee since 11/02 for RiverSource Funds and since 6/11 for Nations Funds | | Managing Director, Forester Biotech (consulting), 2001-2003; Chief Executive Officer and Director, RiboNovix, Inc., (biotechnology), 2003-2010; President and Chief Executive Officer of CMT Inc., 2001-2003; Aquila Biopharmaceuticals Inc., 1996-2000; Cambridge Biotech Corporation, 1995-1996; Mitotix Inc., 1993-1994 | | | 120 | | | Director, Abt Associates
(government contractor) since 2001; Director, Boston Children's Hospital since 2002; Director, Healthways, Inc. (health and well-being solutions) since 2005; Director, ICI Mutual Insurance Company, since 2011 | |
Annual Report 2016
33
COLUMBIA AMT-FREE MARYLAND INTERMEDIATE MUNI BOND FUND
TRUSTEES AND OFFICERS (continued)
Interested Trustee Not Affiliated with Investment Manager*
Name,
Address,
Year of Birth | | Position Held With
Funds and Length of
Service | | Principal Occupation(s)
During Past Five Years
and Other Relevant
Professional Experience | | Number of
Funds in the
Fund Family
Overseen by
Board Member | | Other Present or Past
Directorships/
Trusteeships
(Within Past 5 Years) | |
Anthony M. Santomero
901 S. Marquette Ave.
Minneapolis, MN 55402
1946 | | Trustee since 6/11 for RiverSource Funds and since 1/08 for Nations Funds | | Richard K. Mellon Professor Emeritus of Finance, The Wharton School, University of Pennsylvania since 2002; Senior Advisor, McKinsey & Company (consulting), 2006-2008; President, Federal Reserve Bank of Philadelphia, 2000-2006; Professor of Finance, The Wharton School, University of Pennsylvania, 1972-2002 | | | 118 | | | Trustee, Penn Mutual Life Insurance Company since March 2008; Director, Renaissance Reinsurance Ltd. since May 2008; Director, Citigroup Inc. since 2009; Director, Citibank, N.A. since 2009; former Trustee, BofA Funds Series Trust (11 funds), 2008-2011 | |
* Dr. Santomero is not an affiliated person of the Investment Manager or Ameriprise Financial. However, he is currently deemed by the Funds to be an "interested person" (as defined in the 1940 Act) of the Funds because he serves as a Director of Citigroup Inc. and Citibank, N.A., companies that may directly or through subsidiaries and affiliates engage from time-to-time in brokerage execution, principal transactions and lending relationships with the Funds or accounts advised/managed by the Investment Manager.
Annual Report 2016
34
COLUMBIA AMT-FREE MARYLAND INTERMEDIATE MUNI BOND FUND
TRUSTEES AND OFFICERS (continued)
Interested Trustee Affiliated with Investment Manager*
Name,
Address,
Year of Birth | | Position Held With
the Funds and Length of
Service | | Principal Occupation(s)
During Past Five Years
and Other Relevant
Professional Experience | | Number of
Funds in the
Columbia Funds
Complex
Overseen | | Other Directorships
Held by Trustee During
the Past Five Years | |
William F. Truscott
c/o Columbia Management
Investment Advisers, LLC, 225 Franklin St.
Boston, MA 02110
1960 | | Trustee since 11/01 for RiverSource Funds and since 6/11 for Nations Funds; Senior Vice President since 2002 for RiverSource Funds and since 5/10 for Nations Funds | | Chairman of the Board and President, Columbia Management Investment Advisers, LLC since May 2010 and February 2012, respectively (previously President and Chief Investment Officer, 2001-April 2010); Chief Executive Officer, Global Asset Management, Ameriprise Financial, Inc. since September 2012 (previously Chief Executive Officer, U.S. Asset Management & President, Annuities, May 2010-September 2012 and President — U.S. Asset Management and Chief Investment Officer, 2005-April 2010); Director and Chief Executive Officer, Columbia Management Investment Distributors, Inc. since May 2010 and February 2012, respectively (previously Chairman of the Board and Chief Executive Officer, 2006-April 2010); Chairman of the Board and Chief Executive Officer, RiverSource Distributors, Inc. since 2006; Director, Threadneedle Asset Management Holdings, SARL since 2014; President and Chief Executive Officer, Ameriprise Certificate Company, 2006-August 2012. | | | 178 | | | Chairman of the Board, Columbia Management Investment Advisers, LLC since May 2010; Director, Columbia Management Investment Distributors, Inc. since May 2010; Former Director, Ameriprise Certificate Company, 2006-January 2013 | |
* Interested person (as defined under the 1940 Act) by reason of being an officer, director, security holder and/or employee of the Investment Manager or Ameriprise Financial.
The Statement of Additional Information has additional information about the Fund's Board members and is available, without charge, upon request by calling 800.345.6611; contacting your financial intermediary; or visiting columbiathreadneedle.com/us.
Annual Report 2016
35
COLUMBIA AMT-FREE MARYLAND INTERMEDIATE MUNI BOND FUND
TRUSTEES AND OFFICERS (continued)
The Board has appointed officers who are responsible for day-to-day business decisions based on policies it has established. The officers serve at the pleasure of the Board. The following table provides basic information about the Officers of the Fund, including principal occupations during the past five years, although their specific titles may have varied over the period. In addition to Mr. Truscott, who is Senior Vice President, the Fund's other officers are:
Fund Officers
Name,
Address and
Year of Birth | | Position and Year
First Appointed to
Position for any Fund
in the Columbia
Funds Complex or a
Predecessor Thereof | |
Principal Occupation(s) During Past Five Years | |
Christopher O. Petersen
5228 Ameriprise Financial
Center
Minneapolis, MN 55474
Born 1970 | | President and Principal Executive Officer (2015) | | Vice President and Lead Chief Counsel, Ameriprise Financial, Inc. since January 2015 (previously, Vice President and Chief Counsel January 2010-December 2014; and Vice President and Group Counsel or Counsel 2004-January 2010); officer of Columbia Funds and affiliated funds since 2007. | |
Michael G. Clarke
225 Franklin Street
Boston, MA 02110
Born 1969 | | Treasurer (2011), Chief Financial Officer (2009) and Chief Accounting Officer (2015) | | Vice President — Mutual Fund Administration, Columbia Management Investment Advisers, LLC, since May 2010; Managing Director of Fund Administration, Columbia Management Advisors, LLC, September 2004-April 2010; senior officer of Columbia Funds and affiliated funds since 2002. | |
Paul B. Goucher
100 Park Avenue
New York, NY 10017
Born 1968 | | Senior Vice President (2011), Chief Legal Officer (2015) and Assistant Secretary (2008) | | Vice President and Lead Chief Counsel, Ameriprise Financial, Inc. since November 2008 and January 2013, respectively (previously Chief Counsel, January 2010-January 2013 and Group Counsel, November 2008-January 2010). | |
Thomas P. McGuire
225 Franklin Street
Boston, MA 02110
Born 1972 | | Senior Vice President and Chief Compliance Officer (2012) | | Vice President — Asset Management Compliance, Ameriprise Financial, Inc., since May 2010; Chief Compliance Officer, Ameriprise Certificate Company since September 2010; Compliance Executive, Bank of America, 2005-April 2010. | |
Colin Moore
225 Franklin Street
Boston, MA 02110
Born 1958 | | Senior Vice President (2010) | | Executive Vice President and Global Chief Investment Officer, Ameriprise Financial, Inc., since July 2013; Director and Global Chief Investment Officer, Columbia Management Investment Advisers, LLC since May 2010; Manager, Managing Director and Chief Investment Officer, Columbia Management Advisors, LLC, 2007-April 2010. | |
Michael E. DeFao
225 Franklin Street
Boston, MA 02110
Born 1968 | | Vice President (2011) and Assistant Secretary (2010) | | Vice President and Chief Counsel, Ameriprise Financial, Inc. since May 2010; Associate General Counsel, Bank of America, 2005-April 2010. | |
Amy Johnson
5228 Ameriprise Financial
Center
Minneapolis, MN 55474
Born 1965 | | Vice President (2006) | | Managing Director and Chief Operating Officer, Columbia Management Investment Advisers, LLC since May 2010 (previously Chief Administrative Officer, 2009-April 2010, and Vice President — Asset Management and Trust Company Services, 2006-2009). | |
Lyn Kephart-Strong
5228 Ameriprise Financial Center
Minneapolis, MN 55474
Born 1960 | | Vice President (2015) | | President, Columbia Management Investment Services Corp. since October 2014; Vice President & Resolution Officer, Ameriprise Trust Company since August 2009; President, RiverSource Service Corporation 2004-2010. | |
Ryan C. Larrenaga
225 Franklin Street
Boston, MA 02110
Born 1970 | | Vice President and Secretary (2015) | | Vice President and Group Counsel, Ameriprise Financial, Inc. since August 2011 (previously, Counsel from May 2010 to August 2011); Assistant General Counsel, Bank of America, 2005-April 2010; officer of Columbia Funds and affiliated funds since 2005. | |
Annual Report 2016
36
COLUMBIA AMT-FREE MARYLAND INTERMEDIATE MUNI BOND FUND
IMPORTANT INFORMATION ABOUT THIS REPORT
Each fund mails one shareholder report to each shareholder address. If you would like more than one report, please call shareholder services at 800.345.6611 and additional reports will be sent to you.
The policy of the Board is to vote the proxies of the companies in which each fund holds investments consistent with the procedures as stated in the Statement of Additional Information (SAI). You may obtain a copy of the SAI without charge by calling 800.345.6611; contacting your financial intermediary; visiting columbiathreadneedle.com/us; or searching the website of the Securities and Exchange Commission (SEC) at sec.gov. Information regarding how each fund voted proxies relating to portfolio securities is filed with the SEC by August 31st for the most recent 12-month period ending June 30th of that year, and is available without charge by visiting columbiathreadneedle.com/us, or searching the website of the SEC at sec.gov.
Each fund files a complete schedule of portfolio holdings with the SEC for the first and third quarters of each fiscal year on Form N-Q. Each fund's Form N-Q is available on the SEC's website at sec.gov and may be reviewed and copied at the SEC's Public Reference Room in Washington, D.C. Information on the operation of the Public Reference Room may be obtained by calling 800.SEC.0330. Each fund's complete schedule of portfolio holdings, as filed on Form N-Q, can also be obtained without charge, upon request, by calling 800.345.6611.
Annual Report 2016
37
Columbia AMT-Free Maryland Intermediate Muni Bond Fund
P.O. Box 8081
Boston, MA 02266-8081

This information is for use with concurrent or prior delivery of a fund prospectus. Please read and consider the investment objectives, risks, charges and expenses for any fund carefully before investing. For a prospectus and summary prospectus, which contains this and other important information about the Fund, go to columbiathreadneedle.com/us. The Fund is distributed by Columbia Management Investment Distributors, Inc., member FINRA, and managed by Columbia Management Investment Advisers, LLC.
Columbia Threadneedle Investments (Columbia Threadneedle) is the global brand name of the Columbia and Threadneedle group of companies.
All rights reserved. Columbia Management Investment Distributors, Inc., 225 Franklin Street, Boston, MA 02110-2804
© 2016 Columbia Management Investment Advisers, LLC.
columbiathreadneedle.com/us
ANN190_04_F01_(06/16)

ANNUAL REPORT
April 30, 2016

COLUMBIA AMT-FREE SOUTH CAROLINA INTERMEDIATE MUNI BOND FUND

ABOUT COLUMBIA THREADNEEDLE INVESTMENTS
Columbia Threadneedle Investments is a leading global asset management group that provides a broad range of actively managed investment strategies and solutions for individual, institutional and corporate clients around the world.
With more than 2,000 people, including over 450 investment professionals based in North America, Europe and Asia, we manage $464 billion* of assets across developed and emerging market equities, fixed income, asset allocation solutions and alternatives. We are the 13th largest manager of long-term mutual fund assets in the U.S.** and the 3rd largest manager of retail funds in the U.K.***
Our priority is the investment success of our clients. We aim to deliver the investment outcomes they expect through an investment approach that is team-based, performance-driven and risk-aware. Our culture is dynamic and interactive. By sharing our insights across asset classes and geographies, we generate richer perspectives on global, regional and local investment landscapes. The ability to exchange and debate investment ideas in a collaborative environment enriches our teams' investment processes. More importantly, it results in better informed investment decisions for our clients.
Columbia funds are distributed by Columbia Management Investment Distributors, Inc., member FINRA, and managed by Columbia Management Investment Advisers, LLC.
Columbia Threadneedle Investments (Columbia Threadneedle) is the global brand name of the Columbia and Threadneedle group of companies.
* In U.S. dollars as of March 31, 2016. Source: Ameriprise Q1 Earnings Release. Includes all assets managed by entities in the Columbia and Threadneedle group of companies. Contact us for more current data.
** Source: ICI as of March 31, 2016 for Columbia Management Investment Advisers, LLC.
*** Source: Investment Association as of December 2015 for Threadneedle Asset Management Limited.
© 2016 Columbia Management Investment Advisers, LLC. All rights reserved.
Not part of the shareholder report
Investment strategies to help meet investor needs
We are committed to helping investors navigate financial challenges to reach their desired outcomes. The possibilities are endless.
Your success is our priority.
Retire comfortably
Fund college or higher education
Leave a legacy
Generate an appropriate stream of income in retirement
Traditional approaches to income may no longer be adequate — and they may no longer provide the diversification benefits they once did. Investors need to rethink how they generate retirement income.
Worried about running out of income? You are not alone.
Navigate a changing interest rate environment
Even in today's challenging interest rate environment, it's still possible to navigate markets and achieve your goals.
Make investment choices designed specifically for this market environment.
Maximize after-tax returns
In an environment where what you keep is more important than what you earn, municipal bonds can help mitigate higher taxes while providing attractive yields compared to other investment options.
You've worked too hard building your wealth to lose it to taxes.
Grow assets to achieve financial goals
Finding growth opportunities in today's complex market environment requires strong research capabilities, creative thinking and a disciplined approach.
Do your investments deliver the portfolio growth you need?
Ease the impact of volatile markets
With increasing concerns about market volatility, investors should consider diversifying their portfolios with non-traditional holdings.
Interested in turning volatility into opportunity?
To find out more, contact your financial professional, call 800.426.3750 or visit columbiathreadneedle.com/us
Not part of the shareholder report
 Dear Shareholders,
Volatility comes with the territory for long-term investors. Some investors instinctively want to pull out of the market or sell underperforming investments at the first sign of increased volatility or perhaps even as soon as they perceive it on the horizon. But taking yourself out of the market could mean losing out on potential opportunities, and putting your longer-term investment goals at risk.
Cumulative return is not just about achieving high returns when markets are going up; it's also about remaining invested and minimizing losses during weak or volatile markets so that you can participate on the upside. Developing a deeper understanding of the various risks your portfolio is subject to can help you balance these risks.
Diversification is critical in seeking to achieve that balance. We believe that most portfolios could be more effectively diversified either by introducing holdings with performance profiles unrelated to existing holdings (like alternative products) or by rebalancing existing holdings with an eye toward risk allocation. Over time, distributing risk more evenly may produce a more pronounced diversification benefit and may improve portfolio efficiency. We believe market volatility can create significant opportunities and, in fact, these periods may be some of the very best times to invest.
With this in mind, I thought it important to highlight excerpts from a piece written by Colin Moore, Global Chief Investment Officer, in which he touches on some of these issues emphasizing the importance of a properly constructed portfolio in seeking to effectively manage volatility and to achieve consistency of returns. I encourage you to read the article in its entirety. To access the full article and for other insights on current market, please visit blog.columbiathreadneedleus.com/latest-perspectives.
You need investments that are designed to help you ease the impact of volatile market environments and keep the savings you have worked tirelessly to amass. Columbia Threadneedle Investments provides investment solutions to help you tackle financial challenges and achieve your desired outcome.
Best regards,

Christopher O. Petersen
President, Columbia Funds
Excerpts from:
Taking the scare out of the volatility bogeyman
By Colin Moore, Global Chief Investment Officer
Colin Moore is the global chief investment officer for Columbia Threadneedle Investments. His responsibilities include ensuring that a disciplined investment process is in place across all asset classes, including equity and fixed income. Mr. Moore joined one of the Columbia Threadneedle Investments legacy firms in 2002 as head of equity and was also head of fixed income and liquidity strategies from 2009 – 2010.

n In today's low growth, higher volatility world, the emphasis is shifting from maximization of returns to consistency of returns.
PRESIDENT'S MESSAGE (continued)
n Portfolios should represent the behavioral risk-return tradeoff of investors, remembering that they won't stay invested to realize the return if we get the risk tolerance wrong.
n Holding long-term savings in cash to avoid volatility (the financial equivalent of hiding under the sheets) is detrimental to achieving long-term goals.
According to Wikipedia, "The bogeyman is a common allusion to a mythical creature in many cultures used to control behavior. This monster has no specific appearance, and conceptions about it can vary drastically from household to household within the same community; in many cases he has no set appearance in the mind of an adult or child, but is simply a non-specific embodiment of terror." Different cultures have different names and physical representations for the bogeyman, and investors are no different. We have terrible monsters that we fear may destroy our portfolios, and we call one of the scariest of them volatility.
While the bogeyman is mythical (I hope!), volatility is real and can cause serious damage. To understand why investors have such a hard time coping with volatility, we first need to define three cognitive biases at work in today's investment environment:
1) Recency bias — something that has recently come to the forefront of our attention, regardless of how long established it is, suddenly seems to appear with improbable frequency.
2) Negativity bias — we tend to have a greater recall of unpleasant memories than positive memories.
3) Loss aversion — our dissatisfaction with losing money tends to be greater than our satisfaction with making money.
The level of volatility varies dramatically, and so does investor fear and panic selling — waxing when volatility rises, waning when it falls. Recent studies have pointed to demographics as an important driver of panic selling. The theory is that as people get closer to retirement, the prospects of a large (20% – 30%) loss in financial assets can have a much more pronounced effect on their sense of well-being. Wealth preservation instincts kick in much more quickly than for younger (and typically less wealthy) savers.
The reality is that there is little opportunity for return without volatility. Therefore, the bogeyman effect of holding long-term savings in cash to avoid volatility (the financial equivalent of hiding under the sheets) is detrimental to achieving long-term goals. This effect tends to be more pronounced during the episodic spikes in volatility. The significant spike in volatility in 2008 and 2009 led to significant withdrawals from long-term investment funds over the same period. Less pronounced effects can also be seen when comparing 2001 – 2003 and 2011 – 2012. Conversely, flows picked up when volatility returned to "normal" levels. Investor behavior of this type is consistent with the three behavioral biases.
I believe average volatility will be higher over the next 10 years than the last 10 years and episodic spikes will increase in frequency because sustainable economic growth will be structurally lower and geopolitical risk higher than any time since World War II. Low growth creates uncertainty while loss aversion will make investors fear that we are one economic mishap or geopolitical event away from no growth or recession. The result will be higher volatility on average. Negativity bias will tend to exacerbate "spike" reactions to event-driven geopolitical news, and the volatility bogeyman will appear more often. Assuming the behavioral biases continue, investor returns are likely to be very disappointing regardless of the total return generated by financial markets due to the bogeyman effect.
To mitigate this effect, we need to focus on portfolio construction and an improved understanding of diversification. I accept that equities are likely to offer the highest return over the next 10 years, but they also offer the highest volatility. Many portfolio construction optimization tools use historical average volatility, which is likely to underestimate the volatility investors will face. The bogeyman emerges when individual asset class volatility spikes and cross correlations rise, the combination of which increases overall portfolio volatility far beyond expectation. Diversification is meant to protect investors against volatility, but what's the point of owning lots of investments if the volatility bogeyman has not been properly estimated?
Most importantly, portfolios should be constructed to properly represent the behavioral risk-return tradeoff of investors, remembering that they won't stay invested to realize the return if we get the risk tolerance wrong. In a low growth, higher volatility world, the emphasis is shifting to return consistency rather than return maximization,
PRESIDENT'S MESSAGE (continued)
and investors are best served through investment approaches that appreciate that distinction. Even though it's a permanent feature of financial markets, volatility is less likely to be the bogeyman we all fear if portfolios are constructed with this understanding.
Please visit blog.columbiathreadneedleus.com/latest-perspectives to read the entire article.
Investors should consider the investment objectives, risks, charges and expenses of a mutual fund carefully before investing. For a free prospectus and summary prospectus, which contains this and other important information about a fund, visit columbiathreadneedle.com/us. The prospectus should be read carefully before investing.
The views expressed are as of April 2016, may change as market or other conditions change, and may differ from views expressed by other Columbia Management Investment Advisers, LLC (CMIA) associates or affiliates. Actual investments or investment decisions made by CMIA and its affiliates, whether for its own account or on behalf of clients, will not necessarily reflect the views expressed. This information is not intended to provide investment advice and does not account for individual investor circumstances. Investment decisions should always be made based on an investor's specific financial needs, objectives, goals, time horizon and risk tolerance. Asset classes described may not be suitable for all investors.
Past performance does not guarantee future results, and no forecast should be considered a guarantee either. Since economic and market conditions change frequently, there can be no assurance that the trends described here will continue or that the forecasts are accurate.
Diversification does not guarantee a profit or protect against loss.
Columbia Funds are distributed by Columbia Management Investment Distributors, Inc., member FINRA, and managed by Columbia Management Investment Advisers, LLC.
© 2016 Columbia Management Investment Advisers, LLC. All rights reserved
COLUMBIA AMT-FREE SOUTH CAROLINA INTERMEDIATE MUNI BOND FUND
Performance Overview | | | 2 | | |
Manager Discussion of Fund Performance | | | 4 | | |
Understanding Your Fund's Expenses | | | 6 | | |
Portfolio of Investments | | | 7 | | |
Statement of Assets and Liabilities | | | 13 | | |
Statement of Operations | | | 15 | | |
Statement of Changes in Net Assets | | | 16 | | |
Financial Highlights | | | 18 | | |
Notes to Financial Statements | | | 23 | | |
Report of Independent Registered Public Accounting Firm | | | 29 | | |
Federal Income Tax Information | | | 30 | | |
Trustees and Officers | | | 31 | | |
Important Information About This Report | | | 37 | | |
Fund Investment Manager
Columbia Management Investment
Advisers, LLC
225 Franklin Street
Boston, MA 02110
Fund Distributor
Columbia Management Investment
Distributors, Inc.
225 Franklin Street
Boston, MA 02110
Fund Transfer Agent
Columbia Management Investment
Services Corp.
P.O. Box 8081
Boston, MA 02266-8081
For more information about any of the funds, please visit columbiathreadneedle.com/us or call 800.345.6611. Customer Service Representatives are available to answer your questions Monday through Friday from 8 a.m. to 7 p.m. Eastern time.
The views expressed in this report reflect the current views of the respective parties. These views are not guarantees of future performance and involve certain risks, uncertainties and assumptions that are difficult to predict, so actual outcomes and results may differ significantly from the views expressed. These views are subject to change at any time based upon economic, market or other conditions and the respective parties disclaim any responsibility to update such views. These views may not be relied on as investment advice and, because investment decisions for a Columbia fund are based on numerous factors, may not be relied on as an indication of trading intent on behalf of any particular Columbia fund. References to specific securities should not be construed as a recommendation or investment advice.
COLUMBIA AMT-FREE SOUTH CAROLINA INTERMEDIATE MUNI BOND FUND
Performance Summary
n Columbia AMT-Free South Carolina Intermediate Muni Bond Fund (the Fund) Class A shares returned 4.33% excluding sales charges for the 12-month period that ended April 30, 2016. Class Z shares of the Fund returned 4.69% for the same time period.
n The Fund underperformed its benchmark, the Barclays 3-15 Year Blend Municipal Bond Index, which returned 4.86% during the 12-month period.
n The Fund was helped by its underweight positions in higher quality issues, as well as its overweight in A-rated bonds.
Average Annual Total Returns (%) (for period ended April 30, 2016)
| | | Inception | | 1 Year | | 5 Years | | 10 Years | |
Class A | | 05/05/92 | | | | | | | |
Excluding sales charges | | | | | 4.33 | | | | 3.85 | | | | 3.84 | | |
Including sales charges | | | | | 1.23 | | | | 3.21 | | | | 3.52 | | |
Class B | | 06/08/93 | | | | | | | |
Excluding sales charges | | | | | 3.55 | | | | 3.09 | | | | 3.07 | | |
Including sales charges | | | | | 0.55 | | | | 3.09 | | | | 3.07 | | |
Class C | | 06/17/92 | | | | | | | |
Excluding sales charges | | | | | 3.65 | | | | 3.07 | | | | 3.06 | | |
Including sales charges | | | | | 2.65 | | | | 3.07 | | | | 3.06 | | |
Class R4* | | 03/19/13 | | | 4.59 | | | | 4.10 | | | | 4.09 | | |
Class Z | | 01/06/92 | | | 4.69 | | | | 4.12 | | | | 4.10 | | |
Barclays 3-15 Year Blend Municipal Bond Index | | | | | 4.86 | | | | 4.61 | | | | 4.89 | | |
Returns for Class A are shown with and without the maximum initial sales charge of 3.00%. Returns for Class B are shown with and without the applicable contingent deferred sales charge (CDSC) of 3.00% in the first year, declining to 1.00% in the fourth year and eliminated thereafter. Returns for Class C are shown with and without the 1.00% CDSC for the first year only. The Fund's other classes are not subject to sales charges and have limited eligibility. Please see the Fund's prospectus for details. Performance for different share classes will vary based on differences in sales charges and fees associated with each class. All results shown assume reinvestment of distributions during the period. Returns do not reflect the deduction of taxes that a shareholder may pay on Fund distributions or on the redemption of Fund shares. Performance results reflect the effect of any fee waivers or reimbursements of Fund expenses by Columbia Management Investment Advisers, LLC and/or any of its affiliates. Absent these fee waivers or expense reimbursement arrangements, performance results would have been lower.
The performance information shown represents past performance and is not a guarantee of future results. The investment return and principal value of your investment will fluctuate so that your shares, when redeemed, may be worth more or less than their original cost. Current performance may be lower or higher than the performance information shown. You may obtain performance information current to the most recent month-end by contacting your financial intermediary, visiting columbiathreadneedle.com/us or calling 800.345.6611.
*The returns shown for periods prior to the share class inception date (including returns for the Life of the Fund, if shown, which are since Fund inception) include the returns of the Fund's oldest share class. These returns are adjusted to reflect any higher class-related operating expenses of the newer share classes, as applicable. Please visit columbiathreadneedle.com/us/investment-products/mutual-funds/appended-performance for more information.
The Barclays 3-15 Year Blend Municipal Bond Index is an unmanaged index that tracks the performance of municipal bonds issued after December 31, 1990, with remaining maturities between 2 and 17 years and at least $7 million in principal amount outstanding.
Indices are not available for investment, are not professionally managed and do not reflect sales charges, fees, brokerage commissions, taxes or other expenses of investing. Securities in the Fund may not match those in an index.
Annual Report 2016
2
COLUMBIA AMT-FREE SOUTH CAROLINA INTERMEDIATE MUNI BOND FUND
PERFORMANCE OVERVIEW (continued)
Performance of a Hypothetical $10,000 Investment (May 1, 2006 – April 30, 2016)

The chart above shows the change in value of a hypothetical $10,000 investment in Class A shares of Columbia AMT-Free South Carolina Intermediate Muni Bond Fund during the stated time period, and does not reflect the deduction of taxes that a shareholder may pay on Fund distributions or on the redemption of Fund shares.
Annual Report 2016
3
COLUMBIA AMT-FREE SOUTH CAROLINA INTERMEDIATE MUNI BOND FUND
MANAGER DISCUSSION OF FUND PERFORMANCE
Portfolio Management
Brian McGreevy
Quality Breakdown (%)
(at April 30, 2016) | |
AAA rating | | | 6.5 | | |
AA rating | | | 35.7 | | |
A rating | | | 51.5 | | |
BBB rating | | | 2.2 | | |
BB rating | | | 0.7 | | |
Not rated | | | 3.4 | | |
Total | | | 100.0 | | |
Percentages indicated are based upon total fixed income investments (excluding Money Market Funds).
Bond ratings apply to the underlying holdings of the Fund and not the Fund itself and are divided into categories ranging from highest to lowest credit quality, determined by using the middle rating of Moody's, S&P and Fitch, after dropping the highest and lowest available ratings. When ratings are available from only two rating agencies, the lower rating is used. When a rating is available from only one rating agency, that rating is used. When a bond is not rated by any rating agency, it is designated as "Not rated." Credit quality ratings assigned by a rating agency are subjective opinions, not statements of fact, and are subject to change, including daily. The ratings assigned by credit rating agencies are but one of the considerations that the Investment Manager and/or Fund's subadviser incorporates into its credit analysis process, along with such other issuer-specific factors as cash flows, capital structure and leverage ratios, ability to de-leverage (repay) through free cash flow, quality of management, market positioning and access to capital, as well as such security-specific factors as the terms of the security (e.g., interest rate and time to maturity) and the amount and type of any collateral.
For the 12-month period that ended April 30, 2016, the Fund's Class A shares returned 4.33% (excluding sales charges), and its Class Z shares returned 4.69%. The Fund underperformed its benchmark, the Barclays 3-15 Year Blend Municipal Bond Index, which returned 4.86%. The Fund was helped by its underweight positions in higher quality issues, as well as its overweight in A-rated bonds.
Market Overview
The U.S. municipal bond market produced a positive return and outperformed U.S. Treasuries during the reporting period, thanks in part to a highly favorable balance of supply and demand. Mutual fund cash flows provided a steady source of support for the market, with positive inflows for 30 consecutive weeks as of the close of the period. In the interval from October 2015 through April 2016 alone, inflows into municipal funds totaled over $27 billion. Insurance companies and banks were active buyers, as well. Supply was also strong, but almost half of the new issuance came from refunding deals — rather than new issuance — as issuers sought to take advantage of the cost savings from refinancing older, higher coupon debt. The refinancing activity added an additional layer of demand since many of the refundings were of currently callable bonds issued in 2005 or 2006. As a result, many investors who were taken out of older bonds reinvested the proceeds back into the market.
The strength of state and local finances throughout the United States, with the notable exceptions of New Jersey, Illinois, the City of Chicago, and Puerto Rico, further aided the performance of municipal bonds. Longer term securities generally provided superior returns versus shorter term issues, reflecting the latter category's low nominal yields. Lower quality bonds outpaced their higher quality counterparts, as investors' hearty appetite for risk fueled a continued reach for yield.
South Carolina's Municipal Market Outperformed
Although its pace of growth slowed somewhat in the second half of the period, South Carolina's economy exhibited strength relative to the nation as a whole. The combination of improving conditions in the manufacturing, aerospace, and tourism industries, together with meaningful population expansion, led to above-average income growth and robust new home construction. Additionally, the state's business-friendly policies remain a steady source of support for its economy. These favorable trends were reflected in the relative performance of South Carolina's municipal bond market, which outpaced the broad-based, national indices.
Contributors and Detractors
The Fund finished with a return close to that of the benchmark, reflecting the fact that its duration (interest-rate sensitivity) and positioning along the yield curve were in line with the benchmark. The Fund did have exposure to very short maturities, which was a drag on results, but our allocation in the 12- to 17-year space outperformed the benchmark due to the longer call structure and longer duration of our holdings. The Fund had an overweight position in bonds with calls between 10 and 15 years, which further aided relative performance. In addition, Fund returns were
Annual Report 2016
4
COLUMBIA AMT-FREE SOUTH CAROLINA INTERMEDIATE MUNI BOND FUND
MANAGER DISCUSSION OF FUND PERFORMANCE (continued)
helped by an underweight in the three highest rating categories (AAA, AA1, AA2) — a positive given that higher quality debt lagged. The Fund had an overweight to A-rated issues, which generated solid returns above those of the benchmark.
The Fund was significantly underweight in state and local general obligation bonds, but our overall positioning added value since the Fund was overweight in some of the better performing sectors within the two groups. The Fund's allocation to pre-refunded issues, which are largely shorter maturity bonds that did not benefit in the rally, detracted from performance. The portfolio's weighting in pre-refunded bonds increased during the period, a shift that was a result of increased refunding volumes in South Carolina rather than an active management decision on our part.
On a sector basis, education and lease revenue bonds were the Fund's best performers. The hospital sector was a weaker performer, but this was due more to its shorter average maturities rather than any credit concerns. Our positions in the special-tax sector outperformed, while water and sewer issues lagged.
Fund Positioning
We adopted a more cautious approach near the end of the period in response to the tightening of credit spreads, the improvement in municipal yields relative to U.S. Treasuries, and the flattening of the yield curve. Accordingly, we became more selective with respect to lower rated securities in the investment-grade space. The yield curve was steep and attractive in spots near the end of the period, and we saw value in bonds with maturities in the 10-year area. We also identified value in lower coupon issues, such as those in the 4% range (as opposed to the 5% coupons that generally dominate the market). Since these securities continued to trade at premiums, we believe there is some protection from the adverse tax consequences associated with investments in discount bonds. In terms of sectors, we added to schools, transportation, electric power and water and sewer issues, with the majority of our new holdings coming from the A and AA rating categories.
Investment Risks
Fixed-income securities present issuer default risk. The Fund invests substantially in municipal securities and will be affected by tax, legislative, regulatory, demographic or political changes, as well as changes impacting a state's financial, economic or other conditions. A relatively small number of tax-exempt issuers may necessitate the Fund investing more heavily in a single issuer and, therefore, be more exposed to the risk of loss than a fund that invests more broadly. The value of the Fund's portfolio may be more volatile than a more geographically diversified fund. Prepayment and extension risk exists as a loan, bond or other investment may be called, prepaid or redeemed before maturity and that similar yielding investments may not be available for purchase. A rise in interest rates may result in a price decline of fixed-income instruments held by the Fund, negatively impacting its performance and NAV. Falling rates may result in the Fund investing in lower yielding debt instruments, lowering the Fund's income and yield. These risks may be heightened for longer maturity and duration securities. Non-investment-grade (high-yield or junk) securities present greater price volatility and more risk to principal and income than higher rated securities. Market risk may affect a single issuer, sector of the economy, industry or the market as a whole. Federal and state tax rules apply to capital gain distributions and any gains or losses on sales. Income may be subject to state or local taxes. Liquidity risk is associated with the difficulty of selling underlying investments at a desirable time or price. See the Fund's prospectus for information on these and other risks.
Annual Report 2016
5
COLUMBIA AMT-FREE SOUTH CAROLINA INTERMEDIATE MUNI BOND FUND
UNDERSTANDING YOUR FUND'S EXPENSES
(Unaudited)
As an investor, you incur two types of costs. There are transaction costs, which generally include sales charges on purchases and may include redemption fees. There are also ongoing costs, which generally include management fees, distribution and/or service fees, and other fund expenses. The following information is intended to help you understand your ongoing costs (in dollars) of investing in the Fund and to help you compare these costs with the ongoing costs of investing in other mutual funds.
Analyzing Your Fund's Expenses
To illustrate these ongoing costs, we have provided examples and calculated the expenses paid by investors in each share class of the Fund during the period. The actual and hypothetical information in the table is based on an initial investment of $1,000 at the beginning of the period indicated and held for the entire period. Expense information is calculated two ways and each method provides you with different information. The amount listed in the "Actual" column is calculated using the Fund's actual operating expenses and total return for the period. You may use the Actual information, together with the amount invested, to estimate the expenses that you paid over the period. Simply divide your account value by $1,000 (for example, an $8,600 account value divided by $1,000 = 8.6), then multiply the results by the expenses paid during the period under the "Actual" column. The amount listed in the "Hypothetical" column assumes a 5% annual rate of return before expenses (which is not the Fund's actual return) and then applies the Fund's actual expense ratio for the period to the hypothetical return. You should not use the hypothetical account values and expenses to estimate either your actual account balance at the end of the period or the expenses you paid during the period. See "Compare With Other Funds" below for details on how to use the hypothetical data.
Compare With Other Funds
Since all mutual funds are required to include the same hypothetical calculations about expenses in shareholder reports, you can use this information to compare the ongoing cost of investing in the Fund with other funds. To do so, compare the hypothetical example with the 5% hypothetical examples that appear in the shareholder reports of other funds. As you compare hypothetical examples of other funds, it is important to note that hypothetical examples are meant to highlight the ongoing costs of investing in a fund only and do not reflect any transaction costs, such as sales charges, or redemption or exchange fees. Therefore, the hypothetical calculations are useful in comparing ongoing costs only, and will not help you determine the relative total costs of owning different funds. If transaction costs were included in these calculations, your costs would be higher.
November 1, 2015 – April 30, 2016
| | | Account Value at the Beginning
of the Period ($) | | Account Value at the End of the
Period ($) | | Expenses Paid During the
Period ($) | | Fund's Annualized
Expense Ratio (%) | |
| | | Actual | | Hypothetical | | Actual | | Hypothetical | | Actual | | Hypothetical | | Actual | |
Class A | | | 1,000.00 | | | | 1,000.00 | | | | 1,030.00 | | | | 1,020.84 | | | | 4.09 | | | | 4.07 | | | | 0.81 | | |
Class B | | | 1,000.00 | | | | 1,000.00 | | | | 1,026.20 | | | | 1,017.11 | | | | 7.86 | | | | 7.82 | | | | 1.56 | | |
Class C | | | 1,000.00 | | | | 1,000.00 | | | | 1,027.20 | | | | 1,017.11 | | | | 7.86 | | | | 7.82 | | | | 1.56 | | |
Class R4 | | | 1,000.00 | | | | 1,000.00 | | | | 1,031.30 | | | | 1,022.08 | | | | 2.83 | | | | 2.82 | | | | 0.56 | | |
Class Z | | | 1,000.00 | | | | 1,000.00 | | | | 1,032.30 | | | | 1,022.08 | | | | 2.83 | | | | 2.82 | | | | 0.56 | | |
Expenses paid during the period are equal to the annualized expense ratio for each class as indicated above, multiplied by the average account value over the period and then multiplied by the number of days in the Fund's most recent fiscal half year and divided by 366.
Expenses do not include fees and expenses incurred indirectly by the Fund from its investment in underlying funds, including affiliated and non-affiliated pooled investment vehicles, such as mutual funds and exchange-traded funds.
Had Columbia Management Investment Advisers, LLC and/or certain of its affiliates not waived/reimbursed certain fees and expenses, account value at the end of the period would have been reduced.
Annual Report 2016
6
COLUMBIA AMT-FREE SOUTH CAROLINA INTERMEDIATE MUNI BOND FUND
PORTFOLIO OF INVESTMENTS
April 30, 2016
(Percentages represent value of investments compared to net assets)
Municipal Bonds 95.3%
Issue
Description | | Coupon
Rate | | Principal
Amount ($) | | Value ($) | |
AIRPORT 1.9% | |
County of Horry Airport
Revenue Bonds
Series 2010A
07/01/18 | | | 5.000 | % | | | 1,315,000 | | | | 1,422,107 | | |
07/01/20 | | | 5.000 | % | | | 1,150,000 | | | | 1,309,171 | | |
Total | | | | | | | 2,731,278 | | |
HIGHER EDUCATION 6.0% | |
Clemson University
Revenue Bonds
Athletic Facility
Series 2014A
05/01/28 | | | 5.000 | % | | | 1,170,000 | | | | 1,453,959 | | |
Coastal Carolina University
Revenue Bonds
Series 2015
06/01/24 | | | 5.000 | % | | | 1,500,000 | | | | 1,868,745 | | |
South Carolina Jobs-Economic Development Authority
Refunding Revenue Bonds
Furman University
Series 2015
10/01/32 | | | 5.000 | % | | | 1,895,000 | | | | 2,258,897 | | |
University of South Carolina
Revenue Bonds
Moore School of Business Project
Series 2012
05/01/26 | | | 5.000 | % | | | 1,500,000 | | | | 1,784,655 | | |
Series 2008A (AGM)
06/01/21 | | | 5.000 | % | | | 1,060,000 | | | | 1,148,976 | | |
Total | | | | | | | 8,515,232 | | |
HOSPITAL 13.5% | |
County of Florence
Refunding Revenue Bonds
McLeod Regional Medical Center Project
Series 2014
11/01/31 | | | 5.000 | % | | | 1,500,000 | | | | 1,786,995 | | |
County of Greenwood
Refunding Revenue Bonds
Self Regional Healthcare
Series 2012B
10/01/27 | | | 5.000 | % | | | 1,750,000 | | | | 2,008,352 | | |
10/01/31 | | | 5.000 | % | | | 2,000,000 | | | | 2,253,660 | | |
Greenville Health System
Refunding Revenue Bonds
Series 2008A
05/01/21 | | | 5.250 | % | | | 2,750,000 | | | | 2,980,340 | | |
Lexington County Health Services District, Inc.
Refunding Revenue Bonds
Series 2007
11/01/17 | | | 5.000 | % | | | 1,230,000 | | | | 1,306,961 | | |
11/01/18 | | | 5.000 | % | | | 1,000,000 | | | | 1,064,700 | | |
Municipal Bonds (continued)
Issue
Description | | Coupon
Rate | | Principal
Amount ($) | | Value ($) | |
South Carolina Jobs-Economic Development Authority
Refunding Revenue Bonds
Anmed Health Project
Series 2010
02/01/17 | | | 5.000 | % | | | 500,000 | | | | 515,240 | | |
Palmetto Health
Series 2005A (AGM)
08/01/21 | | | 5.250 | % | | | 3,000,000 | | | | 3,269,880 | | |
Revenue Bonds
Bon Secours Health System, Inc.
Series 2013
11/01/20 | | | 5.000 | % | | | 2,000,000 | | | | 2,325,020 | | |
11/01/24 | | | 5.000 | % | | | 450,000 | | | | 538,736 | | |
Spartanburg Regional Health Services District
Revenue Bonds
Series 2008A
04/15/19 | | | 5.000 | % | | | 1,225,000 | | | | 1,320,734 | | |
Total | | | | | | | 19,370,618 | | |
JOINT POWER AUTHORITY 6.1% | |
Piedmont Municipal Power Agency
Refunding Revenue Bonds
Series 2008A-3 (AGM)
01/01/18 | | | 5.000 | % | | | 3,050,000 | | | | 3,258,620 | | |
South Carolina State Public Service Authority
Refunding Revenue Bonds
Series 2014B
12/01/32 | | | 5.000 | % | | | 1,250,000 | | | | 1,482,575 | | |
Series 2016A
12/01/28 | | | 5.000 | % | | | 2,000,000 | | | | 2,488,120 | | |
Unrefunded Revenue Bonds
Series 2009A
01/01/28 | | | 5.000 | % | | | 1,360,000 | | | | 1,495,864 | | |
Total | | | | | | | 8,725,179 | | |
LOCAL APPROPRIATION 22.4% | |
Berkeley County School District
Refunding Revenue Bonds
Securing Assets for Education
Series 2015A
12/01/27 | | | 5.000 | % | | | 1,500,000 | | | | 1,827,450 | | |
Charleston Educational Excellence Finance Corp.
Refunding Revenue Bonds
Charleston County School
Series 2013
12/01/25 | | | 5.000 | % | | | 2,000,000 | | | | 2,485,020 | | |
Charleston Public Facilities Corp.
Revenue Bonds
Series 2015A
09/01/29 | | | 5.000 | % | | | 1,000,000 | | | | 1,224,460 | | |
The accompanying Notes to Financial Statements are an integral part of this statement.
Annual Report 2016
7
COLUMBIA AMT-FREE SOUTH CAROLINA INTERMEDIATE MUNI BOND FUND
PORTFOLIO OF INVESTMENTS (continued)
April 30, 2016
Municipal Bonds (continued)
Issue
Description | | Coupon
Rate | | Principal
Amount ($) | | Value ($) | |
City of Florence Accomodations Fee
Revenue Bonds
Series 2015
05/01/30 | | | 4.000 | % | | | 1,000,000 | | | | 1,120,860 | | |
05/01/35 | | | 5.000 | % | | | 1,000,000 | | | | 1,167,980 | | |
City of North Charleston
Revenue Bonds
Series 2012
06/01/29 | | | 5.000 | % | | | 2,280,000 | | | | 2,650,842 | | |
County of Florence
Revenue Bonds
Series 2015
10/01/28 | | | 5.000 | % | | | 1,000,000 | | | | 1,190,380 | | |
Dorchester County School District No. 2
Refunding Revenue Bonds
Growth Installment Purchase
Series 2013
12/01/27 | | | 5.000 | % | | | 1,000,000 | | | | 1,198,170 | | |
Fort Mill School Facilities Corp.
Refunding Revenue Bonds
Fort Mills School District #4
Series 2015
12/01/28 | | | 5.000 | % | | | 1,000,000 | | | | 1,209,720 | | |
Greenwood Fifty Schools Facilities, Inc.
Refunding Revenue Bonds
Greenwood School District #50
Series 2016 (BAM)
12/01/27 | | | 5.000 | % | | | 1,750,000 | | | | 2,165,223 | | |
Kershaw County School District
Refunding Revenue Bonds
Series 2015
12/01/25 | | | 5.000 | % | | | 1,000,000 | | | | 1,230,880 | | |
Lexington One School Facilities Corp.
Refunding Revenue Bonds
Lexington County School District
Series 2015
12/01/26 | | | 5.000 | % | | | 835,000 | | | | 1,034,807 | | |
Lexington School District No. 2 Educational Facilities Corp.
Refunding Revenue Bonds
Series 2015B
12/01/26 | | | 5.000 | % | | | 1,815,000 | | | | 2,211,069 | | |
Newberry Investing in Children's Education
Refunding Revenue Bonds
Newberry County School District
Series 2014
12/01/29 | | | 5.000 | % | | | 1,500,000 | | | | 1,796,325 | | |
SCAGO Educational Facilities Corp for Calhoun School District
Refunding Revenue Bonds
Series 2015 (BAM)
12/01/26 | | | 5.000 | % | | | 520,000 | | | | 644,602 | | |
Municipal Bonds (continued)
Issue
Description | | Coupon
Rate | | Principal
Amount ($) | | Value ($) | |
SCAGO Educational Facilities Corp. for Cherokee School
District No. 1 Refunding Revenue Bonds
Series 2015
12/01/28 | | | 5.000 | % | | | 1,830,000 | | | | 2,200,539 | | |
SCAGO Educational Facilities Corp. for Colleton School
District Refunding Revenue Bonds
Series 2015
12/01/27 | | | 5.000 | % | | | 1,295,000 | | | | 1,553,909 | | |
SCAGO Educational Facilities Corp. for Pickens School
District Refunding Revenue Bonds
Series 2015
12/01/29 | | | 5.000 | % | | | 1,500,000 | | | | 1,795,515 | | |
12/01/30 | | | 5.000 | % | | | 1,275,000 | | | | 1,520,310 | | |
Sumter Two School Facilities, Inc.
Refunding Revenue Bonds
Sumter County School District No. 2
Series 2016 (BAM)
12/01/27 | | | 5.000 | % | | | 1,500,000 | | | | 1,813,185 | | |
Total | | | | | | | 32,041,246 | | |
LOCAL GENERAL OBLIGATION 1.8% | |
Beaufort County School District
Unlimited General Obligation Bonds
Series 2014B
03/01/23 | | | 5.000 | % | | | 1,190,000 | | | | 1,470,376 | | |
South Carolina Jobs-Economic Development Authority
Refunding Revenue Bonds
Series 2015
04/01/34 | | | 5.000 | % | | | 940,000 | | | | 1,111,202 | | |
Total | | | | | | | 2,581,578 | | |
MUNICIPAL POWER 2.3% | |
City of Rock Hill Combined Utility System
Refunding Revenue Bonds
Series 2012A (AGM)
01/01/23 | | | 5.000 | % | | | 1,560,000 | | | | 1,856,728 | | |
Easley Combined Utility System
Refunding Revenue Bonds
Series 2011 (AGM)
12/01/28 | | | 5.000 | % | | | 1,000,000 | | | | 1,095,020 | | |
Guam Power Authority
Refunding Revenue Bonds
Series 2012A (AGM)(a)
10/01/24 | | | 5.000 | % | | | 315,000 | | | | 380,863 | | |
Total | | | | | | | 3,332,611 | | |
PORTS 0.8% | |
South Carolina Ports Authority
Revenue Bonds
Series 2010
07/01/23 | | | 5.250 | % | | | 1,000,000 | | | | 1,159,890 | | |
The accompanying Notes to Financial Statements are an integral part of this statement.
Annual Report 2016
8
COLUMBIA AMT-FREE SOUTH CAROLINA INTERMEDIATE MUNI BOND FUND
PORTFOLIO OF INVESTMENTS (continued)
April 30, 2016
Municipal Bonds (continued)
Issue
Description | | Coupon
Rate | | Principal
Amount ($) | | Value ($) | |
PREP SCHOOL 1.1% | |
South Carolina Jobs-Economic Development Authority
Revenue Bonds
York Preparatory Academy Project
Series 2014A
11/01/33 | | | 7.000 | % | | | 500,000 | | | | 555,425 | | |
South Carolina Jobs-Economic Development Authority(b)
Revenue Bonds
Series 2015A
08/15/35 | | | 5.125 | % | | | 1,000,000 | | | | 1,022,660 | | |
Total | | | | | | | 1,578,085 | | |
REFUNDED / ESCROWED 10.1% | |
Berkeley County School District
Prerefunded 12/01/16 Revenue Bonds
Securing Assets for Education
Series 2006
12/01/22 | | | 5.000 | % | | | 1,000,000 | | | | 1,025,870 | | |
City of Charleston Waterworks & Sewer System
Prerefunded 01/01/19 Revenue Bonds
Series 2009A
01/01/21 | | | 5.000 | % | | | 2,500,000 | | | | 2,778,425 | | |
County of Charleston
Prerefunded 08/01/19 Unlimited General Obligation
Bonds Improvement
Series 2009A
08/01/23 | | | 5.000 | % | | | 2,000,000 | | | | 2,265,340 | | |
SCAGO Educational Facilities Corp. for Pickens School
District Prerefunded 12/01/16 Revenue Bonds
Pickens County Project
Series 2006 (AGM)
12/01/23 | | | 5.000 | % | | | 3,000,000 | | | | 3,077,130 | | |
South Carolina Jobs-Economic Development Authority
Prerefunded 09/15/18 Revenue Bonds
Kershaw County Medical Center Project
Series 2008
09/15/25 | | | 5.500 | % | | | 1,925,000 | | | | 2,138,790 | | |
South Carolina State Public Service Authority
Prerefunded 01/01/19 Revenue Bonds
Series 2009A
01/01/28 | | | 5.000 | % | | | 640,000 | | | | 711,642 | | |
Series 2009B
01/01/24 | | | 5.000 | % | | | 1,250,000 | | | | 1,389,213 | | |
Sumter Two School Facilities, Inc.
Refunding Revenue Bonds
Sumter County School District No. 2
Series 2007 Escrowed to Maturity
12/01/17 | | | 5.000 | % | | | 1,000,000 | | | | 1,067,650 | | |
Total | | | | | | | 14,454,060 | | |
Municipal Bonds (continued)
Issue
Description | | Coupon
Rate | | Principal
Amount ($) | | Value ($) | |
RESOURCE RECOVERY 2.0% | |
Three Rivers Solid Waste Authority(c)
Revenue Bonds
Capital Appreciation-Landfill Gas Project
Series 2007
10/01/24 | | | 0.000 | % | | | 1,835,000 | | | | 1,488,222 | | |
10/01/25 | | | 0.000 | % | | | 1,835,000 | | | | 1,425,905 | | |
Total | | | | | | | 2,914,127 | | |
RETIREMENT COMMUNITIES 2.4% | |
South Carolina Jobs-Economic Development Authority
Refunding Revenue Bonds
1st Mortgage-Lutheran Homes
Series 2007
05/01/16 | | | 5.000 | % | | | 1,245,000 | | | | 1,245,199 | | |
05/01/21 | | | 5.375 | % | | | 1,650,000 | | | | 1,686,713 | | |
1st Mortgage-Wesley Commons
Series 2006
10/01/36 | | | 5.300 | % | | | 500,000 | | | | 501,135 | | |
Total | | | | | | | 3,433,047 | | |
SINGLE FAMILY 0.3% | |
South Carolina State Housing Finance & Development
Authority Revenue Bonds
Series 2010-1 (GNMA)
01/01/28 | | | 5.000 | % | | | 350,000 | | | | 370,937 | | |
SPECIAL NON PROPERTY TAX 5.9% | |
City of Columbia
Revenue Bonds
Series 2014
02/01/33 | | | 5.000 | % | | | 1,195,000 | | | | 1,427,631 | | |
City of Greenville Hospitality Tax
Improvement Refunding Revenue Bonds
Series 2011 (AGM)
04/01/21 | | | 5.000 | % | | | 1,290,000 | | | | 1,505,133 | | |
City of Myrtle Beach
Revenue Bonds
Hospitality Fee
Series 2014B
06/01/30 | | | 5.000 | % | | | 560,000 | | | | 658,431 | | |
City of Rock Hill
Revenue Bonds
Hospitality Fee Pledge
Series 2013
04/01/23 | | | 5.000 | % | | | 695,000 | | | | 840,276 | | |
Greenville County Public Facilities Corp.
Refunding Certificate of Participation
Series 2014
04/01/26 | | | 5.000 | % | | | 890,000 | | | | 1,078,556 | | |
The accompanying Notes to Financial Statements are an integral part of this statement.
Annual Report 2016
9
COLUMBIA AMT-FREE SOUTH CAROLINA INTERMEDIATE MUNI BOND FUND
PORTFOLIO OF INVESTMENTS (continued)
April 30, 2016
Municipal Bonds (continued)
Issue
Description | | Coupon
Rate | | Principal
Amount ($) | | Value ($) | |
Territory of Guam
Revenue Bonds
Series 2011A(a)
01/01/31 | | | 5.000 | % | | | 400,000 | | | | 449,412 | | |
Town of Hilton Head Island
Revenue Bonds
Series 2011A
06/01/23 | | | 5.000 | % | | | 555,000 | | | | 660,794 | | |
06/01/24 | | | 5.000 | % | | | 580,000 | | | | 685,206 | | |
Virgin Islands Public Finance Authority
Revenue Bonds
Matching Fund Loan Notes-Senior Lien
Series 2010A(a)
10/01/25 | | | 5.000 | % | | | 1,060,000 | | | | 1,185,345 | | |
Total | | | | | | | 8,490,784 | | |
STATE GENERAL OBLIGATION 0.9% | |
State of South Carolina
Unlimited General Obligation Bonds
Series 2014B
04/01/25 | | | 5.000 | % | | | 1,000,000 | | | | 1,261,170 | | |
STUDENT LOAN 1.2% | |
South Carolina State Education Assistance Authority
Revenue Bonds
Student Loan
Series 2009I
10/01/24 | | | 5.000 | % | | | 1,615,000 | | | | 1,751,435 | | |
TRANSPORTATION 5.8% | |
South Carolina Transportation Infrastructure Bank
Refunding Revenue Bonds
Infrastructure Bank
Series 2015A
10/01/24 | | | 5.000 | % | | | 2,000,000 | | | | 2,518,520 | | |
Series 2005A (AMBAC)
10/01/20 | | | 5.250 | % | | | 4,880,000 | | | | 5,747,078 | | |
Total | | | | | | | 8,265,598 | | |
WATER & SEWER 10.8% | |
Anderson Regional Joint Water System
Refunding Revenue Bonds
Series 2012
07/15/28 | | | 5.000 | % | | | 2,000,000 | | | | 2,341,420 | | |
Municipal Bonds (continued)
Issue
Description | | Coupon
Rate | | Principal
Amount ($) | | Value ($) | |
Beaufort-Jasper Water & Sewer Authority
Unrefunded Revenue Bonds
Series 2006 (AGM)
03/01/23 | | | 5.000 | % | | | 1,080,000 | | | | 1,130,544 | | |
03/01/25 | | | 4.750 | % | | | 2,160,000 | | | | 2,255,062 | | |
Beaufort-Jasper Water & Sewer Authority(d)
Refunding Revenue Bonds
Series 2016B
03/01/24 | | | 5.000 | % | | | 1,000,000 | | | | 1,201,270 | | |
City of Columbia Waterworks & Sewer System
Refunding Revenue Bonds
Series 2011A
02/01/27 | | | 5.000 | % | | | 1,000,000 | | | | 1,161,670 | | |
City of Sumter Waterworks & Sewer System
Refunding Revenue Bonds
Series 2015
12/01/27 | | | 4.000 | % | | | 400,000 | | | | 462,400 | | |
County of Berkeley Water & Sewer
Refunding Revenue Bonds
Series 2008A (AGM)
06/01/21 | | | 5.000 | % | | | 1,000,000 | | | | 1,085,250 | | |
Georgetown County Water & Sewer District
Refunding Revenue Bonds
Series 2015
06/01/27 | | | 4.000 | % | | | 450,000 | | | | 512,685 | | |
Renewable Water Resources
Refunding Revenue Bonds
Series 2005B (AGM)
03/01/19 | | | 5.250 | % | | | 1,000,000 | | | | 1,119,960 | | |
Series 2010A
01/01/20 | | | 5.000 | % | | | 1,500,000 | | | | 1,708,215 | | |
Series 2012
01/01/24 | | | 5.000 | % | | | 1,000,000 | | | | 1,205,930 | | |
Spartanburg Sanitation Sewer District
Refunding Revenue Bonds
Series 2014B
03/01/34 | | | 5.000 | % | | | 1,000,000 | | | | 1,184,930 | | |
Total | | | | | | | 15,369,336 | | |
Total Municipal Bonds
(Cost: $127,597,895) | | | | | | | 136,346,211 | | |
Total Investments
(Cost: $127,597,895) | | | | | | | 136,346,211 | | |
Other Assets & Liabilities, Net | | | | | | | 6,660,698 | | |
Net Assets | | | | | | | 143,006,909 | | |
Notes to Portfolio of Investments
(a) Municipal obligations include debt obligations issued by or on behalf of territories, possessions, or sovereign nations within the territorial boundaries of the United States. At April 30, 2016, the value of these securities amounted to $2,015,620 or 1.41% of net assets.
The accompanying Notes to Financial Statements are an integral part of this statement.
Annual Report 2016
10
COLUMBIA AMT-FREE SOUTH CAROLINA INTERMEDIATE MUNI BOND FUND
PORTFOLIO OF INVESTMENTS (continued)
April 30, 2016
Notes to Portfolio of Investments (continued)
(b) Represents privately placed and other securities and instruments exempt from SEC registration (collectively, private placements), such as Section 4(a)(2) and Rule 144A eligible securities, which are often sold only to qualified institutional buyers. The Fund may invest in private placements determined to be liquid as well as those determined to be illiquid. Private placements may be determined to be liquid under guidelines established by the Fund's Board of Trustees. At April 30, 2016, the value of these securities amounted to $1,022,660 or 0.72% of net assets.
(c) Zero coupon bond.
(d) Security, or a portion thereof, has been purchased on a when-issued or delayed delivery basis.
Abbreviation Legend
AGM Assured Guaranty Municipal Corporation
AMBAC Ambac Assurance Corporation
BAM Build America Mutual Assurance Co.
GNMA Government National Mortgage Association
Fair Value Measurements
The Fund categorizes its fair value measurements according to a three-level hierarchy that maximizes the use of observable inputs and minimizes the use of unobservable inputs by prioritizing that the most observable input be used when available. Observable inputs are those that market participants would use in pricing an investment based on market data obtained from sources independent of the reporting entity. Unobservable inputs are those that reflect the Fund's assumptions about the information market participants would use in pricing an investment. An investment's level within the fair value hierarchy is based on the lowest level of any input that is deemed significant to the asset's or liability's fair value measurement. The input levels are not necessarily an indication of the risk or liquidity associated with investments at that level. For example, certain U.S. government securities are generally high quality and liquid, however, they are reflected as Level 2 because the inputs used to determine fair value may not always be quoted prices in an active market.
Fair value inputs are summarized in the three broad levels listed below:
> Level 1 — Valuations based on quoted prices for investments in active markets that the Fund has the ability to access at the measurement date (including NAV for open-end mutual funds). Valuation adjustments are not applied to Level 1 investments.
> Level 2 — Valuations based on other significant observable inputs (including quoted prices for similar securities, interest rates, prepayment speeds, credit risks, etc.).
> Level 3 — Valuations based on significant unobservable inputs (including the Fund's own assumptions and judgment in determining the fair value of investments).
Inputs that are used in determining fair value of an investment may include price information, credit data, volatility statistics, and other factors. These inputs can be either observable or unobservable. The availability of observable inputs can vary between investments, and is affected by various factors such as the type of investment, and the volume and level of activity for that investment or similar investments in the marketplace. The inputs will be considered by the Investment Manager, along with any other relevant factors in the calculation of an investment's fair value. The Fund uses prices and inputs that are current as of the measurement date, which may include periods of market dislocations. During these periods, the availability of prices and inputs may be reduced for many investments. This condition could cause an investment to be reclassified between the various levels within the hierarchy.
Investments falling into the Level 3 category are primarily supported by quoted prices from brokers and dealers participating in the market for those investments. However, these may be classified as Level 3 investments due to lack of market transparency and corroboration to support these quoted prices. Additionally, valuation models may be used as the pricing source for any remaining investments classified as Level 3. These models may rely on one or more significant unobservable inputs and/or significant assumptions by the Investment Manager. Inputs used in valuations may include, but are not limited to, financial statement analysis, capital account balances, discount rates and estimated cash flows, and comparable company data.
Under the direction of the Fund's Board of Trustees (the Board), the Investment Manager's Valuation Committee (the Committee) is responsible for overseeing the valuation procedures approved by the Board. The Committee consists of voting and non-voting members from various groups within the Investment Manager's organization, including operations and accounting, trading and investments, compliance, risk management and legal.
The Committee meets at least monthly to review and approve valuation matters, which may include a description of specific valuation determinations, data regarding pricing information received from approved pricing vendors and brokers and the results of Board-approved valuation control policies and procedures (the Policies). The Policies address, among other things, instances when market quotations are or are not readily available, including recommendations of third party pricing vendors and a determination of appropriate pricing methodologies; events that require specific valuation determinations and assessment of fair value techniques; securities with a potential for stale pricing,
The accompanying Notes to Financial Statements are an integral part of this statement.
Annual Report 2016
11
COLUMBIA AMT-FREE SOUTH CAROLINA INTERMEDIATE MUNI BOND FUND
PORTFOLIO OF INVESTMENTS (continued)
April 30, 2016
Fair Value Measurements (continued)
including those that are illiquid, restricted, or in default; and the effectiveness of third party pricing vendors, including periodic reviews of vendors. The Committee meets more frequently, as needed, to discuss additional valuation matters, which may include the need to review back-testing results, review time-sensitive information or approve related valuation actions. The Committee reports to the Board, with members of the Committee meeting with the Board at each of its regularly scheduled meetings to discuss valuation matters and actions during the period, similar to those described earlier.
For investments categorized as Level 3, the Committee monitors information similar to that described above, which may include: (i) data specific to the issuer or comparable issuers, (ii) general market or specific sector news and (iii) quoted prices and specific or similar security transactions. The Committee considers this data and any changes from prior periods in order to assess the reasonableness of observable and unobservable inputs, any assumptions or internal models used to value those securities and changes in fair value. This data is also used to corroborate, when available, information received from approved pricing vendors and brokers. Various factors impact the frequency of monitoring this information (which may occur as often as daily). However, the Committee may determine that changes to inputs, assumptions and models are not required as a result of the monitoring procedures performed.
The following table is a summary of the inputs used to value the Fund's investments at April 30, 2016:
| | | Level 1
Quoted Prices in Active
Markets for Identical
Assets ($) | | Level 2
Other Significant
Observable Inputs ($) | | Level 3
Significant
Unobservable Inputs ($) | | Total ($) | |
Investments | |
Municipal Bonds | | | — | | | | 136,346,211 | | | | — | | | | 136,346,211 | | |
Total Investments | | | — | | | | 136,346,211 | | | | — | | | | 136,346,211 | | |
See the Portfolio of Investments for all investment classifications not indicated in the table.
The Fund's assets assigned to the Level 2 input category are generally valued using the market approach, in which a security's value is determined through reference to prices and information from market transactions for similar or identical assets.
There were no transfers of financial assets between levels during the period.
The accompanying Notes to Financial Statements are an integral part of this statement.
Annual Report 2016
12
COLUMBIA AMT-FREE SOUTH CAROLINA INTERMEDIATE MUNI BOND FUND
STATEMENT OF ASSETS AND LIABILITIES
April 30, 2016
Assets | |
Investments, at value | |
(identified cost $127,597,895) | | $ | 136,346,211 | | |
Cash | | | 6,207,222 | | |
Receivable for: | |
Investments sold | | | 10,167 | | |
Capital shares sold | | | 550,959 | | |
Interest | | | 1,709,681 | | |
Expense reimbursement due from Investment Manager | | | 652 | | |
Prepaid expenses | | | 700 | | |
Other assets | | | 3,719 | | |
Total assets | | | 144,829,311 | | |
Liabilities | |
Payable for: | |
Investments purchased on a delayed delivery basis | | | 1,165,940 | | |
Capital shares purchased | | | 127,442 | | |
Dividend distributions to shareholders | | | 356,656 | | |
Investment management fees | | | 1,830 | | |
Distribution and/or service fees | | | 561 | | |
Transfer agent fees | | | 25,060 | | |
Compensation of board members | | | 114,085 | | |
Other expenses | | | 30,828 | | |
Total liabilities | | | 1,822,402 | | |
Net assets applicable to outstanding capital stock | | $ | 143,006,909 | | |
Represented by | |
Paid-in capital | | $ | 133,405,271 | | |
Undistributed net investment income | | | 785,348 | | |
Accumulated net realized gain | | | 67,974 | | |
Unrealized appreciation (depreciation) on: | |
Investments | | | 8,748,316 | | |
Total — representing net assets applicable to outstanding capital stock | | $ | 143,006,909 | | |
The accompanying Notes to Financial Statements are an integral part of this statement.
Annual Report 2016
13
COLUMBIA AMT-FREE SOUTH CAROLINA INTERMEDIATE MUNI BOND FUND
STATEMENT OF ASSETS AND LIABILITIES (continued)
April 30, 2016
Class A | |
Net assets | | $ | 21,972,102 | | |
Shares outstanding | | | 2,082,530 | | |
Net asset value per share | | $ | 10.55 | | |
Maximum offering price per share(a) | | $ | 10.88 | | |
Class B | |
Net assets | | $ | 26,582 | | |
Shares outstanding | | | 2,517 | | |
Net asset value per share | | $ | 10.56 | | |
Class C | |
Net assets | | $ | 15,050,996 | | |
Shares outstanding | | | 1,425,531 | | |
Net asset value per share | | $ | 10.56 | | |
Class R4 | |
Net assets | | $ | 757,551 | | |
Shares outstanding | | | 71,845 | | |
Net asset value per share | | $ | 10.54 | | |
Class Z | |
Net assets | | $ | 105,199,678 | | |
Shares outstanding | | | 9,966,405 | | |
Net asset value per share | | $ | 10.56 | | |
(a) The maximum offering price per share is calculated by dividing the net asset value per share by 1.0 minus the maximum sales charge of 3.00%.
The accompanying Notes to Financial Statements are an integral part of this statement.
Annual Report 2016
14
COLUMBIA AMT-FREE SOUTH CAROLINA INTERMEDIATE MUNI BOND FUND
STATEMENT OF OPERATIONS
Year Ended April 30, 2016
Net investment income | |
Income: | |
Interest | | $ | 4,712,972 | | |
Total income | | | 4,712,972 | | |
Expenses: | |
Investment management fees | | | 635,248 | | |
Distribution and/or service fees | |
Class A | | | 54,379 | | |
Class B | | | 263 | | |
Class C | | | 153,416 | | |
Transfer agent fees | |
Class A | | | 42,857 | | |
Class B | | | 51 | | |
Class C | | | 30,207 | | |
Class R4 | | | 1,387 | | |
Class Z | | | 191,397 | | |
Compensation of board members | | | 9,249 | | |
Custodian fees | | | 2,178 | | |
Printing and postage fees | | | 20,062 | | |
Registration fees | | | 18,986 | | |
Audit fees | | | 27,051 | | |
Legal fees | | | 7,538 | | |
Other | | | 11,776 | | |
Total expenses | | | 1,206,045 | | |
Fees waived or expenses reimbursed by Investment Manager and its affiliates | | | (242,847 | ) | |
Total net expenses | | | 963,198 | | |
Net investment income | | | 3,749,774 | | |
Realized and unrealized gain (loss) — net | |
Net realized gain (loss) on: | |
Investments | | | 170,726 | | |
Net realized gain | | | 170,726 | | |
Net change in unrealized appreciation (depreciation) on: | |
Investments | | | 2,064,400 | | |
Net change in unrealized appreciation | | | 2,064,400 | | |
Net realized and unrealized gain | | | 2,235,126 | | |
Net increase in net assets resulting from operations | | $ | 5,984,900 | | |
The accompanying Notes to Financial Statements are an integral part of this statement.
Annual Report 2016
15
COLUMBIA AMT-FREE SOUTH CAROLINA INTERMEDIATE MUNI BOND FUND
STATEMENT OF CHANGES IN NET ASSETS
| | | Year Ended
April 30,
2016 | | Year Ended
April 30,
2015 | |
Operations | |
Net investment income | | $ | 3,749,774 | | | $ | 3,669,396 | | |
Net realized gain | | | 170,726 | | | | 1,177,178 | | |
Net change in unrealized appreciation (depreciation) | | | 2,064,400 | | | | (1,287,146 | ) | |
Net increase in net assets resulting from operations | | | 5,984,900 | | | | 3,559,428 | | |
Distributions to shareholders | |
Net investment income | |
Class A | | | (630,209 | ) | | | (658,269 | ) | |
Class B | | | (569 | ) | | | (469 | ) | |
Class C | | | (330,101 | ) | | | (304,726 | ) | |
Class R4 | | | (22,150 | ) | | | (22,206 | ) | |
Class Z | | | (3,077,712 | ) | | | (2,683,726 | ) | |
Net realized gains | |
Class A | | | (61,950 | ) | | | (152,738 | ) | |
Class B | | | (88 | ) | | | (123 | ) | |
Class C | | | (45,331 | ) | | | (92,934 | ) | |
Class R4 | | | (2,241 | ) | | | (4,860 | ) | |
Class Z | | | (299,932 | ) | | | (522,659 | ) | |
Total distributions to shareholders | | | (4,470,283 | ) | | | (4,442,710 | ) | |
Increase in net assets from capital stock activity | | | 6,420,711 | | | | 11,769,274 | | |
Total increase in net assets | | | 7,935,328 | | | | 10,885,992 | | |
Net assets at beginning of year | | | 135,071,581 | | | | 124,185,589 | | |
Net assets at end of year | | $ | 143,006,909 | | | $ | 135,071,581 | | |
Undistributed net investment income | | $ | 785,348 | | | $ | 1,096,315 | | |
The accompanying Notes to Financial Statements are an integral part of this statement.
Annual Report 2016
16
COLUMBIA AMT-FREE SOUTH CAROLINA INTERMEDIATE MUNI BOND FUND
STATEMENT OF CHANGES IN NET ASSETS (continued)
| | | Year Ended April 30, 2016 | | Year Ended April 30, 2015 | |
| | | Shares | | Dollars ($) | | Shares | | Dollars ($) | |
Capital stock activity | |
Class A shares | |
Subscriptions(a) | | | 357,593 | | | | 3,737,566 | | | | 521,276 | | | | 5,498,534 | | |
Distributions reinvested | | | 50,887 | | | | 531,090 | | | | 58,334 | | | | 614,589 | | |
Redemptions | | | (623,214 | ) | | | (6,479,638 | ) | | | (349,709 | ) | | | (3,681,579 | ) | |
Net increase (decrease) | | | (214,734 | ) | | | (2,210,982 | ) | | | 229,901 | | | | 2,431,544 | | |
Class B shares | |
Subscriptions | | | 964 | | | | 10,000 | | | | — | | | | — | | |
Distributions reinvested | | | 38 | | | | 394 | | | | 41 | | | | 434 | | |
Redemptions(a) | | | (353 | ) | | | (3,708 | ) | | | (506 | ) | | | (5,352 | ) | |
Net increase (decrease) | | | 649 | | | | 6,686 | | | | (465 | ) | | | (4,918 | ) | |
Class C shares | |
Subscriptions | | | 169,657 | | | | 1,773,712 | | | | 368,504 | | | | 3,888,533 | | |
Distributions reinvested | | | 26,528 | | | | 277,060 | | | | 26,324 | | | | 277,418 | | |
Redemptions | | | (271,758 | ) | | | (2,839,168 | ) | | | (214,770 | ) | | | (2,262,894 | ) | |
Net increase (decrease) | | | (75,573 | ) | | | (788,396 | ) | | | 180,058 | | | | 1,903,057 | | |
Class R4 shares | |
Subscriptions | | | 31,036 | | | | 324,428 | | | | 21,378 | | | | 224,983 | | |
Distributions reinvested | | | 2,306 | | | | 24,045 | | | | 2,534 | | | | 26,687 | | |
Redemptions | | | (28,857 | ) | | | (300,827 | ) | | | (14,167 | ) | | | (148,643 | ) | |
Net increase | | | 4,485 | | | | 47,646 | | | | 9,745 | | | | 103,027 | | |
Class Z shares | |
Subscriptions | | | 2,706,901 | | | | 28,314,343 | | | | 2,504,284 | | | | 26,481,416 | | |
Distributions reinvested | | | 40,913 | | | | 427,277 | | | | 40,482 | | | | 426,727 | | |
Redemptions | | | (1,850,539 | ) | | | (19,375,863 | ) | | | (1,856,834 | ) | | | (19,571,579 | ) | |
Net increase | | | 897,275 | | | | 9,365,757 | | | | 687,932 | | | | 7,336,564 | | |
Total net increase | | | 612,102 | | | | 6,420,711 | | | | 1,107,171 | | | | 11,769,274 | | |
(a) Includes conversions of Class B shares to Class A shares, if any.
The accompanying Notes to Financial Statements are an integral part of this statement.
Annual Report 2016
17
COLUMBIA AMT-FREE SOUTH CAROLINA INTERMEDIATE MUNI BOND FUND
The following tables are intended to help you understand the Fund's financial performance. Certain information reflects financial results for a single share of a class held for the periods shown. Per share net investment income (loss) amounts are calculated based on average shares outstanding during the period. Total return assumes reinvestment of all dividends and distributions, if any. Total return does not reflect payment of sales charges, if any. Total return and portfolio turnover are not annualized for periods of less than one year. The portfolio turnover rate is calculated without regard to purchase and sales transactions of short-term instruments and certain derivatives, if any. If such transactions were included, the Fund's portfolio turnover rate may be higher.
| | | Year Ended April 30, | | Year Ended
March 31, | |
Class A | | 2016 | | 2015 | | 2014 | | 2013 | | 2012(a) | | 2012 | |
Per share data | |
Net asset value, beginning of period | | $ | 10.44 | | | $ | 10.49 | | | $ | 10.89 | | | $ | 10.74 | | | $ | 10.64 | | | $ | 10.08 | | |
Income from investment operations: | |
Net investment income | | | 0.28 | | | | 0.30 | | | | 0.32 | | | | 0.30 | | | | 0.03 | | | | 0.33 | | |
Net realized and unrealized gain (loss) | | | 0.16 | | | | 0.02 | (b) | | | (0.40 | ) | | | 0.15 | | | | 0.10 | | | | 0.56 | | |
Total from investment operations | | | 0.44 | | | | 0.32 | | | | (0.08 | ) | | | 0.45 | | | | 0.13 | | | | 0.89 | | |
Less distributions to shareholders: | |
Net investment income | | | (0.30 | ) | | | (0.30 | ) | | | (0.31 | ) | | | (0.30 | ) | | | (0.03 | ) | | | (0.33 | ) | |
Net realized gains | | | (0.03 | ) | | | (0.07 | ) | | | (0.01 | ) | | | — | | | | — | | | | — | | |
Total distributions to shareholders | | | (0.33 | ) | | | (0.37 | ) | | | (0.32 | ) | | | (0.30 | ) | | | (0.03 | ) | | | (0.33 | ) | |
Net asset value, end of period | | $ | 10.55 | | | $ | 10.44 | | | $ | 10.49 | | | $ | 10.89 | | | $ | 10.74 | | | $ | 10.64 | | |
Total return | | | 4.33 | % | | | 3.05 | % | | | (0.66 | %) | | | 4.28 | % | | | 1.18 | % | | | 8.97 | % | |
Ratios to average net assets(c) | |
Total gross expenses | | | 0.99 | % | | | 1.00 | % | | | 1.01 | % | | | 0.97 | % | | | 0.99 | %(d) | | | 1.04 | % | |
Total net expenses(e) | | | 0.81 | % | | | 0.81 | % | | | 0.81 | % | | | 0.81 | %(f) | | | 0.79 | %(d) | | | 0.79 | %(f) | |
Net investment income | | | 2.69 | % | | | 2.85 | % | | | 3.02 | % | | | 2.81 | % | | | 2.95 | %(d) | | | 3.16 | % | |
Supplemental data | |
Net assets, end of period (in thousands) | | $ | 21,972 | | | $ | 23,975 | | | $ | 21,694 | | | $ | 27,743 | | | $ | 24,707 | | | $ | 24,748 | | |
Portfolio turnover | | | 16 | % | | | 16 | % | | | 6 | % | | | 14 | % | | | 0 | % | | | 9 | % | |
Notes to Financial Highlights
(a) For the period from April 1, 2012 to April 30, 2012. During the period, the Fund's fiscal year end was changed from March 31 to April 30.
(b) Calculation of the net gain (loss) per share (both realized and unrealized) does not correlate to the aggregate realized and unrealized gain (loss) presented in the Statement of Operations due to the timing of subscriptions and redemptions of Fund shares in relation to fluctuations in the market value of the portfolio.
(c) In addition to the fees and expenses that the Fund bears directly, the Fund indirectly bears a pro rata share of the fees and expenses of any other funds in which it invests. Such indirect expenses are not included in the Fund's reported expense ratios.
(d) Annualized.
(e) Total net expenses include the impact of certain fee waivers/expense reimbursements made by the Investment Manager and certain of its affiliates, if applicable.
(f) The benefits derived from expense reductions had an impact of less than 0.01%.
The accompanying Notes to Financial Statements are an integral part of this statement.
Annual Report 2016
18
COLUMBIA AMT-FREE SOUTH CAROLINA INTERMEDIATE MUNI BOND FUND
FINANCIAL HIGHLIGHTS (continued)
| | | Year Ended April 30, | | Year Ended
March 31, | |
Class B | | 2016 | | 2015 | | 2014 | | 2013 | | 2012(a) | | 2012 | |
Per share data | |
Net asset value, beginning of period | | $ | 10.45 | | | $ | 10.50 | | | $ | 10.89 | | | $ | 10.75 | | | $ | 10.65 | | | $ | 10.08 | | |
Income from investment operations: | |
Net investment income | | | 0.20 | | | | 0.22 | | | | 0.24 | | | | 0.22 | | | | 0.02 | | | | 0.25 | | |
Net realized and unrealized gain (loss) | | | 0.17 | | | | 0.02 | (b) | | | (0.39 | ) | | | 0.14 | | | | 0.10 | | | | 0.58 | | |
Total from investment operations | | | 0.37 | | | | 0.24 | | | | (0.15 | ) | | | 0.36 | | | | 0.12 | | | | 0.83 | | |
Less distributions to shareholders: | |
Net investment income | | | (0.23 | ) | | | (0.22 | ) | | | (0.23 | ) | | | (0.22 | ) | | | (0.02 | ) | | | (0.26 | ) | |
Net realized gains | | | (0.03 | ) | | | (0.07 | ) | | | (0.01 | ) | | | — | | | | — | | | | — | | |
Total distributions to shareholders | | | (0.26 | ) | | | (0.29 | ) | | | (0.24 | ) | | | (0.22 | ) | | | (0.02 | ) | | | (0.26 | ) | |
Net asset value, end of period | | $ | 10.56 | | | $ | 10.45 | | | $ | 10.50 | | | $ | 10.89 | | | $ | 10.75 | | | $ | 10.65 | | |
Total return | | | 3.55 | % | | | 2.27 | % | | | (1.31 | %) | | | 3.41 | % | | | 1.12 | % | | | 8.25 | % | |
Ratios to average net assets(c) | |
Total gross expenses | | | 1.74 | % | | | 1.75 | % | | | 1.76 | % | | | 1.72 | % | | | 1.74 | %(d) | | | 1.84 | % | |
Total net expenses(e) | | | 1.56 | % | | | 1.56 | % | | | 1.56 | % | | | 1.55 | %(f) | | | 1.54 | %(d) | | | 1.54 | %(f) | |
Net investment income | | | 1.93 | % | | | 2.11 | % | | | 2.29 | % | | | 2.07 | % | | | 2.20 | %(d) | | | 2.43 | % | |
Supplemental data | |
Net assets, end of period (in thousands) | | $ | 27 | | | $ | 20 | | | $ | 24 | | | $ | 113 | | | $ | 155 | | | $ | 154 | | |
Portfolio turnover | | | 16 | % | | | 16 | % | | | 6 | % | | | 14 | % | | | 0 | % | | | 9 | % | |
Notes to Financial Highlights
(a) For the period from April 1, 2012 to April 30, 2012. During the period, the Fund's fiscal year end was changed from March 31 to April 30.
(b) Calculation of the net gain (loss) per share (both realized and unrealized) does not correlate to the aggregate realized and unrealized gain (loss) presented in the Statement of Operations due to the timing of subscriptions and redemptions of Fund shares in relation to fluctuations in the market value of the portfolio.
(c) In addition to the fees and expenses that the Fund bears directly, the Fund indirectly bears a pro rata share of the fees and expenses of any other funds in which it invests. Such indirect expenses are not included in the Fund's reported expense ratios.
(d) Annualized.
(e) Total net expenses include the impact of certain fee waivers/expense reimbursements made by the Investment Manager and certain of its affiliates, if applicable.
(f) The benefits derived from expense reductions had an impact of less than 0.01%.
The accompanying Notes to Financial Statements are an integral part of this statement.
Annual Report 2016
19
COLUMBIA AMT-FREE SOUTH CAROLINA INTERMEDIATE MUNI BOND FUND
FINANCIAL HIGHLIGHTS (continued)
| | | Year Ended April 30, | | Year Ended
March 31, | |
Class C | | 2016 | | 2015 | | 2014 | | 2013 | | 2012(a) | | 2012 | |
Per share data | |
Net asset value, beginning of period | | $ | 10.44 | | | $ | 10.50 | | | $ | 10.89 | | | $ | 10.75 | | | $ | 10.65 | | | $ | 10.08 | | |
Income from investment operations: | |
Net investment income | | | 0.20 | | | | 0.22 | | | | 0.24 | | | | 0.22 | | | | 0.02 | | | | 0.25 | | |
Net realized and unrealized gain (loss) | | | 0.18 | | | | 0.01 | (b) | | | (0.39 | ) | | | 0.14 | | | | 0.10 | | | | 0.58 | | |
Total from investment operations | | | 0.38 | | | | 0.23 | | | | (0.15 | ) | | | 0.36 | | | | 0.12 | | | | 0.83 | | |
Less distributions to shareholders: | |
Net investment income | | | (0.23 | ) | | | (0.22 | ) | | | (0.23 | ) | | | (0.22 | ) | | | (0.02 | ) | | | (0.26 | ) | |
Net realized gains | | | (0.03 | ) | | | (0.07 | ) | | | (0.01 | ) | | | — | | | | — | | | | — | | |
Total distributions to shareholders | | | (0.26 | ) | | | (0.29 | ) | | | (0.24 | ) | | | (0.22 | ) | | | (0.02 | ) | | | (0.26 | ) | |
Net asset value, end of period | | $ | 10.56 | | | $ | 10.44 | | | $ | 10.50 | | | $ | 10.89 | | | $ | 10.75 | | | $ | 10.65 | | |
Total return | | | 3.65 | % | | | 2.18 | % | | | (1.31 | %) | | | 3.41 | % | | | 1.12 | % | | | 8.27 | % | |
Ratios to average net assets(c) | |
Total gross expenses | | | 1.74 | % | | | 1.75 | % | | | 1.76 | % | | | 1.72 | % | | | 1.73 | %(d) | | | 1.78 | % | |
Total net expenses(e) | | | 1.56 | % | | | 1.56 | % | | | 1.56 | % | | | 1.55 | %(f) | | | 1.54 | %(d) | | | 1.54 | %(f) | |
Net investment income | | | 1.94 | % | | | 2.10 | % | | | 2.28 | % | | | 2.06 | % | | | 2.19 | %(d) | | | 2.41 | % | |
Supplemental data | |
Net assets, end of period (in thousands) | | $ | 15,051 | | | $ | 15,677 | | | $ | 13,871 | | | $ | 15,694 | | | $ | 14,041 | | | $ | 13,093 | | |
Portfolio turnover | | | 16 | % | | | 16 | % | | | 6 | % | | | 14 | % | | | 0 | % | | | 9 | % | |
Notes to Financial Highlights
(a) For the period from April 1, 2012 to April 30, 2012. During the period, the Fund's fiscal year end was changed from March 31 to April 30.
(b) Calculation of the net gain (loss) per share (both realized and unrealized) does not correlate to the aggregate realized and unrealized gain (loss) presented in the Statement of Operations due to the timing of subscriptions and redemptions of Fund shares in relation to fluctuations in the market value of the portfolio.
(c) In addition to the fees and expenses that the Fund bears directly, the Fund indirectly bears a pro rata share of the fees and expenses of any other funds in which it invests. Such indirect expenses are not included in the Fund's reported expense ratios.
(d) Annualized.
(e) Total net expenses include the impact of certain fee waivers/expense reimbursements made by the Investment Manager and certain of its affiliates, if applicable.
(f) The benefits derived from expense reductions had an impact of less than 0.01%.
The accompanying Notes to Financial Statements are an integral part of this statement.
Annual Report 2016
20
COLUMBIA AMT-FREE SOUTH CAROLINA INTERMEDIATE MUNI BOND FUND
FINANCIAL HIGHLIGHTS (continued)
| | | Year Ended April 30, | |
Class R4 | | 2016 | | 2015 | | 2014 | | 2013(a) | |
Per share data | |
Net asset value, beginning of period | | $ | 10.43 | | | $ | 10.49 | | | $ | 10.88 | | | $ | 10.80 | | |
Income from investment operations: | |
Net investment income | | | 0.30 | | | | 0.33 | | | | 0.34 | | | | 0.04 | | |
Net realized and unrealized gain (loss) | | | 0.17 | | | | 0.00 | (b)(c) | | | (0.38 | ) | | | 0.08 | | |
Total from investment operations | | | 0.47 | | | | 0.33 | | | | (0.04 | ) | | | 0.12 | | |
Less distributions to shareholders: | |
Net investment income | | | (0.33 | ) | | | (0.32 | ) | | | (0.34 | ) | | | (0.04 | ) | |
Net realized gains | | | (0.03 | ) | | | (0.07 | ) | | | (0.01 | ) | | | — | | |
Total distributions to shareholders | | | (0.36 | ) | | | (0.39 | ) | | | (0.35 | ) | | | (0.04 | ) | |
Net asset value, end of period | | $ | 10.54 | | | $ | 10.43 | | | $ | 10.49 | | | $ | 10.88 | | |
Total return | | | 4.59 | % | | | 3.21 | % | | | (0.32 | %) | | | 1.09 | % | |
Ratios to average net assets(d) | |
Total gross expenses | | | 0.74 | % | | | 0.75 | % | | | 0.79 | % | | | 0.58 | %(e) | |
Total net expenses(f) | | | 0.56 | % | | | 0.56 | % | | | 0.56 | % | | | 0.53 | %(e) | |
Net investment income | | | 2.93 | % | | | 3.11 | % | | | 3.34 | % | | | 3.12 | %(e) | |
Supplemental data | |
Net assets, end of period (in thousands) | | $ | 758 | | | $ | 703 | | | $ | 604 | | | $ | 3 | | |
Portfolio turnover | | | 16 | % | | | 16 | % | | | 6 | % | | | 14 | % | |
Notes to Financial Highlights
(a) Based on operations from March 19, 2013 (commencement of operations) through the stated period end.
(b) Rounds to zero.
(c) Calculation of the net gain (loss) per share (both realized and unrealized) does not correlate to the aggregate realized and unrealized gain (loss) presented in the Statement of Operations due to the timing of subscriptions and redemptions of Fund shares in relation to fluctuations in the market value of the portfolio.
(d) In addition to the fees and expenses that the Fund bears directly, the Fund indirectly bears a pro rata share of the fees and expenses of any other funds in which it invests. Such indirect expenses are not included in the Fund's reported expense ratios.
(e) Annualized.
(f) Total net expenses include the impact of certain fee waivers/expense reimbursements made by the Investment Manager and certain of its affiliates, if applicable.
The accompanying Notes to Financial Statements are an integral part of this statement.
Annual Report 2016
21
COLUMBIA AMT-FREE SOUTH CAROLINA INTERMEDIATE MUNI BOND FUND
FINANCIAL HIGHLIGHTS (continued)
| | | Year Ended April 30, | | Year Ended
March 31, | |
Class Z | | 2016 | | 2015 | | 2014 | | 2013 | | 2012(a) | | 2012 | |
Per share data | |
Net asset value, beginning of period | | $ | 10.44 | | | $ | 10.50 | | | $ | 10.89 | | | $ | 10.75 | | | $ | 10.65 | | | $ | 10.08 | | |
Income from investment operations: | |
Net investment income | | | 0.31 | | | | 0.33 | | | | 0.34 | | | | 0.33 | | | | 0.03 | | | | 0.36 | | |
Net realized and unrealized gain (loss) | | | 0.17 | | | | 0.00 | (b)(c) | | | (0.38 | ) | | | 0.14 | | | | 0.10 | | | | 0.57 | | |
Total from investment operations | | | 0.48 | | | | 0.33 | | | | (0.04 | ) | | | 0.47 | | | | 0.13 | | | | 0.93 | | |
Less distributions to shareholders: | |
Net investment income | | | (0.33 | ) | | | (0.32 | ) | | | (0.34 | ) | | | (0.33 | ) | | | (0.03 | ) | | | (0.36 | ) | |
Net realized gains | | | (0.03 | ) | | | (0.07 | ) | | | (0.01 | ) | | | — | | | | — | | | | — | | |
Total distributions to shareholders | | | (0.36 | ) | | | (0.39 | ) | | | (0.35 | ) | | | (0.33 | ) | | | (0.03 | ) | | | (0.36 | ) | |
Net asset value, end of period | | $ | 10.56 | | | $ | 10.44 | | | $ | 10.50 | | | $ | 10.89 | | | $ | 10.75 | | | $ | 10.65 | | |
Total return | | | 4.69 | % | | | 3.21 | % | | | (0.32 | %) | | | 4.45 | % | | | 1.20 | % | | | 9.33 | % | |
Ratios to average net assets(d) | |
Total gross expenses | | | 0.74 | % | | | 0.75 | % | | | 0.76 | % | | | 0.72 | % | | | 0.73 | %(e) | | | 0.78 | % | |
Total net expenses(f) | | | 0.56 | % | | | 0.56 | % | | | 0.56 | % | | | 0.55 | %(g) | | | 0.54 | %(e) | | | 0.54 | %(g) | |
Net investment income | | | 2.93 | % | | | 3.10 | % | | | 3.27 | % | | | 3.06 | % | | | 3.20 | %(e) | | | 3.42 | % | |
Supplemental data | |
Net assets, end of period (in thousands) | | $ | 105,200 | | | $ | 94,697 | | | $ | 87,992 | | | $ | 122,578 | | | $ | 135,227 | | | $ | 131,663 | | |
Portfolio turnover | | | 16 | % | | | 16 | % | | | 6 | % | | | 14 | % | | | 0 | % | | | 9 | % | |
Notes to Financial Highlights
(a) For the period from April 1, 2012 to April 30, 2012. During the period, the Fund's fiscal year end was changed from March 31 to April 30.
(b) Rounds to zero.
(c) Calculation of the net gain (loss) per share (both realized and unrealized) does not correlate to the aggregate realized and unrealized gain (loss) presented in the Statement of Operations due to the timing of subscriptions and redemptions of Fund shares in relation to fluctuations in the market value of the portfolio.
(d) In addition to the fees and expenses that the Fund bears directly, the Fund indirectly bears a pro rata share of the fees and expenses of any other funds in which it invests. Such indirect expenses are not included in the Fund's reported expense ratios.
(e) Annualized.
(f) Total net expenses include the impact of certain fee waivers/expense reimbursements made by the Investment Manager and certain of its affiliates, if applicable.
(g) The benefits derived from expense reductions had an impact of less than 0.01%.
The accompanying Notes to Financial Statements are an integral part of this statement.
Annual Report 2016
22
COLUMBIA AMT-FREE SOUTH CAROLINA INTERMEDIATE MUNI BOND FUND
NOTES TO FINANCIAL STATEMENTS
April 30, 2016
Note 1. Organization
Columbia AMT-Free South Carolina Intermediate Muni Bond Fund (the Fund), a series of Columbia Funds Series Trust (the Trust), is a diversified fund. The Trust is registered under the Investment Company Act of 1940, as amended (the 1940 Act), as an open-end management investment company organized as a Delaware statutory trust.
Fund Shares
The Trust may issue an unlimited number of shares (without par value). The Fund offers Class A, Class B, Class C, Class R4 and Class Z shares. Although all share classes generally have identical voting, dividend and liquidation rights, each share class votes separately when required by the Trust's organizational documents or by law. Different share classes pay different distribution amounts to the extent the expenses of such share classes differ, and distributions in liquidation will be proportional to the net asset value of each share class. Each share class has its own expense and sales charge structure.
Class A shares are subject to a maximum front-end sales charge of 3.00% based on the initial investment amount. In addition, Class A shares purchased on or after February 19, 2015 are subject to a contingent deferred sales charge (CDSC) of 0.75% on certain investments of $500,000 or more if redeemed within 12 months after purchase. Redemptions of Class A shares purchased prior to February 19, 2015, without an initial sales charge in accounts aggregating $1 million to $50 million at the time of purchase, are subject to a CDSC of 1.00% if redeemed within 12 months after purchase, and 0.50% if redeemed more than 12, but less than 18, months after purchase.
Class B shares may be subject to a maximum CDSC of 3.00% based upon the holding period after purchase. Class B shares will generally convert to Class A shares eight years after purchase. The Fund no longer accepts investments by new or existing investors in the Fund's Class B shares, except in connection with the reinvestment of any dividend and/or capital gain distributions in Class B shares of the Fund and exchanges by existing Class B shareholders of certain other funds within the Columbia Family of Funds.
Class C shares are subject to a 1.00% CDSC on shares redeemed within 12 months after purchase.
Class R4 shares are not subject to sales charges and are generally available only to omnibus retirement plans and certain investors as described in the Fund's prospectus.
Class Z shares are not subject to sales charges and are available only to eligible investors, which are subject to different investment minimums as described in the Fund's prospectus.
Note 2. Summary of Significant Accounting Policies
Basis of Preparation
The Fund is an investment company that applies the accounting and reporting guidance in the Financial Accounting Standards Board (FASB) Accounting Standards Codification Topic 946, Financial Services — Investment Companies (ASC 946). The financial statements are prepared in accordance with U.S. generally accepted accounting principles (GAAP), which requires management to make certain estimates and assumptions that affect the reported amounts of assets and liabilities, the disclosure of contingent assets and liabilities at the date of the financial statements and the reported amounts of income and expenses during the reporting period. Actual results could differ from those estimates.
The following is a summary of significant accounting policies followed by the Fund in the preparation of its financial statements.
Security Valuation
Debt securities generally are valued by pricing services approved by the Board of Trustees (the Board) based upon market transactions for normal, institutional-size trading units of similar securities. The services may use various pricing techniques that take into account, as applicable, factors such as yield, quality, coupon rate, maturity, type of issue, trading characteristics and other data, as well as broker quotes. Debt securities for which quotations are not readily available or not believed to be reflective of market value may also be valued based upon a bid quote from an approved independent broker-dealer. Debt securities maturing in 60 days or less are valued primarily at amortized cost value, unless this method results in a valuation that management believes does not approximate market value.
Investments for which market quotations are not readily available, or that have quotations which management believes are not reflective of market value or reliable, are valued at fair value as determined in good faith under procedures approved by and under the general supervision of the Board. If a security or class of securities (such as foreign securities) is valued at fair value, such value is likely to be different from the quoted or published price for the security.
Annual Report 2016
23
COLUMBIA AMT-FREE SOUTH CAROLINA INTERMEDIATE MUNI BOND FUND
NOTES TO FINANCIAL STATEMENTS (continued)
April 30, 2016
The determination of fair value often requires significant judgment. To determine fair value, management may use assumptions including but not limited to future cash flows and estimated risk premiums. Multiple inputs from various sources may be used to determine fair value.
GAAP requires disclosure regarding the inputs and valuation techniques used to measure fair value and any changes in valuation inputs or techniques. In addition, investments shall be disclosed by major category. This information is disclosed following the Fund's Portfolio of Investments.
Delayed Delivery Securities
The Fund may trade securities on other than normal settlement terms, including securities purchased or sold on a "when-issued" basis. This may increase risk to the Fund since the other party to the transaction may fail to deliver, which could cause the Fund to subsequently invest at less advantageous prices. The Fund designates cash or liquid securities in an amount equal to the delayed delivery commitment.
Security Transactions
Security transactions are accounted for on the trade date. Cost is determined and gains (losses) are based upon the specific identification method for both financial statement and federal income tax purposes.
Income Recognition
Interest income is recorded on an accrual basis. Market premiums and discounts, including original issue discounts, are amortized and accreted, respectively, over the expected life of the security on all debt securities, unless otherwise noted.
The Fund may place a debt security on non-accrual status and reduce related interest income when it becomes probable that the interest will not be collected and the amount of uncollectible interest can be reasonably estimated. A defaulted debt security is removed from non-accrual status when the issuer resumes interest payments or when collectibility of interest is reasonably assured.
Expenses
General expenses of the Trust are allocated to the Fund and other funds of the Trust based upon relative net assets or other expense allocation methodologies determined by the nature of the expense. Expenses directly attributable to the Fund are charged to the Fund. Expenses directly attributable to a specific class of shares are charged to that share class.
Determination of Class Net Asset Value
All income, expenses (other than class-specific expenses, which are charged to that share class, as shown in the Statement of Operations) and realized and unrealized gains (losses) are allocated to each class of the Fund on a daily basis, based on the relative net assets of each class, for purposes of determining the net asset value of each class.
Federal Income Tax Status
The Fund intends to qualify each year as a regulated investment company under Subchapter M of the Internal Revenue Code, as amended, and will distribute substantially all of its tax exempt and taxable income (including net short-term capital gains), if any, for its tax year, and as such will not be subject to federal income taxes. In addition, the Fund intends to distribute in each calendar year substantially all of its net investment income, capital gains and certain other amounts, if any, such that the Fund should not be subject to federal excise tax. Therefore, no federal income or excise tax provision is recorded.
Distributions to Shareholders
Distributions from net investment income, if any, are declared daily and paid monthly. Net realized capital gains, if any, are distributed at least annually. Income distributions and capital gain distributions are determined in accordance with federal income tax regulations, which may differ from GAAP.
Guarantees and Indemnifications
Under the Trust's organizational documents and, in some cases, by contract, its officers and trustees are indemnified against certain liabilities arising out of the performance of their duties to the Trust or its funds. In addition, certain of the Fund's contracts with its service providers contain general indemnification clauses. The Fund's maximum exposure under these arrangements is unknown since the amount of any future claims that may be made against the Fund cannot be determined, and the Fund has no historical basis for predicting the likelihood of any such claims.
Note 3. Fees and Other Transactions with Affiliates
Management Fees
Effective September 1, 2015, the Fund entered into a Management Agreement with Columbia Management Investment Advisers, LLC (the Investment Manager), a
Annual Report 2016
24
COLUMBIA AMT-FREE SOUTH CAROLINA INTERMEDIATE MUNI BOND FUND
NOTES TO FINANCIAL STATEMENTS (continued)
April 30, 2016
wholly-owned subsidiary of Ameriprise Financial, Inc. (Ameriprise Financial). Under the Management Agreement, the Investment Manager provides the Fund with investment research and advice, as well as administrative and accounting services. The management services fee is an annual fee that is equal to a percentage of the Fund's average daily net assets that declines from 0.47% to 0.31% as the Fund's net assets increase. The effective management services fee rate for the year ended April 30, 2016 was 0.47% of the Fund's average daily net assets.
Prior to September 1, 2015, the Fund paid the Investment Manager an annual fee for advisory services under an Investment Management Services Agreement and a separate annual fee for administrative and accounting services under an Administrative Services Agreement. For the period from May 1, 2015 through August 31, 2015, the investment advisory services fee paid to the Investment Manager was $179,119, and the administrative services fee paid to the Investment Manager was $31,346.
Other Expenses
Other expenses are for, among other things, miscellaneous expenses of the Fund or the Board, including payments to Board Services Corp., a company providing limited administrative services to the Fund and the Board. That company's expenses include boardroom and office expense, employee compensation, employee health and retirement benefits, and certain other expenses. For the year ended April 30, 2016, other expenses paid by the Fund to this company were $1,236.
Compensation of Board Members
Board members, who are not officers or employees of the Investment Manager or Ameriprise Financial, are compensated for their services to the Fund as disclosed in the Statement of Operations. Under a Deferred Compensation Plan (the Plan), these Board members may elect to defer payment of up to 100% of their compensation. Deferred amounts are treated as though equivalent dollar amounts had been invested in shares of certain funds managed by the Investment Manager. The Fund's liability for these amounts is adjusted for market value changes and remains in the Fund until distributed in accordance with the Plan. All amounts payable under the Plan constitute a general unsecured obligation of the Fund.
Transfer Agency Fees
Under a Transfer and Dividend Disbursing Agent Agreement, Columbia Management Investment Services Corp. (the Transfer Agent), an affiliate of the Investment
Manager and a wholly-owned subsidiary of Ameriprise Financial, is responsible for providing transfer agency services to the Fund. The Transfer Agent has contracted with Boston Financial Data Services (BFDS) to serve as sub-transfer agent.
The Transfer Agent receives a monthly transfer agency fee based on the number or the average value of accounts, depending on the type of account. In addition, the Transfer Agent also receives sub-transfer agency fees based on a percentage of the average aggregate value of the Fund's shares maintained in omnibus accounts (other than omnibus accounts for which American Enterprise Investment Services Inc. is the broker of record or accounts where the beneficial shareholder is a customer of Ameriprise Financial Services, Inc., for which the Transfer Agent receives a per account fee). The Transfer Agent pays the fees of BFDS for services as sub-transfer agent and is not entitled to reimbursement for such fees from the Fund (with the exception of out-of-pocket fees).
The Transfer Agent also receives compensation from the Fund for various shareholder services and reimbursements for certain out-of-pocket fees.
For the year ended April 30, 2016, the Fund's effective transfer agency fee rates as a percentage of average daily net assets of each class were as follows:
Class A | | | 0.20 | % | |
Class B | | | 0.20 | | |
Class C | | | 0.20 | | |
Class R4 | | | 0.20 | | |
Class Z | | | 0.20 | | |
An annual minimum account balance fee of $20 may apply to certain accounts with a value below the applicable share class's initial minimum investment requirements to reduce the impact of small accounts on transfer agency fees. These minimum account balance fees are remitted to the Fund and recorded as part of expense reductions in the Statement of Operations. For the year ended April 30, 2016, no minimum account balance fees were charged by the Fund.
Distribution and Service Fees
The Fund has an agreement with Columbia Management Investment Distributors, Inc. (the Distributor), an affiliate of the Investment Manager and a wholly-owned subsidiary of Ameriprise Financial, for distribution and shareholder services. The Board has approved, and the Fund has adopted, distribution and shareholder service plans (the Plans) applicable to certain share classes, which set the distribution and service fees for the Fund. These fees are calculated daily and are intended to
Annual Report 2016
25
COLUMBIA AMT-FREE SOUTH CAROLINA INTERMEDIATE MUNI BOND FUND
NOTES TO FINANCIAL STATEMENTS (continued)
April 30, 2016
compensate the Distributor and/or eligible selling and/or servicing agents for selling shares of the Fund and providing services to investors.
Under the Plans, the Fund pays a monthly combined distribution and service fee to the Distributor at the maximum annual rate of 0.25% of the average daily net assets attributable to Class A shares of the Fund. Also under the Plans, the Fund pays a monthly service fee at the maximum annual rate of 0.25% of the average daily net assets attributable to Class B and Class C shares of the Fund and a monthly distribution fee at the maximum annual rate of 0.75% of the average daily net assets attributable to Class B and Class C shares of the Fund.
Sales Charges
Sales charges, including front-end charges and CDSCs, received by the Distributor for distributing Fund shares were $29,289 for Class A shares for the year ended April 30, 2016.
Expenses Waived/Reimbursed by the Investment Manager and its Affiliates
The Investment Manager and certain of its affiliates have contractually agreed to waive fees and/or reimburse expenses (excluding certain fees and expenses described below) for the period disclosed below, unless sooner terminated at the sole discretion of the Board, so that the Fund's net operating expenses, after giving effect to fees waived/expenses reimbursed and any balance credits and/or overdraft charges from the Fund's custodian, do not exceed the following annual rates as a percentage of the class' average daily net assets:
| | | Fee Rates Contractual
through
August 31, 2016 | |
Class A | | | 0.81 | % | |
Class B | | | 1.56 | | |
Class C | | | 1.56 | | |
Class R4 | | | 0.56 | | |
Class Z | | | 0.56 | | |
Under the agreement governing these fee waivers and/or expense reimbursement arrangements, the following fees and expenses are excluded from the waiver/reimbursement commitment, and therefore will be paid by the Fund, if applicable: taxes (including foreign transaction taxes), expenses associated with investments in affiliated and non-affiliated pooled investment vehicles (including mutual funds and exchange-traded funds), transaction costs and brokerage commissions, costs related to any securities lending
program, dividend and interest expenses associated with securities sold short, inverse floater program fees and expenses, transaction charges and interest on borrowed money, interest, extraordinary expenses and any other expenses the exclusion of which is specifically approved by the Board. This agreement may be modified or amended only with approval from the Investment Manager, certain of its affiliates and the Fund. Any fees waived and/or expenses reimbursed under the expense reimbursement arrangements described above are not recoverable by the Investment Manager or its affiliates in future periods.
Note 4. Federal Tax Information
The timing and character of income and capital gain distributions are determined in accordance with income tax regulations, which may differ from GAAP because of temporary or permanent book to tax differences.
At April 30, 2016, these differences are primarily due to differing treatment for deferral/reversal of wash sale losses, Trustees' deferred compensation and distributions. To the extent these differences are permanent, reclassifications are made among the components of the Fund's net assets in the Statement of Assets and Liabilities. Temporary differences do not require reclassifications.
The Fund did not have any permanent differences; therefore, no reclassifications were made to the Statement of Assets and Liabilities.
The tax character of distributions paid during the years indicated was as follows:
Year Ended April 30, | | 2016 | | 2015 | |
Ordinary income | | $ | 10,321 | | | $ | 9,789 | | |
Tax-exempt income | | | 4,050,420 | | | | 3,659,607 | | |
Long-term capital gains | | | 409,542 | | | | 773,314 | | |
Total | | $ | 4,470,283 | | | $ | 4,442,710 | | |
Short-term capital gain distributions, if any, are considered ordinary income distributions for tax purposes.
At April 30, 2016, the components of distributable earnings on a tax basis were as follows:
Undistributed tax-exempt income | | $ | 1,255,450 | | |
Undistributed long-term capital gains | | | 134,389 | | |
Net unrealized appreciation | | | 8,681,901 | | |
At April 30, 2016, the cost of investments for federal income tax purposes was $127,664,310 and the
Annual Report 2016
26
COLUMBIA AMT-FREE SOUTH CAROLINA INTERMEDIATE MUNI BOND FUND
NOTES TO FINANCIAL STATEMENTS (continued)
April 30, 2016
aggregate gross unrealized appreciation and depreciation based on that cost was:
Unrealized appreciation | | $ | 8,681,901 | | |
Unrealized depreciation | | | — | | |
Net unrealized appreciation | | $ | 8,681,901 | | |
Management of the Fund has concluded that there are no significant uncertain tax positions in the Fund that would require recognition in the financial statements. However, management's conclusion may be subject to review and adjustment at a later date based on factors including, but not limited to, new tax laws, regulations, and administrative interpretations (including relevant court decisions). Generally, the Fund's federal tax returns for the prior three fiscal years remain subject to examination by the Internal Revenue Service.
Note 5. Portfolio Information
The cost of purchases and proceeds from sales of securities, excluding short-term investments and derivatives, if any, aggregated to $23,624,221 and $20,567,972, respectively, for the year ended April 30, 2016. The amount of purchase and sale activity impacts the portfolio turnover rate reported in the Financial Highlights.
Note 6. Line of Credit
The Fund has access to a revolving credit facility whereby the Fund may borrow for the temporary funding of shareholder redemptions or for other temporary or emergency purposes. Effective December 8, 2015, Citibank, N.A. and HSBC Bank USA, N.A. joined JPMorgan Chase Bank, N.A. (JPMorgan) as lead of a syndicate of banks under the credit facility, which is a collective agreement between the Fund and certain other funds managed by the Investment Manager, severally and not jointly, that permits collective borrowings up to $1 billion. Interest is charged to each participating fund based on its borrowings at a rate equal to the higher of (i) the overnight federal funds rate plus 1.00% or (ii) the one-month LIBOR rate plus 1.00%. Each borrowing under the credit facility matures no later than 60 days after the date of borrowing. The Fund also pays a commitment fee equal to its pro rata share of the amount of the credit facility at a rate of 0.15% per annum. The commitment fee is included in other expenses in the Statement of Operations. Prior to December 8, 2015, JPMorgan was the sole lead bank under the credit facility agreement that permitted borrowings up to $550 million under the same terms and interest rates as described above with the exception of the commitment fee which was charged at a rate of 0.075% per annum.
The Fund had no borrowings during the year ended April 30, 2016.
Note 7. Significant Risks
Shareholder Concentration Risk
At April 30, 2016, one unaffiliated shareholder of record owned 63.6% of the outstanding shares of the Fund in one or more accounts. The Fund has no knowledge about whether any portion of those shares was owned beneficially. Subscription and redemption activity by concentrated accounts may have a significant effect on the operations of the Fund. In the case of a large redemption, the Fund may be forced to sell investments at inopportune times, including its liquid or more liquid positions, resulting in Fund losses and the Fund holding a higher percentage of less liquid or illiquid securities. Large redemptions could result in decreased economies of scale and increased operating expenses for non-redeeming Fund shareholders.
Credit Risk
Credit risk is the risk that the value of debt securities in the Fund's portfolio may decline because the issuer may default and fail to pay interest or repay principal when due. Rating agencies assign credit ratings to debt securities to indicate their credit risk. Lower rated or unrated debt securities held by the Fund may present increased credit risk as compared to higher-rated debt securities.
Interest Rate Risk
Interest rate risk is the risk of losses attributable to changes in interest rates. In general, if prevailing interest rates rise, the values of debt securities tend to fall, and if interest rates fall, the values of debt securities tend to rise. Actions by governments and central banking authorities can result in increases in interest rates. Increasing interest rates may negatively affect the value of debt securities held by the Fund, resulting in a negative impact on the Fund's performance and net asset value per share. In general, the longer the maturity or duration of a debt security, the greater its sensitivity to changes in interest rates.
Liquidity Risk
Liquidity risk is the risk associated with a lack of marketability of investments which may make it difficult to sell the investment at a desirable time or price. Changing regulatory, market or other conditions or environments (for example, the interest rate or credit environments) may adversely affect the liquidity of the Fund's investments. The Fund may have to accept a lower selling price for the holding, sell other investments, or forego
Annual Report 2016
27
COLUMBIA AMT-FREE SOUTH CAROLINA INTERMEDIATE MUNI BOND FUND
NOTES TO FINANCIAL STATEMENTS (continued)
April 30, 2016
another, more appealing investment opportunity. Generally, the less liquid the market at the time the Fund sells a portfolio investment, the greater the risk of loss or decline of value to the Fund. A less liquid market can lead to an increase in Fund redemptions, which may negatively impact Fund performance and net asset value per share, including, for example, if the Fund is forced to sell securities in a down market.
Geographic Concentration Risk
Because the Fund invests substantially in municipal securities issued by the state identified in the Fund's name and political sub-divisions of that state, the Fund will be particularly affected by adverse tax, legislative, regulatory, demographic or political changes as well as changes impacting the state's financial, economic or other condition and prospects. In addition, because of the relatively small number of issuers of tax-exempt securities in the state, the Fund may invest a higher percentage of assets in a single issuer and, therefore, be more exposed to the risk of loss than a fund that invests more broadly. The value of municipal and other securities owned by the Fund also may be adversely affected by future changes in federal or state income tax laws.
Note 8. Subsequent Events
Management has evaluated the events and transactions that have occurred through the date the financial statements were issued and noted no items requiring adjustment of the financial statements or additional disclosure.
Note 9. Information Regarding Pending and Settled Legal Proceedings
In December 2005, without admitting or denying the allegations, American Express Financial Corporation (AEFC, which is now known as Ameriprise Financial, Inc. (Ameriprise Financial)) entered into settlement agreements with the Securities and Exchange Commission (SEC) and Minnesota Department of Commerce (MDOC) related to market timing activities. As a result, AEFC was censured and ordered to cease and desist from committing or causing any violations of certain provisions of the Investment Advisers Act of 1940, the Investment Company Act of 1940, and various Minnesota laws. AEFC agreed to pay disgorgement of $10 million and civil money penalties of $7 million. AEFC also agreed to retain an independent distribution consultant to assist in developing a plan for distribution of all disgorgement and civil penalties ordered by the SEC in accordance with various undertakings detailed at
http://www.sec.gov/litigation/admin/ia-2451.pdf. Ameriprise Financial and its affiliates have cooperated with the SEC and the MDOC in these legal proceedings, and have made regular reports to the Funds' Boards of Trustees.
Ameriprise Financial and certain of its affiliates have historically been involved in a number of legal, arbitration and regulatory proceedings, including routine litigation, class actions, and governmental actions, concerning matters arising in connection with the conduct of their business activities. Ameriprise Financial believes that the Funds are not currently the subject of, and that neither Ameriprise Financial nor any of its affiliates are the subject of, any pending legal, arbitration or regulatory proceedings that are likely to have a material adverse effect on the Funds or the ability of Ameriprise Financial or its affiliates to perform under their contracts with the Funds. Ameriprise Financial is required to make quarterly (10-Q), annual (10-K) and, as necessary, 8-K filings with the SEC on legal and regulatory matters that relate to Ameriprise Financial and its affiliates. Copies of these filings may be obtained by accessing the SEC website at www.sec.gov.
There can be no assurance that these matters, or the adverse publicity associated with them, will not result in increased fund redemptions, reduced sale of fund shares or other adverse consequences to the Funds. Further, although we believe proceedings are not likely to have a material adverse effect on the Funds or the ability of Ameriprise Financial or its affiliates to perform under their contracts with the Funds, these proceedings are subject to uncertainties and, as such, we are unable to estimate the possible loss or range of loss that may result. An adverse outcome in one or more of these proceedings could result in adverse judgments, settlements, fines, penalties or other relief that could have a material adverse effect on the consolidated financial condition or results of operations of Ameriprise Financial.
Annual Report 2016
28
COLUMBIA AMT-FREE SOUTH CAROLINA INTERMEDIATE MUNI BOND FUND
REPORT OF INDEPENDENT REGISTERED PUBLIC ACCOUNTING FIRM
To the Trustees of Columbia Funds Series Trust and the Shareholders of
Columbia AMT-Free South Carolina Intermediate Muni Bond Fund
In our opinion, the accompanying statement of assets and liabilities, including the portfolio of investments, and the related statements of operations and of changes in net assets and the financial highlights present fairly, in all material respects, the financial position of Columbia AMT-Free South Carolina Intermediate Muni Bond Fund (the "Fund", a series of Columbia Funds Series Trust) at April 30, 2016, and the results of its operations, the changes in its net assets and the financial highlights for each of the periods indicated, in conformity with accounting principles generally accepted in the United States of America. These financial statements and financial highlights (hereafter referred to as "financial statements") are the responsibility of the Fund's management. Our responsibility is to express an opinion on these financial statements based on our audits. We conducted our audits of these financial statements in accordance with the standards of the Public Company Accounting Oversight Board (United States). Those standards require that we plan and perform the audit to obtain reasonable assurance about whether the financial statements are free of material misstatement. An audit includes examining, on a test basis, evidence supporting the amounts and disclosures in the financial statements, assessing the accounting principles used and significant estimates made by management, and evaluating the overall financial statement presentation. We believe that our audits, which included confirmation of securities at April 30, 2016 by correspondence with the custodian and brokers, and the application of alternative auditing procedures where such confirmations had not been received, provide a reasonable basis for our opinion.
PricewaterhouseCoopers LLP
Minneapolis, MN
June 21, 2016
Annual Report 2016
29
COLUMBIA AMT-FREE SOUTH CAROLINA INTERMEDIATE MUNI BOND FUND
FEDERAL INCOME TAX INFORMATION
(Unaudited)
The Fund hereby designates the following tax attributes for the fiscal year ended April 30, 2016. Shareholders will be notified in early 2017 of the amounts for use in preparing 2016 income tax returns.
Tax Designations
Capital Gain Dividend | | $ | 179,262 | | |
Exempt-Interest Dividends | | | 99.75 | % | |
Capital Gain Dividend. The Fund designates as a capital gain dividend the amount reflected above, or if subsequently determined to be different, the net capital gain of such fiscal period.
Exempt-Interest Dividends. The percentage of net investment income distributed during the fiscal year that qualifies as exempt-interest dividends for federal income tax purposes.
Annual Report 2016
30
COLUMBIA AMT-FREE SOUTH CAROLINA INTERMEDIATE MUNI BOND FUND
Shareholders elect the Board that oversees the Fund's operations. The Board appoints officers who are responsible for day-to-day business decisions based on policies set by the Board. The following table provides basic biographical information about the Fund's Trustees, including their principal occupations during the past five years, although specific titles for individuals may have varied over the period. Under current Board policy, members generally may serve through the end of the calendar year in which they reach either the mandatory retirement age established by the Board or the fifteenth anniversary of the first Board meeting they attended as a member of the Board.
Trustees
Independent Trustees
Name,
Address,
Year of Birth | | Position Held With
the Funds and Length of
Service | | Principal Occupation(s)
During the Past Five Years
and Other Relevant
Professional Experience | | Number of
Funds in the
Columbia Funds
Complex
Overseen | | Other Directorships
Held by Trustee During
the Past Five Years | |
Kathleen Blatz
901 S. Marquette Ave.
Minneapolis, MN 55402
1954 | | Trustee since 1/06 for RiverSource Funds and since 6/11 for Nations Funds | | Attorney; specializing in arbitration and mediation; Chief Justice, Minnesota Supreme Court, 1998-2006; Associate Justice, Minnesota Supreme Court, 1996-1998; Fourth Judicial District Court Judge, Hennepin County, 1994-1996; Attorney in private practice and public service, 1984-1993; State Representative, Minnesota House of Representatives, 1979-1993, which included service on the Tax and Financial Institutions and Insurance Committees | | | 120 | | | Trustee, BlueCross BlueShield of Minnesota (Chair of the Business Development Committee) since 2009; Chair of the Robina Foundation since August 2013 | |
Edward J. Boudreau, Jr.
901 S. Marquette Ave. Minneapolis, MN 55402
1944 | | Trustee since 6/11 for RiverSource Funds and since 1/05 for Nations Funds | | Managing Director, E.J. Boudreau & Associates (consulting) since 2000; FINRA Industry Arbitrator, 2002-present; Chairman and Chief Executive Officer, John Hancock Funds (asset management), Chairman and Interested Trustee for open-end and closed-end funds offered by John Hancock, 1989-2000; John Hancock Life Insurance Company, including SVP and Treasurer and SVP Information Technology, 1968-1988 | | | 118 | | | Former Trustee, Boston Museum of Science (Chair of Finance Committee), 1985-2013; former Trustee, BofA Funds Series Trust (11 funds), 2005-2011 | |
Pamela G. Carlton
901 S. Marquette Ave.
Minneapolis, MN 55402
1954 | | Trustee since 7/07 for RiverSource Funds and since 6/11 for Nations Funds | | President, Springboard — Partners in Cross Cultural Leadership (consulting company) since 2003; Managing Director of US Equity Research, JP Morgan Chase, 1999-2003; Director of US Equity Research, Chase Asset Management, 1996-1999; Co-Director Latin America Research, 1993-1996, COO Global Research, 1992-1996, Co-Director of US Research, 1991-1992, Investment Banker, Morgan Stanley, 1982-1991 | | | 120 | | | Trustee, New York Presbyterian Hospital Board (Executive Committee and Chair of Human Resources Committee) since 1996 | |
Annual Report 2016
31
COLUMBIA AMT-FREE SOUTH CAROLINA INTERMEDIATE MUNI BOND FUND
TRUSTEES AND OFFICERS (continued)
Independent Trustees (continued)
Name,
Address,
Year of Birth | | Position Held With
the Funds and Length of
Service | | Principal Occupation(s)
During the Past Five Years
and Other Relevant
Professional Experience | | Number of
Funds in the
Columbia Funds
Complex
Overseen | | Other Directorships
Held by Trustee During
the Past Five Years | |
William P. Carmichael
901 S. Marquette Ave. Minneapolis, MN 55402
1943 | | Trustee since 6/11 for RiverSource Funds and since 2003 for Nations Funds; Chair of the Board from 1/14-11/15 | | Retired; Co-founder, The Succession Fund (provides exit strategies to owners of privately held companies), 1998-2007; Adjunct Professor of Finance, Kelley School of Business, Indiana University, 1993-2007; Senior Vice President, Sara Lee Corporation, 1991-1993; Senior Vice President and Chief Financial Officer, Beatrice Foods Company, 1984-1990; Vice President, Esmark, Inc., 1973-1984; Associate, Price Waterhouse, 1968-1972 | | | 120 | | | Director, The Finish Line (athletic shoes and apparel) since July 2003; Director, International Textile Corp. since 2012; Director, hhgregg since May, 2015; former Director, Cobra Electronics Corporation (electronic equipment manufacturer), 1994-August 2014; former Director, Spectrum Brands, Inc. (consumer products), 2002-2009; former Director, Simmons Company (bedding), 2004-2010; former Trustee, BofA Funds Series Trust (11 funds), 2009-2011; former Director, McMoRan Exploration Company (oil and gas exploration and development), 2010-2013 | |
Patricia M. Flynn
901 S. Marquette Ave. Minneapolis, MN 55402
1950 | | Trustee since 11/04 for RiverSource Funds and since 6/11 for Nations Funds | | Trustee Professor of Economics and Management, Bentley University since 1976 (also teaches and conducts research on corporate governance); Dean, McCallum Graduate School of Business, Bentley University, 1992-2002 | | | 120 | | | Trustee, MA Taxpayers Foundation since 1997; Board of Governors, Innovation Institute, MA Technology Collaborative since 2010 | |
William A. Hawkins
901 S. Marquette Ave.
Minneapolis, MN 55402
1942 | | Chair of the Board since 11/15; Trustee since 6/11 for RiverSource Funds and since 1/05 for Nations Funds | | Managing Director, Overton Partners (financial consulting) since August 2010; President and Chief Executive Officer, California General Bank, N.A., January 2008-August 2010; Operation Hope, COO, 2004-2007; IndyMac Bancorp, President, CBG, 1999-2003; American General Bank, President, 1997-1999; Griffin Financial Services, CEO, 1981-1997; The Griffin Funds, CEO, 1992-1998 | | | 120 | | | Former Trustee, BofA Funds Series Trust (11 funds), 2009-2015 | |
R. Glenn Hilliard
901 S. Marquette Ave. Minneapolis, MN 55402
1943 | | Trustee since 6/11 for RiverSource Funds and since 1/05 for Nations Funds | | Chairman and Chief Executive Officer, Hilliard Group LLC (investing and consulting) since April 2003; Non-Executive Director & Chairman, CNO Financial Group, Inc. (insurance), 2003-2011; Chair & CEO, ING Americas, 1996-2003 | | | 118 | | | Chairman, BofA Funds Series Trust (11 funds); former Director, CNO Financial Group, Inc. (insurance), 2003-2011 | |
Annual Report 2016
32
COLUMBIA AMT-FREE SOUTH CAROLINA INTERMEDIATE MUNI BOND FUND
TRUSTEES AND OFFICERS (continued)
Independent Trustees (continued)
Name,
Address,
Year of Birth | | Position Held With
the Funds and Length of
Service | | Principal Occupation(s)
During the Past Five Years
and Other Relevant
Professional Experience | | Number of
Funds in the
Columbia Funds
Complex
Overseen | | Other Directorships
Held by Trustee During
the Past Five Years | |
Catherine James Paglia
901 S. Marquette Ave.
Minneapolis, MN 55402
1952 | | Trustee since 11/04 for RiverSource Funds and since 6/11 for Nations Funds | | Director, Enterprise Asset Management, Inc. (private real estate and asset management company) since September 1998; Managing Director and Partner, Interlaken Capital, Inc., 1989-1997; Managing Director, Morgan Stanley, 1982-1989; Vice President, Investment Banking, 1980-1982, Associate, Investment Banking, 1976-1980, Dean Witter Reynolds, Inc. | | | 120 | | | Director, Valmont Industries, Inc. (irrigation systems manufacturer) since 2012; Trustee, Carleton College (on the Investment Committee); Trustee, Carnegie Endowment for International Peace (on the Investment Committee) | |
Leroy C. Richie
901 S. Marquette Ave.
Minneapolis, MN 55402
1941 | | Trustee since 2000 for Seligman Funds, since 11/08 for RiverSource Funds and since 6/11 for Nations Funds | | Counsel, Lewis & Munday, P.C. (law firm) since 2004; Vice President and General Counsel, Automotive Legal Affairs, Chrysler Corporation, 1993-1997 | | | 118 | | | Lead Outside Director, Infinity Resources, Inc. (oil and gas exploration and production) since 1994; Lead Outside Director, Digital Ally, Inc. (digital imaging) since September 2005; Trustee, Marygrove College (Chair of Finance Committee) since 2007; former Director, OGE Energy Corp. (energy and energy services), 2007-2014 | |
Minor M. Shaw
901 S. Marquette Ave.
Minneapolis, MN 55402
1947 | | Trustee since 6/11 for RiverSource Funds and since 2003 for Nations Funds | | President, Micco LLC (private investments) since 2011; President, Micco Corp. (family investment business), 1998-2011 | | | 120 | | | Director, Piedmont Natural Gas; Director, BlueCross BlueShield of South Carolina since April 2008; Chair of the Duke Endowment; Director, National Association of Corporate Directors, Carolinas Chapter since 2013; Chair of Greenville — Spartanburg Airport Commission; former Trustee, BofA Funds Series Trust (11 funds), 2003-2011 | |
Alison Taunton-Rigby
901 S. Marquette Ave.
Minneapolis, MN 55402
1944 | | Trustee since 11/02 for RiverSource Funds and since 6/11 for Nations Funds | | Managing Director, Forester Biotech (consulting), 2001-2003; Chief Executive Officer and Director, RiboNovix, Inc., (biotechnology), 2003-2010; President and Chief Executive Officer of CMT Inc., 2001-2003; Aquila Biopharmaceuticals Inc., 1996-2000; Cambridge Biotech Corporation, 1995-1996; Mitotix Inc., 1993-1994 | | | 120 | | | Director, Abt Associates
(government contractor) since 2001; Director, Boston Children's Hospital since 2002; Director, Healthways, Inc. (health and well-being solutions) since 2005; Director, ICI Mutual Insurance Company, since 2011 | |
Annual Report 2016
33
COLUMBIA AMT-FREE SOUTH CAROLINA INTERMEDIATE MUNI BOND FUND
TRUSTEES AND OFFICERS (continued)
Interested Trustee Not Affiliated with Investment Manager*
Name,
Address,
Year of Birth | | Position Held With
Funds and Length of
Service | | Principal Occupation(s)
During Past Five Years
and Other Relevant
Professional Experience | | Number of
Funds in the
Fund Family
Overseen by
Board Member | | Other Present or Past
Directorships/
Trusteeships
(Within Past 5 Years) | |
Anthony M. Santomero
901 S. Marquette Ave.
Minneapolis, MN 55402
1946 | | Trustee since 6/11 for RiverSource Funds and since 1/08 for Nations Funds | | Richard K. Mellon Professor Emeritus of Finance, The Wharton School, University of Pennsylvania since 2002; Senior Advisor, McKinsey & Company (consulting), 2006-2008; President, Federal Reserve Bank of Philadelphia, 2000-2006; Professor of Finance, The Wharton School, University of Pennsylvania, 1972-2002 | | | 118 | | | Trustee, Penn Mutual Life Insurance Company since March 2008; Director, Renaissance Reinsurance Ltd. since May 2008; Director, Citigroup Inc. since 2009; Director, Citibank, N.A. since 2009; former Trustee, BofA Funds Series Trust (11 funds), 2008-2011 | |
* Dr. Santomero is not an affiliated person of the Investment Manager or Ameriprise Financial. However, he is currently deemed by the Funds to be an "interested person" (as defined in the 1940 Act) of the Funds because he serves as a Director of Citigroup Inc. and Citibank, N.A., companies that may directly or through subsidiaries and affiliates engage from time-to-time in brokerage execution, principal transactions and lending relationships with the Funds or accounts advised/managed by the Investment Manager.
Annual Report 2016
34
COLUMBIA AMT-FREE SOUTH CAROLINA INTERMEDIATE MUNI BOND FUND
TRUSTEES AND OFFICERS (continued)
Interested Trustee Affiliated with Investment Manager*
Name,
Address,
Year of Birth | | Position Held With
the Funds and Length of
Service | | Principal Occupation(s)
During Past Five Years
and Other Relevant
Professional Experience | | Number of
Funds in the
Columbia Funds
Complex
Overseen | | Other Directorships
Held by Trustee During
the Past Five Years | |
William F. Truscott
c/o Columbia Management
Investment Advisers, LLC, 225 Franklin St.
Boston, MA 02110
1960 | | Trustee since 11/01 for RiverSource Funds and since 6/11 for Nations Funds; Senior Vice President since 2002 for RiverSource Funds and since 5/10 for Nations Funds | | Chairman of the Board and President, Columbia Management Investment Advisers, LLC since May 2010 and February 2012, respectively (previously President and Chief Investment Officer, 2001-April 2010); Chief Executive Officer, Global Asset Management, Ameriprise Financial, Inc. since September 2012 (previously Chief Executive Officer, U.S. Asset Management & President, Annuities, May 2010-September 2012 and President — U.S. Asset Management and Chief Investment Officer, 2005-April 2010); Director and Chief Executive Officer, Columbia Management Investment Distributors, Inc. since May 2010 and February 2012, respectively (previously Chairman of the Board and Chief Executive Officer, 2006-April 2010); Chairman of the Board and Chief Executive Officer, RiverSource Distributors, Inc. since 2006; Director, Threadneedle Asset Management Holdings, SARL since 2014; President and Chief Executive Officer, Ameriprise Certificate Company, 2006-August 2012. | | | 178 | | | Chairman of the Board, Columbia Management Investment Advisers, LLC since May 2010; Director, Columbia Management Investment Distributors, Inc. since May 2010; Former Director, Ameriprise Certificate Company, 2006-January 2013 | |
* Interested person (as defined under the 1940 Act) by reason of being an officer, director, security holder and/or employee of the Investment Manager or Ameriprise Financial.
The Statement of Additional Information has additional information about the Fund's Board members and is available, without charge, upon request by calling 800.345.6611; contacting your financial intermediary; or visiting columbiathreadneedle.com/us.
Annual Report 2016
35
COLUMBIA AMT-FREE SOUTH CAROLINA INTERMEDIATE MUNI BOND FUND
TRUSTEES AND OFFICERS (continued)
The Board has appointed officers who are responsible for day-to-day business decisions based on policies it has established. The officers serve at the pleasure of the Board. The following table provides basic information about the Officers of the Fund, including principal occupations during the past five years, although their specific titles may have varied over the period. In addition to Mr. Truscott, who is Senior Vice President, the Fund's other officers are:
Fund Officers
Name,
Address and
Year of Birth | | Position and Year
First Appointed to
Position for any Fund
in the Columbia
Funds Complex or a
Predecessor Thereof | |
Principal Occupation(s) During Past Five Years | |
Christopher O. Petersen
5228 Ameriprise
Financial Center
Minneapolis, MN 55474
Born 1970 | | President and Principal Executive Officer (2015) | | Vice President and Lead Chief Counsel, Ameriprise Financial, Inc. since January 2015 (previously, Vice President and Chief Counsel January 2010-December 2014; and Vice President and Group Counsel or Counsel 2004-January 2010); officer of Columbia Funds and affiliated funds since 2007. | |
Michael G. Clarke
225 Franklin Street
Boston, MA 02110
Born 1969 | | Treasurer (2011), Chief Financial Officer (2009) and Chief Accounting Officer (2015) | | Vice President — Mutual Fund Administration, Columbia Management Investment Advisers, LLC, since May 2010; Managing Director of Fund Administration, Columbia Management Advisors, LLC, September 2004-April 2010; senior officer of Columbia Funds and affiliated funds since 2002. | |
Paul B. Goucher
100 Park Avenue
New York, NY 10017
Born 1968 | | Senior Vice President (2011), Chief Legal Officer (2015) and Assistant Secretary (2008) | | Vice President and Lead Chief Counsel, Ameriprise Financial, Inc. since November 2008 and January 2013, respectively (previously Chief Counsel, January 2010-January 2013 and Group Counsel, November 2008-January 2010). | |
Thomas P. McGuire
225 Franklin Street
Boston, MA 02110
Born 1972 | | Senior Vice President and Chief Compliance Officer (2012) | | Vice President — Asset Management Compliance, Ameriprise Financial, Inc., since May 2010; Chief Compliance Officer, Ameriprise Certificate Company since September 2010; Compliance Executive, Bank of America, 2005-April 2010. | |
Colin Moore
225 Franklin Street
Boston, MA 02110
Born 1958 | | Senior Vice President (2010) | | Executive Vice President and Global Chief Investment Officer, Ameriprise Financial, Inc., since July 2013; Director and Global Chief Investment Officer, Columbia Management Investment Advisers, LLC since May 2010; Manager, Managing Director and Chief Investment Officer, Columbia Management Advisors, LLC, 2007-April 2010. | |
Michael E. DeFao
225 Franklin Street
Boston, MA 02110
Born 1968 | | Vice President (2011) and Assistant Secretary (2010) | | Vice President and Chief Counsel, Ameriprise Financial, Inc. since May 2010; Associate General Counsel, Bank of America, 2005-April 2010. | |
Amy Johnson
5228 Ameriprise
Financial Center
Minneapolis, MN 55474
Born 1965 | | Vice President (2006) | | Managing Director and Chief Operating Officer, Columbia Management Investment Advisers, LLC since May 2010 (previously Chief Administrative Officer, 2009-April 2010, and Vice President — Asset Management and Trust Company Services, 2006-2009). | |
Lyn Kephart-Strong
5228 Ameriprise
Financial Center
Minneapolis, MN 55474
Born 1960 | | Vice President (2015) | | President, Columbia Management Investment Services Corp. since October 2014; Vice President & Resolution Officer, Ameriprise Trust Company since August 2009; President, RiverSource Service Corporation 2004-2010. | |
Ryan C. Larrenaga
225 Franklin Street
Boston, MA 02110
Born 1970 | | Vice President and Secretary (2015) | | Vice President and Group Counsel, Ameriprise Financial, Inc. since August 2011 (previously, Counsel from May 2010 to August 2011); Assistant General Counsel, Bank of America, 2005-April 2010; officer of Columbia Funds and affiliated funds since 2005. | |
Annual Report 2016
36
COLUMBIA AMT-FREE SOUTH CAROLINA INTERMEDIATE MUNI BOND FUND
IMPORTANT INFORMATION ABOUT THIS REPORT
Each fund mails one shareholder report to each shareholder address. If you would like more than one report, please call shareholder services at 800.345.6611 and additional reports will be sent to you.
The policy of the Board is to vote the proxies of the companies in which each fund holds investments consistent with the procedures as stated in the Statement of Additional Information (SAI). You may obtain a copy of the SAI without charge by calling 800.345.6611; contacting your financial intermediary; visiting columbiathreadneedle.com/us; or searching the website of the Securities and Exchange Commission (SEC) at sec.gov. Information regarding how each fund voted proxies relating to portfolio securities is filed with the SEC by August 31st for the most recent 12-month period ending June 30th of that year, and is available without charge by visiting columbiathreadneedle.com/us, or searching the website of the SEC at sec.gov.
Each fund files a complete schedule of portfolio holdings with the SEC for the first and third quarters of each fiscal year on Form N-Q. Each fund's Form N-Q is available on the SEC's website at sec.gov and may be reviewed and copied at the SEC's Public Reference Room in Washington, D.C. Information on the operation of the Public Reference Room may be obtained by calling 800.SEC.0330. Each fund's complete schedule of portfolio holdings, as filed on Form N-Q, can also be obtained without charge, upon request, by calling 800.345.6611.
Annual Report 2016
37
Columbia AMT-Free South Carolina Intermediate Muni Bond Fund
P.O. Box 8081
Boston, MA 02266-8081

This information is for use with concurrent or prior delivery of a fund prospectus. Please read and consider the investment objectives, risks, charges and expenses for any fund carefully before investing. For a prospectus and summary prospectus, which contains this and other important information about the Fund, go to columbiathreadneedle.com/us. The Fund is distributed by Columbia Management Investment Distributors, Inc., member FINRA, and managed by Columbia Management Investment Advisers, LLC.
Columbia Threadneedle Investments (Columbia Threadneedle) is the global brand name of the Columbia and Threadneedle group of companies.
All rights reserved. Columbia Management Investment Distributors, Inc., 225 Franklin Street, Boston, MA 02110-2804
© 2016 Columbia Management Investment Advisers, LLC.
columbiathreadneedle.com/us
ANN231_04_F01_(06/16)

ANNUAL REPORT
April 30, 2016

COLUMBIA AMT-FREE VIRGINIA INTERMEDIATE MUNI BOND FUND

ABOUT COLUMBIA THREADNEEDLE INVESTMENTS
Columbia Threadneedle Investments is a leading global asset management group that provides a broad range of actively managed investment strategies and solutions for individual, institutional and corporate clients around the world.
With more than 2,000 people, including over 450 investment professionals based in North America, Europe and Asia, we manage $464 billion* of assets across developed and emerging market equities, fixed income, asset allocation solutions and alternatives. We are the 13th largest manager of long-term mutual fund assets in the U.S.** and the 3rd largest manager of retail funds in the U.K.***
Our priority is the investment success of our clients. We aim to deliver the investment outcomes they expect through an investment approach that is team-based, performance-driven and risk-aware. Our culture is dynamic and interactive. By sharing our insights across asset classes and geographies, we generate richer perspectives on global, regional and local investment landscapes. The ability to exchange and debate investment ideas in a collaborative environment enriches our teams' investment processes. More importantly, it results in better informed investment decisions for our clients.
Columbia funds are distributed by Columbia Management Investment Distributors, Inc., member FINRA, and managed by Columbia Management Investment Advisers, LLC.
Columbia Threadneedle Investments (Columbia Threadneedle) is the global brand name of the Columbia and Threadneedle group of companies.
* In U.S. dollars as of March 31, 2016. Source: Ameriprise Q1 Earnings Release. Includes all assets managed by entities in the Columbia and Threadneedle group of companies. Contact us for more current data.
** Source: ICI as of March 31, 2016 for Columbia Management Investment Advisers, LLC.
*** Source: Investment Association as of December 2015 for Threadneedle Asset Management Limited.
© 2016 Columbia Management Investment Advisers, LLC. All rights reserved.
Not part of the shareholder report
 Dear Shareholders,
Volatility comes with the territory for long-term investors. Some investors instinctively want to pull out of the market or sell underperforming investments at the first sign of increased volatility or perhaps even as soon as they perceive it on the horizon. But taking yourself out of the market could mean losing out on potential opportunities, and putting your longer-term investment goals at risk.
Cumulative return is not just about achieving high returns when markets are going up; it's also about remaining invested and minimizing losses during weak or volatile markets so that you can participate on the upside. Developing a deeper understanding of the various risks your portfolio is subject to can help you balance these risks.
Diversification is critical in seeking to achieve that balance. We believe that most portfolios could be more effectively diversified either by introducing holdings with performance profiles unrelated to existing holdings (like alternative products) or by rebalancing existing holdings with an eye toward risk allocation. Over time, distributing risk more evenly may produce a more pronounced diversification benefit and may improve portfolio efficiency. We believe market volatility can create significant opportunities and, in fact, these periods may be some of the very best times to invest.
With this in mind, I thought it important to highlight excerpts from a piece written by Colin Moore, Global Chief Investment Officer, in which he touches on some of these issues emphasizing the importance of a properly constructed portfolio in seeking to effectively manage volatility and to achieve consistency of returns. I encourage you to read the article in its entirety. To access the full article and for other insights on current market, please visit blog.columbiathreadneedleus.com/latest-perspectives.
You need investments that are designed to help you ease the impact of volatile market environments and keep the savings you have worked tirelessly to amass. Columbia Threadneedle Investments provides investment solutions to help you tackle financial challenges and achieve your desired outcome.
Best regards,

Christopher O. Petersen
President, Columbia Funds
Excerpts from:
Taking the scare out of the volatility bogeyman
By Colin Moore, Global Chief Investment Officer
Colin Moore is the global chief investment officer for Columbia Threadneedle Investments. His responsibilities include ensuring that a disciplined investment process is in place across all asset classes, including equity and fixed income. Mr. Moore joined one of the Columbia Threadneedle Investments legacy firms in 2002 as head of equity and was also head of fixed income and liquidity strategies from 2009 – 2010.

n In today's low growth, higher volatility world, the emphasis is shifting from maximization of returns to consistency of returns.
PRESIDENT'S MESSAGE (continued)
n Portfolios should represent the behavioral risk-return tradeoff of investors, remembering that they won't stay invested to realize the return if we get the risk tolerance wrong.
n Holding long-term savings in cash to avoid volatility (the financial equivalent of hiding under the sheets) is detrimental to achieving long-term goals.
According to Wikipedia, "The bogeyman is a common allusion to a mythical creature in many cultures used to control behavior. This monster has no specific appearance, and conceptions about it can vary drastically from household to household within the same community; in many cases he has no set appearance in the mind of an adult or child, but is simply a non-specific embodiment of terror." Different cultures have different names and physical representations for the bogeyman, and investors are no different. We have terrible monsters that we fear may destroy our portfolios, and we call one of the scariest of them volatility.
While the bogeyman is mythical (I hope!), volatility is real and can cause serious damage. To understand why investors have such a hard time coping with volatility, we first need to define three cognitive biases at work in today's investment environment:
1) Recency bias — something that has recently come to the forefront of our attention, regardless of how long established it is, suddenly seems to appear with improbable frequency.
2) Negativity bias — we tend to have a greater recall of unpleasant memories than positive memories.
3) Loss aversion — our dissatisfaction with losing money tends to be greater than our satisfaction with making money.
The level of volatility varies dramatically, and so does investor fear and panic selling — waxing when volatility rises, waning when it falls. Recent studies have pointed to demographics as an important driver of panic selling. The theory is that as people get closer to retirement, the prospects of a large (20% – 30%) loss in financial assets can have a much more pronounced effect on their sense of well-being. Wealth preservation instincts kick in much more quickly than for younger (and typically less wealthy) savers.
The reality is that there is little opportunity for return without volatility. Therefore, the bogeyman effect of holding long-term savings in cash to avoid volatility (the financial equivalent of hiding under the sheets) is detrimental to achieving long-term goals. This effect tends to be more pronounced during the episodic spikes in volatility. The significant spike in volatility in 2008 and 2009 led to significant withdrawals from long-term investment funds over the same period. Less pronounced effects can also be seen when comparing 2001 – 2003 and 2011 – 2012. Conversely, flows picked up when volatility returned to "normal" levels. Investor behavior of this type is consistent with the three behavioral biases.
I believe average volatility will be higher over the next 10 years than the last 10 years and episodic spikes will increase in frequency because sustainable economic growth will be structurally lower and geopolitical risk higher than any time since World War II. Low growth creates uncertainty while loss aversion will make investors fear that we are one economic mishap or geopolitical event away from no growth or recession. The result will be higher volatility on average. Negativity bias will tend to exacerbate "spike" reactions to event-driven geopolitical news, and the volatility bogeyman will appear more often. Assuming the behavioral biases continue, investor returns are likely to be very disappointing regardless of the total return generated by financial markets due to the bogeyman effect.
To mitigate this effect, we need to focus on portfolio construction and an improved understanding of diversification. I accept that equities are likely to offer the highest return over the next 10 years, but they also offer the highest volatility. Many portfolio construction optimization tools use historical average volatility, which is likely to underestimate the volatility investors will face. The bogeyman emerges when individual asset class volatility spikes and cross correlations rise, the combination of which increases overall portfolio volatility far beyond expectation. Diversification is meant to protect investors against volatility, but what's the point of owning lots of investments if the volatility bogeyman has not been properly estimated?
Most importantly, portfolios should be constructed to properly represent the behavioral risk-return tradeoff of investors, remembering that they won't stay invested to realize the return if we get the risk tolerance wrong. In a low growth, higher volatility world, the emphasis is shifting to return consistency rather than return maximization,
PRESIDENT'S MESSAGE (continued)
and investors are best served through investment approaches that appreciate that distinction. Even though it's a permanent feature of financial markets, volatility is less likely to be the bogeyman we all fear if portfolios are constructed with this understanding.
Please visit blog.columbiathreadneedleus.com/latest-perspectives to read the entire article.
Investors should consider the investment objectives, risks, charges and expenses of a mutual fund carefully before investing. For a free prospectus and summary prospectus, which contains this and other important information about a fund, visit columbiathreadneedle.com/us. The prospectus should be read carefully before investing.
The views expressed are as of April 2016, may change as market or other conditions change, and may differ from views expressed by other Columbia Management Investment Advisers, LLC (CMIA) associates or affiliates. Actual investments or investment decisions made by CMIA and its affiliates, whether for its own account or on behalf of clients, will not necessarily reflect the views expressed. This information is not intended to provide investment advice and does not account for individual investor circumstances. Investment decisions should always be made based on an investor's specific financial needs, objectives, goals, time horizon and risk tolerance. Asset classes described may not be suitable for all investors.
Past performance does not guarantee future results, and no forecast should be considered a guarantee either. Since economic and market conditions change frequently, there can be no assurance that the trends described here will continue or that the forecasts are accurate.
Diversification does not guarantee a profit or protect against loss.
Columbia Funds are distributed by Columbia Management Investment Distributors, Inc., member FINRA, and managed by Columbia Management Investment Advisers, LLC.
© 2016 Columbia Management Investment Advisers, LLC. All rights reserved
COLUMBIA AMT-FREE VIRGINIA INTERMEDIATE MUNI BOND FUND
Fund Investment Manager
Columbia Management Investment
Advisers, LLC
225 Franklin Street
Boston, MA 02110
Fund Distributor
Columbia Management Investment
Distributors, Inc.
225 Franklin Street
Boston, MA 02110
Fund Transfer Agent
Columbia Management Investment
Services Corp.
P.O. Box 8081
Boston, MA 02266-8081
For more information about any of the funds, please visit columbiathreadneedle.com/us or call 800.345.6611. Customer Service Representatives are available to answer your questions Monday through Friday from 8 a.m. to 7 p.m. Eastern time.
The views expressed in this report reflect the current views of the respective parties. These views are not guarantees of future performance and involve certain risks, uncertainties and assumptions that are difficult to predict, so actual outcomes and results may differ significantly from the views expressed. These views are subject to change at any time based upon economic, market or other conditions and the respective parties disclaim any responsibility to update such views. These views may not be relied on as investment advice and, because investment decisions for a Columbia fund are based on numerous factors, may not be relied on as an indication of trading intent on behalf of any particular Columbia fund. References to specific securities should not be construed as a recommendation or investment advice.
Performance Overview | | | 3 | | |
Manager Discussion of Fund Performance | | | 5 | | |
Understanding Your Fund's Expenses | | | 7 | | |
Portfolio of Investments | | | 8 | | |
Statement of Assets and Liabilities | | | 15 | | |
Statement of Operations | | | 17 | | |
Statement of Changes in Net Assets | | | 18 | | |
Financial Highlights | | | 20 | | |
Notes to Financial Statements | | | 25 | | |
Report of Independent Registered Public Accounting Firm | | | 31 | | |
Federal Income Tax Information | | | 32 | | |
Trustees and Officers | | | 33 | | |
Important Information About This Report | | | 39 | | |
COLUMBIA AMT-FREE VIRGINIA INTERMEDIATE MUNI BOND FUND
Performance Summary
n Columbia AMT-Free Virginia Intermediate Muni Bond Fund (the Fund) Class A shares returned 3.65% excluding sales charges for the 12-month period that ended April 30, 2016. Class Z shares of the Fund returned 3.91% for the same time period.
n The Fund's benchmark, the Barclays 3-15 Year Blend Municipal Bond Index, returned 4.86% during the same time period.
n The Fund's higher quality bias, which reflects the composition of Virginia's municipal bond market, contributed to its underperformance versus the benchmark, which measures the national municipal bond market.
Average Annual Total Returns (%) (for period ended April 30, 2016)
| | | Inception | | 1 Year | | 5 Years | | 10 Years | |
Class A | | 12/05/89 | | | | | | | | | | | |
Excluding sales charges | | | | | | | 3.65 | | | | 3.40 | | | | 3.83 | | |
Including sales charges | | | | | | | 0.57 | | | | 2.78 | | | | 3.51 | | |
Class B | | 06/07/93 | | | | | | | | | | | | | |
Excluding sales charges | | | | | | | 2.87 | | | | 2.61 | | | | 3.04 | | |
Including sales charges | | | | | | | -0.13 | | | | 2.61 | | | | 3.04 | | |
Class C | | 06/17/92 | | | | | | | | | | | | | |
Excluding sales charges | | | | | | | 2.97 | | | | 2.63 | | | | 3.06 | | |
Including sales charges | | | | | | | 1.97 | | | | 2.63 | | | | 3.06 | | |
Class R4* | | 03/19/13 | | | 4.00 | | | | 3.68 | | | | 4.09 | | |
Class Z | | 09/20/89 | | | 3.91 | | | | 3.66 | | | | 4.09 | | |
Barclays 3-15 Year Blend Municipal Bond Index | | | | | | | 4.86 | | | | 4.61 | | | | 4.89 | | |
Returns for Class A are shown with and without the maximum initial sales charge of 3.00%. Returns for Class B are shown with and without the applicable contingent deferred sales charge (CDSC) of 3.00% in the first year, declining to 1.00% in the fourth year and eliminated thereafter. Returns for Class C are shown with and without the 1.00% CDSC for the first year only. The Fund's other classes are not subject to sales charges and have limited eligibility. Please see the Fund's prospectus for details. Performance for different share classes will vary based on differences in sales charges and fees associated with each class. All results shown assume reinvestment of distributions during the period. Returns do not reflect the deduction of taxes that a shareholder may pay on Fund distributions or on the redemption of Fund shares. Performance results reflect the effect of any fee waivers or reimbursements of Fund expenses by Columbia Management Investment Advisers, LLC and/or any of its affiliates. Absent these fee waivers or expense reimbursement arrangements, performance results would have been lower.
The performance information shown represents past performance and is not a guarantee of future results. The investment return and principal value of your investment will fluctuate so that your shares, when redeemed, may be worth more or less than their original cost. Current performance may be lower or higher than the performance information shown. You may obtain performance information current to the most recent month-end by contacting your financial intermediary, visiting columbiathreadneedle.com/us or calling 800.345.6611.
*The returns shown for periods prior to the share class inception date (including returns for the Life of the Fund, if shown, which are since Fund inception) include the returns of the Fund's oldest share class. These returns are adjusted to reflect any higher class-related operating expenses of the newer share classes, as applicable. Please visit columbiathreadneedle.com/us/investment-products/mutual-funds/appended-performance for more information.
The Barclays 3-15 Year Blend Municipal Bond Index is an unmanaged index that tracks the performance of municipal bonds issued after December 31, 1990, with remaining maturities between 2 and 17 years and at least $7 million in principal amount outstanding.
Indices are not available for investment, are not professionally managed and do not reflect sales charges, fees, brokerage commissions, taxes or other expenses of investing. Securities in the Fund may not match those in an index.
Annual Report 2016
3
COLUMBIA AMT-FREE VIRGINIA INTERMEDIATE MUNI BOND FUND
PERFORMANCE OVERVIEW (continued)
Performance of a Hypothetical $10,000 Investment (May 1, 2006 – April 30, 2016)

The chart above shows the change in value of a hypothetical $10,000 investment in Class A shares of Columbia AMT-Free Virginia Intermediate Muni Bond Fund during the stated time period, and does not reflect the deduction of taxes that a shareholder may pay on Fund distributions or on the redemption of Fund shares.
Annual Report 2016
4
COLUMBIA AMT-FREE VIRGINIA INTERMEDIATE MUNI BOND FUND
MANAGER DISCUSSION OF FUND PERFORMANCE
For the 12-month period that ended April 30, 2016, the Fund's Class A shares returned 3.65% excluding sales charges. Class Z shares of the Fund returned 3.91%. The Fund's benchmark, the Barclays 3-15 Year Blend Municipal Bond Index, returned 4.86% for the same time period. The Fund's higher quality bias, which reflects the composition of Virginia's municipal bond market, contributed to its underperformance versus the benchmark, which measures the national municipal bond market.
Market Overview
The U.S. municipal bond market produced a positive return and outperformed U.S. Treasuries during the reporting period, thanks in part to a highly favorable balance of supply and demand. Mutual fund cash flows provided a steady source of support for the market, with positive inflows for 30 consecutive weeks as of the close of the period. In the interval from October 2015 through April 2016 alone, inflows into municipal funds totaled over $27 billion. Insurance companies and banks were active buyers, as well. Supply was also strong, but almost half of the new issuance came from refunding deals — rather than new issuance — as issuers sought to take advantage of the cost savings from refinancing older, higher coupon debt. The refinancing activity added an additional layer of demand since many of the refundings were of currently callable bonds issued in 2005 or 2006. As a result, many investors who were taken out of older bonds reinvested the proceeds back into the market.
The strength of state and local finances throughout the United States, with the notable exceptions of New Jersey, Illinois, the City of Chicago, and Puerto Rico, further aided the performance of municipal bonds. Longer term securities generally provided superior returns versus shorter term issues, reflecting the latter category's low nominal yields. Lower quality bonds outpaced their higher quality counterparts, as investors' hearty appetite for risk fueled a continued reach for yield.
Mixed Results for Virginia's Economy and Bond Market
While Virginia's economy began to catch up with the national average during the reporting period, the results remained mixed overall. For example, employment and gross domestic product growth were both still below that of country as a whole, but personal income was higher. The recent cuts in federal spending were an important reason for this uneven data, but an improving outlook on this front augers well for the state's longer term prospects.
Although Virginia's economy remained in recovery mode, its bond market underperformed during the period. The state's debt tends to be highly rated, a relative headwind at a time in which investors displayed a preference for lower quality issues.
Contributors and Detractors
The Fund lagged the benchmark during the period, reflecting the impact of Virginia's higher credit quality relative to the benchmark, which is general municipal market index. Both the state and the Fund have a higher weighting in the AAA-rated credit tier than the benchmark, which was a headwind to performance in the past year. The Fund's allocation to A-rated
Portfolio Management
Brian McGreevy
Quality Breakdown (%)
(at April 30, 2016) | |
AAA rating | | | 17.5 | | |
AA rating | | | 51.6 | | |
A rating | | | 17.5 | | |
BBB rating | | | 9.1 | | |
Not rated | | | 4.3 | | |
Total | | | 100.0 | | |
Percentages indicated are based upon total fixed income investments (excluding Money Market Funds).
Bond ratings apply to the underlying holdings of the Fund and not the Fund itself and are divided into categories ranging from highest to lowest credit quality, determined by using the middle rating of Moody's, S&P and Fitch, after dropping the highest and lowest available ratings. When ratings are available from only two rating agencies, the lower rating is used. When a rating is available from only one rating agency, that rating is used. When a bond is not rated by any rating agency, it is designated as "Not rated." Credit quality ratings assigned by a rating agency are subjective opinions, not statements of fact, and are subject to change, including daily. The ratings assigned by credit rating agencies are but one of the considerations that the Investment Manager and/or Fund's subadviser incorporates into its credit analysis process, along with such other issuer-specific factors as cash flows, capital structure and leverage ratios, ability to de-leverage (repay) through free cash flow, quality of management, market positioning and access to capital, as well as such security-specific factors as the terms of the security (e.g., interest rate and time to maturity) and the amount and type of any collateral.
Annual Report 2016
5
COLUMBIA AMT-FREE VIRGINIA INTERMEDIATE MUNI BOND FUND
MANAGER DISCUSSION OF FUND PERFORMANCE (continued)
Investment Risks
Fixed-income securities present issuer default risk. The Fund invests substantially in municipal securities and will be affected by tax, legislative, regulatory, demographic or political changes, as well as changes impacting a state's financial, economic or other conditions. A relatively small number of tax-exempt issuers may necessitate the Fund investing more heavily in a single issuer and, therefore, be more exposed to the risk of loss than a Fund that invests more broadly. The value of the Fund's portfolio may be more volatile than a more geographically diversified fund. Prepayment and extension risk exists because a loan, bond or other investment may be called, prepaid or redeemed before maturity and similar yielding investments may not be available for purchase. A rise in interest rates may result in a price decline of fixed-income instruments held by the Fund, negatively impacting its performance and NAV. Falling rates may result in the Fund investing in lower yielding debt instruments, lowering the Fund's income and yield. These risks may be heightened for longer maturity and duration securities. Non-investment-grade (high-yield or junk) securities present greater price volatility and more risk to principal and income than higher rated securities. Market risk may affect a single issuer, sector of the economy, industry or the market as a whole. Federal and state tax rules apply to capital gain distributions and any gains or losses on sales. Income may be subject to state or local taxes. Liquidity risk is associated with the difficulty of selling underlying investments at a desirable time or price. See the Fund's prospectus for more information on these and other risks.
bonds, while lower than that of the benchmark, nonetheless outperformed due to its slightly longer maturity. Overall, however, the Fund had a somewhat shorter average maturity than the benchmark. This aspect of our positioning detracted from our results, with the largest impact coming from our underweight in bonds with maturities of 12 to 17 years. The Fund's allocation to cash and shorter maturity issues also detracted. On the other hand, our positions in longer term bonds outperformed the corresponding benchmark components thanks to their higher interest-rate sensitivity.
The Fund had an overweight exposure to pre-refunded bonds due to the heavy refinancing activity in the market. Since these bonds have shorter maturities, this aspect of our positioning detracted from performance. Local general-obligation debt also weighed on returns, as the higher quality and lower yields of these securities led them to outperform. On the plus side, the Fund's overweight position in hospitals generated solid returns, as did its investments in transportation and toll-road issues. Our holdings in the education sector finished in line with the averages.
The Fund had one position in Sweet Briar College, which underperformed in the fiscal year ended April 30, 2015 due to concerns that it was going to close. However, the bonds rebounded during the period on news that the college is working on a turnaround. Portfolio holdings in continuing-care retirement communities also generated good returns. These credits are typically of lower quality, and we tend to hold longer maturities within this group. As a result, the positions benefited from the outperformance of both lower rated and longer maturity debt.
Fund Positioning
We adopted a more cautious approach near the end of the period in response to the tightening of credit spreads, the improvement in municipal yields relative to U.S. Treasuries, and the flattening of the yield curve. Accordingly, we became more selective with respect to lower rated bonds in the investment-grade space. The yield curve was steep and attractive in spots near the end of the period, and we saw value in bonds with maturities in between 10 and 15 years. We also identified value in lower coupon issues, such as those in the 4% range (as opposed to the 5% coupons that generally dominate the market). Since the bonds continue to trade at premiums, we believe there is some protection from the adverse tax consequences associated with investments in discount bonds.
Annual Report 2016
6
COLUMBIA AMT-FREE VIRGINIA INTERMEDIATE MUNI BOND FUND
UNDERSTANDING YOUR FUND'S EXPENSES
(Unaudited)
As an investor, you incur two types of costs. There are transaction costs, which generally include sales charges on purchases and may include redemption fees. There are also ongoing costs, which generally include management fees, distribution and/or service fees, and other fund expenses. The following information is intended to help you understand your ongoing costs (in dollars) of investing in the Fund and to help you compare these costs with the ongoing costs of investing in other mutual funds.
Analyzing Your Fund's Expenses
To illustrate these ongoing costs, we have provided examples and calculated the expenses paid by investors in each share class of the Fund during the period. The actual and hypothetical information in the table is based on an initial investment of $1,000 at the beginning of the period indicated and held for the entire period. Expense information is calculated two ways and each method provides you with different information. The amount listed in the "Actual" column is calculated using the Fund's actual operating expenses and total return for the period. You may use the Actual information, together with the amount invested, to estimate the expenses that you paid over the period. Simply divide your account value by $1,000 (for example, an $8,600 account value divided by $1,000 = 8.6), then multiply the results by the expenses paid during the period under the "Actual" column. The amount listed in the "Hypothetical" column assumes a 5% annual rate of return before expenses (which is not the Fund's actual return) and then applies the Fund's actual expense ratio for the period to the hypothetical return. You should not use the hypothetical account values and expenses to estimate either your actual account balance at the end of the period or the expenses you paid during the period. See "Compare With Other Funds" below for details on how to use the hypothetical data.
Compare With Other Funds
Since all mutual funds are required to include the same hypothetical calculations about expenses in shareholder reports, you can use this information to compare the ongoing cost of investing in the Fund with other funds. To do so, compare the hypothetical example with the 5% hypothetical examples that appear in the shareholder reports of other funds. As you compare hypothetical examples of other funds, it is important to note that hypothetical examples are meant to highlight the ongoing costs of investing in a fund only and do not reflect any transaction costs, such as sales charges, or redemption or exchange fees. Therefore, the hypothetical calculations are useful in comparing ongoing costs only, and will not help you determine the relative total costs of owning different funds. If transaction costs were included in these calculations, your costs would be higher.
November 1, 2015 – April 30, 2016
| | | Account Value at the Beginning
of the Period ($) | | Account Value at the End of the
Period ($) | | Expenses Paid During the
Period ($) | | Fund's Annualized
Expense Ratio (%) | |
| | | Actual | | Hypothetical | | Actual | | Hypothetical | | Actual | | Hypothetical | | Actual | |
Class A | | | 1,000.00 | | | | 1,000.00 | | | | 1,025.90 | | | | 1,020.84 | | | | 4.08 | | | | 4.07 | | | | 0.81 | | |
Class B | | | 1,000.00 | | | | 1,000.00 | | | | 1,021.00 | | | | 1,017.11 | | | | 7.84 | | | | 7.82 | | | | 1.56 | | |
Class C | | | 1,000.00 | | | | 1,000.00 | | | | 1,022.00 | | | | 1,017.11 | | | | 7.84 | | | | 7.82 | | | | 1.56 | | |
Class R4 | | | 1,000.00 | | | | 1,000.00 | | | | 1,027.10 | | | | 1,022.08 | | | | 2.82 | | | | 2.82 | | | | 0.56 | | |
Class Z | | | 1,000.00 | | | | 1,000.00 | | | | 1,027.10 | | | | 1,022.08 | | | | 2.82 | | | | 2.82 | | | | 0.56 | | |
Expenses paid during the period are equal to the annualized expense ratio for each class as indicated above, multiplied by the average account value over the period and then multiplied by the number of days in the Fund's most recent fiscal half year and divided by 366.
Expenses do not include fees and expenses incurred indirectly by the Fund from its investment in underlying funds, including affiliated and non-affiliated pooled investment vehicles, such as mutual funds and exchange-traded funds.
Had Columbia Management Investment Advisers, LLC and/or certain of its affiliates not waived/reimbursed certain fees and expenses, account value at the end of the period would have been reduced.
Annual Report 2016
7
COLUMBIA AMT-FREE VIRGINIA INTERMEDIATE MUNI BOND FUND
PORTFOLIO OF INVESTMENTS
April 30, 2016
(Percentages represent value of investments compared to net assets)
Municipal Bonds 97.5%
Issue
Description | | Coupon
Rate | | Principal
Amount ($) | |
Value ($) | |
AIRPORT 6.2% | |
Metropolitan Washington Airports Authority
Refunding Revenue Bonds
Series 2010F-1
10/01/21 | | | 5.000 | % | | | 1,000,000 | | | | 1,194,970 | | |
Revenue Bonds
Series 2009B
10/01/21 | | | 5.000 | % | | | 3,000,000 | | | | 3,394,320 | | |
Series 2009C
10/01/23 | | | 5.000 | % | | | 3,000,000 | | | | 3,280,950 | | |
Series 2010A
10/01/23 | | | 5.000 | % | | | 2,475,000 | | | | 2,875,381 | | |
10/01/27 | | | 5.000 | % | | | 1,515,000 | | | | 1,740,508 | | |
Norfolk Airport Authority
Refunding Revenue Bonds
Series 2011 (AGM)
07/01/24 | | | 5.000 | % | | | 1,000,000 | | | | 1,168,660 | | |
Total | | | | | | | 13,654,789 | | |
HIGHER EDUCATION 9.2% | |
Amherst Industrial Development Authority
Refunding Revenue Bonds
Educational Facilities Sweet Briar Institute
Series 2006
09/01/26 | | | 5.000 | % | | | 1,000,000 | | | | 956,340 | | |
Lexington Industrial Development Authority
Revenue Bonds
VMI Development Board, Inc. Project
Series 2006A
12/01/20 | | | 5.000 | % | | | 1,400,000 | | | | 1,650,418 | | |
Lexington Industrial Development Authority(a)
Refunding Revenue Bonds
VMI Development Board, Inc.
Series 2016
12/01/30 | | | 4.000 | % | | | 1,500,000 | | | | 1,714,050 | | |
Virginia College Building Authority
Refunding Revenue Bonds
University of Richmond Project
Series 2011A
03/01/22 | | | 5.000 | % | | | 1,245,000 | | | | 1,478,051 | | |
Series 2011B
03/01/21 | | | 5.000 | % | | | 2,250,000 | | | | 2,664,000 | | |
Revenue Bonds
Liberty University Projects
Series 2010
03/01/19 | | | 5.000 | % | | | 1,000,000 | | | | 1,116,860 | | |
03/01/22 | | | 5.000 | % | | | 1,455,000 | | | | 1,661,028 | | |
03/01/23 | | | 5.000 | % | | | 2,000,000 | | | | 2,280,240 | | |
Washington & Lee University Project
Series 1998 (NPFGC)
01/01/26 | | | 5.250 | % | | | 3,115,000 | | | | 3,883,346 | | |
Municipal Bonds (continued)
Issue
Description | | Coupon
Rate | | Principal
Amount ($) | |
Value ($) | |
Virginia Polytechnic Institute & State University
Revenue Bonds
General Dorm and Dining Hall
Series 2015A
06/01/27 | | | 4.000 | % | | | 2,650,000 | | | | 3,067,375 | | |
Total | | | | | | | 20,471,708 | | |
HOSPITAL 11.5% | |
Augusta County Economic Development Authority
Refunding Revenue Bonds
Augusta Health Care, Inc.
Series 2003
09/01/19 | | | 5.250 | % | | | 905,000 | | | | 1,026,496 | | |
Fairfax County Industrial Development Authority
Refunding Revenue Bonds
Inova Health System Project
Series 1993
08/15/19 | | | 5.250 | % | | | 1,000,000 | | | | 1,072,760 | | |
Series 1993I (NPFGC)
08/15/19 | | | 5.250 | % | | | 1,000,000 | | | | 1,060,770 | | |
Revenue Bonds
Inova Health System
Series 2009C
05/15/25 | | | 5.000 | % | | | 1,000,000 | | | | 1,116,900 | | |
Fairfax County Industrial Development Authority(a)
Refunding Revenue Bonds
Inova Health System Project
Series 2016
05/15/30 | | | 5.000 | % | | | 1,000,000 | | | | 1,244,900 | | |
Fredericksburg Economic Development Authority
Refunding Revenue Bonds
MediCorp Health Systems Obligation
Series 2007
06/15/18 | | | 5.250 | % | | | 1,000,000 | | | | 1,066,560 | | |
06/15/20 | | | 5.250 | % | | | 4,000,000 | | | | 4,462,600 | | |
Norfolk Economic Development Authority
Refunding Revenue Bonds
Sentara Healthcare
Series 2012B
11/01/27 | | | 5.000 | % | | | 1,735,000 | | | | 2,040,013 | | |
Roanoke Economic Development Authority
Refunding Revenue Bonds
Carilion Clinic Obligation Group
Series 2010
07/01/25 | | | 5.000 | % | | | 3,500,000 | | | | 3,978,415 | | |
Revenue Bonds
Carilion Clinic Obligation Group
Series 2012
07/01/22 | | | 5.000 | % | | | 2,000,000 | | | | 2,405,940 | | |
07/01/23 | | | 5.000 | % | | | 1,000,000 | | | | 1,180,690 | | |
The accompanying Notes to Financial Statements are an integral part of this statement.
Annual Report 2016
8
COLUMBIA AMT-FREE VIRGINIA INTERMEDIATE MUNI BOND FUND
PORTFOLIO OF INVESTMENTS (continued)
April 30, 2016
Municipal Bonds (continued)
Issue
Description | | Coupon
Rate | | Principal
Amount ($) | |
Value ($) | |
Stafford County Economic Development Authority(a)
Refunding Revenue Bonds
Mary Washington Healthcare
Series 2016
06/15/33 | | | 5.000 | % | | | 200,000 | | | | 235,040 | | |
06/15/35 | | | 5.000 | % | | | 1,000,000 | | | | 1,170,430 | | |
Virginia Small Business Financing Authority
Revenue Bonds
Wellmont Health System Project
Series 2007A
09/01/22 | | | 5.125 | % | | | 710,000 | | | | 744,719 | | |
Winchester Economic Development Authority
Refunding Revenue Bonds
Valley Health System Obligation Group
Series 2015
01/01/32 | | | 5.000 | % | | | 1,250,000 | | | | 1,483,888 | | |
Revenue Bonds
Valley Health System Obligation Group
Series 2007
01/01/26 | | | 5.000 | % | | | 1,075,000 | | | | 1,103,133 | | |
Total | | | | | | | 25,393,254 | | |
INVESTOR OWNED 1.0% | |
Chesterfield County Economic Development Authority
Refunding Revenue Bonds
Virginia Electric & Power Co.
Series 2009A
05/01/23 | | | 5.000 | % | | | 2,000,000 | | | | 2,238,620 | | |
LOCAL APPROPRIATION 5.3% | |
Appomattox County Economic Development Authority
Refunding Revenue Bonds
Series 2010
05/01/22 | | | 5.000 | % | | | 1,490,000 | | | | 1,674,506 | | |
Fairfax County Economic Development Authority
Revenue Bonds
Six Public Facilities Projects
Series 2010
04/01/24 | | | 4.000 | % | | | 1,340,000 | | | | 1,432,929 | | |
Henrico County Economic Development Authority
Refunding Revenue Bonds
Series 2009B
08/01/21 | | | 4.500 | % | | | 1,770,000 | | | | 1,970,612 | | |
Loudoun County Economic Development Authority
Revenue Bonds
Loudoun County Roads & Public Facilities Project
Series 2015
12/01/25 | | | 5.000 | % | | | 3,000,000 | | | | 3,855,660 | | |
Series 2015
12/01/28 | | | 5.000 | % | | | 1,035,000 | | | | 1,283,659 | | |
Municipal Bonds (continued)
Issue
Description | | Coupon
Rate | | Principal
Amount ($) | |
Value ($) | |
Virginia Beach Development Authority
Revenue Bonds
Series 2010C
08/01/23 | | | 5.000 | % | | | 1,380,000 | | | | 1,592,244 | | |
Total | | | | | | | 11,809,610 | | |
LOCAL GENERAL OBLIGATION 10.8% | |
City of Hampton
Limited General Obligation Refunding &
Public Improvement Bonds
Series 2010A
01/15/19 | | | 4.000 | % | | | 2,000,000 | | | | 2,171,160 | | |
City of Lynchburg
Unlimited General Obligation Public Improvement Bonds
Series 2009A
08/01/20 | | | 5.000 | % | | | 525,000 | | | | 595,424 | | |
08/01/21 | | | 5.000 | % | | | 530,000 | | | | 598,084 | | |
City of Manassas Park
Unlimited General Obligation Refunding Bonds
Series 2008 (AGM)
01/01/22 | | | 5.000 | % | | | 1,205,000 | | | | 1,285,132 | | |
City of Newport News
Unlimited General Obligation Refunding & Improvement
Bonds Water
Series 2007B
07/01/20 | | | 5.250 | % | | | 2,000,000 | | | | 2,352,740 | | |
City of Portsmouth
Unlimited General Obligation Refunding Bonds
Public Utilities
Series 2012A
07/15/21 | | | 5.000 | % | | | 3,000,000 | | | | 3,588,870 | | |
City of Richmond
Unlimited General Obligation Bonds
Public Improvement
Series 2015B
03/01/28 | | | 4.000 | % | | | 2,000,000 | | | | 2,306,220 | | |
Unlimited General Obligation Public Improvement Bonds
Series 2010D
07/15/22 | | | 5.000 | % | | | 575,000 | | | | 669,743 | | |
07/15/24 | | | 5.000 | % | | | 1,000,000 | | | | 1,161,800 | | |
City of Suffolk
Unlimited General Obligation Refunding Bonds
Series 2014
02/01/29 | | | 4.000 | % | | | 2,000,000 | | | | 2,277,760 | | |
County of Fairfax
Unlimited General Obligation Refunding Bonds
Public Improvement
Series 2016A
10/01/26 | | | 4.000 | % | | | 2,000,000 | | | | 2,411,260 | | |
County of Smyth
Unlimited General Obligation Bonds
Public Improvement
Series 2011A
11/01/31 | | | 5.000 | % | | | 4,000,000 | | | | 4,606,840 | | |
Total | | | | | | | 24,025,033 | | |
The accompanying Notes to Financial Statements are an integral part of this statement.
Annual Report 2016
9
COLUMBIA AMT-FREE VIRGINIA INTERMEDIATE MUNI BOND FUND
PORTFOLIO OF INVESTMENTS (continued)
April 30, 2016
Municipal Bonds (continued)
Issue
Description | | Coupon
Rate | | Principal
Amount ($) | |
Value ($) | |
OTHER REVENUE 1.0% | |
Rappahannock Regional Jail Authority
Refunding Revenue Bonds
Series 2015
10/01/30 | | | 5.000 | % | | | 1,725,000 | | | | 2,121,198 | | |
OTHER UTILITY 0.5% | |
City of Richmond
Revenue Bonds
Series 2007 (AGM)
01/15/21 | | | 4.500 | % | | | 1,000,000 | | | | 1,027,300 | | |
POOL/BOND BANK 11.9% | |
Virginia Public School Authority
Refunding Revenue Bonds
School Financing
Series 2009C
08/01/25 | | | 4.000 | % | | | 2,560,000 | | | | 2,807,885 | | |
Virginia Resources Authority
Refunding Revenue Bonds
Revolving Fund
Series 2011A
08/01/24 | | | 5.000 | % | | | 1,395,000 | | | | 1,643,798 | | |
Series 2015
10/01/27 | | | 5.000 | % | | | 1,500,000 | | | | 1,907,925 | | |
State Revolving Fund
Subordinated Series 2005
10/01/19 | | | 5.500 | % | | | 4,000,000 | | | | 4,628,200 | | |
10/01/20 | | | 5.500 | % | | | 3,500,000 | | | | 4,188,835 | | |
10/01/21 | | | 5.500 | % | | | 6,475,000 | | | | 7,982,056 | | |
Unrefunded Revenue Bonds
Series 2009B
11/01/18 | | | 4.000 | % | | | 2,000,000 | | | | 2,160,860 | | |
St. Moral
Series 2009B
11/01/18 | | | 4.000 | % | | | 965,000 | | | | 1,040,685 | | |
Total | | | | | | | 26,360,244 | | |
REFUNDED/ESCROWED 12.7% | |
City of Newport News Water
Prerefunded 06/01/17 Revenue Bonds
Series 2007 (AGM)
06/01/19 | | | 5.000 | % | | | 1,035,000 | | | | 1,084,111 | | |
City of Newport News
Prerefunded 07/01/20 Unlimited General Obligation
Improvement Bonds
Series 2011A
07/01/23 | | | 5.000 | % | | | 1,380,000 | | | | 1,609,315 | | |
County of Fairfax
Prerefunded 04/01/21 Unlimited General Obligation
Refunding Bonds
Public Improvement
Series 2011A
04/01/24 | | | 4.000 | % | | | 2,000,000 | | | | 2,285,940 | | |
Municipal Bonds (continued)
Issue
Description | | Coupon
Rate | | Principal
Amount ($) | |
Value ($) | |
County of Henrico
Prerefunded 12/01/18 Unlimited General Obligation
Public Improvement Bonds
Series 2008A
12/01/21 | | | 5.000 | % | | | 1,000,000 | | | | 1,108,660 | | |
County of Pittsylvania
Prerefunded 02/01/19 Unlimited General Obligation
Bonds
Series 2008B
02/01/23 | | | 5.500 | % | | | 1,030,000 | | | | 1,161,912 | | |
County of Spotsylvania Water & Sewer
Prerefunded 06/01/17 Revenue Bonds
Series 2007 (AGM)
06/01/19 | | | 5.000 | % | | | 1,030,000 | | | | 1,079,110 | | |
Fairfax County Economic Development Authority
Prerefunded 04/01/20 Special Tax Bonds
Silver Line Phase I Project
Series 2011
04/01/26 | | | 5.000 | % | | | 4,185,000 | | | | 4,843,008 | | |
Hampton Roads Sanitation District
Prerefunded 04/01/18 Revenue Bonds
Series 2008
04/01/22 | | | 5.000 | % | | | 1,000,000 | | | | 1,081,860 | | |
04/01/24 | | | 5.000 | % | | | 3,000,000 | | | | 3,245,580 | | |
Prerefunded 11/01/19 Revenue Bonds
Series 2011
11/01/24 | | | 5.000 | % | | | 1,750,000 | | | | 2,000,075 | | |
11/01/25 | | | 5.000 | % | | | 1,380,000 | | | | 1,577,202 | | |
Montgomery County Industrial Development Authority
Prerefunded 02/01/18 Revenue Bonds
Public Projects
Series 2008
02/01/29 | | | 5.000 | % | | | 1,000,000 | | | | 1,074,610 | | |
Richmond Metropolitan Transportation Authority (The)
Refunding Revenue Bonds
Series 1998 Escrowed to Maturity (NPFGC)
07/15/17 | | | 5.250 | % | | | 285,000 | | | | 293,772 | | |
Virginia Resources Authority
Prerefunded 10/01/18 Revenue Bonds
State Revolving Fund
Subordinated Series 2008
10/01/29 | | | 5.000 | % | | | 5,000,000 | | | | 5,507,800 | | |
Revenue Bonds
Series 2009B Escrowed to Maturity
11/01/18 | | | 4.000 | % | | | 130,000 | | | | 140,444 | | |
St. Moral
Series 2009B Escrowed to Maturity
11/01/18 | | | 4.000 | % | | | 35,000 | | | | 37,812 | | |
Total | | | | | | | 28,131,211 | | |
The accompanying Notes to Financial Statements are an integral part of this statement.
Annual Report 2016
10
COLUMBIA AMT-FREE VIRGINIA INTERMEDIATE MUNI BOND FUND
PORTFOLIO OF INVESTMENTS (continued)
April 30, 2016
Municipal Bonds (continued)
Issue
Description | | Coupon
Rate | | Principal
Amount ($) | |
Value ($) | |
RETIREMENT COMMUNITIES 4.0% | |
Albermarle County Economic Development Authority
Revenue Bonds
Westminster-Canterbury of the Blue Ridge
Series 2012
01/01/32 | | | 4.625 | % | | | 2,000,000 | | | | 2,067,720 | | |
Fairfax County Economic Development Authority
Refunding Revenue Bonds
Retirement-Greenspring Village, Inc.
Series 2006A
10/01/26 | | | 4.750 | % | | | 1,500,000 | | | | 1,524,330 | | |
Revenue Bonds
Goodwin House, Inc.
Series 2007
10/01/22 | | | 5.000 | % | | | 2,500,000 | | | | 2,620,475 | | |
Hanover County Economic Development Authority
Revenue Bonds
Covenant Woods
Series 2012A
07/01/22 | | | 4.000 | % | | | 1,320,000 | | | | 1,366,688 | | |
Henrico County Economic Development Authority
Refunding Revenue Bonds
Westminster-Canterbury Corp.
Series 2015
10/01/35 | | | 4.000 | % | | | 1,320,000 | | | | 1,348,961 | | |
Total | | | | | | | 8,928,174 | | |
SALES TAX 1.1% | |
Northern Virginia Transportation Authority
Revenue Bonds
Series 2014
06/01/32 | | | 5.000 | % | | | 2,000,000 | | | | 2,414,500 | | |
SPECIAL NON PROPERTY TAX 6.7% | |
Greater Richmond Convention Center Authority
Refunding Revenue Bonds
Series 2015
06/15/29 | | | 5.000 | % | | | 1,350,000 | | | | 1,647,513 | | |
06/15/30 | | | 5.000 | % | | | 1,540,000 | | | | 1,868,605 | | |
Riverside Regional Jail Authority
Refunding Revenue Bonds
Series 2015
07/01/28 | | | 5.000 | % | | | 2,685,000 | | | | 3,318,875 | | |
Territory of Guam
Revenue Bonds
Series 2011A(b)
01/01/31 | | | 5.000 | % | | | 850,000 | | | | 955,001 | | |
Municipal Bonds (continued)
Issue
Description | | Coupon
Rate | | Principal
Amount ($) | |
Value ($) | |
Virgin Islands Public Finance Authority(b)
Revenue Bonds
Matching Fund Loan Notes-Senior Lien
Series 2010A
10/01/25 | | | 5.000 | % | | | 2,450,000 | | | | 2,739,712 | | |
Series 2012A
10/01/32 | | | 5.000 | % | | | 2,210,000 | | | | 2,393,850 | | |
Western Regional Jail Authority
Refunding Revenue Bonds
Series 2015
12/01/27 | | | 5.000 | % | | | 1,500,000 | | | | 1,873,410 | | |
Total | | | | | | | 14,796,966 | | |
SPECIAL PROPERTY TAX 4.7% | |
Dulles Town Center Community Development Authority
Refunding Special Assessment Bonds
Dulles Town Center Project
Series 2012
03/01/23 | | | 4.000 | % | | | 1,000,000 | | | | 1,032,570 | | |
Fairfax County Economic Development Authority
Refunding Special Tax Bonds
Silver Line Phase I Project
Series 2016
04/01/31 | | | 4.000 | % | | | 1,000,000 | | | | 1,139,560 | | |
04/01/32 | | | 4.000 | % | | | 1,000,000 | | | | 1,131,070 | | |
Special Tax Bonds
Silver Line Phase I Project
Series 2011
04/01/19 | | | 5.000 | % | | | 3,000,000 | | | | 3,357,180 | | |
Marquis Community Development Authority of York County(c)(d)
Tax Allocation Bonds
Series 2007C
09/01/41 | | | 0.000 | % | | | 3,164,000 | | | | 428,279 | | |
Marquis Community Development Authority of York County(c)(d)(e)
Revenue Bonds
Convertible
Series 2015
09/01/45 | | | 0.000 | % | | | 644,000 | | | | 419,965 | | |
Marquis Community Development Authority of York County(d)
Tax Allocation Bonds
Series 2007B
09/01/41 | | | 5.625 | % | | | 2,084,000 | | | | 1,682,518 | | |
Shops at White Oak Village Community Development
Authority (The)
Special Assessment Bonds
Series 2007
03/01/17 | | | 5.300 | % | | | 389,000 | | | | 398,293 | | |
Virginia Gateway Community Development Authority
Refunding Special Assessment Bonds
Series 2012
03/01/25 | | | 5.000 | % | | | 690,000 | | | | 730,365 | | |
Total | | | | | | | 10,319,800 | | |
The accompanying Notes to Financial Statements are an integral part of this statement.
Annual Report 2016
11
COLUMBIA AMT-FREE VIRGINIA INTERMEDIATE MUNI BOND FUND
PORTFOLIO OF INVESTMENTS (continued)
April 30, 2016
Municipal Bonds (continued)
Issue
Description | | Coupon
Rate | | Principal
Amount ($) | |
Value ($) | |
TRANSPORTATION 1.6% | |
Virginia Commonwealth Transportation Board
Revenue Bonds
Capital Projects
Series 2012
05/15/29 | | | 5.000 | % | | | 3,000,000 | | | | 3,591,630 | | |
TURNPIKE/BRIDGE/TOLL ROAD 5.3% | |
Chesapeake Bay Bridge & Tunnel District
Refunding Revenue Bonds
General Resolution
Series 1998 (NPFGC)
07/01/25 | | | 5.500 | % | | | 4,000,000 | | | | 5,060,560 | | |
City of Chesapeake Expressway Toll Road
Revenue Bonds
Transportation System
Senior Series 2012A
07/15/23 | | | 5.000 | % | | | 1,025,000 | | | | 1,200,890 | | |
07/15/27 | | | 5.000 | % | | | 1,000,000 | | | | 1,154,600 | | |
Metropolitan Washington Airports Authority Dulles Toll
Road
Revenue Bonds
Capital Appreciation-2nd Senior Lien
Series 2009B (AGM)(c)
10/01/23 | | | 0.000 | % | | | 5,000,000 | | | | 4,097,500 | | |
Richmond Metropolitan Transportation Authority (The)
Refunding Revenue Bonds
Series 1998 (NPFGC)
07/15/17 | | | 5.250 | % | | | 155,000 | | | | 158,965 | | |
Total | | | | | | | 11,672,515 | | |
WATER & SEWER 4.0% | |
City of Norfolk Water
Refunding Revenue Bonds
Series 2012
11/01/19 | | | 5.000 | % | | | 1,000,000 | | | | 1,140,290 | | |
Municipal Bonds (continued)
Issue
Description | | Coupon
Rate | | Principal
Amount ($) | |
Value ($) | |
County of Fairfax Sewer
Refunding Revenue Bonds
Series 2016A(a)
07/15/30 | | | 5.000 | % | | | 1,000,000 | | | | 1,277,050 | | |
Fairfax County Water Authority
Subordinated Refunding Revenue Bonds
Series 2005B
04/01/19 | | | 5.250 | % | | | 1,835,000 | | | | 2,072,375 | | |
Guam Government Waterworks Authority
Revenue Bonds
Series 2016(b)
07/01/36 | | | 5.000 | % | | | 350,000 | | | | 406,959 | | |
Hampton Roads Sanitation District
Refunding Subordinated Revenue Bonds
Series 2016A
08/01/31 | | | 5.000 | % | | | 2,000,000 | | | | 2,515,740 | | |
Upper Occoquan Sewage Authority
Revenue Bonds
Series 1995A (NPFGC)
07/01/20 | | | 5.150 | % | | | 1,295,000 | | | | 1,412,897 | | |
Total | | | | | | | 8,825,311 | | |
Total Municipal Bonds
(Cost: $200,350,897) | | | | | | | 215,781,863 | | |
Total Investments
(Cost: $200,350,897) | | | | | | | 215,781,863 | | |
Other Assets & Liabilities, Net | | | | | | | 5,598,548 | | |
Net Assets | | | | | | | 221,380,411 | | |
Notes to Portfolio of Investments
(a) Security, or a portion thereof, has been purchased on a when-issued or delayed delivery basis.
(b) Municipal obligations include debt obligations issued by or on behalf of territories, possessions, or sovereign nations within the territorial boundaries of the United States. At April 30, 2016, the value of these securities amounted to $6,495,522 or 2.93% of net assets.
(c) Zero coupon bond.
The accompanying Notes to Financial Statements are an integral part of this statement.
Annual Report 2016
12
COLUMBIA AMT-FREE VIRGINIA INTERMEDIATE MUNI BOND FUND
PORTFOLIO OF INVESTMENTS (continued)
April 30, 2016
Notes to Portfolio of Investments (continued)
(d) Identifies securities considered by the Investment Manager to be illiquid and may be difficult to sell. The aggregate value of such securities at April 30, 2016 was $2,530,762, which represents 1.14% of net assets. Information concerning such security holdings at April 30, 2016 is as follows:
Security Description | | Acquisition Dates | | Cost ($) | |
Marquis Community Development Authority of York County
Tax Allocation Bonds
Series 2007B
09/01/41 5.625% | | 11/30/2007 | | | 2,084,000 | | |
Marquis Community Development Authority of York County
Tax Allocation Bonds
Series 2007C
09/01/41 0.000% | | 11/30/2007 | | | 926,385 | | |
Marquis Community Development Authority of York County
Revenue Bonds
Convertible
Series 2015
09/01/45 0.000% | | 10/27/2015 | | | 434,801 | | |
(e) Represents privately placed and other securities and instruments exempt from SEC registration (collectively, private placements), such as Section 4(a)(2) and Rule 144A eligible securities, which are often sold only to qualified institutional buyers. The Fund may invest in private placements determined to be liquid as well as those determined to be illiquid. Private placements may be determined to be liquid under guidelines established by the Fund's Board of Trustees. At April 30, 2016, the value of these securities amounted to $419,965 or 0.19% of net assets.
Abbreviation Legend
AGM Assured Guaranty Municipal Corporation
NPFGC National Public Finance Guarantee Corporation
Fair Value Measurements
The Fund categorizes its fair value measurements according to a three-level hierarchy that maximizes the use of observable inputs and minimizes the use of unobservable inputs by prioritizing that the most observable input be used when available. Observable inputs are those that market participants would use in pricing an investment based on market data obtained from sources independent of the reporting entity. Unobservable inputs are those that reflect the Fund's assumptions about the information market participants would use in pricing an investment. An investment's level within the fair value hierarchy is based on the lowest level of any input that is deemed significant to the asset's or liability's fair value measurement. The input levels are not necessarily an indication of the risk or liquidity associated with investments at that level. For example, certain U.S. government securities are generally high quality and liquid, however, they are reflected as Level 2 because the inputs used to determine fair value may not always be quoted prices in an active market.
Fair value inputs are summarized in the three broad levels listed below:
> Level 1 — Valuations based on quoted prices for investments in active markets that the Fund has the ability to access at the measurement date (including NAV for open-end mutual funds). Valuation adjustments are not applied to Level 1 investments.
> Level 2 — Valuations based on other significant observable inputs (including quoted prices for similar securities, interest rates, prepayment speeds, credit risks, etc.).
> Level 3 — Valuations based on significant unobservable inputs (including the Fund's own assumptions and judgment in determining the fair value of investments).
Inputs that are used in determining fair value of an investment may include price information, credit data, volatility statistics, and other factors. These inputs can be either observable or unobservable. The availability of observable inputs can vary between investments, and is affected by various factors such as the type of investment, and the volume and level of activity for that investment or similar investments in the marketplace. The inputs will be considered by the Investment Manager, along with any other relevant factors in the calculation of an investment's fair value. The Fund uses prices and inputs that are current as of the measurement date, which may include periods of market dislocations. During these periods, the availability of prices and inputs may be reduced for many investments. This condition could cause an investment to be reclassified between the various levels within the hierarchy.
The accompanying Notes to Financial Statements are an integral part of this statement.
Annual Report 2016
13
COLUMBIA AMT-FREE VIRGINIA INTERMEDIATE MUNI BOND FUND
PORTFOLIO OF INVESTMENTS (continued)
April 30, 2016
Fair Value Measurements (continued)
Investments falling into the Level 3 category are primarily supported by quoted prices from brokers and dealers participating in the market for those investments. However, these may be classified as Level 3 investments due to lack of market transparency and corroboration to support these quoted prices. Additionally, valuation models may be used as the pricing source for any remaining investments classified as Level 3. These models may rely on one or more significant unobservable inputs and/or significant assumptions by the Investment Manager. Inputs used in valuations may include, but are not limited to, financial statement analysis, capital account balances, discount rates and estimated cash flows, and comparable company data.
Under the direction of the Fund's Board of Trustees (the Board), the Investment Manager's Valuation Committee (the Committee) is responsible for overseeing the valuation procedures approved by the Board. The Committee consists of voting and non-voting members from various groups within the Investment Manager's organization, including operations and accounting, trading and investments, compliance, risk management and legal.
The Committee meets at least monthly to review and approve valuation matters, which may include a description of specific valuation determinations, data regarding pricing information received from approved pricing vendors and brokers and the results of Board-approved valuation control policies and procedures (the Policies). The Policies address, among other things, instances when market quotations are or are not readily available, including recommendations of third party pricing vendors and a determination of appropriate pricing methodologies; events that require specific valuation determinations and assessment of fair value techniques; securities with a potential for stale pricing, including those that are illiquid, restricted, or in default; and the effectiveness of third party pricing vendors, including periodic reviews of vendors. The Committee meets more frequently, as needed, to discuss additional valuation matters, which may include the need to review back-testing results, review time-sensitive information or approve related valuation actions. The Committee reports to the Board, with members of the Committee meeting with the Board at each of its regularly scheduled meetings to discuss valuation matters and actions during the period, similar to those described earlier.
For investments categorized as Level 3, the Committee monitors information similar to that described above, which may include: (i) data specific to the issuer or comparable issuers, (ii) general market or specific sector news and (iii) quoted prices and specific or similar security transactions. The Committee considers this data and any changes from prior periods in order to assess the reasonableness of observable and unobservable inputs, any assumptions or internal models used to value those securities and changes in fair value. This data is also used to corroborate, when available, information received from approved pricing vendors and brokers. Various factors impact the frequency of monitoring this information (which may occur as often as daily). However, the Committee may determine that changes to inputs, assumptions and models are not required as a result of the monitoring procedures performed.
The following table is a summary of the inputs used to value the Fund's investments at April 30, 2016:
| | | Level 1
Quoted Prices in Active
Markets for Identical
Assets ($) | |
Level 2
Other Significant
Observable Inputs ($) | |
Level 3
Significant
Unobservable Inputs ($) | |
Total ($) | |
Investments | |
Municipal Bonds | | | — | | | | 215,781,863 | | | | — | | | | 215,781,863 | | |
Total Investments | | | — | | | | 215,781,863 | | | | — | | | | 215,781,863 | | |
See the Portfolio of Investments for all investment classifications not indicated in the table.
The Fund's assets assigned to the Level 2 input category are generally valued using the market approach, in which a security's value is determined through reference to prices and information from market transactions for similar or identical assets.
There were no transfers of financial assets between levels during the period.
The accompanying Notes to Financial Statements are an integral part of this statement.
Annual Report 2016
14
COLUMBIA AMT-FREE VIRGINIA INTERMEDIATE MUNI BOND FUND
STATEMENT OF ASSETS AND LIABILITIES
April 30, 2016
Assets | |
Investments, at value | |
(identified cost $200,350,897) | | $ | 215,781,863 | | |
Cash | | | 9,549,209 | | |
Receivable for: | |
Capital shares sold | | | 320,098 | | |
Interest | | | 2,131,314 | | |
Expense reimbursement due from Investment Manager | | | 864 | | |
Prepaid expenses | | | 764 | | |
Other assets | | | 3,804 | | |
Total assets | | | 227,787,916 | | |
Liabilities | |
Payable for: | |
Investments purchased on a delayed delivery basis | | | 5,639,351 | | |
Capital shares purchased | | | 45,313 | | |
Dividend distributions to shareholders | | | 533,178 | | |
Investment management fees | | | 2,840 | | |
Distribution and/or service fees | | | 427 | | |
Transfer agent fees | | | 32,200 | | |
Compensation of board members | | | 122,613 | | |
Other expenses | | | 31,583 | | |
Total liabilities | | | 6,407,505 | | |
Net assets applicable to outstanding capital stock | | $ | 221,380,411 | | |
Represented by | |
Paid-in capital | | $ | 204,770,826 | | |
Undistributed net investment income | | | 555,754 | | |
Accumulated net realized gain | | | 622,865 | | |
Unrealized appreciation (depreciation) on: | |
Investments | | | 15,430,966 | | |
Total — representing net assets applicable to outstanding capital stock | | $ | 221,380,411 | | |
The accompanying Notes to Financial Statements are an integral part of this statement.
Annual Report 2016
15
COLUMBIA AMT-FREE VIRGINIA INTERMEDIATE MUNI BOND FUND
STATEMENT OF ASSETS AND LIABILITIES (continued)
April 30, 2016
Class A | |
Net assets | | $ | 42,045,754 | | |
Shares outstanding | | | 3,759,923 | | |
Net asset value per share | | $ | 11.18 | | |
Maximum offering price per share(a) | | $ | 11.53 | | |
Class B | |
Net assets | | $ | 10,765 | | |
Shares outstanding | | | 963 | | |
Net asset value per share | | $ | 11.18 | | |
Class C | |
Net assets | | $ | 5,141,156 | | |
Shares outstanding | | | 459,567 | | |
Net asset value per share | | $ | 11.19 | | |
Class R4 | |
Net assets | | $ | 506,046 | | |
Shares outstanding | | | 45,281 | | |
Net asset value per share | | $ | 11.18 | | |
Class Z | |
Net assets | | $ | 173,676,690 | | |
Shares outstanding | | | 15,533,416 | | |
Net asset value per share | | $ | 11.18 | | |
(a) The maximum offering price per share is calculated by dividing the net asset value per share by 1.0 minus the maximum sales charge of 3.00%.
The accompanying Notes to Financial Statements are an integral part of this statement.
Annual Report 2016
16
COLUMBIA AMT-FREE VIRGINIA INTERMEDIATE MUNI BOND FUND
STATEMENT OF OPERATIONS
Year Ended April 30, 2016
Net investment income | |
Income: | |
Interest | | $ | 7,721,020 | | |
Total income | | | 7,721,020 | | |
Expenses: | |
Investment management fees | | | 1,030,573 | | |
Distribution and/or service fees | |
Class A | | | 111,015 | | |
Class B | | | 195 | | |
Class C | | | 47,657 | | |
Transfer agent fees | |
Class A | | | 85,459 | | |
Class B | | | 37 | | |
Class C | | | 9,157 | | |
Class R4 | | | 1,196 | | |
Class Z | | | 325,970 | | |
Compensation of board members | | | 10,154 | | |
Custodian fees | | | 2,510 | | |
Printing and postage fees | | | 21,257 | | |
Registration fees | | | 27,119 | | |
Audit fees | | | 27,051 | | |
Legal fees | | | 8,193 | | |
Other | | | 13,100 | | |
Total expenses | | | 1,720,643 | | |
Fees waived or expenses reimbursed by Investment Manager and its affiliates | | | (336,395 | ) | |
Expense reductions | | | (20 | ) | |
Total net expenses | | | 1,384,228 | | |
Net investment income | | | 6,336,792 | | |
Realized and unrealized gain (loss) — net | |
Net realized gain (loss) on: | |
Investments | | | 908,332 | | |
Net realized gain | | | 908,332 | | |
Net change in unrealized appreciation (depreciation) on: | |
Investments | | | 1,055,449 | | |
Net change in unrealized appreciation | | | 1,055,449 | | |
Net realized and unrealized gain | | | 1,963,781 | | |
Net increase in net assets resulting from operations | | $ | 8,300,573 | | |
The accompanying Notes to Financial Statements are an integral part of this statement.
Annual Report 2016
17
COLUMBIA AMT-FREE VIRGINIA INTERMEDIATE MUNI BOND FUND
STATEMENT OF CHANGES IN NET ASSETS
| | | Year Ended
April 30,
2016 | | Year Ended
April 30,
2015 | |
Operations | |
Net investment income | | $ | 6,336,792 | | | $ | 6,723,216 | | |
Net realized gain | | | 908,332 | | | | 693,450 | | |
Net change in unrealized appreciation | | | 1,055,449 | | | | 62,174 | | |
Net increase in net assets resulting from operations | | | 8,300,573 | | | | 7,478,840 | | |
Distributions to shareholders | |
Net investment income | |
Class A | | | (1,257,373 | ) | | | (1,321,460 | ) | |
Class B | | | (405 | ) | | | (324 | ) | |
Class C | | | (99,414 | ) | | | (82,606 | ) | |
Class R4 | | | (19,131 | ) | | | (17,434 | ) | |
Class Z | | | (5,226,767 | ) | | | (5,301,392 | ) | |
Net realized gains | |
Class A | | | (138,967 | ) | | | (8,343 | ) | |
Class B | | | (67 | ) | | | (3 | ) | |
Class C | | | (15,239 | ) | | | (710 | ) | |
Class R4 | | | (2,706 | ) | | | (120 | ) | |
Class Z | | | (517,929 | ) | | | (30,836 | ) | |
Total distributions to shareholders | | | (7,277,998 | ) | | | (6,763,228 | ) | |
Decrease in net assets from capital stock activity | | | (3,828,669 | ) | | | (5,282,696 | ) | |
Total decrease in net assets | | | (2,806,094 | ) | | | (4,567,084 | ) | |
Net assets at beginning of year | | | 224,186,505 | | | | 228,753,589 | | |
Net assets at end of year | | $ | 221,380,411 | | | $ | 224,186,505 | | |
Undistributed net investment income | | $ | 555,754 | | | $ | 822,052 | | |
The accompanying Notes to Financial Statements are an integral part of this statement.
Annual Report 2016
18
COLUMBIA AMT-FREE VIRGINIA INTERMEDIATE MUNI BOND FUND
STATEMENT OF CHANGES IN NET ASSETS (continued)
| | | Year Ended April 30, 2016 | | Year Ended April 30, 2015 | |
| | | Shares | | Dollars ($) | | Shares | | Dollars ($) | |
Capital stock activity | |
Class A shares | |
Subscriptions(a) | | | 406,607 | | | | 4,512,753 | | | | 483,758 | | | | 5,406,217 | | |
Distributions reinvested | | | 75,502 | | | | 837,349 | | | | 63,844 | | | | 714,560 | | |
Redemptions | | | (974,758 | ) | | | (10,809,217 | ) | | | (541,572 | ) | | | (6,069,753 | ) | |
Net increase (decrease) | | | (492,649 | ) | | | (5,459,115 | ) | | | 6,030 | | | | 51,024 | | |
Class B shares | |
Subscriptions | | | 906 | | | | 10,015 | | | | 1 | | | | 13 | | |
Distributions reinvested | | | 23 | | | | 256 | | | | 28 | | | | 314 | | |
Redemptions(a) | | | (1,208 | ) | | | (13,486 | ) | | | (394 | ) | | | (4,411 | ) | |
Net decrease | | | (279 | ) | | | (3,215 | ) | | | (365 | ) | | | (4,084 | ) | |
Class C shares | |
Subscriptions | | | 91,281 | | | | 1,011,789 | | | | 86,090 | | | | 963,758 | | |
Distributions reinvested | | | 7,740 | | | | 85,884 | | | | 5,177 | | | | 57,944 | | |
Redemptions | | | (36,407 | ) | | | (403,976 | ) | | | (58,671 | ) | | | (656,965 | ) | |
Net increase | | | 62,614 | | | | 693,697 | | | | 32,596 | | | | 364,737 | | |
Class R4 shares | |
Subscriptions | | | 35,660 | | | | 394,465 | | | | 98,421 | | | | 1,094,475 | | |
Distributions reinvested | | | 1,941 | | | | 21,495 | | | | 1,541 | | | | 17,243 | | |
Redemptions | | | (51,271 | ) | | | (570,104 | ) | | | (47,956 | ) | | | (532,480 | ) | |
Net increase (decrease) | | | (13,670 | ) | | | (154,144 | ) | | | 52,006 | | | | 579,238 | | |
Class Z shares | |
Subscriptions | | | 2,439,307 | | | | 27,096,314 | | | | 1,816,960 | | | | 20,329,214 | | |
Distributions reinvested | | | 42,112 | | | | 467,046 | | | | 38,271 | | | | 428,179 | | |
Redemptions | | | (2,386,494 | ) | | | (26,469,252 | ) | | | (2,418,718 | ) | | | (27,031,004 | ) | |
Net increase (decrease) | | | 94,925 | | | | 1,094,108 | | | | (563,487 | ) | | | (6,273,611 | ) | |
Total net decrease | | | (349,059 | ) | | | (3,828,669 | ) | | | (473,220 | ) | | | (5,282,696 | ) | |
(a) Includes conversions of Class B shares to Class A shares, if any.
The accompanying Notes to Financial Statements are an integral part of this statement.
Annual Report 2016
19
COLUMBIA AMT-FREE VIRGINIA INTERMEDIATE MUNI BOND FUND
The following tables are intended to help you understand the Fund's financial performance. Certain information reflects financial results for a single share of a class held for the periods shown. Per share net investment income (loss) amounts are calculated based on average shares outstanding during the period. Total return assumes reinvestment of all dividends and distributions, if any. Total return does not reflect payment of sales charges, if any. Total return and portfolio turnover are not annualized for periods of less than one year. The portfolio turnover rate is calculated without regard to purchase and sales transactions of short-term instruments and certain derivatives, if any. If such transactions were included, the Fund's portfolio turnover rate may be higher.
| | | Year Ended April 30, | | Year Ended
March 31, | |
Class A | | 2016 | | 2015 | | 2014 | | 2013 | | 2012(a) | | 2012 | |
Per share data | |
Net asset value, beginning of period | | $ | 11.13 | | | $ | 11.09 | | | $ | 11.54 | | | $ | 11.47 | | | $ | 11.38 | | | $ | 10.86 | | |
Income from investment operations: | |
Net investment income | | | 0.30 | | | | 0.31 | | | | 0.32 | | | | 0.31 | | | | 0.03 | | | | 0.33 | | |
Net realized and unrealized gain (loss) | | | 0.10 | | | | 0.04 | | | | (0.39 | ) | | | 0.09 | | | | 0.09 | | | | 0.52 | | |
Total from investment operations | | | 0.40 | | | | 0.35 | | | | (0.07 | ) | | | 0.40 | | | | 0.12 | | | | 0.85 | | |
Less distributions to shareholders: | |
Net investment income | | | (0.32 | ) | | | (0.31 | ) | | | (0.31 | ) | | | (0.31 | ) | | | (0.03 | ) | | | (0.33 | ) | |
Net realized gains | | | (0.03 | ) | | | (0.00 | )(b) | | | (0.07 | ) | | | (0.02 | ) | | | — | | | | — | | |
Total distributions to shareholders | | | (0.35 | ) | | | (0.31 | ) | | | (0.38 | ) | | | (0.33 | ) | | | (0.03 | ) | | | (0.33 | ) | |
Net asset value, end of period | | $ | 11.18 | | | $ | 11.13 | | | $ | 11.09 | | | $ | 11.54 | | | $ | 11.47 | | | $ | 11.38 | | |
Total return | | | 3.65 | % | | | 3.21 | % | | | (0.51 | %) | | | 3.49 | % | | | 1.06 | % | | | 7.87 | % | |
Ratios to average net assets(c) | |
Total gross expenses | | | 0.96 | % | | | 0.97 | % | | | 0.97 | % | | | 0.95 | % | | | 0.94 | %(d) | | | 0.98 | % | |
Total net expenses(e) | | | 0.81 | %(f) | | | 0.81 | %(f) | | | 0.81 | %(f) | | | 0.80 | %(f) | | | 0.79 | %(d) | | | 0.79 | %(f) | |
Net investment income | | | 2.72 | % | | | 2.79 | % | | | 2.86 | % | | | 2.68 | % | | | 3.04 | %(d) | | | 2.92 | % | |
Supplemental data | |
Net assets, end of period (in thousands) | | $ | 42,046 | | | $ | 47,324 | | | $ | 47,113 | | | $ | 55,003 | | | $ | 54,025 | | | $ | 53,775 | | |
Portfolio turnover | | | 12 | % | | | 9 | % | | | 2 | % | | | 11 | % | | | 0 | % | | | 8 | % | |
Notes to Financial Highlights
(a) For the period from April 1, 2012 to April 30, 2012. During the period, the Fund's fiscal year end was changed from March 31 to April 30.
(b) Rounds to zero.
(c) In addition to the fees and expenses that the Fund bears directly, the Fund indirectly bears a pro rata share of the fees and expenses of any other funds in which it invests. Such indirect expenses are not included in the Fund's reported expense ratios.
(d) Annualized.
(e) Total net expenses include the impact of certain fee waivers/expense reimbursements made by the Investment Manager and certain of its affiliates, if applicable.
(f) The benefits derived from expense reductions had an impact of less than 0.01%.
The accompanying Notes to Financial Statements are an integral part of this statement.
Annual Report 2016
20
COLUMBIA AMT-FREE VIRGINIA INTERMEDIATE MUNI BOND FUND
FINANCIAL HIGHLIGHTS (continued)
| | | Year Ended April 30, | | Year Ended
March 31, | |
Class B | | 2016 | | 2015 | | 2014 | | 2013 | | 2012(a) | | 2012 | |
Per share data | |
Net asset value, beginning of period | | $ | 11.13 | | | $ | 11.10 | | | $ | 11.54 | | | $ | 11.48 | | | $ | 11.38 | | | $ | 10.86 | | |
Income from investment operations: | |
Net investment income | | | 0.22 | | | | 0.23 | | | | 0.23 | | | | 0.22 | | | | 0.02 | | | | 0.25 | | |
Net realized and unrealized gain (loss) | | | 0.09 | | | | 0.03 | | | | (0.37 | ) | | | 0.08 | | | | 0.10 | | | | 0.51 | | |
Total from investment operations | | | 0.31 | | | | 0.26 | | | | (0.14 | ) | | | 0.30 | | | | 0.12 | | | | 0.76 | | |
Less distributions to shareholders: | |
Net investment income | | | (0.23 | ) | | | (0.23 | ) | | | (0.23 | ) | | | (0.22 | ) | | | (0.02 | ) | | | (0.24 | ) | |
Net realized gains | | | (0.03 | ) | | | (0.00 | )(b) | | | (0.07 | ) | | | (0.02 | ) | | | — | | | | — | | |
Total distributions to shareholders | | | (0.26 | ) | | | (0.23 | ) | | | (0.30 | ) | | | (0.24 | ) | | | (0.02 | ) | | | (0.24 | ) | |
Net asset value, end of period | | $ | 11.18 | | | $ | 11.13 | | | $ | 11.10 | | | $ | 11.54 | | | $ | 11.48 | | | $ | 11.38 | | |
Total return | | | 2.87 | % | | | 2.35 | % | | | (1.16 | %) | | | 2.62 | % | | | 1.08 | % | | | 7.06 | % | |
Ratios to average net assets(c) | |
Total gross expenses | | | 1.71 | % | | | 1.72 | % | | | 1.71 | % | | | 1.70 | % | | | 1.69 | %(d) | | | 1.81 | % | |
Total net expenses(e) | | | 1.56 | %(f) | | | 1.56 | %(f) | | | 1.56 | %(f) | | | 1.55 | %(f) | | | 1.54 | %(d) | | | 1.54 | %(f) | |
Net investment income | | | 1.95 | % | | | 2.04 | % | | | 2.08 | % | | | 1.92 | % | | | 2.29 | %(d) | | | 2.19 | % | |
Supplemental data | |
Net assets, end of period (in thousands) | | $ | 11 | | | $ | 14 | | | $ | 18 | | | $ | 47 | | | $ | 161 | | | $ | 182 | | |
Portfolio turnover | | | 12 | % | | | 9 | % | | | 2 | % | | | 11 | % | | | 0 | % | | | 8 | % | |
Notes to Financial Highlights
(a) For the period from April 1, 2012 to April 30, 2012. During the period, the Fund's fiscal year end was changed from March 31 to April 30.
(b) Rounds to zero.
(c) In addition to the fees and expenses that the Fund bears directly, the Fund indirectly bears a pro rata share of the fees and expenses of any other funds in which it invests. Such indirect expenses are not included in the Fund's reported expense ratios.
(d) Annualized.
(e) Total net expenses include the impact of certain fee waivers/expense reimbursements made by the Investment Manager and certain of its affiliates, if applicable.
(f) The benefits derived from expense reductions had an impact of less than 0.01%.
The accompanying Notes to Financial Statements are an integral part of this statement.
Annual Report 2016
21
COLUMBIA AMT-FREE VIRGINIA INTERMEDIATE MUNI BOND FUND
FINANCIAL HIGHLIGHTS (continued)
| | | Year Ended April 30, | | Year Ended
March 31, | |
Class C | | 2016 | | 2015 | | 2014 | | 2013 | | 2012(a) | | 2012 | |
Per share data | |
Net asset value, beginning of period | | $ | 11.13 | | | $ | 11.10 | | | $ | 11.54 | | | $ | 11.48 | | | $ | 11.38 | | | $ | 10.86 | | |
Income from investment operations: | |
Net investment income | | | 0.22 | | | | 0.23 | | | | 0.23 | | | | 0.22 | | | | 0.02 | | | | 0.24 | | |
Net realized and unrealized gain (loss) | | | 0.10 | | | | 0.03 | | | | (0.37 | ) | | | 0.08 | | | | 0.10 | | | | 0.52 | | |
Total from investment operations | | | 0.32 | | | | 0.26 | | | | (0.14 | ) | | | 0.30 | | | | 0.12 | | | | 0.76 | | |
Less distributions to shareholders: | |
Net investment income | | | (0.23 | ) | | | (0.23 | ) | | | (0.23 | ) | | | (0.22 | ) | | | (0.02 | ) | | | (0.24 | ) | |
Net realized gains | | | (0.03 | ) | | | (0.00 | )(b) | | | (0.07 | ) | | | (0.02 | ) | | | — | | | | — | | |
Total distributions to shareholders | | | (0.26 | ) | | | (0.23 | ) | | | (0.30 | ) | | | (0.24 | ) | | | (0.02 | ) | | | (0.24 | ) | |
Net asset value, end of period | | $ | 11.19 | | | $ | 11.13 | | | $ | 11.10 | | | $ | 11.54 | | | $ | 11.48 | | | $ | 11.38 | | |
Total return | | | 2.97 | % | | | 2.35 | % | | | (1.16 | %) | | | 2.63 | % | | | 1.08 | % | | | 7.06 | % | |
Ratios to average net assets(c) | |
Total gross expenses | | | 1.72 | % | | | 1.72 | % | | | 1.72 | % | | | 1.70 | % | | | 1.70 | %(d) | | | 1.73 | % | |
Total net expenses(e) | | | 1.56 | %(f) | | | 1.56 | %(f) | | | 1.56 | %(f) | | | 1.55 | %(f) | | | 1.54 | %(d) | | | 1.54 | %(f) | |
Net investment income | | | 1.97 | % | | | 2.03 | % | | | 2.11 | % | | | 1.93 | % | | | 2.29 | %(d) | | | 2.15 | % | |
Supplemental data | |
Net assets, end of period (in thousands) | | $ | 5,141 | | | $ | 4,419 | | | $ | 4,044 | | | $ | 5,601 | | | $ | 4,694 | | | $ | 4,739 | | |
Portfolio turnover | | | 12 | % | | | 9 | % | | | 2 | % | | | 11 | % | | | 0 | % | | | 8 | % | |
Notes to Financial Highlights
(a) For the period from April 1, 2012 to April 30, 2012. During the period, the Fund's fiscal year end was changed from March 31 to April 30.
(b) Rounds to zero.
(c) In addition to the fees and expenses that the Fund bears directly, the Fund indirectly bears a pro rata share of the fees and expenses of any other funds in which it invests. Such indirect expenses are not included in the Fund's reported expense ratios.
(d) Annualized.
(e) Total net expenses include the impact of certain fee waivers/expense reimbursements made by the Investment Manager and certain of its affiliates, if applicable.
(f) The benefits derived from expense reductions had an impact of less than 0.01%.
The accompanying Notes to Financial Statements are an integral part of this statement.
Annual Report 2016
22
COLUMBIA AMT-FREE VIRGINIA INTERMEDIATE MUNI BOND FUND
FINANCIAL HIGHLIGHTS (continued)
| | | Year Ended April 30, | |
Class R4 | | 2016 | | 2015 | | 2014 | | 2013(a) | |
Per share data | |
Net asset value, beginning of period | | $ | 11.12 | | | $ | 11.08 | | | $ | 11.52 | | | $ | 11.43 | | |
Income from investment operations: | |
Net investment income | | | 0.33 | | | | 0.34 | | | | 0.35 | | | | 0.04 | | |
Net realized and unrealized gain (loss) | | | 0.11 | | | | 0.04 | | | | (0.38 | ) | | | 0.09 | | |
Total from investment operations | | | 0.44 | | | | 0.38 | | | | (0.03 | ) | | | 0.13 | | |
Less distributions to shareholders: | |
Net investment income | | | (0.35 | ) | | | (0.34 | ) | | | (0.34 | ) | | | (0.04 | ) | |
Net realized gains | | | (0.03 | ) | | | (0.00 | )(b) | | | (0.07 | ) | | | — | | |
Total distributions to shareholders | | | (0.38 | ) | | | (0.34 | ) | | | (0.41 | ) | | | (0.04 | ) | |
Net asset value, end of period | | $ | 11.18 | | | $ | 11.12 | | | $ | 11.08 | | | $ | 11.52 | | |
Total return | | | 4.00 | % | | | 3.47 | % | | | (0.19 | %) | | | 1.12 | % | |
Ratios to average net assets(c) | |
Total gross expenses | | | 0.72 | % | | | 0.72 | % | | | 0.72 | % | | | 0.56 | %(d) | |
Total net expenses(e) | | | 0.56 | %(f) | | | 0.56 | %(f) | | | 0.56 | %(f) | | | 0.52 | %(d) | |
Net investment income | | | 2.97 | % | | | 3.06 | % | | | 3.18 | % | | | 2.98 | %(d) | |
Supplemental data | |
Net assets, end of period (in thousands) | | $ | 506 | | | $ | 656 | | | $ | 77 | | | $ | 3 | | |
Portfolio turnover | | | 12 | % | | | 9 | % | | | 2 | % | | | 11 | % | |
Notes to Financial Highlights
(a) Based on operations from March 19, 2013 (commencement of operations) through the stated period end.
(b) Rounds to zero.
(c) In addition to the fees and expenses that the Fund bears directly, the Fund indirectly bears a pro rata share of the fees and expenses of any other funds in which it invests. Such indirect expenses are not included in the Fund's reported expense ratios.
(d) Annualized.
(e) Total net expenses include the impact of certain fee waivers/expense reimbursements made by the Investment Manager and certain of its affiliates, if applicable.
(f) The benefits derived from expense reductions had an impact of less than 0.01%.
The accompanying Notes to Financial Statements are an integral part of this statement.
Annual Report 2016
23
COLUMBIA AMT-FREE VIRGINIA INTERMEDIATE MUNI BOND FUND
FINANCIAL HIGHLIGHTS (continued)
| | | Year Ended April 30, | | Year Ended
March 31, | |
Class Z | | 2016 | | 2015 | | 2014 | | 2013 | | 2012(a) | | 2012 | |
Per share data | |
Net asset value, beginning of period | | $ | 11.13 | | | $ | 11.09 | | | $ | 11.54 | | | $ | 11.47 | | | $ | 11.38 | | | $ | 10.85 | | |
Income from investment operations: | |
Net investment income | | | 0.33 | | | | 0.34 | | | | 0.34 | | | | 0.34 | | | | 0.03 | | | | 0.35 | | |
Net realized and unrealized gain (loss) | | | 0.10 | | | | 0.04 | | | | (0.38 | ) | | | 0.08 | | | | 0.09 | | | | 0.53 | | |
Total from investment operations | | | 0.43 | | | | 0.38 | | | | (0.04 | ) | | | 0.42 | | | | 0.12 | | | | 0.88 | | |
Less distributions to shareholders: | |
Net investment income | | | (0.35 | ) | | | (0.34 | ) | | | (0.34 | ) | | | (0.33 | ) | | | (0.03 | ) | | | (0.35 | ) | |
Net realized gains | | | (0.03 | ) | | | (0.00 | )(b) | | | (0.07 | ) | | | (0.02 | ) | | | — | | | | — | | |
Total distributions to shareholders | | | (0.38 | ) | | | (0.34 | ) | | | (0.41 | ) | | | (0.35 | ) | | | (0.03 | ) | | | (0.35 | ) | |
Net asset value, end of period | | $ | 11.18 | | | $ | 11.13 | | | $ | 11.09 | | | $ | 11.54 | | | $ | 11.47 | | | $ | 11.38 | | |
Total return | | | 3.91 | % | | | 3.47 | % | | | (0.26 | %) | | | 3.75 | % | | | 1.08 | % | | | 8.23 | % | |
Ratios to average net assets(c) | |
Total gross expenses | | | 0.71 | % | | | 0.72 | % | | | 0.72 | % | | | 0.70 | % | | | 0.69 | %(d) | | | 0.73 | % | |
Total net expenses(e) | | | 0.56 | %(f) | | | 0.56 | %(f) | | | 0.56 | %(f) | | | 0.55 | %(f) | | | 0.54 | %(d) | | | 0.54 | %(f) | |
Net investment income | | | 2.97 | % | | | 3.04 | % | | | 3.09 | % | | | 2.93 | % | | | 3.29 | %(d) | | | 3.16 | % | |
Supplemental data | |
Net assets, end of period (in thousands) | | $ | 173,677 | | | $ | 171,775 | | | $ | 177,502 | | | $ | 281,126 | | | $ | 308,836 | | | $ | 306,166 | | |
Portfolio turnover | | | 12 | % | | | 9 | % | | | 2 | % | | | 11 | % | | | 0 | % | | | 8 | % | |
Notes to Financial Highlights
(a) For the period from April 1, 2012 to April 30, 2012. During the period, the Fund's fiscal year end was changed from March 31 to April 30.
(b) Rounds to zero.
(c) In addition to the fees and expenses that the Fund bears directly, the Fund indirectly bears a pro rata share of the fees and expenses of any other funds in which it invests. Such indirect expenses are not included in the Fund's reported expense ratios.
(d) Annualized.
(e) Total net expenses include the impact of certain fee waivers/expense reimbursements made by the Investment Manager and certain of its affiliates, if applicable.
(f) The benefits derived from expense reductions had an impact of less than 0.01%.
The accompanying Notes to Financial Statements are an integral part of this statement.
Annual Report 2016
24
COLUMBIA AMT-FREE VIRGINIA INTERMEDIATE MUNI BOND FUND
NOTES TO FINANCIAL STATEMENTS
April 30, 2016
Note 1. Organization
Columbia AMT-Free Virginia Intermediate Muni Bond Fund (the Fund), a series of Columbia Funds Series Trust (the Trust), is a diversified fund. The Trust is registered under the Investment Company Act of 1940, as amended (the 1940 Act), as an open-end management investment company organized as a Delaware statutory trust.
Fund Shares
The Trust may issue an unlimited number of shares (without par value). The Fund offers Class A, Class B, Class C, Class R4 and Class Z shares. Although all share classes generally have identical voting, dividend and liquidation rights, each share class votes separately when required by the Trust's organizational documents or by law. Different share classes pay different distribution amounts to the extent the expenses of such share classes differ, and distributions in liquidation will be proportional to the net asset value of each share class. Each share class has its own expense and sales charge structure.
Class A shares are subject to a maximum front-end sales charge of 3.00% based on the initial investment amount. In addition, Class A shares purchased on or after February 19, 2015 are subject to a contingent deferred sales charge (CDSC) of 0.75% on certain investments of $500,000 or more if redeemed within 12 months after purchase. Redemptions of Class A shares purchased prior to February 19, 2015, without an initial sales charge in accounts aggregating $1 million to $50 million at the time of purchase, are subject to a CDSC of 1.00% if redeemed within 12 months after purchase, and 0.50% if redeemed more than 12, but less than 18, months after purchase.
Class B shares may be subject to a maximum CDSC of 3.00% based upon the holding period after purchase. Class B shares will generally convert to Class A shares eight years after purchase. The Fund no longer accepts investments by new or existing investors in the Fund's Class B shares, except in connection with the reinvestment of any dividend and/or capital gain distributions in Class B shares of the Fund and exchanges by existing Class B shareholders of certain other funds within the Columbia Family of Funds.
Class C shares are subject to a 1.00% CDSC on shares redeemed within 12 months after purchase.
Class R4 shares are not subject to sales charges and are generally available only to omnibus retirement plans
and certain investors as described in the Fund's prospectus.
Class Z shares are not subject to sales charges and are available only to eligible investors, which are subject to different investment minimums as described in the Fund's prospectus.
Note 2. Summary of Significant Accounting Policies
Basis of Preparation
The Fund is an investment company that applies the accounting and reporting guidance in the Financial Accounting Standards Board (FASB) Accounting Standards Codification Topic 946, Financial Services — Investment Companies (ASC 946). The financial statements are prepared in accordance with U.S. generally accepted accounting principles (GAAP), which requires management to make certain estimates and assumptions that affect the reported amounts of assets and liabilities, the disclosure of contingent assets and liabilities at the date of the financial statements and the reported amounts of income and expenses during the reporting period. Actual results could differ from those estimates.
The following is a summary of significant accounting policies followed by the Fund in the preparation of its financial statements.
Security Valuation
Debt securities generally are valued by pricing services approved by the Board of Trustees (the Board) based upon market transactions for normal, institutional-size trading units of similar securities. The services may use various pricing techniques that take into account, as applicable, factors such as yield, quality, coupon rate, maturity, type of issue, trading characteristics and other data, as well as broker quotes. Debt securities for which quotations are not readily available or not believed to be reflective of market value may also be valued based upon a bid quote from an approved independent broker-dealer. Debt securities maturing in 60 days or less are valued primarily at amortized cost value, unless this method results in a valuation that management believes does not approximate market value.
Investments for which market quotations are not readily available, or that have quotations which management believes are not reflective of market value or reliable, are valued at fair value as determined in good faith under procedures approved by and under the general
Annual Report 2016
25
COLUMBIA AMT-FREE VIRGINIA INTERMEDIATE MUNI BOND FUND
NOTES TO FINANCIAL STATEMENTS (continued)
April 30, 2016
supervision of the Board. If a security or class of securities (such as foreign securities) is valued at fair value, such value is likely to be different from the quoted or published price for the security.
The determination of fair value often requires significant judgment. To determine fair value, management may use assumptions including but not limited to future cash flows and estimated risk premiums. Multiple inputs from various sources may be used to determine fair value.
GAAP requires disclosure regarding the inputs and valuation techniques used to measure fair value and any changes in valuation inputs or techniques. In addition, investments shall be disclosed by major category. This information is disclosed following the Fund's Portfolio of Investments.
Delayed Delivery Securities
The Fund may trade securities on other than normal settlement terms, including securities purchased or sold on a "when-issued" basis. This may increase risk to the Fund since the other party to the transaction may fail to deliver, which could cause the Fund to subsequently invest at less advantageous prices. The Fund designates cash or liquid securities in an amount equal to the delayed delivery commitment.
Security Transactions
Security transactions are accounted for on the trade date. Cost is determined and gains (losses) are based upon the specific identification method for both financial statement and federal income tax purposes.
Income Recognition
Interest income is recorded on an accrual basis. Market premiums and discounts, including original issue discounts, are amortized and accreted, respectively, over the expected life of the security on all debt securities, unless otherwise noted.
The Fund may place a debt security on non-accrual status and reduce related interest income when it becomes probable that the interest will not be collected and the amount of uncollectible interest can be reasonably estimated. A defaulted debt security is removed from non-accrual status when the issuer resumes interest payments or when collectibility of interest is reasonably assured.
Expenses
General expenses of the Trust are allocated to the Fund and other funds of the Trust based upon relative net
assets or other expense allocation methodologies determined by the nature of the expense. Expenses directly attributable to the Fund are charged to the Fund. Expenses directly attributable to a specific class of shares are charged to that share class.
Determination of Class Net Asset Value
All income, expenses (other than class-specific expenses, which are charged to that share class, as shown in the Statement of Operations) and realized and unrealized gains (losses) are allocated to each class of the Fund on a daily basis, based on the relative net assets of each class, for purposes of determining the net asset value of each class.
Federal Income Tax Status
The Fund intends to qualify each year as a regulated investment company under Subchapter M of the Internal Revenue Code, as amended, and will distribute substantially all of its tax exempt and taxable income (including net short-term capital gains), if any, for its tax year, and as such will not be subject to federal income taxes. In addition, the Fund intends to distribute in each calendar year substantially all of its net investment income, capital gains and certain other amounts, if any, such that the Fund should not be subject to federal excise tax. Therefore, no federal income or excise tax provision is recorded.
Distributions to Shareholders
Distributions from net investment income, if any, are declared daily and paid monthly. Net realized capital gains, if any, are distributed at least annually. Income distributions and capital gain distributions are determined in accordance with federal income tax regulations, which may differ from GAAP.
Guarantees and Indemnifications
Under the Trust's organizational documents and, in some cases, by contract, its officers and trustees are indemnified against certain liabilities arising out of the performance of their duties to the Trust or its funds. In addition, certain of the Fund's contracts with its service providers contain general indemnification clauses. The Fund's maximum exposure under these arrangements is unknown since the amount of any future claims that may be made against the Fund cannot be determined, and the Fund has no historical basis for predicting the likelihood of any such claims.
Annual Report 2016
26
COLUMBIA AMT-FREE VIRGINIA INTERMEDIATE MUNI BOND FUND
NOTES TO FINANCIAL STATEMENTS (continued)
April 30, 2016
Note 3. Fees and Other Transactions with Affiliates
Management Fees
Effective September 1, 2015, the Fund entered into a Management Agreement with Columbia Management Investment Advisers, LLC (the Investment Manager), a wholly-owned subsidiary of Ameriprise Financial, Inc. (Ameriprise Financial). Under the Management Agreement, the Investment Manager provides the Fund with investment research and advice, as well as administrative and accounting services. The management services fee is an annual fee that is equal to a percentage of the Fund's average daily net assets that declines from 0.47% to 0.31% as the Fund's net assets increase. The effective management services fee rate for the year ended April 30, 2016 was 0.47% of the Fund's average daily net assets.
Prior to September 1, 2015, the Fund paid the Investment Manager an annual fee for advisory services under an Investment Management Services Agreement and a separate annual fee for administrative and accounting services under an Administrative Services Agreement. For the period from May 1, 2015 through August 31, 2015, the investment advisory services fee paid to the Investment Manager was $298,140, and the administrative services fee paid to the Investment Manager was $52,175.
Other Expenses
Other expenses are for, among other things, miscellaneous expenses of the Fund or the Board, including payments to Board Services Corp., a company providing limited administrative services to the Fund and the Board. That company's expenses include boardroom and office expense, employee compensation, employee health and retirement benefits, and certain other expenses. For the year ended April 30, 2016, other expenses paid by the Fund to this company were $1,353.
Compensation of Board Members
Board members, who are not officers or employees of the Investment Manager or Ameriprise Financial, are compensated for their services to the Fund as disclosed in the Statement of Operations. Under a Deferred Compensation Plan (the Plan), these Board members may elect to defer payment of up to 100% of their compensation. Deferred amounts are treated as though equivalent dollar amounts had been invested in shares of certain funds managed by the Investment Manager.
The Fund's liability for these amounts is adjusted for market value changes and remains in the Fund until distributed in accordance with the Plan. All amounts payable under the Plan constitute a general unsecured obligation of the Fund.
Transfer Agency Fees
Under a Transfer and Dividend Disbursing Agent Agreement, Columbia Management Investment Services Corp. (the Transfer Agent), an affiliate of the Investment Manager and a wholly-owned subsidiary of Ameriprise Financial, is responsible for providing transfer agency services to the Fund. The Transfer Agent has contracted with Boston Financial Data Services (BFDS) to serve as sub-transfer agent.
The Transfer Agent receives a monthly transfer agency fee based on the number or the average value of accounts, depending on the type of account. In addition, the Transfer Agent also receives sub-transfer agency fees based on a percentage of the average aggregate value of the Fund's shares maintained in omnibus accounts (other than omnibus accounts for which American Enterprise Investment Services Inc. is the broker of record or accounts where the beneficial shareholder is a customer of Ameriprise Financial Services, Inc., for which the Transfer Agent receives a per account fee). The Transfer Agent pays the fees of BFDS for services as sub-transfer agent and is not entitled to reimbursement for such fees from the Fund (with the exception of out-of-pocket fees).
The Transfer Agent also receives compensation from the Fund for various shareholder services and reimbursements for certain out-of-pocket fees.
For the year ended April 30, 2016, the Fund's effective transfer agency fee rates as a percentage of average daily net assets of each class were as follows:
Class A | | | 0.19 | % | |
Class B | | | 0.19 | | |
Class C | | | 0.19 | | |
Class R4 | | | 0.19 | | |
Class Z | | | 0.19 | | |
An annual minimum account balance fee of $20 may apply to certain accounts with a value below the applicable share class's initial minimum investment requirements to reduce the impact of small accounts on transfer agency fees. These minimum account balance fees are remitted to the Fund and recorded as part of expense reductions in the Statement of Operations. For the year ended April 30, 2016, these minimum account balance fees reduced total expenses of the Fund by $20.
Annual Report 2016
27
COLUMBIA AMT-FREE VIRGINIA INTERMEDIATE MUNI BOND FUND
NOTES TO FINANCIAL STATEMENTS (continued)
April 30, 2016
Distribution and Service Fees
The Fund has an agreement with Columbia Management Investment Distributors, Inc. (the Distributor), an affiliate of the Investment Manager and a wholly-owned subsidiary of Ameriprise Financial, for distribution and shareholder services. The Board has approved, and the Fund has adopted, distribution and shareholder service plans (the Plans) applicable to certain share classes, which set the distribution and service fees for the Fund. These fees are calculated daily and are intended to compensate the Distributor and/or eligible selling and/or servicing agents for selling shares of the Fund and providing services to investors.
Under the Plans, the Fund pays a monthly combined distribution and service fee to the Distributor at the maximum annual rate of 0.25% of the average daily net assets attributable to Class A shares of the Fund. Also under the Plans, the Fund pays a monthly service fee at the maximum annual rate of 0.25% of the average daily net assets attributable to Class B and Class C shares of the Fund and a monthly distribution fee at the maximum annual rate of 0.75% of the average daily net assets attributable to Class B and Class C shares of the Fund.
Sales Charges
Sales charges, including front-end charges and CDSCs, received by the Distributor for distributing Fund shares were $5,992 for Class A, $0 for Class B and $492 for Class C shares for the year ended April 30, 2016.
Expenses Waived/Reimbursed by the Investment Manager and its Affiliates
The Investment Manager and certain of its affiliates have contractually agreed to waive fees and/or reimburse expenses (excluding certain fees and expenses described below) for the period disclosed below, unless sooner terminated at the sole discretion of the Board, so that the Fund's net operating expenses, after giving effect to fees waived/expenses reimbursed and any balance credits and/or overdraft charges from the Fund's custodian, do not exceed the following annual rates as a percentage of the class' average daily net assets:
| | | Fee Rates Contractual
through
August 31, 2016 | |
Class A | | | 0.81 | % | |
Class B | | | 1.56 | | |
Class C | | | 1.56 | | |
Class R4 | | | 0.56 | | |
Class Z | | | 0.56 | | |
Under the agreement governing these fee waivers and/or expense reimbursement arrangements, the following fees and expenses are excluded from the waiver/reimbursement commitment, and therefore will be paid by the Fund, if applicable: taxes (including foreign transaction taxes), expenses associated with investments in affiliated and non-affiliated pooled investment vehicles (including mutual funds and exchange-traded funds), transaction costs and brokerage commissions, costs related to any securities lending program, dividend and interest expenses associated with securities sold short, inverse floater program fees and expenses, transaction charges and interest on borrowed money, interest, extraordinary expenses and any other expenses the exclusion of which is specifically approved by the Board. This agreement may be modified or amended only with approval from the Investment Manager, certain of its affiliates and the Fund. Any fees waived and/or expenses reimbursed under the expense reimbursement arrangements described above are not recoverable by the Investment Manager or its affiliates in future periods.
Note 4. Federal Tax Information
The timing and character of income and capital gain distributions are determined in accordance with income tax regulations, which may differ from GAAP because of temporary or permanent book to tax differences.
At April 30, 2016, these differences are primarily due to differing treatment for Trustees' deferred compensation and distributions. To the extent these differences are permanent, reclassifications are made among the components of the Fund's net assets in the Statement of Assets and Liabilities. Temporary differences do not require reclassifications.
The Fund did not have any permanent differences; therefore, no reclassifications were made to the Statement of Assets and Liabilities.
The tax character of distributions paid during the years indicated was as follows:
Year Ended April 30, | | 2016 | | 2015 | |
Ordinary income | | $ | 38,653 | | | $ | 37,088 | | |
Tax-exempt income | | | 6,564,437 | | | | 6,686,128 | | |
Long-term capital gains | | | 674,908 | | | | 40,012 | | |
Total | | $ | 7,277,998 | | | $ | 6,763,228 | | |
Short-term capital gain distributions, if any, are considered ordinary income distributions for tax purposes.
Annual Report 2016
28
COLUMBIA AMT-FREE VIRGINIA INTERMEDIATE MUNI BOND FUND
NOTES TO FINANCIAL STATEMENTS (continued)
April 30, 2016
At April 30, 2016, the components of distributable earnings on a tax basis were as follows:
Undistributed tax-exempt income | | $ | 1,210,845 | | |
Undistributed long-term capital gains | | | 622,865 | | |
Net unrealized appreciation | | | 15,430,966 | | |
At April 30, 2016, the cost of investments for federal income tax purposes was $200,350,897 and the aggregate gross unrealized appreciation and depreciation based on that cost was:
Unrealized appreciation | | $ | 16,392,482 | | |
Unrealized depreciation | | | (961,516 | ) | |
Net unrealized appreciation | | $ | 15,430,966 | | |
Management of the Fund has concluded that there are no significant uncertain tax positions in the Fund that would require recognition in the financial statements. However, management's conclusion may be subject to review and adjustment at a later date based on factors including, but not limited to, new tax laws, regulations, and administrative interpretations (including relevant court decisions). Generally, the Fund's federal tax returns for the prior three fiscal years remain subject to examination by the Internal Revenue Service.
Note 5. Portfolio Information
The cost of purchases and proceeds from sales of securities, excluding short-term investments and derivatives, if any, aggregated to $25,742,410 and $31,023,424, respectively, for the year ended April 30, 2016. The amount of purchase and sale activity impacts the portfolio turnover rate reported in the Financial Highlights.
Note 6. Line of Credit
The Fund has access to a revolving credit facility whereby the Fund may borrow for the temporary funding of shareholder redemptions or for other temporary or emergency purposes. Effective December 8, 2015, Citibank, N.A. and HSBC Bank USA, N.A. joined JPMorgan Chase Bank, N.A. (JPMorgan) as lead of a syndicate of banks under the credit facility, which is a collective agreement between the Fund and certain other funds managed by the Investment Manager, severally and not jointly, that permits collective borrowings up to $1 billion. Interest is charged to each participating fund based on its borrowings at a rate equal to the higher of (i) the overnight federal funds rate plus 1.00% or (ii) the one-month LIBOR rate plus 1.00%. Each borrowing under the credit facility matures no later than 60 days after the date of borrowing. The Fund also pays a commitment fee equal to its pro rata share of the amount of the credit facility at a rate of
0.15% per annum. The commitment fee is included in other expenses in the Statement of Operations. Prior to December 8, 2015, JPMorgan was the sole lead bank under the credit facility agreement that permitted borrowings up to $550 million under the same terms and interest rates as described above with the exception of the commitment fee which was charged at a rate of 0.075% per annum.
The Fund had no borrowings during the year ended April 30, 2016.
Note 7. Significant Risks
Shareholder Concentration Risk
At April 30, 2016, one unaffiliated shareholder of record owned 78.4% of the outstanding shares of the Fund in one or more accounts. The Fund has no knowledge about whether any portion of those shares was owned beneficially. Subscription and redemption activity by concentrated accounts may have a significant effect on the operations of the Fund.
Credit Risk
Credit risk is the risk that the value of debt securities in the Fund's portfolio may decline because the issuer may default and fail to pay interest or repay principal when due. Rating agencies assign credit ratings to debt securities to indicate their credit risk. Lower rated or unrated debt securities held by the Fund may present increased credit risk as compared to higher-rated debt securities.
Interest Rate Risk
Interest rate risk is the risk of losses attributable to changes in interest rates. In general, if prevailing interest rates rise, the values of debt securities tend to fall, and if interest rates fall, the values of debt securities tend to rise. Actions by governments and central banking authorities can result in increases in interest rates. Increasing interest rates may negatively affect the value of debt securities held by the Fund, resulting in a negative impact on the Fund's performance and net asset value per share. In general, the longer the maturity or duration of a debt security, the greater its sensitivity to changes in interest rates.
Liquidity Risk
Liquidity risk is the risk associated with a lack of marketability of investments which may make it difficult to sell the investment at a desirable time or price. Changing regulatory, market or other conditions or environments (for example, the interest rate or credit environments) may adversely affect the liquidity of the
Annual Report 2016
29
COLUMBIA AMT-FREE VIRGINIA INTERMEDIATE MUNI BOND FUND
NOTES TO FINANCIAL STATEMENTS (continued)
April 30, 2016
Fund's investments. The Fund may have to accept a lower selling price for the holding, sell other investments, or forego another, more appealing investment opportunity. Generally, the less liquid the market at the time the Fund sells a portfolio investment, the greater the risk of loss or decline of value to the Fund. A less liquid market can lead to an increase in Fund redemptions, which may negatively impact Fund performance and net asset value per share, including, for example, if the Fund is forced to sell securities in a down market.
Geographic Concentration Risk
Because the Fund invests substantially in municipal securities issued by the state identified in the Fund's name and political sub-divisions of that state, the Fund will be particularly affected by adverse tax, legislative, regulatory, demographic or political changes as well as changes impacting the state's financial, economic or other condition and prospects. In addition, because of the relatively small number of issuers of tax-exempt securities in the state, the Fund may invest a higher percentage of assets in a single issuer and, therefore, be more exposed to the risk of loss than a fund that invests more broadly. The value of municipal and other securities owned by the Fund also may be adversely affected by future changes in federal or state income tax laws.
Note 8. Subsequent Events
Management has evaluated the events and transactions that have occurred through the date the financial statements were issued and noted no items requiring adjustment of the financial statements or additional disclosure.
Note 9. Information Regarding Pending and Settled Legal Proceedings
In December 2005, without admitting or denying the allegations, American Express Financial Corporation (AEFC, which is now known as Ameriprise Financial, Inc. (Ameriprise Financial)) entered into settlement agreements with the Securities and Exchange Commission (SEC) and Minnesota Department of Commerce (MDOC) related to market timing activities. As a result, AEFC was censured and ordered to cease and desist from committing or causing any violations of certain provisions of the Investment Advisers Act of 1940, the Investment Company Act of 1940, and various Minnesota laws. AEFC agreed to pay disgorgement of $10 million and civil money penalties of $7 million. AEFC also agreed to retain an independent distribution
consultant to assist in developing a plan for distribution of all disgorgement and civil penalties ordered by the SEC in accordance with various undertakings detailed at http://www.sec.gov/litigation/admin/ia-2451.pdf. Ameriprise Financial and its affiliates have cooperated with the SEC and the MDOC in these legal proceedings, and have made regular reports to the Funds' Boards of Trustees.
Ameriprise Financial and certain of its affiliates have historically been involved in a number of legal, arbitration and regulatory proceedings, including routine litigation, class actions, and governmental actions, concerning matters arising in connection with the conduct of their business activities. Ameriprise Financial believes that the Funds are not currently the subject of, and that neither Ameriprise Financial nor any of its affiliates are the subject of, any pending legal, arbitration or regulatory proceedings that are likely to have a material adverse effect on the Funds or the ability of Ameriprise Financial or its affiliates to perform under their contracts with the Funds. Ameriprise Financial is required to make quarterly (10-Q), annual (10-K) and, as necessary, 8-K filings with the SEC on legal and regulatory matters that relate to Ameriprise Financial and its affiliates. Copies of these filings may be obtained by accessing the SEC website at www.sec.gov.
There can be no assurance that these matters, or the adverse publicity associated with them, will not result in increased fund redemptions, reduced sale of fund shares or other adverse consequences to the Funds. Further, although we believe proceedings are not likely to have a material adverse effect on the Funds or the ability of Ameriprise Financial or its affiliates to perform under their contracts with the Funds, these proceedings are subject to uncertainties and, as such, we are unable to estimate the possible loss or range of loss that may result. An adverse outcome in one or more of these proceedings could result in adverse judgments, settlements, fines, penalties or other relief that could have a material adverse effect on the consolidated financial condition or results of operations of Ameriprise Financial.
Annual Report 2016
30
COLUMBIA AMT-FREE VIRGINIA INTERMEDIATE MUNI BOND FUND
REPORT OF INDEPENDENT REGISTERED PUBLIC ACCOUNTING FIRM
To the Trustees of Columbia Funds Series Trust and the Shareholders of
Columbia AMT-Free Virginia Intermediate Muni Bond Fund
In our opinion, the accompanying statement of assets and liabilities, including the portfolio of investments, and the related statements of operations and of changes in net assets and the financial highlights present fairly, in all material respects, the financial position of Columbia AMT-Free Virginia Intermediate Muni Bond Fund (the "Fund", a series of Columbia Funds Series Trust) at April 30, 2016, and the results of its operations, the changes in its net assets and the financial highlights for each of the periods indicated, in conformity with accounting principles generally accepted in the United States of America. These financial statements and financial highlights (hereafter referred to as "financial statements") are the responsibility of the Fund's management. Our responsibility is to express an opinion on these financial statements based on our audits. We conducted our audits of these financial statements in accordance with the standards of the Public Company Accounting Oversight Board (United States). Those standards require that we plan and perform the audit to obtain reasonable assurance about whether the financial statements are free of material misstatement. An audit includes examining, on a test basis, evidence supporting the amounts and disclosures in the financial statements, assessing the accounting principles used and significant estimates made by management, and evaluating the overall financial statement presentation. We believe that our audits, which included confirmation of securities at April 30, 2016 by correspondence with the custodian and brokers, and the application of alternative auditing procedures where such confirmations had not been received, provide a reasonable basis for our opinion.
PricewaterhouseCoopers LLP
Minneapolis, MN
June 21, 2016
Annual Report 2016
31
COLUMBIA AMT-FREE VIRGINIA INTERMEDIATE MUNI BOND FUND
FEDERAL INCOME TAX INFORMATION
(Unaudited)
The Fund hereby designates the following tax attributes for the fiscal year ended April 30, 2016. Shareholders will be notified in early 2017 of the amounts for use in preparing 2016 income tax returns.
Tax Designations
Capital Gain Dividend | | $ | 953,749 | | |
Exempt-Interest Dividends | | | 99.41 | % | |
Capital Gain Dividend. The Fund designates as a capital gain dividend the amount reflected above, or if subsequently determined to be different, the net capital gain of such fiscal period.
Exempt-Interest Dividends. The percentage of net investment income distributed during the fiscal year that qualifies as exempt-interest dividends for federal income tax purposes.
Annual Report 2016
32
COLUMBIA AMT-FREE VIRGINIA INTERMEDIATE MUNI BOND FUND
Shareholders elect the Board that oversees the Fund's operations. The Board appoints officers who are responsible for day-to-day business decisions based on policies set by the Board. The following table provides basic biographical information about the Fund's Trustees, including their principal occupations during the past five years, although specific titles for individuals may have varied over the period. Under current Board policy, members generally may serve through the end of the calendar year in which they reach either the mandatory retirement age established by the Board or the fifteenth anniversary of the first Board meeting they attended as a member of the Board.
Trustees
Independent Trustees
Name,
Address,
Year of Birth | | Position Held With
the Funds and Length of
Service | | Principal Occupation(s)
During the Past Five Years
and Other Relevant
Professional Experience | | Number of
Funds in the
Columbia Funds
Complex
Overseen | | Other Directorships
Held by Trustee During
the Past Five Years | |
Kathleen Blatz
901 S. Marquette Ave.
Minneapolis, MN 55402
1954 | | Trustee since 1/06 for RiverSource Funds and since 6/11 for Nations Funds | | Attorney; specializing in arbitration and mediation; Chief Justice, Minnesota Supreme Court, 1998-2006; Associate Justice, Minnesota Supreme Court, 1996-1998; Fourth Judicial District Court Judge, Hennepin County, 1994-1996; Attorney in private practice and public service, 1984-1993; State Representative, Minnesota House of Representatives, 1979-1993, which included service on the Tax and Financial Institutions and Insurance Committees | | | 120 | | | Trustee, BlueCross BlueShield of Minnesota (Chair of the Business Development Committee) since 2009; Chair of the Robina Foundation since August 2013 | |
Edward J. Boudreau, Jr.
901 S. Marquette Ave. Minneapolis, MN 55402
1944 | | Trustee since 6/11 for RiverSource Funds and since 1/05 for Nations Funds | | Managing Director, E.J. Boudreau & Associates (consulting) since 2000; FINRA Industry Arbitrator, 2002-present; Chairman and Chief Executive Officer, John Hancock Funds (asset management), Chairman and Interested Trustee for open-end and closed-end funds offered by John Hancock, 1989-2000; John Hancock Life Insurance Company, including SVP and Treasurer and SVP Information Technology, 1968-1988 | | | 118 | | | Former Trustee, Boston Museum of Science (Chair of Finance Committee), 1985-2013; former Trustee, BofA Funds Series Trust (11 funds), 2005-2011 | |
Pamela G. Carlton
901 S. Marquette Ave.
Minneapolis, MN 55402
1954 | | Trustee since 7/07 for RiverSource Funds and since 6/11 for Nations Funds | | President, Springboard — Partners in Cross Cultural Leadership (consulting company) since 2003; Managing Director of US Equity Research, JP Morgan Chase, 1999-2003; Director of US Equity Research, Chase Asset Management, 1996-1999; Co-Director Latin America Research, 1993-1996, COO Global Research, 1992-1996, Co-Director of US Research, 1991-1992, Investment Banker, Morgan Stanley, 1982-1991 | | | 120 | | | Trustee, New York Presbyterian Hospital Board (Executive Committee and Chair of Human Resources Committee) since 1996 | |
Annual Report 2016
33
COLUMBIA AMT-FREE VIRGINIA INTERMEDIATE MUNI BOND FUND
TRUSTEES AND OFFICERS (continued)
Independent Trustees (continued)
Name,
Address,
Year of Birth | | Position Held With
the Funds and Length of
Service | | Principal Occupation(s)
During the Past Five Years
and Other Relevant
Professional Experience | | Number of
Funds in the
Columbia Funds
Complex
Overseen | | Other Directorships
Held by Trustee During
the Past Five Years | |
William P. Carmichael
901 S. Marquette Ave. Minneapolis, MN 55402
1943 | | Trustee since 6/11 for RiverSource Funds and since 2003 for Nations Funds; Chair of the Board from 1/14-11/15 | | Retired; Co-founder, The Succession Fund (provides exit strategies to owners of privately held companies), 1998-2007; Adjunct Professor of Finance, Kelley School of Business, Indiana University, 1993-2007; Senior Vice President, Sara Lee Corporation, 1991-1993; Senior Vice President and Chief Financial Officer, Beatrice Foods Company, 1984-1990; Vice President, Esmark, Inc., 1973-1984; Associate, Price Waterhouse, 1968-1972 | | | 120 | | | Director, The Finish Line (athletic shoes and apparel) since July 2003; Director, International Textile Corp. since 2012; Director, hhgregg since May, 2015; former Director, Cobra Electronics Corporation (electronic equipment manufacturer), 1994-August 2014; former Director, Spectrum Brands, Inc. (consumer products), 2002-2009; former Director, Simmons Company (bedding), 2004-2010; former Trustee, BofA Funds Series Trust (11 funds), 2009-2011; former Director, McMoRan Exploration Company (oil and gas exploration and development), 2010-2013 | |
Patricia M. Flynn
901 S. Marquette Ave. Minneapolis, MN 55402
1950 | | Trustee since 11/04 for RiverSource Funds and since 6/11 for Nations Funds | | Trustee Professor of Economics and Management, Bentley University since 1976 (also teaches and conducts research on corporate governance); Dean, McCallum Graduate School of Business, Bentley University, 1992-2002 | | | 120 | | | Trustee, MA Taxpayers Foundation since 1997; Board of Governors, Innovation Institute, MA Technology Collaborative since 2010 | |
William A. Hawkins
901 S. Marquette Ave.
Minneapolis, MN 55402
1942 | | Chair of the Board since 11/15; Trustee since 6/11 for RiverSource Funds and since 1/05 for Nations Funds | | Managing Director, Overton Partners (financial consulting) since August 2010; President and Chief Executive Officer, California General Bank, N.A., January 2008-August 2010; Operation Hope, COO, 2004-2007; IndyMac Bancorp, President, CBG, 1999-2003; American General Bank, President, 1997-1999; Griffin Financial Services, CEO, 1981-1997; The Griffin Funds, CEO, 1992-1998 | | | 120 | | | Former Trustee, BofA Funds Series Trust (11 funds), 2009-2015 | |
R. Glenn Hilliard
901 S. Marquette Ave. Minneapolis, MN 55402
1943 | | Trustee since 6/11 for RiverSource Funds and since 1/05 for Nations Funds | | Chairman and Chief Executive Officer, Hilliard Group LLC (investing and consulting) since April 2003; Non-Executive Director & Chairman, CNO Financial Group, Inc. (insurance), 2003-2011; Chair & CEO, ING Americas, 1996-2003 | | | 118 | | | Chairman, BofA Funds Series Trust (11 funds); former Director, CNO Financial Group, Inc. (insurance), 2003-2011 | |
Annual Report 2016
34
COLUMBIA AMT-FREE VIRGINIA INTERMEDIATE MUNI BOND FUND
TRUSTEES AND OFFICERS (continued)
Independent Trustees (continued)
Name,
Address,
Year of Birth | | Position Held With
the Funds and Length of
Service | | Principal Occupation(s)
During the Past Five Years
and Other Relevant
Professional Experience | | Number of
Funds in the
Columbia Funds
Complex
Overseen | | Other Directorships
Held by Trustee During
the Past Five Years | |
Catherine James Paglia
901 S. Marquette Ave.
Minneapolis, MN 55402
1952 | | Trustee since 11/04 for RiverSource Funds and since 6/11 for Nations Funds | | Director, Enterprise Asset Management, Inc. (private real estate and asset management company) since September 1998; Managing Director and Partner, Interlaken Capital, Inc., 1989-1997; Managing Director, Morgan Stanley, 1982-1989; Vice President, Investment Banking, 1980-1982, Associate, Investment Banking, 1976-1980, Dean Witter Reynolds, Inc. | | | 120 | | | Director, Valmont Industries, Inc. (irrigation systems manufacturer) since 2012; Trustee, Carleton College (on the Investment Committee); Trustee, Carnegie Endowment for International Peace (on the Investment Committee) | |
Leroy C. Richie
901 S. Marquette Ave.
Minneapolis, MN 55402
1941 | | Trustee since 2000 for Seligman Funds, since 11/08 for RiverSource Funds and since 6/11 for Nations Funds | | Counsel, Lewis & Munday, P.C. (law firm) since 2004; Vice President and General Counsel, Automotive Legal Affairs, Chrysler Corporation, 1993-1997 | | | 118 | | | Lead Outside Director, Infinity Resources, Inc. (oil and gas exploration and production) since 1994; Lead Outside Director, Digital Ally, Inc. (digital imaging) since September 2005; Trustee, Marygrove College (Chair of Finance Committee) since 2007; former Director, OGE Energy Corp. (energy and energy services), 2007-2014 | |
Minor M. Shaw
901 S. Marquette Ave.
Minneapolis, MN 55402
1947 | | Trustee since 6/11 for RiverSource Funds and since 2003 for Nations Funds | | President, Micco LLC (private investments) since 2011; President, Micco Corp. (family investment business), 1998-2011 | | | 120 | | | Director, Piedmont Natural Gas; Director, BlueCross BlueShield of South Carolina since April 2008; Chair of the Duke Endowment; Director, National Association of Corporate Directors, Carolinas Chapter since 2013; Chair of Greenville — Spartanburg Airport Commission; former Trustee, BofA Funds Series Trust (11 funds), 2003-2011 | |
Alison Taunton-Rigby
901 S. Marquette Ave.
Minneapolis, MN 55402
1944 | | Trustee since 11/02 for RiverSource Funds and since 6/11 for Nations Funds | | Managing Director, Forester Biotech (consulting), 2001-2003; Chief Executive Officer and Director, RiboNovix, Inc., (biotechnology), 2003-2010; President and Chief Executive Officer of CMT Inc., 2001-2003; Aquila Biopharmaceuticals Inc., 1996-2000; Cambridge Biotech Corporation, 1995-1996; Mitotix Inc., 1993-1994 | | | 120 | | | Director, Abt Associates
(government contractor) since 2001; Director, Boston Children's Hospital since 2002; Director, Healthways, Inc. (health and well-being solutions) since 2005; Director, ICI Mutual Insurance Company, since 2011 | |
Annual Report 2016
35
COLUMBIA AMT-FREE VIRGINIA INTERMEDIATE MUNI BOND FUND
TRUSTEES AND OFFICERS (continued)
Interested Trustee Not Affiliated with Investment Manager*
Name,
Address,
Year of Birth | | Position Held With
Funds and Length of
Service | | Principal Occupation(s)
During Past Five Years
and Other Relevant
Professional Experience | | Number of
Funds in the
Fund Family
Overseen by
Board Member | | Other Present or Past
Directorships/
Trusteeships
(Within Past 5 Years) | |
Anthony M. Santomero
901 S. Marquette Ave.
Minneapolis, MN 55402
1946 | | Trustee since 6/11 for RiverSource Funds and since 1/08 for Nations Funds | | Richard K. Mellon Professor Emeritus of Finance, The Wharton School, University of Pennsylvania since 2002; Senior Advisor, McKinsey & Company (consulting), 2006-2008; President, Federal Reserve Bank of Philadelphia, 2000-2006; Professor of Finance, The Wharton School, University of Pennsylvania, 1972-2002 | | | 118 | | | Trustee, Penn Mutual Life Insurance Company since March 2008; Director, Renaissance Reinsurance Ltd. since May 2008; Director, Citigroup Inc. since 2009; Director, Citibank, N.A. since 2009; former Trustee, BofA Funds Series Trust (11 funds), 2008-2011 | |
* Dr. Santomero is not an affiliated person of the Investment Manager or Ameriprise Financial. However, he is currently deemed by the Funds to be an "interested person" (as defined in the 1940 Act) of the Funds because he serves as a Director of Citigroup Inc. and Citibank, N.A., companies that may directly or through subsidiaries and affiliates engage from time-to-time in brokerage execution, principal transactions and lending relationships with the Funds or accounts advised/managed by the Investment Manager.
Annual Report 2016
36
COLUMBIA AMT-FREE VIRGINIA INTERMEDIATE MUNI BOND FUND
TRUSTEES AND OFFICERS (continued)
Interested Trustee Affiliated with Investment Manager*
Name,
Address,
Year of Birth | | Position Held With
the Funds and Length of
Service | | Principal Occupation(s)
During Past Five Years
and Other Relevant
Professional Experience | | Number of
Funds in the
Columbia Funds
Complex
Overseen | | Other Directorships
Held by Trustee During
the Past Five Years | |
William F. Truscott
c/o Columbia Management
Investment Advisers, LLC, 225 Franklin St.
Boston, MA 02110
1960 | | Trustee since 11/01 for RiverSource Funds and since 6/11 for Nations Funds; Senior Vice President since 2002 for RiverSource Funds and since 5/10 for Nations Funds | | Chairman of the Board and President, Columbia Management Investment Advisers, LLC since May 2010 and February 2012, respectively (previously President and Chief Investment Officer, 2001-April 2010); Chief Executive Officer, Global Asset Management, Ameriprise Financial, Inc. since September 2012 (previously Chief Executive Officer, U.S. Asset Management & President, Annuities, May 2010-September 2012 and President — U.S. Asset Management and Chief Investment Officer, 2005-April 2010); Director and Chief Executive Officer, Columbia Management Investment Distributors, Inc. since May 2010 and February 2012, respectively (previously Chairman of the Board and Chief Executive Officer, 2006-April 2010); Chairman of the Board and Chief Executive Officer, RiverSource Distributors, Inc. since 2006; Director, Threadneedle Asset Management Holdings, SARL since 2014; President and Chief Executive Officer, Ameriprise Certificate Company, 2006-August 2012. | | | 178 | | | Chairman of the Board, Columbia Management Investment Advisers, LLC since May 2010; Director, Columbia Management Investment Distributors, Inc. since May 2010; Former Director, Ameriprise Certificate Company, 2006-January 2013 | |
* Interested person (as defined under the 1940 Act) by reason of being an officer, director, security holder and/or employee of the Investment Manager or Ameriprise Financial.
The Statement of Additional Information has additional information about the Fund's Board members and is available, without charge, upon request by calling 800.345.6611; contacting your financial intermediary; or visiting columbiathreadneedle.com/us.
Annual Report 2016
37
COLUMBIA AMT-FREE VIRGINIA INTERMEDIATE MUNI BOND FUND
TRUSTEES AND OFFICERS (continued)
The Board has appointed officers who are responsible for day-to-day business decisions based on policies it has established. The officers serve at the pleasure of the Board. The following table provides basic information about the Officers of the Fund, including principal occupations during the past five years, although their specific titles may have varied over the period. In addition to Mr. Truscott, who is Senior Vice President, the Fund's other officers are:
Fund Officers
Name,
Address and
Year of Birth | | Position and Year
First Appointed to
Position for any Fund
in the Columbia
Funds Complex or a
Predecessor Thereof | |
Principal Occupation(s) During Past Five Years | |
Christopher O. Petersen
5228 Ameriprise
Financial Center
Minneapolis, MN 55474
Born 1970 | | President and Principal Executive Officer (2015) | | Vice President and Lead Chief Counsel, Ameriprise Financial, Inc. since January 2015 (previously, Vice President and Chief Counsel January 2010-December 2014; and Vice President and Group Counsel or Counsel 2004-January 2010); officer of Columbia Funds and affiliated funds since 2007. | |
Michael G. Clarke
225 Franklin Street
Boston, MA 02110
Born 1969 | | Treasurer (2011), Chief Financial Officer (2009) and Chief Accounting Officer (2015) | | Vice President — Mutual Fund Administration, Columbia Management Investment Advisers, LLC, since May 2010; Managing Director of Fund Administration, Columbia Management Advisors, LLC, September 2004-April 2010; senior officer of Columbia Funds and affiliated funds since 2002. | |
Paul B. Goucher
100 Park Avenue
New York, NY 10017
Born 1968 | | Senior Vice President (2011), Chief Legal Officer (2015) and Assistant Secretary (2008) | | Vice President and Lead Chief Counsel, Ameriprise Financial, Inc. since November 2008 and January 2013, respectively (previously Chief Counsel, January 2010-January 2013 and Group Counsel, November 2008-January 2010). | |
Thomas P. McGuire
225 Franklin Street
Boston, MA 02110
Born 1972 | | Senior Vice President and Chief Compliance Officer (2012) | | Vice President — Asset Management Compliance, Ameriprise Financial, Inc., since May 2010; Chief Compliance Officer, Ameriprise Certificate Company since September 2010; Compliance Executive, Bank of America, 2005-April 2010. | |
Colin Moore
225 Franklin Street
Boston, MA 02110
Born 1958 | | Senior Vice President (2010) | | Executive Vice President and Global Chief Investment Officer, Ameriprise Financial, Inc., since July 2013; Director and Global Chief Investment Officer, Columbia Management Investment Advisers, LLC since May 2010; Manager, Managing Director and Chief Investment Officer, Columbia Management Advisors, LLC, 2007-April 2010. | |
Michael E. DeFao
225 Franklin Street
Boston, MA 02110
Born 1968 | | Vice President (2011) and Assistant Secretary (2010) | | Vice President and Chief Counsel, Ameriprise Financial, Inc. since May 2010; Associate General Counsel, Bank of America, 2005-April 2010. | |
Amy Johnson
5228 Ameriprise
Financial Center
Minneapolis, MN 55474
Born 1965 | | Vice President (2006) | | Managing Director and Chief Operating Officer, Columbia Management Investment Advisers, LLC since May 2010 (previously Chief Administrative Officer, 2009-April 2010, and Vice President — Asset Management and Trust Company Services, 2006-2009). | |
Lyn Kephart-Strong
5228 Ameriprise
Financial Center
Minneapolis, MN 55474
Born 1960 | | Vice President (2015) | | President, Columbia Management Investment Services Corp. since October 2014; Vice President & Resolution Officer, Ameriprise Trust Company since August 2009; President, RiverSource Service Corporation 2004-2010. | |
Ryan C. Larrenaga
225 Franklin Street
Boston, MA 02110
Born 1970 | | Vice President and Secretary (2015) | | Vice President and Group Counsel, Ameriprise Financial, Inc. since August 2011 (previously, Counsel from May 2010 to August 2011); Assistant General Counsel, Bank of America, 2005-April 2010; officer of Columbia Funds and affiliated funds since 2005. | |
Annual Report 2016
38
COLUMBIA AMT-FREE VIRGINIA INTERMEDIATE MUNI BOND FUND
IMPORTANT INFORMATION ABOUT THIS REPORT
Each fund mails one shareholder report to each shareholder address. If you would like more than one report, please call shareholder services at 800.345.6611 and additional reports will be sent to you.
The policy of the Board is to vote the proxies of the companies in which each fund holds investments consistent with the procedures as stated in the Statement of Additional Information (SAI). You may obtain a copy of the SAI without charge by calling 800.345.6611; contacting your financial intermediary; visiting columbiathreadneedle.com/us; or searching the website of the Securities and Exchange Commission (SEC) at sec.gov. Information regarding how each fund voted proxies relating to portfolio securities is filed with the SEC by August 31st for the most recent 12-month period ending June 30th of that year, and is available without charge by visiting columbiathreadneedle.com/us, or searching the website of the SEC at sec.gov.
Each fund files a complete schedule of portfolio holdings with the SEC for the first and third quarters of each fiscal year on Form N-Q. Each fund's Form N-Q is available on the SEC's website at sec.gov and may be reviewed and copied at the SEC's Public Reference Room in Washington, D.C. Information on the operation of the Public Reference Room may be obtained by calling 800.SEC.0330. Each fund's complete schedule of portfolio holdings, as filed on Form N-Q, can also be obtained without charge, upon request, by calling 800.345.6611.
Annual Report 2016
39
Columbia AMT-Free Virginia Intermediate Muni Bond Fund
P.O. Box 8081
Boston, MA 02266-8081

This information is for use with concurrent or prior delivery of a fund prospectus. Please read and consider the investment objectives, risks, charges and expenses for any fund carefully before investing. For a prospectus and summary prospectus, which contains this and other important information about the Fund, go to columbiathreadneedle.com/us. The Fund is distributed by Columbia Management Investment Distributors, Inc., member FINRA, and managed by Columbia Management Investment Advisers, LLC.
Columbia Threadneedle Investments (Columbia Threadneedle) is the global brand name of the Columbia and Threadneedle group of companies.
All rights reserved. Columbia Management Investment Distributors, Inc., 225 Franklin Street, Boston, MA 02110-2804
© 2016 Columbia Management Investment Advisers, LLC.
columbiathreadneedle.com/us
ANN239_04_F01_(06/16)

ANNUAL REPORT
April 30, 2016

COLUMBIA SHORT TERM MUNICIPAL BOND FUND

 Dear Shareholders,
Volatility comes with the territory for long-term investors. Some investors instinctively want to pull out of the market or sell underperforming investments at the first sign of increased volatility or perhaps even as soon as they perceive it on the horizon. But taking yourself out of the market could mean losing out on potential opportunities, and putting your longer-term investment goals at risk.
Cumulative return is not just about achieving high returns when markets are going up; it's also about remaining invested and minimizing losses during weak or volatile markets so that you can participate on the upside. Developing a deeper understanding of the various risks your portfolio is subject to can help you balance these risks.
Diversification is critical in seeking to achieve that balance. We believe that most portfolios could be more effectively diversified either by introducing holdings with performance profiles unrelated to existing holdings (like alternative products) or by rebalancing existing holdings with an eye toward risk allocation. Over time, distributing risk more evenly may produce a more pronounced diversification benefit and may improve portfolio efficiency. We believe market volatility can create significant opportunities and, in fact, these periods may be some of the very best times to invest.
With this in mind, I thought it important to highlight excerpts from a piece written by Colin Moore, Global Chief Investment Officer, in which he touches on some of these issues emphasizing the importance of a properly constructed portfolio in seeking to effectively manage volatility and to achieve consistency of returns. I encourage you to read the article in its entirety. To access the full article and for other insights on current market, please visit blog.columbiathreadneedleus.com/latest-perspectives.
You need investments that are designed to help you ease the impact of volatile market environments and keep the savings you have worked tirelessly to amass. Columbia Threadneedle Investments provides investment solutions to help you tackle financial challenges and achieve your desired outcome.
Best regards,

Christopher O. Petersen
President, Columbia Funds
Excerpts from:
Taking the scare out of the volatility bogeyman
By Colin Moore, Global Chief Investment Officer
Colin Moore is the global chief investment officer for Columbia Threadneedle Investments. His responsibilities include ensuring that a disciplined investment process is in place across all asset classes, including equity and fixed income. Mr. Moore joined one of the Columbia Threadneedle Investments legacy firms in 2002 as head of equity and was also head of fixed income and liquidity strategies from 2009 – 2010.

n In today's low growth, higher volatility world, the emphasis is shifting from maximization of returns to consistency of returns.
PRESIDENT'S MESSAGE (continued)
n Portfolios should represent the behavioral risk-return tradeoff of investors, remembering that they won't stay invested to realize the return if we get the risk tolerance wrong.
n Holding long-term savings in cash to avoid volatility (the financial equivalent of hiding under the sheets) is detrimental to achieving long-term goals.
According to Wikipedia, "The bogeyman is a common allusion to a mythical creature in many cultures used to control behavior. This monster has no specific appearance, and conceptions about it can vary drastically from household to household within the same community; in many cases he has no set appearance in the mind of an adult or child, but is simply a non-specific embodiment of terror." Different cultures have different names and physical representations for the bogeyman, and investors are no different. We have terrible monsters that we fear may destroy our portfolios, and we call one of the scariest of them volatility.
While the bogeyman is mythical (I hope!), volatility is real and can cause serious damage. To understand why investors have such a hard time coping with volatility, we first need to define three cognitive biases at work in today's investment environment:
1) Recency bias — something that has recently come to the forefront of our attention, regardless of how long established it is, suddenly seems to appear with improbable frequency.
2) Negativity bias — we tend to have a greater recall of unpleasant memories than positive memories.
3) Loss aversion — our dissatisfaction with losing money tends to be greater than our satisfaction with making money.
The level of volatility varies dramatically, and so does investor fear and panic selling — waxing when volatility rises, waning when it falls. Recent studies have pointed to demographics as an important driver of panic selling. The theory is that as people get closer to retirement, the prospects of a large (20% – 30%) loss in financial assets can have a much more pronounced effect on their sense of well-being. Wealth preservation instincts kick in much more quickly than for younger (and typically less wealthy) savers.
The reality is that there is little opportunity for return without volatility. Therefore, the bogeyman effect of holding long-term savings in cash to avoid volatility (the financial equivalent of hiding under the sheets) is detrimental to achieving long-term goals. This effect tends to be more pronounced during the episodic spikes in volatility. The significant spike in volatility in 2008 and 2009 led to significant withdrawals from long-term investment funds over the same period. Less pronounced effects can also be seen when comparing 2001 – 2003 and 2011 – 2012. Conversely, flows picked up when volatility returned to "normal" levels. Investor behavior of this type is consistent with the three behavioral biases.
I believe average volatility will be higher over the next 10 years than the last 10 years and episodic spikes will increase in frequency because sustainable economic growth will be structurally lower and geopolitical risk higher than any time since World War II. Low growth creates uncertainty while loss aversion will make investors fear that we are one economic mishap or geopolitical event away from no growth or recession. The result will be higher volatility on average. Negativity bias will tend to exacerbate "spike" reactions to event-driven geopolitical news, and the volatility bogeyman will appear more often. Assuming the behavioral biases continue, investor returns are likely to be very disappointing regardless of the total return generated by financial markets due to the bogeyman effect.
To mitigate this effect, we need to focus on portfolio construction and an improved understanding of diversification. I accept that equities are likely to offer the highest return over the next 10 years, but they also offer the highest volatility. Many portfolio construction optimization tools use historical average volatility, which is likely to underestimate the volatility investors will face. The bogeyman emerges when individual asset class volatility spikes and cross correlations rise, the combination of which increases overall portfolio volatility far beyond expectation. Diversification is meant to protect investors against volatility, but what's the point of owning lots of investments if the volatility bogeyman has not been properly estimated?
Most importantly, portfolios should be constructed to properly represent the behavioral risk-return tradeoff of investors, remembering that they won't stay invested to realize the return if we get the risk tolerance wrong. In a low growth, higher volatility world, the emphasis is shifting to return consistency rather than return maximization,
PRESIDENT'S MESSAGE (continued)
and investors are best served through investment approaches that appreciate that distinction. Even though it's a permanent feature of financial markets, volatility is less likely to be the bogeyman we all fear if portfolios are constructed with this understanding.
Please visit blog.columbiathreadneedleus.com/latest-perspectives to read the entire article.
Investors should consider the investment objectives, risks, charges and expenses of a mutual fund carefully before investing. For a free prospectus and summary prospectus, which contains this and other important information about a fund, visit columbiathreadneedle.com/us. The prospectus should be read carefully before investing.
The views expressed are as of April 2016, may change as market or other conditions change, and may differ from views expressed by other Columbia Management Investment Advisers, LLC (CMIA) associates or affiliates. Actual investments or investment decisions made by CMIA and its affiliates, whether for its own account or on behalf of clients, will not necessarily reflect the views expressed. This information is not intended to provide investment advice and does not account for individual investor circumstances. Investment decisions should always be made based on an investor's specific financial needs, objectives, goals, time horizon and risk tolerance. Asset classes described may not be suitable for all investors.
Past performance does not guarantee future results, and no forecast should be considered a guarantee either. Since economic and market conditions change frequently, there can be no assurance that the trends described here will continue or that the forecasts are accurate.
Diversification does not guarantee a profit or protect against loss.
Columbia Funds are distributed by Columbia Management Investment Distributors, Inc., member FINRA, and managed by Columbia Management Investment Advisers, LLC.
© 2016 Columbia Management Investment Advisers, LLC. All rights reserved
COLUMBIA SHORT TERM MUNICIPAL BOND FUND
Performance Overview | | | 2 | | |
Manager Discussion of Fund Performance | | | 4 | | |
Understanding Your Fund's Expenses | | | 7 | | |
Portfolio of Investments | | | 8 | | |
Statement of Assets and Liabilities | | | 25 | | |
Statement of Operations | | | 27 | | |
Statement of Changes in Net Assets | | | 28 | | |
Financial Highlights | | | 30 | | |
Notes to Financial Statements | | | 36 | | |
Report of Independent Registered Public Accounting Firm | | | 43 | | |
Federal Income Tax Information | | | 44 | | |
Trustees and Officers | | | 45 | | |
Important Information About This Report | | | 51 | | |
Fund Investment Manager
Columbia Management Investment
Advisers, LLC
225 Franklin Street
Boston, MA 02110
Fund Distributor
Columbia Management Investment
Distributors, Inc.
225 Franklin Street
Boston, MA 02110
Fund Transfer Agent
Columbia Management Investment
Services Corp.
P.O. Box 8081
Boston, MA 02266-8081
For more information about any of the funds, please visit columbiathreadneedle.com/us or call 800.345.6611. Customer Service Representatives are available to answer your questions Monday through Friday from 8 a.m. to 7 p.m. Eastern time.
The views expressed in this report reflect the current views of the respective parties. These views are not guarantees of future performance and involve certain risks, uncertainties and assumptions that are difficult to predict, so actual outcomes and results may differ significantly from the views expressed. These views are subject to change at any time based upon economic, market or other conditions and the respective parties disclaim any responsibility to update such views. These views may not be relied on as investment advice and, because investment decisions for a Columbia fund are based on numerous factors, may not be relied on as an indication of trading intent on behalf of any particular Columbia fund. References to specific securities should not be construed as a recommendation or investment advice.
COLUMBIA SHORT TERM MUNICIPAL BOND FUND
Performance Summary
n Columbia Short Term Municipal Bond Fund (the Fund) Class A shares returned 0.74% excluding sales charges for the 12-month period that ended April 30, 2016. The Fund's Class Z shares returned 0.99% during the same time period.
n The Fund underperformed its benchmark, the Barclays 1-3 Year Municipal Bond Index, which returned 1.13% for the same time period.
n Effective credit quality and yield curve positioning overall contributed positively, virtually offset by the negative effect of duration positioning. Sector positioning and security selection generated mixed results during the reporting period.
Average Annual Total Returns (%) (for period ended April 30, 2016)
| | | Inception | | 1 Year | | 5 Years | | 10 Years | |
Class A | | 11/02/93 | | | | | | | | | | | | | |
Excluding sales charges | | | | | | | 0.74 | | | | 0.85 | | | | 1.97 | | |
Including sales charges | | | | | | | -0.31 | | | | 0.64 | | | | 1.87 | | |
Class B | | 10/12/93 | | | 0.00 | | | | 0.10 | | | | 1.21 | | |
Class C | | 05/19/94 | | | | | | | | | | | | | |
Excluding sales charges | | | | | | | 0.00 | | | | 0.10 | | | | 1.21 | | |
Including sales charges | | | | | | | -1.00 | | | | 0.10 | | | | 1.21 | | |
Class R4* | | 03/19/13 | | | 1.09 | | | | 1.10 | | | | 2.23 | | |
Class R5* | | 11/08/12 | | | 1.10 | | | | 1.16 | | | | 2.26 | | |
Class Z | | 10/07/93 | | | 0.99 | | | | 1.10 | | | | 2.23 | | |
Barclays 1-3 Year Municipal Bond Index | | | | | | | 1.13 | | | | 1.12 | | | | 2.43 | | |
Returns for Class A are shown with and without the maximum initial sales charge of 1.00%. Returns for Class C are shown with and without the applicable contingent deferred sales charge (CDSC) of 1.00% in the first year. The Fund's other classes are not subject to sales charges and have limited eligibility. Please see the Fund's prospectus for details. Performance for different share classes will vary based on differences in sales charges and fees associated with each class. All results shown assume reinvestment of distributions during the period. Returns do not reflect the deduction of taxes that a shareholder may pay on Fund distributions or on the redemption of Fund shares. Performance results reflect the effect of any fee waivers or reimbursements of Fund expenses by Columbia Management Investment Advisers, LLC and/or any of its affiliates. Absent these fee waivers or expense reimbursement arrangements, performance results would have been lower.
The performance information shown represents past performance and is not a guarantee of future results. The investment return and principal value of your investment will fluctuate so that your shares, when redeemed, may be worth more or less than their original cost. Current performance may be lower or higher than the performance information shown. You may obtain performance information current to the most recent month-end by contacting your financial intermediary, visiting columbiathreadneedle.com/us or calling 800.345.6611.
*The returns shown for periods prior to the share class inception date (including returns for the Life of the Fund, if shown, which are since Fund inception) include the returns of the Fund's oldest share class. These returns are adjusted to reflect any higher class-related operating expenses of the newer share classes, as applicable. Please visit columbiathreadneedle.com/us/investment-products/mutual-funds/appended-performance for more information.
The Barclays 1-3 Year Municipal Bond Index is an unmanaged index which consists of a broad selection of investment grade general obligation and revenue bonds of maturities ranging from one year to three years.
Indices are not available for investment, are not professionally managed and do not reflect sales charges, fees, brokerage commissions, taxes or other expenses of investing. Securities in the Fund may not match those in an index.
Annual Report 2016
2
COLUMBIA SHORT TERM MUNICIPAL BOND FUND
PERFORMANCE OVERVIEW (continued)
Performance of a Hypothetical $10,000 Investment (May 1, 2006 – April 30, 2016)

The chart above shows the change in value of a hypothetical $10,000 investment in Class A shares of Columbia Short Term Municipal Bond Fund during the stated time period, and does not reflect the deduction of taxes that a shareholder may pay on Fund distributions or on the redemption of Fund shares.
Annual Report 2016
3
COLUMBIA SHORT TERM MUNICIPAL BOND FUND
MANAGER DISCUSSION OF FUND PERFORMANCE
Portfolio Management
Catherine Stienstra
Anders Myhran, CFA
Top Ten States/Territories (%)
(at April 30, 2016) | |
New York | | | 27.7 | | |
Illinois | | | 16.2 | | |
New Jersey | | | 5.8 | | |
Texas | | | 5.6 | | |
California | | | 4.2 | | |
Washington | | | 3.8 | | |
Pennsylvania | | | 3.8 | | |
Kentucky | | | 3.3 | | |
Florida | | | 2.9 | | |
Connecticut | | | 2.8 | | |
Percentages indicated are based upon total investments (excluding Money Market Funds).
For further detail about these holdings, please refer to the section entitled "Portfolio of Investments."
Fund holdings are as of the date given, are subject to change at any time, and are not recommendations to buy or sell any security.
For the 12-month period that ended April 30, 2016, the Fund's Class A shares returned 0.74% excluding sales charges. Class Z shares of the Fund returned 0.99%. The Fund underperformed its benchmark, the Barclays 1-3 Year Municipal Bond Index, which returned 1.13% for the same period. Effective credit quality and yield curve positioning overall contributed positively, virtually offset by the negative effect of duration positioning. Sector positioning and security selection generated mixed results during the annual period.
Shifting Fed Policy Pressured Short-Term Tax-Exempt Bond Market
Overall, municipal bonds outperformed most asset classes in 2015 and posted ten consecutive months of positive returns as of April 2016. However, the short-term municipal bond market was somewhat pressured, as longer dated securities outperformed short-term municipal bonds during the reporting period. Also, lower quality, higher yielding municipal bonds generally outperformed their higher quality, lower yielding counterparts.
The key factor impacting the tax-exempt fixed-income market during the period was perception about Federal Reserve (Fed) monetary policy. The Fed's language shifted throughout the period, moving from a "balance of risk" stance early in the period to implementing its first interest rate increase since 2006 in December 2015. The Fed subsequently lowered expectations about the number of further interest rate hikes likely to be implemented in 2016 and shifted its focus on various global and domestic factors in between. The ever-changing communications from the Fed created significant volatility in municipal bond yield curve activity. Overall, the municipal bond yield curve across the spectrum of maturities flattened during the period, as yields on long-term maturities declined and yields on short-term maturities rose. Similarly, the short-term municipal bond yield curve, i.e. from one-year to five-year maturities, flattened, as one-year maturity yields rose, while three-year and five-year maturity yields declined. (There is an inverse relationship between bond prices and yield movements, so that bond prices fall when yields rise and vice versa.)
Still, underlying municipal bond market fundamentals remained sound throughout the period, as the gradually growing U.S. economy drove sales, property and income tax revenues higher, while state and local government spending stayed restrained. Select negative credit stories made headlines, including Puerto Rico's multi-notch downgrade, unfunded pensions and/or budget impasses in Illinois, New Jersey, Pennsylvania and Connecticut and turmoil in the Chicago Public Schools. However, such stories were not representative of the general health of the broad municipal bond market, and overall, the default environment remained benign. There were more credit upgrades than downgrades. Municipal bonds were broadly viewed as a relatively safe haven during the period, as volatile equity markets drove investors to the segment.
The technical, or supply and demand, landscape for the municipal bond market overall also supported tax-exempt fixed-income market performance. Supply on the national and state levels declined, with
Annual Report 2016
4
COLUMBIA SHORT TERM MUNICIPAL BOND FUND
MANAGER DISCUSSION OF FUND PERFORMANCE (continued)
refunding activity down considerably although new money issuance was up. Meanwhile, demand, as evidenced by mutual fund flows, was strong during the period. Indeed, year-to-date through April 30, 2016 mutual fund inflows were the highest seen in the last five years, as investors continued to search for attractive levels of tax-exempt income.
Exposure to IDR/PCR Sector and Chicago Credits Hampered Returns
Detracting from the Fund's relative results was having an underweight exposure to industrial development revenue/pollution control revenue (IDR/PCR) bonds, as this was the best performing sector in the benchmark during the period. Having a modestly overweight exposure to Chicago general obligation securities also hurt, as these spreads, or yield differential to AAA-rated municipal bonds, widened. Chicago credits continued to struggle in light of headlines around its pension reform attempts and ratings downgrades.
The Fund's duration positioning also hurt its relative results during the period. The Fund had a modestly shorter duration stance than that of the benchmark for most of the period.
Credit Quality Allocation and Yield Curve Positioning Overall Boosted Results
As lower quality securities overall outperformed higher quality securities during the period, having overweight allocations to bonds rated A and BBB and exposure to non-rated securities and having underweight allocations to bonds rated AAA added value. The Fund also benefited from its yield curve positioning. The Fund had exposure to bonds with maturities of more than three years, which, not part of the benchmark, contributed positively, as longer dated maturities outperformed shorter term maturities even within the short-term segment, i.e. one to five year range, of the municipal bond yield curve. This positive contribution was only partially offset by an overweight to bonds with maturities of one year and less, which hurt, as yields rose in this portion of the municipal bond yield curve.
From a sector perspective, having an underweight to pre-refunded* bonds boosted the Fund's relative results. The pre-refunded sector is generally a higher quality one, which underperformed lower quality sectors during the period. Having an overweight exposure to the transportation sector also helped, as these bonds tend to be of lower quality, which, as mentioned, outperformed higher quality bonds during the period. Security selection among state general obligation bonds, local general obligation bonds and transportation bonds contributed positively as well.
Fundamental Analysis Drove Portfolio Changes
We adjusted the Fund's duration during the period, shifting primarily between a modestly shorter duration than that of the benchmark and a more neutral duration stance depending upon then-current statements by the Fed. We maintained the Fund's barbell structure (larger weightings in the ends of the spectrum, with minimal weightings in the middle), but
Quality Breakdown (%)
(at April 30, 2016) | |
AAA rating | | | 4.6 | | |
AA rating | | | 32.7 | | |
A rating | | | 34.1 | | |
BBB rating | | | 12.6 | | |
BB rating | | | 0.8 | | |
Not rated | | | 15.2 | | |
Total | | | 100.0 | | |
Percentages indicated are based upon total fixed income investments (excluding Money Market Funds).
Bond ratings apply to the underlying holdings of the Fund and not the Fund itself and are divided into categories ranging from highest to lowest credit quality, determined by using the middle rating of Moody's, S&P and Fitch, after dropping the highest and lowest available ratings. When ratings are available from only two rating agencies, the lower rating is used. When a rating is available from only one rating agency, that rating is used. When a bond is not rated by any rating agency, it is designated as "Not rated." Credit quality ratings assigned by a rating agency are subjective opinions, not statements of fact, and are subject to change, including daily. The ratings assigned by credit rating agencies are but one of the considerations that the Investment Manager and/or Fund's subadviser incorporates into its credit analysis process, along with such other issuer-specific factors as cash flows, capital structure and leverage ratios, ability to de-leverage (repay) through free cash flow, quality of management, market positioning and access to capital, as well as such security-specific factors as the terms of the security (e.g., interest rate and time to maturity) and the amount and type of any collateral.
Annual Report 2016
5
COLUMBIA SHORT TERM MUNICIPAL BOND FUND
MANAGER DISCUSSION OF FUND PERFORMANCE (continued)
Investment Risks
Fixed-income securities present issuer default risk. The Fund invests substantially in municipal securities and will be affected by tax, legislative, regulatory, demographic or political changes, as well as changes impacting a state's financial, economic or other conditions. A relatively small number of tax-exempt issuers may necessitate the Fund investing more heavily in a single issuer and, therefore, be more exposed to the risk of loss than a fund that invests more broadly. Prepayment and extension risk exists as a loan, bond or other investment may be called, prepaid or redeemed before maturity and that similar yielding investments may not be available for purchase. Market risk may affect a single issuer, sector of the economy, industry or the market as a whole. A rise in interest rates may result in a price decline of fixed-income instruments held by the Fund, negatively impacting its performance and NAV. Falling rates may result in the Fund investing in lower yielding debt instruments, lowering the Fund's income and yield. These risks may be heightened for longer maturity and duration securities. Federal and state tax rules apply to capital gain distributions and any gains or losses on sales. Income may be subject to state, local or alternative minimum taxes. See the Fund's prospectus for more information on these and other risks.
allowed the overweight in bonds with maturities of one year and under to become less pronounced as we used the short-term end of the Fund's barbell structure as a source of liquidity. From a credit-quality perspective, we increased the Fund's emphasis on bonds rated A and BBB as we sought to add yield. We trimmed the Fund's overweight to Illinois state general obligation bonds given the state's lingering budget impasse. We modestly increased the Fund's position in Chicago general obligation bonds, shifting from a neutral weighting relative to the benchmark to an overweight. We reduced the Fund's exposure to California state bonds, as spreads compressed to what we view as rich levels given strong demand for the state's tax-exempt securities.
*Pre-refunded bonds, also known as advance refunding, is a procedure in which a bond issuer floats a second bond at a lower interest rate, and the proceeds from the sale of the second bond are invested, usually in Treasury securities, which in turn, are held in escrow collateralizing the first bond. Advance refunded bonds no longer represent the credit risk profile of the original borrower, and given the high credit quality of the escrow account they often increase in value — sometimes significantly.
Annual Report 2016
6
COLUMBIA SHORT TERM MUNICIPAL BOND FUND
UNDERSTANDING YOUR FUND'S EXPENSES
(Unaudited)
As an investor, you incur two types of costs. There are transaction costs, which generally include sales charges on purchases and may include redemption fees. There are also ongoing costs, which generally include management fees, distribution and/or service fees, and other fund expenses. The following information is intended to help you understand your ongoing costs (in dollars) of investing in the Fund and to help you compare these costs with the ongoing costs of investing in other mutual funds.
Analyzing Your Fund's Expenses
To illustrate these ongoing costs, we have provided examples and calculated the expenses paid by investors in each share class of the Fund during the period. The actual and hypothetical information in the table is based on an initial investment of $1,000 at the beginning of the period indicated and held for the entire period. Expense information is calculated two ways and each method provides you with different information. The amount listed in the "Actual" column is calculated using the Fund's actual operating expenses and total return for the period. You may use the Actual information, together with the amount invested, to estimate the expenses that you paid over the period. Simply divide your account value by $1,000 (for example, an $8,600 account value divided by $1,000 = 8.6), then multiply the results by the expenses paid during the period under the "Actual" column. The amount listed in the "Hypothetical" column assumes a 5% annual rate of return before expenses (which is not the Fund's actual return) and then applies the Fund's actual expense ratio for the period to the hypothetical return. You should not use the hypothetical account values and expenses to estimate either your actual account balance at the end of the period or the expenses you paid during the period. See "Compare With Other Funds" below for details on how to use the hypothetical data.
Compare With Other Funds
Since all mutual funds are required to include the same hypothetical calculations about expenses in shareholder reports, you can use this information to compare the ongoing cost of investing in the Fund with other funds. To do so, compare the hypothetical example with the 5% hypothetical examples that appear in the shareholder reports of other funds. As you compare hypothetical examples of other funds, it is important to note that hypothetical examples are meant to highlight the ongoing costs of investing in a fund only and do not reflect any transaction costs, such as sales charges, or redemption or exchange fees. Therefore, the hypothetical calculations are useful in comparing ongoing costs only, and will not help you determine the relative total costs of owning different funds. If transaction costs were included in these calculations, your costs would be higher.
November 1, 2015 – April 30, 2016
| | | Account Value at the Beginning
of the Period ($) | | Account Value at the End of the
Period ($) | | Expenses Paid During the
Period ($) | | Fund's Annualized
Expense Ratio (%) | |
| | | Actual | | Hypothetical | | Actual | | Hypothetical | | Actual | | Hypothetical | | Actual | |
Class A | | | 1,000.00 | | | | 1,000.00 | | | | 1,003.80 | | | | 1,021.28 | | | | 3.59 | | | | 3.62 | | | | 0.72 | | |
Class B | | | 1,000.00 | | | | 1,000.00 | | | | 1,000.00 | | | | 1,017.55 | | | | 7.31 | | | | 7.37 | | | | 1.47 | | |
Class C | | | 1,000.00 | | | | 1,000.00 | | | | 1,000.00 | | | | 1,017.55 | | | | 7.31 | | | | 7.37 | | | | 1.47 | | |
Class R4 | | | 1,000.00 | | | | 1,000.00 | | | | 1,005.10 | | | | 1,022.53 | | | | 2.34 | | | | 2.36 | | | | 0.47 | | |
Class R5 | | | 1,000.00 | | | | 1,000.00 | | | | 1,004.70 | | | | 1,023.07 | | | | 1.79 | | | | 1.81 | | | | 0.36 | | |
Class Z | | | 1,000.00 | | | | 1,000.00 | | | | 1,005.10 | | | | 1,022.53 | | | | 2.34 | | | | 2.36 | | | | 0.47 | | |
Expenses paid during the period are equal to the annualized expense ratio for each class as indicated above, multiplied by the average account value over the period and then multiplied by the number of days in the Fund's most recent fiscal half year and divided by 366.
Expenses do not include fees and expenses incurred indirectly by the Fund from its investment in underlying funds, including affiliated and non-affiliated pooled investment vehicles, such as mutual funds and exchange-traded funds.
Had Columbia Management Investment Advisers, LLC and/or certain of its affiliates not waived/reimbursed certain fees and expenses, account value at the end of the period would have been reduced.
Annual Report 2016
7
COLUMBIA SHORT TERM MUNICIPAL BOND FUND
PORTFOLIO OF INVESTMENTS
April 30, 2016
(Percentages represent value of investments compared to net assets)
Municipal Bonds 76.5%
Issue
Description | | Coupon
Rate | | Principal
Amount ($) | | Value ($) | |
ALABAMA 1.0% | |
Alabama 21st Century Authority
Revenue Bonds
Series 2012A
06/01/18 | | | 5.000 | % | | | 1,250,000 | | | | 1,351,688 | | |
Alabama Federal Aid Highway Finance Authority
Revenue Bonds
Grant Anticipation - GARVEE
Series 2012
09/01/20 | | | 5.000 | % | | | 2,210,000 | | | | 2,569,390 | | |
Alabama Public School & College Authority
Refunding Revenue Bonds
Pool
Series 2012A
03/01/18 | | | 5.000 | % | | | 7,510,000 | | | | 8,096,531 | | |
City of Birmingham
Refunding Limited General Obligation Notes
Series 2016A(a)
04/01/18 | | | 5.000 | % | | | 6,045,000 | | | | 6,452,191 | | |
Total | | | | | | | 18,469,800 | | |
ALASKA 0.5% | |
Alaska Railroad Corp.
Refunding Revenue Bonds
Sections 5307 & 5337
Series 2015
08/01/18 | | | 5.000 | % | | | 4,500,000 | | | | 4,878,450 | | |
Municipality of Anchorage
Unlimited General Obligation Refunding Bonds
General Purpose
Series 2014B
09/01/19 | | | 5.000 | % | | | 3,645,000 | | | | 4,129,785 | | |
Total | | | | | | | 9,008,235 | | |
ARIZONA 1.4% | |
Arizona Health Facilities Authority
Refunding Revenue Bonds
Banner Health
Series 2015A
01/01/20 | | | 5.000 | % | | | 2,000,000 | | | | 2,286,940 | | |
01/01/21 | | | 5.000 | % | | | 2,435,000 | | | | 2,857,789 | | |
Arizona School Facilities Board
Certificate of Participation
Series 2008
09/01/18 | | | 5.750 | % | | | 5,935,000 | | | | 6,605,002 | | |
Arizona Transportation Board
Refunding Revenue Bonds
Series 2014
07/01/19 | | | 5.000 | % | | | 4,250,000 | | | | 4,803,690 | | |
Municipal Bonds (continued)
Issue
Description | | Coupon
Rate | | Principal
Amount ($) | | Value ($) | |
City of Glendale
Limited General Obligation Refunding Bonds
Series 2015 (AGM)
07/01/19 | | | 4.000 | % | | | 1,350,000 | | | | 1,464,655 | | |
County of Maricopa
Certificate of Participation
Series 2015
07/01/18 | | | 5.000 | % | | | 3,645,000 | | | | 3,959,126 | | |
County of Pima Sewer System
Revenue Bonds
Series 2012A
07/01/16 | | | 3.000 | % | | | 450,000 | | | | 451,980 | | |
07/01/16 | | | 4.000 | % | | | 500,000 | | | | 503,060 | | |
Maricopa County Industrial Development Authority
Revenue Bonds
Dignity Health
Series 2007A
07/01/18 | | | 5.000 | % | | | 1,845,000 | | | | 1,932,767 | | |
State of Arizona
Refunding Certificate of Participation
Department of Administration
Series 2013B
10/01/16 | | | 5.000 | % | | | 175,000 | | | | 178,245 | | |
Total | | | | | | | 25,043,254 | | |
ARKANSAS 0.8% | |
Arkansas Development Finance Authority
Refunding Revenue Bonds
Baptist Health
Series 2015A
12/01/17 | | | 4.000 | % | | | 1,530,000 | | | | 1,606,393 | | |
12/01/18 | | | 5.000 | % | | | 2,640,000 | | | | 2,907,643 | | |
12/01/19 | | | 5.000 | % | | | 8,095,000 | | | | 9,195,192 | | |
Total | | | | | | | 13,709,228 | | |
CALIFORNIA 2.7% | |
Brea Redevelopment Agency
Refunding Tax Allocation Bonds
Redevelopment Project
Series 2013
08/01/17 | | | 5.000 | % | | | 950,000 | | | | 1,001,357 | | |
08/01/18 | | | 5.000 | % | | | 995,000 | | | | 1,088,450 | | |
California State Public Works Board
Refunding Revenue Bonds
Series 2014G
01/01/19 | | | 5.000 | % | | | 13,500,000 | | | | 14,958,000 | | |
Revenue Bonds
Various Capital Projects
Series 2013I
11/01/17 | | | 5.000 | % | | | 750,000 | | | | 798,600 | | |
The accompanying Notes to Financial Statements are an integral part of this statement.
Annual Report 2016
8
COLUMBIA SHORT TERM MUNICIPAL BOND FUND
PORTFOLIO OF INVESTMENTS (continued)
April 30, 2016
Municipal Bonds (continued)
Issue
Description | | Coupon
Rate | | Principal
Amount ($) | | Value ($) | |
City of San Jose Airport
Revenue Bonds
Series 2007A (AMBAC) AMT(b)
03/01/17 | | | 5.000 | % | | | 5,415,000 | | | | 5,600,085 | | |
Glendale Redevelopment Agency Successor Agency
Refunding Tax Allocation Bonds
Central Glendale Redevelopment
Subordinated Series 2013 (AGM)
12/01/16 | | | 4.000 | % | | | 1,000,000 | | | | 1,020,100 | | |
12/01/17 | | | 4.000 | % | | | 1,235,000 | | | | 1,298,442 | | |
Port of Los Angeles
Refunding Revenue Bonds
Series 2014A AMT(b)
08/01/17 | | | 4.000 | % | | | 2,980,000 | | | | 3,098,783 | | |
Sacramento City Financing Authority
Refunding Revenue Bonds
EPA Building
Series 2013A
05/01/16 | | | 4.000 | % | | | 750,000 | | | | 750,157 | | |
State of California
Unlimited General Obligation Bonds
Various Purpose
Series 2013
02/01/18 | | | 5.000 | % | | | 10,000,000 | | | | 10,754,900 | | |
Series 2014
10/01/18 | | | 5.000 | % | | | 5,000,000 | | | | 5,512,900 | | |
Unlimited General Obligation Refunding Bonds
Veterans Bond
Series 2015
12/01/18 | | | 1.050 | % | | | 1,190,000 | | | | 1,197,711 | | |
Total | | | | | | | 47,079,485 | | |
COLORADO 0.6% | |
Colorado Health Facilities Authority
Refunding Revenue Bonds
Evangelical Lutheran Good Samaritan Society
Series 2015
06/01/17 | | | 3.000 | % | | | 300,000 | | | | 306,150 | | |
06/01/18 | | | 3.000 | % | | | 550,000 | | | | 569,415 | | |
06/01/19 | | | 4.000 | % | | | 900,000 | | | | 964,413 | | |
E-470 Public Highway Authority
Refunding Revenue Bonds
Series 2015A
09/01/19 | | | 5.000 | % | | | 1,000,000 | | | | 1,127,720 | | |
E-470 Public Highway Authority(e)
Revenue Bonds
Capital Appreciation
Senior Series 1997B (NPFGC)
09/01/16 | | | 0.000 | % | | | 4,460,000 | | | | 4,444,747 | | |
Municipal Bonds (continued)
Issue
Description | | Coupon
Rate | | Principal
Amount ($) | | Value ($) | |
Regional Transportation District
Refunding Certificate of Participation
Series 2013A
06/01/16 | | | 5.000 | % | | | 3,045,000 | | | | 3,057,783 | | |
Total | | | | | | | 10,470,228 | | |
CONNECTICUT 2.2% | |
City of Bridgeport
Unlimited General Obligation Refunding Bonds
Series 2012B
08/15/17 | | | 5.000 | % | | | 5,000,000 | | | | 5,268,350 | | |
City of New Britain
Unlimited General Obligation Refunding Bonds
Series 2016A (BAM)
03/01/20 | | | 5.000 | % | | | 1,000,000 | | | | 1,139,180 | | |
03/01/21 | | | 5.000 | % | | | 1,500,000 | | | | 1,748,490 | | |
Connecticut Housing Finance Authority
Refunding Revenue Bonds
Series 2014
11/15/44 | | | 4.000 | % | | | 4,010,000 | | | | 4,243,662 | | |
Revenue Bonds
Series 2014A-1
11/15/44 | | | 4.000 | % | | | 4,015,000 | | | | 4,295,729 | | |
Connecticut State Health & Educational Facility Authority(c)
Revenue Bonds
Church Home of Hartford, Inc.
Series 2016
09/01/20 | | | 2.875 | % | | | 700,000 | | | | 701,589 | | |
09/01/21 | | | 3.250 | % | | | 850,000 | | | | 853,638 | | |
State of Connecticut
Unlimited General Obligation Refunding Bonds
Series 2014C
12/15/18 | | | 5.000 | % | | | 5,200,000 | | | | 5,751,304 | | |
Series 2014H
11/15/19 | | | 5.000 | % | | | 13,500,000 | | | | 15,341,670 | | |
Total | | | | | | | 39,343,612 | | |
FLORIDA 2.9% | |
Citizens Property Insurance Corp.
Revenue Bonds
Senior Secured
Series 2012A-1
06/01/17 | | | 5.000 | % | | | 15,000,000 | | | | 15,684,600 | | |
Series 2015A-1
06/01/18 | | | 5.000 | % | | | 1,000,000 | | | | 1,063,000 | | |
06/01/20 | | | 5.000 | % | | | 3,925,000 | | | | 4,452,520 | | |
City of Jacksonville
Refunding Revenue Bonds
Better Jacksonville
Series 2012
10/01/17 | | | 5.000 | % | | | 2,000,000 | | | | 2,120,440 | | |
The accompanying Notes to Financial Statements are an integral part of this statement.
Annual Report 2016
9
COLUMBIA SHORT TERM MUNICIPAL BOND FUND
PORTFOLIO OF INVESTMENTS (continued)
April 30, 2016
Municipal Bonds (continued)
Issue
Description | | Coupon
Rate | | Principal
Amount ($) | | Value ($) | |
City of Tampa
Revenue Bonds
Baycare Health Systems
Series 2010
11/15/16 | | | 5.000 | % | | | 2,000,000 | | | | 2,048,060 | | |
County of Broward Airport System(b)
Refunding Revenue Bonds
Series 2015C AMT
10/01/19 | | | 5.000 | % | | | 3,000,000 | | | | 3,386,460 | | |
10/01/20 | | | 5.000 | % | | | 1,885,000 | | | | 2,186,392 | | |
County of Miami-Dade Aviation
Refunding Revenue Bonds
Series 2014 AMT(b)
10/01/20 | | | 5.000 | % | | | 2,000,000 | | | | 2,322,120 | | |
Florida Housing Finance Corp.
Revenue Bonds
Homeowner Mortgage Special Program
Series 2010A (GNMA/FNMA/FHLMC)
07/01/28 | | | 5.000 | % | | | 1,305,000 | | | | 1,368,867 | | |
Florida Municipal Loan Council
Revenue Bonds
9B Design-Build-Finance Project
Series 2012
08/15/16 | | | 1.750 | % | | | 1,910,000 | | | | 1,913,190 | | |
Hillsborough County Aviation Authority
Refunding Revenue Bonds
Tampa International
Subordinated Series 2013A AMT(b)
10/01/19 | | | 5.000 | % | | | 2,000,000 | | | | 2,257,640 | | |
Pasco County School Board
Revenue Bonds
Series 2013
10/01/18 | | | 5.000 | % | | | 1,000,000 | | | | 1,097,370 | | |
School Board of Miami-Dade County (The)
Refunding Bonds Certificate of Participation
Series 2015D
02/01/20 | | | 5.000 | % | | | 2,250,000 | | | | 2,565,810 | | |
Refunding Certificate of Participation
Series 2015A
05/01/19 | | | 5.000 | % | | | 2,000,000 | | | | 2,232,920 | | |
St. Johns County School Board
Refunding Certificate of Participation
Series 2015
07/01/19 | | | 5.000 | % | | | 1,000,000 | | | | 1,123,910 | | |
07/01/20 | | | 5.000 | % | | | 2,000,000 | | | | 2,308,780 | | |
St. Johns River Power Park
Refunding Revenue Bonds
Issue 2
Series 2011-23
10/01/17 | | | 5.000 | % | | | 3,000,000 | | | | 3,183,750 | | |
Total | | | | | | | 51,315,829 | | |
Municipal Bonds (continued)
Issue
Description | | Coupon
Rate | | Principal
Amount ($) | | Value ($) | |
GEORGIA 1.2% | |
Burke County Development Authority
Refunding Revenue Bonds
Georgia Power Co. Plant Vogtle Project
Series 2015
10/01/32 | | | 2.350 | % | | | 7,700,000 | | | | 7,897,659 | | |
Revenue Bonds
Georgia Power Co. Plant Vogtle Project
Series 2012
11/01/48 | | | 1.550 | % | | | 5,000,000 | | | | 5,006,200 | | |
City of Atlanta Department of Aviation
Refunding Revenue Bonds
General
Series 2011A
01/01/19 | | | 5.000 | % | | | 4,000,000 | | | | 4,437,640 | | |
Monroe County Development Authority
Revenue Bonds
Georgia Power Co. Plant Scherer
Series 2015
10/01/48 | | | 2.350 | % | | | 4,000,000 | | | | 4,102,680 | | |
Total | | | | | | | 21,444,179 | | |
HAWAII 0.3% | |
State of Hawaii Airports System
Refunding Revenue Bonds
Series 2010B AMT(b)
07/01/17 | | | 5.000 | % | | | 5,000,000 | | | | 5,243,250 | | |
ILLINOIS 16.0% | |
Chicago Midway International Airport
Refunding Revenue Bonds
2nd Lien
Series 2004B (AMBAC)
01/01/18 | | | 5.000 | % | | | 5,120,000 | | | | 5,139,200 | | |
Chicago O'Hare International Airport
Refunding Revenue Bonds
Series 2015B
01/01/20 | | | 5.000 | % | | | 3,000,000 | | | | 3,412,950 | | |
01/01/21 | | | 5.000 | % | | | 4,000,000 | | | | 4,668,720 | | |
Revenue Bonds
General 3rd Lien
Series 2011B
01/01/17 | | | 5.000 | % | | | 2,500,000 | | | | 2,571,250 | | |
Series 2008B (AGM)
01/01/18 | | | 5.000 | % | | | 10,000,000 | | | | 10,302,200 | | |
Chicago O'Hare International Airport(b)
Refunding Revenue Bonds
General 2nd Lien
Series 2012A AMT
01/01/17 | | | 5.000 | % | | | 13,600,000 | | | | 13,983,928 | | |
01/01/18 | | | 5.000 | % | | | 11,340,000 | | | | 12,068,708 | | |
Passenger Facility Charge
Series 2012 AMT
01/01/17 | | | 5.000 | % | | | 13,125,000 | | | | 13,495,519 | | |
The accompanying Notes to Financial Statements are an integral part of this statement.
Annual Report 2016
10
COLUMBIA SHORT TERM MUNICIPAL BOND FUND
PORTFOLIO OF INVESTMENTS (continued)
April 30, 2016
Municipal Bonds (continued)
Issue
Description | | Coupon
Rate | | Principal
Amount ($) | | Value ($) | |
Revenue Bonds
General Purpose Senior Lien
Seires 2013C AMT
01/01/21 | | | 5.000 | % | | | 2,035,000 | | | | 2,353,193 | | |
Chicago Park District
Limited General Obligation Refunding Bonds
Series 2015B
01/01/17 | | | 4.000 | % | | | 1,000,000 | | | | 1,016,710 | | |
01/01/18 | | | 4.000 | % | | | 1,250,000 | | | | 1,298,862 | | |
01/01/19 | | | 4.000 | % | | | 1,750,000 | | | | 1,850,450 | | |
Series 2015C
01/01/18 | | | 4.000 | % | | | 1,500,000 | | | | 1,558,635 | | |
01/01/19 | | | 4.000 | % | | | 1,805,000 | | | | 1,908,607 | | |
Unlimited General Obligation Refunding Bonds
Alternative Revenue Source
Series 2015
01/01/17 | | | 4.000 | % | | | 1,235,000 | | | | 1,255,637 | | |
01/01/18 | | | 4.000 | % | | | 1,000,000 | | | | 1,039,090 | | |
Chicago Transit Authority
Refunding Revenue Bonds
Federal Transit Administration Sectioin 5307
Urbanized Area Formula Funds
Series 2015
06/01/20 | | | 5.000 | % | | | 10,000,000 | | | | 11,270,500 | | |
Federal Transit Administration Section 5307
Series 2015
06/01/18 | | | 5.000 | % | | | 6,000,000 | | | | 6,446,280 | | |
06/01/19 | | | 5.000 | % | | | 5,000,000 | | | | 5,518,250 | | |
Unrefunded Revenue Bonds
Federal Transit Administration
Series 2006 (AMBAC)
06/01/17 | | | 5.000 | % | | | 2,875,000 | | | | 2,936,985 | | |
City of Chicago Wastewater Transmission
Refunding Revenue Bonds
2nd Lien
Series 2001 (NPFGC)
01/01/18 | | | 5.500 | % | | | 1,750,000 | | | | 1,860,635 | | |
Series 2015C
01/01/18 | | | 5.000 | % | | | 2,500,000 | | | | 2,635,825 | | |
01/01/19 | | | 5.000 | % | | | 2,810,000 | | | | 3,037,385 | | |
01/01/20 | | | 5.000 | % | | | 1,000,000 | | | | 1,104,190 | | |
01/01/21 | | | 5.000 | % | | | 1,000,000 | | | | 1,116,110 | | |
City of Chicago Waterworks
Revenue Bonds
2nd Lien Project
Series 2014
11/01/18 | | | 4.000 | % | | | 1,000,000 | | | | 1,054,500 | | |
City of Chicago
Refunding Revenue Bonds
Series 2009A
01/01/22 | | | 5.000 | % | | | 2,090,000 | | | | 2,259,959 | | |
Unlimited General Obligation Bonds
Neighborhoods Alive 21 Program
Series 2015 Escrowed to Maturity
01/01/17 | | | 5.000 | % | | | 245,000 | | | | 251,983 | | |
Municipal Bonds (continued)
Issue
Description | | Coupon
Rate | | Principal
Amount ($) | | Value ($) | |
Series 2007D (AMBAC)
12/01/16 | | | 5.000 | % | | | 2,695,000 | | | | 2,735,829 | | |
Series 2008A (BAM/TCRS)
01/01/19 | | | 5.000 | % | | | 4,000,000 | | | | 4,172,680 | | |
Series 2010A
12/01/16 | | | 5.000 | % | | | 2,500,000 | | | | 2,536,550 | | |
Series 2015A
01/01/19 | | | 5.000 | % | | | 1,300,000 | | | | 1,348,256 | | |
01/01/20 | | | 5.000 | % | | | 3,480,000 | | | | 3,616,868 | | |
Series 2015B Escrowed to Maturity
01/01/17 | | | 5.000 | % | | | 750,000 | | | | 771,375 | | |
Unlimited General Obligation Notes
Series 2015A
01/01/21 | | | 5.000 | % | | | 5,000,000 | | | | 5,195,750 | | |
Unlimited General Obligation Refunding Bonds
Project
Series 2006A (AGM)
01/01/18 | | | 4.250 | % | | | 1,350,000 | | | | 1,351,728 | | |
Series 1996A-2 (AMBAC)
01/01/18 | | | 5.500 | % | | | 4,880,000 | | | | 5,041,284 | | |
Series 2003B
01/01/18 | | | 5.000 | % | | | 1,500,000 | | | | 1,539,120 | | |
Series 2016C
01/01/20 | | | 5.000 | % | | | 1,000,000 | | | | 1,039,330 | | |
01/01/21 | | | 5.000 | % | | | 1,800,000 | | | | 1,870,470 | | |
01/01/22 | | | 5.000 | % | | | 5,000,000 | | | | 5,181,850 | | |
Unrefunded Unlimited General Obligation Bonds
Neighborhoods Alive 21 Program
Series 2015
01/01/17 | | | 5.000 | % | | | 305,000 | | | | 310,081 | | |
Series 2015B
01/01/17 | | | 5.000 | % | | | 950,000 | | | | 965,827 | | |
City of Springfield Electric
Refunding Revenue Bonds
Senior Lien
Series 2015
03/01/19 | | | 5.000 | % | | | 2,000,000 | | | | 2,218,780 | | |
03/01/20 | | | 5.000 | % | | | 2,000,000 | | | | 2,273,540 | | |
Cook County Community High School District No. 228 Bremen
Limited General Obligation Bonds
Series 2014B
12/01/16 | | | 5.000 | % | | | 1,250,000 | | | | 1,280,812 | | |
12/01/17 | | | 5.000 | % | | | 2,000,000 | | | | 2,121,460 | | |
Illinois Finance Authority
Refunding Revenue Bonds
Advocate Health Care
Series 2014
08/01/19 | | | 5.000 | % | | | 600,000 | | | | 676,434 | | |
Revenue Bonds
Ascension Health
Series 2012E
11/15/42 | | | 5.000 | % | | | 2,000,000 | | | | 2,084,040 | | |
The accompanying Notes to Financial Statements are an integral part of this statement.
Annual Report 2016
11
COLUMBIA SHORT TERM MUNICIPAL BOND FUND
PORTFOLIO OF INVESTMENTS (continued)
April 30, 2016
Municipal Bonds (continued)
Issue
Description | | Coupon
Rate | | Principal
Amount ($) | | Value ($) | |
Illinois Finance Authority(d)
Refunding Revenue Bonds
Presbyterian Home
Series 2016
05/01/36 | | | 1.656 | % | | | 2,400,000 | | | | 2,406,264 | | |
Illinois State Toll Highway Authority
Refunding Revenue Bonds
Series 2014A
12/01/20 | | | 5.000 | % | | | 5,330,000 | | | | 6,227,039 | | |
Kane Cook & DuPage Counties School District No. U-46 Elgin
Unlimited General Obligation Refunding Bonds
Series 2015C
01/01/19 | | | 5.000 | % | | | 1,250,000 | | | | 1,381,150 | | |
01/01/20 | | | 5.000 | % | | | 1,500,000 | | | | 1,706,475 | | |
Kane McHenry Cook & De Kalb Counties Unit School District No. 300
Unlimited General Obligation Refunding Bonds
Series 2015
01/01/17 | | | 5.000 | % | | | 625,000 | | | | 642,688 | | |
01/01/18 | | | 5.000 | % | | | 750,000 | | | | 799,748 | | |
Railsplitter Tobacco Settlement Authority
Revenue Bonds
Series 2010
06/01/16 | | | 5.000 | % | | | 8,280,000 | | | | 8,312,654 | | |
Regional Transportation Authority
Revenue Bonds
Series 2003B (NPFGC)
06/01/19 | | | 5.500 | % | | | 3,945,000 | | | | 4,488,345 | | |
Series 2006A (NPFGC)
07/01/18 | | | 5.000 | % | | | 4,970,000 | | | | 5,008,368 | | |
State of Illinois Unemployment Compensation Trust Fund
Revenue Bonds
Series 2012B
06/15/17 | | | 5.000 | % | | | 9,000,000 | | | | 9,254,880 | | |
State of Illinois
Revenue Bonds
Build Illinois
Series 2010
06/15/19 | | | 5.000 | % | | | 4,575,000 | | | | 5,121,072 | | |
Series 2011
06/15/18 | | | 3.000 | % | | | 4,800,000 | | | | 5,009,184 | | |
Unlimited General Obligation Bonds
Series 2013CR (AGM)
04/01/21 | | | 5.000 | % | | | 7,180,000 | | | | 8,123,667 | | |
Series 2014
02/01/18 | | | 4.000 | % | | | 2,750,000 | | | | 2,862,200 | | |
04/01/18 | | | 5.000 | % | | | 10,000,000 | | | | 10,630,200 | | |
04/01/19 | | | 5.000 | % | | | 10,000,000 | | | | 10,842,900 | | |
Series 2016
01/01/20 | | | 5.000 | % | | | 10,000,000 | | | | 11,000,900 | | |
Unlimited General Obligation Notes
Series 2012
09/01/17 | | | 4.000 | % | | | 3,550,000 | | | | 3,666,014 | | |
Municipal Bonds (continued)
Issue
Description | | Coupon
Rate | | Principal
Amount ($) | | Value ($) | |
Unlimited General Obligation Refunding Bonds
Series 2012
08/01/16 | | | 5.000 | % | | | 20,000,000 | | | | 20,203,200 | | |
Unrefunded Revenue Bonds
Build Illinois
Series 2009B
06/15/20 | | | 5.000 | % | | | 1,415,000 | | | | 1,583,159 | | |
University of Illinois
Refunding Certificate of Participation
Series 2014C
03/15/19 | | | 5.000 | % | | | 1,555,000 | | | | 1,712,055 | | |
Total | | | | | | | 286,730,487 | | |
INDIANA 1.0% | |
Indiana Finance Authority
Refunding Revenue Bonds
Indiana University Health
Series 2016A
12/01/19 | | | 5.000 | % | | | 1,100,000 | | | | 1,255,199 | | |
12/01/20 | | | 5.000 | % | | | 1,100,000 | | | | 1,290,003 | | |
Series 2008A-1
11/01/16 | | | 5.000 | % | | | 2,665,000 | | | | 2,723,284 | | |
Revenue Bonds
2nd Lien-CWA Authority, Inc.
Series 2011C
10/01/16 | | | 3.000 | % | | | 10,000,000 | | | | 10,096,100 | | |
Beacon Health System Obligation Group
Series 2013
08/15/16 | | | 5.000 | % | | | 1,000,000 | | | | 1,012,910 | | |
Ivy Tech Community College
Revenue Bonds
Student Fee
Series 2013R-1
07/01/17 | | | 5.000 | % | | | 1,000,000 | | | | 1,050,100 | | |
Total | | | | | | | 17,427,596 | | |
IOWA 0.2% | |
Iowa Finance Authority
Revenue Bonds
Genesis Health System
Series 2010
07/01/16 | | | 5.000 | % | | | 1,150,000 | | | | 1,159,097 | | |
People's Memorial Hospital of Buchanan County
Revenue Bonds
Series 2016
12/01/18 | | | 1.500 | % | | | 3,000,000 | | | | 2,990,880 | | |
Total | | | | | | | 4,149,977 | | |
KENTUCKY 1.2% | |
Kentucky Rural Water Finance Corp.
Refunding Revenue Bonds
Series 2016A
02/01/18 | | | 1.250 | % | | | 6,385,000 | | | | 6,414,243 | | |
The accompanying Notes to Financial Statements are an integral part of this statement.
Annual Report 2016
12
COLUMBIA SHORT TERM MUNICIPAL BOND FUND
PORTFOLIO OF INVESTMENTS (continued)
April 30, 2016
Municipal Bonds (continued)
Issue
Description | | Coupon
Rate | | Principal
Amount ($) | | Value ($) | |
Kentucky State Property & Building Commission
Refunding Revenue Bonds
Project #108
Series 2015B
08/01/19 | | | 5.000 | % | | | 5,000,000 | | | | 5,601,050 | | |
Project #112
Series 2016B
11/01/21 | | | 5.000 | % | | | 6,000,000 | | | | 7,051,260 | | |
Project No. 100
Series 2011A
08/01/18 | | | 5.000 | % | | | 2,500,000 | | | | 2,723,125 | | |
Total | | | | | | | 21,789,678 | | |
LOUISIANA 1.4% | |
Louisiana Office Facilities Corp.
Refunding Revenue Bonds
State Capitol
Series 2010A
05/01/16 | | | 5.000 | % | | | 4,505,000 | | | | 4,506,151 | | |
Louisiana State Citizens Property Insurance Corp.
Refunding Revenue Bonds
Series 2015
06/01/18 | | | 5.000 | % | | | 2,850,000 | | | | 3,085,467 | | |
Orleans Parish Parishwide School District
Unlimited General Obligation Refunding Bonds
Series 2010 (AGM)
09/01/16 | | | 5.000 | % | | | 3,785,000 | | | | 3,837,195 | | |
Regional Transit Authority
Revenue Bonds
Sales Tax
Series 2010 (AGM)
12/01/16 | | | 4.000 | % | | | 1,000,000 | | | | 1,018,610 | | |
State of Louisiana
Unlimited General Obligation Bonds
Series 2015
05/01/19 | | | 5.000 | % | | | 9,250,000 | | | | 10,333,175 | | |
Series 2015B
05/01/19 | | | 5.000 | % | | | 2,530,000 | | | | 2,826,263 | | |
Total | | | | | | | 25,606,861 | | |
MAINE —% | |
Maine Health & Higher Educational Facilities Authority
Revenue Bonds
Series 2010B Escrowed to Maturity
07/01/16 | | | 4.000 | % | | | 335,000 | | | | 337,037 | | |
07/01/16 | | | 4.000 | % | | | 50,000 | | | | 50,302 | | |
Total | | | | | | | 387,339 | | |
Municipal Bonds (continued)
Issue
Description | | Coupon
Rate | | Principal
Amount ($) | | Value ($) | |
MARYLAND 1.6% | |
County of Charles
Unlimited General Obligation Refunding Bonds
Consolidated Public Improvement
Series 2012
03/01/18 | | | 5.000 | % | | | 4,395,000 | | | | 4,743,304 | | |
Maryland Health & Higher Educational Facilities Authority
Refunding Revenue Bonds
Meritus Medical Center Issue
Series 2015
07/01/17 | | | 5.000 | % | | | 400,000 | | | | 419,220 | | |
07/01/18 | | | 5.000 | % | | | 305,000 | | | | 331,007 | | |
07/01/19 | | | 5.000 | % | | | 500,000 | | | | 559,790 | | |
State of Maryland
Unlimited General Obligation Bonds
1st Series 2014A
03/01/19 | | | 5.000 | % | | | 6,465,000 | | | | 7,233,365 | | |
Series 2011B
08/01/18 | | | 5.000 | % | | | 11,000,000 | | | | 12,059,520 | | |
University System of Maryland
Revenue Bonds
Series 2012C
04/01/18 | | | 5.000 | % | | | 3,605,000 | | | | 3,903,350 | | |
Total | | | | | | | 29,249,556 | | |
MASSACHUSETTS 0.5% | |
Massachusetts Development Finance Agency
Revenue Bonds
Boston Medical Center
Series 2012 Escrowed to Maturity
07/01/16 | | | 5.000 | % | | | 800,000 | | | | 806,256 | | |
Unrefunded Revenue Bonds
Boston Medical Center
Series 2012
07/01/16 | | | 5.000 | % | | | 800,000 | | | | 805,832 | | |
Massachusetts Educational Financing Authority(b)
Revenue Bonds
Education Loan
Series 2014-I AMT
01/01/18 | | | 4.000 | % | | | 1,500,000 | | | | 1,562,175 | | |
01/01/19 | | | 5.000 | % | | | 2,000,000 | | | | 2,171,660 | | |
Series 2015A AMT
01/01/19 | | | 5.000 | % | | | 3,000,000 | | | | 3,257,490 | | |
Total | | | | | | | 8,603,413 | | |
MICHIGAN 1.3% | |
Michigan Finance Authority
Refunding Revenue Bonds
Senior Lien-Detroit Water & Sewer
Series 2014C-5
07/01/18 | | | 5.000 | % | | | 2,165,000 | | | | 2,347,185 | | |
Series 2014H-1
10/01/19 | | | 5.000 | % | | | 1,415,000 | | | | 1,588,903 | | |
The accompanying Notes to Financial Statements are an integral part of this statement.
Annual Report 2016
13
COLUMBIA SHORT TERM MUNICIPAL BOND FUND
PORTFOLIO OF INVESTMENTS (continued)
April 30, 2016
Municipal Bonds (continued)
Issue
Description | | Coupon
Rate | | Principal
Amount ($) | | Value ($) | |
State Revolving Fund Drinking Water
Series 2012
10/01/18 | | | 5.000 | % | | | 3,640,000 | | | | 4,012,008 | | |
Trinity Health Corp.
Series 2015
12/01/19 | | | 5.000 | % | | | 2,000,000 | | | | 2,281,420 | | |
Michigan Finance Authority(b)
Refunding Revenue Bonds
Student Loan
Series 2014 25-A AMT
11/01/18 | | | 5.000 | % | | | 2,220,000 | | | | 2,392,316 | | |
11/01/19 | | | 5.000 | % | | | 1,250,000 | | | | 1,379,000 | | |
Royal Oak Hospital Finance Authority
Refunding Revenue Bonds
William Beaumont Hospital
Series 2014D
09/01/17 | | | 5.000 | % | | | 1,400,000 | | | | 1,478,330 | | |
Royal Oak School District
Unlimited General Obligation Refunding Bonds
Series 2014
05/01/18 | | | 5.000 | % | | | 1,000,000 | | | | 1,083,540 | | |
05/01/19 | | | 5.000 | % | | | 450,000 | | | | 504,212 | | |
State of Michigan Trunk Line
Refunding Revenue Bonds
Series 2014
11/15/18 | | | 5.000 | % | | | 5,180,000 | | | | 5,732,758 | | |
Total | | | | | | | 22,799,672 | | |
MINNESOTA 0.3% | |
Minnesota Housing Finance Agency
Refunding Revenue Bonds
Residential Housing
Series 2014C (GNMA) AMT(b)
07/01/19 | | | 1.800 | % | | | 1,775,000 | | | | 1,797,489 | | |
Moorhead Independent School District No. 152
Unlimited General Obligation Refunding Bonds
School Buildings
Series 2014A
04/01/18 | | | 5.000 | % | | | 3,285,000 | | | | 3,555,553 | | |
Total | | | | | | | 5,353,042 | | |
MISSISSIPPI 0.3% | |
Mississippi Development Bank
Refunding Revenue Bonds
Jackson Public School District Project
Series 2015A
04/01/19 | | | 5.000 | % | | | 1,250,000 | | | | 1,385,987 | | |
04/01/20 | | | 5.000 | % | | | 1,000,000 | | | | 1,140,000 | | |
Municipal Bonds (continued)
Issue
Description | | Coupon
Rate | | Principal
Amount ($) | | Value ($) | |
State of Mississippi
Revenue Bonds
Series 2015E
10/15/17 | | | 3.000 | % | | | 1,500,000 | | | | 1,548,750 | | |
10/15/18 | | | 4.000 | % | | | 2,080,000 | | | | 2,236,645 | | |
Total | | | | | | | 6,311,382 | | |
MISSOURI 1.5% | |
City of St. Louis Airport
Refunding Revenue Bonds
Lambert-St. Louis International Airport
Series 2013
07/01/16 | | | 5.000 | % | | | 1,325,000 | | | | 1,335,096 | | |
07/01/17 | | | 5.000 | % | | | 715,000 | | | | 750,307 | | |
07/01/18 | | | 5.000 | % | | | 765,000 | | | | 832,657 | | |
Kansas City Airport Revenue
Refunding Revenue Bonds
General Improvement
Series 2013B
09/01/16 | | | 5.000 | % | | | 410,000 | | | | 416,166 | | |
Kansas City Planned Industrial Expansion Authority
Revenue Bonds
2nd & DE Apartments
Series 2016
12/01/18 | | | 1.500 | % | | | 11,430,000 | | | | 11,481,664 | | |
Missouri Joint Municipal Electric Utility Commission
Refunding Revenue Bonds
Series 2014
01/01/19 | | | 5.000 | % | | | 2,150,000 | | | | 2,374,976 | | |
01/01/20 | | | 5.000 | % | | | 7,825,000 | | | | 8,908,136 | | |
Total | | | | | | | 26,099,002 | | |
NEBRASKA 1.6% | |
Central Plains Energy Project
Refunding Revenue Bonds
Series 2014 (Royal Bank of Canada)
08/01/39 | | | 5.000 | % | | | 14,500,000 | | | | 16,405,155 | | |
Nebraska Investment Finance Authority
Revenue Bonds
Series 2014A
03/01/44 | | | 3.000 | % | | | 3,380,000 | | | | 3,475,113 | | |
Nebraska Public Power District
Refunding Revenue Bonds
Series 2014
01/01/19 | | | 5.000 | % | | | 2,000,000 | | | | 2,216,000 | | |
Public Power Generation Agency
Refunding Revenue Bonds
Whelan Energy Center Unit
Series 2015
01/01/19 | | | 5.000 | % | | | 2,250,000 | | | | 2,479,792 | | |
01/01/20 | | | 5.000 | % | | | 3,030,000 | | | | 3,420,234 | | |
Total | | | | | | | 27,996,294 | | |
The accompanying Notes to Financial Statements are an integral part of this statement.
Annual Report 2016
14
COLUMBIA SHORT TERM MUNICIPAL BOND FUND
PORTFOLIO OF INVESTMENTS (continued)
April 30, 2016
Municipal Bonds (continued)
Issue
Description | | Coupon
Rate | | Principal
Amount ($) | | Value ($) | |
NEVADA 1.8% | |
Clark County School District
Limited General Obligation Refunding Bonds
Series 2014A
06/15/18 | | | 5.000 | % | | | 10,000,000 | | | | 10,880,800 | | |
Unlimited General Obligation Refunding Bonds
Series 2014B
06/15/18 | | | 5.000 | % | | | 15,000,000 | | | | 16,321,200 | | |
County of Clark Department of Aviation
Revenue Bonds
Series 2014B
07/01/18 | | | 5.000 | % | | | 5,000,000 | | | | 5,447,850 | | |
Total | | | | | | | 32,649,850 | | |
NEW JERSEY 4.8% | |
City of Newark
Unlimited General Obligation Refunding Bonds
Qualified General Improvement
Series 2013A
07/15/16 | | | 5.000 | % | | | 5,845,000 | | | | 5,883,869 | | |
Unlimited General Obligation Refunding Notes
Series 2015
12/06/16 | | | 1.610 | % | | | 8,800,000 | | | | 8,845,848 | | |
City of Trenton
Unlimited General Obligation Refunding Bonds
Series 2013
07/15/16 | | | 4.000 | % | | | 1,100,000 | | | | 1,107,095 | | |
New Jersey Building Authority
Refunding Revenue Bonds
Series 2013A
06/15/17 | | | 5.000 | % | | | 5,500,000 | | | | 5,736,995 | | |
Revenue Bonds
Series 2009A
12/15/18 | | | 5.000 | % | | | 2,695,000 | | | | 2,895,077 | | |
New Jersey Economic Development Authority
Refunding Revenue Bonds
School Facilities Construction
Series 2014-PP
06/15/18 | | | 5.000 | % | | | 5,000,000 | | | | 5,313,950 | | |
Revenue Bonds
School Facilities Construction
Series 2010 Escrowed to Maturity
12/15/17 | | | 5.000 | % | | | 4,260,000 | | | | 4,551,256 | | |
Unrefunded Revenue Bonds
School Facilities Construction
Series 2010
12/15/17 | | | 5.000 | % | | | 175,000 | | | | 184,429 | | |
New Jersey Economic Development Authority(d)
Refunding Revenue Bonds
NTS School Facilities
Series 2011C
02/01/18 | | | 2.210 | % | | | 8,895,000 | | | | 8,853,905 | | |
Municipal Bonds (continued)
Issue
Description | | Coupon
Rate | | Principal
Amount ($) | | Value ($) | |
New Jersey Health Care Facilities Financing Authority
Refunding Revenue Bonds
Princeton HealthCare System
Series 2016
07/01/18 | | | 5.000 | % | | | 540,000 | | | | 585,684 | | |
07/01/19 | | | 5.000 | % | | | 525,000 | | | | 587,255 | | |
07/01/20 | | | 5.000 | % | | | 650,000 | | | | 746,492 | | |
07/01/21 | | | 5.000 | % | | | 750,000 | | | | 880,972 | | |
New Jersey Higher Education Student Assistance Authority(b)
Revenue Bonds
Senior Series 2013-1A AMT
12/01/16 | | | 4.000 | % | | | 1,000,000 | | | | 1,016,700 | | |
12/01/17 | | | 5.000 | % | | | 2,780,000 | | | | 2,928,563 | | |
Senior Series 2015-1A AMT
12/01/16 | | | 5.000 | % | | | 1,000,000 | | | | 1,022,550 | | |
12/01/17 | | | 5.000 | % | | | 2,000,000 | | | | 2,106,880 | | |
12/01/18 | | | 5.000 | % | | | 4,250,000 | | | | 4,574,147 | | |
Student Loan
Series 2012-1A AMT
12/01/18 | | | 5.000 | % | | | 2,480,000 | | | | 2,669,150 | | |
New Jersey Transit Corp.
Certificate of Participation
Federal Transit Administration Grants
Subordinated Series 2005A Escrowed to Maturity (NPFGC)
09/15/17 | | | 5.000 | % | | | 8,770,000 | | | | 9,285,501 | | |
New Jersey Transit Corp
Revenue Bonds
Grant Anticipation Note
Series 2014A
09/15/18 | | | 5.000 | % | | | 3,500,000 | | | | 3,760,610 | | |
New Jersey Transportation Trust Fund Authority
Revenue Bonds
Transportation System
Series 1999A
06/15/20 | | | 5.750 | % | | | 5,000,000 | | | | 5,594,550 | | |
Unrefunded Revenue Bonds
Transportation System
Series 1999
06/15/16 | | | 5.750 | % | | | 4,860,000 | | | | 4,890,556 | | |
State of New Jersey
Certificate of Participation
Equipment Lease Purchase
Series 2008A
06/15/17 | | | 5.000 | % | | | 1,935,000 | | | | 2,019,076 | | |
Total | | | | | | | 86,041,110 | | |
NEW YORK 11.0% | |
City of New York
Subordinated Unlimited General Obligation Bonds
Series 2004H-B
03/01/19 | | | 5.000 | % | | | 8,500,000 | | | | 9,483,960 | | |
Series 2008I-1
02/01/17 | | | 5.000 | % | | | 8,635,000 | | | | 8,920,991 | | |
The accompanying Notes to Financial Statements are an integral part of this statement.
Annual Report 2016
15
COLUMBIA SHORT TERM MUNICIPAL BOND FUND
PORTFOLIO OF INVESTMENTS (continued)
April 30, 2016
Municipal Bonds (continued)
Issue
Description | | Coupon
Rate | | Principal
Amount ($) | | Value ($) | |
Unlimited General Obligation Bonds
Series 2009C
08/01/17 | | | 5.000 | % | | | 12,000,000 | | | | 12,651,480 | | |
Series 2010B
08/01/17 | | | 5.000 | % | | | 5,000,000 | | | | 5,271,450 | | |
Series 2013E
08/01/18 | | | 5.000 | % | | | 4,000,000 | | | | 4,376,760 | | |
08/01/18 | | | 5.000 | % | | | 5,960,000 | | | | 6,521,372 | | |
Unlimited General Obligation Refunding Bonds
Fiscal 2015
Series 2014A
08/01/18 | | | 5.000 | % | | | 4,645,000 | | | | 5,082,513 | | |
Series 2012F
08/01/18 | | | 5.000 | % | | | 1,675,000 | | | | 1,832,768 | | |
City of Yonkers
Limited General Obligation Refunding Bonds
Series 2015D
08/01/17 | | | 3.000 | % | | | 2,045,000 | | | | 2,098,334 | | |
08/01/18 | | | 4.000 | % | | | 2,970,000 | | | | 3,162,694 | | |
County of Rockland
Limited General Obligation Bonds
Series 2014A (AGM)
03/01/17 | | | 5.000 | % | | | 1,825,000 | | | | 1,885,973 | | |
03/01/18 | | | 5.000 | % | | | 1,825,000 | | | | 1,954,429 | | |
03/01/19 | | | 5.000 | % | | | 2,000,000 | | | | 2,203,020 | | |
County of Suffolk
Limited General Obligation Bonds
Public Improvement
Series 2013B
10/15/16 | | | 3.000 | % | | | 3,905,000 | | | | 3,948,228 | | |
Erie County Industrial Development Agency (The)
Revenue Bonds
Series 2012
05/01/17 | | | 5.000 | % | | | 3,000,000 | | | | 3,132,960 | | |
Housing Development Corp.
Refunding Revenue Bonds
Series 2015G-2
11/01/19 | | | 1.450 | % | | | 2,500,000 | | | | 2,515,650 | | |
Long Island Power Authority
Revenue Bonds
Series 2012B
09/01/16 | | | 5.000 | % | | | 6,755,000 | | | | 6,855,177 | | |
Metropolitan Transportation Authority
Revenue Bonds
Series 2005A (AMBAC)
11/15/18 | | | 5.500 | % | | | 5,000,000 | | | | 5,593,750 | | |
Series 2008A
11/15/18 | | | 5.000 | % | | | 2,125,000 | | | | 2,350,633 | | |
Series 2012E
11/15/16 | | | 4.000 | % | | | 1,000,000 | | | | 1,019,070 | | |
11/15/17 | | | 5.000 | % | | | 1,000,000 | | | | 1,066,620 | | |
Transportation
Series 2005G
11/15/18 | | | 5.000 | % | | | 2,900,000 | | | | 3,207,922 | | |
Municipal Bonds (continued)
Issue
Description | | Coupon
Rate | | Principal
Amount ($) | | Value ($) | |
Series 2010D
11/15/18 | | | 5.000 | % | | | 1,890,000 | | | | 2,090,680 | | |
Series 2014B
11/15/18 | | | 5.000 | % | | | 1,000,000 | | | | 1,106,180 | | |
New York City Industrial Development Agency
Refunding Revenue Bonds
Trips Obligated Group
Senior Series 2012A AMT(b)
07/01/18 | | | 5.000 | % | | | 4,655,000 | | | | 4,989,415 | | |
New York City Transitional Finance Authority
Revenue Bonds
Future Tax Secured
Series 2012E-1
02/01/19 | | | 5.000 | % | | | 4,750,000 | | | | 5,292,545 | | |
New York State Dormitory Authority
Revenue Bonds
General Purpose
Series 2014A
02/15/18 | | | 5.000 | % | | | 14,250,000 | | | | 15,345,967 | | |
Mount Sinai School of Medicine
Series 2010A
07/01/16 | | | 5.000 | % | | | 2,645,000 | | | | 2,665,155 | | |
New York State Thruway Authority
Revenue Bonds
Series 2007H (NPFGC)
01/01/19 | | | 5.000 | % | | | 6,240,000 | | | | 6,698,266 | | |
Series 2012I Escrowed to Maturity
01/01/17 | | | 5.000 | % | | | 225,000 | | | | 231,723 | | |
Series 2013A
05/01/19 | | | 5.000 | % | | | 20,000,000 | | | | 22,407,200 | | |
Series 2014J
01/01/19 | | | 5.000 | % | | | 1,200,000 | | | | 1,329,936 | | |
Unrefunded Revenue Bonds
Series 2012I
01/01/17 | | | 5.000 | % | | | 775,000 | | | | 797,568 | | |
New York State Urban Development Corp.
Refunding Revenue Bonds
State Personal Income Tax
Series 2014
03/15/19 | | | 5.000 | % | | | 15,000,000 | | | | 16,777,650 | | |
Revenue Bonds
State Personal Income Tax
Series 2010A
03/15/19 | | | 5.000 | % | | | 3,235,000 | | | | 3,618,380 | | |
New York Transportation Development Corp.
Refunding Revenue Bonds
Terminal One Group Association
Series 2015 AMT(b)
01/01/21 | | | 5.000 | % | | | 5,500,000 | | | | 6,400,515 | | |
Port Authority of New York & New Jersey(b)
Revenue Bonds
167th
Series 2011 AMT
09/15/19 | | | 5.000 | % | | | 5,000,000 | | | | 5,646,000 | | |
The accompanying Notes to Financial Statements are an integral part of this statement.
Annual Report 2016
16
COLUMBIA SHORT TERM MUNICIPAL BOND FUND
PORTFOLIO OF INVESTMENTS (continued)
April 30, 2016
Municipal Bonds (continued)
Issue
Description | | Coupon
Rate | | Principal
Amount ($) | | Value ($) | |
Consolidated 172nd
Series 2012 AMT
10/01/17 | | | 5.000 | % | | | 5,000,000 | | | | 5,294,500 | | |
Utica School District
Unlimited General Obligation Refunding Bonds
Series 2013
07/01/16 | | | 3.000 | % | | | 1,000,000 | | | | 1,003,280 | | |
Total | | | | | | | 196,830,714 | | |
NORTH CAROLINA 0.5% | |
North Carolina Eastern Municipal Power Agency
Prerefunded 01/01/18 Revenue Bonds
Series 2008A (AGM)
01/01/19 | | | 5.250 | % | | | 3,740,000 | | | | 4,022,370 | | |
State of North Carolina
Revenue Bonds
Grant Anticipation Revenue Vehicle
Series 2007 (NPFGC)
03/01/18 | | | 5.000 | % | | | 4,500,000 | | | | 4,667,355 | | |
Total | | | | | | | 8,689,725 | | |
OHIO 0.6% | |
Ohio Housing Finance Agency
Revenue Bonds
Series 2010-1 (GNMA/FNMA)
11/01/28 | | | 5.000 | % | | | 1,420,000 | | | | 1,494,848 | | |
State of Ohio
Refunding Revenue Bonds
Series 2014B
12/15/19 | | | 5.000 | % | | | 5,000,000 | | | | 5,719,650 | | |
State of Ohio(b)
Revenue Bonds
Ohio Water Development Authority Waste Management
Series 2015 AMT
11/01/22 | | | 1.700 | % | | | 2,980,000 | | | | 2,994,572 | | |
Total | | | | | | | 10,209,070 | | |
OKLAHOMA 0.4% | |
Cleveland County Educational Facilities Authority
Revenue Bonds
Moore Public Schools Project
Series 2016
06/01/19 | | | 5.000 | % | | | 3,000,000 | | | | 3,340,110 | | |
06/01/20 | | | 5.000 | % | | | 500,000 | | | | 570,530 | | |
Norman Public Schools Project
Series 2014
07/01/18 | | | 5.000 | % | | | 2,400,000 | | | | 2,603,040 | | |
Total | | | | | | | 6,513,680 | | |
Municipal Bonds (continued)
Issue
Description | | Coupon
Rate | | Principal
Amount ($) | | Value ($) | |
PENNSYLVANIA 3.7% | |
Commonwealth of Pennsylvania
Unlimited General Obligation Bonds
1st Series 2012
06/01/19 | | | 5.000 | % | | | 5,650,000 | | | | 6,328,000 | | |
1st Series 2013
04/01/21 | | | 5.000 | % | | | 5,000,000 | | | | 5,842,900 | | |
Unlimited General Obligation Refunding Bonds
2nd Series 2009
07/01/19 | | | 5.000 | % | | | 10,980,000 | | | | 12,329,552 | | |
County of Allegheny
Unlimited General Obligation Refunding Bonds
Series 2014C-73
12/01/18 | | | 5.000 | % | | | 6,650,000 | | | | 7,340,070 | | |
Lehigh County Industrial Development Authority
Refunding Revenue Bonds
PPL Electric Utilities Corp. Project
Series 2016
02/15/27 | | | 0.900 | % | | | 5,000,000 | | | | 4,994,600 | | |
09/01/29 | | | 0.900 | % | | | 2,250,000 | | | | 2,247,277 | | |
Monroeville Finance Authority
Revenue Bonds
Series 2012
02/15/18 | | | 4.000 | % | | | 1,250,000 | | | | 1,321,575 | | |
Montgomery County Industrial Development Authority
Refunding Revenue Bonds
Albert Einstein HealthCare Network
Series 2015
01/15/17 | | | 5.000 | % | | | 1,250,000 | | | | 1,283,288 | | |
01/15/18 | | | 5.000 | % | | | 750,000 | | | | 793,073 | | |
01/15/19 | | | 5.000 | % | | | 1,000,000 | | | | 1,083,380 | | |
Pennsylvania Housing Finance Agency
Refunding Revenue Bonds
Series 2016-119
10/01/41 | | | 3.500 | % | | | 6,500,000 | | | | 6,906,380 | | |
Pennsylvania Turnpike Commission
Revenue Bonds
Series 2013B(d)
12/01/19 | | | 1.540 | % | | | 3,070,000 | | | | 3,093,547 | | |
Philadelphia Municipal Authority
Refunding Revenue Bonds
City Agreement
Series 2013A
11/15/16 | | | 5.000 | % | | | 1,750,000 | | | | 1,791,003 | | |
Pittsburgh Public Parking Authority
Refunding Revenue Bonds
System
Series 2015A
12/01/17 | | | 4.000 | % | | | 2,225,000 | | | | 2,334,581 | | |
12/01/18 | | | 4.000 | % | | | 1,750,000 | | | | 1,882,353 | | |
The accompanying Notes to Financial Statements are an integral part of this statement.
Annual Report 2016
17
COLUMBIA SHORT TERM MUNICIPAL BOND FUND
PORTFOLIO OF INVESTMENTS (continued)
April 30, 2016
Municipal Bonds (continued)
Issue
Description | | Coupon
Rate | | Principal
Amount ($) | | Value ($) | |
School District of Philadelphia (The)
Unlimited General Obligation Refunding Bonds
Series 2015D
09/01/19 | | | 5.000 | % | | | 3,750,000 | | | | 4,129,762 | | |
State Public School Building Authority
Refunding Revenue Bonds
The School District of Philadelphia Project
Series 2015
06/01/19 | | | 5.000 | % | | | 2,890,000 | | | | 3,145,360 | | |
Total | | | | | | | 66,846,701 | | |
RHODE ISLAND 1.0% | |
Rhode Island Commerce Corp.
Revenue Bonds
Grant Anticipation-Department of Transportation
Series 2006A (NPFGC)
06/15/17 | | | 5.000 | % | | | 16,410,000 | | | | 16,497,301 | | |
Rhode Island Housing & Mortgage Finance Corp.
Revenue Bonds
Series 2016(a)
10/01/46 | | | 3.500 | % | | | 2,000,000 | | | | 2,116,720 | | |
Total | | | | | | | 18,614,021 | | |
SOUTH CAROLINA 1.2% | |
Berkeley County School District
Revenue Bonds
Series 2013
12/01/16 | | | 4.000 | % | | | 400,000 | | | | 407,752 | | |
12/01/17 | | | 5.000 | % | | | 500,000 | | | | 531,755 | | |
Piedmont Municipal Power Agency
Refunding Revenue Bonds
Series 2009A-3
01/01/18 | | | 5.000 | % | | | 5,080,000 | | | | 5,425,745 | | |
Series 2009A-4
01/01/19 | | | 5.000 | % | | | 6,645,000 | | | | 7,340,333 | | |
SCAGO Educational Facilities Corp. for Pickens School District
Refunding Revenue Bonds
Series 2015
12/01/18 | | | 5.000 | % | | | 1,100,000 | | | | 1,214,246 | | |
12/01/19 | | | 5.000 | % | | | 1,250,000 | | | | 1,421,625 | | |
South Carolina State Public Service Authority
Refunding Revenue Bonds
Santee Cooper
Series 2012C
12/01/16 | | | 5.000 | % | | | 5,065,000 | | | | 5,196,842 | | |
Total | | | | | | | 21,538,298 | | |
TENNESSEE 0.1% | |
Memphis-Shelby County Airport Authority
Refunding Revenue Bonds
Series 2010B AMT(b)
07/01/16 | | | 5.000 | % | | | 1,000,000 | | | | 1,007,310 | | |
Municipal Bonds (continued)
Issue
Description | | Coupon
Rate | | Principal
Amount ($) | | Value ($) | |
Metropolitan Government of Nashville & Davidson County
Water & Sewer
Subordinated Refunding Revenue Bonds
Lien
Series 2012
07/01/16 | | | 5.000 | % | | | 1,250,000 | | | | 1,259,750 | | |
Total | | | | | | | 2,267,060 | | |
TEXAS 5.2% | |
Central Texas Regional Mobility Authority
Refunding Revenue Bonds
Senior Lien
Series 2013A
01/01/17 | | | 5.000 | % | | | 925,000 | | | | 952,288 | | |
City Public Service Board of San Antonio
Refunding Revenue Bonds
Junior Lien
Series 2014
02/01/19 | | | 5.000 | % | | | 13,865,000 | | | | 15,453,374 | | |
City of El Paso Water & Sewer
Refunding Revenue Bonds
Series 2014
03/01/19 | | | 4.000 | % | | | 1,000,000 | | | | 1,087,970 | | |
City of Houston Combined Utility System
Refunding Revenue Bonds
Combined 1st Lien-SIFMA
Series 2012(d)
05/15/34 | | | 0.990 | % | | | 6,000,000 | | | | 5,999,760 | | |
Dallas/Fort Worth International Airport
Refunding Revenue Bonds
Series 2013D
11/01/16 | | | 5.000 | % | | | 1,000,000 | | | | 1,022,470 | | |
Dallas/Fort Worth International Airport(b)
Refunding Revenue Bonds
Series 2013E AMT
11/01/18 | | | 5.000 | % | | | 20,980,000 | | | | 23,065,832 | | |
Harris County-Houston Sports Authority
Refunding Revenue Bonds
Senior Lien
Series 2014A
11/15/19 | | | 5.000 | % | | | 3,000,000 | | | | 3,407,880 | | |
Houston Independent School District
Revenue Bonds
Series 2014
09/15/19 | | | 5.000 | % | | | 4,100,000 | | | | 4,653,459 | | |
Irving Independent School District
Unlimited General Obligation Refunding Bonds
Texas Permanent School Fund Program
Series 2015A
02/15/20 | | | 5.000 | % | | | 1,205,000 | | | | 1,385,232 | | |
02/15/21 | | | 5.000 | % | | | 1,500,000 | | | | 1,770,915 | | |
The accompanying Notes to Financial Statements are an integral part of this statement.
Annual Report 2016
18
COLUMBIA SHORT TERM MUNICIPAL BOND FUND
PORTFOLIO OF INVESTMENTS (continued)
April 30, 2016
Municipal Bonds (continued)
Issue
Description | | Coupon
Rate | | Principal
Amount ($) | | Value ($) | |
Metropolitan Transit Authority of Harris County
Revenue Bonds
Contractual Obligation
Series 2015B
11/01/17 | | | 5.000 | % | | | 1,595,000 | | | | 1,697,367 | | |
Series 2015A
08/15/18 | | | 5.000 | % | | | 2,000,000 | | | | 2,191,440 | | |
North Texas Tollway Authority
Refunding Revenue Bonds
Series 2015A
01/01/19 | | | 5.000 | % | | | 1,350,000 | | | | 1,491,264 | | |
01/01/20 | | | 5.000 | % | | | 1,105,000 | | | | 1,251,976 | | |
Northwest Independent School District
Unlimited General Obligation Refunding Bonds
Texas Permanent School Fund Program
Series 2015B
02/15/20 | | | 4.000 | % | | | 3,240,000 | | | | 3,604,208 | | |
02/15/21 | | | 5.000 | % | | | 1,250,000 | | | | 1,475,763 | | |
Sam Rayburn Municipal Power Agency
Refunding Revenue Bonds
Series 2012
10/01/16 | | | 5.000 | % | | | 1,925,000 | | | | 1,960,112 | | |
10/01/17 | | | 5.000 | % | | | 4,895,000 | | | | 5,174,700 | | |
Spring Branch Independent School District
Limited General Obligation Refunding Bonds
Texas Permanent School Fund Program
Series 2015A
02/01/21 | | | 5.000 | % | | | 5,000,000 | | | | 5,896,700 | | |
Tarrant County Cultural Education Facilities Finance Corp.
Refunding Revenue Bonds
Trinity Terrace Project
Series 2014
12/01/18 | | | 2.500 | % | | | 4,995,000 | | | | 5,042,053 | | |
Tarrant County Housing Finance Corp.
Revenue Bonds
Multifamily Housing Reserve Quebec Apartments
Series 2016
08/01/18 | | | 1.000 | % | | | 5,100,000 | | | | 5,088,831 | | |
Total | | | | | | | 93,673,594 | | |
UTAH 0.1% | |
Utah Housing Corp.
Refunding Revenue Bonds
Series 2015D-1 Class III (FHA) AMT(b)
01/01/19 | | | 1.850 | % | | | 1,805,000 | | | | 1,819,115 | | |
VIRGIN ISLANDS 0.2% | |
Virgin Islands Public Finance Authority(c)(f)
Revenue Bonds
Series 2015
09/01/17 | | | 4.000 | % | | | 500,000 | | | | 518,215 | | |
09/01/18 | | | 5.000 | % | | | 1,720,000 | | | | 1,863,740 | | |
09/01/20 | | | 5.000 | % | | | 750,000 | | | | 853,635 | | |
Total | | | | | | | 3,235,590 | | |
Municipal Bonds (continued)
Issue
Description | | Coupon
Rate | | Principal
Amount ($) | | Value ($) | |
VIRGINIA 1.4% | |
Louisa Industrial Development Authority
Refunding Revenue Bonds
Series 2015
11/01/35 | | | 1.750 | % | | | 7,000,000 | | | | 7,109,060 | | |
Peninsula Ports Authority
Refunding Revenue Bonds
Dominion Term Association Project
Series 2003
10/01/33 | | | 2.375 | % | | | 3,335,000 | | | | 3,351,642 | | |
Wise County Industrial Development Authority
Revenue Bonds
Series 2015A
10/01/40 | | | 2.150 | % | | | 8,500,000 | | | | 8,759,505 | | |
Virginia Electric & Power Co.
Series 2015A
11/01/40 | | | 1.875 | % | | | 5,000,000 | | | | 5,103,700 | | |
Total | | | | | | | 24,323,907 | | |
WASHINGTON 3.7% | |
Energy Northwest
Refunding Revenue Bonds
Project 1
Series 2012B
07/01/17 | | | 5.000 | % | | | 30,220,000 | | | | 31,766,962 | | |
Wind Project
Series 2014
07/01/16 | | | 5.000 | % | | | 1,000,000 | | | | 1,007,660 | | |
07/01/17 | | | 5.000 | % | | | 1,000,000 | | | | 1,048,890 | | |
07/01/18 | | | 5.000 | % | | | 1,425,000 | | | | 1,549,730 | | |
Snohomish County School District No. 15 Edmonds
Unlimited General Obligation Refunding Bonds
Series 2012
12/01/17 | | | 4.000 | % | | | 2,000,000 | | | | 2,103,820 | | |
State of Washington
Certificate of Participation
State & Local Agency Personal Property
Series 2014B
07/01/18 | | | 5.000 | % | | | 5,000,000 | | | | 5,446,750 | | |
Revenue Bonds
520 Corridor Program
Senior Series 2013
09/01/16 | | | 5.000 | % | | | 2,000,000 | | | | 2,029,940 | | |
Senior Series 2013C
09/01/19 | | | 5.000 | % | | | 2,000,000 | | | | 2,256,840 | | |
Unlimited General Obligation Bonds
Motor Vehicle Fuel Tax
Series 2014E
02/01/18 | | | 5.000 | % | | | 4,410,000 | | | | 4,742,382 | | |
Various Purpose
Series 2013D
02/01/18 | | | 5.000 | % | | | 2,810,000 | | | | 3,021,790 | | |
The accompanying Notes to Financial Statements are an integral part of this statement.
Annual Report 2016
19
COLUMBIA SHORT TERM MUNICIPAL BOND FUND
PORTFOLIO OF INVESTMENTS (continued)
April 30, 2016
Municipal Bonds (continued)
Issue
Description | | Coupon
Rate | | Principal
Amount ($) | | Value ($) | |
Unlimited General Obligation Refunding Bonds
Series 2010A
01/01/19 | | | 5.000 | % | | | 5,780,000 | | | | 6,423,718 | | |
Various Purpose
Series 2009R
01/01/18 | | | 5.000 | % | | | 4,940,000 | | | | 5,295,038 | | |
Washington State Housing Finance Commission
Revenue Bonds
Series 2010A (GNMA/FNMA/FHLMC)
10/01/28 | | | 4.700 | % | | | 525,000 | | | | 555,161 | | |
Total | | | | | | | 67,248,681 | | |
WEST VIRGINIA 0.2% | |
West Virginia Economic Development Authority
Revenue Bonds
Appalachian Power Co.-Amos Project
Series 2011A AMT(b)
01/01/41 | | | 2.250 | % | | | 3,750,000 | | | | 3,760,238 | | |
WYOMING 0.1% | |
County of Sweetwater
Revenue Bonds
Series 2013
12/15/16 | | | 5.000 | % | | | 2,500,000 | | | | 2,561,925 | | |
Total Municipal Bonds
(Cost: $1,361,789,191) | | | | | | | 1,370,454,678 | | |
Floating Rate Notes 0.9%
Issue
Description | | Effective
Yield | | Principal
Amount ($) | | Value ($) | |
CALIFORNIA 0.5% | |
Grossmont Union High School District
Prerefunded 08/01/18 Unlimited General Obligation Bonds
Election of 2004
Series 2008(c)(d)
08/01/16 | | | 0.630 | % | | | 4,545,000 | | | | 4,545,000 | | |
Grossmont Union High School District
Unlimited General Obligation Bonds
Election of 2008
Series 2010B(c)(d)
08/01/18 | | | 0.630 | % | | | 4,850,000 | | | | 4,850,000 | | |
Total | | | | | | | 9,395,000 | | |
FLORIDA 0.1% | |
JEA Water & Sewer System
Subordinated Revenue Bonds
VRDN Series 2008A-1 (U.S Bank)(d)(g)
10/01/38 | | | 0.300 | % | | | 1,030,000 | | | | 1,030,000 | | |
Floating Rate Notes (continued)
Issue
Description | | Effective
Yield | | Principal
Amount ($) | | Value ($) | |
NEW YORK 0.3% | |
New York City Transitional Finance Authority Future Tax
Secured
Revenue Bonds
Future Tax Secured
VRDN Subordinated Series 2015
(JPMorgan Chase Bank)(d)(g)
02/01/45 | | | 0.320 | % | | | 6,250,000 | | | | 6,250,000 | | |
Total Floating Rate Notes
(Cost: $16,675,000) | | | | | | | 16,675,000 | | |
Municipal Short Term 21.6%
ALABAMA 0.2% | |
Industrial Development Board of the City of Mobile
Revenue Bonds
Alabama Power Co.-Barry Plant
Series 2015
07/15/34 | | | 1.570 | % | | | 3,250,000 | | | | 3,279,738 | | |
CALIFORNIA 1.0% | |
California Pollution Control Financing Authority
Refunding Revenue Bonds
Republic Services, Inc.
Series 2010A AMT(b)
08/01/23 | | | 0.650 | % | | | 13,000,000 | | | | 13,000,000 | | |
Lake Elsinore School District
Revenue Notes
TRAN Series 2015A
06/30/16 | | | 0.430 | % | | | 5,715,000 | | | | 5,730,145 | | |
Total | | | | | | | 18,730,145 | | |
COLORADO 0.1% | |
Colorado Educational & Cultural Facilities Authority
Revenue Bonds
National Jewish Federation
Series 2007D-3(d)
12/01/37 | | | 0.300 | % | | | 1,900,000 | | | | 1,900,000 | | |
CONNECTICUT 0.6% | |
Town of Hamden
Unlimited General Obligation Notes
Series 2015 (BAN)
08/18/16 | | | 0.760 | % | | | 10,000,000 | | | | 10,067,100 | | |
INDIANA 0.2% | |
Indiana Finance Authority
Revenue Bonds
Republic Services, Inc. Project
Series 2010A AMT(b)(d)
05/01/34 | | | 0.710 | % | | | 3,580,000 | | | | 3,580,000 | | |
The accompanying Notes to Financial Statements are an integral part of this statement.
Annual Report 2016
20
COLUMBIA SHORT TERM MUNICIPAL BOND FUND
PORTFOLIO OF INVESTMENTS (continued)
April 30, 2016
Municipal Short Term (continued)
Issue
Description | | Effective
Yield | | Principal
Amount ($) | | Value ($) | |
KENTUCKY 2.1% | |
City of Pikeville
Revenue Bonds
Pikeville College of Optometry
BAN Series 2015
08/01/17 | | | 2.160 | % | | | 15,000,000 | | | | 15,154,950 | | |
Kentucky Economic Development Finance Authority
Refunding Revenue Bonds
Republic Services
Series 2016A AMT(b)(d)
04/01/31 | | | 0.700 | % | | | 16,420,000 | | | | 16,420,000 | | |
Kentucky Public Transportation Infrastructure Authority
Revenue Bonds
Downtown Crossing Project
BAN Subordinated Series 2013
07/01/17 | | | 1.300 | % | | | 5,550,000 | | | | 5,788,039 | | |
Total | | | | | | | 37,362,989 | | |
MARYLAND —% | |
Maryland Health & Higher Educational Facilities Authority
Refunding Revenue Bonds
Meritus Medical Center Issue
Series 2015
07/01/16 | | | 0.580 | % | | | 600,000 | | | | 604,554 | | |
NEW JERSEY 0.9% | |
City of East Orange
Unlimited General Obligation Notes
Series 2016
03/28/17 | | | 1.070 | % | | | 13,059,500 | | | | 13,168,808 | | |
City of Newark
Unlimited General Obligation Notes
TAN Series 2016A
02/15/17 | | | 1.700 | % | | | 3,905,000 | | | | 3,929,367 | | |
Total | | | | | | | 17,098,175 | | |
NEW YORK 16.1% | |
Board of Cooperative Educational Services
for the Sole Supervisory District
Revenue Notes
Series 2015
06/24/16 | | | 0.800 | % | | | 6,500,000 | | | | 6,511,815 | | |
City of Long Beach
Limited General Obligation Notes
BAN Series 2016
02/16/17 | | | 1.150 | % | | | 5,582,000 | | | | 5,597,239 | | |
City of New York
Unlimited General Obligation Bonds
Fiscal 1995
Subordinated Series 2015F(d)
02/15/19 | | | 1.060 | % | | | 6,250,000 | | | | 6,247,000 | | |
Municipal Short Term (continued)
Issue
Description | | Effective
Yield | | Principal
Amount ($) | | Value ($) | |
City of Rome
Limited General Obligation Notes
Series 2015C (BAN)
06/30/16 | | | 0.980 | % | | | 14,100,000 | | | | 14,100,423 | | |
Series 2015D (BAN)
06/30/16 | | | 1.180 | % | | | 4,250,000 | | | | 4,251,318 | | |
County of Monroe
Limited General Obligation Notes
BAN Series 2015
06/30/16 | | | 0.740 | % | | | 10,835,000 | | | | 10,848,760 | | |
County of Rockland
Limited General Obligation Notes
TAN Series 2016
03/16/17 | | | 0.980 | % | | | 6,000,000 | | | | 6,053,160 | | |
Greater Southern Tier Board of Cooperative Educational
Services District
Revenue Bonds
RAN Series 2016
06/30/16 | | | 1.060 | % | | | 15,000,000 | | | | 15,011,100 | | |
Haverstraw-Stony Point Central School District
Unlimited General Obligation Notes
BAN Series 2015
06/24/16 | | | 0.550 | % | | | 6,140,000 | | | | 6,151,161 | | |
Hempstead Union Free School District
Unlimited General Obligation Notes
Series 2015 (TAN)
06/24/16 | | | 0.980 | % | | | 15,000,000 | | | | 15,023,134 | | |
Jamestown City School District
Unlimited General Obligation Notes
BAN Series 2015
06/23/16 | | | 0.780 | % | | | 13,850,000 | | | | 13,874,975 | | |
06/23/16 | | | 0.860 | % | | | 23,390,000 | | | | 23,429,648 | | |
Lewiston-Porter Central School District
Unlimited General Obligation Notes
BAN Series 2015
07/21/16 | | | 0.870 | % | | | 24,005,000 | | | | 24,066,213 | | |
Liverpool Central School District
Unlimited General Obligation Notes
RAN Series 2015A
07/07/16 | | | 0.740 | % | | | 5,000,000 | | | | 5,007,050 | | |
Mount Markham Central School District
Unlimited General Obligation Notes
BAN Series 2015
06/28/16 | | | 0.820 | % | | | 4,750,000 | | | | 4,759,064 | | |
New York City Industrial Development Agency
Revenue Bonds
John F. Kennedy International Airport Project
Series 2002B-R AMT(b)
08/01/28 | | | 1.980 | % | | | 7,800,000 | | | | 7,814,742 | | |
The accompanying Notes to Financial Statements are an integral part of this statement.
Annual Report 2016
21
COLUMBIA SHORT TERM MUNICIPAL BOND FUND
PORTFOLIO OF INVESTMENTS (continued)
April 30, 2016
Municipal Short Term (continued)
Issue
Description | | Effective
Yield | | Principal
Amount ($) | | Value ($) | |
New York City Water & Sewer System
Revenue Bonds
2nd General Resolution
Series 2014(d)
06/15/50 | | | 0.250 | % | | | 350,000 | | | | 350,000 | | |
Niagara Falls City School District
Unlimited General Obligation Notes
BAN Series 2015
06/23/16 | | | 0.700 | % | | | 20,109,094 | | | | 20,147,895 | | |
Pine Valley Central School District
Unlimited General Obligation Notes
Series 2015 (BAN)
09/29/16 | | | 1.120 | % | | | 10,435,530 | | | | 10,472,889 | | |
Salmon River Central School District
Unlimited General Obligation Notes
RAN Series 2015
06/17/16 | | | 0.710 | % | | | 9,000,000 | | | | 9,012,363 | | |
Schenectady City School District
Unlimited General Obligation Notes
BAN Series 2015
07/08/16 | | | 0.470 | % | | | 15,000,000 | | | | 15,043,650 | | |
Shoreham-Wading River Central School District
Unlimited General Obligation Notes
Series 2015 (TAN)
06/28/16 | | | 1.100 | % | | | 4,000,000 | | | | 4,005,784 | | |
Town of Batavia
Limited General Obligation Notes
BAN Series 2016
03/16/17 | | | 1.220 | % | | | 5,496,190 | | | | 5,533,289 | | |
Town of Oyster Bay
Limited General Obligation Notes
BAN Series 2015B
07/08/16 | | | 1.030 | % | | | 16,200,000 | | | | 16,214,256 | | |
BAN Series 2016A
02/03/17 | | | 1.870 | % | | | 10,000,000 | | | | 10,064,800 | | |
Utica School District
Unlimited General Obligation Notes
BAN Series 2015
07/22/16 | | | 1.340 | % | | | 20,000,000 | | | | 20,029,200 | | |
Village of Arcade
Limited General Obligation Notes
Series 2015 (BAN)
08/18/16 | | | 0.990 | % | | | 4,675,000 | | | | 4,689,025 | | |
Weedsport Central School District
Unlimited General Obligation Notes
BAN Series 2015
07/15/16 | | | 0.710 | % | | | 4,850,000 | | | | 4,858,002 | | |
Total | | | | | | | 289,167,955 | | |
Municipal Short Term (continued)
Issue
Description | | Effective
Yield | | Principal
Amount ($) | | Value ($) | |
TEXAS 0.3% | |
Harris County Cultural Education Facilities Finance Corp.
Refunding Revenue Bonds
Texas Medical Center
Series 2008A(d)
09/01/31 | | | 0.300 | % | | | 1,065,000 | | | | 1,065,000 | | |
Mission Economic Development Corp.
Revenue Bonds
Republic Services, Inc.
Series 2008A
01/01/20 | | | 0.700 | % | | | 4,000,000 | | | | 4,000,000 | | |
Total | | | | | | | 5,065,000 | | |
VIRGIN ISLANDS 0.1% | |
Virgin Islands Public Finance Authority
Revenue Bonds
Series 2015(c)(f)
09/01/16 | | | 1.000 | % | | | 1,000,000 | | | | 1,006,740 | | |
Total Municipal Short Term
(Cost: $387,781,381) | | | | | | | 387,862,396 | | |
Money Market Funds 0.2%
| | | Shares | | Value ($) | |
JPMorgan Tax-Free Money Market Fund,
Agency Shares, 0.110%(h) | | | 4,126,700 | | | | 4,126,700 | | |
Total Money Market Funds
(Cost: $4,126,700) | | | | | 4,126,700 | | |
Total Investments
(Cost: $1,770,372,272) | | | | | 1,779,118,774 | | |
Other Assets & Liabilities, Net | | | | | 14,369,629 | | |
Net Assets | | | | | 1,793,488,403 | | |
The accompanying Notes to Financial Statements are an integral part of this statement.
Annual Report 2016
22
COLUMBIA SHORT TERM MUNICIPAL BOND FUND
PORTFOLIO OF INVESTMENTS (continued)
April 30, 2016
Notes to Portfolio of Investments
(a) Security, or a portion thereof, has been purchased on a when-issued or delayed delivery basis.
(b) Income from this security may be subject to alternative minimum tax.
(c) Represents privately placed and other securities and instruments exempt from SEC registration (collectively, private placements), such as Section 4(a)(2) and Rule 144A eligible securities, which are often sold only to qualified institutional buyers. The Fund may invest in private placements determined to be liquid as well as those determined to be illiquid. Private placements may be determined to be liquid under guidelines established by the Fund's Board of Trustees. At April 30, 2016, the value of these securities amounted to $15,192,557 or 0.85% of net assets.
(d) Variable rate security.
(e) Zero coupon bond.
(f) Municipal obligations include debt obligations issued by or on behalf of territories, possessions, or sovereign nations within the territorial boundaries of the United States. At April 30, 2016, the value of these securities amounted to $4,242,330 or 0.24% of net assets.
(g) The Fund is entitled to receive principal and interest from the guarantor after a day or a week's notice or upon maturity. The maturity date disclosed represents the final maturity.
(h) The rate shown is the seven-day current annualized yield at April 30, 2016.
Abbreviation Legend
AGM Assured Guaranty Municipal Corporation
AMBAC Ambac Assurance Corporation
AMT Alternative Minimum Tax
BAM Build America Mutual Assurance Co.
BAN Bond Anticipation Note
FHA Federal Housing Authority
FHLMC Federal Home Loan Mortgage Corporation
FNMA Federal National Mortgage Association
GNMA Government National Mortgage Association
NPFGC National Public Finance Guarantee Corporation
RAN Revenue Anticipation Note
TAN Tax Anticipation Note
TCRS Transferable Custodial Receipts
TRAN Tax & Revenue Anticipation Note
VRDN Variable Rate Demand Note
Fair Value Measurements
The Fund categorizes its fair value measurements according to a three-level hierarchy that maximizes the use of observable inputs and minimizes the use of unobservable inputs by prioritizing that the most observable input be used when available. Observable inputs are those that market participants would use in pricing an investment based on market data obtained from sources independent of the reporting entity. Unobservable inputs are those that reflect the Fund's assumptions about the information market participants would use in pricing an investment. An investment's level within the fair value hierarchy is based on the lowest level of any input that is deemed significant to the asset's or liability's fair value measurement. The input levels are not necessarily an indication of the risk or liquidity associated with investments at that level. For example, certain U.S. government securities are generally high quality and liquid, however, they are reflected as Level 2 because the inputs used to determine fair value may not always be quoted prices in an active market.
Fair value inputs are summarized in the three broad levels listed below:
> Level 1 — Valuations based on quoted prices for investments in active markets that the Fund has the ability to access at the measurement date (including NAV for open-end mutual funds). Valuation adjustments are not applied to Level 1 investments.
> Level 2 — Valuations based on other significant observable inputs (including quoted prices for similar securities, interest rates, prepayment speeds, credit risks, etc.).
The accompanying Notes to Financial Statements are an integral part of this statement.
Annual Report 2016
23
COLUMBIA SHORT TERM MUNICIPAL BOND FUND
PORTFOLIO OF INVESTMENTS (continued)
April 30, 2016
Fair Value Measurements (continued)
> Level 3 — Valuations based on significant unobservable inputs (including the Fund's own assumptions and judgment in determining the fair value of investments).
Inputs that are used in determining fair value of an investment may include price information, credit data, volatility statistics, and other factors. These inputs can be either observable or unobservable. The availability of observable inputs can vary between investments, and is affected by various factors such as the type of investment, and the volume and level of activity for that investment or similar investments in the marketplace. The inputs will be considered by the Investment Manager, along with any other relevant factors in the calculation of an investment's fair value. The Fund uses prices and inputs that are current as of the measurement date, which may include periods of market dislocations. During these periods, the availability of prices and inputs may be reduced for many investments. This condition could cause an investment to be reclassified between the various levels within the hierarchy.
Investments falling into the Level 3 category are primarily supported by quoted prices from brokers and dealers participating in the market for those investments. However, these may be classified as Level 3 investments due to lack of market transparency and corroboration to support these quoted prices. Additionally, valuation models may be used as the pricing source for any remaining investments classified as Level 3. These models may rely on one or more significant unobservable inputs and/or significant assumptions by the Investment Manager. Inputs used in valuations may include, but are not limited to, financial statement analysis, capital account balances, discount rates and estimated cash flows, and comparable company data.
Under the direction of the Fund's Board of Trustees (the Board), the Investment Manager's Valuation Committee (the Committee) is responsible for overseeing the valuation procedures approved by the Board. The Committee consists of voting and non-voting members from various groups within the Investment Manager's organization, including operations and accounting, trading and investments, compliance, risk management and legal.
The Committee meets at least monthly to review and approve valuation matters, which may include a description of specific valuation determinations, data regarding pricing information received from approved pricing vendors and brokers and the results of Board-approved valuation control policies and procedures (the Policies). The Policies address, among other things, instances when market quotations are or are not readily available, including recommendations of third party pricing vendors and a determination of appropriate pricing methodologies; events that require specific valuation determinations and assessment of fair value techniques; securities with a potential for stale pricing, including those that are illiquid, restricted, or in default; and the effectiveness of third party pricing vendors, including periodic reviews of vendors. The Committee meets more frequently, as needed, to discuss additional valuation matters, which may include the need to review back-testing results, review time-sensitive information or approve related valuation actions. The Committee reports to the Board, with members of the Committee meeting with the Board at each of its regularly scheduled meetings to discuss valuation matters and actions during the period, similar to those described earlier.
For investments categorized as Level 3, the Committee monitors information similar to that described above, which may include: (i) data specific to the issuer or comparable issuers, (ii) general market or specific sector news and (iii) quoted prices and specific or similar security transactions. The Committee considers this data and any changes from prior periods in order to assess the reasonableness of observable and unobservable inputs, any assumptions or internal models used to value those securities and changes in fair value. This data is also used to corroborate, when available, information received from approved pricing vendors and brokers. Various factors impact the frequency of monitoring this information (which may occur as often as daily). However, the Committee may determine that changes to inputs, assumptions and models are not required as a result of the monitoring procedures performed.
The following table is a summary of the inputs used to value the Fund's investments at April 30, 2016:
| | | Level 1
Quoted Prices in Active
Markets for Identical
Assets ($) | | Level 2
Other Significant
Observable Inputs ($) | | Level 3
Significant
Unobservable Inputs ($) | | Total ($) | |
Investments | |
Municipal Bonds | | | — | | | | 1,370,454,678 | | | | — | | | | 1,370,454,678 | | |
Floating Rate Notes | | | — | | | | 16,675,000 | | | | — | | | | 16,675,000 | | |
Municipal Short Term | | | — | | | | 387,862,396 | | | | — | | | | 387,862,396 | | |
Money Market Funds | | | 4,126,700 | | | | — | | | | — | | | | 4,126,700 | | |
Total Investments | | | 4,126,700 | | | | 1,774,992,074 | | | | — | | | | 1,779,118,774 | | |
See the Portfolio of Investments for all investment classifications not indicated in the table.
The Fund's assets assigned to the Level 2 input category are generally valued using the market approach, in which a security's value is determined through reference to prices and information from market transactions for similar or identical assets.
There were no transfers of financial assets between levels during the period.
The accompanying Notes to Financial Statements are an integral part of this statement.
Annual Report 2016
24
COLUMBIA SHORT TERM MUNICIPAL BOND FUND
STATEMENT OF ASSETS AND LIABILITIES
April 30, 2016
Assets | |
Investments, at value | |
(identified cost $1,770,372,272) | | $ | 1,779,118,774 | | |
Receivable for: | |
Investments sold | | | 2,144,432 | | |
Capital shares sold | | | 1,741,636 | | |
Interest | | | 21,451,182 | | |
Expense reimbursement due from Investment Manager | | | 7,647 | | |
Prepaid expenses | | | 2,003 | | |
Total assets | | | 1,804,465,674 | | |
Liabilities | |
Payable for: | |
Investments purchased on a delayed delivery basis | | | 8,563,608 | | |
Capital shares purchased | | | 508,102 | | |
Dividend distributions to shareholders | | | 1,407,486 | | |
Investment management fees | | | 20,671 | | |
Distribution and/or service fees | | | 1,397 | | |
Transfer agent fees | | | 281,744 | | |
Compensation of board members | | | 151,453 | | |
Other expenses | | | 42,810 | | |
Total liabilities | | | 10,977,271 | | |
Net assets applicable to outstanding capital stock | | $ | 1,793,488,403 | | |
Represented by | |
Paid-in capital | | $ | 1,783,470,901 | | |
Undistributed net investment income | | | 2,215,833 | | |
Accumulated net realized loss | | | (944,833 | ) | |
Unrealized appreciation (depreciation) on: | |
Investments | | | 8,746,502 | | |
Total — representing net assets applicable to outstanding capital stock | | $ | 1,793,488,403 | | |
The accompanying Notes to Financial Statements are an integral part of this statement.
Annual Report 2016
25
COLUMBIA SHORT TERM MUNICIPAL BOND FUND
STATEMENT OF ASSETS AND LIABILITIES (continued)
April 30, 2016
Class A | |
Net assets | | $ | 127,769,222 | | |
Shares outstanding | | | 12,254,207 | | |
Net asset value per share | | $ | 10.43 | | |
Maximum offering price per share(a) | | $ | 10.54 | | |
Class B | |
Net assets | | $ | 135,605 | | |
Shares outstanding | | | 13,020 | | |
Net asset value per share | | $ | 10.42 | | |
Class C | |
Net assets | | $ | 19,073,680 | | |
Shares outstanding | | | 1,830,841 | | |
Net asset value per share | | $ | 10.42 | | |
Class R4 | |
Net assets | | $ | 543,964 | | |
Shares outstanding | | | 52,177 | | |
Net asset value per share | | $ | 10.43 | | |
Class R5 | |
Net assets | | $ | 22,158,511 | | |
Shares outstanding | | | 2,126,037 | | |
Net asset value per share | | $ | 10.42 | | |
Class Z | |
Net assets | | $ | 1,623,807,421 | | |
Shares outstanding | | | 155,713,682 | | |
Net asset value per share | | $ | 10.43 | | |
(a) The maximum offering price per share is calculated by dividing the net asset value per share by 1.0 minus the maximum sales charge of 1.00%.
The accompanying Notes to Financial Statements are an integral part of this statement.
Annual Report 2016
26
COLUMBIA SHORT TERM MUNICIPAL BOND FUND
STATEMENT OF OPERATIONS
Year Ended April 30, 2016
Net investment income | |
Income: | |
Dividends | | $ | 5,171 | | |
Interest | | | 25,112,960 | | |
Total income | | | 25,118,131 | | |
Expenses: | |
Investment management fees | | | 7,762,811 | | |
Distribution and/or service fees | |
Class A | | | 326,236 | | |
Class B | | | 1,332 | | |
Class C | | | 202,222 | | |
Transfer agent fees | |
Class A | | | 266,454 | | |
Class B | | | 272 | | |
Class C | | | 41,286 | | |
Class R4 | | | 1,395 | | |
Class R5 | | | 10,424 | | |
Class Z | | | 3,407,125 | | |
Compensation of board members | | | 30,358 | | |
Custodian fees | | | 13,367 | | |
Printing and postage fees | | | 33,455 | | |
Registration fees | | | 118,572 | | |
Audit fees | | | 24,308 | | |
Legal fees | | | 21,056 | | |
Other | | | 40,051 | | |
Total expenses | | | 12,300,724 | | |
Fees waived or expenses reimbursed by Investment Manager and its affiliates | | | (3,096,375 | ) | |
Expense reductions | | | (20 | ) | |
Total net expenses | | | 9,204,329 | | |
Net investment income | | | 15,913,802 | | |
Realized and unrealized gain (loss) — net | |
Net realized gain (loss) on: | |
Investments | | | 192,325 | | |
Net realized gain | | | 192,325 | | |
Net change in unrealized appreciation (depreciation) on: | |
Investments | | | 1,836,081 | | |
Net change in unrealized appreciation | | | 1,836,081 | | |
Net realized and unrealized gain | | | 2,028,406 | | |
Net increase in net assets resulting from operations | | $ | 17,942,208 | | |
The accompanying Notes to Financial Statements are an integral part of this statement.
Annual Report 2016
27
COLUMBIA SHORT TERM MUNICIPAL BOND FUND
STATEMENT OF CHANGES IN NET ASSETS
| | | Year Ended
April 30,
2016 | | Year Ended
April 30,
2015 | |
Operations | |
Net investment income | | $ | 15,913,802 | | | $ | 20,560,067 | | |
Net realized gain | | | 192,325 | | | | 305,753 | | |
Net change in unrealized appreciation (depreciation) | | | 1,836,081 | | | | (11,444,000 | ) | |
Net increase in net assets resulting from operations | | | 17,942,208 | | | | 9,421,820 | | |
Distributions to shareholders | |
Net investment income | |
Class A | | | (834,469 | ) | | | (1,205,953 | ) | |
Class B | | | (2 | ) | | | (55 | ) | |
Class C | | | (304 | ) | | | (10,293 | ) | |
Class R4 | | | (6,078 | ) | | | (1,992 | ) | |
Class R5 | | | (207,972 | ) | | | (250,660 | ) | |
Class Z | | | (14,875,169 | ) | | | (19,125,663 | ) | |
Total distributions to shareholders | | | (15,923,994 | ) | | | (20,594,616 | ) | |
Decrease in net assets from capital stock activity | | | (75,957,436 | ) | | | (157,962,302 | ) | |
Total decrease in net assets | | | (73,939,222 | ) | | | (169,135,098 | ) | |
Net assets at beginning of year | | | 1,867,427,625 | | | | 2,036,562,723 | | |
Net assets at end of year | | $ | 1,793,488,403 | | | $ | 1,867,427,625 | | |
Undistributed net investment income | | $ | 2,215,833 | | | $ | 2,226,025 | | |
The accompanying Notes to Financial Statements are an integral part of this statement.
Annual Report 2016
28
COLUMBIA SHORT TERM MUNICIPAL BOND FUND
STATEMENT OF CHANGES IN NET ASSETS (continued)
| | | Year Ended April 30, 2016 | | Year Ended April 30, 2015 | |
| | | Shares | | Dollars ($) | | Shares | | Dollars ($) | |
Capital stock activity | |
Class A shares | |
Subscriptions(a) | | | 4,413,168 | | | | 45,946,467 | | | | 4,800,943 | | | | 50,219,992 | | |
Distributions reinvested | | | 65,818 | | | | 685,179 | | | | 80,067 | | | | 837,472 | | |
Redemptions | | | (4,790,599 | ) | | | (49,870,873 | ) | | | (8,140,884 | ) | | | (85,145,912 | ) | |
Net decrease | | | (311,613 | ) | | | (3,239,227 | ) | | | (3,259,874 | ) | | | (34,088,448 | ) | |
Class B shares | |
Subscriptions | | | 961 | | | | 10,002 | | | | 3 | | | | 44 | | |
Distributions reinvested | | | — | | | | — | | | | 1 | | | | 3 | | |
Redemptions(a) | | | (10 | ) | | | (106 | ) | | | (162 | ) | | | (1,696 | ) | |
Net increase (decrease) | | | 951 | | | | 9,896 | | | | (158 | ) | | | (1,649 | ) | |
Class C shares | |
Subscriptions | | | 550,460 | | | | 5,723,086 | | | | 987,898 | | | | 10,337,603 | | |
Distributions reinvested | | | 15 | | | | 158 | | | | 513 | | | | 5,373 | | |
Redemptions | | | (752,943 | ) | | | (7,836,025 | ) | | | (1,286,309 | ) | | | (13,455,885 | ) | |
Net decrease | | | (202,468 | ) | | | (2,112,781 | ) | | | (297,898 | ) | | | (3,112,909 | ) | |
Class R4 shares | |
Subscriptions | | | 58,008 | | | | 603,072 | | | | 51,079 | | | | 534,275 | | |
Distributions reinvested | | | 575 | | | | 5,989 | | | | 181 | | | | 1,888 | | |
Redemptions | | | (60,923 | ) | | | (634,700 | ) | | | (4,814 | ) | | | (50,294 | ) | |
Net increase (decrease) | | | (2,340 | ) | | | (25,639 | ) | | | 46,446 | | | | 485,869 | | |
Class R5 shares | |
Subscriptions | | | 1,975,369 | | | | 20,533,646 | | | | 1,065,038 | | | | 11,142,196 | | |
Distributions reinvested | | | 19,968 | | | | 207,868 | | | | 23,955 | | | | 250,543 | | |
Redemptions | | | (1,311,922 | ) | | | (13,660,915 | ) | | | (1,858,884 | ) | | | (19,429,265 | ) | |
Net increase (decrease) | | | 683,415 | | | | 7,080,599 | | | | (769,891 | ) | | | (8,036,526 | ) | |
Class Z shares | |
Subscriptions | | | 64,437,575 | | | | 670,727,341 | | | | 59,806,951 | | | | 625,714,831 | | |
Distributions reinvested | | | 84,231 | | | | 877,035 | | | | 123,155 | | | | 1,288,390 | | |
Redemptions | | | (71,971,692 | ) | | | (749,274,660 | ) | | | (70,778,267 | ) | | | (740,211,860 | ) | |
Net decrease | | | (7,449,886 | ) | | | (77,670,284 | ) | | | (10,848,161 | ) | | | (113,208,639 | ) | |
Total net decrease | | | (7,281,941 | ) | | | (75,957,436 | ) | | | (15,129,536 | ) | | | (157,962,302 | ) | |
(a) Includes conversions of Class B shares to Class A shares, if any.
The accompanying Notes to Financial Statements are an integral part of this statement.
Annual Report 2016
29
COLUMBIA SHORT TERM MUNICIPAL BOND FUND
The following tables are intended to help you understand the Fund's financial performance. Certain information reflects financial results for a single share of a class held for the periods shown. Per share net investment income (loss) amounts are calculated based on average shares outstanding during the period. Total return assumes reinvestment of all dividends and distributions, if any. Total return does not reflect payment of sales charges, if any. Total return and portfolio turnover are not annualized for periods of less than one year. The portfolio turnover rate is calculated without regard to purchase and sales transactions of short-term instruments and certain derivatives, if any. If such transactions were included, the Fund's portfolio turnover rate may be higher.
| | | Year Ended April 30, | | Year Ended
March 31, | |
Class A | | 2016 | | 2015 | | 2014 | | 2013 | | 2012(a) | | 2012 | |
Per share data | |
Net asset value, beginning of period | | $ | 10.42 | | | $ | 10.48 | | | $ | 10.54 | | | $ | 10.55 | | | $ | 10.54 | | | $ | 10.47 | | |
Income from investment operations: | |
Net investment income | | | 0.07 | | | | 0.08 | | | | 0.10 | | | | 0.11 | | | | 0.01 | | | | 0.16 | | |
Net realized and unrealized gain (loss) | | | 0.01 | | | | (0.06 | ) | | | (0.06 | ) | | | (0.01 | ) | | | 0.01 | | | | 0.06 | | |
Total from investment operations | | | 0.08 | | | | 0.02 | | | | 0.04 | | | | 0.10 | | | | 0.02 | | | | 0.22 | | |
Less distributions to shareholders: | |
Net investment income | | | (0.07 | ) | | | (0.08 | ) | | | (0.10 | ) | | | (0.11 | ) | | | (0.01 | ) | | | (0.15 | ) | |
Total distributions to shareholders | | | (0.07 | ) | | | (0.08 | ) | | | (0.10 | ) | | | (0.11 | ) | | | (0.01 | ) | | | (0.15 | ) | |
Net asset value, end of period | | $ | 10.43 | | | $ | 10.42 | | | $ | 10.48 | | | $ | 10.54 | | | $ | 10.55 | | | $ | 10.54 | | |
Total return | | | 0.74 | % | | | 0.22 | % | | | 0.37 | % | | | 0.96 | % | | | 0.19 | % | | | 2.12 | % | |
Ratios to average net assets(b) | |
Total gross expenses | | | 0.89 | % | | | 0.89 | % | | | 0.89 | % | | | 0.89 | % | | | 0.88 | %(c) | | | 0.90 | % | |
Total net expenses(d) | | | 0.72 | %(e) | | | 0.73 | %(e) | | | 0.73 | %(e) | | | 0.73 | %(e) | | | 0.72 | %(c) | | | 0.73 | %(e) | |
Net investment income | | | 0.64 | % | | | 0.79 | % | | | 0.94 | % | | | 1.05 | % | | | 1.17 | %(c) | | | 1.54 | % | |
Supplemental data | |
Net assets, end of period (in thousands) | | $ | 127,769 | | | $ | 130,876 | | | $ | 165,777 | | | $ | 185,205 | | | $ | 209,557 | | | $ | 216,298 | | |
Portfolio turnover | | | 37 | % | | | 28 | % | | | 31 | % | | | 37 | % | | | 2 | % | | | 39 | % | |
Notes to Financial Highlights
(a) For the period from April 1, 2012 to April 30, 2012. During the period, the Fund's fiscal year end was changed from March 31 to April 30.
(b) In addition to the fees and expenses that the Fund bears directly, the Fund indirectly bears a pro rata share of the fees and expenses of any other funds in which it invests. Such indirect expenses are not included in the Fund's reported expense ratios.
(c) Annualized.
(d) Total net expenses include the impact of certain fee waivers/expense reimbursements made by the Investment Manager and certain of its affiliates, if applicable.
(e) The benefits derived from expense reductions had an impact of less than 0.01%.
The accompanying Notes to Financial Statements are an integral part of this statement.
Annual Report 2016
30
COLUMBIA SHORT TERM MUNICIPAL BOND FUND
FINANCIAL HIGHLIGHTS (continued)
| | | Year Ended April 30, | | Year Ended
March 31, | |
Class B | | 2016 | | 2015 | | 2014 | | 2013 | | 2012(a) | | 2012 | |
Per share data | |
Net asset value, beginning of period | | $ | 10.42 | | | $ | 10.47 | | | $ | 10.54 | | | $ | 10.55 | | | $ | 10.54 | | | $ | 10.47 | | |
Income from investment operations: | |
Net investment income (loss) | | | (0.01 | ) | | | 0.00 | (b) | | | 0.02 | | | | 0.03 | | | | 0.00 | (b) | | | 0.08 | | |
Net realized and unrealized gain (loss) | | | 0.01 | | | | (0.05 | ) | | | (0.07 | ) | | | (0.01 | ) | | | 0.01 | | | | 0.06 | | |
Total from investment operations | | | — | | | | (0.05 | ) | | | (0.05 | ) | | | 0.02 | | | | 0.01 | | | | 0.14 | | |
Less distributions to shareholders: | |
Net investment income | | | (0.00 | )(b) | | | (0.00 | )(b) | | | (0.02 | ) | | | (0.03 | ) | | | (0.00 | )(b) | | | (0.07 | ) | |
Total distributions to shareholders | | | (0.00 | )(b) | | | (0.00 | )(b) | | | (0.02 | ) | | | (0.03 | ) | | | (0.00 | )(b) | | | (0.07 | ) | |
Net asset value, end of period | | $ | 10.42 | | | $ | 10.42 | | | $ | 10.47 | | | $ | 10.54 | | | $ | 10.55 | | | $ | 10.54 | | |
Total return | | | 0.00 | %(b) | | | (0.43 | %) | | | (0.47 | %) | | | 0.20 | % | | | 0.12 | % | | | 1.35 | % | |
Ratios to average net assets(c) | |
Total gross expenses | | | 1.65 | % | | | 1.64 | % | | | 1.64 | % | | | 1.64 | % | | | 1.63 | %(d) | | | 1.63 | % | |
Total net expenses(e) | | | 1.47 | %(f) | | | 1.48 | %(f) | | | 1.48 | %(f) | | | 1.48 | % | | | 1.47 | %(d) | | | 1.48 | %(f) | |
Net investment income (loss) | | | (0.11 | %) | | | 0.04 | % | | | 0.19 | % | | | 0.30 | % | | | 0.41 | %(d) | | | 0.79 | % | |
Supplemental data | |
Net assets, end of period (in thousands) | | $ | 136 | | | $ | 126 | | | $ | 128 | | | $ | 169 | | | $ | 243 | | | $ | 243 | | |
Portfolio turnover | | | 37 | % | | | 28 | % | | | 31 | % | | | 37 | % | | | 2 | % | | | 39 | % | |
Notes to Financial Highlights
(a) For the period from April 1, 2012 to April 30, 2012. During the period, the Fund's fiscal year end was changed from March 31 to April 30.
(b) Rounds to zero.
(c) In addition to the fees and expenses that the Fund bears directly, the Fund indirectly bears a pro rata share of the fees and expenses of any other funds in which it invests. Such indirect expenses are not included in the Fund's reported expense ratios.
(d) Annualized.
(e) Total net expenses include the impact of certain fee waivers/expense reimbursements made by the Investment Manager and certain of its affiliates, if applicable.
(f) The benefits derived from expense reductions had an impact of less than 0.01%.
The accompanying Notes to Financial Statements are an integral part of this statement.
Annual Report 2016
31
COLUMBIA SHORT TERM MUNICIPAL BOND FUND
FINANCIAL HIGHLIGHTS (continued)
| | | Year Ended April 30, | | Year Ended
March 31, | |
Class C | | 2016 | | 2015 | | 2014 | | 2013 | | 2012(a) | | 2012 | |
Per share data | |
Net asset value, beginning of period | | $ | 10.42 | | | $ | 10.48 | | | $ | 10.54 | | | $ | 10.55 | | | $ | 10.54 | | | $ | 10.47 | | |
Income from investment operations: | |
Net investment income (loss) | | | (0.01 | ) | | | 0.00 | (b) | | | 0.02 | | | | 0.03 | | | | 0.00 | (b) | | | 0.08 | | |
Net realized and unrealized gain (loss) | | | 0.01 | | | | (0.06 | ) | | | (0.06 | ) | | | (0.01 | ) | | | 0.01 | | | | 0.06 | | |
Total from investment operations | | | — | | | | (0.06 | ) | | | (0.04 | ) | | | 0.02 | | | | 0.01 | | | | 0.14 | | |
Less distributions to shareholders: | |
Net investment income | | | (0.00 | )(b) | | | (0.00 | )(b) | | | (0.02 | ) | | | (0.03 | ) | | | (0.00 | )(b) | | | (0.07 | ) | |
Total distributions to shareholders | | | (0.00 | )(b) | | | (0.00 | )(b) | | | (0.02 | ) | | | (0.03 | ) | | | (0.00 | )(b) | | | (0.07 | ) | |
Net asset value, end of period | | $ | 10.42 | | | $ | 10.42 | | | $ | 10.48 | | | $ | 10.54 | | | $ | 10.55 | | | $ | 10.54 | | |
Total return | | | 0.00 | %(b) | | | (0.53 | %) | | | (0.38 | %) | | | 0.20 | % | | | 0.12 | % | | | 1.35 | % | |
Ratios to average net assets(c) | |
Total gross expenses | | | 1.64 | % | | | 1.64 | % | | | 1.64 | % | | | 1.64 | % | | | 1.63 | %(d) | | | 1.64 | % | |
Total net expenses(e) | | | 1.47 | %(f) | | | 1.48 | %(f) | | | 1.48 | %(f) | | | 1.48 | %(f) | | | 1.47 | %(d) | | | 1.48 | %(f) | |
Net investment income (loss) | | | (0.10 | %) | | | 0.04 | % | | | 0.19 | % | | | 0.30 | % | | | 0.42 | %(d) | | | 0.79 | % | |
Supplemental data | |
Net assets, end of period (in thousands) | | $ | 19,074 | | | $ | 21,184 | | | $ | 24,424 | | | $ | 27,730 | | | $ | 32,953 | | | $ | 33,176 | | |
Portfolio turnover | | | 37 | % | | | 28 | % | | | 31 | % | | | 37 | % | | | 2 | % | | | 39 | % | |
Notes to Financial Highlights
(a) For the period from April 1, 2012 to April 30, 2012. During the period, the Fund's fiscal year end was changed from March 31 to April 30.
(b) Rounds to zero.
(c) In addition to the fees and expenses that the Fund bears directly, the Fund indirectly bears a pro rata share of the fees and expenses of any other funds in which it invests. Such indirect expenses are not included in the Fund's reported expense ratios.
(d) Annualized.
(e) Total net expenses include the impact of certain fee waivers/expense reimbursements made by the Investment Manager and certain of its affiliates, if applicable.
(f) The benefits derived from expense reductions had an impact of less than 0.01%.
The accompanying Notes to Financial Statements are an integral part of this statement.
Annual Report 2016
32
COLUMBIA SHORT TERM MUNICIPAL BOND FUND
FINANCIAL HIGHLIGHTS (continued)
| | | Year Ended April 30, | |
Class R4 | | 2016 | | 2015 | | 2014 | | 2013(a) | |
Per share data | |
Net asset value, beginning of period | | $ | 10.41 | | | $ | 10.47 | | | $ | 10.54 | | | $ | 10.54 | | |
Income from investment operations: | |
Net investment income | | | 0.09 | | | | 0.11 | | | | 0.13 | | | | 0.02 | | |
Net realized and unrealized gain (loss) | | | 0.02 | | | | (0.06 | ) | | | (0.08 | ) | | | (0.01 | ) | |
Total from investment operations | | | 0.11 | | | | 0.05 | | | | 0.05 | | | | 0.01 | | |
Less distributions to shareholders: | |
Net investment income | | | (0.09 | ) | | | (0.11 | ) | | | (0.12 | ) | | | (0.01 | ) | |
Total distributions to shareholders | | | (0.09 | ) | | | (0.11 | ) | | | (0.12 | ) | | | (0.01 | ) | |
Net asset value, end of period | | $ | 10.43 | | | $ | 10.41 | | | $ | 10.47 | | | $ | 10.54 | | |
Total return | | | 1.09 | % | | | 0.47 | % | | | 0.53 | % | | | 0.14 | % | |
Ratios to average net assets(b) | |
Total gross expenses | | | 0.64 | % | | | 0.65 | % | | | 0.64 | % | | | 0.66 | %(c) | |
Total net expenses(d) | | | 0.47 | %(e) | | | 0.48 | %(e) | | | 0.48 | %(e) | | | 0.48 | %(c) | |
Net investment income | | | 0.89 | % | | | 1.04 | % | | | 1.19 | % | | | 1.32 | %(c) | |
Supplemental data | |
Net assets, end of period (in thousands) | | $ | 544 | | | $ | 568 | | | $ | 85 | | | $ | 2,044 | | |
Portfolio turnover | | | 37 | % | | | 28 | % | | | 31 | % | | | 37 | % | |
Notes to Financial Highlights
(a) Based on operations from March 19, 2013 (commencement of operations) through the stated period end.
(b) In addition to the fees and expenses that the Fund bears directly, the Fund indirectly bears a pro rata share of the fees and expenses of any other funds in which it invests. Such indirect expenses are not included in the Fund's reported expense ratios.
(c) Annualized.
(d) Total net expenses include the impact of certain fee waivers/expense reimbursements made by the Investment Manager and certain of its affiliates, if applicable.
(e) The benefits derived from expense reductions had an impact of less than 0.01%.
The accompanying Notes to Financial Statements are an integral part of this statement.
Annual Report 2016
33
COLUMBIA SHORT TERM MUNICIPAL BOND FUND
FINANCIAL HIGHLIGHTS (continued)
| | | Year Ended April 30, | |
Class R5 | | 2016 | | 2015 | | 2014 | | 2013(a) | |
Per share data | |
Net asset value, beginning of period | | $ | 10.41 | | | $ | 10.47 | | | $ | 10.54 | | | $ | 10.55 | | |
Income from investment operations: | |
Net investment income | | | 0.10 | | | | 0.12 | | | | 0.14 | | | | 0.07 | | |
Net realized and unrealized gain (loss) | | | 0.01 | | | | (0.06 | ) | | | (0.07 | ) | | | (0.01 | ) | |
Total from investment operations | | | 0.11 | | | | 0.06 | | | | 0.07 | | | | 0.06 | | |
Less distributions to shareholders: | |
Net investment income | | | (0.10 | ) | | | (0.12 | ) | | | (0.14 | ) | | | (0.07 | ) | |
Total distributions to shareholders | | | (0.10 | ) | | | (0.12 | ) | | | (0.14 | ) | | | (0.07 | ) | |
Net asset value, end of period | | $ | 10.42 | | | $ | 10.41 | | | $ | 10.47 | | | $ | 10.54 | | |
Total return | | | 1.10 | % | | | 0.57 | % | | | 0.67 | % | | | 0.54 | % | |
Ratios to average net assets(b) | |
Total gross expenses | | | 0.49 | % | | | 0.49 | % | | | 0.48 | % | | | 0.48 | %(c) | |
Total net expenses(d) | | | 0.37 | % | | | 0.38 | % | | | 0.37 | % | | | 0.39 | %(c) | |
Net investment income | | | 1.00 | % | | | 1.14 | % | | | 1.31 | % | | | 1.40 | %(c) | |
Supplemental data | |
Net assets, end of period (in thousands) | | $ | 22,159 | | | $ | 15,024 | | | $ | 23,173 | | | $ | 522 | | |
Portfolio turnover | | | 37 | % | | | 28 | % | | | 31 | % | | | 37 | % | |
Notes to Financial Highlights
(a) Based on operations from November 8, 2012 (commencement of operations) through the stated period end.
(b) In addition to the fees and expenses that the Fund bears directly, the Fund indirectly bears a pro rata share of the fees and expenses of any other funds in which it invests. Such indirect expenses are not included in the Fund's reported expense ratios.
(c) Annualized.
(d) Total net expenses include the impact of certain fee waivers/expense reimbursements made by the Investment Manager and certain of its affiliates, if applicable.
The accompanying Notes to Financial Statements are an integral part of this statement.
Annual Report 2016
34
COLUMBIA SHORT TERM MUNICIPAL BOND FUND
FINANCIAL HIGHLIGHTS (continued)
| | | Year Ended April 30, | | Year Ended
March 31, | |
Class Z | | 2016 | | 2015 | | 2014 | | 2013 | | 2012(a) | | 2012 | |
Per share data | |
Net asset value, beginning of period | | $ | 10.42 | | | $ | 10.48 | | | $ | 10.54 | | | $ | 10.55 | | | $ | 10.54 | | | $ | 10.47 | | |
Income from investment operations: | |
Net investment income | | | 0.09 | | | | 0.11 | | | | 0.13 | | | | 0.14 | | | | 0.01 | | | | 0.19 | | |
Net realized and unrealized gain (loss) | | | 0.01 | | | | (0.06 | ) | | | (0.06 | ) | | | (0.01 | ) | | | 0.01 | | | | 0.06 | | |
Total from investment operations | | | 0.10 | | | | 0.05 | | | | 0.07 | | | | 0.13 | | | | 0.02 | | | | 0.25 | | |
Less distributions to shareholders: | |
Net investment income | | | (0.09 | ) | | | (0.11 | ) | | | (0.13 | ) | | | (0.14 | ) | | | (0.01 | ) | | | (0.18 | ) | |
Total distributions to shareholders | | | (0.09 | ) | | | (0.11 | ) | | | (0.13 | ) | | | (0.14 | ) | | | (0.01 | ) | | | (0.18 | ) | |
Net asset value, end of period | | $ | 10.43 | | | $ | 10.42 | | | $ | 10.48 | | | $ | 10.54 | | | $ | 10.55 | | | $ | 10.54 | | |
Total return | | | 0.99 | % | | | 0.47 | % | | | 0.62 | % | | | 1.21 | % | | | 0.21 | % | | | 2.37 | % | |
Ratios to average net assets(b) | |
Total gross expenses | | | 0.64 | % | | | 0.64 | % | | | 0.64 | % | | | 0.64 | % | | | 0.63 | %(c) | | | 0.63 | % | |
Total net expenses(d) | | | 0.47 | %(e) | | | 0.48 | %(e) | | | 0.48 | %(e) | | | 0.48 | %(e) | | | 0.47 | %(c) | | | 0.48 | %(e) | |
Net investment income | | | 0.89 | % | | | 1.04 | % | | | 1.19 | % | | | 1.30 | % | | | 1.41 | %(c) | | | 1.77 | % | |
Supplemental data | |
Net assets, end of period (in thousands) | | $ | 1,623,807 | | | $ | 1,699,650 | | | $ | 1,822,976 | | | $ | 1,829,096 | | | $ | 1,986,836 | | | $ | 2,040,417 | | |
Portfolio turnover | | | 37 | % | | | 28 | % | | | 31 | % | | | 37 | % | | | 2 | % | | | 39 | % | |
Notes to Financial Highlights
(a) For the period from April 1, 2012 to April 30, 2012. During the period, the Fund's fiscal year end was changed from March 31 to April 30.
(b) In addition to the fees and expenses that the Fund bears directly, the Fund indirectly bears a pro rata share of the fees and expenses of any other funds in which it invests. Such indirect expenses are not included in the Fund's reported expense ratios.
(c) Annualized.
(d) Total net expenses include the impact of certain fee waivers/expense reimbursements made by the Investment Manager and certain of its affiliates, if applicable.
(e) The benefits derived from expense reductions had an impact of less than 0.01%.
The accompanying Notes to Financial Statements are an integral part of this statement.
Annual Report 2016
35
COLUMBIA SHORT TERM MUNICIPAL BOND FUND
NOTES TO FINANCIAL STATEMENTS
April 30, 2016
Note 1. Organization
Columbia Short Term Municipal Bond Fund (the Fund), a series of Columbia Funds Series Trust (the Trust), is a diversified fund. The Trust is registered under the Investment Company Act of 1940, as amended (the 1940 Act), as an open-end management investment company organized as a Delaware statutory trust.
Fund Shares
The Trust may issue an unlimited number of shares (without par value). The Fund offers Class A, Class B, Class C, Class R4, Class R5 and Class Z shares. Although all share classes generally have identical voting, dividend and liquidation rights, each share class votes separately when required by the Trust's organizational documents or by law. Different share classes pay different distribution amounts to the extent the expenses of such share classes differ, and distributions in liquidation will be proportional to the net asset value of each share class. Each share class has its own expense and sales charge structure.
Class A shares are subject to a maximum front-end sales charge of 1.00% based on the initial investment amount. In addition, Class A shares purchased on or after February 19, 2015 are subject to a contingent deferred sales charge (CDSC) of 0.75% on certain investments of $500,000 or more if redeemed within 12 months after purchase. Redemptions of Class A shares purchased prior to February 19, 2015, without an initial sales charge in accounts aggregating $1 million to $50 million at the time of purchase, are subject to a CDSC of 1.00% if redeemed within 12 months after purchase, and 0.50% if redeemed more than 12, but less than 18, months after purchase.
Class B shares are not subject to sales charges and will generally convert to Class A shares eight years after purchase. The Fund no longer accepts investments by new or existing investors in the Fund's Class B shares, except in connection with the reinvestment of any dividend and/or capital gain distributions in Class B shares of the Fund and exchanges by existing Class B shareholders of certain other funds within the Columbia Family of Funds.
Class C shares are subject to a 1.00% CDSC on shares redeemed within 12 months after purchase.
Class R4 shares are not subject to sales charges and are generally available only to omnibus retirement plans and certain investors as described in the Fund's prospectus.
Class R5 shares are not subject to sales charges and are generally available only to investors purchasing through authorized investment professionals and omnibus retirement plans.
Class Z shares are not subject to sales charges and are available only to eligible investors, which are subject to different investment minimums as described in the Fund's prospectus.
Note 2. Summary of Significant Accounting Policies
Basis of Preparation
The Fund is an investment company that applies the accounting and reporting guidance in the Financial Accounting Standards Board (FASB) Accounting Standards Codification Topic 946, Financial Services — Investment Companies (ASC 946). The financial statements are prepared in accordance with U.S. generally accepted accounting principles (GAAP), which requires management to make certain estimates and assumptions that affect the reported amounts of assets and liabilities, the disclosure of contingent assets and liabilities at the date of the financial statements and the reported amounts of income and expenses during the reporting period. Actual results could differ from those estimates.
The following is a summary of significant accounting policies followed by the Fund in the preparation of its financial statements.
Security Valuation
Debt securities generally are valued by pricing services approved by the Board of Trustees (the Board) based upon market transactions for normal, institutional-size trading units of similar securities. The services may use various pricing techniques that take into account, as applicable, factors such as yield, quality, coupon rate, maturity, type of issue, trading characteristics and other data, as well as broker quotes. Debt securities for which quotations are not readily available or not believed to be reflective of market value may also be valued based upon a bid quote from an approved independent broker-dealer. Debt securities maturing in 60 days or less are valued primarily at amortized cost value, unless this method results in a valuation that management believes does not approximate market value.
Investments in open-end investment companies, including money market funds, are valued at their latest net asset value.
Annual Report 2016
36
COLUMBIA SHORT TERM MUNICIPAL BOND FUND
NOTES TO FINANCIAL STATEMENTS (continued)
April 30, 2016
Investments for which market quotations are not readily available, or that have quotations which management believes are not reflective of market value or reliable, are valued at fair value as determined in good faith under procedures approved by and under the general supervision of the Board. If a security or class of securities (such as foreign securities) is valued at fair value, such value is likely to be different from the quoted or published price for the security.
The determination of fair value often requires significant judgment. To determine fair value, management may use assumptions including but not limited to future cash flows and estimated risk premiums. Multiple inputs from various sources may be used to determine fair value.
GAAP requires disclosure regarding the inputs and valuation techniques used to measure fair value and any changes in valuation inputs or techniques. In addition, investments shall be disclosed by major category. This information is disclosed following the Fund's Portfolio of Investments.
Delayed Delivery Securities
The Fund may trade securities on other than normal settlement terms, including securities purchased or sold on a "when-issued" basis. This may increase risk to the Fund since the other party to the transaction may fail to deliver, which could cause the Fund to subsequently invest at less advantageous prices. The Fund designates cash or liquid securities in an amount equal to the delayed delivery commitment.
Security Transactions
Security transactions are accounted for on the trade date. Cost is determined and gains (losses) are based upon the specific identification method for both financial statement and federal income tax purposes.
Income Recognition
Interest income is recorded on an accrual basis. Market premiums and discounts, including original issue discounts, are amortized and accreted, respectively, over the expected life of the security on all debt securities, unless otherwise noted.
The Fund may place a debt security on non-accrual status and reduce related interest income when it becomes probable that the interest will not be collected and the amount of uncollectible interest can be reasonably estimated. A defaulted debt security is removed from non-accrual status when the issuer
resumes interest payments or when collectibility of interest is reasonably assured.
Dividend income is recorded on the ex-dividend date.
Expenses
General expenses of the Trust are allocated to the Fund and other funds of the Trust based upon relative net assets or other expense allocation methodologies determined by the nature of the expense. Expenses directly attributable to the Fund are charged to the Fund. Expenses directly attributable to a specific class of shares are charged to that share class.
Determination of Class Net Asset Value
All income, expenses (other than class-specific expenses, which are charged to that share class, as shown in the Statement of Operations) and realized and unrealized gains (losses) are allocated to each class of the Fund on a daily basis, based on the relative net assets of each class, for purposes of determining the net asset value of each class.
Federal Income Tax Status
The Fund intends to qualify each year as a regulated investment company under Subchapter M of the Internal Revenue Code, as amended, and will distribute substantially all of its tax exempt and taxable income (including net short-term capital gains), if any, for its tax year, and as such will not be subject to federal income taxes. In addition, the Fund intends to distribute in each calendar year substantially all of its net investment income, capital gains and certain other amounts, if any, such that the Fund should not be subject to federal excise tax. Therefore, no federal income or excise tax provision is recorded.
Distributions to Shareholders
Distributions from net investment income, if any, are declared daily and paid monthly. Net realized capital gains, if any, are distributed at least annually. Income distributions and capital gain distributions are determined in accordance with federal income tax regulations, which may differ from GAAP.
Guarantees and Indemnifications
Under the Trust's organizational documents and, in some cases, by contract, its officers and trustees are indemnified against certain liabilities arising out of the performance of their duties to the Trust or its funds. In addition, certain of the Fund's contracts with its service providers contain general indemnification clauses. The
Annual Report 2016
37
COLUMBIA SHORT TERM MUNICIPAL BOND FUND
NOTES TO FINANCIAL STATEMENTS (continued)
April 30, 2016
Fund's maximum exposure under these arrangements is unknown since the amount of any future claims that may be made against the Fund cannot be determined, and the Fund has no historical basis for predicting the likelihood of any such claims.
Note 3. Fees and Other Transactions with Affiliates
Management Fees
Effective September 1, 2015, the Fund entered into a Management Agreement with Columbia Management Investment Advisers, LLC (the Investment Manager), a wholly-owned subsidiary of Ameriprise Financial, Inc. (Ameriprise Financial). Under the Management Agreement, the Investment Manager provides the Fund with investment research and advice, as well as administrative and accounting services. The management services fee is an annual fee that is equal to a percentage of the Fund's average daily net assets that declines from 0.43% to 0.28% as the Fund's net assets increase. The effective management services fee rate for the year ended April 30, 2016 was 0.42% of the Fund's average daily net assets.
Prior to September 1, 2015, the Fund paid the Investment Manager an annual fee for advisory services under an Investment Management Services Agreement and a separate annual fee for administrative and accounting services under an Administrative Services Agreement. For the period from May 1, 2015 through August 31, 2015, the investment advisory services fee paid to the Investment Manager was $2,278,923, and the administrative services fee paid to the Investment Manager was $407,596.
Other Expenses
Other expenses are for, among other things, miscellaneous expenses of the Fund or the Board, including payments to Board Services Corp., a company providing limited administrative services to the Fund and the Board. That company's expenses include boardroom and office expense, employee compensation, employee health and retirement benefits, and certain other expenses. For the year ended April 30, 2016, other expenses paid by the Fund to this company were $3,558.
Compensation of Board Members
Board members, who are not officers or employees of the Investment Manager or Ameriprise Financial, are compensated for their services to the Fund as disclosed in the Statement of Operations. Under a Deferred
Compensation Plan (the Plan), these Board members may elect to defer payment of up to 100% of their compensation. Deferred amounts are treated as though equivalent dollar amounts had been invested in shares of certain funds managed by the Investment Manager. The Fund's liability for these amounts is adjusted for market value changes and remains in the Fund until distributed in accordance with the Plan. All amounts payable under the Plan constitute a general unsecured obligation of the Fund.
Transactions with Affiliates
For the year ended April 30, 2016, the Fund engaged in purchase and/or sale transactions with affiliates and/or accounts that have a common investment manager (or affiliated investment managers), common directors/trustees, and/or common officers. Those purchase and sale transactions complied with provisions of Rule 17a-7 under the 1940 Act and were $15,189,450 and $0, respectively.
Transfer Agency Fees
Under a Transfer and Dividend Disbursing Agent Agreement, Columbia Management Investment Services Corp. (the Transfer Agent), an affiliate of the Investment Manager and a wholly-owned subsidiary of Ameriprise Financial, is responsible for providing transfer agency services to the Fund. The Transfer Agent has contracted with Boston Financial Data Services (BFDS) to serve as sub-transfer agent.
The Transfer Agent receives a monthly transfer agency fee based on the number or the average value of accounts, depending on the type of account. In addition, the Transfer Agent also receives sub-transfer agency fees based on a percentage of the average aggregate value of the Fund's shares maintained in omnibus accounts (other than omnibus accounts for which American Enterprise Investment Services Inc. is the broker of record or accounts where the beneficial shareholder is a customer of Ameriprise Financial Services, Inc., for which the Transfer Agent receives a per account fee). The Transfer Agent pays the fees of BFDS for services as sub-transfer agent and is not entitled to reimbursement for such fees from the Fund (with the exception of out-of-pocket fees).
The Transfer Agent also receives compensation from the Fund for various shareholder services and reimbursements for certain out-of-pocket fees. Total transfer agency fees for Class R5 shares are subject to
Annual Report 2016
38
COLUMBIA SHORT TERM MUNICIPAL BOND FUND
NOTES TO FINANCIAL STATEMENTS (continued)
April 30, 2016
an annual limitation of not more than 0.05% of the average daily net assets attributable to Class R5 shares.
For the year ended April 30, 2016, the Fund's effective transfer agency fee rates as a percentage of average daily net assets of each class were as follows:
Class A | | | 0.20 | % | |
Class B | | | 0.20 | | |
Class C | | | 0.20 | | |
Class R4 | | | 0.21 | | |
Class R5 | | | 0.05 | | |
Class Z | | | 0.20 | | |
An annual minimum account balance fee of $20 may apply to certain accounts with a value below the applicable share class's initial minimum investment requirements to reduce the impact of small accounts on transfer agency fees. These minimum account balance fees are remitted to the Fund and recorded as part of expense reductions in the Statement of Operations. For the year ended April 30, 2016, these minimum account balance fees reduced total expenses of the Fund by $20.
Distribution and Service Fees
The Fund has an agreement with Columbia Management Investment Distributors, Inc. (the Distributor), an affiliate of the Investment Manager and a wholly-owned subsidiary of Ameriprise Financial, for distribution and shareholder services. The Board has approved, and the Fund has adopted, distribution and shareholder service plans (the Plans) applicable to certain share classes, which set the distribution and service fees for the Fund. These fees are calculated daily and are intended to compensate the Distributor and/or eligible selling and/or servicing agents for selling shares of the Fund and providing services to investors.
Under the Plans, the Fund pays a monthly combined distribution and service fee to the Distributor at the maximum annual rate of 0.25% of the average daily net assets attributable to Class A shares of the Fund. Also under the Plans, the Fund pays a monthly service fee at the maximum annual rate of 0.25% of the average daily net assets attributable to Class B and Class C shares of the Fund and a monthly distribution fee at the maximum annual rate of 0.75% of the average daily net assets attributable to Class B and Class C shares of the Fund, respectively.
Sales Charges
Sales charges, including front-end charges and CDSCs, received by the Distributor for distributing Fund shares
were $34,450 for Class A and $403 for Class C shares for the year ended April 30, 2016.
Expenses Waived/Reimbursed by the Investment Manager and its Affiliates
The Investment Manager and certain of its affiliates have contractually agreed to waive fees and/or reimburse expenses (excluding certain fees and expenses described below) for the periods disclosed below, unless sooner terminated at the sole discretion of the Board, so that the Fund's net operating expenses, after giving effect to fees waived/expenses reimbursed and any balance credits and/or overdraft charges from the Fund's custodian, do not exceed the following annual rates as a percentage of the class' average daily net assets:
| | | September 1, 2015
through
August 31, 2016 | | Prior to
September 1, 2015 | |
Class A | | | 0.72 | % | | | 0.73 | % | |
Class B | | | 1.47 | | | | 1.48 | | |
Class C | | | 1.47 | | | | 1.48 | | |
Class R4 | | | 0.47 | | | | 0.48 | | |
Class R5 | | | 0.36 | | | | 0.38 | | |
Class Z | | | 0.47 | | | | 0.48 | | |
Under the agreement governing these fee waivers and/or expense reimbursement arrangements, the following fees and expenses are excluded from the waiver/reimbursement commitment, and therefore will be paid by the Fund, if applicable: taxes (including foreign transaction taxes), expenses associated with investments in affiliated and non-affiliated pooled investment vehicles (including mutual funds and exchange-traded funds), transaction costs and brokerage commissions, costs related to any securities lending program, dividend and interest expenses associated with securities sold short, inverse floater program fees and expenses, transaction charges and interest on borrowed money, interest, extraordinary expenses and any other expenses the exclusion of which is specifically approved by the Board. This agreement may be modified or amended only with approval from the Investment Manager, certain of its affiliates and the Fund. Any fees waived and/or expenses reimbursed under the expense reimbursement arrangements described above are not recoverable by the Investment Manager or its affiliates in future periods.
Note 4. Federal Tax Information
The timing and character of income and capital gain distributions are determined in accordance with income
Annual Report 2016
39
COLUMBIA SHORT TERM MUNICIPAL BOND FUND
NOTES TO FINANCIAL STATEMENTS (continued)
April 30, 2016
tax regulations, which may differ from GAAP because of temporary or permanent book to tax differences.
At April 30, 2016, these differences are primarily due to differing treatment for capital loss carryforwards, Trustees' deferred compensation and distributions. To the extent these differences are permanent, reclassifications are made among the components of the Fund's net assets in the Statement of Assets and Liabilities. Temporary differences do not require reclassifications.
The Fund did not have any permanent differences; therefore, no reclassifications were made to the Statement of Assets and Liabilities.
The tax character of distributions paid during the years indicated was as follows:
Year Ended April 30, | | 2016 | | 2015 | |
Ordinary income | | $ | — | | | $ | 314 | | |
Tax-exempt income | | | 15,923,994 | | | | 20,594,302 | | |
Total | | | 15,923,994 | | | | 20,594,616 | | |
Short-term capital gain distributions, if any, are considered ordinary income distributions for tax purposes.
At April 30, 2016, the components of distributable earnings on a tax basis were as follows:
Undistributed tax-exempt income | | $ | 3,772,910 | | |
Capital loss carryforwards | | | (944,833 | ) | |
Net unrealized appreciation | | | 8,746,502 | | |
At April 30, 2016, the cost of investments for federal income tax purposes was $1,770,372,272 and the aggregate gross unrealized appreciation and depreciation based on that cost was:
Unrealized appreciation | | $ | 9,913,818 | | |
Unrealized depreciation | | | (1,167,316 | ) | |
Net unrealized appreciation | | $ | 8,746,502 | | |
The following capital loss carryforwards, determined at April 30, 2016, may be available to reduce taxable income arising from future net realized gains on investments, if any, to the extent permitted by the Internal Revenue Code:
Year of Expiration | | Amount ($) | |
2018 | | | 602,849 | | |
No expiration — short-term | | | 341,984 | | |
Total | | | 944,833 | | |
Capital loss carryforwards with no expiration are required to be utilized prior to any capital losses which carry an expiration date. As a result of this ordering rule, capital loss carryforwards which carry an expiration date may be more likely to expire unused.
For the year ended April 30, 2016, $192,325 of capital loss carryforward was utilized.
Management of the Fund has concluded that there are no significant uncertain tax positions in the Fund that would require recognition in the financial statements. However, management's conclusion may be subject to review and adjustment at a later date based on factors including, but not limited to, new tax laws, regulations, and administrative interpretations (including relevant court decisions). Generally, the Fund's federal tax returns for the prior three fiscal years remain subject to examination by the Internal Revenue Service.
Note 5. Portfolio Information
The cost of purchases and proceeds from sales of securities, excluding short-term investments and derivatives, if any, aggregated to $539,463,186 and $679,439,793, respectively, for the year ended April 30, 2016. The amount of purchase and sale activity impacts the portfolio turnover rate reported in the Financial Highlights.
Note 6. Line of Credit
The Fund has access to a revolving credit facility whereby the Fund may borrow for the temporary funding of shareholder redemptions or for other temporary or emergency purposes. Effective December 8, 2015, Citibank, N.A. and HSBC Bank USA, N.A. joined JPMorgan Chase Bank, N.A. (JPMorgan) as lead of a syndicate of banks under the credit facility, which is a collective agreement between the Fund and certain other funds managed by the Investment Manager, severally and not jointly, that permits collective borrowings up to $1 billion. Interest is charged to each participating fund based on its borrowings at a rate equal to the higher of (i) the overnight federal funds rate plus 1.00% or (ii) the one-month LIBOR rate plus 1.00%. Each borrowing under the credit facility matures no later than 60 days after the date of borrowing. The Fund also pays a commitment fee equal to its pro rata share of the amount of the credit facility at a rate of 0.15% per annum. The commitment fee is included in other expenses in the Statement of Operations. Prior to December 8, 2015, JPMorgan was the sole lead bank under the credit facility agreement that permitted borrowings up to $550 million under the
Annual Report 2016
40
COLUMBIA SHORT TERM MUNICIPAL BOND FUND
NOTES TO FINANCIAL STATEMENTS (continued)
April 30, 2016
same terms and interest rates as described above with the exception of the commitment fee which was charged at a rate of 0.075% per annum.
The Fund had no borrowings during the year ended April 30, 2016.
Note 7. Significant Risks
Shareholder Concentration Risk
At April 30, 2016, one unaffiliated shareholder of record owned 84.9% of the outstanding shares of the Fund in one or more accounts. The Fund has no knowledge about whether any portion of those shares was owned beneficially. Subscription and redemption activity by concentrated accounts may have a significant effect on the operations of the Fund. In the case of a large redemption, the Fund may be forced to sell investments at inopportune times, including its liquid or more liquid positions, resulting in Fund losses and the Fund holding a higher percentage of less liquid or illiquid securities. Large redemptions could result in decreased economies of scale and increased operating expenses for non-redeeming Fund shareholders.
Credit Risk
Credit risk is the risk that the value of debt securities in the Fund's portfolio may decline because the issuer may default and fail to pay interest or repay principal when due. Rating agencies assign credit ratings to debt securities to indicate their credit risk. Lower rated or unrated debt securities held by the Fund may present increased credit risk as compared to higher-rated debt securities.
Interest Rate Risk
Interest rate risk is the risk of losses attributable to changes in interest rates. In general, if prevailing interest rates rise, the values of debt securities tend to fall, and if interest rates fall, the values of debt securities tend to rise. Actions by governments and central banking authorities can result in increases in interest rates. Increasing interest rates may negatively affect the value of debt securities held by the Fund, resulting in a negative impact on the Fund's performance and net asset value per share. In general, the longer the maturity or duration of a debt security, the greater its sensitivity to changes in interest rates.
Liquidity Risk
Liquidity risk is the risk associated with a lack of marketability of investments which may make it difficult to sell the investment at a desirable time or price. Changing regulatory, market or other conditions or environments
(for example, the interest rate or credit environments) may adversely affect the liquidity of the Fund's investments. The Fund may have to accept a lower selling price for the holding, sell other investments, or forego another, more appealing investment opportunity. Generally, the less liquid the market at the time the Fund sells a portfolio investment, the greater the risk of loss or decline of value to the Fund. A less liquid market can lead to an increase in Fund redemptions, which may negatively impact Fund performance and net asset value per share, including, for example, if the Fund is forced to sell securities in a down market.
Municipal Securities Risk
Securities issued by a particular state and its instrumentalities are subject to the risk of unfavorable developments in such state. A municipal security can be significantly affected by adverse tax, legislative, regulatory, demographic or political changes as well as changes in a particular state's (state and its instrumentalities') financial, economic or other condition and prospects.
New York Geographic Concentration Risk
To the extent that the Fund concentrates its investments in the municipal securities issued by a particular state and political sub-divisions of the state, the Fund will be particularly affected by political and economic conditions and developments in such state in which it invests. The Fund may, therefore, have a greater risk than that of a municipal bond fund which is more geographically diversified. The value of the municipal securities owned by the Fund also may be adversely affected by future changes in federal or state income tax laws.
Note 8. Subsequent Events
Management has evaluated the events and transactions that have occurred through the date the financial statements were issued and noted no items requiring adjustment of the financial statements or additional disclosure.
Note 9. Information Regarding Pending and Settled Legal Proceedings
In December 2005, without admitting or denying the allegations, American Express Financial Corporation (AEFC, which is now known as Ameriprise Financial, Inc. (Ameriprise Financial)) entered into settlement agreements with the Securities and Exchange Commission (SEC) and Minnesota Department of Commerce (MDOC) related to market timing activities. As
Annual Report 2016
41
COLUMBIA SHORT TERM MUNICIPAL BOND FUND
NOTES TO FINANCIAL STATEMENTS (continued)
April 30, 2016
a result, AEFC was censured and ordered to cease and desist from committing or causing any violations of certain provisions of the Investment Advisers Act of 1940, the Investment Company Act of 1940, and various Minnesota laws. AEFC agreed to pay disgorgement of $10 million and civil money penalties of $7 million. AEFC also agreed to retain an independent distribution consultant to assist in developing a plan for distribution of all disgorgement and civil penalties ordered by the SEC in accordance with various undertakings detailed at http://www.sec.gov/litigation/admin/ia-2451.pdf. Ameriprise Financial and its affiliates have cooperated with the SEC and the MDOC in these legal proceedings, and have made regular reports to the Funds' Boards of Trustees.
Ameriprise Financial and certain of its affiliates have historically been involved in a number of legal, arbitration and regulatory proceedings, including routine litigation, class actions, and governmental actions, concerning matters arising in connection with the conduct of their business activities. Ameriprise Financial believes that the Funds are not currently the subject of, and that neither Ameriprise Financial nor any of its affiliates are the subject of, any pending legal, arbitration or regulatory proceedings that are likely to have a material adverse effect on the Funds or the ability of Ameriprise Financial or its affiliates to perform under their contracts with the Funds. Ameriprise Financial is required to make quarterly (10-Q), annual (10-K) and, as necessary, 8-K filings with the SEC on legal and regulatory matters that relate to Ameriprise Financial and its affiliates. Copies of these filings may be obtained by accessing the SEC website at www.sec.gov.
There can be no assurance that these matters, or the adverse publicity associated with them, will not result in increased fund redemptions, reduced sale of fund shares or other adverse consequences to the Funds. Further, although we believe proceedings are not likely to have a material adverse effect on the Funds or the ability of Ameriprise Financial or its affiliates to perform under their contracts with the Funds, these proceedings are subject to uncertainties and, as such, we are unable to estimate the possible loss or range of loss that may result. An adverse outcome in one or more of these proceedings could result in adverse judgments, settlements, fines, penalties or other relief that could have a material adverse effect on the consolidated financial condition or results of operations of Ameriprise Financial.
Annual Report 2016
42
COLUMBIA SHORT TERM MUNICIPAL BOND FUND
REPORT OF INDEPENDENT REGISTERED PUBLIC ACCOUNTING FIRM
To the Trustees of Columbia Funds Series Trust and the Shareholders of
Columbia Short Term Municipal Bond Fund
In our opinion, the accompanying statement of assets and liabilities, including the portfolio of investments, and the related statements of operations and of changes in net assets and the financial highlights present fairly, in all material respects, the financial position of Columbia Short Term Municipal Bond Fund (the "Fund", a series of Columbia Funds Series Trust) at April 30, 2016, and the results of its operations, the changes in its net assets and the financial highlights for each of the periods indicated, in conformity with accounting principles generally accepted in the United States of America. These financial statements and financial highlights (hereafter referred to as "financial statements") are the responsibility of the Fund's management. Our responsibility is to express an opinion on these financial statements based on our audits. We conducted our audits of these financial statements in accordance with the standards of the Public Company Accounting Oversight Board (United States). Those standards require that we plan and perform the audit to obtain reasonable assurance about whether the financial statements are free of material misstatement. An audit includes examining, on a test basis, evidence supporting the amounts and disclosures in the financial statements, assessing the accounting principles used and significant estimates made by management, and evaluating the overall financial statement presentation. We believe that our audits, which included confirmation of securities at April 30, 2016 by correspondence with the custodian and brokers, and the application of alternative auditing procedures where such confirmations had not been received, provide a reasonable basis for our opinion.
PricewaterhouseCoopers LLP
Minneapolis, MN
June 21, 2016
Annual Report 2016
43
COLUMBIA SHORT TERM MUNICIPAL BOND FUND
FEDERAL INCOME TAX INFORMATION
(Unaudited)
The Fund hereby designates the following tax attributes for the fiscal year ended April 30, 2016. Shareholders will be notified in early 2017 of the amounts for use in preparing 2016 income tax returns.
Tax Designations:
| Exempt-Interest Dividends | | | 100.00 | % | |
Exempt-Interest Dividends. The percentage of net investment income distributed during the fiscal year that qualifies as exempt-interest dividends for federal income tax purposes. A portion of the income may be subject to federal alternative minimum tax.
Annual Report 2016
44
COLUMBIA SHORT TERM MUNICIPAL BOND FUND
Shareholders elect the Board that oversees the Fund's operations. The Board appoints officers who are responsible for day-to-day business decisions based on policies set by the Board. The following table provides basic biographical information about the Fund's Trustees, including their principal occupations during the past five years, although specific titles for individuals may have varied over the period. Under current Board policy, members generally may serve through the end of the calendar year in which they reach either the mandatory retirement age established by the Board or the fifteenth anniversary of the first Board meeting they attended as a member of the Board.
Trustees
Independent Trustees
Name,
Address,
Year of Birth | | Position Held With
the Funds and Length of
Service | | Principal Occupation(s)
During the Past Five Years
and Other Relevant
Professional Experience | | Number of
Funds in the
Columbia Funds
Complex
Overseen | | Other Directorships
Held by Trustee During
the Past Five Years | |
Kathleen Blatz
901 S. Marquette Ave.
Minneapolis, MN 55402
1954 | | Trustee since 1/06 for RiverSource Funds and since 6/11 for Nations Funds | | Attorney; specializing in arbitration and mediation; Chief Justice, Minnesota Supreme Court, 1998-2006; Associate Justice, Minnesota Supreme Court, 1996-1998; Fourth Judicial District Court Judge, Hennepin County, 1994-1996; Attorney in private practice and public service, 1984-1993; State Representative, Minnesota House of Representatives, 1979-1993, which included service on the Tax and Financial Institutions and Insurance Committees | | | 120 | | | Trustee, BlueCross BlueShield of Minnesota (Chair of the Business Development Committee) since 2009; Chair of the Robina Foundation since August 2013 | |
Edward J. Boudreau, Jr.
901 S. Marquette Ave. Minneapolis, MN 55402
1944 | | Trustee since 6/11 for RiverSource Funds and since 1/05 for Nations Funds | | Managing Director, E.J. Boudreau & Associates (consulting) since 2000; FINRA Industry Arbitrator, 2002-present; Chairman and Chief Executive Officer, John Hancock Funds (asset management), Chairman and Interested Trustee for open-end and closed-end funds offered by John Hancock, 1989-2000; John Hancock Life Insurance Company, including SVP and Treasurer and SVP Information Technology, 1968-1988 | | | 118 | | | Former Trustee, Boston Museum of Science (Chair of Finance Committee), 1985-2013; former Trustee, BofA Funds Series Trust (11 funds), 2005-2011 | |
Pamela G. Carlton
901 S. Marquette Ave.
Minneapolis, MN 55402
1954 | | Trustee since 7/07 for RiverSource Funds and since 6/11 for Nations Funds | | President, Springboard — Partners in Cross Cultural Leadership (consulting company) since 2003; Managing Director of US Equity Research, JP Morgan Chase, 1999-2003; Director of US Equity Research, Chase Asset Management, 1996-1999; Co-Director Latin America Research, 1993-1996, COO Global Research, 1992-1996, Co-Director of US Research, 1991-1992, Investment Banker, Morgan Stanley, 1982-1991 | | | 120 | | | Trustee, New York Presbyterian Hospital Board (Executive Committee and Chair of Human Resources Committee) since 1996 | |
Annual Report 2016
45
COLUMBIA SHORT TERM MUNICIPAL BOND FUND
TRUSTEES AND OFFICERS (continued)
Independent Trustees (continued)
Name,
Address,
Year of Birth | | Position Held With
the Funds and Length of
Service | | Principal Occupation(s)
During the Past Five Years
and Other Relevant
Professional Experience | | Number of
Funds in the
Columbia Funds
Complex
Overseen | | Other Directorships
Held by Trustee During
the Past Five Years | |
William P. Carmichael
901 S. Marquette Ave. Minneapolis, MN 55402
1943 | | Trustee since 6/11 for RiverSource Funds and since 2003 for Nations Funds; Chair of the Board from 1/14-11/15 | | Retired; Co-founder, The Succession Fund (provides exit strategies to owners of privately held companies), 1998-2007; Adjunct Professor of Finance, Kelley School of Business, Indiana University, 1993-2007; Senior Vice President, Sara Lee Corporation, 1991-1993; Senior Vice President and Chief Financial Officer, Beatrice Foods Company, 1984-1990; Vice President, Esmark, Inc., 1973-1984; Associate, Price Waterhouse, 1968-1972 | | | 120 | | | Director, The Finish Line (athletic shoes and apparel) since July 2003; Director, International Textile Corp. since 2012; Director, hhgregg since May, 2015; former Director, Cobra Electronics Corporation (electronic equipment manufacturer), 1994-August 2014; former Director, Spectrum Brands, Inc. (consumer products), 2002-2009; former Director, Simmons Company (bedding), 2004-2010; former Trustee, BofA Funds Series Trust (11 funds), 2009-2011; former Director, McMoRan Exploration Company (oil and gas exploration and development), 2010-2013 | |
Patricia M. Flynn
901 S. Marquette Ave. Minneapolis, MN 55402
1950 | | Trustee since 11/04 for RiverSource Funds and since 6/11 for Nations Funds | | Trustee Professor of Economics and Management, Bentley University since 1976 (also teaches and conducts research on corporate governance); Dean, McCallum Graduate School of Business, Bentley University, 1992-2002 | | | 120 | | | Trustee, MA Taxpayers Foundation since 1997; Board of Governors, Innovation Institute, MA Technology Collaborative since 2010 | |
William A. Hawkins
901 S. Marquette Ave.
Minneapolis, MN 55402
1942 | | Chair of the Board since 11/15; Trustee since 6/11 for RiverSource Funds and since 1/05 for Nations Funds | | Managing Director, Overton Partners (financial consulting) since August 2010; President and Chief Executive Officer, California General Bank, N.A., January 2008-August 2010; Operation Hope, COO, 2004-2007; IndyMac Bancorp, President, CBG, 1999-2003; American General Bank, President, 1997-1999; Griffin Financial Services, CEO, 1981-1997; The Griffin Funds, CEO, 1992-1998 | | | 120 | | | Former Trustee, BofA Funds Series Trust (11 funds), 2009-2015 | |
R. Glenn Hilliard
901 S. Marquette Ave. Minneapolis, MN 55402
1943 | | Trustee since 6/11 for RiverSource Funds and since 1/05 for Nations Funds | | Chairman and Chief Executive Officer, Hilliard Group LLC (investing and consulting) since April 2003; Non-Executive Director & Chairman, CNO Financial Group, Inc. (insurance), 2003-2011; Chair & CEO, ING Americas, 1996-2003 | | | 118 | | | Chairman, BofA Funds Series Trust (11 funds); former Director, CNO Financial Group, Inc. (insurance), 2003-2011 | |
Annual Report 2016
46
COLUMBIA SHORT TERM MUNICIPAL BOND FUND
TRUSTEES AND OFFICERS (continued)
Independent Trustees (continued)
Name,
Address,
Year of Birth | | Position Held With
the Funds and Length of
Service | | Principal Occupation(s)
During the Past Five Years
and Other Relevant
Professional Experience | | Number of
Funds in the
Columbia Funds
Complex
Overseen | | Other Directorships
Held by Trustee During
the Past Five Years | |
Catherine James Paglia
901 S. Marquette Ave.
Minneapolis, MN 55402
1952 | | Trustee since 11/04 for RiverSource Funds and since 6/11 for Nations Funds | | Director, Enterprise Asset Management, Inc. (private real estate and asset management company) since September 1998; Managing Director and Partner, Interlaken Capital, Inc., 1989-1997; Managing Director, Morgan Stanley, 1982-1989; Vice President, Investment Banking, 1980-1982, Associate, Investment Banking, 1976-1980, Dean Witter Reynolds, Inc. | | | 120 | | | Director, Valmont Industries, Inc. (irrigation systems manufacturer) since 2012; Trustee, Carleton College (on the Investment Committee); Trustee, Carnegie Endowment for International Peace (on the Investment Committee) | |
Leroy C. Richie
901 S. Marquette Ave.
Minneapolis, MN 55402
1941 | | Trustee since 2000 for Seligman Funds, since 11/08 for RiverSource Funds and since 6/11 for Nations Funds | | Counsel, Lewis & Munday, P.C. (law firm) since 2004; Vice President and General Counsel, Automotive Legal Affairs, Chrysler Corporation, 1993-1997 | | | 118 | | | Lead Outside Director, Infinity Resources, Inc. (oil and gas exploration and production) since 1994; Lead Outside Director, Digital Ally, Inc. (digital imaging) since September 2005; Trustee, Marygrove College (Chair of Finance Committee) since 2007; former Director, OGE Energy Corp. (energy and energy services), 2007-2014 | |
Minor M. Shaw
901 S. Marquette Ave.
Minneapolis, MN 55402
1947 | | Trustee since 6/11 for RiverSource Funds and since 2003 for Nations Funds | | President, Micco LLC (private investments) since 2011; President, Micco Corp. (family investment business), 1998-2011 | | | 120 | | | Director, Piedmont Natural Gas; Director, BlueCross BlueShield of South Carolina since April 2008; Chair of the Duke Endowment; Director, National Association of Corporate Directors, Carolinas Chapter since 2013; Chair of Greenville — Spartanburg Airport Commission; former Trustee, BofA Funds Series Trust (11 funds), 2003-2011 | |
Alison Taunton-Rigby
901 S. Marquette Ave.
Minneapolis, MN 55402
1944 | | Trustee since 11/02 for RiverSource Funds and since 6/11 for Nations Funds | | Managing Director, Forester Biotech (consulting), 2001-2003; Chief Executive Officer and Director, RiboNovix, Inc., (biotechnology), 2003-2010; President and Chief Executive Officer of CMT Inc., 2001-2003; Aquila Biopharmaceuticals Inc., 1996-2000; Cambridge Biotech Corporation, 1995-1996; Mitotix Inc., 1993-1994 | | | 120 | | | Director, Abt Associates
(government contractor) since 2001; Director, Boston Children's Hospital since 2002; Director, Healthways, Inc. (health and well-being solutions) since 2005; Director, ICI Mutual Insurance Company, since 2011 | |
Annual Report 2016
47
COLUMBIA SHORT TERM MUNICIPAL BOND FUND
TRUSTEES AND OFFICERS (continued)
Interested Trustee Not Affiliated with Investment Manager*
Name,
Address,
Year of Birth | | Position Held With
Funds and Length of
Service | | Principal Occupation(s)
During Past Five Years
and Other Relevant
Professional Experience | | Number of
Funds in the
Fund Family
Overseen by
Board Member | | Other Present or Past
Directorships/
Trusteeships
(Within Past 5 Years) | |
Anthony M. Santomero
901 S. Marquette Ave.
Minneapolis, MN 55402
1946 | | Trustee since 6/11 for RiverSource Funds and since 1/08 for Nations Funds | | Richard K. Mellon Professor Emeritus of Finance, The Wharton School, University of Pennsylvania since 2002; Senior Advisor, McKinsey & Company (consulting), 2006-2008; President, Federal Reserve Bank of Philadelphia, 2000-2006; Professor of Finance, The Wharton School, University of Pennsylvania, 1972-2002 | | | 118 | | | Trustee, Penn Mutual Life Insurance Company since March 2008; Director, Renaissance Reinsurance Ltd. since May 2008; Director, Citigroup Inc. since 2009; Director, Citibank, N.A. since 2009; former Trustee, BofA Funds Series Trust (11 funds), 2008-2011 | |
* Dr. Santomero is not an affiliated person of the Investment Manager or Ameriprise Financial. However, he is currently deemed by the Funds to be an "interested person" (as defined in the 1940 Act) of the Funds because he serves as a Director of Citigroup Inc. and Citibank, N.A., companies that may directly or through subsidiaries and affiliates engage from time-to-time in brokerage execution, principal transactions and lending relationships with the Funds or accounts advised/managed by the Investment Manager.
Annual Report 2016
48
COLUMBIA SHORT TERM MUNICIPAL BOND FUND
TRUSTEES AND OFFICERS (continued)
Interested Trustee Affiliated with Investment Manager*
Name,
Address,
Year of Birth | | Position Held With
the Funds and Length of
Service | | Principal Occupation(s)
During Past Five Years
and Other Relevant
Professional Experience | | Number of
Funds in the
Columbia Funds
Complex
Overseen | | Other Directorships
Held by Trustee During
the Past Five Years | |
William F. Truscott
c/o Columbia Management
Investment Advisers, LLC, 225 Franklin St.
Boston, MA 02110
1960 | | Trustee since 11/01 for RiverSource Funds and since 6/11 for Nations Funds; Senior Vice President since 2002 for RiverSource Funds and since 5/10 for Nations Funds | | Chairman of the Board and President, Columbia Management Investment Advisers, LLC since May 2010 and February 2012, respectively (previously President and Chief Investment Officer, 2001-April 2010); Chief Executive Officer, Global Asset Management, Ameriprise Financial, Inc. since September 2012 (previously Chief Executive Officer, U.S. Asset Management & President, Annuities, May 2010-September 2012 and President — U.S. Asset Management and Chief Investment Officer, 2005-April 2010); Director and Chief Executive Officer, Columbia Management Investment Distributors, Inc. since May 2010 and February 2012, respectively (previously Chairman of the Board and Chief Executive Officer, 2006-April 2010); Chairman of the Board and Chief Executive Officer, RiverSource Distributors, Inc. since 2006; Director, Threadneedle Asset Management Holdings, SARL since 2014; President and Chief Executive Officer, Ameriprise Certificate Company, 2006-August 2012. | | | 178 | | | Chairman of the Board, Columbia Management Investment Advisers, LLC since May 2010; Director, Columbia Management Investment Distributors, Inc. since May 2010; Former Director, Ameriprise Certificate Company, 2006-January 2013 | |
* Interested person (as defined under the 1940 Act) by reason of being an officer, director, security holder and/or employee of the Investment Manager or Ameriprise Financial.
The Statement of Additional Information has additional information about the Fund's Board members and is available, without charge, upon request by calling 800.345.6611; contacting your financial intermediary; or visiting columbiathreadneedle.com/us.
Annual Report 2016
49
COLUMBIA SHORT TERM MUNICIPAL BOND FUND
TRUSTEES AND OFFICERS (continued)
The Board has appointed officers who are responsible for day-to-day business decisions based on policies it has established. The officers serve at the pleasure of the Board. The following table provides basic information about the Officers of the Fund, including principal occupations during the past five years, although their specific titles may have varied over the period. In addition to Mr. Truscott, who is Senior Vice President, the Fund's other officers are:
Fund Officers
Name,
Address and
Year of Birth | | Position and Year
First Appointed to
Position for any Fund
in the Columbia
Funds Complex or a
Predecessor Thereof | |
Principal Occupation(s) During Past Five Years | |
Christopher O. Petersen
5228 Ameriprise
Financial Center
Minneapolis, MN 55474
Born 1970 | | President and Principal Executive Officer (2015) | | Vice President and Lead Chief Counsel, Ameriprise Financial, Inc. since January 2015 (previously, Vice President and Chief Counsel January 2010-December 2014; and Vice President and Group Counsel or Counsel 2004-January 2010); officer of Columbia Funds and affiliated funds since 2007. | |
Michael G. Clarke
225 Franklin Street
Boston, MA 02110
Born 1969 | | Treasurer (2011), Chief Financial Officer (2009) and Chief Accounting Officer (2015) | | Vice President — Mutual Fund Administration, Columbia Management Investment Advisers, LLC, since May 2010; Managing Director of Fund Administration, Columbia Management Advisors, LLC, September 2004-April 2010; senior officer of Columbia Funds and affiliated funds since 2002. | |
Paul B. Goucher
100 Park Avenue
New York, NY 10017
Born 1968 | | Senior Vice President (2011), Chief Legal Officer (2015) and Assistant Secretary (2008) | | Vice President and Lead Chief Counsel, Ameriprise Financial, Inc. since November 2008 and January 2013, respectively (previously Chief Counsel, January 2010-January 2013 and Group Counsel, November 2008-January 2010). | |
Thomas P. McGuire
225 Franklin Street
Boston, MA 02110
Born 1972 | | Senior Vice President and Chief Compliance Officer (2012) | | Vice President — Asset Management Compliance, Ameriprise Financial, Inc., since May 2010; Chief Compliance Officer, Ameriprise Certificate Company since September 2010; Compliance Executive, Bank of America, 2005-April 2010. | |
Colin Moore
225 Franklin Street
Boston, MA 02110
Born 1958 | | Senior Vice President (2010) | | Executive Vice President and Global Chief Investment Officer, Ameriprise Financial, Inc., since July 2013; Director and Global Chief Investment Officer, Columbia Management Investment Advisers, LLC since May 2010; Manager, Managing Director and Chief Investment Officer, Columbia Management Advisors, LLC, 2007-April 2010. | |
Michael E. DeFao
225 Franklin Street
Boston, MA 02110
Born 1968 | | Vice President (2011) and Assistant Secretary (2010) | | Vice President and Chief Counsel, Ameriprise Financial, Inc. since May 2010; Associate General Counsel, Bank of America, 2005-April 2010. | |
Amy Johnson
5228 Ameriprise
Financial Center
Minneapolis, MN 55474
Born 1965 | | Vice President (2006) | | Managing Director and Chief Operating Officer, Columbia Management Investment Advisers, LLC since May 2010 (previously Chief Administrative Officer, 2009-April 2010, and Vice President — Asset Management and Trust Company Services, 2006-2009). | |
Lyn Kephart-Strong
5228 Ameriprise
Financial Center
Minneapolis, MN 55474
Born 1960 | | Vice President (2015) | | President, Columbia Management Investment Services Corp. since October 2014; Vice President & Resolution Officer, Ameriprise Trust Company since August 2009; President, RiverSource Service Corporation 2004-2010. | |
Ryan C. Larrenaga
225 Franklin Street
Boston, MA 02110
Born 1970 | | Vice President and Secretary (2015) | | Vice President and Group Counsel, Ameriprise Financial, Inc. since August 2011 (previously, Counsel from May 2010 to August 2011); Assistant General Counsel, Bank of America, 2005-April 2010; officer of Columbia Funds and affiliated funds since 2005. | |
Annual Report 2016
50
COLUMBIA SHORT TERM MUNICIPAL BOND FUND
IMPORTANT INFORMATION ABOUT THIS REPORT
Each fund mails one shareholder report to each shareholder address. If you would like more than one report, please call shareholder services at 800.345.6611 and additional reports will be sent to you.
The policy of the Board is to vote the proxies of the companies in which each fund holds investments consistent with the procedures as stated in the Statement of Additional Information (SAI). You may obtain a copy of the SAI without charge by calling 800.345.6611; contacting your financial intermediary; visiting columbiathreadneedle.com/us; or searching the website of the Securities and Exchange Commission (SEC) at sec.gov. Information regarding how each fund voted proxies relating to portfolio securities is filed with the SEC by August 31st for the most recent 12-month period ending June 30th of that year, and is available without charge by visiting columbiathreadneedle.com/us, or searching the website of the SEC at sec.gov.
Each fund files a complete schedule of portfolio holdings with the SEC for the first and third quarters of each fiscal year on Form N-Q. Each fund's Form N-Q is available on the SEC's website at sec.gov and may be reviewed and copied at the SEC's Public Reference Room in Washington, D.C. Information on the operation of the Public Reference Room may be obtained by calling 800.SEC.0330. Each fund's complete schedule of portfolio holdings, as filed on Form N-Q, can also be obtained without charge, upon request, by calling 800.345.6611.
Annual Report 2016
51
Columbia Short Term Municipal Bond Fund
P.O. Box 8081
Boston, MA 02266-8081

This information is for use with concurrent or prior delivery of a fund prospectus. Please read and consider the investment objectives, risks, charges and expenses for any fund carefully before investing. For a prospectus and summary prospectus, which contains this and other important information about the Fund, go to columbiathreadneedle.com/us. The Fund is distributed by Columbia Management Investment Distributors, Inc., member FINRA, and managed by Columbia Management Investment Advisers, LLC.
Columbia Threadneedle Investments (Columbia Threadneedle) is the global brand name of the Columbia and Threadneedle group of companies.
All rights reserved. Columbia Management Investment Distributors, Inc., 225 Franklin Street, Boston, MA 02110-2804
© 2016 Columbia Management Investment Advisers, LLC.
columbiathreadneedle.com/us
ANN223_04_F01_(06/16)

ANNUAL REPORT
April 30, 2016

COLUMBIA AMT-FREE NORTH CAROLINA INTERMEDIATE MUNI BOND FUND

 Dear Shareholders,
Volatility comes with the territory for long-term investors. Some investors instinctively want to pull out of the market or sell underperforming investments at the first sign of increased volatility or perhaps even as soon as they perceive it on the horizon. But taking yourself out of the market could mean losing out on potential opportunities, and putting your longer-term investment goals at risk.
Cumulative return is not just about achieving high returns when markets are going up; it's also about remaining invested and minimizing losses during weak or volatile markets so that you can participate on the upside. Developing a deeper understanding of the various risks your portfolio is subject to can help you balance these risks.
Diversification is critical in seeking to achieve that balance. We believe that most portfolios could be more effectively diversified either by introducing holdings with performance profiles unrelated to existing holdings (like alternative products) or by rebalancing existing holdings with an eye toward risk allocation. Over time, distributing risk more evenly may produce a more pronounced diversification benefit and may improve portfolio efficiency. We believe market volatility can create significant opportunities and, in fact, these periods may be some of the very best times to invest.
With this in mind, I thought it important to highlight excerpts from a piece written by Colin Moore, Global Chief Investment Officer, in which he touches on some of these issues emphasizing the importance of a properly constructed portfolio in seeking to effectively manage volatility and to achieve consistency of returns. I encourage you to read the article in its entirety. To access the full article and for other insights on current market, please visit blog.columbiathreadneedleus.com/latest-perspectives.
You need investments that are designed to help you ease the impact of volatile market environments and keep the savings you have worked tirelessly to amass. Columbia Threadneedle Investments provides investment solutions to help you tackle financial challenges and achieve your desired outcome.
Best regards,

Christopher O. Petersen
President, Columbia Funds
Excerpts from:
Taking the scare out of the volatility bogeyman
By Colin Moore, Global Chief Investment Officer
Colin Moore is the global chief investment officer for Columbia Threadneedle Investments. His responsibilities include ensuring that a disciplined investment process is in place across all asset classes, including equity and fixed income. Mr. Moore joined one of the Columbia Threadneedle Investments legacy firms in 2002 as head of equity and was also head of fixed income and liquidity strategies from 2009 – 2010.

n In today's low growth, higher volatility world, the emphasis is shifting from maximization of returns to consistency of returns.
PRESIDENT'S MESSAGE (continued)
n Portfolios should represent the behavioral risk-return tradeoff of investors, remembering that they won't stay invested to realize the return if we get the risk tolerance wrong.
n Holding long-term savings in cash to avoid volatility (the financial equivalent of hiding under the sheets) is detrimental to achieving long-term goals.
According to Wikipedia, "The bogeyman is a common allusion to a mythical creature in many cultures used to control behavior. This monster has no specific appearance, and conceptions about it can vary drastically from household to household within the same community; in many cases he has no set appearance in the mind of an adult or child, but is simply a non-specific embodiment of terror." Different cultures have different names and physical representations for the bogeyman, and investors are no different. We have terrible monsters that we fear may destroy our portfolios, and we call one of the scariest of them volatility.
While the bogeyman is mythical (I hope!), volatility is real and can cause serious damage. To understand why investors have such a hard time coping with volatility, we first need to define three cognitive biases at work in today's investment environment:
1) Recency bias — something that has recently come to the forefront of our attention, regardless of how long established it is, suddenly seems to appear with improbable frequency.
2) Negativity bias — we tend to have a greater recall of unpleasant memories than positive memories.
3) Loss aversion — our dissatisfaction with losing money tends to be greater than our satisfaction with making money.
The level of volatility varies dramatically, and so does investor fear and panic selling — waxing when volatility rises, waning when it falls. Recent studies have pointed to demographics as an important driver of panic selling. The theory is that as people get closer to retirement, the prospects of a large (20% – 30%) loss in financial assets can have a much more pronounced effect on their sense of well-being. Wealth preservation instincts kick in much more quickly than for younger (and typically less wealthy) savers.
The reality is that there is little opportunity for return without volatility. Therefore, the bogeyman effect of holding long-term savings in cash to avoid volatility (the financial equivalent of hiding under the sheets) is detrimental to achieving long-term goals. This effect tends to be more pronounced during the episodic spikes in volatility. The significant spike in volatility in 2008 and 2009 led to significant withdrawals from long-term investment funds over the same period. Less pronounced effects can also be seen when comparing 2001 – 2003 and 2011 – 2012. Conversely, flows picked up when volatility returned to "normal" levels. Investor behavior of this type is consistent with the three behavioral biases.
I believe average volatility will be higher over the next 10 years than the last 10 years and episodic spikes will increase in frequency because sustainable economic growth will be structurally lower and geopolitical risk higher than any time since World War II. Low growth creates uncertainty while loss aversion will make investors fear that we are one economic mishap or geopolitical event away from no growth or recession. The result will be higher volatility on average. Negativity bias will tend to exacerbate "spike" reactions to event-driven geopolitical news, and the volatility bogeyman will appear more often. Assuming the behavioral biases continue, investor returns are likely to be very disappointing regardless of the total return generated by financial markets due to the bogeyman effect.
To mitigate this effect, we need to focus on portfolio construction and an improved understanding of diversification. I accept that equities are likely to offer the highest return over the next 10 years, but they also offer the highest volatility. Many portfolio construction optimization tools use historical average volatility, which is likely to underestimate the volatility investors will face. The bogeyman emerges when individual asset class volatility spikes and cross correlations rise, the combination of which increases overall portfolio volatility far beyond expectation. Diversification is meant to protect investors against volatility, but what's the point of owning lots of investments if the volatility bogeyman has not been properly estimated?
Most importantly, portfolios should be constructed to properly represent the behavioral risk-return tradeoff of investors, remembering that they won't stay invested to realize the return if we get the risk tolerance wrong. In a low growth, higher volatility world, the emphasis is shifting to return consistency rather than return maximization,
PRESIDENT'S MESSAGE (continued)
and investors are best served through investment approaches that appreciate that distinction. Even though it's a permanent feature of financial markets, volatility is less likely to be the bogeyman we all fear if portfolios are constructed with this understanding.
Please visit blog.columbiathreadneedleus.com/latest-perspectives to read the entire article.
Investors should consider the investment objectives, risks, charges and expenses of a mutual fund carefully before investing. For a free prospectus and summary prospectus, which contains this and other important information about a fund, visit columbiathreadneedle.com/us. The prospectus should be read carefully before investing.
The views expressed are as of April 2016, may change as market or other conditions change, and may differ from views expressed by other Columbia Management Investment Advisers, LLC (CMIA) associates or affiliates. Actual investments or investment decisions made by CMIA and its affiliates, whether for its own account or on behalf of clients, will not necessarily reflect the views expressed. This information is not intended to provide investment advice and does not account for individual investor circumstances. Investment decisions should always be made based on an investor's specific financial needs, objectives, goals, time horizon and risk tolerance. Asset classes described may not be suitable for all investors.
Past performance does not guarantee future results, and no forecast should be considered a guarantee either. Since economic and market conditions change frequently, there can be no assurance that the trends described here will continue or that the forecasts are accurate.
Diversification does not guarantee a profit or protect against loss.
Columbia Funds are distributed by Columbia Management Investment Distributors, Inc., member FINRA, and managed by Columbia Management Investment Advisers, LLC.
© 2016 Columbia Management Investment Advisers, LLC. All rights reserved
COLUMBIA AMT-FREE NORTH CAROLINA INTERMEDIATE MUNI BOND FUND
Performance Overview | | | 2 | | |
Manager Discussion of Fund Performance | | | 4 | | |
Understanding Your Fund's Expenses | | | 6 | | |
Portfolio of Investments | | | 7 | | |
Statement of Assets and Liabilities | | | 14 | | |
Statement of Operations | | | 16 | | |
Statement of Changes in Net Assets | | | 17 | | |
Financial Highlights | | | 19 | | |
Notes to Financial Statements | | | 24 | | |
Report of Independent Registered Public Accounting Firm | | | 31 | | |
Federal Income Tax Information | | | 32 | | |
Trustees and Officers | | | 33 | | |
Important Information About This Report | | | 39 | | |
Fund Investment Manager
Columbia Management Investment
Advisers, LLC
225 Franklin Street
Boston, MA 02110
Fund Distributor
Columbia Management Investment
Distributors, Inc.
225 Franklin Street
Boston, MA 02110
Fund Transfer Agent
Columbia Management Investment
Services Corp.
P.O. Box 8081
Boston, MA 02266-8081
For more information about any of the funds, please visit columbiathreadneedle.com/us or call 800.345.6611. Customer Service Representatives are available to answer your questions Monday through Friday from 8 a.m. to 7 p.m. Eastern time.
The views expressed in this report reflect the current views of the respective parties. These views are not guarantees of future performance and involve certain risks, uncertainties and assumptions that are difficult to predict, so actual outcomes and results may differ significantly from the views expressed. These views are subject to change at any time based upon economic, market or other conditions and the respective parties disclaim any responsibility to update such views. These views may not be relied on as investment advice and, because investment decisions for a Columbia fund are based on numerous factors, may not be relied on as an indication of trading intent on behalf of any particular Columbia fund. References to specific securities should not be construed as a recommendation or investment advice.
COLUMBIA AMT-FREE NORTH CAROLINA INTERMEDIATE MUNI BOND FUND
Performance Summary
n Columbia AMT-Free North Carolina Intermediate Muni Bond Fund (the Fund) Class A shares returned 3.77% excluding sales charges for the 12-month period that ended April 30, 2016. Class Z shares of the Fund returned 4.03% for the same time period.
n The Fund underperformed its benchmark, the Barclays 3-15 Year Blend Municipal Bond Index, which returned 4.86% during the 12-month period.
n The Fund's underperformance stemmed from its yield curve and duration positioning.
Average Annual Total Returns (%) (for period ended April 30, 2016)
| | | Inception | | 1 Year | | 5 Years | | 10 Years | |
Class A | | 12/14/92 | | | | | | | | | | | | | |
Excluding sales charges | | | | | | | 3.77 | | | | 3.56 | | | | 3.54 | | |
Including sales charges | | | | | | | 0.63 | | | | 2.93 | | | | 3.23 | | |
Class B | | 06/07/93 | | | | | | | | | | | | | |
Excluding sales charges | | | | | | | 3.00 | | | | 2.75 | | | | 2.76 | | |
Including sales charges | | | | | | | 0.00 | | | | 2.75 | | | | 2.76 | | |
Class C | | 12/16/92 | | | | | | | | | | | | | |
Excluding sales charges | | | | | | | 3.00 | | | | 2.78 | | | | 2.77 | | |
Including sales charges | | | | | | | 2.00 | | | | 2.78 | | | | 2.77 | | |
Class R4* | | 03/19/13 | | | 4.03 | | | | 3.81 | | | | 3.79 | | |
Class Z | | 12/11/92 | | | 4.03 | | | | 3.81 | | | | 3.79 | | |
Barclays 3-15 Year Blend Municipal Bond Index | | | | | | | 4.86 | | | | 4.61 | | | | 4.89 | | |
Returns for Class A are shown with and without the maximum initial sales charge of 3.00%. Returns for Class B are shown with and without the applicable contingent deferred sales charge (CDSC) of 3.00% in the first year, declining to 1.00% in the fourth year and eliminated thereafter. Returns for Class C are shown with and without the 1.00% CDSC for the first year only. The Fund's other classes are not subject to sales charges and have limited eligibility. Please see the Fund's prospectus for details. Performance for different share classes will vary based on differences in sales charges and fees associated with each class. All results shown assume reinvestment of distributions during the period. Returns do not reflect the deduction of taxes that a shareholder may pay on Fund distributions or on the redemption of Fund shares. Performance results reflect the effect of any fee waivers or reimbursements of Fund expenses by Columbia Management Investment Advisers, LLC and/or any of its affiliates. Absent these fee waivers or expense reimbursement arrangements, performance results would have been lower.
The performance information shown represents past performance and is not a guarantee of future results. The investment return and principal value of your investment will fluctuate so that your shares, when redeemed, may be worth more or less than their original cost. Current performance may be lower or higher than the performance information shown. You may obtain performance information current to the most recent month-end by contacting your financial intermediary, visiting columbiathreadneedle.com/us or calling 800.345.6611.
*The returns shown for periods prior to the share class inception date (including returns for the Life of the Fund, if shown, which are since Fund inception) include the returns of the Fund's oldest share class. These returns are adjusted to reflect any higher class-related operating expenses of the newer share classes, as applicable. Please visit columbiathreadneedle.com/us/investment-products/mutual-funds/appended-performance for more information.
The Barclays 3-15 Year Blend Municipal Bond Index is an unmanaged index that tracks the performance of municipal bonds issued after December 31, 1990, with remaining maturities between 2 and 17 years and at least $7 million in principal amount outstanding.
Indices are not available for investment, are not professionally managed and do not reflect sales charges, fees, brokerage commissions, taxes or other expenses of investing. Securities in the Fund may not match those in an index.
Annual Report 2016
2
COLUMBIA AMT-FREE NORTH CAROLINA INTERMEDIATE MUNI BOND FUND
PERFORMANCE OVERVIEW (continued)
Performance of a Hypothetical $10,000 Investment (May 1, 2006 – April 30, 2016)
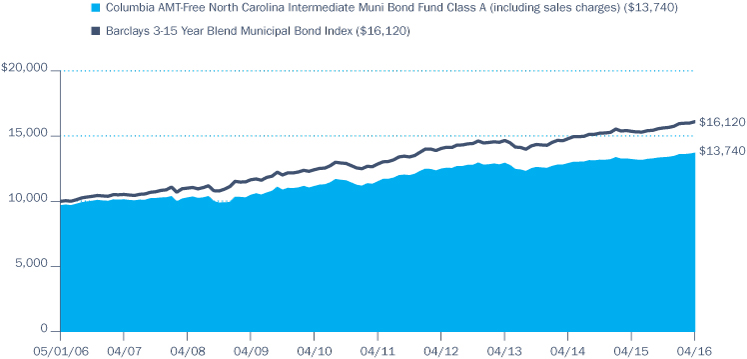
The chart above shows the change in value of a hypothetical $10,000 investment in Class A shares of Columbia AMT-Free North Carolina Intermediate Muni Bond Fund during the stated time period, and does not reflect the deduction of taxes that a shareholder may pay on Fund distributions or on the redemption of Fund shares.
Annual Report 2016
3
COLUMBIA AMT-FREE NORTH CAROLINA INTERMEDIATE MUNI BOND FUND
MANAGER DISCUSSION OF FUND PERFORMANCE
Portfolio Management
Brian McGreevy
Quality Breakdown (%)
(at April 30, 2016) | |
AAA rating | | | 16.5 | | |
AA rating | | | 50.8 | | |
A rating | | | 23.3 | | |
BBB rating | | | 4.6 | | |
Not rated | | | 4.8 | | |
Total | | | 100.0 | | |
Percentages indicated are based upon total fixed income investments (excluding Money Market Funds).
Bond ratings apply to the underlying holdings of the Fund and not the Fund itself and are divided into categories ranging from highest to lowest credit quality, determined by using the middle rating of Moody's, S&P and Fitch, after dropping the highest and lowest available ratings. When ratings are available from only two rating agencies, the lower rating is used. When a rating is available from only one rating agency, that rating is used. When a bond is not rated by any rating agency, it is designated as "Not rated." Credit quality ratings assigned by a rating agency are subjective opinions, not statements of fact, and are subject to change, including daily. The ratings assigned by credit rating agencies are but one of the considerations that the Investment Manager and/or Fund's subadviser incorporates into its credit analysis process, along with such other issuer-specific factors as cash flows, capital structure and leverage ratios, ability to de-leverage (repay) through free cash flow, quality of management, market positioning and access to capital, as well as such security-specific factors as the terms of the security (e.g., interest rate and time to maturity) and the amount and type of any collateral.
For the 12-month period that ended April 30, 2016, the Fund's Class A shares returned 3.77% excluding sales charges. Class Z shares of the Fund returned 4.03%. The Fund underperformed its benchmark, the Barclays 3-15 Year Blend Municipal Bond Index, which returned 4.86% for the same time period. The Fund's underperformance stemmed from its yield curve and duration positioning.
Market Overview
The U.S. municipal bond market produced a positive return and outperformed U.S. Treasuries during the reporting period, thanks in part to a highly favorable balance of supply and demand. Mutual fund cash flows provided a steady source of support for the market, with positive inflows for 30 consecutive weeks as of the close of the period. In the interval from October 2015 through April 2016 alone, inflows into municipal funds totaled over $27 billion. Insurance companies and banks were active buyers, as well. Supply was also strong, but almost half of the new issuance came from refunding deals — rather than new issuance — as issuers sought to take advantage of the cost savings from refinancing older, higher coupon debt. The refinancing activity added an additional layer of demand since many of the refundings were of currently callable bonds issued in 2005 or 2006. As a result, many investors who were taken out of older bonds reinvested the proceeds back into the market.
The strength of state and local finances throughout the United States, with the notable exceptions of New Jersey, Illinois, the City of Chicago, and Puerto Rico, further aided the performance of municipal bonds. Longer term securities generally provided superior returns versus shorter term issues, reflecting the latter category's low nominal yields. Lower quality bonds outpaced their higher quality counterparts, as investors' hearty appetite for risk fueled a continued reach for yield.
North Carolina's Market Underperformed
North Carolina's economy remained on a firm footing during the period, with growth above both the U.S. and regional averages. The combination of a rising number of start-ups and the expansion of existing business led to healthy wage gains, which in turn boosted consumer spending. Rising investments in both the public and private sectors, together with the state's strong demographics and the sizable contribution from the technology sector, provided a robust underpinning for economic growth. Despite these positive factors, North Carolina's municipal bond market underperformed during the period. The State's debt is highly rated, a relative headwind at a time in which investors displayed a preference for lower quality issues.
Contributors and Detractors
The Fund's underperformance stemmed from its yield curve positioning — specifically, its overweight allocations to shorter maturities and cash — as well as its shorter duration (lower interest-rate sensitivity) versus the benchmark. While we sought to maintain a neutral duration, solid cash flows and several refundings of existing holdings caused the Fund's duration to be shorter than our desired objective at times.
Annual Report 2016
4
COLUMBIA AMT-FREE NORTH CAROLINA INTERMEDIATE MUNI BOND FUND
MANAGER DISCUSSION OF FUND PERFORMANCE (continued)
However, the Fund's longer dated bonds outperformed the corresponding holdings within the benchmark due to their longer call structures.
The Fund's positions in higher rated bonds detracted given the outperformance of lower quality securities. On the plus side, the Fund's holdings in single-A rated debt outpaced the benchmark components and therefore aided results. The Fund had a heavy weighting in pre-refunded bonds due to substantial refunding activity in North Carolina, which was a drag on performance since these bonds are shorter in maturity and of higher quality. Electric revenue and hospital bonds aided returns, as both areas strongly outperformed. Education was the best sector for the Fund, while the water and sewer sector generated below- average results.
Fund Positioning
The Fund was fairly active over the period, purchasing bonds with maturities between 10 and 15 years in order to keep the Fund's average maturity in line with the benchmark. In addition, we increased the portfolio's weightings in the education, utility and local general-obligation (GO) sectors. Since most of the local GOs were higher rated issues, the overall quality of the portfolio increased during the course of the year. We maintained the Fund's higher quality tilt, as there were limited opportunities add to the A and BBB areas in the size and quantity we desired.
Investment Risks
Fixed-income securities present issuer default risk. The Fund invests substantially in municipal securities and will be affected by tax, legislative, regulatory, demographic or political changes, as well as changes impacting a state's financial, economic or other conditions. A relatively small number of tax-exempt issuers may necessitate the Fund investing more heavily in a single issuer and, therefore, be more exposed to the risk of loss than a fund that invests more broadly. The value of the Fund's portfolio may be more volatile than a more geographically diversified fund. Prepayment and extension risk exists as a loan, bond or other investment may be called, prepaid or redeemed before maturity and that similar yielding investments may not be available for purchase. A rise in interest rates may result in a price decline of fixed-income instruments held by the Fund, negatively impacting its performance and NAV. Falling rates may result in the Fund investing in lower yielding debt instruments, lowering the Fund's income and yield. These risks may be heightened for longer maturity and duration securities. Non-investment-grade (high-yield or junk) securities present greater price volatility and more risk to principal and income than higher rated securities. Market risk may affect a single issuer, sector of the economy, industry or the market as a whole. Federal and state tax rules apply to capital gain distributions and any gains or losses on sales. Income may be subject to state or local taxes. Liquidity risk is associated with the difficulty of selling underlying investments at a desirable time or price. See the Fund's prospectus for information on these and other risks.
Annual Report 2016
5
COLUMBIA AMT-FREE NORTH CAROLINA INTERMEDIATE MUNI BOND FUND
UNDERSTANDING YOUR FUND'S EXPENSES
(Unaudited)
As an investor, you incur two types of costs. There are transaction costs, which generally include sales charges on purchases and may include redemption fees. There are also ongoing costs, which generally include management fees, distribution and/or service fees, and other fund expenses. The following information is intended to help you understand your ongoing costs (in dollars) of investing in the Fund and to help you compare these costs with the ongoing costs of investing in other mutual funds.
Analyzing Your Fund's Expenses
To illustrate these ongoing costs, we have provided examples and calculated the expenses paid by investors in each share class of the Fund during the period. The actual and hypothetical information in the table is based on an initial investment of $1,000 at the beginning of the period indicated and held for the entire period. Expense information is calculated two ways and each method provides you with different information. The amount listed in the "Actual" column is calculated using the Fund's actual operating expenses and total return for the period. You may use the Actual information, together with the amount invested, to estimate the expenses that you paid over the period. Simply divide your account value by $1,000 (for example, an $8,600 account value divided by $1,000 = 8.6), then multiply the results by the expenses paid during the period under the "Actual" column. The amount listed in the "Hypothetical" column assumes a 5% annual rate of return before expenses (which is not the Fund's actual return) and then applies the Fund's actual expense ratio for the period to the hypothetical return. You should not use the hypothetical account values and expenses to estimate either your actual account balance at the end of the period or the expenses you paid during the period. See "Compare With Other Funds" below for details on how to use the hypothetical data.
Compare With Other Funds
Since all mutual funds are required to include the same hypothetical calculations about expenses in shareholder reports, you can use this information to compare the ongoing cost of investing in the Fund with other funds. To do so, compare the hypothetical example with the 5% hypothetical examples that appear in the shareholder reports of other funds. As you compare hypothetical examples of other funds, it is important to note that hypothetical examples are meant to highlight the ongoing costs of investing in a fund only and do not reflect any transaction costs, such as sales charges, or redemption or exchange fees. Therefore, the hypothetical calculations are useful in comparing ongoing costs only, and will not help you determine the relative total costs of owning different funds. If transaction costs were included in these calculations, your costs would be higher.
November 1, 2015 – April 30, 2016
| | | Account Value at the Beginning
of the Period ($) | | Account Value at the End of the
Period ($) | | Expenses Paid During the
Period ($) | | Fund's Annualized
Expense Ratio (%) | |
| | | Actual | | Hypothetical | | Actual | | Hypothetical | | Actual | | Hypothetical | | Actual | |
Class A | | | 1,000.00 | | | | 1,000.00 | | | | 1,026.50 | | | | 1,020.84 | | | | 4.08 | | | | 4.07 | | | | 0.81 | | |
Class B | | | 1,000.00 | | | | 1,000.00 | | | | 1,021.70 | | | | 1,017.11 | | | | 7.84 | | | | 7.82 | | | | 1.56 | | |
Class C | | | 1,000.00 | | | | 1,000.00 | | | | 1,022.70 | | | | 1,017.11 | | | | 7.85 | | | | 7.82 | | | | 1.56 | | |
Class R4 | | | 1,000.00 | | | | 1,000.00 | | | | 1,027.80 | | | | 1,022.08 | | | | 2.82 | | | | 2.82 | | | | 0.56 | | |
Class Z | | | 1,000.00 | | | | 1,000.00 | | | | 1,026.80 | | | | 1,022.08 | | | | 2.82 | | | | 2.82 | | | | 0.56 | | |
Expenses paid during the period are equal to the annualized expense ratio for each class as indicated above, multiplied by the average account value over the period and then multiplied by the number of days in the Fund's most recent fiscal half year and divided by 366.
Expenses do not include fees and expenses incurred indirectly by the Fund from its investment in underlying funds, including affiliated and non-affiliated pooled investment vehicles, such as mutual funds and exchange-traded funds.
Had Columbia Management Investment Advisers, LLC and/or certain of its affiliates not waived/reimbursed certain fees and expenses, account value at the end of the period would have been reduced.
Annual Report 2016
6
COLUMBIA AMT-FREE NORTH CAROLINA INTERMEDIATE MUNI BOND FUND
PORTFOLIO OF INVESTMENTS
April 30, 2016
(Percentages represent value of investments compared to net assets)
Municipal Bonds 94.7%
Issue
Description | | Coupon
Rate | | Principal
Amount ($) | |
Value ($) | |
AIRPORT 1.5% | |
Raleigh Durham Airport Authority
Refunding Revenue Bonds
Series 2010A
05/01/23 | | | 5.000 | % | | | 3,000,000 | | | | 3,467,040 | | |
HIGHER EDUCATION 8.2% | |
Appalachian State University
Refunding Revenue Bonds
Series 2016B(a)
10/01/20 | | | 5.000 | % | | | 1,380,000 | | | | 1,588,973 | | |
East Carolina University
Revenue Bonds
General
Series 2014A
10/01/31 | | | 5.000 | % | | | 1,900,000 | | | | 2,304,453 | | |
Series 2016A
10/01/30 | | | 4.000 | % | | | 2,000,000 | | | | 2,279,120 | | |
North Carolina Agricultural & Technical State University
Refunding Revenue Bonds
General Purpose
Series 2015A
10/01/32 | | | 5.000 | % | | | 2,000,000 | | | | 2,408,080 | | |
North Carolina Capital Facilities Finance Agency
Revenue Bonds
Meredith College
Series 2008
06/01/31 | | | 6.000 | % | | | 1,000,000 | | | | 1,069,930 | | |
Wake Forest University
Series 2009
01/01/26 | | | 5.000 | % | | | 1,000,000 | | | | 1,104,360 | | |
University of North Carolina System
Revenue Bonds
General Trust Indenture
Series 2009B
10/01/17 | | | 4.250 | % | | | 1,000,000 | | | | 1,047,810 | | |
Unrefunded Revenue Bonds
Series 2008A (AGM)
10/01/22 | | | 5.000 | % | | | 360,000 | | | | 394,351 | | |
University of North Carolina at Charlotte (The)
Revenue Bonds
Series 2014
04/01/30 | | | 5.000 | % | | | 1,000,000 | | | | 1,201,730 | | |
University of North Carolina at Greensboro
Refunding Revenue Bonds
Series 2016
04/01/29 | | | 5.000 | % | | | 390,000 | | | | 485,484 | | |
04/01/30 | | | 5.000 | % | | | 250,000 | | | | 309,073 | | |
Revenue Bonds
General
Series 2014
04/01/32 | | | 5.000 | % | | | 2,000,000 | | | | 2,387,420 | | |
Municipal Bonds (continued)
Issue
Description | | Coupon
Rate | | Principal
Amount ($) | |
Value ($) | |
University of North Carolina at Wilmington
Refunding Revenue Bonds
Series 2015
06/01/29 | | | 5.000 | % | | | 2,000,000 | | | | 2,385,100 | | |
Total | | | | | | | 18,965,884 | | |
HOSPITAL 11.6% | |
Charlotte-Mecklenburg Hospital Authority (The)
Refunding Revenue Bonds
Carolinas Health Care System Group
Series 2007A (AGM)
01/15/20 | | | 5.000 | % | | | 1,550,000 | | | | 1,597,011 | | |
Series 2008A
01/15/24 | | | 5.250 | % | | | 2,000,000 | | | | 2,128,600 | | |
Series 2009A
01/15/21 | | | 5.000 | % | | | 1,000,000 | | | | 1,109,840 | | |
North Carolina Medical Care Commission
Refunding Revenue Bonds
Mission Health System, Inc.
Series 2015
10/01/36 | | | 5.000 | % | | | 2,515,000 | | | | 2,995,642 | | |
Novant Health Obligation Group
Series 2013
11/01/24 | | | 5.000 | % | | | 530,000 | | | | 634,511 | | |
Southeastern Regional Medical Center
Series 2012
06/01/26 | | | 5.000 | % | | | 1,000,000 | | | | 1,137,750 | | |
Vidant Health
Series 2012A
06/01/25 | | | 5.000 | % | | | 1,500,000 | | | | 1,749,345 | | |
06/01/36 | | | 5.000 | % | | | 1,445,000 | | | | 1,619,224 | | |
Series 2015
06/01/30 | | | 5.000 | % | | | 1,000,000 | | | | 1,198,510 | | |
WakeMed
Series 2012A
10/01/31 | | | 5.000 | % | | | 2,000,000 | | | | 2,330,720 | | |
Revenue Bonds
Duke University Health System
Series 2012A
06/01/32 | | | 5.000 | % | | | 3,635,000 | | | | 4,266,290 | | |
Moses Cone Health System
Series 2011
10/01/20 | | | 5.000 | % | | | 3,215,000 | | | | 3,715,157 | | |
Rex Hospital, Inc.
Series 2015A
07/01/32 | | | 5.000 | % | | | 1,000,000 | | | | 1,184,830 | | |
Northern Hospital District of Surry County
Revenue Bonds
Series 2008
10/01/24 | | | 5.750 | % | | | 1,000,000 | | | | 1,065,070 | | |
Total | | | | | | | 26,732,500 | | |
The accompanying Notes to Financial Statements are an integral part of this statement.
Annual Report 2016
7
COLUMBIA AMT-FREE NORTH CAROLINA INTERMEDIATE MUNI BOND FUND
PORTFOLIO OF INVESTMENTS (continued)
April 30, 2016
Municipal Bonds (continued)
Issue
Description | | Coupon
Rate | | Principal
Amount ($) | |
Value ($) | |
JOINT POWER AUTHORITY 2.1% | |
North Carolina Municipal Power Agency No. 1
Refunding Revenue Bonds
Series 2015A
01/01/31 | | | 5.000 | % | | | 2,000,000 | | | | 2,452,220 | | |
Series 2016A
01/01/28 | | | 5.000 | % | | | 1,500,000 | | | | 1,891,815 | | |
Unrefunded Revenue Bonds
Series 2009A
01/01/25 | | | 5.000 | % | | | 430,000 | | | | 474,393 | | |
Total | | | | | | | 4,818,428 | | |
LOCAL APPROPRIATION 17.5% | |
Appalachian State University
Refunding Revenue Bonds
Series 2016A
10/01/26 | | | 5.000 | % | | | 325,000 | | | | 416,306 | | |
City of Kannapolis
Revenue Bonds
Series 2014
04/01/31 | | | 5.000 | % | | | 1,365,000 | | | | 1,616,392 | | |
City of Monroe
Refunding Revenue Bonds
Series 2016
03/01/33 | | | 4.000 | % | | | 800,000 | | | | 882,760 | | |
03/01/35 | | | 5.000 | % | | | 1,000,000 | | | | 1,203,280 | | |
City of Raleigh
Refunding Limited Obligation Revenue Bonds
Series 2016
02/01/31 | | | 4.000 | % | | | 385,000 | | | | 441,891 | | |
02/01/32 | | | 4.000 | % | | | 775,000 | | | | 883,702 | | |
City of Wilmington
Refunding Certificate of Participation
Series 2006A
06/01/17 | | | 5.000 | % | | | 1,005,000 | | | | 1,009,251 | | |
Refunding Revenue Bonds
Series 2014A
06/01/28 | | | 5.000 | % | | | 500,000 | | | | 608,210 | | |
City of Winston-Salem
Refunding Revenue Bonds
Series 2014C
06/01/29 | | | 5.000 | % | | | 750,000 | | | | 916,740 | | |
County of Brunswick
Revenue Bonds
Series 2015A
06/01/28 | | | 5.000 | % | | | 250,000 | | | | 307,493 | | |
06/01/29 | | | 5.000 | % | | | 250,000 | | | | 305,380 | | |
County of Buncombe
Revenue Bonds
Series 2012
06/01/28 | | | 5.000 | % | | | 500,000 | | | | 595,830 | | |
06/01/29 | | | 5.000 | % | | | 1,000,000 | | | | 1,187,090 | | |
Series 2014A
06/01/32 | | | 5.000 | % | | | 1,635,000 | | | | 1,973,854 | | |
Municipal Bonds (continued)
Issue
Description | | Coupon
Rate | | Principal
Amount ($) | |
Value ($) | |
County of Cabarru
Revenue Bonds
Installment Financing Contract
Series 2016
04/01/28 | | | 5.000 | % | | | 1,000,000 | | | | 1,255,200 | | |
County of Catawba
Revenue Bonds
Series 2011
10/01/22 | | | 5.000 | % | | | 400,000 | | | | 474,472 | | |
County of Cumberland
Refunding Certificate of Participation
Improvement Projects
Series 2009-B1
12/01/21 | | | 5.000 | % | | | 2,775,000 | | | | 3,150,235 | | |
County of Davidson
Revenue Bonds
Series 2016
06/01/29 | | | 5.000 | % | | | 1,000,000 | | | | 1,253,460 | | |
County of Duplin
Revenue Bonds
Series 2016
04/01/34 | | | 5.000 | % | | | 1,000,000 | | | | 1,196,120 | | |
County of Henderson
Certificate of Participation
Series 2006A (AMBAC)
06/01/16 | | | 5.000 | % | | | 1,060,000 | | | | 1,064,226 | | |
County of Johnston
Revenue Bonds
Series 2014
06/01/28 | | | 5.000 | % | | | 1,000,000 | | | | 1,234,710 | | |
County of Martin
Refunding Revenue Bonds
Water & Sewer District
Series 2014
06/01/30 | | | 4.000 | % | | | 730,000 | | | | 804,993 | | |
County of Moore
Revenue Bonds
Series 2010
06/01/24 | | | 5.000 | % | | | 1,635,000 | | | | 1,857,278 | | |
County of New Hanover
Refunding Certificate of Participation
Series 2005B (AMBAC)
09/01/18 | | | 5.000 | % | | | 1,755,000 | | | | 1,920,426 | | |
County of Onslow
Revenue Bonds
Series 2015
06/01/27 | | | 4.000 | % | | | 405,000 | | | | 463,859 | | |
County of Pender
Revenue Bonds
Series 2015
04/01/27 | | | 5.000 | % | | | 1,165,000 | | | | 1,436,701 | | |
04/01/28 | | | 5.000 | % | | | 1,290,000 | | | | 1,577,051 | | |
The accompanying Notes to Financial Statements are an integral part of this statement.
Annual Report 2016
8
COLUMBIA AMT-FREE NORTH CAROLINA INTERMEDIATE MUNI BOND FUND
PORTFOLIO OF INVESTMENTS (continued)
April 30, 2016
Municipal Bonds (continued)
Issue
Description | | Coupon
Rate | | Principal
Amount ($) | |
Value ($) | |
County of Randolph
Refunding Revenue Bonds
Series 2013C
10/01/26 | | | 5.000 | % | | | 1,500,000 | | | | 1,894,830 | | |
County of Union
Refunding Revenue Bonds
Series 2012
12/01/24 | | | 5.000 | % | | | 1,715,000 | | | | 2,184,035 | | |
County of Wilkes
Refunding Revenue Bonds
Series 2015
06/01/27 | | | 5.000 | % | | | 500,000 | | | | 613,410 | | |
06/01/29 | | | 5.000 | % | | | 500,000 | | | | 604,825 | | |
Durham Capital Financing Corp.
Refunding Revenue Bonds
Series 2016
12/01/28 | | | 5.000 | % | | | 630,000 | | | | 799,955 | | |
Durham Capital Financing Corp
Refunding Revenue Bonds
Series 2016
12/01/29 | | | 5.000 | % | | | 1,100,000 | | | | 1,389,696 | | |
Jacksonville Public Facilities Corp.
Limited Obligation Revenue Bonds
Series 2012
04/01/26 | | | 5.000 | % | | | 1,075,000 | | | | 1,270,575 | | |
Orange County Public Facilities Co.
Revenue Bonds
Series 2012
10/01/24 | | | 5.000 | % | | | 1,325,000 | | | | 1,615,837 | | |
Total | | | | | | | 40,410,073 | | |
LOCAL GENERAL OBLIGATION 5.9% | |
City of Raleigh
Refunding Unlimited General Obligation Bonds
Series 2016A
09/01/27 | | | 5.000 | % | | | 2,000,000 | | | | 2,652,900 | | |
City of Winston-Salem
Unlimited General Obligation Bonds
Series 2016B
06/01/23 | | | 5.000 | % | | | 1,935,000 | | | | 2,424,052 | | |
County of Henderson
Revenue Bonds
Series 2015
10/01/30 | | | 5.000 | % | | | 500,000 | | | | 618,065 | | |
County of New Hanover
Unlimited General Obligation Refunding Bonds
Series 2009
12/01/17 | | | 5.000 | % | | | 1,170,000 | | | | 1,250,086 | | |
County of New Hanover(a)
Refunding Unlimited General Obligation Bonds
Series 2016
08/01/27 | | | 4.000 | % | | | 820,000 | | | | 978,711 | | |
Municipal Bonds (continued)
Issue
Description | | Coupon
Rate | | Principal
Amount ($) | |
Value ($) | |
County of Stanly
Unlimited General Obligation Refunding Bonds
Series 2010
02/01/18 | | | 4.000 | % | | | 1,500,000 | | | | 1,587,915 | | |
County of Wake
Unlimited General Obligation Refunding Bonds
Series 2010C
03/01/22 | | | 5.000 | % | | | 2,000,000 | | | | 2,439,780 | | |
Unrefunded Unlimited General Obligation Public Improvement Bonds
Series 2009
03/01/20 | | | 5.000 | % | | | 1,565,000 | | | | 1,754,146 | | |
Total | | | | | | | 13,705,655 | | |
MULTI-FAMILY 1.7% | |
North Carolina Capital Facilities Finance Agency
Refunding Revenue Bonds
North Carolina A&T University Foundation Project
Series 2015A
06/01/28 | | | 5.000 | % | | | 1,000,000 | | | | 1,169,900 | | |
Western Carolina University
Refunding Limited Obligation Revenue Bonds
Student Housing
Series 2016 (AGM)
06/01/27 | | | 5.000 | % | | | 500,000 | | | | 623,225 | | |
06/01/28 | | | 5.000 | % | | | 1,000,000 | | | | 1,236,690 | | |
06/01/29 | | | 5.000 | % | | | 800,000 | | | | 983,232 | | |
Total | | | | | | | 4,013,047 | | |
MUNICIPAL POWER 2.1% | |
City of Concord Utilities Systems
Refunding Revenue Bonds
Series 2009B
12/01/19 | | | 5.000 | % | | | 1,500,000 | | | | 1,712,205 | | |
City of Fayetteville Public Works Commission
Revenue Bonds
Series 2014
03/01/27 | | | 4.000 | % | | | 1,250,000 | | | | 1,439,838 | | |
Greenville Utilities Commission
Revenue Bonds
Series 2008A (AGM)
11/01/18 | | | 5.000 | % | | | 1,040,000 | | | | 1,144,218 | | |
Guam Power Authority
Refunding Revenue Bonds
Series 2012A (AGM)(b)
10/01/24 | | | 5.000 | % | | | 520,000 | | | | 628,727 | | |
Total | | | | | | | 4,924,988 | | |
The accompanying Notes to Financial Statements are an integral part of this statement.
Annual Report 2016
9
COLUMBIA AMT-FREE NORTH CAROLINA INTERMEDIATE MUNI BOND FUND
PORTFOLIO OF INVESTMENTS (continued)
April 30, 2016
Municipal Bonds (continued)
Issue
Description | | Coupon
Rate | | Principal
Amount ($) | |
Value ($) | |
PORTS 1.0% | |
North Carolina State Ports Authority
Revenue Bonds
Senior Lien
Series 2010B
02/01/25 | | | 5.000 | % | | | 2,000,000 | | | | 2,230,180 | | |
REFUNDED/ESCROWED 22.1% | |
Albemarle Hospital Authority
Prerefunded 10/01/17 Revenue Bonds
Series 2007
10/01/21 | | | 5.250 | % | | | 2,000,000 | | | | 2,127,360 | | |
10/01/27 | | | 5.250 | % | | | 1,000,000 | | | | 1,063,680 | | |
City of Winston-Salem Water & Sewer System
Prerefunded 06/01/17 Revenue Bonds
Series 2007A
06/01/19 | | | 5.000 | % | | | 3,000,000 | | | | 3,142,650 | | |
Prerefunded 06/01/19 Revenue Bonds
Series 2009
06/01/23 | | | 5.000 | % | | | 1,000,000 | | | | 1,126,680 | | |
County of Brunswick Enterprise Systems
Prerefunded 04/01/18 Revenue Bonds
Series 2008A
04/01/20 | | | 5.000 | % | | | 1,915,000 | | | | 2,070,594 | | |
04/01/22 | | | 5.000 | % | | | 1,390,000 | | | | 1,502,938 | | |
County of Cabarrus
Prerefunded 06/01/18 Certificates of Participation
Installment Financing Contract
Series 2008C
06/01/22 | | | 5.000 | % | | | 1,545,000 | | | | 1,681,671 | | |
County of Craven
Prerefunded 06/01/17 Certificate of Participation
Series 2007 (NPFGC)
06/01/18 | | | 5.000 | % | | | 2,825,000 | | | | 2,959,950 | | |
06/01/19 | | | 5.000 | % | | | 1,825,000 | | | | 1,912,180 | | |
County of Harnett
Prerefunded 06/01/19 Certificate of Participation
Series 2009
06/01/22 | | | 5.000 | % | | | 1,880,000 | | | | 2,116,936 | | |
County of Mecklenburg
Prerefunded 02/01/19 Certificate of Participation
Series 2009A
02/01/23 | | | 5.000 | % | | | 1,000,000 | | | | 1,114,420 | | |
County of Wake
Prerefunded 03/01/19 Unlimited General Obligation Public Improvement Bonds
Series 2009
03/01/20 | | | 5.000 | % | | | 935,000 | | | | 1,045,096 | | |
Revenue Bonds
Series 1993 Escrowed to Maturity (NPFGC)
10/01/26 | | | 5.125 | % | | | 3,065,000 | | | | 3,597,329 | | |
Municipal Bonds (continued)
Issue
Description | | Coupon
Rate | | Principal
Amount ($) | |
Value ($) | |
North Carolina Eastern Municipal Power Agency
Prerefunded 01/01/18 Revenue Bonds
Series 2008A (AGM)
01/01/19 | | | 5.250 | % | | | 1,500,000 | | | | 1,613,250 | | |
Prerefunded 01/01/19 Revenue Bonds
Series 2009B
01/01/26 | | | 5.000 | % | | | 2,250,000 | | | | 2,499,953 | | |
Prerefunded 01/01/22 Revenue Bonds
Series 1988A
01/01/26 | | | 6.000 | % | | | 1,000,000 | | | | 1,268,710 | | |
Refunding Revenue Bonds
Series 1993B Escrowed to Maturity (NPFGC)
01/01/22 | | | 6.000 | % | | | 1,000,000 | | | | 1,265,560 | | |
Series 1993B Escrowed to Maturity (NPFGC/IBC)
01/01/22 | | | 6.000 | % | | | 3,000,000 | | | | 3,674,400 | | |
North Carolina Infrastructure Finance Corp.
Prerefunded 05/01/17 Certificate of Participation
Capital Improvement
Series 2007A (AGM)
05/01/24 | | | 5.000 | % | | | 2,570,000 | | | | 2,683,646 | | |
North Carolina Medical Care Commission
Prerefunded 11/01/17 Revenue Bonds
Wilson Medical Center
Series 2007
11/01/19 | | | 5.000 | % | | | 3,385,000 | | | | 3,603,468 | | |
North Carolina Municipal Power Agency No. 1
Prerefunded 01/01/18 Revenue Bonds
Series 2008A
01/01/20 | | | 5.250 | % | | | 2,000,000 | | | | 2,150,300 | | |
Prerefunded 01/01/19 Revenue Bonds
Series 2009A
01/01/25 | | | 5.000 | % | | | 1,070,000 | | | | 1,188,866 | | |
Puerto Rico Highways & Transportation Authority
Refunding Revenue Bonds
Series 2003AA Escrowed to Maturity (NPFGC)(b)
07/01/18 | | | 5.500 | % | | | 3,360,000 | | | | 3,692,472 | | |
University of North Carolina System
Prerefunded 10/01/18 Revenue Bonds
Series 2008A (AGM)
10/01/22 | | | 5.000 | % | | | 985,000 | | | | 1,084,662 | | |
10/01/22 | | | 5.000 | % | | | 655,000 | | | | 721,273 | | |
Total | | | | | | | 50,908,044 | | |
RETIREMENT COMMUNITIES 2.4% | |
North Carolina Medical Care Commission
Refunding Revenue Bonds
1st Mortgage-Givens Estates
Series 2007
07/01/16 | | | 5.000 | % | | | 1,000,000 | | | | 1,005,460 | | |
1st Mortgage-United Church
Series 2015A
09/01/30 | | | 4.500 | % | | | 1,000,000 | | | | 999,950 | | |
The accompanying Notes to Financial Statements are an integral part of this statement.
Annual Report 2016
10
COLUMBIA AMT-FREE NORTH CAROLINA INTERMEDIATE MUNI BOND FUND
PORTFOLIO OF INVESTMENTS (continued)
April 30, 2016
Municipal Bonds (continued)
Issue
Description | | Coupon
Rate | | Principal
Amount ($) | |
Value ($) | |
1st Mortgage-United Methodist
Series 2013A
10/01/33 | | | 5.000 | % | | | 1,595,000 | | | | 1,666,488 | | |
Pennybyrn at Maryfield
Series 2015
10/01/25 | | | 5.000 | % | | | 1,000,000 | | | | 1,105,950 | | |
North Carolina Medical Care Commission(a)
Refunding Revenue Bonds
United Methodist Retirement
Series 2016
10/01/30 | | | 5.000 | % | | | 700,000 | | | | 836,577 | | |
Total | | | | | | | 5,614,425 | | |
SPECIAL NON PROPERTY TAX 1.7% | |
Territory of Guam
Revenue Bonds
Series 2011A(b)
01/01/31 | | | 5.000 | % | | | 500,000 | | | | 561,765 | | |
Virgin Islands Public Finance Authority(b)
Refunding Revenue Bonds
Senior Lien
Series 2009B
10/01/25 | | | 5.000 | % | | | 1,500,000 | | | | 1,664,925 | | |
Revenue Bonds
Matching Fund Loan Notes-Senior Lien
Series 2010A
10/01/20 | | | 5.000 | % | | | 1,560,000 | | | | 1,760,273 | | |
Total | | | | | | | 3,986,963 | | |
STATE APPROPRIATED 1.1% | |
State of North Carolina
Refunding Revenue Bonds
Series 2014B
06/01/25 | | | 5.000 | % | | | 2,000,000 | | | | 2,554,600 | | |
TRANSPORTATION 0.5% | |
State of North Carolina
Revenue Bonds
Vehicle - GARVEE
Series 2015
03/01/27 | | | 5.000 | % | | | 900,000 | | | | 1,108,314 | | |
WATER & SEWER 15.3% | |
Cape Fear Public Utility Authority
Revenue Bonds
Series 2008
08/01/20 | | | 5.000 | % | | | 1,000,000 | | | | 1,093,510 | | |
City of Charlotte Water & Sewer System
Revenue Bonds
Series 2008
07/01/23 | | | 5.000 | % | | | 3,000,000 | | | | 3,274,530 | | |
Series 2009B
07/01/25 | | | 5.000 | % | | | 5,835,000 | | | | 6,773,385 | | |
Municipal Bonds (continued)
Issue
Description | | Coupon
Rate | | Principal
Amount ($) | |
Value ($) | |
City of Gastonia Combined Utilities System
Refunding Revenue Bonds
Series 2009
05/01/17 | | | 4.000 | % | | | 1,205,000 | | | | 1,245,813 | | |
Revenue Bonds
Series 2015
05/01/29 | | | 5.000 | % | | | 265,000 | | | | 328,907 | | |
05/01/30 | | | 5.000 | % | | | 660,000 | | | | 812,453 | | |
City of Greensboro Combined Water & Sewer System
Refunding Revenue Bonds
Series 2006
06/01/17 | | | 5.250 | % | | | 2,000,000 | | | | 2,101,000 | | |
06/01/22 | | | 5.250 | % | | | 1,200,000 | | | | 1,484,220 | | |
06/01/23 | | | 5.250 | % | | | 2,000,000 | | | | 2,522,280 | | |
City of High Point Combined Water & Sewer System
Revenue Bonds
Series 2008 (AGM)
11/01/24 | | | 5.000 | % | | | 1,000,000 | | | | 1,103,580 | | |
11/01/25 | | | 5.000 | % | | | 1,000,000 | | | | 1,102,530 | | |
City of Jacksonville Enterprise System
Refunding Revenue Bonds
Series 2016(a)
05/01/28 | | | 5.250 | % | | | 250,000 | | | | 327,303 | | |
City of Raleigh Combined Enterprise System
Refunding Revenue Bonds
Series 2015B
12/01/25 | | | 5.000 | % | | | 1,200,000 | | | | 1,567,224 | | |
Revenue Bonds
Series 2011
03/01/27 | | | 5.000 | % | | | 800,000 | | | | 938,304 | | |
City of Thomasville Combined Enterprise System
Refunding Revenue Bonds
Series 2012
05/01/26 | | | 4.000 | % | | | 860,000 | | | | 952,613 | | |
City of Winston-Salem Water & Sewer System
Refunding Revenue Bonds
Series 2016A
06/01/33 | | | 4.000 | % | | | 2,165,000 | | | | 2,469,551 | | |
County of Brunswick Enterprise Systems
Refunding Revenue Bonds
Series 2015
04/01/26 | | | 5.000 | % | | | 1,070,000 | | | | 1,353,336 | | |
04/01/27 | | | 5.000 | % | | | 1,500,000 | | | | 1,880,310 | | |
County of Union Enterprise System
Revenue Bonds
Series 2015
06/01/29 | | | 5.000 | % | | | 500,000 | | | | 623,940 | | |
Guam Government Waterworks Authority
Revenue Bonds
Series 2016(b)
07/01/36 | | | 5.000 | % | | | 350,000 | | | | 406,959 | | |
The accompanying Notes to Financial Statements are an integral part of this statement.
Annual Report 2016
11
COLUMBIA AMT-FREE NORTH CAROLINA INTERMEDIATE MUNI BOND FUND
PORTFOLIO OF INVESTMENTS (continued)
April 30, 2016
Municipal Bonds (continued)
Issue
Description | | Coupon
Rate | | Principal
Amount ($) | |
Value ($) | |
Onslow Water & Sewer Authority
Refunding Revenue Bonds
Series 2016
12/01/31 | | | 4.000 | % | | | 1,640,000 | | | | 1,851,298 | | |
Town of Fuquay-Varina Combined Utilities System
Revenue Bonds
Series 2016
04/01/30 | | | 5.000 | % | | | 335,000 | | | | 421,601 | | |
04/01/31 | | | 5.000 | % | | | 450,000 | | | | 563,580 | | |
Total | | | | | | | 35,198,227 | | |
Total Municipal Bonds
(Cost: $205,035,400) | | | | | | | 218,638,368 | | |
Total Investments
(Cost: $205,035,400) | | | | | | | 218,638,368 | | |
Other Assets & Liabilities, Net | | | | | | | 12,224,812 | | |
Net Assets | | | | | | | 230,863,180 | | |
Notes to Portfolio of Investments
(a) Security, or a portion thereof, has been purchased on a when-issued or delayed delivery basis.
(b) Municipal obligations include debt obligations issued by or on behalf of territories, possessions, or sovereign nations within the territorial boundaries of the United States. At April 30, 2016, the value of these securities amounted to $8,715,121 or 3.78% of net assets.
Abbreviation Legend
AGM Assured Guaranty Municipal Corporation
AMBAC Ambac Assurance Corporation
IBC Insurance Bond Certificate
NPFGC National Public Finance Guarantee Corporation
Fair Value Measurements
The Fund categorizes its fair value measurements according to a three-level hierarchy that maximizes the use of observable inputs and minimizes the use of unobservable inputs by prioritizing that the most observable input be used when available. Observable inputs are those that market participants would use in pricing an investment based on market data obtained from sources independent of the reporting entity. Unobservable inputs are those that reflect the Fund's assumptions about the information market participants would use in pricing an investment. An investment's level within the fair value hierarchy is based on the lowest level of any input that is deemed significant to the asset's or liability's fair value measurement. The input levels are not necessarily an indication of the risk or liquidity associated with investments at that level. For example, certain U.S. government securities are generally high quality and liquid, however, they are reflected as Level 2 because the inputs used to determine fair value may not always be quoted prices in an active market.
Fair value inputs are summarized in the three broad levels listed below:
> Level 1 — Valuations based on quoted prices for investments in active markets that the Fund has the ability to access at the measurement date (including NAV for open-end mutual funds). Valuation adjustments are not applied to Level 1 investments.
> Level 2 — Valuations based on other significant observable inputs (including quoted prices for similar securities, interest rates, prepayment speeds, credit risks, etc.).
> Level 3 — Valuations based on significant unobservable inputs (including the Fund's own assumptions and judgment in determining the fair value of investments).
The accompanying Notes to Financial Statements are an integral part of this statement.
Annual Report 2016
12
COLUMBIA AMT-FREE NORTH CAROLINA INTERMEDIATE MUNI BOND FUND
PORTFOLIO OF INVESTMENTS (continued)
April 30, 2016
Fair Value Measurements (continued)
Inputs that are used in determining fair value of an investment may include price information, credit data, volatility statistics, and other factors. These inputs can be either observable or unobservable. The availability of observable inputs can vary between investments, and is affected by various factors such as the type of investment, and the volume and level of activity for that investment or similar investments in the marketplace. The inputs will be considered by the Investment Manager, along with any other relevant factors in the calculation of an investment's fair value. The Fund uses prices and inputs that are current as of the measurement date, which may include periods of market dislocations. During these periods, the availability of prices and inputs may be reduced for many investments. This condition could cause an investment to be reclassified between the various levels within the hierarchy.
Investments falling into the Level 3 category are primarily supported by quoted prices from brokers and dealers participating in the market for those investments. However, these may be classified as Level 3 investments due to lack of market transparency and corroboration to support these quoted prices. Additionally, valuation models may be used as the pricing source for any remaining investments classified as Level 3. These models may rely on one or more significant unobservable inputs and/or significant assumptions by the Investment Manager. Inputs used in valuations may include, but are not limited to, financial statement analysis, capital account balances, discount rates and estimated cash flows, and comparable company data.
Under the direction of the Fund's Board of Trustees (the Board), the Investment Manager's Valuation Committee (the Committee) is responsible for overseeing the valuation procedures approved by the Board. The Committee consists of voting and non-voting members from various groups within the Investment Manager's organization, including operations and accounting, trading and investments, compliance, risk management and legal.
The Committee meets at least monthly to review and approve valuation matters, which may include a description of specific valuation determinations, data regarding pricing information received from approved pricing vendors and brokers and the results of Board-approved valuation control policies and procedures (the Policies). The Policies address, among other things, instances when market quotations are or are not readily available, including recommendations of third party pricing vendors and a determination of appropriate pricing methodologies; events that require specific valuation determinations and assessment of fair value techniques; securities with a potential for stale pricing, including those that are illiquid, restricted, or in default; and the effectiveness of third party pricing vendors, including periodic reviews of vendors. The Committee meets more frequently, as needed, to discuss additional valuation matters, which may include the need to review back-testing results, review time-sensitive information or approve related valuation actions. The Committee reports to the Board, with members of the Committee meeting with the Board at each of its regularly scheduled meetings to discuss valuation matters and actions during the period, similar to those described earlier.
For investments categorized as Level 3, the Committee monitors information similar to that described above, which may include: (i) data specific to the issuer or comparable issuers, (ii) general market or specific sector news and (iii) quoted prices and specific or similar security transactions. The Committee considers this data and any changes from prior periods in order to assess the reasonableness of observable and unobservable inputs, any assumptions or internal models used to value those securities and changes in fair value. This data is also used to corroborate, when available, information received from approved pricing vendors and brokers. Various factors impact the frequency of monitoring this information (which may occur as often as daily). However, the Committee may determine that changes to inputs, assumptions and models are not required as a result of the monitoring procedures performed.
The following table is a summary of the inputs used to value the Fund's investments at April 30, 2016:
| | | Level 1
Quoted Prices in Active
Markets for Identical
Assets ($) | | Level 2
Other Significant
Observable Inputs ($) | | Level 3
Significant
Unobservable Inputs ($) | | Total ($) | |
Investments | |
Municipal Bonds | | | — | | | | 218,638,368 | | | | — | | | | 218,638,368 | | |
Total Investments | | | — | | | | 218,638,368 | | | | — | | | | 218,638,368 | | |
See the Portfolio of Investments for all investment classifications not indicated in the table.
The Fund's assets assigned to the Level 2 input category are generally valued using the market approach, in which a security's value is determined through reference to prices and information from market transactions for similar or identical assets.
There were no transfers of financial assets between levels during the period.
The accompanying Notes to Financial Statements are an integral part of this statement.
Annual Report 2016
13
COLUMBIA AMT-FREE NORTH CAROLINA INTERMEDIATE MUNI BOND FUND
STATEMENT OF ASSETS AND LIABILITIES
April 30, 2016
Assets | |
Investments, at value | |
(identified cost $205,035,400) | | $ | 218,638,368 | | |
Cash | | | 13,883,119 | | |
Receivable for: | |
Capital shares sold | | | 385,118 | | |
Interest | | | 2,462,692 | | |
Expense reimbursement due from Investment Manager | | | 941 | | |
Prepaid expenses | | | 737 | | |
Other assets | | | 5,352 | | |
Total assets | | | 235,376,327 | | |
Liabilities | |
Payable for: | |
Investments purchased on a delayed delivery basis | | | 3,714,868 | | |
Capital shares purchased | | | 144,968 | | |
Dividend distributions to shareholders | | | 471,303 | | |
Investment management fees | | | 2,958 | | |
Distribution and/or service fees | | | 409 | | |
Transfer agent fees | | | 32,442 | | |
Compensation of board members | | | 114,964 | | |
Other expenses | | | 31,235 | | |
Total liabilities | | | 4,513,147 | | |
Net assets applicable to outstanding capital stock | | $ | 230,863,180 | | |
Represented by | |
Paid-in capital | | $ | 219,369,514 | | |
Undistributed net investment income | | | 721,185 | | |
Accumulated net realized loss | | | (2,830,487 | ) | |
Unrealized appreciation (depreciation) on: | |
Investments | | | 13,602,968 | | |
Total — representing net assets applicable to outstanding capital stock | | $ | 230,863,180 | | |
The accompanying Notes to Financial Statements are an integral part of this statement.
Annual Report 2016
14
COLUMBIA AMT-FREE NORTH CAROLINA INTERMEDIATE MUNI BOND FUND
STATEMENT OF ASSETS AND LIABILITIES (continued)
April 30, 2016
Class A | |
Net assets | | $ | 27,615,715 | | |
Shares outstanding | | | 2,581,280 | | |
Net asset value per share | | $ | 10.70 | | |
Maximum offering price per share(a) | | $ | 11.03 | | |
Class B | |
Net assets | | $ | 105,404 | | |
Shares outstanding | | | 9,851 | | |
Net asset value per share | | $ | 10.70 | | |
Class C | |
Net assets | | $ | 8,022,977 | | |
Shares outstanding | | | 750,154 | | |
Net asset value per share | | $ | 10.70 | | |
Class R4 | |
Net assets | | $ | 3,458,113 | | |
Shares outstanding | | | 323,607 | | |
Net asset value per share | | $ | 10.69 | | |
Class Z | |
Net assets | | $ | 191,660,971 | | |
Shares outstanding | | | 17,931,417 | | |
Net asset value per share | | $ | 10.69 | | |
(a) The maximum offering price per share is calculated by dividing the net asset value per share by 1.0 minus the maximum sales charge of 3.00%.
The accompanying Notes to Financial Statements are an integral part of this statement.
Annual Report 2016
15
COLUMBIA AMT-FREE NORTH CAROLINA INTERMEDIATE MUNI BOND FUND
STATEMENT OF OPERATIONS
Year Ended April 30, 2016
Net investment income | |
Income: | |
Interest | | $ | 6,591,012 | | |
Total income | | | 6,591,012 | | |
Expenses: | |
Investment management fees | | | 918,288 | | |
Distribution and/or service fees | |
Class A | | | 65,662 | | |
Class B | | | 1,014 | | |
Class C | | | 77,260 | | |
Transfer agent fees | |
Class A | | | 53,247 | | |
Class B | | | 206 | | |
Class C | | | 15,661 | | |
Class R4 | | | 7,411 | | |
Class Z | | | 319,368 | | |
Compensation of board members | | | 9,972 | | |
Custodian fees | | | 2,356 | | |
Printing and postage fees | | | 20,178 | | |
Registration fees | | | 22,303 | | |
Audit fees | | | 24,308 | | |
Legal fees | | | 8,002 | | |
Other | | | 12,584 | | |
Total expenses | | | 1,557,820 | | |
Fees waived or expenses reimbursed by Investment Manager and its affiliates | | | (321,931 | ) | |
Total net expenses | | | 1,235,889 | | |
Net investment income | | | 5,355,123 | | |
Realized and unrealized gain (loss) — net | |
Net realized gain (loss) on: | |
Investments | | | 26,729 | | |
Net realized gain | | | 26,729 | | |
Net change in unrealized appreciation (depreciation) on: | |
Investments | | | 2,371,811 | | |
Net change in unrealized appreciation | | | 2,371,811 | | |
Net realized and unrealized gain | | | 2,398,540 | | |
Net increase in net assets resulting from operations | | $ | 7,753,663 | | |
The accompanying Notes to Financial Statements are an integral part of this statement.
Annual Report 2016
16
COLUMBIA AMT-FREE NORTH CAROLINA INTERMEDIATE MUNI BOND FUND
STATEMENT OF CHANGES IN NET ASSETS
| | | Year Ended
April 30,
2016 | | Year Ended
April 30,
2015 | |
Operations | |
Net investment income | | $ | 5,355,123 | | | $ | 5,055,260 | | |
Net realized gain | | | 26,729 | | | | 251,729 | | |
Net change in unrealized appreciation (depreciation) | | | 2,371,811 | | | | (883,590 | ) | |
Net increase in net assets resulting from operations | | | 7,753,663 | | | | 4,423,399 | | |
Distributions to shareholders | |
Net investment income | |
Class A | | | (676,701 | ) | | | (714,735 | ) | |
Class B | | | (1,851 | ) | | | (1,815 | ) | |
Class C | | | (140,794 | ) | | | (137,325 | ) | |
Class R4 | | | (103,447 | ) | | | (82,530 | ) | |
Class Z | | | (4,448,177 | ) | | | (4,118,853 | ) | |
Total distributions to shareholders | | | (5,370,970 | ) | | | (5,055,258 | ) | |
Increase in net assets from capital stock activity | | | 42,658,785 | | | | 24,382,599 | | |
Total increase in net assets | | | 45,041,478 | | | | 23,750,740 | | |
Net assets at beginning of year | | | 185,821,702 | | | | 162,070,962 | | |
Net assets at end of year | | $ | 230,863,180 | | | $ | 185,821,702 | | |
Undistributed net investment income | | $ | 721,185 | | | $ | 737,032 | | |
The accompanying Notes to Financial Statements are an integral part of this statement.
Annual Report 2016
17
COLUMBIA AMT-FREE NORTH CAROLINA INTERMEDIATE MUNI BOND FUND
STATEMENT OF CHANGES IN NET ASSETS (continued)
| | | Year Ended April 30, 2016 | | Year Ended April 30, 2015 | |
| | | Shares | | Dollars ($) | | Shares | | Dollars ($) | |
Capital stock activity | |
Class A shares | |
Subscriptions(a) | | | 425,311 | | | | 4,500,943 | | | | 306,247 | | | | 3,260,068 | | |
Distributions reinvested | | | 51,488 | | | | 544,566 | | | | 52,179 | | | | 556,388 | | |
Redemptions | | | (253,754 | ) | | | (2,686,901 | ) | | | (619,752 | ) | | | (6,604,486 | ) | |
Net increase (decrease) | | | 223,045 | | | | 2,358,608 | | | | (261,326 | ) | | | (2,788,030 | ) | |
Class B shares | |
Subscriptions | | | 984 | | | | 10,333 | | | | 32 | | | | 346 | | |
Distributions reinvested | | | 130 | | | | 1,379 | | | | 138 | | | | 1,468 | | |
Redemptions(a) | | | (103 | ) | | | (1,091 | ) | | | (941 | ) | | | (10,006 | ) | |
Net increase (decrease) | | | 1,011 | | | | 10,621 | | | | (771 | ) | | | (8,192 | ) | |
Class C shares | |
Subscriptions | | | 151,363 | | | | 1,599,052 | | | | 116,994 | | | | 1,245,308 | | |
Distributions reinvested | | | 11,304 | | | | 119,528 | | | | 11,000 | | | | 117,262 | | |
Redemptions | | | (95,856 | ) | | | (1,017,005 | ) | | | (105,964 | ) | | | (1,128,848 | ) | |
Net increase | | | 66,811 | | | | 701,575 | | | | 22,030 | | | | 233,722 | | |
Class R4 shares | |
Subscriptions | | | 36,919 | | | | 390,617 | | | | 232,452 | | | | 2,475,600 | | |
Distributions reinvested | | | 9,746 | | | | 102,947 | | | | 7,699 | | | | 81,999 | | |
Redemptions | | | (70,861 | ) | | | (750,476 | ) | | | (56,213 | ) | | | (600,038 | ) | |
Net increase (decrease) | | | (24,196 | ) | | | (256,912 | ) | | | 183,938 | | | | 1,957,561 | | |
Class Z shares | |
Subscriptions | | | 6,371,841 | | | | 67,492,180 | | | | 4,305,279 | | | | 45,808,782 | | |
Distributions reinvested | | | 59,331 | | | | 626,946 | | | | 54,896 | | | | 584,785 | | |
Redemptions | | | (2,679,841 | ) | | | (28,274,233 | ) | | | (2,010,575 | ) | | | (21,406,029 | ) | |
Net increase | | | 3,751,331 | | | | 39,844,893 | | | | 2,349,600 | | | | 24,987,538 | | |
Total net increase | | | 4,018,002 | | | | 42,658,785 | | | | 2,293,471 | | | | 24,382,599 | | |
(a) Includes conversions of Class B shares to Class A shares, if any.
The accompanying Notes to Financial Statements are an integral part of this statement.
Annual Report 2016
18
COLUMBIA AMT-FREE NORTH CAROLINA INTERMEDIATE MUNI BOND FUND
The following tables are intended to help you understand the Fund's financial performance. Certain information reflects financial results for a single share of a class held for the periods shown. Per share net investment income (loss) amounts are calculated based on average shares outstanding during the period. Total return assumes reinvestment of all dividends and distributions, if any. Total return does not reflect payment of sales charges, if any. Total return and portfolio turnover are not annualized for periods of less than one year. The portfolio turnover rate is calculated without regard to purchase and sales transactions of short-term instruments and certain derivatives, if any. If such transactions were included, the Fund's portfolio turnover rate may be higher.
| | | Year Ended April 30, | | Year Ended
March 31, | |
Class A | | 2016 | | 2015 | | 2014 | | 2013 | | 2012(a) | | 2012 | |
Per share data | |
Net asset value, beginning of period | | $ | 10.58 | | | $ | 10.61 | | | $ | 10.94 | | | $ | 10.84 | | | $ | 10.74 | | | $ | 10.13 | | |
Income from investment operations: | |
Net investment income | | | 0.27 | | | | 0.28 | | | | 0.30 | | | | 0.28 | | | | 0.02 | | | | 0.30 | | |
Net realized and unrealized gain (loss) | | | 0.12 | | | | (0.03 | ) | | | (0.33 | ) | | | 0.10 | | | | 0.10 | | | | 0.61 | | |
Total from investment operations | | | 0.39 | | | | 0.25 | | | | (0.03 | ) | | | 0.38 | | | | 0.12 | | | | 0.91 | | |
Less distributions to shareholders: | |
Net investment income | | | (0.27 | ) | | | (0.28 | ) | | | (0.30 | ) | | | (0.28 | ) | | | (0.02 | ) | | | (0.30 | ) | |
Total distributions to shareholders | | | (0.27 | ) | | | (0.28 | ) | | | (0.30 | ) | | | (0.28 | ) | | | (0.02 | ) | | | (0.30 | ) | |
Net asset value, end of period | | $ | 10.70 | | | $ | 10.58 | | | $ | 10.61 | | | $ | 10.94 | | | $ | 10.84 | | | $ | 10.74 | | |
Total return | | | 3.77 | % | | | 2.41 | % | | | (0.22 | %) | | | 3.57 | % | | | 1.15 | % | | | 9.02 | % | |
Ratios to average net assets(b) | |
Total gross expenses | | | 0.97 | % | | | 0.98 | % | | | 0.99 | % | | | 0.97 | % | | | 0.96 | %(c) | | | 1.00 | % | |
Total net expenses(d) | | | 0.81 | % | | | 0.81 | % | | | 0.81 | % | | | 0.80 | % | | | 0.79 | %(c) | | | 0.79 | % | |
Net investment income | | | 2.57 | % | | | 2.67 | % | | | 2.84 | % | | | 2.59 | % | | | 2.65 | %(c) | | | 2.80 | % | |
Supplemental data | |
Net assets, end of period (in thousands) | | $ | 27,616 | | | $ | 24,948 | | | $ | 27,797 | | | $ | 34,852 | | | $ | 33,601 | | | $ | 33,061 | | |
Portfolio turnover | | | 11 | % | | | 6 | % | | | 3 | % | | | 10 | % | | | 1 | % | | | 4 | % | |
Notes to Financial Highlights
(a) For the period from April 1, 2012 to April 30, 2012. During the period, the Fund's fiscal year end was changed from March 31 to April 30.
(b) In addition to the fees and expenses that the Fund bears directly, the Fund indirectly bears a pro rata share of the fees and expenses of any other funds in which it invests. Such indirect expenses are not included in the Fund's reported expense ratios.
(c) Annualized.
(d) Total net expenses include the impact of certain fee waivers/expense reimbursements made by the Investment Manager and certain of its affiliates, if applicable.
The accompanying Notes to Financial Statements are an integral part of this statement.
Annual Report 2016
19
COLUMBIA AMT-FREE NORTH CAROLINA INTERMEDIATE MUNI BOND FUND
FINANCIAL HIGHLIGHTS (continued)
| | | Year Ended April 30, | | Year Ended
March 31, | |
Class B | | 2016 | | 2015 | | 2014 | | 2013 | | 2012(a) | | 2012 | |
Per share data | |
Net asset value, beginning of period | | $ | 10.58 | | | $ | 10.61 | | | $ | 10.94 | | | $ | 10.84 | | | $ | 10.74 | | | $ | 10.13 | | |
Income from investment operations: | |
Net investment income | | | 0.19 | | | | 0.20 | | | | 0.22 | | | | 0.20 | | | | 0.02 | | | | 0.22 | | |
Net realized and unrealized gain (loss) | | | 0.12 | | | | (0.03 | ) | | | (0.33 | ) | | | 0.10 | | | | 0.10 | | | | 0.59 | | |
Total from investment operations | | | 0.31 | | | | 0.17 | | | | (0.11 | ) | | | 0.30 | | | | 0.12 | | | | 0.81 | | |
Less distributions to shareholders: | |
Net investment income | | | (0.19 | ) | | | (0.20 | ) | | | (0.22 | ) | | | (0.20 | ) | | | (0.02 | ) | | | (0.20 | ) | |
Total distributions to shareholders | | | (0.19 | ) | | | (0.20 | ) | | | (0.22 | ) | | | (0.20 | ) | | | (0.02 | ) | | | (0.20 | ) | |
Net asset value, end of period | | $ | 10.70 | | | $ | 10.58 | | | $ | 10.61 | | | $ | 10.94 | | | $ | 10.84 | | | $ | 10.74 | | |
Total return | | | 3.00 | % | | | 1.65 | % | | | (0.96 | %) | | | 2.80 | % | | | 1.09 | % | | | 8.07 | % | |
Ratios to average net assets(b) | |
Total gross expenses | | | 1.73 | % | | | 1.73 | % | | | 1.74 | % | | | 1.72 | % | | | 1.71 | %(c) | | | 1.82 | % | |
Total net expenses(d) | | | 1.56 | % | | | 1.56 | % | | | 1.56 | % | | | 1.55 | % | | | 1.54 | %(c) | | | 1.55 | % | |
Net investment income | | | 1.82 | % | | | 1.92 | % | | | 2.09 | % | | | 1.85 | % | | | 1.90 | %(c) | | | 2.08 | % | |
Supplemental data | |
Net assets, end of period (in thousands) | | $ | 105 | | | $ | 94 | | | $ | 102 | | | $ | 139 | | | $ | 185 | | | $ | 183 | | |
Portfolio turnover | | | 11 | % | | | 6 | % | | | 3 | % | | | 10 | % | | | 1 | % | | | 4 | % | |
Notes to Financial Highlights
(a) For the period from April 1, 2012 to April 30, 2012. During the period, the Fund's fiscal year end was changed from March 31 to April 30.
(b) In addition to the fees and expenses that the Fund bears directly, the Fund indirectly bears a pro rata share of the fees and expenses of any other funds in which it invests. Such indirect expenses are not included in the Fund's reported expense ratios.
(c) Annualized.
(d) Total net expenses include the impact of certain fee waivers/expense reimbursements made by the Investment Manager and certain of its affiliates, if applicable.
The accompanying Notes to Financial Statements are an integral part of this statement.
Annual Report 2016
20
COLUMBIA AMT-FREE NORTH CAROLINA INTERMEDIATE MUNI BOND FUND
FINANCIAL HIGHLIGHTS (continued)
| | | Year Ended April 30, | | Year Ended
March 31, | |
Class C | | 2016 | | 2015 | | 2014 | | 2013 | | 2012(a) | | 2012 | |
Per share data | |
Net asset value, beginning of period | | $ | 10.58 | | | $ | 10.61 | | | $ | 10.94 | | | $ | 10.83 | | | $ | 10.74 | | | $ | 10.13 | | |
Income from investment operations: | |
Net investment income | | | 0.19 | | | | 0.20 | | | | 0.22 | | | | 0.20 | | | | 0.02 | | | | 0.21 | | |
Net realized and unrealized gain (loss) | | | 0.12 | | | | (0.03 | ) | | | (0.33 | ) | | | 0.11 | | | | 0.09 | | | | 0.62 | | |
Total from investment operations | | | 0.31 | | | | 0.17 | | | | (0.11 | ) | | | 0.31 | | | | 0.11 | | | | 0.83 | | |
Less distributions to shareholders: | |
Net investment income | | | (0.19 | ) | | | (0.20 | ) | | | (0.22 | ) | | | (0.20 | ) | | | (0.02 | ) | | | (0.22 | ) | |
Total distributions to shareholders | | | (0.19 | ) | | | (0.20 | ) | | | (0.22 | ) | | | (0.20 | ) | | | (0.02 | ) | | | (0.22 | ) | |
Net asset value, end of period | | $ | 10.70 | | | $ | 10.58 | | | $ | 10.61 | | | $ | 10.94 | | | $ | 10.83 | | | $ | 10.74 | | |
Total return | | | 3.00 | % | | | 1.65 | % | | | (0.96 | %) | | | 2.89 | % | | | 0.99 | % | | | 8.23 | % | |
Ratios to average net assets(b) | |
Total gross expenses | | | 1.73 | % | | | 1.73 | % | | | 1.74 | % | | | 1.72 | % | | | 1.71 | %(c) | | | 1.74 | % | |
Total net expenses(d) | | | 1.56 | % | | | 1.56 | % | | | 1.56 | % | | | 1.55 | % | | | 1.54 | %(c) | | | 1.54 | % | |
Net investment income | | | 1.82 | % | | | 1.92 | % | | | 2.09 | % | | | 1.84 | % | | | 1.90 | %(c) | | | 2.03 | % | |
Supplemental data | |
Net assets, end of period (in thousands) | | $ | 8,023 | | | $ | 7,227 | | | $ | 7,015 | | | $ | 8,683 | | | $ | 8,222 | | | $ | 8,112 | | |
Portfolio turnover | | | 11 | % | | | 6 | % | | | 3 | % | | | 10 | % | | | 1 | % | | | 4 | % | |
Notes to Financial Highlights
(a) For the period from April 1, 2012 to April 30, 2012. During the period, the Fund's fiscal year end was changed from March 31 to April 30.
(b) In addition to the fees and expenses that the Fund bears directly, the Fund indirectly bears a pro rata share of the fees and expenses of any other funds in which it invests. Such indirect expenses are not included in the Fund's reported expense ratios.
(c) Annualized.
(d) Total net expenses include the impact of certain fee waivers/expense reimbursements made by the Investment Manager and certain of its affiliates, if applicable.
The accompanying Notes to Financial Statements are an integral part of this statement.
Annual Report 2016
21
COLUMBIA AMT-FREE NORTH CAROLINA INTERMEDIATE MUNI BOND FUND
FINANCIAL HIGHLIGHTS (continued)
| | | Year Ended April 30, | |
Class R4 | | 2016 | | 2015 | | 2014 | | 2013(a) | |
Per share data | |
Net asset value, beginning of period | | $ | 10.57 | | | $ | 10.60 | | | $ | 10.93 | | | $ | 10.85 | | |
Income from investment operations: | |
Net investment income | | | 0.30 | | | | 0.31 | | | | 0.33 | | | | 0.04 | | |
Net realized and unrealized gain (loss) | | | 0.12 | | | | (0.03 | ) | | | (0.33 | ) | | | 0.08 | | |
Total from investment operations | | | 0.42 | | | | 0.28 | | | | — | | | | 0.12 | | |
Less distributions to shareholders: | |
Net investment income | | | (0.30 | ) | | | (0.31 | ) | | | (0.33 | ) | | | (0.04 | ) | |
Total distributions to shareholders | | | (0.30 | ) | | | (0.31 | ) | | | (0.33 | ) | | | (0.04 | ) | |
Net asset value, end of period | | $ | 10.69 | | | $ | 10.57 | | | $ | 10.60 | | | $ | 10.93 | | |
Total return | | | 4.03 | % | | | 2.67 | % | | | 0.03 | % | | | 1.07 | % | |
Ratios to average net assets(b) | |
Total gross expenses | | | 0.72 | % | | | 0.74 | % | | | 0.76 | % | | | 0.60 | %(c) | |
Total net expenses(d) | | | 0.56 | % | | | 0.56 | % | | | 0.56 | % | | | 0.52 | %(c) | |
Net investment income | | | 2.83 | % | | | 2.92 | % | | | 3.17 | % | | | 2.98 | %(c) | |
Supplemental data | |
Net assets, end of period (in thousands) | | $ | 3,458 | | | $ | 3,675 | | | $ | 1,737 | | | $ | 3 | | |
Portfolio turnover | | | 11 | % | | | 6 | % | | | 3 | % | | | 10 | % | |
Notes to Financial Highlights
(a) Based on operations from March 19, 2013 (commencement of operations) through the stated period end.
(b) In addition to the fees and expenses that the Fund bears directly, the Fund indirectly bears a pro rata share of the fees and expenses of any other funds in which it invests. Such indirect expenses are not included in the Fund's reported expense ratios.
(c) Annualized.
(d) Total net expenses include the impact of certain fee waivers/expense reimbursements made by the Investment Manager and certain of its affiliates, if applicable.
The accompanying Notes to Financial Statements are an integral part of this statement.
Annual Report 2016
22
COLUMBIA AMT-FREE NORTH CAROLINA INTERMEDIATE MUNI BOND FUND
FINANCIAL HIGHLIGHTS (continued)
| | | Year Ended April 30, | | Year Ended
March 31, | |
Class Z | | 2016 | | 2015 | | 2014 | | 2013 | | 2012(a) | | 2012 | |
Per share data | |
Net asset value, beginning of period | | $ | 10.57 | | | $ | 10.60 | | | $ | 10.93 | | | $ | 10.83 | | | $ | 10.73 | | | $ | 10.12 | | |
Income from investment operations: | |
Net investment income | | | 0.30 | | | | 0.31 | | | | 0.32 | | | | 0.31 | | | | 0.03 | | | | 0.32 | | |
Net realized and unrealized gain (loss) | | | 0.12 | | | | (0.03 | ) | | | (0.32 | ) | | | 0.10 | | | | 0.10 | | | | 0.61 | | |
Total from investment operations | | | 0.42 | | | | 0.28 | | | | — | | | | 0.41 | | | | 0.13 | | | | 0.93 | | |
Less distributions to shareholders: | |
Net investment income | | | (0.30 | ) | | | (0.31 | ) | | | (0.33 | ) | | | (0.31 | ) | | | (0.03 | ) | | | (0.32 | ) | |
Total distributions to shareholders | | | (0.30 | ) | | | (0.31 | ) | | | (0.33 | ) | | | (0.31 | ) | | | (0.03 | ) | | | (0.32 | ) | |
Net asset value, end of period | | $ | 10.69 | | | $ | 10.57 | | | $ | 10.60 | | | $ | 10.93 | | | $ | 10.83 | | | $ | 10.73 | | |
Total return | | | 4.03 | % | | | 2.67 | % | | | 0.03 | % | | | 3.83 | % | | | 1.17 | % | | | 9.30 | % | |
Ratios to average net assets(b) | |
Total gross expenses | | | 0.73 | % | | | 0.73 | % | | | 0.74 | % | | | 0.72 | % | | | 0.71 | %(c) | | | 0.74 | % | |
Total net expenses(d) | | | 0.56 | % | | | 0.56 | % | | | 0.56 | % | | | 0.55 | % | | | 0.54 | %(c) | | | 0.54 | % | |
Net investment income | | | 2.82 | % | | | 2.92 | % | | | 3.09 | % | | | 2.84 | % | | | 2.90 | %(c) | | | 3.05 | % | |
Supplemental data | |
Net assets, end of period (in thousands) | | $ | 191,661 | | | $ | 149,878 | | | $ | 125,420 | | | $ | 165,833 | | | $ | 178,425 | | | $ | 178,204 | | |
Portfolio turnover | | | 11 | % | | | 6 | % | | | 3 | % | | | 10 | % | | | 1 | % | | | 4 | % | |
Notes to Financial Highlights
(a) For the period from April 1, 2012 to April 30, 2012. During the period, the Fund's fiscal year end was changed from March 31 to April 30.
(b) In addition to the fees and expenses that the Fund bears directly, the Fund indirectly bears a pro rata share of the fees and expenses of any other funds in which it invests. Such indirect expenses are not included in the Fund's reported expense ratios.
(c) Annualized.
(d) Total net expenses include the impact of certain fee waivers/expense reimbursements made by the Investment Manager and certain of its affiliates, if applicable.
The accompanying Notes to Financial Statements are an integral part of this statement.
Annual Report 2016
23
COLUMBIA AMT-FREE NORTH CAROLINA INTERMEDIATE MUNI BOND FUND
NOTES TO FINANCIAL STATEMENTS
April 30, 2016
Note 1. Organization
Columbia AMT-Free North Carolina Intermediate Muni Bond Fund (the Fund), a series of Columbia Funds Series Trust (the Trust), is a diversified fund. The Trust is registered under the Investment Company Act of 1940, as amended (the 1940 Act), as an open-end management investment company organized as a Delaware statutory trust.
Fund Shares
The Trust may issue an unlimited number of shares (without par value). The Fund offers Class A, Class B, Class C, Class R4 and Class Z shares. Although all share classes generally have identical voting, dividend and liquidation rights, each share class votes separately when required by the Trust's organizational documents or by law. Different share classes pay different distribution amounts to the extent the expenses of such share classes differ, and distributions in liquidation will be proportional to the net asset value of each share class. Each share class has its own expense and sales charge structure.
Class A shares are subject to a maximum front-end sales charge of 3.00% based on the initial investment amount. In addition, Class A shares purchased on or after February 19, 2015 are subject to a contingent deferred sales charge (CDSC) of 0.75% on certain investments of $500,000 or more if redeemed within 12 months after purchase. Redemptions of Class A shares purchased prior to February 19, 2015, without an initial sales charge in accounts aggregating $1 million to $50 million at the time of purchase, are subject to a CDSC of 1.00% if redeemed within 12 months after purchase, and 0.50% if redeemed more than 12, but less than 18, months after purchase.
Class B shares may be subject to a maximum CDSC of 3.00% based upon the holding period after purchase. Class B shares will generally convert to Class A shares eight years after purchase. The Fund no longer accepts investments by new or existing investors in the Fund's Class B shares, except in connection with the reinvestment of any dividend and/or capital gain distributions in Class B shares of the Fund and exchanges by existing Class B shareholders of certain other funds within the Columbia Family of Funds.
Class C shares are subject to a 1.00% CDSC on shares redeemed within 12 months after purchase.
Class R4 shares are not subject to sales charges and are generally available only to omnibus retirement plans
and certain investors as described in the Fund's prospectus.
Class Z shares are not subject to sales charges and are available only to eligible investors, which are subject to different investment minimums as described in the Fund's prospectus.
Note 2. Summary of Significant Accounting Policies
Basis of Preparation
The Fund is an investment company that applies the accounting and reporting guidance in the Financial Accounting Standards Board (FASB) Accounting Standards Codification Topic 946, Financial Services — Investment Companies (ASC 946). The financial statements are prepared in accordance with U.S. generally accepted accounting principles (GAAP), which requires management to make certain estimates and assumptions that affect the reported amounts of assets and liabilities, the disclosure of contingent assets and liabilities at the date of the financial statements and the reported amounts of income and expenses during the reporting period. Actual results could differ from those estimates.
The following is a summary of significant accounting policies followed by the Fund in the preparation of its financial statements.
Security Valuation
Debt securities generally are valued by pricing services approved by the Board of Trustees (the Board) based upon market transactions for normal, institutional-size trading units of similar securities. The services may use various pricing techniques that take into account, as applicable, factors such as yield, quality, coupon rate, maturity, type of issue, trading characteristics and other data, as well as broker quotes. Debt securities for which quotations are not readily available or not believed to be reflective of market value may also be valued based upon a bid quote from an approved independent broker-dealer. Debt securities maturing in 60 days or less are valued primarily at amortized cost value, unless this method results in a valuation that management believes does not approximate market value.
Investments for which market quotations are not readily available, or that have quotations which management believes are not reflective of market value or reliable, are valued at fair value as determined in good faith under procedures approved by and under the general
Annual Report 2016
24
COLUMBIA AMT-FREE NORTH CAROLINA INTERMEDIATE MUNI BOND FUND
NOTES TO FINANCIAL STATEMENTS (continued)
April 30, 2016
supervision of the Board. If a security or class of securities (such as foreign securities) is valued at fair value, such value is likely to be different from the quoted or published price for the security.
The determination of fair value often requires significant judgment. To determine fair value, management may use assumptions including but not limited to future cash flows and estimated risk premiums. Multiple inputs from various sources may be used to determine fair value.
GAAP requires disclosure regarding the inputs and valuation techniques used to measure fair value and any changes in valuation inputs or techniques. In addition, investments shall be disclosed by major category. This information is disclosed following the Fund's Portfolio of Investments.
Delayed Delivery Securities
The Fund may trade securities on other than normal settlement terms, including securities purchased or sold on a "when-issued" basis. This may increase risk to the Fund since the other party to the transaction may fail to deliver, which could cause the Fund to subsequently invest at less advantageous prices. The Fund designates cash or liquid securities in an amount equal to the delayed delivery commitment.
Security Transactions
Security transactions are accounted for on the trade date. Cost is determined and gains (losses) are based upon the specific identification method for both financial statement and federal income tax purposes.
Income Recognition
Interest income is recorded on an accrual basis. Market premiums and discounts, including original issue discounts, are amortized and accreted, respectively, over the expected life of the security on all debt securities, unless otherwise noted.
The Fund may place a debt security on non-accrual status and reduce related interest income when it becomes probable that the interest will not be collected and the amount of uncollectible interest can be reasonably estimated. A defaulted debt security is removed from non-accrual status when the issuer resumes interest payments or when collectibility of interest is reasonably assured.
Expenses
General expenses of the Trust are allocated to the Fund and other funds of the Trust based upon relative net
assets or other expense allocation methodologies determined by the nature of the expense. Expenses directly attributable to the Fund are charged to the Fund. Expenses directly attributable to a specific class of shares are charged to that share class.
Determination of Class Net Asset Value
All income, expenses (other than class-specific expenses, which are charged to that share class, as shown in the Statement of Operations) and realized and unrealized gains (losses) are allocated to each class of the Fund on a daily basis, based on the relative net assets of each class, for purposes of determining the net asset value of each class.
Federal Income Tax Status
The Fund intends to qualify each year as a regulated investment company under Subchapter M of the Internal Revenue Code, as amended, and will distribute substantially all of its tax exempt and taxable income (including net short-term capital gains), if any, for its tax year, and as such will not be subject to federal income taxes. In addition, the Fund intends to distribute in each calendar year substantially all of its net investment income, capital gains and certain other amounts, if any, such that the Fund should not be subject to federal excise tax. Therefore, no federal income or excise tax provision is recorded.
Distributions to Shareholders
Distributions from net investment income, if any, are declared daily and paid monthly. Net realized capital gains, if any, are distributed at least annually. Income distributions and capital gain distributions are determined in accordance with federal income tax regulations, which may differ from GAAP.
Guarantees and Indemnifications
Under the Trust's organizational documents and, in some cases, by contract, its officers and trustees are indemnified against certain liabilities arising out of the performance of their duties to the Trust or its funds. In addition, certain of the Fund's contracts with its service providers contain general indemnification clauses. The Fund's maximum exposure under these arrangements is unknown since the amount of any future claims that may be made against the Fund cannot be determined, and the Fund has no historical basis for predicting the likelihood of any such claims.
Annual Report 2016
25
COLUMBIA AMT-FREE NORTH CAROLINA INTERMEDIATE MUNI BOND FUND
NOTES TO FINANCIAL STATEMENTS (continued)
April 30, 2016
Note 3. Fees and Other Transactions with Affiliates
Management Fees
Effective September 1, 2015, the Fund entered into a Management Agreement with Columbia Management Investment Advisers, LLC (the Investment Manager), a wholly-owned subsidiary of Ameriprise Financial, Inc. (Ameriprise Financial). Under the Management Agreement, the Investment Manager provides the Fund with investment research and advice, as well as administrative and accounting services. The management services fee is an annual fee that is equal to a percentage of the Fund's average daily net assets that declines from 0.47% to 0.31% as the Fund's net assets increase. The effective management services fee rate for the year ended April 30, 2016 was 0.47% of the Fund's average daily net assets.
Prior to September 1, 2015, the Fund paid the Investment Manager an annual fee for advisory services under an Investment Management Services Agreement and a separate annual fee for administrative and accounting services under an Administrative Services Agreement. For the period from May 1, 2015 through August 31, 2015, the investment advisory services fee paid to the Investment Manager was $247,175, and the administrative services fee paid to the Investment Manager was $43,256.
Other Expenses
Other expenses are for, among other things, miscellaneous expenses of the Fund or the Board, including payments to Board Services Corp., a company providing limited administrative services to the Fund and the Board. That company's expenses include boardroom and office expense, employee compensation, employee health and retirement benefits, and certain other expenses. For the year ended April 30, 2016, other expenses paid by the Fund to this company were $1,312.
Compensation of Board Members
Board members, who are not officers or employees of the Investment Manager or Ameriprise Financial, are compensated for their services to the Fund as disclosed in the Statement of Operations. Under a Deferred Compensation Plan (the Plan), these Board members may elect to defer payment of up to 100% of their compensation. Deferred amounts are treated as though equivalent dollar amounts had been invested in shares of certain funds managed by the Investment Manager. The Fund's liability for these amounts is adjusted for
market value changes and remains in the Fund until distributed in accordance with the Plan. All amounts payable under the Plan constitute a general unsecured obligation of the Fund.
Transfer Agency Fees
Under a Transfer and Dividend Disbursing Agent Agreement, Columbia Management Investment Services Corp. (the Transfer Agent), an affiliate of the Investment Manager and a wholly-owned subsidiary of Ameriprise Financial, is responsible for providing transfer agency services to the Fund. The Transfer Agent has contracted with Boston Financial Data Services (BFDS) to serve as sub-transfer agent.
The Transfer Agent receives a monthly transfer agency fee based on the number or the average value of accounts, depending on the type of account. In addition, the Transfer Agent also receives sub-transfer agency fees based on a percentage of the average aggregate value of the Fund's shares maintained in omnibus accounts (other than omnibus accounts for which American Enterprise Investment Services Inc. is the broker of record or accounts where the beneficial shareholder is a customer of Ameriprise Financial Services, Inc., for which the Transfer Agent receives a per account fee). The Transfer Agent pays the fees of BFDS for services as sub-transfer agent and is not entitled to reimbursement for such fees from the Fund (with the exception of out-of-pocket fees).
The Transfer Agent also receives compensation from the Fund for various shareholder services and reimbursements for certain out-of-pocket fees.
For the year ended April 30, 2016, the Fund's effective transfer agency fee rates as a percentage of average daily net assets of each class were as follows:
Class A | | | 0.20 | % | |
Class B | | | 0.20 | | |
Class C | | | 0.20 | | |
Class R4 | | | 0.20 | | |
Class Z | | | 0.20 | | |
An annual minimum account balance fee of $20 may apply to certain accounts with a value below the applicable share class's initial minimum investment requirements to reduce the impact of small accounts on transfer agency fees. These minimum account balance fees are remitted to the Fund and recorded as part of expense reductions in the Statement of Operations. For the year ended April 30, 2016, no minimum account balance fees were charged by the Fund.
Annual Report 2016
26
COLUMBIA AMT-FREE NORTH CAROLINA INTERMEDIATE MUNI BOND FUND
NOTES TO FINANCIAL STATEMENTS (continued)
April 30, 2016
Distribution and Service Fees
The Fund has an agreement with Columbia Management Investment Distributors, Inc. (the Distributor), an affiliate of the Investment Manager and a wholly-owned subsidiary of Ameriprise Financial, for distribution and shareholder services. The Board has approved, and the Fund has adopted, distribution and shareholder service plans (the Plans) applicable to certain share classes, which set the distribution and service fees for the Fund. These fees are calculated daily and are intended to compensate the Distributor and/or eligible selling and/or servicing agents for selling shares of the Fund and providing services to investors.
Under the Plans, the Fund pays a monthly combined distribution and service fee to the Distributor at the maximum annual rate of 0.25% of the average daily net assets attributable to Class A shares of the Fund. Also under the Plans, the Fund pays a monthly service fee at the maximum annual rate of 0.25% of the average daily net assets attributable to Class B and Class C shares of the Fund and a monthly distribution fee at the maximum annual rate of 0.75% of the average daily net assets attributable to Class B and Class C shares of the Fund.
Sales Charges
Sales charges, including front-end charges and CDSCs, received by the Distributor for distributing Fund shares were $12,472 for Class A and $700 for Class C shares for the year ended April 30, 2016.
Expenses Waived/Reimbursed by the Investment Manager and its Affiliates
The Investment Manager and certain of its affiliates have contractually agreed to waive fees and/or reimburse expenses (excluding certain fees and expenses described below) for the period disclosed below, unless sooner terminated at the sole discretion of the Board, so that the Fund's net operating expenses, after giving effect to fees waived/expenses reimbursed and any balance credits and/or overdraft charges from the Fund's custodian, do not exceed the following annual rates as a percentage of the class' average daily net assets:
| | | Fee Rates Contractual
through
August 31, 2016 | |
Class A | | | 0.81 | % | |
Class B | | | 1.56 | | |
Class C | | | 1.56 | | |
Class R4 | | | 0.56 | | |
Class Z | | | 0.56 | | |
Under the agreement governing these fee waivers and/or expense reimbursement arrangements, the following fees and expenses are excluded from the waiver/reimbursement commitment, and therefore will be paid by the Fund, if applicable: taxes (including foreign transaction taxes), expenses associated with investments in affiliated and non-affiliated pooled investment vehicles (including mutual funds and exchange-traded funds), transaction costs and brokerage commissions, costs related to any securities lending program, dividend and interest expenses associated with securities sold short, inverse floater program fees and expenses, transaction charges and interest on borrowed money, interest, extraordinary expenses and any other expenses the exclusion of which is specifically approved by the Board. This agreement may be modified or amended only with approval from the Investment Manager, certain of its affiliates and the Fund. Any fees waived and/or expenses reimbursed under the expense reimbursement arrangements described above are not recoverable by the Investment Manager or its affiliates in future periods.
Note 4. Federal Tax Information
The timing and character of income and capital gain distributions are determined in accordance with income tax regulations, which may differ from GAAP because of temporary or permanent book to tax differences.
At April 30, 2016, these differences are primarily due to differing treatment for capital loss carryforwards, Trustees' deferred compensation, distributions and tax straddles. To the extent these differences are permanent, reclassifications are made among the components of the Fund's net assets in the Statement of Assets and Liabilities. Temporary differences do not require reclassifications.
The Fund did not have any permanent differences; therefore, no reclassifications were made to the Statement of Assets and Liabilities.
The tax character of distributions paid during the years indicated was as follows:
Year Ended April 30, | | 2016 | | 2015 | |
Ordinary income | | $ | 11,875 | | | $ | 11,271 | | |
Tax-exempt income | | | 5,359,095 | | | | 5,043,987 | | |
Total | | $ | 5,370,970 | | | $ | 5,055,258 | | |
Short-term capital gain distributions, if any, are considered ordinary income distributions for tax purposes.
Annual Report 2016
27
COLUMBIA AMT-FREE NORTH CAROLINA INTERMEDIATE MUNI BOND FUND
NOTES TO FINANCIAL STATEMENTS (continued)
April 30, 2016
At April 30, 2016, the components of distributable earnings on a tax basis were as follows:
Undistributed tax-exempt income | | | 1,281,016 | | |
Capital loss carryforwards | | | (2,803,296 | ) | |
Net unrealized appreciation | | | 13,628,720 | | |
At April 30, 2016, the cost of investments for federal income tax purposes was $205,009,648 and the aggregate gross unrealized appreciation and depreciation based on that cost was:
Unrealized appreciation | | $ | 13,635,707 | | |
Unrealized depreciation | | | (6,987 | ) | |
Net unrealized appreciation | | $ | 13,628,720 | | |
The following capital loss carryforwards, determined at April 30, 2016, may be available to reduce taxable income arising from future net realized gains on investments, if any, to the extent permitted by the Internal Revenue Code:
Year of Expiration | | Amount ($) | |
2017 | | | 2,649,648 | | |
No expiration — short-term | | | 153,648 | | |
Total | | | 2,803,296 | | |
Capital loss carryforwards with no expiration are required to be utilized prior to any capital losses which carry an expiration date. As a result of this ordering rule, capital loss carryforwards which carry an expiration date may be more likely to expire unused.
For the year ended April 30, 2016, $26,729 of capital loss carryforward was utilized.
Management of the Fund has concluded that there are no significant uncertain tax positions in the Fund that would require recognition in the financial statements. However, management's conclusion may be subject to review and adjustment at a later date based on factors including, but not limited to, new tax laws, regulations, and administrative interpretations (including relevant court decisions). Generally, the Fund's federal tax returns for the prior three fiscal years remain subject to examination by the Internal Revenue Service.
Note 5. Portfolio Information
The cost of purchases and proceeds from sales of securities, excluding short-term investments and derivatives, if any, aggregated to $54,510,995 and $21,296,629, respectively, for the year ended April 30, 2016. The amount of purchase and sale activity impacts
the portfolio turnover rate reported in the Financial Highlights.
Note 6. Line of Credit
The Fund has access to a revolving credit facility whereby the Fund may borrow for the temporary funding of shareholder redemptions or for other temporary or emergency purposes. Effective December 8, 2015, Citibank, N.A. and HSBC Bank USA, N.A. joined JPMorgan Chase Bank, N.A. (JPMorgan) as lead of a syndicate of banks under the credit facility, which is a collective agreement between the Fund and certain other funds managed by the Investment Manager, severally and not jointly, that permits collective borrowings up to $1 billion. Interest is charged to each participating fund based on its borrowings at a rate equal to the higher of (i) the overnight federal funds rate plus 1.00% or (ii) the one-month LIBOR rate plus 1.00%. Each borrowing under the credit facility matures no later than 60 days after the date of borrowing. The Fund also pays a commitment fee equal to its pro rata share of the amount of the credit facility at a rate of 0.15% per annum. The commitment fee is included in other expenses in the Statement of Operations. Prior to December 8, 2015, JPMorgan was the sole lead bank under the credit facility agreement that permitted borrowings up to $550 million under the same terms and interest rates as described above with the exception of the commitment fee which was charged at a rate of 0.075% per annum.
The Fund had no borrowings during the year ended April 30, 2016.
Note 7. Significant Risks
Shareholder Concentration Risk
At April 30, 2016, one unaffiliated shareholder of record owned 74.7% of the outstanding shares of the Fund in one or more accounts. The Fund has no knowledge about whether any portion of those shares was owned beneficially. Subscription and redemption activity by concentrated accounts may have a significant effect on the operations of the Fund. In the case of a large redemption, the Fund may be forced to sell investments at inopportune times, including its liquid or more liquid positions, resulting in Fund losses and the Fund holding a higher percentage of less liquid or illiquid securities. Large redemptions could result in decreased economies of scale and increased operating expenses for non-redeeming Fund shareholders.
Annual Report 2016
28
COLUMBIA AMT-FREE NORTH CAROLINA INTERMEDIATE MUNI BOND FUND
NOTES TO FINANCIAL STATEMENTS (continued)
April 30, 2016
Credit Risk
Credit risk is the risk that the value of debt securities in the Fund's portfolio may decline because the issuer may default and fail to pay interest or repay principal when due. Rating agencies assign credit ratings to debt securities to indicate their credit risk. Lower rated or unrated debt securities held by the Fund may present increased credit risk as compared to higher-rated debt securities.
Interest Rate Risk
Interest rate risk is the risk of losses attributable to changes in interest rates. In general, if prevailing interest rates rise, the values of debt securities tend to fall, and if interest rates fall, the values of debt securities tend to rise. Actions by governments and central banking authorities can result in increases in interest rates. Increasing interest rates may negatively affect the value of debt securities held by the Fund, resulting in a negative impact on the Fund's performance and net asset value per share. In general, the longer the maturity or duration of a debt security, the greater its sensitivity to changes in interest rates.
Liquidity Risk
Liquidity risk is the risk associated with a lack of marketability of investments which may make it difficult to sell the investment at a desirable time or price. Changing regulatory, market or other conditions or environments (for example, the interest rate or credit environments) may adversely affect the liquidity of the Fund's investments. The Fund may have to accept a lower selling price for the holding, sell other investments, or forego another, more appealing investment opportunity. Generally, the less liquid the market at the time the Fund sells a portfolio investment, the greater the risk of loss or decline of value to the Fund. A less liquid market can lead to an increase in Fund redemptions, which may negatively impact Fund performance and net asset value per share, including, for example, if the Fund is forced to sell securities in a down market.
Geographic Concentration Risk
Because the Fund invests substantially in municipal securities issued by the state identified in the Fund's name and political sub-divisions of that state, the Fund will be particularly affected by adverse tax, legislative, regulatory, demographic or political changes as well as changes impacting the state's financial, economic or other condition and prospects. In addition, because of
the relatively small number of issuers of tax-exempt securities in the state, the Fund may invest a higher percentage of assets in a single issuer and, therefore, be more exposed to the risk of loss than a fund that invests more broadly. The value of municipal and other securities owned by the Fund also may be adversely affected by future changes in federal or state income tax laws.
Note 8. Subsequent Events
Management has evaluated the events and transactions that have occurred through the date the financial statements were issued and noted no items requiring adjustment of the financial statements or additional disclosure.
Note 9. Information Regarding Pending and Settled Legal Proceedings
In December 2005, without admitting or denying the allegations, American Express Financial Corporation (AEFC, which is now known as Ameriprise Financial, Inc. (Ameriprise Financial)) entered into settlement agreements with the Securities and Exchange Commission (SEC) and Minnesota Department of Commerce (MDOC) related to market timing activities. As a result, AEFC was censured and ordered to cease and desist from committing or causing any violations of certain provisions of the Investment Advisers Act of 1940, the Investment Company Act of 1940, and various Minnesota laws. AEFC agreed to pay disgorgement of $10 million and civil money penalties of $7 million. AEFC also agreed to retain an independent distribution consultant to assist in developing a plan for distribution of all disgorgement and civil penalties ordered by the SEC in accordance with various undertakings detailed at http://www.sec.gov/litigation/admin/ia-2451.pdf. Ameriprise Financial and its affiliates have cooperated with the SEC and the MDOC in these legal proceedings, and have made regular reports to the Funds' Boards of Trustees.
Ameriprise Financial and certain of its affiliates have historically been involved in a number of legal, arbitration and regulatory proceedings, including routine litigation, class actions, and governmental actions, concerning matters arising in connection with the conduct of their business activities. Ameriprise Financial believes that the Funds are not currently the subject of, and that neither Ameriprise Financial nor any of its affiliates are the subject of, any pending legal, arbitration or regulatory proceedings that are likely to have a material adverse effect on the Funds or the ability of Ameriprise Financial or its affiliates
Annual Report 2016
29
COLUMBIA AMT-FREE NORTH CAROLINA INTERMEDIATE MUNI BOND FUND
NOTES TO FINANCIAL STATEMENTS (continued)
April 30, 2016
to perform under their contracts with the Funds. Ameriprise Financial is required to make quarterly (10-Q), annual (10-K) and, as necessary, 8-K filings with the SEC on legal and regulatory matters that relate to Ameriprise Financial and its affiliates. Copies of these filings may be obtained by accessing the SEC website at www.sec.gov.
There can be no assurance that these matters, or the adverse publicity associated with them, will not result in increased fund redemptions, reduced sale of fund shares or other adverse consequences to the Funds. Further, although we believe proceedings are not likely to have a material adverse effect on the Funds or the ability of Ameriprise Financial or its affiliates to perform under their contracts with the Funds, these proceedings are subject to uncertainties and, as such, we are unable to estimate the possible loss or range of loss that may result. An adverse outcome in one or more of these proceedings could result in adverse judgments, settlements, fines, penalties or other relief that could have a material adverse effect on the consolidated financial condition or results of operations of Ameriprise Financial.
Annual Report 2016
30
COLUMBIA AMT-FREE NORTH CAROLINA INTERMEDIATE MUNI BOND FUND
REPORT OF INDEPENDENT REGISTERED PUBLIC ACCOUNTING FIRM
To the Trustees of Columbia Funds Series Trust and the Shareholders of
Columbia AMT-Free North Carolina Intermediate Muni Bond Fund
In our opinion, the accompanying statement of assets and liabilities, including the portfolio of investments, and the related statements of operations and of changes in net assets and the financial highlights present fairly, in all material respects, the financial position of Columbia AMT-Free North Carolina Intermediate Muni Bond Fund (the "Fund", a series of Columbia Funds Series Trust) at April 30, 2016, and the results of its operations, the changes in its net assets and the financial highlights for each of the periods indicated, in conformity with accounting principles generally accepted in the United States of America. These financial statements and financial highlights (hereafter referred to as "financial statements") are the responsibility of the Fund's management. Our responsibility is to express an opinion on these financial statements based on our audits. We conducted our audits of these financial statements in accordance with the standards of the Public Company Accounting Oversight Board (United States). Those standards require that we plan and perform the audit to obtain reasonable assurance about whether the financial statements are free of material misstatement. An audit includes examining, on a test basis, evidence supporting the amounts and disclosures in the financial statements, assessing the accounting principles used and significant estimates made by management, and evaluating the overall financial statement presentation. We believe that our audits, which included confirmation of securities at April 30, 2016 by correspondence with the custodian and brokers, and the application of alternative auditing procedures where such confirmations had not been received, provide a reasonable basis for our opinion.
PricewaterhouseCoopers LLP
Minneapolis, MN
June 21, 2016
Annual Report 2016
31
COLUMBIA AMT-FREE NORTH CAROLINA INTERMEDIATE MUNI BOND FUND
FEDERAL INCOME TAX INFORMATION
(Unaudited)
The Fund hereby designates the following tax attributes for the fiscal year ended April 30, 2016. Shareholders will be notified in early 2017 of the amounts for use in preparing 2016 income tax returns.
Tax Designations
Exempt-Interest Dividends | | | 99.78 | % | |
Exempt-Interest Dividends. The percentage of net investment income distributed during the fiscal year that qualifies as exempt-interest dividends for federal income tax purposes.
Annual Report 2016
32
COLUMBIA AMT-FREE NORTH CAROLINA INTERMEDIATE MUNI BOND FUND
Shareholders elect the Board that oversees the Fund's operations. The Board appoints officers who are responsible for day-to-day business decisions based on policies set by the Board. The following table provides basic biographical information about the Fund's Trustees, including their principal occupations during the past five years, although specific titles for individuals may have varied over the period. Under current Board policy, members generally may serve through the end of the calendar year in which they reach either the mandatory retirement age established by the Board or the fifteenth anniversary of the first Board meeting they attended as a member of the Board.
Trustees
Independent Trustees
Name,
Address,
Year of Birth | | Position Held With
the Funds and Length of
Service | | Principal Occupation(s)
During the Past Five Years
and Other Relevant
Professional Experience | | Number of
Funds in the
Columbia Funds
Complex
Overseen | | Other Directorships
Held by Trustee During
the Past Five Years | |
Kathleen Blatz
901 S. Marquette Ave.
Minneapolis, MN 55402
1954 | | Trustee since 1/06 for RiverSource Funds and since 6/11 for Nations Funds | | Attorney; specializing in arbitration and mediation; Chief Justice, Minnesota Supreme Court, 1998-2006; Associate Justice, Minnesota Supreme Court, 1996-1998; Fourth Judicial District Court Judge, Hennepin County, 1994-1996; Attorney in private practice and public service, 1984-1993; State Representative, Minnesota House of Representatives, 1979-1993, which included service on the Tax and Financial Institutions and Insurance Committees | | | 120 | | | Trustee, BlueCross BlueShield of Minnesota (Chair of the Business Development Committee) since 2009; Chair of the Robina Foundation since August 2013 | |
Edward J. Boudreau, Jr.
901 S. Marquette Ave. Minneapolis, MN 55402
1944 | | Trustee since 6/11 for RiverSource Funds and since 1/05 for Nations Funds | | Managing Director, E.J. Boudreau & Associates (consulting) since 2000; FINRA Industry Arbitrator, 2002-present; Chairman and Chief Executive Officer, John Hancock Funds (asset management), Chairman and Interested Trustee for open-end and closed-end funds offered by John Hancock, 1989-2000; John Hancock Life Insurance Company, including SVP and Treasurer and SVP Information Technology, 1968-1988 | | | 118 | | | Former Trustee, Boston Museum of Science (Chair of Finance Committee), 1985-2013; former Trustee, BofA Funds Series Trust (11 funds), 2005-2011 | |
Pamela G. Carlton
901 S. Marquette Ave.
Minneapolis, MN 55402
1954 | | Trustee since 7/07 for RiverSource Funds and since 6/11 for Nations Funds | | President, Springboard — Partners in Cross Cultural Leadership (consulting company) since 2003; Managing Director of US Equity Research, JP Morgan Chase, 1999-2003; Director of US Equity Research, Chase Asset Management, 1996-1999; Co-Director Latin America Research, 1993-1996, COO Global Research, 1992-1996, Co-Director of US Research, 1991-1992, Investment Banker, Morgan Stanley, 1982-1991 | | | 120 | | | Trustee, New York Presbyterian Hospital Board (Executive Committee and Chair of Human Resources Committee) since 1996 | |
Annual Report 2016
33
COLUMBIA AMT-FREE NORTH CAROLINA INTERMEDIATE MUNI BOND FUND
TRUSTEES AND OFFICERS (continued)
Independent Trustees (continued)
Name,
Address,
Year of Birth | | Position Held With
the Funds and Length of
Service | | Principal Occupation(s)
During the Past Five Years
and Other Relevant
Professional Experience | | Number of
Funds in the
Columbia Funds
Complex
Overseen | | Other Directorships
Held by Trustee During
the Past Five Years | |
William P. Carmichael
901 S. Marquette Ave. Minneapolis, MN 55402
1943 | | Trustee since 6/11 for RiverSource Funds and since 2003 for Nations Funds; Chair of the Board from 1/14-11/15 | | Retired; Co-founder, The Succession Fund (provides exit strategies to owners of privately held companies), 1998-2007; Adjunct Professor of Finance, Kelley School of Business, Indiana University, 1993-2007; Senior Vice President, Sara Lee Corporation, 1991-1993; Senior Vice President and Chief Financial Officer, Beatrice Foods Company, 1984-1990; Vice President, Esmark, Inc., 1973-1984; Associate, Price Waterhouse, 1968-1972 | | | 120 | | | Director, The Finish Line (athletic shoes and apparel) since July 2003; Director, International Textile Corp. since 2012; Director, hhgregg since May, 2015; former Director, Cobra Electronics Corporation (electronic equipment manufacturer), 1994-August 2014; former Director, Spectrum Brands, Inc. (consumer products), 2002-2009; former Director, Simmons Company (bedding), 2004-2010; former Trustee, BofA Funds Series Trust (11 funds), 2009-2011; former Director, McMoRan Exploration Company (oil and gas exploration and development), 2010-2013 | |
Patricia M. Flynn
901 S. Marquette Ave. Minneapolis, MN 55402
1950 | | Trustee since 11/04 for RiverSource Funds and since 6/11 for Nations Funds | | Trustee Professor of Economics and Management, Bentley University since 1976 (also teaches and conducts research on corporate governance); Dean, McCallum Graduate School of Business, Bentley University, 1992-2002 | | | 120 | | | Trustee, MA Taxpayers Foundation since 1997; Board of Governors, Innovation Institute, MA Technology Collaborative since 2010 | |
William A. Hawkins
901 S. Marquette Ave.
Minneapolis, MN 55402
1942 | | Chair of the Board since 11/15; Trustee since 6/11 for RiverSource Funds and since 1/05 for Nations Funds | | Managing Director, Overton Partners (financial consulting) since August 2010; President and Chief Executive Officer, California General Bank, N.A., January 2008-August 2010; Operation Hope, COO, 2004-2007; IndyMac Bancorp, President, CBG, 1999-2003; American General Bank, President, 1997-1999; Griffin Financial Services, CEO, 1981-1997; The Griffin Funds, CEO, 1992-1998 | | | 120 | | | Former Trustee, BofA Funds Series Trust (11 funds), 2009-2015 | |
R. Glenn Hilliard
901 S. Marquette Ave. Minneapolis, MN 55402
1943 | | Trustee since 6/11 for RiverSource Funds and since 1/05 for Nations Funds | | Chairman and Chief Executive Officer, Hilliard Group LLC (investing and consulting) since April 2003; Non-Executive Director & Chairman, CNO Financial Group, Inc. (insurance), 2003-2011; Chair & CEO, ING Americas, 1996-2003 | | | 118 | | | Chairman, BofA Funds Series Trust (11 funds); former Director, CNO Financial Group, Inc. (insurance), 2003-2011 | |
Annual Report 2016
34
COLUMBIA AMT-FREE NORTH CAROLINA INTERMEDIATE MUNI BOND FUND
TRUSTEES AND OFFICERS (continued)
Independent Trustees (continued)
Name,
Address,
Year of Birth | | Position Held With
the Funds and Length of
Service | | Principal Occupation(s)
During the Past Five Years
and Other Relevant
Professional Experience | | Number of
Funds in the
Columbia Funds
Complex
Overseen | | Other Directorships
Held by Trustee During
the Past Five Years | |
Catherine James Paglia
901 S. Marquette Ave.
Minneapolis, MN 55402
1952 | | Trustee since 11/04 for RiverSource Funds and since 6/11 for Nations Funds | | Director, Enterprise Asset Management, Inc. (private real estate and asset management company) since September 1998; Managing Director and Partner, Interlaken Capital, Inc., 1989-1997; Managing Director, Morgan Stanley, 1982-1989; Vice President, Investment Banking, 1980-1982, Associate, Investment Banking, 1976-1980, Dean Witter Reynolds, Inc. | | | 120 | | | Director, Valmont Industries, Inc. (irrigation systems manufacturer) since 2012; Trustee, Carleton College (on the Investment Committee); Trustee, Carnegie Endowment for International Peace (on the Investment Committee) | |
Leroy C. Richie
901 S. Marquette Ave.
Minneapolis, MN 55402
1941 | | Trustee since 2000 for Seligman Funds, since 11/08 for RiverSource Funds and since 6/11 for Nations Funds | | Counsel, Lewis & Munday, P.C. (law firm) since 2004; Vice President and General Counsel, Automotive Legal Affairs, Chrysler Corporation, 1993-1997 | | | 118 | | | Lead Outside Director, Infinity Resources, Inc. (oil and gas exploration and production) since 1994; Lead Outside Director, Digital Ally, Inc. (digital imaging) since September 2005; Trustee, Marygrove College (Chair of Finance Committee) since 2007; former Director, OGE Energy Corp. (energy and energy services), 2007-2014 | |
Minor M. Shaw
901 S. Marquette Ave.
Minneapolis, MN 55402
1947 | | Trustee since 6/11 for RiverSource Funds and since 2003 for Nations Funds | | President, Micco LLC (private investments) since 2011; President, Micco Corp. (family investment business), 1998-2011 | | | 120 | | | Director, Piedmont Natural Gas; Director, BlueCross BlueShield of South Carolina since April 2008; Chair of the Duke Endowment; Director, National Association of Corporate Directors, Carolinas Chapter since 2013; Chair of Greenville — Spartanburg Airport Commission; former Trustee, BofA Funds Series Trust (11 funds), 2003-2011 | |
Alison Taunton-Rigby
901 S. Marquette Ave.
Minneapolis, MN 55402
1944 | | Trustee since 11/02 for RiverSource Funds and since 6/11 for Nations Funds | | Managing Director, Forester Biotech (consulting), 2001-2003; Chief Executive Officer and Director, RiboNovix, Inc., (biotechnology), 2003-2010; President and Chief Executive Officer of CMT Inc., 2001-2003; Aquila Biopharmaceuticals Inc., 1996-2000; Cambridge Biotech Corporation, 1995-1996; Mitotix Inc., 1993-1994 | | | 120 | | | Director, Abt Associates
(government contractor) since 2001; Director, Boston Children's Hospital since 2002; Director, Healthways, Inc. (health and well-being solutions) since 2005; Director, ICI Mutual Insurance Company, since 2011 | |
Annual Report 2016
35
COLUMBIA AMT-FREE NORTH CAROLINA INTERMEDIATE MUNI BOND FUND
TRUSTEES AND OFFICERS (continued)
Interested Trustee Not Affiliated with Investment Manager*
Name,
Address,
Year of Birth | | Position Held With
Funds and Length of
Service | | Principal Occupation(s)
During Past Five Years
and Other Relevant
Professional Experience | | Number of
Funds in the
Fund Family
Overseen by
Board Member | | Other Present or Past
Directorships/
Trusteeships
(Within Past 5 Years) | |
Anthony M. Santomero
901 S. Marquette Ave.
Minneapolis, MN 55402
1946 | | Trustee since 6/11 for RiverSource Funds and since 1/08 for Nations Funds | | Richard K. Mellon Professor Emeritus of Finance, The Wharton School, University of Pennsylvania since 2002; Senior Advisor, McKinsey & Company (consulting), 2006-2008; President, Federal Reserve Bank of Philadelphia, 2000-2006; Professor of Finance, The Wharton School, University of Pennsylvania, 1972-2002 | | | 118 | | | Trustee, Penn Mutual Life Insurance Company since March 2008; Director, Renaissance Reinsurance Ltd. since May 2008; Director, Citigroup Inc. since 2009; Director, Citibank, N.A. since 2009; former Trustee, BofA Funds Series Trust (11 funds), 2008-2011 | |
* Dr. Santomero is not an affiliated person of the Investment Manager or Ameriprise Financial. However, he is currently deemed by the Funds to be an "interested person" (as defined in the 1940 Act) of the Funds because he serves as a Director of Citigroup Inc. and Citibank, N.A., companies that may directly or through subsidiaries and affiliates engage from time-to-time in brokerage execution, principal transactions and lending relationships with the Funds or accounts advised/managed by the Investment Manager.
Annual Report 2016
36
COLUMBIA AMT-FREE NORTH CAROLINA INTERMEDIATE MUNI BOND FUND
TRUSTEES AND OFFICERS (continued)
Interested Trustee Affiliated with Investment Manager*
Name,
Address,
Year of Birth | | Position Held With
the Funds and Length of
Service | | Principal Occupation(s)
During Past Five Years
and Other Relevant
Professional Experience | | Number of
Funds in the
Columbia Funds
Complex
Overseen | | Other Directorships
Held by Trustee During
the Past Five Years | |
William F. Truscott
c/o Columbia Management
Investment Advisers, LLC, 225 Franklin St.
Boston, MA 02110
1960 | | Trustee since 11/01 for RiverSource Funds and since 6/11 for Nations Funds; Senior Vice President since 2002 for RiverSource Funds and since 5/10 for Nations Funds | | Chairman of the Board and President, Columbia Management Investment Advisers, LLC since May 2010 and February 2012, respectively (previously President and Chief Investment Officer, 2001-April 2010); Chief Executive Officer, Global Asset Management, Ameriprise Financial, Inc. since September 2012 (previously Chief Executive Officer, U.S. Asset Management & President, Annuities, May 2010-September 2012 and President — U.S. Asset Management and Chief Investment Officer, 2005-April 2010); Director and Chief Executive Officer, Columbia Management Investment Distributors, Inc. since May 2010 and February 2012, respectively (previously Chairman of the Board and Chief Executive Officer, 2006-April 2010); Chairman of the Board and Chief Executive Officer, RiverSource Distributors, Inc. since 2006; Director, Threadneedle Asset Management Holdings, SARL since 2014; President and Chief Executive Officer, Ameriprise Certificate Company, 2006-August 2012. | | | 178 | | | Chairman of the Board, Columbia Management Investment Advisers, LLC since May 2010; Director, Columbia Management Investment Distributors, Inc. since May 2010; Former Director, Ameriprise Certificate Company, 2006-January 2013 | |
* Interested person (as defined under the 1940 Act) by reason of being an officer, director, security holder and/or employee of the Investment Manager or Ameriprise Financial.
The Statement of Additional Information has additional information about the Fund's Board members and is available, without charge, upon request by calling 800.345.6611; contacting your financial intermediary; or visiting columbiathreadneedle.com/us.
Annual Report 2016
37
COLUMBIA AMT-FREE NORTH CAROLINA INTERMEDIATE MUNI BOND FUND
TRUSTEES AND OFFICERS (continued)
The Board has appointed officers who are responsible for day-to-day business decisions based on policies it has established. The officers serve at the pleasure of the Board. The following table provides basic information about the Officers of the Fund, including principal occupations during the past five years, although their specific titles may have varied over the period. In addition to Mr. Truscott, who is Senior Vice President, the Fund's other officers are:
Fund Officers
Name,
Address and
Year of Birth | | Position and Year
First Appointed to
Position for any Fund
in the Columbia
Funds Complex or a
Predecessor Thereof | |
Principal Occupation(s) During Past Five Years | |
Christopher O. Petersen
5228 Ameriprise
Financial Center
Minneapolis, MN 55474
Born 1970 | | President and Principal Executive Officer (2015) | | Vice President and Lead Chief Counsel, Ameriprise Financial, Inc. since January 2015 (previously, Vice President and Chief Counsel January 2010-December 2014; and Vice President and Group Counsel or Counsel 2004-January 2010); officer of Columbia Funds and affiliated funds since 2007. | |
Michael G. Clarke
225 Franklin Street
Boston, MA 02110
Born 1969 | | Treasurer (2011), Chief Financial Officer (2009) and Chief Accounting Officer (2015) | | Vice President — Mutual Fund Administration, Columbia Management Investment Advisers, LLC, since May 2010; Managing Director of Fund Administration, Columbia Management Advisors, LLC, September 2004-April 2010; senior officer of Columbia Funds and affiliated funds since 2002. | |
Paul B. Goucher
100 Park Avenue
New York, NY 10017
Born 1968 | | Senior Vice President (2011), Chief Legal Officer (2015) and Assistant Secretary (2008) | | Vice President and Lead Chief Counsel, Ameriprise Financial, Inc. since November 2008 and January 2013, respectively (previously Chief Counsel, January 2010-January 2013 and Group Counsel, November 2008-January 2010). | |
Thomas P. McGuire
225 Franklin Street
Boston, MA 02110
Born 1972 | | Senior Vice President and Chief Compliance Officer (2012) | | Vice President — Asset Management Compliance, Ameriprise Financial, Inc., since May 2010; Chief Compliance Officer, Ameriprise Certificate Company since September 2010; Compliance Executive, Bank of America, 2005-April 2010. | |
Colin Moore
225 Franklin Street
Boston, MA 02110
Born 1958 | | Senior Vice President (2010) | | Executive Vice President and Global Chief Investment Officer, Ameriprise Financial, Inc., since July 2013; Director and Global Chief Investment Officer, Columbia Management Investment Advisers, LLC since May 2010; Manager, Managing Director and Chief Investment Officer, Columbia Management Advisors, LLC, 2007-April 2010. | |
Michael E. DeFao
225 Franklin Street
Boston, MA 02110
Born 1968 | | Vice President (2011) and Assistant Secretary (2010) | | Vice President and Chief Counsel, Ameriprise Financial, Inc. since May 2010; Associate General Counsel, Bank of America, 2005-April 2010. | |
Amy Johnson
5228 Ameriprise
Financial Center
Minneapolis, MN 55474
Born 1965 | | Vice President (2006) | | Managing Director and Chief Operating Officer, Columbia Management Investment Advisers, LLC since May 2010 (previously Chief Administrative Officer, 2009-April 2010, and Vice President — Asset Management and Trust Company Services, 2006-2009). | |
Lyn Kephart-Strong
5228 Ameriprise
Financial Center
Minneapolis, MN 55474
Born 1960 | | Vice President (2015) | | President, Columbia Management Investment Services Corp. since October 2014; Vice President & Resolution Officer, Ameriprise Trust Company since August 2009; President, RiverSource Service Corporation 2004-2010. | |
Ryan C. Larrenaga
225 Franklin Street
Boston, MA 02110
Born 1970 | | Vice President and Secretary (2015) | | Vice President and Group Counsel, Ameriprise Financial, Inc. since August 2011 (previously, Counsel from May 2010 to August 2011); Assistant General Counsel, Bank of America, 2005-April 2010; officer of Columbia Funds and affiliated funds since 2005. | |
Annual Report 2016
38
COLUMBIA AMT-FREE NORTH CAROLINA INTERMEDIATE MUNI BOND FUND
IMPORTANT INFORMATION ABOUT THIS REPORT
Each fund mails one shareholder report to each shareholder address. If you would like more than one report, please call shareholder services at 800.345.6611 and additional reports will be sent to you.
The policy of the Board is to vote the proxies of the companies in which each fund holds investments consistent with the procedures as stated in the Statement of Additional Information (SAI). You may obtain a copy of the SAI without charge by calling 800.345.6611; contacting your financial intermediary; visiting columbiathreadneedle.com/us; or searching the website of the Securities and Exchange Commission (SEC) at sec.gov. Information regarding how each fund voted proxies relating to portfolio securities is filed with the SEC by August 31st for the most recent 12-month period ending June 30th of that year, and is available without charge by visiting columbiathreadneedle.com/us, or searching the website of the SEC at sec.gov.
Each fund files a complete schedule of portfolio holdings with the SEC for the first and third quarters of each fiscal year on Form N-Q. Each fund's Form N-Q is available on the SEC's website at sec.gov and may be reviewed and copied at the SEC's Public Reference Room in Washington, D.C. Information on the operation of the Public Reference Room may be obtained by calling 800.SEC.0330. Each fund's complete schedule of portfolio holdings, as filed on Form N-Q, can also be obtained without charge, upon request, by calling 800.345.6611.
Annual Report 2016
39
Columbia AMT-Free North Carolina Intermediate Muni Bond Fund
P.O. Box 8081
Boston, MA 02266-8081

This information is for use with concurrent or prior delivery of a fund prospectus. Please read and consider the investment objectives, risks, charges and expenses for any fund carefully before investing. For a prospectus and summary prospectus, which contains this and other important information about the Fund, go to columbiathreadneedle.com/us. The Fund is distributed by Columbia Management Investment Distributors, Inc., member FINRA, and managed by Columbia Management Investment Advisers, LLC.
Columbia Threadneedle Investments (Columbia Threadneedle) is the global brand name of the Columbia and Threadneedle group of companies.
All rights reserved. Columbia Management Investment Distributors, Inc., 225 Franklin Street, Boston, MA 02110-2804
© 2016 Columbia Management Investment Advisers, LLC.
columbiathreadneedle.com/us
ANN206_04_F01_(06/16)
Item 2. Code of Ethics.
(a) The registrant has adopted a code of ethics that applies to the registrant’s principal executive officer, principal financial officer, principal accounting officer or controller, or persons performing similar functions, regardless of whether these individuals are employed by the registrant or a third party.
(b) During the period covered by this report, there were not any amendments to a provision of the code of ethics adopted in 2(a) above.
(c) During the period covered by this report, there were no waivers, including any implicit waivers, from a provision of the code of ethics described in 2(a) above that relates to one or more of the items set forth in paragraph (b) of this item’s instructions.
Item 3. Audit Committee Financial Expert.
The registrant’s Board of Trustees has determined that Edward J. Boudreau, Pamela G. Carlton, William P. Carmichael and Alison Taunton-Rigby, each of whom are members of the registrant’s Board of Trustees and Audit Committee, each qualify as an audit committee financial expert. Mr. Boudreau, Ms. Carlton, Mr. Carmichael and Ms. Taunton-Rigby are each independent trustees, as defined in paragraph (a)(2) of this item’s instructions.
Item 4. Principal Accountant Fees and Services.
Fee information below is disclosed for the seven series of the registrant whose report to stockholders are included in this annual filing.
(a) Audit Fees. Aggregate Audit Fees billed by the principal accountant for professional services rendered during the fiscal years ended April 30, 2016 and April 30, 2015 are approximately as follows:
2016 | | 2015 | |
$ | 154,000 | | $ | 154,000 | |
| | | | | |
Audit Fees include amounts related to the audit of the registrant’s annual financial statements or services that are normally provided by the accountant in connection with statutory and regulatory filings or engagements for those fiscal years.
(b) Audit-Related Fees. Aggregate Audit-Related Fees billed to the registrant by the principal accountant for professional services rendered during the fiscal years ended April 30, 2016 and April 30, 2015 are approximately as follows:
Audit-Related Fees include amounts for assurance and related services by the principal accountant that are reasonably related to the performance of the audit of the registrant’s financial statements and are not reported in Audit Fees above. In both fiscal years 2016 and 2015, Audit-Related Fees consist of agreed-upon procedures performed for semi-annual shareholder reports.
During the fiscal years ended April 30, 2016 and April 30, 2015, there were no Audit-Related Fees billed by the registrant’s principal accountant to the registrant’s investment adviser (not including any sub-adviser whose role is primarily portfolio management and is subcontracted with or overseen by another investment adviser) and any entity controlling, controlled by, or under common control with the adviser that provides ongoing services to the registrant for an engagement that related directly to the operations and financial reporting of the registrant.
(c) Tax Fees. Aggregate Tax Fees billed by the principal accountant to the registrant for professional services rendered during the fiscal years ended April 30, 2016 and April 30, 2015 are approximately as follows:
2016 | | 2015 | |
$ | 28,100 | | $ | 25,800 | |
| | | | | |
Tax Fees include amounts for the review of annual tax returns, the review of required shareholder distribution calculations and typically include amounts for professional services by the principal accountant for tax compliance, tax advice and tax planning.
During the fiscal years ended April 30, 2016 and April 30, 2015, there were no Tax Fees billed by the registrant’s principal accountant to the registrant’s investment adviser (not including any sub-adviser whose role is primarily portfolio management and is subcontracted with or overseen by another investment adviser) and any entity controlling, controlled by, or under common control with the adviser that provides ongoing services to the registrant for an engagement that related directly to the operations and financial reporting of the registrant.
(d) All Other Fees. Aggregate All Other Fees billed by the principal accountant to the registrant for professional services rendered during the fiscal years ended April 30, 2016 and April 30, 2015 are approximately as follows:
All Other Fees include amounts for products and services provided by the principal accountant, other than the services reported in paragraphs (a) through (c) above.
Aggregate All Other Fees billed by the registrant’s principal accountant to the registrant’s investment adviser (not including any sub-adviser whose role is primarily portfolio management and is subcontracted with or overseen by another investment adviser) and any entity controlling, controlled by, or under common control with the adviser that provides ongoing services to the registrant for an engagement that related directly to the operations and financial reporting of the registrant during the fiscal years ended April 30, 2016 and April 30, 2015 are approximately as follows:
2016 | | 2015 | |
$ | 335,000 | | $ | 225,000 | |
| | | | | |
In fiscal years 2016 and 2015, All Other Fees primarily consists of fees billed for internal control examinations of the registrant’s transfer agent and investment adviser.
(e)(1) Audit Committee Pre-Approval Policies and Procedures
The registrant’s Audit Committee is required to pre-approve the engagement of the registrant’s independent auditors to provide audit and non-audit services to the registrant and non-audit services to its investment adviser (excluding any sub-adviser whose role is primarily portfolio management and is sub-contracted or overseen by another investment adviser (the “Adviser”) or any entity controlling, controlled by or under common control with the Adviser that provides ongoing services to the Fund (a “Control Affiliate”) if the engagement relates directly to the operations and financial reporting of the registrant.
The Audit Committee has adopted a Policy for Engagement of Independent Auditors for Audit and Non-Audit Services (the “Policy”). The Policy sets forth the understanding of the Audit Committee regarding the engagement of the registrant’s independent accountants to provide (i) audit and permissible audit-related, tax and other services to the registrant (“Fund Services”); (ii) non-audit services to the registrant’s Adviser and any Control Affiliates, that relates directly to the operations and financial reporting of a Fund (“Fund-related Adviser Services”); and (iii) certain other audit and non-audit services to the registrant’s Adviser and its Control Affiliates. A service will require specific pre-approval by the Audit Committee if it is to be provided by the Fund’s independent auditor; provided, however, that pre-approval of non-audit services to the Fund, the Adviser or Control Affiliates may be waived if certain de minimis requirements set forth in the SEC’s rules are met.
Under the Policy, the Audit Committee may delegate pre-approval authority to any pre-designated member or members who are independent board members. The member(s) to whom such authority is delegated must report, for informational purposes only, any pre-approval decisions to the Audit Committee at its next regular meeting. The Audit Committee’s responsibilities with respect to the pre-approval of services performed by the independent auditor may not be delegated to management.
On an annual basis, at a regularly scheduled Audit Committee meeting, the Fund’s Treasurer or other Fund officer shall submit to the Audit Committee a schedule of the types of Fund Services and Fund-related Adviser Services that are subject to specific pre-approval. This schedule will provide a description of each type of service that is subject to specific pre-approval, along with total projected fees for each service. The pre-approval will generally cover a one-year period. The Audit Committee will review and approve the types of services and the projected fees for the next one-year period and may add to, or subtract from, the list of pre-approved services from time to time, based on subsequent determinations. This specific approval acknowledges that the Audit Committee is in agreement with the specific types of services that the independent auditor will be permitted to perform and the projected fees for each service.
The Fund’s Treasurer or other Fund officer shall report to the Audit Committee at each of its regular meetings regarding all Fund Services or Fund-related Adviser Services provided since the last such report was rendered, including a description of the services, by category, with forecasted fees for the annual reporting period, proposed changes requiring specific pre-approval and a description of services provided by the independent auditor, by category, with actual fees during the current reporting period.
*****
(e)(2) 100% of the services performed for items (b) through (d) above during 2016 and 2015 were pre-approved by the registrant’s Audit Committee.
(f) Not applicable.
(g) The aggregate non-audit fees billed by the registrant’s accountant for services rendered to the registrant, and rendered to the registrant’s investment adviser (not including any sub-adviser whose role is primarily portfolio management and is subcontracted with or overseen by another investment adviser), and any entity controlling, controlled by, or under common control with the adviser that provides ongoing services to the registrant for the fiscal years ended April 30, 2016 and April 30, 2015 are approximately as follows:
2016 | | 2015 | |
$ | 365,900 | | $ | 253,600 | |
| | | | | |
(h) The registrant’s Audit Committee of the Board of Directors has considered whether the provision of non-audit services that were rendered to the registrant’s adviser (not including any sub-adviser whose role is primarily portfolio management and is subcontracted with or overseen by another investment adviser), and any entity
controlling, controlled by, or under common control with the investment adviser that provides ongoing services to the registrant that were not pre-approved pursuant to paragraph (c)(7)(ii) of Rule 2-01 of Regulation S-X, is compatible with maintaining the principal accountant’s independence.
Item 5. Audit Committee of Listed Registrants.
Not applicable.
Item 6. Investments
(a) The registrant’s “Schedule I — Investments in securities of unaffiliated issuers” (as set forth in 17 CFR 210.12-12) is included in Item 1 of this Form N-CSR.
(b) Not applicable.
Item 7. Disclosure of Proxy Voting Policies and Procedures for Closed-End Management Investment Companies.
Not applicable.
Item 8. Portfolio Managers of Closed-End Management Investment Companies.
Not applicable.
Item 9. Purchases of Equity Securities by Closed-End Management Investment Company and Affiliated Purchasers.
Not applicable.
Item 10. Submission of Matters to a Vote of Security Holders.
There were no material changes to the procedures by which shareholders may recommend nominees to the registrant’s board of directors.
Item 11. Controls and Procedures.
(a) The registrant’s principal executive officer and principal financial officers, based on their evaluation of the registrant’s disclosure controls and procedures as of a date within 90 days of the filing of this report, have concluded that such controls and procedures are adequately designed to ensure that material information required to be disclosed by the registrant in Form N-CSR is accumulated and communicated to the registrant’s management, including the principal executive officer and principal financial officer, or persons performing similar functions, as appropriate to allow timely decisions regarding required disclosure.
(b) There was no change in the registrant’s internal control over financial reporting that occurred during the registrant’s second fiscal quarter of the period covered by this report that has materially affected, or is reasonably likely to materially affect, the registrant’s internal control over financial reporting.
Item 12. Exhibits.
(a)(1) Code of ethics required to be disclosed under Item 2 of Form N-CSR attached hereto as Exhibit 99.CODE ETH.
(a)(2) Certifications pursuant to Rule 30a-2(a) under the Investment Company Act of 1940 (17 CFR 270.30a-2(a)) attached hereto as Exhibit 99.CERT.
(a)(3) Not applicable.
(b) Certification pursuant to Rule 30a-2(b) under the Investment Company Act of 1940 (17 CFR 270.30a-2(b)) attached hereto as Exhibit 99.906CERT.
SIGNATURES
Pursuant to the requirements of the Securities Exchange Act of 1934 and the Investment Company Act of 1940, the registrant has duly caused this report to be signed on its behalf by the undersigned, thereunto duly authorized.
(registrant) | Columbia Funds Series Trust |
| |
| |
By (Signature and Title) | /s/ Christopher O. Petersen |
| Christopher O. Petersen, President and Principal Executive Officer |
| |
| |
Date | June 21, 2016 |
| | | |
Pursuant to the requirements of the Securities Exchange Act of 1934 and the Investment Company Act of 1940, this report has been signed below by the following persons on behalf of the registrant and in the capacities and on the dates indicated.
By (Signature and Title) | /s/ Christopher O. Petersen |
| Christopher O. Petersen, President and Principal Executive Officer |
| |
| |
Date | June 21, 2016 |
| | |
By (Signature and Title) | /s/ Michael G. Clarke |
| Michael G. Clarke, Treasurer and Chief Financial Officer |
| |
| |
Date | June 21, 2016 |
| | |