UNITED STATES
SECURITIES AND EXCHANGE COMMISSION
Washington, D.C. 20549
FORM N-CSR
CERTIFIED SHAREHOLDER REPORT OF REGISTERED
MANAGEMENT INVESTMENT COMPANIES
Investment Company Act file number 811-09645
Columbia Funds Series Trust
(Exact name of registrant as specified in charter)
225 Franklin Street, Boston, Massachusetts 02110
(Address of principal executive offices) (Zip code)
Ryan Larrenaga
c/o Columbia Management Investment Advisers, LLC
225 Franklin Street
Boston, MA 02110
(Name and address of agent for service)
Registrant’s telephone number, including area code: (800) 345-6611
Date of fiscal year end: January 31
Date of reporting period: January 31, 2017
Form N-CSR is to be used by management investment companies to file reports with the Commission not later than 10 days after the transmission to stockholders of any report that is required to be transmitted to stockholders under Rule 30e-1 under the Investment Company Act of 1940 (17 CFR 270.30e-1). The Commission may use the information provided on Form N-CSR in its regulatory, disclosure review, inspection, and policymaking roles.
A registrant is required to disclose the information specified by Form N-CSR, and the Commission will make this information public. A registrant is not required to respond to the collection of information contained in Form N-CSR unless the Form displays a currently valid Office of Management and Budget (“OMB”) control number. Please direct comments concerning the accuracy of the information collection burden estimate and any suggestions for reducing the burden to Secretary, Securities and Exchange Commission, 450 Fifth Street, NW, Washington, DC 20549-0609. The OMB has reviewed this collection of information under the clearance requirements of 44 U.S.C. § 3507.
Item 1. Reports to Stockholders.

Annual Report
January 31, 2017
Columbia Global Strategic Equity Fund
Not FDIC Insured • No bank guarantee • May lose value
Dear Shareholders,
While emotions have run high following the outcome of the U.S. Presidential election, it remains unclear how the Trump presidency will unfold in terms of policy. We have a sense of the priorities espoused by the President over the past eighteen months, but campaign priorities are not always realized and are often never pursued. What seems certain is that, while some investors have already priced expectations into the market, others have retreated, preferring instead a wait and see approach. The outcome of such behaviors appears to have created conditions ripe for ongoing market volatility.
While volatility in the financial markets can be stressful, volatility itself is not a new phenomenon. Other factors that have been at the root cause of recent volatility include uncertainty following the United Kingdom’s vote to exit the European Union (Brexit), speculation around the Federal Reserve’s decision to increase interest rates, divergent central bank policy and geopolitical unrest. The point is, financial markets have fluctuated for years and may be expected to continue to fluctuate — sometimes wildly. If anything, such volatility seems to be the new normal, perhaps exacerbated by access to information and development of technological tools which have enabled investors to react rapidly to real and perceived change. So what can you do?
Position your portfolio for the reality of market volatility
That there is a historical precedent for market volatility, or even an acceptance that it may persist, offers little comfort. A measured and strategic approach remains the best strategy for investors to stay on track in achieving their investment goals.
Step 1: Review your investment goals
Take this opportunity to review your investment goals and the strategies you are pursuing to achieve those goals in order to remain focused on what’s important to you. It is entirely possible that your goals have changed in response either to your life situation or to changes in the market. Accept what you can’t control — volatility, and focus on what you can — your investment goals and strategies.
Step 2: Reassess your risk tolerance
Sit down with your financial advisor to discuss your investment goals and strategies, as well as any changes to your tolerance for risk. Consider your investment horizon. Increased market volatility and a new investment horizon may impact the strategies that can best help you achieve your investment goals. Remember, achieving your investment goals may require a certain amount of risk. Ultimately, you must maintain vigilance in reassessing your risk tolerance and the strategies you have selected in pursuit of your investment goals, and awareness of how those strategies may react to market volatility.
Step 3: Remain calm and focus on your long-term plan
Remember, investing is about the long game. Short term events are not necessarily evidence of a longer term reality. Investors who attempt to time the market too often end up reacting to a down turn by selling low and then compounding the problem by waiting on the sidelines, ultimately missing the right opportunity to reinvest.
Columbia Global Strategic Equity Fund | Annual Report 2017
President’s Message (continued)
As long as there is a market, there will be volatility. How you respond to that volatility can make a big difference in the measure of your success as an investor. Talk to your financial advisor about how working with Columbia Threadneedle Investments may help you position your portfolio for the reality of ongoing volatility and, perhaps, even turn such volatility into investment opportunity.
Sincerely,
Christopher O. Petersen
President, Columbia Funds
Investors should consider the investment objectives, risks, charges and expenses of a mutual fund carefully before investing. For a free prospectus and summary prospectus, which contains this and other important information about a fund, visit investor.columbiathreadneedleus.com. The prospectus should be read carefully before investing.
Columbia Funds are distributed by Columbia Management Investment Distributors, Inc., member FINRA, and managed by Columbia Management Investment Advisers, LLC.
© 2017 Columbia Management Investment Advisers, LLC. All rights reserved.
Columbia Global Strategic Equity Fund | Annual Report 2017
Columbia Global Strategic Equity Fund | Annual Report 2017
Investment objective
Columbia Global Strategic Equity Fund (the Fund) seeks capital appreciation.
Portfolio management
Mark Burgess
Co-manager
Managed Fund since 2015
Melda Mergen, CFA, CAIA
Co-manager
Managed Fund since March 2016
Morningstar style boxTM
The Morningstar Style Box is based on a fund’s portfolio holdings. For equity funds, the vertical axis shows the market capitalization of the stocks owned, and the horizontal axis shows investment style (value, blend, or growth). Information shown is based on the most recent data provided by Morningstar.
© 2017 Morningstar, Inc. All rights reserved. The Morningstar information contained herein: (1) is proprietary to Morningstar and/or its content providers; (2) may not be copied or distributed; and (3) is not warranted to be accurate, complete or timely. Neither Morningstar nor its content providers are responsible for any damages or losses arising from any use of this information.
| Average annual total returns (%) (for the period ended January 31, 2017) |
| | | Inception | 1 Year | 5 Years | 10 Years |
| Class A | Excluding sales charges | 10/15/96 | 15.63 | 9.34 | 5.07 |
| | Including sales charges | | 9.00 | 8.05 | 4.45 |
| Class B | Excluding sales charges | 08/12/97 | 14.84 | 8.53 | 4.30 |
| | Including sales charges | | 9.84 | 8.24 | 4.30 |
| Class C | Excluding sales charges | 10/15/96 | 14.81 | 8.54 | 4.29 |
| | Including sales charges | | 13.81 | 8.54 | 4.29 |
| Class K * | 03/07/11 | 15.85 | 9.48 | 5.15 |
| Class R | 01/23/06 | 15.30 | 9.06 | 4.80 |
| Class R4 * | 11/08/12 | 16.01 | 9.58 | 5.19 |
| Class R5 * | 11/08/12 | 16.04 | 9.71 | 5.25 |
| Class Z | 10/15/96 | 15.98 | 9.62 | 5.35 |
| MSCI ACWI (Net) | | 17.93 | 8.72 | 3.74 |
Returns for Class A are shown with and without the maximum initial sales charge of 5.75%. Returns for Class B are shown with and without the applicable contingent deferred sales charge (CDSC) of 5.00% in the first year, declining to 1.00% in the sixth year and eliminated thereafter. The Fund does not accept new investments in Class B shares, except for certain limited transactions. The Fund’s current Class B investors, having held their shares for the requisite time period, are no longer subject to a CDSC upon redemption of their shares. Returns for Class C are shown with and without the 1.00% CDSC for the first year only. The Fund’s other classes are not subject to sales charges and have limited eligibility. Please see the Fund’s prospectus for details. Performance for different share classes will vary based on differences in sales charges and fees associated with each class. All results shown assume reinvestment of distributions during the period. Returns do not reflect the deduction of taxes that a shareholder may pay on Fund distributions or on the redemption of Fund shares. Performance results reflect the effect of any fee waivers or reimbursements of Fund expenses by Columbia Management Investment Advisers, LLC and/or any of its affiliates. Absent these fee waivers or expense reimbursement arrangements, performance results would have been lower.
The performance information shown represents past performance and is not a guarantee of future results. The investment return and principal value of your investment will fluctuate so that your shares, when redeemed, may be worth more or less than their original cost. Current performance may be lower or higher than the performance information shown. You may obtain performance information current to the most recent month-end by contacting your financial intermediary, visiting investor.columbiathreadneedleus.com or calling 800.345.6611.
| * | The returns shown for periods prior to the share class inception date (including returns for the Life of the Fund, if shown, which are since Fund inception) include the returns of the Fund’s oldest share class. Since the Fund launched more than one share class at its inception, Class A shares were used. These returns are adjusted to reflect any higher class-related operating expenses of the newer share classes, as applicable. Please visit investor.columbiathreadneedleus.com/investment-products/mutual-funds/appended-performance for more information. |
The MSCI ACWI (Net) is a free float-adjusted market capitalization weighted index that is designed to measure the equity market performance of developed and emerging markets. The index consists of 45 country indices comprising 24 developed and 21 emerging market country indices.
Indices are not available for investment, are not professionally managed and do not reflect sales charges, fees, brokerage commissions, taxes (except the MSCI ACWI Index (Net), which reflects reinvested dividends net of withholding taxes) or other expenses of investing. Securities in the Fund may not match those in an index.
Columbia Global Strategic Equity Fund | Annual Report 2017
| 3 |
Fund at a Glance (continued)
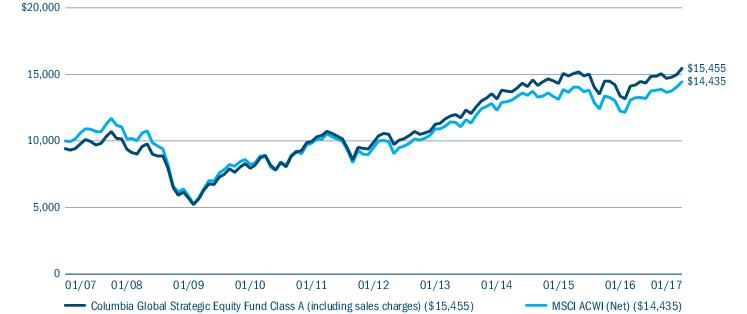
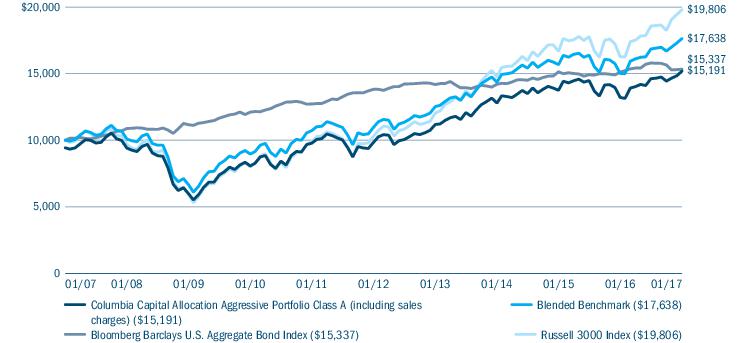
Performance of a hypothetical $10,000 investment (January 31, 2007 — January 31, 2017)
The chart above shows the change in value of a hypothetical $10,000 investment in Class A shares of Columbia Global Strategic Equity Fund during the stated time period, and does not reflect the deduction of taxes that a shareholder may pay on Fund distributions or on the redemption of Fund shares.
| Portfolio breakdown (%) (at January 31, 2017) |
| Common Stocks | 9.1 |
| Equity Funds | 86.6 |
| Exchange-Traded Funds | 0.3 |
| Fixed-Income Funds | 3.6 |
| Money Market Funds | 0.4 |
| Total | 100.0 |
Percentages indicated are based upon total investments. The Fund’s portfolio composition is subject to change.
| 4 | Columbia Global Strategic Equity Fund | Annual Report 2017 |
Manager Discussion of Fund Performance
For the 12-month period that ended January 31, 2017, the Fund’s Class A shares returned 15.63% excluding sales charges. While absolute returns were robust, the Fund underperformed its benchmark, the MSCI ACWI (Net), which returned 17.93% during the same time period. We attribute the portfolio’s underperformance of the benchmark primarily to positioning, via underlying funds, in European and emerging market equities, which more than offset positioning in commodity and technology stocks, which contributed positively.
Global equities made solid gains despite challenges and surprises
Global equity markets made solid gains in U.S. dollar terms during the 12-month period ended January 31, 2017. After a choppy start, global equities rallied on the back of recovering oil prices and enhanced stimulus measures from the European Central Bank (ECB). However, global equity markets then saw heightened volatility late in the second quarter of 2016 following the U.K.’s surprise referendum vote to leave the European Union, popularly known as Brexit. Global equities subsequently staged something of a “relief rally,” partly due to low core bond yields driving investors to higher yielding assets. Later in the period, initial concern about the prospects of a Donald Trump presidency gave way to a market surge after the candidate’s surprise victory. Financials, energy firms and construction companies were among the key beneficiaries amid expectations for a more favorable regulatory environment, lower corporate taxes and higher infrastructure spending. Meanwhile, an agreement by OPEC to cut oil production in 2017 provided a further boost to oil prices in the last months of the annual period.
From a regional perspective, U.S. equities rose strongly through most of the period. Alongside oil prices and political issues, investors retained a sharp focus on Federal Reserve (Fed) intentions, with market sentiment often waxing and waning in line with the perceived likelihood of further interest rate increases. During the first half of the period, those who favored hiking interest rates sooner than later were largely kept at bay by mixed economic data and uncertainty around global politics. However, during the second half of the period, robust employment data heightened expectations for an interest rate hike. In December 2016, this interest rate increase was delivered when the Fed raised the targeted federal funds rate by 25 basis points. (A basis point is 1/100th of a percentage point.) Following Trump’s victory, the U.S. equity market hit record highs.
European equity markets had a tougher time than their U.S. counterparts but still finished the period in positive territory. Central bank activity was also in the foreground in the eurozone. The ECB initially boosted stimulus, but then opted to pause in the wake of the Brexit vote before it announced an extension to its bond-buying program (albeit with reduced monthly purchases) until at least December 2017. Later in the period, regional news was dominated by a constitutional referendum in Italy. There, constitutional reform proposals were soundly rejected, prompting the resignation of Italy’s prime minister. Having largely priced in a “no” vote, European equity markets were largely unaffected by the referendum result.
In the U.K., market sentiment increasingly shifted in line with forecasts for the outcome of its European Union membership vote. Although the surprise result initially prompted a large-scale sell-off, the U.K. equity market quickly bounced back as fears about the potential impact of Brexit eased. Post-Brexit economic indicators overall beat consensus forecasts, but the British pound sterling weakened on fears of a possible “hard Brexit” (i.e. without access to the European single-market).
Throughout the period, Japan battled to boost inflation and weaken the yen, with mixed results. In the fourth quarter of 2016, the yen depreciated as investors anticipated both faster U.S. interest rate hikes and the Bank of Japan keeping its interest rates in negative territory. The weaker currency prompted a rise in Japan’s equity market, recovering losses from earlier in the period.
Emerging market equities made particularly strong gains during the period, despite the prospect, then reality, of rising interest rates in the United States. Brazilian equities rallied following the impeachment of its president, Dilma Rousseff. Oil exporters, including Russia, saw their equity markets gain as oil prices climbed. Still, in the wake of Trump’s victory, sentiment toward China cooled on worries about the outlook for its trading relationship with the United States.
All told, for the period overall, the broad global equity market, as measured by the benchmark, underperformed the broad U.S. equity market, as measured by the S&P 500 Index, which rose 20.04%. As measured by the MSCI EAFE Index (Net) and the MSCI Emerging Markets Index (Net), respectively, international developed market equities and emerging market equities returned 12.03% and 25.41%, respectively.
Columbia Global Strategic Equity Fund | Annual Report 2017
| 5 |
Manager Discussion of Fund Performance (continued)
Positioning in European and emerging market equities dampened relative results
Via positions in underlying funds, an overweight in European equities, which lagged the benchmark during the period, and an underweight in emerging market equities, which outpaced the benchmark during the period, detracted most from the Fund’s relative results. Notable detractors during the period were positions in underlying funds Columbia European Equity Fund, Columbia Select Global Equity Fund, Columbia International Opportunities Fund and Columbia Emerging Markets Fund. Also, within the U.S. equity market, exposure to growth stocks, via positions in underlying funds, dampened results, as value stocks performed significantly better than growth stocks during the period. A position in underlying fund Columbia Large Cap Growth Fund detracted.
On the positive side, exposure to commodity and information technology stocks, via positions in underlying funds, added value given the rally in these sectors during the period. Also, within the U.S. equity market, exposure to value stocks boosted relative results as did exposure to small cap stocks, which handily outpaced large cap stocks during the period. More specifically, positive contributors included positions in underlying funds Columbia Global Energy and Natural Resources Fund, Columbia Global Technology Growth Fund, Columbia Disciplined Value Fund and Columbia Small Cap Growth Fund. An out-of-benchmark exposure to convertible securities, via underlying fund Columbia Convertible Securities Fund, also contributed positively to relative results.
Risk management analysis drove portfolio changes
Changes within the portfolio can be driven by active trading, by directing allocations to select market segments or by market appreciation or depreciation within a given market segment, all via investments in underlying funds. Throughout the period, we rebalanced the Fund’s portfolio as we sought to manage risk. Via varying positions in underlying funds, we increased the Fund’s exposure to U.S. value-oriented stocks, having begun the period with a significant tilt toward growth stocks. We trimmed exposures to Japanese equities, U.S. small-cap equities and information technology stocks, via positions in underlying funds.
Market risk may affect a single issuer, sector of the economy, industry or the market as a whole. Asset allocation does not assure a profit or protect against loss. The Fund’s investment in other funds subjects it to the investment performance (positive or negative), risks and expenses of these underlying funds. ETFs trade like stocks, are subject to investment risk and will fluctuate in market value. Investment products, including shares of mutual funds, are not federally or FDIC-insured, are not deposits or obligations of, or guaranteed by any financial institution. The Fund may invest significantly in issuers within a particular sector, which may be negatively affected by market, economic or other conditions, making the Fund more vulnerable to unfavorable developments in the sector. International investing involves certain risks and volatility due to potential political, economic or currency instabilities and different financial and accounting standards. Investing in derivatives is a specialized activity that involves special risks, which may result in significant losses or limited gains. See the Fund’s prospectus for more information on these and other risks.
| 6 | Columbia Global Strategic Equity Fund | Annual Report 2017 |
Understanding Your Fund’s Expenses
(Unaudited)
As an investor, you incur two types of costs. There are transaction costs, which generally include sales charges on purchases and may include redemption fees. There are also ongoing costs, which generally include management fees, distribution and/or service fees, and other fund expenses. The following information is intended to help you understand your ongoing costs (in dollars) of investing in the Fund and to help you compare these costs with the ongoing costs of investing in other mutual funds.
Analyzing your Fund’s expenses
To illustrate these ongoing costs, we have provided examples and calculated the expenses paid by investors in each share class of the Fund during the period. The actual and hypothetical information in the table is based on an initial investment of $1,000 at the beginning of the period indicated and held for the entire period. Expense information is calculated two ways and each method provides you with different information. The amount listed in the “Actual” column is calculated using the Fund’s actual operating expenses and total return for the period. You may use the Actual information, together with the amount invested, to estimate the expenses that you paid over the period. Simply divide your account value by $1,000 (for example, an $8,600 account value divided by $1,000 = 8.6), then multiply the results by the expenses paid during the period under the “Actual” column. The amount listed in the “Hypothetical” column assumes a 5% annual rate of return before expenses (which is not the Fund’s actual return) and then applies the Fund’s actual expense ratio for the period to the hypothetical return. You should not use the hypothetical account values and expenses to estimate either your actual account balance at the end of the period or the expenses you paid during the period. See “Compare with other funds” below for details on how to use the hypothetical data.
In addition to the ongoing expenses which the Fund bears directly, the Fund’s shareholders indirectly bear the Fund’s allocable share of the costs and expenses of each underlying fund in which the Fund invests. You can also estimate the effective expenses paid during the period, which includes the indirect fees associated with investing in the underlying funds, by using the amounts listed in the “Effective expenses paid during the period” column.
Compare with other funds
Since all mutual funds are required to include the same hypothetical calculations about expenses in shareholder reports, you can use this information to compare the ongoing cost of investing in the Fund with other funds. To do so, compare the hypothetical example with the 5% hypothetical examples that appear in the shareholder reports of other funds. As you compare hypothetical examples of other funds, it is important to note that hypothetical examples are meant to highlight the ongoing costs of investing in a fund only and do not reflect any transaction costs, such as sales charges, or redemption or exchange fees. Therefore, the hypothetical calculations are useful in comparing ongoing costs only, and will not help you determine the relative total costs of owning different funds. If transaction costs were included in these calculations, your costs would be higher.
| August 1, 2016 — January 31, 2017 |
| | Account value at the
beginning of the
period ($) | Account value at the
end of the
period ($) | Expenses paid during
the period ($) | Fund’s annualized
expense ratio (%) | Effective expenses
paid during the
period ($) | Fund’s effective
annualized
expense ratio (%) |
| | Actual | Hypothetical | Actual | Hypothetical | Actual | Hypothetical | Actual | Actual | Hypothetical | Actual |
| Class A | 1,000.00 | 1,000.00 | 1,040.80 | 1,022.82 | 2.64 | 2.62 | 0.51 | 6.69 | 6.63 | 1.29 |
| Class B | 1,000.00 | 1,000.00 | 1,037.50 | 1,019.01 | 6.52 | 6.46 | 1.26 | 10.56 | 10.47 | 2.04 |
| Class C | 1,000.00 | 1,000.00 | 1,037.90 | 1,019.01 | 6.52 | 6.46 | 1.26 | 10.56 | 10.47 | 2.04 |
| Class K | 1,000.00 | 1,000.00 | 1,042.20 | 1,023.22 | 2.23 | 2.21 | 0.43 | 6.28 | 6.22 | 1.21 |
| Class R | 1,000.00 | 1,000.00 | 1,039.80 | 1,021.55 | 3.94 | 3.90 | 0.76 | 7.98 | 7.91 | 1.54 |
| Class R4 | 1,000.00 | 1,000.00 | 1,043.10 | 1,024.09 | 1.35 | 1.34 | 0.26 | 5.40 | 5.35 | 1.04 |
| Class R5 | 1,000.00 | 1,000.00 | 1,043.00 | 1,024.50 | 0.93 | 0.93 | 0.18 | 4.98 | 4.94 | 0.96 |
| Class Z | 1,000.00 | 1,000.00 | 1,043.00 | 1,024.09 | 1.35 | 1.34 | 0.26 | 5.40 | 5.35 | 1.04 |
Expenses paid during the period are equal to the annualized expense ratio for each class as indicated above, multiplied by the average account value over the period and then multiplied by the number of days in the Fund’s most recent fiscal half year and divided by 366.
Effective expenses paid during the period and the Fund’s effective annualized expense ratio include expenses borne directly to the class plus the Fund’s pro rata portion of the ongoing expenses charged by the underlying funds using the expense ratio of each class of the underlying funds as of the underlying fund’s most recent shareholder report.
Columbia Global Strategic Equity Fund | Annual Report 2017
| 7 |
Portfolio of Investments
January 31, 2017
(Percentages represent value of investments compared to net assets)
| Common Stocks 9.1% |
| Issuer | Shares | Value ($) |
| Consumer Discretionary 1.1% |
| Auto Components 0.3% |
| Koito Manufacturing Co., Ltd. | 37,700 | 1,999,820 |
| Automobiles 0.6% |
| Fuji Heavy Industries Ltd. | 66,700 | 2,669,076 |
| Toyota Motor Corp. | 18,900 | 1,099,089 |
| Total | | 3,768,165 |
| Household Durables 0.2% |
| Sony Corp. | 34,400 | 1,041,555 |
| Total Consumer Discretionary | 6,809,540 |
| Consumer Staples 0.2% |
| Food & Staples Retailing 0.2% |
| Tsuruha Holdings, Inc. | 13,800 | 1,297,223 |
| Total Consumer Staples | 1,297,223 |
| Financials 1.4% |
| Banks 0.6% |
| Mitsubishi UFJ Financial Group, Inc. | 461,700 | 2,956,506 |
| Mizuho Financial Group, Inc. | 327,900 | 608,447 |
| Total | | 3,564,953 |
| Diversified Financial Services 0.4% |
| ORIX Corp. | 180,000 | 2,715,703 |
| Insurance 0.4% |
| Dai-ichi Life Holdings, Inc. | 126,800 | 2,298,745 |
| Total Financials | 8,579,401 |
| Health Care 0.5% |
| Health Care Equipment & Supplies 0.3% |
| Hoya Corp. | 48,400 | 2,109,609 |
| Pharmaceuticals 0.2% |
| Astellas Pharma, Inc. | 84,700 | 1,136,824 |
| Total Health Care | 3,246,433 |
| Industrials 3.0% |
| Building Products 0.4% |
| Daikin Industries Ltd. | 26,200 | 2,600,677 |
| Construction & Engineering 0.1% |
| Raito Kogyo Co., Ltd. | 45,300 | 475,358 |
| Electrical Equipment 0.4% |
| Nidec Corp. | 30,700 | 2,882,531 |
| Common Stocks (continued) |
| Issuer | Shares | Value ($) |
| Machinery 0.7% |
| Fujitec Co., Ltd. | 55,600 | 653,432 |
| Komatsu Ltd. | 52,700 | 1,247,863 |
| Nittoku Engineering Co., Ltd. | 46,500 | 740,853 |
| Takuma Co., Ltd. | 176,000 | 1,524,223 |
| Total | | 4,166,371 |
| Professional Services 0.4% |
| Nihon M&A Center, Inc. | 15,300 | 446,233 |
| Tanseisha Co., Ltd. | 152,800 | 1,202,234 |
| Temp Holdings Co., Ltd. | 37,500 | 650,339 |
| Total | | 2,298,806 |
| Road & Rail 0.1% |
| Trancom Co., Ltd. | 9,200 | 443,196 |
| Trading Companies & Distributors 0.9% |
| Hanwa Co., Ltd. | 133,000 | 907,144 |
| ITOCHU Corp. | 88,700 | 1,221,923 |
| MISUMI Group, Inc. | 40,600 | 758,560 |
| Mitsubishi Corp. | 118,600 | 2,679,185 |
| Total | | 5,566,812 |
| Total Industrials | 18,433,751 |
| Information Technology 1.3% |
| Electronic Equipment, Instruments & Components 0.6% |
| Hitachi High-Technologies Corp. | 29,800 | 1,276,456 |
| Keyence Corp. | 5,800 | 2,252,531 |
| Total | | 3,528,987 |
| Semiconductors & Semiconductor Equipment 0.6% |
| Lasertec Corp. | 47,000 | 980,362 |
| Rohm Co., Ltd. | 16,800 | 1,074,297 |
| Tokyo Electron Ltd. | 16,600 | 1,719,507 |
| Total | | 3,774,166 |
| Technology Hardware, Storage & Peripherals 0.1% |
| Elecom Co., Ltd. | 34,800 | 590,978 |
| Total Information Technology | 7,894,131 |
The accompanying Notes to Financial Statements are an integral part of this statement.
| 8 | Columbia Global Strategic Equity Fund | Annual Report 2017 |
Portfolio of Investments (continued)
January 31, 2017
| Common Stocks (continued) |
| Issuer | Shares | Value ($) |
| Materials 0.5% |
| Chemicals 0.5% |
| Mitsui Chemicals, Inc. | 293,000 | 1,377,858 |
| Nitto Denko Corp. | 19,000 | 1,503,402 |
| Total | | 2,881,260 |
| Total Materials | 2,881,260 |
| Real Estate 0.1% |
| Real Estate Management & Development 0.1% |
| Daito Trust Construction Co., Ltd. | 4,600 | 643,077 |
| Relo Group, Inc. | 2,100 | 308,688 |
| Total | | 951,765 |
| Total Real Estate | 951,765 |
| Telecommunication Services 1.0% |
| Diversified Telecommunication Services 0.4% |
| Nippon Telegraph & Telephone Corp. | 57,000 | 2,517,822 |
| Wireless Telecommunication Services 0.6% |
| SoftBank Group Corp. | 45,700 | 3,520,717 |
| Total Telecommunication Services | 6,038,539 |
Total Common Stocks
(Cost $51,713,834) | 56,132,043 |
|
| Equity Funds 86.7% |
| | Shares | Value ($) |
| Dividend Income 11.6% |
| Columbia Dividend Income Fund, Class I Shares(a) | 1,756,531 | 33,901,045 |
| Columbia Global Dividend Opportunity Fund, Class I Shares(a) | 2,211,783 | 37,777,267 |
| Total | 71,678,312 |
| International 45.8% |
| Columbia Asia Pacific ex-Japan Fund, Class I Shares(a) | 1,258,054 | 13,347,949 |
| Columbia Emerging Markets Fund, Class I Shares(a),(b) | 2,612,421 | 26,333,200 |
| Columbia European Equity Fund, Class I Shares(a) | 8,191,787 | 49,806,062 |
| Columbia Global Energy and Natural Resources Fund, Class I Shares(a) | 919,902 | 16,834,215 |
| Columbia Global Infrastructure Fund, Class I Shares(a) | 2,019,699 | 24,620,131 |
| Columbia Global Technology Growth Fund, Class I Shares(a),(b) | 1,347,797 | 34,126,225 |
| Equity Funds (continued) |
| | Shares | Value ($) |
| Columbia Overseas Value Fund, Class I Shares(a) | 6,704,822 | 56,789,842 |
| Columbia Select Global Equity Fund, Class I Shares(a),(b) | 5,959,628 | 62,158,924 |
| Total | 284,016,548 |
| U.S. Large Cap 25.6% |
| Columbia Disciplined Value Fund, Class I Shares(a) | 6,433,238 | 62,981,404 |
| Columbia Large Cap Growth Fund, Class I Shares(a) | 640,010 | 22,848,362 |
| Columbia Select Large Cap Equity Fund, Class I Shares(a) | 4,962,502 | 62,279,394 |
| Columbia Select Large Cap Growth Fund, Class I Shares(a),(b) | 696,729 | 10,381,256 |
| Total | 158,490,416 |
| U.S. Small Cap 3.7% |
| Columbia Small Cap Growth Fund I, Class I Shares(a),(b) | 1,231,528 | 22,795,589 |
Total Equity Funds
(Cost $532,224,851) | 536,980,865 |
|
| Exchange-Traded Funds 0.3% |
| | |
| WisdomTree Japan Hedged Equity Fund | 42,440 | 2,116,483 |
Total Exchange-Traded Funds
(Cost $1,778,066) | 2,116,483 |
|
| Fixed-Income Funds 3.6% |
| | |
| Convertible 3.6% |
| Columbia Convertible Securities Fund, Class I Shares(a) | 1,207,665 | 22,196,884 |
Total Fixed-Income Funds
(Cost $19,251,576) | 22,196,884 |
|
| Money Market Funds 0.4% |
| | Shares | Value ($) |
| Columbia Short-Term Cash Fund, 0.662%(a),(c) | 2,660,125 | 2,660,124 |
Total Money Market Funds
(Cost $2,660,124) | 2,660,124 |
Total Investments
(Cost: $607,628,451) | 620,086,399 |
| Other Assets & Liabilities, Net | | (750,555) |
| Net Assets | 619,335,844 |
The accompanying Notes to Financial Statements are an integral part of this statement.
Columbia Global Strategic Equity Fund | Annual Report 2017
| 9 |
Portfolio of Investments (continued)
January 31, 2017
Notes to Portfolio of Investments
| (a) | As defined in the Investment Company Act of 1940, an affiliated company is one in which the Fund owns 5% or more of the company’s outstanding voting securities, or a company which is under common ownership or control with the Fund. Holdings and transactions in these affiliated companies during the year ended January 31, 2017 are as follows: |
| Issuer | Beginning
shares | Shares
purchased | Shares
sold | Ending
shares | Capital gain
distributions ($) | Realized gain
(loss) ($) | Dividends —
affiliated
issuers ($) | Value ($) |
| Columbia Asia Pacific ex-Japan Fund, Class I Shares | 1,545,119 | 50,584 | (337,649) | 1,258,054 | — | (1,416,277) | 179,755 | 13,347,949 |
| Columbia Contrarian Core Fund, Class I Shares | 1,860,167 | — | (1,860,167) | — | — | 1,296,000 | — | — |
| Columbia Convertible Securities Fund, Class I Shares | 1,623,781 | 737,714 | (1,153,830) | 1,207,665 | — | 3,088,760 | 677,827 | 22,196,884 |
| Columbia Disciplined Core Fund, Class I Shares | 2,393,964 | — | (2,393,964) | — | — | 2,996,702 | — | — |
| Columbia Disciplined Value Fund, Class I Shares | — | 7,589,272 | (1,156,034) | 6,433,238 | — | 560,500 | 1,181,782 | 62,981,404 |
| Columbia Dividend Income Fund, Class I Shares | 1,546,484 | 598,111 | (388,064) | 1,756,531 | 796,762 | 2,024,108 | 720,170 | 33,901,045 |
| Columbia Emerging Markets Fund, Class I Shares | 2,109,773 | 1,107,521 | (604,873) | 2,612,421 | — | (193,860) | — | 26,333,200 |
| Columbia European Equity Fund, Class I Shares | 9,393,015 | 345,645 | (1,546,873) | 8,191,787 | — | (1,713,111) | 1,260,018 | 49,806,062 |
| Columbia Global Dividend Opportunity Fund, Class I Shares | 3,659,863 | 150,661 | (1,598,741) | 2,211,783 | — | (6,506,646) | 1,445,414 | 37,777,267 |
| Columbia Global Energy and Natural Resources Fund, Class I Shares | 1,206,040 | 50,946 | (337,084) | 919,902 | — | (1,404,348) | 289,295 | 16,834,215 |
| Columbia Global Equity Value Fund, Class I Shares | 1,852,643 | 6,663 | (1,859,306) | — | — | (2,189,868) | 72,432 | — |
| Columbia Global Infrastructure Fund, Class I Shares | 2,374,594 | 108,767 | (463,662) | 2,019,699 | — | (4,118,725) | 674,214 | 24,620,131 |
| Columbia Global Technology Growth Fund, Class I Shares | 3,012,176 | 600,060 | (2,264,439) | 1,347,797 | 113,296 | 3,069,278 | — | 34,126,225 |
| Columbia International Opportunities Fund, Class I Shares | 2,134,832 | 30,655 | (2,165,487)* | — | — | (113,825) | 359,454 | — |
| Columbia Large Cap Growth Fund, Class I Shares | 1,077,990 | 23,452 | (461,432) | 640,010 | 301,724 | 3,392,137 | 133,872 | 22,848,362 |
| Columbia Overseas Value Fund, Class I Shares | 2,425,769 | 6,513,139 | (2,234,086) | 6,704,822 | — | (1,891,468) | 1,222,962 | 56,789,842 |
| Columbia Select Global Equity Fund, Class I Shares | 6,850,002 | 123,795 | (1,014,169) | 5,959,628 | — | 120,201 | — | 62,158,924 |
| Columbia Select International Equity Fund, Class I Shares | — | 2,122,966* | (2,122,966) | — | — | (3,564,027) | — | — |
| Columbia Select Large Cap Equity Fund, Class I Shares | — | 4,962,502 | — | 4,962,502 | 605,554 | — | 776,048 | 62,279,394 |
| Columbia Select Large Cap Growth Fund, Class I Shares | 923,460 | 755,110 | (981,841) | 696,729 | 1,223,194 | (1,836,512) | — | 10,381,256 |
| Columbia Short-Term Cash Fund, 0.662% | 2,603,359 | 41,102,369 | (41,045,603) | 2,660,125 | — | (40) | 8,724 | 2,660,124 |
| Columbia Small Cap Growth Fund I, Class I Shares | 1,590,402 | 965,332 | (1,324,206) | 1,231,528 | 1,822,773 | (15,009,435) | — | 22,795,589 |
| Total | 50,183,433 | 67,945,264 | (67,314,476) | 50,814,221 | 4,863,303 | (23,410,456) | 9,001,967 | 561,837,873 |
| * | Includes the effect of underlying fund reorganization. |
| (b) | Non-income producing investment. |
| (c) | The rate shown is the seven-day current annualized yield at January 31, 2017. |
The accompanying Notes to Financial Statements are an integral part of this statement.
| 10 | Columbia Global Strategic Equity Fund | Annual Report 2017 |
Portfolio of Investments (continued)
January 31, 2017
Fair value measurements
The Fund categorizes its fair value measurements according to a three-level hierarchy that maximizes the use of observable inputs and minimizes the use of unobservable inputs by prioritizing that the most observable input be used when available. Observable inputs are those that market participants would use in pricing an investment based on market data obtained from sources independent of the reporting entity. Unobservable inputs are those that reflect the Fund’s assumptions about the information market participants would use in pricing an investment. An investment’s level within the fair value hierarchy is based on the lowest level of any input that is deemed significant to the asset’s or liability’s fair value measurement. The input levels are not necessarily an indication of the risk or liquidity associated with investments at that level. For example, certain U.S. government securities are generally high quality and liquid, however, they are reflected as Level 2 because the inputs used to determine fair value may not always be quoted prices in an active market.
Fair value inputs are summarized in the three broad levels listed below:
| • | Level 1 - Valuations based on quoted prices for investments in active markets that the Fund has the ability to access at the measurement date (including NAV for open-end mutual funds). Valuation adjustments are not applied to Level 1 investments. |
| • | Level 2 – Valuations based on other significant observable inputs (including quoted prices for similar securities, interest rates, prepayment speeds, credit risks, etc.). |
| • | Level 3 – Valuations based on significant unobservable inputs (including the Fund’s own assumptions and judgment in determining the fair value of investments). |
Inputs that are used in determining fair value of an investment may include price information, credit data, volatility statistics, and other factors. These inputs can be either observable or unobservable. The availability of observable inputs can vary between investments, and is affected by various factors such as the type of investment, and the volume and level of activity for that investment or similar investments in the marketplace. The inputs will be considered by the Investment Manager, along with any other relevant factors in the calculation of an investment’s fair value. The Fund uses prices and inputs that are current as of the measurement date, which may include periods of market dislocations. During these periods, the availability of prices and inputs may be reduced for many investments. This condition could cause an investment to be reclassified between the various levels within the hierarchy.
Foreign equity securities actively traded in markets where there is a significant delay in the local close relative to the New York Stock Exchange (NYSE) are classified as Level 2. The values of these securities may include an adjustment to reflect the impact of significant market movements following the close of local trading, as described in Note 2 to the financial statements – Security Valuation
Certain investments that have been measured at fair value using the net asset value (NAV) per share (or its equivalent) are not categorized in the fair value hierarchy. The fair value amounts presented in the table are intended to reconcile the fair value hierarchy to the amounts presented in the Portfolio of Investments. The Columbia Short-Term Cash Fund seeks to provide shareholders with maximum current income consistent with liquidity and stability of principal. Columbia Short-Term Cash Fund prices its shares with a floating NAV and no longer seeks to maintain a stable NAV.
Investments falling into the Level 3 category are primarily supported by quoted prices from brokers and dealers participating in the market for those investments. However, these may be classified as Level 3 investments due to lack of market transparency and corroboration to support these quoted prices. Additionally, valuation models may be used as the pricing source for any remaining investments classified as Level 3. These models may rely on one or more significant unobservable inputs and/or significant assumptions by the Investment Manager. Inputs used in valuations may include, but are not limited to, financial statement analysis, capital account balances, discount rates and estimated cash flows, and comparable company data.
Under the direction of the Fund���s Board of Trustees (the Board), the Investment Manager’s Valuation Committee (the Committee) is responsible for overseeing the valuation procedures approved by the Board. The Committee consists of voting and non-voting members from various groups within the Investment Manager’s organization, including operations and accounting, trading and investments, compliance, risk management and legal.
The Committee meets at least monthly to review and approve valuation matters, which may include a description of specific valuation determinations, data regarding pricing information received from approved pricing vendors and brokers and the results of Board-approved valuation control policies and procedures (the Policies). The Policies address, among other things, instances when market quotations are or are not readily available, including recommendations of third party pricing vendors and a determination of appropriate pricing methodologies; events that require specific valuation determinations and assessment of fair value techniques; securities with a potential for stale pricing, including those that are illiquid, restricted, or in default; and the effectiveness of third party pricing vendors, including periodic reviews of vendors. The Committee meets more frequently, as needed, to discuss additional valuation matters, which may include the need to review back-testing results, review time-sensitive information or approve related valuation actions. The Committee reports to the Board, with members of the Committee meeting with the Board at each of its regularly scheduled meetings to discuss valuation matters and actions during the period, similar to those described earlier.
For investments categorized as Level 3, the Committee monitors information similar to that described above, which may include: (i) data specific to the issuer or comparable issuers, (ii) general market or specific sector news and (iii) quoted prices and specific or similar security transactions. The Committee considers this data and any changes from prior periods in order to assess the reasonableness of observable and unobservable inputs, any assumptions or internal models used to value those securities and changes in fair value. This data is also used to corroborate, when available, information received from approved pricing vendors and brokers. Various factors impact the frequency of monitoring this information (which may occur as often as daily). However, the Committee may determine that changes to inputs, assumptions and models are not required as a result of the monitoring procedures performed.
The following table is a summary of the inputs used to value the Fund’s investments at January 31, 2017:
| | Level 1
quoted prices
in active
markets for
identical
assets ($) | Level 2
other
significant
observable
inputs ($) | Level 3
significant
unobservable
inputs ($) | Investments
measured at
net asset
value ($) | Total ($) |
| Investments | | | | | |
| Common Stocks | | | | | |
| Consumer Discretionary | — | 6,809,540 | — | — | 6,809,540 |
| Consumer Staples | — | 1,297,223 | — | — | 1,297,223 |
| Financials | — | 8,579,401 | — | — | 8,579,401 |
| Health Care | — | 3,246,433 | — | — | 3,246,433 |
| Industrials | — | 18,433,751 | — | — | 18,433,751 |
The accompanying Notes to Financial Statements are an integral part of this statement.
Columbia Global Strategic Equity Fund | Annual Report 2017
| 11 |
Portfolio of Investments (continued)
January 31, 2017
Fair value measurements (continued)
| | Level 1
quoted prices
in active
markets for
identical
assets ($) | Level 2
other
significant
observable
inputs ($) | Level 3
significant
unobservable
inputs ($) | Investments
measured at
net asset
value ($) | Total ($) |
| Information Technology | — | 7,894,131 | — | — | 7,894,131 |
| Materials | — | 2,881,260 | — | — | 2,881,260 |
| Real Estate | — | 951,765 | — | — | 951,765 |
| Telecommunication Services | — | 6,038,539 | — | — | 6,038,539 |
| Total Common Stocks | — | 56,132,043 | — | — | 56,132,043 |
| Equity Funds | 536,980,865 | — | — | — | 536,980,865 |
| Exchange-Traded Funds | 2,116,483 | — | — | — | 2,116,483 |
| Fixed-Income Funds | 22,196,884 | — | — | — | 22,196,884 |
| Money Market Funds | — | — | — | 2,660,124 | 2,660,124 |
| Total Investments | 561,294,232 | 56,132,043 | — | 2,660,124 | 620,086,399 |
See the Portfolio of Investments for all investment classifications not indicated in the table.
The Fund’s assets assigned to the Level 2 input category are generally valued using the market approach, in which a security’s value is determined through reference to prices and information from market transactions for similar or identical assets. These assets include certain foreign securities for which a third party statistical pricing service may be employed for purposes of fair market valuation. The model utilized by such third party statistical pricing service takes into account a security’s correlation to available market data including, but not limited to, intraday index, ADR, and exchange-traded fund movements.
There were no transfers of financial assets between levels during the period.
The accompanying Notes to Financial Statements are an integral part of this statement.
| 12 | Columbia Global Strategic Equity Fund | Annual Report 2017 |
Statement of Assets and Liabilities
January 31, 2017
| Assets | |
| Investments, at cost | |
| Unaffiliated issuers, at cost | $53,491,900 |
| Affiliated issuers, at cost | 554,136,551 |
| Total investments, at cost | 607,628,451 |
| Investments, at value | |
| Unaffiliated issuers, at value | 58,248,526 |
| Affiliated issuers, at value | 561,837,873 |
| Total investments, at value | 620,086,399 |
| Receivable for: | |
| Investments sold | 1,185,728 |
| Capital shares sold | 272,237 |
| Dividends | 14,729 |
| Foreign tax reclaims | 79,609 |
| Prepaid expenses | 2,486 |
| Other assets | 566 |
| Total assets | 621,641,754 |
| Liabilities | |
| Payable for: | |
| Investments purchased | 160,476 |
| Capital shares purchased | 1,998,771 |
| Management services fees | 1,247 |
| Distribution and/or service fees | 5,726 |
| Transfer agent fees | 60,145 |
| Plan administration fees | 1 |
| Compensation of board members | 32,609 |
| Compensation of chief compliance officer | 136 |
| Other expenses | 46,799 |
| Total liabilities | 2,305,910 |
| Net assets applicable to outstanding capital stock | $619,335,844 |
| Represented by | |
| Paid in capital | 626,318,088 |
| Undistributed net investment income | 5,865,259 |
| Accumulated net realized loss | (25,302,880) |
| Unrealized appreciation (depreciation) on: | |
| Investments - unaffiliated issuers | 4,756,626 |
| Investments - affiliated issuers | 7,701,322 |
| Foreign currency translations | (2,571) |
| Total - representing net assets applicable to outstanding capital stock | $619,335,844 |
The accompanying Notes to Financial Statements are an integral part of this statement.
Columbia Global Strategic Equity Fund | Annual Report 2017
| 13 |
Statement of Assets and Liabilities (continued)
January 31, 2017
| Class A | |
| Net assets | $515,289,755 |
| Shares outstanding | 40,404,179 |
| Net asset value per share | $12.75 |
| Maximum offering price per share(a) | $13.53 |
| Class B | |
| Net assets | $5,354,893 |
| Shares outstanding | 483,328 |
| Net asset value per share | $11.08 |
| Class C | |
| Net assets | $74,057,210 |
| Shares outstanding | 6,765,978 |
| Net asset value per share | $10.95 |
| Class K | |
| Net assets | $105,673 |
| Shares outstanding | 8,081 |
| Net asset value per share | $13.08 |
| Class R | |
| Net assets | $872,146 |
| Shares outstanding | 69,524 |
| Net asset value per share | $12.54 |
| Class R4 | |
| Net assets | $283,606 |
| Shares outstanding | 21,308 |
| Net asset value per share | $13.31 |
| Class R5 | |
| Net assets | $607,426 |
| Shares outstanding | 45,569 |
| Net asset value per share | $13.33 |
| Class Z | |
| Net assets | $22,765,135 |
| Shares outstanding | 1,736,931 |
| Net asset value per share | $13.11 |
| (a) | The maximum offering price per share is calculated by dividing the net asset value per share by 1.0 minus the maximum sales charge of 5.75%. |
The accompanying Notes to Financial Statements are an integral part of this statement.
| 14 | Columbia Global Strategic Equity Fund | Annual Report 2017 |
Statement of Operations
Year Ended January 31, 2017
| Net investment income | |
| Income: | |
| Dividends — unaffiliated issuers | $1,151,462 |
| Dividends — affiliated issuers | 9,001,967 |
| Foreign taxes withheld | (114,443) |
| Total income | 10,038,986 |
| Expenses: | |
| Management services fees | 481,788 |
| Distribution and/or service fees | |
| Class A | 1,327,357 |
| Class B | 86,152 |
| Class C | 787,887 |
| Class R | 5,073 |
| Transfer agent fees | |
| Class A | 785,899 |
| Class B | 12,949 |
| Class C | 116,822 |
| Class K | 52 |
| Class R | 1,526 |
| Class R4 | 200 |
| Class R5 | 155 |
| Class Z | 35,149 |
| Plan administration fees | |
| Class K | 249 |
| Compensation of board members | 22,281 |
| Custodian fees | 29,327 |
| Printing and postage fees | 81,274 |
| Registration fees | 114,682 |
| Audit fees | 19,798 |
| Legal fees | 13,048 |
| Compensation of chief compliance officer | 136 |
| Other | 23,984 |
| Total expenses | 3,945,788 |
| Expense reduction | (600) |
| Total net expenses | 3,945,188 |
| Net investment income | 6,093,798 |
| Realized and unrealized gain (loss) — net | |
| Net realized gain (loss) on: | |
| Investments — unaffiliated issuers | (2,552,574) |
| Investments — affiliated issuers | (23,410,456) |
| Capital gain distributions from underlying affiliated funds | 4,863,303 |
| Foreign currency translations | 47,608 |
| Net realized loss | (21,052,119) |
| Net change in unrealized appreciation (depreciation) on: | |
| Investments — unaffiliated issuers | 7,957,390 |
| Investments — affiliated issuers | 99,091,402 |
| Foreign currency translations | 5,071 |
| Net change in unrealized appreciation (depreciation) | 107,053,863 |
| Net realized and unrealized gain | 86,001,744 |
| Net increase in net assets resulting from operations | $92,095,542 |
The accompanying Notes to Financial Statements are an integral part of this statement.
Columbia Global Strategic Equity Fund | Annual Report 2017
| 15 |
Statement of Changes in Net Assets
| | Year Ended
January 31, 2017 | Year Ended
January 31, 2016 |
| Operations | | |
| Net investment income | $6,093,798 | $11,740,257 |
| Net realized gain (loss) | (21,052,119) | 111,009,144 |
| Net change in unrealized appreciation (depreciation) | 107,053,863 | (167,910,932) |
| Net increase (decrease) in net assets resulting from operations | 92,095,542 | (45,161,531) |
| Distributions to shareholders | | |
| Net investment income | | |
| Class A | (566,248) | (13,318,216) |
| Class B | — | (319,406) |
| Class C | — | (1,739,569) |
| Class K | (151) | (2,283) |
| Class R | (160) | (53,623) |
| Class R4 | (244) | (2,177) |
| Class R5 | (678) | (8,879) |
| Class Z | (52,857) | (910,600) |
| Net realized gains | | |
| Class A | (14,097,120) | (116,440,092) |
| Class B | (272,449) | (3,762,199) |
| Class C | (2,457,719) | (20,400,096) |
| Class K | (2,547) | (19,260) |
| Class R | (22,501) | (511,499) |
| Class R4 | (3,387) | (18,379) |
| Class R5 | (4,845) | (69,949) |
| Class Z | (622,281) | (7,218,349) |
| Total distributions to shareholders | (18,103,187) | (164,794,576) |
| Increase (decrease) in net assets from capital stock activity | (97,374,176) | 49,111,670 |
| Total decrease in net assets | (23,381,821) | (160,844,437) |
| Net assets at beginning of year | 642,717,665 | 803,562,102 |
| Net assets at end of year | $619,335,844 | $642,717,665 |
| Undistributed net investment income | $5,865,259 | $21,552 |
The accompanying Notes to Financial Statements are an integral part of this statement.
| 16 | Columbia Global Strategic Equity Fund | Annual Report 2017 |
Statement of Changes in Net Assets (continued)
| | Year Ended | Year Ended |
| | January 31, 2017 | January 31, 2016 |
| | Shares | Dollars ($) | Shares | Dollars ($) |
| Capital stock activity |
| Class A | | | | |
| Subscriptions (a) | 2,815,693 | 33,990,935 | 4,286,880 | 59,866,975 |
| Distributions reinvested | 1,019,455 | 11,716,563 | 7,865,106 | 102,836,354 |
| Redemptions | (9,497,922) | (115,002,064) | (6,629,625) | (96,085,087) |
| Net increase (decrease) | (5,662,774) | (69,294,566) | 5,522,361 | 66,618,242 |
| Class B | | | | |
| Subscriptions | 3,747 | 37,619 | 69,249 | 824,483 |
| Distributions reinvested | 23,027 | 230,730 | 276,665 | 3,245,485 |
| Redemptions (a) | (776,055) | (8,129,868) | (1,158,577) | (15,443,704) |
| Net decrease | (749,281) | (7,861,519) | (812,663) | (11,373,736) |
| Class C | | | | |
| Subscriptions | 485,835 | 5,042,575 | 941,822 | 11,545,927 |
| Distributions reinvested | 184,438 | 1,825,941 | 1,431,675 | 16,346,154 |
| Redemptions | (2,040,310) | (21,308,973) | (1,370,592) | (17,423,012) |
| Net increase (decrease) | (1,370,037) | (14,440,457) | 1,002,905 | 10,469,069 |
| Class K | | | | |
| Distributions reinvested | 224 | 2,637 | 1,571 | 20,967 |
| Net increase | 224 | 2,637 | 1,571 | 20,967 |
| Class R | | | | |
| Subscriptions | 9,268 | 108,658 | 46,241 | 653,394 |
| Distributions reinvested | 1,267 | 14,329 | 40,316 | 523,858 |
| Redemptions | (142,500) | (1,604,910) | (61,623) | (882,713) |
| Net increase (decrease) | (131,965) | (1,481,923) | 24,934 | 294,539 |
| Class R4 | | | | |
| Subscriptions | 16,288 | 210,418 | 15,401 | 233,617 |
| Distributions reinvested | 299 | 3,575 | 1,585 | 20,033 |
| Redemptions | (1,324) | (17,029) | (11,621) | (154,423) |
| Net increase | 15,263 | 196,964 | 5,365 | 99,227 |
| Class R5 | | | | |
| Subscriptions | 39,992 | 521,412 | 8,399 | 126,968 |
| Distributions reinvested | 455 | 5,467 | 5,816 | 78,304 |
| Redemptions | (23,635) | (300,237) | (5,420) | (76,033) |
| Net increase | 16,812 | 226,642 | 8,795 | 129,239 |
| Class Z | | | | |
| Subscriptions | 478,869 | 5,919,766 | 420,245 | 6,139,485 |
| Distributions reinvested | 21,656 | 255,508 | 174,109 | 2,367,369 |
| Redemptions | (895,297) | (10,897,228) | (1,747,439) | (25,652,731) |
| Net decrease | (394,772) | (4,721,954) | (1,153,085) | (17,145,877) |
| Total net increase (decrease) | (8,276,530) | (97,374,176) | 4,600,183 | 49,111,670 |
| (a) | Includes conversions of Class B shares to Class A shares, if any. |
The accompanying Notes to Financial Statements are an integral part of this statement.
Columbia Global Strategic Equity Fund | Annual Report 2017
| 17 |
The following table is intended to help you understand the Fund’s financial performance. Certain information reflects financial results for a single share of a class held for the periods shown. Per share net investment income (loss) amounts are calculated based on average shares outstanding during the period. Total return assumes reinvestment of all dividends and distributions, if any. Total return does not reflect payment of sales charges, if any. Total return and portfolio turnover are not annualized for periods of less than one year. The portfolio turnover rate is calculated without regard to purchase and sales transactions of short-term instruments and certain derivatives, if any. If such transactions were included, the Fund’s portfolio turnover rate may be higher.
| Year ended | Net asset value,
beginning of
period | Net
investment
income | Net
realized
and
unrealized
gain (loss) | Total from
investment
operations | Distributions
from net
investment
income | Distributions
from net
realized
gains |
| Class A |
| 1/31/2017 | $11.35 | 0.13 | 1.61 | 1.74 | (0.02) | (0.32) |
| 1/31/2016 | $15.35 | 0.24 | (1.00) | (0.76) | (0.33) | (2.91) |
| 1/31/2015 | $14.83 | 0.17 | 1.16 | 1.33 | (0.35) | (0.46) |
| 1/31/2014 | $12.96 | 0.16 | 2.02 | 2.18 | (0.31) | — |
| 1/31/2013 | $11.59 | 0.17 | 1.42 | 1.59 | (0.22) | — |
| Class B |
| 1/31/2017 | $9.96 | 0.00 | 1.44 | 1.44 | — | (0.32) |
| 1/31/2016 | $13.88 | 0.09 | (0.85) | (0.76) | (0.25) | (2.91) |
| 1/31/2015 | $13.48 | 0.04 | 1.05 | 1.09 | (0.23) | (0.46) |
| 1/31/2014 | $11.79 | 0.04 | 1.86 | 1.90 | (0.21) | — |
| 1/31/2013 | $10.56 | 0.06 | 1.30 | 1.36 | (0.13) | — |
| Class C |
| 1/31/2017 | $9.85 | 0.03 | 1.39 | 1.42 | — | (0.32) |
| 1/31/2016 | $13.76 | 0.12 | (0.87) | (0.75) | (0.25) | (2.91) |
| 1/31/2015 | $13.36 | 0.05 | 1.04 | 1.09 | (0.23) | (0.46) |
| 1/31/2014 | $11.69 | 0.05 | 1.83 | 1.88 | (0.21) | — |
| 1/31/2013 | $10.47 | 0.07 | 1.28 | 1.35 | (0.13) | — |
| Class K |
| 1/31/2017 | $11.62 | 0.15 | 1.65 | 1.80 | (0.02) | (0.32) |
| 1/31/2016 | $15.64 | 0.27 | (1.03) | (0.76) | (0.35) | (2.91) |
| 1/31/2015 | $15.10 | 0.19 | 1.18 | 1.37 | (0.37) | (0.46) |
| 1/31/2014 | $13.19 | 0.19 | 2.05 | 2.24 | (0.33) | — |
| 1/31/2013 | $11.79 | 0.17 | 1.46 | 1.63 | (0.23) | — |
| Class R |
| 1/31/2017 | $11.19 | 0.08 | 1.60 | 1.68 | (0.01) | (0.32) |
| 1/31/2016 | $15.19 | 0.19 | (0.98) | (0.79) | (0.30) | (2.91) |
| 1/31/2015 | $14.68 | 0.13 | 1.15 | 1.28 | (0.31) | (0.46) |
| 1/31/2014 | $12.83 | 0.13 | 2.00 | 2.13 | (0.28) | — |
| 1/31/2013 | $11.48 | 0.14 | 1.40 | 1.54 | (0.19) | — |
| Class R4 |
| 1/31/2017 | $11.81 | 0.19 | 1.66 | 1.85 | (0.03) | (0.32) |
| 1/31/2016 | $15.85 | 0.39 | (1.16) | (0.77) | (0.36) | (2.91) |
| 1/31/2015 | $15.29 | 0.20 | 1.21 | 1.41 | (0.39) | (0.46) |
| 1/31/2014 | $13.35 | 0.27 | 2.02 | 2.29 | (0.35) | — |
| 1/31/2013 (d) | $12.29 | 0.11 | 1.05 | 1.16 | (0.10) | — |
The accompanying Notes to Financial Statements are an integral part of this statement.
| 18 | Columbia Global Strategic Equity Fund | Annual Report 2017 |
Total
distributions to
shareholders | Net
asset
value,
end of
period | Total
return | Total gross
expense
ratio to
average
net assets(a) | Total net
expense
ratio to
average
net assets(a),(b) | Net investment
income
ratio to
average
net assets | Portfolio
turnover | Net
assets,
end of
period
(000’s) |
| |
| (0.34) | $12.75 | 15.63% | 0.52% | 0.52% (c) | 1.05% | 54% | $515,290 |
| (3.24) | $11.35 | (6.66%) | 0.50% | 0.50% (c) | 1.66% | 75% | $522,769 |
| (0.81) | $15.35 | 8.88% | 0.48% | 0.48% (c) | 1.10% | 16% | $622,508 |
| (0.31) | $14.83 | 16.86% | 0.50% | 0.50% (c) | 1.17% | 18% | $605,625 |
| (0.22) | $12.96 | 13.81% | 0.53% | 0.48% (c) | 1.38% | 26% | $552,395 |
| |
| (0.32) | $11.08 | 14.84% | 1.27% | 1.27% (c) | 0.03% | 54% | $5,355 |
| (3.16) | $9.96 | (7.40%) | 1.24% | 1.24% (c) | 0.70% | 75% | $12,279 |
| (0.69) | $13.88 | 8.01% | 1.23% | 1.23% (c) | 0.27% | 16% | $28,394 |
| (0.21) | $13.48 | 16.09% | 1.25% | 1.25% (c) | 0.35% | 18% | $44,368 |
| (0.13) | $11.79 | 12.93% | 1.28% | 1.23% (c) | 0.55% | 26% | $59,438 |
| |
| (0.32) | $10.95 | 14.81% | 1.27% | 1.27% (c) | 0.28% | 54% | $74,057 |
| (3.16) | $9.85 | (7.38%) | 1.25% | 1.25% (c) | 0.90% | 75% | $80,104 |
| (0.69) | $13.76 | 8.08% | 1.23% | 1.23% (c) | 0.34% | 16% | $98,125 |
| (0.21) | $13.36 | 16.06% | 1.25% | 1.25% (c) | 0.42% | 18% | $96,989 |
| (0.13) | $11.69 | 12.95% | 1.28% | 1.23% (c) | 0.62% | 26% | $89,630 |
| |
| (0.34) | $13.08 | 15.85% | 0.42% | 0.42% | 1.20% | 54% | $106 |
| (3.26) | $11.62 | (6.59%) | 0.39% | 0.39% | 1.80% | 75% | $91 |
| (0.83) | $15.64 | 8.98% | 0.35% | 0.35% | 1.18% | 16% | $98 |
| (0.33) | $15.10 | 17.04% | 0.36% | 0.36% | 1.32% | 18% | $158 |
| (0.23) | $13.19 | 13.93% | 0.38% | 0.38% | 1.42% | 26% | $135 |
| |
| (0.33) | $12.54 | 15.30% | 0.77% | 0.77% (c) | 0.68% | 54% | $872 |
| (3.21) | $11.19 | (6.91%) | 0.75% | 0.75% (c) | 1.35% | 75% | $2,254 |
| (0.77) | $15.19 | 8.64% | 0.73% | 0.73% (c) | 0.81% | 16% | $2,681 |
| (0.28) | $14.68 | 16.59% | 0.75% | 0.75% (c) | 0.93% | 18% | $3,131 |
| (0.19) | $12.83 | 13.49% | 0.78% | 0.73% (c) | 1.18% | 26% | $3,312 |
| |
| (0.35) | $13.31 | 16.01% | 0.27% | 0.27% (c) | 1.52% | 54% | $284 |
| (3.27) | $11.81 | (6.55%) | 0.27% | 0.27% (c) | 2.73% | 75% | $71 |
| (0.85) | $15.85 | 9.15% | 0.22% | 0.22% (c) | 1.23% | 16% | $11 |
| (0.35) | $15.29 | 17.19% | 0.24% | 0.24% (c) | 1.84% | 18% | $15 |
| (0.10) | $13.35 | 9.50% | 0.37% (e) | 0.27% (e) | 3.94% (e) | 26% | $3 |
Columbia Global Strategic Equity Fund | Annual Report 2017
| 19 |
Financial Highlights (continued)
| Year ended | Net asset value,
beginning of
period | Net
investment
income | Net
realized
and
unrealized
gain (loss) | Total from
investment
operations | Distributions
from net
investment
income | Distributions
from net
realized
gains |
| Class R5 |
| 1/31/2017 | $11.83 | 0.19 | 1.67 | 1.86 | (0.04) | (0.32) |
| 1/31/2016 | $15.85 | 0.32 | (1.06) | (0.74) | (0.37) | (2.91) |
| 1/31/2015 | $15.29 | 0.32 | 1.10 | 1.42 | (0.40) | (0.46) |
| 1/31/2014 | $13.35 | 0.29 | 2.02 | 2.31 | (0.37) | — |
| 1/31/2013 (f) | $12.29 | 0.12 | 1.05 | 1.17 | (0.11) | — |
| Class Z |
| 1/31/2017 | $11.64 | 0.16 | 1.66 | 1.82 | (0.03) | (0.32) |
| 1/31/2016 | $15.66 | 0.26 | (1.01) | (0.75) | (0.36) | (2.91) |
| 1/31/2015 | $15.11 | 0.22 | 1.18 | 1.40 | (0.39) | (0.46) |
| 1/31/2014 | $13.20 | 0.20 | 2.05 | 2.25 | (0.34) | — |
| 1/31/2013 | $11.80 | 0.20 | 1.45 | 1.65 | (0.25) | — |
| Notes to Financial Highlights |
| (a) | In addition to the fees and expenses that the Fund bears directly, the Fund indirectly bears a pro rata share of the fees and expenses of any other funds in which it invests. Such indirect expenses are not included in the Fund’s reported expense ratios. |
| (b) | Total net expenses include the impact of certain fee waivers/expense reimbursements made by the Investment Manager and certain of its affiliates, if applicable. |
| (c) | The benefits derived from expense reductions had an impact of less than 0.01%. |
| (d) | Class R4 shares commenced operations on November 8, 2012. Per share data and total return reflect activity from that date. |
| (e) | Annualized. |
| (f) | Class R5 shares commenced operations on November 8, 2012. Per share data and total return reflect activity from that date. |
The accompanying Notes to Financial Statements are an integral part of this statement.
| 20 | Columbia Global Strategic Equity Fund | Annual Report 2017 |
Total
distributions to
shareholders | Net
asset
value,
end of
period | Total
return | Total gross
expense
ratio to
average
net assets(a) | Total net
expense
ratio to
average
net assets(a),(b) | Net investment
income
ratio to
average
net assets | Portfolio
turnover | Net
assets,
end of
period
(000’s) |
| |
| (0.36) | $13.33 | 16.04% | 0.18% | 0.18% | 1.53% | 54% | $607 |
| (3.28) | $11.83 | (6.32%) | 0.14% | 0.14% | 2.15% | 75% | $340 |
| (0.86) | $15.85 | 9.26% | 0.10% | 0.10% | 2.03% | 16% | $316 |
| (0.37) | $15.29 | 17.39% | 0.10% | 0.10% | 1.96% | 18% | $29 |
| (0.11) | $13.35 | 9.54% | 0.15% (e) | 0.15% (e) | 4.08% (e) | 26% | $3 |
| |
| (0.35) | $13.11 | 15.98% | 0.27% | 0.27% (c) | 1.27% | 54% | $22,765 |
| (3.27) | $11.64 | (6.48%) | 0.24% | 0.24% (c) | 1.73% | 75% | $24,809 |
| (0.85) | $15.66 | 9.18% | 0.23% | 0.23% (c) | 1.40% | 16% | $51,428 |
| (0.34) | $15.11 | 17.14% | 0.25% | 0.25% (c) | 1.42% | 18% | $53,613 |
| (0.25) | $13.20 | 14.09% | 0.28% | 0.23% (c) | 1.64% | 26% | $49,653 |
Columbia Global Strategic Equity Fund | Annual Report 2017
| 21 |
Notes to Financial Statements
January 31, 2017
Note 1. Organization
Columbia Global Strategic Equity Fund (the Fund), a series of Columbia Funds Series Trust (the Trust), is a diversified fund. The Trust is registered under the Investment Company Act of 1940, as amended (the 1940 Act), as an open-end management investment company organized as a Delaware statutory trust.
The Fund is a “fund-of-funds”, investing significantly in funds managed by Columbia Management Investment Advisers, LLC (the Investment Manager), a wholly-owned subsidiary of Ameriprise Financial, Inc. (Ameriprise Financial), or its affiliates (Underlying Funds).
For information on the Underlying Funds, please refer to the Fund’s current prospectus and the prospectuses of the Underlying Funds, which are available, free of charge, from the Securities and Exchange Commission website, www.sec.gov.
Fund shares
The Trust may issue an unlimited number of shares (without par value). Although all share classes generally have identical voting, dividend and liquidation rights, each share class votes separately when required by the Trust’s organizational documents or by law. Different share classes pay different distribution amounts to the extent the expenses of such share classes differ, and distributions in liquidation will be proportional to the net asset value of each share class. Each share class has its own expense and sales charge structure. The Fund offers each of the share classes identified below.
Class A shares are subject to a maximum front-end sales charge of 5.75% based on the initial investment amount. Class A shares purchased without an initial sales charge in accounts aggregating $1 million to $50 million at the time of purchase are subject to a contingent deferred sales charge (CDSC) if the shares are sold within 18 months after purchase, charged as follows: 1.00% CDSC if redeemed within 12 months after purchase, and 0.50% CDSC if redeemed more than 12, but less than 18, months after purchase.
The Fund no longer accepts investments by new or existing investors in the Fund’s Class B shares, except in connection with the reinvestment of any dividend and/or capital gain distributions in Class B shares of the Fund and exchanges by existing Class B shareholders of certain other funds within the Columbia Family of Funds. Class B shares generally convert to Class A shares eight years after purchase. Class B shares are typically subject to a maximum CDSC of 5.00% based upon the holding period after purchase. However, the Fund’s current Class B investors, having held their shares for the requisite time period, are no longer subject to a CDSC upon redemption of their shares.
Class C shares are subject to a 1.00% CDSC on shares redeemed within 12 months after purchase.
Class K shares are not subject to sales charges, however this share class is closed to new investors.
Class R shares are not subject to sales charges and are generally available only to certain retirement plans and other investors as described in the Fund’s prospectus.
Class R4 shares are not subject to sales charges and are generally available only to omnibus retirement plans and certain investors as described in the Fund’s prospectus.
Class R5 shares are not subject to sales charges and are generally available only to investors purchasing through authorized investment professionals and omnibus retirement plans.
Class Y shares are not subject to sales charges or distribution and service (12b-1) fees, and are available to institutional and certain other investors as described in the Fund’s prospectus. Class Y shares commenced operations on March 1, 2017.
Class Z shares are not subject to sales charges and are generally available only to eligible investors, which are subject to different investment minimums as described in the Fund’s prospectus.
| 22 | Columbia Global Strategic Equity Fund | Annual Report 2017 |
Notes to Financial Statements (continued)
January 31, 2017
Note 2. Summary of significant accounting policies
Basis of preparation
The Fund is an investment company that applies the accounting and reporting guidance in the Financial Accounting Standards Board (FASB) Accounting Standards Codification Topic 946, Financial Services - Investment Companies (ASC 946). The financial statements are prepared in accordance with U.S. generally accepted accounting principles (GAAP), which requires management to make certain estimates and assumptions that affect the reported amounts of assets and liabilities, the disclosure of contingent assets and liabilities at the date of the financial statements and the reported amounts of income and expenses during the reporting period. Actual results could differ from those estimates.
The following is a summary of significant accounting policies followed by the Fund in the preparation of its financial statements.
Security valuation
All equity securities and exchange-traded funds are valued at the close of business of the New York Stock Exchange. Equity securities and exchange-traded funds are valued at the last quoted sales price on the principal exchange or market on which they trade, except for securities traded on the NASDAQ Stock Market, which are valued at the NASDAQ official close price. Unlisted securities or listed securities for which there were no sales during the day are valued at the mean of the latest quoted bid and ask prices on such exchanges or markets.
Foreign equity securities are valued based on the closing price on the foreign exchange in which such securities are primarily traded. If any foreign equity security closing prices are not readily available, the securities are valued at the mean of the latest quoted bid and ask prices on such exchanges or markets. Foreign currency exchange rates are generally determined at 4:00 p.m. Eastern (U.S.) time. Many securities markets and exchanges outside the U.S. close prior to the close of the New York Stock Exchange; therefore, the closing prices for securities in such markets or on such exchanges may not fully reflect events that occur after such close but before the close of the New York Stock Exchange. In those situations, foreign securities will be fair valued pursuant to a policy adopted by the Board of Trustees, including, if available, utilizing a third party pricing service to determine these fair values. The third party pricing service takes into account multiple factors, including, but not limited to, movements in the U.S. securities markets, certain depositary receipts, futures contracts and foreign exchange rates that have occurred subsequent to the close of the foreign exchange or market, to determine a good faith estimate that reasonably reflects the current market conditions as of the close of the New York Stock Exchange. The fair value of a security is likely to be different from the quoted or published price, if available.
Investments in the Underlying Funds are valued at the net asset value of the applicable class of the Underlying Fund determined as of the close of the New York Stock Exchange on the valuation date.
Investments for which market quotations are not readily available, or that have quotations which management believes are not reflective of market value or reliable, are valued at fair value as determined in good faith under procedures approved by and under the general supervision of the Board of Trustees. If a security or class of securities (such as foreign securities) is valued at fair value, such value is likely to be different from the quoted or published price for the security.
The determination of fair value often requires significant judgment. To determine fair value, management may use assumptions including but not limited to future cash flows and estimated risk premiums. Multiple inputs from various sources may be used to determine fair value.
GAAP requires disclosure regarding the inputs and valuation techniques used to measure fair value and any changes in valuation inputs or techniques. In addition, investments shall be disclosed by major category. This information is disclosed following the Fund’s Portfolio of Investments.
Foreign currency transactions and translations
The values of all assets and liabilities denominated in foreign currencies are generally translated into U.S. dollars at exchange rates determined at the close of regular trading on the New York Stock Exchange. Net realized and unrealized gains (losses) on foreign currency transactions and translations include gains (losses) arising from the fluctuation in exchange
Columbia Global Strategic Equity Fund | Annual Report 2017
| 23 |
Notes to Financial Statements (continued)
January 31, 2017
rates between trade and settlement dates on securities transactions, gains (losses) arising from the disposition of foreign currency and currency gains (losses) between the accrual and payment dates on dividends, interest income and foreign withholding taxes.
For financial statement purposes, the Fund does not distinguish that portion of gains (losses) on investments which is due to changes in foreign exchange rates from that which is due to changes in market prices of the investments. Such fluctuations are included with the net realized and unrealized gains (losses) on investments in the Statement of Operations.
Security transactions
Security transactions are accounted for on the trade date. Cost is determined and gains (losses) are based upon the specific identification method for both financial statement and federal income tax purposes.
Income recognition
Corporate actions and dividend income are generally recorded net of any non-reclaimable tax withholdings, on the ex-dividend date or upon receipt of ex-dividend notification in the case of certain foreign securities.
The Fund may receive distributions from holdings in equity securities, business development companies (BDCs), exchange-traded funds, other regulated investment companies (RICs), and real estate investment trusts (REITs), which report information on the tax character of their distributions annually. These distributions are allocated to dividend income, capital gain and return of capital based on actual information reported. Return of capital is recorded as a reduction of the cost basis of securities held. If the Fund no longer owns the applicable securities, return of capital is recorded as a realized gain. With respect to REITs, to the extent actual information has not yet been reported, estimates for return of capital are made by the Fund’s management. Management’s estimates are subsequently adjusted when the actual character of the distributions is disclosed by the REITs, which could result in a proportionate change in return of capital to shareholders.
Awards from class action litigation are recorded as a reduction of cost basis if the Fund still owns the applicable securities on the payment date. If the Fund no longer owns the applicable securities, the proceeds are recorded as realized gains.
Income and capital gain distributions from the Underlying Funds, if any, are recorded on the ex-dividend date.
Expenses
General expenses of the Trust are allocated to the Fund and other funds of the Trust based upon relative net assets or other expense allocation methodologies determined by the nature of the expense. Expenses directly attributable to the Fund are charged to the Fund. Expenses directly attributable to a specific class of shares are charged to that share class.
Determination of class net asset value
All income, expenses (other than class-specific expenses, which are charged to that share class, as shown in the Statement of Operations) and realized and unrealized gains (losses) are allocated to each class of the Fund on a daily basis, based on the relative net assets of each class, for purposes of determining the net asset value of each class.
Federal income tax status
The Fund intends to qualify each year as a regulated investment company under Subchapter M of the Internal Revenue Code, as amended, and will distribute substantially all of its taxable income (including net short-term capital gains), if any, for its tax year, and as such will not be subject to federal income taxes. In addition, the Fund intends to distribute in each calendar year substantially all of its net investment income, capital gains and certain other amounts, if any, such that the Fund should not be subject to federal excise tax. Therefore, no federal income or excise tax provision is recorded.
Foreign taxes
The Fund may be subject to foreign taxes on income, gains on investments or currency repatriation, a portion of which may be recoverable. The Fund will accrue such taxes and recoveries, as applicable, based upon its current interpretation of tax rules and regulations that exist in the markets in which it invests.
| 24 | Columbia Global Strategic Equity Fund | Annual Report 2017 |
Notes to Financial Statements (continued)
January 31, 2017
Realized gains in certain countries may be subject to foreign taxes at the Fund level, based on statutory rates. The Fund accrues for such foreign taxes on realized and unrealized gains at the appropriate rate for each jurisdiction, as applicable. The amount, if any, is disclosed as a liability on the Statement of Assets and Liabilities.
Distributions to shareholders
Distributions from net investment income, if any, are declared and paid each calendar quarter. Net realized capital gains, if any, are distributed at least annually. Income distributions and capital gain distributions are determined in accordance with federal income tax regulations, which may differ from GAAP.
Guarantees and indemnifications
Under the Trust’s organizational documents and, in some cases, by contract, its officers and trustees are indemnified against certain liabilities arising out of the performance of their duties to the Trust or its funds. In addition, certain of the Fund’s contracts with its service providers contain general indemnification clauses. The Fund’s maximum exposure under these arrangements is unknown since the amount of any future claims that may be made against the Fund cannot be determined, and the Fund has no historical basis for predicting the likelihood of any such claims.
Investment company reporting modernization
In October 2016, the U.S. Securities and Exchange Commission adopted new rules and forms, and amendments to certain current rules and forms, to modernize reporting and disclosure of information by registered investment companies. The amendments to Regulation S-X will require standardized, enhanced disclosure about derivatives in investment company financial statements, and will also change the rules governing the form and content of such financial statements. The amendments to Regulation S-X take effect on August 1, 2017. At this time, management is assessing the anticipated impact of these regulatory developments.
Note 3. Fees and other transactions with affiliates
Management services fees and underlying fund fees
Effective June 1, 2016, the Fund entered into a Management Agreement with the Investment Manager. Under the Management Agreement, the Investment Manager provides the Fund with investment research and advice, as well as administrative and accounting services. The management services fee is an annual fee that is a blend of (i) 0.020% on assets invested in Columbia proprietary funds (excluding any underlying funds that do not pay a management services fee (or investment advisory services fee, as applicable) to the Investment Manager), (ii) 0.120% on assets invested in non-exchange-traded third-party advised mutual funds and (iii) 0.570% on assets invested in all other securities, instruments and other assets not described above, including other funds advised by the Investment Manager that do not pay a management services fee (or investment advisory services fee, as applicable), exchange-traded funds, derivatives and individual securities. Prior to June 1, 2016, the Fund paid the Investment Manager an annual fee for advisory services under an Investment Management Services Agreement and a separate annual fee for administrative and accounting services under an Administrative Services Agreement. The effective management services fee rate for the year ended January 31, 2017 (reflecting all advisory and administrative services fees paid to the Investment Manager) was 0.075% of the Fund’s average daily net assets. For the period from February 1, 2016 through May 31, 2016, the investment advisory services fee paid to the Investment Manager was $133,498, and the administrative services fee paid to the Investment Manager was $43,306.
In addition to the fees and expenses which the Fund bears directly, the Fund indirectly bears a pro rata share of the fees and expenses of the Underlying Funds in which the Fund invests. Because the Underlying Funds have varied expense and fee levels and the Fund may own different proportions of Underlying Funds at different times, the amount of fees and expenses incurred indirectly by the Fund will vary. These expenses are not reflected in the expenses shown in Statement of Operations and are not included in the ratios to average net assets shown in the Financial Highlights.
Participating Affiliates
The Investment Manager and its investment advisory affiliates (Participating Affiliates) around the world may coordinate in providing services to their clients. From time to time the Investment Manager (or any affiliated investment subadviser to the Fund, as the case may be) may engage its Participating Affiliates to provide a variety of services such as investment
Columbia Global Strategic Equity Fund | Annual Report 2017
| 25 |
Notes to Financial Statements (continued)
January 31, 2017
research, investment monitoring, trading and discretionary investment management (including portfolio management) to certain accounts managed by the Investment Manager, including the Fund. These Participating Affiliates will provide services to the Investment Manager (or any affiliated investment subadviser to the Fund as the case may be) either pursuant to subadvisory agreements, personnel-sharing agreements or similar inter-company arrangements and the Fund will pay no additional fees and expenses as a result of any such arrangements.
These Participating Affiliates, like the Investment Manager, are direct or indirect subsidiaries of Ameriprise Financial and are registered with appropriate respective regulators in their home jurisdictions and, where required, the Securities and Exchange Commission and the Commodity Futures Trading Commission in the United States.
Pursuant to some of these arrangements, certain employees of these Participating Affiliates may serve as "associated persons" of the Investment Manager and, in this capacity, subject to the oversight and supervision of the Investment Manager and consistent with the investment objectives, policies and limitations set forth in the Fund’s prospectus and Statement of Additional Information (SAI), may provide such services to the Fund on behalf of the Investment Manager.
Other expenses
Other expenses are for, among other things, miscellaneous expenses of the Fund or the Board of Trustees, including payments to Board Services Corp., a company providing limited administrative services to the Fund and the Board of Trustees. That company’s expenses include boardroom and office expense, employee compensation, employee health and retirement benefits, and certain other expenses. For the year ended January 31, 2017, other expenses paid by the Fund to this company were $132.
Compensation of board members
Members of the Board of Trustees, who are not officers or employees of the Investment Manager or Ameriprise Financial, are compensated for their services to the Fund as disclosed in the Statement of Operations. Under a Deferred Compensation Plan (the Plan), these members of the Board of Trustees may elect to defer payment of up to 100% of their compensation. Deferred amounts are treated as though equivalent dollar amounts had been invested in shares of certain funds managed by the Investment Manager. The Fund’s liability for these amounts is adjusted for market value changes and remains in the Fund until distributed in accordance with the Plan. All amounts payable under the Plan constitute a general unsecured obligation of the Fund.
Compensation of Chief Compliance Officer
The Board of Trustees has appointed a Chief Compliance Officer to the Fund in accordance with federal securities regulations. A portion of the Chief Compliance Officer’s total compensation is allocated to the Fund, along with other affiliated funds governed by the Board of Trustees, based on relative net assets. The total amount allocated to all affiliated funds governed by the Board of Trustees will not exceed $40,000 annually.
Transfer agency fees
Under a Transfer and Dividend Disbursing Agent Agreement, Columbia Management Investment Services Corp. (the Transfer Agent), an affiliate of the Investment Manager and a wholly-owned subsidiary of Ameriprise Financial, is responsible for providing transfer agency services to the Fund. The Transfer Agent has contracted with Boston Financial Data Services (BFDS) to serve as sub-transfer agent. The Transfer Agent pays the fees of BFDS for services as sub-transfer agent and BFDS is not entitled to reimbursement for such fees from the Fund (with the exception of out-of-pocket fees).
The Fund pays the Transfer Agent a monthly transfer agency fee based on the number or the average value of accounts, depending on the type of account. In addition, prior to October 1, 2016, the Transfer Agent also received sub-transfer agency fees based on a percentage of the average aggregate value of the Fund’s shares maintained in omnibus accounts (other than omnibus accounts for which American Enterprise Investment Services Inc. is the broker of record or accounts where the beneficial shareholder is a customer of Ameriprise Financial Services, Inc., for which the Transfer Agent receives a per account fee). Effective October 1, 2016, the Fund pays the Transfer Agent a fee for shareholder services based on the number of accounts or on a percentage of the average aggregate value of the Fund’s shares maintained in omnibus accounts up to the lesser of the amount charged by the servicing agent or a cap established by the Board of Trustees from time to time.
| 26 | Columbia Global Strategic Equity Fund | Annual Report 2017 |
Notes to Financial Statements (continued)
January 31, 2017
The Transfer Agent also receives compensation from the Fund for various shareholder services and reimbursements for certain out-of-pocket fees. Effective January 1, 2017, total transfer agency fees for Class K and Class R5 shares are subject to an annual limitation of not more than 0.075% of the average daily net assets attributable to each share class. Prior to January 1, 2017, total transfer agency fees for Class K and Class R5 shares were subject to an annual limitation of not more than 0.05% of the average daily net assets attributable to each share class.
For the year ended January 31, 2017, the Fund’s effective transfer agency fee rates as a percentage of average daily net assets of each class were as follows:
| Class A | 0.15% |
| Class B | 0.15 |
| Class C | 0.15 |
| Class K | 0.05 |
| Class R | 0.15 |
| Class R4 | 0.14 |
| Class R5 | 0.05 |
| Class Z | 0.15 |
An annual minimum account balance fee of $20 may apply to certain accounts with a value below the applicable share class’s initial minimum investment requirements to reduce the impact of small accounts on transfer agency fees. These minimum account balance fees are remitted to the Fund and recorded as part of expense reductions in the Statement of Operations. For the year ended January 31, 2017, these minimum account balance fees reduced total expenses of the Fund by $600.
Plan administration fees
Under a Plan Administration Services Agreement with the Transfer Agent, the Fund pays an annual fee at a rate of 0.25% of the Fund’s average daily net assets attributable to Class K shares for the provision of various administrative, recordkeeping, communication and educational services.
Distribution and service fees
The Fund has an agreement with Columbia Management Investment Distributors, Inc. (the Distributor), an affiliate of the Investment Manager and a wholly-owned subsidiary of Ameriprise Financial, for distribution and shareholder services. The Board of Trustees has approved, and the Fund has adopted, distribution and shareholder service plans (the Plans) applicable to certain share classes, which set the distribution and service fees for the Fund. These fees are calculated daily and are intended to compensate the Distributor and/or eligible selling and/or servicing agents for selling shares of the Fund and providing services to investors.
Under the Plans, the Fund pays a monthly combined distribution and service fee to the Distributor at the maximum annual rate of 0.25% of the average daily net assets attributable to Class A shares of the Fund. Also under the Plans, the Fund pays a monthly service fee at the maximum annual rate of 0.25% of the average daily net assets attributable to Class B and Class C shares of the Fund and a monthly distribution fee at the maximum annual rate of 0.75%, 0.75% and 0.50% of the average daily net assets attributable to Class B, Class C and Class R shares of the Fund, respectively.
Sales charges (unaudited)
Sales charges, including front-end charges and CDSCs, received by the Distributor for distributing Fund shares for the year ended January 31, 2017, if any, are listed below:
| | Amount ($) |
| Class A | 423,222 |
| Class B | 271 |
| Class C | 4,059 |
Columbia Global Strategic Equity Fund | Annual Report 2017
| 27 |
Notes to Financial Statements (continued)
January 31, 2017
Expenses waived/reimbursed by the Investment Manager and its affiliates
The Investment Manager and certain of its affiliates have contractually agreed to waive fees and/or reimburse expenses (excluding certain fees and expenses described below) for the periods disclosed below, unless sooner terminated at the sole discretion of the Board of Trustees, so that the Fund’s net operating expenses, after giving effect to fees waived/expenses reimbursed and any balance credits and/or overdraft charges from the Fund’s custodian, do not exceed the following annual rates as a percentage of the class’ average daily net assets:
| | June 1, 2016
through
May 31, 2017 | Prior to
June 1, 2016 |
| Class A | 0.60% | 0.51% |
| Class B | 1.35 | 1.26 |
| Class C | 1.35 | 1.26 |
| Class K | 0.53 | 0.43 |
| Class R | 0.85 | 0.76 |
| Class R4 | 0.35 | 0.26 |
| Class R5 | 0.28 | 0.18 |
| Class Z | 0.35 | 0.26 |
Under the agreement governing these fee waivers and/or expense reimbursement arrangements, the following fees and expenses are excluded from the waiver/reimbursement commitment, and therefore will be paid by the Fund, if applicable: taxes (including foreign transaction taxes), expenses associated with investments in affiliated and non-affiliated pooled investment vehicles (including mutual funds and exchange-traded funds), transaction costs and brokerage commissions, costs related to any securities lending program, dividend and interest expenses associated with securities sold short, inverse floater program fees and expenses, transaction charges and interest on borrowed money, interest, infrequent and/or unusual expenses and any other expenses the exclusion of which is specifically approved by the Board of Trustees. This agreement may be modified or amended only with approval from the Investment Manager, certain of its affiliates and the Fund. The Fund’s management services fee is also excluded from the waiver/reimbursement commitment and is therefore paid by the Fund. Any fees waived and/or expenses reimbursed under the expense reimbursement arrangements described above are not recoverable by the Investment Manager or its affiliates in future periods.
Note 4. Federal tax information
The timing and character of income and capital gain distributions are determined in accordance with income tax regulations, which may differ from GAAP because of temporary or permanent book to tax differences.
At January 31, 2017, these differences are primarily due to differing treatment for deferral/reversal of wash sale losses, passive foreign investment company (PFIC) holdings, capital loss carryforwards, trustees’ deferred compensation, foreign currency transactions and distribution reclassifications. To the extent these differences are permanent, reclassifications are made among the components of the Fund’s net assets in the Statement of Assets and Liabilities. Temporary differences do not require reclassifications.
In the Statement of Assets and Liabilities the following reclassifications were made:
Undistributed net
investment
income ($) | Accumulated
net realized
(loss) ($) | Paid in
capital ($) |
| 370,247 | (370,247) | — |
Net investment income (loss) and net realized gains (losses), as disclosed in the Statement of Operations, and net assets were not affected by this reclassification.
| 28 | Columbia Global Strategic Equity Fund | Annual Report 2017 |
Notes to Financial Statements (continued)
January 31, 2017
The tax character of distributions paid during the years indicated was as follows:
| January 31, 2017 | January 31, 2016 |
Ordinary
income ($) | Long-term
capital gains ($) | Total ($) | Ordinary
income (S) | Long-term
capital gains ($) | Total ($) |
| 770,554 | 17,332,633 | 18,103,187 | 16,354,753 | 148,439,823 | 164,794,576 |
Short-term capital gain distributions, if any, are considered ordinary income distributions for tax purposes.
At January 31, 2017, the components of distributable earnings on a tax basis were as follows:
Undistributed
ordinary income ($) | Undistributed
long-term
capital gains ($) | Capital loss
carryforwards ($) | Net unrealized
appreciation ($) |
| 6,061,749 | — | (20,718,902) | 7,708,980 |
At January 31, 2017, the cost of investments for federal income tax purposes along with the aggregate gross unrealized appreciation and depreciation based on that cost was:
Federal
tax cost ($) | Gross unrealized
appreciation ($) | Gross unrealized
(depreciation) ($) | Net unrealized
appreciation ($) |
| 612,377,419 | 32,460,900 | (24,751,920) | 7,708,980 |
The following capital loss carryforwards, determined at January 31, 2017, may be available to reduce taxable income arising from future net realized gains on investments, if any, to the extent permitted by the Internal Revenue Code. Capital loss carryforwards with no expiration are required to be utilized prior to any capital losses which carry an expiration date. As a result of this ordering rule, capital loss carryforwards which carry an expiration date may be more likely to expire unused. In addition, for the year ended January 31, 2017, capital loss carryforwards utilized, expired unused and permanently lost were as follows:
| 2017 ($) | 2018 ($) | 2019 ($) | No expiration
short-term ($) | No expiration
long-term ($) | Total ($) | Utilized ($) | Expired ($) | Permanently
lost ($) |
| — | — | — | 8,569,884 | 12,149,018 | 20,718,902 | — | — | — |
Management of the Fund has concluded that there are no significant uncertain tax positions in the Fund that would require recognition in the financial statements. However, management’s conclusion may be subject to review and adjustment at a later date based on factors including, but not limited to, new tax laws, regulations, and administrative interpretations (including relevant court decisions). Generally, the Fund’s federal tax returns for the prior three fiscal years remain subject to examination by the Internal Revenue Service.
Note 5. Portfolio information
The cost of purchases and proceeds from sales of securities, excluding short-term investments and derivatives, if any, aggregated to $345,743,611 and $448,910,190, respectively, for the year ended January 31, 2017. The amount of purchase and sale activity impacts the portfolio turnover rate reported in the Financial Highlights.
Note 6. Affiliated money market fund
The Fund invests in Columbia Short-Term Cash Fund, an affiliated money market fund established for the exclusive use by the Fund and other affiliated funds (the Affiliated MMF). The income earned by the Fund from such investments is included as Dividends - affiliated issuers in the Statement of Operations. As an investing fund, the Fund indirectly bears its proportionate share of the expenses of the Affiliated MMF. Effective October 1, 2016, the Affiliated MMF prices its shares with a floating net asset value (NAV) and no longer seeks to maintain a stable NAV. In addition, the Board of Trustees of the Affiliated MMF may impose a fee on redemptions (sometimes referred to as a liquidity fee) or temporarily suspend redemptions (sometimes referred to as imposing a redemption gate) in the event its liquidity falls below regulatory limits.
Columbia Global Strategic Equity Fund | Annual Report 2017
| 29 |
Notes to Financial Statements (continued)
January 31, 2017
Note 7. Line of credit
The Fund has access to a revolving credit facility with a syndicate of banks led by Citibank, N.A., HSBC Bank USA, N.A. and JPMorgan Chase Bank, N.A. whereby the Fund may borrow for the temporary funding of shareholder redemptions or for other temporary or emergency purposes. The credit facility agreement, which is a collective agreement between the Fund and certain other funds managed by the Investment Manager, severally and not jointly, permits collective borrowings up to $1 billion. Interest is charged to each participating fund based on its borrowings at a rate equal to the higher of (i) the overnight federal funds rate plus 1.00% or (ii) the one-month LIBOR rate plus 1.00%. Each borrowing under the credit facility matures no later than 60 days after the date of borrowing. The Fund also pays a commitment fee equal to its pro rata share of the amount of the credit facility at a rate of 0.15% per annum. The commitment fee is included in other expenses in the Statement of Operations.
The Fund had no borrowings during the year ended January 31, 2017.
Note 8. Significant risks
Foreign securities and emerging market countries risk
Investing in foreign securities may include certain risks and considerations not typically associated with investing in U.S. securities, such as fluctuating currency values and changing local and regional economic, political and social conditions, which may result in greater market volatility. In addition, certain foreign securities may not be as liquid as U.S. securities. Investing in emerging markets may accentuate these risks. These countries are also more likely to experience high levels of inflation, deflation or currency devaluation which could hurt their economies and securities markets. To the extent that the Fund concentrates its investment exposure to any one or a few specific countries, the Fund will be particularly susceptible to the various conditions, events or other factors impacting those countries and may, therefore, have a greater risk than that of a fund which is more geographically diversified.
Shareholder concentration risk
At January 31, 2017, one unaffiliated shareholder of record owned 21.2% of the outstanding shares of the Fund in one or more accounts. The Fund has no knowledge about whether any portion of those shares was owned beneficially. Affiliated shareholders of record owned 58.3% of the outstanding shares of the Fund in one or more accounts. Subscription and redemption activity by concentrated accounts may have a significant effect on the operations of the Fund. In the case of a large redemption, the Fund may be forced to sell investments at inopportune times, including its liquid or more liquid positions, resulting in Fund losses and the Fund holding a higher percentage of less liquid or illiquid securities. Large redemptions could result in decreased economies of scale and increased operating expenses for non-redeeming Fund shareholders.
Note 9. Subsequent events
Management has evaluated the events and transactions that have occurred through the date the financial statements were issued. Other than as noted in Note 1 above, there were no items requiring adjustment of the financial statements or additional disclosure.
Note 10. Information regarding pending and settled legal proceedings
Ameriprise Financial and certain of its affiliates have historically been involved in a number of legal, arbitration and regulatory proceedings, including routine litigation, class actions, and governmental actions, concerning matters arising in connection with the conduct of their business activities. Ameriprise Financial believes that the Funds are not currently the subject of, and that neither Ameriprise Financial nor any of its affiliates are the subject of, any pending legal, arbitration or regulatory proceedings that are likely to have a material adverse effect on the Funds or the ability of Ameriprise Financial or its affiliates to perform under their contracts with the Funds. Ameriprise Financial is required to make quarterly (10-Q), annual (10-K) and, as necessary, 8-K filings with the Securities and Exchange Commission (SEC) on legal and regulatory matters that relate to Ameriprise Financial and its affiliates. Copies of these filings may be obtained by accessing the SEC website at www.sec.gov.
| 30 | Columbia Global Strategic Equity Fund | Annual Report 2017 |
Notes to Financial Statements (continued)
January 31, 2017
There can be no assurance that these matters, or the adverse publicity associated with them, will not result in increased fund redemptions, reduced sale of fund shares or other adverse consequences to the Funds. Further, although we believe proceedings are not likely to have a material adverse effect on the Funds or the ability of Ameriprise Financial or its affiliates to perform under their contracts with the Funds, these proceedings are subject to uncertainties and, as such, we are unable to estimate the possible loss or range of loss that may result. An adverse outcome in one or more of these proceedings could result in adverse judgments, settlements, fines, penalties or other relief that could have a material adverse effect on the consolidated financial condition or results of operations of Ameriprise Financial.
Columbia Global Strategic Equity Fund | Annual Report 2017
| 31 |
Report of Independent Registered Public Accounting Firm
To the Trustees of Columbia Funds Series Trust and the Shareholders of Columbia Global Strategic Equity Fund
In our opinion, the accompanying statement of assets and liabilities, including the portfolio of investments, and the related statements of operations and of changes in net assets and the financial highlights present fairly, in all material respects, the financial position of Columbia Global Strategic Equity Fund (the "Fund," a series of Columbia Funds Series Trust) as of January 31, 2017, the results of its operations for the year then ended, the changes in its net assets for each of the two years in the period then ended and the financial highlights for each of the five years in the period then ended, in conformity with accounting principles generally accepted in the United States of America. These financial statements and financial highlights (hereafter referred to as "financial statements") are the responsibility of the Fund’s management. Our responsibility is to express an opinion on these financial statements based on our audits. We conducted our audits of these financial statements in accordance with the standards of the Public Company Accounting Oversight Board (United States). Those standards require that we plan and perform the audit to obtain reasonable assurance about whether the financial statements are free of material misstatement. An audit includes examining, on a test basis, evidence supporting the amounts and disclosures in the financial statements, assessing the accounting principles used and significant estimates made by management, and evaluating the overall financial statement presentation. We believe that our audits, which included confirmation of securities as of January 31, 2017 by correspondence with the custodian, brokers, and transfer agent, provide a reasonable basis for our opinion.
PricewaterhouseCoopers LLP
Minneapolis, MN
March 24, 2017
| 32 | Columbia Global Strategic Equity Fund | Annual Report 2017 |
Federal Income Tax Information
(Unaudited)
The Fund hereby designates the following tax attributes for the fiscal year ended January 31, 2017. Shareholders will be notified in early 2018 of the amounts for use in preparing 2017 income tax returns.
Qualified
dividend
income | Dividends
received
deduction | Foreign
taxes paid | Foreign
taxes paid
per share | Foreign
source
income | Foreign
source
income per
share |
| 100.00% | 100.00% | $641,250 | $0.01 | $4,867,825 | $0.10 |
Qualified dividend income. For taxable, non-corporate shareholders, the percentage of ordinary income distributed during the fiscal year that represents qualified dividend income subject to reduced tax rates.
Dividends received deduction. The percentage of ordinary income distributed during the fiscal year that qualifies for the corporate dividends received deduction.
Foreign Taxes. The Fund makes the election to pass through to shareholders the foreign taxes paid. Eligible shareholders may claim a foreign tax credit. These taxes, and the corresponding foreign source income, are provided.
Columbia Global Strategic Equity Fund | Annual Report 2017
| 33 |
Shareholders elect the Board that oversees the Fund’s operations. The Board appoints officers who are responsible for day-to-day business decisions based on policies set by the Board. The following table provides basic biographical information about the Fund’s Trustees, including their principal occupations during the past five years, although specific titles for individuals may have varied over the period. Under current Board policy, Trustees not affiliated with the Investment Manager generally may serve through the end of the calendar year in which he or she reaches either the mandatory retirement age established by the Board or the fifteenth anniversary of the first Columbia Funds board meeting they attended as a member of the Board.
Independent trustees
Name,
address,
year of birth | Position held
with the Trust and
length of service | Principal occupation(s)
during past five years
and other relevant
professional experience | Number of
Funds in the
Columbia Funds
complex
overseen | Other directorships
held by Trustee
during the past
five years |
George S. Batejan
c/o Columbia Management
Investment Advisers, LLC
225 Franklin Street
Mail Drop BX32 05228
Boston, MA 02110
1953 | Trustee since 1/17 | Executive Vice President, Global Head of Technology and Operations, Janus Capital Group, Inc., 2010-2016 | 124 | Advisory Board Member, University of Colorado Business School (Executive Committee, Nominating Committee and Governance Committee) since November 2015; former Chairman of the Board, NICSA (National Investment Company Services Association), 2014-2016; former Director, Intech Investment Management, 2011- 2016; former Board Member, Metro Denver Chamber of Commerce, 2015-2016 |
Kathleen Blatz
c/o Columbia Management
Investment Advisers, LLC
225 Franklin Street
Mail Drop BX32 05228
Boston, MA 02110
1954 | Trustee since 1/06 for RiverSource Funds and since 6/11 for Nations Funds | Attorney; specializing in arbitration and mediation; Chief Justice, Minnesota Supreme Court, 1998-2006; Associate Justice, Minnesota Supreme Court, 1996-1998; Fourth Judicial District Court Judge, Hennepin County, 1994-1996; Attorney in private practice and public service, 1984-1993; State Representative, Minnesota House of Representatives, 1979-1993, which included service on the Tax and Financial Institutions and Insurance Committees | 126 | Trustee, BlueCross BlueShield of Minnesota (Chair of the Business Development Committee) since 2009; Chair of the Robina Foundation since August 2013 |
Edward J. Boudreau, Jr.
c/o Columbia Management
Investment Advisers, LLC
225 Franklin Street
Mail Drop BX32 05228
Boston, MA 02110
1944 | Trustee since 6/11 for RiverSource Funds and since 1/05 for Nations Funds | Managing Director, E.J. Boudreau & Associates (consulting) since 2000; FINRA Industry Arbitrator, 2002-present; Chairman and Chief Executive Officer, John Hancock Investments (asset management), Chairman and Interested Trustee for open-end and closed-end funds offered by John Hancock,1989-2000; John Hancock Mutual Life Insurance Company, including Senior Vice President and Treasurer and Senior Vice President Information Technology, 1968-1988 | 124 | Former Trustee, Boston Museum of Science (Chair of Finance Committee) 1985-2013; former Trustee, BofA Funds Series Trust (11 funds), 2005-2011 |
Pamela G. Carlton
c/o Columbia Management
Investment Advisers, LLC
225 Franklin Street
Mail Drop BX32 05228
Boston, MA 02110
1954 | Trustee since 7/07 for RiverSource Funds and since 6/11 for Nations Funds | President, Springboard — Partners in Cross Cultural Leadership (consulting company) since 2003; Managing Director of US Equity Research, JP Morgan Chase, 1999-2003; Director of US Equity Research, Chase Asset Management, 1996-1999; Co-Director Latin America Research, 1993-1996, COO Global Research, 1992-1996, Co-Director of US Research, 1991-1992, Investment Banker, Morgan Stanley, 1982-1991 | 126 | Trustee, New York Presbyterian Hospital Board (Executive Committee and Chair of Human Resources Committee) since 1996 |
| 34 | Columbia Global Strategic Equity Fund | Annual Report 2017 |
TRUSTEES AND OFFICERS (continued)
Independent trustees (continued)
Name,
address,
year of birth | Position held
with the Trust and
length of service | Principal occupation(s)
during past five years
and other relevant
professional experience | Number of
Funds in the
Columbia Funds
complex
overseen | Other directorships
held by Trustee
during the past
five years |
William P. Carmichael
c/o Columbia Management
Investment Advisers, LLC
225 Franklin Street
Mail Drop BX32 05228
Boston, MA 02110
1943 | Trustee since 6/11 for RiverSource Funds and since 2003 for Nations Funds; Chair of the Board from 1/14-11/15 | Retired; Co-founder, The Succession Fund (provides exit strategies to owners of privately held companies), 1998-2007; Adjunct Professor of Finance, Kelley School of Business, Indiana University, 1993-2007; Senior Vice President, Sara Lee Corporation, 1991-1993; Senior Vice President and Chief Financial Officer, Beatrice Foods Company, 1984-1990; Vice President, Esmark, Inc., 1973-1984; Associate, Price Waterhouse, 1968-1972 | 126 | Director, The Finish Line (athletic shoes and apparel) since July 2003; Director, hhgregg since May 2015; former Director, Cobra Electronics Corporation (electronic equipment manufacturer), 1994-August 2014; former Director, Spectrum Brands, Inc. (consumer products), 2002-2009; former Director, Simmons Company (bedding), 2004-2010; former Trustee, BofA Funds Series Trust (11 funds) 2003-2011; former Director, McMoRan Exploration Company (oil and gas exploration and development) 2010 - 2013; former Director, International Textile Corp., 2012-2016 |
Patricia M. Flynn
c/o Columbia Management
Investment Advisers, LLC
225 Franklin Street
Mail Drop BX32 05228
Boston, MA 02110
1950 | Trustee since 11/04 for RiverSource Funds and since 6/11 for Nations Funds | Trustee Professor of Economics and Management, Bentley University since 1976 (also teaches and conducts research on corporate governance); Dean, McCallum Graduate School of Business, Bentley University, 1992-2002 | 126 | Trustee, MA Taxpayers Foundation since 1997; Board of Governors, Innovation Institute, MA Technology Collaborative since 2010 |
William A. Hawkins
c/o Columbia Management
Investment Advisers, LLC
225 Franklin Street
Mail Drop BX32 05228
Boston, MA 02110
1942 | Chair of the Board since 11/15, Trustee since 6/11 for RiverSource Funds and since 1/05 for Nations Funds | Managing Director, Overton Partners (financial consulting), since August 2010; President and Chief Executive Officer, California General Bank, N.A., January 2008-August 2010; Operation Hope, COO, 2004-2007; IndyMac Bancorp, President, CBG, 1999-2003; American General Bank, President, 1997-1999; Griffin Financial Services, CEO, 1981-1997; The Griffin Funds, CEO, 1992-1998 | 126 | Former Trustee, BofA Funds Series Trust (11 funds), 2005-2015 |
Catherine James Paglia
c/o Columbia Management
Investment Advisers, LLC
225 Franklin Street
Mail Drop BX32 05228
Boston, MA 02110
1952 | Trustee since 11/04 for RiverSource Funds and since 6/11 for Nations Funds | Director, Enterprise Asset Management, Inc. (private real estate and asset management company) since September 1998; Managing Director and Partner, Interlaken Capital, Inc., 1989-1997; Managing Director, Morgan Stanley, 1982-1989; Vice President, Investment Banking, 1980-1982, Associate, Investment Banking, 1976-1980, Dean Witter Reynolds, Inc. | 126 | Director, Valmont Industries, Inc. (irrigation systems manufacturer) since 2012; Trustee, Carleton College (on the Investment Committee); Trustee, Carnegie Endowment for International Peace (on the Investment Committee) |
Columbia Global Strategic Equity Fund | Annual Report 2017
| 35 |
TRUSTEES AND OFFICERS (continued)
Independent trustees (continued)
Name,
address,
year of birth | Position held
with the Trust and
length of service | Principal occupation(s)
during past five years
and other relevant
professional experience | Number of
Funds in the
Columbia Funds
complex
overseen | Other directorships
held by Trustee
during the past
five years |
Minor M. Shaw
c/o Columbia Management
Investment Advisers, LLC
225 Franklin Street
Mail Drop BX32 05228
Boston, MA 02110
1947 | Trustee since 6/11 for RiverSource Funds and since 2003 for Nations Funds | President, Micco LLC (private investments) since 2011; President, Micco Corp. (family investment business), 1998-2011 | 126 | Director, BlueCross BlueShield of South Carolina since April 2008; Advisory Board member, Duke Energy Corp. since October 2016; Chair of the Duke Endowment; Director, National Association of Corporate Directors, Carolinas Chapter, since 2013; Chair of Greenville – Spartanburg Airport Commission; former Trustee, BofA Funds Series Trust (11 funds), 2003-2011; former Director, Piedmont Natural Gas, 2004-2016 |
John G. Taft
c/o Columbia Management
Investment Advisers, LLC
225 Franklin Street
Mail Drop BX32 05228
Boston, MA 02110
1955 | Trustee since 1/17 | Chief Executive Officer, RBC Wealth Management (a division of RBC Capital Markets LLC), 2005-2016 | 124 | Trustee, Andy Warhol Foundation for Visual Arts (Finance Committee) since 2014; former Director, RBC Global Asset Management – U.S., 2001-2016 |
Alison Taunton-Rigby
c/o Columbia Management
Investment Advisers, LLC
225 Franklin Street
Mail Drop BX32 05228
Boston, MA 02110
1944 | Trustee since 11/02 for RiverSource Funds and since 6/11 for Nations Funds | President, Chief Executive Officer (CEO) and Director, RiboNovix, Inc., 2003-2010; President and CEO, CMT Inc., 2001-2003; President and CEO, Aquila Biopharmaceuticals Inc., 1996- 2000; President and CEO, Cambridge Biotechnology Corporation, 1995- 1996, President and CEO, Mitotix Inc., 1993-1994 | 127 | Director, Boston Children’s Hospital since 2002; Director, ICI Mutual Insurance Company, since 2011; Director, Blumont/IRD since 2016; Director, Mount Ida College since 2016; former Director, Abt Associates (government contractor), 2001-2016; former Director, Healthways, Inc. (health and well-being solutions), 2005-2016 |
Interested trustee not affiliated with Investment Manager*
Name
address
year of birth | Position held
with the Trust and
length of service | Principal occupation(s) during the
past five years and other relevant
professional experience | Number of
Funds in the
Columbia Funds
complex overseen | Other directorships/
held by Trustee
during the past
five years |
Anthony M. Santomero
c/o Columbia Management
Investment Advisers, LLC
225 Franklin Street
Mail Drop BX32 05228
Boston, MA 02110
1946 | Trustee since 6/11 for RiverSource Funds and since 1/08 for Nations Funds | Richard K. Mellon Professor Emeritus of Finance, The Wharton School, University of Pennsylvania, since 2002; Senior Advisor, McKinsey & Company (consulting), 2006-2008; President, Federal Reserve Bank of Philadelphia, 2000-2006, Professor of Finance, The Wharton School, University of Pennsylvania, 1972-2002 | 124 | Trustee, Penn Mutual Life Insurance Company since March 2008; Director, Renaissance Reinsurance Ltd. since May 2008; Director, Citigroup Inc. since 2009; Director, Citibank, N.A. since 2009; former Trustee, BofA Funds Series Trust (11 funds), 2008-2011 |
| 36 | Columbia Global Strategic Equity Fund | Annual Report 2017 |
TRUSTEES AND OFFICERS (continued)
| * | Dr. Santomero is not an affiliated person of the Investment Manager or Ameriprise Financial. However, he is currently deemed by the Funds to be an “interested person” (as defined in the 1940 Act) of the Funds because he serves as a Director of Citigroup Inc. and Citibank, N.A., companies that may directly or through subsidiaries and affiliates engage from time-to-time in brokerage execution, principal transactions and lending relationships with the Funds or accounts advised/managed by the Investment Manager. |
Interested trustee affiliated with Investment Manager*
Name,
address,
year of birth | Position held with the Trusts and length of service | Principal occupation(s) during the
past five years and other relevant
professional experience | Number of
Funds in the
Columbia Funds
complex overseen | Other directorships
held by Trustee
during the past
five years |
William F. Truscott
c/o Columbia Management
Investment Advisers, LLC
225 Franklin St.
Boston, MA 02110
1960 | Trustee since 11/01 for RiverSource Funds and since 6/11 for Nations Funds; Senior Vice President since 2002 for RiverSource Funds and since 5/10 for Nations Funds | Chairman of the Board and President, Columbia Management Investment Advisers, LLC since May 2010 and February 2012, respectively; Chief Executive Officer, Global Asset Management, Ameriprise Financial, Inc. since September 2012 (previously Chief Executive Officer, U.S. Asset Management & President, Annuities, May 2010 - September 2012); Director and Chief Executive Officer, Columbia Management Investment Distributors, Inc. since May 2010 and February 2012, respectively; Chairman of the Board and Chief Executive Officer, RiverSource Distributors, Inc. since 2006; Director, Threadneedle Asset Management Holdings, SARL since 2014; President and Chief Executive Officer, Ameriprise Certificate Company, 2006 - August 2012. | 185 | Chairman of the Board, Columbia Management Investment Advisers, LLC since May 2010; Director, Columbia Management Investment Distributors, Inc. since May 2010; former Director, Ameriprise Certificate Company, 2006-January 2013 |
| * | Interested person (as defined under the 1940 Act) by reason of being an officer, director, security holder and/or employee of the Investment Manager or Ameriprise Financial. |
The Statement of Additional Information has additional information about the Fund’s Board members and is available, without charge, upon request by calling 800.345.6611; contacting your financial intermediary; or visiting
investor.columbiathreadneedleus.com.
Columbia Global Strategic Equity Fund | Annual Report 2017
| 37 |
TRUSTEES AND OFFICERS (continued)
The Board has appointed officers who are responsible for day-to-day business decisions based on policies it has established. The officers serve at the pleasure of the Board. The following table provides basic information about the Officers of the Fund, including principal occupations during the past five years, although their specific titles may have varied over the period. In addition to Mr. Truscott, who is Senior Vice President, the Fund’s other officers are:
Fund officers
Name,
address and
year of birth | Position and year
first appointed to
position for any Fund
in the Columbia
Funds complex or a
predecessor thereof | Principal occupation(s) during past five years |
Christopher O. Petersen
5228 Ameriprise
Financial Center
Minneapolis, MN 55474
Born 1970 | President and Principal Executive Officer (2015) | Vice President and Lead Chief Counsel, Ameriprise Financial, Inc. since January 2015 (previously, Vice President and Chief Counsel, January 2010 - December 2014; officer of Columbia Funds and affiliated funds since 2007. |
Michael G. Clarke
225 Franklin Street
Boston, MA 02110
Born 1969 | Treasurer (2011), Chief Financial Officer (2009) and Chief Accounting Officer (2015) | Vice President — Mutual Fund Administration, Columbia Management Investment Advisers, LLC, since May 2010; senior officer of Columbia Funds and affiliated funds since 2002. |
Paul B. Goucher
100 Park Avenue
New York, NY 10017
Born 1968 | Senior Vice President (2011), Chief Legal Officer (2015) and Assistant Secretary (2008) | Senior Vice President and Assistant General Counsel, Ameriprise Financial, Inc. since January 2017 (previously Vice President and Lead Chief Counsel, November 2008 - January 2017 and January 2013 - January 2017, respectively and Chief Counsel, January 2010 - January 2013); Vice President, Chief Legal Officer and Assitant Secretary, Columbia Management Investment Advisers, LLC since May 2010. |
Thomas P. McGuire
225 Franklin Street
Boston, MA 02110
Born 1972 | Senior Vice President and Chief Compliance Officer (2012) | Vice President — Asset Management Compliance, Ameriprise Financial, Inc., since May 2010; Chief Compliance Officer, Ameriprise Certificate Company since September 2010. |
Colin Moore
225 Franklin Street
Boston, MA 02110
Born 1958 | Senior Vice President (2010) | Executive Vice President and Global Chief Investment Officer, Ameriprise Financial, Inc., since July 2013; Executive Vice President and Global Chief Investment Officer, Columbia Management Investment Advisers, LLC since July 2013 (previously Director and Global Chief Investment Officer, 2010 - 2013). |
Michael E. DeFao
225 Franklin Street
Boston, MA 02110
Born 1968 | Vice President (2011) and Assistant Secretary (2010) | Vice President and Chief Counsel, Ameriprise Financial, Inc. since May 2010. |
Amy Johnson
5228 Ameriprise
Financial Center
Minneapolis, MN 55474
Born 1965 | Vice President (2006) | Managing Director and Global Head of Operations, Columbia Management Investment Advisers, LLC since April 2016 (previously Managing Director and Chief Operatiing Officer, 2010 - 2016).). |
Lyn Kephart-Strong
5228 Ameriprise
Financial Center
Minneapolis, MN 55474
Born 1960 | Vice President (2015) | President, Columbia Management Investment Services Corp. since October 2014; Vice President & Resolution Officer, Ameriprise Trust Company since August 2009. |
Ryan C. Larrenaga
225 Franklin Street
Boston, MA 02110
Born 1970 | Vice President and Secretary (2015) | Vice President and Group Counsel, Ameriprise Financial, Inc. since August 2011; officer of Columbia Funds and affiliated funds since 2005. |
| 38 | Columbia Global Strategic Equity Fund | Annual Report 2017 |
The Fund mails one shareholder report to each shareholder address. If you would like more than one report, please call shareholder services at 800.345.6611 and additional reports will be sent to you.
Proxy voting policies and procedures
The policy of the Board is to vote the proxies of the companies in which the Fund holds investments consistent with the procedures as stated in the Statement of Additional Information (SAI). You may obtain a copy of the SAI without charge by calling 800.345.6611; contacting your financial intermediary; visiting investor.columbiathreadneedleus.com; or searching the website of the Securities and Exchange Commission (SEC) at sec.gov. Information regarding how the Fund voted proxies relating to portfolio securities is filed with the SEC by August 31st for the most recent 12-month period ending June 30th of that year, and is available without charge by visiting investor.columbiathreadneedleus.com, or searching the website of the SEC at sec.gov.
Quarterly schedule of investments
The Fund files a complete schedule of portfolio holdings with the SEC for the first and third quarters of each fiscal year on Form N-Q. The Fund’s Form N-Q is available on the SEC’s website at sec.gov and may be reviewed and copied at the SEC’s Public Reference Room in Washington, D.C. Information on the operation of the Public Reference Room may be obtained by calling 800.SEC.0330. The Fund’s complete schedule of portfolio holdings, as filed on Form N-Q, can also be obtained without charge, upon request, by calling 800.345.6611.
Additional Fund information
For more information about the Fund, please visit investor.columbiathreadneedleus.com or call 800.345.6611. Customer Service Representatives are available to answer your questions Monday through Friday from 8 a.m. to 7 p.m. Eastern time.
Fund investment manager
Columbia Management Investment Advisers, LLC
225 Franklin Street
Boston, MA 02110
Fund distributor
Columbia Management Investment Distributors, Inc.
225 Franklin Street
Boston, MA 02110
Fund transfer agent
Columbia Management Investment Services Corp.
P.O. Box 8081
Boston, MA 02266-8081
Columbia Global Strategic Equity Fund | Annual Report 2017
| 39 |
[THIS PAGE INTENTIONALLY LEFT BLANK]
[THIS PAGE INTENTIONALLY LEFT BLANK]
Columbia Global Strategic Equity Fund
P.O. Box 8081
Boston, MA 02266-8081
Please read and consider the investment objectives, risks, charges and expenses for any fund carefully before investing. For a prospectus and summary prospectus, which contains this and other important information about the Fund, go to
investor.columbiathreadneedleus.com. The Fund is distributed by Columbia Management Investment Distributors, Inc., member FINRA, and managed by Columbia Management Investment Advisers, LLC.
Columbia Threadneedle Investments (Columbia Threadneedle) is the global brand name of the Columbia and Threadneedle group of companies. All rights reserved. Columbia Management Investment Distributors, Inc., 225 Franklin Street, Boston, MA 02110-2804
© 2017 Columbia Management Investment Advisers, LLC.
investor.columbiathreadneedleus.com

Annual Report
January 31, 2017
Columbia Capital Allocation Portfolios
Columbia Capital Allocation Conservative Portfolio
Columbia Capital Allocation Moderate Conservative Portfolio
Columbia Capital Allocation Moderate Portfolio
Columbia Capital Allocation Moderate Aggressive Portfolio
Columbia Capital Allocation Aggressive Portfolio
Not FDIC Insured • No bank guarantee • May lose value
Dear Shareholders,
While emotions have run high following the outcome of the U.S. Presidential election, it remains unclear how the Trump presidency will unfold in terms of policy. We have a sense of the priorities espoused by the President over the past eighteen months, but campaign priorities are not always realized and are often never pursued. What seems certain is that, while some investors have already priced expectations into the market, others have retreated, preferring instead a wait and see approach. The outcome of such behaviors appears to have created conditions ripe for ongoing market volatility.
While volatility in the financial markets can be stressful, volatility itself is not a new phenomenon. Other factors that have been at the root cause of recent volatility include uncertainty following the United Kingdom’s vote to exit the European Union (Brexit), speculation around the Federal Reserve’s decision to increase interest rates, divergent central bank policy and geopolitical unrest. The point is, financial markets have fluctuated for years and may be expected to continue to fluctuate — sometimes wildly. If anything, such volatility seems to be the new normal, perhaps exacerbated by access to information and development of technological tools which have enabled investors to react rapidly to real and perceived change. So what can you do?
Position your portfolio for the reality of market volatility
That there is a historical precedent for market volatility, or even an acceptance that it may persist, offers little comfort. A measured and strategic approach remains the best strategy for investors to stay on track in achieving their investment goals.
Step 1: Review your investment goals
Take this opportunity to review your investment goals and the strategies you are pursuing to achieve those goals in order to remain focused on what’s important to you. It is entirely possible that your goals have changed in response either to your life situation or to changes in the market. Accept what you can’t control — volatility, and focus on what you can — your investment goals and strategies.
Step 2: Reassess your risk tolerance
Sit down with your financial advisor to discuss your investment goals and strategies, as well as any changes to your tolerance for risk. Consider your investment horizon. Increased market volatility and a new investment horizon may impact the strategies that can best help you achieve your investment goals. Remember, achieving your investment goals may require a certain amount of risk. Ultimately, you must maintain vigilance in reassessing your risk tolerance and the strategies you have selected in pursuit of your investment goals, and awareness of how those strategies may react to market volatility.
Step 3: Remain calm and focus on your long-term plan
Remember, investing is about the long game. Short term events are not necessarily evidence of a longer term reality. Investors who attempt to time the market too often end up reacting to a down turn by selling low and then compounding the problem by waiting on the sidelines, ultimately missing the right opportunity to reinvest.
Columbia Capital Allocation Portfolios | Annual Report 2017
President’s Message (continued)
As long as there is a market, there will be volatility. How you respond to that volatility can make a big difference in the measure of your success as an investor. Talk to your financial advisor about how working with Columbia Threadneedle Investments may help you position your portfolio for the reality of ongoing volatility and, perhaps, even turn such volatility into investment opportunity.
Sincerely,
Christopher O. Petersen
President, Columbia Funds
Investors should consider the investment objectives, risks, charges and expenses of a mutual fund carefully before investing. For a free prospectus and summary prospectus, which contains this and other important information about a fund, visit investor.columbiathreadneedleus.com. The prospectus should be read carefully before investing.
Columbia Funds are distributed by Columbia Management Investment Distributors, Inc., member FINRA, and managed by Columbia Management Investment Advisers, LLC.
© 2017 Columbia Management Investment Advisers, LLC. All rights reserved.
Columbia Capital Allocation Portfolios | Annual Report 2017
| 3 |
| 5 |
| 7 |
| 9 |
| 11 |
| 13 |
| 15 |
| 17 |
| 79 |
| 84 |
| 88 |
| 96 |
| 118 |
| 143 |
| 144 |
| 145 |
| 150 |
Columbia Capital Allocation Portfolios | Annual Report 2017
Fund at a Glance
Columbia Capital Allocation Conservative Portfolio
Investment objective
Columbia Capital Allocation Conservative Portfolio (the Fund) seeks the highest level of total return that is consistent with a conservative level of risk.
Portfolio management
Jeffrey Knight, CFA
Co-manager
Managed Fund since 2013
Anwiti Bahuguna, Ph.D.
Co-manager
Managed Fund since 2010
Joshua Kutin, CFA*
Co-manager
Managed Fund since January 2017
Dan Boncarosky, CFA*
Co-manager
Managed Fund since January 2017
*Effective January 27, 2017, Marie Schofield, Beth Vanney and Toby Nangle no longer serve as portfolio managers of the Fund. On the same date, Messrs. Kutin and Boncarosky were named as portfolio managers of the Fund.
| Average annual total returns (%) (for the period ended January 31, 2017) |
| | | Inception | 1 Year | 5 Years | 10 Years |
| Class A | Excluding sales charges | 03/04/04 | 6.67 | 3.93 | 4.03 |
| | Including sales charges | | 1.62 | 2.93 | 3.52 |
| Class B | Excluding sales charges | 03/04/04 | 5.90 | 3.15 | 3.25 |
| | Including sales charges | | 0.90 | 2.82 | 3.25 |
| Class C | Excluding sales charges | 03/04/04 | 5.80 | 3.13 | 3.25 |
| | Including sales charges | | 4.80 | 3.13 | 3.25 |
| Class K | 03/04/04 | 6.70 | 4.01 | 4.17 |
| Class R * | 09/27/10 | 6.41 | 3.68 | 3.80 |
| Class R4 * | 06/13/13 | 6.98 | 4.10 | 4.11 |
| Class R5 * | 06/13/13 | 7.05 | 4.16 | 4.15 |
| Class Y * | 06/13/13 | 6.99 | 4.20 | 4.16 |
| Class Z * | 09/27/10 | 6.94 | 4.19 | 4.20 |
| Blended Benchmark | | 5.50 | 4.11 | 4.60 |
| Bloomberg Barclays U.S. Aggregate Bond Index | | 1.45 | 2.09 | 4.37 |
| Russell 3000 Index | | 21.73 | 13.97 | 7.07 |
Returns for Class A are shown with and without the maximum initial sales charge of 4.75%. Returns for Class B are shown with and without the applicable contingent deferred sales charge (CDSC) of 5.00% in the first year, declining to 1.00% in the sixth year and eliminated thereafter. The Fund does not accept new investments in Class B shares, except for certain limited transactions. The Fund’s current Class B investors, having held their shares for the requisite time period, are no longer subject to a CDSC upon redemption of their shares. Returns for Class C are shown with and without the 1.00% CDSC for the first year only. The Fund’s other classes are not subject to sales charges and have limited eligibility. Please see the Fund’s prospectus for details. Performance for different share classes will vary based on differences in sales charges and fees associated with each class. All results shown assume reinvestment of distributions during the period. Returns do not reflect the deduction of taxes that a shareholder may pay on Fund distributions or on the redemption of Fund shares. Performance results reflect the effect of any fee waivers or reimbursements of Fund expenses by Columbia Management Investment Advisers, LLC and/or any of its affiliates. Absent these fee waivers or expense reimbursement arrangements, performance results would have been lower.
The performance information shown represents past performance and is not a guarantee of future results. The investment return and principal value of your investment will fluctuate so that your shares, when redeemed, may be worth more or less than their original cost. Current performance may be lower or higher than the performance information shown. You may obtain performance information current to the most recent month-end by contacting your financial intermediary, visiting investor.columbiathreadneedleus.com or calling 800.345.6611.
| * | The returns shown for periods prior to the share class inception date (including returns for the Life of the Fund, if shown, which are since Fund inception) include the returns of the Fund’s oldest share class. Since the Fund launched more than one share class at its inception, Class A shares were used. These returns are adjusted to reflect any higher class-related operating expenses of the newer share classes, as applicable. Please visit investor.columbiathreadneedleus.com/investment-products/mutual-funds/appended-performance for more information. |
The Blended Benchmark consists of 66% Bloomberg Barclays U.S. Aggregate Bond Index, 15% Russell 3000 Index, 10% Citi Three-Month U.S. Treasury Bill Index, 5% MSCI EAFE Index (Net) and 4% Bloomberg Barclays U.S. Corporate High-Yield Index. The Citi Three-Month U.S. Treasury Bill Index, an unmanaged index, is representative of the performance of three-month Treasury bills. The MSCI EAFE Index (Net) is a free float-adjusted market capitalization index that is designed to measure the equity market performance of developed markets, excluding the U.S. and Canada. The Bloomberg Barclays U.S. Corporate High-Yield Index is a market value-weighted index, which covers the U.S. non-investment-grade fixed-rate debt market.
The Bloomberg Barclays U.S. Aggregate Bond Index is a broad-based benchmark that measures the investment-grade, U.S. dollar-denominated, fixed-rate taxable bond market, including Treasuries, government-related and corporate securities, mortgage-backed securities (agency fixed-rate and hybrid adjustable-rate mortgage passthroughs), asset-backed securities, and commercial mortgage-backed securities.
The Russell 3000 Index, an unmanaged index, measures the performance of the 3,000 largest U.S. companies based on total market capitalization, which represents approximately 98% of the investable U.S. equity market.
Columbia Capital Allocation Portfolios | Annual Report 2017
| 3 |
Fund at a Glance (continued)
Columbia Capital Allocation Conservative Portfolio
Indices are not available for investment, are not professionally managed and do not reflect sales charges, fees, brokerage commissions, taxes (except the MSCI EAFE Index (Net), which reflects reinvested dividends net of withholding taxes) or other expenses of investing. Securities in the Fund may not match those in an index.
Performance of a hypothetical $10,000 investment (January 31, 2007 — January 31, 2017)
The chart above shows the change in value of a hypothetical $10,000 investment in Class A shares of Columbia Capital Allocation Conservative Portfolio during the stated time period, and does not reflect the deduction of taxes that a shareholder may pay on Fund distributions or on the redemption of Fund shares.
| Portfolio breakdown (%) (at January 31, 2017) |
| Alternative Investment Funds | 7.6 |
| Common Stocks | 3.1 |
| Equity Funds | 18.3 |
| Fixed-Income Funds | 60.2 |
| Money Market Funds | 10.7 |
| Preferred Stocks | 0.1 |
| Total | 100.0 |
Percentages indicated are based upon total investments. The Fund’s portfolio composition is subject to change.
| 4 | Columbia Capital Allocation Portfolios | Annual Report 2017 |
Fund at a Glance
Columbia Capital Allocation Moderate Conservative Portfolio
Investment objective
Columbia Capital Allocation Moderate Conservative Portfolio (the Fund) seeks the highest level of total return that is consistent with a moderate conservative level of risk.
Portfolio management
Jeffrey Knight, CFA
Co-manager
Managed Fund since 2013
Anwiti Bahuguna, Ph.D.
Co-manager
Managed Fund since 2009
Joshua Kutin, CFA*
Co-manager
Managed Fund since January 2017
Dan Boncarosky, CFA*
Co-manager
Managed Fund since January 2017
*Effective January 27, 2017, Marie Schofield, Beth Vanney and Toby Nangle no longer serve as portfolio managers of the Fund. On the same date, Messrs. Kutin and Boncarosky were named as portfolio managers of the Fund.
| Average annual total returns (%) (for the period ended January 31, 2017) |
| | | Inception | 1 Year | 5 Years | 10 Years |
| Class A | Excluding sales charges | 10/15/96 | 8.47 | 5.32 | 4.89 |
| | Including sales charges | | 2.22 | 4.08 | 4.27 |
| Class B | Excluding sales charges | 08/07/97 | 7.61 | 4.52 | 4.09 |
| | Including sales charges | | 2.61 | 4.19 | 4.09 |
| Class C | Excluding sales charges | 10/15/96 | 7.67 | 4.53 | 4.10 |
| | Including sales charges | | 6.67 | 4.53 | 4.10 |
| Class K * | 02/28/13 | 8.59 | 5.39 | 4.92 |
| Class R | 01/23/06 | 8.09 | 5.06 | 4.63 |
| Class R4 * | 11/08/12 | 8.71 | 5.55 | 5.00 |
| Class R5 * | 11/08/12 | 8.78 | 5.60 | 5.03 |
| Class Y * | 06/13/13 | 8.84 | 5.63 | 5.04 |
| Class Z | 10/15/96 | 8.75 | 5.58 | 5.14 |
| Blended Benchmark | | 8.26 | 5.72 | 5.06 |
| Bloomberg Barclays U.S. Aggregate Bond Index | | 1.45 | 2.09 | 4.37 |
| Russell 3000 Index | | 21.73 | 13.97 | 7.07 |
Returns for Class A are shown with and without the maximum initial sales charge of 5.75%. Returns for Class B are shown with and without the applicable contingent deferred sales charge (CDSC) of 5.00% in the first year, declining to 1.00% in the sixth year and eliminated thereafter. The Fund does not accept new investments in Class B shares, except for certain limited transactions. The Fund’s current Class B investors, having held their shares for the requisite time period, are no longer subject to a CDSC upon redemption of their shares. Returns for Class C are shown with and without the 1.00% CDSC for the first year only. The Fund’s other classes are not subject to sales charges and have limited eligibility. Please see the Fund’s prospectus for details. Performance for different share classes will vary based on differences in sales charges and fees associated with each class. All results shown assume reinvestment of distributions during the period. Returns do not reflect the deduction of taxes that a shareholder may pay on Fund distributions or on the redemption of Fund shares. Performance results reflect the effect of any fee waivers or reimbursements of Fund expenses by Columbia Management Investment Advisers, LLC and/or any of its affiliates. Absent these fee waivers or expense reimbursement arrangements, performance results would have been lower.
The performance information shown represents past performance and is not a guarantee of future results. The investment return and principal value of your investment will fluctuate so that your shares, when redeemed, may be worth more or less than their original cost. Current performance may be lower or higher than the performance information shown. You may obtain performance information current to the most recent month-end by contacting your financial intermediary, visiting investor.columbiathreadneedleus.com or calling 800.345.6611.
| * | The returns shown for periods prior to the share class inception date (including returns for the Life of the Fund, if shown, which are since Fund inception) include the returns of the Fund’s oldest share class. Since the Fund launched more than one share class at its inception, Class A shares were used. These returns are adjusted to reflect any higher class-related operating expenses of the newer share classes, as applicable. Please visit investor.columbiathreadneedleus.com/investment-products/mutual-funds/appended-performance for more information. |
The Blended Benchmark consists of 55.5% Bloomberg Barclays U.S. Aggregate Bond Index, 26% Russell 3000 Index, 9% MSCI EAFE Index (Net), 5% Citi Three-Month U.S. Treasury Bill Index and 4.5% Bloomberg Barclays U.S. Corporate High-Yield Index. The MSCI EAFE Index (Net) is a free float-adjusted market capitalization index that is designed to measure the equity market performance of developed markets, excluding the U.S. and Canada. The Citi Three-Month U.S. Treasury Bill Index, an unmanaged index, is representative of the performance of three-month Treasury bills. The Bloomberg Barclays U.S. Corporate High-Yield Index is a market value-weighted index, which covers the U.S. non-investment-grade fixed-rate debt market.
The Bloomberg Barclays U.S. Aggregate Bond Index is a broad-based benchmark that measures the investment-grade, U.S. dollar-denominated, fixed-rate taxable bond market, including Treasuries, government-related and corporate securities, mortgage-backed securities (agency fixed-rate and hybrid adjustable-rate mortgage passthroughs), asset-backed securities, and commercial mortgage-backed securities.
The Russell 3000 Index, an unmanaged index, measures the performance of the 3,000 largest U.S. companies based on total market capitalization, which represents approximately 98% of the investable U.S. equity market.
Columbia Capital Allocation Portfolios | Annual Report 2017
| 5 |
Fund at a Glance (continued)
Columbia Capital Allocation Moderate Conservative Portfolio
Indices are not available for investment, are not professionally managed and do not reflect sales charges, fees, brokerage commissions, taxes (except the MSCI EAFE Index (Net), which reflects reinvested dividends net of withholding taxes) or other expenses of investing. Securities in the Fund may not match those in an index.
Performance of a hypothetical $10,000 investment (January 31, 2007 — January 31, 2017)
The chart above shows the change in value of a hypothetical $10,000 investment in Class A shares of Columbia Capital Allocation Moderate Conservative Portfolio during the stated time period, and does not reflect the deduction of taxes that a shareholder may pay on Fund distributions or on the redemption of Fund shares.
| Portfolio breakdown (%) (at January 31, 2017) |
| Alternative Investment Funds | 6.9 |
| Common Stocks | 2.1 |
| Equity Funds | 32.6 |
| Fixed-Income Funds | 49.3 |
| Money Market Funds | 9.1 |
| Preferred Stocks | 0.0 (a) |
| Total | 100.0 |
Percentages indicated are based upon total investments. The Fund’s portfolio composition is subject to change.
| 6 | Columbia Capital Allocation Portfolios | Annual Report 2017 |
Fund at a Glance
Columbia Capital Allocation Moderate Portfolio
Investment objective
Columbia Capital Allocation Moderate Portfolio (the Fund) seeks the highest level of total return that is consistent with a moderate level of risk.
Portfolio management
Jeffrey Knight, CFA
Co-manager
Managed Fund since 2013
Anwiti Bahuguna, Ph.D.
Co-manager
Managed Fund since 2010
Joshua Kutin, CFA*
Co-manager
Managed Fund since January 2017
Dan Boncarosky, CFA*
Co-manager
Managed Fund since January 2017
*Effective January 27, 2017, Marie Schofield, Beth Vanney and Toby Nangle no longer serve as portfolio managers of the Fund. On the same date, Messrs. Kutin and Boncarosky were named as portfolio managers of the Fund.
| Average annual total returns (%) (for the period ended January 31, 2017) |
| | | Inception | 1 Year | 5 Years | 10 Years |
| Class A | Excluding sales charges | 03/04/04 | 11.19 | 6.91 | 5.08 |
| | Including sales charges | | 4.81 | 5.64 | 4.46 |
| Class B | Excluding sales charges | 03/04/04 | 10.32 | 6.12 | 4.29 |
| | Including sales charges | | 5.32 | 5.80 | 4.29 |
| Class C | Excluding sales charges | 03/04/04 | 10.34 | 6.12 | 4.30 |
| | Including sales charges | | 9.34 | 6.12 | 4.30 |
| Class K | 03/04/04 | 11.26 | 6.99 | 5.23 |
| Class R * | 09/27/10 | 10.84 | 6.63 | 4.81 |
| Class R4 * | 06/13/13 | 11.39 | 7.11 | 5.17 |
| Class R5 * | 06/13/13 | 11.55 | 7.18 | 5.21 |
| Class Y * | 06/13/13 | 11.61 | 7.24 | 5.24 |
| Class Z * | 09/27/10 | 11.48 | 7.17 | 5.24 |
| Blended Benchmark | | 11.81 | 7.33 | 5.57 |
| Russell 3000 Index | | 21.73 | 13.97 | 7.07 |
| Bloomberg Barclays U.S. Aggregate Bond Index | | 1.45 | 2.09 | 4.37 |
Returns for Class A are shown with and without the maximum initial sales charge of 5.75%. Returns for Class B are shown with and without the applicable contingent deferred sales charge (CDSC) of 5.00% in the first year, declining to 1.00% in the sixth year and eliminated thereafter. The Fund does not accept new investments in Class B shares, except for certain limited transactions. The Fund’s current Class B investors, having held their shares for the requisite time period, are no longer subject to a CDSC upon redemption of their shares. Returns for Class C are shown with and without the 1.00% CDSC for the first year only. The Fund’s other classes are not subject to sales charges and have limited eligibility. Please see the Fund’s prospectus for details. Performance for different share classes will vary based on differences in sales charges and fees associated with each class. All results shown assume reinvestment of distributions during the period. Returns do not reflect the deduction of taxes that a shareholder may pay on Fund distributions or on the redemption of Fund shares. Performance results reflect the effect of any fee waivers or reimbursements of Fund expenses by Columbia Management Investment Advisers, LLC and/or any of its affiliates. Absent these fee waivers or expense reimbursement arrangements, performance results would have been lower.
The performance information shown represents past performance and is not a guarantee of future results. The investment return and principal value of your investment will fluctuate so that your shares, when redeemed, may be worth more or less than their original cost. Current performance may be lower or higher than the performance information shown. You may obtain performance information current to the most recent month-end by contacting your financial intermediary, visiting investor.columbiathreadneedleus.com or calling 800.345.6611.
| * | The returns shown for periods prior to the share class inception date (including returns for the Life of the Fund, if shown, which are since Fund inception) include the returns of the Fund’s oldest share class. Since the Fund launched more than one share class at its inception, Class A shares were used. These returns are adjusted to reflect any higher class-related operating expenses of the newer share classes, as applicable. Please visit investor.columbiathreadneedleus.com/investment-products/mutual-funds/appended-performance for more information. |
The Blended Benchmark consists of 42.5% Bloomberg Barclays U.S. Aggregate Bond Index, 37% Russell 3000 Index, 11% MSCI EAFE Index (Net), 7.5% Bloomberg Barclays U.S. Corporate High-Yield Index and 2% MSCI Emerging Markets Index (Net). The MSCI EAFE Index (Net) is a free float-adjusted market capitalization index that is designed to measure the equity market performance of developed markets, excluding the U.S. and Canada. The Bloomberg Barclays U.S. Corporate High-Yield Index is a market value-weighted index, which covers the U.S. non-investment-grade fixed-rate debt market. The MSCI Emerging Markets Index (Net) is a free float-adjusted market capitalization index that is designed to measure equity market performance of emerging markets.
The Russell 3000 Index, an unmanaged index, measures the performance of the 3,000 largest U.S. companies based on total market capitalization, which represents approximately 98% of the investable U.S. equity market.
The Bloomberg Barclays U.S. Aggregate Bond Index is a broad-based benchmark that measures the investment-grade, U.S. dollar-denominated, fixed-rate taxable bond market, including Treasuries, government-related and corporate securities, mortgage-backed securities (agency fixed-rate and hybrid adjustable-rate mortgage passthroughs), asset-backed securities, and commercial mortgage-backed securities.
Columbia Capital Allocation Portfolios | Annual Report 2017
| 7 |
Fund at a Glance (continued)
Columbia Capital Allocation Moderate Portfolio
Indices are not available for investment, are not professionally managed and do not reflect sales charges, fees, brokerage commissions, taxes (except the MSCI EAFE Index (Net) and the MSCI Emerging Markets Index (Net), which reflect reinvested dividends net of withholding taxes) or other expenses of investing. Securities in the Fund may not match those in an index.
Performance of a hypothetical $10,000 investment (January 31, 2007 — January 31, 2017)
The chart above shows the change in value of a hypothetical $10,000 investment in Class A shares of Columbia Capital Allocation Moderate Portfolio during the stated time period, and does not reflect the deduction of taxes that a shareholder may pay on Fund distributions or on the redemption of Fund shares.
| Portfolio breakdown (%) (at January 31, 2017) |
| Alternative Investment Funds | 6.0 |
| Common Stocks | 2.1 |
| Equity Funds | 43.3 |
| Fixed-Income Funds | 42.5 |
| Money Market Funds | 6.1 |
| Preferred Stocks | 0.0 (a) |
| Total | 100.0 |
Percentages indicated are based upon total investments. The Fund’s portfolio composition is subject to change.
| 8 | Columbia Capital Allocation Portfolios | Annual Report 2017 |
Fund at a Glance
Columbia Capital Allocation Moderate Aggressive Portfolio
Investment objective
Columbia Capital Allocation Moderate Aggressive Portfolio (the Fund) seeks the highest level of total return that is consistent with a moderate aggressive level of risk.
Portfolio management
Jeffrey Knight, CFA
Co-manager
Managed Fund since 2013
Anwiti Bahuguna, Ph.D.
Co-manager
Managed Fund since 2009
Joshua Kutin, CFA*
Co-manager
Managed Fund since January 2017
Dan Boncarosky, CFA*
Co-manager
Managed Fund since January 2017
*Effective January 27, 2017, Marie Schofield, Beth Vanney and Toby Nangle no longer serve as portfolio managers of the Fund. On the same date, Messrs. Kutin and Boncarosky were named as portfolio managers of the Fund.
| Average annual total returns (%) (for the period ended January 31, 2017) |
| | | Inception | 1 Year | 5 Years | 10 Years |
| Class A | Excluding sales charges | 10/15/96 | 13.24 | 7.78 | 5.59 |
| | Including sales charges | | 6.73 | 6.51 | 4.96 |
| Class B | Excluding sales charges | 08/13/97 | 12.39 | 6.98 | 4.79 |
| | Including sales charges | | 7.39 | 6.68 | 4.79 |
| Class C | Excluding sales charges | 10/15/96 | 12.36 | 6.98 | 4.80 |
| | Including sales charges | | 11.36 | 6.98 | 4.80 |
| Class K * | 02/28/13 | 13.21 | 7.87 | 5.63 |
| Class R | 01/23/06 | 12.97 | 7.52 | 5.33 |
| Class R4 * | 11/08/12 | 13.61 | 8.04 | 5.71 |
| Class R5 * | 11/08/12 | 13.63 | 8.12 | 5.75 |
| Class V * | Excluding sales charges | 03/07/11 | 13.24 | 7.75 | 5.55 |
| | Including sales charges | | 6.73 | 6.48 | 4.92 |
| Class Y * | 06/13/13 | 13.68 | 8.11 | 5.75 |
| Class Z | 10/15/96 | 13.55 | 8.05 | 5.86 |
| Blended Benchmark | | 14.69 | 8.70 | 5.77 |
| Russell 3000 Index | | 21.73 | 13.97 | 7.07 |
| Bloomberg Barclays U.S. Aggregate Bond Index | | 1.45 | 2.09 | 4.37 |
Returns for Class A and Class V are shown with and without the maximum initial sales charge of 5.75%. (Effective January 24, 2017, Class T shares were renamed as Class V shares.) Returns for Class B are shown with and without the applicable contingent deferred sales charge (CDSC) of 5.00% in the first year, declining to 1.00% in the sixth year and eliminated thereafter. The Fund does not accept new investments in Class B shares, except for certain limited transactions. The Fund’s current Class B investors, having held their shares for the requisite time period, are no longer subject to a CDSC upon redemption of their shares. Returns for Class C are shown with and without the 1.00% CDSC for the first year only. The Fund’s other classes are not subject to sales charges and have limited eligibility. Please see the Fund’s prospectus for details. Performance for different share classes will vary based on differences in sales charges and fees associated with each class. All results shown assume reinvestment of distributions during the period. Returns do not reflect the deduction of taxes that a shareholder may pay on Fund distributions or on the redemption of Fund shares. Performance results reflect the effect of any fee waivers or reimbursements of Fund expenses by Columbia Management Investment Advisers, LLC and/or any of its affiliates. Absent these fee waivers or expense reimbursement arrangements, performance results would have been lower.
The performance information shown represents past performance and is not a guarantee of future results. The investment return and principal value of your investment will fluctuate so that your shares, when redeemed, may be worth more or less than their original cost. Current performance may be lower or higher than the performance information shown. You may obtain performance information current to the most recent month-end by contacting your financial intermediary, visiting investor.columbiathreadneedleus.com or calling 800.345.6611.
| * | The returns shown for periods prior to the share class inception date (including returns for the Life of the Fund, if shown, which are since Fund inception) include the returns of the Fund’s oldest share class. Since the Fund launched more than one share class at its inception, Class A shares were used. These returns are adjusted to reflect any higher class-related operating expenses of the newer share classes, as applicable. Please visit investor.columbiathreadneedleus.com/investment-products/mutual-funds/appended-performance for more information. |
The Blended Benchmark consists of 49% Russell 3000 Index, 28.5% Bloomberg Barclays U.S. Aggregate Bond Index, 12% MSCI EAFE Index (Net), 6.5% Bloomberg Barclays U.S. Corporate High-Yield Index and 4% MSCI Emerging Markets Index (Net). The MSCI EAFE Index (Net) is a free float-adjusted market capitalization index that is designed to measure the equity market performance of developed markets, excluding the U.S. and Canada. The Bloomberg Barclays U.S. Corporate High-Yield Index is a market value-weighted index, which covers the U.S. non-investment-grade fixed-rate debt market. The MSCI Emerging Markets Index (Net) is a free float-adjusted market capitalization index that is designed to measure equity market performance of emerging markets.
The Russell 3000 Index, an unmanaged index, measures the performance of the 3,000 largest U.S. companies based on total market capitalization, which represents approximately 98% of the investable U.S. equity market.
Columbia Capital Allocation Portfolios | Annual Report 2017
| 9 |
Fund at a Glance (continued)
Columbia Capital Allocation Moderate Aggressive Portfolio
The Bloomberg Barclays U.S. Aggregate Bond Index is a broad-based benchmark that measures the investment-grade, U.S. dollar-denominated, fixed-rate taxable bond market, including Treasuries, government-related and corporate securities, mortgage-backed securities (agency fixed-rate and hybrid adjustable-rate mortgage passthroughs), asset-backed securities, and commercial mortgage-backed securities.
Indices are not available for investment, are not professionally managed and do not reflect sales charges, fees, brokerage commissions, taxes (except the MSCI EAFE Index (Net) and the MSCI Emerging Markets Index (Net), which reflect reinvested dividends net of withholding taxes) or other expenses of investing. Securities in the Fund may not match those in an index.
Performance of a hypothetical $10,000 investment (January 31, 2007 — January 31, 2017)
The chart above shows the change in value of a hypothetical $10,000 investment in Class A shares of Columbia Capital Allocation Moderate Aggressive Portfolio during the stated time period, and does not reflect the deduction of taxes that a shareholder may pay on Fund distributions or on the redemption of Fund shares.
| Portfolio breakdown (%) (at January 31, 2017) |
| Alternative Investment Funds | 5.9 |
| Common Stocks | 1.5 |
| Equity Funds | 56.0 |
| Fixed-Income Funds | 24.7 |
| Money Market Funds | 11.9 |
| Preferred Stocks | 0.0 (a) |
| Total | 100.0 |
Percentages indicated are based upon total investments. The Fund’s portfolio composition is subject to change.
| 10 | Columbia Capital Allocation Portfolios | Annual Report 2017 |
Fund at a Glance
Columbia Capital Allocation Aggressive Portfolio
Investment objective
Columbia Capital Allocation Aggressive Portfolio (the Fund) seeks the highest level of total return that is consistent with an aggressive level of risk.
Portfolio management
Jeffrey Knight, CFA
Co-manager
Managed Fund since 2013
Anwiti Bahuguna, Ph.D.
Co-manager
Managed Fund since 2010
Joshua Kutin, CFA*
Co-manager
Managed Fund since January 2017
Dan Boncarosky, CFA*
Co-manager
Managed Fund since January 2017
*Effective January 27, 2017, Marie Schofield, Beth Vanney and Toby Nangle no longer serve as portfolio managers of the Fund. On the same date, Messrs. Kutin and Boncarosky were named as portfolio managers of the Fund.e
| Average annual total returns (%) (for the period ended January 31, 2017) |
| | | Inception | 1 Year | 5 Years | 10 Years |
| Class A | Excluding sales charges | 03/04/04 | 14.95 | 9.07 | 4.89 |
| | Including sales charges | | 8.31 | 7.79 | 4.27 |
| Class B | Excluding sales charges | 03/04/04 | 14.03 | 8.26 | 4.09 |
| | Including sales charges | | 9.03 | 7.96 | 4.09 |
| Class C | Excluding sales charges | 03/04/04 | 14.01 | 8.26 | 4.09 |
| | Including sales charges | | 13.01 | 8.26 | 4.09 |
| Class K | 03/04/04 | 14.98 | 9.19 | 5.05 |
| Class R * | 09/27/10 | 14.61 | 8.80 | 4.64 |
| Class R4 * | 06/13/13 | 15.20 | 9.26 | 4.98 |
| Class R5 * | 06/13/13 | 15.28 | 9.33 | 5.01 |
| Class Y * | 06/13/13 | 15.44 | 9.38 | 5.03 |
| Class Z * | 09/27/10 | 15.27 | 9.35 | 5.06 |
| Blended Benchmark | | 17.42 | 9.96 | 5.84 |
| Russell 3000 Index | | 21.73 | 13.97 | 7.07 |
| Bloomberg Barclays U.S. Aggregate Bond Index | | 1.45 | 2.09 | 4.37 |
Returns for Class A are shown with and without the maximum initial sales charge of 5.75%. Returns for Class B are shown with and without the applicable contingent deferred sales charge (CDSC) of 5.00% in the first year, declining to 1.00% in the sixth year and eliminated thereafter. The Fund does not accept new investments in Class B shares, except for certain limited transactions. The Fund’s current Class B investors, having held their shares for the requisite time period, are no longer subject to a CDSC upon redemption of their shares. Returns for Class C are shown with and without the 1.00% CDSC for the first year only. The Fund’s other classes are not subject to sales charges and have limited eligibility. Please see the Fund’s prospectus for details. Performance for different share classes will vary based on differences in sales charges and fees associated with each class. All results shown assume reinvestment of distributions during the period. Returns do not reflect the deduction of taxes that a shareholder may pay on Fund distributions or on the redemption of Fund shares. Performance results reflect the effect of any fee waivers or reimbursements of Fund expenses by Columbia Management Investment Advisers, LLC and/or any of its affiliates. Absent these fee waivers or expense reimbursement arrangements, performance results would have been lower.
The performance information shown represents past performance and is not a guarantee of future results. The investment return and principal value of your investment will fluctuate so that your shares, when redeemed, may be worth more or less than their original cost. Current performance may be lower or higher than the performance information shown. You may obtain performance information current to the most recent month-end by contacting your financial intermediary, visiting investor.columbiathreadneedleus.com or calling 800.345.6611.
| * | The returns shown for periods prior to the share class inception date (including returns for the Life of the Fund, if shown, which are since Fund inception) include the returns of the Fund’s oldest share class. Since the Fund launched more than one share class at its inception, Class A shares were used. These returns are adjusted to reflect any higher class-related operating expenses of the newer share classes, as applicable. Please visit investor.columbiathreadneedleus.com/investment-products/mutual-funds/appended-performance for more information. |
The Blended Benchmark consists of 60% Russell 3000 Index, 15% Bloomberg Barclays U.S. Aggregate Bond Index, 14% MSCI EAFE Index (Net), 6% MSCI Emerging Markets Index (Net) and 5% Bloomberg Barclays U.S. Corporate High-Yield Index. The MSCI EAFE Index (Net) is a free float-adjusted market capitalization index that is designed to measure the equity market performance of developed markets, excluding the U.S. and Canada. The MSCI Emerging Markets Index (Net) is a free float-adjusted market capitalization index that is designed to measure equity market performance of emerging markets. The Bloomberg Barclays U.S. Corporate High-Yield Index is a market value-weighted index, which covers the U.S. non-investment-grade fixed-rate debt market.
The Russell 3000 Index, an unmanaged index, measures the performance of the 3,000 largest U.S. companies based on total market capitalization, which represents approximately 98% of the investable U.S. equity market.
The Bloomberg Barclays U.S. Aggregate Bond Index is a broad-based benchmark that measures the investment-grade, U.S. dollar-denominated, fixed-rate taxable bond market, including Treasuries, government-related and corporate securities, mortgage-backed securities (agency fixed-rate and hybrid adjustable-rate mortgage passthroughs), asset-backed securities, and commercial mortgage-backed securities.
Columbia Capital Allocation Portfolios | Annual Report 2017
| 11 |
Fund at a Glance (continued)
Columbia Capital Allocation Aggressive Portfolio
Indices are not available for investment, are not professionally managed and do not reflect sales charges, fees, brokerage commissions, taxes (except the MSCI EAFE Index (Net) and the MSCI Emerging Markets Index (Net), which reflect reinvested dividends net of withholding taxes) or other expenses of investing. Securities in the Fund may not match those in an index.
Performance of a hypothetical $10,000 investment (January 31, 2007 — January 31, 2017)
The chart above shows the change in value of a hypothetical $10,000 investment in Class A shares of Columbia Capital Allocation Aggressive Portfolio during the stated time period, and does not reflect the deduction of taxes that a shareholder may pay on Fund distributions or on the redemption of Fund shares.
| Portfolio breakdown (%) (at January 31, 2017) |
| Alternative Investment Funds | 5.9 |
| Common Stocks | 2.7 |
| Equity Funds | 72.0 |
| Fixed-Income Funds | 12.1 |
| Money Market Funds | 7.3 |
| Preferred Stocks | 0.0 (a) |
| Total | 100.0 |
Percentages indicated are based upon total investments. The Fund’s portfolio composition is subject to change.
| 12 | Columbia Capital Allocation Portfolios | Annual Report 2017 |
Manager Discussion of Fund Performance
All Fund returns listed below are for Class A shares excluding sales charges for the 12-month period that ended January 31, 2017. We attribute the Funds’ relative performance to mixed results from asset class allocation and underlying fund performance.
| ■ | Columbia Capital Allocation Conservative Portfolio returned 6.67%. The Fund outperformed its Blended Benchmark, which returned 5.50%. |
| ■ | Columbia Capital Allocation Moderate Conservative Portfolio returned 8.47%. The Fund outperformed its Blended Benchmark, which returned 8.26%. |
| ■ | Columbia Capital Allocation Moderate Portfolio returned 11.19%. While absolute returns were healthy, the Fund underperformed its Blended Benchmark, which returned 11.81%. |
| ■ | Columbia Capital Allocation Moderate Aggressive Portfolio returned 13.24%. While absolute returns were robust, the Fund underperformed its Blended Benchmark, which returned 14.69%. |
| ■ | Columbia Capital Allocation Aggressive Portfolio returned 14.95%. While absolute returns were strong, the Fund underperformed its Blended Benchmark, which returned 17.42%. |
During the same time frame, the Russell 3000 Index, which measures domestic equities, returned 21.73%; the Bloomberg Barclays U.S. Aggregate Bond Index, which measures the U.S. fixed-income market, returned 1.45%; the Bloomberg Barclays U.S Corporate High-Yield Index, which measures the U.S. high-yield corporate bond market, returned 20.77%; the MSCI EAFE Index (Net), which measures international equities, returned 12.03%; the MSCI Emerging Markets Index (Net), which measures emerging market equities, returned 25.41%; and the Citi Three-Month U.S. Treasury Bill Index returned 0.30%.
Global capital markets gained despite macro surprises
During the 12 months ended January 31, 2017, several macro events surprised investors. The period began slowly, as investor concerns about global economic growth, especially the slowdown in China, and plunging oil prices heightened market volatility. However, risk assets rose swiftly and strongly in size, scope and speed beginning in mid-February 2016. Market volatility rose again ahead of the June 2016 referendum vote in the U.K. regarding its membership in the European Union. The unexpected “leave” vote, popularly known as Brexit, caught some market participants off guard, and a steep, albeit short-lived, equity market decline ensued globally. A rally, which many market strategists were surprised to see unfold, followed in a matter of days following the Brexit vote and pushed risk assets higher through the remainder of the summer. In November 2016, the U.S. elections again took investors for a bit of an unanticipated ride, as volatility spiked and U.S. Treasury bond yields soared higher following the victory of Donald Trump and a Republican sweep of Congress. The bellwether 10-year U.S. Treasury yield had reached a record low of 1.36% in July 2016 only to move higher and finish the annual period at 2.45%. While other interest rate-sensitive fixed-income sectors, such as securitized bonds, posted modest gains, high-yield corporate bonds led the way within the fixed-income market, with a return of 20.77%, as measured by the Bloomberg Barclays U.S. Corporate High-Yield Index.
The Russell 3000 Index and the S& P 500 Index, each a proxy for the broad U.S. stock market, returned 21.73% and 20.04%, respectively, for the period. Within the U.S. equity market, small cap stocks outperformed large cap stocks, and value stocks outperformed growth stocks. Overall, U.S. equities outperformed international developed market equities, although emerging market equities broadly performed comparably to U.S. equities amid divergent and varied monetary policies implemented by central banks around the world. For the period, the MSCI EAFE Index (Net), representing international developed market equities, posted a return of 12.03%, while the MSCI Emerging Markets Index (Net) returned 25.41%. At the end of the period, the advance in U.S. equity markets — from their bottom in March 2009 — had surpassed the duration of the bull market of 1990-1998 to become the second longest bull market of all time in the U.S., as measured by S&P 500 Index history. The bull market spanning 1921-1929 remained the longest bull market in history; however, should the existing bull market last until the middle of March 2017, then this record will fall.
The Federal Reserve (the Fed) raised the targeted federal funds rate in December 2016 for the first time in 12 months and also revised higher its expectations for the path of short-term interest rates in 2017, increasing its forecast from two interest rate hikes to three. Still, the Fed largely expressed a high degree of uncertainty about the ultimate effect of the then-incoming presidential administration’s policies on realized U.S. economic activity.
Columbia Capital Allocation Portfolios | Annual Report 2017
| 13 |
Manager Discussion of Fund Performance (continued)
Positioning and underlying fund performance generated mixed results
Underlying fund performance was the primary detractor from relative results in all but the most conservative fund, where it contributed positively. In particular, weak underlying fund performance among equities, especially those focused on U.S. large core equities, U.S. large growth equities and European equities, hurt relative results. On the fixed-income side, performance of underlying funds focused on high-yield bonds dampened results. Conversely, strategies focused on core fixed income proved especially beneficial to relative returns, while those focused on emerging market bonds also supported results, though more modestly so.
Asset allocation decisions contributed positively to results in all five Funds. Having an underweight allocation to core fixed income in all but Columbia Capital Allocation Moderate Portfolio helped relative results, as fixed income underperformed equities during the period, posting positive but modest returns. Having an underweight position to high-yield bonds detracted from returns in Columbia Capital Allocation Conservative Portfolio and Columbia Capital Allocation Moderate Conservative Portfolio, while having an overweight to high-yield bonds in Columbia Capital Allocation Moderate Aggressive Portfolio and Columbia Capital Allocation Aggressive Portfolio contributed to returns as high-yield posted bonds posted robust double-digit absolute returns during the period. Similarly, having an underweight or neutral allocation to equities in all five Funds hurt relative results, as equities posted strong absolute returns that significantly outpaced fixed income during the period. Exposure to absolute return strategies, which are not components of the Blended Benchmarks, detracted from results in all five Funds, as several of these underlying funds posted negative absolute returns during the period.
Further, given that most asset classes and sectors that the Funds invested in posted positive absolute returns during the period, having underweight positions in cash across all five Funds contributed positively to relative performance.
Various factors drove portfolio changes
Asset class changes within the portfolios can be driven by active trading, by directing allocations to select asset classes or by market appreciation or depreciation within a given asset class. During the annual period, we increased the Funds’ exposure to equities and reduced allocations to fixed income. Within equities, we increased exposure to U.S. large cap equities and emerging market equities. Within fixed income, we decreased allocations to securitized bonds, investment-grade bonds and high-yield bonds in all five Funds.
We increased allocations to commodities in all five Funds, as momentum and dynamics remained favorable, in our view. We also believed commodities offered potential for a tactical “catch-up” within the Funds’ risk asset holdings. We decreased allocations to alternative strategies in all five Funds, as we felt other asset classes offered more compelling return opportunities. Still, we continued to believe absolute return strategies may play an important role in the Funds, as they provide a key element of diversification.
Derivatives usage
During the period, the use of derivatives positions on equity indices, fixed-income indices and currencies was implemented via an overlay to the Funds to efficiently allocate capital across the Funds and to allow greater flexibility in establishing exposure to a given market that might otherwise not be possible. Futures and credit default swaps were used, as they can offer both a liquid and cost efficient means of establishing exposure in a given market and can be used to hedge duration and/or to reduce, or hedge, exposure to risk. The Funds benefited from the use of futures and credit default swaps during the period. Also, some of the underlying funds used derivatives during the period to attempt to enhance portfolio return and for hedging purposes as market conditions warranted.
Market risk may affect a single issuer, sector of the economy, industry or the market as a whole. The Fund’s investment in other funds subjects it to the investment performance (positive or negative), risks and expenses of these underlying funds. There are risks associated with fixed-income investments, including credit risk, interest rate risk, and prepayment and extension risk. In general, bond prices rise when interest rates fall and vice versa. This effect is usually more pronounced for longer term securities. Foreign investments subject the Fund to risks, including political, economic, market, social and others within a particular country, as well as to currency instabilities and less stringent financial and accounting standards generally applicable to U.S. issuers. Investing in derivatives is a specialized activity that involves special risks that subject the Fund to significant loss potential, including when used as leverage, and may result in greater fluctuation in Fund value. Asset allocation does not assure a profit or protect against loss. See the Fund’s prospectus for more information on these and other risks.
| 14 | Columbia Capital Allocation Portfolios | Annual Report 2017 |
Understanding Your Fund’s Expenses
(Unaudited)
As an investor, you incur two types of costs. There are transaction costs, which generally include sales charges on purchases and may include redemption fees. There are also ongoing costs, which generally include management fees, distribution and/or service fees, and other fund expenses. The following information is intended to help you understand your ongoing costs (in dollars) of investing in the Fund and to help you compare these costs with the ongoing costs of investing in other mutual funds.
Analyzing your Fund’s expenses
To illustrate these ongoing costs, we have provided examples and calculated the expenses paid by investors in each share class of the Fund during the period. The actual and hypothetical information in the table is based on an initial investment of $1,000 at the beginning of the period indicated and held for the entire period. Expense information is calculated two ways and each method provides you with different information. The amount listed in the “Actual” column is calculated using the Fund’s actual operating expenses and total return for the period. You may use the Actual information, together with the amount invested, to estimate the expenses that you paid over the period. Simply divide your account value by $1,000 (for example, an $8,600 account value divided by $1,000 = 8.6), then multiply the results by the expenses paid during the period under the “Actual” column. The amount listed in the “Hypothetical” column assumes a 5% annual rate of return before expenses (which is not the Fund’s actual return) and then applies the Fund’s actual expense ratio for the period to the hypothetical return. You should not use the hypothetical account values and expenses to estimate either your actual account balance at the end of the period or the expenses you paid during the period. See “Compare with other funds” below for details on how to use the hypothetical data.
In addition to the ongoing expenses which the Fund bears directly, the Fund’s shareholders indirectly bear the Fund’s allocable share of the costs and expenses of each underlying fund in which the Fund invests. You can also estimate the effective expenses paid during the period, which includes the indirect fees associated with investing in the underlying funds, by using the amounts listed in the “Effective expenses paid during the period” column.
Compare with other funds
Since all mutual funds are required to include the same hypothetical calculations about expenses in shareholder reports, you can use this information to compare the ongoing cost of investing in the Fund with other funds. To do so, compare the hypothetical example with the 5% hypothetical examples that appear in the shareholder reports of other funds. As you compare hypothetical examples of other funds, it is important to note that hypothetical examples are meant to highlight the ongoing costs of investing in a fund only and do not reflect any transaction costs, such as sales charges, or redemption or exchange fees. Therefore, the hypothetical calculations are useful in comparing ongoing costs only, and will not help you determine the relative total costs of owning different funds. If transaction costs were included in these calculations, your costs would be higher.
| August 1, 2016 — January 31, 2017 |
| | Account value at the
beginning of the
period ($) | Account value at the
end of the
period ($) | Expenses paid during
the period ($) | Fund’s annualized
expense ratio (%) | Effective expenses
paid during the
period ($) | Fund’s effective
annualized
expense ratio (%) |
| | Actual | Hypothetical | Actual | Hypothetical | Actual | Hypothetical | Actual | Actual | Hypothetical | Actual |
| Columbia Capital Allocation Conservative Portfolio |
| Class A | 1,000.00 | 1,000.00 | 998.10 | 1,022.56 | 2.84 | 2.88 | 0.56 | 5.33 | 5.40 | 1.05 |
| Class B | 1,000.00 | 1,000.00 | 994.30 | 1,018.75 | 6.64 | 6.72 | 1.31 | 9.12 | 9.23 | 1.80 |
| Class C | 1,000.00 | 1,000.00 | 993.30 | 1,018.75 | 6.64 | 6.72 | 1.31 | 9.12 | 9.23 | 1.80 |
| Class K | 1,000.00 | 1,000.00 | 998.40 | 1,022.82 | 2.59 | 2.62 | 0.51 | 5.08 | 5.14 | 1.00 |
| Class R | 1,000.00 | 1,000.00 | 996.90 | 1,021.29 | 4.11 | 4.16 | 0.81 | 6.60 | 6.68 | 1.30 |
| Class R4 | 1,000.00 | 1,000.00 | 999.30 | 1,023.83 | 1.57 | 1.59 | 0.31 | 4.06 | 4.11 | 0.80 |
| Class R5 | 1,000.00 | 1,000.00 | 999.70 | 1,024.09 | 1.32 | 1.34 | 0.26 | 3.81 | 3.86 | 0.75 |
| Class Y | 1,000.00 | 1,000.00 | 999.90 | 1,024.39 | 1.02 | 1.03 | 0.20 | 3.51 | 3.55 | 0.69 |
| Class Z | 1,000.00 | 1,000.00 | 999.40 | 1,023.83 | 1.57 | 1.59 | 0.31 | 4.06 | 4.11 | 0.80 |
Columbia Capital Allocation Portfolios | Annual Report 2017
| 15 |
Understanding Your Fund’s Expenses (continued)
(Unaudited)
| August 1, 2016 — January 31, 2017 |
| | Account value at the
beginning of the
period ($) | Account value at the
end of the
period ($) | Expenses paid during
the period ($) | Fund’s annualized
expense ratio (%) | Effective expenses
paid during the
period ($) | Fund’s effective
annualized
expense ratio (%) |
| | Actual | Hypothetical | Actual | Hypothetical | Actual | Hypothetical | Actual | Actual | Hypothetical | Actual |
| Columbia Capital Allocation Moderate Conservative Portfolio |
| Class A | 1,000.00 | 1,000.00 | 1,008.80 | 1,022.92 | 2.50 | 2.52 | 0.49 | 5.31 | 5.35 | 1.04 |
| Class B | 1,000.00 | 1,000.00 | 1,004.10 | 1,019.11 | 6.31 | 6.36 | 1.24 | 9.12 | 9.18 | 1.79 |
| Class C | 1,000.00 | 1,000.00 | 1,004.10 | 1,019.11 | 6.31 | 6.36 | 1.24 | 9.12 | 9.18 | 1.79 |
| Class K | 1,000.00 | 1,000.00 | 1,009.20 | 1,023.17 | 2.25 | 2.26 | 0.44 | 5.05 | 5.09 | 0.99 |
| Class R | 1,000.00 | 1,000.00 | 1,006.60 | 1,021.65 | 3.77 | 3.80 | 0.74 | 6.58 | 6.63 | 1.29 |
| Class R4 | 1,000.00 | 1,000.00 | 1,010.20 | 1,024.19 | 1.23 | 1.23 | 0.24 | 4.04 | 4.06 | 0.79 |
| Class R5 | 1,000.00 | 1,000.00 | 1,009.50 | 1,024.44 | 0.97 | 0.98 | 0.19 | 3.78 | 3.81 | 0.74 |
| Class Y | 1,000.00 | 1,000.00 | 1,010.80 | 1,024.70 | 0.72 | 0.72 | 0.14 | 3.53 | 3.55 | 0.69 |
| Class Z | 1,000.00 | 1,000.00 | 1,009.20 | 1,024.19 | 1.23 | 1.23 | 0.24 | 4.03 | 4.06 | 0.79 |
| Columbia Capital Allocation Moderate Portfolio |
| Class A | 1,000.00 | 1,000.00 | 1,020.30 | 1,023.17 | 2.26 | 2.26 | 0.44 | 5.54 | 5.55 | 1.08 |
| Class B | 1,000.00 | 1,000.00 | 1,016.60 | 1,019.36 | 6.10 | 6.11 | 1.19 | 9.38 | 9.39 | 1.83 |
| Class C | 1,000.00 | 1,000.00 | 1,017.50 | 1,019.36 | 6.10 | 6.11 | 1.19 | 9.38 | 9.39 | 1.83 |
| Class K | 1,000.00 | 1,000.00 | 1,020.60 | 1,023.43 | 2.00 | 2.01 | 0.39 | 5.29 | 5.30 | 1.03 |
| Class R | 1,000.00 | 1,000.00 | 1,019.10 | 1,021.90 | 3.54 | 3.54 | 0.69 | 6.82 | 6.83 | 1.33 |
| Class R4 | 1,000.00 | 1,000.00 | 1,021.80 | 1,024.44 | 0.98 | 0.98 | 0.19 | 4.26 | 4.27 | 0.83 |
| Class R5 | 1,000.00 | 1,000.00 | 1,023.00 | 1,024.70 | 0.72 | 0.72 | 0.14 | 4.01 | 4.01 | 0.78 |
| Class Y | 1,000.00 | 1,000.00 | 1,022.30 | 1,024.95 | 0.46 | 0.46 | 0.09 | 3.75 | 3.76 | 0.73 |
| Class Z | 1,000.00 | 1,000.00 | 1,022.50 | 1,024.44 | 0.98 | 0.98 | 0.19 | 4.27 | 4.27 | 0.83 |
| Columbia Capital Allocation Moderate Aggressive Portfolio |
| Class A | 1,000.00 | 1,000.00 | 1,030.50 | 1,022.87 | 2.58 | 2.57 | 0.50 | 5.98 | 5.96 | 1.16 |
| Class B | 1,000.00 | 1,000.00 | 1,027.00 | 1,019.06 | 6.44 | 6.41 | 1.25 | 9.84 | 9.80 | 1.91 |
| Class C | 1,000.00 | 1,000.00 | 1,026.50 | 1,019.06 | 6.44 | 6.41 | 1.25 | 9.84 | 9.80 | 1.91 |
| Class K | 1,000.00 | 1,000.00 | 1,030.30 | 1,022.97 | 2.48 | 2.47 | 0.48 | 5.88 | 5.86 | 1.14 |
| Class R | 1,000.00 | 1,000.00 | 1,029.30 | 1,021.60 | 3.87 | 3.85 | 0.75 | 7.27 | 7.24 | 1.41 |
| Class R4 | 1,000.00 | 1,000.00 | 1,032.40 | 1,024.14 | 1.29 | 1.29 | 0.25 | 4.70 | 4.68 | 0.91 |
| Class R5 | 1,000.00 | 1,000.00 | 1,032.10 | 1,024.55 | 0.88 | 0.87 | 0.17 | 4.29 | 4.27 | 0.83 |
Class V
(formerly Class T) | 1,000.00 | 1,000.00 | 1,030.50 | 1,022.87 | 2.58 | 2.57 | 0.50 | 5.98 | 5.96 | 1.16 |
| Class Y | 1,000.00 | 1,000.00 | 1,032.10 | 1,024.80 | 0.62 | 0.62 | 0.12 | 4.03 | 4.01 | 0.78 |
| Class Z | 1,000.00 | 1,000.00 | 1,031.90 | 1,024.14 | 1.29 | 1.29 | 0.25 | 4.70 | 4.68 | 0.91 |
| Columbia Capital Allocation Aggressive Portfolio |
| Class A | 1,000.00 | 1,000.00 | 1,038.70 | 1,022.87 | 2.59 | 2.57 | 0.50 | 6.32 | 6.27 | 1.22 |
| Class B | 1,000.00 | 1,000.00 | 1,034.50 | 1,019.06 | 6.46 | 6.41 | 1.25 | 10.18 | 10.11 | 1.97 |
| Class C | 1,000.00 | 1,000.00 | 1,034.30 | 1,019.06 | 6.46 | 6.41 | 1.25 | 10.18 | 10.11 | 1.97 |
| Class K | 1,000.00 | 1,000.00 | 1,039.20 | 1,023.17 | 2.28 | 2.26 | 0.44 | 6.01 | 5.96 | 1.16 |
| Class R | 1,000.00 | 1,000.00 | 1,036.70 | 1,021.55 | 3.93 | 3.90 | 0.76 | 7.66 | 7.60 | 1.48 |
| Class R4 | 1,000.00 | 1,000.00 | 1,040.00 | 1,024.09 | 1.35 | 1.34 | 0.26 | 5.08 | 5.04 | 0.98 |
| Class R5 | 1,000.00 | 1,000.00 | 1,039.80 | 1,024.50 | 0.93 | 0.93 | 0.18 | 4.66 | 4.63 | 0.90 |
| Class Y | 1,000.00 | 1,000.00 | 1,041.10 | 1,024.75 | 0.67 | 0.67 | 0.13 | 4.41 | 4.37 | 0.85 |
| Class Z | 1,000.00 | 1,000.00 | 1,040.30 | 1,024.14 | 1.30 | 1.29 | 0.25 | 5.03 | 4.99 | 0.97 |
Expenses paid during the period are equal to the annualized expense ratio for each class as indicated above, multiplied by the average account value over the period and then multiplied by the number of days in the Fund’s most recent fiscal half year and divided by 366.
Effective expenses paid during the period and the Fund’s effective annualized expense ratio include expenses borne directly to the class plus the Fund’s pro rata portion of the ongoing expenses charged by the underlying funds using the expense ratio of each class of the underlying funds as of the underlying fund’s most recent shareholder report.
Columbia Capital Allocation Moderate Aggressive Portfolio’s annualized expense ratio excludes the impact of an expense reimbursement from a third party due to overbilling.
| 16 | Columbia Capital Allocation Portfolios | Annual Report 2017 |
Portfolio of Investments
Columbia Capital Allocation Conservative Portfolio, January 31, 2017
(Percentages represent value of investments compared to net assets)
| Alternative Investment Funds 7.6% |
| | Shares | Value ($) |
| Columbia Absolute Return Currency and Income Fund, Class I Shares(a),(b) | 58,152 | 642,002 |
| Columbia Alternative Beta Fund, Class I Shares(a) | 458,101 | 4,173,302 |
| Columbia Commodity Strategy Fund, Class I Shares(a),(b) | 436,338 | 2,465,307 |
| Columbia Diversified Absolute Return Fund, Class I Shares(a),(b) | 482,091 | 4,570,225 |
| Columbia Multi-Asset Income Fund, Class I Shares(a) | 857,137 | 8,245,653 |
Total Alternative Investment Funds
(Cost $20,922,295) | 20,096,489 |
|
| Common Stocks 3.1% |
| Issuer | Shares | Value ($) |
| Consumer Discretionary 0.4% |
| Auto Components 0.1% |
| Bridgestone Corp. | 400 | 14,671 |
| Continental AG | 367 | 71,845 |
| Cooper Tire & Rubber Co. | 351 | 12,724 |
| Cooper-Standard Holding, Inc.(b) | 125 | 13,160 |
| Dana, Inc. | 364 | 7,331 |
| Drew Industries, Inc. | 208 | 22,828 |
| Superior Industries International, Inc. | 485 | 11,179 |
| Total | | 153,738 |
| Automobiles 0.1% |
| Fuji Heavy Industries Ltd. | 2,600 | 104,042 |
| Peugeot SA(b) | 4,744 | 88,288 |
| Suzuki Motor Corp. | 2,400 | 92,623 |
| Total | | 284,953 |
| Diversified Consumer Services —% |
| Capella Education Co. | 255 | 21,802 |
| Hotels, Restaurants & Leisure 0.1% |
| Bloomin’ Brands, Inc. | 525 | 8,983 |
| Cheesecake Factory, Inc. (The) | 374 | 22,537 |
| Compass Group PLC | 3,661 | 65,155 |
| Denny’s Corp.(b) | 170 | 2,069 |
| Isle of Capri Casinos, Inc.(b) | 488 | 11,619 |
| Papa John’s International, Inc. | 124 | 10,567 |
| Pinnacle Entertainment, Inc.(b) | 70 | 1,078 |
| Ruth’s Hospitality Group, Inc. | 977 | 16,756 |
| Total | | 138,764 |
| Common Stocks (continued) |
| Issuer | Shares | Value ($) |
| Household Durables 0.1% |
| Electrolux AB, Class B | 3,510 | 93,335 |
| La-Z-Boy, Inc. | 540 | 15,444 |
| Persimmon PLC | 598 | 14,565 |
| Sony Corp. | 1,200 | 36,333 |
| Total | | 159,677 |
| Media —% |
| Gannett Co., Inc. | 1,620 | 15,584 |
| New York Times Co. (The), Class A | 1,480 | 19,980 |
| WPP PLC | 775 | 18,038 |
| Total | | 53,602 |
| Multiline Retail —% |
| Big Lots, Inc. | 390 | 19,500 |
| Specialty Retail —% |
| Aaron’s, Inc.(b) | 380 | 11,757 |
| Big 5 Sporting Goods Corp. | 730 | 11,242 |
| Children’s Place, Inc. (The) | 228 | 22,116 |
| Francesca’s Holdings Corp.(b) | 1,030 | 17,964 |
| Genesco, Inc.(b) | 191 | 11,498 |
| Pier 1 Imports, Inc. | 1,993 | 14,489 |
| Total | | 89,066 |
| Textiles, Apparel & Luxury Goods —% |
| Movado Group, Inc. | 685 | 18,598 |
| Total Consumer Discretionary | 939,700 |
| Consumer Staples 0.3% |
| Beverages —% |
| Coca-Cola Amatil Ltd. | 3,247 | 24,013 |
| Food & Staples Retailing 0.1% |
| Jeronimo Martins SGPS SA | 4,562 | 77,215 |
| Koninklijke Ahold Delhaize NV(b) | 1,889 | 40,243 |
| Metro AG | 609 | 20,840 |
| SpartanNash Co. | 528 | 19,990 |
| SUPERVALU, Inc.(b) | 356 | 1,395 |
| Total | | 159,683 |
The accompanying Notes to Financial Statements are an integral part of this statement.
Columbia Capital Allocation Portfolios | Annual Report 2017
| 17 |
Portfolio of Investments (continued)
Columbia Capital Allocation Conservative Portfolio, January 31, 2017
| Common Stocks (continued) |
| Issuer | Shares | Value ($) |
| Food Products 0.1% |
| Dean Foods Co. | 1,117 | 22,184 |
| Fresh Del Monte Produce, Inc. | 68 | 3,893 |
| Marine Harvest ASA | 2,195 | 38,801 |
| Nestlé SA, Registered Shares(b) | 1,304 | 95,537 |
| Sanderson Farms, Inc. | 246 | 22,386 |
| WH Group Ltd. | 110,500 | 83,929 |
| Total | | 266,730 |
| Household Products —% |
| Reckitt Benckiser Group PLC | 1,247 | 107,000 |
| Personal Products —% |
| Usana Health Sciences, Inc.(b) | 115 | 7,164 |
| Tobacco 0.1% |
| Imperial Brands PLC | 1,053 | 48,783 |
| Swedish Match AB | 2,364 | 76,964 |
| Total | | 125,747 |
| Total Consumer Staples | 690,337 |
| Energy 0.1% |
| Energy Equipment & Services —% |
| Archrock, Inc. | 740 | 10,804 |
| Atwood Oceanics, Inc.(b) | 1,665 | 20,246 |
| Petrofac Ltd. | 2,079 | 24,073 |
| Seadrill Ltd.(b) | 5,650 | 10,566 |
| Total | | 65,689 |
| Oil, Gas & Consumable Fuels 0.1% |
| BP PLC | 1,837 | 10,972 |
| Caltex Australia Ltd. | 2,044 | 44,360 |
| Idemitsu Kosan Co., Ltd. | 2,900 | 89,672 |
| OMV AG | 2,299 | 80,461 |
| PDC Energy, Inc.(b) | 296 | 21,886 |
| Repsol SA | 1,334 | 19,772 |
| REX American Resources Corp.(b) | 232 | 19,263 |
| Royal Dutch Shell PLC, Class B | 297 | 8,389 |
| Western Refining, Inc. | 189 | 6,617 |
| Total | | 301,392 |
| Total Energy | 367,081 |
| Common Stocks (continued) |
| Issuer | Shares | Value ($) |
| Financials 0.6% |
| Banks 0.3% |
| Banc of California, Inc. | 1,316 | 20,793 |
| Banco Latinoamericano de Comercio Exterior SA, Class E | 540 | 14,688 |
| Bank Hapoalim BM | 9,151 | 55,228 |
| BNP Paribas SA | 1,481 | 94,742 |
| BOC Hong Kong Holdings Ltd. | 15,788 | 63,119 |
| Central Pacific Financial Corp. | 705 | 22,088 |
| Customers Bancorp, Inc.(b) | 564 | 19,435 |
| FCB Financial Holdings, Inc., Class A(b) | 432 | 20,282 |
| First BanCorp(b) | 845 | 5,678 |
| Fulton Financial Corp. | 195 | 3,549 |
| Hanmi Financial Corp. | 100 | 3,315 |
| Hilltop Holdings, Inc.(b) | 560 | 15,333 |
| HSBC Holdings PLC(b) | 20,360 | 173,690 |
| ING Groep NV | 597 | 8,577 |
| International Bancshares Corp. | 590 | 21,889 |
| Societe Generale SA | 2,427 | 118,650 |
| Westpac Banking Corp. | 4,472 | 107,657 |
| Wintrust Financial Corp. | 164 | 11,742 |
| Total | | 780,455 |
| Capital Markets —% |
| 3i Group PLC | 9,786 | 86,447 |
| Arlington Asset Investment Corp., Class A | 1,223 | 18,308 |
| KCG Holdings, Inc., Class A(b) | 1,322 | 18,468 |
| Piper Jaffray Companies(b) | 271 | 19,106 |
| Total | | 142,329 |
| Consumer Finance —% |
| Nelnet, Inc., Class A | 411 | 20,151 |
| Insurance 0.2% |
| Allianz SE, Registered Shares(b) | 732 | 124,414 |
| Ambac Financial Group, Inc.(b) | 475 | 9,937 |
| American Equity Investment Life Holding Co. | 186 | 4,389 |
| Assicurazioni Generali SpA | 4,572 | 72,956 |
| AXA SA | 2,108 | 51,809 |
| CNP Assurances | 1,213 | 22,796 |
| Dai-ichi Life Holdings, Inc. | 4,000 | 72,515 |
| Heritage Insurance Holdings, Inc. | 1,100 | 15,598 |
The accompanying Notes to Financial Statements are an integral part of this statement.
| 18 | Columbia Capital Allocation Portfolios | Annual Report 2017 |
Portfolio of Investments (continued)
Columbia Capital Allocation Conservative Portfolio, January 31, 2017
| Common Stocks (continued) |
| Issuer | Shares | Value ($) |
| Maiden Holdings Ltd. | 925 | 16,419 |
| NN Group NV | 3,062 | 108,443 |
| Swiss Re AG | 260 | 24,297 |
| Universal Insurance Holdings, Inc. | 818 | 21,391 |
| Total | | 544,964 |
| Mortgage Real Estate Investment Trusts (REITS) —% |
| CYS Investments, Inc. | 2,480 | 18,774 |
| Invesco Mortgage Capital, Inc. | 670 | 9,762 |
| Redwood Trust, Inc. | 340 | 5,270 |
| Total | | 33,806 |
| Thrifts & Mortgage Finance 0.1% |
| BofI Holding, Inc.(b) | 780 | 23,010 |
| Essent Group Ltd.(b) | 715 | 24,718 |
| Flagstar Bancorp, Inc.(b) | 694 | 17,884 |
| HomeStreet, Inc.(b) | 610 | 15,982 |
| Meta Financial Group, Inc. | 54 | 4,744 |
| MGIC Investment Corp.(b) | 2,499 | 26,614 |
| Radian Group, Inc.(b) | 1,475 | 27,140 |
| Walker & Dunlop, Inc.(b) | 685 | 21,516 |
| Washington Federal, Inc. | 750 | 24,638 |
| Total | | 186,246 |
| Total Financials | 1,707,951 |
| Health Care 0.4% |
| Biotechnology 0.1% |
| Alder Biopharmaceuticals, Inc.(b) | 280 | 5,754 |
| ARIAD Pharmaceuticals, Inc.(b) | 270 | 6,431 |
| Arrowhead Pharmaceuticals, Inc.(b) | 1,305 | 2,532 |
| bluebird bio, Inc.(b) | 115 | 8,568 |
| Coherus Biosciences, Inc.(b) | 165 | 4,604 |
| Dynavax Technologies Corp.(b) | 455 | 1,866 |
| Halozyme Therapeutics, Inc.(b) | 395 | 4,562 |
| Insys Therapeutics, Inc.(b) | 575 | 5,888 |
| Keryx Biopharmaceuticals, Inc.(b) | 1,775 | 8,857 |
| Kite Pharma, Inc.(b) | 105 | 5,352 |
| Ligand Pharmaceuticals, Inc.(b) | 145 | 15,371 |
| PTC Therapeutics, Inc.(b) | 330 | 4,323 |
| Puma Biotechnology, Inc.(b) | 210 | 6,804 |
| Ra Pharmaceuticals, Inc.(b) | 246 | 3,921 |
| Common Stocks (continued) |
| Issuer | Shares | Value ($) |
| Sage Therapeutics, Inc.(b) | 105 | 5,038 |
| Shire PLC(b) | 573 | 31,902 |
| Spark Therapeutics, Inc.(b) | 200 | 12,612 |
| TESARO, Inc.(b) | 60 | 9,770 |
| Total | | 144,155 |
| Health Care Equipment & Supplies 0.1% |
| Analogic Corp. | 84 | 6,523 |
| Angiodynamics, Inc.(b) | 915 | 14,727 |
| Halyard Health, Inc.(b) | 345 | 13,272 |
| Masimo Corp.(b) | 337 | 24,796 |
| Natus Medical, Inc.(b) | 95 | 3,710 |
| OraSure Technologies, Inc.(b) | 1,400 | 12,348 |
| Orthofix International NV(b) | 517 | 18,581 |
| Total | | 93,957 |
| Health Care Providers & Services —% |
| Chemed Corp. | 22 | 3,654 |
| Magellan Health, Inc.(b) | 266 | 19,937 |
| Molina Healthcare, Inc.(b) | 338 | 19,171 |
| Owens & Minor, Inc. | 450 | 16,146 |
| Triple-S Management Corp., Class B(b) | 677 | 12,937 |
| Total | | 71,845 |
| Life Sciences Tools & Services —% |
| INC Research Holdings, Inc. Class A(b) | 416 | 22,048 |
| Pra Health Sciences, Inc.(b) | 367 | 21,503 |
| Total | | 43,551 |
| Pharmaceuticals 0.2% |
| Aerie Pharmaceuticals, Inc.(b) | 305 | 13,390 |
| Astellas Pharma, Inc. | 5,400 | 72,478 |
| Bayer AG, Registered Shares | 741 | 82,310 |
| GlaxoSmithKline PLC | 6,444 | 124,530 |
| Jounce Therapeutics, Inc.(b) | 318 | 5,272 |
| Novo Nordisk A/S, Class B | 291 | 10,451 |
| Roche Holding AG, Genusschein Shares(b) | 560 | 132,691 |
| Sanofi | 1,423 | 114,376 |
| Supernus Pharmaceuticals, Inc.(b) | 585 | 15,824 |
| Teva Pharmaceutical Industries Ltd., ADR | 994 | 33,229 |
| Total | | 604,551 |
| Total Health Care | 958,059 |
The accompanying Notes to Financial Statements are an integral part of this statement.
Columbia Capital Allocation Portfolios | Annual Report 2017
| 19 |
Portfolio of Investments (continued)
Columbia Capital Allocation Conservative Portfolio, January 31, 2017
| Common Stocks (continued) |
| Issuer | Shares | Value ($) |
| Industrials 0.5% |
| Aerospace & Defense —% |
| Curtiss-Wright Corp. | 250 | 24,515 |
| Air Freight & Logistics —% |
| Forward Air Corp. | 30 | 1,446 |
| Royal Mail PLC | 4,124 | 21,417 |
| Total | | 22,863 |
| Airlines 0.1% |
| Deutsche Lufthansa AG, Registered Shares | 1,825 | 24,380 |
| Hawaiian Holdings, Inc.(b) | 440 | 22,418 |
| Japan Airlines Co., Ltd. | 2,400 | 76,424 |
| Qantas Airways Ltd. | 20,786 | 53,728 |
| Total | | 176,950 |
| Building Products —% |
| Continental Building Product(b) | 790 | 18,368 |
| Gibraltar Industries, Inc.(b) | 495 | 21,730 |
| NCI Building Systems, Inc.(b) | 370 | 5,920 |
| Universal Forest Products, Inc. | 206 | 20,952 |
| Total | | 66,970 |
| Commercial Services & Supplies —% |
| ACCO Brands Corp.(b) | 930 | 11,857 |
| Brady Corp., Class A | 465 | 16,903 |
| Knoll, Inc. | 150 | 3,917 |
| Quad/Graphics, Inc. | 732 | 19,171 |
| Total | | 51,848 |
| Construction & Engineering 0.1% |
| ACS Actividades de Construccion y Servicios SA | 2,890 | 89,071 |
| Argan, Inc. | 274 | 20,207 |
| Obayashi Corp. | 3,200 | 30,484 |
| Skanska AB, Class B | 3,854 | 94,231 |
| Taisei Corp. | 12,000 | 85,243 |
| Total | | 319,236 |
| Electrical Equipment 0.1% |
| ABB Ltd.(b) | 4,577 | 109,074 |
| EnerSys | 323 | 25,178 |
| Generac Holdings, Inc.(b) | 305 | 12,279 |
| Total | | 146,531 |
| Common Stocks (continued) |
| Issuer | Shares | Value ($) |
| Machinery 0.1% |
| Astec Industries, Inc. | 90 | 6,298 |
| Energy Recovery, Inc.(b) | 1,740 | 17,818 |
| Global Brass & Copper Holdings, Inc.(b) | 550 | 18,233 |
| Greenbrier Companies, Inc. (The) | 501 | 21,919 |
| KONE OYJ, Class B | 540 | 24,414 |
| Mueller Industries, Inc. | 220 | 8,857 |
| NSK Ltd. | 3,600 | 43,701 |
| Wabash National Corp.(b) | 1,330 | 23,474 |
| Total | | 164,714 |
| Professional Services —% |
| Huron Consulting Group, Inc.(b) | 415 | 18,799 |
| RPX Corp.(b) | 1,710 | 18,571 |
| Total | | 37,370 |
| Road & Rail —% |
| ArcBest Corp. | 627 | 19,813 |
| Trading Companies & Distributors 0.1% |
| Applied Industrial Technologies, Inc. | 394 | 23,817 |
| ITOCHU Corp. | 7,000 | 96,431 |
| Sumitomo Corp. | 4,800 | 60,172 |
| Total | | 180,420 |
| Total Industrials | 1,211,230 |
| Information Technology 0.3% |
| Electronic Equipment, Instruments & Components 0.1% |
| Benchmark Electronics, Inc.(b) | 790 | 24,174 |
| Hitachi High-Technologies Corp. | 200 | 8,567 |
| Methode Electronics, Inc. | 330 | 13,877 |
| Rogers Corp.(b) | 255 | 20,387 |
| Sanmina Corp.(b) | 695 | 27,070 |
| Scansource, Inc.(b) | 355 | 14,040 |
| TTM Technologies, Inc.(b) | 1,370 | 20,317 |
| Vishay Intertechnology, Inc. | 1,260 | 20,916 |
| Total | | 149,348 |
| Internet Software & Services 0.1% |
| Bankrate, Inc.(b) | 330 | 3,597 |
| EarthLink Holdings Corp. | 2,755 | 17,659 |
| j2 Global, Inc.(b) | 318 | 26,652 |
| Mixi, Inc. | 2,400 | 104,127 |
The accompanying Notes to Financial Statements are an integral part of this statement.
| 20 | Columbia Capital Allocation Portfolios | Annual Report 2017 |
Portfolio of Investments (continued)
Columbia Capital Allocation Conservative Portfolio, January 31, 2017
| Common Stocks (continued) |
| Issuer | Shares | Value ($) |
| RetailMeNot, Inc.(b) | 1,658 | 15,005 |
| Shutterstock, Inc.(b) | 88 | 4,734 |
| Total | | 171,774 |
| IT Services —% |
| Cardtronics PLC, Class A(b) | 445 | 24,288 |
| Convergys Corp. | 600 | 14,892 |
| CSG Systems International, Inc. | 292 | 14,133 |
| EVERTEC, Inc. | 1,090 | 18,584 |
| Fujitsu Ltd. | 6,000 | 34,872 |
| Science Applications International Corp. | 62 | 5,048 |
| Sykes Enterprises, Inc.(b) | 141 | 3,938 |
| Travelport Worldwide Ltd. | 430 | 6,175 |
| Unisys Corp.(b) | 740 | 9,509 |
| Total | | 131,439 |
| Semiconductors & Semiconductor Equipment —% |
| Amkor Technology, Inc.(b) | 1,819 | 17,117 |
| Diodes, Inc.(b) | 184 | 4,580 |
| Entegris, Inc.(b) | 1,145 | 21,469 |
| Semtech Corp.(b) | 660 | 21,747 |
| Synaptics, Inc.(b) | 370 | 20,860 |
| Xcerra Corp.(b) | 1,418 | 10,748 |
| Total | | 96,521 |
| Software 0.1% |
| Aspen Technology, Inc.(b) | 409 | 21,722 |
| Barracuda Networks, Inc.(b) | 285 | 6,695 |
| CommVault Systems, Inc.(b) | 375 | 18,412 |
| Mentor Graphics Corp. | 195 | 7,197 |
| Oracle Corp. Japan | 1,600 | 89,649 |
| Progress Software Corp.(b) | 275 | 7,706 |
| Qualys, Inc.(b) | 275 | 9,873 |
| VASCO Data Security International, Inc.(b) | 355 | 5,396 |
| Total | | 166,650 |
| Technology Hardware, Storage & Peripherals —% |
| Seiko Epson Corp. | 3,700 | 76,224 |
| Total Information Technology | 791,956 |
| Common Stocks (continued) |
| Issuer | Shares | Value ($) |
| Materials 0.2% |
| Chemicals 0.1% |
| Ferro Corp.(b) | 1,260 | 17,816 |
| Hitachi Chemical Co., Ltd. | 300 | 8,517 |
| Innospec, Inc. | 345 | 24,616 |
| Johnson Matthey PLC(b) | 102 | 4,184 |
| Mitsubishi Chemical Holdings Corp. | 13,200 | 92,069 |
| Rayonier Advanced Materials, Inc. | 1,410 | 19,134 |
| Trinseo SA | 370 | 23,958 |
| Total | | 190,294 |
| Construction Materials —% |
| Fletcher Building Ltd. | 5,296 | 40,803 |
| Containers & Packaging —% |
| Greif, Inc., Class A | 344 | 19,808 |
| Metals & Mining 0.1% |
| Fortescue Metals Group Ltd. | 20,126 | 101,843 |
| Materion Corp. | 188 | 7,388 |
| Rio Tinto PLC | 3,043 | 134,814 |
| Schnitzer Steel Industries, Inc., Class A | 750 | 17,738 |
| Total | | 261,783 |
| Paper & Forest Products —% |
| UPM-Kymmene OYJ | 4,358 | 98,839 |
| Total Materials | 611,527 |
| Real Estate 0.1% |
| Equity Real Estate Investment Trusts (REITS) 0.1% |
| Ashford Hospitality Prime, Inc. | 270 | 3,629 |
| CBL & Associates Properties, Inc. | 1,840 | 19,964 |
| CorEnergy Infrastructure Trust, Inc. | 337 | 12,098 |
| DuPont Fabros Technology, Inc. | 169 | 8,024 |
| Government Properties Income Trust | 210 | 4,045 |
| LaSalle Hotel Properties | 365 | 11,012 |
| Lexington Realty Trust | 2,050 | 21,976 |
| PS Business Parks, Inc. | 186 | 20,839 |
| Ramco-Gershenson Properties Trust | 210 | 3,415 |
| RLJ Lodging Trust | 305 | 7,079 |
| Ryman Hospitality Properties, Inc. | 324 | 19,822 |
| Sabra Health Care REIT, Inc. | 110 | 2,794 |
| Select Income REIT | 745 | 18,632 |
The accompanying Notes to Financial Statements are an integral part of this statement.
Columbia Capital Allocation Portfolios | Annual Report 2017
| 21 |
Portfolio of Investments (continued)
Columbia Capital Allocation Conservative Portfolio, January 31, 2017
| Common Stocks (continued) |
| Issuer | Shares | Value ($) |
| STAG Industrial, Inc. | 210 | 4,859 |
| Summit Hotel Properties, Inc. | 1,440 | 22,795 |
| Washington Prime Group, Inc. | 2,050 | 19,783 |
| Xenia Hotels & Resorts, Inc. | 165 | 3,028 |
| Total | | 203,794 |
| Real Estate Management & Development —% |
| Cheung Kong Property Holding Ltd.(b) | 8,349 | 54,877 |
| Daiwa House Industry Co., Ltd. | 1,600 | 43,332 |
| Wheelock & Co., Ltd. | 16,070 | 97,672 |
| Total | | 195,881 |
| Total Real Estate | 399,675 |
| Telecommunication Services 0.1% |
| Diversified Telecommunication Services 0.1% |
| General Communication, Inc., Class A(b) | 880 | 17,706 |
| Nippon Telegraph & Telephone Corp. | 2,300 | 101,596 |
| Telefonica SA | 3,388 | 32,779 |
| Telenor ASA | 3,501 | 55,435 |
| Telstra Corp., Ltd. | 4,728 | 17,938 |
| Windstream Holdings, Inc. | 1,420 | 11,474 |
| Total | | 236,928 |
| Wireless Telecommunication Services —% |
| NTT DoCoMo, Inc. | 2,100 | 50,211 |
| Total Telecommunication Services | 287,139 |
| Utilities 0.1% |
| Electric Utilities 0.1% |
| Endesa SA | 3,761 | 77,561 |
| Enel SpA(b) | 16,477 | 68,884 |
| IDACORP, Inc. | 7 | 560 |
| Portland General Electric Co. | 14 | 611 |
| Total | | 147,616 |
| Gas Utilities —% |
| Chesapeake Utilities Corp. | 247 | 16,154 |
| Northwest Natural Gas Co. | 210 | 12,369 |
| Southwest Gas Corp. | 308 | 24,815 |
| Total | | 53,338 |
| Independent Power and Renewable Electricity Producers —% |
| Ormat Technologies, Inc. | 300 | 16,110 |
| Common Stocks (continued) |
| Issuer | Shares | Value ($) |
| Multi-Utilities —% |
| E.ON SE | 6,729 | 51,834 |
| Water Utilities —% |
| SJW Corp. | 394 | 19,740 |
| Total Utilities | 288,638 |
Total Common Stocks
(Cost $7,499,841) | 8,253,293 |
|
| Equity Funds 18.4% |
| | Shares | Value ($) |
| International 3.8% |
| Columbia Emerging Markets Fund, Class I Shares(a),(b) | 355,075 | 3,579,154 |
| Columbia European Equity Fund, Class I Shares(a) | 236,309 | 1,436,762 |
| Columbia Overseas Value Fund, Class I Shares(a) | 584,161 | 4,947,841 |
| Total | 9,963,757 |
| U.S. Large Cap 14.5% |
| Columbia Contrarian Core Fund, Class I Shares(a) | 181,515 | 4,156,689 |
| Columbia Disciplined Core Fund, Class I Shares(a) | 1,061,097 | 11,024,799 |
| Columbia Disciplined Growth Fund, Class I Shares(a) | 888,892 | 7,608,918 |
| Columbia Disciplined Value Fund, Class I Shares(a) | 810,791 | 7,937,648 |
| Columbia Select Large Cap Equity Fund, Class I Shares(a) | 599,736 | 7,526,682 |
| Total | 38,254,736 |
| U.S. Small Cap 0.1% |
| Columbia Disciplined Small Core Fund, Class I Shares(a) | 21,571 | 206,001 |
Total Equity Funds
(Cost $45,486,744) | 48,424,494 |
|
| Fixed-Income Funds 60.3% |
| | |
| Emerging Markets 1.5% |
| Columbia Emerging Markets Bond Fund, Class I Shares(a) | 336,531 | 3,816,259 |
| High Yield 2.1% |
| Columbia Income Opportunities Fund, Class I Shares(a) | 566,540 | 5,586,089 |
| Inflation Protected Securities 3.9% |
| Columbia Inflation Protected Securities Fund, Class I Shares(a),(b) | 1,097,800 | 10,363,232 |
| Investment Grade 52.8% |
| Columbia Corporate Income Fund, Class I Shares(a) | 3,326,072 | 33,327,234 |
| Columbia Limited Duration Credit Fund, Class I Shares(a) | 1,325,664 | 13,018,022 |
The accompanying Notes to Financial Statements are an integral part of this statement.
| 22 | Columbia Capital Allocation Portfolios | Annual Report 2017 |
Portfolio of Investments (continued)
Columbia Capital Allocation Conservative Portfolio, January 31, 2017
| Fixed-Income Funds (continued) |
| | Shares | Value ($) |
| Columbia Mortgage Opportunities Fund, Class I Shares(a) | 378,711 | 3,730,305 |
| Columbia Total Return Bond Fund, Class I Shares(a) | 1,865,478 | 16,751,995 |
| Columbia U.S. Government Mortgage Fund, Class I Shares(a) | 7,437,116 | 40,086,055 |
| Columbia U.S. Treasury Index Fund, Class I Shares(a) | 2,950,514 | 32,396,641 |
| Total | 139,310,252 |
Total Fixed-Income Funds
(Cost $163,567,016) | 159,075,832 |
| Preferred Stocks —% |
| Issuer | Coupon
Rate | Shares | Value ($) |
| Consumer Discretionary —% |
| Auto Components —% |
| Schaeffler AG | — | 5,660 | 91,782 |
| Total Consumer Discretionary | 91,782 |
Total Preferred Stocks
(Cost $81,322) | 91,782 |
| Money Market Funds 10.7% |
| | Shares | Value ($) |
| Columbia Short-Term Cash Fund, 0.662%(a),(c) | 28,203,510 | 28,203,510 |
Total Money Market Funds
(Cost $28,203,523) | 28,203,510 |
Total Investments
(Cost: $265,760,741) | 264,145,400 |
| Other Assets & Liabilities, Net | | (180,717) |
| Net Assets | 263,964,683 |
At January 31, 2017, securities and/or cash totaling $702,360 were pledged as collateral.
Investments in derivatives
| Forward foreign currency exchange contracts open at January 31, 2017 |
| Counterparty | Exchange
date | Currency to
be delivered | Currency to
be received | Unrealized
appreciation ($) | Unrealized
depreciation ($) |
| Barclays | 02/22/2017 | 42,000 EUR | 44,703 USD | — | (667) |
| Barclays | 02/22/2017 | 192,000 ILS | 50,213 USD | — | (744) |
| Barclays | 02/22/2017 | 10,820,000 JPY | 94,488 USD | — | (1,388) |
| Barclays | 02/22/2017 | 285,000 NOK | 33,576 USD | — | (982) |
| Barclays | 02/22/2017 | 23,000 NZD | 16,361 USD | — | (505) |
| Barclays | 02/22/2017 | 851,000 SEK | 95,225 USD | — | (2,143) |
| Barclays | 02/22/2017 | 78,017 USD | 104,000 AUD | 822 | — |
| Barclays | 02/22/2017 | 128,302 USD | 129,000 CHF | 2,181 | — |
| Barclays | 02/22/2017 | 83,925 USD | 586,000 DKK | 1,206 | — |
| Barclays | 02/22/2017 | 161,974 USD | 132,000 GBP | 4,136 | — |
| Barclays | 02/22/2017 | 72,818 USD | 104,000 SGD | 987 | — |
| Total | | | | 9,332 | (6,429) |
Futures contracts outstanding at January 31, 2017
| Long futures contracts outstanding |
| Contract description | Number of
contracts | Trading
currency | Notional market
value ($) | Expiration date | Unrealized
appreciation ($) | Unrealized
depreciation ($) |
| Mini MSCI Emerging Markets Index | 34 | USD | 1,555,670 | 03/2017 | 61,794 | — |
| S&P 500 E-mini | 28 | USD | 3,184,300 | 03/2017 | 27,791 | — |
| TOPIX Index | 14 | JPY | 1,880,967 | 03/2017 | — | (31,248) |
The accompanying Notes to Financial Statements are an integral part of this statement.
Columbia Capital Allocation Portfolios | Annual Report 2017
| 23 |
Portfolio of Investments (continued)
Columbia Capital Allocation Conservative Portfolio, January 31, 2017
| Long futures contracts outstanding (continued) |
| Contract description | Number of
contracts | Trading
currency | Notional market
value ($) | Expiration date | Unrealized
appreciation ($) | Unrealized
depreciation ($) |
| U.S. Long Bond | 23 | USD | 3,469,406 | 03/2017 | — | (22,833) |
| U.S. Ultra Bond | 4 | USD | 642,750 | 03/2017 | — | (5,258) |
| Total | | | 10,733,093 | | 89,585 | (59,339) |
| Short futures contracts outstanding |
| Contract description | Number of
contracts | Trading
currency | Notional market
value ($) | Expiration date | Unrealized
appreciation ($) | Unrealized
depreciation ($) |
| EURO STOXX 50 | (45) | EUR | (1,570,996) | 03/2017 | — | (21,556) |
| FTSE 100 Index | (17) | GBP | (1,506,750) | 03/2017 | — | (47,107) |
| Total | | | (3,077,746) | | — | (68,663) |
Cleared credit default swap contracts outstanding at January 31, 2017
| Buy protection |
| Counterparty | Reference
entity | Expiration
date | Pay fixed
rate (%) | Notional
currency | Notional
amount ($) | Unrealized
appreciation ($) | Unrealized
depreciation ($) |
| Morgan Stanley | Markit CDX North America High Yield Index, Series 26 | 06/20/2021 | 5.000 | USD | 1,370,000 | — | (70,075) |
| Morgan Stanley | Markit CDX North America Investment Grade Index, Series 27 | 12/20/2021 | 1.000 | USD | 6,000,000 | — | (19,502) |
| Total | | | | | | — | (89,577) |
Credit default swap contracts outstanding at January 31, 2017
| Sell protection |
| Counterparty | Reference
entity | Expiration
date | Receive
fixed
rate
(%) | Implied
credit
spread
(%) | Notional
currency | Notional
amount
($) | Market
value
($) | Periodic
payments
receivable
(payable)
($) | Premium
paid
($) | Premium
received
($) | Unrealized
appreciation
($) | Unrealized
depreciation
($) |
| Barclays | Markit CDX Emerging Markets Index, Series 26 | 12/20/21 | 1.000 | 2.372 | USD | (564,103) | (34,300) | 674 | — | (36,301) | 2,675 | — |
| Barclays | Markit CDX Emerging Markets Index, Series 26 | 12/20/21 | 1.000 | 2.372 | USD | (1,128,205) | (68,601) | 1,348 | — | (73,149) | 5,896 | — |
| Barclays | Markit CDX Emerging Markets Index, Series 26 | 12/20/21 | 1.000 | 2.372 | USD | (1,057,692) | (64,311) | 1,263 | — | (68,987) | 5,939 | — |
| Total | | | | | | | | | — | (178,437) | 14,510 | — |
Notes to Portfolio of Investments
| (a) | As defined in the Investment Company Act of 1940, an affiliated company is one in which the Fund owns 5% or more of the company’s outstanding voting securities, or a company which is under common ownership or control with the Fund. Holdings and transactions in these affiliated companies during the year ended January 31, 2017 are as follows: |
| Issuer | Beginning
shares | Shares
purchased | Shares
sold | Ending
shares | Capital gain
distributions ($) | Realized gain
(loss) ($) | Dividends —
affiliated
issuers ($) | Value ($) |
| Columbia Absolute Return Currency and Income Fund, Class I Shares | 41,552 | 31,766 | (15,166) | 58,152 | 18,178 | 14,142 | — | 642,002 |
| Columbia Alternative Beta Fund, Class I Shares | 455,212 | 2,889 | — | 458,101 | — | — | 26,120 | 4,173,302 |
| Columbia Commodity Strategy Fund, Class I Shares | — | 537,022 | (100,684) | 436,338 | — | (17,943) | — | 2,465,307 |
| Columbia Contrarian Core Fund, Class I Shares | 221,163 | 18,310 | (57,958) | 181,515 | 31,785 | 390,220 | 44,371 | 4,156,689 |
The accompanying Notes to Financial Statements are an integral part of this statement.
| 24 | Columbia Capital Allocation Portfolios | Annual Report 2017 |
Portfolio of Investments (continued)
Columbia Capital Allocation Conservative Portfolio, January 31, 2017
Notes to Portfolio of Investments (continued)
| Issuer | Beginning
shares | Shares
purchased | Shares
sold | Ending
shares | Capital gain
distributions ($) | Realized gain
(loss) ($) | Dividends —
affiliated
issuers ($) | Value ($) |
| Columbia Corporate Income Fund, Class I Shares | 6,041,292 | 309,331 | (3,024,551) | 3,326,072 | — | (733,550) | 1,431,634 | 33,327,234 |
| Columbia Disciplined Core Fund, Class I Shares | 831,078 | 444,167 | (214,148) | 1,061,097 | — | 846,281 | 116,391 | 11,024,799 |
| Columbia Disciplined Growth Fund, Class I Shares | 1,042,013 | 128,842 | (281,963) | 888,892 | 386,757 | 125,099 | 67,602 | 7,608,918 |
| Columbia Disciplined Small Core Fund, Class I Shares | 131,196 | 26,496 | (136,121) | 21,571 | 83,006 | (597,721) | 1,444 | 206,001 |
| Columbia Disciplined Value Fund, Class I Shares | 1,001,517 | 85,834 | (276,560) | 810,791 | — | 187,080 | 153,295 | 7,937,648 |
| Columbia Diversified Absolute Return Fund, Class I Shares | 650,038 | 92,636 | (260,583) | 482,091 | — | (119,393) | — | 4,570,225 |
| Columbia Emerging Markets Bond Fund, Class I Shares | 379,657 | 38,444 | (81,570) | 336,531 | — | (17,031) | 128,615 | 3,816,259 |
| Columbia Emerging Markets Fund, Class I Shares | — | 355,075 | — | 355,075 | — | — | — | 3,579,154 |
| Columbia European Equity Fund, Class I Shares | 294,010 | 101,104 | (158,805) | 236,309 | — | (114,470) | 42,268 | 1,436,762 |
| Columbia Income Opportunities Fund, Class I Shares | 988,644 | 75,889 | (497,993) | 566,540 | — | (111,186) | 382,723 | 5,586,089 |
| Columbia Inflation Protected Securities Fund, Class I Shares | 1,288,534 | 45,371 | (236,105) | 1,097,800 | — | (200,754) | — | 10,363,232 |
| Columbia Limited Duration Credit Fund, Class I Shares | 2,716,155 | 98,583 | (1,489,074) | 1,325,664 | — | (586,217) | 359,718 | 13,018,022 |
| Columbia Mortgage Opportunities Fund, Class I Shares | 416,313 | 40,243 | (77,845) | 378,711 | 50,747 | (13,515) | 153,210 | 3,730,305 |
| Columbia Multi-Asset Income Fund, Class I Shares | 645,283 | 211,854 | — | 857,137 | — | — | 381,491 | 8,245,653 |
| Columbia Overseas Value Fund, Class I Shares | 739,593 | 92,634 | (248,066) | 584,161 | — | (138,481) | 114,007 | 4,947,841 |
| Columbia Select Large Cap Equity Fund, Class I Shares | 274,589 | 325,147 | — | 599,736 | 34,294 | — | 43,949 | 7,526,682 |
| Columbia Short-Term Cash Fund, 0.662% | 13,376,044 | 35,899,816 | (21,072,350) | 28,203,510 | — | 18 | 119,124 | 28,203,510 |
| Columbia Total Return Bond Fund, Class I Shares | — | 1,865,478 | — | 1,865,478 | 258,207 | — | 376,016 | 16,751,995 |
| Columbia U.S. Government Mortgage Fund, Class I Shares | 8,540,787 | 726,420 | (1,830,091) | 7,437,116 | 195,044 | (63,001) | 1,057,662 | 40,086,055 |
| Columbia U.S. Treasury Index Fund, Class I Shares | 3,036,748 | 307,777 | (394,011) | 2,950,514 | 96,680 | (193,694) | 471,380 | 32,396,641 |
| Total | 43,111,418 | 41,861,128 | (30,453,644) | 54,518,902 | 1,154,698 | (1,344,116) | 5,471,020 | 255,800,325 |
| (b) | Non-income producing investment. |
| (c) | The rate shown is the seven-day current annualized yield at January 31, 2017. |
Abbreviation Legend
| ADR | American Depositary Receipt |
The accompanying Notes to Financial Statements are an integral part of this statement.
Columbia Capital Allocation Portfolios | Annual Report 2017
| 25 |
Portfolio of Investments (continued)
Columbia Capital Allocation Conservative Portfolio, January 31, 2017
Currency Legend
| AUD | Australian Dollar |
| CHF | Swiss Franc |
| DKK | Danish Krone |
| EUR | Euro |
| GBP | British Pound |
| ILS | New Israeli Sheqel |
| JPY | Japanese Yen |
| NOK | Norwegian Krone |
| NZD | New Zealand Dollar |
| SEK | Swedish Krona |
| SGD | Singapore Dollar |
| USD | US Dollar |
Fair value measurements
The Fund categorizes its fair value measurements according to a three-level hierarchy that maximizes the use of observable inputs and minimizes the use of unobservable inputs by prioritizing that the most observable input be used when available. Observable inputs are those that market participants would use in pricing an investment based on market data obtained from sources independent of the reporting entity. Unobservable inputs are those that reflect the Fund’s assumptions about the information market participants would use in pricing an investment. An investment’s level within the fair value hierarchy is based on the lowest level of any input that is deemed significant to the asset’s or liability’s fair value measurement. The input levels are not necessarily an indication of the risk or liquidity associated with investments at that level. For example, certain U.S. government securities are generally high quality and liquid, however, they are reflected as Level 2 because the inputs used to determine fair value may not always be quoted prices in an active market.
Fair value inputs are summarized in the three broad levels listed below:
| • | Level 1 - Valuations based on quoted prices for investments in active markets that the Fund has the ability to access at the measurement date (including NAV for open-end mutual funds). Valuation adjustments are not applied to Level 1 investments. |
| • | Level 2 – Valuations based on other significant observable inputs (including quoted prices for similar securities, interest rates, prepayment speeds, credit risks, etc.). |
| • | Level 3 – Valuations based on significant unobservable inputs (including the Fund’s own assumptions and judgment in determining the fair value of investments). |
Inputs that are used in determining fair value of an investment may include price information, credit data, volatility statistics, and other factors. These inputs can be either observable or unobservable. The availability of observable inputs can vary between investments, and is affected by various factors such as the type of investment, and the volume and level of activity for that investment or similar investments in the marketplace. The inputs will be considered by the Investment Manager, along with any other relevant factors in the calculation of an investment’s fair value. The Fund uses prices and inputs that are current as of the measurement date, which may include periods of market dislocations. During these periods, the availability of prices and inputs may be reduced for many investments. This condition could cause an investment to be reclassified between the various levels within the hierarchy.
Foreign equity securities actively traded in markets where there is a significant delay in the local close relative to the New York Stock Exchange (NYSE) are classified as Level 2. The values of these securities may include an adjustment to reflect the impact of significant market movements following the close of local trading, as described in Note 2 to the financial statements - Security Valuation.
Certain investments that have been measured at fair value using the net asset value (NAV) per share (or its equivalent) are not categorized in the fair value hierarchy. The fair value amounts presented in the table are intended to reconcile the fair value hierarchy to the amounts presented in the Portfolio of Investments. The Columbia Short-Term Cash Fund seeks to provide shareholders with maximum current income consistent with liquidity and stability of principal. Columbia Short-Term Cash Fund prices its shares with a floating NAV and no longer seeks to maintain a stable NAV.
Investments falling into the Level 3 category are primarily supported by quoted prices from brokers and dealers participating in the market for those investments. However, these may be classified as Level 3 investments due to lack of market transparency and corroboration to support these quoted prices. Additionally, valuation models may be used as the pricing source for any remaining investments classified as Level 3. These models may rely on one or more significant unobservable inputs and/or significant assumptions by the Investment Manager. Inputs used in valuations may include, but are not limited to, financial statement analysis, capital account balances, discount rates and estimated cash flows, and comparable company data.
Under the direction of the Fund’s Board of Trustees (the Board), the Investment Manager’s Valuation Committee (the Committee) is responsible for overseeing the valuation procedures approved by the Board. The Committee consists of voting and non-voting members from various groups within the Investment Manager’s organization, including operations and accounting, trading and investments, compliance, risk management and legal.
The Committee meets at least monthly to review and approve valuation matters, which may include a description of specific valuation determinations, data regarding pricing information received from approved pricing vendors and brokers and the results of Board-approved valuation control policies and procedures (the Policies). The Policies address, among other things, instances when market quotations are or are not readily available, including recommendations of third party pricing vendors and a determination of appropriate pricing methodologies; events that require specific valuation determinations and assessment of fair value techniques; securities with a potential for stale pricing, including those that are illiquid, restricted, or in default; and the effectiveness of third party pricing vendors, including periodic reviews of vendors. The Committee meets more frequently, as needed, to discuss additional valuation matters, which may include the need to review back-testing results, review time-sensitive information or approve related valuation actions. The Committee reports to the Board, with members of the Committee meeting with the Board at each of its regularly scheduled meetings to discuss valuation matters and actions during the period, similar to those described earlier.
The accompanying Notes to Financial Statements are an integral part of this statement.
| 26 | Columbia Capital Allocation Portfolios | Annual Report 2017 |
Portfolio of Investments (continued)
Columbia Capital Allocation Conservative Portfolio, January 31, 2017
Fair value measurements (continued)
For investments categorized as Level 3, the Committee monitors information similar to that described above, which may include: (i) data specific to the issuer or comparable issuers, (ii) general market or specific sector news and (iii) quoted prices and specific or similar security transactions. The Committee considers this data and any changes from prior periods in order to assess the reasonableness of observable and unobservable inputs, any assumptions or internal models used to value those securities and changes in fair value. This data is also used to corroborate, when available, information received from approved pricing vendors and brokers. Various factors impact the frequency of monitoring this information (which may occur as often as daily). However, the Committee may determine that changes to inputs, assumptions and models are not required as a result of the monitoring procedures performed.
The following table is a summary of the inputs used to value the Fund’s investments at January 31, 2017:
| | Level 1
quoted prices
in active
markets for
identical
assets ($) | Level 2
other
significant
observable
inputs ($) | Level 3
significant
unobservable
inputs ($) | Investments
measured at
net asset
value ($) | Total ($) |
| Investments | | | | | |
| Alternative Investment Funds | 20,096,489 | — | — | — | 20,096,489 |
| Common Stocks | | | | | |
| Consumer Discretionary | 340,805 | 598,895 | — | — | 939,700 |
| Consumer Staples | 77,012 | 613,325 | — | — | 690,337 |
| Energy | 89,382 | 277,699 | — | — | 367,081 |
| Financials | 522,611 | 1,185,340 | — | — | 1,707,951 |
| Health Care | 389,321 | 568,738 | — | — | 958,059 |
| Industrials | 402,460 | 808,770 | — | — | 1,211,230 |
| Information Technology | 478,517 | 313,439 | — | — | 791,956 |
| Materials | 130,458 | 481,069 | — | — | 611,527 |
| Real Estate | 203,794 | 195,881 | — | — | 399,675 |
| Telecommunication Services | 29,180 | 257,959 | — | — | 287,139 |
| Utilities | 90,359 | 198,279 | — | — | 288,638 |
| Total Common Stocks | 2,753,899 | 5,499,394 | — | — | 8,253,293 |
| Equity Funds | 48,424,494 | — | — | — | 48,424,494 |
| Fixed-Income Funds | 159,075,832 | — | — | — | 159,075,832 |
| Preferred Stocks | | | | | |
| Consumer Discretionary | — | 91,782 | — | — | 91,782 |
| Money Market Funds | — | — | — | 28,203,510 | 28,203,510 |
| Total Investments | 230,350,714 | 5,591,176 | — | 28,203,510 | 264,145,400 |
| Derivatives | | | | | |
| Asset | | | | | |
| Forward Foreign Currency Exchange Contracts | — | 9,332 | — | — | 9,332 |
| Futures Contracts | 89,585 | — | — | — | 89,585 |
| Swap Contracts | — | 14,510 | — | — | 14,510 |
| Liability | | | | | |
| Forward Foreign Currency Exchange Contracts | — | (6,429) | — | — | (6,429) |
| Futures Contracts | (128,002) | — | — | — | (128,002) |
| Swap Contracts | — | (89,577) | — | — | (89,577) |
| Total | 230,312,297 | 5,519,012 | — | 28,203,510 | 264,034,819 |
See the Portfolio of Investments for all investment classifications not indicated in the table.
The Fund’s assets assigned to the Level 2 input category are generally valued using the market approach, in which a security’s value is determined through reference to prices and information from market transactions for similar or identical assets. These assets include certain foreign securities for which a third party statistical pricing service may be employed for purposes of fair market valuation. The model utilized by such third party statistical pricing service takes into account a security’s correlation to available market data including, but not limited to, intraday index, ADR, and exchange-traded fund movements.
Derivative instruments are valued at unrealized appreciation (depreciation).
There were no transfers of financial assets between levels during the period.
The accompanying Notes to Financial Statements are an integral part of this statement.
Columbia Capital Allocation Portfolios | Annual Report 2017
| 27 |
Portfolio of Investments
Columbia Capital Allocation Moderate Conservative Portfolio, January 31, 2017
(Percentages represent value of investments compared to net assets)
| Alternative Investment Funds 6.9% |
| | Shares | Value ($) |
| Columbia Absolute Return Currency and Income Fund, Class I Shares(a),(b) | 187,205 | 2,066,749 |
| Columbia Alternative Beta Fund, Class I Shares(a) | 458,101 | 4,173,302 |
| Columbia Commodity Strategy Fund, Class I Shares(a) | 1,327,610 | 7,500,997 |
| Columbia Diversified Absolute Return Fund, Class I Shares(a),(b) | 1,053,957 | 9,991,508 |
| Columbia Multi-Asset Income Fund, Class I Shares(a) | 1,898,935 | 18,267,753 |
Total Alternative Investment Funds
(Cost $43,394,854) | 42,000,309 |
|
| Common Stocks 2.1% |
| Issuer | Shares | Value ($) |
| Consumer Discretionary 0.2% |
| Auto Components —% |
| Bridgestone Corp. | 600 | 22,006 |
| Continental AG | 561 | 109,823 |
| Cooper Tire & Rubber Co. | 582 | 21,097 |
| Cooper-Standard Holding, Inc.(b) | 209 | 22,004 |
| Dana, Inc. | 605 | 12,185 |
| Drew Industries, Inc. | 350 | 38,412 |
| Superior Industries International, Inc. | 810 | 18,671 |
| Total | | 244,198 |
| Automobiles 0.1% |
| Fuji Heavy Industries Ltd. | 4,000 | 160,064 |
| Peugeot SA(b) | 7,221 | 134,387 |
| Suzuki Motor Corp. | 3,700 | 142,794 |
| Total | | 437,245 |
| Diversified Consumer Services —% |
| Capella Education Co. | 422 | 36,081 |
| Hotels, Restaurants & Leisure —% |
| Bloomin’ Brands, Inc. | 880 | 15,057 |
| Cheesecake Factory, Inc. (The) | 625 | 37,663 |
| Compass Group PLC | 5,598 | 99,628 |
| Denny’s Corp.(b) | 285 | 3,468 |
| Isle of Capri Casinos, Inc.(b) | 807 | 19,215 |
| Papa John’s International, Inc. | 206 | 17,555 |
| Pinnacle Entertainment, Inc.(b) | 120 | 1,848 |
| Ruth’s Hospitality Group, Inc. | 1,622 | 27,817 |
| Total | | 222,251 |
| Common Stocks (continued) |
| Issuer | Shares | Value ($) |
| Household Durables 0.1% |
| Electrolux AB, Class B | 5,365 | 142,661 |
| La-Z-Boy, Inc. | 895 | 25,597 |
| Persimmon PLC | 914 | 22,262 |
| Sony Corp. | 1,800 | 54,500 |
| Total | | 245,020 |
| Media —% |
| Gannett Co., Inc. | 2,685 | 25,830 |
| New York Times Co. (The), Class A | 2,495 | 33,683 |
| WPP PLC | 1,187 | 27,626 |
| Total | | 87,139 |
| Multiline Retail —% |
| Big Lots, Inc. | 650 | 32,500 |
| Specialty Retail —% |
| Aaron’s, Inc.(b) | 630 | 19,492 |
| Big 5 Sporting Goods Corp. | 1,220 | 18,788 |
| Children’s Place, Inc. (The) | 379 | 36,763 |
| Francesca’s Holdings Corp.(b) | 1,720 | 29,997 |
| Genesco, Inc.(b) | 315 | 18,963 |
| Pier 1 Imports, Inc. | 3,330 | 24,209 |
| Total | | 148,212 |
| Textiles, Apparel & Luxury Goods —% |
| Movado Group, Inc. | 1,155 | 31,358 |
| Total Consumer Discretionary | 1,484,004 |
| Consumer Staples 0.2% |
| Beverages —% |
| Coca-Cola Amatil Ltd. | 4,964 | 36,711 |
| Food & Staples Retailing 0.1% |
| Jeronimo Martins SGPS SA | 6,986 | 118,242 |
| Koninklijke Ahold Delhaize NV(b) | 2,888 | 61,525 |
| Metro AG | 931 | 31,860 |
| SpartanNash Co. | 865 | 32,749 |
| SUPERVALU, Inc.(b) | 584 | 2,289 |
| Total | | 246,665 |
The accompanying Notes to Financial Statements are an integral part of this statement.
| 28 | Columbia Capital Allocation Portfolios | Annual Report 2017 |
Portfolio of Investments (continued)
Columbia Capital Allocation Moderate Conservative Portfolio, January 31, 2017
| Common Stocks (continued) |
| Issuer | Shares | Value ($) |
| Food Products 0.1% |
| Dean Foods Co. | 1,877 | 37,277 |
| Fresh Del Monte Produce, Inc. | 110 | 6,298 |
| Marine Harvest ASA | 3,355 | 59,306 |
| Nestlé SA, Registered Shares(b) | 1,982 | 145,210 |
| Sanderson Farms, Inc. | 409 | 37,219 |
| WH Group Ltd. | 169,000 | 128,363 |
| Total | | 413,673 |
| Household Products —% |
| Reckitt Benckiser Group PLC | 1,906 | 163,545 |
| Personal Products —% |
| Usana Health Sciences, Inc.(b) | 190 | 11,837 |
| Tobacco —% |
| Imperial Brands PLC | 1,610 | 74,588 |
| Swedish Match AB | 3,613 | 117,627 |
| Total | | 192,215 |
| Total Consumer Staples | 1,064,646 |
| Energy 0.1% |
| Energy Equipment & Services —% |
| Archrock, Inc. | 1,245 | 18,177 |
| Atwood Oceanics, Inc.(b) | 2,758 | 33,537 |
| Petrofac Ltd. | 3,179 | 36,810 |
| Seadrill Ltd.(b) | 9,350 | 17,485 |
| Total | | 106,009 |
| Oil, Gas & Consumable Fuels 0.1% |
| BP PLC | 2,810 | 16,783 |
| Caltex Australia Ltd. | 3,124 | 67,799 |
| Idemitsu Kosan Co., Ltd. | 4,400 | 136,055 |
| OMV AG | 3,516 | 123,053 |
| PDC Energy, Inc.(b) | 495 | 36,600 |
| Repsol SA | 2,039 | 30,222 |
| REX American Resources Corp.(b) | 380 | 31,551 |
| Royal Dutch Shell PLC, Class B | 454 | 12,823 |
| Western Refining, Inc. | 310 | 10,853 |
| Total | | 465,739 |
| Total Energy | 571,748 |
| Common Stocks (continued) |
| Issuer | Shares | Value ($) |
| Financials 0.4% |
| Banks 0.2% |
| Banc of California, Inc. | 2,186 | 34,539 |
| Banco Latinoamericano de Comercio Exterior SA, Class E | 900 | 24,480 |
| Bank Hapoalim BM | 13,988 | 84,420 |
| BNP Paribas SA | 2,264 | 144,832 |
| BOC Hong Kong Holdings Ltd. | 24,139 | 96,505 |
| Central Pacific Financial Corp. | 1,160 | 36,343 |
| Customers Bancorp, Inc.(b) | 941 | 32,427 |
| FCB Financial Holdings, Inc., Class A(b) | 720 | 33,804 |
| First BanCorp(b) | 1,375 | 9,240 |
| Fulton Financial Corp. | 320 | 5,824 |
| Hanmi Financial Corp. | 165 | 5,470 |
| Hilltop Holdings, Inc.(b) | 930 | 25,463 |
| HSBC Holdings PLC(b) | 31,161 | 265,832 |
| ING Groep NV | 913 | 13,116 |
| International Bancshares Corp. | 985 | 36,544 |
| Societe Generale SA | 3,710 | 181,373 |
| Westpac Banking Corp. | 6,837 | 164,590 |
| Wintrust Financial Corp. | 270 | 19,332 |
| Total | | 1,214,134 |
| Capital Markets —% |
| 3i Group PLC | 14,962 | 132,170 |
| Arlington Asset Investment Corp., Class A | 2,038 | 30,509 |
| KCG Holdings, Inc., Class A(b) | 2,206 | 30,818 |
| Piper Jaffray Companies(b) | 450 | 31,725 |
| Total | | 225,222 |
| Consumer Finance —% |
| Nelnet, Inc., Class A | 685 | 33,586 |
| Insurance 0.1% |
| Allianz SE, Registered Shares(b) | 1,119 | 190,190 |
| Ambac Financial Group, Inc.(b) | 790 | 16,527 |
| American Equity Investment Life Holding Co. | 306 | 7,222 |
| Assicurazioni Generali SpA | 6,987 | 111,492 |
| AXA SA | 3,222 | 79,188 |
| CNP Assurances | 1,855 | 34,861 |
| Dai-ichi Life Holdings, Inc. | 6,100 | 110,586 |
| Heritage Insurance Holdings, Inc. | 1,830 | 25,949 |
The accompanying Notes to Financial Statements are an integral part of this statement.
Columbia Capital Allocation Portfolios | Annual Report 2017
| 29 |
Portfolio of Investments (continued)
Columbia Capital Allocation Moderate Conservative Portfolio, January 31, 2017
| Common Stocks (continued) |
| Issuer | Shares | Value ($) |
| Maiden Holdings Ltd. | 1,535 | 27,246 |
| NN Group NV | 4,681 | 165,782 |
| Swiss Re AG | 398 | 37,193 |
| Universal Insurance Holdings, Inc. | 1,356 | 35,459 |
| Total | | 841,695 |
| Mortgage Real Estate Investment Trusts (REITS) —% |
| CYS Investments, Inc. | 4,125 | 31,226 |
| Invesco Mortgage Capital, Inc. | 1,110 | 16,173 |
| Redwood Trust, Inc. | 560 | 8,680 |
| Total | | 56,079 |
| Thrifts & Mortgage Finance 0.1% |
| BofI Holding, Inc.(b) | 1,290 | 38,055 |
| Essent Group Ltd.(b) | 1,190 | 41,138 |
| Flagstar Bancorp, Inc.(b) | 1,160 | 29,893 |
| HomeStreet, Inc.(b) | 1,035 | 27,117 |
| Meta Financial Group, Inc. | 90 | 7,907 |
| MGIC Investment Corp.(b) | 4,155 | 44,251 |
| Radian Group, Inc.(b) | 2,455 | 45,172 |
| Walker & Dunlop, Inc.(b) | 1,140 | 35,807 |
| Washington Federal, Inc. | 1,245 | 40,898 |
| Total | | 310,238 |
| Total Financials | 2,680,954 |
| Health Care 0.2% |
| Biotechnology —% |
| Alder Biopharmaceuticals, Inc.(b) | 460 | 9,453 |
| ARIAD Pharmaceuticals, Inc.(b) | 450 | 10,719 |
| Arrowhead Pharmaceuticals, Inc.(b) | 2,175 | 4,220 |
| bluebird bio, Inc.(b) | 195 | 14,527 |
| Coherus Biosciences, Inc.(b) | 275 | 7,673 |
| Dynavax Technologies Corp.(b) | 725 | 2,973 |
| Halozyme Therapeutics, Inc.(b) | 655 | 7,565 |
| Insys Therapeutics, Inc.(b) | 955 | 9,779 |
| Keryx Biopharmaceuticals, Inc.(b) | 2,955 | 14,745 |
| Kite Pharma, Inc.(b) | 180 | 9,175 |
| Ligand Pharmaceuticals, Inc.(b) | 241 | 25,548 |
| PTC Therapeutics, Inc.(b) | 555 | 7,271 |
| Puma Biotechnology, Inc.(b) | 350 | 11,340 |
| Ra Pharmaceuticals, Inc.(b) | 414 | 6,599 |
| Common Stocks (continued) |
| Issuer | Shares | Value ($) |
| Sage Therapeutics, Inc.(b) | 180 | 8,636 |
| Shire PLC(b) | 876 | 48,772 |
| Spark Therapeutics, Inc.(b) | 335 | 21,125 |
| TESARO, Inc.(b) | 100 | 16,284 |
| Total | | 236,404 |
| Health Care Equipment & Supplies —% |
| Analogic Corp. | 141 | 10,949 |
| Angiodynamics, Inc.(b) | 1,510 | 24,303 |
| Halyard Health, Inc.(b) | 575 | 22,120 |
| Masimo Corp.(b) | 565 | 41,573 |
| Natus Medical, Inc.(b) | 160 | 6,248 |
| OraSure Technologies, Inc.(b) | 2,325 | 20,507 |
| Orthofix International NV(b) | 865 | 31,088 |
| Total | | 156,788 |
| Health Care Providers & Services —% |
| Chemed Corp. | 36 | 5,979 |
| Magellan Health, Inc.(b) | 444 | 33,278 |
| Molina Healthcare, Inc.(b) | 556 | 31,536 |
| Owens & Minor, Inc. | 745 | 26,731 |
| Triple-S Management Corp., Class B(b) | 1,130 | 21,594 |
| Total | | 119,118 |
| Life Sciences Tools & Services —% |
| INC Research Holdings, Inc. Class A(b) | 691 | 36,623 |
| Pra Health Sciences, Inc.(b) | 611 | 35,799 |
| Total | | 72,422 |
| Pharmaceuticals 0.2% |
| Aerie Pharmaceuticals, Inc.(b) | 510 | 22,389 |
| Astellas Pharma, Inc. | 8,300 | 111,401 |
| Bayer AG, Registered Shares | 1,133 | 125,853 |
| GlaxoSmithKline PLC | 9,848 | 190,312 |
| Jounce Therapeutics, Inc.(b) | 528 | 8,754 |
| Novo Nordisk A/S, Class B | 445 | 15,982 |
| Roche Holding AG, Genusschein Shares(b) | 857 | 203,065 |
| Sanofi | 2,176 | 174,899 |
| Supernus Pharmaceuticals, Inc.(b) | 975 | 26,374 |
| Teva Pharmaceutical Industries Ltd., ADR | 1,519 | 50,780 |
| Total | | 929,809 |
| Total Health Care | 1,514,541 |
The accompanying Notes to Financial Statements are an integral part of this statement.
| 30 | Columbia Capital Allocation Portfolios | Annual Report 2017 |
Portfolio of Investments (continued)
Columbia Capital Allocation Moderate Conservative Portfolio, January 31, 2017
| Common Stocks (continued) |
| Issuer | Shares | Value ($) |
| Industrials 0.3% |
| Aerospace & Defense —% |
| Curtiss-Wright Corp. | 416 | 40,793 |
| Air Freight & Logistics —% |
| Forward Air Corp. | 50 | 2,409 |
| Royal Mail PLC | 6,302 | 32,729 |
| Total | | 35,138 |
| Airlines 0.1% |
| Deutsche Lufthansa AG, Registered Shares | 2,790 | 37,270 |
| Hawaiian Holdings, Inc.(b) | 740 | 37,703 |
| Japan Airlines Co., Ltd. | 3,700 | 117,820 |
| Qantas Airways Ltd. | 31,764 | 82,105 |
| Total | | 274,898 |
| Building Products —% |
| Continental Building Product(b) | 1,315 | 30,574 |
| Gibraltar Industries, Inc.(b) | 820 | 35,998 |
| NCI Building Systems, Inc.(b) | 620 | 9,920 |
| Universal Forest Products, Inc. | 342 | 34,785 |
| Total | | 111,277 |
| Commercial Services & Supplies —% |
| ACCO Brands Corp.(b) | 1,540 | 19,635 |
| Brady Corp., Class A | 775 | 28,171 |
| Knoll, Inc. | 250 | 6,528 |
| Quad/Graphics, Inc. | 1,213 | 31,768 |
| Total | | 86,102 |
| Construction & Engineering 0.1% |
| ACS Actividades de Construccion y Servicios SA | 4,419 | 136,196 |
| Argan, Inc. | 455 | 33,556 |
| Obayashi Corp. | 4,900 | 46,678 |
| Skanska AB, Class B | 5,894 | 144,109 |
| Taisei Corp. | 18,000 | 127,864 |
| Total | | 488,403 |
| Electrical Equipment —% |
| ABB Ltd.(b) | 6,998 | 166,768 |
| EnerSys | 532 | 41,470 |
| Generac Holdings, Inc.(b) | 505 | 20,331 |
| Total | | 228,569 |
| Common Stocks (continued) |
| Issuer | Shares | Value ($) |
| Machinery —% |
| Astec Industries, Inc. | 150 | 10,497 |
| Energy Recovery, Inc.(b) | 2,890 | 29,594 |
| Global Brass & Copper Holdings, Inc.(b) | 910 | 30,166 |
| Greenbrier Companies, Inc. (The) | 835 | 36,531 |
| KONE OYJ, Class B | 825 | 37,299 |
| Mueller Industries, Inc. | 370 | 14,896 |
| NSK Ltd. | 5,500 | 66,766 |
| Wabash National Corp.(b) | 2,214 | 39,077 |
| Total | | 264,826 |
| Professional Services —% |
| Huron Consulting Group, Inc.(b) | 685 | 31,031 |
| RPX Corp.(b) | 2,840 | 30,842 |
| Total | | 61,873 |
| Road & Rail —% |
| ArcBest Corp. | 1,040 | 32,864 |
| Trading Companies & Distributors 0.1% |
| Applied Industrial Technologies, Inc. | 655 | 39,595 |
| ITOCHU Corp. | 10,700 | 147,402 |
| Sumitomo Corp. | 7,300 | 91,511 |
| Total | | 278,508 |
| Total Industrials | 1,903,251 |
| Information Technology 0.2% |
| Electronic Equipment, Instruments & Components —% |
| Benchmark Electronics, Inc.(b) | 1,310 | 40,086 |
| Hitachi High-Technologies Corp. | 300 | 12,850 |
| Methode Electronics, Inc. | 545 | 22,917 |
| Rogers Corp.(b) | 425 | 33,979 |
| Sanmina Corp.(b) | 1,155 | 44,987 |
| Scansource, Inc.(b) | 590 | 23,335 |
| TTM Technologies, Inc.(b) | 2,280 | 33,812 |
| Vishay Intertechnology, Inc. | 2,090 | 34,694 |
| Total | | 246,660 |
| Internet Software & Services 0.1% |
| Bankrate, Inc.(b) | 550 | 5,995 |
| EarthLink Holdings Corp. | 4,655 | 29,839 |
| j2 Global, Inc.(b) | 529 | 44,335 |
| Mixi, Inc. | 3,700 | 160,529 |
The accompanying Notes to Financial Statements are an integral part of this statement.
Columbia Capital Allocation Portfolios | Annual Report 2017
| 31 |
Portfolio of Investments (continued)
Columbia Capital Allocation Moderate Conservative Portfolio, January 31, 2017
| Common Stocks (continued) |
| Issuer | Shares | Value ($) |
| RetailMeNot, Inc.(b) | 2,769 | 25,059 |
| Shutterstock, Inc.(b) | 145 | 7,801 |
| Total | | 273,558 |
| IT Services —% |
| Cardtronics PLC, Class A(b) | 740 | 40,389 |
| Convergys Corp. | 1,000 | 24,820 |
| CSG Systems International, Inc. | 485 | 23,474 |
| EVERTEC, Inc. | 1,812 | 30,895 |
| Fujitsu Ltd. | 9,000 | 52,308 |
| Science Applications International Corp. | 103 | 8,386 |
| Sykes Enterprises, Inc.(b) | 235 | 6,563 |
| Travelport Worldwide Ltd. | 720 | 10,339 |
| Unisys Corp.(b) | 1,240 | 15,934 |
| Total | | 213,108 |
| Semiconductors & Semiconductor Equipment —% |
| Amkor Technology, Inc.(b) | 3,030 | 28,512 |
| Diodes, Inc.(b) | 309 | 7,691 |
| Entegris, Inc.(b) | 1,905 | 35,719 |
| Semtech Corp.(b) | 1,095 | 36,080 |
| Synaptics, Inc.(b) | 617 | 34,787 |
| Xcerra Corp.(b) | 2,358 | 17,874 |
| Total | | 160,663 |
| Software 0.1% |
| Aspen Technology, Inc.(b) | 680 | 36,115 |
| Barracuda Networks, Inc.(b) | 470 | 11,040 |
| CommVault Systems, Inc.(b) | 625 | 30,688 |
| Mentor Graphics Corp. | 320 | 11,811 |
| Oracle Corp. Japan | 2,400 | 134,474 |
| Progress Software Corp.(b) | 460 | 12,889 |
| Qualys, Inc.(b) | 460 | 16,514 |
| VASCO Data Security International, Inc.(b) | 595 | 9,044 |
| Total | | 262,575 |
| Technology Hardware, Storage & Peripherals —% |
| Seiko Epson Corp. | 5,700 | 117,426 |
| Total Information Technology | 1,273,990 |
| Common Stocks (continued) |
| Issuer | Shares | Value ($) |
| Materials 0.2% |
| Chemicals 0.1% |
| Ferro Corp.(b) | 2,100 | 29,694 |
| Hitachi Chemical Co., Ltd. | 500 | 14,196 |
| Innospec, Inc. | 570 | 40,669 |
| Johnson Matthey PLC(b) | 156 | 6,399 |
| Mitsubishi Chemical Holdings Corp. | 20,200 | 140,894 |
| Rayonier Advanced Materials, Inc. | 2,310 | 31,347 |
| Trinseo SA | 635 | 41,116 |
| Total | | 304,315 |
| Construction Materials —% |
| Fletcher Building Ltd. | 8,097 | 62,383 |
| Containers & Packaging —% |
| Greif, Inc., Class A | 570 | 32,821 |
| Metals & Mining 0.1% |
| Fortescue Metals Group Ltd. | 30,764 | 155,675 |
| Materion Corp. | 310 | 12,183 |
| Rio Tinto PLC | 4,653 | 206,141 |
| Schnitzer Steel Industries, Inc., Class A | 1,240 | 29,326 |
| Total | | 403,325 |
| Paper & Forest Products —% |
| UPM-Kymmene OYJ | 6,663 | 151,116 |
| Total Materials | 953,960 |
| Real Estate 0.1% |
| Equity Real Estate Investment Trusts (REITS) 0.1% |
| Ashford Hospitality Prime, Inc. | 450 | 6,048 |
| CBL & Associates Properties, Inc. | 3,075 | 33,364 |
| CorEnergy Infrastructure Trust, Inc. | 558 | 20,032 |
| DuPont Fabros Technology, Inc. | 280 | 13,294 |
| Government Properties Income Trust | 350 | 6,741 |
| LaSalle Hotel Properties | 600 | 18,102 |
| Lexington Realty Trust | 3,400 | 36,448 |
| PS Business Parks, Inc. | 310 | 34,733 |
| Ramco-Gershenson Properties Trust | 350 | 5,691 |
| RLJ Lodging Trust | 505 | 11,721 |
| Ryman Hospitality Properties, Inc. | 540 | 33,037 |
| Sabra Health Care REIT, Inc. | 180 | 4,572 |
| Select Income REIT | 1,240 | 31,012 |
The accompanying Notes to Financial Statements are an integral part of this statement.
| 32 | Columbia Capital Allocation Portfolios | Annual Report 2017 |
Portfolio of Investments (continued)
Columbia Capital Allocation Moderate Conservative Portfolio, January 31, 2017
| Common Stocks (continued) |
| Issuer | Shares | Value ($) |
| STAG Industrial, Inc. | 350 | 8,099 |
| Summit Hotel Properties, Inc. | 2,370 | 37,517 |
| Washington Prime Group, Inc. | 3,395 | 32,762 |
| Xenia Hotels & Resorts, Inc. | 280 | 5,138 |
| Total | | 338,311 |
| Real Estate Management & Development —% |
| Cheung Kong Property Holding Ltd.(b) | 12,765 | 83,903 |
| Daiwa House Industry Co., Ltd. | 2,400 | 64,997 |
| Wheelock & Co., Ltd. | 24,558 | 149,262 |
| Total | | 298,162 |
| Total Real Estate | 636,473 |
| Telecommunication Services 0.1% |
| Diversified Telecommunication Services 0.1% |
| General Communication, Inc., Class A(b) | 1,465 | 29,476 |
| Nippon Telegraph & Telephone Corp. | 3,500 | 154,603 |
| Telefonica SA | 5,179 | 50,107 |
| Telenor ASA | 5,353 | 84,760 |
| Telstra Corp., Ltd. | 7,227 | 27,420 |
| Windstream Holdings, Inc. | 2,350 | 18,988 |
| Total | | 365,354 |
| Wireless Telecommunication Services —% |
| NTT DoCoMo, Inc. | 3,200 | 76,512 |
| Total Telecommunication Services | 441,866 |
| Utilities 0.1% |
| Electric Utilities 0.1% |
| Endesa SA | 5,749 | 118,559 |
| Enel SpA(b) | 25,186 | 105,293 |
| IDACORP, Inc. | 11 | 880 |
| Portland General Electric Co. | 21 | 916 |
| Total | | 225,648 |
| Gas Utilities —% |
| Chesapeake Utilities Corp. | 415 | 27,141 |
| Northwest Natural Gas Co. | 350 | 20,615 |
| Southwest Gas Corp. | 511 | 41,171 |
| Total | | 88,927 |
| Independent Power and Renewable Electricity Producers —% |
| Ormat Technologies, Inc. | 500 | 26,850 |
| Common Stocks (continued) |
| Issuer | Shares | Value ($) |
| Multi-Utilities —% |
| E.ON SE | 10,283 | 79,211 |
| Water Utilities —% |
| SJW Corp. | 655 | 32,816 |
| Total Utilities | 453,452 |
Total Common Stocks
(Cost $11,866,591) | 12,978,885 |
|
| Equity Funds 32.5% |
| | Shares | Value ($) |
| International 7.9% |
| Columbia Emerging Markets Fund, Class I Shares(a),(b) | 883,010 | 8,900,736 |
| Columbia European Equity Fund, Class I Shares(a) | 2,509,671 | 15,258,801 |
| Columbia Overseas Value Fund, Class I Shares(a) | 2,641,904 | 22,376,929 |
| Columbia Pacific/Asia Fund, Class I Shares(a) | 191,401 | 1,802,991 |
| Total | 48,339,457 |
| U.S. Large Cap 23.7% |
| Columbia Contrarian Core Fund, Class I Shares(a) | 880,130 | 20,154,973 |
| Columbia Disciplined Core Fund, Class I Shares(a) | 3,202,201 | 33,270,865 |
| Columbia Disciplined Growth Fund, Class I Shares(a) | 2,258,281 | 19,330,891 |
| Columbia Disciplined Value Fund, Class I Shares(a) | 3,515,184 | 34,413,654 |
| Columbia Large Cap Growth Fund, Class I Shares(a) | 384,154 | 13,714,293 |
| Columbia Select Large Cap Equity Fund, Class I Shares(a) | 1,964,141 | 24,649,966 |
| Total | 145,534,642 |
| U.S. Small Cap 0.9% |
| Columbia Disciplined Small Core Fund, Class I Shares(a) | 618,263 | 5,904,414 |
Total Equity Funds
(Cost $187,854,525) | 199,778,513 |
|
| Fixed-Income Funds 49.2% |
| | |
| Emerging Markets 2.2% |
| Columbia Emerging Markets Bond Fund, Class I Shares(a) | 1,169,445 | 13,261,508 |
| High Yield 3.6% |
| Columbia Income Opportunities Fund, Class I Shares(a) | 2,252,027 | 22,204,988 |
| Inflation Protected Securities 1.9% |
| Columbia Inflation Protected Securities Fund, Class I Shares(a),(b) | 1,253,786 | 11,835,740 |
The accompanying Notes to Financial Statements are an integral part of this statement.
Columbia Capital Allocation Portfolios | Annual Report 2017
| 33 |
Portfolio of Investments (continued)
Columbia Capital Allocation Moderate Conservative Portfolio, January 31, 2017
| Fixed-Income Funds (continued) |
| | Shares | Value ($) |
| Investment Grade 41.5% |
| Columbia Corporate Income Fund, Class I Shares(a) | 5,559,903 | 55,710,226 |
| Columbia Limited Duration Credit Fund, Class I Shares(a) | 1,466,606 | 14,402,071 |
| Columbia Mortgage Opportunities Fund, Class I Shares(a) | 960,409 | 9,460,029 |
| Columbia Total Return Bond Fund, Class I Shares(a) | 3,592,336 | 32,259,179 |
| Columbia U.S. Government Mortgage Fund, Class I Shares(a) | 15,922,919 | 85,824,532 |
| Columbia U.S. Treasury Index Fund, Class I Shares(a) | 5,241,913 | 57,556,209 |
| Total | 255,212,246 |
Total Fixed-Income Funds
(Cost $308,585,693) | 302,514,482 |
| Preferred Stocks —% |
| Issuer | Coupon
Rate | Shares | Value ($) |
| Consumer Discretionary —% |
| Auto Components —% |
| Schaeffler AG | — | 8,654 | 140,333 |
| Total Consumer Discretionary | 140,333 |
Total Preferred Stocks
(Cost $124,342) | 140,333 |
| Money Market Funds 9.1% |
| | Shares | Value ($) |
| Columbia Short-Term Cash Fund, 0.662%(a),(c) | 55,877,563 | 55,877,563 |
Total Money Market Funds
(Cost $55,877,602) | 55,877,563 |
Total Investments
(Cost: $607,703,607) | 613,290,085 |
| Other Assets & Liabilities, Net | | 1,404,133 |
| Net Assets | 614,694,218 |
At January 31, 2017, securities and/or cash totaling $2,190,693 were pledged as collateral.
Investments in derivatives
| Forward foreign currency exchange contracts open at January 31, 2017 |
| Counterparty | Exchange
date | Currency to
be delivered | Currency to
be received | Unrealized
appreciation ($) | Unrealized
depreciation ($) |
| Barclays | 02/22/2017 | 68,000 EUR | 72,376 USD | — | (1,080) |
| Barclays | 02/22/2017 | 294,000 ILS | 76,888 USD | — | (1,139) |
| Barclays | 02/22/2017 | 16,053,000 JPY | 140,186 USD | — | (2,060) |
| Barclays | 02/22/2017 | 436,000 NOK | 51,366 USD | — | (1,502) |
| Barclays | 02/22/2017 | 36,000 NZD | 25,608 USD | — | (790) |
| Barclays | 02/22/2017 | 1,301,000 SEK | 145,578 USD | — | (3,275) |
| Barclays | 02/22/2017 | 119,275 USD | 159,000 AUD | 1,256 | — |
| Barclays | 02/22/2017 | 196,928 USD | 198,000 CHF | 3,348 | — |
| Barclays | 02/22/2017 | 128,180 USD | 895,000 DKK | 1,842 | — |
| Barclays | 02/22/2017 | 247,869 USD | 202,000 GBP | 6,329 | — |
| Barclays | 02/22/2017 | 111,328 USD | 159,000 SGD | 1,510 | — |
| Total | | | | 14,285 | (9,846) |
The accompanying Notes to Financial Statements are an integral part of this statement.
| 34 | Columbia Capital Allocation Portfolios | Annual Report 2017 |
Portfolio of Investments (continued)
Columbia Capital Allocation Moderate Conservative Portfolio, January 31, 2017
Investments in derivatives (continued)
Futures contracts outstanding at January 31, 2017
| Long futures contracts outstanding |
| Contract description | Number of
contracts | Trading
currency | Notional market
value ($) | Expiration date | Unrealized
appreciation ($) | Unrealized
depreciation ($) |
| Mini MSCI Emerging Markets Index | 80 | USD | 3,660,400 | 03/2017 | 145,398 | — |
| Russell 2000 Mini | 29 | USD | 1,971,275 | 03/2017 | — | (39,488) |
| S&P 500 E-mini | 92 | USD | 10,462,700 | 03/2017 | 91,313 | — |
| S&P Mid 400 E-mini | 20 | USD | 3,371,000 | 03/2017 | — | (10,849) |
| TOPIX Index | 57 | JPY | 7,658,223 | 03/2017 | — | (109,704) |
| U.S. Long Bond | 44 | USD | 6,637,125 | 03/2017 | — | (43,680) |
| U.S. Treasury 10-Year Note | 89 | USD | 11,077,719 | 03/2017 | — | (38,398) |
| U.S. Ultra Bond | 10 | USD | 1,606,875 | 03/2017 | — | (13,145) |
| Total | | | 46,445,317 | | 236,711 | (255,264) |
| Short futures contracts outstanding |
| Contract description | Number of
contracts | Trading
currency | Notional market
value ($) | Expiration date | Unrealized
appreciation ($) | Unrealized
depreciation ($) |
| EURO STOXX 50 | (101) | EUR | (3,526,013) | 03/2017 | — | (48,381) |
| FTSE 100 Index | (38) | GBP | (3,368,029) | 03/2017 | — | (105,298) |
| Total | | | (6,894,042) | | — | (153,679) |
Cleared credit default swap contracts outstanding at January 31, 2017
| Buy protection |
| Counterparty | Reference
entity | Expiration
date | Pay fixed
rate (%) | Notional
currency | Notional
amount ($) | Unrealized
appreciation ($) | Unrealized
depreciation ($) |
| Morgan Stanley | Markit CDX North America High Yield Index, Series 26 | 06/20/2021 | 5.000 | USD | 3,167,000 | — | (161,991) |
| Morgan Stanley | Markit CDX North America Investment Grade Index, Series 27 | 12/20/2021 | 1.000 | USD | 12,050,000 | — | (39,166) |
| Total | | | | | | — | (201,157) |
Credit default swap contracts outstanding at January 31, 2017
| Sell protection |
| Counterparty | Reference
entity | Expiration
date | Receive
fixed
rate
(%) | Implied
credit
spread
(%) | Notional
currency | Notional
amount
($) | Market
value
($) | Periodic
payments
receivable
(payable)
($) | Premium
paid
($) | Premium
received
($) | Unrealized
appreciation
($) | Unrealized
depreciation
($) |
| Barclays | Markit CDX Emerging Markets Index, Series 26 | 12/20/21 | 1.000 | 2.372 | USD | (461,538) | (28,064) | 551 | — | (29,701) | 2,188 | — |
| Barclays | Markit CDX Emerging Markets Index, Series 26 | 12/20/21 | 1.000 | 2.372 | USD | (923,077) | (56,127) | 1,102 | — | (59,849) | 4,824 | — |
| Barclays | Markit CDX Emerging Markets Index, Series 26 | 12/20/21 | 1.000 | 2.372 | USD | (865,385) | (52,619) | 1,034 | — | (56,444) | 4,859 | — |
| Total | | | | | | | | | — | (145,994) | 11,871 | — |
The accompanying Notes to Financial Statements are an integral part of this statement.
Columbia Capital Allocation Portfolios | Annual Report 2017
| 35 |
Portfolio of Investments (continued)
Columbia Capital Allocation Moderate Conservative Portfolio, January 31, 2017
Notes to Portfolio of Investments
| (a) | As defined in the Investment Company Act of 1940, an affiliated company is one in which the Fund owns 5% or more of the company’s outstanding voting securities, or a company which is under common ownership or control with the Fund. Holdings and transactions in these affiliated companies during the year ended January 31, 2017 are as follows: |
| Issuer | Beginning
shares | Shares
purchased | Shares
sold | Ending
shares | Capital gain
distributions ($) | Realized gain
(loss) ($) | Dividends —
affiliated
issuers ($) | Value ($) |
| Columbia Absolute Return Currency and Income Fund, Class I Shares | 226,606 | 13,324 | (52,725) | 187,205 | 69,066 | 42,352 | — | 2,066,749 |
| Columbia Alternative Beta Fund, Class I Shares | 455,212 | 2,889 | — | 458,101 | — | — | 26,120 | 4,173,302 |
| Columbia Commodity Strategy Fund, Class I Shares | — | 1,427,484 | (99,874) | 1,327,610 | — | (10,352) | — | 7,500,997 |
| Columbia Contrarian Core Fund, Class I Shares | 1,056,395 | 25,392 | (201,657) | 880,130 | 157,516 | 1,736,425 | 219,885 | 20,154,973 |
| Columbia Corporate Income Fund, Class I Shares | 11,565,291 | 278,905 | (6,284,293) | 5,559,903 | — | (1,326,857) | 2,568,024 | 55,710,226 |
| Columbia Disciplined Core Fund, Class I Shares | 2,655,844 | 958,971 | (412,614) | 3,202,201 | — | 1,809,637 | 401,357 | 33,270,865 |
| Columbia Disciplined Growth Fund, Class I Shares | 2,609,637 | 179,510 | (530,866) | 2,258,281 | 1,047,955 | 154,775 | 183,174 | 19,330,891 |
| Columbia Disciplined Small Core Fund, Class I Shares | 853,768 | 253,291 | (488,796) | 618,263 | 2,002,865 | (2,737,952) | 34,845 | 5,904,414 |
| Columbia Disciplined Value Fund, Class I Shares | 4,318,404 | 99,851 | (903,071) | 3,515,184 | — | 353,458 | 671,040 | 34,413,654 |
| Columbia Diversified Absolute Return Fund, Class I Shares | 1,446,713 | 44,028 | (436,784) | 1,053,957 | — | (192,226) | — | 9,991,508 |
| Columbia Emerging Markets Bond Fund, Class I Shares | 1,341,809 | 48,454 | (220,818) | 1,169,445 | — | (22,309) | 445,096 | 13,261,508 |
| Columbia Emerging Markets Fund, Class I Shares | — | 945,926 | (62,916) | 883,010 | — | 46,569 | — | 8,900,736 |
| Columbia European Equity Fund, Class I Shares | 3,008,706 | 197,856 | (696,891) | 2,509,671 | — | 265,550 | 402,100 | 15,258,801 |
| Columbia Income Opportunities Fund, Class I Shares | 3,229,875 | 161,644 | (1,139,492) | 2,252,027 | — | 221,267 | 1,314,910 | 22,204,988 |
| Columbia Inflation Protected Securities Fund, Class I Shares | 1,531,056 | 9,604 | (286,874) | 1,253,786 | — | (344,183) | — | 11,835,740 |
| Columbia Large Cap Growth Fund, Class I Shares | 449,310 | 19,154 | (84,310) | 384,154 | 185,997 | 895,988 | 82,525 | 13,714,293 |
| Columbia Limited Duration Credit Fund, Class I Shares | 4,571,818 | 73,762 | (3,178,974) | 1,466,606 | — | (285,947) | 459,769 | 14,402,071 |
| Columbia Mortgage Opportunities Fund, Class I Shares | 1,004,089 | 60,687 | (104,367) | 960,409 | 122,944 | (18,751) | 367,521 | 9,460,029 |
| Columbia Multi-Asset Income Fund, Class I Shares | 1,451,492 | 447,443 | — | 1,898,935 | — | — | 850,956 | 18,267,753 |
| Columbia Overseas Value Fund, Class I Shares | 3,215,719 | 112,980 | (686,795) | 2,641,904 | — | (330,883) | 505,215 | 22,376,929 |
| Columbia Pacific/Asia Fund, Class I Shares | 202,080 | 36,666 | (47,345) | 191,401 | 119,427 | 18,745 | 13,122 | 1,802,991 |
| Columbia Select Large Cap Equity Fund, Class I Shares | 1,195,681 | 768,460 | — | 1,964,141 | 149,329 | — | 191,373 | 24,649,966 |
| Columbia Short-Term Cash Fund, 0.662% | 22,212,738 | 86,463,386 | (52,798,561) | 55,877,563 | — | 43 | 235,115 | 55,877,563 |
The accompanying Notes to Financial Statements are an integral part of this statement.
| 36 | Columbia Capital Allocation Portfolios | Annual Report 2017 |
Portfolio of Investments (continued)
Columbia Capital Allocation Moderate Conservative Portfolio, January 31, 2017
Notes to Portfolio of Investments (continued)
| Issuer | Beginning
shares | Shares
purchased | Shares
sold | Ending
shares | Capital gain
distributions ($) | Realized gain
(loss) ($) | Dividends —
affiliated
issuers ($) | Value ($) |
| Columbia Total Return Bond Fund, Class I Shares | — | 3,592,336 | — | 3,592,336 | 497,227 | — | 738,419 | 32,259,179 |
| Columbia U.S. Government Mortgage Fund, Class I Shares | 17,173,866 | 713,427 | (1,964,374) | 15,922,919 | 413,157 | (83,793) | 2,179,411 | 85,824,532 |
| Columbia U.S. Treasury Index Fund, Class I Shares | 5,324,773 | 237,145 | (320,005) | 5,241,913 | 167,156 | (134,145) | 819,768 | 57,556,209 |
| Total | 91,100,882 | 97,172,575 | (71,002,402) | 117,271,055 | 4,932,639 | 57,411 | 12,709,745 | 600,170,867 |
| (b) | Non-income producing investment. |
| (c) | The rate shown is the seven-day current annualized yield at January 31, 2017. |
Abbreviation Legend
| ADR | American Depositary Receipt |
Currency Legend
| AUD | Australian Dollar |
| CHF | Swiss Franc |
| DKK | Danish Krone |
| EUR | Euro |
| GBP | British Pound |
| ILS | New Israeli Sheqel |
| JPY | Japanese Yen |
| NOK | Norwegian Krone |
| NZD | New Zealand Dollar |
| SEK | Swedish Krona |
| SGD | Singapore Dollar |
| USD | US Dollar |
Fair value measurements
The Fund categorizes its fair value measurements according to a three-level hierarchy that maximizes the use of observable inputs and minimizes the use of unobservable inputs by prioritizing that the most observable input be used when available. Observable inputs are those that market participants would use in pricing an investment based on market data obtained from sources independent of the reporting entity. Unobservable inputs are those that reflect the Fund’s assumptions about the information market participants would use in pricing an investment. An investment’s level within the fair value hierarchy is based on the lowest level of any input that is deemed significant to the asset’s or liability’s fair value measurement. The input levels are not necessarily an indication of the risk or liquidity associated with investments at that level. For example, certain U.S. government securities are generally high quality and liquid, however, they are reflected as Level 2 because the inputs used to determine fair value may not always be quoted prices in an active market.
Fair value inputs are summarized in the three broad levels listed below:
| • | Level 1 - Valuations based on quoted prices for investments in active markets that the Fund has the ability to access at the measurement date (including NAV for open-end mutual funds). Valuation adjustments are not applied to Level 1 investments. |
| • | Level 2 – Valuations based on other significant observable inputs (including quoted prices for similar securities, interest rates, prepayment speeds, credit risks, etc.). |
| • | Level 3 – Valuations based on significant unobservable inputs (including the Fund’s own assumptions and judgment in determining the fair value of investments). |
Inputs that are used in determining fair value of an investment may include price information, credit data, volatility statistics, and other factors. These inputs can be either observable or unobservable. The availability of observable inputs can vary between investments, and is affected by various factors such as the type of investment, and the volume and level of activity for that investment or similar investments in the marketplace. The inputs will be considered by the Investment Manager, along with any other relevant factors in the calculation of an investment’s fair value. The Fund uses prices and inputs that are current as of the measurement date, which may include periods of market dislocations. During these periods, the availability of prices and inputs may be reduced for many investments. This condition could cause an investment to be reclassified between the various levels within the hierarchy.
Foreign equity securities actively traded in markets where there is a significant delay in the local close relative to the New York Stock Exchange (NYSE) are classified as Level 2. The values of these securities may include an adjustment to reflect the impact of significant market movements following the close of local trading, as described in Note 2 to the financial statements – Security Valuation.
The accompanying Notes to Financial Statements are an integral part of this statement.
Columbia Capital Allocation Portfolios | Annual Report 2017
| 37 |
Portfolio of Investments (continued)
Columbia Capital Allocation Moderate Conservative Portfolio, January 31, 2017
Fair value measurements (continued)
Certain investments that have been measured at fair value using the net asset value (NAV) per share (or its equivalent) are not categorized in the fair value hierarchy. The fair value amounts presented in the table are intended to reconcile the fair value hierarchy to the amounts presented in the Portfolio of Investments. The Columbia Short-Term Cash Fund seeks to provide shareholders with maximum current income consistent with liquidity and stability of principal. Columbia Short-Term Cash Fund prices its shares with a floating NAV and no longer seeks to maintain a stable NAV.
Investments falling into the Level 3 category are primarily supported by quoted prices from brokers and dealers participating in the market for those investments. However, these may be classified as Level 3 investments due to lack of market transparency and corroboration to support these quoted prices. Additionally, valuation models may be used as the pricing source for any remaining investments classified as Level 3. These models may rely on one or more significant unobservable inputs and/or significant assumptions by the Investment Manager. Inputs used in valuations may include, but are not limited to, financial statement analysis, capital account balances, discount rates and estimated cash flows, and comparable company data.
Under the direction of the Fund’s Board of Trustees (the Board), the Investment Manager’s Valuation Committee (the Committee) is responsible for overseeing the valuation procedures approved by the Board. The Committee consists of voting and non-voting members from various groups within the Investment Manager’s organization, including operations and accounting, trading and investments, compliance, risk management and legal.
The Committee meets at least monthly to review and approve valuation matters, which may include a description of specific valuation determinations, data regarding pricing information received from approved pricing vendors and brokers and the results of Board-approved valuation control policies and procedures (the Policies). The Policies address, among other things, instances when market quotations are or are not readily available, including recommendations of third party pricing vendors and a determination of appropriate pricing methodologies; events that require specific valuation determinations and assessment of fair value techniques; securities with a potential for stale pricing, including those that are illiquid, restricted, or in default; and the effectiveness of third party pricing vendors, including periodic reviews of vendors. The Committee meets more frequently, as needed, to discuss additional valuation matters, which may include the need to review back-testing results, review time-sensitive information or approve related valuation actions. The Committee reports to the Board, with members of the Committee meeting with the Board at each of its regularly scheduled meetings to discuss valuation matters and actions during the period, similar to those described earlier.
For investments categorized as Level 3, the Committee monitors information similar to that described above, which may include: (i) data specific to the issuer or comparable issuers, (ii) general market or specific sector news and (iii) quoted prices and specific or similar security transactions. The Committee considers this data and any changes from prior periods in order to assess the reasonableness of observable and unobservable inputs, any assumptions or internal models used to value those securities and changes in fair value. This data is also used to corroborate, when available, information received from approved pricing vendors and brokers. Various factors impact the frequency of monitoring this information (which may occur as often as daily). However, the Committee may determine that changes to inputs, assumptions and models are not required as a result of the monitoring procedures performed.
The following table is a summary of the inputs used to value the Fund’s investments at January 31, 2017:
| | Level 1
quoted prices
in active
markets for
identical
assets ($) | Level 2
other
significant
observable
inputs ($) | Level 3
significant
unobservable
inputs ($) | Investments
measured at
net asset
value ($) | Total ($) |
| Investments | | | | | |
| Alternative Investment Funds | 42,000,309 | — | — | — | 42,000,309 |
| Common Stocks | | | | | |
| Consumer Discretionary | 568,253 | 915,751 | — | — | 1,484,004 |
| Consumer Staples | 127,669 | 936,977 | — | — | 1,064,646 |
| Energy | 148,203 | 423,545 | — | — | 571,748 |
| Financials | 868,824 | 1,812,130 | — | — | 2,680,954 |
| Health Care | 644,257 | 870,284 | — | — | 1,514,541 |
| Industrials | 668,734 | 1,234,517 | — | — | 1,903,251 |
| Information Technology | 796,403 | 477,587 | — | — | 1,273,990 |
| Materials | 217,156 | 736,804 | — | — | 953,960 |
| Real Estate | 338,311 | 298,162 | — | — | 636,473 |
| Telecommunication Services | 48,464 | 393,402 | — | — | 441,866 |
| Utilities | 150,389 | 303,063 | — | — | 453,452 |
| Total Common Stocks | 4,576,663 | 8,402,222 | — | — | 12,978,885 |
| Equity Funds | 199,778,513 | — | — | — | 199,778,513 |
| Fixed-Income Funds | 302,514,482 | — | — | — | 302,514,482 |
| Preferred Stocks | | | | | |
| Consumer Discretionary | — | 140,333 | — | — | 140,333 |
| Money Market Funds | — | — | — | 55,877,563 | 55,877,563 |
| Total Investments | 548,869,967 | 8,542,555 | — | 55,877,563 | 613,290,085 |
| Derivatives | | | | | |
The accompanying Notes to Financial Statements are an integral part of this statement.
| 38 | Columbia Capital Allocation Portfolios | Annual Report 2017 |
Portfolio of Investments (continued)
Columbia Capital Allocation Moderate Conservative Portfolio, January 31, 2017
Fair value measurements (continued)
| | Level 1
quoted prices
in active
markets for
identical
assets ($) | Level 2
other
significant
observable
inputs ($) | Level 3
significant
unobservable
inputs ($) | Investments
measured at
net asset
value ($) | Total ($) |
| Asset | | | | | |
| Forward Foreign Currency Exchange Contracts | — | 14,285 | — | — | 14,285 |
| Futures Contracts | 236,711 | — | — | — | 236,711 |
| Swap Contracts | — | 11,871 | — | — | 11,871 |
| Liability | | | | | |
| Forward Foreign Currency Exchange Contracts | — | (9,846) | — | — | (9,846) |
| Futures Contracts | (408,943) | — | — | — | (408,943) |
| Swap Contracts | — | (201,157) | — | — | (201,157) |
| Total | 548,697,735 | 8,357,708 | — | 55,877,563 | 612,933,006 |
See the Portfolio of Investments for all investment classifications not indicated in the table.
The Fund’s assets assigned to the Level 2 input category are generally valued using the market approach, in which a security’s value is determined through reference to prices and information from market transactions for similar or identical assets. These assets include certain foreign securities for which a third party statistical pricing service may be employed for purposes of fair market valuation. The model utilized by such third party statistical pricing service takes into account a security’s correlation to available market data including, but not limited to, intraday index, ADR, and exchange-traded fund movements.
Derivative instruments are valued at unrealized appreciation (depreciation).
There were no transfers of financial assets between levels during the period.
The accompanying Notes to Financial Statements are an integral part of this statement.
Columbia Capital Allocation Portfolios | Annual Report 2017
| 39 |
Portfolio of Investments
Columbia Capital Allocation Moderate Portfolio, January 31, 2017
(Percentages represent value of investments compared to net assets)
| Alternative Investment Funds 6.0% |
| | Shares | Value ($) |
| Columbia Absolute Return Currency and Income Fund, Class I Shares(a),(b) | 828,427 | 9,145,828 |
| Columbia Alternative Beta Fund, Class I Shares(a) | 458,101 | 4,173,302 |
| Columbia Commodity Strategy Fund, Class I Shares(a) | 3,978,653 | 22,479,391 |
| Columbia Diversified Absolute Return Fund, Class I Shares(a),(b) | 2,169,972 | 20,571,329 |
| Columbia Multi-Asset Income Fund, Class I Shares(a) | 3,622,034 | 34,843,970 |
Total Alternative Investment Funds
(Cost $93,327,401) | 91,213,820 |
|
| Common Stocks 2.0% |
| Issuer | Shares | Value ($) |
| Consumer Discretionary 0.3% |
| Auto Components 0.1% |
| Cooper Tire & Rubber Co. | 2,870 | 104,038 |
| Cooper-Standard Holding, Inc.(b) | 1,030 | 108,438 |
| Dana, Inc. | 2,960 | 59,614 |
| Drew Industries, Inc. | 1,730 | 189,867 |
| Hyundai Mobis Co., Ltd. | 323 | 67,196 |
| Magna International, Inc.(b) | 972 | 42,047 |
| Superior Industries International, Inc. | 3,975 | 91,624 |
| Total | | 662,824 |
| Automobiles —% |
| Fuji Heavy Industries Ltd. | 4,000 | 160,065 |
| Peugeot SA(b) | 9,070 | 168,798 |
| Suzuki Motor Corp. | 4,000 | 154,371 |
| Total | | 483,234 |
| Diversified Consumer Services —% |
| Capella Education Co. | 2,087 | 178,439 |
| Hotels, Restaurants & Leisure 0.1% |
| Bloomin’ Brands, Inc. | 4,300 | 73,573 |
| Cheesecake Factory, Inc. (The) | 3,075 | 185,299 |
| Compass Group PLC | 4,160 | 74,036 |
| Denny’s Corp.(b) | 1,410 | 17,160 |
| Flight Centre Travel Group Ltd. | 2,293 | 52,136 |
| InterContinental Hotels Group PLC | 776 | 36,035 |
| Isle of Capri Casinos, Inc.(b) | 3,990 | 95,002 |
| Papa John’s International, Inc. | 1,020 | 86,924 |
| Common Stocks (continued) |
| Issuer | Shares | Value ($) |
| Pinnacle Entertainment, Inc.(b) | 600 | 9,240 |
| Ruth’s Hospitality Group, Inc. | 7,970 | 136,685 |
| Total | | 766,090 |
| Household Durables —% |
| Arcelik AS | 3,906 | 23,665 |
| Electrolux AB, Class B | 5,625 | 149,575 |
| La-Z-Boy, Inc. | 4,400 | 125,840 |
| Persimmon PLC | 752 | 18,316 |
| Sony Corp. | 1,300 | 39,361 |
| Total | | 356,757 |
| Media —% |
| Gannett Co., Inc. | 13,250 | 127,465 |
| New York Times Co. (The), Class A | 12,305 | 166,118 |
| Total | | 293,583 |
| Multiline Retail —% |
| Big Lots, Inc. | 3,200 | 160,000 |
| Specialty Retail 0.1% |
| Aaron’s, Inc.(b) | 3,125 | 96,687 |
| Big 5 Sporting Goods Corp. | 6,000 | 92,400 |
| Children’s Place, Inc. (The) | 1,870 | 181,390 |
| Francesca’s Holdings Corp.(b) | 8,450 | 147,368 |
| Genesco, Inc.(b) | 1,575 | 94,815 |
| Pier 1 Imports, Inc. | 16,300 | 118,501 |
| Total | | 731,161 |
| Textiles, Apparel & Luxury Goods —% |
| Movado Group, Inc. | 5,605 | 152,176 |
| Total Consumer Discretionary | 3,784,264 |
| Consumer Staples 0.1% |
| Beverages —% |
| Ambev SA | 19,371 | 105,735 |
| Food & Staples Retailing —% |
| Alimentation Couche-Tard, Inc., Class B | 1,082 | 49,566 |
| Casino Guichard Perrachon SA | 273 | 14,721 |
| Jeronimo Martins SGPS SA | 6,018 | 101,858 |
| Koninklijke Ahold Delhaize NV(b) | 1,489 | 31,721 |
| Loblaw Companies Ltd. | 370 | 19,446 |
| Metro AG | 898 | 30,730 |
| SpartanNash Co. | 4,260 | 161,284 |
The accompanying Notes to Financial Statements are an integral part of this statement.
| 40 | Columbia Capital Allocation Portfolios | Annual Report 2017 |
Portfolio of Investments (continued)
Columbia Capital Allocation Moderate Portfolio, January 31, 2017
| Common Stocks (continued) |
| Issuer | Shares | Value ($) |
| SUPERVALU, Inc.(b) | 2,835 | 11,113 |
| Wm Morrison Supermarkets PLC | 6,434 | 19,182 |
| Total | | 439,621 |
| Food Products 0.1% |
| Dean Foods Co. | 9,280 | 184,301 |
| Fresh Del Monte Produce, Inc. | 550 | 31,487 |
| Marine Harvest ASA | 1,083 | 19,144 |
| Sanderson Farms, Inc. | 2,015 | 183,365 |
| WH Group Ltd. | 190,500 | 144,693 |
| Total | | 562,990 |
| Household Products —% |
| Reckitt Benckiser Group PLC | 939 | 80,572 |
| Personal Products —% |
| Usana Health Sciences, Inc.(b) | 940 | 58,562 |
| Tobacco —% |
| British American Tobacco PLC | 1,253 | 77,345 |
| Imperial Brands PLC | 643 | 29,789 |
| Swedish Match AB | 3,701 | 120,492 |
| Total | | 227,626 |
| Total Consumer Staples | 1,475,106 |
| Energy 0.1% |
| Energy Equipment & Services —% |
| Archrock, Inc. | 6,100 | 89,060 |
| Atwood Oceanics, Inc.(b) | 13,600 | 165,376 |
| Seadrill Ltd.(b) | 46,200 | 86,394 |
| Total | | 340,830 |
| Oil, Gas & Consumable Fuels 0.1% |
| China Petroleum & Chemical Corp., Class H | 196,000 | 154,826 |
| ENI SpA | 489 | 7,519 |
| Idemitsu Kosan Co., Ltd. | 700 | 21,645 |
| Lukoil PJSC | 1,903 | 106,610 |
| MOL Hungarian Oil and Gas NyRt | 287 | 20,225 |
| PDC Energy, Inc.(b) | 2,425 | 179,304 |
| Polski Koncern Naftowy Orlen SA | 680 | 13,784 |
| PTT PCL, Foreign Registered Shares | 13,500 | 154,953 |
| Repsol SA | 2,349 | 34,816 |
| REX American Resources Corp.(b) | 1,900 | 157,757 |
| Common Stocks (continued) |
| Issuer | Shares | Value ($) |
| SK Innovation Co., Ltd. | 1,059 | 143,463 |
| Western Refining, Inc. | 1,550 | 54,266 |
| Total | | 1,049,168 |
| Total Energy | 1,389,998 |
| Financials 0.4% |
| Banks 0.2% |
| ABSA Group Ltd. | 825 | 9,723 |
| Banc of California, Inc. | 10,805 | 170,719 |
| Banco Latinoamericano de Comercio Exterior SA, Class E | 4,440 | 120,768 |
| Bank of China Ltd., Class H | 336,000 | 152,180 |
| Bank of Montreal(b) | 1,608 | 121,633 |
| Bank of Nova Scotia (The)(b) | 2,939 | 175,629 |
| BNP Paribas SA | 493 | 31,538 |
| BOC Hong Kong Holdings Ltd. | 4,500 | 17,990 |
| Canadian Imperial Bank of Commerce | 1,900 | 161,798 |
| Central Pacific Financial Corp. | 5,710 | 178,894 |
| China CITIC Bank Corp., Ltd., Class H | 70,000 | 46,040 |
| China Construction Bank Corp., Class H | 39,000 | 28,914 |
| Customers Bancorp, Inc.(b) | 4,650 | 160,239 |
| FCB Financial Holdings, Inc., Class A(b) | 3,550 | 166,672 |
| First BanCorp(b) | 7,275 | 48,888 |
| Fulton Financial Corp. | 1,600 | 29,120 |
| Hanmi Financial Corp. | 825 | 27,349 |
| Hilltop Holdings, Inc.(b) | 4,600 | 125,948 |
| HSBC Holdings PLC(b) | 17,587 | 150,033 |
| International Bancshares Corp. | 4,865 | 180,491 |
| Royal Bank of Canada | 394 | 28,329 |
| Societe Generale SA | 3,638 | 177,853 |
| Standard Bank Group Ltd. | 6,305 | 67,341 |
| Toronto-Dominion Bank (The)(b) | 400 | 20,722 |
| Wintrust Financial Corp. | 1,350 | 96,660 |
| Total | | 2,495,471 |
| Capital Markets —% |
| Arlington Asset Investment Corp., Class A | 10,070 | 150,748 |
| KCG Holdings, Inc., Class A(b) | 10,900 | 152,273 |
| Piper Jaffray Companies(b) | 2,230 | 157,215 |
| Total | | 460,236 |
The accompanying Notes to Financial Statements are an integral part of this statement.
Columbia Capital Allocation Portfolios | Annual Report 2017
| 41 |
Portfolio of Investments (continued)
Columbia Capital Allocation Moderate Portfolio, January 31, 2017
| Common Stocks (continued) |
| Issuer | Shares | Value ($) |
| Consumer Finance —% |
| Nelnet, Inc., Class A | 3,375 | 165,476 |
| Insurance 0.1% |
| Allianz SE, Registered Shares(b) | 1,110 | 188,660 |
| Ambac Financial Group, Inc.(b) | 3,900 | 81,588 |
| American Equity Investment Life Holding Co. | 1,514 | 35,730 |
| Assicurazioni Generali SpA | 6,928 | 110,551 |
| AXA SA | 2,745 | 67,465 |
| CNP Assurances | 1,181 | 22,194 |
| Heritage Insurance Holdings, Inc. | 9,060 | 128,471 |
| Legal & General Group PLC | 11,299 | 33,509 |
| Maiden Holdings Ltd. | 7,580 | 134,545 |
| NN Group NV | 4,797 | 169,890 |
| Swiss Re AG | 1,543 | 144,191 |
| Universal Insurance Holdings, Inc. | 6,617 | 173,035 |
| Total | | 1,289,829 |
| Mortgage Real Estate Investment Trusts (REITS) —% |
| CYS Investments, Inc. | 20,300 | 153,671 |
| Invesco Mortgage Capital, Inc. | 5,500 | 80,135 |
| Redwood Trust, Inc. | 2,750 | 42,625 |
| Total | | 276,431 |
| Thrifts & Mortgage Finance 0.1% |
| BofI Holding, Inc.(b) | 6,385 | 188,358 |
| Essent Group Ltd.(b) | 5,950 | 205,691 |
| Flagstar Bancorp, Inc.(b) | 5,700 | 146,889 |
| HomeStreet, Inc.(b) | 5,030 | 131,786 |
| Meta Financial Group, Inc. | 440 | 38,654 |
| MGIC Investment Corp.(b) | 20,500 | 218,325 |
| Radian Group, Inc.(b) | 12,100 | 222,640 |
| Walker & Dunlop, Inc.(b) | 5,700 | 179,037 |
| Washington Federal, Inc. | 6,175 | 202,849 |
| Total | | 1,534,229 |
| Total Financials | 6,221,672 |
| Common Stocks (continued) |
| Issuer | Shares | Value ($) |
| Health Care 0.2% |
| Biotechnology 0.1% |
| Alder Biopharmaceuticals, Inc.(b) | 2,295 | 47,162 |
| ARIAD Pharmaceuticals, Inc.(b) | 2,165 | 51,570 |
| Arrowhead Pharmaceuticals, Inc.(b) | 10,705 | 20,768 |
| bluebird bio, Inc.(b) | 930 | 69,285 |
| Coherus Biosciences, Inc.(b) | 1,345 | 37,525 |
| Dynavax Technologies Corp.(b) | 3,695 | 15,150 |
| Halozyme Therapeutics, Inc.(b) | 3,220 | 37,191 |
| Insys Therapeutics, Inc.(b) | 4,715 | 48,282 |
| Keryx Biopharmaceuticals, Inc.(b) | 14,565 | 72,679 |
| Kite Pharma, Inc.(b) | 880 | 44,854 |
| Ligand Pharmaceuticals, Inc.(b) | 1,165 | 123,502 |
| PTC Therapeutics, Inc.(b) | 2,725 | 35,698 |
| Puma Biotechnology, Inc.(b) | 1,725 | 55,890 |
| Ra Pharmaceuticals, Inc.(b) | 2,033 | 32,406 |
| Sage Therapeutics, Inc.(b) | 895 | 42,942 |
| Shire PLC(b) | 651 | 36,245 |
| Spark Therapeutics, Inc.(b) | 1,635 | 103,103 |
| TESARO, Inc.(b) | 505 | 82,234 |
| Total | | 956,486 |
| Health Care Equipment & Supplies —% |
| Analogic Corp. | 690 | 53,579 |
| Angiodynamics, Inc.(b) | 7,500 | 120,712 |
| Halyard Health, Inc.(b) | 2,850 | 109,639 |
| Masimo Corp.(b) | 2,770 | 203,817 |
| Natus Medical, Inc.(b) | 800 | 31,240 |
| OraSure Technologies, Inc.(b) | 11,400 | 100,548 |
| Orthofix International NV(b) | 4,250 | 152,745 |
| Total | | 772,280 |
| Health Care Providers & Services —% |
| Chemed Corp. | 175 | 29,066 |
| Magellan Health, Inc.(b) | 2,185 | 163,766 |
| Molina Healthcare, Inc.(b) | 2,780 | 157,681 |
| Owens & Minor, Inc. | 3,675 | 131,859 |
| Sinopharm Group Co. Class H(b) | 3,600 | 16,452 |
| Triple-S Management Corp., Class B(b) | 5,585 | 106,729 |
| Total | | 605,553 |
The accompanying Notes to Financial Statements are an integral part of this statement.
| 42 | Columbia Capital Allocation Portfolios | Annual Report 2017 |
Portfolio of Investments (continued)
Columbia Capital Allocation Moderate Portfolio, January 31, 2017
| Common Stocks (continued) |
| Issuer | Shares | Value ($) |
| Life Sciences Tools & Services —% |
| INC Research Holdings, Inc. Class A(b) | 3,406 | 180,518 |
| Pra Health Sciences, Inc.(b) | 3,010 | 176,356 |
| Total | | 356,874 |
| Pharmaceuticals 0.1% |
| Aerie Pharmaceuticals, Inc.(b) | 2,515 | 110,409 |
| Astellas Pharma, Inc. | 700 | 9,395 |
| Bayer AG, Registered Shares | 218 | 24,215 |
| Daiichi Sankyo Co., Ltd. | 1,300 | 29,085 |
| GlaxoSmithKline PLC | 9,688 | 187,221 |
| Jounce Therapeutics, Inc.(b) | 2,606 | 43,207 |
| Novo Nordisk A/S, Class B | 2,603 | 93,487 |
| Roche Holding AG, Genusschein Shares(b) | 826 | 195,719 |
| Sanofi | 2,018 | 162,200 |
| Supernus Pharmaceuticals, Inc.(b) | 4,795 | 129,705 |
| Total | | 984,643 |
| Total Health Care | 3,675,836 |
| Industrials 0.3% |
| Aerospace & Defense —% |
| Curtiss-Wright Corp. | 2,050 | 201,023 |
| Air Freight & Logistics —% |
| Forward Air Corp. | 250 | 12,048 |
| Royal Mail PLC | 6,108 | 31,721 |
| Total | | 43,769 |
| Airlines —% |
| Deutsche Lufthansa AG, Registered Shares | 4,634 | 61,904 |
| Hawaiian Holdings, Inc.(b) | 3,615 | 184,184 |
| Japan Airlines Co., Ltd. | 3,900 | 124,188 |
| Qantas Airways Ltd. | 24,080 | 62,243 |
| Total | | 432,519 |
| Building Products 0.1% |
| Continental Building Product(b) | 6,465 | 150,311 |
| Gibraltar Industries, Inc.(b) | 4,000 | 175,600 |
| NCI Building Systems, Inc.(b) | 3,050 | 48,800 |
| Universal Forest Products, Inc. | 1,690 | 171,890 |
| Total | | 546,601 |
| Common Stocks (continued) |
| Issuer | Shares | Value ($) |
| Commercial Services & Supplies —% |
| ACCO Brands Corp.(b) | 7,600 | 96,900 |
| Brady Corp., Class A | 3,825 | 139,039 |
| Knoll, Inc. | 1,250 | 32,637 |
| Quad/Graphics, Inc. | 6,015 | 157,533 |
| Total | | 426,109 |
| Construction & Engineering 0.1% |
| ACS Actividades de Construccion y Servicios SA | 1,549 | 47,741 |
| Argan, Inc. | 2,260 | 166,675 |
| China Railway Construction Corp., Ltd., Class H(b) | 60,500 | 83,944 |
| Hyundai Development Co. | 320 | 12,041 |
| Leighton Holdings Ltd. | 2,143 | 55,780 |
| Shimizu Corp. | 6,000 | 55,148 |
| Skanska AB, Class B | 4,018 | 98,240 |
| Taisei Corp. | 20,000 | 142,072 |
| Total | | 661,641 |
| Electrical Equipment —% |
| EnerSys | 2,650 | 206,567 |
| Generac Holdings, Inc.(b) | 2,475 | 99,644 |
| Prysmian SpA(b) | 2,402 | 62,483 |
| Total | | 368,694 |
| Industrial Conglomerates —% |
| Hanwha Corp. | 2,289 | 69,462 |
| Siemens AG, Registered Shares | 690 | 89,257 |
| Total | | 158,719 |
| Machinery 0.1% |
| Astec Industries, Inc. | 740 | 51,785 |
| Energy Recovery, Inc.(b) | 14,300 | 146,432 |
| Global Brass & Copper Holdings, Inc.(b) | 4,500 | 149,175 |
| Greenbrier Companies, Inc. (The) | 4,100 | 179,375 |
| KONE OYJ, Class B | 185 | 8,364 |
| Mueller Industries, Inc. | 1,825 | 73,475 |
| Wabash National Corp.(b) | 10,930 | 192,914 |
| Total | | 801,520 |
| Professional Services —% |
| Huron Consulting Group, Inc.(b) | 3,400 | 154,020 |
| RPX Corp.(b) | 14,060 | 152,692 |
| Total | | 306,712 |
The accompanying Notes to Financial Statements are an integral part of this statement.
Columbia Capital Allocation Portfolios | Annual Report 2017
| 43 |
Portfolio of Investments (continued)
Columbia Capital Allocation Moderate Portfolio, January 31, 2017
| Common Stocks (continued) |
| Issuer | Shares | Value ($) |
| Road & Rail —% |
| ArcBest Corp. | 5,145 | 162,582 |
| Trading Companies & Distributors —% |
| Applied Industrial Technologies, Inc. | 3,220 | 194,649 |
| ITOCHU Corp. | 6,500 | 89,543 |
| Total | | 284,192 |
| Total Industrials | 4,394,081 |
| Information Technology 0.3% |
| Electronic Equipment, Instruments & Components 0.1% |
| Benchmark Electronics, Inc.(b) | 6,450 | 197,370 |
| Hon Hai Precision Industry Co., Ltd.(b) | 66,000 | 176,997 |
| Methode Electronics, Inc. | 2,700 | 113,535 |
| Rogers Corp.(b) | 2,100 | 167,895 |
| Sanmina Corp.(b) | 5,690 | 221,626 |
| Scansource, Inc.(b) | 2,900 | 114,695 |
| TTM Technologies, Inc.(b) | 11,300 | 167,579 |
| Vishay Intertechnology, Inc. | 10,300 | 170,980 |
| Total | | 1,330,677 |
| Internet Software & Services —% |
| Bankrate, Inc.(b) | 2,700 | 29,430 |
| EarthLink Holdings Corp. | 22,550 | 144,546 |
| j2 Global, Inc.(b) | 2,605 | 218,325 |
| Mixi, Inc. | 3,900 | 169,206 |
| RetailMeNot, Inc.(b) | 13,565 | 122,763 |
| Shutterstock, Inc.(b) | 725 | 39,005 |
| Total | | 723,275 |
| IT Services 0.1% |
| Cardtronics PLC, Class A(b) | 3,600 | 196,488 |
| Convergys Corp. | 4,900 | 121,618 |
| CSG Systems International, Inc. | 2,400 | 116,160 |
| EVERTEC, Inc. | 8,935 | 152,342 |
| Science Applications International Corp. | 510 | 41,524 |
| Sykes Enterprises, Inc.(b) | 1,175 | 32,818 |
| Travelport Worldwide Ltd. | 3,500 | 50,260 |
| Unisys Corp.(b) | 6,150 | 79,027 |
| Total | | 790,237 |
| Common Stocks (continued) |
| Issuer | Shares | Value ($) |
| Semiconductors & Semiconductor Equipment 0.1% |
| Amkor Technology, Inc.(b) | 14,870 | 139,927 |
| Diodes, Inc.(b) | 1,540 | 38,330 |
| Entegris, Inc.(b) | 9,385 | 175,969 |
| Semtech Corp.(b) | 5,400 | 177,930 |
| Synaptics, Inc.(b) | 3,035 | 171,113 |
| Xcerra Corp.(b) | 11,605 | 87,966 |
| Total | | 791,235 |
| Software —% |
| Aspen Technology, Inc.(b) | 3,370 | 178,981 |
| Barracuda Networks, Inc.(b) | 2,350 | 55,202 |
| CommVault Systems, Inc.(b) | 3,075 | 150,982 |
| Mentor Graphics Corp. | 1,580 | 58,318 |
| Oracle Corp. Japan | 1,900 | 106,458 |
| Progress Software Corp.(b) | 2,275 | 63,745 |
| Qualys, Inc.(b) | 2,250 | 80,775 |
| VASCO Data Security International, Inc.(b) | 2,900 | 44,080 |
| Total | | 738,541 |
| Technology Hardware, Storage & Peripherals —% |
| Foxconn Technology Co., Ltd. | 49,490 | 139,678 |
| Inventec Co., Ltd. | 46,000 | 34,596 |
| Pegatron Corp. | 42,000 | 101,140 |
| Samsung Electronics Co., Ltd. | 37 | 62,929 |
| Seiko Epson Corp. | 2,600 | 53,563 |
| Total | | 391,906 |
| Total Information Technology | 4,765,871 |
| Materials 0.1% |
| Chemicals 0.1% |
| Ferro Corp.(b) | 10,400 | 147,056 |
| Hyosung Corp.(b) | 96 | 11,191 |
| Innospec, Inc. | 2,835 | 202,277 |
| Mitsubishi Chemical Holdings Corp. | 15,600 | 108,809 |
| Rayonier Advanced Materials, Inc. | 11,550 | 156,734 |
| Sinopec Shanghai Petrochemical Co., Ltd. | 126,000 | 78,021 |
| Trinseo SA | 3,125 | 202,344 |
| Total | | 906,432 |
| Containers & Packaging —% |
| Greif, Inc., Class A | 2,825 | 162,663 |
The accompanying Notes to Financial Statements are an integral part of this statement.
| 44 | Columbia Capital Allocation Portfolios | Annual Report 2017 |
Portfolio of Investments (continued)
Columbia Capital Allocation Moderate Portfolio, January 31, 2017
| Common Stocks (continued) |
| Issuer | Shares | Value ($) |
| Metals & Mining —% |
| AngloGold Ashanti Ltd.(b) | 1,302 | 16,415 |
| Eregli Demir ve Celik Fabrikalari TAS | 62,757 | 96,635 |
| Fortescue Metals Group Ltd. | 25,605 | 129,569 |
| Materion Corp. | 1,525 | 59,933 |
| Rio Tinto PLC | 4,535 | 200,914 |
| Schnitzer Steel Industries, Inc., Class A | 6,150 | 145,447 |
| Sibanye Gold Ltd. | 8,052 | 18,094 |
| Total | | 667,007 |
| Paper & Forest Products —% |
| UPM-Kymmene OYJ | 6,423 | 145,673 |
| Total Materials | 1,881,775 |
| Real Estate 0.1% |
| Equity Real Estate Investment Trusts (REITS) 0.1% |
| Ashford Hospitality Prime, Inc. | 2,200 | 29,568 |
| CBL & Associates Properties, Inc. | 15,100 | 163,835 |
| CorEnergy Infrastructure Trust, Inc. | 2,741 | 98,402 |
| DuPont Fabros Technology, Inc. | 1,375 | 65,285 |
| Government Properties Income Trust | 1,700 | 32,742 |
| LaSalle Hotel Properties | 2,975 | 89,756 |
| Lexington Realty Trust | 16,800 | 180,096 |
| PS Business Parks, Inc. | 1,528 | 171,197 |
| Ramco-Gershenson Properties Trust | 1,700 | 27,642 |
| RLJ Lodging Trust | 2,500 | 58,025 |
| Ryman Hospitality Properties, Inc. | 2,660 | 162,739 |
| Sabra Health Care REIT, Inc. | 900 | 22,860 |
| Select Income REIT | 6,100 | 152,561 |
| STAG Industrial, Inc. | 1,750 | 40,495 |
| Summit Hotel Properties, Inc. | 11,800 | 186,794 |
| Washington Prime Group, Inc. | 16,900 | 163,085 |
| Xenia Hotels & Resorts, Inc. | 1,350 | 24,772 |
| Total | | 1,669,854 |
| Real Estate Management & Development —% |
| China Vanke Co., Ltd., Class H | 15,800 | 40,081 |
| Guangzhou R&F Properties Co., Ltd., Class H | 103,200 | 132,364 |
| Wheelock & Co., Ltd. | 17,227 | 104,704 |
| Total | | 277,149 |
| Total Real Estate | 1,947,003 |
| Common Stocks (continued) |
| Issuer | Shares | Value ($) |
| Telecommunication Services —% |
| Diversified Telecommunication Services —% |
| China Communications Services Corp., Ltd., Class H | 32,000 | 21,753 |
| General Communication, Inc., Class A(b) | 7,210 | 145,065 |
| Nippon Telegraph & Telephone Corp. | 3,400 | 150,186 |
| Telenor ASA | 7,406 | 117,267 |
| Windstream Holdings, Inc. | 11,600 | 93,728 |
| Total | | 527,999 |
| Wireless Telecommunication Services —% |
| Global Telecom Holding SAE(b) | 254,111 | 94,940 |
| NTT DoCoMo, Inc. | 2,700 | 64,557 |
| Total | | 159,497 |
| Total Telecommunication Services | 687,496 |
| Utilities 0.1% |
| Electric Utilities —% |
| IDACORP, Inc. | 50 | 4,001 |
| Korea Electric Power Corp. | 3,079 | 112,762 |
| Portland General Electric Co. | 110 | 4,797 |
| Transmissora Alianca de Energia Eletrica SA | 9,039 | 61,559 |
| Total | | 183,119 |
| Gas Utilities 0.1% |
| Chesapeake Utilities Corp. | 2,050 | 134,070 |
| Northwest Natural Gas Co. | 1,720 | 101,308 |
| Southwest Gas Corp. | 2,525 | 203,439 |
| Total | | 438,817 |
| Independent Power and Renewable Electricity Producers —% |
| Ormat Technologies, Inc. | 2,475 | 132,908 |
| Multi-Utilities —% |
| E.ON SE | 17,498 | 134,789 |
| Water Utilities —% |
| SJW Corp. | 3,225 | 161,572 |
| Total Utilities | 1,051,205 |
Total Common Stocks
(Cost $28,006,902) | 31,274,307 |
|
The accompanying Notes to Financial Statements are an integral part of this statement.
Columbia Capital Allocation Portfolios | Annual Report 2017
| 45 |
Portfolio of Investments (continued)
Columbia Capital Allocation Moderate Portfolio, January 31, 2017
| Equity Funds 43.1% |
| | Shares | Value ($) |
| International 12.2% |
| Columbia Emerging Markets Fund, Class I Shares(a),(b) | 4,286,289 | 43,205,796 |
| Columbia European Equity Fund, Class I Shares(a) | 8,065,814 | 49,040,146 |
| Columbia Overseas Value Fund, Class I Shares(a) | 6,296,658 | 53,332,696 |
| Columbia Pacific/Asia Fund, Class I Shares(a) | 4,369,094 | 41,156,860 |
| Total | 186,735,498 |
| U.S. Large Cap 29.6% |
| Columbia Contrarian Core Fund, Class I Shares(a) | 3,326,676 | 76,180,873 |
| Columbia Disciplined Core Fund, Class I Shares(a) | 6,078,758 | 63,158,291 |
| Columbia Disciplined Growth Fund, Class I Shares(a) | 7,476,584 | 63,999,559 |
| Columbia Disciplined Value Fund, Class I Shares(a) | 9,648,447 | 94,458,297 |
| Columbia Large Cap Growth Fund, Class I Shares(a) | 597,790 | 21,341,113 |
| Columbia Select Large Cap Equity Fund, Class I Shares(a) | 4,848,903 | 60,853,736 |
| Columbia Select Large Cap Growth Fund, Class I Shares(a),(b) | 2,560,754 | 38,155,231 |
| Columbia Select Large-Cap Value Fund, Class I Shares(a) | 1,372,678 | 32,697,189 |
| Total | 450,844,289 |
| U.S. Small Cap 1.3% |
| Columbia Disciplined Small Core Fund, Class I Shares(a) | 2,144,006 | 20,475,262 |
Total Equity Funds
(Cost $599,137,201) | 658,055,049 |
|
| Fixed-Income Funds 42.4% |
| | |
| Emerging Markets 1.8% |
| Columbia Emerging Markets Bond Fund, Class I Shares(a) | 2,406,864 | 27,293,832 |
| High Yield 7.0% |
| Columbia High Yield Bond Fund, Class I Shares(a) | 2,607,520 | 7,640,034 |
| Columbia Income Opportunities Fund, Class I Shares(a) | 10,084,407 | 99,432,256 |
| Total | 107,072,290 |
| Inflation Protected Securities 1.0% |
| Columbia Inflation Protected Securities Fund, Class I Shares(a),(b) | 1,614,603 | 15,241,852 |
| Fixed-Income Funds (continued) |
| | Shares | Value ($) |
| Investment Grade 32.6% |
| Columbia Corporate Income Fund, Class I Shares(a) | 12,719,884 | 127,453,240 |
| Columbia Limited Duration Credit Fund, Class I Shares(a) | 3,496,211 | 34,332,796 |
| Columbia Mortgage Opportunities Fund, Class I Shares(a) | 2,631,105 | 25,916,382 |
| Columbia Total Return Bond Fund, Class I Shares(a) | 21,679,684 | 194,683,559 |
| Columbia U.S. Government Mortgage Fund, Class I Shares(a) | 12,503,810 | 67,395,536 |
| Columbia U.S. Treasury Index Fund, Class I Shares(a) | 4,273,125 | 46,918,916 |
| Total | 496,700,429 |
Total Fixed-Income Funds
(Cost $658,415,101) | 646,308,403 |
| Preferred Stocks —% |
| Issuer | Coupon
Rate | Shares | Value ($) |
| Consumer Discretionary —% |
| Auto Components —% |
| Schaeffler AG | — | 1,632 | 26,465 |
| Total Consumer Discretionary | 26,465 |
| Financials —% |
| Banks —% |
| Banco Bradesco SA(b) | — | 17,534 | 181,956 |
| Itau Unibanco Holding SA(b) | — | 1,478 | 17,467 |
| Total | | | 199,423 |
| Total Financials | 199,423 |
Total Preferred Stocks
(Cost $195,150) | 225,888 |
| Money Market Funds 6.1% |
| | Shares | Value ($) |
| Columbia Short-Term Cash Fund, 0.662%(a),(c) | 93,238,902 | 93,238,902 |
Total Money Market Funds
(Cost $93,239,039) | 93,238,902 |
Total Investments
(Cost: $1,472,320,794) | 1,520,316,369 |
| Other Assets & Liabilities, Net | | 5,550,739 |
| Net Assets | 1,525,867,108 |
At January 31, 2017, securities and/or cash totaling $8,125,565 were pledged as collateral.
The accompanying Notes to Financial Statements are an integral part of this statement.
| 46 | Columbia Capital Allocation Portfolios | Annual Report 2017 |
Portfolio of Investments (continued)
Columbia Capital Allocation Moderate Portfolio, January 31, 2017
Investments in derivatives
| Forward foreign currency exchange contracts open at January 31, 2017 |
| Counterparty | Exchange
date | Currency to
be delivered | Currency to
be received | Unrealized
appreciation ($) | Unrealized
depreciation ($) |
| BNP Paribas | 02/22/2017 | 449,000 BRL | 138,175 USD | — | (3,640) |
| BNP Paribas | 02/22/2017 | 949,000 CNY | 137,337 USD | — | (512) |
| BNP Paribas | 02/22/2017 | 1,592,000 EGP | 83,351 USD | — | (307) |
| BNP Paribas | 02/22/2017 | 204,075,000 KRW | 173,092 USD | — | (3,600) |
| BNP Paribas | 02/22/2017 | 621,000 NOK | 73,113 USD | — | (2,188) |
| BNP Paribas | 02/22/2017 | 1,555,000 SEK | 173,888 USD | — | (4,027) |
| BNP Paribas | 02/22/2017 | 3,568,000 THB | 100,592 USD | — | (725) |
| BNP Paribas | 02/22/2017 | 175,000 TRY | 45,735 USD | — | (408) |
| BNP Paribas | 02/22/2017 | 5,792,000 TWD | 182,713 USD | — | (2,998) |
| BNP Paribas | 02/22/2017 | 182,291 USD | 243,000 AUD | 1,917 | — |
| BNP Paribas | 02/22/2017 | 209,756 USD | 211,000 CHF | 3,669 | — |
| BNP Paribas | 02/22/2017 | 37,485 USD | 35,000 EUR | 323 | — |
| BNP Paribas | 02/22/2017 | 201,109 USD | 164,000 GBP | 5,270 | — |
| BNP Paribas | 02/22/2017 | 54,854 USD | 736,419,000 IDR | 231 | — |
| BNP Paribas | 02/22/2017 | 36,598 USD | 140,000 ILS | 559 | — |
| BNP Paribas | 02/22/2017 | 174,190 USD | 11,932,000 INR | 1,924 | — |
| BNP Paribas | 02/22/2017 | 81,134 USD | 9,295,000 JPY | 1,230 | — |
| BNP Paribas | 02/22/2017 | 76,238 USD | 1,599,000 MXN | 236 | — |
| BNP Paribas | 02/22/2017 | 54,850 USD | 246,000 MYR | 621 | — |
| BNP Paribas | 02/22/2017 | 82,538 USD | 118,000 SGD | 1,203 | — |
| BNP Paribas | 02/22/2017 | 36,460 USD | 501,000 ZAR | 598 | — |
| Total | | | | 17,781 | (18,405) |
Futures contracts outstanding at January 31, 2017
| Long futures contracts outstanding |
| Contract description | Number of
contracts | Trading
currency | Notional market
value ($) | Expiration date | Unrealized
appreciation ($) | Unrealized
depreciation ($) |
| Mini MSCI EAFE Index | 270 | USD | 23,333,400 | 03/2017 | 257,106 | — |
| Mini MSCI Emerging Markets Index | 193 | USD | 8,830,715 | 03/2017 | 350,774 | — |
| Russell 2000 Mini | 3 | USD | 203,925 | 03/2017 | — | (4,160) |
| S&P 500 E-mini | 573 | USD | 65,164,425 | 03/2017 | 549,408 | — |
| S&P Mid 400 E-mini | 91 | USD | 15,338,050 | 03/2017 | — | (49,365) |
| TOPIX Index | 109 | JPY | 14,644,673 | 03/2017 | — | (243,289) |
| U.S. Long Bond | 6 | USD | 905,062 | 03/2017 | — | (5,956) |
| U.S. Treasury 10-Year Note | 445 | USD | 55,388,594 | 03/2017 | — | (191,988) |
| U.S. Treasury 5-Year Note | 243 | USD | 28,641,727 | 03/2017 | — | (87,766) |
| Total | | | 212,450,571 | | 1,157,288 | (582,524) |
| Short futures contracts outstanding |
| Contract description | Number of
contracts | Trading
currency | Notional market
value ($) | Expiration date | Unrealized
appreciation ($) | Unrealized
depreciation ($) |
| EURO STOXX 50 | (242) | EUR | (8,448,467) | 03/2017 | — | (115,924) |
| FTSE 100 Index | (90) | GBP | (7,976,911) | 03/2017 | — | (249,389) |
| U.S. Ultra Bond | (60) | USD | (9,641,250) | 03/2017 | 78,630 | — |
| Total | | | (26,066,628) | | 78,630 | (365,313) |
The accompanying Notes to Financial Statements are an integral part of this statement.
Columbia Capital Allocation Portfolios | Annual Report 2017
| 47 |
Portfolio of Investments (continued)
Columbia Capital Allocation Moderate Portfolio, January 31, 2017
Cleared credit default swap contracts outstanding at January 31, 2017
| Buy protection |
| Counterparty | Reference
entity | Expiration
date | Pay fixed
rate (%) | Notional
currency | Notional
amount ($) | Unrealized
appreciation ($) | Unrealized
depreciation ($) |
| Morgan Stanley | Markit CDX North America High Yield Index, Series 26 | 06/20/2021 | 5.000 | USD | 7,671,000 | — | (392,371) |
| Morgan Stanley | Markit CDX North America Investment Grade Index, Series 27 | 12/20/2021 | 1.000 | USD | 9,250,000 | — | (30,065) |
| Total | | | | | | — | (422,436) |
Credit default swap contracts outstanding at January 31, 2017
| Sell protection |
| Counterparty | Reference
entity | Expiration
date | Receive
fixed
rate
(%) | Implied
credit
spread
(%) | Notional
currency | Notional
amount
($) | Market
value
($) | Periodic
payments
receivable
(payable)
($) | Premium
paid
($) | Premium
received
($) | Unrealized
appreciation
($) | Unrealized
depreciation
($) |
| Barclays | Markit CDX Emerging Markets Index, Series 26 | 12/20/21 | 1.000 | 2.372 | USD | (1,897,436) | (115,372) | 2,266 | — | (122,102) | 8,996 | — |
| Barclays | Markit CDX Emerging Markets Index, Series 26 | 12/20/21 | 1.000 | 2.372 | USD | (3,794,872) | (230,745) | 4,533 | — | (246,046) | 19,834 | — |
| Barclays | Markit CDX Emerging Markets Index, Series 26 | 12/20/21 | 1.000 | 2.372 | USD | (3,557,692) | (216,323) | 4,250 | — | (232,049) | 19,976 | — |
| Total | | | | | | | | | — | (600,197) | 48,806 | — |
Notes to Portfolio of Investments
| (a) | As defined in the Investment Company Act of 1940, an affiliated company is one in which the Fund owns 5% or more of the company’s outstanding voting securities, or a company which is under common ownership or control with the Fund. Holdings and transactions in these affiliated companies during the year ended January 31, 2017 are as follows: |
| Issuer | Beginning
shares | Shares
purchased | Shares
sold | Ending
shares | Capital gain
distributions ($) | Realized gain
(loss) ($) | Dividends —
affiliated
issuers ($) | Value ($) |
| Columbia Absolute Return Currency and Income Fund, Class I Shares | 846,712 | 30,818 | (49,103) | 828,427 | 252,197 | 42,674 | — | 9,145,828 |
| Columbia Alternative Beta Fund, Class I Shares | 455,212 | 2,889 | — | 458,101 | — | — | 26,120 | 4,173,302 |
| Columbia Commodity Strategy Fund, Class I Shares | — | 3,981,554 | (2,901) | 3,978,653 | — | (942) | — | 22,479,391 |
| Columbia Contrarian Core Fund, Class I Shares | 3,863,495 | 65,520 | (602,339) | 3,326,676 | 584,431 | 4,379,515 | 815,838 | 76,180,873 |
| Columbia Corporate Income Fund, Class I Shares | 13,371,007 | 419,340 | (1,070,463) | 12,719,884 | — | 29,798 | 3,995,670 | 127,453,240 |
| Columbia Disciplined Core Fund, Class I Shares | 6,793,919 | 111,264 | (826,425) | 6,078,758 | — | 4,303,516 | 1,039,770 | 63,158,291 |
| Columbia Disciplined Growth Fund, Class I Shares | 8,129,492 | 484,997 | (1,137,905) | 7,476,584 | 3,360,541 | 670,112 | 587,395 | 63,999,559 |
| Columbia Disciplined Small Core Fund, Class I Shares | 1,821,075 | 753,356 | (430,424) | 2,144,007 | 6,832,103 | (2,259,633) | 118,862 | 20,475,262 |
The accompanying Notes to Financial Statements are an integral part of this statement.
| 48 | Columbia Capital Allocation Portfolios | Annual Report 2017 |
Portfolio of Investments (continued)
Columbia Capital Allocation Moderate Portfolio, January 31, 2017
Notes to Portfolio of Investments (continued)
| Issuer | Beginning
shares | Shares
purchased | Shares
sold | Ending
shares | Capital gain
distributions ($) | Realized gain
(loss) ($) | Dividends —
affiliated
issuers ($) | Value ($) |
| Columbia Disciplined Value Fund, Class I Shares | 11,370,206 | 204,847 | (1,926,606) | 9,648,447 | — | 305,998 | 1,841,890 | 94,458,297 |
| Columbia Diversified Absolute Return Fund, Class I Shares | 3,161,367 | 3,406 | (994,802) | 2,169,971 | — | (430,569) | — | 20,571,329 |
| Columbia Emerging Markets Bond Fund, Class I Shares | 2,695,962 | 80,310 | (369,408) | 2,406,864 | — | (58,010) | 876,091 | 27,293,832 |
| Columbia Emerging Markets Fund, Class I Shares | 1,528,192 | 2,758,348 | (251) | 4,286,289 | — | (241) | — | 43,205,796 |
| Columbia European Equity Fund, Class I Shares | 10,372,672 | 285,032 | (2,591,890) | 8,065,814 | — | 1,820,221 | 1,316,570 | 49,040,146 |
| Columbia High Yield Bond Fund, Class I Shares | 2,770,111 | 142,686 | (305,277) | 2,607,520 | — | (26,928) | 407,261 | 7,640,034 |
| Columbia Income Opportunities Fund, Class I Shares | 12,420,039 | 558,808 | (2,894,440) | 10,084,407 | — | 886,240 | 5,351,322 | 99,432,256 |
| Columbia Inflation Protected Securities Fund, Class I Shares | 1,785,233 | 559 | (171,189) | 1,614,603 | — | (200,533) | — | 15,241,852 |
| Columbia Large Cap Growth Fund, Class I Shares | 674,233 | 14,571 | (91,014) | 597,790 | 284,566 | 1,446,429 | 126,259 | 21,341,113 |
| Columbia Limited Duration Credit Fund, Class I Shares | 3,633,330 | 88,926 | (226,045) | 3,496,211 | — | (52,247) | 758,467 | 34,332,796 |
| Columbia Mortgage Opportunities Fund, Class I Shares | 2,698,992 | 136,532 | (204,419) | 2,631,105 | 330,997 | (48,626) | 980,616 | 25,916,382 |
| Columbia Multi-Asset Income Fund, Class I Shares | 2,687,995 | 934,039 | — | 3,622,034 | — | — | 1,601,832 | 34,843,970 |
| Columbia Overseas Value Fund, Class I Shares | 8,386,559 | 167,553 | (2,257,454) | 6,296,658 | — | (2,038,695) | 1,172,011 | 53,332,696 |
| Columbia Pacific/Asia Fund, Class I Shares | 4,458,755 | 295,194 | (384,855) | 4,369,094 | 2,266,586 | 820,296 | 259,950 | 41,156,860 |
| Columbia Select Large Cap Equity Fund, Class I Shares | 5,657,911 | 125,861 | (934,869) | 4,848,903 | 624,705 | (1,583,232) | 805,812 | 60,853,736 |
| Columbia Select Large Cap Growth Fund, Class I Shares | 2,512,162 | 321,371 | (272,779) | 2,560,754 | 4,274,594 | 1,069,846 | — | 38,155,231 |
| Columbia Select Large-Cap Value Fund, Class I Shares | 1,602,773 | 115,914 | (346,009) | 1,372,678 | 2,224,838 | 3,207,271 | 468,663 | 32,697,189 |
| Columbia Select Smaller-Cap Value Fund, Class I Shares | 296,947 | — | (296,947) | — | — | (2,893,328) | — | — |
| Columbia Short-Term Cash Fund, 0.662% | 64,953,566 | 163,370,375 | (135,085,039) | 93,238,902 | — | 67 | 287,179 | 93,238,902 |
The accompanying Notes to Financial Statements are an integral part of this statement.
Columbia Capital Allocation Portfolios | Annual Report 2017
| 49 |
Portfolio of Investments (continued)
Columbia Capital Allocation Moderate Portfolio, January 31, 2017
Notes to Portfolio of Investments (continued)
| Issuer | Beginning
shares | Shares
purchased | Shares
sold | Ending
shares | Capital gain
distributions ($) | Realized gain
(loss) ($) | Dividends —
affiliated
issuers ($) | Value ($) |
| Columbia Small Cap Growth Fund I, Class I Shares | 272,768 | 4,382 | (277,150) | — | — | (210,266) | — | — |
| Columbia Total Return Bond Fund, Class I Shares | 21,757,049 | 1,041,634 | (1,118,999) | 21,679,684 | 3,000,517 | 471,980 | 5,713,860 | 194,683,559 |
| Columbia U.S. Government Mortgage Fund, Class I Shares | 18,285,464 | 565,903 | (6,347,557) | 12,503,810 | 465,749 | (847,313) | 2,367,395 | 67,395,536 |
| Columbia U.S. Treasury Index Fund, Class I Shares | 4,201,587 | 71,538 | — | 4,273,125 | 135,677 | — | 669,524 | 46,918,916 |
| Total | 223,464,785 | 177,137,527 | (161,216,559) | 239,385,753 | 24,637,501 | 8,803,400 | 31,588,357 | 1,488,816,174 |
| (b) | Non-income producing investment. |
| (c) | The rate shown is the seven-day current annualized yield at January 31, 2017. |
Currency Legend
| AUD | Australian Dollar |
| BRL | Brazilian Real |
| CHF | Swiss Franc |
| CNY | China Yuan Renminbi |
| EGP | Egyptian Pound |
| EUR | Euro |
| GBP | British Pound |
| IDR | Indonesian Rupiah |
| ILS | New Israeli Sheqel |
| INR | Indian Rupee |
| JPY | Japanese Yen |
| KRW | South Korean Won |
| MXN | Mexican Peso |
| MYR | Malaysian Ringgit |
| NOK | Norwegian Krone |
| SEK | Swedish Krona |
| SGD | Singapore Dollar |
| THB | Thailand Baht |
| TRY | Turkish Lira |
| TWD | New Taiwan Dollar |
| USD | US Dollar |
| ZAR | South African Rand |
Fair value measurements
The Fund categorizes its fair value measurements according to a three-level hierarchy that maximizes the use of observable inputs and minimizes the use of unobservable inputs by prioritizing that the most observable input be used when available. Observable inputs are those that market participants would use in pricing an investment based on market data obtained from sources independent of the reporting entity. Unobservable inputs are those that reflect the Fund’s assumptions about the information market participants would use in pricing an investment. An investment’s level within the fair value hierarchy is based on the lowest level of any input that is deemed significant to the asset’s or liability’s fair value measurement. The input levels are not necessarily an indication of the risk or liquidity associated with investments at that level. For example, certain U.S. government securities are generally high quality and liquid, however, they are reflected as Level 2 because the inputs used to determine fair value may not always be quoted prices in an active market.
Fair value inputs are summarized in the three broad levels listed below:
The accompanying Notes to Financial Statements are an integral part of this statement.
| 50 | Columbia Capital Allocation Portfolios | Annual Report 2017 |
Portfolio of Investments (continued)
Columbia Capital Allocation Moderate Portfolio, January 31, 2017
Fair value measurements (continued)
| • | Level 1 - Valuations based on quoted prices for investments in active markets that the Fund has the ability to access at the measurement date (including NAV for open-end mutual funds). Valuation adjustments are not applied to Level 1 investments. |
| • | Level 2 – Valuations based on other significant observable inputs (including quoted prices for similar securities, interest rates, prepayment speeds, credit risks, etc.). |
| • | Level 3 – Valuations based on significant unobservable inputs (including the Fund’s own assumptions and judgment in determining the fair value of investments). |
Inputs that are used in determining fair value of an investment may include price information, credit data, volatility statistics, and other factors. These inputs can be either observable or unobservable. The availability of observable inputs can vary between investments, and is affected by various factors such as the type of investment, and the volume and level of activity for that investment or similar investments in the marketplace. The inputs will be considered by the Investment Manager, along with any other relevant factors in the calculation of an investment’s fair value. The Fund uses prices and inputs that are current as of the measurement date, which may include periods of market dislocations. During these periods, the availability of prices and inputs may be reduced for many investments. This condition could cause an investment to be reclassified between the various levels within the hierarchy.
Foreign equity securities actively traded in markets where there is a significant delay in the local close relative to the New York Stock Exchange (NYSE) are classified as Level 2. The values of these securities may include an adjustment to reflect the impact of significant market movements following the close of local trading, as described in Note 2 to the financial statements – Security Valuation.
Certain investments that have been measured at fair value using the net asset value (NAV) per share (or its equivalent) are not categorized in the fair value hierarchy. The fair value amounts presented in the table are intended to reconcile the fair value hierarchy to the amounts presented in the Portfolio of Investments. The Columbia Short-Term Cash Fund seeks to provide shareholders with maximum current income consistent with liquidity and stability of principal. Columbia Short-Term Cash Fund prices its shares with a floating NAV and no longer seeks to maintain a stable NAV.
Investments falling into the Level 3 category are primarily supported by quoted prices from brokers and dealers participating in the market for those investments. However, these may be classified as Level 3 investments due to lack of market transparency and corroboration to support these quoted prices. Additionally, valuation models may be used as the pricing source for any remaining investments classified as Level 3. These models may rely on one or more significant unobservable inputs and/or significant assumptions by the Investment Manager. Inputs used in valuations may include, but are not limited to, financial statement analysis, capital account balances, discount rates and estimated cash flows, and comparable company data.
Under the direction of the Fund’s Board of Trustees (the Board), the Investment Manager’s Valuation Committee (the Committee) is responsible for overseeing the valuation procedures approved by the Board. The Committee consists of voting and non-voting members from various groups within the Investment Manager’s organization, including operations and accounting, trading and investments, compliance, risk management and legal.
The Committee meets at least monthly to review and approve valuation matters, which may include a description of specific valuation determinations, data regarding pricing information received from approved pricing vendors and brokers and the results of Board-approved valuation control policies and procedures (the Policies). The Policies address, among other things, instances when market quotations are or are not readily available, including recommendations of third party pricing vendors and a determination of appropriate pricing methodologies; events that require specific valuation determinations and assessment of fair value techniques; securities with a potential for stale pricing, including those that are illiquid, restricted, or in default; and the effectiveness of third party pricing vendors, including periodic reviews of vendors. The Committee meets more frequently, as needed, to discuss additional valuation matters, which may include the need to review back-testing results, review time-sensitive information or approve related valuation actions. The Committee reports to the Board, with members of the Committee meeting with the Board at each of its regularly scheduled meetings to discuss valuation matters and actions during the period, similar to those described earlier.
For investments categorized as Level 3, the Committee monitors information similar to that described above, which may include: (i) data specific to the issuer or comparable issuers, (ii) general market or specific sector news and (iii) quoted prices and specific or similar security transactions. The Committee considers this data and any changes from prior periods in order to assess the reasonableness of observable and unobservable inputs, any assumptions or internal models used to value those securities and changes in fair value. This data is also used to corroborate, when available, information received from approved pricing vendors and brokers. Various factors impact the frequency of monitoring this information (which may occur as often as daily). However, the Committee may determine that changes to inputs, assumptions and models are not required as a result of the monitoring procedures performed.
The following table is a summary of the inputs used to value the Fund’s investments at January 31, 2017:
| | Level 1
quoted prices
in active
markets for
identical
assets ($) | Level 2
other
significant
observable
inputs ($) | Level 3
significant
unobservable
inputs ($) | Investments
measured at
net asset
value ($) | Total ($) |
| Investments | | | | | |
| Alternative Investment Funds | 91,213,820 | — | — | — | 91,213,820 |
| Common Stocks | | | | | |
| Consumer Discretionary | 2,840,710 | 943,554 | — | — | 3,784,264 |
| Consumer Staples | 804,859 | 670,247 | — | — | 1,475,106 |
| Energy | 732,157 | 657,841 | — | — | 1,389,998 |
| Financials | 4,803,600 | 1,418,072 | — | — | 6,221,672 |
| Health Care | 2,921,817 | 754,019 | — | — | 3,675,836 |
| Industrials | 3,299,950 | 1,094,131 | — | — | 4,394,081 |
| Information Technology | 3,921,304 | 844,567 | — | — | 4,765,871 |
| Materials | 1,076,454 | 805,321 | — | — | 1,881,775 |
| Real Estate | 1,669,854 | 277,149 | — | — | 1,947,003 |
The accompanying Notes to Financial Statements are an integral part of this statement.
Columbia Capital Allocation Portfolios | Annual Report 2017
| 51 |
Portfolio of Investments (continued)
Columbia Capital Allocation Moderate Portfolio, January 31, 2017
Fair value measurements (continued)
| | Level 1
quoted prices
in active
markets for
identical
assets ($) | Level 2
other
significant
observable
inputs ($) | Level 3
significant
unobservable
inputs ($) | Investments
measured at
net asset
value ($) | Total ($) |
| Telecommunication Services | 238,793 | 448,703 | — | — | 687,496 |
| Utilities | 803,654 | 247,551 | — | — | 1,051,205 |
| Total Common Stocks | 23,113,152 | 8,161,155 | — | — | 31,274,307 |
| Equity Funds | 658,055,049 | — | — | — | 658,055,049 |
| Fixed-Income Funds | 646,308,403 | — | — | — | 646,308,403 |
| Preferred Stocks | | | | | |
| Consumer Discretionary | — | 26,465 | — | — | 26,465 |
| Financials | 199,423 | — | — | — | 199,423 |
| Total Preferred Stocks | 199,423 | 26,465 | — | — | 225,888 |
| Money Market Funds | — | — | — | 93,238,902 | 93,238,902 |
| Total Investments | 1,418,889,847 | 8,187,620 | — | 93,238,902 | 1,520,316,369 |
| Derivatives | | | | | |
| Asset | | | | | |
| Forward Foreign Currency Exchange Contracts | — | 17,781 | — | — | 17,781 |
| Futures Contracts | 1,235,918 | — | — | — | 1,235,918 |
| Swap Contracts | — | 48,806 | — | — | 48,806 |
| Liability | | | | | |
| Forward Foreign Currency Exchange Contracts | — | (18,405) | — | — | (18,405) |
| Futures Contracts | (947,837) | — | — | — | (947,837) |
| Swap Contracts | — | (422,436) | — | — | (422,436) |
| Total | 1,419,177,928 | 7,813,366 | — | 93,238,902 | 1,520,230,196 |
See the Portfolio of Investments for all investment classifications not indicated in the table.
The Fund’s assets assigned to the Level 2 input category are generally valued using the market approach, in which a security’s value is determined through reference to prices and information from market transactions for similar or identical assets. These assets include certain foreign securities for which a third party statistical pricing service may be employed for purposes of fair market valuation. The model utilized by such third party statistical pricing service takes into account a security’s correlation to available market data including, but not limited to, intraday index, ADR, and exchange-traded fund movements.
Derivative instruments are valued at unrealized appreciation (depreciation).
There were no transfers of financial assets between levels during the period.
The accompanying Notes to Financial Statements are an integral part of this statement.
| 52 | Columbia Capital Allocation Portfolios | Annual Report 2017 |
Portfolio of Investments
Columbia Capital Allocation Moderate Aggressive Portfolio, January 31, 2017
(Percentages represent value of investments compared to net assets)
| Alternative Investment Funds 5.9% |
| | Shares | Value ($) |
| Columbia Absolute Return Currency and Income Fund, Class I Shares(a),(b) | 1,144,206 | 12,632,030 |
| Columbia Alternative Beta Fund, Class I Shares(a) | 458,101 | 4,173,302 |
| Columbia Commodity Strategy Fund, Class I Shares(a) | 6,297,489 | 35,580,812 |
| Columbia Diversified Absolute Return Fund, Class I Shares(a),(b) | 2,730,823 | 25,888,203 |
| Columbia Multi-Asset Income Fund, Class I Shares(a) | 4,910,534 | 47,239,338 |
Total Alternative Investment Funds
(Cost $128,314,519) | 125,513,685 |
|
| Common Stocks 1.5% |
| Issuer | Shares | Value ($) |
| Consumer Discretionary 0.2% |
| Auto Components —% |
| Cooper Tire & Rubber Co. | 3,200 | 116,000 |
| Cooper-Standard Holding, Inc.(b) | 1,140 | 120,019 |
| Dana, Inc. | 3,295 | 66,362 |
| Drew Industries, Inc. | 1,920 | 210,720 |
| Hyundai Mobis Co., Ltd. | 225 | 46,808 |
| Magna International, Inc.(b) | 678 | 29,329 |
| Superior Industries International, Inc. | 4,400 | 101,420 |
| Total | | 690,658 |
| Automobiles —% |
| Fuji Heavy Industries Ltd. | 2,800 | 112,045 |
| Peugeot SA(b) | 6,322 | 117,656 |
| Suzuki Motor Corp. | 2,800 | 108,060 |
| Total | | 337,761 |
| Diversified Consumer Services —% |
| Capella Education Co. | 2,321 | 198,445 |
| Hotels, Restaurants & Leisure 0.1% |
| Bloomin’ Brands, Inc. | 4,800 | 82,128 |
| Cheesecake Factory, Inc. (The) | 3,400 | 204,884 |
| Compass Group PLC | 2,894 | 51,505 |
| Denny’s Corp.(b) | 1,570 | 19,107 |
| Flight Centre Travel Group Ltd. | 1,599 | 36,356 |
| InterContinental Hotels Group PLC | 541 | 25,122 |
| Isle of Capri Casinos, Inc.(b) | 4,430 | 105,478 |
| Papa John’s International, Inc. | 1,130 | 96,299 |
| Common Stocks (continued) |
| Issuer | Shares | Value ($) |
| Pinnacle Entertainment, Inc.(b) | 600 | 9,240 |
| Ruth’s Hospitality Group, Inc. | 9,005 | 154,436 |
| Total | | 784,555 |
| Household Durables —% |
| Arcelik AS | 2,722 | 16,491 |
| Electrolux AB, Class B | 3,921 | 104,264 |
| La-Z-Boy, Inc. | 4,925 | 140,855 |
| Persimmon PLC | 524 | 12,763 |
| Sony Corp. | 900 | 27,250 |
| Total | | 301,623 |
| Media —% |
| Gannett Co., Inc. | 14,700 | 141,414 |
| New York Times Co. (The), Class A | 13,520 | 182,520 |
| Total | | 323,934 |
| Multiline Retail —% |
| Big Lots, Inc. | 3,575 | 178,750 |
| Specialty Retail 0.1% |
| Aaron’s, Inc.(b) | 3,450 | 106,743 |
| Big 5 Sporting Goods Corp. | 6,650 | 102,410 |
| Children’s Place, Inc. (The) | 2,080 | 201,760 |
| Francesca’s Holdings Corp.(b) | 9,400 | 163,936 |
| Genesco, Inc.(b) | 1,750 | 105,350 |
| Pier 1 Imports, Inc. | 18,200 | 132,314 |
| Total | | 812,513 |
| Textiles, Apparel & Luxury Goods —% |
| Movado Group, Inc. | 6,225 | 169,009 |
| Total Consumer Discretionary | 3,797,248 |
| Consumer Staples 0.1% |
| Beverages —% |
| Ambev SA | 13,500 | 73,689 |
| Food & Staples Retailing —% |
| Alimentation Couche-Tard, Inc., Class B | 754 | 34,541 |
| Casino Guichard Perrachon SA | 190 | 10,245 |
| Jeronimo Martins SGPS SA | 4,195 | 71,003 |
| Koninklijke Ahold Delhaize NV(b) | 1,038 | 22,113 |
| Loblaw Companies Ltd. | 258 | 13,560 |
| Metro AG | 626 | 21,422 |
| SpartanNash Co. | 4,735 | 179,267 |
The accompanying Notes to Financial Statements are an integral part of this statement.
Columbia Capital Allocation Portfolios | Annual Report 2017
| 53 |
Portfolio of Investments (continued)
Columbia Capital Allocation Moderate Aggressive Portfolio, January 31, 2017
| Common Stocks (continued) |
| Issuer | Shares | Value ($) |
| SUPERVALU, Inc.(b) | 3,180 | 12,466 |
| Wm Morrison Supermarkets PLC | 4,483 | 13,365 |
| Total | | 377,982 |
| Food Products 0.1% |
| China Milk Products Group Ltd.(b),(c),(d) | 322,000 | 0 |
| Dean Foods Co. | 10,180 | 202,175 |
| Fresh Del Monte Produce, Inc. | 625 | 35,781 |
| Marine Harvest ASA | 755 | 13,346 |
| Sanderson Farms, Inc. | 2,235 | 203,385 |
| WH Group Ltd. | 133,000 | 101,019 |
| Total | | 555,706 |
| Household Products —% |
| Reckitt Benckiser Group PLC | 655 | 56,203 |
| Personal Products —% |
| Usana Health Sciences, Inc.(b) | 1,045 | 65,103 |
| Tobacco —% |
| British American Tobacco PLC | 873 | 53,888 |
| Imperial Brands PLC | 448 | 20,755 |
| Swedish Match AB | 2,575 | 83,834 |
| Total | | 158,477 |
| Total Consumer Staples | 1,287,160 |
| Energy 0.1% |
| Energy Equipment & Services —% |
| Archrock, Inc. | 6,800 | 99,280 |
| Atwood Oceanics, Inc.(b) | 15,140 | 184,102 |
| Seadrill Ltd.(b) | 51,300 | 95,931 |
| Total | | 379,313 |
| Oil, Gas & Consumable Fuels 0.1% |
| China Petroleum & Chemical Corp., Class H | 136,000 | 107,430 |
| ENI SpA | 341 | 5,243 |
| Idemitsu Kosan Co., Ltd. | 500 | 15,461 |
| Lukoil PJSC | 1,327 | 74,341 |
| MOL Hungarian Oil and Gas NyRt | 200 | 14,094 |
| PDC Energy, Inc.(b) | 2,690 | 198,899 |
| Polski Koncern Naftowy Orlen SA | 474 | 9,609 |
| PTT PCL, Foreign Registered Shares | 9,400 | 107,894 |
| Repsol SA | 1,637 | 24,263 |
| REX American Resources Corp.(b) | 2,107 | 174,944 |
| Common Stocks (continued) |
| Issuer | Shares | Value ($) |
| SK Innovation Co., Ltd. | 737 | 99,841 |
| Western Refining, Inc. | 1,700 | 59,517 |
| Total | | 891,536 |
| Total Energy | 1,270,849 |
| Financials 0.3% |
| Banks 0.1% |
| ABSA Group Ltd. | 575 | 6,777 |
| Banc of California, Inc. | 12,150 | 191,970 |
| Banco Latinoamericano de Comercio Exterior SA, Class E | 4,900 | 133,280 |
| Bank of China Ltd., Class H | 234,000 | 105,982 |
| Bank of Montreal(b) | 1,122 | 84,871 |
| Bank of Nova Scotia (The)(b) | 2,049 | 122,444 |
| BNP Paribas SA | 344 | 22,006 |
| BOC Hong Kong Holdings Ltd. | 3,000 | 11,994 |
| Canadian Imperial Bank of Commerce | 1,300 | 110,704 |
| Central Pacific Financial Corp. | 6,440 | 201,765 |
| China CITIC Bank Corp., Ltd., Class H | 49,000 | 32,228 |
| China Construction Bank Corp., Class H | 27,000 | 20,017 |
| Customers Bancorp, Inc.(b) | 5,140 | 177,124 |
| FCB Financial Holdings, Inc., Class A(b) | 3,950 | 185,452 |
| First BanCorp(b) | 8,250 | 55,440 |
| Fulton Financial Corp. | 1,800 | 32,760 |
| Hanmi Financial Corp. | 900 | 29,835 |
| Hilltop Holdings, Inc.(b) | 5,100 | 139,638 |
| HSBC Holdings PLC(b) | 12,264 | 104,623 |
| International Bancshares Corp. | 5,390 | 199,969 |
| Royal Bank of Canada | 275 | 19,773 |
| Societe Generale SA | 2,537 | 124,028 |
| Standard Bank Group Ltd. | 4,396 | 46,952 |
| Toronto-Dominion Bank (The)(b) | 300 | 15,541 |
| Wintrust Financial Corp. | 1,485 | 106,326 |
| Total | | 2,281,499 |
| Capital Markets —% |
| Arlington Asset Investment Corp., Class A | 11,190 | 167,514 |
| KCG Holdings, Inc., Class A(b) | 12,050 | 168,339 |
| Piper Jaffray Companies(b) | 2,475 | 174,487 |
| Total | | 510,340 |
The accompanying Notes to Financial Statements are an integral part of this statement.
| 54 | Columbia Capital Allocation Portfolios | Annual Report 2017 |
Portfolio of Investments (continued)
Columbia Capital Allocation Moderate Aggressive Portfolio, January 31, 2017
| Common Stocks (continued) |
| Issuer | Shares | Value ($) |
| Consumer Finance —% |
| Nelnet, Inc., Class A | 3,750 | 183,863 |
| Insurance 0.1% |
| Allianz SE, Registered Shares(b) | 774 | 131,552 |
| Ambac Financial Group, Inc.(b) | 4,300 | 89,956 |
| American Equity Investment Life Holding Co. | 1,678 | 39,601 |
| Assicurazioni Generali SpA | 4,829 | 77,057 |
| AXA SA | 1,913 | 47,016 |
| CNP Assurances | 823 | 15,467 |
| Heritage Insurance Holdings, Inc. | 10,020 | 142,084 |
| Legal & General Group PLC | 7,871 | 23,343 |
| Maiden Holdings Ltd. | 8,410 | 149,277 |
| NN Group NV | 3,345 | 118,466 |
| Swiss Re AG | 1,077 | 100,644 |
| Universal Insurance Holdings, Inc. | 7,348 | 192,150 |
| Total | | 1,126,613 |
| Mortgage Real Estate Investment Trusts (REITS) —% |
| CYS Investments, Inc. | 22,600 | 171,082 |
| Invesco Mortgage Capital, Inc. | 6,100 | 88,877 |
| Redwood Trust, Inc. | 3,100 | 48,050 |
| Total | | 308,009 |
| Thrifts & Mortgage Finance 0.1% |
| BofI Holding, Inc.(b) | 7,085 | 209,008 |
| Essent Group Ltd.(b) | 6,600 | 228,162 |
| Flagstar Bancorp, Inc.(b) | 6,350 | 163,640 |
| HomeStreet, Inc.(b) | 5,590 | 146,458 |
| Meta Financial Group, Inc. | 490 | 43,047 |
| MGIC Investment Corp.(b) | 22,790 | 242,713 |
| Radian Group, Inc.(b) | 13,440 | 247,296 |
| Walker & Dunlop, Inc.(b) | 6,240 | 195,998 |
| Washington Federal, Inc. | 6,850 | 225,022 |
| Total | | 1,701,344 |
| Total Financials | 6,111,668 |
| Common Stocks (continued) |
| Issuer | Shares | Value ($) |
| Health Care 0.2% |
| Biotechnology 0.1% |
| Alder Biopharmaceuticals, Inc.(b) | 2,550 | 52,402 |
| ARIAD Pharmaceuticals, Inc.(b) | 2,415 | 57,525 |
| Arrowhead Pharmaceuticals, Inc.(b) | 11,890 | 23,067 |
| bluebird bio, Inc.(b) | 1,085 | 80,832 |
| Coherus Biosciences, Inc.(b) | 1,495 | 41,711 |
| Dynavax Technologies Corp.(b) | 4,095 | 16,790 |
| Halozyme Therapeutics, Inc.(b) | 3,575 | 41,291 |
| Insys Therapeutics, Inc.(b) | 5,220 | 53,453 |
| Keryx Biopharmaceuticals, Inc.(b) | 16,175 | 80,713 |
| Kite Pharma, Inc.(b) | 975 | 49,696 |
| Ligand Pharmaceuticals, Inc.(b) | 1,295 | 137,283 |
| PTC Therapeutics, Inc.(b) | 3,025 | 39,628 |
| Puma Biotechnology, Inc.(b) | 1,915 | 62,046 |
| Ra Pharmaceuticals, Inc.(b) | 2,258 | 35,993 |
| Sage Therapeutics, Inc.(b) | 985 | 47,260 |
| Shire PLC(b) | 454 | 25,277 |
| Spark Therapeutics, Inc.(b) | 1,820 | 114,769 |
| TESARO, Inc.(b) | 560 | 91,190 |
| Total | | 1,050,926 |
| Health Care Equipment & Supplies 0.1% |
| Analogic Corp. | 770 | 59,791 |
| Angiodynamics, Inc.(b) | 8,300 | 133,588 |
| Halyard Health, Inc.(b) | 3,150 | 121,181 |
| Masimo Corp.(b) | 3,075 | 226,258 |
| Natus Medical, Inc.(b) | 875 | 34,169 |
| OraSure Technologies, Inc.(b) | 12,700 | 112,014 |
| Orthofix International NV(b) | 4,725 | 169,816 |
| Total | | 856,817 |
| Health Care Providers & Services —% |
| Chemed Corp. | 195 | 32,387 |
| Magellan Health, Inc.(b) | 2,425 | 181,754 |
| Molina Healthcare, Inc.(b) | 3,081 | 174,754 |
| Owens & Minor, Inc. | 4,075 | 146,211 |
| Sinopharm Group Co. Class H(b) | 2,400 | 10,968 |
| Triple-S Management Corp., Class B(b) | 6,170 | 117,909 |
| Total | | 663,983 |
The accompanying Notes to Financial Statements are an integral part of this statement.
Columbia Capital Allocation Portfolios | Annual Report 2017
| 55 |
Portfolio of Investments (continued)
Columbia Capital Allocation Moderate Aggressive Portfolio, January 31, 2017
| Common Stocks (continued) |
| Issuer | Shares | Value ($) |
| Life Sciences Tools & Services —% |
| INC Research Holdings, Inc. Class A(b) | 3,781 | 200,393 |
| Pra Health Sciences, Inc.(b) | 3,341 | 195,749 |
| Total | | 396,142 |
| Pharmaceuticals —% |
| Aerie Pharmaceuticals, Inc.(b) | 2,790 | 122,481 |
| Astellas Pharma, Inc. | 500 | 6,711 |
| Bayer AG, Registered Shares | 152 | 16,884 |
| Daiichi Sankyo Co., Ltd. | 900 | 20,136 |
| GlaxoSmithKline PLC | 6,755 | 130,540 |
| Jounce Therapeutics, Inc.(b) | 2,895 | 47,999 |
| Novo Nordisk A/S, Class B | 1,815 | 65,186 |
| Roche Holding AG, Genusschein Shares(b) | 576 | 136,482 |
| Sanofi | 1,406 | 113,010 |
| Supernus Pharmaceuticals, Inc.(b) | 5,320 | 143,906 |
| Total | | 803,335 |
| Total Health Care | 3,771,203 |
| Industrials 0.2% |
| Aerospace & Defense —% |
| Curtiss-Wright Corp. | 2,280 | 223,577 |
| Air Freight & Logistics —% |
| Forward Air Corp. | 275 | 13,252 |
| Royal Mail PLC | 4,259 | 22,119 |
| Total | | 35,371 |
| Airlines —% |
| Deutsche Lufthansa AG, Registered Shares | 3,231 | 43,162 |
| Hawaiian Holdings, Inc.(b) | 4,000 | 203,800 |
| Japan Airlines Co., Ltd. | 2,700 | 85,976 |
| Qantas Airways Ltd. | 16,782 | 43,379 |
| Total | | 376,317 |
| Building Products 0.1% |
| Continental Building Product(b) | 7,215 | 167,749 |
| Gibraltar Industries, Inc.(b) | 4,500 | 197,550 |
| NCI Building Systems, Inc.(b) | 3,350 | 53,600 |
| Universal Forest Products, Inc. | 1,875 | 190,706 |
| Total | | 609,605 |
| Common Stocks (continued) |
| Issuer | Shares | Value ($) |
| Commercial Services & Supplies —% |
| ACCO Brands Corp.(b) | 8,400 | 107,100 |
| Brady Corp., Class A | 4,225 | 153,579 |
| Knoll, Inc. | 1,350 | 35,249 |
| Quad/Graphics, Inc. | 6,650 | 174,163 |
| Total | | 470,091 |
| Construction & Engineering —% |
| ACS Actividades de Construccion y Servicios SA | 1,079 | 33,255 |
| Argan, Inc. | 2,500 | 184,375 |
| China Railway Construction Corp., Ltd., Class H(b) | 42,000 | 58,275 |
| Hyundai Development Co. | 223 | 8,391 |
| Leighton Holdings Ltd. | 1,494 | 38,887 |
| Shimizu Corp. | 4,000 | 36,766 |
| Skanska AB, Class B | 2,802 | 68,509 |
| Taisei Corp. | 14,000 | 99,450 |
| Total | | 527,908 |
| Electrical Equipment —% |
| EnerSys | 2,937 | 228,939 |
| Generac Holdings, Inc.(b) | 2,750 | 110,715 |
| Prysmian SpA(b) | 1,676 | 43,598 |
| Total | | 383,252 |
| Industrial Conglomerates —% |
| Hanwha Corp. | 1,595 | 48,402 |
| Siemens AG, Registered Shares | 481 | 62,221 |
| Total | | 110,623 |
| Machinery 0.1% |
| Astec Industries, Inc. | 825 | 57,734 |
| Energy Recovery, Inc.(b) | 15,900 | 162,816 |
| Global Brass & Copper Holdings, Inc.(b) | 5,000 | 165,750 |
| Greenbrier Companies, Inc. (The) | 4,550 | 199,062 |
| KONE OYJ, Class B | 129 | 5,832 |
| Mueller Industries, Inc. | 2,025 | 81,527 |
| Wabash National Corp.(b) | 12,130 | 214,094 |
| Total | | 886,815 |
| Professional Services —% |
| Huron Consulting Group, Inc.(b) | 3,755 | 170,102 |
| RPX Corp.(b) | 15,570 | 169,090 |
| Total | | 339,192 |
The accompanying Notes to Financial Statements are an integral part of this statement.
| 56 | Columbia Capital Allocation Portfolios | Annual Report 2017 |
Portfolio of Investments (continued)
Columbia Capital Allocation Moderate Aggressive Portfolio, January 31, 2017
| Common Stocks (continued) |
| Issuer | Shares | Value ($) |
| Road & Rail —% |
| ArcBest Corp. | 5,690 | 179,804 |
| Trading Companies & Distributors —% |
| Applied Industrial Technologies, Inc. | 3,580 | 216,411 |
| ITOCHU Corp. | 4,500 | 61,991 |
| Total | | 278,402 |
| Total Industrials | 4,420,957 |
| Information Technology 0.2% |
| Electronic Equipment, Instruments & Components 0.1% |
| Benchmark Electronics, Inc.(b) | 7,200 | 220,320 |
| Hon Hai Precision Industry Co., Ltd.(b) | 46,200 | 123,898 |
| Methode Electronics, Inc. | 3,000 | 126,150 |
| Rogers Corp.(b) | 2,330 | 186,284 |
| Sanmina Corp.(b) | 6,310 | 245,774 |
| Scansource, Inc.(b) | 3,225 | 127,549 |
| TTM Technologies, Inc.(b) | 12,500 | 185,375 |
| Vishay Intertechnology, Inc. | 11,500 | 190,900 |
| Total | | 1,406,250 |
| Internet Software & Services —% |
| Bankrate, Inc.(b) | 3,000 | 32,700 |
| EarthLink Holdings Corp. | 25,525 | 163,615 |
| j2 Global, Inc.(b) | 2,900 | 243,049 |
| Mixi, Inc. | 2,700 | 117,143 |
| RetailMeNot, Inc.(b) | 15,130 | 136,927 |
| Shutterstock, Inc.(b) | 800 | 43,040 |
| Total | | 736,474 |
| IT Services —% |
| Cardtronics PLC, Class A(b) | 4,050 | 221,049 |
| Convergys Corp. | 5,450 | 135,269 |
| CSG Systems International, Inc. | 2,650 | 128,260 |
| EVERTEC, Inc. | 9,923 | 169,187 |
| Science Applications International Corp. | 560 | 45,595 |
| Sykes Enterprises, Inc.(b) | 1,275 | 35,611 |
| Travelport Worldwide Ltd. | 3,900 | 56,004 |
| Unisys Corp.(b) | 6,800 | 87,380 |
| Total | | 878,355 |
| Common Stocks (continued) |
| Issuer | Shares | Value ($) |
| Semiconductors & Semiconductor Equipment 0.1% |
| Amkor Technology, Inc.(b) | 16,545 | 155,688 |
| Diodes, Inc.(b) | 1,685 | 41,940 |
| Entegris, Inc.(b) | 10,440 | 195,750 |
| Semtech Corp.(b) | 6,000 | 197,700 |
| Synaptics, Inc.(b) | 3,374 | 190,226 |
| Xcerra Corp.(b) | 12,871 | 97,562 |
| Total | | 878,866 |
| Software —% |
| Aspen Technology, Inc.(b) | 3,730 | 198,100 |
| Barracuda Networks, Inc.(b) | 2,600 | 61,074 |
| CommVault Systems, Inc.(b) | 3,425 | 168,167 |
| Mentor Graphics Corp. | 1,750 | 64,593 |
| Oracle Corp. Japan | 1,300 | 72,840 |
| Progress Software Corp.(b) | 2,500 | 70,050 |
| Qualys, Inc.(b) | 2,500 | 89,750 |
| VASCO Data Security International, Inc.(b) | 3,250 | 49,400 |
| Total | | 773,974 |
| Technology Hardware, Storage & Peripherals —% |
| Foxconn Technology Co., Ltd. | 34,340 | 96,919 |
| Inventec Co., Ltd. | 32,000 | 24,067 |
| Pegatron Corp. | 29,000 | 69,835 |
| Samsung Electronics Co., Ltd. | 26 | 44,220 |
| Seiko Epson Corp. | 1,800 | 37,082 |
| Total | | 272,123 |
| Total Information Technology | 4,946,042 |
| Materials 0.1% |
| Chemicals 0.1% |
| Ferro Corp.(b) | 11,500 | 162,610 |
| Hyosung Corp.(b) | 67 | 7,811 |
| Innospec, Inc. | 3,105 | 221,542 |
| Mitsubishi Chemical Holdings Corp. | 10,900 | 76,027 |
| Rayonier Advanced Materials, Inc. | 12,650 | 171,660 |
| Sinopec Shanghai Petrochemical Co., Ltd. | 88,000 | 54,491 |
| Trinseo SA | 3,370 | 218,207 |
| Total | | 912,348 |
| Containers & Packaging —% |
| Greif, Inc., Class A | 3,125 | 179,938 |
The accompanying Notes to Financial Statements are an integral part of this statement.
Columbia Capital Allocation Portfolios ���| Annual Report 2017
| 57 |
Portfolio of Investments (continued)
Columbia Capital Allocation Moderate Aggressive Portfolio, January 31, 2017
| Common Stocks (continued) |
| Issuer | Shares | Value ($) |
| Metals & Mining —% |
| AngloGold Ashanti Ltd.(b) | 908 | 11,448 |
| Eregli Demir ve Celik Fabrikalari TAS | 43,661 | 67,230 |
| Fortescue Metals Group Ltd. | 17,853 | 90,341 |
| Materion Corp. | 1,705 | 67,007 |
| Rio Tinto PLC | 3,162 | 140,086 |
| Schnitzer Steel Industries, Inc., Class A | 6,800 | 160,820 |
| Sibanye Gold Ltd. | 5,612 | 12,611 |
| Total | | 549,543 |
| Paper & Forest Products —% |
| UPM-Kymmene OYJ | 4,477 | 101,538 |
| Total Materials | 1,743,367 |
| Real Estate 0.1% |
| Equity Real Estate Investment Trusts (REITS) 0.1% |
| Ashford Hospitality Prime, Inc. | 2,450 | 32,928 |
| CBL & Associates Properties, Inc. | 16,800 | 182,280 |
| CorEnergy Infrastructure Trust, Inc. | 3,043 | 109,244 |
| DuPont Fabros Technology, Inc. | 1,550 | 73,594 |
| Government Properties Income Trust | 1,900 | 36,594 |
| LaSalle Hotel Properties | 3,300 | 99,561 |
| Lexington Realty Trust | 18,700 | 200,464 |
| PS Business Parks, Inc. | 1,696 | 190,020 |
| Ramco-Gershenson Properties Trust | 1,900 | 30,894 |
| RLJ Lodging Trust | 2,755 | 63,943 |
| Ryman Hospitality Properties, Inc. | 3,000 | 183,540 |
| Sabra Health Care REIT, Inc. | 1,000 | 25,400 |
| Select Income REIT | 6,800 | 170,068 |
| STAG Industrial, Inc. | 1,950 | 45,123 |
| Summit Hotel Properties, Inc. | 13,100 | 207,373 |
| Washington Prime Group, Inc. | 18,800 | 181,420 |
| Xenia Hotels & Resorts, Inc. | 1,500 | 27,525 |
| Total | | 1,859,971 |
| Real Estate Management & Development —% |
| China Vanke Co., Ltd., Class H | 11,000 | 27,904 |
| Guangzhou R&F Properties Co., Ltd., Class H | 72,000 | 92,347 |
| Wheelock & Co., Ltd. | 12,009 | 72,990 |
| Total | | 193,241 |
| Total Real Estate | 2,053,212 |
| Common Stocks (continued) |
| Issuer | Shares | Value ($) |
| Telecommunication Services —% |
| Diversified Telecommunication Services —% |
| China Communications Services Corp., Ltd., Class H | 22,000 | 14,955 |
| General Communication, Inc., Class A(b) | 7,990 | 160,759 |
| Nippon Telegraph & Telephone Corp. | 2,400 | 106,014 |
| Telenor ASA | 5,162 | 81,735 |
| Windstream Holdings, Inc. | 12,900 | 104,232 |
| Total | | 467,695 |
| Wireless Telecommunication Services —% |
| Global Telecom Holding SAE(b) | 177,180 | 66,197 |
| NTT DoCoMo, Inc. | 1,900 | 45,429 |
| Total | | 111,626 |
| Total Telecommunication Services | 579,321 |
| Utilities —% |
| Electric Utilities —% |
| IDACORP, Inc. | 60 | 4,801 |
| Korea Electric Power Corp. | 2,146 | 78,593 |
| Portland General Electric Co. | 120 | 5,233 |
| Transmissora Alianca de Energia Eletrica SA | 6,300 | 42,905 |
| Total | | 131,532 |
| Gas Utilities —% |
| Chesapeake Utilities Corp. | 2,275 | 148,785 |
| Northwest Natural Gas Co. | 1,915 | 112,794 |
| Southwest Gas Corp. | 2,800 | 225,596 |
| Total | | 487,175 |
| Independent Power and Renewable Electricity Producers —% |
| Ormat Technologies, Inc. | 2,750 | 147,675 |
| Multi-Utilities —% |
| E.ON SE | 12,202 | 93,993 |
| Water Utilities —% |
| SJW Corp. | 3,585 | 179,609 |
| Total Utilities | 1,039,984 |
Total Common Stocks
(Cost $27,891,763) | 31,021,011 |
|
The accompanying Notes to Financial Statements are an integral part of this statement.
| 58 | Columbia Capital Allocation Portfolios | Annual Report 2017 |
Portfolio of Investments (continued)
Columbia Capital Allocation Moderate Aggressive Portfolio, January 31, 2017
| Equity Funds 55.7% |
| | Shares | Value ($) |
| International 16.5% |
| Columbia Emerging Markets Fund, Class I Shares(a),(b) | 10,936,948 | 110,244,434 |
| Columbia European Equity Fund, Class I Shares(a) | 11,039,188 | 67,118,261 |
| Columbia Overseas Value Fund, Class I Shares(a) | 11,780,932 | 99,784,496 |
| Columbia Pacific/Asia Fund, Class I Shares(a) | 7,855,521 | 73,999,007 |
| Total | 351,146,198 |
| U.S. Large Cap 37.9% |
| Columbia Contrarian Core Fund, Class I Shares(a) | 5,538,551 | 126,832,827 |
| Columbia Disciplined Core Fund, Class I Shares(a) | 12,173,141 | 126,478,937 |
| Columbia Disciplined Growth Fund, Class I Shares(a) | 10,209,743 | 87,395,402 |
| Columbia Disciplined Value Fund, Class I Shares(a) | 17,188,273 | 168,273,193 |
| Columbia Large Cap Growth Fund, Class I Shares(a) | 1,775,975 | 63,402,290 |
| Columbia Select Large Cap Equity Fund, Class I Shares(a) | 7,525,844 | 94,449,340 |
| Columbia Select Large Cap Growth Fund, Class I Shares(a),(b) | 4,948,254 | 73,728,979 |
| Columbia Select Large-Cap Value Fund, Class I Shares(a) | 2,665,211 | 63,485,324 |
| Total | 804,046,292 |
| U.S. Small Cap 1.3% |
| Columbia Disciplined Small Core Fund, Class I Shares(a) | 1,093,755 | 10,445,362 |
| Columbia Select Smaller-Cap Value Fund, Class I Shares(a),(b) | 302,708 | 6,305,405 |
| Columbia Small Cap Growth Fund I, Class I Shares(a),(b) | 570,788 | 10,565,293 |
| Total | 27,316,060 |
Total Equity Funds
(Cost $1,076,993,342) | 1,182,508,550 |
|
| Fixed-Income Funds 24.5% |
| | |
| Emerging Markets 1.2% |
| Columbia Emerging Markets Bond Fund, Class I Shares(a) | 2,339,511 | 26,530,051 |
| High Yield 7.6% |
| Columbia High Yield Bond Fund, Class I Shares(a) | 20,742,021 | 60,774,121 |
| Columbia Income Opportunities Fund, Class I Shares(a) | 10,242,330 | 100,989,373 |
| Total | 161,763,494 |
| Fixed-Income Funds (continued) |
| | Shares | Value ($) |
| Inflation Protected Securities 0.5% |
| Columbia Inflation Protected Securities Fund, Class I Shares(a),(b) | 1,097,533 | 10,360,714 |
| Investment Grade 15.2% |
| Columbia Corporate Income Fund, Class I Shares(a) | 16,421,977 | 164,548,210 |
| Columbia Mortgage Opportunities Fund, Class I Shares(a) | 1,906,382 | 18,777,862 |
| Columbia U.S. Government Mortgage Fund, Class I Shares(a) | 22,484,505 | 121,191,484 |
| Columbia U.S. Treasury Index Fund, Class I Shares(a) | 1,573,968 | 17,282,165 |
| Total | 321,799,721 |
Total Fixed-Income Funds
(Cost $525,710,563) | 520,453,980 |
| Preferred Stocks —% |
| Issuer | Coupon
Rate | Shares | Value ($) |
| Consumer Discretionary —% |
| Auto Components —% |
| Schaeffler AG | — | 1,138 | 18,454 |
| Total Consumer Discretionary | 18,454 |
| Financials —% |
| Banks —% |
| Banco Bradesco SA(b) | — | 12,223 | 126,842 |
| Itau Unibanco Holding SA(b) | — | 1,031 | 12,184 |
| Total | | | 139,026 |
| Total Financials | 139,026 |
Total Preferred Stocks
(Cost $136,049) | 157,480 |
| Money Market Funds 11.8% |
| | Shares | Value ($) |
| Columbia Short-Term Cash Fund, 0.662%(a),(e) | 250,600,424 | 250,600,425 |
Total Money Market Funds
(Cost $250,600,603) | 250,600,425 |
Total Investments
(Cost: $2,009,646,839) | 2,110,255,131 |
| Other Assets & Liabilities, Net | | 11,831,117 |
| Net Assets | 2,122,086,248 |
At January 31, 2017, securities and/or cash totaling $14,931,030 were pledged as collateral.
The accompanying Notes to Financial Statements are an integral part of this statement.
Columbia Capital Allocation Portfolios | Annual Report 2017
| 59 |
Portfolio of Investments (continued)
Columbia Capital Allocation Moderate Aggressive Portfolio, January 31, 2017
Investments in derivatives
| Forward foreign currency exchange contracts open at January 31, 2017 |
| Counterparty | Exchange
date | Currency to
be delivered | Currency to
be received | Unrealized
appreciation ($) | Unrealized
depreciation ($) |
| Citi | 02/22/2017 | 313,000 BRL | 96,838 USD | — | (2,022) |
| Citi | 02/22/2017 | 662,000 CNY | 95,803 USD | — | (357) |
| Citi | 02/22/2017 | 1,111,000 EGP | 58,814 USD | 432 | — |
| Citi | 02/22/2017 | 142,332,000 KRW | 120,730 USD | — | (2,504) |
| Citi | 02/22/2017 | 433,000 NOK | 50,941 USD | — | (1,564) |
| Citi | 02/22/2017 | 1,085,000 SEK | 121,486 USD | — | (2,654) |
| Citi | 02/22/2017 | 2,489,000 THB | 70,155 USD | — | (523) |
| Citi | 02/22/2017 | 122,000 TRY | 31,878 USD | — | (290) |
| Citi | 02/22/2017 | 4,040,000 TWD | 127,766 USD | — | (1,769) |
| Citi | 02/22/2017 | 127,573 USD | 170,000 AUD | 1,298 | — |
| Citi | 02/22/2017 | 146,221 USD | 147,000 CHF | 2,469 | — |
| Citi | 02/22/2017 | 25,716 USD | 24,000 EUR | 210 | — |
| Citi | 02/22/2017 | 141,121 USD | 115,000 GBP | 3,595 | — |
| Citi | 02/22/2017 | 38,369 USD | 513,614,000 IDR | 50 | — |
| Citi | 02/22/2017 | 25,644 USD | 98,000 ILS | 365 | — |
| Citi | 02/22/2017 | 121,351 USD | 8,322,000 INR | 1,480 | — |
| Citi | 02/22/2017 | 56,535 USD | 6,482,000 JPY | 902 | — |
| Citi | 02/22/2017 | 53,261 USD | 1,116,000 MXN | 113 | — |
| Citi | 02/22/2017 | 38,460 USD | 172,000 MYR | 324 | — |
| Citi | 02/22/2017 | 57,419 USD | 82,000 SGD | 773 | — |
| Citi | 02/22/2017 | 25,436 USD | 349,000 ZAR | 379 | — |
| Total | | | | 12,390 | (11,683) |
Futures contracts outstanding at January 31, 2017
| Long futures contracts outstanding |
| Contract description | Number of
contracts | Trading
currency | Notional market
value ($) | Expiration date | Unrealized
appreciation ($) | Unrealized
depreciation ($) |
| Mini MSCI EAFE Index | 155 | USD | 13,395,100 | 03/2017 | 54,649 | — |
| Mini MSCI Emerging Markets Index | 269 | USD | 12,308,095 | 03/2017 | 488,902 | — |
| Russell 2000 Mini | 3 | USD | 203,925 | 03/2017 | — | (4,160) |
| Russell 2000 Mini | 421 | USD | 28,617,475 | 03/2017 | — | (573,259) |
| S&P 500 E-mini | 1,167 | USD | 132,717,075 | 03/2017 | 1,162,971 | — |
| S&P Mid 400 E-mini | 174 | USD | 29,327,700 | 03/2017 | — | (94,390) |
| TOPIX Index | 176 | JPY | 23,646,444 | 03/2017 | — | (392,833) |
| U.S. Long Bond | 217 | USD | 32,733,094 | 03/2017 | — | (215,424) |
| U.S. Treasury 10-Year Note | 13 | USD | 1,618,094 | 03/2017 | — | (5,609) |
| U.S. Treasury 5-Year Note | 610 | USD | 71,898,985 | 03/2017 | — | (220,317) |
| Total | | | 346,465,987 | | 1,706,522 | (1,505,992) |
| Short futures contracts outstanding |
| Contract description | Number of
contracts | Trading
currency | Notional market
value ($) | Expiration date | Unrealized
appreciation ($) | Unrealized
depreciation ($) |
| EURO STOXX 50 | (332) | EUR | (11,590,459) | 03/2017 | — | (159,035) |
| FTSE 100 Index | (124) | GBP | (10,990,410) | 03/2017 | — | (343,603) |
| U.S. Ultra Bond | (66) | USD | (10,605,375) | 03/2017 | 86,493 | — |
| Total | | | (33,186,244) | | 86,493 | (502,638) |
The accompanying Notes to Financial Statements are an integral part of this statement.
| 60 | Columbia Capital Allocation Portfolios | Annual Report 2017 |
Portfolio of Investments (continued)
Columbia Capital Allocation Moderate Aggressive Portfolio, January 31, 2017
Cleared credit default swap contracts outstanding at January 31, 2017
| Buy protection |
| Counterparty | Reference
entity | Expiration
date | Pay fixed
rate (%) | Notional
currency | Notional
amount ($) | Unrealized
appreciation ($) | Unrealized
depreciation ($) |
| Morgan Stanley | Markit CDX North America High Yield Index, Series 26 | 06/20/2021 | 5.000 | USD | 10,647,000 | — | (544,593) |
| Morgan Stanley | Markit CDX North America Investment Grade Index, Series 27 | 12/20/2021 | 1.000 | USD | 12,500,000 | — | (40,628) |
| Total | | | | | | — | (585,221) |
Credit default swap contracts outstanding at January 31, 2017
| Sell protection |
| Counterparty | Reference
entity | Expiration
date | Receive
fixed
rate
(%) | Implied
credit
spread
(%) | Notional
currency | Notional
amount
($) | Market
value
($) | Periodic
payments
receivable
(payable)
($) | Premium
paid
($) | Premium
received
($) | Unrealized
appreciation
($) | Unrealized
depreciation
($) |
| Barclays | Markit CDX Emerging Markets Index, Series 26 | 12/20/21 | 1.000 | 2.372 | USD | (4,769,231) | (289,990) | 5,697 | — | (306,905) | 22,612 | — |
| Barclays | Markit CDX Emerging Markets Index, Series 26 | 12/20/21 | 1.000 | 2.372 | USD | (9,538,461) | (579,979) | 11,393 | — | (618,439) | 49,853 | — |
| Barclays | Markit CDX Emerging Markets Index, Series 26 | 12/20/21 | 1.000 | 2.372 | USD | (8,942,308) | (543,731) | 10,681 | — | (583,259) | 50,209 | — |
| Total | | | | | | | | | — | (1,508,603) | 122,674 | — |
Notes to Portfolio of Investments
| (a) | As defined in the Investment Company Act of 1940, an affiliated company is one in which the Fund owns 5% or more of the company’s outstanding voting securities, or a company which is under common ownership or control with the Fund. Holdings and transactions in these affiliated companies during the year ended January 31, 2017 are as follows: |
| Issuer | Beginning
shares | Shares
purchased | Shares
sold | Ending
shares | Capital gain
distributions ($) | Realized gain
(loss) ($) | Dividends —
affiliated
issuers ($) | Value ($) |
| Columbia Absolute Return Currency and Income Fund, Class I Shares | 1,180,421 | 33,799 | (70,014) | 1,144,206 | 346,645 | 50,964 | — | 12,632,030 |
| Columbia Alternative Beta Fund, Class I Shares | 455,212 | 2,889 | — | 458,101 | — | — | 26,120 | 4,173,302 |
| Columbia Commodity Strategy Fund, Class I Shares | — | 6,310,938 | (13,449) | 6,297,489 | — | (3,025) | — | 35,580,812 |
| Columbia Contrarian Core Fund, Class I Shares | 6,550,052 | 103,570 | (1,115,071) | 5,538,551 | 987,035 | 8,627,736 | 1,377,855 | 126,832,827 |
| Columbia Corporate Income Fund, Class I Shares | 17,929,057 | 567,662 | (2,074,742) | 16,421,977 | — | 93,719 | 5,291,287 | 164,548,210 |
| Columbia Disciplined Core Fund, Class I Shares | 13,599,425 | 199,443 | (1,625,727) | 12,173,141 | — | 6,747,758 | 2,061,080 | 126,478,937 |
| Columbia Disciplined Growth Fund, Class I Shares | 11,052,283 | 633,998 | (1,476,538) | 10,209,743 | 4,551,518 | 526,214 | 795,568 | 87,395,402 |
| Columbia Disciplined Small Core Fund, Class I Shares | 936,359 | 371,829 | (214,433) | 1,093,755 | 3,427,740 | (1,089,083) | 59,634 | 10,445,362 |
The accompanying Notes to Financial Statements are an integral part of this statement.
Columbia Capital Allocation Portfolios | Annual Report 2017
| 61 |
Portfolio of Investments (continued)
Columbia Capital Allocation Moderate Aggressive Portfolio, January 31, 2017
Notes to Portfolio of Investments (continued)
| Issuer | Beginning
shares | Shares
purchased | Shares
sold | Ending
shares | Capital gain
distributions ($) | Realized gain
(loss) ($) | Dividends —
affiliated
issuers ($) | Value ($) |
| Columbia Disciplined Value Fund, Class I Shares | 20,187,972 | 332,362 | (3,332,061) | 17,188,273 | — | 61,446 | 3,257,791 | 168,273,193 |
| Columbia Diversified Absolute Return Fund, Class I Shares | 3,841,332 | 4,435 | (1,114,944) | 2,730,823 | — | (472,012) | — | 25,888,203 |
| Columbia Emerging Markets Bond Fund, Class I Shares | 2,650,301 | 83,908 | (394,698) | 2,339,511 | — | (118,154) | 859,282 | 26,530,051 |
| Columbia Emerging Markets Fund, Class I Shares | 6,820,687 | 4,212,260 | (95,999) | 10,936,948 | — | (91,529) | — | 110,244,434 |
| Columbia European Equity Fund, Class I Shares | 14,773,787 | 323,714 | (4,058,313) | 11,039,188 | — | 1,756,891 | 1,850,103 | 67,118,261 |
| Columbia High Yield Bond Fund, Class I Shares | 22,409,071 | 1,136,353 | (2,803,403) | 20,742,021 | — | 60,746 | 3,233,840 | 60,774,121 |
| Columbia Income Opportunities Fund, Class I Shares | 13,298,788 | 582,694 | (3,639,152) | 10,242,330 | — | 538,118 | 5,549,268 | 100,989,373 |
| Columbia Inflation Protected Securities Fund, Class I Shares | 1,221,538 | 2,384 | (126,389) | 1,097,533 | — | (15,617) | — | 10,360,714 |
| Columbia Large Cap Growth Fund, Class I Shares | 2,014,851 | 35,797 | (274,673) | 1,775,975 | 834,456 | 4,579,929 | 370,241 | 63,402,290 |
| Columbia Mortgage Opportunities Fund, Class I Shares | 1,981,065 | 99,652 | (174,335) | 1,906,382 | 236,689 | (40,533) | 707,713 | 18,777,862 |
| Columbia Multi-Advisor Small Cap Value Fund, Class I Shares | 2,374,784 | 2,636 | (2,377,420)* | — | — | 2,438,375 | — | — |
| Columbia Multi-Asset Income Fund, Class I Shares | 3,771,025 | 1,139,509 | — | 4,910,534 | — | — | 2,205,158 | 47,239,338 |
| Columbia Overseas Value Fund, Class I Shares | 13,720,887 | 271,865 | (2,211,820) | 11,780,932 | — | (272,997) | 2,183,645 | 99,784,496 |
| Columbia Pacific/Asia Fund, Class I Shares | 8,113,224 | 526,396 | (784,099) | 7,855,521 | 3,991,750 | 1,871,526 | 460,151 | 73,999,007 |
| Columbia Select Large Cap Equity Fund, Class I Shares | 8,762,886 | 182,218 | (1,419,260) | 7,525,844 | 960,073 | (2,103,974) | 1,237,440 | 94,449,340 |
| Columbia Select Large Cap Growth Fund, Class I Shares | 4,922,157 | 588,978 | (562,881) | 4,948,254 | 8,072,861 | 1,542,020 | — | 73,728,979 |
| Columbia Select Large-Cap Value Fund, Class I Shares | 3,249,854 | 218,835 | (803,478) | 2,665,211 | 4,312,175 | 7,793,975 | 908,361 | 63,485,324 |
| Columbia Select Smaller-Cap Value Fund, Class I Shares | 416,654 | 16,545 | (130,491) | 302,708 | 340,356 | (370,492) | — | 6,305,405 |
| Columbia Short-Term Cash Fund, 0.662% | 227,930,997 | 274,603,653 | (251,934,226) | 250,600,424 | — | 147 | 1,018,838 | 250,600,425 |
The accompanying Notes to Financial Statements are an integral part of this statement.
| 62 | Columbia Capital Allocation Portfolios | Annual Report 2017 |
Portfolio of Investments (continued)
Columbia Capital Allocation Moderate Aggressive Portfolio, January 31, 2017
Notes to Portfolio of Investments (continued)
| Issuer | Beginning
shares | Shares
purchased | Shares
sold | Ending
shares | Capital gain
distributions ($) | Realized gain
(loss) ($) | Dividends —
affiliated
issuers ($) | Value ($) |
| Columbia Small Cap Growth Fund I, Class I Shares | 615,713 | 48,156 | (93,081) | 570,788 | 857,586 | (848,850) | — | 10,565,293 |
| Columbia U.S. Government Mortgage Fund, Class I Shares | 28,038,937 | 866,815 | (6,421,247) | 22,484,505 | 701,033 | (634,434) | 3,610,190 | 121,191,484 |
| Columbia U.S. Treasury Index Fund, Class I Shares | 1,637,558 | 32,688 | (96,278) | 1,573,968 | 49,833 | (35,314) | 248,109 | 17,282,165 |
| Total | 444,456,877 | 293,535,981 | (289,438,222) | 448,554,636 | 29,669,750 | 30,593,550 | 37,311,674 | 2,079,076,640 |
| * | Includes the effect of underlying fund reorganization. |
| (b) | Non-income producing investment. |
| (c) | Represents fair value as determined in good faith under procedures approved by the Board of Trustees. At January 31, 2017, the value of these securities amounted to $0, which represents less than 0.01% of net assets. |
| (d) | Negligible market value. |
| (e) | The rate shown is the seven-day current annualized yield at January 31, 2017. |
Currency Legend
| AUD | Australian Dollar |
| BRL | Brazilian Real |
| CHF | Swiss Franc |
| CNY | China Yuan Renminbi |
| EGP | Egyptian Pound |
| EUR | Euro |
| GBP | British Pound |
| IDR | Indonesian Rupiah |
| ILS | New Israeli Sheqel |
| INR | Indian Rupee |
| JPY | Japanese Yen |
| KRW | South Korean Won |
| MXN | Mexican Peso |
| MYR | Malaysian Ringgit |
| NOK | Norwegian Krone |
| SEK | Swedish Krona |
| SGD | Singapore Dollar |
| THB | Thailand Baht |
| TRY | Turkish Lira |
| TWD | New Taiwan Dollar |
| USD | US Dollar |
| ZAR | South African Rand |
Fair value measurements
The Fund categorizes its fair value measurements according to a three-level hierarchy that maximizes the use of observable inputs and minimizes the use of unobservable inputs by prioritizing that the most observable input be used when available. Observable inputs are those that market participants would use in pricing an investment based on market data obtained from sources independent of the reporting entity. Unobservable inputs are those that reflect the Fund’s assumptions about the information market participants would use in
The accompanying Notes to Financial Statements are an integral part of this statement.
Columbia Capital Allocation Portfolios | Annual Report 2017
| 63 |
Portfolio of Investments (continued)
Columbia Capital Allocation Moderate Aggressive Portfolio, January 31, 2017
Fair value measurements (continued)
pricing an investment. An investment’s level within the fair value hierarchy is based on the lowest level of any input that is deemed significant to the asset’s or liability’s fair value measurement. The input levels are not necessarily an indication of the risk or liquidity associated with investments at that level. For example, certain U.S. government securities are generally high quality and liquid, however, they are reflected as Level 2 because the inputs used to determine fair value may not always be quoted prices in an active market.
Fair value inputs are summarized in the three broad levels listed below:
| • | Level 1 - Valuations based on quoted prices for investments in active markets that the Fund has the ability to access at the measurement date (including NAV for open-end mutual funds). Valuation adjustments are not applied to Level 1 investments. |
| • | Level 2 – Valuations based on other significant observable inputs (including quoted prices for similar securities, interest rates, prepayment speeds, credit risks, etc.). |
| • | Level 3 – Valuations based on significant unobservable inputs (including the Fund’s own assumptions and judgment in determining the fair value of investments). |
Inputs that are used in determining fair value of an investment may include price information, credit data, volatility statistics, and other factors. These inputs can be either observable or unobservable. The availability of observable inputs can vary between investments, and is affected by various factors such as the type of investment, and the volume and level of activity for that investment or similar investments in the marketplace. The inputs will be considered by the Investment Manager, along with any other relevant factors in the calculation of an investment’s fair value. The Fund uses prices and inputs that are current as of the measurement date, which may include periods of market dislocations. During these periods, the availability of prices and inputs may be reduced for many investments. This condition could cause an investment to be reclassified between the various levels within the hierarchy.
Foreign equity securities actively traded in markets where there is a significant delay in the local close relative to the New York Stock Exchange (NYSE) are classified as Level 2. The values of these securities may include an adjustment to reflect the impact of significant market movements following the close of local trading, as described in Note 2 to the financial statements — Security Valuation.
Certain investments that have been measured at fair value using the net asset value (NAV) per share (or its equivalent) are not categorized in the fair value hierarchy. The fair value amounts presented in the table are intended to reconcile the fair value hierarchy to the amounts presented in the Portfolio of Investments. The Columbia Short-Term Cash Fund seeks to provide shareholders with maximum current income consistent with liquidity and stability of principal. Columbia Short-Term Cash Fund prices its shares with a floating NAV and no longer seeks to maintain a stable NAV.
Investments falling into the Level 3 category are primarily supported by quoted prices from brokers and dealers participating in the market for those investments. However, these may be classified as Level 3 investments due to lack of market transparency and corroboration to support these quoted prices. Additionally, valuation models may be used as the pricing source for any remaining investments classified as Level 3. These models may rely on one or more significant unobservable inputs and/or significant assumptions by the Investment Manager. Inputs used in valuations may include, but are not limited to, financial statement analysis, capital account balances, discount rates and estimated cash flows, and comparable company data.
Under the direction of the Fund’s Board of Trustees (the Board), the Investment Manager’s Valuation Committee (the Committee) is responsible for overseeing the valuation procedures approved by the Board. The Committee consists of voting and non-voting members from various groups within the Investment Manager’s organization, including operations and accounting, trading and investments, compliance, risk management and legal.
The Committee meets at least monthly to review and approve valuation matters, which may include a description of specific valuation determinations, data regarding pricing information received from approved pricing vendors and brokers and the results of Board-approved valuation control policies and procedures (the Policies). The Policies address, among other things, instances when market quotations are or are not readily available, including recommendations of third party pricing vendors and a determination of appropriate pricing methodologies; events that require specific valuation determinations and assessment of fair value techniques; securities with a potential for stale pricing, including those that are illiquid, restricted, or in default; and the effectiveness of third party pricing vendors, including periodic reviews of vendors. The Committee meets more frequently, as needed, to discuss additional valuation matters, which may include the need to review back-testing results, review time-sensitive information or approve related valuation actions. The Committee reports to the Board, with members of the Committee meeting with the Board at each of its regularly scheduled meetings to discuss valuation matters and actions during the period, similar to those described earlier.
For investments categorized as Level 3, the Committee monitors information similar to that described above, which may include: (i) data specific to the issuer or comparable issuers, (ii) general market or specific sector news and (iii) quoted prices and specific or similar security transactions. The Committee considers this data and any changes from prior periods in order to assess the reasonableness of observable and unobservable inputs, any assumptions or internal models used to value those securities and changes in fair value. This data is also used to corroborate, when available, information received from approved pricing vendors and brokers. Various factors impact the frequency of monitoring this information (which may occur as often as daily). However, the Committee may determine that changes to inputs, assumptions and models are not required as a result of the monitoring procedures performed.
The following table is a summary of the inputs used to value the Fund’s investments at January 31, 2017:
| | Level 1
quoted prices
in active
markets for
identical
assets ($) | Level 2
other
significant
observable
inputs ($) | Level 3
significant
unobservable
inputs ($) | Investments
measured at
net asset
value ($) | Total ($) |
| Investments | | | | | |
| Alternative Investment Funds | 125,513,685 | — | — | — | 125,513,685 |
| Common Stocks | | | | | |
| Consumer Discretionary | 3,138,928 | 658,320 | — | — | 3,797,248 |
| Consumer Staples | 819,967 | 467,193 | 0* | — | 1,287,160 |
| Energy | 812,673 | 458,176 | — | — | 1,270,849 |
| Financials | 5,123,516 | 988,152 | — | — | 6,111,668 |
| Health Care | 3,246,009 | 525,194 | — | — | 3,771,203 |
| Industrials | 3,660,744 | 760,213 | — | — | 4,420,957 |
| Information Technology | 4,360,038 | 586,004 | — | — | 4,946,042 |
The accompanying Notes to Financial Statements are an integral part of this statement.
| 64 | Columbia Capital Allocation Portfolios | Annual Report 2017 |
Portfolio of Investments (continued)
Columbia Capital Allocation Moderate Aggressive Portfolio, January 31, 2017
Fair value measurements (continued)
| | Level 1
quoted prices
in active
markets for
identical
assets ($) | Level 2
other
significant
observable
inputs ($) | Level 3
significant
unobservable
inputs ($) | Investments
measured at
net asset
value ($) | Total ($) |
| Materials | 1,181,784 | 561,583 | — | — | 1,743,367 |
| Real Estate | 1,859,971 | 193,241 | — | — | 2,053,212 |
| Telecommunication Services | 264,991 | 314,330 | — | — | 579,321 |
| Utilities | 867,398 | 172,586 | — | — | 1,039,984 |
| Total Common Stocks | 25,336,019 | 5,684,992 | 0* | — | 31,021,011 |
| Equity Funds | 1,182,508,550 | — | — | — | 1,182,508,550 |
| Fixed-Income Funds | 520,453,980 | — | — | — | 520,453,980 |
| Preferred Stocks | | | | | |
| Consumer Discretionary | — | 18,454 | — | — | 18,454 |
| Financials | 139,026 | — | — | — | 139,026 |
| Total Preferred Stocks | 139,026 | 18,454 | — | — | 157,480 |
| Money Market Funds | — | — | — | 250,600,425 | 250,600,425 |
| Total Investments | 1,853,951,260 | 5,703,446 | 0* | 250,600,425 | 2,110,255,131 |
| Derivatives | | | | | |
| Asset | | | | | |
| Forward Foreign Currency Exchange Contracts | — | 12,390 | — | — | 12,390 |
| Futures Contracts | 1,793,015 | — | — | — | 1,793,015 |
| Swap Contracts | — | 122,674 | — | — | 122,674 |
| Liability | | | | | |
| Forward Foreign Currency Exchange Contracts | — | (11,683) | — | — | (11,683) |
| Futures Contracts | (2,008,630) | — | — | — | (2,008,630) |
| Swap Contracts | — | (585,221) | — | — | (585,221) |
| Total | 1,853,735,645 | 5,241,606 | 0* | 250,600,425 | 2,109,577,676 |
See the Portfolio of Investments for all investment classifications not indicated in the table.
The Fund’s assets assigned to the Level 2 input category are generally valued using the market approach, in which a security’s value is determined through reference to prices and information from market transactions for similar or identical assets. These assets include certain foreign securities for which a third party statistical pricing service may be employed for purposes of fair market valuation. The model utilized by such third party statistical pricing service takes into account a security’s correlation to available market data including, but not limited to, intraday index, ADR, and exchange-traded fund movements.
Derivative instruments are valued at unrealized appreciation (depreciation).
There were no transfers of financial assets between levels during the period.
The Fund does not hold any significant investments (greater than one percent of net assets) categorized as Level 3.
The Fund’s assets assigned to the Level 3 category are valued utilizing the valuation technique deemed the most appropriate in the circumstances. Certain common stock classified as Level 3 securities are valued using the market approach. To determine fair value for these securities, management considered various factors which may have included, but were not limited to, the halt price of the security, the movement in observed market prices for other securities from the issuer, the movement in certain foreign or domestic market indices, and the position of the security within the respective company’s capital structure. Significant increases (decreases) to any of these inputs would result in a significantly lower (higher) fair value measurement.
The accompanying Notes to Financial Statements are an integral part of this statement.
Columbia Capital Allocation Portfolios | Annual Report 2017
| 65 |
Portfolio of Investments
Columbia Capital Allocation Aggressive Portfolio, January 31, 2017
(Percentages represent value of investments compared to net assets)
| Alternative Investment Funds 5.9% |
| | Shares | Value ($) |
| Columbia Absolute Return Currency and Income Fund, Class I Shares(a),(b) | 182,646 | 2,016,415 |
| Columbia Alternative Beta Fund, Class I Shares(a) | 458,101 | 4,173,302 |
| Columbia Commodity Strategy Fund, Class I Shares(a) | 2,253,467 | 12,732,086 |
| Columbia Diversified Absolute Return Fund, Class I Shares(a),(b) | 759,504 | 7,200,097 |
| Columbia Multi-Asset Income Fund, Class I Shares(a) | 1,415,801 | 13,620,010 |
Total Alternative Investment Funds
(Cost $40,930,069) | 39,741,910 |
|
| Common Stocks 2.7% |
| Issuer | Shares | Value ($) |
| Consumer Discretionary 0.3% |
| Auto Components 0.1% |
| Cooper Tire & Rubber Co. | 1,414 | 51,257 |
| Cooper-Standard Holding, Inc.(b) | 505 | 53,166 |
| Dana, Inc. | 1,460 | 29,404 |
| Drew Industries, Inc. | 840 | 92,190 |
| Hyundai Mobis Co., Ltd. | 266 | 55,338 |
| Magna International, Inc.(b) | 803 | 34,737 |
| Superior Industries International, Inc. | 1,955 | 45,063 |
| Total | | 361,155 |
| Automobiles 0.1% |
| Fuji Heavy Industries Ltd. | 3,300 | 132,053 |
| Peugeot SA(b) | 7,487 | 139,338 |
| Suzuki Motor Corp. | 3,300 | 127,356 |
| Total | | 398,747 |
| Diversified Consumer Services —% |
| Capella Education Co. | 1,031 | 88,151 |
| Hotels, Restaurants & Leisure 0.1% |
| Bloomin’ Brands, Inc. | 2,125 | 36,359 |
| Cheesecake Factory, Inc. (The) | 1,510 | 90,993 |
| Compass Group PLC | 3,434 | 61,115 |
| Denny’s Corp.(b) | 725 | 8,823 |
| Flight Centre Travel Group Ltd. | 1,893 | 43,041 |
| InterContinental Hotels Group PLC | 640 | 29,719 |
| Isle of Capri Casinos, Inc.(b) | 1,965 | 46,787 |
| Papa John’s International, Inc. | 505 | 43,036 |
| Common Stocks (continued) |
| Issuer | Shares | Value ($) |
| Pinnacle Entertainment, Inc.(b) | 300 | 4,620 |
| Ruth’s Hospitality Group, Inc. | 3,996 | 68,531 |
| Total | | 433,024 |
| Household Durables —% |
| Arcelik AS | 3,224 | 19,533 |
| Electrolux AB, Class B | 4,643 | 123,462 |
| La-Z-Boy, Inc. | 2,175 | 62,205 |
| Persimmon PLC | 621 | 15,125 |
| Sony Corp. | 1,100 | 33,306 |
| Total | | 253,631 |
| Media —% |
| Gannett Co., Inc. | 6,550 | 63,011 |
| New York Times Co. (The), Class A | 5,995 | 80,933 |
| Total | | 143,944 |
| Multiline Retail —% |
| Big Lots, Inc. | 1,580 | 79,000 |
| Specialty Retail —% |
| Aaron’s, Inc.(b) | 1,550 | 47,957 |
| Big 5 Sporting Goods Corp. | 2,975 | 45,815 |
| Children’s Place, Inc. (The) | 925 | 89,725 |
| Francesca’s Holdings Corp.(b) | 4,175 | 72,812 |
| Genesco, Inc.(b) | 770 | 46,354 |
| Pier 1 Imports, Inc. | 8,030 | 58,378 |
| Total | | 361,041 |
| Textiles, Apparel & Luxury Goods —% |
| Movado Group, Inc. | 2,765 | 75,070 |
| Total Consumer Discretionary | 2,193,763 |
| Consumer Staples 0.1% |
| Beverages —% |
| Ambev SA | 15,988 | 87,269 |
| Food & Staples Retailing —% |
| Alimentation Couche-Tard, Inc., Class B | 893 | 40,908 |
| Casino Guichard Perrachon SA | 225 | 12,133 |
| Jeronimo Martins SGPS SA | 4,967 | 84,069 |
| Koninklijke Ahold Delhaize NV(b) | 1,229 | 26,182 |
| Loblaw Companies Ltd. | 306 | 16,082 |
| Metro AG | 741 | 25,358 |
| SpartanNash Co. | 2,100 | 79,506 |
The accompanying Notes to Financial Statements are an integral part of this statement.
| 66 | Columbia Capital Allocation Portfolios | Annual Report 2017 |
Portfolio of Investments (continued)
Columbia Capital Allocation Aggressive Portfolio, January 31, 2017
| Common Stocks (continued) |
| Issuer | Shares | Value ($) |
| SUPERVALU, Inc.(b) | 1,430 | 5,606 |
| Wm Morrison Supermarkets PLC | 5,311 | 15,834 |
| Total | | 305,678 |
| Food Products 0.1% |
| Dean Foods Co. | 4,583 | 91,018 |
| Fresh Del Monte Produce, Inc. | 270 | 15,458 |
| Marine Harvest ASA | 894 | 15,803 |
| Sanderson Farms, Inc. | 995 | 90,545 |
| WH Group Ltd. | 157,500 | 119,628 |
| Total | | 332,452 |
| Household Products —% |
| Reckitt Benckiser Group PLC | 776 | 66,585 |
| Personal Products —% |
| Usana Health Sciences, Inc.(b) | 460 | 28,658 |
| Tobacco —% |
| British American Tobacco PLC | 1,034 | 63,826 |
| Imperial Brands PLC | 530 | 24,554 |
| Swedish Match AB | 3,055 | 99,461 |
| Total | | 187,841 |
| Total Consumer Staples | 1,008,483 |
| Energy 0.1% |
| Energy Equipment & Services —% |
| Archrock, Inc. | 3,000 | 43,800 |
| Atwood Oceanics, Inc.(b) | 6,715 | 81,654 |
| Seadrill Ltd.(b) | 22,800 | 42,636 |
| Total | | 168,090 |
| Oil, Gas & Consumable Fuels 0.1% |
| China Petroleum & Chemical Corp., Class H | 162,000 | 127,968 |
| ENI SpA | 404 | 6,212 |
| Idemitsu Kosan Co., Ltd. | 600 | 18,553 |
| Lukoil PJSC | 1,571 | 88,010 |
| MOL Hungarian Oil and Gas NyRt | 237 | 16,702 |
| PDC Energy, Inc.(b) | 1,195 | 88,358 |
| Polski Koncern Naftowy Orlen SA | 561 | 11,372 |
| PTT PCL, Foreign Registered Shares | 11,100 | 127,406 |
| Repsol SA | 1,939 | 28,739 |
| REX American Resources Corp.(b) | 924 | 76,720 |
| Common Stocks (continued) |
| Issuer | Shares | Value ($) |
| SK Innovation Co., Ltd. | 874 | 118,401 |
| Western Refining, Inc. | 755 | 26,433 |
| Total | | 734,874 |
| Total Energy | 902,964 |
| Financials 0.5% |
| Banks 0.3% |
| ABSA Group Ltd. | 681 | 8,026 |
| Banc of California, Inc. | 5,398 | 85,288 |
| Banco Latinoamericano de Comercio Exterior SA, Class E | 2,185 | 59,432 |
| Bank of China Ltd., Class H | 277,000 | 125,458 |
| Bank of Montreal(b) | 1,328 | 100,453 |
| Bank of Nova Scotia (The)(b) | 2,426 | 144,973 |
| BNP Paribas SA | 407 | 26,037 |
| BOC Hong Kong Holdings Ltd. | 3,500 | 13,993 |
| Canadian Imperial Bank of Commerce | 1,600 | 136,251 |
| Central Pacific Financial Corp. | 2,815 | 88,194 |
| China CITIC Bank Corp., Ltd., Class H | 58,000 | 38,147 |
| China Construction Bank Corp., Class H | 32,000 | 23,724 |
| Customers Bancorp, Inc.(b) | 2,291 | 78,948 |
| FCB Financial Holdings, Inc., Class A(b) | 1,750 | 82,162 |
| First BanCorp(b) | 3,385 | 22,747 |
| Fulton Financial Corp. | 800 | 14,560 |
| Hanmi Financial Corp. | 410 | 13,592 |
| Hilltop Holdings, Inc.(b) | 2,275 | 62,290 |
| HSBC Holdings PLC(b) | 14,522 | 123,886 |
| International Bancshares Corp. | 2,395 | 88,854 |
| Royal Bank of Canada | 326 | 23,439 |
| Societe Generale SA | 3,004 | 146,858 |
| Standard Bank Group Ltd. | 5,204 | 55,581 |
| Toronto-Dominion Bank (The)(b) | 400 | 20,722 |
| Wintrust Financial Corp. | 660 | 47,256 |
| Total | | 1,630,871 |
| Capital Markets —% |
| Arlington Asset Investment Corp., Class A | 4,985 | 74,625 |
| KCG Holdings, Inc., Class A(b) | 5,345 | 74,670 |
| Piper Jaffray Companies(b) | 1,100 | 77,550 |
| Total | | 226,845 |
The accompanying Notes to Financial Statements are an integral part of this statement.
Columbia Capital Allocation Portfolios | Annual Report 2017
| 67 |
Portfolio of Investments (continued)
Columbia Capital Allocation Aggressive Portfolio, January 31, 2017
| Common Stocks (continued) |
| Issuer | Shares | Value ($) |
| Consumer Finance —% |
| Nelnet, Inc., Class A | 1,665 | 81,635 |
| Insurance 0.1% |
| Allianz SE, Registered Shares(b) | 916 | 155,687 |
| Ambac Financial Group, Inc.(b) | 1,925 | 40,271 |
| American Equity Investment Life Holding Co. | 757 | 17,865 |
| Assicurazioni Generali SpA | 5,719 | 91,259 |
| AXA SA | 2,265 | 55,667 |
| CNP Assurances | 975 | 18,323 |
| Heritage Insurance Holdings, Inc. | 4,470 | 63,385 |
| Legal & General Group PLC | 9,325 | 27,655 |
| Maiden Holdings Ltd. | 3,750 | 66,563 |
| NN Group NV | 3,960 | 140,247 |
| Swiss Re AG | 1,275 | 119,147 |
| Universal Insurance Holdings, Inc. | 3,306 | 86,452 |
| Total | | 882,521 |
| Mortgage Real Estate Investment Trusts (REITS) —% |
| CYS Investments, Inc. | 10,000 | 75,700 |
| Invesco Mortgage Capital, Inc. | 2,700 | 39,339 |
| Redwood Trust, Inc. | 1,350 | 20,925 |
| Total | | 135,964 |
| Thrifts & Mortgage Finance 0.1% |
| BofI Holding, Inc.(b) | 3,140 | 92,630 |
| Essent Group Ltd.(b) | 2,925 | 101,117 |
| Flagstar Bancorp, Inc.(b) | 2,825 | 72,800 |
| HomeStreet, Inc.(b) | 2,475 | 64,845 |
| Meta Financial Group, Inc. | 220 | 19,327 |
| MGIC Investment Corp.(b) | 10,135 | 107,938 |
| Radian Group, Inc.(b) | 5,965 | 109,756 |
| Walker & Dunlop, Inc.(b) | 2,770 | 87,006 |
| Washington Federal, Inc. | 3,045 | 100,028 |
| Total | | 755,447 |
| Total Financials | 3,713,283 |
| Common Stocks (continued) |
| Issuer | Shares | Value ($) |
| Health Care 0.3% |
| Biotechnology 0.1% |
| Alder Biopharmaceuticals, Inc.(b) | 1,125 | 23,119 |
| ARIAD Pharmaceuticals, Inc.(b) | 1,075 | 25,606 |
| Arrowhead Pharmaceuticals, Inc.(b) | 5,280 | 10,243 |
| bluebird bio, Inc.(b) | 460 | 34,270 |
| Coherus Biosciences, Inc.(b) | 665 | 18,553 |
| Dynavax Technologies Corp.(b) | 1,825 | 7,483 |
| Halozyme Therapeutics, Inc.(b) | 1,590 | 18,364 |
| Insys Therapeutics, Inc.(b) | 2,325 | 23,808 |
| Keryx Biopharmaceuticals, Inc.(b) | 7,180 | 35,828 |
| Kite Pharma, Inc.(b) | 435 | 22,172 |
| Ligand Pharmaceuticals, Inc.(b) | 575 | 60,956 |
| PTC Therapeutics, Inc.(b) | 1,345 | 17,620 |
| Puma Biotechnology, Inc.(b) | 850 | 27,540 |
| Ra Pharmaceuticals, Inc.(b) | 1,002 | 15,972 |
| Sage Therapeutics, Inc.(b) | 445 | 21,351 |
| Shire PLC(b) | 538 | 29,954 |
| Spark Therapeutics, Inc.(b) | 805 | 50,763 |
| TESARO, Inc.(b) | 240 | 39,082 |
| Total | | 482,684 |
| Health Care Equipment & Supplies 0.1% |
| Analogic Corp. | 340 | 26,401 |
| Angiodynamics, Inc.(b) | 3,700 | 59,551 |
| Halyard Health, Inc.(b) | 1,400 | 53,858 |
| Masimo Corp.(b) | 1,365 | 100,437 |
| Natus Medical, Inc.(b) | 390 | 15,230 |
| OraSure Technologies, Inc.(b) | 5,650 | 49,833 |
| Orthofix International NV(b) | 2,100 | 75,474 |
| Total | | 380,784 |
| Health Care Providers & Services —% |
| Chemed Corp. | 85 | 14,117 |
| Magellan Health, Inc.(b) | 1,080 | 80,946 |
| Molina Healthcare, Inc.(b) | 1,360 | 77,139 |
| Owens & Minor, Inc. | 1,810 | 64,943 |
| Sinopharm Group Co. Class H(b) | 2,800 | 12,796 |
| Triple-S Management Corp., Class B(b) | 2,745 | 52,457 |
| Total | | 302,398 |
The accompanying Notes to Financial Statements are an integral part of this statement.
| 68 | Columbia Capital Allocation Portfolios | Annual Report 2017 |
Portfolio of Investments (continued)
Columbia Capital Allocation Aggressive Portfolio, January 31, 2017
| Common Stocks (continued) |
| Issuer | Shares | Value ($) |
| Life Sciences Tools & Services —% |
| INC Research Holdings, Inc. Class A(b) | 1,680 | 89,040 |
| Pra Health Sciences, Inc.(b) | 1,485 | 87,006 |
| Total | | 176,046 |
| Pharmaceuticals 0.1% |
| Aerie Pharmaceuticals, Inc.(b) | 1,240 | 54,436 |
| Astellas Pharma, Inc. | 600 | 8,053 |
| Bayer AG, Registered Shares | 180 | 19,994 |
| Daiichi Sankyo Co., Ltd. | 1,100 | 24,610 |
| GlaxoSmithKline PLC | 7,997 | 154,542 |
| Jounce Therapeutics, Inc.(b) | 1,287 | 21,339 |
| Novo Nordisk A/S, Class B | 2,149 | 77,182 |
| Roche Holding AG, Genusschein Shares(b) | 682 | 161,599 |
| Sanofi | 1,666 | 133,907 |
| Supernus Pharmaceuticals, Inc.(b) | 2,365 | 63,973 |
| Total | | 719,635 |
| Total Health Care | 2,061,547 |
| Industrials 0.4% |
| Aerospace & Defense —% |
| Curtiss-Wright Corp. | 1,015 | 99,531 |
| Air Freight & Logistics —% |
| Forward Air Corp. | 120 | 5,783 |
| Royal Mail PLC | 5,042 | 26,185 |
| Total | | 31,968 |
| Airlines 0.1% |
| Deutsche Lufthansa AG, Registered Shares | 3,825 | 51,097 |
| Hawaiian Holdings, Inc.(b) | 1,775 | 90,436 |
| Japan Airlines Co., Ltd. | 3,200 | 101,898 |
| Qantas Airways Ltd. | 19,874 | 51,371 |
| Total | | 294,802 |
| Building Products 0.1% |
| Continental Building Product(b) | 3,190 | 74,167 |
| Gibraltar Industries, Inc.(b) | 1,970 | 86,483 |
| NCI Building Systems, Inc.(b) | 1,500 | 24,000 |
| Universal Forest Products, Inc. | 835 | 84,928 |
| Total | | 269,578 |
| Common Stocks (continued) |
| Issuer | Shares | Value ($) |
| Commercial Services & Supplies —% |
| ACCO Brands Corp.(b) | 3,750 | 47,813 |
| Brady Corp., Class A | 1,880 | 68,338 |
| Knoll, Inc. | 600 | 15,666 |
| Quad/Graphics, Inc. | 2,950 | 77,260 |
| Total | | 209,077 |
| Construction & Engineering 0.1% |
| ACS Actividades de Construccion y Servicios SA | 1,278 | 39,389 |
| Argan, Inc. | 1,110 | 81,862 |
| China Railway Construction Corp., Ltd., Class H(b) | 50,000 | 69,375 |
| Hyundai Development Co. | 264 | 9,934 |
| Leighton Holdings Ltd. | 1,769 | 46,045 |
| Shimizu Corp. | 5,000 | 45,957 |
| Skanska AB, Class B | 3,318 | 81,125 |
| Taisei Corp. | 17,000 | 120,761 |
| Total | | 494,448 |
| Electrical Equipment —% |
| EnerSys | 1,310 | 102,114 |
| Generac Holdings, Inc.(b) | 1,230 | 49,520 |
| Prysmian SpA(b) | 1,984 | 51,610 |
| Total | | 203,244 |
| Industrial Conglomerates —% |
| Hanwha Corp. | 1,889 | 57,324 |
| Siemens AG, Registered Shares | 570 | 73,734 |
| Total | | 131,058 |
| Machinery 0.1% |
| Astec Industries, Inc. | 360 | 25,193 |
| Energy Recovery, Inc.(b) | 7,100 | 72,704 |
| Global Brass & Copper Holdings, Inc.(b) | 2,220 | 73,593 |
| Greenbrier Companies, Inc. (The) | 2,030 | 88,813 |
| KONE OYJ, Class B | 153 | 6,917 |
| Mueller Industries, Inc. | 895 | 36,033 |
| Wabash National Corp.(b) | 5,390 | 95,133 |
| Total | | 398,386 |
| Professional Services —% |
| Huron Consulting Group, Inc.(b) | 1,670 | 75,651 |
| RPX Corp.(b) | 6,920 | 75,151 |
| Total | | 150,802 |
The accompanying Notes to Financial Statements are an integral part of this statement.
Columbia Capital Allocation Portfolios | Annual Report 2017
| 69 |
Portfolio of Investments (continued)
Columbia Capital Allocation Aggressive Portfolio, January 31, 2017
| Common Stocks (continued) |
| Issuer | Shares | Value ($) |
| Road & Rail —% |
| ArcBest Corp. | 2,530 | 79,948 |
| Trading Companies & Distributors —% |
| Applied Industrial Technologies, Inc. | 1,590 | 96,116 |
| ITOCHU Corp. | 5,300 | 73,012 |
| Total | | 169,128 |
| Total Industrials | 2,531,970 |
| Information Technology 0.4% |
| Electronic Equipment, Instruments & Components 0.1% |
| Benchmark Electronics, Inc.(b) | 3,175 | 97,155 |
| Hon Hai Precision Industry Co., Ltd.(b) | 55,000 | 147,498 |
| Methode Electronics, Inc. | 1,330 | 55,927 |
| Rogers Corp.(b) | 1,035 | 82,748 |
| Sanmina Corp.(b) | 2,800 | 109,060 |
| Scansource, Inc.(b) | 1,430 | 56,557 |
| TTM Technologies, Inc.(b) | 5,550 | 82,306 |
| Vishay Intertechnology, Inc. | 5,075 | 84,245 |
| Total | | 715,496 |
| Internet Software & Services 0.1% |
| Bankrate, Inc.(b) | 1,300 | 14,170 |
| EarthLink Holdings Corp. | 11,120 | 71,279 |
| j2 Global, Inc.(b) | 1,283 | 107,528 |
| Mixi, Inc. | 3,200 | 138,836 |
| RetailMeNot, Inc.(b) | 6,692 | 60,563 |
| Shutterstock, Inc.(b) | 360 | 19,368 |
| Total | | 411,744 |
| IT Services 0.1% |
| Cardtronics PLC, Class A(b) | 1,800 | 98,244 |
| Convergys Corp. | 2,425 | 60,189 |
| CSG Systems International, Inc. | 1,180 | 57,112 |
| EVERTEC, Inc. | 4,415 | 75,276 |
| Science Applications International Corp. | 250 | 20,355 |
| Sykes Enterprises, Inc.(b) | 565 | 15,780 |
| Travelport Worldwide Ltd. | 1,750 | 25,130 |
| Unisys Corp.(b) | 3,025 | 38,871 |
| Total | | 390,957 |
| Common Stocks (continued) |
| Issuer | Shares | Value ($) |
| Semiconductors & Semiconductor Equipment —% |
| Amkor Technology, Inc.(b) | 7,320 | 68,881 |
| Diodes, Inc.(b) | 745 | 18,543 |
| Entegris, Inc.(b) | 4,625 | 86,719 |
| Semtech Corp.(b) | 2,675 | 88,141 |
| Synaptics, Inc.(b) | 1,496 | 84,344 |
| Xcerra Corp.(b) | 5,727 | 43,411 |
| Total | | 390,039 |
| Software 0.1% |
| Aspen Technology, Inc.(b) | 1,655 | 87,897 |
| Barracuda Networks, Inc.(b) | 1,150 | 27,014 |
| CommVault Systems, Inc.(b) | 1,520 | 74,632 |
| Mentor Graphics Corp. | 785 | 28,974 |
| Oracle Corp. Japan | 1,500 | 84,046 |
| Progress Software Corp.(b) | 1,125 | 31,522 |
| Qualys, Inc.(b) | 1,110 | 39,849 |
| VASCO Data Security International, Inc.(b) | 1,425 | 21,660 |
| Total | | 395,594 |
| Technology Hardware, Storage & Peripherals —% |
| Foxconn Technology Co., Ltd. | 40,400 | 114,023 |
| Inventec Co., Ltd. | 38,000 | 28,580 |
| Pegatron Corp. | 34,000 | 81,875 |
| Samsung Electronics Co., Ltd. | 31 | 52,724 |
| Seiko Epson Corp. | 2,100 | 43,262 |
| Total | | 320,464 |
| Total Information Technology | 2,624,294 |
| Materials 0.2% |
| Chemicals 0.1% |
| Ferro Corp.(b) | 5,125 | 72,468 |
| Hyosung Corp.(b) | 79 | 9,210 |
| Innospec, Inc. | 1,380 | 98,463 |
| Mitsubishi Chemical Holdings Corp. | 12,900 | 89,977 |
| Rayonier Advanced Materials, Inc. | 5,700 | 77,349 |
| Sinopec Shanghai Petrochemical Co., Ltd. | 104,000 | 64,398 |
| Trinseo SA | 1,550 | 100,362 |
| Total | | 512,227 |
| Containers & Packaging —% |
| Greif, Inc., Class A | 1,390 | 80,036 |
The accompanying Notes to Financial Statements are an integral part of this statement.
| 70 | Columbia Capital Allocation Portfolios | Annual Report 2017 |
Portfolio of Investments (continued)
Columbia Capital Allocation Aggressive Portfolio, January 31, 2017
| Common Stocks (continued) |
| Issuer | Shares | Value ($) |
| Metals & Mining 0.1% |
| AngloGold Ashanti Ltd.(b) | 1,075 | 13,553 |
| Eregli Demir ve Celik Fabrikalari TAS | 51,801 | 79,765 |
| Fortescue Metals Group Ltd. | 21,134 | 106,944 |
| Materion Corp. | 750 | 29,475 |
| Rio Tinto PLC | 3,743 | 165,826 |
| Schnitzer Steel Industries, Inc., Class A | 3,025 | 71,541 |
| Sibanye Gold Ltd. | 6,646 | 14,935 |
| Total | | 482,039 |
| Paper & Forest Products —% |
| UPM-Kymmene OYJ | 5,302 | 120,249 |
| Total Materials | 1,194,551 |
| Real Estate 0.2% |
| Equity Real Estate Investment Trusts (REITS) 0.1% |
| Ashford Hospitality Prime, Inc. | 1,100 | 14,784 |
| CBL & Associates Properties, Inc. | 7,450 | 80,833 |
| CorEnergy Infrastructure Trust, Inc. | 1,358 | 48,752 |
| DuPont Fabros Technology, Inc. | 680 | 32,286 |
| Government Properties Income Trust | 850 | 16,371 |
| LaSalle Hotel Properties | 1,475 | 44,501 |
| Lexington Realty Trust | 8,300 | 88,976 |
| PS Business Parks, Inc. | 753 | 84,366 |
| Ramco-Gershenson Properties Trust | 850 | 13,821 |
| RLJ Lodging Trust | 1,235 | 28,664 |
| Ryman Hospitality Properties, Inc. | 1,325 | 81,064 |
| Sabra Health Care REIT, Inc. | 450 | 11,430 |
| Select Income REIT | 3,025 | 75,655 |
| STAG Industrial, Inc. | 850 | 19,669 |
| Summit Hotel Properties, Inc. | 5,750 | 91,022 |
| Washington Prime Group, Inc. | 8,350 | 80,578 |
| Xenia Hotels & Resorts, Inc. | 675 | 12,386 |
| Total | | 825,158 |
| Real Estate Management & Development 0.1% |
| China Vanke Co., Ltd., Class H | 13,000 | 32,978 |
| Guangzhou R&F Properties Co., Ltd., Class H | 85,200 | 109,277 |
| Wheelock & Co., Ltd. | 14,220 | 86,428 |
| Total | | 228,683 |
| Total Real Estate | 1,053,841 |
| Common Stocks (continued) |
| Issuer | Shares | Value ($) |
| Telecommunication Services 0.1% |
| Diversified Telecommunication Services 0.1% |
| China Communications Services Corp., Ltd., Class H | 26,000 | 17,674 |
| General Communication, Inc., Class A(b) | 3,615 | 72,734 |
| Nippon Telegraph & Telephone Corp. | 2,800 | 123,682 |
| Telenor ASA | 6,113 | 96,794 |
| Windstream Holdings, Inc. | 5,750 | 46,460 |
| Total | | 357,344 |
| Wireless Telecommunication Services —% |
| Global Telecom Holding SAE(b) | 209,745 | 78,364 |
| NTT DoCoMo, Inc. | 2,200 | 52,602 |
| Total | | 130,966 |
| Total Telecommunication Services | 488,310 |
| Utilities 0.1% |
| Electric Utilities —% |
| IDACORP, Inc. | 25 | 2,000 |
| Korea Electric Power Corp. | 2,541 | 93,059 |
| Portland General Electric Co. | 59 | 2,573 |
| Transmissora Alianca de Energia Eletrica SA | 7,461 | 50,812 |
| Total | | 148,444 |
| Gas Utilities 0.1% |
| Chesapeake Utilities Corp. | 1,015 | 66,381 |
| Northwest Natural Gas Co. | 850 | 50,065 |
| Southwest Gas Corp. | 1,245 | 100,310 |
| Total | | 216,756 |
| Independent Power and Renewable Electricity Producers —% |
| Ormat Technologies, Inc. | 1,220 | 65,514 |
| Multi-Utilities —% |
| E.ON SE | 14,449 | 111,302 |
| Water Utilities —% |
| SJW Corp. | 1,595 | 79,910 |
| Total Utilities | 621,926 |
Total Common Stocks
(Cost $16,521,007) | 18,394,932 |
|
The accompanying Notes to Financial Statements are an integral part of this statement.
Columbia Capital Allocation Portfolios | Annual Report 2017
| 71 |
Portfolio of Investments (continued)
Columbia Capital Allocation Aggressive Portfolio, January 31, 2017
| Equity Funds 71.7% |
| | Shares | Value ($) |
| International 19.7% |
| Columbia Emerging Markets Fund, Class I Shares(a),(b) | 4,840,561 | 48,792,856 |
| Columbia European Equity Fund, Class I Shares(a) | 3,339,381 | 20,303,436 |
| Columbia Overseas Value Fund, Class I Shares(a) | 4,182,488 | 35,425,670 |
| Columbia Pacific/Asia Fund, Class I Shares(a) | 3,013,695 | 28,389,008 |
| Total | 132,910,970 |
| U.S. Large Cap 48.8% |
| Columbia Contrarian Core Fund, Class I Shares(a) | 2,356,416 | 53,961,918 |
| Columbia Disciplined Core Fund, Class I Shares(a) | 3,924,284 | 40,773,317 |
| Columbia Disciplined Growth Fund, Class I Shares(a) | 5,243,123 | 44,881,132 |
| Columbia Disciplined Value Fund, Class I Shares(a) | 6,774,725 | 66,324,555 |
| Columbia Large Cap Growth Fund, Class I Shares(a) | 584,150 | 20,854,153 |
| Columbia Select Large Cap Equity Fund, Class I Shares(a) | 3,739,016 | 46,924,646 |
| Columbia Select Large Cap Growth Fund, Class I Shares(a),(b) | 2,103,732 | 31,345,610 |
| Columbia Select Large-Cap Value Fund, Class I Shares(a) | 1,033,460 | 24,617,019 |
| Total | 329,682,350 |
| U.S. Small Cap 3.2% |
| Columbia Disciplined Small Core Fund, Class I Shares(a) | 1,112,999 | 10,629,143 |
| Columbia Select Smaller-Cap Value Fund, Class I Shares(a),(b) | 372,495 | 7,759,068 |
| Columbia Small Cap Growth Fund I, Class I Shares(a),(b) | 146,015 | 2,702,745 |
| Total | 21,090,956 |
Total Equity Funds
(Cost $441,096,537) | 483,684,276 |
|
| Fixed-Income Funds 12.0% |
| | |
| Emerging Markets 0.5% |
| Columbia Emerging Markets Bond Fund, Class I Shares(a) | 286,806 | 3,252,377 |
| High Yield 5.7% |
| Columbia High Yield Bond Fund, Class I Shares(a) | 7,993,252 | 23,420,227 |
| Columbia Income Opportunities Fund, Class I Shares(a) | 1,524,750 | 15,034,040 |
| Total | 38,454,267 |
| Fixed-Income Funds (continued) |
| | Shares | Value ($) |
| Investment Grade 5.8% |
| Columbia Corporate Income Fund, Class I Shares(a) | 2,706,318 | 27,117,305 |
| Columbia Mortgage Opportunities Fund, Class I Shares(a) | 400,112 | 3,941,100 |
| Columbia U.S. Government Mortgage Fund, Class I Shares(a) | 1,522,026 | 8,203,723 |
| Total | 39,262,128 |
Total Fixed-Income Funds
(Cost $81,060,377) | 80,968,772 |
| Preferred Stocks —% |
| Issuer | Coupon
Rate | Shares | Value ($) |
| Consumer Discretionary —% |
| Auto Components —% |
| Schaeffler AG | — | 1,347 | 21,843 |
| Total Consumer Discretionary | 21,843 |
| Financials —% |
| Banks —% |
| Banco Bradesco SA(b) | — | 14,473 | 150,191 |
| Itau Unibanco Holding SA(b) | — | 1,221 | 14,430 |
| Total | | | 164,621 |
| Total Financials | 164,621 |
Total Preferred Stocks
(Cost $161,090) | 186,464 |
| Money Market Funds 7.3% |
| | Shares | Value ($) |
| Columbia Short-Term Cash Fund, 0.662%(a),(c) | 49,253,436 | 49,253,436 |
Total Money Market Funds
(Cost $49,253,484) | 49,253,436 |
Total Investments
(Cost: $629,022,564) | 672,229,790 |
| Other Assets & Liabilities, Net | | 3,031,566 |
| Net Assets | 675,261,356 |
At January 31, 2017, securities and/or cash totaling $4,071,959 were pledged as collateral.
The accompanying Notes to Financial Statements are an integral part of this statement.
| 72 | Columbia Capital Allocation Portfolios | Annual Report 2017 |
Portfolio of Investments (continued)
Columbia Capital Allocation Aggressive Portfolio, January 31, 2017
Investments in derivatives
| Forward foreign currency exchange contracts open at January 31, 2017 |
| Counterparty | Exchange
date | Currency to
be delivered | Currency to
be received | Unrealized
appreciation ($) | Unrealized
depreciation ($) |
| JPMorgan | 02/22/2017 | 370,000 BRL | 113,546 USD | — | (3,317) |
| JPMorgan | 02/22/2017 | 10,000 CAD | 7,543 USD | — | (143) |
| JPMorgan | 02/22/2017 | 783,000 CNY | 113,314 USD | — | (423) |
| JPMorgan | 02/22/2017 | 1,314,000 EGP | 69,158 USD | 108 | — |
| JPMorgan | 02/22/2017 | 168,422,000 KRW | 142,848 USD | — | (2,975) |
| JPMorgan | 02/22/2017 | 513,000 NOK | 60,400 USD | — | (1,805) |
| JPMorgan | 02/22/2017 | 1,283,000 SEK | 143,657 USD | — | (3,138) |
| JPMorgan | 02/22/2017 | 2,945,000 THB | 83,011 USD | — | (615) |
| JPMorgan | 02/22/2017 | 144,000 TRY | 37,637 USD | — | (331) |
| JPMorgan | 02/22/2017 | 4,660,000 TWD | 147,101 USD | — | (2,314) |
| JPMorgan | 02/22/2017 | 150,886 USD | 201,000 AUD | 1,484 | — |
| JPMorgan | 02/22/2017 | 173,054 USD | 174,000 CHF | 2,946 | — |
| JPMorgan | 02/22/2017 | 34,275 USD | 32,000 EUR | 293 | — |
| JPMorgan | 02/22/2017 | 166,898 USD | 136,000 GBP | 4,246 | — |
| JPMorgan | 02/22/2017 | 45,376 USD | 607,762,000 IDR | 86 | — |
| JPMorgan | 02/22/2017 | 30,130 USD | 115,000 ILS | 391 | — |
| JPMorgan | 02/22/2017 | 143,603 USD | 9,848,000 INR | 1,752 | — |
| JPMorgan | 02/22/2017 | 67,097 USD | 7,670,000 JPY | 867 | — |
| JPMorgan | 02/22/2017 | 62,921 USD | 1,320,000 MXN | 209 | — |
| JPMorgan | 02/22/2017 | 45,353 USD | 203,000 MYR | 421 | — |
| JPMorgan | 02/22/2017 | 67,949 USD | 97,000 SGD | 889 | — |
| JPMorgan | 02/22/2017 | 30,170 USD | 414,000 ZAR | 454 | — |
| Total | | | | 14,146 | (15,061) |
Futures contracts outstanding at January 31, 2017
| Long futures contracts outstanding |
| Contract description | Number of
contracts | Trading
currency | Notional market
value ($) | Expiration date | Unrealized
appreciation ($) | Unrealized
depreciation ($) |
| Mini MSCI EAFE Index | 49 | USD | 4,234,580 | 03/2017 | 17,276 | — |
| Mini MSCI Emerging Markets Index | 83 | USD | 3,797,665 | 03/2017 | 150,851 | — |
| Russell 2000 Mini | 1 | USD | 67,975 | 03/2017 | — | (1,387) |
| S&P 500 E-mini | 341 | USD | 38,780,225 | 03/2017 | 339,627 | — |
| S&P Mid 400 E-mini | 48 | USD | 8,090,400 | 03/2017 | — | (26,039) |
| TOPIX Index | 60 | JPY | 8,061,288 | 03/2017 | — | (133,920) |
| U.S. Long Bond | 29 | USD | 4,374,469 | 03/2017 | — | (28,789) |
| U.S. Treasury 5-Year Note | 35 | USD | 4,125,351 | 03/2017 | — | (12,641) |
| Total | | | 71,531,953 | | 507,754 | (202,776) |
| Short futures contracts outstanding |
| Contract description | Number of
contracts | Trading
currency | Notional market
value ($) | Expiration date | Unrealized
appreciation ($) | Unrealized
depreciation ($) |
| EURO STOXX 50 | (102) | EUR | (3,560,924) | 03/2017 | — | (48,860) |
| FTSE 100 Index | (38) | GBP | (3,368,029) | 03/2017 | — | (105,298) |
| Russell 2000 Mini | (19) | USD | (1,291,525) | 03/2017 | 15,829 | — |
| U.S. Treasury 10-Year Note | (15) | USD | (1,867,031) | 03/2017 | 8,643 | — |
| U.S. Ultra Bond | (6) | USD | (964,125) | 03/2017 | 7,863 | — |
| Total | | | (11,051,634) | | 32,335 | (154,158) |
The accompanying Notes to Financial Statements are an integral part of this statement.
Columbia Capital Allocation Portfolios | Annual Report 2017
| 73 |
Portfolio of Investments (continued)
Columbia Capital Allocation Aggressive Portfolio, January 31, 2017
Cleared credit default swap contracts outstanding at January 31, 2017
| Buy protection |
| Counterparty | Reference
entity | Expiration
date | Pay fixed
rate (%) | Notional
currency | Notional
amount ($) | Unrealized
appreciation ($) | Unrealized
depreciation ($) |
| Morgan Stanley | Markit CDX North America High Yield Index, Series 26 | 06/20/2021 | 5.000 | USD | 3,289,000 | — | (168,232) |
| Morgan Stanley | Markit CDX North America Investment Grade Index, Series 27 | 12/20/2021 | 1.000 | USD | 3,750,000 | — | (12,188) |
| Total | | | | | | — | (180,420) |
Credit default swap contracts outstanding at January 31, 2017
| Sell protection |
| Counterparty | Reference
entity | Expiration
date | Receive
fixed
rate
(%) | Implied
credit
spread
(%) | Notional
currency | Notional
amount
($) | Market
value
($) | Periodic
payments
receivable
(payable)
($) | Premium
paid
($) | Premium
received
($) | Unrealized
appreciation
($) | Unrealized
depreciation
($) |
| Barclays | Markit CDX Emerging Markets Index, Series 26 | 12/20/21 | 1.000 | 2.372 | USD | (2,307,692) | (140,318) | 2,757 | — | (148,502) | 10,941 | — |
| Barclays | Markit CDX Emerging Markets Index, Series 26 | 12/20/21 | 1.000 | 2.372 | USD | (4,615,385) | (280,636) | 5,513 | — | (299,245) | 24,122 | — |
| Barclays | Markit CDX Emerging Markets Index, Series 26 | 12/20/21 | 1.000 | 2.372 | USD | (4,326,923) | (263,095) | 5,168 | — | (282,222) | 24,295 | — |
| Total | | | | | | | | | — | (729,969) | 59,358 | — |
Notes to Portfolio of Investments
| (a) | As defined in the Investment Company Act of 1940, an affiliated company is one in which the Fund owns 5% or more of the company’s outstanding voting securities, or a company which is under common ownership or control with the Fund. Holdings and transactions in these affiliated companies during the year ended January 31, 2017 are as follows: |
| Issuer | Beginning
shares | Shares
purchased | Shares
sold | Ending
shares | Capital gain
distributions ($) | Realized gain
(loss) ($) | Dividends —
affiliated
issuers ($) | Value ($) |
| Columbia Absolute Return Currency and Income Fund, Class I Shares | 189,149 | 7,119 | (13,622) | 182,646 | 54,870 | 11,134 | — | 2,016,415 |
| Columbia Alternative Beta Fund, Class I Shares | 455,212 | 2,889 | — | 458,101 | — | — | 26,120 | 4,173,302 |
| Columbia Commodity Strategy Fund, Class I Shares | — | 2,255,165 | (1,698) | 2,253,467 | — | (480) | — | 12,732,086 |
| Columbia Contrarian Core Fund, Class I Shares | 2,604,980 | 42,841 | (291,405) | 2,356,416 | 404,185 | 2,497,028 | 564,223 | 53,961,918 |
| Columbia Corporate Income Fund, Class I Shares | 2,769,544 | 141,086 | (204,312) | 2,706,318 | — | (20,041) | 835,467 | 27,117,305 |
| Columbia Disciplined Core Fund, Class I Shares | 4,206,752 | 67,405 | (349,872) | 3,924,285 | — | 2,094,809 | 656,536 | 40,773,317 |
| Columbia Disciplined Growth Fund, Class I Shares | 5,372,336 | 330,329 | (459,542) | 5,243,123 | 2,294,954 | 357,520 | 401,139 | 44,881,132 |
| Columbia Disciplined Small Core Fund, Class I Shares | 860,055 | 394,331 | (141,387) | 1,112,999 | 3,433,494 | (724,055) | 59,734 | 10,629,143 |
| Columbia Disciplined Value Fund, Class I Shares | 7,534,590 | 145,475 | (905,340) | 6,774,725 | — | 113,384 | 1,273,118 | 66,324,555 |
| Columbia Diversified Absolute Return Fund, Class I Shares | 1,021,514 | 18,450 | (280,460) | 759,504 | — | (120,832) | — | 7,200,097 |
The accompanying Notes to Financial Statements are an integral part of this statement.
| 74 | Columbia Capital Allocation Portfolios | Annual Report 2017 |
Portfolio of Investments (continued)
Columbia Capital Allocation Aggressive Portfolio, January 31, 2017
Notes to Portfolio of Investments (continued)
| Issuer | Beginning
shares | Shares
purchased | Shares
sold | Ending
shares | Capital gain
distributions ($) | Realized gain
(loss) ($) | Dividends —
affiliated
issuers ($) | Value ($) |
| Columbia Emerging Markets Bond Fund, Class I Shares | 321,005 | 12,796 | (46,995) | 286,806 | — | (2,367) | 104,561 | 3,252,377 |
| Columbia Emerging Markets Fund, Class I Shares | 3,465,613 | 1,396,425 | (21,477) | 4,840,561 | — | 4,055 | — | 48,792,856 |
| Columbia European Equity Fund, Class I Shares | 4,582,981 | 205,857 | (1,449,457) | 3,339,381 | — | 514,702 | 571,869 | 20,303,436 |
| Columbia High Yield Bond Fund, Class I Shares | 8,467,828 | 459,498 | (934,074) | 7,993,252 | — | (136,230) | 1,226,748 | 23,420,227 |
| Columbia Income Opportunities Fund, Class I Shares | 2,304,472 | 101,415 | (881,137) | 1,524,750 | — | 308,191 | 902,227 | 15,034,040 |
| Columbia Large Cap Growth Fund, Class I Shares | 607,855 | 17,993 | (41,698) | 584,150 | 269,099 | 836,938 | 119,397 | 20,854,153 |
| Columbia Mortgage Opportunities Fund, Class I Shares | 406,485 | 23,903 | (30,276) | 400,112 | 49,518 | (6,585) | 147,552 | 3,941,100 |
| Columbia Multi-Advisor Small Cap Value Fund, Class I Shares | 1,076,972 | 10,850 | (1,087,822)* | — | | 769,739 | | |
| Columbia Multi-Asset Income Fund, Class I Shares | 1,098,776 | 317,025 | — | 1,415,801 | — | — | 638,831 | 13,620,010 |
| Columbia Overseas Value Fund, Class I Shares | 4,647,726 | 144,981 | (610,219) | 4,182,488 | — | (447,194) | 759,958 | 35,425,670 |
| Columbia Pacific/Asia Fund, Class I Shares | 3,061,777 | 233,960 | (282,042) | 3,013,695 | 1,519,604 | 602,805 | 173,530 | 28,389,008 |
| Columbia Select Large Cap Equity Fund, Class I Shares | 4,096,043 | 88,180 | (445,207) | 3,739,016 | 466,259 | (764,396) | 600,002 | 46,924,646 |
| Columbia Select Large Cap Growth Fund, Class I Shares | 1,889,926 | 337,103 | (123,297) | 2,103,732 | 3,397,373 | 573,106 | — | 31,345,610 |
| Columbia Select Large-Cap Value Fund, Class I Shares | 1,176,170 | 87,880 | (230,590) | 1,033,460 | 1,647,825 | 2,148,363 | 347,115 | 24,617,019 |
| Columbia Select Smaller-Cap Value Fund, Class I Shares | 252,247 | 275,739* | (155,491) | 372,495 | 414,895 | 249,894 | — | 7,759,068 |
| Columbia Short-Term Cash Fund, 0.662% | 46,742,052 | 67,159,918 | (64,648,534) | 49,253,436 | — | 26 | 192,784 | 49,253,436 |
| Columbia Small Cap Growth Fund I, Class I Shares | 168,715 | 15,710 | (38,410) | 146,015 | 216,958 | (360,479) | — | 2,702,745 |
| Columbia U.S. Government Mortgage Fund, Class I Shares | 3,042,073 | 156,378 | (1,676,425) | 1,522,026 | 78,122 | (162,309) | 391,531 | 8,203,723 |
| Total | 112,422,848 | 74,450,701 | (75,350,789) | 111,522,760 | 14,247,156 | 8,336,726 | 9,992,442 | 653,648,394 |
| * | Includes the effect of underlying fund reorganization. |
| (b) | Non-income producing investment. |
| (c) | The rate shown is the seven-day current annualized yield at January 31, 2017. |
The accompanying Notes to Financial Statements are an integral part of this statement.
Columbia Capital Allocation Portfolios | Annual Report 2017
| 75 |
Portfolio of Investments (continued)
Columbia Capital Allocation Aggressive Portfolio, January 31, 2017
Currency Legend
| AUD | Australian Dollar |
| BRL | Brazilian Real |
| CAD | Canada Dollar |
| CHF | Swiss Franc |
| CNY | China Yuan Renminbi |
| EGP | Egyptian Pound |
| EUR | Euro |
| GBP | British Pound |
| IDR | Indonesian Rupiah |
| ILS | New Israeli Sheqel |
| INR | Indian Rupee |
| JPY | Japanese Yen |
| KRW | South Korean Won |
| MXN | Mexican Peso |
| MYR | Malaysian Ringgit |
| NOK | Norwegian Krone |
| SEK | Swedish Krona |
| SGD | Singapore Dollar |
| THB | Thailand Baht |
| TRY | Turkish Lira |
| TWD | New Taiwan Dollar |
| USD | US Dollar |
| ZAR | South African Rand |
Fair value measurements
The Fund categorizes its fair value measurements according to a three-level hierarchy that maximizes the use of observable inputs and minimizes the use of unobservable inputs by prioritizing that the most observable input be used when available. Observable inputs are those that market participants would use in pricing an investment based on market data obtained from sources independent of the reporting entity. Unobservable inputs are those that reflect the Fund’s assumptions about the information market participants would use in pricing an investment. An investment’s level within the fair value hierarchy is based on the lowest level of any input that is deemed significant to the asset’s or liability’s fair value measurement. The input levels are not necessarily an indication of the risk or liquidity associated with investments at that level. For example, certain U.S. government securities are generally high quality and liquid, however, they are reflected as Level 2 because the inputs used to determine fair value may not always be quoted prices in an active market.
Fair value inputs are summarized in the three broad levels listed below:
| • | Level 1 - Valuations based on quoted prices for investments in active markets that the Fund has the ability to access at the measurement date (including NAV for open-end mutual funds). Valuation adjustments are not applied to Level 1 investments. |
| • | Level 2 – Valuations based on other significant observable inputs (including quoted prices for similar securities, interest rates, prepayment speeds, credit risks, etc.). |
| • | Level 3 – Valuations based on significant unobservable inputs (including the Fund’s own assumptions and judgment in determining the fair value of investments). |
Inputs that are used in determining fair value of an investment may include price information, credit data, volatility statistics, and other factors. These inputs can be either observable or unobservable. The availability of observable inputs can vary between investments, and is affected by various factors such as the type of investment, and the volume and level of activity for that investment or similar investments in the marketplace. The inputs will be considered by the Investment Manager, along with any other relevant factors in the calculation of an investment’s fair value. The Fund uses prices and inputs that are current as of the measurement date, which may include periods of market dislocations. During these periods, the availability of prices and inputs may be reduced for many investments. This condition could cause an investment to be reclassified between the various levels within the hierarchy.
Foreign equity securities actively traded in markets where there is a significant delay in the local close relative to the New York Stock Exchange (NYSE) are classified as Level 2. The values of these securities may include an adjustment to reflect the impact of significant market movements following the close of local trading, as described in Note 2 to the financial statements — Security Valuation.
Certain investments that have been measured at fair value using the net asset value (NAV) per share (or its equivalent) are not categorized in the fair value hierarchy. The fair value amounts presented in the table are intended to reconcile the fair value hierarchy to the amounts presented in the Portfolio of Investments. The Columbia Short-Term Cash Fund seeks to provide shareholders with maximum current income consistent with liquidity and stability of principal. Columbia Short-Term Cash Fund prices its shares with a floating NAV and no longer seeks to maintain a stable NAV.
Investments falling into the Level 3 category are primarily supported by quoted prices from brokers and dealers participating in the market for those investments. However, these may be classified as Level 3 investments due to lack of market transparency and corroboration to support these quoted prices. Additionally, valuation models may be used as the pricing source for any remaining investments classified as Level 3. These models may rely on one or more significant unobservable inputs and/or significant assumptions by the Investment Manager. Inputs used in valuations may include, but are not limited to, financial statement analysis, capital account balances, discount rates and estimated cash flows, and comparable company data.
The accompanying Notes to Financial Statements are an integral part of this statement.
| 76 | Columbia Capital Allocation Portfolios | Annual Report 2017 |
Portfolio of Investments (continued)
Columbia Capital Allocation Aggressive Portfolio, January 31, 2017
Fair value measurements (continued)
Under the direction of the Fund’s Board of Trustees (the Board), the Investment Manager’s Valuation Committee (the Committee) is responsible for overseeing the valuation procedures approved by the Board. The Committee consists of voting and non-voting members from various groups within the Investment Manager’s organization, including operations and accounting, trading and investments, compliance, risk management and legal.
The Committee meets at least monthly to review and approve valuation matters, which may include a description of specific valuation determinations, data regarding pricing information received from approved pricing vendors and brokers and the results of Board-approved valuation control policies and procedures (the Policies). The Policies address, among other things, instances when market quotations are or are not readily available, including recommendations of third party pricing vendors and a determination of appropriate pricing methodologies; events that require specific valuation determinations and assessment of fair value techniques; securities with a potential for stale pricing, including those that are illiquid, restricted, or in default; and the effectiveness of third party pricing vendors, including periodic reviews of vendors. The Committee meets more frequently, as needed, to discuss additional valuation matters, which may include the need to review back-testing results, review time-sensitive information or approve related valuation actions. The Committee reports to the Board, with members of the Committee meeting with the Board at each of its regularly scheduled meetings to discuss valuation matters and actions during the period, similar to those described earlier.
For investments categorized as Level 3, the Committee monitors information similar to that described above, which may include: (i) data specific to the issuer or comparable issuers, (ii) general market or specific sector news and (iii) quoted prices and specific or similar security transactions. The Committee considers this data and any changes from prior periods in order to assess the reasonableness of observable and unobservable inputs, any assumptions or internal models used to value those securities and changes in fair value. This data is also used to corroborate, when available, information received from approved pricing vendors and brokers. Various factors impact the frequency of monitoring this information (which may occur as often as daily). However, the Committee may determine that changes to inputs, assumptions and models are not required as a result of the monitoring procedures performed.
The following table is a summary of the inputs used to value the Fund’s investments at January 31, 2017:
| | Level 1
quoted prices
in active
markets for
identical
assets ($) | Level 2
other
significant
observable
inputs ($) | Level 3
significant
unobservable
inputs ($) | Investments
measured at
net asset
value ($) | Total ($) |
| Investments | | | | | |
| Alternative Investment Funds | 39,741,910 | — | — | — | 39,741,910 |
| Common Stocks | | | | | |
| Consumer Discretionary | 1,414,377 | 779,386 | — | — | 2,193,763 |
| Consumer Staples | 455,050 | 553,433 | — | — | 1,008,483 |
| Energy | 359,601 | 543,363 | — | — | 902,964 |
| Financials | 2,543,588 | 1,169,695 | — | — | 3,713,283 |
| Health Care | 1,438,910 | 622,637 | — | — | 2,061,547 |
| Industrials | 1,626,236 | 905,734 | — | — | 2,531,970 |
| Information Technology | 1,933,450 | 690,844 | — | — | 2,624,294 |
| Materials | 529,694 | 664,857 | — | — | 1,194,551 |
| Real Estate | 825,158 | 228,683 | — | — | 1,053,841 |
| Telecommunication Services | 119,194 | 369,116 | — | — | 488,310 |
| Utilities | 417,565 | 204,361 | — | — | 621,926 |
| Total Common Stocks | 11,662,823 | 6,732,109 | — | — | 18,394,932 |
| Equity Funds | 483,684,276 | — | — | — | 483,684,276 |
| Fixed-Income Funds | 80,968,772 | — | — | — | 80,968,772 |
| Preferred Stocks | | | | | |
| Consumer Discretionary | — | 21,843 | — | — | 21,843 |
| Financials | 164,621 | — | — | — | 164,621 |
| Total Preferred Stocks | 164,621 | 21,843 | — | — | 186,464 |
| Money Market Funds | — | — | — | 49,253,436 | 49,253,436 |
| Total Investments | 616,222,402 | 6,753,952 | — | 49,253,436 | 672,229,790 |
| Derivatives | | | | | |
| Asset | | | | | |
| Forward Foreign Currency Exchange Contracts | — | 14,146 | — | — | 14,146 |
| Futures Contracts | 540,089 | — | — | — | 540,089 |
| Swap Contracts | — | 59,358 | — | — | 59,358 |
| Liability | | | | | |
| Forward Foreign Currency Exchange Contracts | — | (15,061) | — | — | (15,061) |
| Futures Contracts | (356,934) | — | — | — | (356,934) |
| Swap Contracts | — | (180,420) | — | — | (180,420) |
| Total | 616,405,557 | 6,631,975 | — | 49,253,436 | 672,290,968 |
The accompanying Notes to Financial Statements are an integral part of this statement.
Columbia Capital Allocation Portfolios | Annual Report 2017
| 77 |
Portfolio of Investments (continued)
Columbia Capital Allocation Aggressive Portfolio, January 31, 2017
Fair value measurements (continued)
See the Portfolio of Investments for all investment classifications not indicated in the table.
The Fund’s assets assigned to the Level 2 input category are generally valued using the market approach, in which a security’s value is determined through reference to prices and information from market transactions for similar or identical assets. These assets include certain foreign securities for which a third party statistical pricing service may be employed for purposes of fair market valuation. The model utilized by such third party statistical pricing service takes into account a security’s correlation to available market data including, but not limited to, intraday index, ADR, and exchange-traded fund movements.
Derivative instruments are valued at unrealized appreciation (depreciation).
There were no transfers of financial assets between levels during the period.
The accompanying Notes to Financial Statements are an integral part of this statement.
| 78 | Columbia Capital Allocation Portfolios | Annual Report 2017 |
Statement of Assets and Liabilities
January 31, 2017
| | Columbia
Capital
Allocation
Conservative
Portfolio | Columbia
Capital
Allocation
Moderate
Conservative
Portfolio | Columbia
Capital
Allocation
Moderate
Portfolio |
| Assets | | | |
| Investments, at cost | | | |
| Unaffiliated issuers, at cost | $7,581,163 | $11,990,933 | $28,202,052 |
| Affiliated issuers, at cost | 258,179,578 | 595,712,674 | 1,444,118,742 |
| Total investments, at cost | 265,760,741 | 607,703,607 | 1,472,320,794 |
| Investments, at value | | | |
| Unaffiliated issuers, at value | 8,345,075 | 13,119,218 | 31,500,195 |
| Affiliated issuers, at value | 255,800,325 | 600,170,867 | 1,488,816,174 |
| Total investments, at value | 264,145,400 | 613,290,085 | 1,520,316,369 |
| Cash collateral held at broker | — | — | 570,000 |
| Margin deposits | 702,360 | 2,190,693 | 7,555,565 |
| Unrealized appreciation on forward foreign currency exchange contracts | 9,332 | 14,285 | 17,781 |
| Unrealized appreciation on swap contracts | 14,510 | 11,871 | 48,806 |
| Receivable for: | | | |
| Investments sold | 237,174 | 731,384 | 746,864 |
| Capital shares sold | 203,506 | 473,030 | 979,883 |
| Dividends | 314,685 | 627,945 | 1,614,635 |
| Foreign tax reclaims | 5,674 | 14,022 | 8,431 |
| Variation margin | 29,130 | 107,815 | 287,775 |
| Prepaid expenses | 1,840 | 2,475 | 4,064 |
| Total assets | 265,663,611 | 617,463,605 | 1,532,150,173 |
| Liabilities | | | |
| Unrealized depreciation on forward foreign currency exchange contracts | 6,429 | 9,846 | 18,405 |
| Premiums received on outstanding swap contracts | 178,437 | 145,994 | 600,197 |
| Payable for: | | | |
| Investments purchased | 301,689 | 601,702 | 1,625,482 |
| Capital shares purchased | 1,029,080 | 1,733,323 | 3,424,312 |
| Variation margin | 33,825 | 135,870 | 340,336 |
| Management services fees | 702 | 1,405 | 2,820 |
| Distribution and/or service fees | 2,676 | 5,936 | 14,485 |
| Transfer agent fees | 22,682 | 47,333 | 106,106 |
| Plan administration fees | 1 | — | 1 |
| Compensation of board members | 85,634 | 36,228 | 47,254 |
| Compensation of chief compliance officer | 59 | 137 | 336 |
| Other expenses | 37,714 | 51,613 | 103,095 |
| Other liabilities | — | — | 236 |
| Total liabilities | 1,698,928 | 2,769,387 | 6,283,065 |
| Net assets applicable to outstanding capital stock | $263,964,683 | $614,694,218 | $1,525,867,108 |
| Represented by | | | |
| Paid in capital | 266,483,508 | 605,268,567 | 1,449,216,848 |
| Undistributed net investment income | 832,330 | 2,187,893 | 1,535,844 |
| Accumulated net realized gain (loss) | (1,620,355) | 2,013,876 | 27,222,168 |
| Unrealized appreciation (depreciation) on: | | | |
| Investments - unaffiliated issuers | 763,912 | 1,128,285 | 3,298,143 |
| Investments - affiliated issuers | (2,379,253) | 4,458,193 | 44,697,432 |
| Foreign currency translations | (4,878) | (5,517) | (17,154) |
| Forward foreign currency exchange contracts | 2,903 | 4,439 | (624) |
| Futures contracts | (38,417) | (172,232) | 288,081 |
| Swap contracts | (75,067) | (189,286) | (373,630) |
| Total - representing net assets applicable to outstanding capital stock | $263,964,683 | $614,694,218 | $1,525,867,108 |
The accompanying Notes to Financial Statements are an integral part of this statement.
Columbia Capital Allocation Portfolios | Annual Report 2017
| 79 |
Statement of Assets and Liabilities (continued)
January 31, 2017
| | Columbia
Capital
Allocation
Conservative
Portfolio | Columbia
Capital
Allocation
Moderate
Conservative
Portfolio | Columbia
Capital
Allocation
Moderate
Portfolio |
| Class A | | | |
| Net assets | $213,724,609 | $494,948,328 | $1,309,998,225 |
| Shares outstanding | 21,718,720 | 46,623,032 | 119,176,597 |
| Net asset value per share | $9.84 | $10.62 | $10.99 |
| Maximum offering price per share(a) | $10.33 | $11.27 | $11.66 |
| Class B | | | |
| Net assets | $1,608,326 | $3,970,533 | $13,397,582 |
| Shares outstanding | 163,980 | 376,236 | 1,225,683 |
| Net asset value per share | $9.81 | $10.55 | $10.93 |
| Class C | | | |
| Net assets | $42,286,317 | $87,493,352 | $186,169,954 |
| Shares outstanding | 4,321,702 | 8,356,316 | 17,071,281 |
| Net asset value per share | $9.78 | $10.47 | $10.91 |
| Class K | | | |
| Net assets | $100,582 | $58,093 | $87,399 |
| Shares outstanding | 10,328 | 5,556 | 7,960 |
| Net asset value per share | $9.74 | $10.46 | $10.98 |
| Class R | | | |
| Net assets | $355,187 | $2,549,479 | $2,281,611 |
| Shares outstanding | 36,106 | 239,778 | 208,138 |
| Net asset value per share | $9.84 | $10.63 | $10.96 |
| Class R4 | | | |
| Net assets | $903,388 | $2,705,193 | $354,611 |
| Shares outstanding | 92,391 | 256,993 | 32,623 |
| Net asset value per share | $9.78 | $10.53 | $10.87 |
| Class R5 | | | |
| Net assets | $417,319 | $2,084,266 | $5,520,678 |
| Shares outstanding | 42,676 | 198,108 | 508,010 |
| Net asset value per share | $9.78 | $10.52 | $10.87 |
| Class Y | | | |
| Net assets | $595,232 | $408,969 | $3,459,226 |
| Shares outstanding | 60,941 | 39,339 | 318,292 |
| Net asset value per share | $9.77 | $10.40 | $10.87 |
| Class Z | | | |
| Net assets | $3,973,723 | $20,476,005 | $4,597,822 |
| Shares outstanding | 403,911 | 1,954,160 | 418,764 |
| Net asset value per share | $9.84 | $10.48 | $10.98 |
| (a) | The maximum offering price per share is calculated by dividing the net asset value per share by 1.0 minus the maximum sales charge of 4.75% for Columbia Capital Allocation Conservative Portfolio and dividing the net asset value by 1.0 minus the maximum sales charge of 5.75% for Columbia Capital Allocation Moderate Conservative Portfolio and Columbia Capital Allocation Moderate Portfolio. |
The accompanying Notes to Financial Statements are an integral part of this statement.
| 80 | Columbia Capital Allocation Portfolios | Annual Report 2017 |
Statement of Assets and Liabilities (continued)
January 31, 2017
| | Columbia
Capital
Allocation
Moderate
Aggressive
Portfolio | Columbia
Capital
Allocation
Aggressive
Portfolio |
| Assets | | |
| Investments, at cost | | |
| Unaffiliated issuers, at cost | $28,027,812 | $16,682,097 |
| Affiliated issuers, at cost | 1,981,619,027 | 612,340,467 |
| Total investments, at cost | 2,009,646,839 | 629,022,564 |
| Investments, at value | | |
| Unaffiliated issuers, at value | 31,178,491 | 18,581,396 |
| Affiliated issuers, at value | 2,079,076,640 | 653,648,394 |
| Total investments, at value | 2,110,255,131 | 672,229,790 |
| Cash | 16,468 | — |
| Cash collateral held at broker | 1,430,000 | 690,000 |
| Margin deposits | 13,501,030 | 3,381,959 |
| Unrealized appreciation on forward foreign currency exchange contracts | 12,390 | 14,146 |
| Unrealized appreciation on swap contracts | 122,674 | 59,358 |
| Receivable for: | | |
| Investments sold | 1,626,982 | 675,662 |
| Capital shares sold | 929,002 | 522,746 |
| Dividends | 1,524,890 | 294,689 |
| Foreign tax reclaims | 5,668 | 6,815 |
| Variation margin | 599,731 | 78,507 |
| Prepaid expenses | 5,110 | 2,515 |
| Trustees’ deferred compensation plan | 36,885 | — |
| Other assets | 1,035 | — |
| Total assets | 2,130,066,996 | 677,956,187 |
| Liabilities | | |
| Foreign currency (identified cost $15,554, $—) | 15,390 | — |
| Unrealized depreciation on forward foreign currency exchange contracts | 11,683 | 15,061 |
| Premiums received on outstanding swap contracts | 1,508,603 | 729,969 |
| Payable for: | | |
| Investments purchased | 1,434,204 | 289,092 |
| Capital shares purchased | 3,932,580 | 1,319,439 |
| Variation margin | 541,477 | 179,253 |
| Management services fees | 5,576 | 1,434 |
| Distribution and/or service fees | 18,448 | 6,281 |
| Transfer agent fees | 168,590 | 54,117 |
| Plan administration fees | — | 1 |
| Compensation of board members | 169,484 | 30,905 |
| Compensation of chief compliance officer | 465 | 147 |
| Other expenses | 137,199 | 68,938 |
| Trustees’ deferred compensation plan | 36,885 | — |
| Other liabilities | 164 | 194 |
| Total liabilities | 7,980,748 | 2,694,831 |
| Net assets applicable to outstanding capital stock | $2,122,086,248 | $675,261,356 |
The accompanying Notes to Financial Statements are an integral part of this statement.
Columbia Capital Allocation Portfolios | Annual Report 2017
| 81 |
Statement of Assets and Liabilities (continued)
January 31, 2017
| | Columbia
Capital
Allocation
Moderate
Aggressive
Portfolio | Columbia
Capital
Allocation
Aggressive
Portfolio |
| Represented by | | |
| Paid in capital | $1,973,503,388 | $617,439,225 |
| Undistributed (excess of distributions over) net investment income | 866,359 | (40,748) |
| Accumulated net realized gain | 47,803,472 | 14,598,468 |
| Unrealized appreciation (depreciation) on: | | |
| Investments - unaffiliated issuers | 3,150,679 | 1,899,299 |
| Investments - affiliated issuers | 97,457,613 | 41,307,927 |
| Foreign currency translations | (17,808) | (3,993) |
| Forward foreign currency exchange contracts | 707 | (915) |
| Futures contracts | (215,615) | 183,155 |
| Swap contracts | (462,547) | (121,062) |
| Total - representing net assets applicable to outstanding capital stock | $2,122,086,248 | $675,261,356 |
The accompanying Notes to Financial Statements are an integral part of this statement.
| 82 | Columbia Capital Allocation Portfolios | Annual Report 2017 |
Statement of Assets and Liabilities (continued)
January 31, 2017
| | Columbia
Capital
Allocation
Moderate
Aggressive
Portfolio | Columbia
Capital
Allocation
Aggressive
Portfolio |
| Class A | | |
| Net assets | $1,671,441,976 | $582,182,427 |
| Shares outstanding | 139,261,869 | 48,088,626 |
| Net asset value per share | $12.00 | $12.11 |
| Maximum offering price per share(a) | $12.73 | $12.85 |
| Class B | | |
| Net assets | $15,429,655 | $6,938,347 |
| Shares outstanding | 1,304,582 | 574,387 |
| Net asset value per share | $11.83 | $12.08 |
| Class C | | |
| Net assets | $216,270,805 | $75,647,980 |
| Shares outstanding | 17,966,633 | 6,381,145 |
| Net asset value per share | $12.04 | $11.85 |
| Class K | | |
| Net assets | $2,379 | $73,327 |
| Shares outstanding | 199 | 6,042 |
| Net asset value per share | $11.95 | $12.14 |
| Class R | | |
| Net assets | $3,743,092 | $2,099,180 |
| Shares outstanding | 312,186 | 174,613 |
| Net asset value per share | $11.99 | $12.02 |
| Class R4 | | |
| Net assets | $2,127,626 | $1,242,128 |
| Shares outstanding | 175,909 | 104,484 |
| Net asset value per share | $12.10 | $11.89 |
| Class R5 | | |
| Net assets | $5,706,068 | $1,637,835 |
| Shares outstanding | 472,039 | 137,826 |
| Net asset value per share | $12.09 | $11.88 |
| Class V(b) | | |
| Net assets | $86,404,409 | $— |
| Shares outstanding | 7,199,015 | — |
| Net asset value per share | $12.00 | $— |
| Maximum offering price per share(a) | $12.73 | $— |
| Class Y | | |
| Net assets | $1,127,642 | $2,111,199 |
| Shares outstanding | 95,244 | 177,770 |
| Net asset value per share | $11.84 | $11.88 |
| Class Z | | |
| Net assets | $119,832,596 | $3,328,933 |
| Shares outstanding | 10,001,319 | 276,061 |
| Net asset value per share | $11.98 | $12.06 |
| (a) | The maximum offering price per share is calculated by dividing the net asset value per share by 1.0 minus the maximum sales charge of 5.75%. |
| (b) | Effective January 24, 2017, Class T shares were renamed Class V shares. |
The accompanying Notes to Financial Statements are an integral part of this statement.
Columbia Capital Allocation Portfolios | Annual Report 2017
| 83 |
Statement of Operations
Year Ended January 31, 2017
| | Columbia
Capital
Allocation
Conservative
Portfolio | Columbia
Capital
Allocation
Moderate
Conservative
Portfolio | Columbia
Capital
Allocation
Moderate
Portfolio |
| Net investment income | | | |
| Income: | | | |
| Dividends — unaffiliated issuers | $249,136 | $386,574 | $662,255 |
| Dividends — affiliated issuers | 5,471,020 | 12,709,745 | 31,588,357 |
| Interest | 136 | 1,321 | 4,292 |
| Foreign taxes withheld | (19,949) | (30,131) | (38,545) |
| Total income | 5,700,343 | 13,067,509 | 32,216,359 |
| Expenses: | | | |
| Management services fees | 245,018 | 489,192 | 844,147 |
| Distribution and/or service fees | | | |
| Class A | 556,010 | 1,280,609 | 3,322,481 |
| Class B | 24,295 | 59,883 | 188,943 |
| Class C | 452,793 | 889,069 | 1,868,681 |
| Class R | 2,660 | 14,301 | 9,566 |
| Transfer agent fees | | | |
| Class A | 249,801 | 554,060 | 1,381,421 |
| Class B | 2,735 | 6,521 | 19,651 |
| Class C | 50,843 | 96,149 | 194,211 |
| Class K | 52 | 22 | 89 |
| Class R | 598 | 3,115 | 1,984 |
| Class R4 | 642 | 1,205 | 241 |
| Class R5 | 242 | 932 | 2,772 |
| Class Y | 11 | 8 | 37 |
| Class Z | 4,135 | 24,905 | 3,848 |
| Plan administration fees | | | |
| Class K | 248 | 108 | 438 |
| Compensation of board members | 21,618 | 22,543 | 35,926 |
| Custodian fees | 41,691 | 42,564 | 49,014 |
| Printing and postage fees | 45,205 | 77,156 | 187,004 |
| Registration fees | 119,229 | 123,156 | 136,954 |
| Audit fees | 25,742 | 22,840 | 28,076 |
| Legal fees | 9,752 | 13,047 | 21,342 |
| Compensation of chief compliance officer | 59 | 137 | 336 |
| Other | 13,354 | 22,401 | 33,801 |
| Total expenses | 1,866,733 | 3,743,923 | 8,330,963 |
| Expense reduction | — | (80) | (60) |
| Total net expenses | 1,866,733 | 3,743,843 | 8,330,903 |
| Net investment income | 3,833,610 | 9,323,666 | 23,885,456 |
The accompanying Notes to Financial Statements are an integral part of this statement.
| 84 | Columbia Capital Allocation Portfolios | Annual Report 2017 |
Statement of Operations (continued)
Year Ended January 31, 2017
| | Columbia
Capital
Allocation
Conservative
Portfolio | Columbia
Capital
Allocation
Moderate
Conservative
Portfolio | Columbia
Capital
Allocation
Moderate
Portfolio |
| Realized and unrealized gain (loss) — net | | | |
| Net realized gain (loss) on: | | | |
| Investments — unaffiliated issuers | $19,343 | $(44,976) | $(197,518) |
| Investments — affiliated issuers | (1,344,116) | 57,411 | 8,803,400 |
| Capital gain distributions from underlying affiliated funds | 1,154,698 | 4,932,639 | 24,637,501 |
| Foreign currency translations | 5,008 | 26,782 | 37,863 |
| Forward foreign currency exchange contracts | (20,696) | (31,710) | (53,291) |
| Futures contracts | 389,609 | 2,031,347 | 9,104,798 |
| Swap contracts | (304,553) | (549,968) | (631,067) |
| Net realized gain (loss) | (100,707) | 6,421,525 | 41,701,686 |
| Net change in unrealized appreciation (depreciation) on: | | | |
| Investments — unaffiliated issuers | 1,116,614 | 1,862,000 | 6,256,148 |
| Investments — affiliated issuers | 12,754,674 | 33,690,238 | 90,653,947 |
| Foreign currency translations | (3,791) | (924) | (11,976) |
| Forward foreign currency exchange contracts | 8,004 | 12,329 | 8,772 |
| Futures contracts | (336,572) | (702,763) | (946,375) |
| Swap contracts | (53,468) | (156,252) | (373,630) |
| Net change in unrealized appreciation (depreciation) | 13,485,461 | 34,704,628 | 95,586,886 |
| Net realized and unrealized gain | 13,384,754 | 41,126,153 | 137,288,572 |
| Net increase in net assets resulting from operations | $17,218,364 | $50,449,819 | $161,174,028 |
The accompanying Notes to Financial Statements are an integral part of this statement.
Columbia Capital Allocation Portfolios | Annual Report 2017
| 85 |
Statement of Operations (continued)
Year Ended January 31, 2017
| | Columbia
Capital
Allocation
Moderate
Aggressive
Portfolio | Columbia
Capital
Allocation
Aggressive
Portfolio |
| Net investment income | | |
| Income: | | |
| Dividends — unaffiliated issuers | $583,840 | $440,460 |
| Dividends — affiliated issuers | 37,311,674 | 9,992,442 |
| Interest | 11,948 | 1,880 |
| Foreign taxes withheld | (28,620) | (31,908) |
| Total income | 37,878,842 | 10,402,874 |
| Expenses: | | |
| Management services fees | 1,878,216 | 474,170 |
| Distribution and/or service fees | | |
| Class A | 4,228,768 | 1,441,355 |
| Class B | 230,564 | 96,864 |
| Class C | 2,154,752 | 721,988 |
| Class R | 16,939 | 6,482 |
| Class V(a) | 218,972 | — |
| Transfer agent fees | | |
| Class A | 2,404,899 | 712,587 |
| Class B | 33,169 | 11,962 |
| Class C | 306,211 | 89,268 |
| Class K | 9 | 35 |
| Class R | 4,810 | 1,620 |
| Class R4 | 1,906 | 846 |
| Class R5 | 2,522 | 689 |
| Class V(a) | 124,523 | — |
| Class Y | 17 | 25 |
| Class Z | 166,772 | 3,234 |
| Plan administration fees | | |
| Class K | 48 | 164 |
| Compensation of board members | 54,604 | 22,345 |
| Custodian fees | 57,956 | 51,934 |
| Printing and postage fees | 268,343 | 107,958 |
| Registration fees | 146,753 | 127,732 |
| Audit fees | 30,251 | 29,876 |
| Legal fees | 26,751 | 13,288 |
| Compensation of chief compliance officer | 465 | 147 |
| Other | (823,798) | 19,572 |
| Total expenses | 11,534,422 | 3,934,141 |
| Expense reduction | (9,774) | (120) |
| Total net expenses | 11,524,648 | 3,934,021 |
| Net investment income | 26,354,194 | 6,468,853 |
The accompanying Notes to Financial Statements are an integral part of this statement.
| 86 | Columbia Capital Allocation Portfolios | Annual Report 2017 |
Statement of Operations (continued)
Year Ended January 31, 2017
| | Columbia
Capital
Allocation
Moderate
Aggressive
Portfolio | Columbia
Capital
Allocation
Aggressive
Portfolio |
| Realized and unrealized gain (loss) — net | | �� |
| Net realized gain (loss) on: | | |
| Investments — unaffiliated issuers | $(320,835) | $11,162 |
| Investments — affiliated issuers | 30,593,550 | 8,336,726 |
| Capital gain distributions from underlying affiliated funds | 29,669,750 | 14,247,156 |
| Foreign currency translations | (1,350) | (1,426) |
| Forward foreign currency exchange contracts | (36,692) | (45,029) |
| Futures contracts | 24,563,282 | 4,714,419 |
| Swap contracts | (835,341) | (243,247) |
| Net realized gain | 83,632,364 | 27,019,761 |
| Net change in unrealized appreciation (depreciation) on: | | |
| Investments — unaffiliated issuers | 6,584,711 | 3,384,826 |
| Investments — affiliated issuers | 145,069,093 | 54,050,039 |
| Foreign currency translations | (17,801) | (3,986) |
| Forward foreign currency exchange contracts | 7,614 | 7,750 |
| Futures contracts | 2,239,427 | 404,096 |
| Swap contracts | (462,547) | (121,062) |
| Net change in unrealized appreciation (depreciation) | 153,420,497 | 57,721,663 |
| Net realized and unrealized gain | 237,052,861 | 84,741,424 |
| Net increase in net assets resulting from operations | $263,407,055 | $91,210,277 |
| (a) | Effective January 24, 2017, Class T shares were renamed Class V shares. |
The accompanying Notes to Financial Statements are an integral part of this statement.
Columbia Capital Allocation Portfolios | Annual Report 2017
| 87 |
Statement of Changes in Net Assets
| | Columbia Capital Allocation
Conservative Portfolio | Columbia Capital Allocation
Moderate Conservative Portfolio |
| | Year Ended
January 31, 2017 | Year Ended
January 31, 2016 | Year Ended
January 31, 2017 | Year Ended
January 31, 2016 |
| Operations | | | | |
| Net investment income | $3,833,610 | $4,915,716 | $9,323,666 | $11,595,181 |
| Net realized gain (loss) | (100,707) | 5,070,209 | 6,421,525 | 22,242,537 |
| Net change in unrealized appreciation (depreciation) | 13,485,461 | (18,185,256) | 34,704,628 | (51,708,726) |
| Net increase (decrease) in net assets resulting from operations | 17,218,364 | (8,199,331) | 50,449,819 | (17,871,008) |
| Distributions to shareholders | | | | |
| Net investment income | | | | |
| Class A | (3,381,022) | (4,448,036) | (7,758,691) | (10,811,068) |
| Class B | (18,407) | (57,097) | (42,600) | (138,567) |
| Class C | (354,966) | (547,575) | (705,691) | (1,186,601) |
| Class K | (1,597) | (1,945) | (700) | (66) |
| Class R | (6,627) | (7,103) | (34,021) | (74,076) |
| Class R4 | (9,373) | (3,344) | (26,712) | (24,707) |
| Class R5 | (8,416) | (4,091) | (36,323) | (10,527) |
| Class Y | (9,897) | (1,638) | (9,366) | (188) |
| Class Z | (65,500) | (66,888) | (401,349) | (602,055) |
| Net realized gains | | | | |
| Class A | (1,943,762) | (4,217,753) | (9,926,178) | (15,881,079) |
| Class B | (21,611) | (84,291) | (120,025) | (329,065) |
| Class C | (403,214) | (858,561) | (1,739,288) | (2,747,116) |
| Class K | (866) | (1,788) | (1,059) | (93) |
| Class R | (5,220) | (8,908) | (48,866) | (117,251) |
| Class R4 | (3,795) | (3,054) | (15,373) | (31,447) |
| Class R5 | (4,277) | (3,797) | (36,592) | (12,668) |
| Class Y | (4,552) | (1,675) | (10,714) | (258) |
| Class Z | (30,895) | (54,705) | (462,330) | (790,424) |
| Total distributions to shareholders | (6,273,997) | (10,372,249) | (21,375,878) | (32,757,256) |
| Decrease in net assets from capital stock activity | (14,749,960) | (18,116,381) | (34,133,689) | (12,096,589) |
| Total decrease in net assets | (3,805,593) | (36,687,961) | (5,059,748) | (62,724,853) |
| Net assets at beginning of year | 267,770,276 | 304,458,237 | 619,753,966 | 682,478,819 |
| Net assets at end of year | $263,964,683 | $267,770,276 | $614,694,218 | $619,753,966 |
| Undistributed net investment income | $832,330 | $482,258 | $2,187,893 | $860,363 |
The accompanying Notes to Financial Statements are an integral part of this statement.
| 88 | Columbia Capital Allocation Portfolios | Annual Report 2017 |
Statement of Changes in Net Assets (continued)
| | Columbia Capital Allocation
Moderate Portfolio | Columbia Capital Allocation
Moderate Aggressive Portfolio |
| | Year Ended
January 31, 2017 | Year Ended
January 31, 2016 | Year Ended
January 31, 2017 | Year Ended
January 31, 2016 |
| Operations | | | | |
| Net investment income | $23,885,456 | $25,694,452 | $26,354,194 | $30,831,267 |
| Net realized gain | 41,701,686 | 90,021,363 | 83,632,364 | 117,283,107 |
| Net change in unrealized appreciation (depreciation) | 95,586,886 | (159,127,232) | 153,420,497 | (220,323,423) |
| Net increase (decrease) in net assets resulting from operations | 161,174,028 | (43,411,417) | 263,407,055 | (72,209,049) |
| Distributions to shareholders | | | | |
| Net investment income | | | | |
| Class A | (25,546,421) | (27,562,443) | (22,345,765) | (31,928,009) |
| Class B | (192,397) | (366,818) | (130,865) | (403,740) |
| Class C | (2,250,044) | (2,312,461) | (1,662,664) | (2,383,812) |
| Class K | (2,961) | (6,180) | (144) | (1,839) |
| Class R | (34,446) | (25,036) | (38,439) | (61,435) |
| Class R4 | (5,209) | (3,442) | (21,568) | (24,085) |
| Class R5 | (123,308) | (49,239) | (82,643) | (57,960) |
| Class V(a) | — | — | (1,156,475) | (1,678,969) |
| Class Y | (69,291) | (5,079) | (17,488) | (5,799) |
| Class Z | (88,153) | (57,266) | (1,861,033) | (2,545,167) |
| Net realized gains | | | | |
| Class A | (32,907,743) | (77,452,249) | (61,207,186) | (100,812,247) |
| Class B | (481,470) | (1,745,165) | (785,428) | (2,379,517) |
| Class C | (4,653,822) | (10,404,243) | (7,800,757) | (12,245,374) |
| Class K | (6,319) | (16,894) | (90) | (5,407) |
| Class R | (41,694) | (84,727) | (119,631) | (230,256) |
| Class R4 | (5,430) | (6,698) | (48,999) | (65,357) |
| Class R5 | (138,173) | (110,284) | (176,327) | (130,866) |
| Class V(a) | — | — | (3,168,524) | (5,315,962) |
| Class Y | (71,478) | (11,037) | (29,260) | (11,157) |
| Class Z | (89,876) | (139,513) | (4,282,177) | (7,066,677) |
| Total distributions to shareholders | (66,708,235) | (120,358,774) | (104,935,463) | (167,353,635) |
| Increase (decrease) in net assets from capital stock activity | (75,066,971) | (705,114) | (127,731,803) | 9,089,709 |
| Total increase (decrease) in net assets | 19,398,822 | (164,475,305) | 30,739,789 | (230,472,975) |
| Net assets at beginning of year | 1,506,468,286 | 1,670,943,591 | 2,091,346,459 | 2,321,819,434 |
| Net assets at end of year | $1,525,867,108 | $1,506,468,286 | $2,122,086,248 | $2,091,346,459 |
| Undistributed (excess of distributions over) net investment income | $1,535,844 | $2,207,343 | $866,359 | $(235,873) |
| (a) | Effective January 24, 2017, Class T shares were renamed Class V shares. |
The accompanying Notes to Financial Statements are an integral part of this statement.
Columbia Capital Allocation Portfolios | Annual Report 2017
| 89 |
Statement of Changes in Net Assets (continued)
| | Columbia Capital Allocation
Aggressive Portfolio |
| | Year Ended
January 31, 2017 | Year Ended
January 31, 2016 |
| Operations | | |
| Net investment income | $6,468,853 | $7,358,674 |
| Net realized gain | 27,019,761 | 43,822,743 |
| Net change in unrealized appreciation (depreciation) | 57,721,663 | (76,946,677) |
| Net increase (decrease) in net assets resulting from operations | 91,210,277 | (25,765,260) |
| Distributions to shareholders | | |
| Net investment income | | |
| Class A | (6,715,750) | (9,360,758) |
| Class B | (37,944) | (120,732) |
| Class C | (383,582) | (640,020) |
| Class K | (872) | (994) |
| Class R | (18,790) | (15,063) |
| Class R4 | (9,014) | (22,722) |
| Class R5 | (22,254) | (21,607) |
| Class Y | (32,328) | (4,922) |
| Class Z | (44,934) | (34,270) |
| Net realized gains | | |
| Class A | (21,486,728) | (39,256,522) |
| Class B | (356,433) | (1,044,471) |
| Class C | (2,751,643) | (4,701,579) |
| Class K | (2,445) | (3,849) |
| Class R | (46,212) | (65,849) |
| Class R4 | (22,129) | (54,834) |
| Class R5 | (48,687) | (46,277) |
| Class Y | (62,134) | (7,475) |
| Class Z | (102,972) | (117,323) |
| Total distributions to shareholders | (32,144,851) | (55,519,267) |
| Increase (decrease) in net assets from capital stock activity | (17,318,215) | 49,105,387 |
| Total increase (decrease) in net assets | 41,747,211 | (32,179,140) |
| Net assets at beginning of year | 633,514,145 | 665,693,285 |
| Net assets at end of year | $675,261,356 | $633,514,145 |
| Excess of distributions over net investment income | $(40,748) | $(11,821) |
The accompanying Notes to Financial Statements are an integral part of this statement.
| 90 | Columbia Capital Allocation Portfolios | Annual Report 2017 |
Statement of Changes in Net Assets (continued)
| | Columbia Capital Allocation
Conservative Portfolio | Columbia Capital Allocation
Moderate Conservative Portfolio |
| | Year Ended | Year Ended | Year Ended | Year Ended |
| | January 31, 2017 | January 31, 2016 | January 31, 2017 | January 31, 2016 |
| | Shares | Dollars ($) | Shares | Dollars ($) | Shares | Dollars ($) | Shares | Dollars ($) |
| Capital stock activity |
| Class A | | | | | | | | |
| Subscriptions (a) | 3,453,730 | 33,841,486 | 2,526,066 | 25,121,440 | 5,244,058 | 55,106,729 | 5,576,851 | 60,564,594 |
| Distributions reinvested | 516,173 | 5,032,734 | 843,495 | 8,241,451 | 1,566,725 | 16,243,578 | 2,300,914 | 24,473,485 |
| Redemptions | (5,146,261) | (50,412,406) | (4,741,051) | (47,178,086) | (9,094,068) | (95,614,956) | (8,689,832) | (94,438,223) |
| Net decrease | (1,176,358) | (11,538,186) | (1,371,490) | (13,815,195) | (2,283,285) | (24,264,649) | (812,067) | (9,400,144) |
| Class B | | | | | | | | |
| Subscriptions | 18,485 | 179,248 | 16,958 | 170,969 | 24,012 | 250,585 | 33,232 | 359,669 |
| Distributions reinvested | 3,955 | 38,414 | 13,764 | 134,536 | 14,335 | 147,454 | 39,619 | 420,807 |
| Redemptions (a) | (215,499) | (2,091,112) | (443,974) | (4,416,213) | (446,898) | (4,653,023) | (852,725) | (9,261,357) |
| Net decrease | (193,059) | (1,873,450) | (413,252) | (4,110,708) | (408,551) | (4,254,984) | (779,874) | (8,480,881) |
| Class C | | | | | | | | |
| Subscriptions | 838,245 | 8,143,830 | 917,744 | 9,088,962 | 1,384,265 | 14,325,161 | 1,530,067 | 16,400,103 |
| Distributions reinvested | 74,314 | 720,321 | 139,171 | 1,351,229 | 221,186 | 2,259,044 | 344,213 | 3,610,210 |
| Redemptions | (1,241,525) | (12,084,646) | (1,172,463) | (11,568,458) | (1,755,249) | (18,210,715) | (1,692,662) | (18,082,443) |
| Net increase (decrease) | (328,966) | (3,220,495) | (115,548) | (1,128,267) | (149,798) | (1,626,510) | 181,618 | 1,927,870 |
| Class K | | | | | | | | |
| Subscriptions | 65 | 641 | 62 | 605 | 5,157 | 53,755 | — | — |
| Distributions reinvested | 249 | 2,402 | 376 | 3,638 | 163 | 1,670 | 3 | 26 |
| Redemptions | (40) | (392) | (19) | (182) | (41) | (424) | (19) | (199) |
| Net increase (decrease) | 274 | 2,651 | 419 | 4,061 | 5,279 | 55,001 | (16) | (173) |
| Class R | | | | | | | | |
| Subscriptions | 22,966 | 222,201 | 31,147 | 315,995 | 112,849 | 1,186,379 | 360,874 | 3,845,506 |
| Distributions reinvested | 1,045 | 10,192 | 1,611 | 15,675 | 6,830 | 70,914 | 14,946 | 157,524 |
| Redemptions | (39,802) | (391,845) | (1,238) | (12,407) | (372,938) | (3,870,315) | (85,630) | (910,701) |
| Net increase (decrease) | (15,791) | (159,452) | 31,520 | 319,263 | (253,259) | (2,613,022) | 290,190 | 3,092,329 |
| Class R4 | | | | | | | | |
| Subscriptions | 95,705 | 931,733 | 6,500 | 64,994 | 205,466 | 2,156,698 | 43,013 | 459,448 |
| Distributions reinvested | 1,349 | 13,104 | 648 | 6,303 | 4,068 | 41,999 | 5,320 | 56,026 |
| Redemptions | (20,119) | (195,719) | (7,196) | (71,028) | (60,148) | (606,465) | (29,409) | (315,011) |
| Net increase (decrease) | 76,935 | 749,118 | (48) | 269 | 149,386 | 1,592,232 | 18,924 | 200,463 |
| Class R5 | | | | | | | | |
| Subscriptions | 28,267 | 269,522 | 34,554 | 338,277 | 156,819 | 1,618,245 | 54,090 | 572,346 |
| Distributions reinvested | 1,304 | 12,630 | 815 | 7,792 | 7,081 | 72,827 | 2,218 | 23,065 |
| Redemptions | (21,142) | (206,959) | (7,172) | (69,298) | (34,031) | (356,911) | (7,985) | (82,485) |
| Net increase | 8,429 | 75,193 | 28,197 | 276,771 | 129,869 | 1,334,161 | 48,323 | 512,926 |
| Class Y | | | | | | | | |
| Subscriptions | 60,831 | 588,974 | 17,151 | 165,939 | 60,918 | 606,952 | 962 | 10,320 |
| Distributions reinvested | 1,483 | 14,385 | 339 | 3,213 | 1,968 | 19,991 | 30 | 315 |
| Redemptions | (19,091) | (186,664) | (9) | (88) | (24,524) | (252,259) | (366) | (3,908) |
| Net increase | 43,223 | 416,695 | 17,481 | 169,064 | 38,362 | 374,684 | 626 | 6,727 |
| Class Z | | | | | | | | |
| Subscriptions | 227,542 | 2,228,637 | 213,994 | 2,096,292 | 571,146 | 5,922,134 | 470,076 | 5,022,976 |
| Distributions reinvested | 8,487 | 82,751 | 9,674 | 94,396 | 38,011 | 388,976 | 58,675 | 616,172 |
| Redemptions | (154,482) | (1,513,422) | (204,935) | (2,022,327) | (1,062,959) | (11,041,712) | (525,729) | (5,594,854) |
| Net increase (decrease) | 81,547 | 797,966 | 18,733 | 168,361 | (453,802) | (4,730,602) | 3,022 | 44,294 |
| Total net decrease | (1,503,766) | (14,749,960) | (1,803,988) | (18,116,381) | (3,225,799) | (34,133,689) | (1,049,254) | (12,096,589) |
| (a) | Includes conversions of Class B shares to Class A shares, if any. |
The accompanying Notes to Financial Statements are an integral part of this statement.
Columbia Capital Allocation Portfolios | Annual Report 2017
| 91 |
Statement of Changes in Net Assets (continued)
| | Columbia Capital Allocation
Moderate Portfolio | Columbia Capital Allocation
Moderate Aggressive Portfolio |
| | Year Ended | Year Ended | Year Ended | Year Ended |
| | January 31, 2017 | January 31, 2016 | January 31, 2017 | January 31, 2016 |
| | Shares | Dollars ($) | Shares | Dollars ($) | Shares | Dollars ($) | Shares | Dollars ($) |
| Capital stock activity |
| Class A | | | | | | | | |
| Subscriptions (a) | 9,418,177 | 101,647,267 | 10,333,555 | 117,917,557 | 8,889,781 | 104,260,537 | 11,604,996 | 143,928,857 |
| Distributions reinvested | 5,439,534 | 57,678,903 | 9,395,199 | 103,690,280 | 6,231,650 | 72,007,188 | 9,395,759 | 113,615,323 |
| Redemptions | (20,915,655) | (225,993,157) | (19,550,249) | (222,999,413) | (23,465,811) | (276,406,424) | (19,147,608) | (237,749,912) |
| Net increase (decrease) | (6,057,944) | (66,666,987) | 178,505 | (1,391,576) | (8,344,380) | (100,138,699) | 1,853,147 | 19,794,268 |
| Class B | | | | | | | | |
| Subscriptions | 38,186 | 408,896 | 56,625 | 645,503 | 21,777 | 249,110 | 70,638 | 862,866 |
| Distributions reinvested | 63,797 | 670,795 | 190,624 | 2,102,322 | 73,563 | 835,816 | 198,084 | 2,378,909 |
| Redemptions (a) | (1,207,783) | (12,929,186) | (2,096,547) | (23,986,672) | (1,624,713) | (18,766,142) | (2,440,858) | (30,260,236) |
| Net decrease | (1,105,800) | (11,849,495) | (1,849,298) | (21,238,847) | (1,529,373) | (17,681,216) | (2,172,136) | (27,018,461) |
| Class C | | | | | | | | |
| Subscriptions | 2,766,131 | 29,626,140 | 3,249,915 | 36,695,291 | 2,452,238 | 28,887,441 | 2,871,075 | 35,637,176 |
| Distributions reinvested | 652,731 | 6,857,159 | 1,153,671 | 12,625,304 | 699,901 | 8,115,443 | 1,006,697 | 12,223,008 |
| Redemptions | (3,740,196) | (40,096,834) | (2,792,354) | (31,606,349) | (3,585,302) | (42,353,594) | (2,513,149) | (31,310,351) |
| Net increase (decrease) | (321,334) | (3,613,535) | 1,611,232 | 17,714,246 | (433,163) | (5,350,710) | 1,364,623 | 16,549,833 |
| Class K | | | | | | | | |
| Subscriptions | 1,593 | 17,166 | 1,780 | 20,150 | — | — | 45 | 581 |
| Distributions reinvested | 871 | 9,175 | 2,077 | 22,887 | 10 | 113 | 586 | 7,058 |
| Redemptions | (22,657) | (245,793) | (1,142) | (12,932) | (7,915) | (92,153) | (440) | (5,714) |
| Net increase (decrease) | (20,193) | (219,452) | 2,715 | 30,105 | (7,905) | (92,040) | 191 | 1,925 |
| Class R | | | | | | | | |
| Subscriptions | 106,526 | 1,144,940 | 39,494 | 452,709 | 113,401 | 1,334,387 | 117,899 | 1,460,199 |
| Distributions reinvested | 6,305 | 66,676 | 9,850 | 108,793 | 12,659 | 146,306 | 23,993 | 290,150 |
| Redemptions | (34,733) | (374,518) | (59,708) | (670,748) | (133,089) | (1,545,330) | (165,990) | (2,026,526) |
| Net increase (decrease) | 78,098 | 837,098 | (10,364) | (109,246) | (7,029) | (64,637) | (24,098) | (276,177) |
| Class R4 | | | | | | | | |
| Subscriptions | 12,499 | 135,270 | 16,349 | 182,991 | 84,234 | 1,009,531 | 22,127 | 277,972 |
| Distributions reinvested | 1,003 | 10,531 | 936 | 9,952 | 6,045 | 70,443 | 7,345 | 89,265 |
| Redemptions | (594) | (6,378) | (91) | (1,000) | (13,979) | (165,325) | (13,921) | (169,625) |
| Net increase | 12,908 | 139,423 | 17,194 | 191,943 | 76,300 | 914,649 | 15,551 | 197,612 |
| Class R5 | | | | | | | | |
| Subscriptions | 247,126 | 2,579,993 | 360,086 | 3,972,903 | 178,372 | 2,078,780 | 268,249 | 3,318,687 |
| Distributions reinvested | 24,913 | 261,372 | 15,097 | 159,332 | 22,221 | 258,853 | 15,836 | 188,647 |
| Redemptions | (135,707) | (1,458,706) | (10,312) | (113,121) | (43,525) | (520,989) | (20,784) | (246,098) |
| Net increase | 136,332 | 1,382,659 | 364,871 | 4,019,114 | 157,068 | 1,816,644 | 263,301 | 3,261,236 |
| Class V(b) | | | | | | | | |
| Subscriptions | — | — | — | — | 59,203 | 689,816 | 55,836 | 693,652 |
| Distributions reinvested | — | — | — | — | 301,723 | 3,486,496 | 454,646 | 5,499,006 |
| Redemptions | — | — | — | — | (794,994) | (9,366,605) | (698,845) | (8,669,705) |
| Net decrease | — | — | — | — | (434,068) | (5,190,293) | (188,363) | (2,477,047) |
| Class Y | | | | | | | | |
| Subscriptions | 291,628 | 3,078,927 | 35,546 | 389,318 | 83,261 | 959,302 | 41,904 | 498,953 |
| Distributions reinvested | 13,388 | 140,658 | 1,511 | 15,923 | 4,064 | 46,628 | 1,461 | 16,773 |
| Redemptions | (22,709) | (244,877) | (1,284) | (13,155) | (26,539) | (309,609) | (9,094) | (106,618) |
| Net increase | 282,307 | 2,974,708 | 35,773 | 392,086 | 60,786 | 696,321 | 34,271 | 409,108 |
The accompanying Notes to Financial Statements are an integral part of this statement.
| 92 | Columbia Capital Allocation Portfolios | Annual Report 2017 |
Statement of Changes in Net Assets (continued)
| | Columbia Capital Allocation
Moderate Portfolio | Columbia Capital Allocation
Moderate Aggressive Portfolio |
| | Year Ended | Year Ended | Year Ended | Year Ended |
| | January 31, 2017 | January 31, 2016 | January 31, 2017 | January 31, 2016 |
| | Shares | Dollars ($) | Shares | Dollars ($) | Shares | Dollars ($) | Shares | Dollars ($) |
| Class Z | | | | | | | | |
| Subscriptions | 701,757 | 7,595,019 | 142,637 | 1,615,688 | 1,636,520 | 19,281,751 | 1,257,040 | 15,423,589 |
| Distributions reinvested | 14,566 | 154,545 | 12,420 | 136,931 | 335,582 | 3,872,455 | 490,413 | 5,921,054 |
| Redemptions | (533,965) | (5,800,954) | (178,853) | (2,065,558) | (2,195,072) | (25,796,028) | (1,840,996) | (22,697,231) |
| Net increase (decrease) | 182,358 | 1,948,610 | (23,796) | (312,939) | (222,970) | (2,641,822) | (93,543) | (1,352,588) |
| Total net increase (decrease) | (6,813,268) | (75,066,971) | 326,832 | (705,114) | (10,684,734) | (127,731,803) | 1,052,944 | 9,089,709 |
| (a) | Includes conversions of Class B shares to Class A shares, if any. |
| (b) | Effective January 24, 2017, Class T shares were renamed Class V shares. |
The accompanying Notes to Financial Statements are an integral part of this statement.
Columbia Capital Allocation Portfolios | Annual Report 2017
| 93 |
Statement of Changes in Net Assets (continued)
| | Columbia Capital Allocation
Aggressive Portfolio |
| | Year Ended | Year Ended |
| | January 31, 2017 | January 31, 2016 |
| | Shares | Dollars ($) | Shares | Dollars ($) |
| Capital stock activity |
| Class A | | | | |
| Subscriptions (a) | 3,963,603 | 46,514,139 | 4,794,249 | 60,144,147 |
| Distributions reinvested | 2,436,608 | 27,934,275 | 3,959,049 | 48,186,327 |
| Redemptions | (7,914,776) | (93,238,477) | (5,250,361) | (66,074,788) |
| Net increase (decrease) | (1,514,565) | (18,790,063) | 3,502,937 | 42,255,686 |
| Class B | | | | |
| Subscriptions | 18,514 | 216,717 | 33,216 | 406,259 |
| Distributions reinvested | 34,660 | 392,427 | 94,616 | 1,159,885 |
| Redemptions (a) | (560,280) | (6,543,431) | (806,208) | (10,206,926) |
| Net decrease | (507,106) | (5,934,287) | (678,376) | (8,640,782) |
| Class C | | | | |
| Subscriptions | 1,223,203 | 14,035,333 | 1,449,242 | 17,781,114 |
| Distributions reinvested | 278,739 | 3,109,704 | 441,119 | 5,279,382 |
| Redemptions | (1,277,999) | (14,688,342) | (805,578) | (9,874,715) |
| Net increase | 223,943 | 2,456,695 | 1,084,783 | 13,185,781 |
| Class K | | | | |
| Subscriptions | 677 | 7,978 | 570 | 7,178 |
| Distributions reinvested | 278 | 3,196 | 380 | 4,628 |
| Redemptions | (2) | (29) | (1,313) | (16,991) |
| Net increase (decrease) | 953 | 11,145 | (363) | (5,185) |
| Class R | | | | |
| Subscriptions | 100,385 | 1,181,008 | 37,493 | 458,163 |
| Distributions reinvested | 4,416 | 50,662 | 5,776 | 69,997 |
| Redemptions | (23,630) | (276,720) | (23,015) | (279,771) |
| Net increase | 81,171 | 954,950 | 20,254 | 248,389 |
| Class R4 | | | | |
| Subscriptions | 67,448 | 790,402 | 75,164 | 927,695 |
| Distributions reinvested | 2,746 | 31,022 | 6,592 | 77,345 |
| Redemptions | (37,246) | (430,882) | (50,509) | (577,499) |
| Net increase | 32,948 | 390,542 | 31,247 | 427,541 |
| Class R5 | | | | |
| Subscriptions | 62,924 | 728,417 | 73,667 | 901,567 |
| Distributions reinvested | 6,258 | 70,819 | 5,797 | 67,672 |
| Redemptions | (27,030) | (309,906) | (14,685) | (177,904) |
| Net increase | 42,152 | 489,330 | 64,779 | 791,335 |
| Class Y | | | | |
| Subscriptions | 167,020 | 1,887,192 | 20,732 | 247,809 |
| Distributions reinvested | 8,326 | 94,339 | 1,064 | 12,182 |
| Redemptions | (17,213) | (201,690) | (2,355) | (25,801) |
| Net increase | 158,133 | 1,779,841 | 19,441 | 234,190 |
| Class Z | | | | |
| Subscriptions | 309,403 | 3,663,467 | 64,561 | 808,452 |
| Distributions reinvested | 12,344 | 141,617 | 11,894 | 143,726 |
| Redemptions | (209,618) | (2,481,452) | (27,280) | (343,746) |
| Net increase | 112,129 | 1,323,632 | 49,175 | 608,432 |
| Total net increase (decrease) | (1,370,242) | (17,318,215) | 4,093,877 | 49,105,387 |
| (a) | Includes conversions of Class B shares to Class A shares, if any. |
The accompanying Notes to Financial Statements are an integral part of this statement.
| 94 | Columbia Capital Allocation Portfolios | Annual Report 2017 |
[THIS PAGE INTENTIONALLY LEFT BLANK]
Columbia Capital Allocation Portfolios | Annual Report 2017
| 95 |
Financial Highlights
Columbia Capital Allocation Conservative Portfolio
The following table is intended to help you understand the Fund’s financial performance. Certain information reflects financial results for a single share of a class held for the periods shown. Per share net investment income (loss) amounts are calculated based on average shares outstanding during the period. Total return assumes reinvestment of all dividends and distributions, if any. Total return does not reflect payment of sales charges, if any. Total return and portfolio turnover are not annualized for periods of less than one year. The portfolio turnover rate is calculated without regard to purchase and sales transactions of short-term instruments and certain derivatives, if any. If such transactions were included, the Fund’s portfolio turnover rate may be higher.
| Year ended | Net asset value,
beginning of
period | Net
investment
income | Net
realized
and
unrealized
gain (loss) | Total from
investment
operations | Distributions
from net
investment
income | Distributions
from net
realized
gains |
| Class A |
| 1/31/2017 | $9.45 | 0.15 | 0.48 | 0.63 | (0.15) | (0.09) |
| 1/31/2016 | $10.10 | 0.18 | (0.46) | (0.28) | (0.19) | (0.18) |
| 1/31/2015 | $10.34 | 0.18 | 0.35 | 0.53 | (0.19) | (0.58) |
| 1/31/2014 | $10.63 | 0.20 | 0.14 | 0.34 | (0.27) | (0.36) |
| 1/31/2013 | $10.32 | 0.24 | 0.54 | 0.78 | (0.35) | (0.12) |
| Class B |
| 1/31/2017 | $9.42 | 0.07 | 0.48 | 0.55 | (0.07) | (0.09) |
| 1/31/2016 | $10.07 | 0.10 | (0.45) | (0.35) | (0.12) | (0.18) |
| 1/31/2015 | $10.31 | 0.09 | 0.37 | 0.46 | (0.12) | (0.58) |
| 1/31/2014 | $10.60 | 0.11 | 0.15 | 0.26 | (0.19) | (0.36) |
| 1/31/2013 | $10.29 | 0.15 | 0.54 | 0.69 | (0.26) | (0.12) |
| Class C |
| 1/31/2017 | $9.40 | 0.07 | 0.47 | 0.54 | (0.07) | (0.09) |
| 1/31/2016 | $10.05 | 0.11 | (0.46) | (0.35) | (0.12) | (0.18) |
| 1/31/2015 | $10.28 | 0.10 | 0.37 | 0.47 | (0.12) | (0.58) |
| 1/31/2014 | $10.58 | 0.12 | 0.13 | 0.25 | (0.19) | (0.36) |
| 1/31/2013 | $10.28 | 0.16 | 0.53 | 0.69 | (0.27) | (0.12) |
| Class K |
| 1/31/2017 | $9.36 | 0.15 | 0.47 | 0.62 | (0.15) | (0.09) |
| 1/31/2016 | $10.01 | 0.19 | (0.46) | (0.27) | (0.20) | (0.18) |
| 1/31/2015 | $10.24 | 0.18 | 0.37 | 0.55 | (0.20) | (0.58) |
| 1/31/2014 | $10.54 | 0.23 | 0.12 | 0.35 | (0.29) | (0.36) |
| 1/31/2013 | $10.25 | 0.24 | 0.53 | 0.77 | (0.36) | (0.12) |
| Class R |
| 1/31/2017 | $9.45 | 0.12 | 0.48 | 0.60 | (0.12) | (0.09) |
| 1/31/2016 | $10.10 | 0.17 | (0.47) | (0.30) | (0.17) | (0.18) |
| 1/31/2015 | $10.33 | 0.15 | 0.37 | 0.52 | (0.17) | (0.58) |
| 1/31/2014 | $10.63 | 0.20 | 0.11 | 0.31 | (0.25) | (0.36) |
| 1/31/2013 | $10.32 | 0.25 | 0.50 | 0.75 | (0.32) | (0.12) |
The accompanying Notes to Financial Statements are an integral part of this statement.
| 96 | Columbia Capital Allocation Portfolios | Annual Report 2017 |
Total
distributions to
shareholders | Net
asset
value,
end of
period | Total
return | Total gross
expense
ratio to
average
net assets(a) | Total net
expense
ratio to
average
net assets(a),(b) | Net investment
income
ratio to
average
net assets | Portfolio
turnover | Net
assets,
end of
period
(000’s) |
| |
| (0.24) | $9.84 | 6.67% | 0.55% | 0.55% | 1.51% | 24% | $213,725 |
| (0.37) | $9.45 | (2.81%) | 0.52% | 0.52% (c) | 1.83% | 24% | $216,423 |
| (0.77) | $10.10 | 5.24% | 0.55% | 0.55% (c) | 1.69% | 12% | $245,212 |
| (0.63) | $10.34 | 3.28% | 0.50% | 0.50% (c) | 1.91% | 22% | $263,334 |
| (0.47) | $10.63 | 7.62% | 0.48% | 0.48% (c) | 2.28% | 19% | $282,382 |
| |
| (0.16) | $9.81 | 5.90% | 1.30% | 1.30% | 0.74% | 24% | $1,608 |
| (0.30) | $9.42 | (3.55%) | 1.27% | 1.27% (c) | 0.98% | 24% | $3,364 |
| (0.70) | $10.07 | 4.46% | 1.30% | 1.30% (c) | 0.90% | 12% | $7,759 |
| (0.55) | $10.31 | 2.51% | 1.25% | 1.25% (c) | 1.07% | 22% | $12,454 |
| (0.38) | $10.60 | 6.79% | 1.23% | 1.23% (c) | 1.47% | 19% | $19,598 |
| |
| (0.16) | $9.78 | 5.80% | 1.30% | 1.30% | 0.76% | 24% | $42,286 |
| (0.30) | $9.40 | (3.56%) | 1.27% | 1.27% (c) | 1.08% | 24% | $43,719 |
| (0.70) | $10.05 | 4.57% | 1.30% | 1.30% (c) | 0.95% | 12% | $47,899 |
| (0.55) | $10.28 | 2.43% | 1.26% | 1.26% (c) | 1.18% | 22% | $47,435 |
| (0.39) | $10.58 | 6.75% | 1.23% | 1.23% (c) | 1.54% | 19% | $45,368 |
| |
| (0.24) | $9.74 | 6.70% | 0.49% | 0.49% | 1.58% | 24% | $101 |
| (0.38) | $9.36 | (2.76%) | 0.46% | 0.46% | 1.91% | 24% | $94 |
| (0.78) | $10.01 | 5.48% | 0.47% | 0.47% | 1.79% | 12% | $96 |
| (0.65) | $10.24 | 3.35% | 0.41% | 0.41% | 2.16% | 22% | $99 |
| (0.48) | $10.54 | 7.62% | 0.39% | 0.39% | 2.27% | 19% | $12 |
| |
| (0.21) | $9.84 | 6.41% | 0.80% | 0.80% | 1.19% | 24% | $355 |
| (0.35) | $9.45 | (3.05%) | 0.77% | 0.77% (c) | 1.72% | 24% | $490 |
| (0.75) | $10.10 | 5.07% | 0.80% | 0.80% (c) | 1.46% | 12% | $206 |
| (0.61) | $10.33 | 2.94% | 0.76% | 0.76% (c) | 1.91% | 22% | $179 |
| (0.44) | $10.63 | 7.39% | 0.72% | 0.72% (c) | 2.36% | 19% | $114 |
Columbia Capital Allocation Portfolios | Annual Report 2017
| 97 |
Financial Highlights (continued)
Columbia Capital Allocation Conservative Portfolio
| Year ended | Net asset value,
beginning of
period | Net
investment
income | Net
realized
and
unrealized
gain (loss) | Total from
investment
operations | Distributions
from net
investment
income | Distributions
from net
realized
gains |
| Class R4 |
| 1/31/2017 | $9.39 | 0.17 | 0.48 | 0.65 | (0.17) | (0.09) |
| 1/31/2016 | $10.04 | 0.20 | (0.45) | (0.25) | (0.22) | (0.18) |
| 1/31/2015 | $10.29 | 0.25 | 0.30 | 0.55 | (0.22) | (0.58) |
| 1/31/2014 (d) | $10.53 | 0.18 | 0.09 | 0.27 | (0.26) | (0.25) |
| Class R5 |
| 1/31/2017 | $9.39 | 0.18 | 0.48 | 0.66 | (0.18) | (0.09) |
| 1/31/2016 | $10.05 | 0.25 | (0.50) | (0.25) | (0.23) | (0.18) |
| 1/31/2015 | $10.29 | 0.17 | 0.40 | 0.57 | (0.23) | (0.58) |
| 1/31/2014 (f) | $10.53 | 0.18 | 0.09 | 0.27 | (0.26) | (0.25) |
| Class Y |
| 1/31/2017 | $9.39 | 0.18 | 0.47 | 0.65 | (0.18) | (0.09) |
| 1/31/2016 | $10.04 | 0.20 | (0.43) | (0.23) | (0.24) | (0.18) |
| 1/31/2015 | $10.29 | 0.20 | 0.36 | 0.56 | (0.23) | (0.58) |
| 1/31/2014 (g) | $10.53 | 0.19 | 0.09 | 0.28 | (0.27) | (0.25) |
| Class Z |
| 1/31/2017 | $9.45 | 0.18 | 0.47 | 0.65 | (0.17) | (0.09) |
| 1/31/2016 | $10.10 | 0.21 | (0.46) | (0.25) | (0.22) | (0.18) |
| 1/31/2015 | $10.33 | 0.20 | 0.37 | 0.57 | (0.22) | (0.58) |
| 1/31/2014 | $10.63 | 0.24 | 0.12 | 0.36 | (0.30) | (0.36) |
| 1/31/2013 | $10.32 | 0.30 | 0.51 | 0.81 | (0.38) | (0.12) |
| Notes to Financial Highlights |
| (a) | In addition to the fees and expenses that the Fund bears directly, the Fund indirectly bears a pro rata share of the fees and expenses of any other funds in which it invests. Such indirect expenses are not included in the Fund’s reported expense ratios. |
| (b) | Total net expenses include the impact of certain fee waivers/expense reimbursements made by the Investment Manager and certain of its affiliates, if applicable. |
| (c) | The benefits derived from expense reductions had an impact of less than 0.01%. |
| (d) | Class R4 shares commenced operations on June 13, 2013. Per share data and total return reflect activity from that date. |
| (e) | Annualized. |
| (f) | Class R5 shares commenced operations on June 13, 2013. Per share data and total return reflect activity from that date. |
| (g) | Class Y shares commenced operations on June 13, 2013. Per share data and total return reflect activity from that date. |
The accompanying Notes to Financial Statements are an integral part of this statement.
| 98 | Columbia Capital Allocation Portfolios | Annual Report 2017 |
Total
distributions to
shareholders | Net
asset
value,
end of
period | Total
return | Total gross
expense
ratio to
average
net assets(a) | Total net
expense
ratio to
average
net assets(a),(b) | Net investment
income
ratio to
average
net assets | Portfolio
turnover | Net
assets,
end of
period
(000’s) |
| |
| (0.26) | $9.78 | 6.98% | 0.31% | 0.31% | 1.76% | 24% | $903 |
| (0.40) | $9.39 | (2.57%) | 0.27% | 0.27% (c) | 2.06% | 24% | $145 |
| (0.80) | $10.04 | 5.41% | 0.31% | 0.31% (c) | 2.44% | 12% | $156 |
| (0.51) | $10.29 | 2.56% | 0.23% (e) | 0.23% (c),(e) | 2.67% (e) | 22% | $2 |
| |
| (0.27) | $9.78 | 7.05% | 0.24% | 0.24% | 1.84% | 24% | $417 |
| (0.41) | $9.39 | (2.60%) | 0.21% | 0.21% | 2.66% | 24% | $322 |
| (0.81) | $10.05 | 5.60% | 0.25% | 0.25% | 1.80% | 12% | $61 |
| (0.51) | $10.29 | 2.64% | 0.12% (e) | 0.12% (e) | 2.78% (e) | 22% | $2 |
| |
| (0.27) | $9.77 | 6.99% | 0.20% | 0.20% | 1.86% | 24% | $595 |
| (0.42) | $9.39 | (2.37%) | 0.15% | 0.15% | 2.13% | 24% | $166 |
| (0.81) | $10.04 | 5.55% | 0.17% | 0.17% | 2.08% | 12% | $2 |
| (0.52) | $10.29 | 2.68% | 0.07% (e) | 0.07% (e) | 2.83% (e) | 22% | $2 |
| |
| (0.26) | $9.84 | 6.94% | 0.30% | 0.30% | 1.79% | 24% | $3,974 |
| (0.40) | $9.45 | (2.56%) | 0.27% | 0.27% (c) | 2.09% | 24% | $3,046 |
| (0.80) | $10.10 | 5.60% | 0.30% | 0.30% (c) | 1.96% | 12% | $3,067 |
| (0.66) | $10.33 | 3.42% | 0.26% | 0.26% (c) | 2.26% | 22% | $2,719 |
| (0.50) | $10.63 | 7.91% | 0.22% | 0.22% (c) | 2.80% | 19% | $700 |
Columbia Capital Allocation Portfolios | Annual Report 2017
| 99 |
Financial Highlights
Columbia Capital Allocation Moderate Conservative Portfolio
| Year ended | Net asset value,
beginning of
period | Net
investment
income | Net
realized
and
unrealized
gain (loss) | Total from
investment
operations | Distributions
from net
investment
income | Distributions
from net
realized
gains |
| Class A |
| 1/31/2017 | $10.14 | 0.17 | 0.68 | 0.85 | (0.16) | (0.21) |
| 1/31/2016 | $10.98 | 0.20 | (0.49) | (0.29) | (0.22) | (0.33) |
| 1/31/2015 | $11.37 | 0.19 | 0.51 | 0.70 | (0.23) | (0.86) |
| 1/31/2014 | $11.33 | 0.25 | 0.44 | 0.69 | (0.33) | (0.32) |
| 1/31/2013 | $10.96 | 0.25 | 0.71 | 0.96 | (0.32) | (0.27) |
| Class B |
| 1/31/2017 | $10.08 | 0.08 | 0.68 | 0.76 | (0.08) | (0.21) |
| 1/31/2016 | $10.92 | 0.11 | (0.48) | (0.37) | (0.14) | (0.33) |
| 1/31/2015 | $11.31 | 0.10 | 0.51 | 0.61 | (0.14) | (0.86) |
| 1/31/2014 | $11.28 | 0.15 | 0.45 | 0.60 | (0.25) | (0.32) |
| 1/31/2013 | $10.91 | 0.15 | 0.73 | 0.88 | (0.24) | (0.27) |
| Class C |
| 1/31/2017 | $10.00 | 0.09 | 0.67 | 0.76 | (0.08) | (0.21) |
| 1/31/2016 | $10.84 | 0.12 | (0.49) | (0.37) | (0.14) | (0.33) |
| 1/31/2015 | $11.23 | 0.11 | 0.50 | 0.61 | (0.14) | (0.86) |
| 1/31/2014 | $11.20 | 0.16 | 0.44 | 0.60 | (0.25) | (0.32) |
| 1/31/2013 | $10.84 | 0.16 | 0.71 | 0.87 | (0.24) | (0.27) |
| Class K |
| 1/31/2017 | $9.99 | 0.18 | 0.67 | 0.85 | (0.17) | (0.21) |
| 1/31/2016 | $10.82 | 0.21 | (0.48) | (0.27) | (0.23) | (0.33) |
| 1/31/2015 | $11.22 | 0.18 | 0.52 | 0.70 | (0.24) | (0.86) |
| 1/31/2014 (d) | $11.25 | 0.32 | 0.32 | 0.64 | (0.35) | (0.32) |
| Class R |
| 1/31/2017 | $10.16 | 0.14 | 0.67 | 0.81 | (0.13) | (0.21) |
| 1/31/2016 | $10.99 | 0.21 | (0.52) | (0.31) | (0.19) | (0.33) |
| 1/31/2015 | $11.38 | 0.17 | 0.50 | 0.67 | (0.20) | (0.86) |
| 1/31/2014 | $11.34 | 0.21 | 0.45 | 0.66 | (0.30) | (0.32) |
| 1/31/2013 | $10.96 | 0.23 | 0.72 | 0.95 | (0.30) | (0.27) |
| Class R4 |
| 1/31/2017 | $10.06 | 0.24 | 0.62 | 0.86 | (0.18) | (0.21) |
| 1/31/2016 | $10.89 | 0.23 | (0.48) | (0.25) | (0.25) | (0.33) |
| 1/31/2015 | $11.29 | 0.24 | 0.48 | 0.72 | (0.26) | (0.86) |
| 1/31/2014 | $11.25 | 0.27 | 0.46 | 0.73 | (0.37) | (0.32) |
| 1/31/2013 (f) | $11.30 | 0.09 | 0.26 | 0.35 | (0.17) | (0.23) |
The accompanying Notes to Financial Statements are an integral part of this statement.
| 100 | Columbia Capital Allocation Portfolios | Annual Report 2017 |
Total
distributions to
shareholders | Net
asset
value,
end of
period | Total
return | Total gross
expense
ratio to
average
net assets(a) | Total net
expense
ratio to
average
net assets(a),(b) | Net investment
income
ratio to
average
net assets | Portfolio
turnover | Net
assets,
end of
period
(000’s) |
| |
| (0.37) | $10.62 | 8.47% | 0.49% | 0.49% (c) | 1.57% | 18% | $494,948 |
| (0.55) | $10.14 | (2.78%) | 0.48% | 0.48% (c) | 1.86% | 21% | $495,849 |
| (1.09) | $10.98 | 6.23% | 0.51% | 0.51% (c) | 1.70% | 14% | $545,696 |
| (0.65) | $11.37 | 6.18% | 0.47% | 0.47% (c) | 2.15% | 30% | $553,593 |
| (0.59) | $11.33 | 8.94% | 0.70% | 0.57% (c) | 2.19% | 38% | $71,321 |
| |
| (0.29) | $10.55 | 7.61% | 1.23% | 1.23% (c) | 0.74% | 18% | $3,971 |
| (0.47) | $10.08 | (3.53%) | 1.23% | 1.23% (c) | 0.98% | 21% | $7,912 |
| (1.00) | $10.92 | 5.46% | 1.26% | 1.26% (c) | 0.88% | 14% | $17,080 |
| (0.57) | $11.31 | 5.32% | 1.22% | 1.22% (c) | 1.30% | 30% | $27,184 |
| (0.51) | $11.28 | 8.17% | 1.44% | 1.32% (c) | 1.36% | 38% | $8,335 |
| |
| (0.29) | $10.47 | 7.67% | 1.24% | 1.24% (c) | 0.83% | 18% | $87,493 |
| (0.47) | $10.00 | (3.56%) | 1.23% | 1.23% (c) | 1.12% | 21% | $85,097 |
| (1.00) | $10.84 | 5.50% | 1.26% | 1.26% (c) | 0.96% | 14% | $90,199 |
| (0.57) | $11.23 | 5.35% | 1.23% | 1.23% (c) | 1.38% | 30% | $85,756 |
| (0.51) | $11.20 | 8.13% | 1.45% | 1.32% (c) | 1.44% | 38% | $23,470 |
| |
| (0.38) | $10.46 | 8.59% | 0.43% | 0.43% | 1.71% | 18% | $58 |
| (0.56) | $9.99 | (2.65%) | 0.41% | 0.41% | 1.92% | 21% | $3 |
| (1.10) | $10.82 | 6.31% | 0.41% | 0.41% | 1.53% | 14% | $3 |
| (0.67) | $11.22 | 5.72% | 0.38% (e) | 0.38% (e) | 3.10% (e) | 30% | $56 |
| |
| (0.34) | $10.63 | 8.09% | 0.73% | 0.73% (c) | 1.30% | 18% | $2,549 |
| (0.52) | $10.16 | (2.93%) | 0.73% | 0.73% (c) | 1.92% | 21% | $5,007 |
| (1.06) | $10.99 | 5.95% | 0.76% | 0.76% (c) | 1.46% | 14% | $2,230 |
| (0.62) | $11.38 | 5.87% | 0.74% | 0.74% (c) | 1.85% | 30% | $2,243 |
| (0.57) | $11.34 | 8.76% | 0.96% | 0.81% (c) | 2.04% | 38% | $2,148 |
| |
| (0.39) | $10.53 | 8.71% | 0.24% | 0.24% (c) | 2.28% | 18% | $2,705 |
| (0.58) | $10.06 | (2.46%) | 0.23% | 0.23% (c) | 2.15% | 21% | $1,082 |
| (1.12) | $10.89 | 6.44% | 0.26% | 0.26% (c) | 2.19% | 14% | $966 |
| (0.69) | $11.29 | 6.52% | 0.19% | 0.19% (c) | 2.36% | 30% | $2 |
| (0.40) | $11.25 | 3.11% | 0.51% (e) | 0.37% (e) | 3.68% (e) | 38% | $2 |
Columbia Capital Allocation Portfolios | Annual Report 2017
| 101 |
Financial Highlights (continued)
Columbia Capital Allocation Moderate Conservative Portfolio
| Year ended | Net asset value,
beginning of
period | Net
investment
income | Net
realized
and
unrealized
gain (loss) | Total from
investment
operations | Distributions
from net
investment
income | Distributions
from net
realized
gains |
| Class R5 |
| 1/31/2017 | $10.05 | 0.20 | 0.67 | 0.87 | (0.19) | (0.21) |
| 1/31/2016 | $10.89 | 0.30 | (0.55) | (0.25) | (0.26) | (0.33) |
| 1/31/2015 | $11.28 | 0.26 | 0.48 | 0.74 | (0.27) | (0.86) |
| 1/31/2014 | $11.25 | 0.38 | 0.35 | 0.73 | (0.38) | (0.32) |
| 1/31/2013 (g) | $11.30 | 0.10 | 0.25 | 0.35 | (0.17) | (0.23) |
| Class Y |
| 1/31/2017 | $9.94 | 0.19 | 0.67 | 0.86 | (0.19) | (0.21) |
| 1/31/2016 | $10.77 | 0.26 | (0.50) | (0.24) | (0.26) | (0.33) |
| 1/31/2015 | $11.18 | 0.25 | 0.48 | 0.73 | (0.28) | (0.86) |
| 1/31/2014 (h) | $11.32 | 0.22 | 0.28 | 0.50 | (0.32) | (0.32) |
| Class Z |
| 1/31/2017 | $10.01 | 0.19 | 0.67 | 0.86 | (0.18) | (0.21) |
| 1/31/2016 | $10.85 | 0.23 | (0.49) | (0.26) | (0.25) | (0.33) |
| 1/31/2015 | $11.25 | 0.22 | 0.50 | 0.72 | (0.26) | (0.86) |
| 1/31/2014 | $11.21 | 0.28 | 0.44 | 0.72 | (0.36) | (0.32) |
| 1/31/2013 | $10.85 | 0.27 | 0.71 | 0.98 | (0.35) | (0.27) |
| Notes to Financial Highlights |
| (a) | In addition to the fees and expenses that the Fund bears directly, the Fund indirectly bears a pro rata share of the fees and expenses of any other funds in which it invests. Such indirect expenses are not included in the Fund’s reported expense ratios. |
| (b) | Total net expenses include the impact of certain fee waivers/expense reimbursements made by the Investment Manager and certain of its affiliates, if applicable. |
| (c) | The benefits derived from expense reductions had an impact of less than 0.01%. |
| (d) | Class K shares commenced operations on February 28, 2013. Per share data and total return reflect activity from that date. |
| (e) | Annualized. |
| (f) | Class R4 shares commenced operations on November 8, 2012. Per share data and total return reflect activity from that date. |
| (g) | Class R5 shares commenced operations on November 8, 2012. Per share data and total return reflect activity from that date. |
| (h) | Class Y shares commenced operations on June 13, 2013. Per share data and total return reflect activity from that date. |
The accompanying Notes to Financial Statements are an integral part of this statement.
| 102 | Columbia Capital Allocation Portfolios | Annual Report 2017 |
Total
distributions to
shareholders | Net
asset
value,
end of
period | Total
return | Total gross
expense
ratio to
average
net assets(a) | Total net
expense
ratio to
average
net assets(a),(b) | Net investment
income
ratio to
average
net assets | Portfolio
turnover | Net
assets,
end of
period
(000’s) |
| |
| (0.40) | $10.52 | 8.78% | 0.18% | 0.18% | 1.93% | 18% | $2,084 |
| (0.59) | $10.05 | (2.48%) | 0.16% | 0.16% | 2.89% | 21% | $686 |
| (1.13) | $10.89 | 6.63% | 0.18% | 0.18% | 2.33% | 14% | $217 |
| (0.70) | $11.28 | 6.53% | 0.13% | 0.13% | 3.35% | 30% | $74 |
| (0.40) | $11.25 | 3.13% | 0.41% (e) | 0.29% (e) | 3.77% (e) | 38% | $2 |
| |
| (0.40) | $10.40 | 8.84% | 0.13% | 0.13% | 1.83% | 18% | $409 |
| (0.59) | $9.94 | (2.38%) | 0.12% | 0.12% | 2.48% | 21% | $10 |
| (1.14) | $10.77 | 6.66% | 0.09% | 0.09% | 2.24% | 14% | $4 |
| (0.64) | $11.18 | 4.51% | 0.08% (e) | 0.08% (e) | 3.02% (e) | 30% | $2 |
| |
| (0.39) | $10.48 | 8.75% | 0.24% | 0.24% (c) | 1.78% | 18% | $20,476 |
| (0.58) | $10.01 | (2.56%) | 0.23% | 0.23% (c) | 2.11% | 21% | $24,108 |
| (1.12) | $10.85 | 6.47% | 0.26% | 0.26% (c) | 1.97% | 14% | $26,084 |
| (0.68) | $11.25 | 6.49% | 0.24% | 0.24% (c) | 2.46% | 30% | $25,287 |
| (0.62) | $11.21 | 9.22% | 0.45% | 0.32% (c) | 2.45% | 38% | $20,710 |
Columbia Capital Allocation Portfolios | Annual Report 2017
| 103 |
Financial Highlights
Columbia Capital Allocation Moderate Portfolio
| Year ended | Net asset value,
beginning of
period | Net
investment
income | Net
realized
and
unrealized
gain (loss) | Total from
investment
operations | Distributions
from net
investment
income | Distributions
from net
realized
gains |
| Class A |
| 1/31/2017 | $10.34 | 0.18 | 0.95 | 1.13 | (0.21) | (0.27) |
| 1/31/2016 | $11.50 | 0.19 | (0.49) | (0.30) | (0.22) | (0.64) |
| 1/31/2015 | $12.00 | 0.18 | 0.63 | 0.81 | (0.24) | (1.07) |
| 1/31/2014 | $11.61 | 0.20 | 0.86 | 1.06 | (0.31) | (0.36) |
| 1/31/2013 | $10.75 | 0.22 | 0.93 | 1.15 | (0.29) | — |
| Class B |
| 1/31/2017 | $10.29 | 0.08 | 0.96 | 1.04 | (0.13) | (0.27) |
| 1/31/2016 | $11.44 | 0.09 | (0.46) | (0.37) | (0.14) | (0.64) |
| 1/31/2015 | $11.94 | 0.08 | 0.64 | 0.72 | (0.15) | (1.07) |
| 1/31/2014 | $11.55 | 0.10 | 0.87 | 0.97 | (0.22) | (0.36) |
| 1/31/2013 | $10.70 | 0.13 | 0.93 | 1.06 | (0.21) | — |
| Class C |
| 1/31/2017 | $10.27 | 0.10 | 0.94 | 1.04 | (0.13) | (0.27) |
| 1/31/2016 | $11.41 | 0.11 | (0.47) | (0.36) | (0.14) | (0.64) |
| 1/31/2015 | $11.92 | 0.09 | 0.62 | 0.71 | (0.15) | (1.07) |
| 1/31/2014 | $11.53 | 0.11 | 0.86 | 0.97 | (0.22) | (0.36) |
| 1/31/2013 | $10.69 | 0.14 | 0.91 | 1.05 | (0.21) | — |
| Class K |
| 1/31/2017 | $10.33 | 0.15 | 0.99 | 1.14 | (0.22) | (0.27) |
| 1/31/2016 | $11.49 | 0.20 | (0.49) | (0.29) | (0.23) | (0.64) |
| 1/31/2015 | $11.99 | 0.19 | 0.63 | 0.82 | (0.25) | (1.07) |
| 1/31/2014 | $11.60 | 0.21 | 0.86 | 1.07 | (0.32) | (0.36) |
| 1/31/2013 | $10.74 | 0.21 | 0.95 | 1.16 | (0.30) | — |
| Class R |
| 1/31/2017 | $10.32 | 0.16 | 0.93 | 1.09 | (0.18) | (0.27) |
| 1/31/2016 | $11.47 | 0.16 | (0.47) | (0.31) | (0.20) | (0.64) |
| 1/31/2015 | $11.97 | 0.15 | 0.63 | 0.78 | (0.21) | (1.07) |
| 1/31/2014 | $11.58 | 0.23 | 0.80 | 1.03 | (0.28) | (0.36) |
| 1/31/2013 | $10.74 | 0.18 | 0.93 | 1.11 | (0.27) | — |
| Class R4 |
| 1/31/2017 | $10.24 | 0.21 | 0.93 | 1.14 | (0.24) | (0.27) |
| 1/31/2016 | $11.39 | 0.28 | (0.54) | (0.26) | (0.25) | (0.64) |
| 1/31/2015 | $11.90 | 0.26 | 0.57 | 0.83 | (0.27) | (1.07) |
| 1/31/2014 (d) | $11.82 | 0.18 | 0.53 | 0.71 | (0.27) | (0.36) |
The accompanying Notes to Financial Statements are an integral part of this statement.
| 104 | Columbia Capital Allocation Portfolios | Annual Report 2017 |
Total
distributions to
shareholders | Net
asset
value,
end of
period | Total
return | Total gross
expense
ratio to
average
net assets(a) | Total net
expense
ratio to
average
net assets(a),(b) | Net investment
income
ratio to
average
net assets | Portfolio
turnover | Net
assets,
end of
period
(000’s) |
| |
| (0.48) | $10.99 | 11.19% | 0.44% | 0.44% (c) | 1.64% | 10% | $1,309,998 |
| (0.86) | $10.34 | (2.89%) | 0.46% | 0.46% (c) | 1.68% | 17% | $1,295,482 |
| (1.31) | $11.50 | 6.77% | 0.48% | 0.48% (c) | 1.49% | 16% | $1,437,972 |
| (0.67) | $12.00 | 9.26% | 0.46% | 0.46% (c) | 1.64% | 23% | $1,425,904 |
| (0.29) | $11.61 | 10.87% | 0.46% | 0.46% (c) | 1.98% | 23% | $1,331,311 |
| |
| (0.40) | $10.93 | 10.32% | 1.19% | 1.19% (c) | 0.78% | 10% | $13,398 |
| (0.78) | $10.29 | (3.56%) | 1.21% | 1.21% (c) | 0.80% | 17% | $23,991 |
| (1.22) | $11.44 | 6.00% | 1.23% | 1.23% (c) | 0.66% | 16% | $47,829 |
| (0.58) | $11.94 | 8.47% | 1.21% | 1.21% (c) | 0.81% | 23% | $71,473 |
| (0.21) | $11.55 | 9.99% | 1.20% | 1.20% (c) | 1.17% | 23% | $94,225 |
| |
| (0.40) | $10.91 | 10.34% | 1.19% | 1.19% (c) | 0.90% | 10% | $186,170 |
| (0.78) | $10.27 | (3.48%) | 1.21% | 1.21% (c) | 0.95% | 17% | $178,548 |
| (1.22) | $11.41 | 5.92% | 1.23% | 1.23% (c) | 0.77% | 16% | $180,143 |
| (0.58) | $11.92 | 8.51% | 1.21% | 1.21% (c) | 0.92% | 23% | $162,357 |
| (0.21) | $11.53 | 9.95% | 1.21% | 1.21% (c) | 1.25% | 23% | $132,770 |
| |
| (0.49) | $10.98 | 11.26% | 0.39% | 0.39% | 1.43% | 10% | $87 |
| (0.87) | $10.33 | (2.83%) | 0.40% | 0.40% | 1.76% | 17% | $291 |
| (1.32) | $11.49 | 6.88% | 0.40% | 0.40% | 1.55% | 16% | $292 |
| (0.68) | $11.99 | 9.39% | 0.36% | 0.36% | 1.77% | 23% | $359 |
| (0.30) | $11.60 | 10.94% | 0.34% | 0.34% | 1.93% | 23% | $298 |
| |
| (0.45) | $10.96 | 10.84% | 0.69% | 0.69% (c) | 1.48% | 10% | $2,282 |
| (0.84) | $10.32 | (3.06%) | 0.71% | 0.71% (c) | 1.37% | 17% | $1,342 |
| (1.28) | $11.47 | 6.52% | 0.73% | 0.73% (c) | 1.29% | 16% | $1,610 |
| (0.64) | $11.97 | 9.02% | 0.72% | 0.72% (c) | 1.92% | 23% | $1,147 |
| (0.27) | $11.58 | 10.46% | 0.70% | 0.70% (c) | 1.67% | 23% | $138 |
| |
| (0.51) | $10.87 | 11.39% | 0.19% | 0.19% (c) | 1.98% | 10% | $355 |
| (0.89) | $10.24 | (2.58%) | 0.21% | 0.21% (c) | 2.61% | 17% | $202 |
| (1.34) | $11.39 | 7.06% | 0.23% | 0.23% (c) | 2.22% | 16% | $29 |
| (0.63) | $11.90 | 6.11% | 0.21% (e) | 0.21% (c),(e) | 2.36% (e) | 23% | $3 |
Columbia Capital Allocation Portfolios | Annual Report 2017
| 105 |
Financial Highlights (continued)
Columbia Capital Allocation Moderate Portfolio
| Year ended | Net asset value,
beginning of
period | Net
investment
income | Net
realized
and
unrealized
gain (loss) | Total from
investment
operations | Distributions
from net
investment
income | Distributions
from net
realized
gains |
| Class R5 |
| 1/31/2017 | $10.23 | 0.21 | 0.94 | 1.15 | (0.24) | (0.27) |
| 1/31/2016 | $11.39 | 0.51 | (0.77) | (0.26) | (0.26) | (0.64) |
| 1/31/2015 | $11.90 | 0.39 | 0.46 | 0.85 | (0.29) | (1.07) |
| 1/31/2014 (f) | $11.82 | 0.19 | 0.53 | 0.72 | (0.28) | (0.36) |
| Class Y |
| 1/31/2017 | $10.23 | 0.23 | 0.93 | 1.16 | (0.25) | (0.27) |
| 1/31/2016 | $11.38 | 0.16 | (0.40) | (0.24) | (0.27) | (0.64) |
| 1/31/2015 | $11.90 | 0.23 | 0.61 | 0.84 | (0.29) | (1.07) |
| 1/31/2014 (g) | $11.82 | 0.19 | 0.54 | 0.73 | (0.29) | (0.36) |
| Class Z |
| 1/31/2017 | $10.33 | 0.22 | 0.94 | 1.16 | (0.24) | (0.27) |
| 1/31/2016 | $11.49 | 0.22 | (0.49) | (0.27) | (0.25) | (0.64) |
| 1/31/2015 | $11.99 | 0.21 | 0.63 | 0.84 | (0.27) | (1.07) |
| 1/31/2014 | $11.59 | 0.23 | 0.87 | 1.10 | (0.34) | (0.36) |
| 1/31/2013 | $10.75 | 0.28 | 0.88 | 1.16 | (0.32) | — |
| Notes to Financial Highlights |
| (a) | In addition to the fees and expenses that the Fund bears directly, the Fund indirectly bears a pro rata share of the fees and expenses of the underlying funds in which the Fund invests. Such indirect expenses are not included in the Fund’s reported expense ratios. |
| (b) | Total net expenses include the impact of certain fee waivers/expense reimbursements made by the Investment Manager and certain of its affiliates, if applicable. |
| (c) | The benefits derived from expense reductions had an impact of less than 0.01%. |
| (d) | Class R4 shares commenced operations on June 13, 2013. Per share data and total return reflect activity from that date. |
| (e) | Annualized. |
| (f) | Class R5 shares commenced operations on June 13, 2013. Per share data and total return reflect activity from that date. |
| (g) | Class Y shares commenced operations on June 13, 2013. Per share data and total return reflect activity from that date. |
The accompanying Notes to Financial Statements are an integral part of this statement.
| 106 | Columbia Capital Allocation Portfolios | Annual Report 2017 |
Total
distributions to
shareholders | Net
asset
value,
end of
period | Total
return | Total gross
expense
ratio to
average
net assets(a) | Total net
expense
ratio to
average
net assets(a),(b) | Net investment
income
ratio to
average
net assets | Portfolio
turnover | Net
assets,
end of
period
(000’s) |
| |
| (0.51) | $10.87 | 11.55% | 0.14% | 0.14% | 1.94% | 10% | $5,521 |
| (0.90) | $10.23 | (2.61%) | 0.15% | 0.15% | 4.80% | 17% | $3,803 |
| (1.36) | $11.39 | 7.21% | 0.16% | 0.16% | 3.39% | 16% | $78 |
| (0.64) | $11.90 | 6.21% | 0.11% (e) | 0.11% (e) | 2.51% (e) | 23% | $3 |
| |
| (0.52) | $10.87 | 11.61% | 0.09% | 0.09% | 2.15% | 10% | $3,459 |
| (0.91) | $10.23 | (2.42%) | 0.09% | 0.09% | 1.59% | 17% | $368 |
| (1.36) | $11.38 | 7.16% | 0.06% | 0.06% | 1.92% | 16% | $2 |
| (0.65) | $11.90 | 6.25% | 0.07% (e) | 0.07% (e) | 2.56% (e) | 23% | $3 |
| |
| (0.51) | $10.98 | 11.48% | 0.19% | 0.19% (c) | 2.02% | 10% | $4,598 |
| (0.89) | $10.33 | (2.65%) | 0.21% | 0.21% (c) | 1.92% | 17% | $2,443 |
| (1.34) | $11.49 | 7.05% | 0.23% | 0.23% (c) | 1.77% | 16% | $2,989 |
| (0.70) | $11.99 | 9.65% | 0.21% | 0.21% (c) | 1.90% | 23% | $3,352 |
| (0.32) | $11.59 | 10.98% | 0.22% | 0.22% (c) | 2.54% | 23% | $2,544 |
Columbia Capital Allocation Portfolios | Annual Report 2017
| 107 |
Financial Highlights
Columbia Capital Allocation Moderate Aggressive Portfolio
| Year ended | Net asset value,
beginning of
period | Net
investment
income | Net
realized
and
unrealized
gain (loss) | Total from
investment
operations | Distributions
from net
investment
income | Distributions
from net
realized
gains |
| Class A |
| 1/31/2017 | $11.15 | 0.15 | 1.30 | 1.45 | (0.16) | (0.44) |
| 1/31/2016 | $12.45 | 0.18 | (0.55) | (0.37) | (0.22) | (0.71) |
| 1/31/2015 | $13.01 | 0.16 | 0.76 | 0.92 | (0.25) | (1.23) |
| 1/31/2014 | $12.04 | 0.18 | 1.21 | 1.39 | (0.25) | (0.17) |
| 1/31/2013 | $11.30 | 0.18 | 1.07 | 1.25 | (0.22) | (0.29) |
| Class B |
| 1/31/2017 | $11.02 | 0.04 | 1.30 | 1.34 | (0.09) | (0.44) |
| 1/31/2016 | $12.32 | 0.06 | (0.52) | (0.46) | (0.13) | (0.71) |
| 1/31/2015 | $12.89 | 0.05 | 0.77 | 0.82 | (0.16) | (1.23) |
| 1/31/2014 | $11.94 | 0.07 | 1.21 | 1.28 | (0.16) | (0.17) |
| 1/31/2013 | $11.21 | 0.07 | 1.08 | 1.15 | (0.13) | (0.29) |
| Class C |
| 1/31/2017 | $11.21 | 0.07 | 1.29 | 1.36 | (0.09) | (0.44) |
| 1/31/2016 | $12.51 | 0.09 | (0.55) | (0.46) | (0.13) | (0.71) |
| 1/31/2015 | $13.07 | 0.06 | 0.77 | 0.83 | (0.16) | (1.23) |
| 1/31/2014 | $12.11 | 0.08 | 1.21 | 1.29 | (0.16) | (0.17) |
| 1/31/2013 | $11.36 | 0.09 | 1.08 | 1.17 | (0.13) | (0.29) |
| Class K |
| 1/31/2017 | $11.12 | 0.09 | 1.35 | 1.44 | (0.17) | (0.44) |
| 1/31/2016 | $12.42 | 0.19 | (0.55) | (0.36) | (0.23) | (0.71) |
| 1/31/2015 | $12.98 | 0.18 | 0.75 | 0.93 | (0.26) | (1.23) |
| 1/31/2014 (h) | $12.07 | 0.18 | 1.17 | 1.35 | (0.27) | (0.17) |
| Class R |
| 1/31/2017 | $11.14 | 0.13 | 1.29 | 1.42 | (0.13) | (0.44) |
| 1/31/2016 | $12.44 | 0.14 | (0.54) | (0.40) | (0.19) | (0.71) |
| 1/31/2015 | $12.99 | 0.13 | 0.76 | 0.89 | (0.21) | (1.23) |
| 1/31/2014 | $12.03 | 0.13 | 1.22 | 1.35 | (0.22) | (0.17) |
| 1/31/2013 | $11.29 | 0.15 | 1.07 | 1.22 | (0.19) | (0.29) |
| Class R4 |
| 1/31/2017 | $11.23 | 0.19 | 1.30 | 1.49 | (0.18) | (0.44) |
| 1/31/2016 | $12.54 | 0.21 | (0.56) | (0.35) | (0.25) | (0.71) |
| 1/31/2015 | $13.08 | 0.53 | 0.44 | 0.97 | (0.28) | (1.23) |
| 1/31/2014 | $12.11 | 0.18 | 1.25 | 1.43 | (0.29) | (0.17) |
| 1/31/2013 (l) | $11.71 | 0.11 | 0.65 | 0.76 | (0.14) | (0.22) |
The accompanying Notes to Financial Statements are an integral part of this statement.
| 108 | Columbia Capital Allocation Portfolios | Annual Report 2017 |
Total
distributions to
shareholders | Net
asset
value,
end of
period | Total
return | Total gross
expense
ratio to
average
net assets(a) | Total net
expense
ratio to
average
net assets(a),(b) | Net investment
income
ratio to
average
net assets | Portfolio
turnover | Net
assets,
end of
period
(000’s) |
| |
| (0.60) | $12.00 | 13.24% | 0.47% (c) | 0.47% (c),(d) | 1.30% | 9% | $1,671,442 |
| (0.93) | $11.15 | (3.42%) | 0.52% | 0.52% (d) | 1.42% | 16% | $1,646,276 |
| (1.48) | $12.45 | 7.03% | 0.52% | 0.52% (d) | 1.22% | 20% | $1,815,185 |
| (0.42) | $13.01 | 11.67% | 0.50% | 0.50% (d) | 1.38% | 22% | $1,805,239 |
| (0.51) | $12.04 | 11.28% | 0.53% | 0.53% (d) | 1.51% | 34% | $679,109 |
| |
| (0.53) | $11.83 | 12.39% | 1.23% (e) | 1.23% (d),(e) | 0.38% | 9% | $15,430 |
| (0.84) | $11.02 | (4.15%) | 1.27% | 1.27% (d) | 0.53% | 16% | $31,228 |
| (1.39) | $12.32 | 6.32% | 1.27% | 1.27% (d) | 0.37% | 20% | $61,673 |
| (0.33) | $12.89 | 10.78% | 1.25% | 1.25% (d) | 0.53% | 22% | $92,956 |
| (0.42) | $11.94 | 10.45% | 1.27% | 1.27% (d) | 0.65% | 34% | $53,009 |
| |
| (0.53) | $12.04 | 12.36% | 1.22% (f) | 1.22% (d),(f) | 0.55% | 9% | $216,271 |
| (0.84) | $11.21 | (4.08%) | 1.27% | 1.27% (d) | 0.69% | 16% | $206,181 |
| (1.39) | $12.51 | 6.30% | 1.27% | 1.27% (d) | 0.49% | 20% | $213,166 |
| (0.33) | $13.07 | 10.71% | 1.25% | 1.25% (d) | 0.63% | 22% | $198,837 |
| (0.42) | $12.11 | 10.49% | 1.28% | 1.28% (d) | 0.75% | 34% | $84,349 |
| |
| (0.61) | $11.95 | 13.21% | 0.42% (g) | 0.42% (g) | 0.80% | 9% | $2 |
| (0.94) | $11.12 | (3.32%) | 0.41% | 0.41% | 1.53% | 16% | $90 |
| (1.49) | $12.42 | 7.17% | 0.41% | 0.41% | 1.34% | 20% | $98 |
| (0.44) | $12.98 | 11.31% | 0.38% (i) | 0.38% (i) | 1.57% (i) | 22% | $105 |
| |
| (0.57) | $11.99 | 12.97% | 0.72% (j) | 0.72% (d),(j) | 1.10% | 9% | $3,743 |
| (0.90) | $11.14 | (3.67%) | 0.77% | 0.77% (d) | 1.11% | 16% | $3,556 |
| (1.44) | $12.44 | 6.86% | 0.77% | 0.77% (d) | 1.01% | 20% | $4,270 |
| (0.39) | $12.99 | 11.31% | 0.75% | 0.75% (d) | 1.02% | 22% | $4,347 |
| (0.48) | $12.03 | 11.01% | 0.78% | 0.78% (d) | 1.26% | 34% | $4,664 |
| |
| (0.62) | $12.10 | 13.61% | 0.22% (k) | 0.22% (d),(k) | 1.62% | 9% | $2,128 |
| (0.96) | $11.23 | (3.23%) | 0.27% | 0.27% (d) | 1.72% | 16% | $1,119 |
| (1.51) | $12.54 | 7.41% | 0.29% | 0.29% (d) | 4.16% | 20% | $1,054 |
| (0.46) | $13.08 | 11.95% | 0.22% | 0.22% (d) | 1.39% | 22% | $7 |
| (0.36) | $12.11 | 6.60% | 0.24% (i) | 0.24% (d),(i) | 3.98% (i) | 34% | $3 |
Columbia Capital Allocation Portfolios | Annual Report 2017
| 109 |
Financial Highlights (continued)
Columbia Capital Allocation Moderate Aggressive Portfolio
| Year ended | Net asset value,
beginning of
period | Net
investment
income | Net
realized
and
unrealized
gain (loss) | Total from
investment
operations | Distributions
from net
investment
income | Distributions
from net
realized
gains |
| Class R5 |
| 1/31/2017 | $11.23 | 0.20 | 1.30 | 1.50 | (0.20) | (0.44) |
| 1/31/2016 | $12.53 | 0.38 | (0.71) | (0.33) | (0.26) | (0.71) |
| 1/31/2015 | $13.08 | 0.21 | 0.77 | 0.98 | (0.30) | (1.23) |
| 1/31/2014 | $12.11 | 0.33 | 1.12 | 1.45 | (0.31) | (0.17) |
| 1/31/2013 (n) | $11.71 | 0.11 | 0.66 | 0.77 | (0.15) | (0.22) |
| Class V(o) |
| 1/31/2017 | $11.15 | 0.15 | 1.30 | 1.45 | (0.16) | (0.44) |
| 1/31/2016 | $12.45 | 0.18 | (0.55) | (0.37) | (0.22) | (0.71) |
| 1/31/2015 | $13.00 | 0.16 | 0.76 | 0.92 | (0.24) | (1.23) |
| 1/31/2014 | $12.04 | 0.16 | 1.22 | 1.38 | (0.25) | (0.17) |
| 1/31/2013 | $11.30 | 0.17 | 1.07 | 1.24 | (0.21) | (0.29) |
| Class Y |
| 1/31/2017 | $11.01 | 0.21 | 1.26 | 1.47 | (0.20) | (0.44) |
| 1/31/2016 | $12.31 | 0.13 | (0.45) | (0.32) | (0.27) | (0.71) |
| 1/31/2015 | $12.87 | 0.21 | 0.76 | 0.97 | (0.30) | (1.23) |
| 1/31/2014 (r) | $12.35 | 0.18 | 0.78 | 0.96 | (0.27) | (0.17) |
The accompanying Notes to Financial Statements are an integral part of this statement.
| 110 | Columbia Capital Allocation Portfolios | Annual Report 2017 |
Total
distributions to
shareholders | Net
asset
value,
end of
period | Total
return | Total gross
expense
ratio to
average
net assets(a) | Total net
expense
ratio to
average
net assets(a),(b) | Net investment
income
ratio to
average
net assets | Portfolio
turnover | Net
assets,
end of
period
(000’s) |
| |
| (0.64) | $12.09 | 13.63% | 0.13% (m) | 0.13% (m) | 1.68% | 9% | $5,706 |
| (0.97) | $11.23 | (3.05%) | 0.17% | 0.17% | 3.15% | 16% | $3,537 |
| (1.53) | $12.53 | 7.46% | 0.16% | 0.16% | 1.62% | 20% | $648 |
| (0.48) | $13.08 | 12.07% | 0.18% | 0.18% | 2.56% | 22% | $577 |
| (0.37) | $12.11 | 6.64% | 0.12% (i) | 0.12% (i) | 4.10% (i) | 34% | $3 |
| |
| (0.60) | $12.00 | 13.24% | 0.47% (p) | 0.47% (d),(p) | 1.30% | 9% | $86,404 |
| (0.93) | $11.15 | (3.42%) | 0.52% | 0.52% (d) | 1.42% | 16% | $85,135 |
| (1.47) | $12.45 | 7.07% | 0.56% | 0.54% (d) | 1.20% | 20% | $97,408 |
| (0.42) | $13.00 | 11.52% | 0.55% | 0.55% (d) | 1.24% | 22% | $101,766 |
| (0.50) | $12.04 | 11.23% | 0.58% | 0.58% (d) | 1.46% | 34% | $100,955 |
| |
| (0.64) | $11.84 | 13.68% | 0.07% (q) | 0.07% (q) | 1.81% | 9% | $1,128 |
| (0.98) | $11.01 | (3.09%) | 0.12% | 0.12% | 1.16% | 16% | $379 |
| (1.53) | $12.31 | 7.58% | 0.09% | 0.09% | 1.64% | 20% | $2 |
| (0.44) | $12.87 | 7.88% | 0.07% (i) | 0.07% (i) | 2.22% (i) | 22% | $3 |
Columbia Capital Allocation Portfolios | Annual Report 2017
| 111 |
Financial Highlights (continued)
Columbia Capital Allocation Moderate Aggressive Portfolio
| Year ended | Net asset value,
beginning of
period | Net
investment
income | Net
realized
and
unrealized
gain (loss) | Total from
investment
operations | Distributions
from net
investment
income | Distributions
from net
realized
gains |
| Class Z |
| 1/31/2017 | $11.13 | 0.18 | 1.29 | 1.47 | (0.18) | (0.44) |
| 1/31/2016 | $12.44 | 0.21 | (0.56) | (0.35) | (0.25) | (0.71) |
| 1/31/2015 | $12.99 | 0.19 | 0.77 | 0.96 | (0.28) | (1.23) |
| 1/31/2014 | $12.03 | 0.19 | 1.23 | 1.42 | (0.29) | (0.17) |
| 1/31/2013 | $11.29 | 0.20 | 1.08 | 1.28 | (0.25) | (0.29) |
| Notes to Financial Highlights |
| (a) | In addition to the fees and expenses that the Fund bears directly, the Fund indirectly bears a pro rata share of the fees and expenses of the underlying funds in which the Fund invests. Such indirect expenses are not included in the Fund’s reported expense ratios. |
| (b) | Total net expenses include the impact of certain fee waivers/expense reimbursements made by the Investment Manager and certain of its affiliates, if applicable. |
| (c) | Expenses have been reduced due to a reimbursement of expenses overbilled by a third party. If the reimbursement had been excluded, the expense ratios would have been higher by 0.04% for Class A. All fee waivers and expense reimbursements by the Investment Manager and its affiliates were applied before giving effect to this third party reimbursement. |
| (d) | The benefits derived from expense reductions had an impact of less than 0.01%. |
| (e) | Expenses have been reduced due to a reimbursement of expenses overbilled by a third party. If the reimbursement had been excluded, the expense ratios would have been higher by 0.03% for Class B. All fee waivers and expense reimbursements by the Investment Manager and its affiliates were applied before giving effect to this third party reimbursement. |
| (f) | Expenses have been reduced due to a reimbursement of expenses overbilled by a third party. If the reimbursement had been excluded, the expense ratios would have been higher by 0.04% for Class C. All fee waivers and expense reimbursements by the Investment Manager and its affiliates were applied before giving effect to this third party reimbursement. |
| (g) | Expenses have been reduced due to a reimbursement of expenses overbilled by a third party. If the reimbursement had been excluded, the expense ratios would have been higher by 0.01% for Class K. All fee waivers and expense reimbursements by the Investment Manager and its affiliates were applied before giving effect to this third party reimbursement. |
| (h) | Class K shares commenced operations on February 28, 2013. Per share data and total return reflect activity from that date. |
| (i) | Annualized. |
| (j) | Expenses have been reduced due to a reimbursement of expenses overbilled by a third party. If the reimbursement had been excluded, the expense ratios would have been higher by 0.04% for Class R. All fee waivers and expense reimbursements by the Investment Manager and its affiliates were applied before giving effect to this third party reimbursement. |
| (k) | Expenses have been reduced due to a reimbursement of expenses overbilled by a third party. If the reimbursement had been excluded, the expense ratios would have been higher by 0.04% for Class R4. All fee waivers and expense reimbursements by the Investment Manager and its affiliates were applied before giving effect to this third party reimbursement. |
| (l) | Class R4 shares commenced operations on November 8, 2012. Per share data and total return reflect activity from that date. |
| (m) | Expenses have been reduced due to a reimbursement of expenses overbilled by a third party. If the reimbursement had been excluded, the expense ratios would have been higher by 0.04% for Class R5. All fee waivers and expense reimbursements by the Investment Manager and its affiliates were applied before giving effect to this third party reimbursement. |
| (n) | Class R5 shares commenced operations on November 8, 2012. Per share data and total return reflect activity from that date. |
| (o) | Effective January 24, 2017, Class T shares were renamed Class V shares. |
| (p) | Expenses have been reduced due to a reimbursement of expenses overbilled by a third party. If the reimbursement had been excluded, the expense ratios would have been higher by 0.04% for Class V. All fee waivers and expense reimbursements by the Investment Manager and its affiliates were applied before giving effect to this third party reimbursement. |
| (q) | Expenses have been reduced due to a reimbursement of expenses overbilled by a third party. If the reimbursement had been excluded, the expense ratios would have been higher by 0.05% for Class Y. All fee waivers and expense reimbursements by the Investment Manager and its affiliates were applied before giving effect to this third party reimbursement. |
| (r) | Class Y shares commenced operations on June 13, 2013. Per share data and total return reflect activity from that date. |
| (s) | Expenses have been reduced due to a reimbursement of expenses overbilled by a third party. If the reimbursement had been excluded, the expense ratios would have been higher by 0.04% for Class Z. All fee waivers and expense reimbursements by the Investment Manager and its affiliates were applied before giving effect to this third party reimbursement. |
The accompanying Notes to Financial Statements are an integral part of this statement.
| 112 | Columbia Capital Allocation Portfolios | Annual Report 2017 |
Total
distributions to
shareholders | Net
asset
value,
end of
period | Total
return | Total gross
expense
ratio to
average
net assets(a) | Total net
expense
ratio to
average
net assets(a),(b) | Net investment
income
ratio to
average
net assets | Portfolio
turnover | Net
assets,
end of
period
(000’s) |
| |
| (0.62) | $11.98 | 13.55% | 0.22% (s) | 0.22% (d),(s) | 1.55% | 9% | $119,833 |
| (0.96) | $11.13 | (3.26%) | 0.27% | 0.27% (d) | 1.67% | 16% | $113,846 |
| (1.51) | $12.44 | 7.40% | 0.27% | 0.27% (d) | 1.47% | 20% | $128,314 |
| (0.46) | $12.99 | 11.87% | 0.25% | 0.25% (d) | 1.49% | 22% | $128,234 |
| (0.54) | $12.03 | 11.57% | 0.28% | 0.28% (d) | 1.72% | 34% | $147,433 |
Columbia Capital Allocation Portfolios | Annual Report 2017
| 113 |
Financial Highlights
Columbia Capital Allocation Aggressive Portfolio
| Year ended | Net asset value,
beginning of
period | Net
investment
income | Net
realized
and
unrealized
gain (loss) | Total from
investment
operations | Distributions
from net
investment
income | Distributions
from net
realized
gains |
| Class A |
| 1/31/2017 | $11.08 | 0.13 | 1.49 | 1.62 | (0.14) | (0.45) |
| 1/31/2016 | $12.54 | 0.15 | (0.57) | (0.42) | (0.19) | (0.85) |
| 1/31/2015 | $12.82 | 0.12 | 0.86 | 0.98 | (0.30) | (0.96) |
| 1/31/2014 | $11.41 | 0.12 | 1.53 | 1.65 | (0.24) | — |
| 1/31/2013 | $10.19 | 0.13 | 1.25 | 1.38 | (0.16) | — |
| Class B |
| 1/31/2017 | $11.07 | 0.02 | 1.50 | 1.52 | (0.06) | (0.45) |
| 1/31/2016 | $12.53 | 0.03 | (0.53) | (0.50) | (0.11) | (0.85) |
| 1/31/2015 | $12.81 | 0.01 | 0.87 | 0.88 | (0.20) | (0.96) |
| 1/31/2014 | $11.41 | 0.02 | 1.53 | 1.55 | (0.15) | — |
| 1/31/2013 | $10.17 | 0.04 | 1.26 | 1.30 | (0.06) | — |
| Class C |
| 1/31/2017 | $10.87 | 0.04 | 1.45 | 1.49 | (0.06) | (0.45) |
| 1/31/2016 | $12.32 | 0.06 | (0.55) | (0.49) | (0.11) | (0.85) |
| 1/31/2015 | $12.62 | 0.03 | 0.83 | 0.86 | (0.20) | (0.96) |
| 1/31/2014 | $11.24 | 0.03 | 1.50 | 1.53 | (0.15) | — |
| 1/31/2013 | $10.04 | 0.05 | 1.24 | 1.29 | (0.09) | — |
| Class K |
| 1/31/2017 | $11.11 | 0.14 | 1.48 | 1.62 | (0.14) | (0.45) |
| 1/31/2016 | $12.56 | 0.16 | (0.56) | (0.40) | (0.20) | (0.85) |
| 1/31/2015 | $12.84 | 0.10 | 0.89 | 0.99 | (0.31) | (0.96) |
| 1/31/2014 | $11.43 | 0.14 | 1.52 | 1.66 | (0.25) | — |
| 1/31/2013 | $10.20 | 0.15 | 1.25 | 1.40 | (0.17) | — |
| Class R |
| 1/31/2017 | $11.01 | 0.14 | 1.43 | 1.57 | (0.11) | (0.45) |
| 1/31/2016 | $12.46 | 0.12 | (0.56) | (0.44) | (0.16) | (0.85) |
| 1/31/2015 | $12.75 | 0.10 | 0.83 | 0.93 | (0.26) | (0.96) |
| 1/31/2014 | $11.35 | 0.14 | 1.47 | 1.61 | (0.21) | — |
| 1/31/2013 | $10.16 | 0.11 | 1.24 | 1.35 | (0.16) | — |
| Class R4 |
| 1/31/2017 | $10.89 | 0.15 | 1.46 | 1.61 | (0.16) | (0.45) |
| 1/31/2016 | $12.34 | 0.24 | (0.61) | (0.37) | (0.23) | (0.85) |
| 1/31/2015 | $12.63 | 0.54 | 0.46 | 1.00 | (0.33) | (0.96) |
| 1/31/2014 (d) | $11.82 | 0.20 | 0.88 | 1.08 | (0.27) | — |
The accompanying Notes to Financial Statements are an integral part of this statement.
| 114 | Columbia Capital Allocation Portfolios | Annual Report 2017 |
Total
distributions to
shareholders | Net
asset
value,
end of
period | Total
return | Total gross
expense
ratio to
average
net assets(a) | Total net
expense
ratio to
average
net assets(a),(b) | Net investment
income
ratio to
average
net assets | Portfolio
turnover | Net
assets,
end of
period
(000’s) |
| |
| (0.59) | $12.11 | 14.95% | 0.50% | 0.50% (c) | 1.06% | 12% | $582,182 |
| (1.04) | $11.08 | (3.92%) | 0.51% | 0.51% (c) | 1.18% | 12% | $549,678 |
| (1.26) | $12.54 | 7.50% | 0.54% | 0.54% (c) | 0.92% | 27% | $577,868 |
| (0.24) | $12.82 | 14.41% | 0.52% | 0.52% (c) | 0.98% | 29% | $554,189 |
| (0.16) | $11.41 | 13.63% | 0.52% | 0.51% (c) | 1.25% | 21% | $495,722 |
| |
| (0.51) | $12.08 | 14.03% | 1.25% | 1.25% (c) | 0.16% | 12% | $6,938 |
| (0.96) | $11.07 | (4.60%) | 1.25% | 1.25% (c) | 0.26% | 12% | $11,970 |
| (1.16) | $12.53 | 6.72% | 1.28% | 1.28% (c) | 0.04% | 27% | $22,043 |
| (0.15) | $12.81 | 13.54% | 1.27% | 1.27% (c) | 0.14% | 29% | $31,473 |
| (0.06) | $11.41 | 12.80% | 1.26% | 1.26% (c) | 0.41% | 21% | $39,020 |
| |
| (0.51) | $11.85 | 14.01% | 1.25% | 1.25% (c) | 0.33% | 12% | $75,648 |
| (0.96) | $10.87 | (4.60%) | 1.25% | 1.25% (c) | 0.46% | 12% | $66,938 |
| (1.16) | $12.32 | 6.66% | 1.29% | 1.29% (c) | 0.22% | 27% | $62,488 |
| (0.15) | $12.62 | 13.56% | 1.27% | 1.27% (c) | 0.27% | 29% | $50,676 |
| (0.09) | $11.24 | 12.86% | 1.27% | 1.26% (c) | 0.52% | 21% | $38,461 |
| |
| (0.59) | $12.14 | 14.98% | 0.43% | 0.43% | 1.19% | 12% | $73 |
| (1.05) | $11.11 | (3.76%) | 0.43% | 0.43% | 1.25% | 12% | $57 |
| (1.27) | $12.56 | 7.60% | 0.43% | 0.43% | 0.72% | 27% | $68 |
| (0.25) | $12.84 | 14.52% | 0.40% | 0.40% | 1.13% | 29% | $152 |
| (0.17) | $11.43 | 13.84% | 0.37% | 0.37% | 1.37% | 21% | $126 |
| |
| (0.56) | $12.02 | 14.61% | 0.75% | 0.75% (c) | 1.22% | 12% | $2,099 |
| (1.01) | $11.01 | (4.09%) | 0.76% | 0.76% (c) | 0.97% | 12% | $1,029 |
| (1.22) | $12.46 | 7.19% | 0.79% | 0.79% (c) | 0.72% | 27% | $912 |
| (0.21) | $12.75 | 14.13% | 0.78% | 0.78% (c) | 1.12% | 29% | $644 |
| (0.16) | $11.35 | 13.38% | 0.79% | 0.76% (c) | 1.03% | 21% | $182 |
| |
| (0.61) | $11.89 | 15.20% | 0.25% | 0.25% (c) | 1.27% | 12% | $1,242 |
| (1.08) | $10.89 | (3.65%) | 0.26% | 0.26% (c) | 1.97% | 12% | $779 |
| (1.29) | $12.34 | 7.78% | 0.28% | 0.28% (c) | 4.28% | 27% | $497 |
| (0.27) | $12.63 | 9.08% | 0.29% (e) | 0.29% (c),(e) | 2.54% (e) | 29% | $26 |
Columbia Capital Allocation Portfolios | Annual Report 2017
| 115 |
Financial Highlights (continued)
Columbia Capital Allocation Aggressive Portfolio
| Year ended | Net asset value,
beginning of
period | Net
investment
income | Net
realized
and
unrealized
gain (loss) | Total from
investment
operations | Distributions
from net
investment
income | Distributions
from net
realized
gains |
| Class R5 |
| 1/31/2017 | $10.88 | 0.17 | 1.45 | 1.62 | (0.17) | (0.45) |
| 1/31/2016 | $12.33 | 0.31 | (0.68) | (0.37) | (0.23) | (0.85) |
| 1/31/2015 | $12.63 | 0.16 | 0.85 | 1.01 | (0.35) | (0.96) |
| 1/31/2014 (f) | $11.82 | 0.04 | 1.06 | 1.10 | (0.29) | — |
| Class Y |
| 1/31/2017 | $10.87 | 0.19 | 1.45 | 1.64 | (0.18) | (0.45) |
| 1/31/2016 | $12.32 | 0.08 | (0.44) | (0.36) | (0.24) | (0.85) |
| 1/31/2015 | $12.62 | 0.17 | 0.84 | 1.01 | (0.35) | (0.96) |
| 1/31/2014 (g) | $11.82 | 0.15 | 0.95 | 1.10 | (0.30) | — |
| Class Z |
| 1/31/2017 | $11.03 | 0.16 | 1.48 | 1.64 | (0.16) | (0.45) |
| 1/31/2016 | $12.49 | 0.19 | (0.58) | (0.39) | (0.22) | (0.85) |
| 1/31/2015 | $12.78 | 0.17 | 0.83 | 1.00 | (0.33) | (0.96) |
| 1/31/2014 | $11.36 | 0.19 | 1.50 | 1.69 | (0.27) | — |
| 1/31/2013 | $10.16 | 0.21 | 1.19 | 1.40 | (0.20) | — |
| Notes to Financial Highlights |
| (a) | In addition to the fees and expenses that the Fund bears directly, the Fund indirectly bears a pro rata share of the fees and expenses of the underlying funds in which the Fund invests. Such indirect expenses are not included in the Fund’s reported expense ratios. |
| (b) | Total net expenses include the impact of certain fee waivers/expense reimbursements made by the Investment Manager and certain of its affiliates, if applicable. |
| (c) | The benefits derived from expense reductions had an impact of less than 0.01%. |
| (d) | Class R4 shares commenced operations on June 13, 2013. Per share data and total return reflect activity from that date. |
| (e) | Annualized. |
| (f) | Class R5 shares commenced operations on June 13, 2013. Per share data and total return reflect activity from that date. |
| (g) | Class Y shares commenced operations on June 13, 2013. Per share data and total return reflect activity from that date. |
The accompanying Notes to Financial Statements are an integral part of this statement.
| 116 | Columbia Capital Allocation Portfolios | Annual Report 2017 |
Total
distributions to
shareholders | Net
asset
value,
end of
period | Total
return | Total gross
expense
ratio to
average
net assets(a) | Total net
expense
ratio to
average
net assets(a),(b) | Net investment
income
ratio to
average
net assets | Portfolio
turnover | Net
assets,
end of
period
(000’s) |
| |
| (0.62) | $11.88 | 15.28% | 0.18% | 0.18% | 1.49% | 12% | $1,638 |
| (1.08) | $10.88 | (3.58%) | 0.18% | 0.18% | 2.61% | 12% | $1,041 |
| (1.31) | $12.33 | 7.83% | 0.18% | 0.18% | 1.22% | 27% | $381 |
| (0.29) | $12.63 | 9.27% | 0.19% (e) | 0.19% (e) | 0.47% (e) | 29% | $385 |
| |
| (0.63) | $11.88 | 15.44% | 0.13% | 0.13% | 1.66% | 12% | $2,111 |
| (1.09) | $10.87 | (3.54%) | 0.15% | 0.15% | 0.69% | 12% | $214 |
| (1.31) | $12.32 | 7.88% | 0.14% | 0.14% | 1.30% | 27% | $2 |
| (0.30) | $12.62 | 9.23% | 0.06% (e) | 0.06% (e) | 1.95% (e) | 29% | $3 |
| |
| (0.61) | $12.06 | 15.27% | 0.25% | 0.25% (c) | 1.39% | 12% | $3,329 |
| (1.07) | $11.03 | (3.69%) | 0.26% | 0.26% (c) | 1.55% | 12% | $1,809 |
| (1.29) | $12.49 | 7.70% | 0.29% | 0.29% (c) | 1.30% | 27% | $1,433 |
| (0.27) | $12.78 | 14.82% | 0.28% | 0.28% (c) | 1.51% | 29% | $951 |
| (0.20) | $11.36 | 13.87% | 0.28% | 0.26% (c) | 2.00% | 21% | $413 |
Columbia Capital Allocation Portfolios | Annual Report 2017
| 117 |
Notes to Financial Statements
January 31, 2017
Note 1. Organization
Columbia Funds Series Trust and Columbia Funds Series Trust II, (each, a Trust and collectively, the Trusts) are registered under the Investment Company Act of 1940, as amended (the 1940 Act), as open-end management investment companies. Columbia Funds Series Trust is organized as a Delaware statutory trust and Columbia Funds Series Trust II is organized as a Massachusetts business trust.
Information presented in these financial statements pertains to the following series of the Trusts (each, a Fund and collectively, the Funds): Columbia Capital Allocation Moderate Conservative Portfolio and Columbia Capital Allocation Moderate Aggressive Portfolio, each a series of Columbia Funds Series Trust, and Columbia Capital Allocation Conservative Portfolio, Columbia Capital Allocation Moderate Portfolio and Columbia Capital Allocation Aggressive Portfolio, each a series of Columbia Funds Series Trust II. Each Fund currently operates as a diversified fund.
Each Fund is a “fund-of-funds”, investing significantly in affiliated funds managed by Columbia Management Investment Advisers, LLC (the Investment Manager), a wholly-owned subsidiary of Ameriprise Financial, Inc. (Ameriprise Financial), or its affiliates, as well as third-party advised (unaffiliated) funds, including exchange-traded funds (collectively, Underlying Funds).
For information on the Underlying Funds, please refer to the Fund’s current prospectus and the prospectuses of the Underlying Funds, which are available, free of charge, from the Securities and Exchange Commission website, www.sec.gov.
Fund shares
Each Trust may issue an unlimited number of shares (without par value) that can be allocated among the separate series as designated by the Board of Trustees.
Columbia Capital Allocation Conservative Portfolio, Columbia Capital Allocation Moderate Conservative Portfolio, Columbia Capital Allocation Moderate Portfolio and Columbia Capital Allocation Aggressive Portfolio each offers Class A, Class B, Class C, Class K, Class R, Class R4, Class R5, Class Y and Class Z shares. Columbia Capital Allocation Moderate Aggressive Portfolio offers Class A, Class B, Class C, Class K, Class R, Class R4, Class R5, Class V (formerly Class T), Class Y and Class Z shares. Although all share classes generally have identical voting, dividend and liquidation rights, each share class votes separately when required by the Trusts’ organizational documents and by law. Different share classes pay different distribution amounts to the extent the expenses of such share classes differ, and distributions in liquidation will be proportional to the net asset value of each share class. Each share class has its own expense structure and sales charges.
Class A shares are subject to a maximum front-end sales charge of 4.75% for Columbia Capital Allocation Conservative Portfolio. Class A shares of Columbia Capital Allocation Moderate Conservative Portfolio, Columbia Capital Allocation Moderate Portfolio, Columbia Capital Allocation Moderate Aggressive Portfolio and Columbia Capital Allocation Aggressive Portfolio are subject to a maximum front-end sales charge of 5.75% based on the initial investment amount. Class A shares purchased without an initial sales charge in accounts aggregating $1 million to $50 million at the time of purchase are subject to a contingent deferred sales charge (CDSC) if the shares are sold within 18 months of purchase, charged as follows: 1.00% CDSC if redeemed within 12 months of purchase, and 0.50% CDSC if redeemed more than 12, but less than 18, months after purchase.
Class B shares may be subject to a maximum CDSC of 5.00% based upon the holding period after purchase. Class B shares will generally convert to Class A shares eight years after purchase. Each Fund no longer accepts investments by new or existing investors in the Fund’s Class B shares, except in connection with the reinvestment of any dividend and/or capital gain distributions in Class B shares of the Fund and exchanges by existing Class B shareholders of certain other funds within the Columbia Family of Funds.
Class C shares are subject to a 1.00% CDSC on shares redeemed within one year of purchase.
Class K shares are not subject to sales charges, however this share class is closed to new investors.
Class R shares are not subject to sales charges and are generally available only to certain retirement plans and other investors as described in the Fund’s prospectus.
| 118 | Columbia Capital Allocation Portfolios | Annual Report 2017 |
Notes to Financial Statements (continued)
January 31, 2017
Class R4 shares are not subject to sales charges and are generally available only to omnibus retirement plans and certain investors as described in the Fund’s prospectus.
Class R5 shares are not subject to sales charges and are generally available only to investors purchasing through authorized investment professionals and omnibus retirement plans.
Class V shares (formerly Class T shares) are subject to a maximum front-end sales charge of 5.75% based on the investment amount. Class V shares purchased without an initial sales charge in accounts aggregating $1 million to $50 million at the time of purchase are subject to a CDSC if the shares are sold within 18 months of purchase, charged as follows: 1.00% CDSC if redeemed within 12 months of purchase, and 0.50% CDSC if redeemed more than 12, but less than 18, months after purchase. Class V shares are available only to investors who received (and who have continuously held) Class V shares in connection with previous fund reorganizations. Effective January 24, 2017, Class T shares were renamed Class V shares.
Class Y shares are not subject to sales charges and are generally available only to certain retirement plans as described in the Fund’s prospectus.
Class Z shares are not subject to sales charges and are generally available only to eligible investors, which are subject to different investment minimums as described in the Fund’s prospectus.
Note 2. Summary of significant accounting policies
Basis of preparation
Each Fund is an investment company that applies the accounting and reporting guidance in the Financial Accounting Standards Board (FASB) Accounting Standards Codification Topic 946, Financial Services - Investment Companies (ASC 946). The financial statements are prepared in accordance with U.S. generally accepted accounting principles (GAAP), which requires management to make certain estimates and assumptions that affect the reported amounts of assets and liabilities, the disclosure of contingent assets and liabilities at the date of the financial statements and the reported amounts of income and expenses during the reporting period. Actual results could differ from those estimates. Columbia Capital Allocation Moderate Aggressive Fund received a reimbursment for expenses overbilled by a third party. Such reimbursement is included as an offset to Other expenses on the Statement of Operations. All fee waivers and expense reimbursements by the Investment Manager and its affiliates were applied before giving effect to the third party reimbursement.
The following is a summary of significant accounting policies followed by the Funds in the preparation of their financial statements.
Security valuation
All equity securities are valued at the close of business of the New York Stock Exchange. Equity securities are valued at the last quoted sales price on the principal exchange or market on which they trade, except for securities traded on the NASDAQ Stock Market, which are valued at the NASDAQ official close price. Unlisted securities or listed securities for which there were no sales during the day are valued at the mean of the latest quoted bid and ask prices on such exchanges or markets.
Investments in the Underlying Funds are valued at the net asset value of the applicable class of the Underlying Fund determined as of the close of the New York Stock Exchange on the valuation date.
Forward foreign currency exchange contracts are marked-to-market based upon foreign currency exchange rates provided by a pricing service.
Futures and options on futures contracts are valued based upon the settlement price at the close of regular trading on their principal exchanges or, in the absence of transactions, at the mean of the latest quoted bid and ask prices.
Swap transactions are valued through an independent pricing service or broker, or if neither is available, through an internal model based upon observable inputs.
Columbia Capital Allocation Portfolios | Annual Report 2017
| 119 |
Notes to Financial Statements (continued)
January 31, 2017
Investments for which market quotations are not readily available, or that have quotations which management believes are not reflective of market value or reliable, are valued at fair value as determined in good faith under procedures approved by and under the general supervision of the Board of Trustees. If a security or class of securities (such as foreign securities) is valued at fair value, such value is likely to be different from the quoted or published price for the security.
The determination of fair value often requires significant judgment. To determine fair value, management may use assumptions including but not limited to future cash flows and estimated risk premiums. Multiple inputs from various sources may be used to determine fair value.
GAAP requires disclosure regarding the inputs and valuation techniques used to measure fair value and any changes in valuation inputs or techniques. In addition, investments shall be disclosed by major category. This information is disclosed following the Fund’s Portfolio of Investments.
Foreign currency transactions and translations
The values of all assets and liabilities denominated in foreign currencies are generally translated into U.S. dollars at exchange rates determined at the close of regular trading on the New York Stock Exchange. Net realized and unrealized gains (losses) on foreign currency transactions and translations include gains (losses) arising from the fluctuation in exchange rates between trade and settlement dates on securities transactions, gains (losses) arising from the disposition of foreign currency and currency gains (losses) between the accrual and payment dates on dividends, interest income and foreign withholding taxes.
For financial statement purposes, the Funds do not distinguish that portion of gains (losses) on investments which is due to changes in foreign exchange rates from that which is due to changes in market prices of the investments. Such fluctuations are included with the net realized and unrealized gains (losses) on investments in the Statement of Operations.
Derivative instruments
Certain Funds invest in certain derivative instruments, as detailed below, to meet its investment objectives. Derivatives are instruments whose values depend on, or are derived from, in whole or in part, the value of one or more securities, currencies, commodities, indices, or other assets or instruments. Derivatives may be used to increase investment flexibility (including to maintain cash reserves while maintaining desired exposure to certain assets), for risk management (hedging) purposes, to facilitate trading, to reduce transaction costs and to pursue higher investment returns. The Fund may also use derivative instruments to mitigate certain investment risks, such as foreign currency exchange rate risk, interest rate risk and credit risk. Derivatives may involve various risks, including the potential inability of the counterparty to fulfill its obligations under the terms of the contract, the potential for an illiquid secondary market (making it difficult for the Fund to sell or terminate, including at favorable prices) and the potential for market movements which may expose the Fund to gains or losses in excess of the amount shown in the Statement of Assets and Liabilities. The notional amounts of derivative instruments, if applicable, are not recorded in the financial statements.
A derivative instrument may suffer a marked-to-market loss if the value of the contract decreases due to an unfavorable change in the market rates or values of the underlying instrument. Losses can also occur if the counterparty does not perform its obligations under the contract. The Fund’s risk of loss from counterparty credit risk on over-the-counter derivatives is generally limited to the aggregate unrealized gain netted against any collateral held by the Fund and the amount of any variation margin held by the counterparty, plus any replacement costs or related amounts. With exchange-traded or centrally cleared derivatives, there is reduced counterparty credit risk to the Fund since the clearinghouse or central counterparty (CCP) provides some protection in the case of clearing member default. The clearinghouse or CCP stands between the buyer and the seller of the contract; therefore, additional counterparty credit risk is failure of the clearinghouse or CCP. However, credit risk still exists in exchange-traded or centrally cleared derivatives with respect to initial and variation margin that is held in a broker’s customer account. While brokers are required to segregate customer margin from their own assets, in the event that a broker becomes insolvent or goes into bankruptcy and at that time there is a shortfall in the aggregate amount of margin held by the broker for all its clients, U.S. bankruptcy laws will typically allocate that shortfall on a pro-rata basis across all the broker’s customers (including the Fund), potentially resulting in losses to the Fund.
| 120 | Columbia Capital Allocation Portfolios | Annual Report 2017 |
Notes to Financial Statements (continued)
January 31, 2017
In order to better define its contractual rights and to secure rights that will help the Fund mitigate its counterparty risk, the Fund may enter into an International Swaps and Derivatives Association, Inc. Master Agreement (ISDA Master Agreement) or similar agreement with its derivatives contract counterparties. An ISDA Master Agreement is an agreement between the Fund and a counterparty that governs over-the-counter derivatives and typically contains, among other things, collateral posting terms and netting provisions in the event of a default and/or termination event. Under an ISDA Master Agreement, the Fund may, under certain circumstances, offset with the counterparty certain derivative instrument’s payables and/or receivables with collateral held and/or posted and create one single net payment. The provisions of the ISDA Master Agreement typically permit a single net payment in the event of default (close-out netting), including the bankruptcy or insolvency of the counterparty. Note, however, that bankruptcy or insolvency laws of a particular jurisdiction may impose restrictions on or prohibitions against the right of offset or netting in bankruptcy, insolvency or other events.
Collateral (margin) requirements differ by type of derivative. Margin requirements are established by the clearinghouse or CCP for exchange-traded and centrally cleared derivatives. Brokers can ask for margin in excess of the minimum in certain circumstances. Collateral terms are contract specific for over-the-counter derivatives. For over-the-counter derivatives traded under an ISDA Master Agreement, the collateral requirements are typically calculated by netting the marked-to-market amount for each transaction under such agreement and comparing that amount to the value of any variation margin currently pledged by the Fund and/or the counterparty. Generally, the amount of collateral due from or to a party has to exceed a minimum transfer amount threshold (e.g., $250,000) before a transfer has to be made. To the extent amounts due to the Fund from its counterparties are not fully collateralized, contractually or otherwise, the Fund bears the risk of loss from counterparty nonperformance. The Fund attempts to mitigate counterparty risk by only entering into agreements with counterparties that it believes have the financial resources to honor their obligations and by monitoring the financial stability of those counterparties.
Certain ISDA Master Agreements allow counterparties of over-the-counter derivatives transactions to terminate derivatives contracts prior to maturity in the event the Fund’s net asset value declines by a stated percentage over a specified time period or if the Fund fails to meet certain terms of the ISDA Master Agreement, which would cause the Fund to accelerate payment of any net liability owed to the counterparty. The Fund also has termination rights if the counterparty fails to meet certain terms of the ISDA Master Agreement. In addition to considering counterparty credit risk, the Fund would consider terminating the derivatives contracts based on whether termination would result in a net liability owed from the counterparty.
For financial reporting purposes, the Fund does not offset derivative assets and derivative liabilities that are subject to netting arrangements in the Statement of Assets and Liabilities.
Forward foreign currency exchange contracts
Forward foreign currency exchange contracts are over-the-counter agreements between two parties to buy and sell a currency at a set price on a future date. The Funds utilized forward foreign currency exchange contracts to hedge the currency exposure associated with some or all of the Fund’s securities, to shift foreign currency exposure back to U.S. dollars, to shift investment exposure from one currency to another, to shift U.S. dollar exposure to achieve a representative weighted mix of major currencies in its benchmark, and/or to recover an underweight country exposure in its portfolio. These instruments may be used for other purposes in future periods.
The values of forward foreign currency exchange contracts fluctuate daily with changes in foreign currency exchange rates. Changes in the value of these contracts are recorded as unrealized appreciation or depreciation until the contract is exercised or has expired. The Fund will realize a gain or loss when the forward foreign currency exchange contract is closed or expires.
The use of forward foreign currency exchange contracts does not eliminate fluctuations in the prices of the Fund’s portfolio securities. The risks of forward foreign currency exchange contracts include movement in the values of the foreign currencies relative to the U.S. dollar (or other foreign currencies) and the possibility that counterparties will not complete their contractual obligations, which may be in excess of the amount reflected, if any, in the Statement of Assets and Liabilities.
Columbia Capital Allocation Portfolios | Annual Report 2017
| 121 |
Notes to Financial Statements (continued)
January 31, 2017
Futures contracts
Futures contracts are exchange-traded and represent commitments for the future purchase or sale of an asset at a specified price on a specified date. The Funds bought and sold futures contracts to produce incremental earnings, to manage the duration and yield curve exposure of the Fund versus the benchmark, to manage exposure to movements in interest rates, to manage exposure to the securities market and to maintain appropriate equity market exposure while keeping sufficient cash to accommodate daily redemptions. These instruments may be used for other purposes in future periods. Upon entering into futures contracts, the Fund bears risks that it may not achieve the anticipated benefits of the futures contracts and may realize a loss. Additional risks include counterparty credit risk, the possibility of an illiquid market, and that a change in the value of the contract or option may not correlate with changes in the value of the underlying asset.
Upon entering into a futures contract, the Fund deposits cash or securities with the broker, known as a futures commission merchant (FCM), in an amount sufficient to meet the initial margin requirement. The initial margin deposit must be maintained at an established level over the life of the contract. Cash deposited as initial margin is recorded in the Statement of Assets and Liabilities as margin deposits. Securities deposited as initial margin are designated in the Portfolio of Investments. Subsequent payments (variation margin) are made or received by the Fund each day. The variation margin payments are equal to the daily change in the contract value and are recorded as variation margin receivable or payable and are offset in unrealized gains or losses. The Fund recognizes a realized gain or loss when the contract is closed or expires. Futures contracts involve, to varying degrees, risk of loss in excess of the variation margin disclosed in the Statement of Assets and Liabilities.
Swap contracts
Swap contracts are negotiated in the over-the-counter market and may be entered into as a bilateral contract or centrally cleared (centrally cleared swap contract). In a centrally cleared swap contract, immediately following execution of the swap contract with a broker, the swap contract is novated to a central counterparty (the CCP) and the CCP becomes the Fund’s counterparty to the centrally cleared swap contract. The Fund is required to deposit initial margin with the futures commission merchant (FCM), which pledges it through to the CCP in the form of cash or securities in an amount that varies depending on the size and risk profile of the particular swap contract. Securities deposited as initial margin are designated in the Portfolio of Investments and cash deposited is recorded in the Statement of Assets and Liabilities as margin deposits. Unlike a bilateral swap contract, for centrally cleared swap contracts, the Fund has minimal credit exposure to the FCM because the CCP stands between the Fund and the relevant buyer/seller on the other side of the contract. Swap contracts are marked-to-market daily and changes in value are recorded as unrealized appreciation (depreciation). The daily change in valuation of centrally cleared swap contracts, if any, is recorded as a receivable or payable for variation margin in the Statement of Assets and Liabilities.
Entering into these contracts involves, to varying degrees, elements of interest, liquidity and counterparty credit risk in excess of the amounts recognized in the Statement of Assets and Liabilities. Such risks involve the possibility that there may be unfavorable changes in interest rates, market conditions or other conditions, it may be difficult to initiate a swap transaction or liquidate a position at an advantageous time or price which may result in significant losses, and that the FCM or CCP may not fulfill its obligation under the contract.
Credit default swap contracts
The Funds entered into credit default swap contracts to increase or decrease its credit exposure to an index and to increase or decrease its credit exposure to a specific debt security or a basket of debt securities, as a protection buyer to reduce overall credit exposure. These instruments may be used for other purposes in future periods. Credit default swap contracts are agreements in which one party pays fixed periodic payments to a counterparty in consideration for an agreement from the counterparty to make a specific payment should a specified credit event(s) take place. Although specified credit events are contract specific, credit events are generally defined as bankruptcy, failure to pay, restructuring, obligation acceleration, obligation default, or repudiation/moratorium.
As the purchaser of a credit default swap contract, the Fund purchases protection by paying a periodic interest rate on the notional amount to the counterparty. The interest amount is accrued daily as a component of unrealized appreciation (depreciation) and is recorded as a realized loss upon payment. If a credit event as specified in the contract occurs, the Fund may have the option either to deliver the reference obligation to the seller in exchange for a cash payment of its par amount,
| 122 | Columbia Capital Allocation Portfolios | Annual Report 2017 |
Notes to Financial Statements (continued)
January 31, 2017
or to receive a net cash settlement equal to the par amount less an agreed-upon value of the reference obligation as of the date of the credit event. The difference between the value of the obligation or cash delivered and the notional amount received will be recorded as a realized gain (loss).
As the seller of a credit default swap contract, the Fund sells protection to a buyer and will generally receive a periodic interest rate on a notional amount. The interest amount is accrued daily as a component of unrealized appreciation (depreciation) and is recorded as a realized gain upon receipt of the payment. If a credit event as specified in the contract with the counterparty occurs, the Fund may either be required to accept the reference obligation from the buyer in exchange for a cash payment of its notional amount, or to pay the buyer a net cash settlement equal to the notional amount less an agreed-upon value of the reference obligation (recovery value) as of the date of the credit event. The difference between the value of the obligation or cash received and the notional amount paid will be recorded as a realized gain (loss). The maximum potential amount of undiscounted future payments the Fund could be required to make as the seller of protection under a credit default swap contract is equal to the notional amount of the reference obligation. These potential amounts may be partially offset by any recovery values of the respective reference obligations or premiums received upon entering into the agreement. The notional amounts and market values of all credit default swap contracts in which the Fund is the seller of protection, if any, are disclosed in the Credit Default Swap Contracts Outstanding schedule following the Portfolio of Investments.
As a protection seller, the Fund bears the risk of loss from the credit events specified in the contract with the counterparty. For credit default swap contracts on credit indices, quoted market prices and resulting market values serve as an indicator of the current status of the payment/performance risk. Increasing market values, in absolute terms when compared to the notional amount of the swap, represent a deterioration of the reference entity’s credit soundness and a greater likelihood or risk of default or other credit event occurring as defined under the terms of the contract.
Any premium paid or received by the Fund upon entering into a credit default swap contract is recorded as an asset or liability, respectively, and amortized daily as a component of realized gain (loss) in the Statement of Operations. Credit default swap contracts are valued daily, and the change in value is recorded as unrealized appreciation (depreciation) until the termination of the swap, at which time a realized gain (loss) is recorded.
Credit default swap contracts can involve greater risks than if a fund had invested in the reference obligation directly since, in addition to general market risks, credit default swaps are subject to counterparty credit risk, leverage risk, hedging risk, correlation risk and liquidity risk.
Effects of derivative transactions in the financial statements
The following tables are intended to provide additional information about the effect of derivatives on the financial statements of the Funds, including: the fair value of derivatives by risk category and the location of those fair values in the Statements of Assets and Liabilities; and the impact of derivative transactions over the period in the Statements of Operations, including realized gains or losses and unrealized gains or losses. The derivative schedules following the Portfolio of Investments present additional information regarding derivative instruments outstanding at the end of the period, if any.
Columbia Capital Allocation Conservative Portfolio
The following table is a summary of the fair value of derivative instruments (not considered to be hedging instruments for accounting disclosure purposes) at January 31, 2017:
| | Asset derivatives | |
Risk exposure
category | Statement
of assets and liabilities
location | Fair value ($) |
| Credit risk | Net assets — unrealized appreciation on swap contracts | 14,510* |
| Equity risk | Net assets — unrealized appreciation on futures contracts | 89,585* |
| Foreign exchange risk | Unrealized appreciation on forward foreign currency exchange contracts | 9,332 |
| Total | | 113,427 |
Columbia Capital Allocation Portfolios | Annual Report 2017
| 123 |
Notes to Financial Statements (continued)
January 31, 2017
| | Liability derivatives | |
Risk exposure
category | Statement
of assets and liabilities
location | Fair value ($) |
| Credit risk | Net assets — unrealized depreciation on swap contracts | 89,577* |
| Credit risk | Premiums received on outstanding swap contracts | 178,437 |
| Equity risk | Net assets — unrealized depreciation on futures contracts | 99,911* |
| Foreign exchange risk | Unrealized depreciation on forward foreign currency exchange contracts | 6,429 |
| Interest rate risk | Net assets — unrealized depreciation on futures contracts | 28,091* |
| Total | | 402,445 |
| * | Includes cumulative appreciation (depreciation) as reported in the tables following the Portfolio of Investments. Only the current day’s variation margin is reported in receivables or payables in the Statement of Assets and Liabilities. |
The following table indicates the effect of derivative instruments (not considered to be hedging instruments for accounting disclosure purposes) in the Statement of Operations for the year ended January 31, 2017:
| Amount of realized gain (loss) on derivatives recognized in income |
Risk
exposure
category | Forward
foreign
currency
exchange
contracts
($) | Futures
contracts
($) | Swap
contracts
($) | Total
($) |
| Credit risk | — | �� | (304,553) | (304,553) |
| Equity risk | — | (432,087) | — | (432,087) |
| Foreign exchange risk | (20,696) | — | — | (20,696) |
| Interest rate risk | — | 821,696 | — | 821,696 |
| Total | (20,696) | 389,609 | (304,553) | 64,360 |
| |
| Change in unrealized appreciation (depreciation) on derivatives recognized in income |
Risk
exposure
category | Forward
foreign
currency
exchange
contracts
($) | Futures
contracts
($) | Swap
contracts
($) | Total
($) |
| Credit risk | — | — | (53,468) | (53,468) |
| Equity risk | — | 92,611 | — | 92,611 |
| Foreign exchange risk | 8,004 | — | — | 8,004 |
| Interest rate risk | — | (429,183) | — | (429,183) |
| Total | 8,004 | (336,572) | (53,468) | (382,036) |
The following table is a summary of the average outstanding volume by derivative instrument for the year ended January 31, 2017:
| Derivative instrument | Average notional
amounts ($)* |
| Futures contracts — long | 25,011,245 |
| Futures contracts — short | 3,912,505 |
| Credit default swap contracts — buy protection | 11,527,500 |
| Credit default swap contracts — sell protection | 687,500 |
| Derivative instrument | Average unrealized
appreciation ($)* | Average unrealized
depreciation ($)* |
| Forward foreign currency exchange contracts | 5,377 | (2,673) |
| * | Based on the ending quarterly outstanding amounts for the year ended January 31, 2017. |
| 124 | Columbia Capital Allocation Portfolios | Annual Report 2017 |
Notes to Financial Statements (continued)
January 31, 2017
Columbia Capital Allocation Moderate Conservative Portfolio
The following table is a summary of the fair value of derivative instruments (not considered to be hedging instruments for accounting disclosure purposes) at January 31, 2017:
| | Asset derivatives | |
Risk exposure
category | Statement
of assets and liabilities
location | Fair value ($) |
| Credit risk | Net assets — unrealized appreciation on swap contracts | 11,871* |
| Equity risk | Net assets — unrealized appreciation on futures contracts | 236,711* |
| Foreign exchange risk | Unrealized appreciation on forward foreign currency exchange contracts | 14,285 |
| Total | | 262,867 |
| | Liability derivatives | |
Risk exposure
category | Statement
of assets and liabilities
location | Fair value ($) |
| Credit risk | Net assets — unrealized depreciation on swap contracts | 201,157* |
| Credit risk | Premiums received on outstanding swap contracts | 145,994 |
| Equity risk | Net assets — unrealized depreciation on futures contracts | 313,720* |
| Foreign exchange risk | Unrealized depreciation on forward foreign currency exchange contracts | 9,846 |
| Interest rate risk | Net assets — unrealized depreciation on futures contracts | 95,223* |
| Total | | 765,940 |
| * | Includes cumulative appreciation (depreciation) as reported in the tables following the Portfolio of Investments. Only the current day’s variation margin is reported in receivables or payables in the Statement of Assets and Liabilities. |
The following table indicates the effect of derivative instruments (not considered to be hedging instruments for accounting disclosure purposes) in the Statement of Operations for the year ended January 31, 2017:
| Amount of realized gain (loss) on derivatives recognized in income |
Risk
exposure
category | Forward
foreign
currency
exchange
contracts
($) | Futures
contracts
($) | Swap
contracts
($) | Total
($) |
| Credit risk | — | — | (549,968) | (549,968) |
| Equity risk | — | 542,305 | — | 542,305 |
| Foreign exchange risk | (31,710) | — | — | (31,710) |
| Interest rate risk | — | 1,489,042 | — | 1,489,042 |
| Total | (31,710) | 2,031,347 | (549,968) | 1,449,669 |
| |
| Change in unrealized appreciation (depreciation) on derivatives recognized in income |
Risk
exposure
category | Forward
foreign
currency
exchange
contracts
($) | Futures
contracts
($) | Swap
contracts
($) | Total
($) |
| Credit risk | — | — | (156,252) | (156,252) |
| Equity risk | — | 439,841 | — | 439,841 |
| Foreign exchange risk | 12,329 | — | — | 12,329 |
| Interest rate risk | — | (1,142,604) | — | (1,142,604) |
| Total | 12,329 | (702,763) | (156,252) | (846,686) |
Columbia Capital Allocation Portfolios | Annual Report 2017
| 125 |
Notes to Financial Statements (continued)
January 31, 2017
The following table is a summary of the average outstanding volume by derivative instrument for the year ended January 31, 2017:
| Derivative instrument | Average notional
amounts ($)* |
| Futures contracts — long | 74,123,333 |
| Futures contracts — short | 8,832,850 |
| Credit default swap contracts — buy protection | 20,762,750 |
| Credit default swap contracts — sell protection | 562,500 |
| Derivative instrument | Average unrealized
appreciation ($)* | Average unrealized
depreciation ($)* |
| Forward foreign currency exchange contracts | 8,259 | (4,091) |
| * | Based on the ending quarterly outstanding amounts for the year ended January 31, 2017. |
Columbia Capital Allocation Moderate Portfolio
The following table is a summary of the fair value of derivative instruments (not considered to be hedging instruments for accounting disclosure purposes) at January 31, 2017:
| | Asset derivatives | |
Risk exposure
category | Statement
of assets and liabilities
location | Fair value ($) |
| Credit risk | Net assets — unrealized appreciation on swap contracts | 48,806* |
| Equity risk | Net assets — unrealized appreciation on futures contracts | 1,157,288* |
| Foreign exchange risk | Unrealized appreciation on forward foreign currency exchange contracts | 17,781 |
| Interest rate risk | Net assets — unrealized appreciation on futures contracts | 78,630* |
| Total | | 1,302,505 |
| | Liability derivatives | |
Risk exposure
category | Statement
of assets and liabilities
location | Fair value ($) |
| Credit risk | Net assets — unrealized depreciation on swap contracts | 422,436* |
| Credit risk | Premiums received on outstanding swap contracts | 600,197 |
| Equity risk | Net assets — unrealized depreciation on futures contracts | 662,127* |
| Foreign exchange risk | Unrealized depreciation on forward foreign currency exchange contracts | 18,405 |
| Interest rate risk | Net assets — unrealized depreciation on futures contracts | 285,710* |
| Total | | 1,988,875 |
| * | Includes cumulative appreciation (depreciation) as reported in the tables following the Portfolio of Investments. Only the current day’s variation margin is reported in receivables or payables in the Statement of Assets and Liabilities. |
| 126 | Columbia Capital Allocation Portfolios | Annual Report 2017 |
Notes to Financial Statements (continued)
January 31, 2017
The following table indicates the effect of derivative instruments (not considered to be hedging instruments for accounting disclosure purposes) in the Statement of Operations for the year ended January 31, 2017:
| Amount of realized gain (loss) on derivatives recognized in income |
Risk
exposure
category | Forward
foreign
currency
exchange
contracts
($) | Futures
contracts
($) | Swap
contracts
($) | Total
($) |
| Credit risk | — | — | (631,067) | (631,067) |
| Equity risk | — | 5,156,289 | — | 5,156,289 |
| Foreign exchange risk | (53,291) | — | — | (53,291) |
| Interest rate risk | — | 3,948,509 | — | 3,948,509 |
| Total | (53,291) | 9,104,798 | (631,067) | 8,420,440 |
| |
| Change in unrealized appreciation (depreciation) on derivatives recognized in income |
Risk
exposure
category | Forward
foreign
currency
exchange
contracts
($) | Futures
contracts
($) | Swap
contracts
($) | Total
($) |
| Credit risk | — | — | (373,630) | (373,630) |
| Equity risk | — | 1,838,337 | — | 1,838,337 |
| Foreign exchange risk | 8,772 | — | — | 8,772 |
| Interest rate risk | — | (2,784,712) | — | (2,784,712) |
| Total | 8,772 | (946,375) | (373,630) | (1,311,233) |
The following table is a summary of the average outstanding volume by derivative instrument for the year ended January 31, 2017:
| Derivative instrument | Average notional
amounts ($)* |
| Futures contracts — long | 224,592,779 |
| Futures contracts — short | 25,120,819 |
| Credit default swap contracts — buy protection | 21,940,750 |
| Credit default swap contracts — sell protection | 2,312,500 |
| Derivative instrument | Average unrealized
appreciation ($)* | Average unrealized
depreciation ($)* |
| Forward foreign currency exchange contracts | 18,575 | (15,099) |
| * | Based on the ending quarterly outstanding amounts for the year ended January 31, 2017. |
Columbia Capital Allocation Portfolios | Annual Report 2017
| 127 |
Notes to Financial Statements (continued)
January 31, 2017
Columbia Capital Allocation Moderate Aggressive Portfolio
The following table is a summary of the fair value of derivative instruments (not considered to be hedging instruments for accounting disclosure purposes) at January 31, 2017:
| | Asset derivatives | |
Risk exposure
category | Statement
of assets and liabilities
location | Fair value ($) |
| Credit risk | Net assets — unrealized appreciation on swap contracts | 122,674* |
| Equity risk | Net assets — unrealized appreciation on futures contracts | 1,706,522* |
| Foreign exchange risk | Unrealized appreciation on forward foreign currency exchange contracts | 12,390 |
| Interest rate risk | Net assets — unrealized appreciation on futures contracts | 86,493* |
| Total | | 1,928,079 |
| | Liability derivatives | |
Risk exposure
category | Statement
of assets and liabilities
location | Fair value ($) |
| Credit risk | Net assets — unrealized depreciation on swap contracts | 585,221* |
| Credit risk | Premiums received on outstanding swap contracts | 1,508,603 |
| Equity risk | Net assets — unrealized depreciation on futures contracts | 1,567,280* |
| Foreign exchange risk | Unrealized depreciation on forward foreign currency exchange contracts | 11,683 |
| Interest rate risk | Net assets — unrealized depreciation on futures contracts | 441,350* |
| Total | | 4,114,137 |
| * | Includes cumulative appreciation (depreciation) as reported in the tables following the Portfolio of Investments. Only the current day’s variation margin is reported in receivables or payables in the Statement of Assets and Liabilities. |
The following table indicates the effect of derivative instruments (not considered to be hedging instruments for accounting disclosure purposes) in the Statement of Operations for the year ended January 31, 2017:
| Amount of realized gain (loss) on derivatives recognized in income |
Risk
exposure
category | Forward
foreign
currency
exchange
contracts
($) | Futures
contracts
($) | Swap
contracts
($) | Total
($) |
| Credit risk | — | — | (835,341) | (835,341) |
| Equity risk | — | 22,361,344 | — | 22,361,344 |
| Foreign exchange risk | (36,692) | — | — | (36,692) |
| Interest rate risk | — | 2,201,938 | — | 2,201,938 |
| Total | (36,692) | 24,563,282 | (835,341) | 23,691,249 |
| |
| Change in unrealized appreciation (depreciation) on derivatives recognized in income |
Risk
exposure
category | Forward
foreign
currency
exchange
contracts
($) | Futures
contracts
($) | Swap
contracts
($) | Total
($) |
| Credit risk | — | — | (462,547) | (462,547) |
| Equity risk | — | 5,052,522 | — | 5,052,522 |
| Foreign exchange risk | 7,614 | — | — | 7,614 |
| Interest rate risk | — | (2,813,095) | — | (2,813,095) |
| Total | 7,614 | 2,239,427 | (462,547) | 1,784,494 |
| 128 | Columbia Capital Allocation Portfolios | Annual Report 2017 |
Notes to Financial Statements (continued)
January 31, 2017
The following table is a summary of the average outstanding volume by derivative instrument for the year ended January 31, 2017:
| Derivative instrument | Average notional
amounts ($)* |
| Futures contracts — long | 391,557,725 |
| Futures contracts — short | 34,676,198 |
| Credit default swap contracts — buy protection | 29,860,250 |
| Credit default swap contracts — sell protection | 5,812,500 |
| Derivative instrument | Average unrealized
appreciation ($)* | Average unrealized
depreciation ($)* |
| Forward foreign currency exchange contracts | 13,212 | (10,146) |
| * | Based on the ending quarterly outstanding amounts for the year ended January 31, 2017. |
Columbia Capital Allocation Aggressive Portfolio
The following table is a summary of the fair value of derivative instruments (not considered to be hedging instruments for accounting disclosure purposes) at January 31, 2017:
| | Asset derivatives | |
Risk exposure
category | Statement
of assets and liabilities
location | Fair value ($) |
| Credit risk | Net assets — unrealized appreciation on swap contracts | 59,358* |
| Equity risk | Net assets — unrealized appreciation on futures contracts | 523,583* |
| Foreign exchange risk | Unrealized appreciation on forward foreign currency exchange contracts | 14,146 |
| Interest rate risk | Net assets — unrealized appreciation on futures contracts | 16,506* |
| Total | | 613,593 |
| | Liability derivatives | |
Risk exposure
category | Statement
of assets and liabilities
location | Fair value ($) |
| Credit risk | Net assets — unrealized depreciation on swap contracts | 180,420* |
| Credit risk | Premiums received on outstanding swap contracts | 729,969 |
| Equity risk | Net assets — unrealized depreciation on futures contracts | 315,504* |
| Foreign exchange risk | Unrealized depreciation on forward foreign currency exchange contracts | 15,061 |
| Interest rate risk | Net assets — unrealized depreciation on futures contracts | 41,430* |
| Total | | 1,282,384 |
| * | Includes cumulative appreciation (depreciation) as reported in the tables following the Portfolio of Investments. Only the current day’s variation margin is reported in receivables or payables in the Statement of Assets and Liabilities. |
Columbia Capital Allocation Portfolios | Annual Report 2017
| 129 |
Notes to Financial Statements (continued)
January 31, 2017
The following table indicates the effect of derivative instruments (not considered to be hedging instruments for accounting disclosure purposes) in the Statement of Operations for the year ended January 31, 2017:
| Amount of realized gain (loss) on derivatives recognized in income |
Risk
exposure
category | Forward
foreign
currency
exchange
contracts
($) | Futures
contracts
($) | Swap
contracts
($) | Total
($) |
| Credit risk | — | — | (243,247) | (243,247) |
| Equity risk | — | 4,370,607 | — | 4,370,607 |
| Foreign exchange risk | (45,029) | — | — | (45,029) |
| Interest rate risk | — | 343,812 | — | 343,812 |
| Total | (45,029) | 4,714,419 | (243,247) | 4,426,143 |
| |
| Change in unrealized appreciation (depreciation) on derivatives recognized in income |
Risk
exposure
category | Forward
foreign
currency
exchange
contracts
($) | Futures
contracts
($) | Swap
contracts
($) | Total
($) |
| Credit risk | — | — | (121,062) | (121,062) |
| Equity risk | — | 1,027,891 | — | 1,027,891 |
| Foreign exchange risk | 7,750 | — | — | 7,750 |
| Interest rate risk | — | (623,795) | — | (623,795) |
| Total | 7,750 | 404,096 | (121,062) | 290,784 |
The following table is a summary of the average outstanding volume by derivative instrument for the year ended January 31, 2017:
| Derivative instrument | Average notional
amounts ($)* |
| Futures contracts — long | 78,718,568 |
| Futures contracts — short | 9,981,356 |
| Credit default swap contracts — buy protection | 9,029,250 |
| Credit default swap contracts — sell protection | 2,812,500 |
| Derivative instrument | Average unrealized
appreciation ($)* | Average unrealized
depreciation ($)* |
| Forward foreign currency exchange contracts | 15,420 | (12,370) |
| * | Based on the ending quarterly outstanding amounts for the year ended January 31, 2017. |
Offsetting of assets and liabilities
The following table presents the Fund’s gross and net amount of assets and liabilities available for offset under netting arrangements as well as any related collateral received or pledged by the Fund as of January 31, 2017:
| 130 | Columbia Capital Allocation Portfolios | Annual Report 2017 |
Notes to Financial Statements (continued)
January 31, 2017
Columbia Capital Allocation Conservative Portfolio
| | Barclays ($) | Morgan
Stanley ($) | Total ($) | | | | | | |
| Assets | | | | | | | | | |
| Centrally cleared credit default swap contracts (a) | - | 975 | 975 | | | | | | |
| Forward foreign currency exchange contracts | 9,332 | - | 9,332 | | | | | | |
| Total Assets | 9,332 | 975 | 10,307 | | | | | | |
| Liabilities | | | | | | | | | |
| Forward foreign currency exchange contracts | 6,429 | - | 6,429 | | | | | | |
| OTC credit default swap contracts(b) | 163,927 | - | 163,927 | | | | | | |
| Total Liabilities | 170,356 | - | 170,356 | | | | | | |
| Total Financial and Derivative Net Assets | (161,024) | 975 | (160,049) | | | | | | |
| Total collateral received (pledged) (c) | - | - | - | | | | | | |
| Net Amount (d) | (161,024) | 975 | (160,049) | | | | | | |
| (a) | Centrally cleared swaps are included within payable/receivable for variation margin on the Statement of Assets and Liabilities. |
| (b) | Over-the-Counter Swap Contracts are presented at market value plus periodic payments receivable (payable), which is comprised of unrealized appreciation, unrealized depreciation, premiums paid and premiums received. |
| (c) | In some instances, the actual collateral received and/or pledged may be more than the amount shown due to overcollateralization. |
| (d) | Represents the net amount due from/(to) counterparties in the event of default. |
Columbia Capital Allocation Moderate Conservative Portfolio
| | Barclays ($) | Morgan
Stanley ($) | Total ($) | | | | | | |
| Assets | | | | | | | | | |
| Centrally cleared credit default swap contracts (a) | - | 2,057 | 2,057 | | | | | | |
| Forward foreign currency exchange contracts | 14,285 | - | 14,285 | | | | | | |
| Total Assets | 14,285 | 2,057 | 16,342 | | | | | | |
| Liabilities | | | | | | | | | |
| Forward foreign currency exchange contracts | 9,846 | - | 9,846 | | | | | | |
| OTC credit default swap contracts (b) | 134,123 | - | 134,123 | | | | | | |
| Total Liabilities | 143,969 | - | 143,969 | | | | | | |
| Total Financial and Derivative Net Assets | (129,684) | 2,057 | (127,627) | | | | | | |
| Total collateral received (pledged) (c) | - | - | - | | | | | | |
| Net Amount (d) | (129,684) | 2,057 | (127,627) | | | | | | |
| (a) | Centrally cleared swaps are included within payable/receivable for variation margin on the Statement of Assets and Liabilities. |
| (b) | Over-the-Counter Swap Contracts are presented at market value plus periodic payments receivable (payable), which is comprised of unrealized appreciation, unrealized depreciation, premiums paid and premiums received. |
| (c) | In some instances, the actual collateral received and/or pledged may be more than the amount shown due to overcollateralization. |
| (d) | Represents the net amount due from/(to) counterparties in the event of default. |
Columbia Capital Allocation Portfolios | Annual Report 2017
| 131 |
Notes to Financial Statements (continued)
January 31, 2017
Columbia Capital Allocation Moderate Portfolio
| | Barclays ($) | BNP
Paribas ($) | Morgan
Stanley ($) | Total ($) | | | | | |
| Assets | | | | | | | | | |
| Centrally cleared credit default swap contracts (a) | - | - | 2,823 | 2,823 | | | | | |
| Forward foreign currency exchange contracts | - | 17,781 | - | 17,781 | | | | | |
| Total Assets | - | 17,781 | 2,823 | 20,604 | | | | | |
| Liabilities | | | | | | | | | |
| Forward foreign currency exchange contracts | - | 18,405 | - | 18,405 | | | | | |
| OTC credit default swap contracts (b) | 551,391 | - | - | 551,391 | | | | | |
| Total Liabilities | 551,391 | 18,405 | - | 569,796 | | | | | |
| Total Financial and Derivative Net Assets | (551,391) | (624) | 2,823 | (549,192) | | | | | |
| Total collateral received (pledged) (c) | (551,391) | - | - | (551,391) | | | | | |
| Net Amount (d) | - | (624) | 2,823 | 2,199 | | | | | |
| (a) | Centrally cleared swaps are included within payable/receivable for variation margin on the Statement of Assets and Liabilities. |
| (b) | Over-the-Counter Swap Contracts are presented at market value plus periodic payments receivable (payable), which is comprised of unrealized appreciation, unrealized depreciation, premiums paid and premiums received. |
| (c) | In some instances, the actual collateral received and/or pledged may be more than the amount shown due to overcollateralization. |
| (d) | Represents the net amount due from/(to) counterparties in the event of default. |
Columbia Capital Allocation Moderate Aggressive Portfolio
| | Barclays ($) | Citi ($) | Morgan
Stanley ($) | Total ($) | | | | | |
| Assets | | | | | | | | | |
| Centrally cleared credit default swap contracts (a) | - | - | 3,882 | 3,882 | | | | | |
| Forward foreign currency exchange contracts | - | 12,390 | - | 12,390 | | | | | |
| Total Assets | - | 12,390 | 3,882 | 16,272 | | | | | |
| Liabilities | | | | | | | | | |
| Forward foreign currency exchange contracts | - | 11,683 | - | 11,683 | | | | | |
| OTC credit default swap contracts (b) | 1,385,929 | - | - | 1,385,929 | | | | | |
| Total Liabilities | 1,385,929 | 11,683 | - | 1,397,612 | | | | | |
| Total Financial and Derivative Net Assets | (1,385,929) | 707 | 3,882 | (1,381,340) | | | | | |
| Total collateral received (pledged) (c) | (1,385,929) | - | - | (1,385,929) | | | | | |
| Net Amount (d) | - | 707 | 3,882 | 4,589 | | | | | |
| (a) | Centrally cleared swaps are included within payable/receivable for variation margin on the Statement of Assets and Liabilities. |
| (b) | Over-the-Counter Swap Contracts are presented at market value plus periodic payments receivable (payable), which is comprised of unrealized appreciation, unrealized depreciation, premiums paid and premiums received. |
| (c) | In some instances, the actual collateral received and/or pledged may be more than the amount shown due to overcollateralization. |
| (d) | Represents the net amount due from/(to) counterparties in the event of default. |
| 132 | Columbia Capital Allocation Portfolios | Annual Report 2017 |
Notes to Financial Statements (continued)
January 31, 2017
Columbia Capital Allocation Aggressive Portfolio
| | Barclays ($) | JPMorgan ($) | Morgan
Stanley ($) | Total ($) | | | | | |
| Assets | | | | | | | | | |
| Centrally cleared credit default swap contracts (a) | - | - | 1,187 | 1,187 | | | | | |
| Forward foreign currency exchange contracts | - | 14,146 | - | 14,146 | | | | | |
| Total Assets | - | 14,146 | 1,187 | 15,333 | | | | | |
| Liabilities | | | | | | | | | |
| Forward foreign currency exchange contracts | - | 15,061 | - | 15,061 | | | | | |
| OTC credit default swap contracts (b) | 670,611 | - | - | 670,611 | | | | | |
| Total Liabilities | 670,611 | 15,061 | - | 685,672 | | | | | |
| Total Financial and Derivative Net Assets | (670,611) | (915) | 1,187 | (670,339) | | | | | |
| Total collateral received (pledged) (c) | (670,611) | - | - | (670,611) | | | | | |
| Net Amount (d) | - | (915) | 1,187 | 272 | | | | | |
| (a) | Centrally cleared swaps are included within payable/receivable for variation margin on the Statement of Assets and Liabilities. |
| (b) | Over-the-Counter Swap Contracts are presented at market value plus periodic payments receivable (payable), which is comprised of unrealized appreciation, unrealized depreciation, premiums paid and premiums received. |
| (c) | In some instances, the actual collateral received and/or pledged may be more than the amount shown due to overcollateralization. |
| (d) | Represents the net amount due from/(to) counterparties in the event of default. |
Security transactions
Security transactions are accounted for on the trade date. Cost is determined and gains (losses) are based upon the specific identification method for both financial statement and federal income tax purposes.
Income recognition
Corporate actions and dividend income are generally recorded net of any non-reclaimable tax withholdings, on the ex-dividend date or upon receipt of ex-dividend notification in the case of certain foreign securities.
The Funds may receive distributions from holdings in equity securities, business development companies (BDCs), exchange-traded funds, other regulated investment companies (RICs), and real estate investment trusts (REITs), which report information on the tax character of their distributions annually. These distributions are allocated to dividend income, capital gain and return of capital based on actual information reported. Return of capital is recorded as a reduction of the cost basis of securities held. If the Fund no longer owns the applicable securities, return of capital is recorded as a realized gain. With respect to REITs, to the extent actual information has not yet been reported, estimates for return of capital are made by the Fund’s management. Management’s estimates are subsequently adjusted when the actual character of the distributions is disclosed by the REITs, which could result in a proportionate change in return of capital to shareholders.
Awards from class action litigation are recorded as a reduction of cost basis if the Fund still owns the applicable securities on the payment date. If the Fund no longer owns the applicable securities, the proceeds are recorded as realized gains.
Income and capital gain distributions from the Underlying Funds, if any, are recorded on the ex-dividend date.
Expenses
General expenses of the Trusts are allocated to the Funds and other funds of the Trust based upon relative net assets or other expense allocation methodologies determined by the nature of the expense. Expenses directly attributable to a Fund are charged to that Fund. Expenses directly attributable to a specific class of shares are charged to that share class.
Determination of class net asset value
All income, expenses (other than class-specific expenses which are charged directly to that share class, as shown in the Statement of Operations) and realized and unrealized gains (losses) are allocated to each class of a Fund on a daily basis, based on the relative net assets of each class, for purposes of determining the net asset value of each class.
Columbia Capital Allocation Portfolios | Annual Report 2017
| 133 |
Notes to Financial Statements (continued)
January 31, 2017
Federal income tax status
For federal income tax purposes, each Fund is treated as a separate entity. The Funds intend to qualify each year as separate regulated investment companies under Subchapter M of the Internal Revenue Code, as amended, and will distribute substantially all of their taxable income for their tax year, and as such will not be subject to federal income taxes. In addition, the Funds intend to distribute in each calendar year substantially all of their net investment income, capital gains and certain other amounts, if any, such that the Funds should not be subject to federal excise tax. Therefore, no federal income or excise tax provisions are recorded.
Foreign taxes
The Funds may be subject to foreign taxes on income, gains on investments or currency repatriation, a portion of which may be recoverable. The Fund will accrue such taxes and recoveries, as applicable, based upon its current interpretation of tax rules and regulations that exist in the markets in which it invests.
Realized gains in certain countries may be subject to foreign taxes at the Fund level, based on statutory rates. The Fund accrues for such foreign taxes on realized and unrealized gains at the appropriate rate for each jurisdiction, as applicable. The amount, if any, is disclosed as a liability on the Statement of Assets and Liabilities.
Distributions to shareholders
Distributions from net investment income, if any, are declared and paid quarterly for Columbia Capital Allocation Conservative Portfolio, Columbia Capital Allocation Moderate Conservative Portfolio, Columbia Capital Allocation Moderate Portfolio and Columbia Capital Allocation Moderate Aggressive Portfolio. Distributions from net investment income, if any, are declared and paid annually for Columbia Capital Allocation Aggressive Portfolio. Net realized capital gains, if any, are distributed along with the income dividend. Income distributions and capital gain distributions are determined in accordance with federal income tax regulations, which may differ from GAAP.
Guarantees and indemnifications
Under the Trusts’ organizational documents and, in some cases, by contract, its officers and trustees are indemnified against certain liabilities arising out of the performance of their duties to the Trust or its funds. In addition, certain of the Funds’ contracts with their service providers contain general indemnification clauses. The Funds’ maximum exposure under these arrangements is unknown since the amount of any future claims that may be made against the Funds cannot be determined, and the Funds have no historical basis for predicting the likelihood of any such claims.
Investment company reporting modernization
In October 2016, the U.S. Securities and Exchange Commission adopted new rules and forms, and amendments to certain current rules and forms, to modernize reporting and disclosure of information by registered investment companies. The amendments to Regulation S-X will require standardized, enhanced disclosure about derivatives in investment company financial statements, and will also change the rules governing the form and content of such financial statements. The amendments to Regulation S-X take effect on August 1, 2017. At this time, management is assessing the anticipated impact of these regulatory developments.
Note 3. Fees and other transactions with affiliates
Management services fees and underlying fund fees
Effective June 1, 2016, the Funds entered into a Management Agreement with the Investment Manager. Under the Management Agreement, the Investment Manager provides the Fund with investment research and advice, as well as administrative and accounting services. The management services fee is an annual fee that is a blend of (i) 0.020% on assets invested in Columbia proprietary funds (excluding any underlying funds that do not pay a management services fee (or investment advisory services fee, as applicable) to the Investment Manager), (ii) 0.120% on assets invested in non-exchange-traded third-party advised mutual funds and (iii) 0.570% on assets invested in all other securities, including other funds advised by the Investment Manager that do not pay a management services fee (or investment advisory services fee, as
| 134 | Columbia Capital Allocation Portfolios | Annual Report 2017 |
Notes to Financial Statements (continued)
January 31, 2017
applicable), exchange-traded funds, derivatives and individual securities. Prior to June 1, 2016, each Fund paid the Investment Manager an annual fee for advisory services under an Investment Management Services Agreement and a separate annual fee for administrative and accounting services under an Administrative Services Agreement.
The effective management services fee rates, net of any waiver, based on each Fund’s average daily net assets for the year ended January 31, 2017 (reflecting all advisory and administrative services fees paid to the Investment Manager) were as follows:
| Fund | Effective management services fee rate |
| Columbia Capital Allocation Conservative Portfolio | 0.089% |
| Columbia Capital Allocation Moderate Conservative Portfolio | 0.077% |
| Columbia Capital Allocation Moderate Portfolio | 0.055% |
| Columbia Capital Allocation Moderate Aggressive Portfolio | 0.088% |
| Columbia Capital Allocation Aggressive Portfolio | 0.071% |
For the period from February 1, 2016 through May 31, 2016, the investment advisory services fee paid to the Investment Manager and the administrative services fee paid to the Investment Manager were as follows:
| Fund | Investment
advisory
services
fee ($) | Administrative
services
fee ($) |
| Columbia Capital Allocation Conservative Portfolio | 55,598 | 18,281 |
| Columbia Capital Allocation Moderate Conservative Portfolio | 103,979 | 42,256 |
| Columbia Capital Allocation Moderate Portfolio | 175,133 | 102,783 |
| Columbia Capital Allocation Moderate Aggressive Portfolio | 488,858 | 142,763 |
| Columbia Capital Allocation Aggressive Portfolio | 118,624 | 43,727 |
In addition to the fees and expenses which the Funds bear directly, the Funds indirectly bear a pro rata share of the fees and expenses of the Underlying Funds in which the Funds invest. Because the Underlying Funds have varied expense and fee levels and the Funds may own different proportions of Underlying Funds at different times, the amount of fees and expenses incurred indirectly by the Funds will vary. These expenses are not reflected in the expenses shown in Statement of Operations and are not included in the ratios to average net assets shown in the Financial Highlights.
Other expenses
Other expenses are for, among other things, miscellaneous expenses of the Funds or the Board of Trustees, including payments to Board Services Corp., a company providing limited administrative services to the Funds and the Board of Trustees. That company’s expenses include boardroom and office expense, employee compensation, employee health and retirement benefits and certain other expenses. For the year ended January 31, 2017, other expenses paid by the Fund to this company were as follows:
| Fund | Amount ($) |
| Columbia Capital Allocation Conservative Portfolio | 95 |
| Columbia Capital Allocation Moderate Conservative Portfolio | 129 |
| Columbia Capital Allocation Moderate Portfolio | 215 |
| Columbia Capital Allocation Moderate Aggressive Portfolio | 271 |
| Columbia Capital Allocation Aggressive Portfolio | 131 |
Compensation of board members
Members of the Board of Trustees, who are not officers or employees of the Investment Manager or Ameriprise Financial, are compensated for their services to the Funds as disclosed in the Statement of Operations. Under a Deferred Compensation Plan (the Plan), these members of the Board of Trustees may elect to defer payment of up to 100% of their compensation. Deferred amounts are treated as though equivalent dollar amounts had been invested in shares of certain funds managed by
Columbia Capital Allocation Portfolios | Annual Report 2017
| 135 |
Notes to Financial Statements (continued)
January 31, 2017
the Investment Manager. Each Fund’s liability for these amounts is adjusted for market value changes and remains in the Funds until distributed in accordance with the Plan. All amounts payable under the Plan constitute a general unsecured obligation of the Funds.
Compensation of Chief Compliance Officer
The Board of Trustees has appointed a Chief Compliance Officer to the Funds in accordance with federal securities regulations. A portion of the Chief Compliance Officer’s total compensation is allocated to the Funds, along with other affiliated funds governed by the Board of Trustees, based on relative net assets. The total amount allocated to all affiliated funds governed by the Board of Trustees will not exceed $40,000 annually.
Transfer agency fees
Under a Transfer and Dividend Disbursing Agent Agreement, Columbia Management Investment Services Corp. (the Transfer Agent), an affiliate of the Investment Manager and a wholly-owned subsidiary of Ameriprise Financial, is responsible for providing transfer agency services to the Fund. The Transfer Agent has contracted with Boston Financial Data Services (BFDS) to serve as sub-transfer agent. The Transfer Agent pays the fees of BFDS for services as sub-transfer agent and BFDS is not entitled to reimbursement for such fees from the Fund (with the exception of out-of-pocket fees).
The Fund pays the Transfer Agent a monthly transfer agency fee based on the number or the average value of accounts, depending on the type of account. In addition, prior to October 1, 2016, the Transfer Agent also received sub-transfer agency fees based on a percentage of the average aggregate value of the Fund’s shares maintained in omnibus accounts (other than omnibus accounts for which American Enterprise Investment Services Inc. is the broker of record or accounts where the beneficial shareholder is a customer of Ameriprise Financial Services, Inc., for which the Transfer Agent receives a per account fee). Effective October 1, 2016, the Fund pays the Transfer Agent a fee for shareholder services based on the number of accounts or on a percentage of the average aggregate value of the Fund’s shares maintained in omnibus accounts up to the lesser of the amount charged by the servicing agent or a cap established by the Board from time to time.
The Transfer Agent also receives compensation from the Fund for various shareholder services and reimbursements for certain out-of-pocket fees. Effective January 1, 2017, total transfer agency fees for Class K and Class R5 shares are subject to an annual limitation of not more than 0.075% of the average daily net assets attributable to each share class. Total transfer agency fees for Class I and Class Y shares are subject to an annual limitation of not more than 0.025% of the average daily net assets attributable to each share class. Prior to January 1, 2017, total transfer agency fees for Class K and Class R5 shares were subject to an annual limitation of not more than 0.05% of the average daily net assets attributable to each share class. Class I and Class Y shares did not pay transfer agency fees.
For the year ended January 31, 2017, the Fund’s effective transfer agency fee rates as a percentage of average daily net assets of each class were as follows:
| Fund | Class A
(%) | Class B
(%) | Class C
(%) | Class K
(%) | Class R
(%) | Class R4
(%) | Class R5
(%) | Class V
(%) | Class Y
(%) | Class Z
(%) |
| Columbia Capital Allocation Conservative Portfolio | 0.11 | 0.11 | 0.11 | 0.05 | 0.11 | 0.11 | 0.05 | — | 0.00 (a) | 0.11 |
| Columbia Capital Allocation Moderate Conservative Portfolio | 0.11 | 0.11 | 0.11 | 0.05 | 0.11 | 0.11 | 0.05 | — | 0.00 (a) | 0.11 |
| Columbia Capital Allocation Moderate Portfolio | 0.10 | 0.10 | 0.10 | 0.05 | 0.10 | 0.10 | 0.05 | — | 0.00 (a) | 0.10 |
| Columbia Capital Allocation Moderate Aggressive Portfolio | 0.14 | 0.14 | 0.14 | 0.05 | 0.14 | 0.14 | 0.05 | 0.14 | 0.00 (a) | 0.14 |
| Columbia Capital Allocation Aggressive Portfolio | 0.12 | 0.12 | 0.12 | 0.05 | 0.13 | 0.13 | 0.05 | — | 0.00 (a) | 0.12 |
An annual minimum account balance fee of $20 may apply to certain accounts with a value below the applicable share class’s initial minimum investment requirements to reduce the impact of small accounts on transfer agency fees. These minimum account balance fees are remitted to the Funds and recorded as part of expense reductions in the Statement of Operations.
| 136 | Columbia Capital Allocation Portfolios | Annual Report 2017 |
Notes to Financial Statements (continued)
January 31, 2017
For the year ended January 31, 2017, these minimum account balance fees reduced total expenses as follows:
| Fund | Amount ($) |
| Columbia Capital Allocation Conservative Portfolio | — |
| Columbia Capital Allocation Moderate Conservative Portfolio | 80 |
| Columbia Capital Allocation Moderate Portfolio | 60 |
| Columbia Capital Allocation Moderate Aggressive Portfolio | 9,774 |
| Columbia Capital Allocation Aggressive Portfolio | 120 |
Plan administration fees
Under a Plan Administration Services Agreement with the Transfer Agent, each Fund pays an annual fee at a rate of 0.25% of the Fund’s average daily net assets attributable to Class K shares for the provision of various administrative, recordkeeping, communication and educational services.
Distribution and service fees
The Funds have an agreement with Columbia Management Investment Distributors, Inc. (the Distributor), an affiliate of the Investment Manager and a wholly-owned subsidiary of Ameriprise Financial, for distribution and shareholder services. The Board of Trustees has approved and the Fund has adopted, distribution and shareholder service plans (the Plans) applicable to certain share classes, which set the distribution and service fees for the Fund. These fees are calculated daily and are intended to compensate the Distributor and/or eligible selling and/or servicing agents for selling shares of the Funds and providing services to investors.
Under the Plans, each Fund pays a monthly fee to the Distributor at the annual rates of up to 0.25% of each Fund’s average daily net assets attributable to Class A shares, up to 1.00% of each Fund’s average daily net assets attributable to Class B and Class C shares and up to 0.50% of each Fund’s average daily net assets attributable to Class R shares (of which up to 0.25% may be used for shareholder services for Columbia Capital Allocation Conservative Portfolio, Columbia Capital Allocation Moderate Portfolio and Columbia Capital Allocation Aggressive Portfolio).
For Class B and Class C shares of the Funds, of 1.00% fee, up to 0.75% is reimbursed for distribution expenses.
The amount of distribution expenses incurred by the Distributor and not yet reimbursed (unreimbursed expense) for each Fund was approximately as follows:
| Fund | Class B ($) | Class C ($) |
| Columbia Capital Allocation Conservative Portfolio | 1,614,000 | 268,000 |
| Columbia Capital Allocation Moderate Conservative Portfolio | 2,714,000 | 462,000 |
| Columbia Capital Allocation Moderate Portfolio | 4,959,000 | 1,601,000 |
| Columbia Capital Allocation Moderate Aggressive Portfolio | 4,168,000 | 1,194,000 |
| Columbia Capital Allocation Aggressive Portfolio | 1,197,000 | 289,000 |
These amounts are based on the most recent information available as of December 31, 2016, and may be recovered from future payments under the distribution plan or CDSCs. To the extent the unreimbursed expense has been fully recovered, the distribution fee is reduced.
Shareholder services fees
Columbia Capital Allocation Moderate Aggressive Portfolio has adopted a shareholder services plan that permits it to pay for certain services provided to Class V shareholders by their selling and/or servicing agents. The Fund may pay shareholder servicing fees up to an aggregate annual rate of 0.50% of the Fund’s average daily net assets attributable to Class V shares (comprised of up to 0.25% for shareholder liaison services and up to 0.25% for administrative support services). These fees are currently limited to an aggregate annual rate of not more than 0.25% of the Fund’s average daily net assets attributable to Class V shares.
Columbia Capital Allocation Portfolios | Annual Report 2017
| 137 |
Notes to Financial Statements (continued)
January 31, 2017
Sales charges (unaudited)
Sales charges, including front-end and CDSCs, received by the Distributor for distributing each Fund’s shares for the year ended January 31, 2017, if any, are as follows:
| Fund | Class A ($) | Class B ($) | Class C ($) | Class V ($) |
| Columbia Capital Allocation Conservative Portfolio | 196,516 | 27 | 5,183 | — |
| Columbia Capital Allocation Moderate Conservative Portfolio | 502,993 | 206 | 9,229 | — |
| Columbia Capital Allocation Moderate Portfolio | 1,509,773 | 603 | 21,038 | — |
| Columbia Capital Allocation Moderate Aggressive Portfolio | 1,911,148 | 1,011 | 18,288 | 6,032 |
| Columbia Capital Allocation Aggressive Portfolio | 1,030,483 | 187 | 7,477 | — |
Expenses waived/reimbursed by the Investment Manager and its affiliates
The Investment Manager and certain of its affiliates have contractually agreed to waive fees and/or reimburse expenses (excluding certain fees and expenses described below) for the periods disclosed below, unless sooner terminated at the sole discretion of the Board of Trustees, so that each Fund’s net operating expenses, after giving effect to fees waived/expenses reimbursed and any balance credits and/or overdraft charges from the Funds’ custodian, do not exceed the following annual rates as a percentage of the class’ average daily net assets:
| | June 1, 2016
through
May 31, 2017 |
| Fund | Class A
(%) | Class B
(%) | Class C
(%) | Class K
(%) | Class R
(%) | Class R4
(%) | Class R5
(%) | Class V
(%) | Class Y
(%) | Class Z
(%) |
| Columbia Capital Allocation Conservative Portfolio | 0.49 | 1.24 | 1.24 | 0.44 | 0.74 | 0.24 | 0.19 | N/A | 0.14 | 0.24 |
| Columbia Capital Allocation Moderate Conservative Portfolio | 0.49 | 1.24 | 1.24 | 0.44 | 0.74 | 0.24 | 0.19 | N/A | 0.14 | 0.24 |
| Columbia Capital Allocation Moderate Portfolio | 0.47 | 1.22 | 1.22 | 0.42 | 0.72 | 0.22 | 0.17 | N/A | 0.12 | 0.22 |
| Columbia Capital Allocation Moderate Aggressive Portfolio | 0.51 | 1.26 | 1.26 | 0.46 | 0.76 | 0.26 | 0.21 | 0.51 | 0.16 | 0.26 |
| Columbia Capital Allocation Aggressive Portfolio | 0.51 | 1.26 | 1.26 | 0.46 | 0.76 | 0.26 | 0.21 | N/A | 0.16 | 0.26 |
| | Prior to
June 1, 2016 |
| Fund | Class A
(%) | Class B
(%) | Class C
(%) | Class K
(%) | Class R
(%) | Class R4
(%) | Class R5
(%) | Class V
(%) | Class Y
(%) | Class Z
(%) |
| Columbia Capital Allocation Conservative Portfolio | 0.51 | 1.26 | 1.26 | 0.46 | 0.76 | 0.26 | 0.21 | N/A | 0.16 | 0.26 |
| Columbia Capital Allocation Moderate Conservative Portfolio | 0.51 | 1.26 | 1.26 | 0.46 | 0.76 | 0.26 | 0.21 | N/A | 0.16 | 0.26 |
| Columbia Capital Allocation Moderate Portfolio | 0.51 | 1.26 | 1.26 | 0.46 | 0.76 | 0.26 | 0.21 | N/A | 0.16 | 0.26 |
| Columbia Capital Allocation Moderate Aggressive Portfolio | 0.51 | 1.26 | 1.26 | 0.46 | 0.76 | 0.26 | 0.21 | 0.51 | 0.16 | 0.26 |
| Columbia Capital Allocation Aggressive Portfolio | 0.51 | 1.26 | 1.26 | 0.46 | 0.76 | 0.26 | 0.21 | N/A | 0.16 | 0.26 |
Under the agreement governing these fee waivers and/or expense reimbursement arrangements, the following fees and expenses are excluded from the waiver/reimbursement commitment, and therefore will be paid by the Fund, if applicable: taxes (including foreign transaction taxes), expenses associated with investments in affiliated and non-affiliated pooled investment vehicles (including mutual funds and exchange-traded funds), transaction costs and brokerage commissions, costs related to any securities lending program, dividend and interest expenses associated with securities sold short, inverse floater program fees and expenses, transaction charges and interest on borrowed money, interest, infrequent and/or unusual expenses and any other expenses the exclusion of which is specifically approved by the Board of Trustees. Each Fund’s management services fee is also excluded from the waiver/reimbursement commitment and is therefore paid by the Funds. This agreement may be modified or amended only with approval from the Investment Manager, certain of its affiliates and the Fund. Any fees waived and/or expenses reimbursed under the expense reimbursement arrangements described above are not recoverable by the Investment Manager or its affiliates in future periods.
| 138 | Columbia Capital Allocation Portfolios | Annual Report 2017 |
Notes to Financial Statements (continued)
January 31, 2017
Note 4. Federal tax information
The timing and character of income and capital gain distributions are determined in accordance with income tax regulations, which may differ from GAAP because of temporary or permanent book to tax differences.
At January 31, 2017, these differences are primarily due to differing treatment for deferral/reversal of wash sale losses, passive foreign investment company (PFIC) holdings, re-characterization of distributions for investments, derivative investments, late-year ordinary losses, capital loss carryforwards, trustees’ deferred compensation, foreign currency transactions and distribution reclassifications. To the extent these differences are permanent, reclassifications are made among the components of the Fund’s net assets in the Statement of Assets and Liabilities. Temporary differences do not require reclassifications.
In the Statement of Assets and Liabilities the following reclassifications were made:
| Fund | Undistributed
(excess of distributions over)
net investment income ($) | Accumulated
net realized
gain (loss) ($) | Paid in capital
increase
(decrease) ($) |
| Columbia Capital Allocation Conservative Portfolio | 372,267 | (372,268) | 1 |
| Columbia Capital Allocation Moderate Conservative Portfolio | 1,019,317 | (1,019,317) | — |
| Columbia Capital Allocation Moderate Portfolio | 3,755,275 | (3,755,275) | — |
| Columbia Capital Allocation Moderate Aggressive Portfolio | 2,065,122 | (2,065,122) | — |
| Columbia Capital Allocation Aggressive Portfolio | 767,688 | (767,687) | (1) |
Net investment income (loss) and net realized gains (losses), as disclosed in the Statement of Operations, and net assets were not affected by these reclassifications.
The tax character of distributions paid during the years indicated was as follows:
| | Year Ended January 31, 2017 | Year Ended January 31, 2016 |
| Fund | Ordinary
income ($) | Long-term
capital gains ($) | Total ($) | Ordinary
income ($) | Long-term
capital gains ($) | Total ($) |
| Columbia Capital Allocation Conservative Portfolio | 4,117,122 | 2,156,875 | 6,273,997 | 5,511,697 | 4,860,552 | 10,372,249 |
| Columbia Capital Allocation Moderate Conservative Portfolio | 9,766,303 | 11,609,575 | 21,375,878 | 14,425,969 | 18,331,287 | 32,757,256 |
| Columbia Capital Allocation Moderate Portfolio | 28,811,684 | 37,896,551 | 66,708,235 | 33,388,988 | 86,969,786 | 120,358,774 |
| Columbia Capital Allocation Moderate Aggressive Portfolio | 28,654,252 | 76,281,211 | 104,935,463 | 44,229,587 | 123,124,048 | 167,353,635 |
| Columbia Capital Allocation Aggressive Portfolio | 7,265,468 | 24,879,383 | 32,144,851 | 11,902,853 | 43,616,414 | 55,519,267 |
Short-term capital gain distributions, if any, are considered ordinary income distributions for tax purposes.
At January 31, 2017, the components of distributable earnings on a tax basis were as follows:
| Fund | Undistributed
ordinary
income ($) | Undistributed
long-term
capital gains ($) | Capital loss
carryforwards ($) | Net unrealized
appreciation
(depreciation) ($) |
| Columbia Capital Allocation Conservative Portfolio | 922,446 | — | (869,431) | (2,378,034) |
| Columbia Capital Allocation Moderate Conservative Portfolio | 2,231,117 | 3,622,111 | — | 3,908,688 |
| Columbia Capital Allocation Moderate Portfolio | 1,582,631 | 31,543,823 | — | 44,205,272 |
| Columbia Capital Allocation Moderate Aggressive Portfolio | 7,453,350 | 45,070,208 | — | 97,137,189 |
| Columbia Capital Allocation Aggressive Portfolio | 1,344,775 | 17,416,280 | — | 39,361,701 |
Columbia Capital Allocation Portfolios | Annual Report 2017
| 139 |
Notes to Financial Statements (continued)
January 31, 2017
At January 31, 2017, the cost of investments for federal income tax purposes along with the aggregate gross unrealized appreciation and depreciation based on that cost was:
| Fund | Tax cost ($) | Gross
unrealized
appreciation ($) | Gross
unrealized
(depreciation) ($) | Net unrealized
appreciation
(depreciation) ($) |
| Columbia Capital Allocation Conservative Portfolio | 266,523,434 | 4,212,987 | (6,591,021) | (2,378,034) |
| Columbia Capital Allocation Moderate Conservative Portfolio | 609,381,397 | 16,336,557 | (12,427,869) | 3,908,688 |
| Columbia Capital Allocation Moderate Portfolio | 1,476,111,097 | 71,745,078 | (27,539,806) | 44,205,272 |
| Columbia Capital Allocation Moderate Aggressive Portfolio | 2,013,117,941 | 131,935,052 | (34,797,863) | 97,137,189 |
| Columbia Capital Allocation Aggressive Portfolio | 632,868,089 | 51,265,348 | (11,903,647) | 39,361,701 |
The following capital loss carryforwards, determined at January 31, 2017, may be available to reduce taxable income arising from future net realized gains on investments, if any, to the extent permitted by the Internal Revenue Code. Capital loss carryforwards with no expiration are required to be utilized prior to any capital losses which carry an expiration date. As a result of this ordering rule, capital loss carryforwards which carry an expiration date may be more likely to expire unused. In addition, for the year ended January 31, 2017, capital loss carryforwards utilized, expired unused and permanently lost were as follows:
| Fund | 2017 ($) | 2018 ($) | 2019 ($) | No expiration
short-term ($) | No expiration
long-term ($) | Total ($) | Utilized ($) | Expired ($) | Permanently
lost ($) |
| Columbia Capital Allocation Conservative Portfolio | — | — | — | 574,410 | 295,021 | 869,431 | — | — | — |
Under current tax rules, regulated investment companies can elect to treat certain late-year ordinary losses incurred and post-October capital losses (capital losses realized after October 31) as arising on the first day of the following taxable year. As of January 31, 2017, the Funds will elect to treat the following late-year ordinary losses and post-October capital losses as arising on February 1, 2017.
| Fund | Late year
ordinary losses ($) | Post-october
capital losses ($) |
| Columbia Capital Allocation Aggressive Portfolio | 10,490 | — |
Management of the Funds has concluded that there are no significant uncertain tax positions in the Funds that would require recognition in the financial statements. However, management’s conclusion may be subject to review and adjustment at a later date based on factors including, but not limited to, new tax laws, regulations, and administrative interpretations (including relevant court decisions). Generally, the Funds’ federal tax returns for the prior three fiscal years remain subject to examination by the Internal Revenue Service.
Note 5. Portfolio information
For the year ended January 31, 2017, the cost of purchases and proceeds from sales of securities, but excluding short-term investments and derivatives, if any, for each Fund aggregated to:
| | Purchases
($) | Proceeds
from sales
($) |
| Columbia Capital Allocation Conservative Portfolio | 59,439,724 | 89,937,717 |
| Columbia Capital Allocation Moderate Conservative Portfolio | 106,251,706 | 180,561,460 |
| Columbia Capital Allocation Moderate Portfolio | 139,889,702 | 256,597,222 |
| Columbia Capital Allocation Moderate Aggressive Portfolio | 176,437,448 | 380,601,592 |
| Columbia Capital Allocation Aggressive Portfolio | 72,273,951 | 113,547,410 |
The amount of purchase and sale activity impacts the portfolio turnover rate reported in the Financial Highlights.
| 140 | Columbia Capital Allocation Portfolios | Annual Report 2017 |
Notes to Financial Statements (continued)
January 31, 2017
Note 6. Affiliated money market fund
Each Fund may invest in Columbia Short-Term Cash Fund, an affiliated money market fund established for the exclusive use by each Fund and other affiliated funds (the Affiliated MMF). The income earned by the Funds from such investments is included as Dividends - affiliated issuers in the Statement of Operations. As an investing fund, each Fund indirectly bears its proportionate share of the expenses of the Affiliated MMF. Effective October 1, 2016, the Affiliated MMF prices its shares with a floating net asset value (NAV) and no longer seeks to maintain a stable NAV. In addition, the Board of Trustees of the Affiliated MMF may impose a fee on redemptions (sometimes referred to as a liquidity fee) or temporarily suspend redemptions (sometimes referred to as imposing a redemption gate) in the event its liquidity falls below regulatory limits.
Note 7. Line of credit
Each Fund has access to a revolving credit facility with a syndicate of banks led by Citibank, N.A., HSBC Bank USA, N.A. and JPMorgan Chase Bank, N.A. whereby the Funds may borrow for the temporary funding of shareholder redemptions or for other temporary or emergency purposes. The credit facility agreement, which is a collective agreement between the Funds and certain other funds managed by the Investment Manager, severally and not jointly, permits collective borrowings up to $1 billion. Interest is charged to each participating fund based on its borrowings at a rate equal to the higher of (i) the overnight federal funds rate plus 1.00% or (ii) the one-month LIBOR rate plus 1.00%. Each borrowing under the credit facility matures no later than 60 days after the date of borrowing. Each Fund also pays a commitment fee equal to its pro rata share of the amount of the credit facility at a rate of 0.15% per annum. The commitment fee is included in other expenses in the Statement of Operations.
No Fund had borrowings during the year ended January 31, 2017.
Note 8. Significant risks
Shareholder concentration risk
At January 31, 2017, certain shareholder accounts owned more than 10% of the outstanding shares of one or more of the Funds. For unaffiliated shareholder accounts, the Funds have no knowledge about whether any portion of those shares were owned beneficially. Subscription and redemption activity of these accounts may have a significant effect on the operations of the Funds. In the case of a large redemption, the Fund may be forced to sell investments at inopportune times, including its liquid or more liquid positions, resulting in Fund losses and the Fund holding a higher percentage of less liquid or illiquid securities. Large redemptions could result in decreased economies of scale and increased operating expenses for non-redeeming Fund shareholders.
The number of accounts and aggregate percentages of shares outstanding held therein were as follows:
| Fund | Number of
unaffiliated
accounts | Percentage of
shares
outstanding
held —
unaffiliated (%) | Percentage of
shares
outstanding
held —
affiliated (%) |
| Columbia Capital Allocation Conservative Portfolio | — | — | 82.2 |
| Columbia Capital Allocation Moderate Conservative Portfolio | — | — | 79.6 |
| Columbia Capital Allocation Moderate Portfolio | — | — | 93.1 |
| Columbia Capital Allocation Moderate Aggressive Portfolio | 1 | 14.5 | 57.7 |
| Columbia Capital Allocation Aggressive Portfolio | — | — | 90.4 |
Note 9. Subsequent events
Management has evaluated the events and transactions that have occurred through the date the financial statements were issued and noted no items requiring adjustment of the financial statements or additional disclosure.
Columbia Capital Allocation Portfolios | Annual Report 2017
| 141 |
Notes to Financial Statements (continued)
January 31, 2017
Note 10. Information regarding pending and settled legal proceedings
Ameriprise Financial and certain of its affiliates have historically been involved in a number of legal, arbitration and regulatory proceedings, including routine litigation, class actions, and governmental actions, concerning matters arising in connection with the conduct of their business activities. Ameriprise Financial believes that the Funds are not currently the subject of, and that neither Ameriprise Financial nor any of its affiliates are the subject of, any pending legal, arbitration or regulatory proceedings that are likely to have a material adverse effect on the Funds or the ability of Ameriprise Financial or its affiliates to perform under their contracts with the Funds. Ameriprise Financial is required to make quarterly (10-Q), annual (10-K) and, as necessary, 8-K filings with the Securities and Exchange Commission (SEC) on legal and regulatory matters that relate to Ameriprise Financial and its affiliates. Copies of these filings may be obtained by accessing the SEC website at www.sec.gov.
There can be no assurance that these matters, or the adverse publicity associated with them, will not result in increased fund redemptions, reduced sale of fund shares or other adverse consequences to the Funds. Further, although we believe proceedings are not likely to have a material adverse effect on the Funds or the ability of Ameriprise Financial or its affiliates to perform under their contracts with the Funds, these proceedings are subject to uncertainties and, as such, we are unable to estimate the possible loss or range of loss that may result. An adverse outcome in one or more of these proceedings could result in adverse judgments, settlements, fines, penalties or other relief that could have a material adverse effect on the consolidated financial condition or results of operations of Ameriprise Financial.
| 142 | Columbia Capital Allocation Portfolios | Annual Report 2017 |
Report of Independent Registered Public Accounting Firm
To the Trustees of Columbia Funds Series Trust and the Shareholders of Columbia Capital Allocation Moderate Conservative Portfolio and Columbia Capital Allocation Moderate Aggressive Portfolio
In our opinion, the accompanying statement of assets and liabilities, including the portfolio of investments, and the related statements of operations and of changes in net assets and the financial highlights present fairly, in all material respects, the financial position of Columbia Capital Allocation Moderate Conservative Portfolio and Columbia Capital Allocation Moderate Aggressive Portfolio (the "Funds," constituting part of Columbia Funds Series Trust) as of January 31, 2017, the results of each of their operations for the year then ended, the changes in each of their net assets for each of the two years in the period then ended and the financial highlights for each of the five years in the period then ended, in conformity with accounting principles generally accepted in the United States of America. These financial statements and financial highlights (hereafter referred to as "financial statements") are the responsibility of the Funds’ management. Our responsibility is to express an opinion on these financial statements based on our audits. We conducted our audits of these financial statements in accordance with the standards of the Public Company Accounting Oversight Board (United States). Those standards require that we plan and perform the audit to obtain reasonable assurance about whether the financial statements are free of material misstatement. An audit includes examining, on a test basis, evidence supporting the amounts and disclosures in the financial statements, assessing the accounting principles used and significant estimates made by management, and evaluating the overall financial statement presentation. We believe that our audits, which included confirmation of securities as of January 31, 2017 by correspondence with the custodian, brokers, and transfer agent, provide a reasonable basis for our opinion.
PricewaterhouseCoopers LLP
Minneapolis, MN
March 24, 2017
To the Trustees of Columbia Funds Series Trust II and the Shareholders of Columbia Capital Allocation Conservative Portfolio, Columbia Capital Allocation Moderate Portfolio and Columbia Capital Allocation Aggressive Portfolio
In our opinion, the accompanying statement of assets and liabilities, including the portfolio of investments, and the related statements of operations and of changes in net assets and the financial highlights present fairly, in all material respects, the financial position of Columbia Capital Allocation Conservative Portfolio, Columbia Capital Allocation Moderate Portfolio, and Columbia Capital Allocation Aggressive Portfolio (the "Funds," constituting part of Columbia Funds Series Trust II) as of January 31, 2017, the results of each of their operations for the year then ended, the changes in each of their net assets for each of the two years in the period then ended and the financial highlights for each of the five years in the period then ended, in conformity with accounting principles generally accepted in the United States of America. These financial statements and financial highlights (hereafter referred to as "financial statements") are the responsibility of the Funds’ management. Our responsibility is to express an opinion on these financial statements based on our audits. We conducted our audits of these financial statements in accordance with the standards of the Public Company Accounting Oversight Board (United States). Those standards require that we plan and perform the audit to obtain reasonable assurance about whether the financial statements are free of material misstatement. An audit includes examining, on a test basis, evidence supporting the amounts and disclosures in the financial statements, assessing the accounting principles used and significant estimates made by management, and evaluating the overall financial statement presentation. We believe that our audits, which included confirmation of securities as of January 31, 2017 by correspondence with the custodian, brokers, and transfer agent, provide a reasonable basis for our opinion.
PricewaterhouseCoopers LLP
Minneapolis, MN
March 24, 2017
Columbia Capital Allocation Portfolios | Annual Report 2017
| 143 |
Federal Income Tax Information
(Unaudited)
The Funds hereby designates the following tax attributes for the fiscal year ended January 31, 2017. Shareholders will be notified in early 2018 of the amounts for use in preparing 2017 income tax returns.
| | Qualified
dividend
income | Dividends
received
deduction | Capital
gain
dividend | Foreign
taxes paid | Foreign
taxes paid
per share | Foreign
source
income | Foreign
source
income per
share |
| Columbia Capital Allocation Conservative Portfolio | 19.70% | 12.18% | $0 | $49,201 | $0.00 | $492,883 | $0.02 |
| Columbia Capital Allocation Moderate Conservative Portfolio | 32.98% | 20.60% | $3,960,483 | $170,962 | $0.00 | $1,664,050 | $0.03 |
| Columbia Capital Allocation Moderate Portfolio | 35.51% | 24.72% | $35,480,215 | $519,662 | $0.00 | $3,917,696 | $0.03 |
| Columbia Capital Allocation Moderate Aggressive Portfolio | 55.11% | 39.11% | $75,365,189 | $918,902 | $0.01 | $5,510,872 | $0.03 |
| Columbia Capital Allocation Aggressive Portfolio | 84.89% | 61.79% | $24,432,449 | $361,313 | $0.01 | $1,876,346 | $0.03 |
Qualified dividend income. For taxable, non-corporate shareholders, the percentage of ordinary income distributed during the fiscal year that represents qualified dividend income subject to reduced tax rates.
Dividends received deduction. The percentage of ordinary income distributed during the fiscal year that qualifies for the corporate dividends received deduction.
Capital gain dividend. The Fund designates as a capital gain dividend the amount reflected above, or if subsequently determined to be different, the net capital gain of such fiscal period.
Foreign taxes. The Fund makes the election to pass through to shareholders the foreign taxes paid. Eligible shareholders may claim a foreign tax credit. These taxes, and the corresponding foreign source income, are provided.
| 144 | Columbia Capital Allocation Portfolios | Annual Report 2017 |
Shareholders elect the Board that oversees the Fund’s operations. The Board appoints officers who are responsible for day-to-day business decisions based on policies set by the Board. The following table provides basic biographical information about the Fund’s Trustees, including their principal occupations during the past five years, although specific titles for individuals may have varied over the period. Under current Board policy, Trustees not affiliated with the Investment Manager generally may serve through the end of the calendar year in which he or she reaches either the mandatory retirement age established by the Board or the fifteenth anniversary of the first Columbia Funds board meeting they attended as a member of the Board.
Independent trustees
Name,
address,
year of birth | Position held
with the Trust and
length of service | Principal occupation(s)
during past five years
and other relevant
professional experience | Number of
Funds in the
Columbia Funds
complex
overseen | Other directorships
held by Trustee
during the past
five years |
George S. Batejan
c/o Columbia Management
Investment Advisers, LLC
225 Franklin Street
Mail Drop BX32 05228
Boston, MA 02110
1953 | Trustee since 1/17 | Executive Vice President, Global Head of Technology and Operations, Janus Capital Group, Inc., 2010-2016 | 124 | Advisory Board Member, University of Colorado Business School (Executive Committee, Nominating Committee and Governance Committee) since November 2015; former Chairman of the Board, NICSA (National Investment Company Services Association), 2014-2016; former Director, Intech Investment Management, 2011- 2016; former Board Member, Metro Denver Chamber of Commerce, 2015-2016 |
Kathleen Blatz
c/o Columbia Management
Investment Advisers, LLC
225 Franklin Street
Mail Drop BX32 05228
Boston, MA 02110
1954 | Trustee since 1/06 for RiverSource Funds and since 6/11 for Nations Funds | Attorney; specializing in arbitration and mediation; Chief Justice, Minnesota Supreme Court, 1998-2006; Associate Justice, Minnesota Supreme Court, 1996-1998; Fourth Judicial District Court Judge, Hennepin County, 1994-1996; Attorney in private practice and public service, 1984-1993; State Representative, Minnesota House of Representatives, 1979-1993, which included service on the Tax and Financial Institutions and Insurance Committees | 126 | Trustee, BlueCross BlueShield of Minnesota (Chair of the Business Development Committee) since 2009; Chair of the Robina Foundation since August 2013 |
Edward J. Boudreau, Jr.
c/o Columbia Management
Investment Advisers, LLC
225 Franklin Street
Mail Drop BX32 05228
Boston, MA 02110
1944 | Trustee since 6/11 for RiverSource Funds and since 1/05 for Nations Funds | Managing Director, E.J. Boudreau & Associates (consulting) since 2000; FINRA Industry Arbitrator, 2002-present; Chairman and Chief Executive Officer, John Hancock Investments (asset management), Chairman and Interested Trustee for open-end and closed-end funds offered by John Hancock,1989-2000; John Hancock Mutual Life Insurance Company, including Senior Vice President and Treasurer and Senior Vice President Information Technology, 1968-1988 | 124 | Former Trustee, Boston Museum of Science (Chair of Finance Committee) 1985-2013; former Trustee, BofA Funds Series Trust (11 funds), 2005-2011 |
Pamela G. Carlton
c/o Columbia Management
Investment Advisers, LLC
225 Franklin Street
Mail Drop BX32 05228
Boston, MA 02110
1954 | Trustee since 7/07 for RiverSource Funds and since 6/11 for Nations Funds | President, Springboard — Partners in Cross Cultural Leadership (consulting company) since 2003; Managing Director of US Equity Research, JP Morgan Chase, 1999-2003; Director of US Equity Research, Chase Asset Management, 1996-1999; Co-Director Latin America Research, 1993-1996, COO Global Research, 1992-1996, Co-Director of US Research, 1991-1992, Investment Banker, Morgan Stanley, 1982-1991 | 126 | Trustee, New York Presbyterian Hospital Board (Executive Committee and Chair of Human Resources Committee) since 1996 |
Columbia Capital Allocation Portfolios | Annual Report 2017
| 145 |
TRUSTEES AND OFFICERS (continued)
Independent trustees (continued)
Name,
address,
year of birth | Position held
with the Trust and
length of service | Principal occupation(s)
during past five years
and other relevant
professional experience | Number of
Funds in the
Columbia Funds
complex
overseen | Other directorships
held by Trustee
during the past
five years |
William P. Carmichael
c/o Columbia Management
Investment Advisers, LLC
225 Franklin Street
Mail Drop BX32 05228
Boston, MA 02110
1943 | Trustee since 6/11 for RiverSource Funds and since 2003 for Nations Funds; Chair of the Board from 1/14-11/15 | Retired; Co-founder, The Succession Fund (provides exit strategies to owners of privately held companies), 1998-2007; Adjunct Professor of Finance, Kelley School of Business, Indiana University, 1993-2007; Senior Vice President, Sara Lee Corporation, 1991-1993; Senior Vice President and Chief Financial Officer, Beatrice Foods Company, 1984-1990; Vice President, Esmark, Inc., 1973-1984; Associate, Price Waterhouse, 1968-1972 | 126 | Director, The Finish Line (athletic shoes and apparel) since July 2003; Director, hhgregg since May 2015; former Director, Cobra Electronics Corporation (electronic equipment manufacturer), 1994-August 2014; former Director, Spectrum Brands, Inc. (consumer products), 2002-2009; former Director, Simmons Company (bedding), 2004-2010; former Trustee, BofA Funds Series Trust (11 funds) 2003-2011; former Director, McMoRan Exploration Company (oil and gas exploration and development) 2010 - 2013; former Director, International Textile Corp., 2012-2016 |
Patricia M. Flynn
c/o Columbia Management
Investment Advisers, LLC
225 Franklin Street
Mail Drop BX32 05228
Boston, MA 02110
1950 | Trustee since 11/04 for RiverSource Funds and since 6/11 for Nations Funds | Trustee Professor of Economics and Management, Bentley University since 1976 (also teaches and conducts research on corporate governance); Dean, McCallum Graduate School of Business, Bentley University, 1992-2002 | 126 | Trustee, MA Taxpayers Foundation since 1997; Board of Governors, Innovation Institute, MA Technology Collaborative since 2010 |
William A. Hawkins
c/o Columbia Management
Investment Advisers, LLC
225 Franklin Street
Mail Drop BX32 05228
Boston, MA 02110
1942 | Chair of the Board since 11/15, Trustee since 6/11 for RiverSource Funds and since 1/05 for Nations Funds | Managing Director, Overton Partners (financial consulting), since August 2010; President and Chief Executive Officer, California General Bank, N.A., January 2008-August 2010; Operation Hope, COO, 2004-2007; IndyMac Bancorp, President, CBG, 1999-2003; American General Bank, President, 1997-1999; Griffin Financial Services, CEO, 1981-1997; The Griffin Funds, CEO, 1992-1998 | 126 | Former Trustee, BofA Funds Series Trust (11 funds), 2005-2015 |
Catherine James Paglia
c/o Columbia Management
Investment Advisers, LLC
225 Franklin Street
Mail Drop BX32 05228
Boston, MA 02110
1952 | Trustee since 11/04 for RiverSource Funds and since 6/11 for Nations Funds | Director, Enterprise Asset Management, Inc. (private real estate and asset management company) since September 1998; Managing Director and Partner, Interlaken Capital, Inc., 1989-1997; Managing Director, Morgan Stanley, 1982-1989; Vice President, Investment Banking, 1980-1982, Associate, Investment Banking, 1976-1980, Dean Witter Reynolds, Inc. | 126 | Director, Valmont Industries, Inc. (irrigation systems manufacturer) since 2012; Trustee, Carleton College (on the Investment Committee); Trustee, Carnegie Endowment for International Peace (on the Investment Committee) |
| 146 | Columbia Capital Allocation Portfolios | Annual Report 2017 |
TRUSTEES AND OFFICERS (continued)
Independent trustees (continued)
Name,
address,
year of birth | Position held
with the Trust and
length of service | Principal occupation(s)
during past five years
and other relevant
professional experience | Number of
Funds in the
Columbia Funds
complex
overseen | Other directorships
held by Trustee
during the past
five years |
Minor M. Shaw
c/o Columbia Management
Investment Advisers, LLC
225 Franklin Street
Mail Drop BX32 05228
Boston, MA 02110
1947 | Trustee since 6/11 for RiverSource Funds and since 2003 for Nations Funds | President, Micco LLC (private investments) since 2011; President, Micco Corp. (family investment business), 1998-2011 | 126 | Director, BlueCross BlueShield of South Carolina since April 2008; Advisory Board member, Duke Energy Corp. since October 2016; Chair of the Duke Endowment; Director, National Association of Corporate Directors, Carolinas Chapter, since 2013; Chair of Greenville – Spartanburg Airport Commission; former Trustee, BofA Funds Series Trust (11 funds), 2003-2011; former Director, Piedmont Natural Gas, 2004-2016 |
John G. Taft
c/o Columbia Management
Investment Advisers, LLC
225 Franklin Street
Mail Drop BX32 05228
Boston, MA 02110
1955 | Trustee since 1/17 | Chief Executive Officer, RBC Wealth Management (a division of RBC Capital Markets LLC), 2005-2016 | 124 | Trustee, Andy Warhol Foundation for Visual Arts (Finance Committee) since 2014; former Director, RBC Global Asset Management – U.S., 2001-2016 |
Alison Taunton-Rigby
c/o Columbia Management
Investment Advisers, LLC
225 Franklin Street
Mail Drop BX32 05228
Boston, MA 02110
1944 | Trustee since 11/02 for RiverSource Funds and since 6/11 for Nations Funds | President, Chief Executive Officer (CEO) and Director, RiboNovix, Inc., 2003-2010; President and CEO, CMT Inc., 2001-2003; President and CEO, Aquila Biopharmaceuticals Inc., 1996- 2000; President and CEO, Cambridge Biotechnology Corporation, 1995- 1996, President and CEO, Mitotix Inc., 1993-1994 | 127 | Director, Boston Children’s Hospital since 2002; Director, ICI Mutual Insurance Company, since 2011; Director, Blumont/IRD since 2016; Director, Mount Ida College since 2016; former Director, Abt Associates (government contractor), 2001-2016; former Director, Healthways, Inc. (health and well-being solutions), 2005-2016 |
Interested trustee not affiliated with Investment Manager*
Name
address
year of birth | Position held
with the Trust and
length of service | Principal occupation(s) during the
past five years and other relevant
professional experience | Number of
Funds in the
Columbia Funds
complex overseen | Other directorships/
held by Trustee
during the past
five years |
Anthony M. Santomero
c/o Columbia Management
Investment Advisers, LLC
225 Franklin Street
Mail Drop BX32 05228
Boston, MA 02110
1946 | Trustee since 6/11 for RiverSource Funds and since 1/08 for Nations Funds | Richard K. Mellon Professor Emeritus of Finance, The Wharton School, University of Pennsylvania, since 2002; Senior Advisor, McKinsey & Company (consulting), 2006-2008; President, Federal Reserve Bank of Philadelphia, 2000-2006, Professor of Finance, The Wharton School, University of Pennsylvania, 1972-2002 | 124 | Trustee, Penn Mutual Life Insurance Company since March 2008; Director, Renaissance Reinsurance Ltd. since May 2008; Director, Citigroup Inc. since 2009; Director, Citibank, N.A. since 2009; former Trustee, BofA Funds Series Trust (11 funds), 2008-2011 |
Columbia Capital Allocation Portfolios | Annual Report 2017
| 147 |
TRUSTEES AND OFFICERS (continued)
| * | Dr. Santomero is not an affiliated person of the Investment Manager or Ameriprise Financial. However, he is currently deemed by the Funds to be an “interested person” (as defined in the 1940 Act) of the Funds because he serves as a Director of Citigroup Inc. and Citibank, N.A., companies that may directly or through subsidiaries and affiliates engage from time-to-time in brokerage execution, principal transactions and lending relationships with the Funds or accounts advised/managed by the Investment Manager. |
Interested trustee affiliated with Investment Manager*
Name,
address,
year of birth | Position held with the Trusts and length of service | Principal occupation(s) during the
past five years and other relevant
professional experience | Number of
Funds in the
Columbia Funds
complex overseen | Other directorships
held by Trustee
during the past
five years |
William F. Truscott
c/o Columbia Management
Investment Advisers, LLC
225 Franklin St.
Boston, MA 02110
1960 | Trustee since 11/01 for RiverSource Funds and since 6/11 for Nations Funds; Senior Vice President since 2002 for RiverSource Funds and since 5/10 for Nations Funds | Chairman of the Board and President, Columbia Management Investment Advisers, LLC since May 2010 and February 2012, respectively; Chief Executive Officer, Global Asset Management, Ameriprise Financial, Inc. since September 2012 (previously Chief Executive Officer, U.S. Asset Management & President, Annuities, May 2010 - September 2012); Director and Chief Executive Officer, Columbia Management Investment Distributors, Inc. since May 2010 and February 2012, respectively; Chairman of the Board and Chief Executive Officer, RiverSource Distributors, Inc. since 2006; Director, Threadneedle Asset Management Holdings, SARL since 2014; President and Chief Executive Officer, Ameriprise Certificate Company, 2006 - August 2012. | 185 | Chairman of the Board, Columbia Management Investment Advisers, LLC since May 2010; Director, Columbia Management Investment Distributors, Inc. since May 2010; former Director, Ameriprise Certificate Company, 2006-January 2013 |
| * | Interested person (as defined under the 1940 Act) by reason of being an officer, director, security holder and/or employee of the Investment Manager or Ameriprise Financial. |
The Statement of Additional Information has additional information about the Fund’s Board members and is available,
without charge, upon request by calling 800.345.6611; contacting your financial intermediary or visiting
investor.columbiathreadneedleus.com.
| 148 | Columbia Capital Allocation Portfolios | Annual Report 2017 |
TRUSTEES AND OFFICERS (continued)
The Board has appointed officers who are responsible for day-to-day business decisions based on policies it has established. The officers serve at the pleasure of the Board. The following table provides basic information about the Officers of the Fund, including principal occupations during the past five years, although their specific titles may have varied over the period. In addition to Mr. Truscott, who is Senior Vice President, the Fund’s other officers are:
Fund officers
Name,
address and
year of birth | Position and year
first appointed to
position for any Fund
in the Columbia
Funds complex or a
predecessor thereof | Principal occupation(s) during past five years |
Christopher O. Petersen
5228 Ameriprise
Financial Center
Minneapolis, MN 55474
Born 1970 | President and Principal Executive Officer (2015) | Vice President and Lead Chief Counsel, Ameriprise Financial, Inc. since January 2015 (previously, Vice President and Chief Counsel, January 2010 - December 2014; officer of Columbia Funds and affiliated funds since 2007. |
Michael G. Clarke
225 Franklin Street
Boston, MA 02110
Born 1969 | Treasurer (2011), Chief Financial Officer (2009) and Chief Accounting Officer (2015) | Vice President — Mutual Fund Administration, Columbia Management Investment Advisers, LLC, since May 2010; senior officer of Columbia Funds and affiliated funds since 2002. |
Paul B. Goucher
100 Park Avenue
New York, NY 10017
Born 1968 | Senior Vice President (2011), Chief Legal Officer (2015) and Assistant Secretary (2008) | Senior Vice President and Assistant General Counsel, Ameriprise Financial, Inc. since January 2017 (previously Vice President and Lead Chief Counsel, November 2008 - January 2017 and January 2013 - January 2017, respectively and Chief Counsel, January 2010 - January 2013); Vice President, Chief Legal Officer and Assitant Secretary, Columbia Management Investment Advisers, LLC since May 2010. |
Thomas P. McGuire
225 Franklin Street
Boston, MA 02110
Born 1972 | Senior Vice President and Chief Compliance Officer (2012) | Vice President — Asset Management Compliance, Ameriprise Financial, Inc., since May 2010; Chief Compliance Officer, Ameriprise Certificate Company since September 2010. |
Colin Moore
225 Franklin Street
Boston, MA 02110
Born 1958 | Senior Vice President (2010) | Executive Vice President and Global Chief Investment Officer, Ameriprise Financial, Inc., since July 2013; Executive Vice President and Global Chief Investment Officer, Columbia Management Investment Advisers, LLC since July 2013 (previously Director and Global Chief Investment Officer, 2010 - 2013). |
Michael E. DeFao
225 Franklin Street
Boston, MA 02110
Born 1968 | Vice President (2011) and Assistant Secretary (2010) | Vice President and Chief Counsel, Ameriprise Financial, Inc. since May 2010. |
Amy Johnson
5228 Ameriprise
Financial Center
Minneapolis, MN 55474
Born 1965 | Vice President (2006) | Managing Director and Global Head of Operations, Columbia Management Investment Advisers, LLC since April 2016 (previously Managing Director and Chief Operatiing Officer, 2010 - 2016).). |
Lyn Kephart-Strong
5228 Ameriprise
Financial Center
Minneapolis, MN 55474
Born 1960 | Vice President (2015) | President, Columbia Management Investment Services Corp. since October 2014; Vice President & Resolution Officer, Ameriprise Trust Company since August 2009. |
Ryan C. Larrenaga
225 Franklin Street
Boston, MA 02110
Born 1970 | Vice President and Secretary (2015) | Vice President and Group Counsel, Ameriprise Financial, Inc. since August 2011; officer of Columbia Funds and affiliated funds since 2005. |
Columbia Capital Allocation Portfolios | Annual Report 2017
| 149 |
The Funds mail one shareholder report to each shareholder address. If you would like more than one report, please call shareholder services at 800.345.6611 and additional reports will be sent to you.
Proxy voting policies and procedures
The policy of the Board is to vote the proxies of the companies in which the Funds hold investments consistent with the procedures as stated in the Statement of Additional Information (SAI). You may obtain a copy of the SAI without charge by calling 800.345.6611; contacting your financial intermediary; visiting investor.columbiathreadneedleus.com; or searching the website of the Securities and Exchange Commission (SEC) at sec.gov. Information regarding how the Funds voted proxies relating to portfolio securities is filed with the SEC by August 31st for the most recent 12-month period ending June 30th of that year, and is available without charge by visiting investor.columbiathreadneedleus.com, or searching the website of the SEC at sec.gov.
Quarterly schedule of investments
Each Fund file a complete schedule of portfolio holdings with the SEC for the first and third quarters of each fiscal year on Form N-Q. Each Fund’s Form N-Q is available on the SEC’s website at sec.gov and may be reviewed and copied at the SEC’s Public Reference Room in Washington, D.C. Information on the operation of the Public Reference Room may be obtained by calling 800.SEC.0330. Each Fund’s complete schedule of portfolio holdings, as filed on Form N-Q, can also be obtained without charge, upon request, by calling 800.345.6611.
Additional Fund information
For more information about the Funds, please visit investor.columbiathreadneedleus.com or call 800.345.6611. Customer Service Representatives are available to answer your questions Monday through Friday from 8 a.m. to 7 p.m. Eastern time.
Fund investment manager
Columbia Management Investment Advisers, LLC
225 Franklin Street
Boston, MA 02110
Fund distributor
Columbia Management Investment Distributors, Inc.
225 Franklin Street
Boston, MA 02110
Fund transfer agent
Columbia Management Investment Services Corp.
P.O. Box 8081
Boston, MA 02266-8081
| 150 | Columbia Capital Allocation Portfolios | Annual Report 2017 |
[THIS PAGE INTENTIONALLY LEFT BLANK]
[THIS PAGE INTENTIONALLY LEFT BLANK]
[THIS PAGE INTENTIONALLY LEFT BLANK]
Columbia Capital Allocation Portfolios
P.O. Box 8081
Boston, MA 02266-8081
Please read and consider the investment objectives, risks, charges and expenses for any fund carefully before investing. For a prospectus and summary prospectus, which contains this and other important information about the Funds, go to
investor.columbiathreadneedleus.com. The Funds are distributed by Columbia Management Investment Distributors, Inc., member FINRA, and managed by Columbia Management Investment Advisers, LLC.
Columbia Threadneedle Investments (Columbia Threadneedle) is the global brand name of the Columbia and Threadneedle group of companies. All rights reserved. Columbia Management Investment Distributors, Inc., 225 Franklin Street, Boston, MA 02110-2804
© 2017 Columbia Management Investment Advisers, LLC.
investor.columbiathreadneedleus.com
Item 2. Code of Ethics.
| | (a) | The registrant has adopted a code of ethics that applies to the registrant’s principal executive officer, principal financial officer, principal accounting officer or controller, or persons performing similar functions, regardless of whether these individuals are employed by the registrant or a third party. |
| | (b) | During the period covered by this report, there were not any amendments to a provision of the code of ethics adopted in 2(a) above. |
| | (c) | During the period covered by this report, there were no waivers, including any implicit waivers, from a provision of the code of ethics described in 2(a) above that relates to one or more of the items set forth in paragraph (b) of this item’s instructions. |
Item 3. Audit Committee Financial Expert.
The registrant’s Board of Trustees has determined that Edward J. Boudreau, Pamela G. Carlton, William A. Hawkins, Alison Taunton-Rigby and John Taft, each of whom are members of the registrant’s Board of Trustees and Audit Committee, each qualify as an audit committee financial expert. Mr. Boudreau, Ms. Carlton, Mr. Hawkins, Ms. Taunton-Rigby and Mr. Taft are each independent trustees, as defined in paragraph (a)(2) of this item’s instructions.
Item 4. Principal Accountant Fees and Services.
Fee information below is disclosed for the three series of the registrant whose reports to stockholders are included in this annual filing. Fiscal year 2016 also includes fees from a fund that liquidated during the period.
(a) Audit Fees. Aggregate Audit Fees billed by the principal accountant for professional services rendered during the fiscal years ended January 31, 2017 and January 31, 2016 are approximately as follows:
Audit Fees include amounts related to the audit of the registrant’s annual financial statements or services that are normally provided by the accountant in connection with statutory and regulatory filings or engagements for those fiscal years.
(b) Audit-Related Fees. Aggregate Audit-Related Fees billed to the registrant by the principal accountant for professional services rendered during the fiscal years ended January 31, 2017 and January 31, 2016 are approximately as follows:
Audit-Related Fees include amounts for assurance and related services by the principal accountant that are reasonably related to the performance of the audit of the registrant’s financial statements and are not reported in Audit Fees above. In both fiscal years 2017 and 2016, Audit-Related Fees consist of agreed-upon procedures performed for semi-annual shareholder reports.
During the fiscal years ended January 31, 2017 and January 31, 2016, there were no Audit-Related Fees billed by the registrant’s principal accountant to the registrant’s investment adviser (not including any sub-adviser whose role is primarily portfolio management and is subcontracted with or overseen by another investment adviser) and any entity controlling, controlled by, or under common control with the adviser that provides ongoing services to the registrant for an engagement that related directly to the operations and financial reporting of the registrant.
(c) Tax Fees. Aggregate Tax Fees billed by the principal accountant to the registrant for professional services rendered during the fiscal years ended January 31, 2017 and January 31, 2016 are approximately as follows:
Tax Fees include amounts for the review of annual tax returns, the review of required shareholder distribution calculations and typically include amounts for professional services by the principal accountant for tax compliance, tax advice and tax planning. Fiscal year 2016 also includes Tax Fees for agreed-upon procedures related to a fund liquidation and a final tax return.
During the fiscal years ended January 31, 2017 and January 31, 2016, there were no Tax Fees billed by the registrant’s principal accountant to the registrant’s investment adviser (not including any sub-adviser whose role is primarily portfolio management and is subcontracted with or overseen by another investment adviser) and any entity controlling, controlled by, or under common control with the adviser that provides ongoing services to the registrant for an engagement that related directly to the operations and financial reporting of the registrant.
(d) All Other Fees. Aggregate All Other Fees billed by the principal accountant to the registrant for professional services rendered during the fiscal years ended January 31, 2017 and January 31, 2016 are approximately as follows:
All Other Fees include amounts for products and services provided by the principal accountant, other than the services reported in paragraphs (a) through (c) above.
Aggregate All Other Fees billed by the registrant’s principal accountant to the registrant’s investment adviser (not including any sub-adviser whose role is primarily portfolio management and is subcontracted with or overseen by another investment adviser) and any entity controlling, controlled by, or under common control with the adviser that provides ongoing services to the registrant for an engagement that related directly to the operations and financial reporting of the registrant during the fiscal years ended January 31, 2017 and January 31, 2016 are approximately as follows:
| | |
| 2017 | | 2016 |
$225,000 | | $110,000 |
In fiscal years 2017 and 2016, All Other Fees primarily consists of fees billed for internal control examinations of the registrant’s transfer agent and investment adviser.
(e)(1) Audit Committee Pre-Approval Policies and Procedures
The registrant’s Audit Committee is required to pre-approve the engagement of the registrant’s independent auditors to provide audit and non-audit services to the registrant and non-audit services to its investment adviser (excluding any sub-adviser whose role is primarily portfolio management and is sub-contracted or overseen by another investment adviser (the “Adviser”) or any entity controlling, controlled by or under common control with the Adviser that provides ongoing services to the Fund (a “Control Affiliate”) if the engagement relates directly to the operations and financial reporting of the registrant.
The Audit Committee has adopted a Policy for Engagement of Independent Auditors for Audit and Non-Audit Services (the “Policy”). The Policy sets forth the understanding of the Audit Committee regarding the engagement of the registrant’s independent accountants to provide (i) audit and permissible audit-related, tax and other services to the registrant (“Fund Services”); (ii) non-audit services to the registrant’s Adviser and any Control Affiliates, that relates directly to the operations and financial reporting of a Fund (“Fund-related Adviser Services”); and (iii) certain other audit and non-audit services to the registrant’s Adviser and its Control Affiliates. A service will require specific pre-approval by the Audit Committee if it is to be provided by the Fund’s independent auditor; provided, however, that pre-approval of non-audit services to the Fund, the Adviser or Control Affiliates may be waived if certain de minimis requirements set forth in the SEC’s rules are met.
Under the Policy, the Audit Committee may delegate pre-approval authority to any pre-designated member or members who are independent board members. The member(s) to whom such authority is delegated must report, for informational purposes only, any pre-approval decisions to the Audit Committee at its next regular meeting. The Audit Committee’s responsibilities with respect to the pre-approval of services performed by the independent auditor may not be delegated to management.
On an annual basis, at a regularly scheduled Audit Committee meeting, the Fund’s Treasurer or other Fund officer shall submit to the Audit Committee a schedule of the types of Fund Services and Fund-related Adviser Services that are subject to specific pre-approval. This schedule will provide a description of each type of service that is subject to specific pre-approval, along with total projected fees for each service. The pre-approval will generally cover a one-year period. The Audit Committee will review and approve the types of services and the projected fees for the next one-year period and may add to, or subtract from, the list of pre-approved services from time to time, based on subsequent determinations. This specific approval acknowledges that the Audit Committee is in agreement with the specific types of services that the independent auditor will be permitted to perform and the projected fees for each service.
The Fund’s Treasurer or other Fund officer shall report to the Audit Committee at each of its regular meetings regarding all Fund Services or Fund-related Adviser Services provided since the last such report was rendered, including a description of the services, by category, with forecasted fees for the annual reporting period, proposed changes requiring specific pre-approval and a description of services provided by the independent auditor, by category, with actual fees during the current reporting period.
*****
(e)(2) 100% of the services performed for items (b) through (d) above during 2017 and 2016 were pre-approved by the registrant’s Audit Committee.
(f) Not applicable.
(g) The aggregate non-audit fees billed by the registrant’s accountant for services rendered to the registrant, and rendered to the registrant’s investment adviser (not including any sub-adviser whose role is primarily portfolio management and is subcontracted with or overseen by another investment adviser), and any entity controlling, controlled by, or under common control with the adviser that provides ongoing services to the registrant for the fiscal years ended January 31, 2017 and January 31, 2016 are approximately as follows:
| | |
| 2017 | | 2016 |
$235,800 | | $136,600 |
(h) The registrant’s Audit Committee of the Board of Directors has considered whether the provision of non-audit services that were rendered to the registrant’s adviser (not including any sub-adviser whose role is primarily portfolio management and is subcontracted with or overseen by another investment adviser), and any entity controlling, controlled by, or under common control with the investment adviser that provides ongoing services to the registrant that were not pre-approved pursuant to paragraph (c)(7)(ii) of Rule 2-01 of Regulation S-X, is compatible with maintaining the principal accountant’s independence.
Item 5. Audit Committee of Listed Registrants.
Not applicable.
Item 6. Investments
| | (a) | The registrant’s “Schedule I – Investments in securities of unaffiliated issuers” (as set forth in 17 CFR 210.12-12) is included in Item 1 of this Form N-CSR. |
Item 7. Disclosure of Proxy Voting Policies and Procedures for Closed-End Management Investment Companies.
Not applicable.
Item 8. Portfolio Managers of Closed-End Management Investment Companies.
Not applicable.
Item 9. Purchases of Equity Securities by Closed-End Management Investment Company and Affiliated Purchasers.
Not applicable.
Item 10. Submission of Matters to a Vote of Security Holders.
There were no material changes to the procedures by which shareholders may recommend nominees to the registrant’s board of directors.
Item 11. Controls and Procedures.
| | (a) | The registrant’s principal executive officer and principal financial officer, based on their evaluation of the registrant’s disclosure controls and procedures as of a date within 90 days of the filing of this report, have concluded that such controls and procedures are adequately designed to ensure that material information required to be disclosed by the registrant in Form N-CSR is accumulated and communicated to the registrant’s management, including the principal executive officer and principal financial officer, or persons performing similar functions, as appropriate to allow timely decisions regarding required disclosure. |
| | (b) | There was no change in the registrant’s internal control over financial reporting that occurred during the registrant’s second fiscal quarter of the period covered by this report that has materially affected, or is reasonably likely to materially affect, the registrant’s internal control over financial reporting. |
Item 12. Exhibits.
(a)(1) Code of ethics required to be disclosed under Item 2 of Form N-CSR attached hereto as Exhibit 99.CODE ETH.
(a)(2) Certifications pursuant to Rule 30a-2(a) under the Investment Company Act of 1940 (17 CFR 270.30a-2(a)) attached hereto as Exhibit 99.CERT.
(a)(3) Not applicable.
(b) Certification pursuant to Rule 30a-2(b) under the Investment Company Act of 1940 (17 CFR 270.30a-2(b)) attached hereto as Exhibit 99.906CERT.
SIGNATURES
Pursuant to the requirements of the Securities Exchange Act of 1934 and the Investment Company Act of 1940, the registrant has duly caused this report to be signed on its behalf by the undersigned, thereunto duly authorized.
| | |
| (registrant) | | Columbia Funds Series Trust |
| | |
| By (Signature and Title) | | /s/ Christopher O. Petersen |
| | Christopher O. Petersen, President and Principal Executive Officer |
Pursuant to the requirements of the Securities Exchange Act of 1934 and the Investment Company Act of 1940, this report has been signed below by the following persons on behalf of the registrant and in the capacities and on the dates indicated.
| | |
| By (Signature and Title) | | /s/ Christopher O. Petersen |
| | Christopher O. Petersen, President and Principal Executive Officer |
| | |
| By (Signature and Title) | | /s/ Michael G. Clarke |
| | Michael G. Clarke, Treasurer and Chief Financial Officer |